Revisão Dell Inspiron 16 Plus 7620: O portátil multimídia de fazer-tudo
O Dell Inspiron 16 Plus 7620 2022 sucede diretamente o Inspiron 16 Plus 7610, introduzindo as CPUs do 12º gênero e mais rapidamente GeForce GPUs RTX para substituir as CPUs do 11º gênero no modelo do ano passado. O fabricante até revisou o chassi para um visual diferente após apenas um ano no mercado para a série.
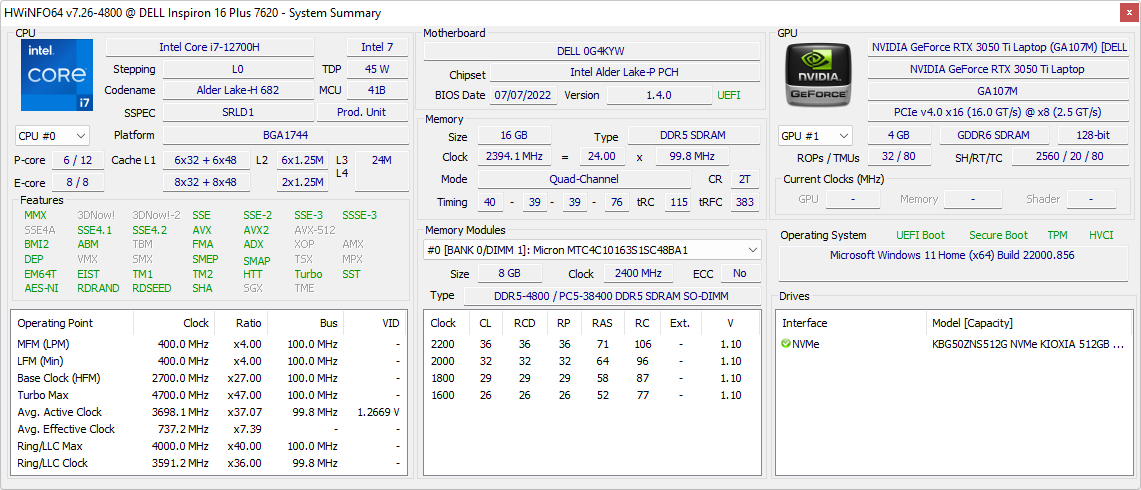
Nossa unidade de teste vem configurada com a CPU Alder Lake-H Core i7-12700H, 65 W GeForce RTX 3050 Ti, e 16:10 3072 x 1280 IPS display por aproximadamente $1400 USD. Outros SKUs com o Core i5-12500H, 60 W RTX 3060, e tela de toque 1920 x 1200 também estão disponíveis. Existe uma versão 2-em-1 do modelo chamada Inspiron 16 Plus 7620 2 em 1.
Os concorrentes neste espaço incluem outros multimídia de média a alta gama de 16 polegadas ou laptops criadores como o Lenovo Yoga 7 16IAP7, Huawei MateBook D 16, Acer Swift X, Asus Vivobook Pro 16X, ou mesmo o MSI Creator Z16.
Mais análises da Dell:
Posibles contendientes en la comparación
Avaliação | Data | Modelo | Peso | Altura | Size | Resolução | Preço |
|---|---|---|---|---|---|---|---|
| 87.4 % v7 (old) | 08/2022 | Dell Inspiron 16 Plus 7620 i7-12700H, GeForce RTX 3050 Ti Laptop GPU | 2.1 kg | 18.99 mm | 16.00" | 3072x1920 | |
| 86.7 % v7 (old) | 08/2021 | Dell Inspiron 16 Plus 7610 i7-11800H, GeForce RTX 3050 4GB Laptop GPU | 2 kg | 18.99 mm | 16.00" | 3072x1920 | |
| 88.7 % v7 (old) | 08/2022 | Lenovo Yoga 7 16IAP7 i7-1260P, Iris Xe G7 96EUs | 2 kg | 19.2 mm | 16.00" | 2560x1600 | |
| 83.6 % v7 (old) | 07/2022 | Huawei MateBook D 16 2022 i7-12700H, Iris Xe G7 96EUs | 1.7 kg | 18.4 mm | 16.00" | 1920x1200 | |
| 86.2 % v7 (old) | 07/2022 | Acer Swift X SFX16-51G-5388 i5-11320H, GeForce RTX 3050 4GB Laptop GPU | 1.8 kg | 18.9 mm | 16.10" | 1920x1080 | |
v (old) | 12/2021 | Asus Vivobook Pro 16X-M7600QE R9 5900HX, GeForce RTX 3050 Ti Laptop GPU | 1.9 kg | 19 mm | 16.10" | 3840x2400 |
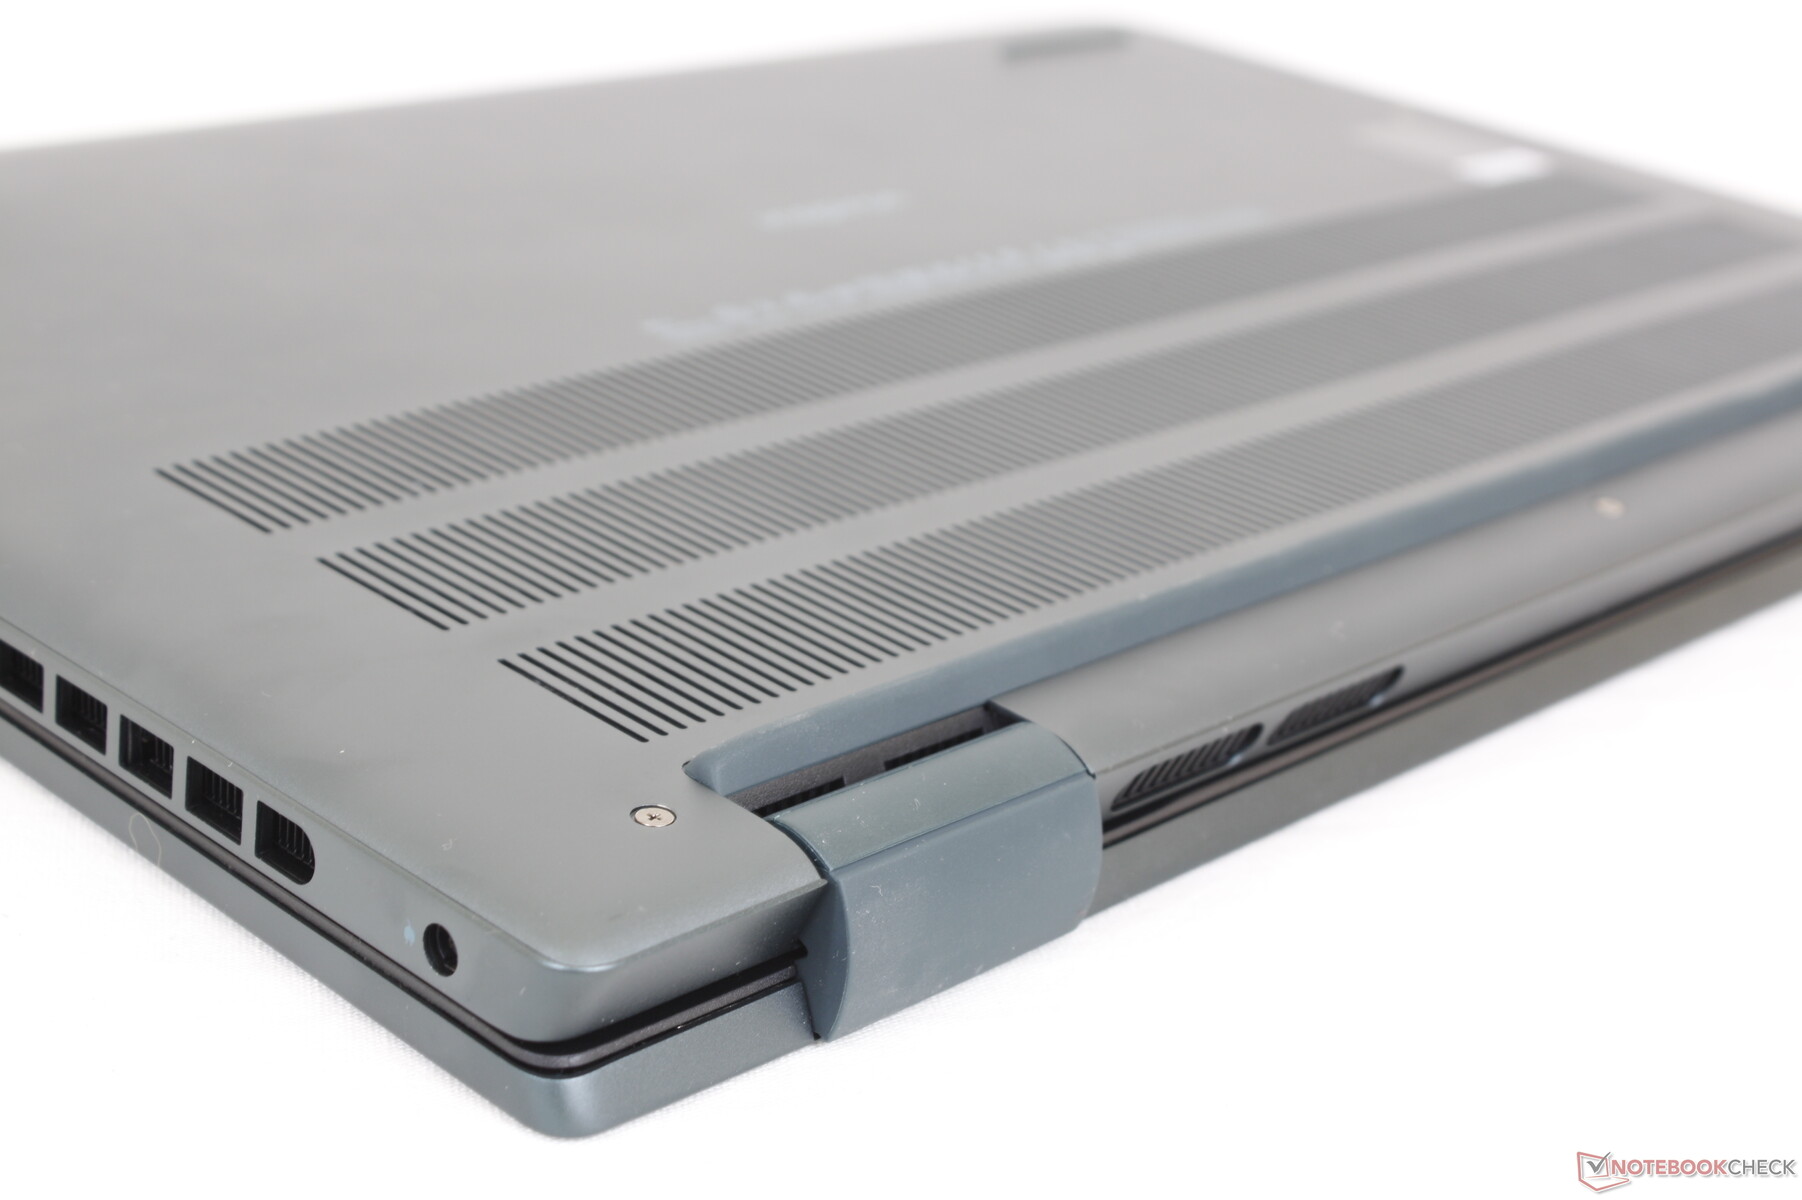
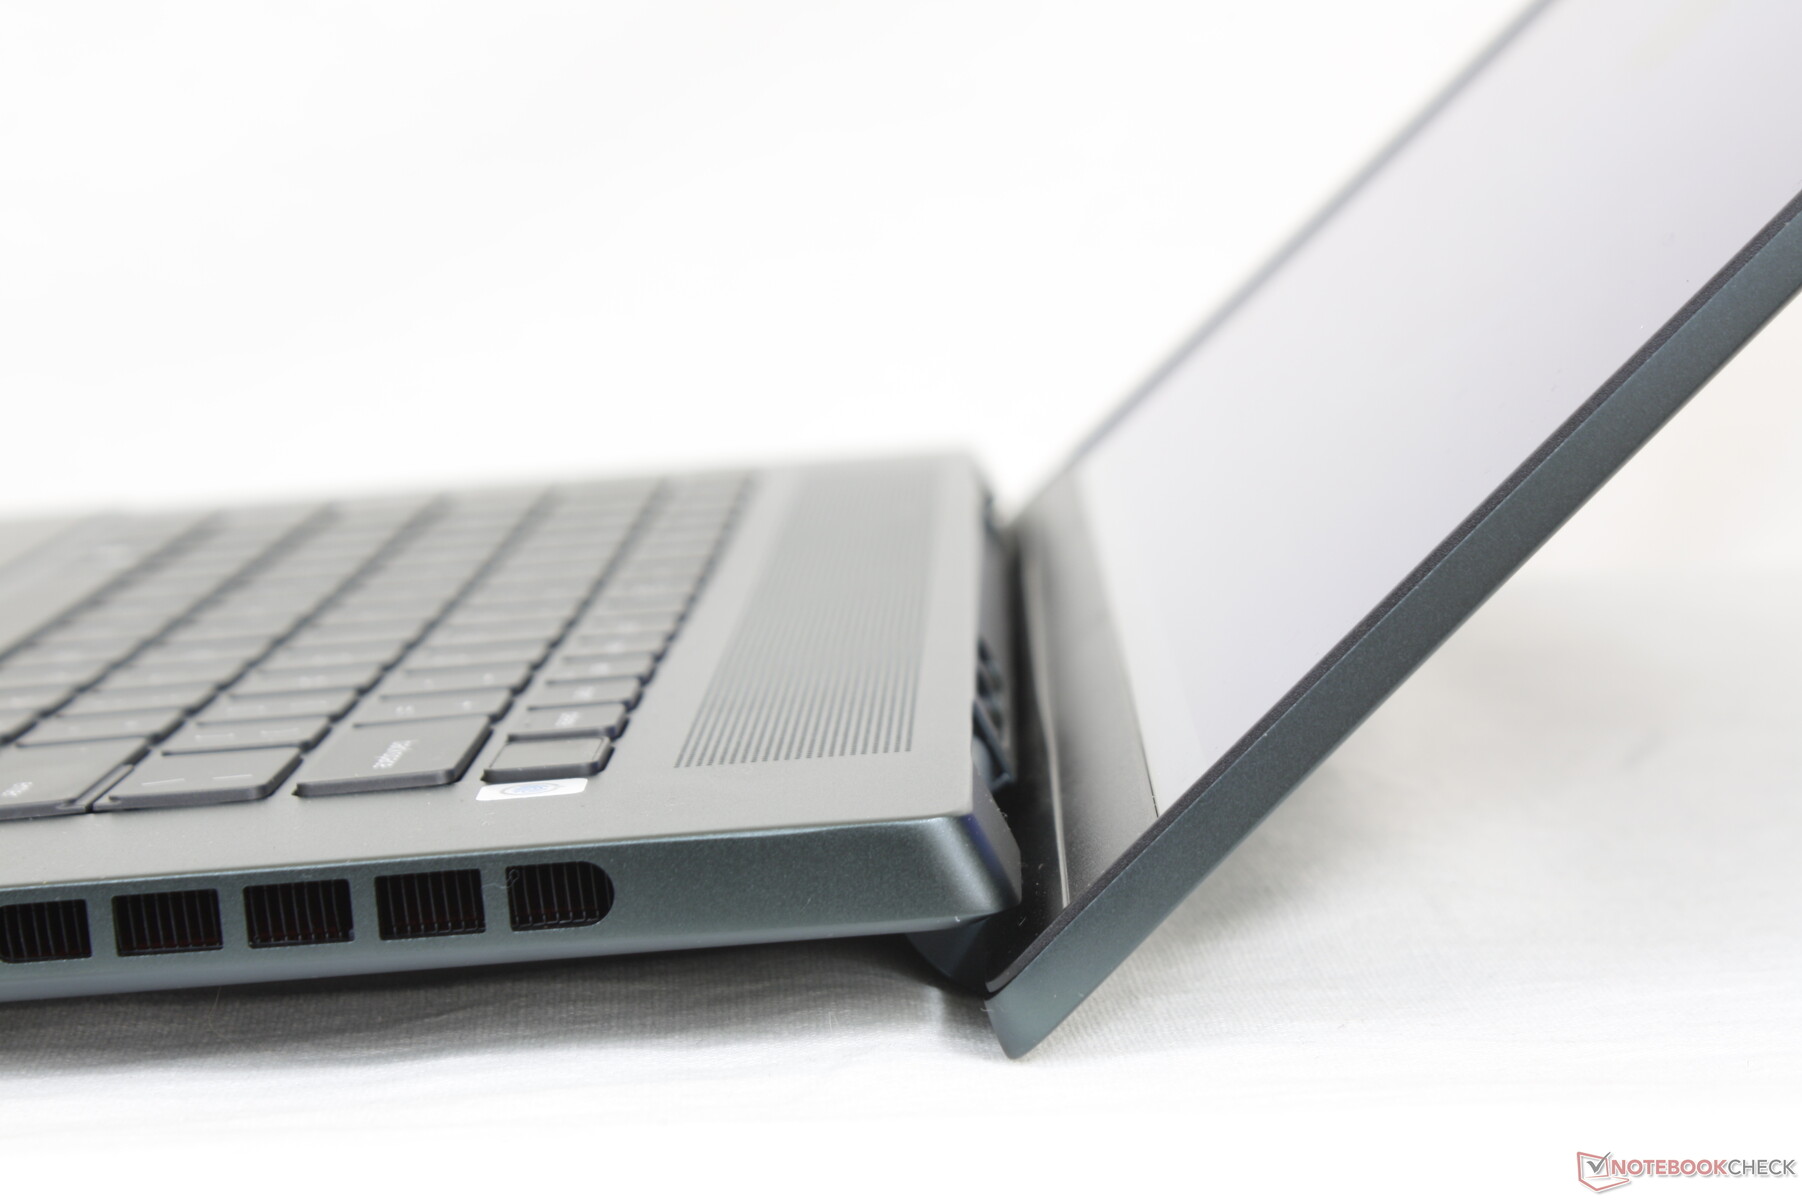
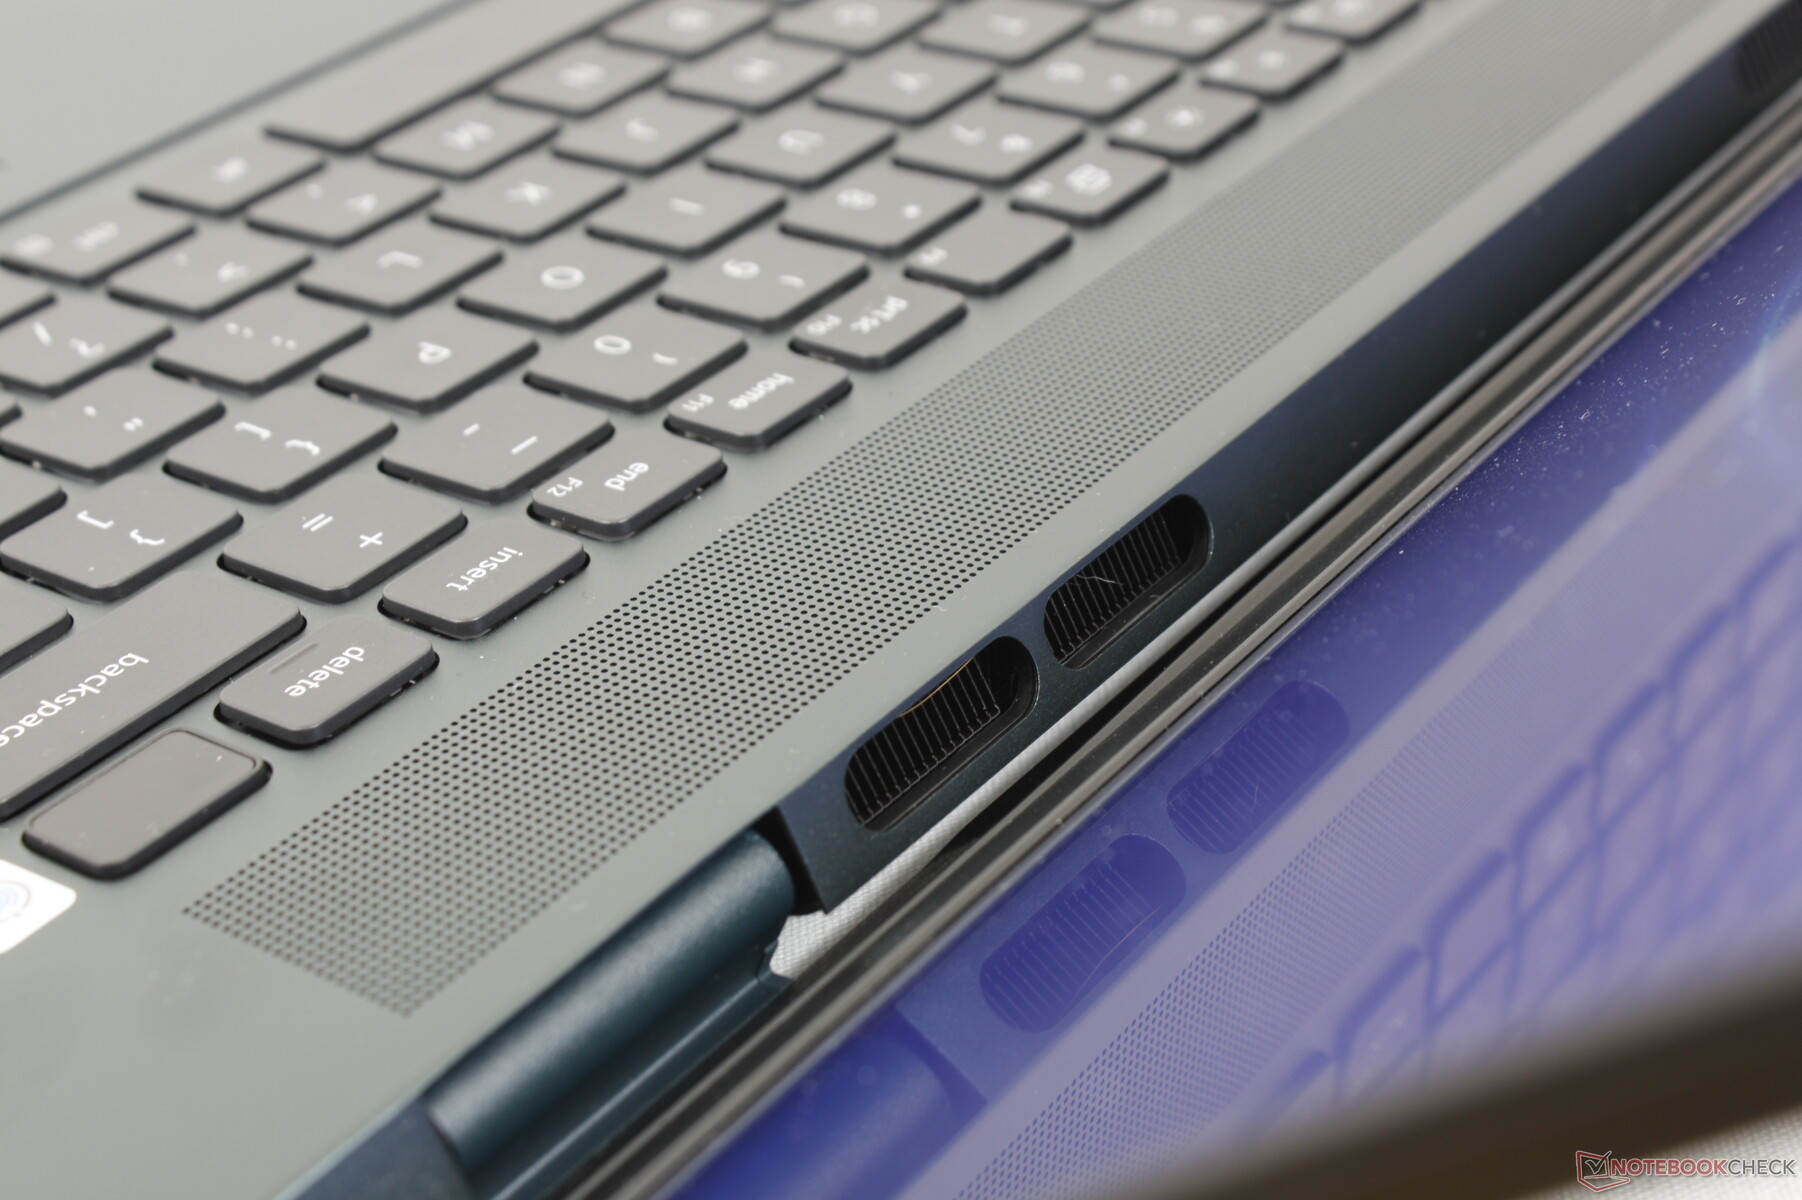
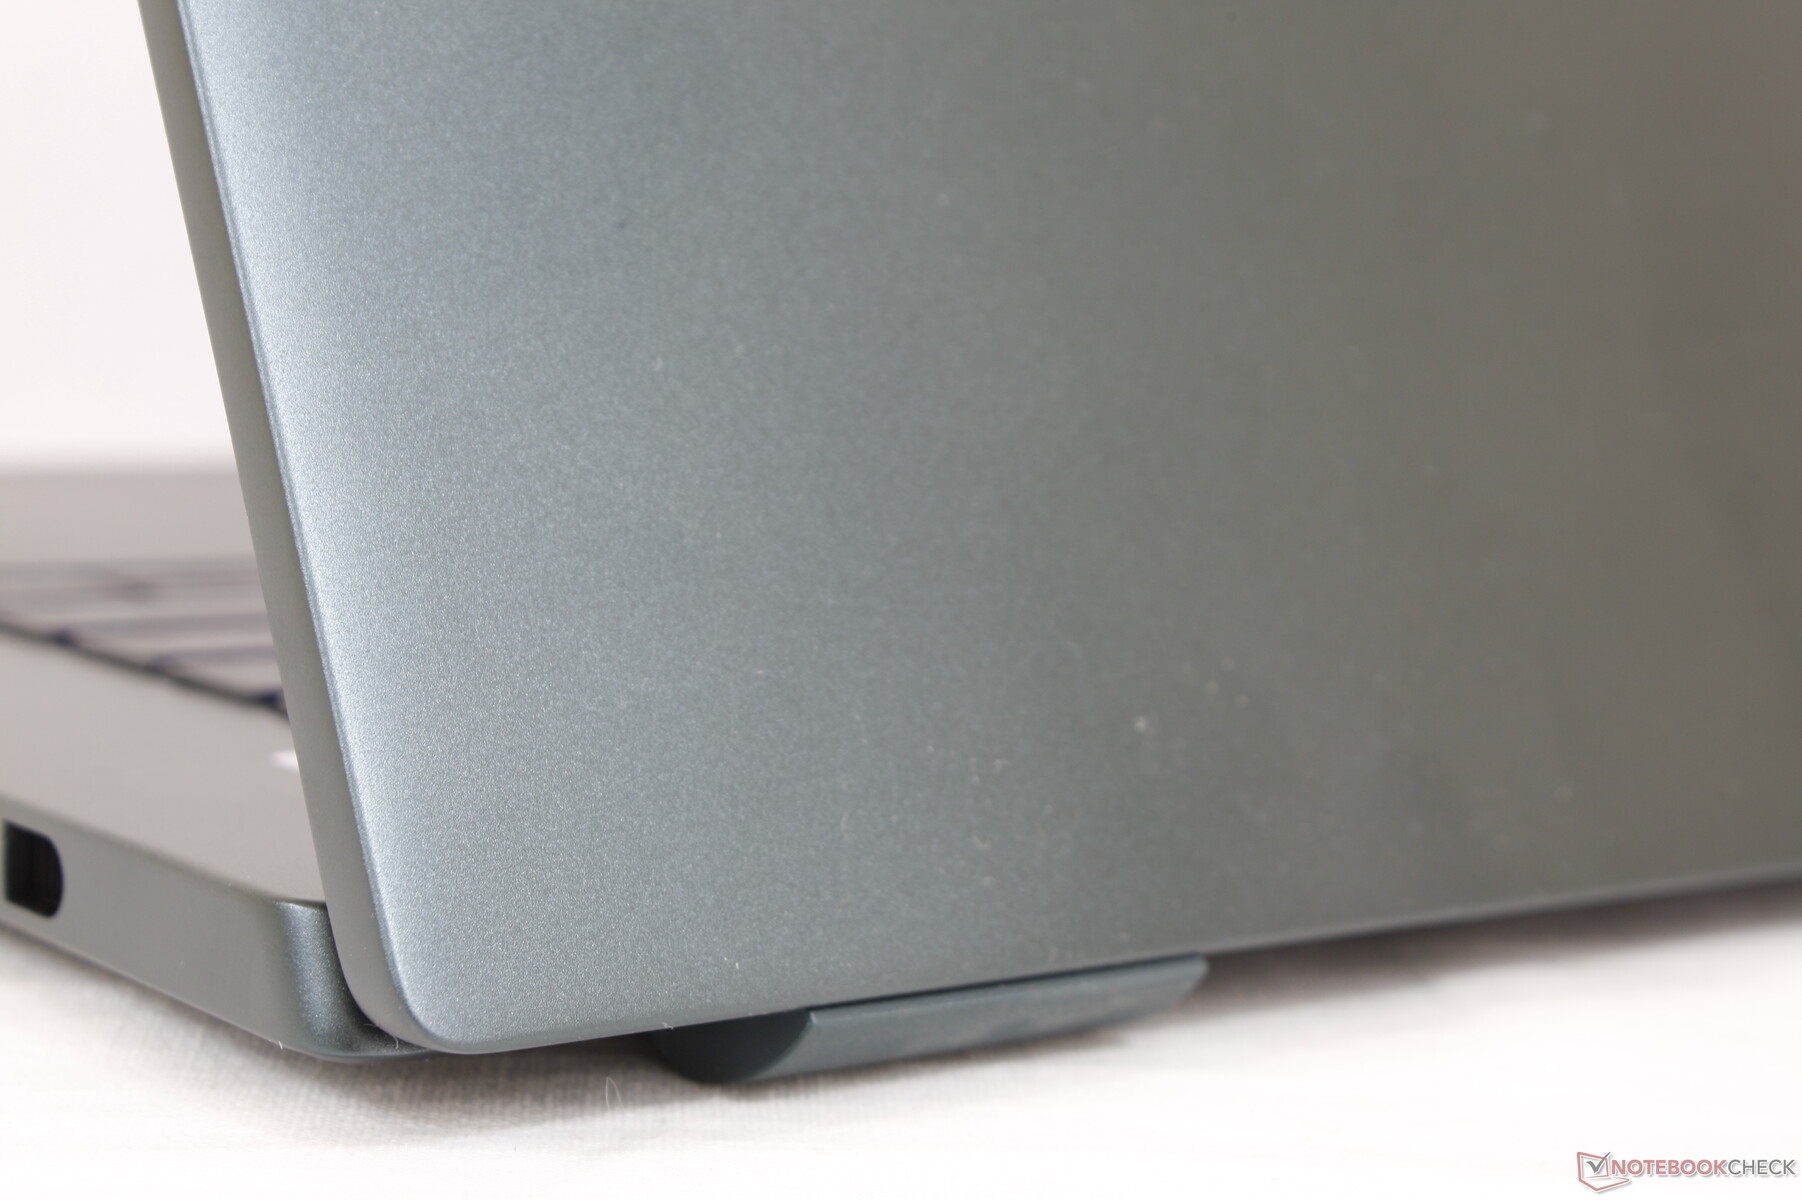
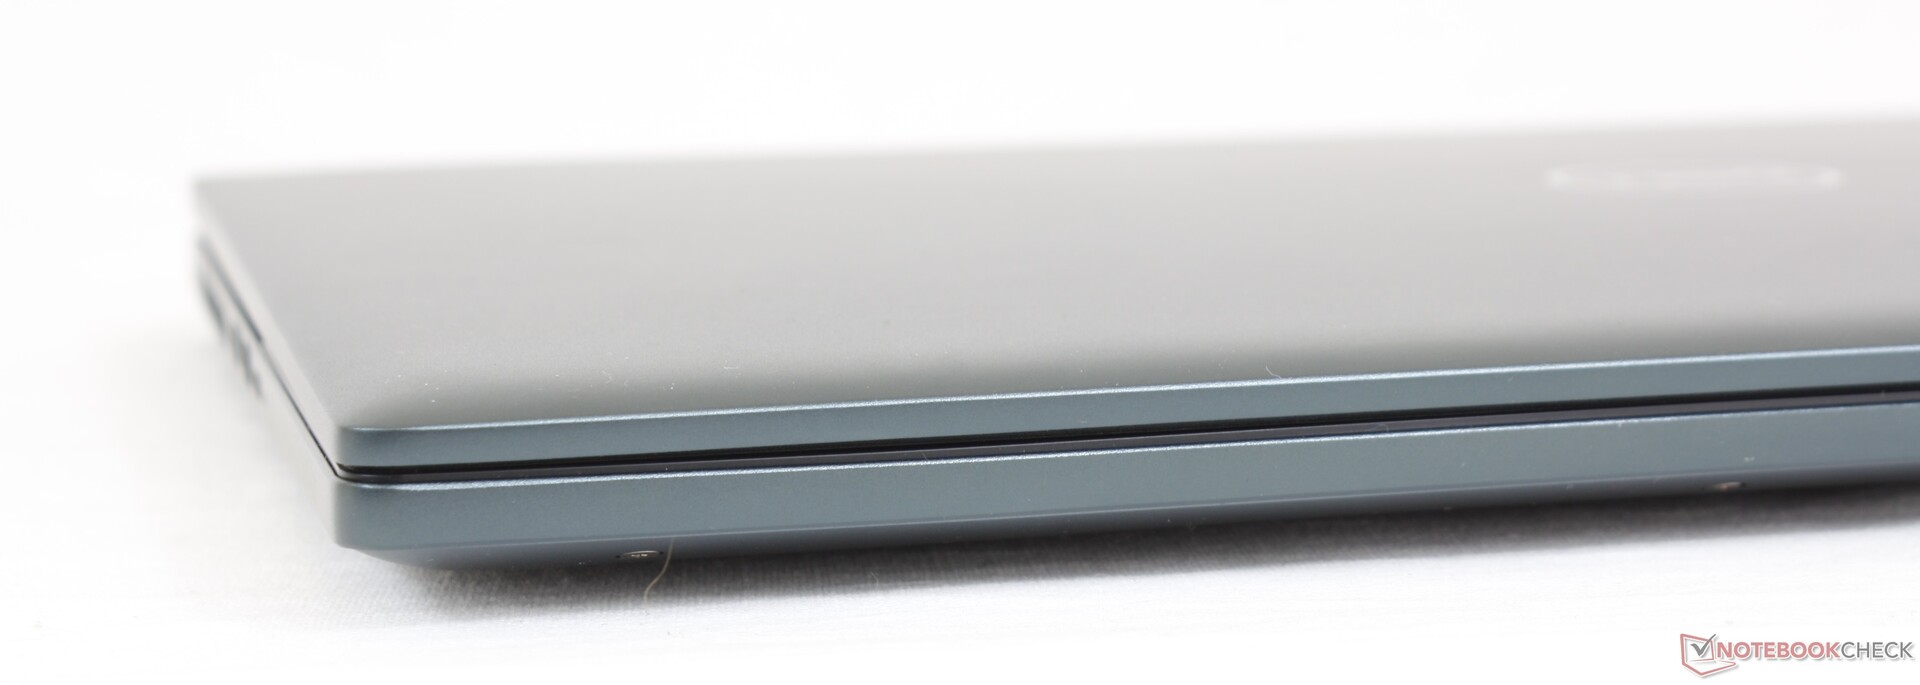
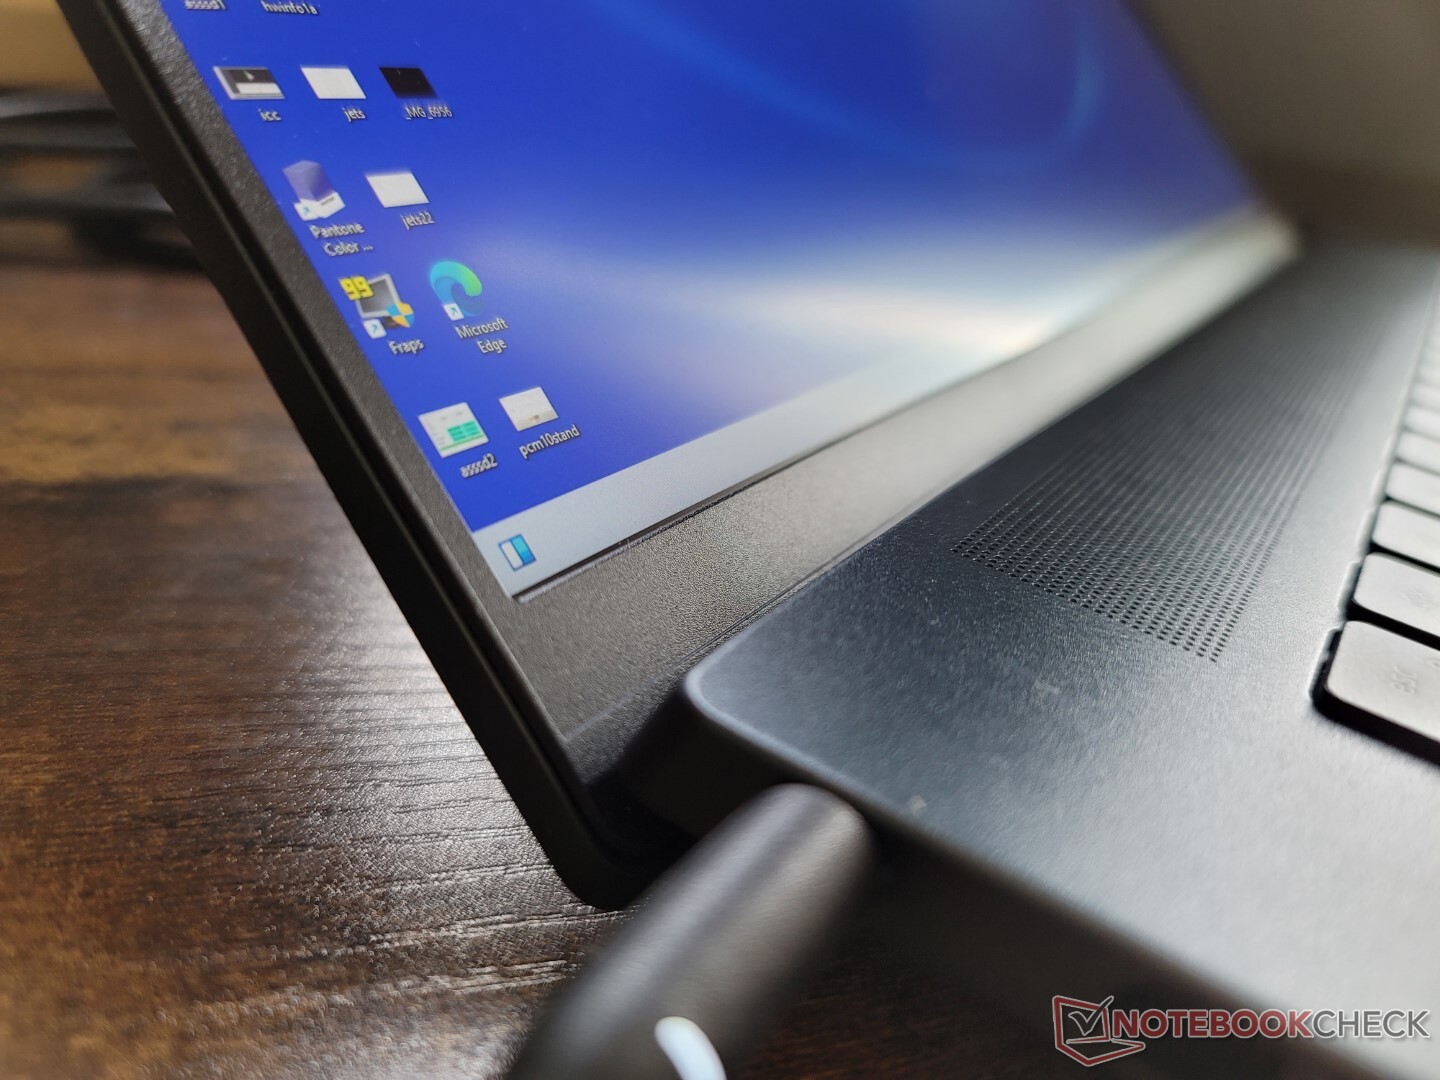
Estojo - Tons mais escuros
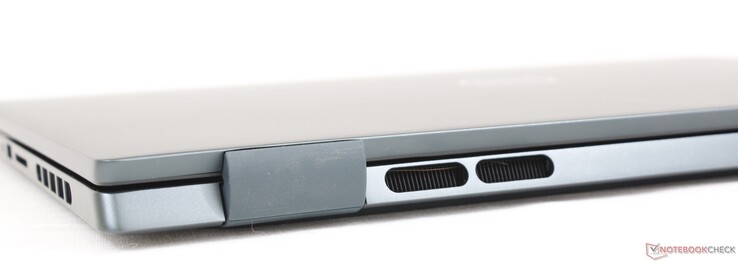
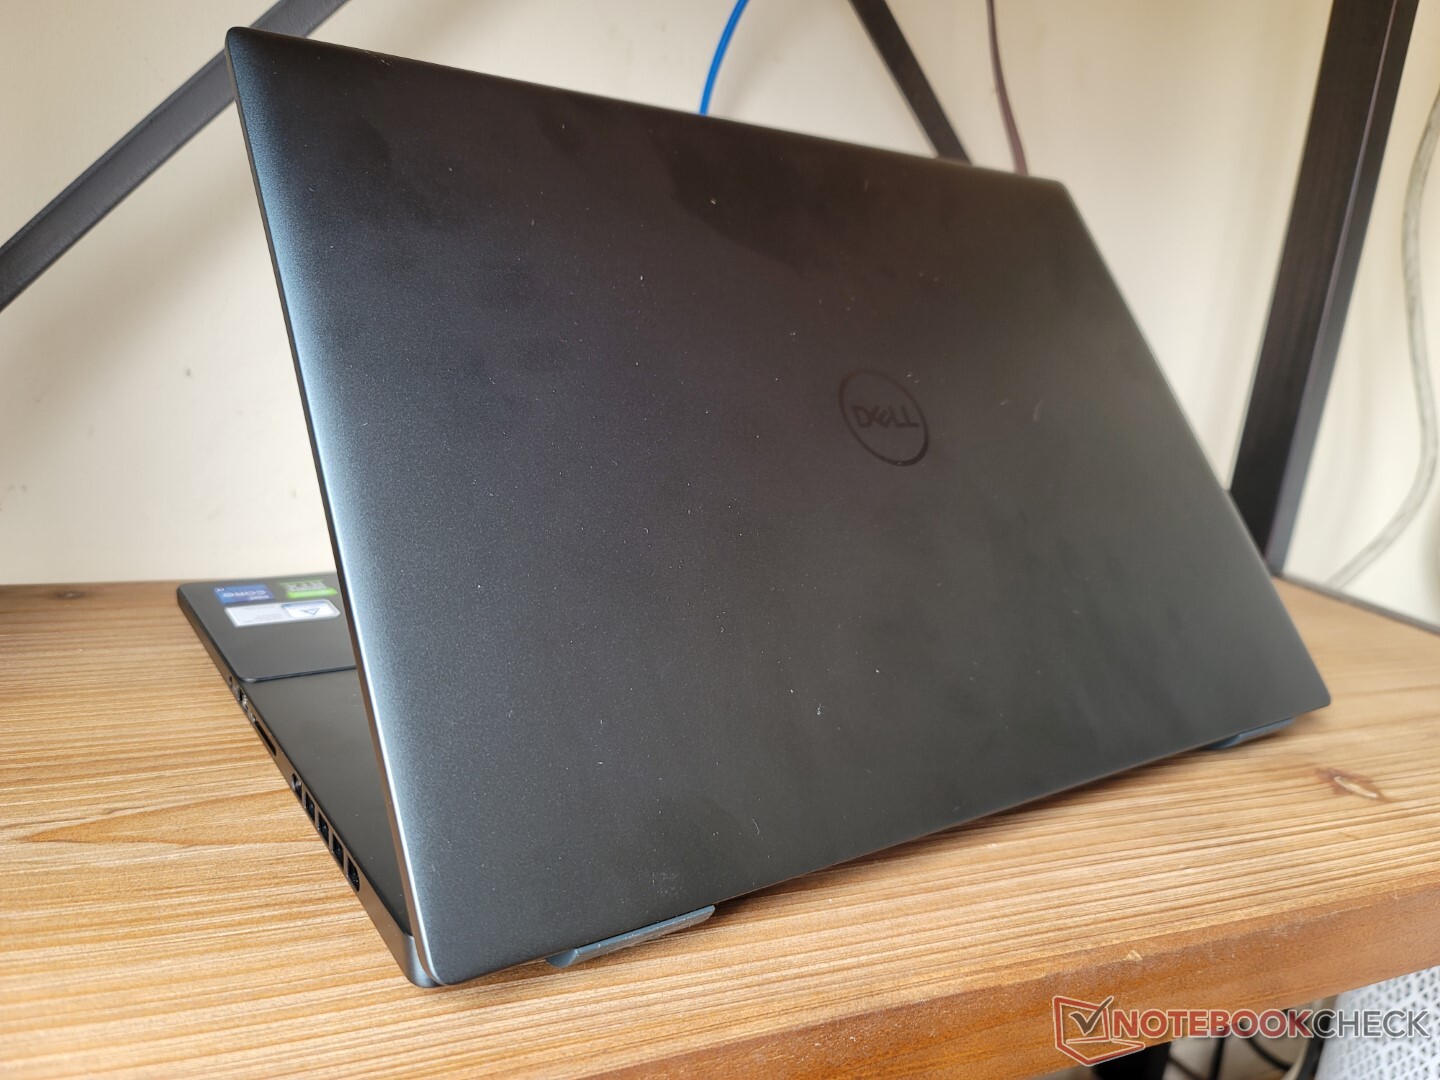
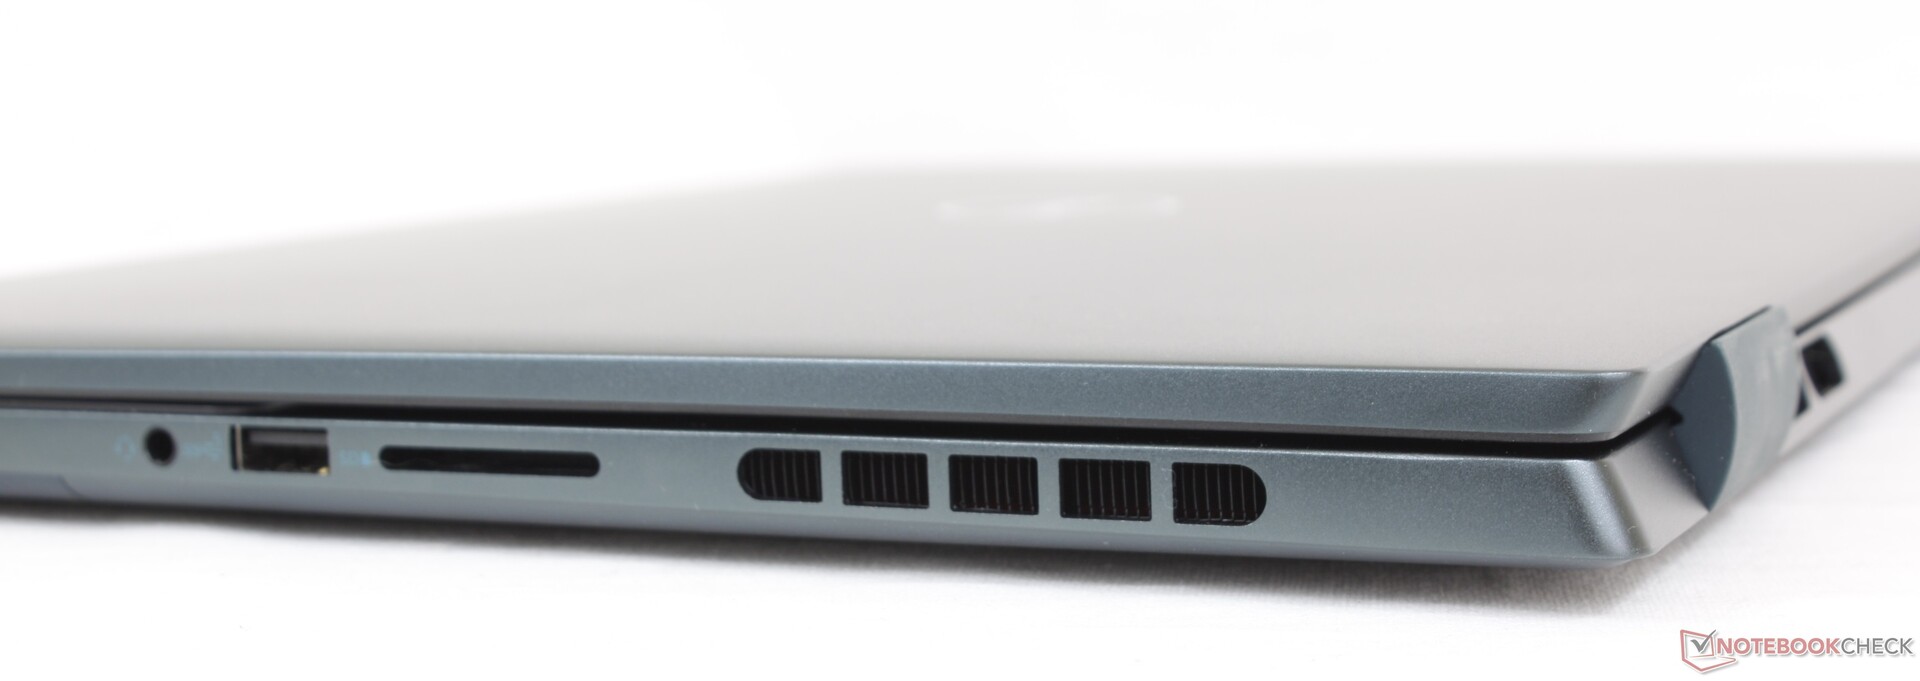
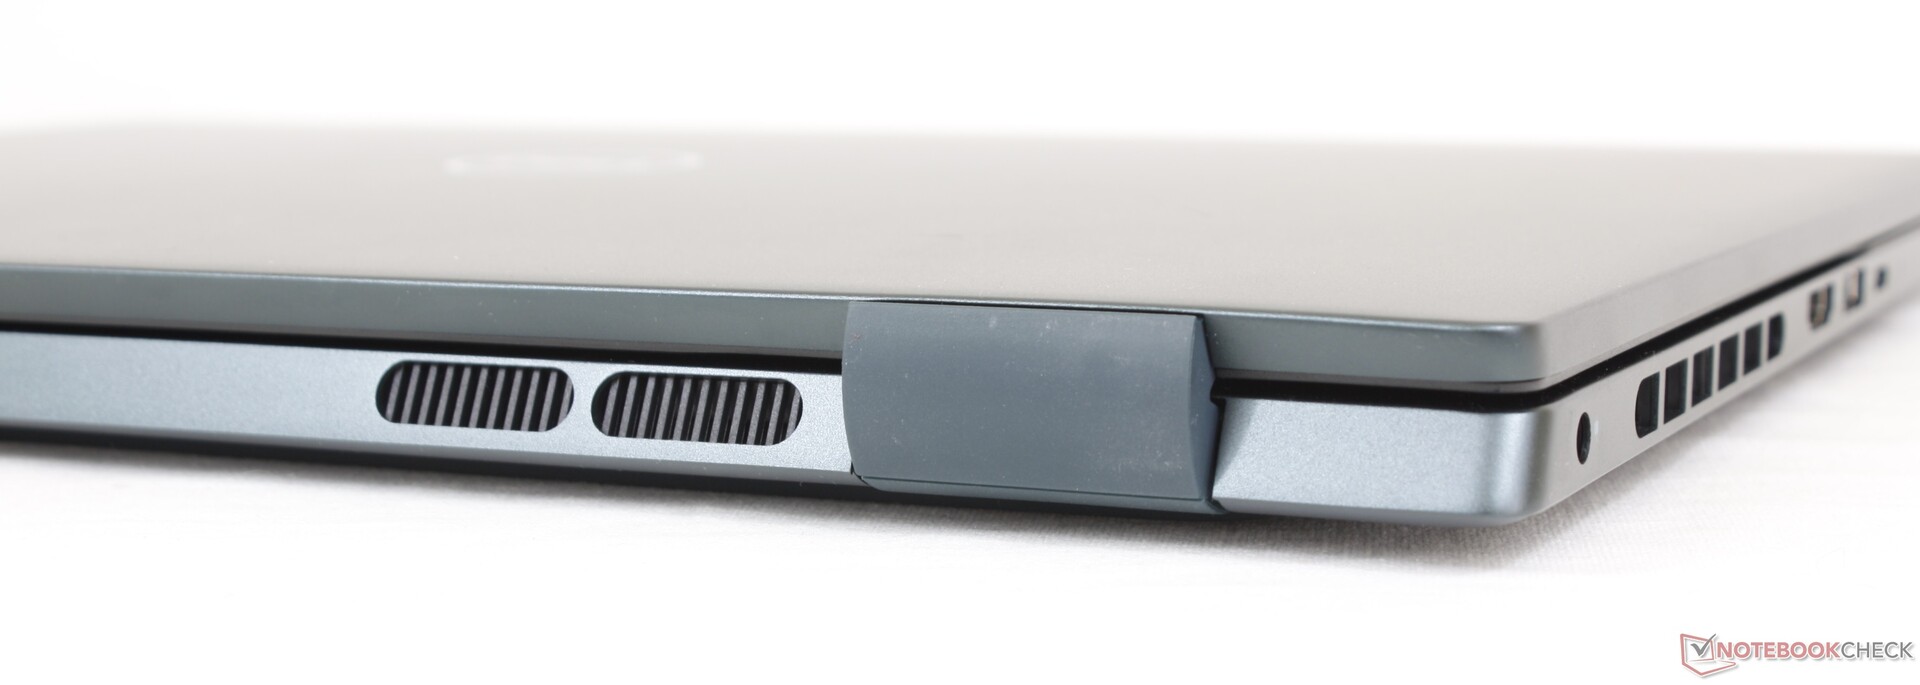
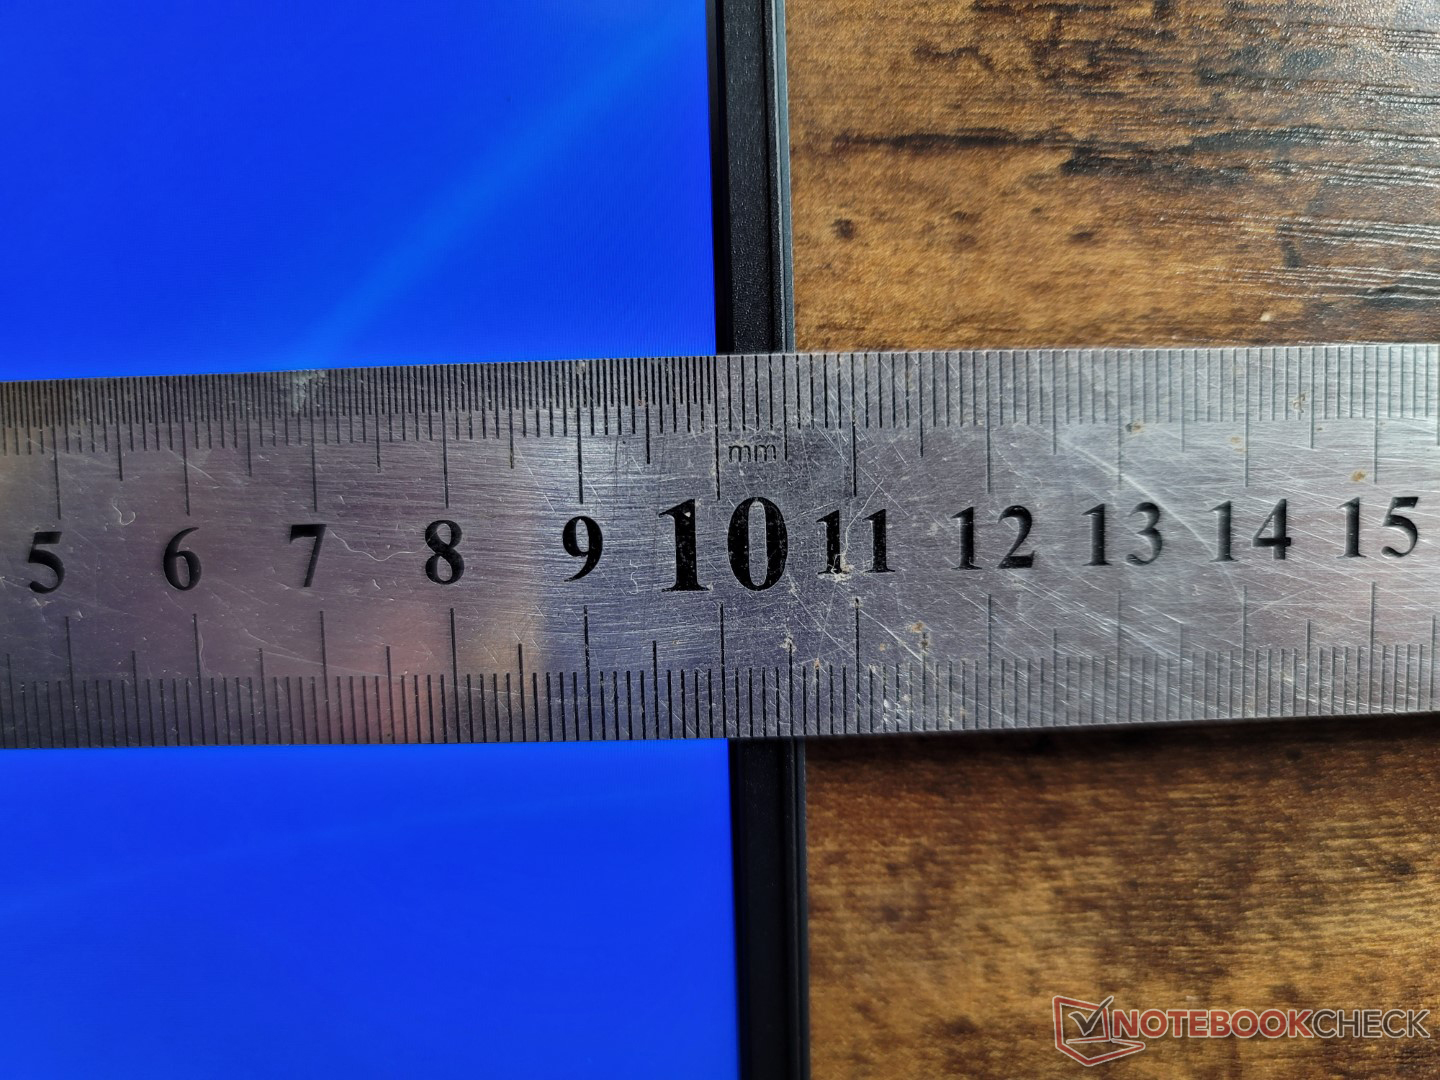
Visualmente, as diferenças entre os modelos 2021 e 2022 são imediatamente perceptíveis. As grelhas de ventilação ao longo dos lados e atrás, por exemplo, são agora retangulares e ovais, respectivamente, ao invés de círculos. As bordas e os cantos cromados agora desapareceram para uma aparência mais monocromática e menos ornamentada
A qualidade de construção permanece praticamente a mesma. A base metálica torce e range um pouco mais do que em um XPS ou Spectre mais caro e isto é especialmente verdade em relação à tampa. Esperávamos que todas as mudanças visuais levassem a um chassi mais forte, mas este não parece ser o caso. Se você ainda está balançando o modelo 2021, então não está perdendo muito do ponto de vista do projeto com o modelo 2022.
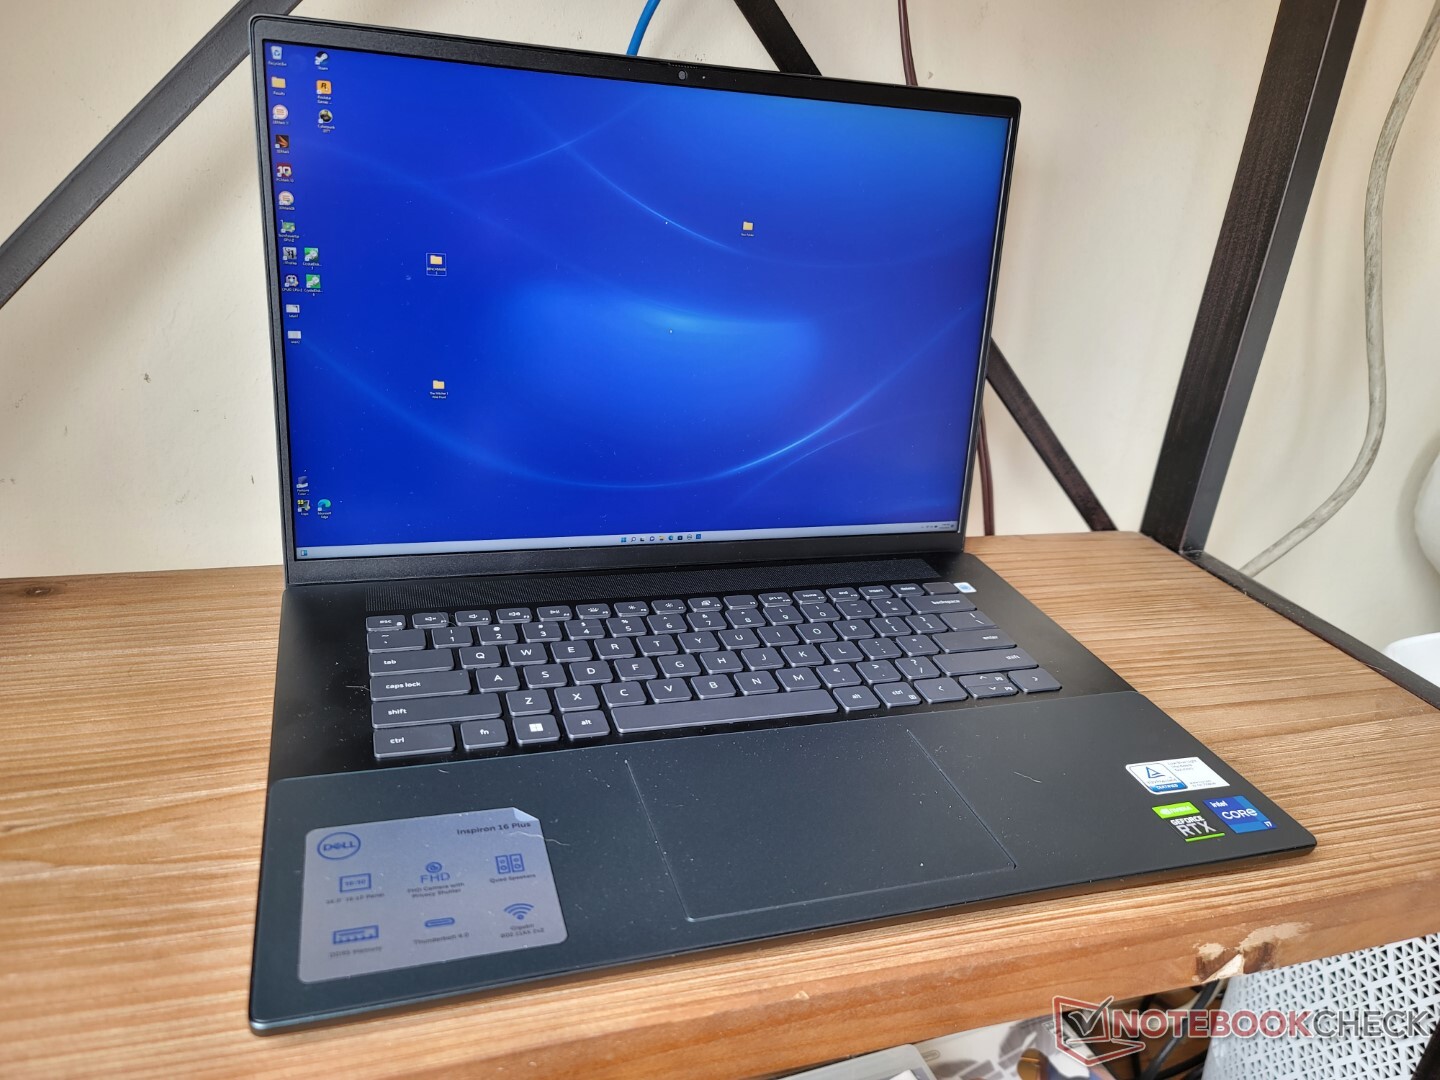
Uma de nossas reclamações sobre o Inspiron 16 Plus 7610 foi seu peso e isto continua a ser verdade para o 7620, apesar do redesenho do chassi. Com 2 a 2,1 kg, o sistema é algumas centenas de gramas mais pesado que o de 16 polegadas Acer Swift X ou Huawei MateBook D 16. O novo design também não é menor, já que as dimensões são na verdade ligeiramente maiores em pegada sobre o 7610.
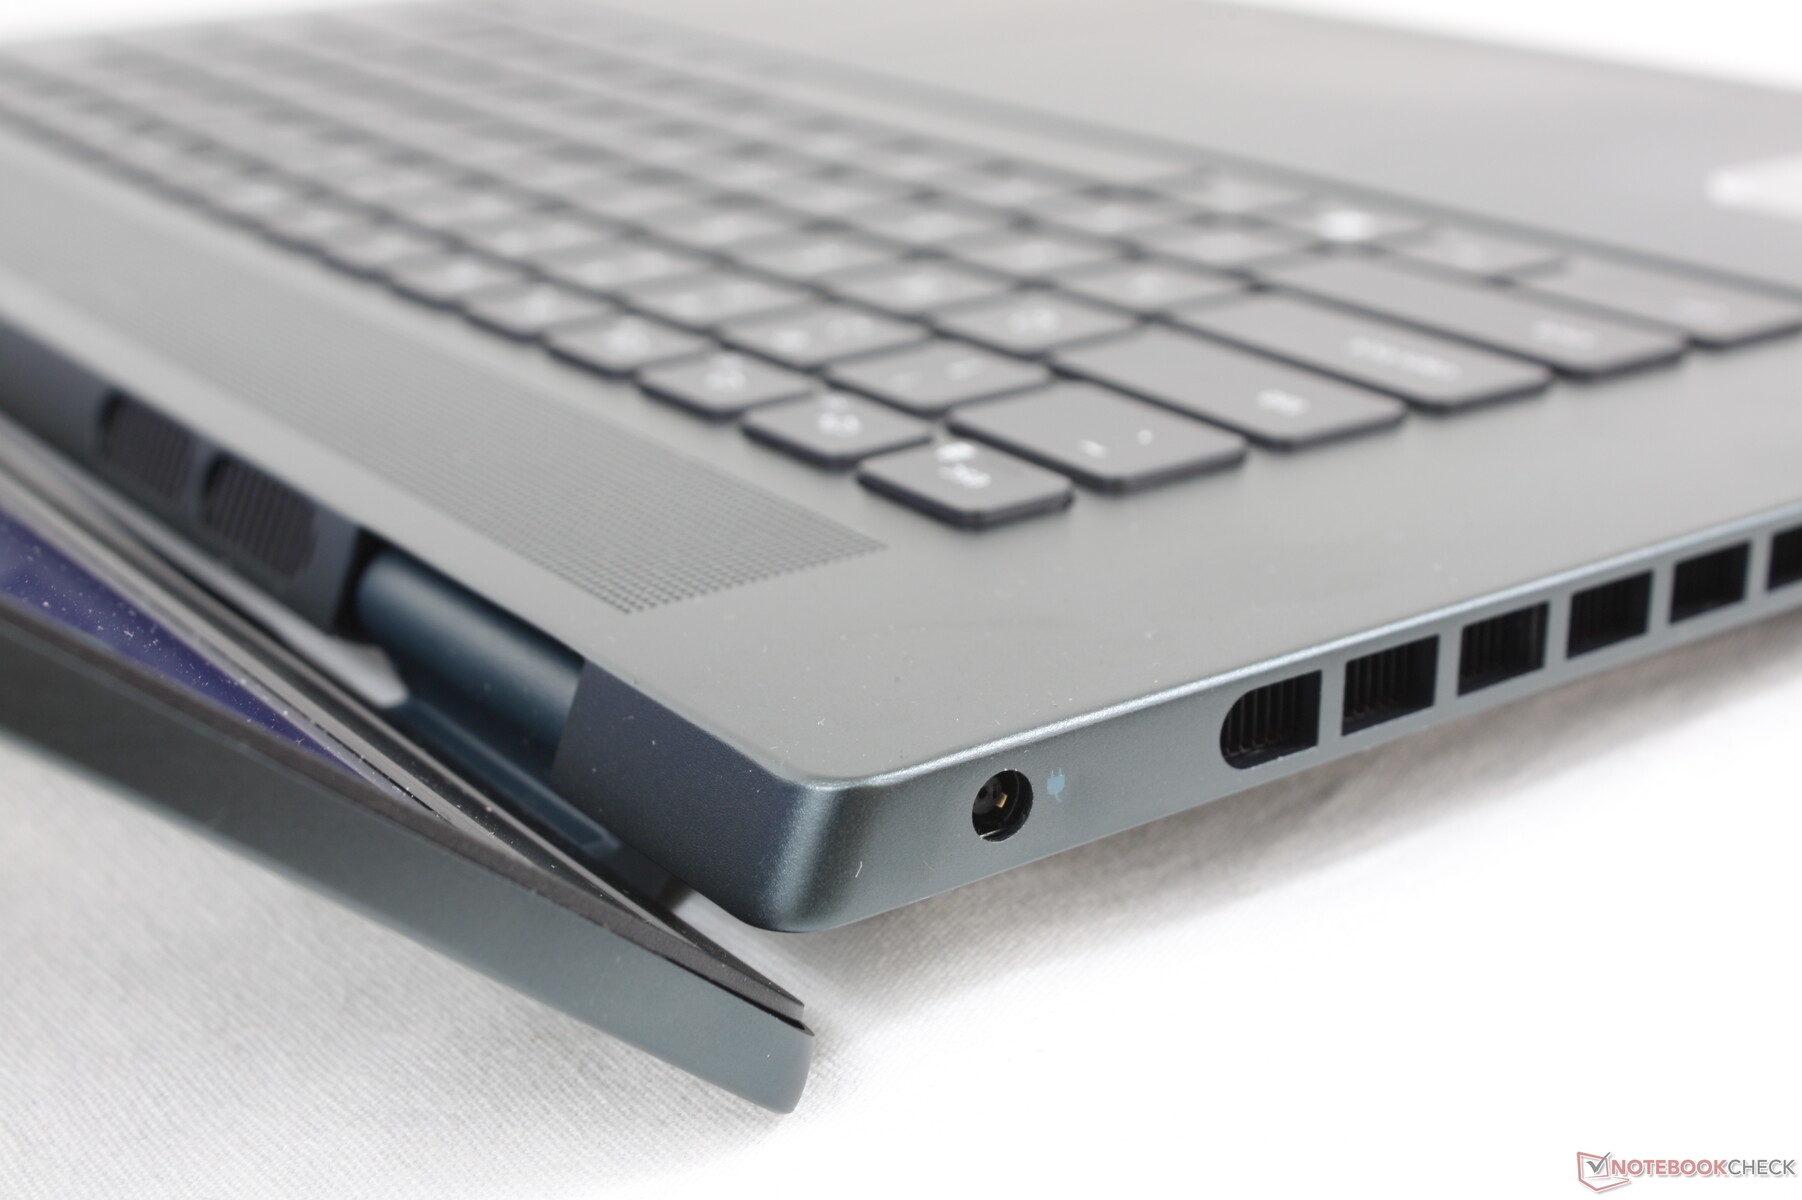
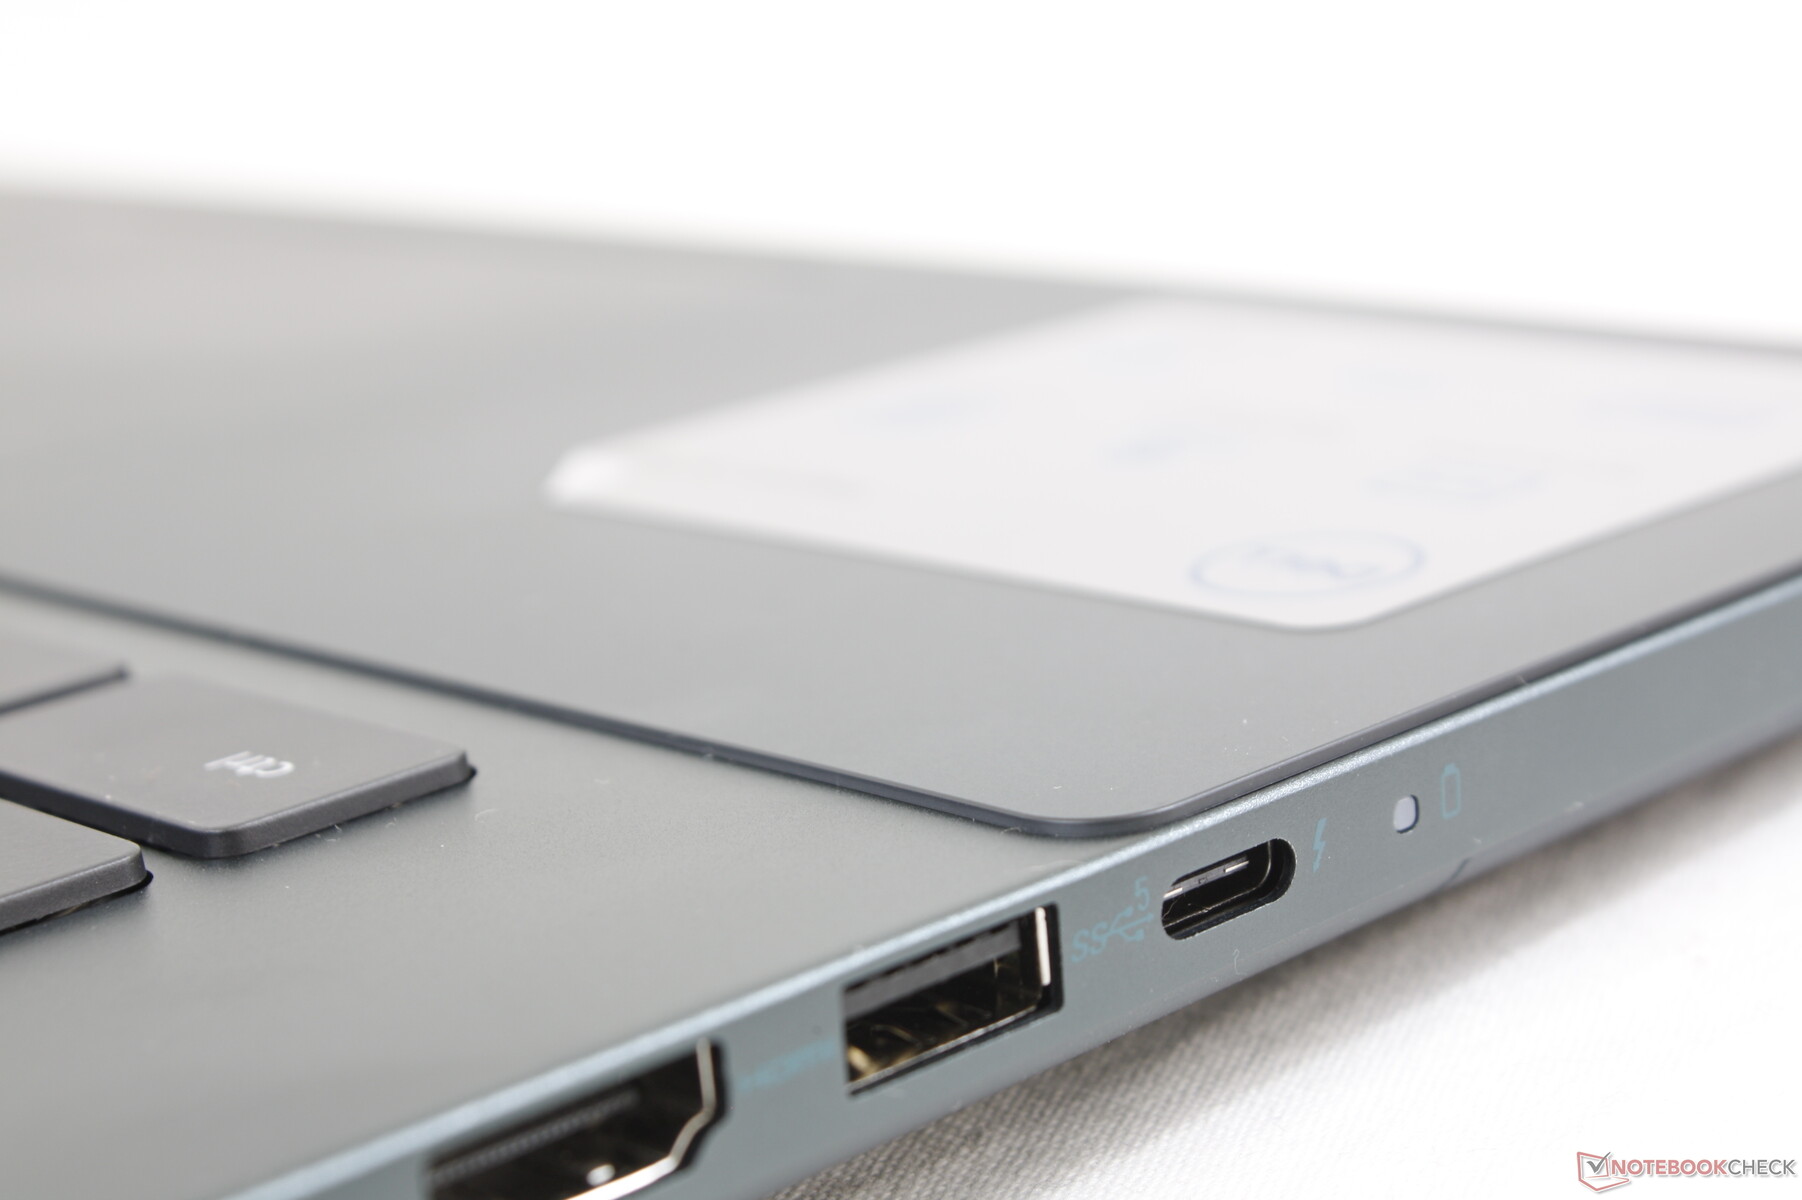
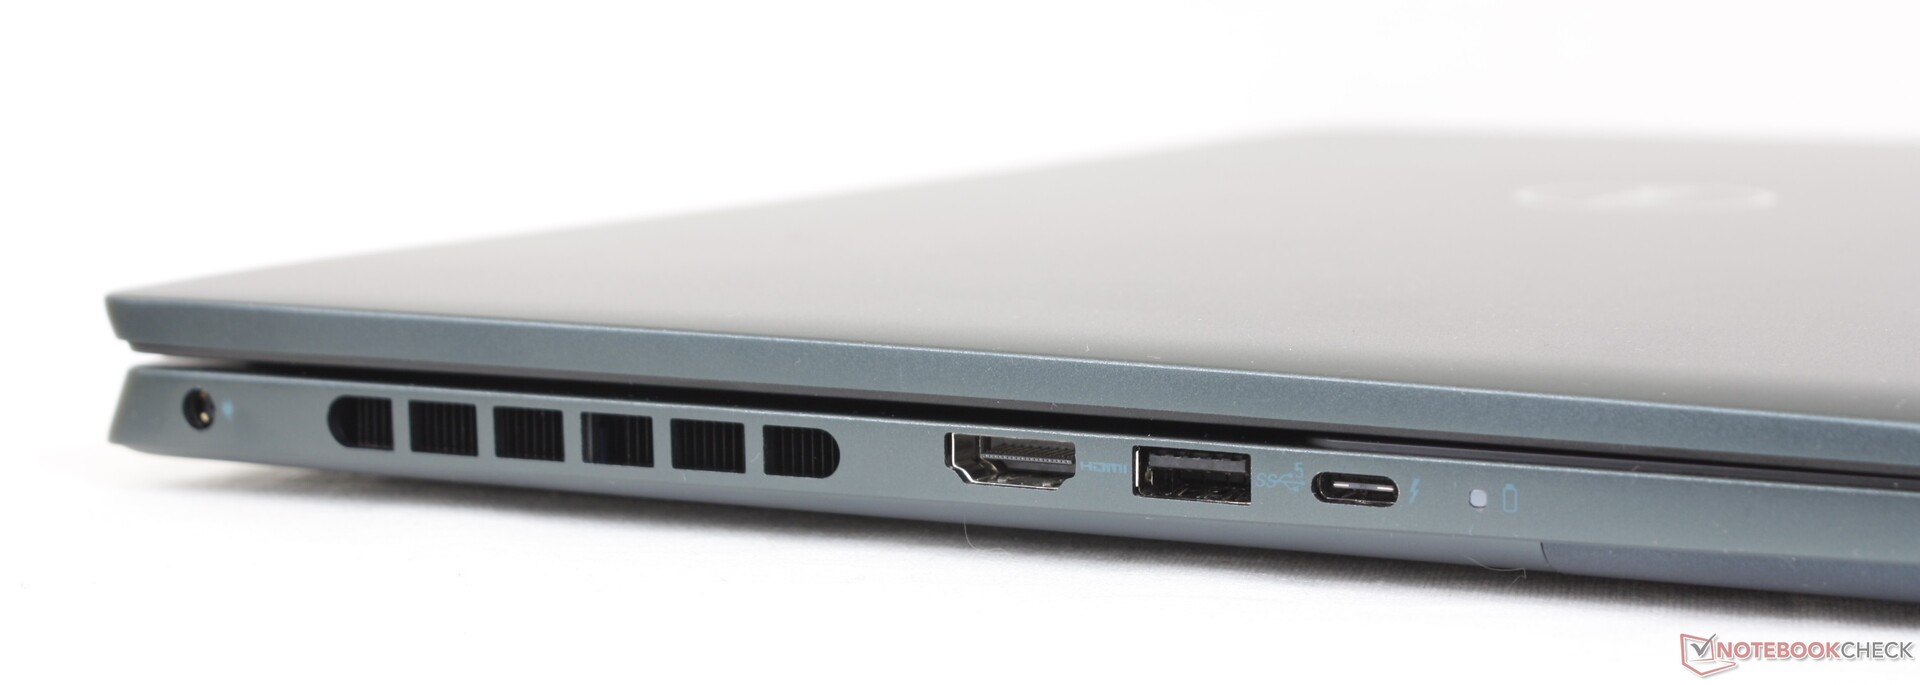
Conectividade - Suporte Thunderbolt 4
O 7620 transporta todos os mesmos portos encontrados no 7610, apesar das mudanças externas. Uma segunda porta USB-C, como na Lenovo Yoga 7 16 Gen 7 teria sido bom ter dado o quão grande e pesada é a unidade.
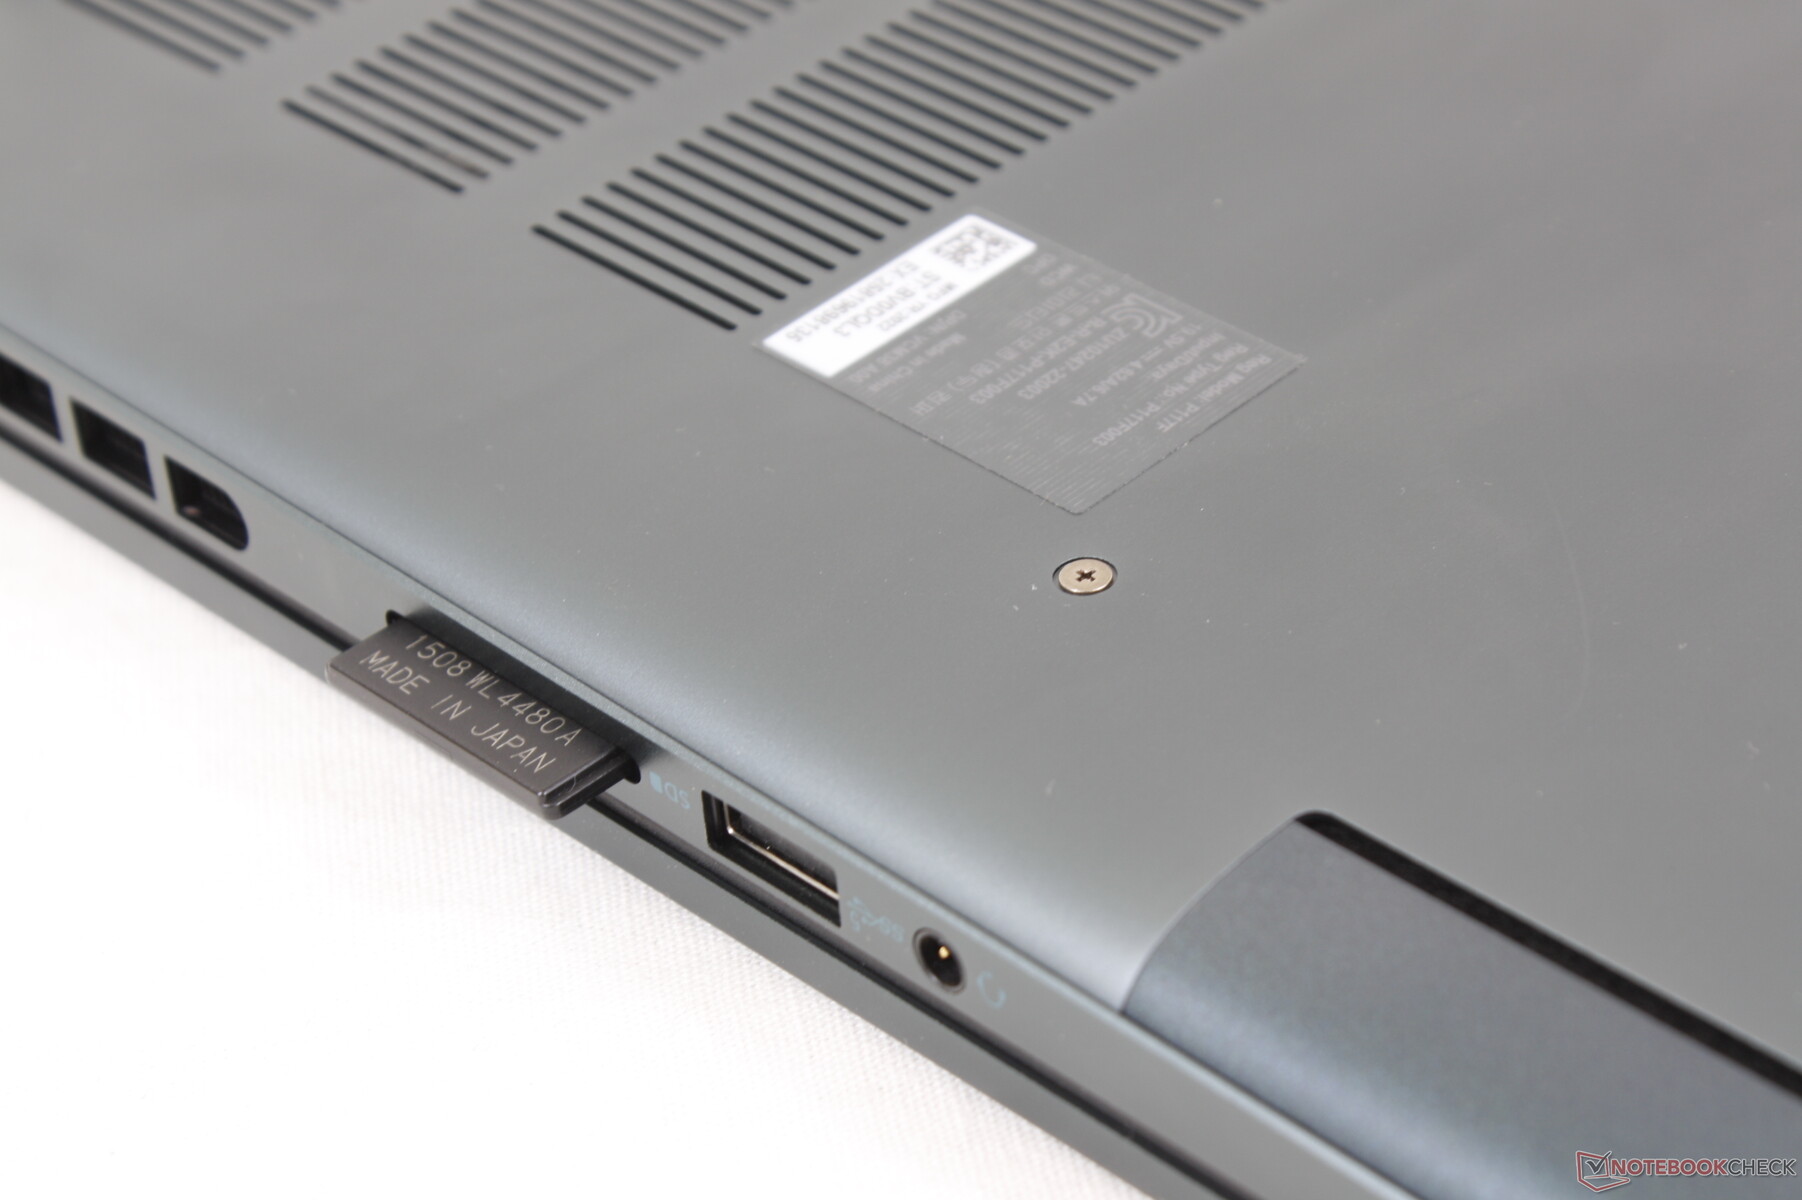
Leitor de cartões SD
As taxas de transferência com o cartão SD continuam a ser muito lentas. Está claro agora que a Dell quer que os usuários atualizem para o série XPS de preços se eles quiserem um desempenho mais rápido do cartão SD.
Observe que o RTX 3060 SKU vem com um leitor MicroSD em vez de um leitor de tamanho completo.
| SD Card Reader | |
| average JPG Copy Test (av. of 3 runs) | |
| Dell XPS 15 9520 RTX 3050 Ti (Toshiba Exceria Pro SDXC 64 GB UHS-II) | |
| Lenovo Yoga 7 16IAP7 (Toshiba Exceria Pro SDXC 64 GB UHS-II) | |
| Asus Vivobook Pro 16X-M7600QE (AV Pro SD microSD 128 GB V60) | |
| Dell Inspiron 16 Plus 7620 (Toshiba Exceria Pro SDXC 64 GB UHS-II) | |
| Dell Inspiron 16 Plus 7610 (AV PRO microSD 128 GB V60) | |
| maximum AS SSD Seq Read Test (1GB) | |
| Dell XPS 15 9520 RTX 3050 Ti (Toshiba Exceria Pro SDXC 64 GB UHS-II) | |
| Lenovo Yoga 7 16IAP7 (Toshiba Exceria Pro SDXC 64 GB UHS-II) | |
| Asus Vivobook Pro 16X-M7600QE (AV Pro SD microSD 128 GB V60) | |
| Dell Inspiron 16 Plus 7620 (Toshiba Exceria Pro SDXC 64 GB UHS-II) | |
| Dell Inspiron 16 Plus 7610 (AV PRO microSD 128 GB V60) | |
Comunicação
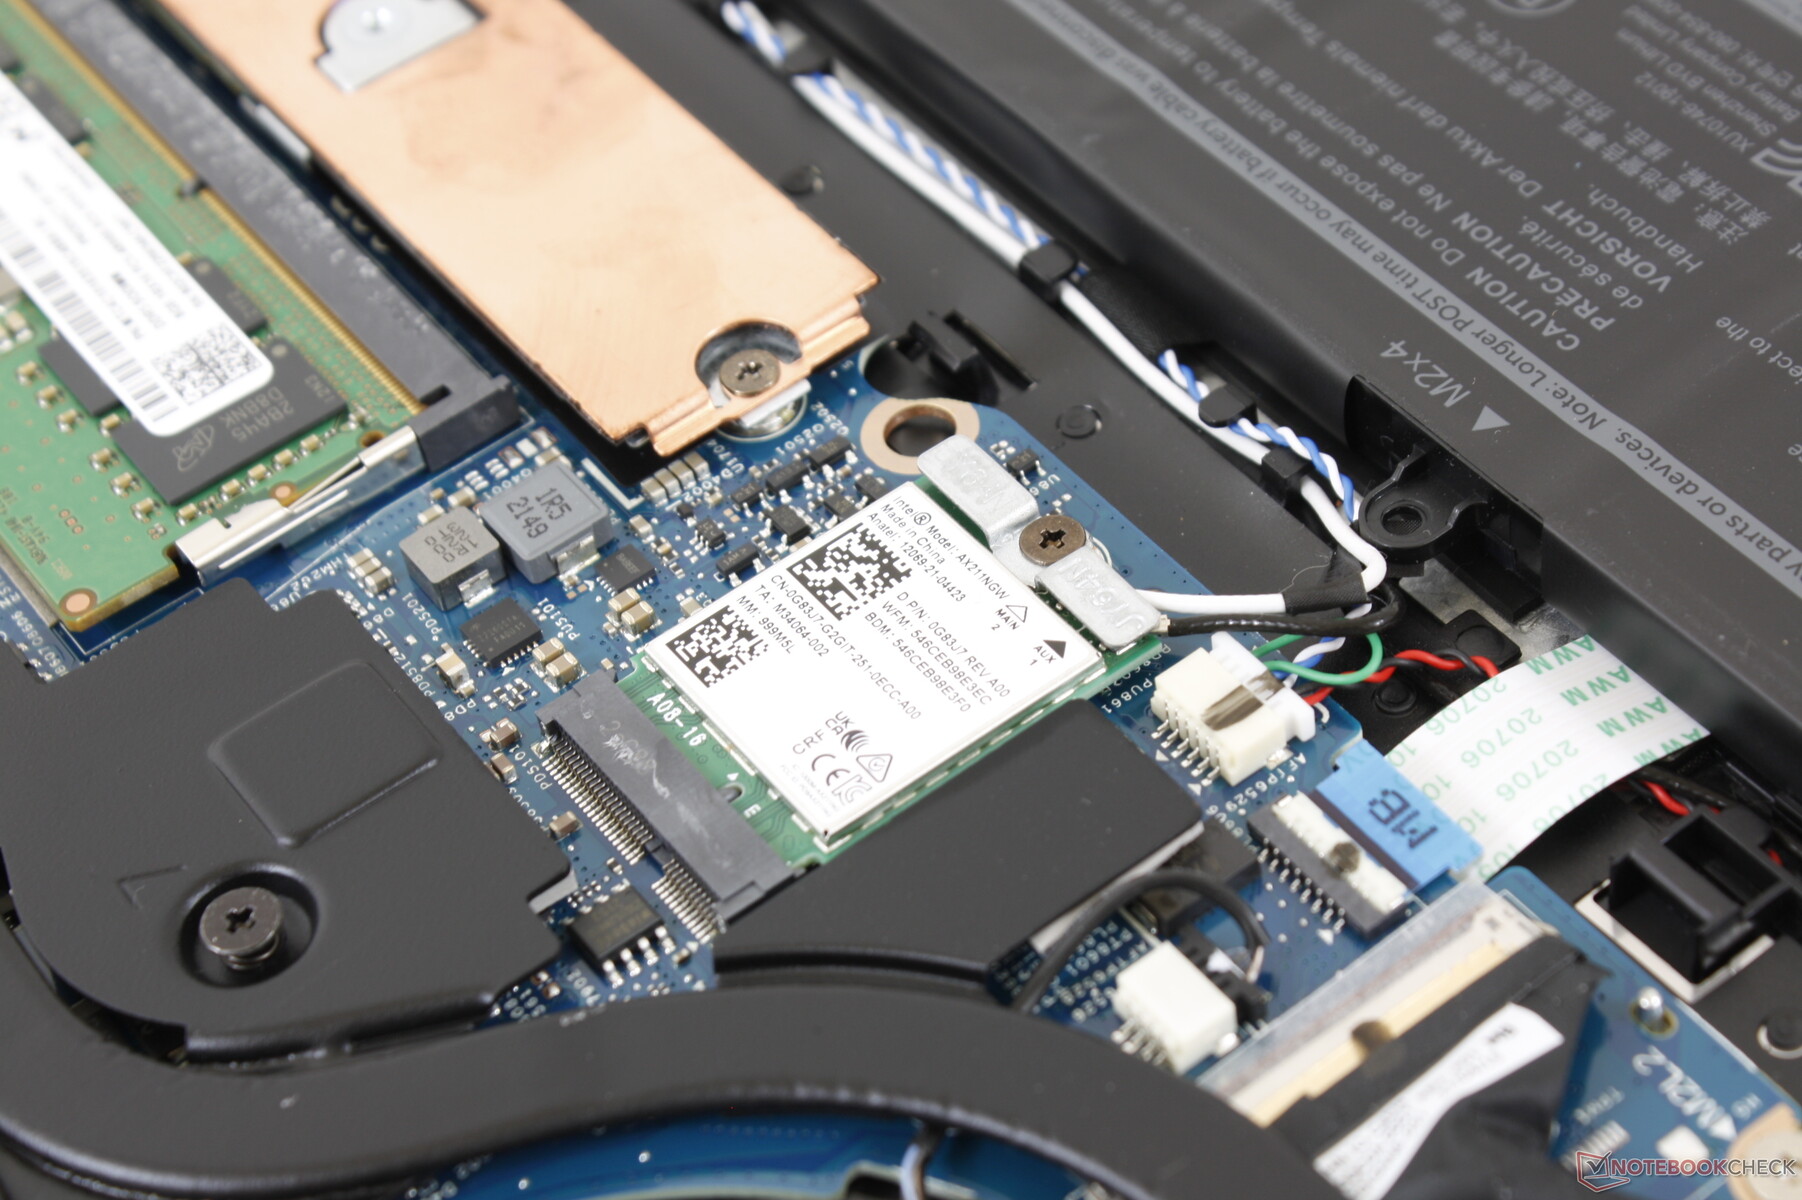
As SKUs podem ser configuradas com o Intel AX201 ou AX211 para conectividade Wi-Fi 6 e Wi-Fi 6E, respectivamente. O AX211 em nossa unidade exibiria excelentes taxas de recepção quando acoplado ao nosso roteador de 6 GHz, mas as taxas de transmissão não são tão estáveis quanto o esperado, mesmo após múltiplas tentativas.
| Networking | |
| iperf3 transmit AX12 | |
| Acer Swift X SFX16-51G-5388 | |
| Dell Inspiron 16 Plus 7610 | |
| Asus Vivobook Pro 16X-M7600QE | |
| iperf3 receive AX12 | |
| Acer Swift X SFX16-51G-5388 | |
| Dell Inspiron 16 Plus 7610 | |
| Asus Vivobook Pro 16X-M7600QE | |
| iperf3 receive AXE11000 6GHz | |
| Lenovo Yoga 7 16IAP7 | |
| Dell Inspiron 16 Plus 7620 | |
| iperf3 transmit AXE11000 6GHz | |
| Lenovo Yoga 7 16IAP7 | |
| Dell Inspiron 16 Plus 7620 | |
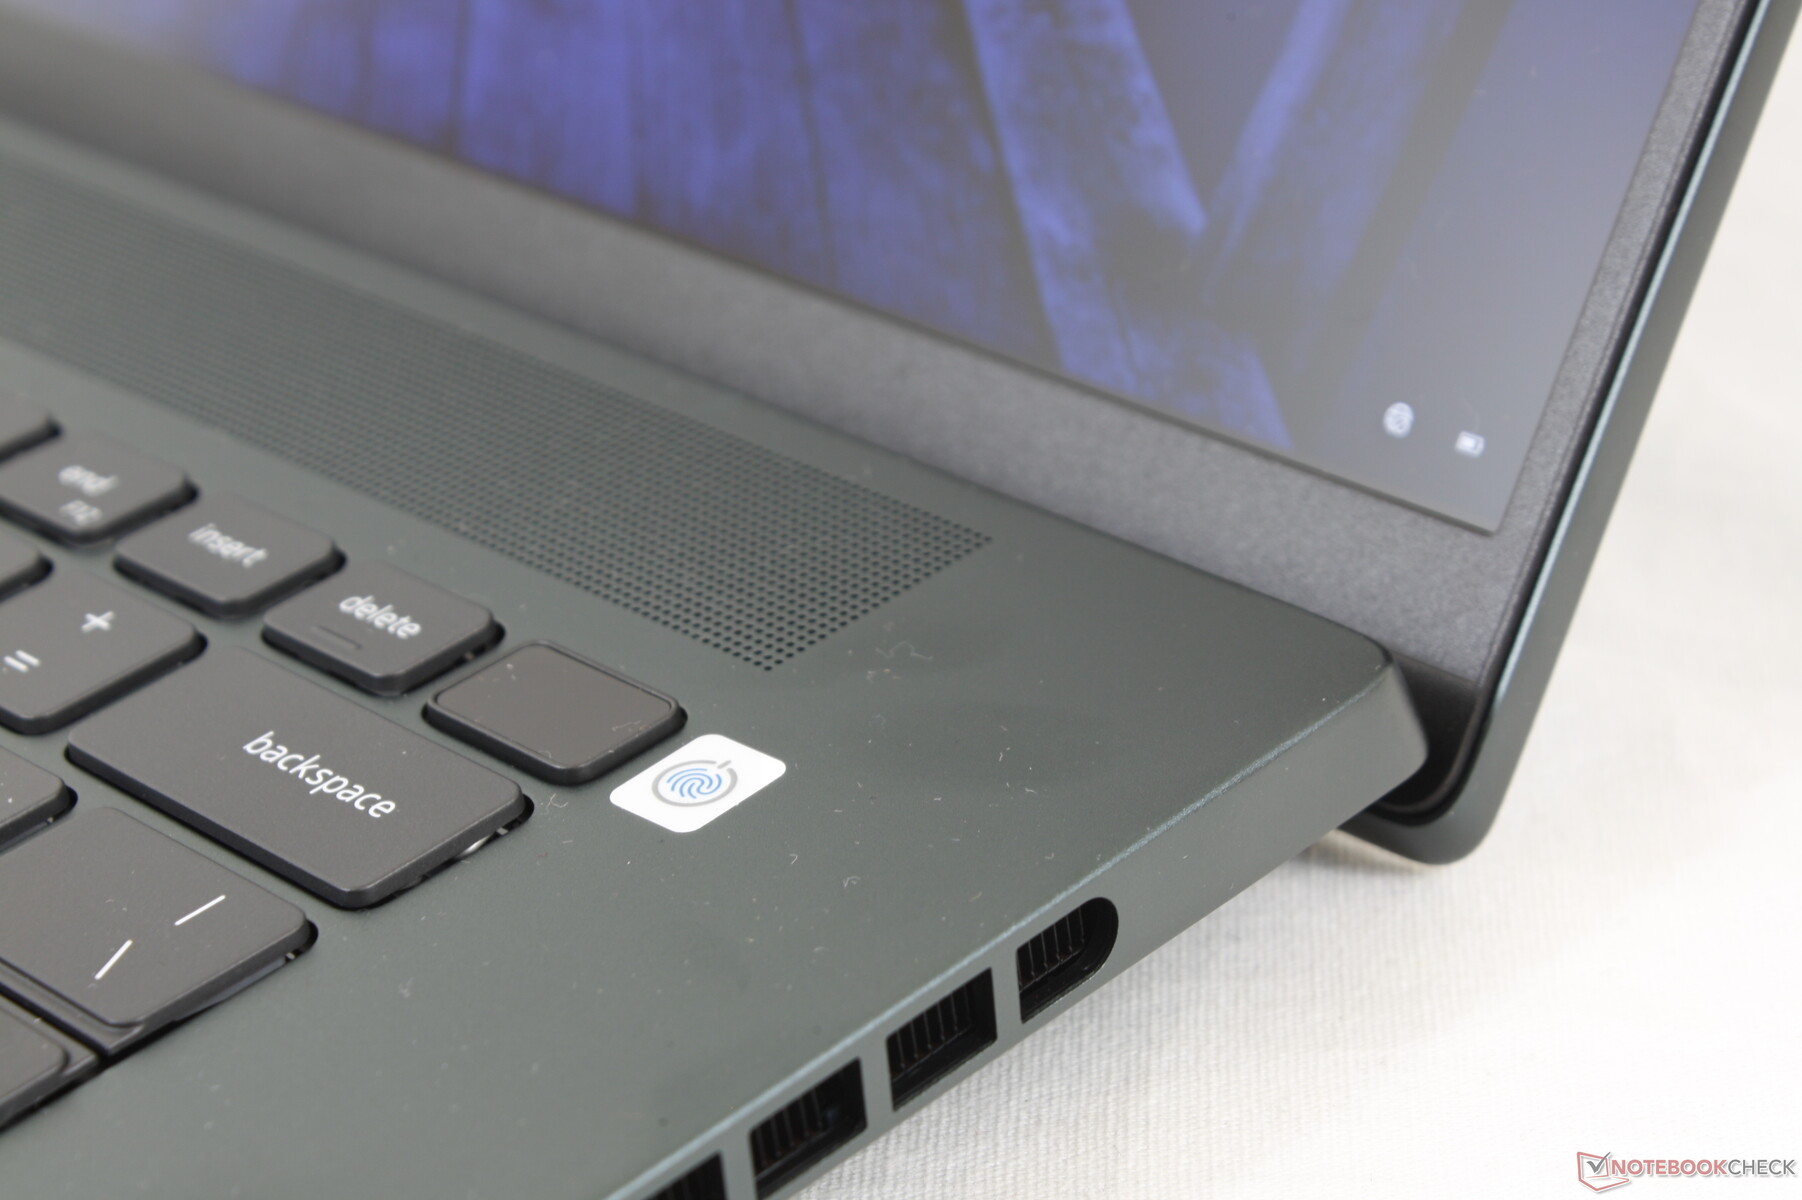
Webcam - Agora 2 MP ao invés de 1 MP
A Dell atualizou a webcam de 720p ou 1 MP no modelo Inspiron 16 Plus 7610 para 1080p ou 2 MP no modelo 7620 para imagens mais limpas. Há suporte para Windows Olá e um obturador físico da webcam para privacidade.


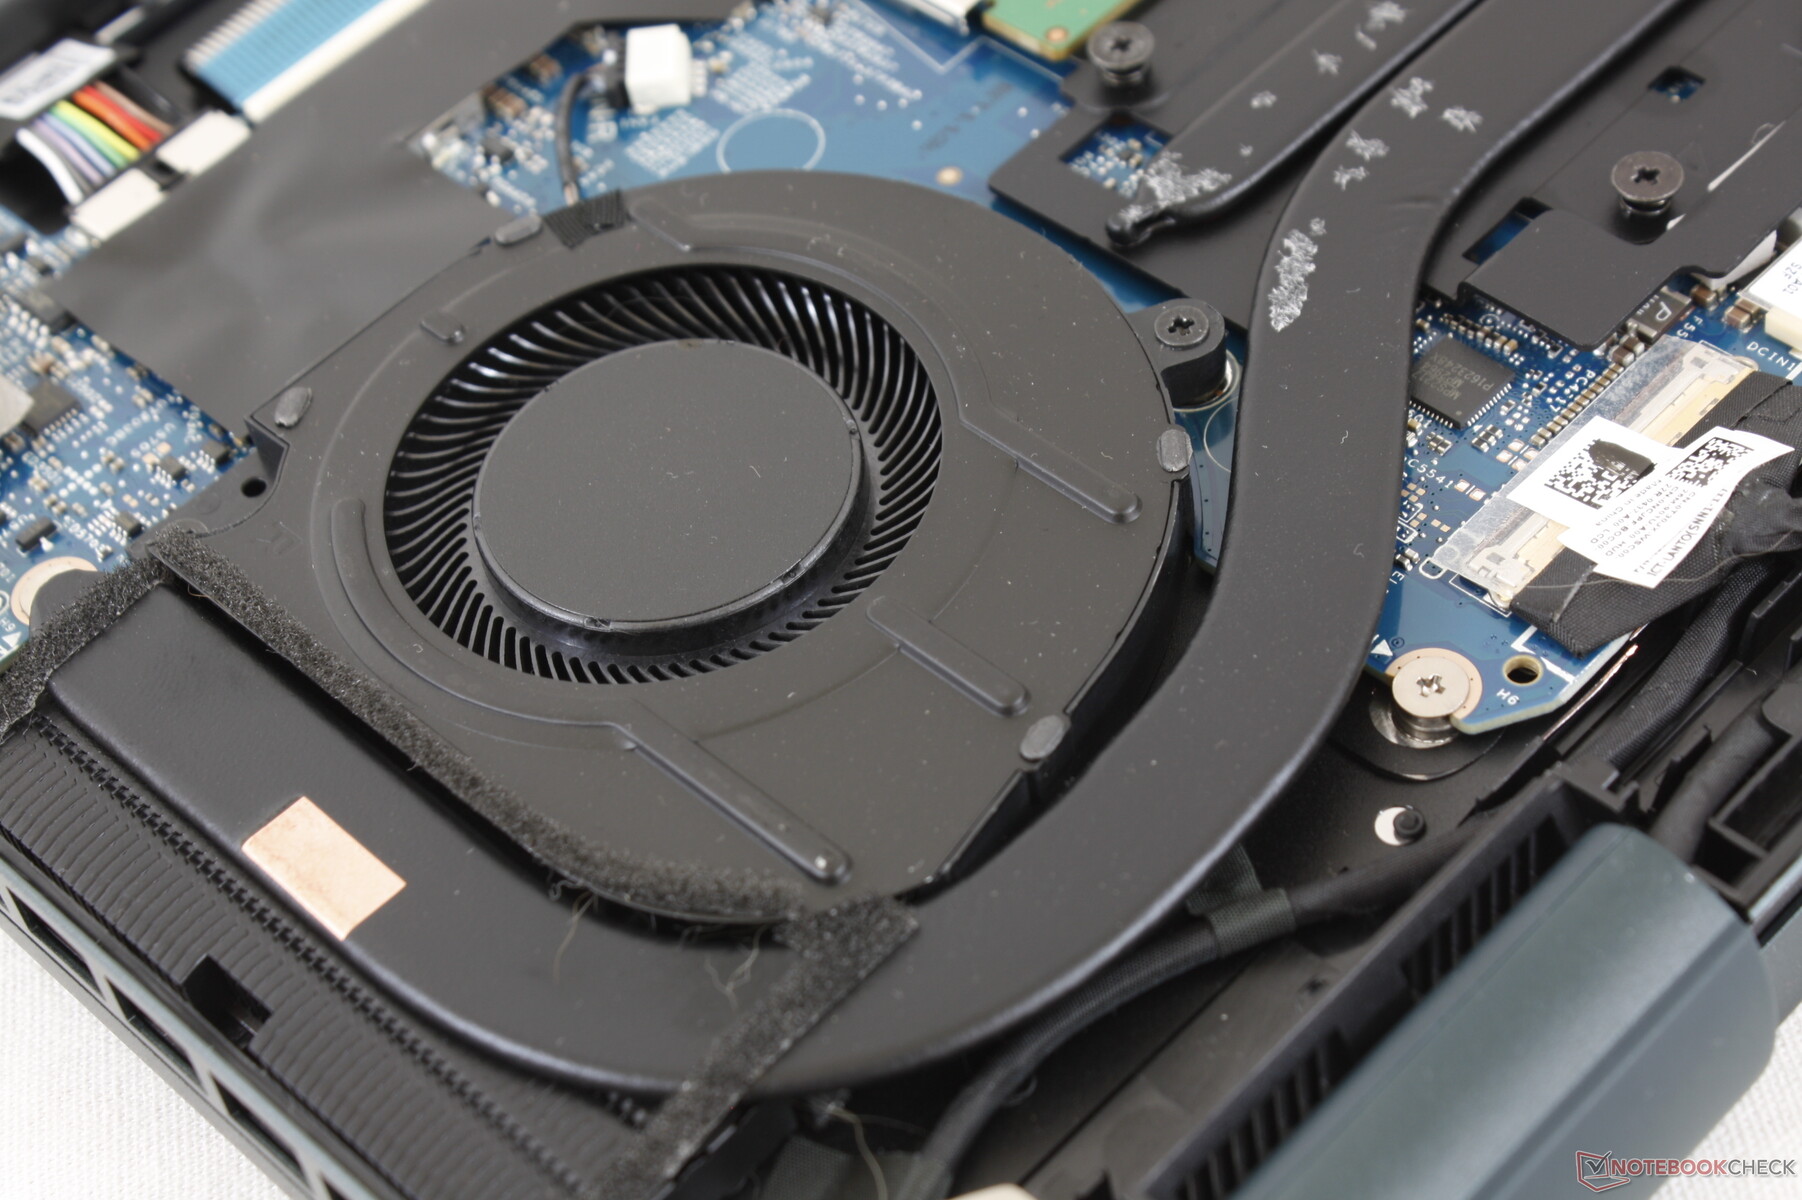
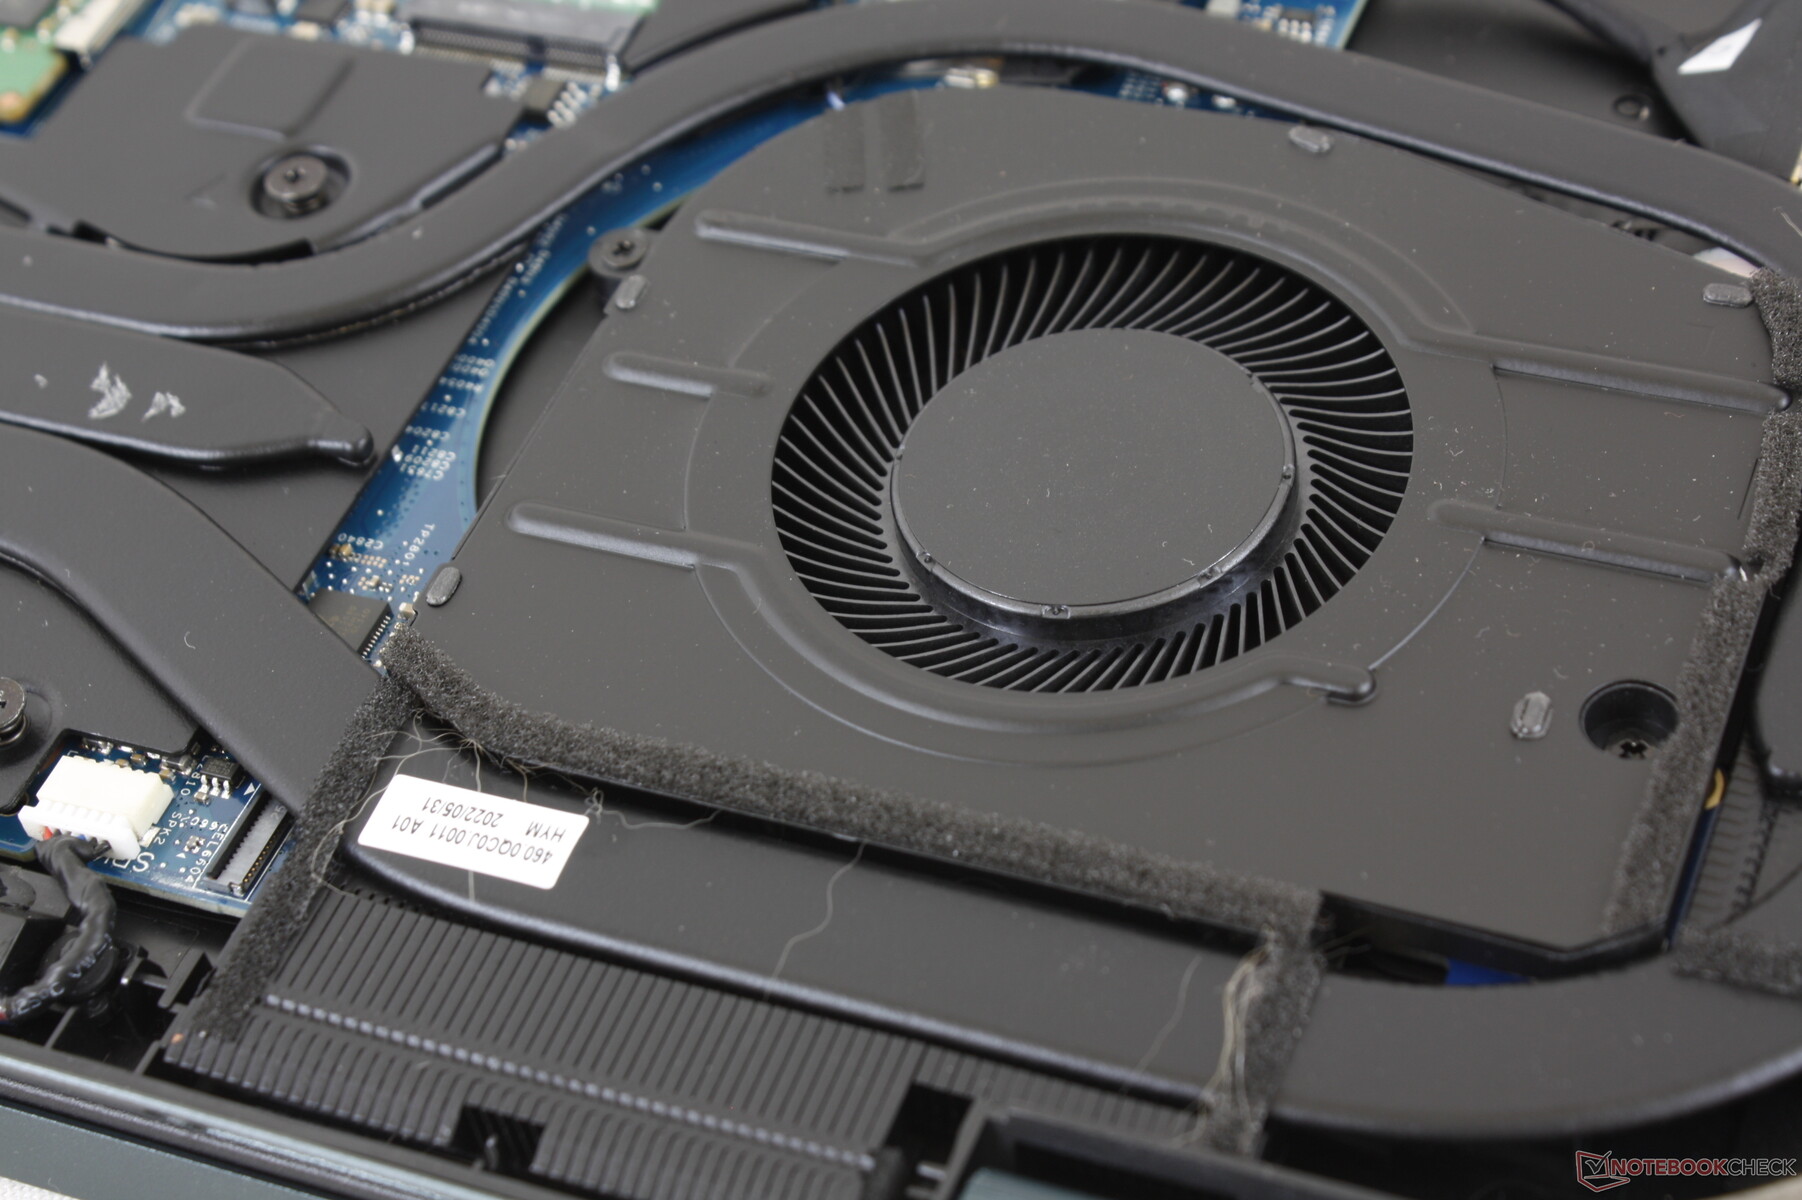
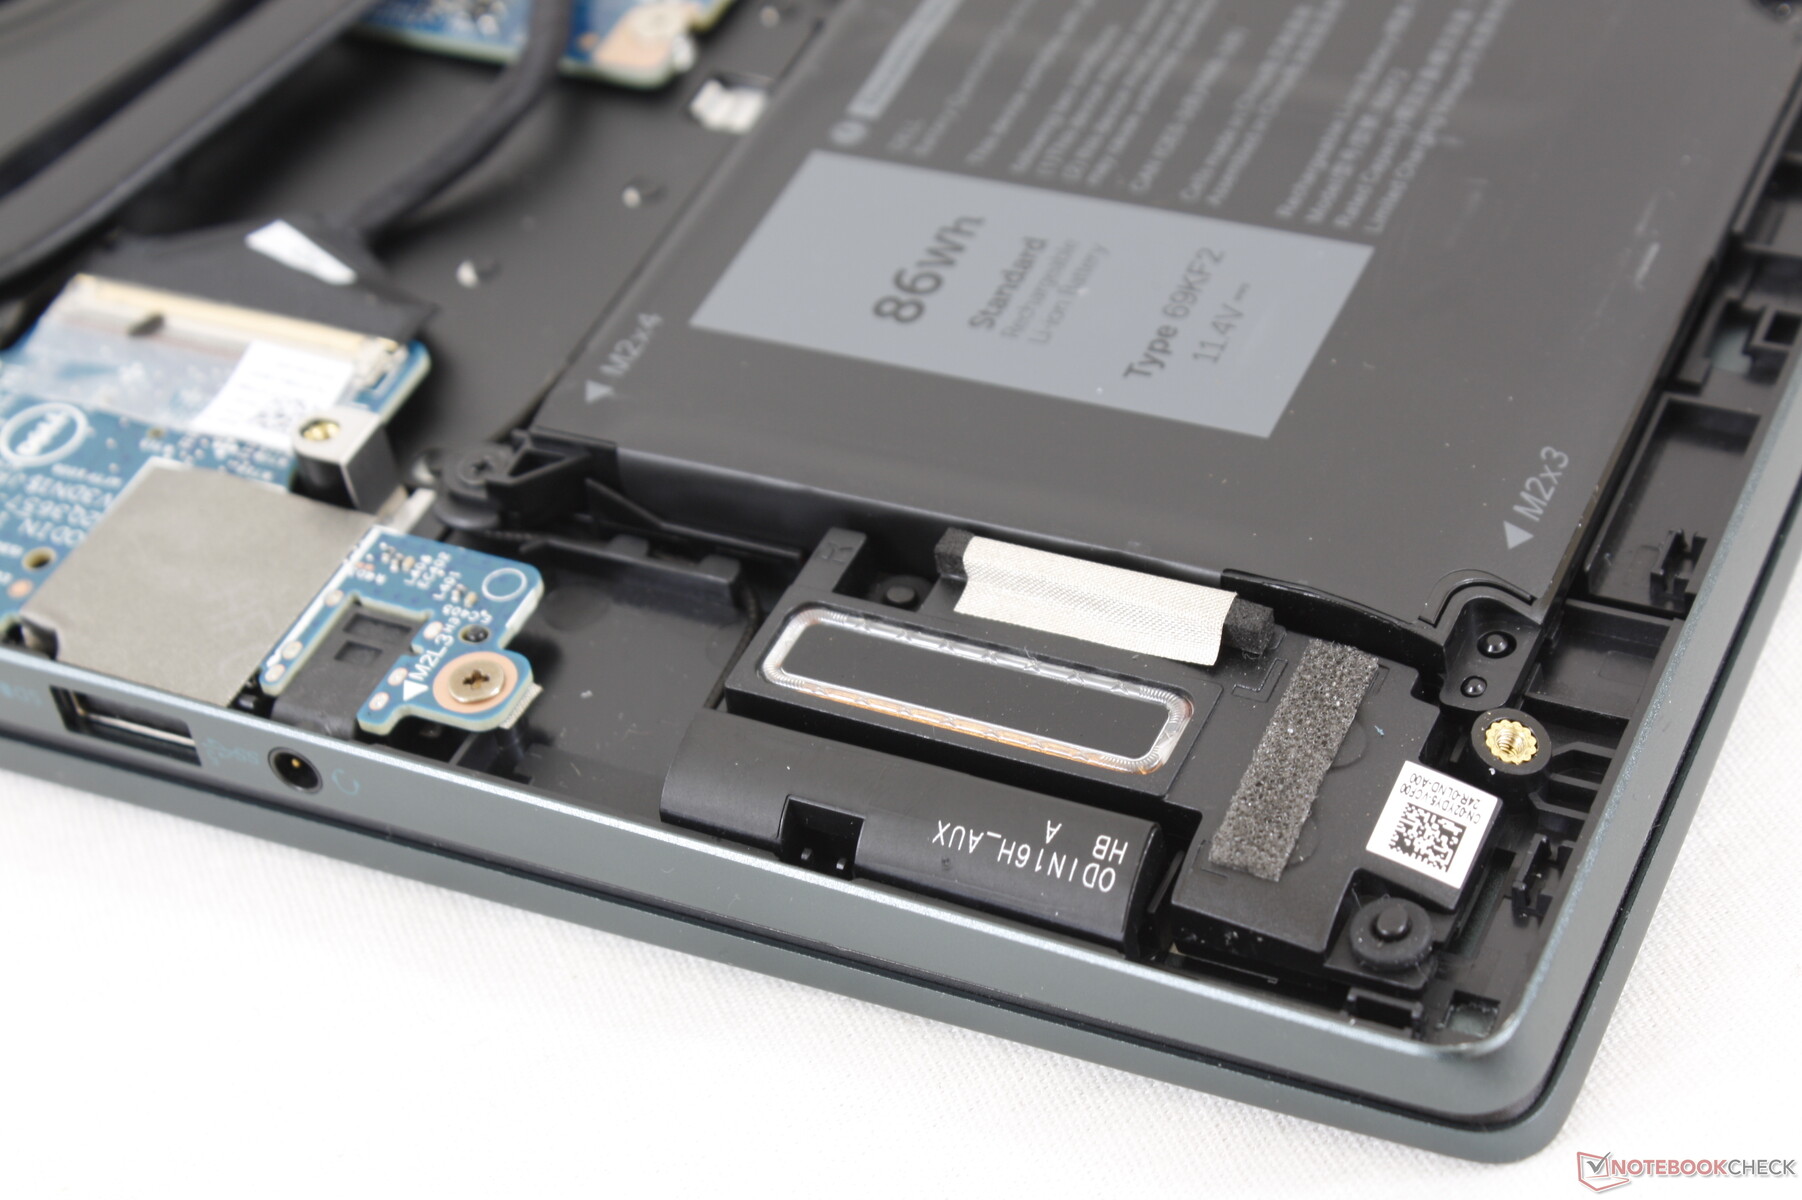
Manutenção
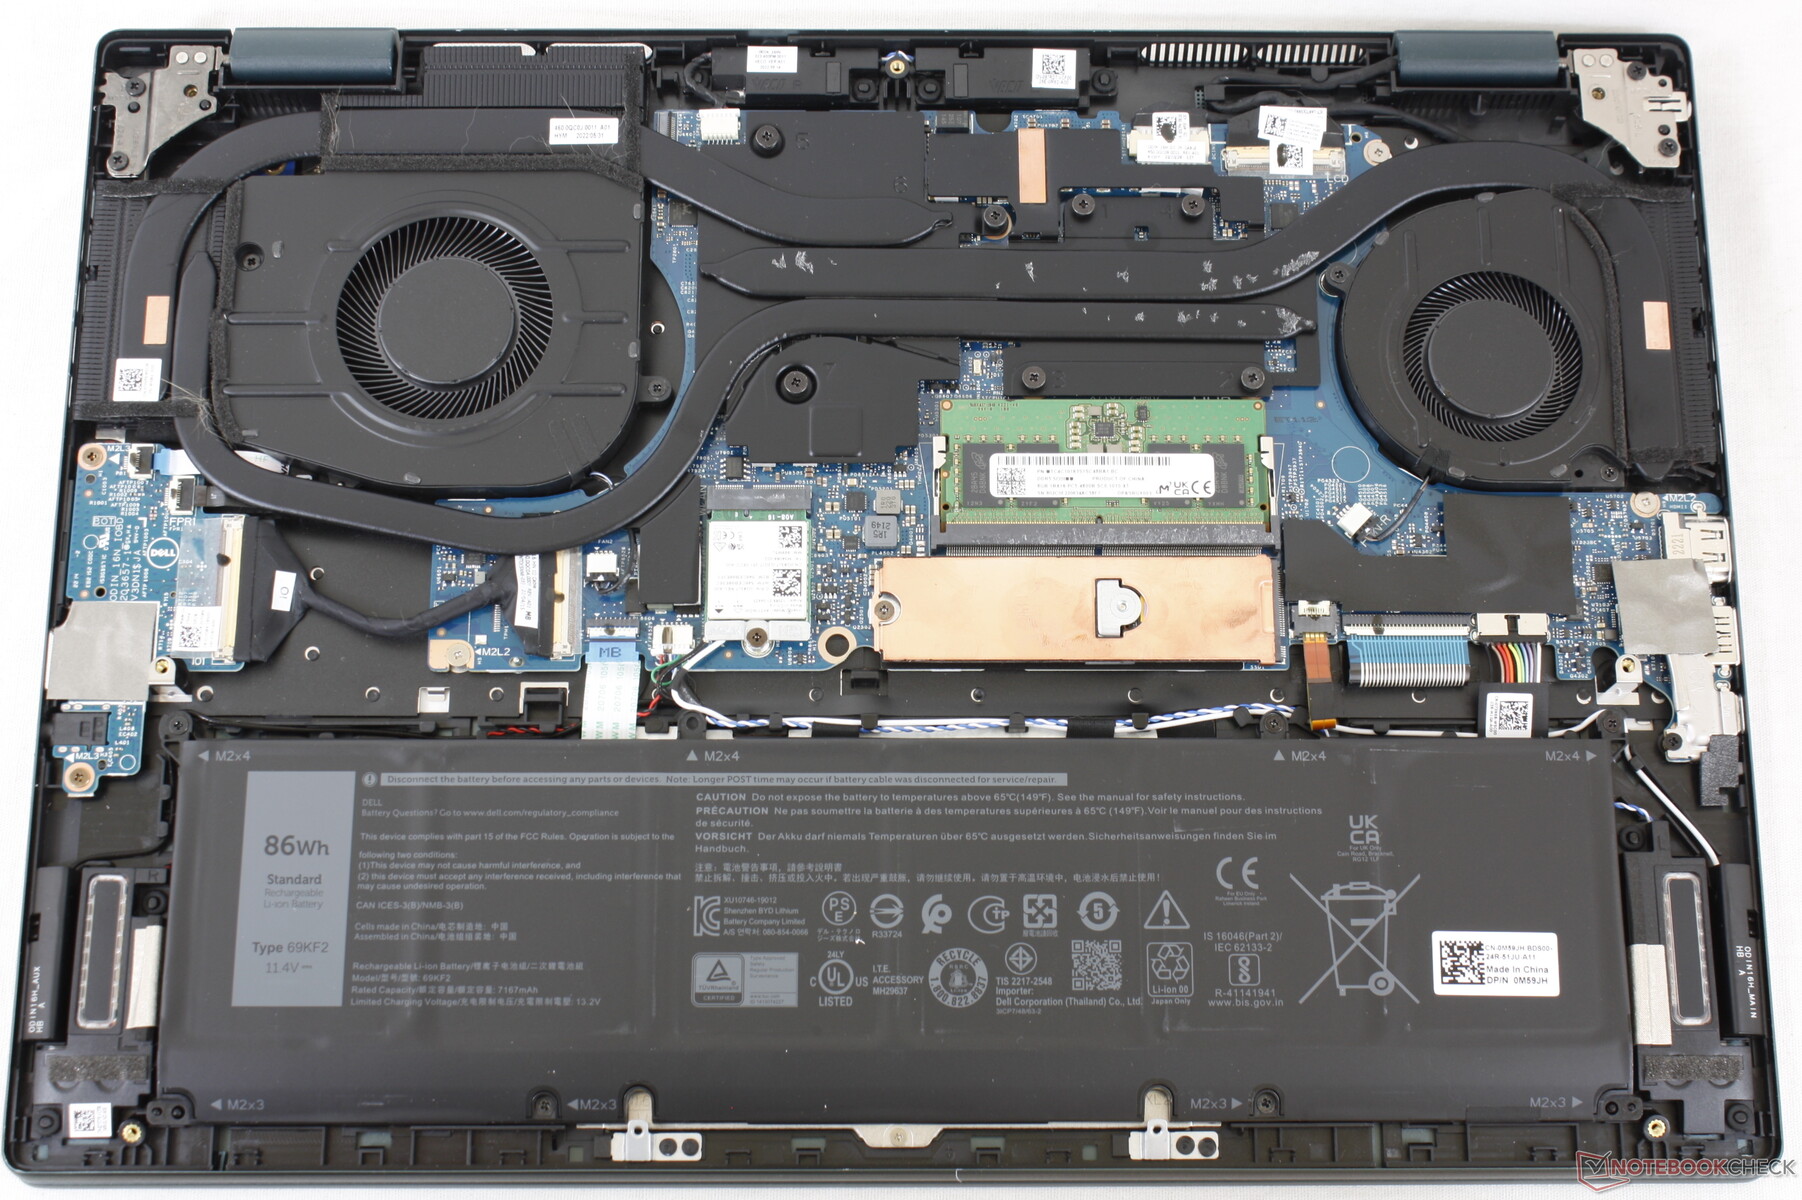
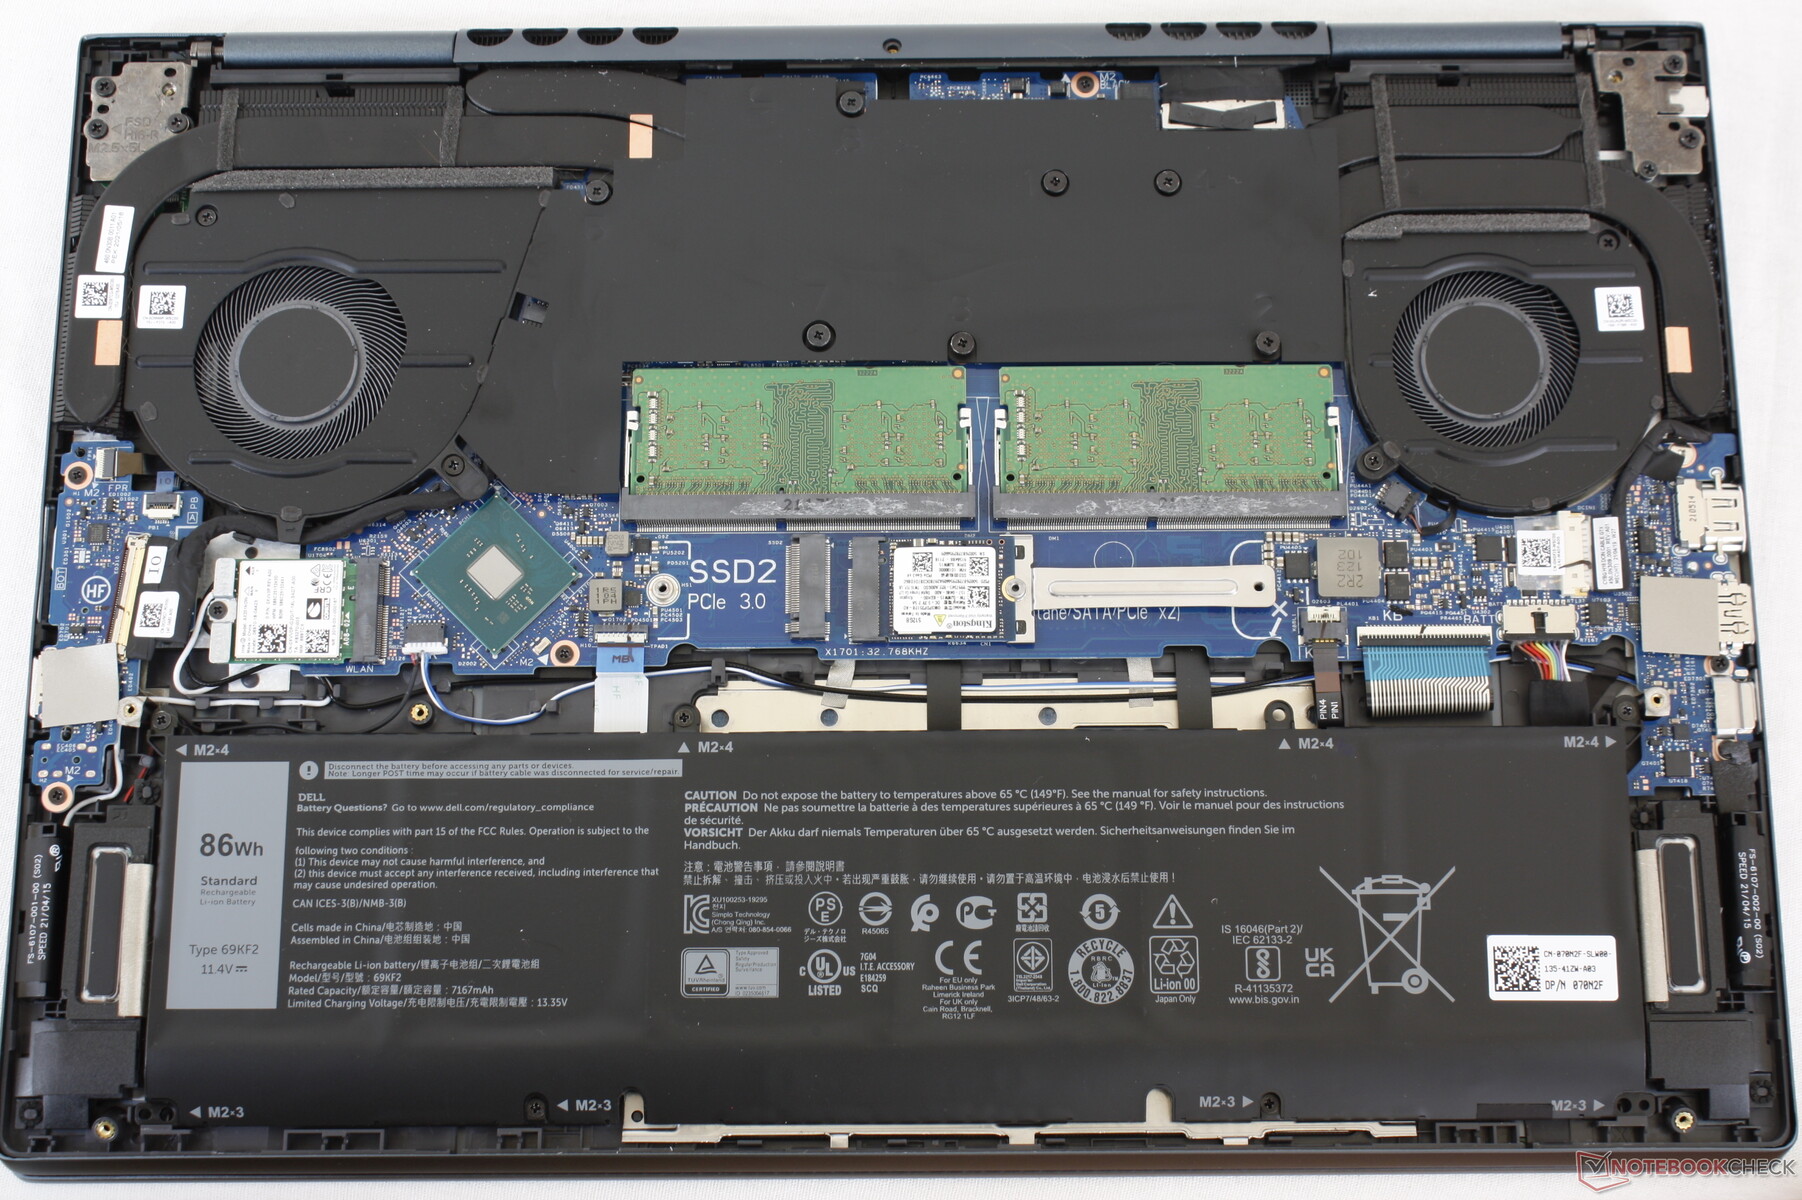
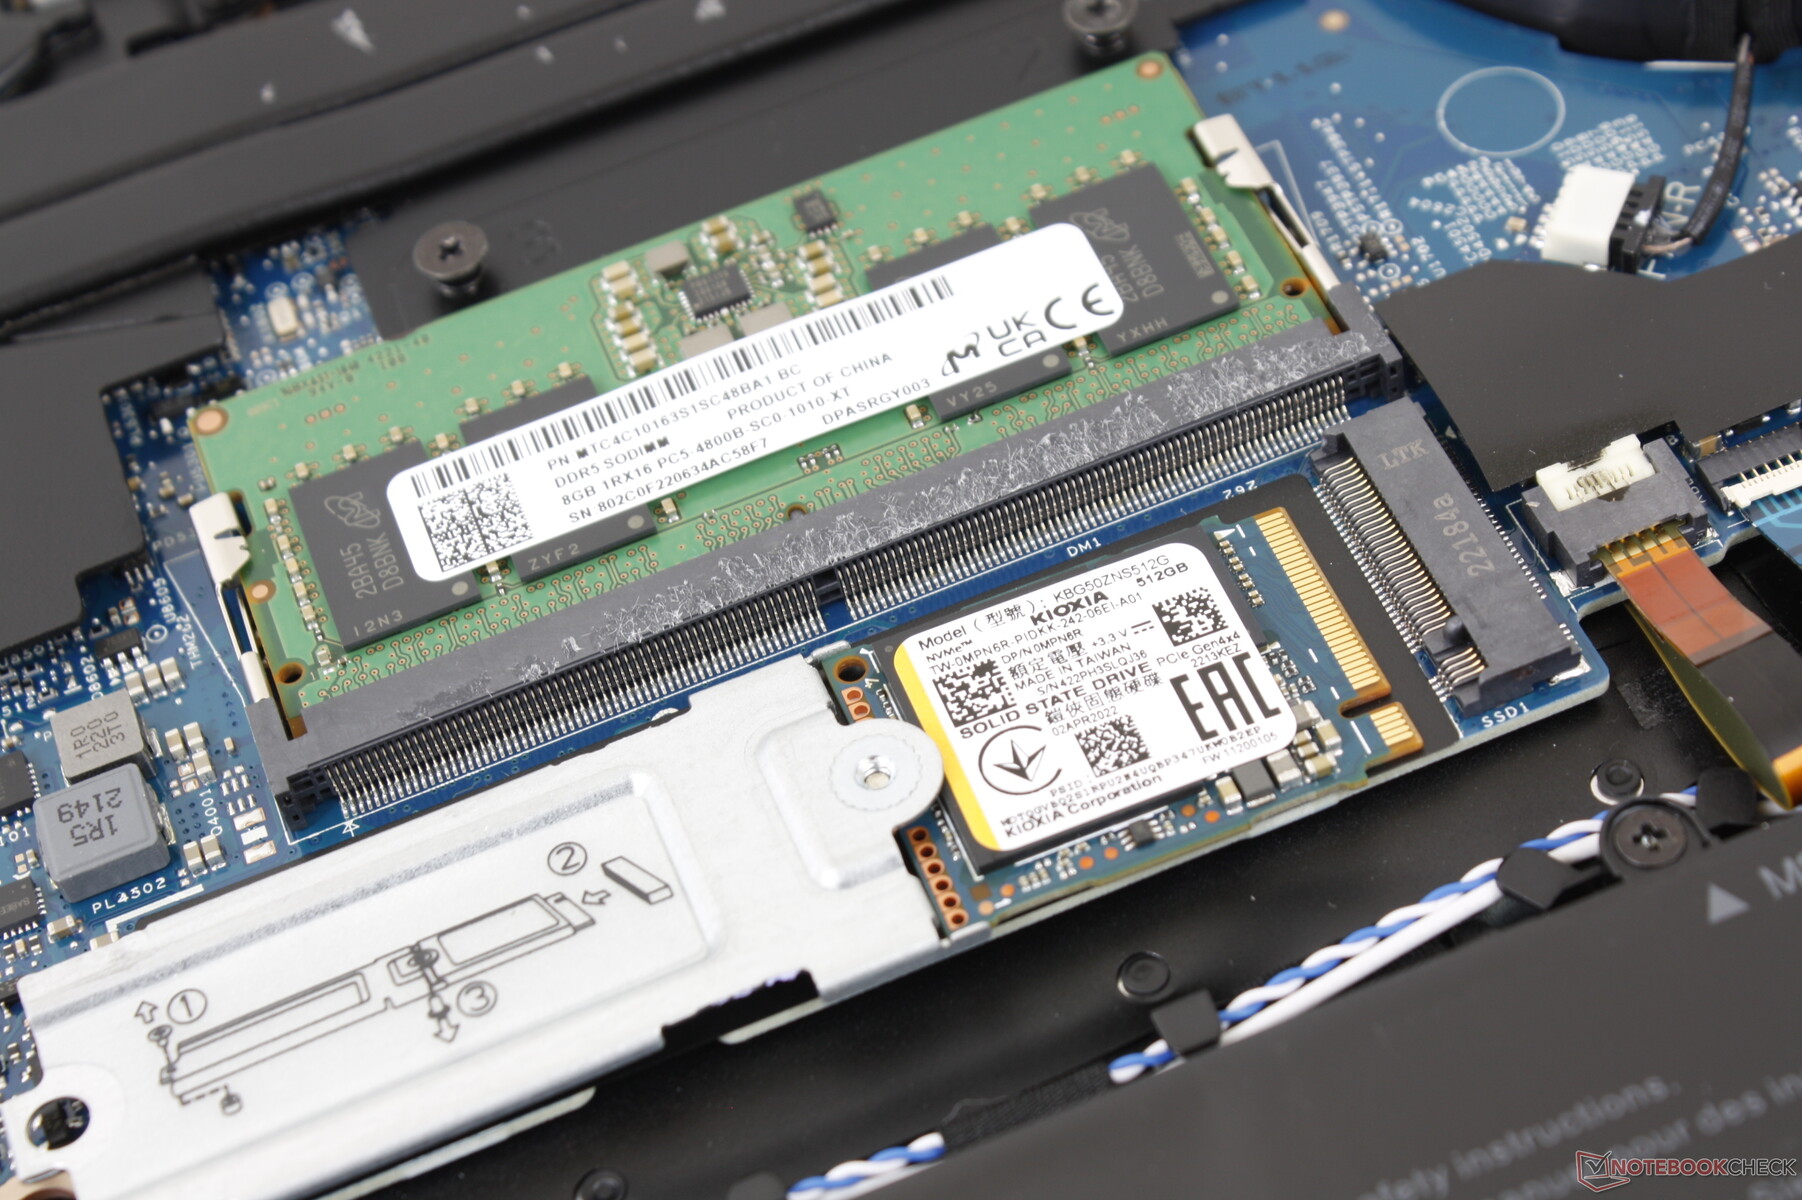
O painel inferior se solta facilmente com apenas uma chave de fenda Philips. Uma vez dentro, os usuários notarão a solução de resfriamento revista quando comparada com a antiga 7610. As mudanças realmente removeram um slot SODIMM e um slot M.2 SSD do 7620, deixando apenas um slot SSD e um slot SODIMM para trabalhar, como mostrado por nossas imagens abaixo. Mais confuso ainda, os usuários que optarem pelo RTX 3060 SKU terão 2x SODIMM slots.
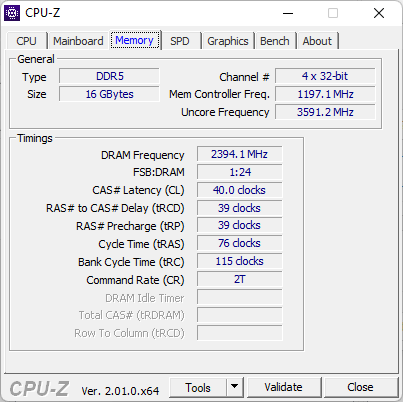
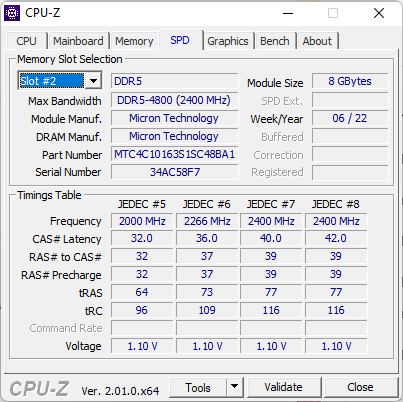
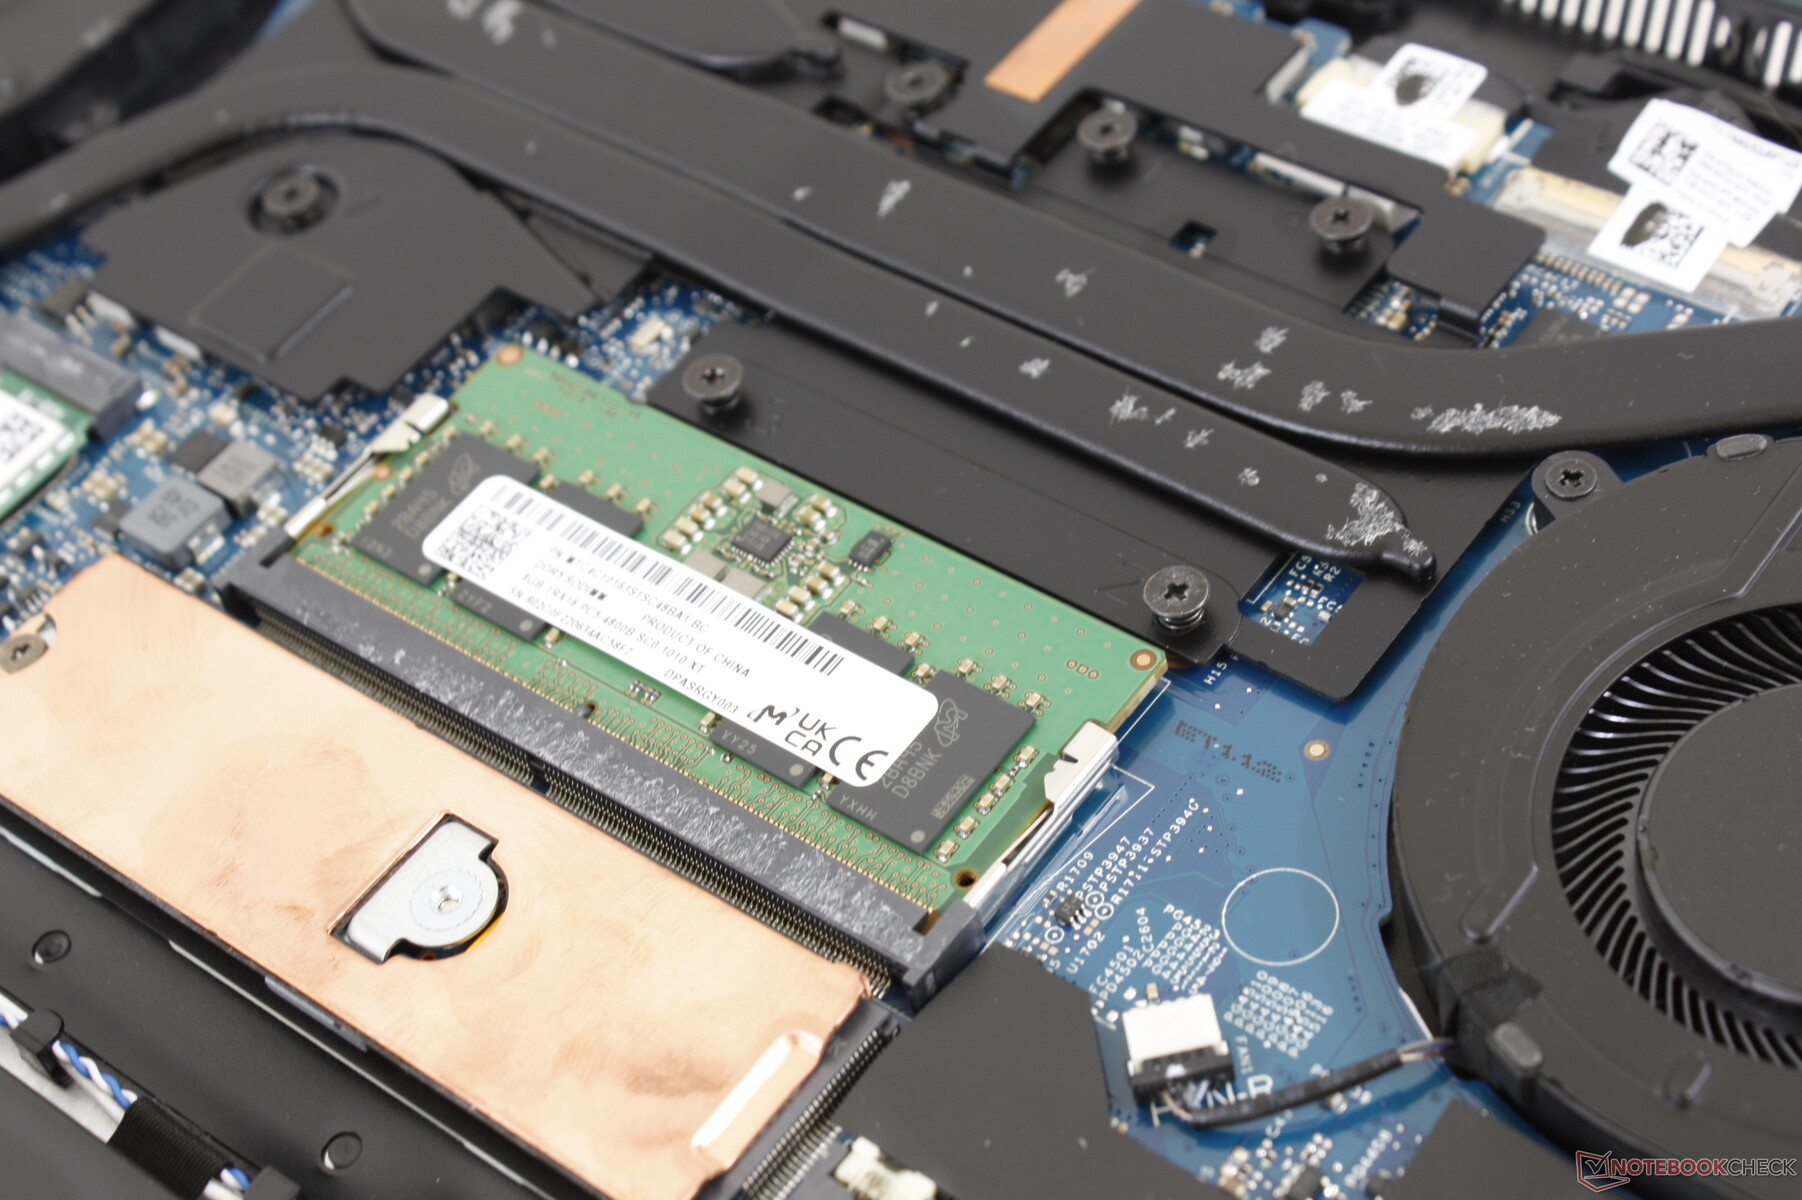
8 GB de RAM vem soldado em nossa placa por um máximo de 40 GB se configurado com um módulo de RAM DDR5 de 32 GB removível. Os SKUs RTX 3060 podem ser configurados com até 64 GB, já que possuem 2x SODIMM slots e nenhuma memória RAM soldada.
Acessórios e Garantia
Não há extras na caixa além do adaptador AC e da papelada. A garantia padrão limitada de um ano se aplica se comprada nos EUA.
Dispositivos de entrada - O mesmo que o Inspiron 16 Plus 7620 2 em 1
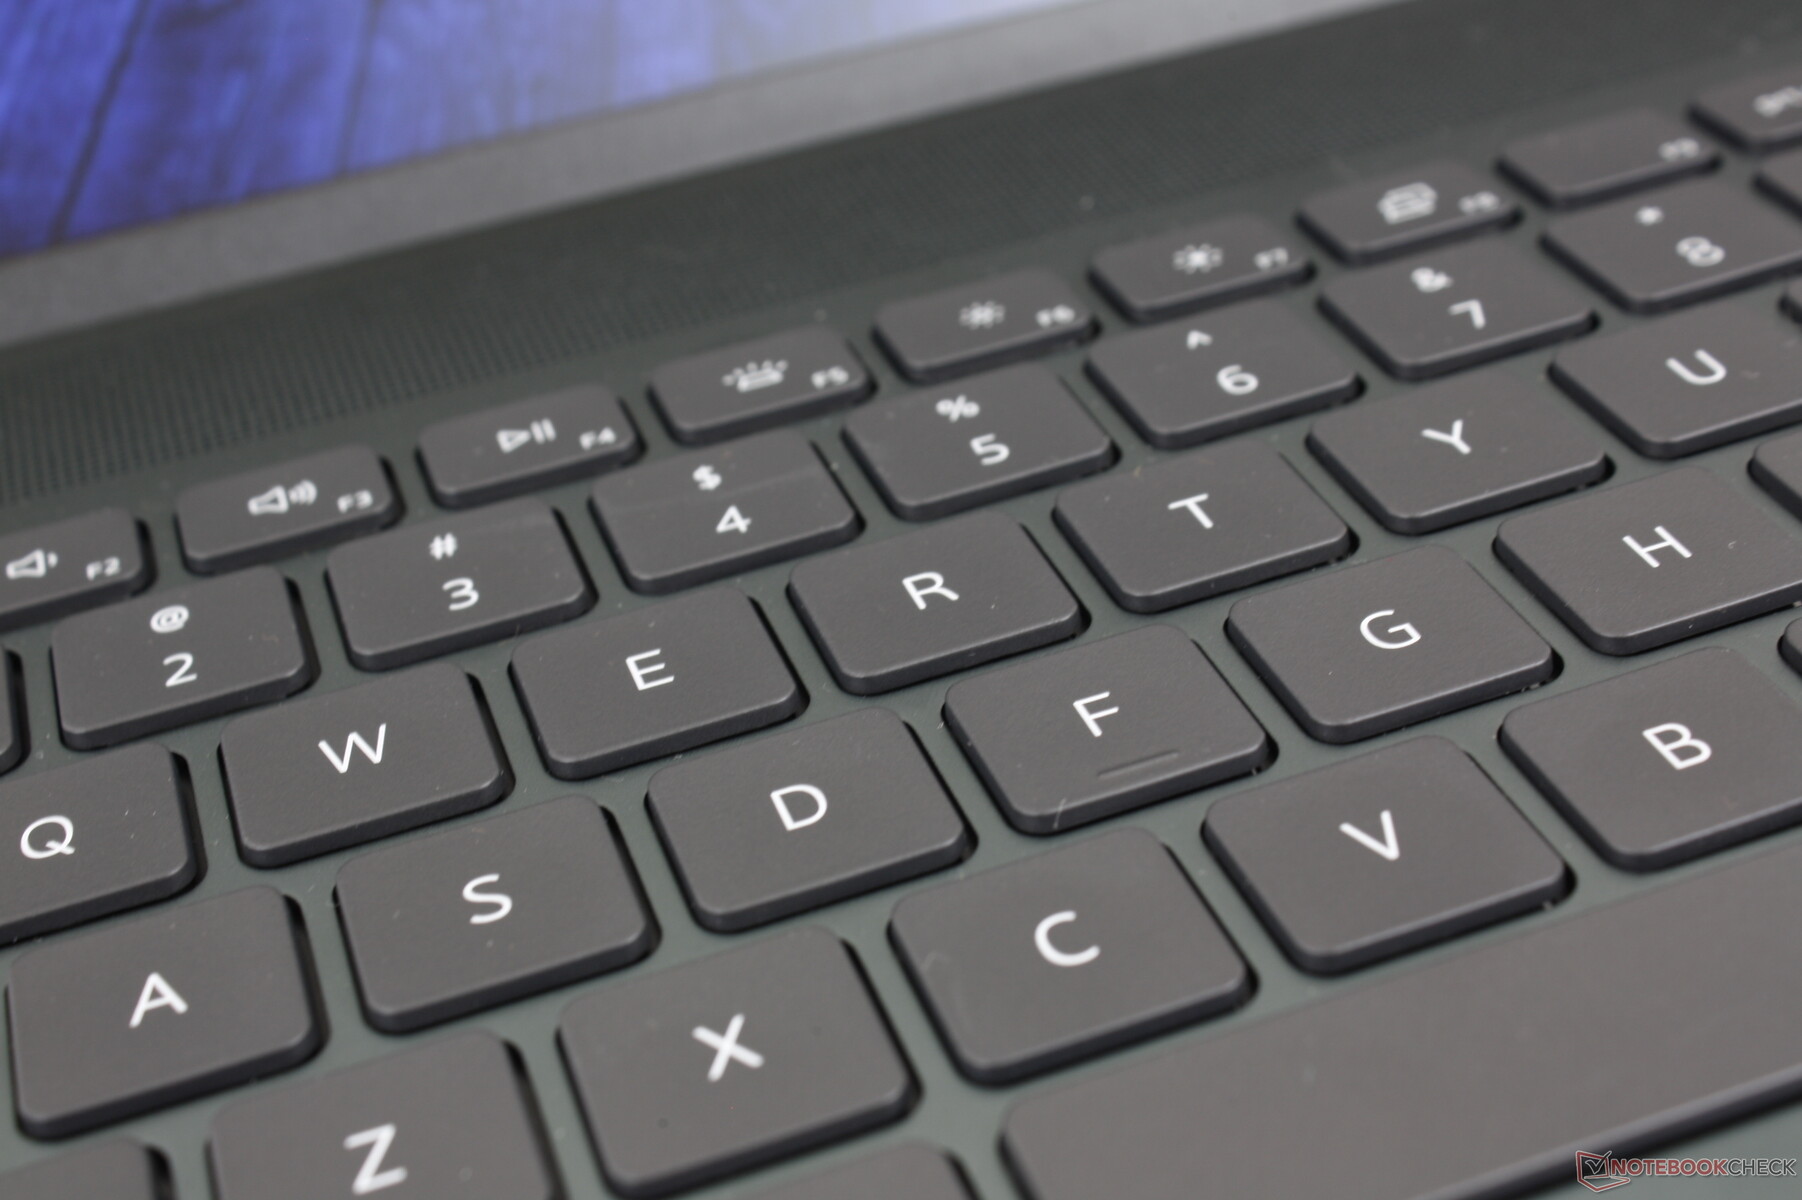
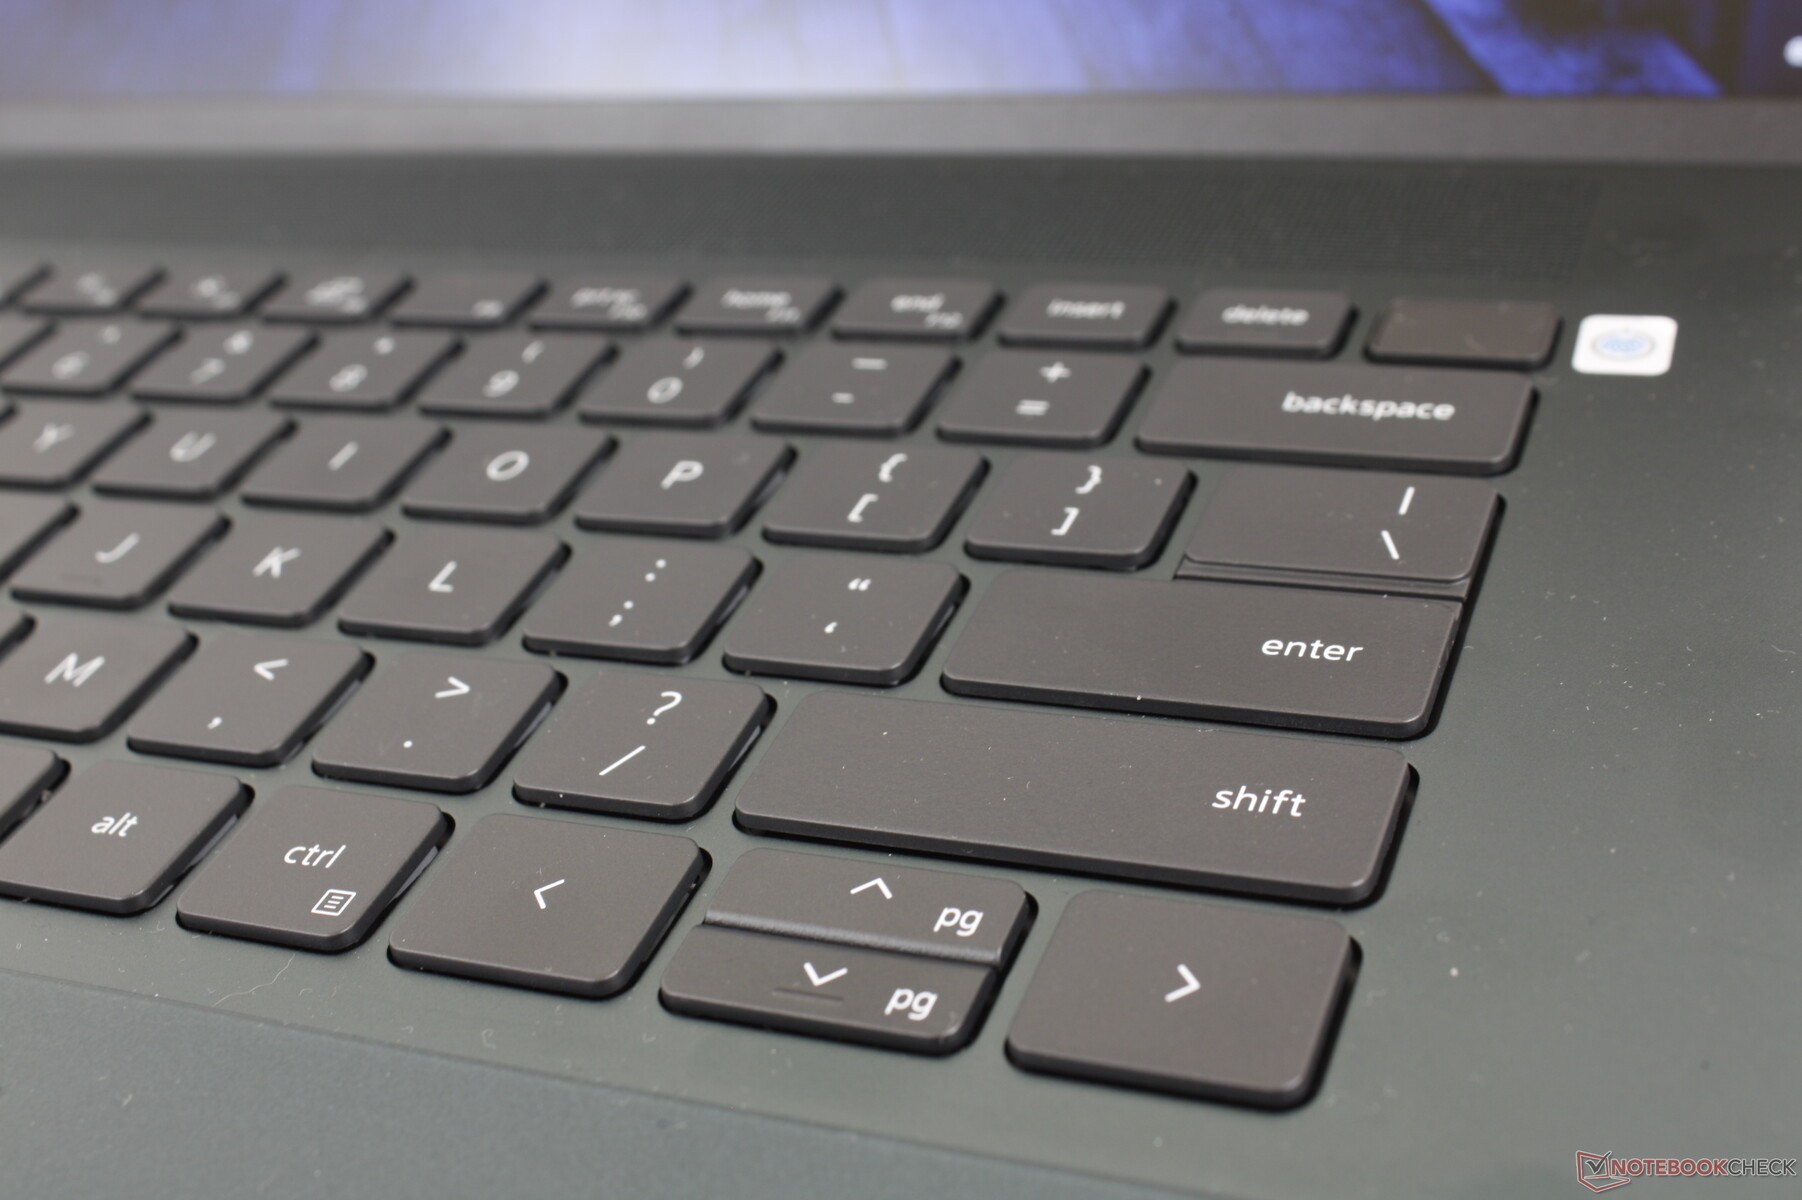
Teclado
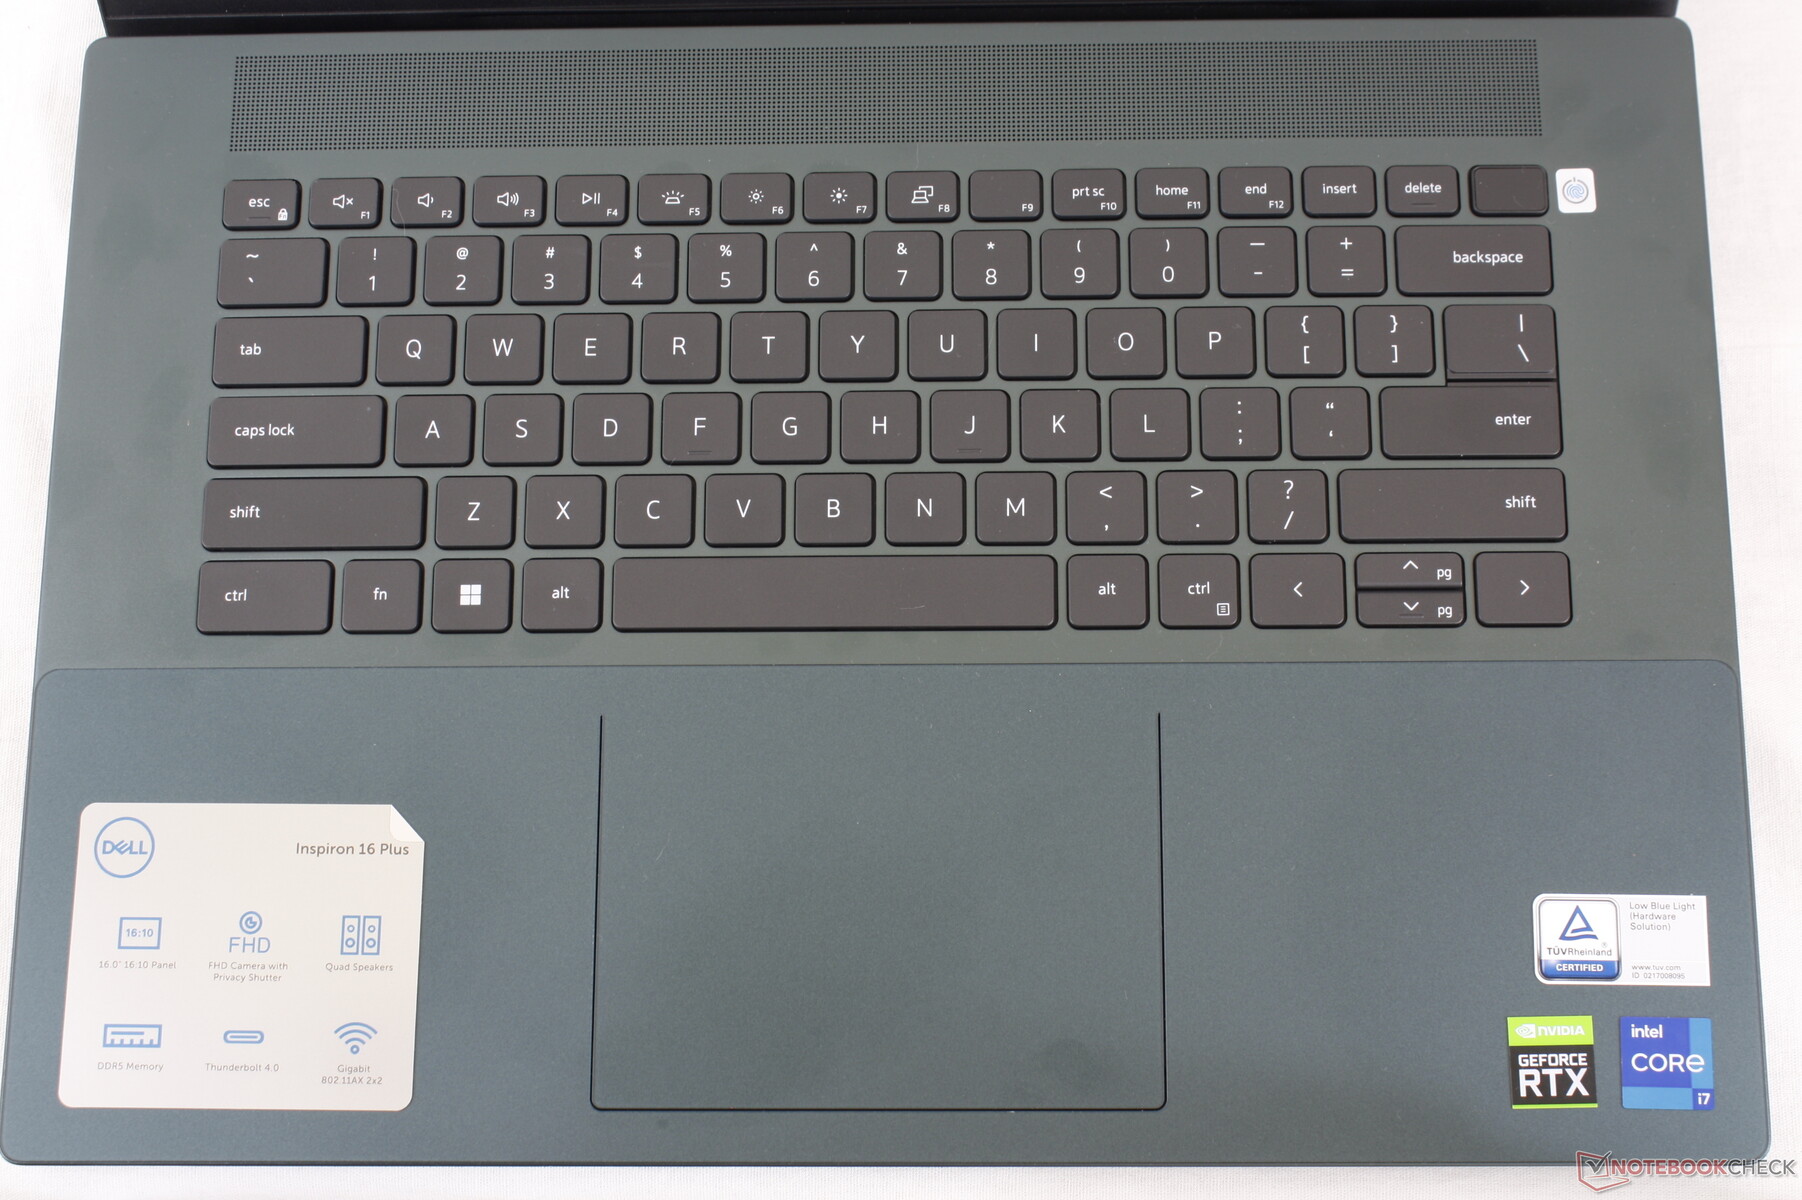
A Dell reformulou o teclado este ano para excluir o teclado numérico. A experiência de digitação é de outra forma semelhante aoInspiron 16 Plus 7620 2 em 1 pois as chaves ainda são ligeiramente mais macias do que as chaves da série LG Gram 16 ou HP Spectre.
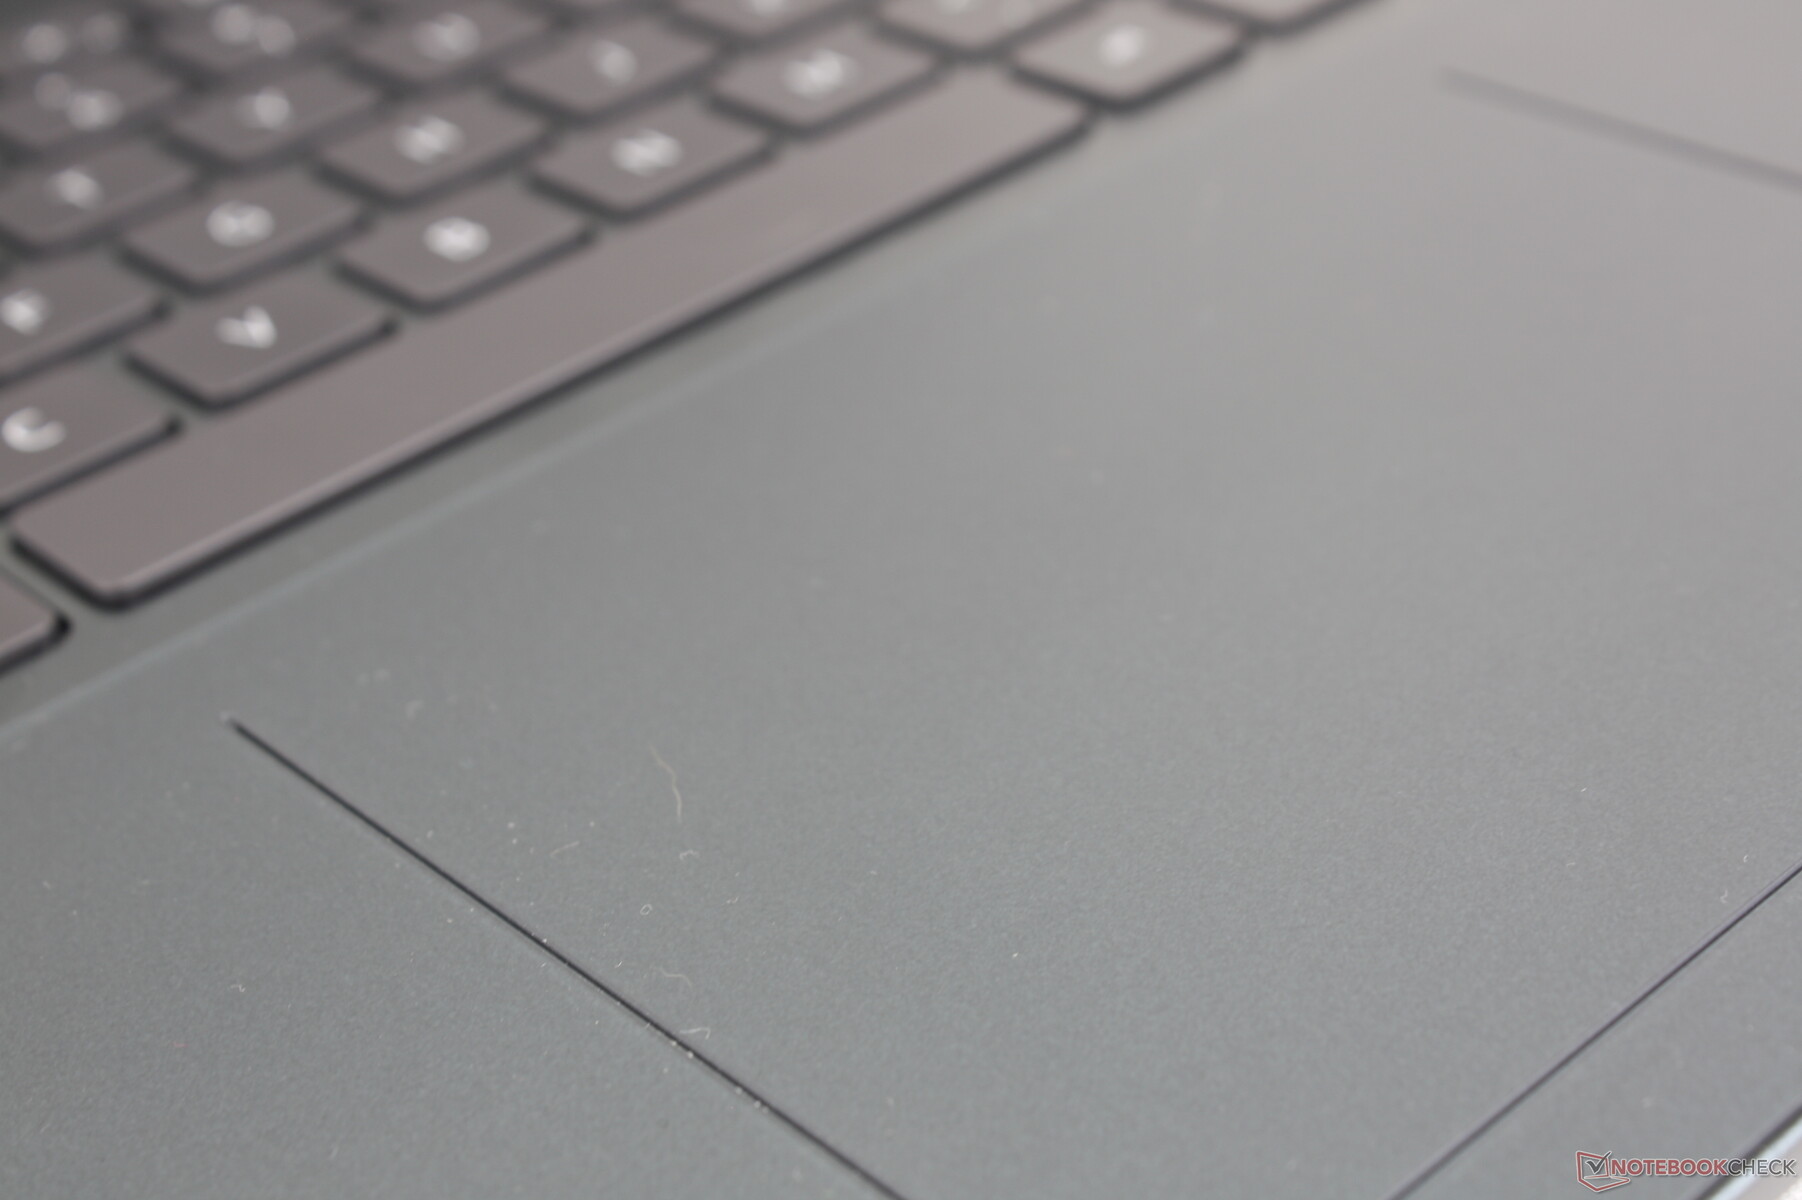
Touchpad
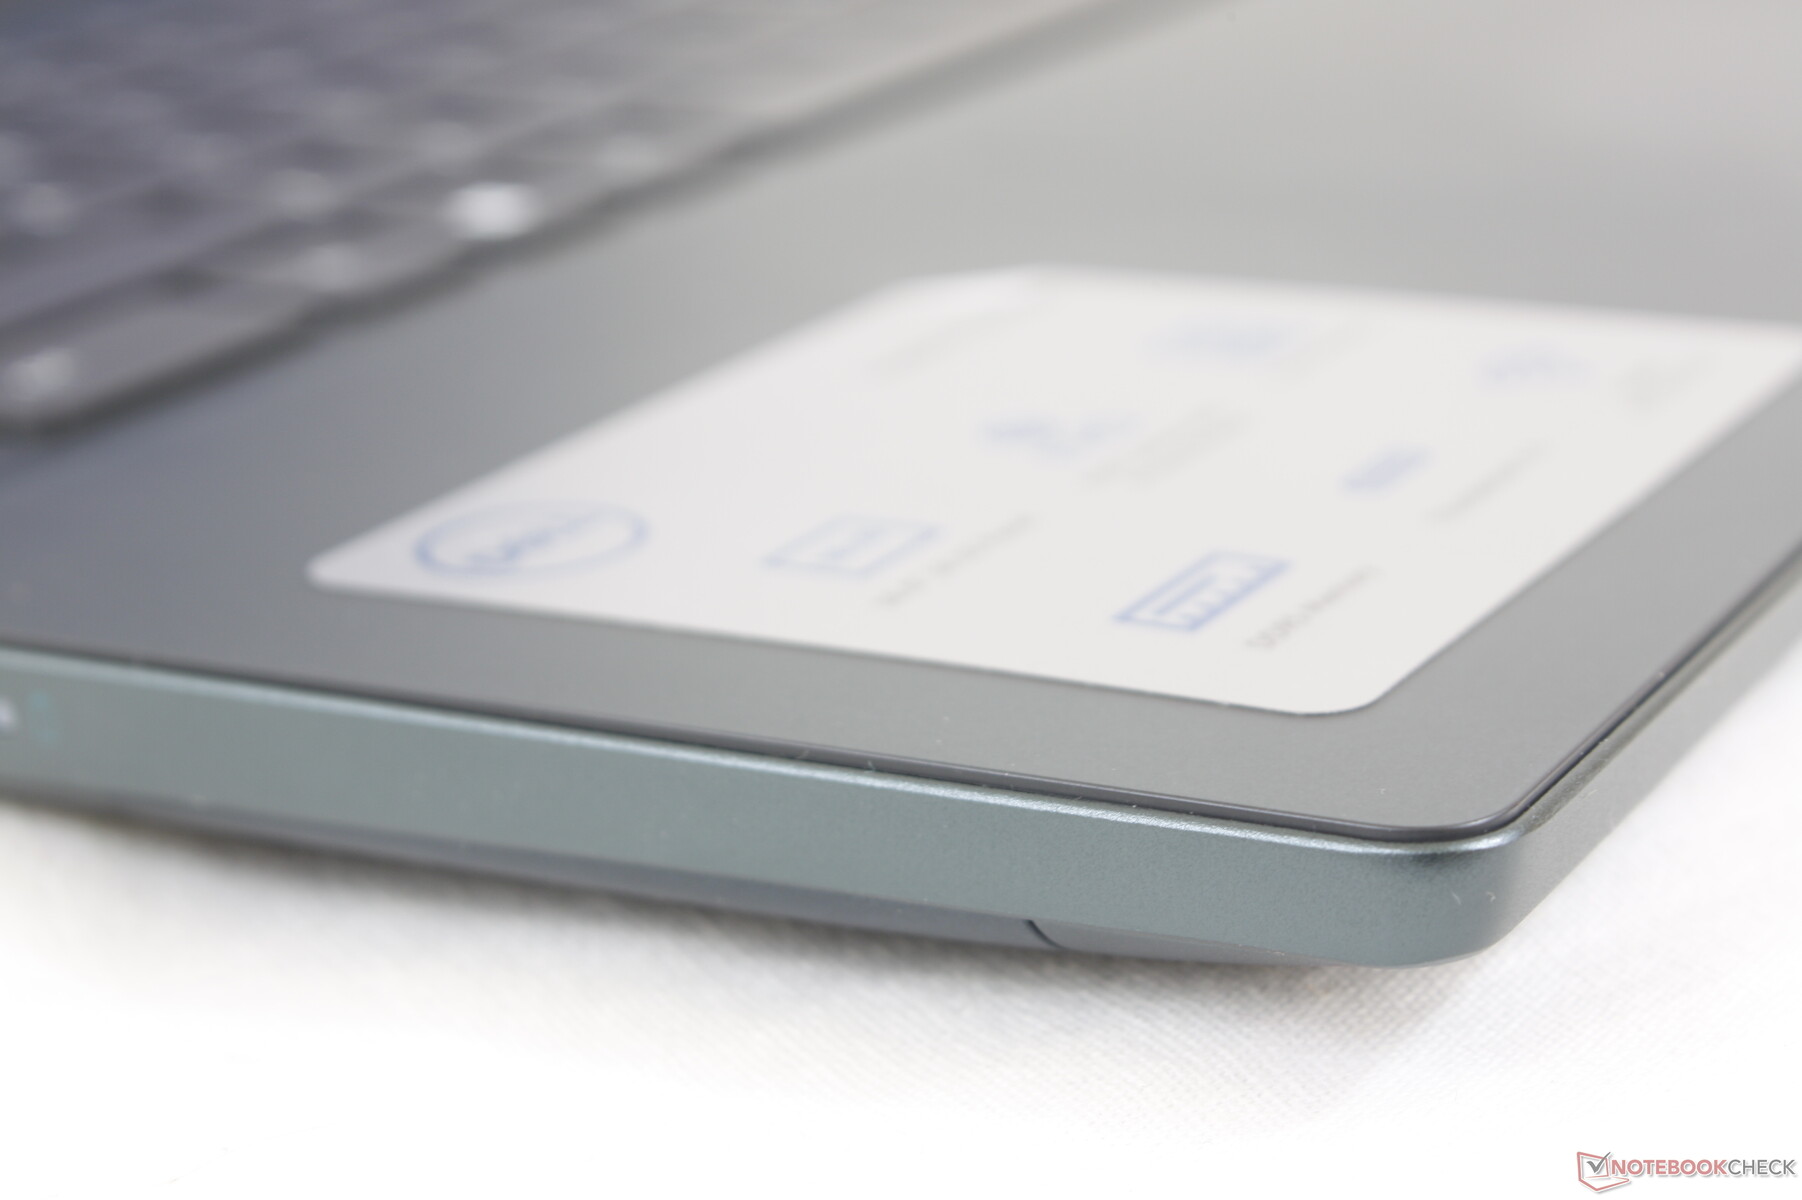
O clickpad do nosso modelo 2022 é menor que o clickpad do modelo 2021 (11,5 x 8 cm vs. 13,5 x 9 cm) para estar em pé de igualdade com o clickpad do Inspiron 16 7620 2 em 1. A nova superfície Mylar funciona muito bem para o controle do cursor, pois é suave ao deslizar rapidamente e um pouco pegajosa ao deslizar lentamente para cliques mais precisos. No entanto, clicar no clickpad ainda é mais suave e esponjoso do que gostaríamos.
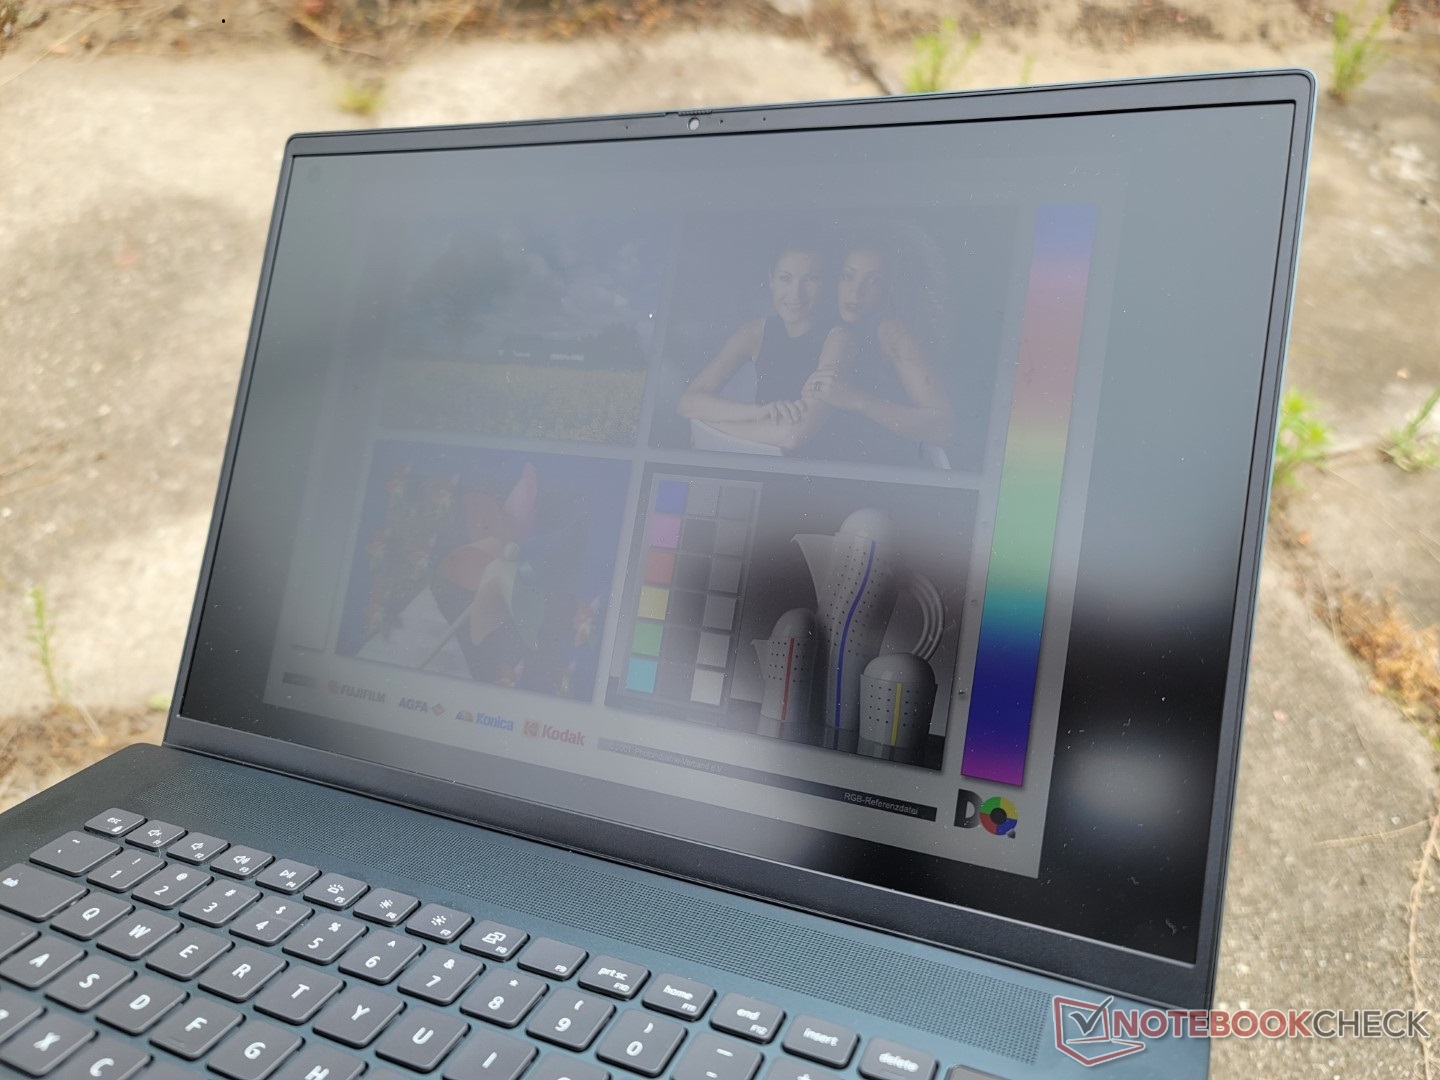
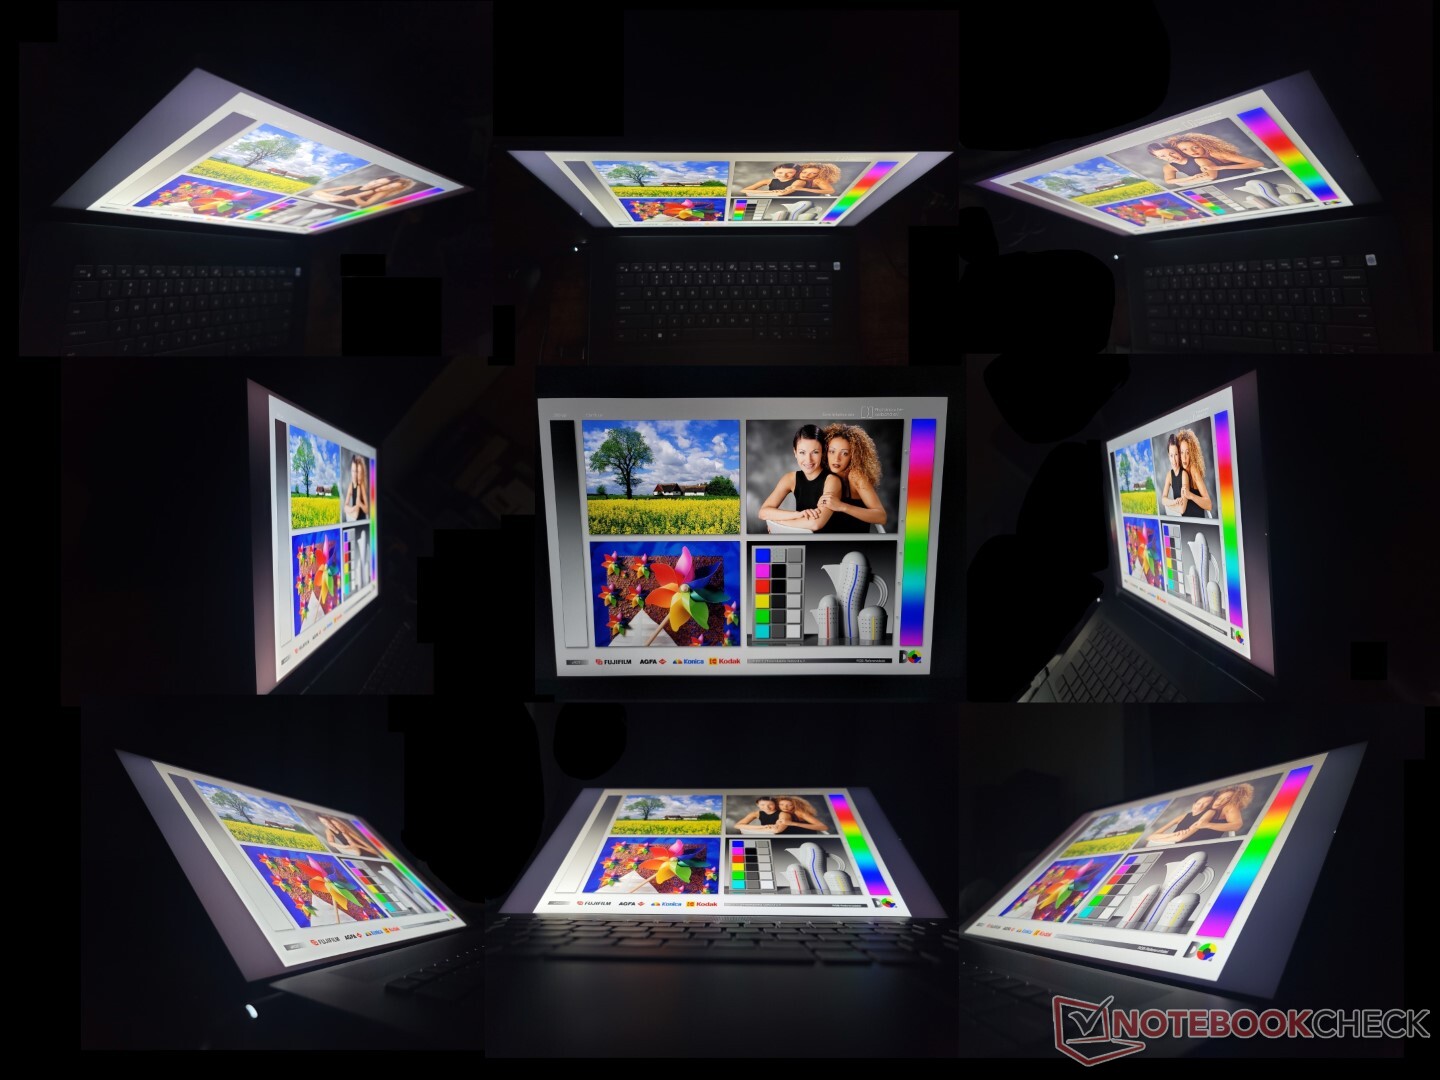
Mostrar - Sem grandes mudanças
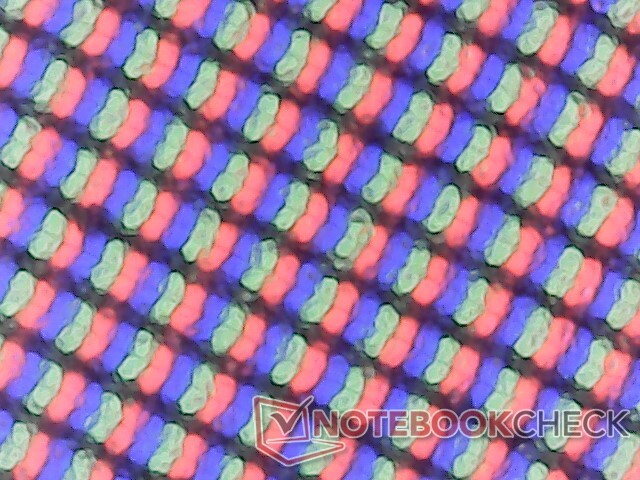
Curiosamente, a Dell mudou os fornecedores de painéis da AU Optronics no Inspiron 16 Plus 7610 do ano passado para BOE para este último modelo. Os tempos de resposta são um pouco mais rápidos para fantasmas menos severos, mas tudo o mais permanece praticamente o mesmo, incluindo a cobertura total de sRGB, ~1000:1 relação de contraste e ~290 brilho máximo de nit
A experiência de visualização é boa, mas ainda alguns passos abaixo da série XPS ou do painel OLED no Asus VivoBook Pro 16X. A qualidade da imagem é visivelmente mais granulada por causa da agressiva camada fosca, enquanto as cores não são tão vibrantes como no OLED. Entendemos que a série Inspiron não deveria ser top de linha, mas é decepcionante que a Dell não tenha feito nenhuma mudança significativa na tela este ano
Há três opções de painel de 300-nit para escolher: 3072 x 1920 matte non-touch, 1920 x 1200 matte non-touch, e 1920 x 1200 matte-touch, e 1920 x 1200 matte glossy touch. Nossas medidas abaixo refletem apenas o painel de maior resolução.
| |||||||||||||||||||||||||
iluminação: 92 %
iluminação com acumulador: 288.9 cd/m²
Contraste: 1111:1 (Preto: 0.26 cd/m²)
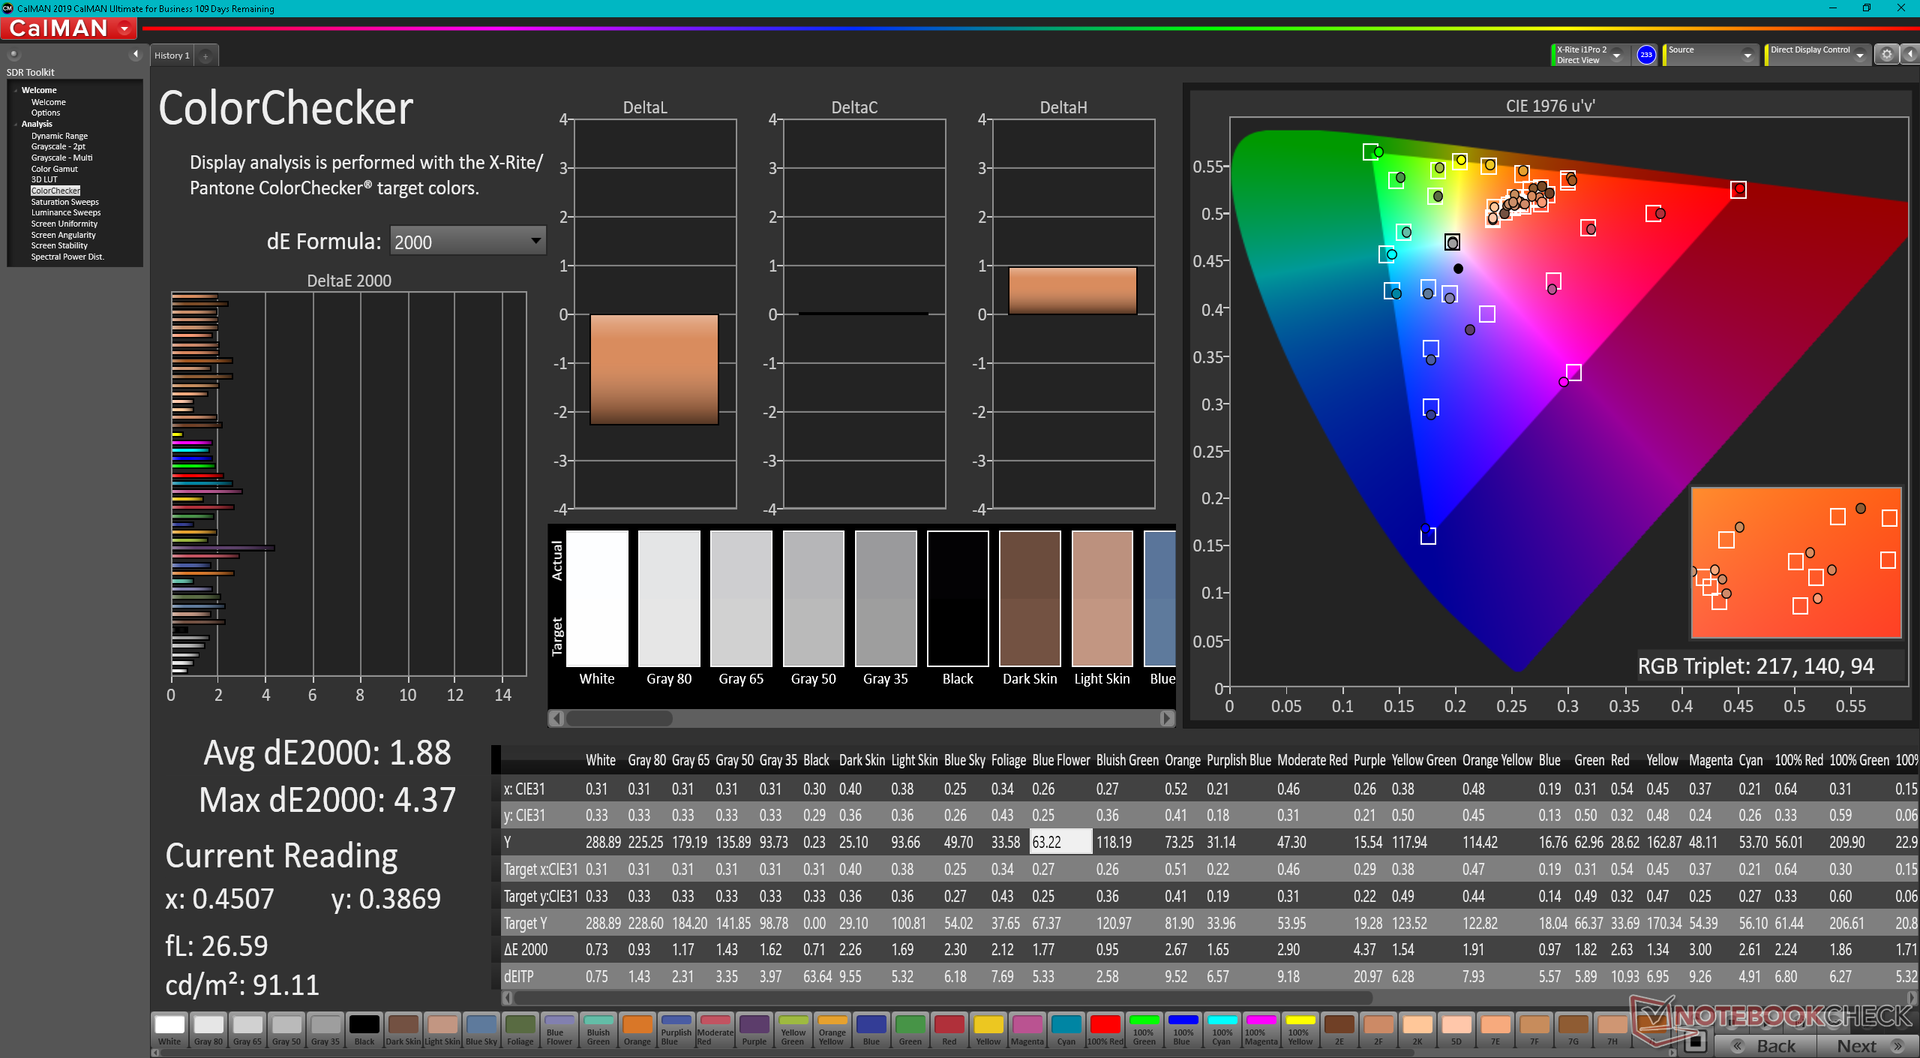
ΔE ColorChecker Calman: 1.88 | ∀{0.5-29.43 Ø4.71}
calibrated: 0.42
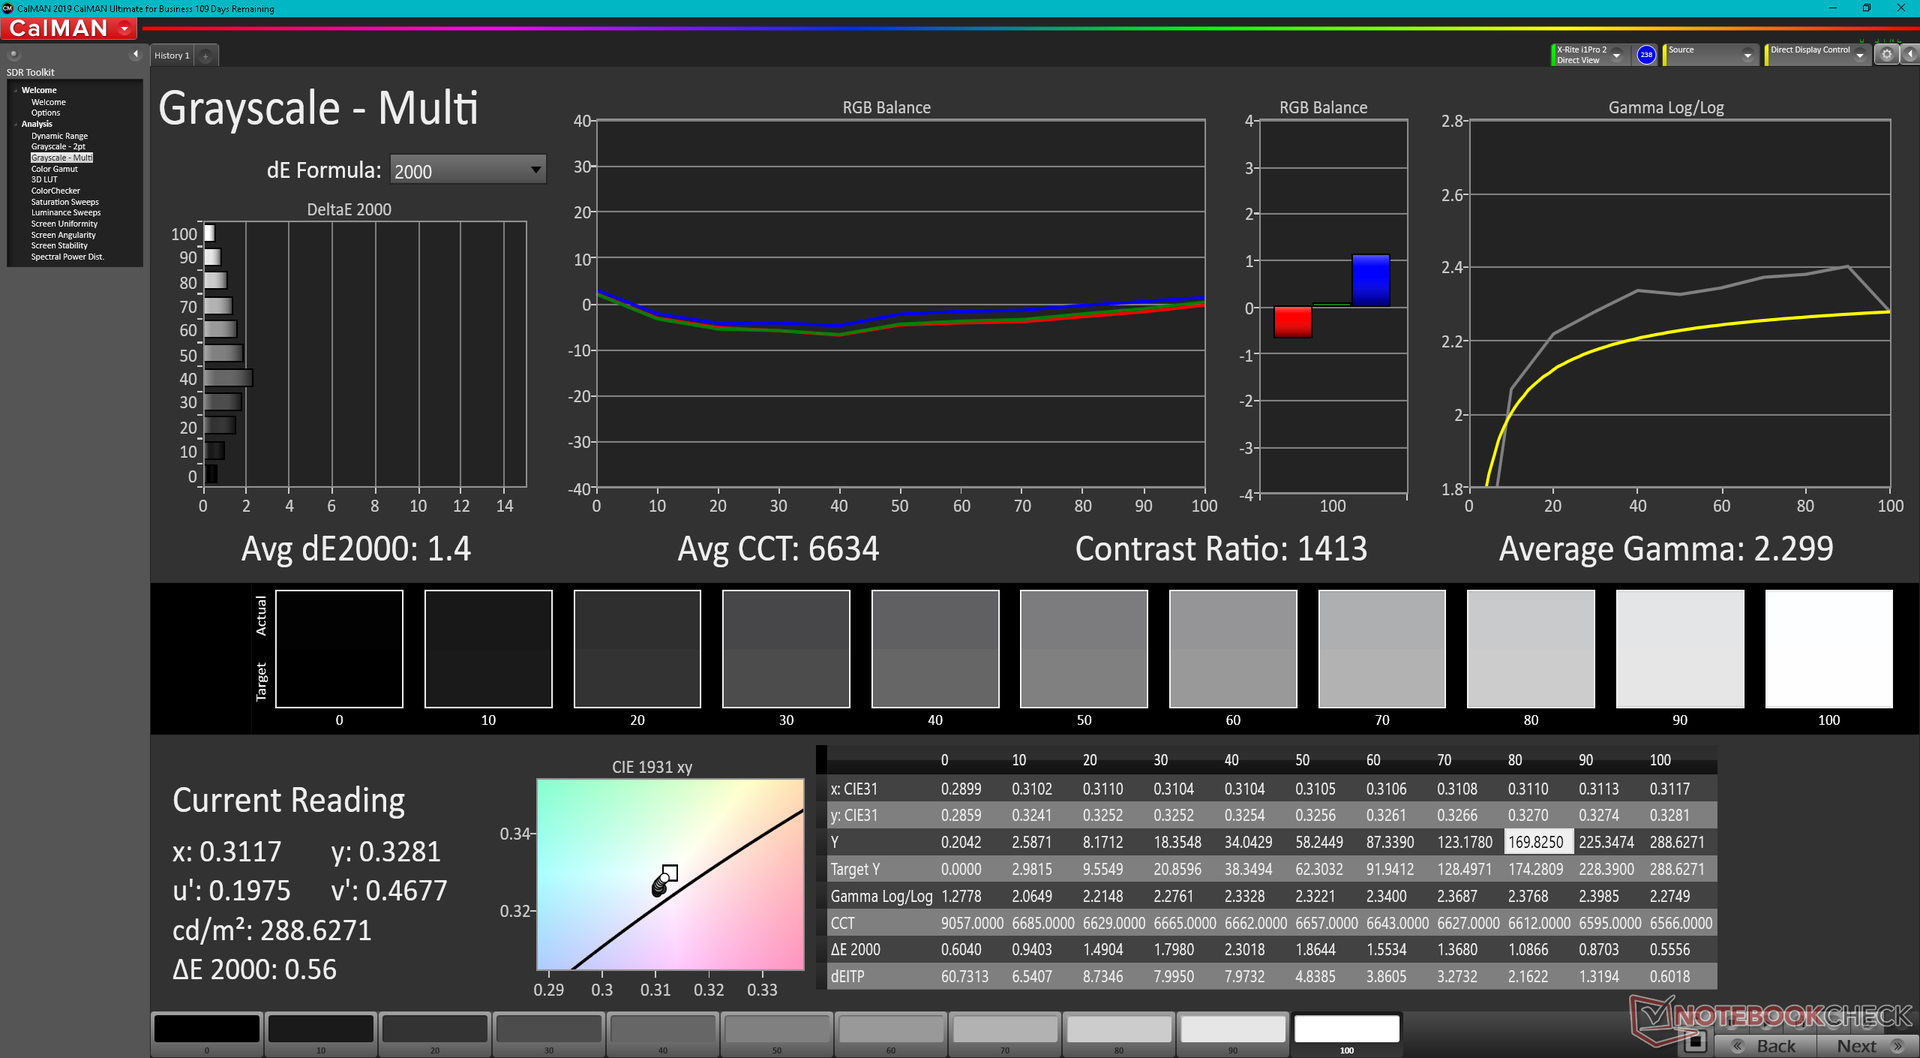
ΔE Greyscale Calman: 1.4 | ∀{0.09-98 Ø4.96}
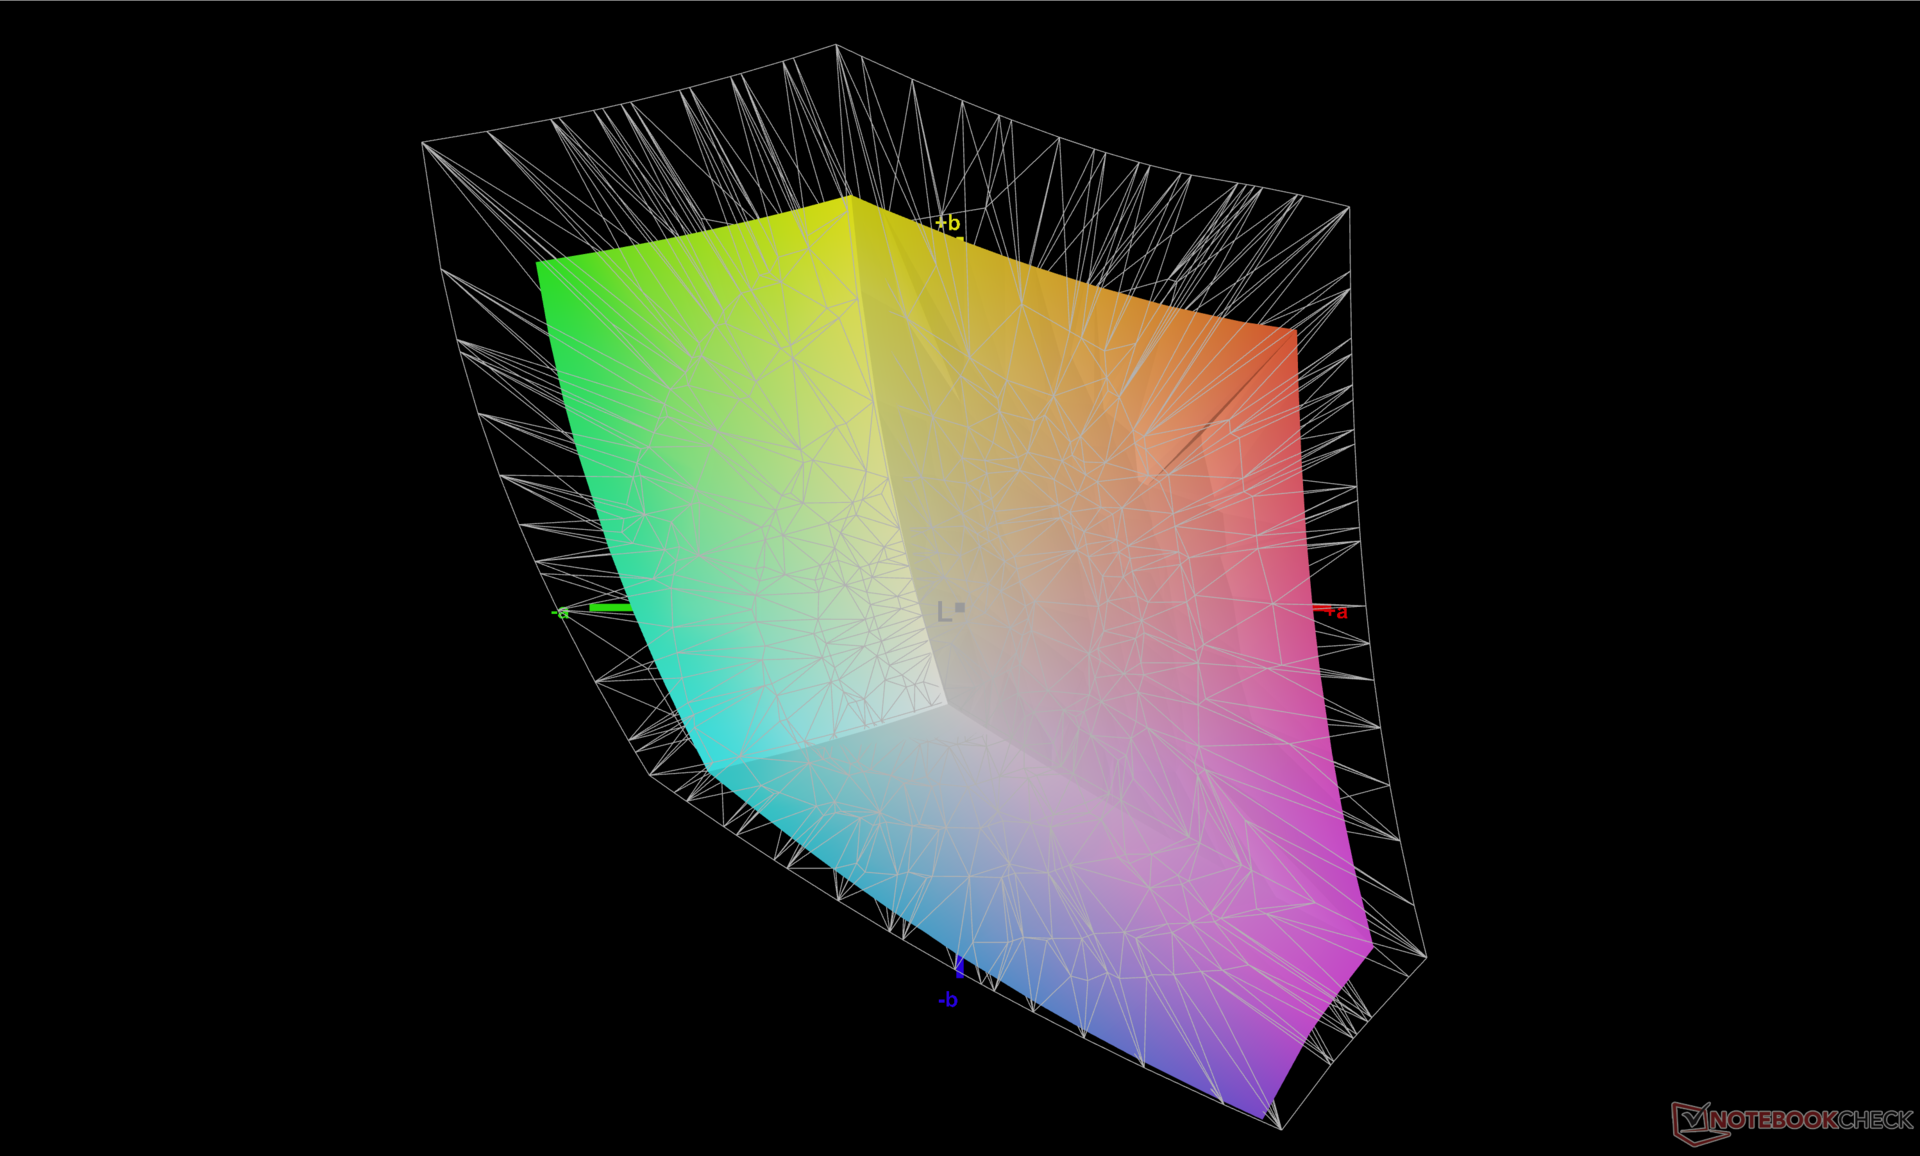
73.2% AdobeRGB 1998 (Argyll 3D)
99.5% sRGB (Argyll 3D)
70.8% Display P3 (Argyll 3D)
Gamma: 2.3
CCT: 6634 K
| Dell Inspiron 16 Plus 7620 BOE NE16N41, IPS, 3072x1920, 16" | Dell Inspiron 16 Plus 7610 AU Optronics B160QAN, IPS, 3072x1920, 16" | Lenovo Yoga 7 16IAP7 Lenovo LEN160WQXGA, IPS, 2560x1600, 16" | Huawei MateBook D 16 2022 BOE NV160WUM-NH0, IPS, 1920x1200, 16" | Acer Swift X SFX16-51G-5388 Chi Mei N161HCA-EA3, , 1920x1080, 16.1" | Asus Vivobook Pro 16X-M7600QE Samsung ATNA60YV02-0, OLED, 3840x2400, 16.1" | |
|---|---|---|---|---|---|---|
| Display | 3% | -5% | -5% | -7% | 25% | |
| Display P3 Coverage (%) | 70.8 | 74.1 5% | 67 -5% | 66.2 -6% | 65.1 -8% | 99.8 41% |
| sRGB Coverage (%) | 99.5 | 99.4 0% | 95.7 -4% | 96.4 -3% | 95.65 -4% | 100 1% |
| AdobeRGB 1998 Coverage (%) | 73.2 | 75.8 4% | 69.3 -5% | 68.3 -7% | 66.75 -9% | 96.9 32% |
| Response Times | -30% | 8% | 27% | 25% | 94% | |
| Response Time Grey 50% / Grey 80% * (ms) | 38 ? | 49.2 ? -29% | 36 ? 5% | 30.5 ? 20% | 30 ? 21% | 2 ? 95% |
| Response Time Black / White * (ms) | 28 ? | 36.8 ? -31% | 24.8 ? 11% | 18.7 ? 33% | 20 ? 29% | 2 ? 93% |
| PWM Frequency (Hz) | 60 ? | |||||
| Screen | -47% | -13% | -56% | -6% | -35% | |
| Brightness middle (cd/m²) | 288.9 | 296.8 3% | 393.7 36% | 319 10% | 276 -4% | 392 36% |
| Brightness (cd/m²) | 276 | 292 6% | 367 33% | 317 15% | 264 -4% | 396 43% |
| Brightness Distribution (%) | 92 | 87 -5% | 84 -9% | 90 -2% | 85 -8% | 98 7% |
| Black Level * (cd/m²) | 0.26 | 0.21 19% | 0.38 -46% | 0.23 12% | 0.16 38% | |
| Contrast (:1) | 1111 | 1413 27% | 1036 -7% | 1387 25% | 1725 55% | |
| Colorchecker dE 2000 * | 1.88 | 2.56 -36% | 1.97 -5% | 3.4 -81% | 1.8 4% | 1.74 7% |
| Colorchecker dE 2000 max. * | 4.37 | 4.76 -9% | 5.46 -25% | 8.1 -85% | 3.77 14% | 3.18 27% |
| Colorchecker dE 2000 calibrated * | 0.42 | 1.86 -343% | 0.62 -48% | 0.8 -90% | 0.63 -50% | 1.85 -340% |
| Greyscale dE 2000 * | 1.4 | 2.6 -86% | 2.1 -50% | 5.7 -307% | 2.76 -97% | 1.77 -26% |
| Gamma | 2.3 96% | 2.07 106% | 2.1 105% | 2.1 105% | 2.37 93% | 2.22 99% |
| CCT | 6634 98% | 6628 98% | 6461 101% | 7433 87% | 6564 99% | 6483 100% |
| Média Total (Programa/Configurações) | -25% /
-34% | -3% /
-9% | -11% /
-33% | 4% /
-2% | 28% /
1% |
* ... menor é melhor
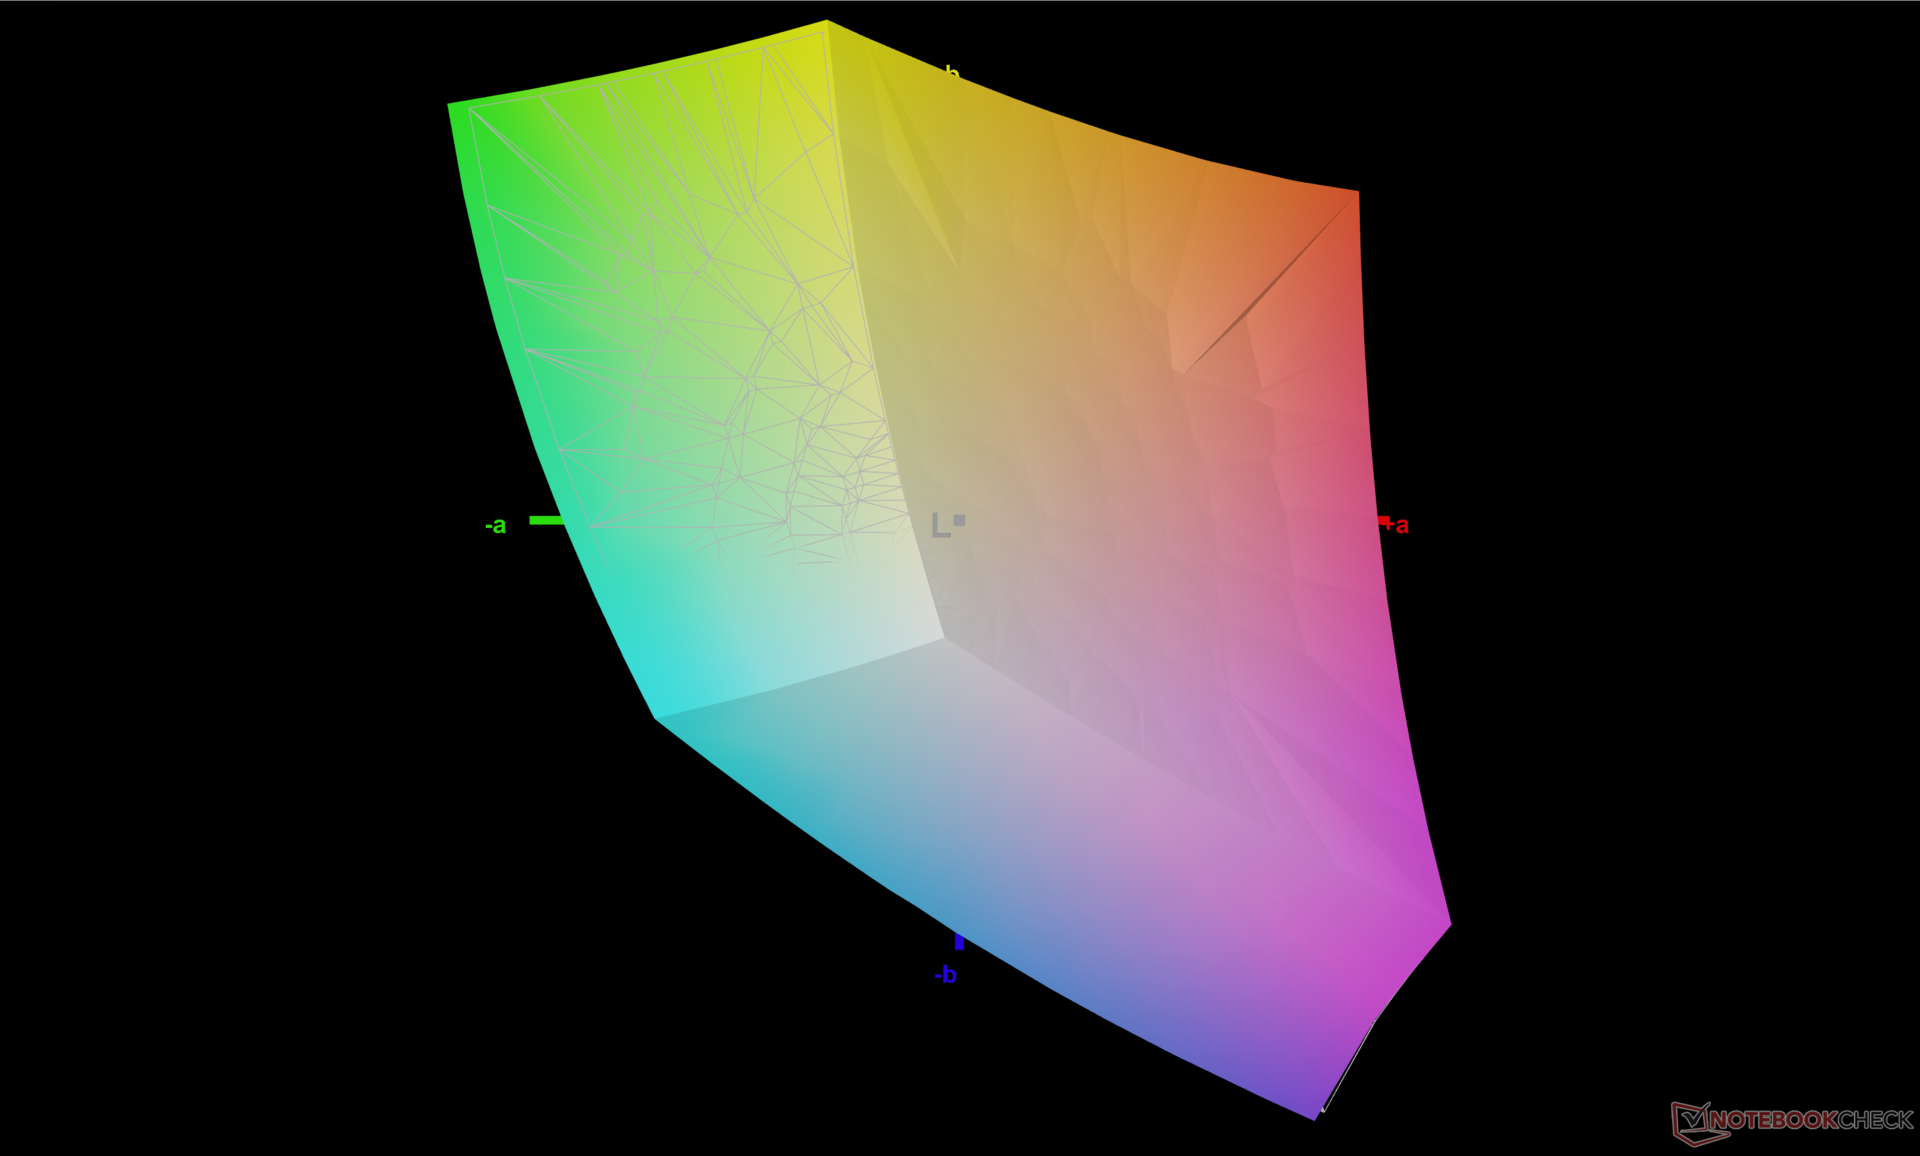
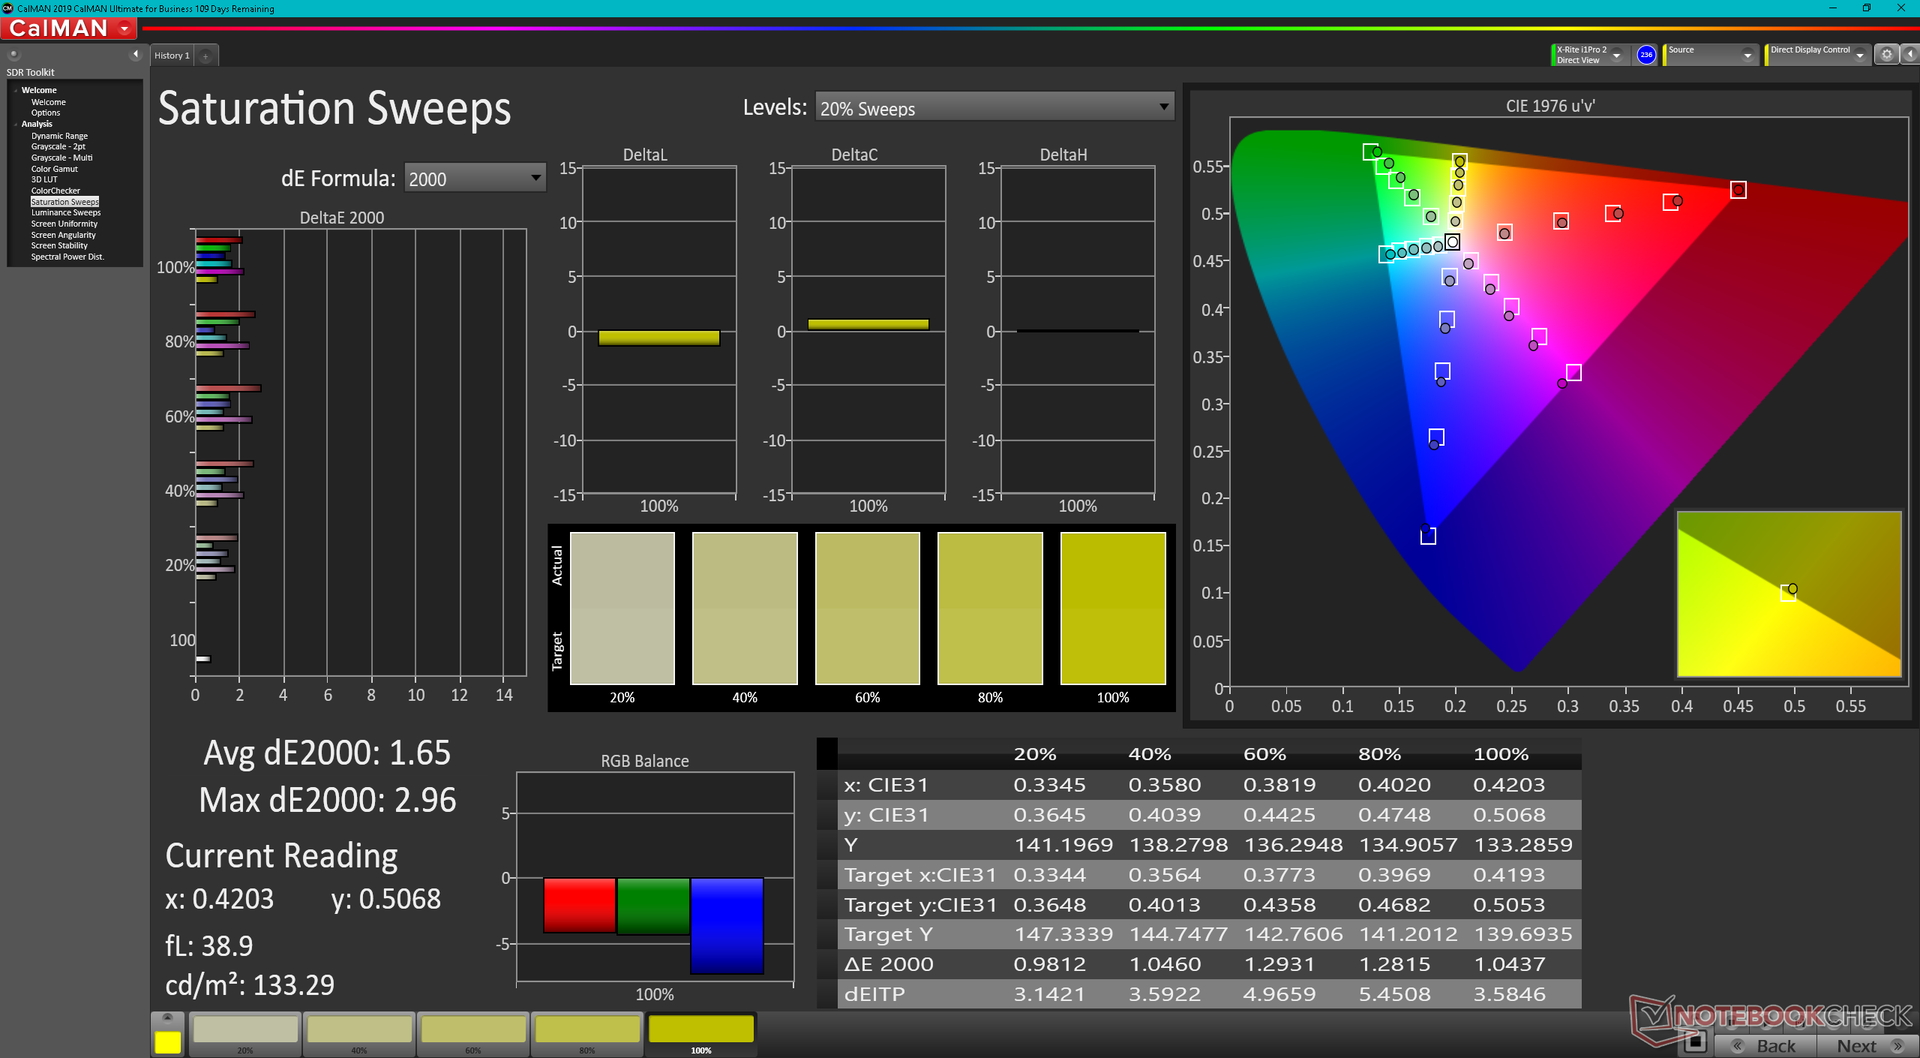
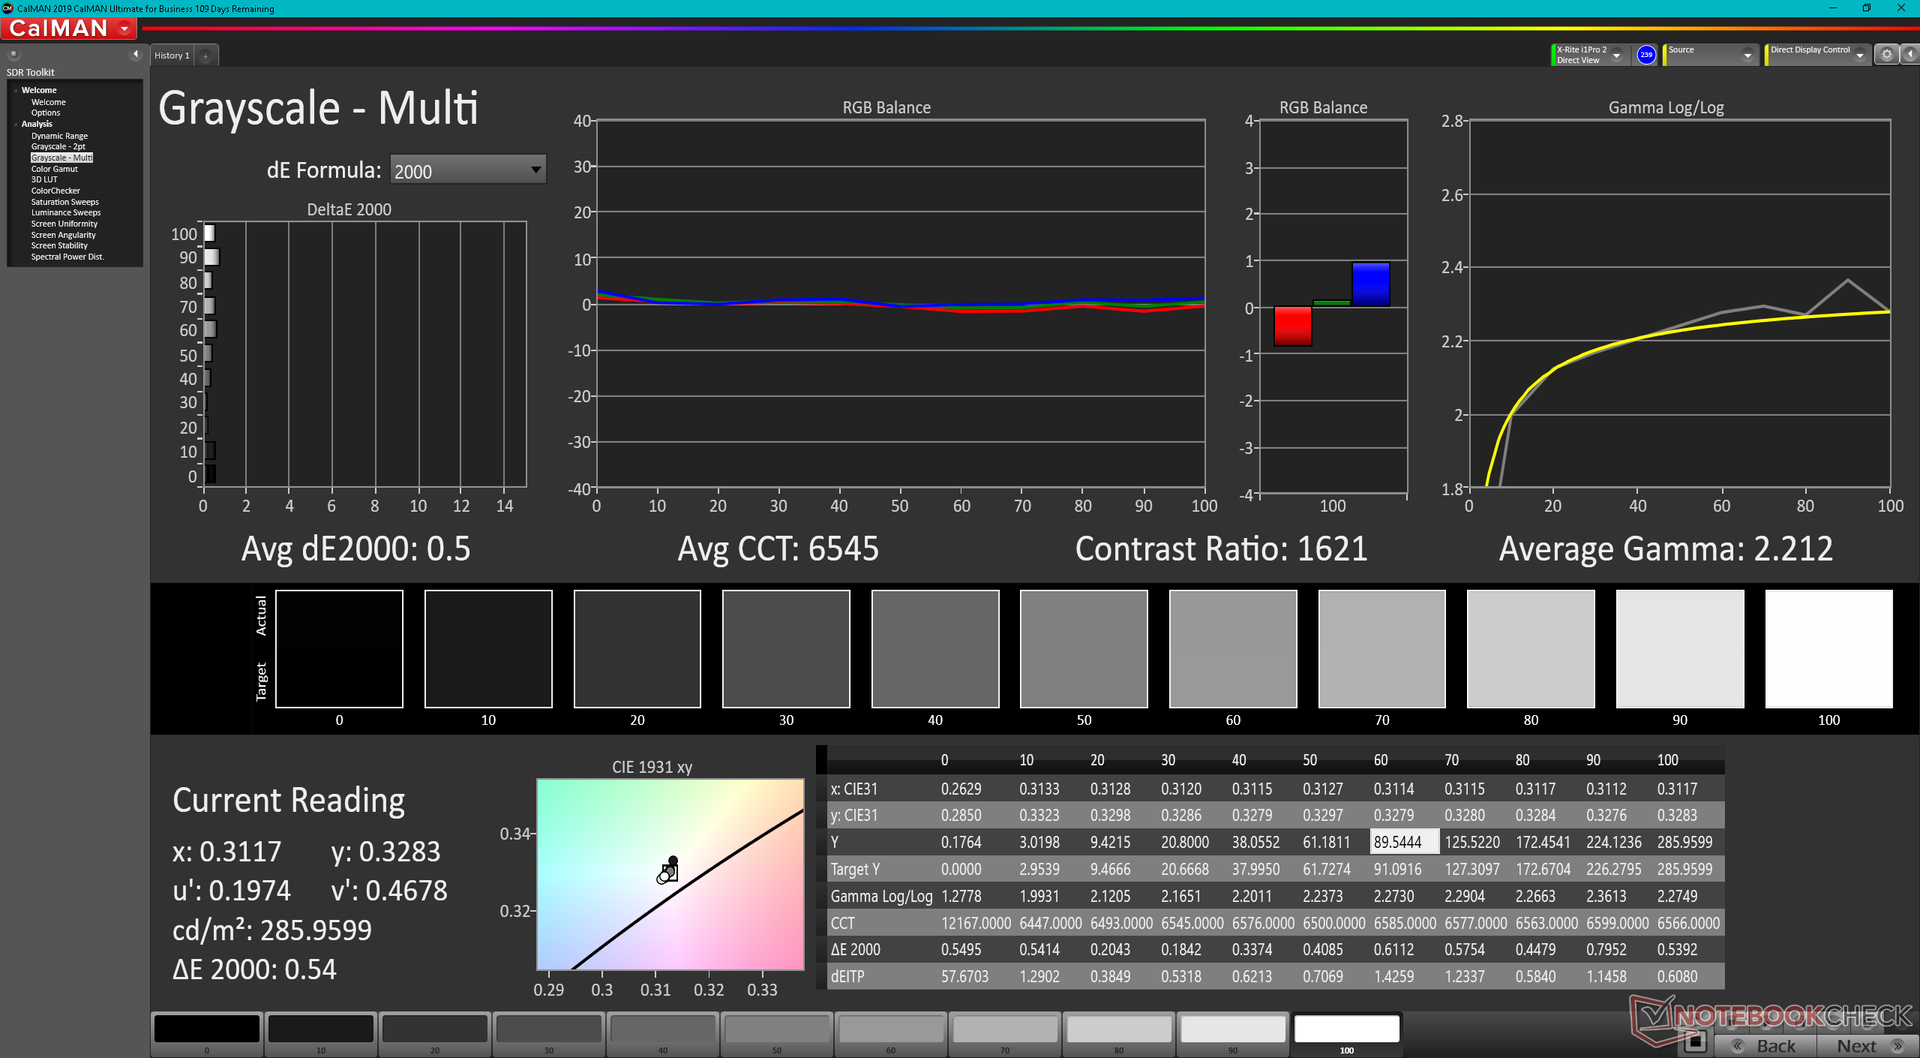
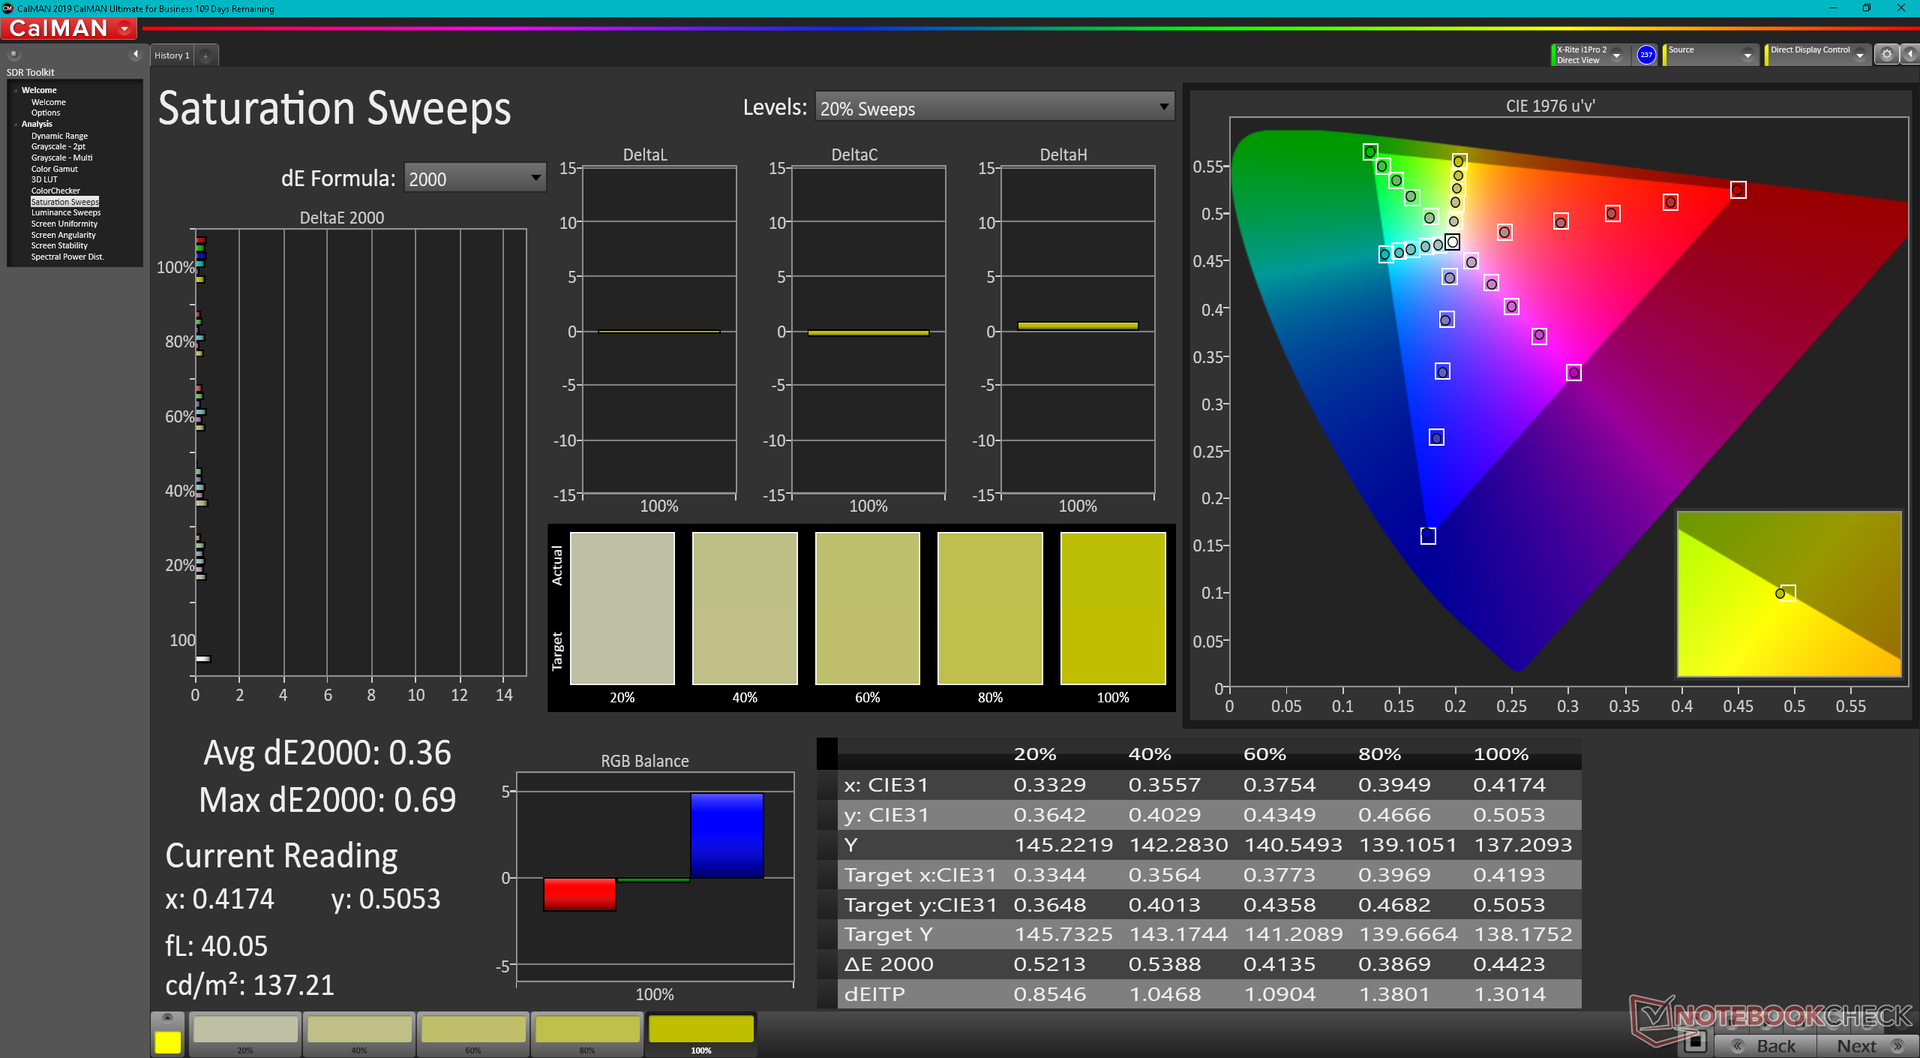
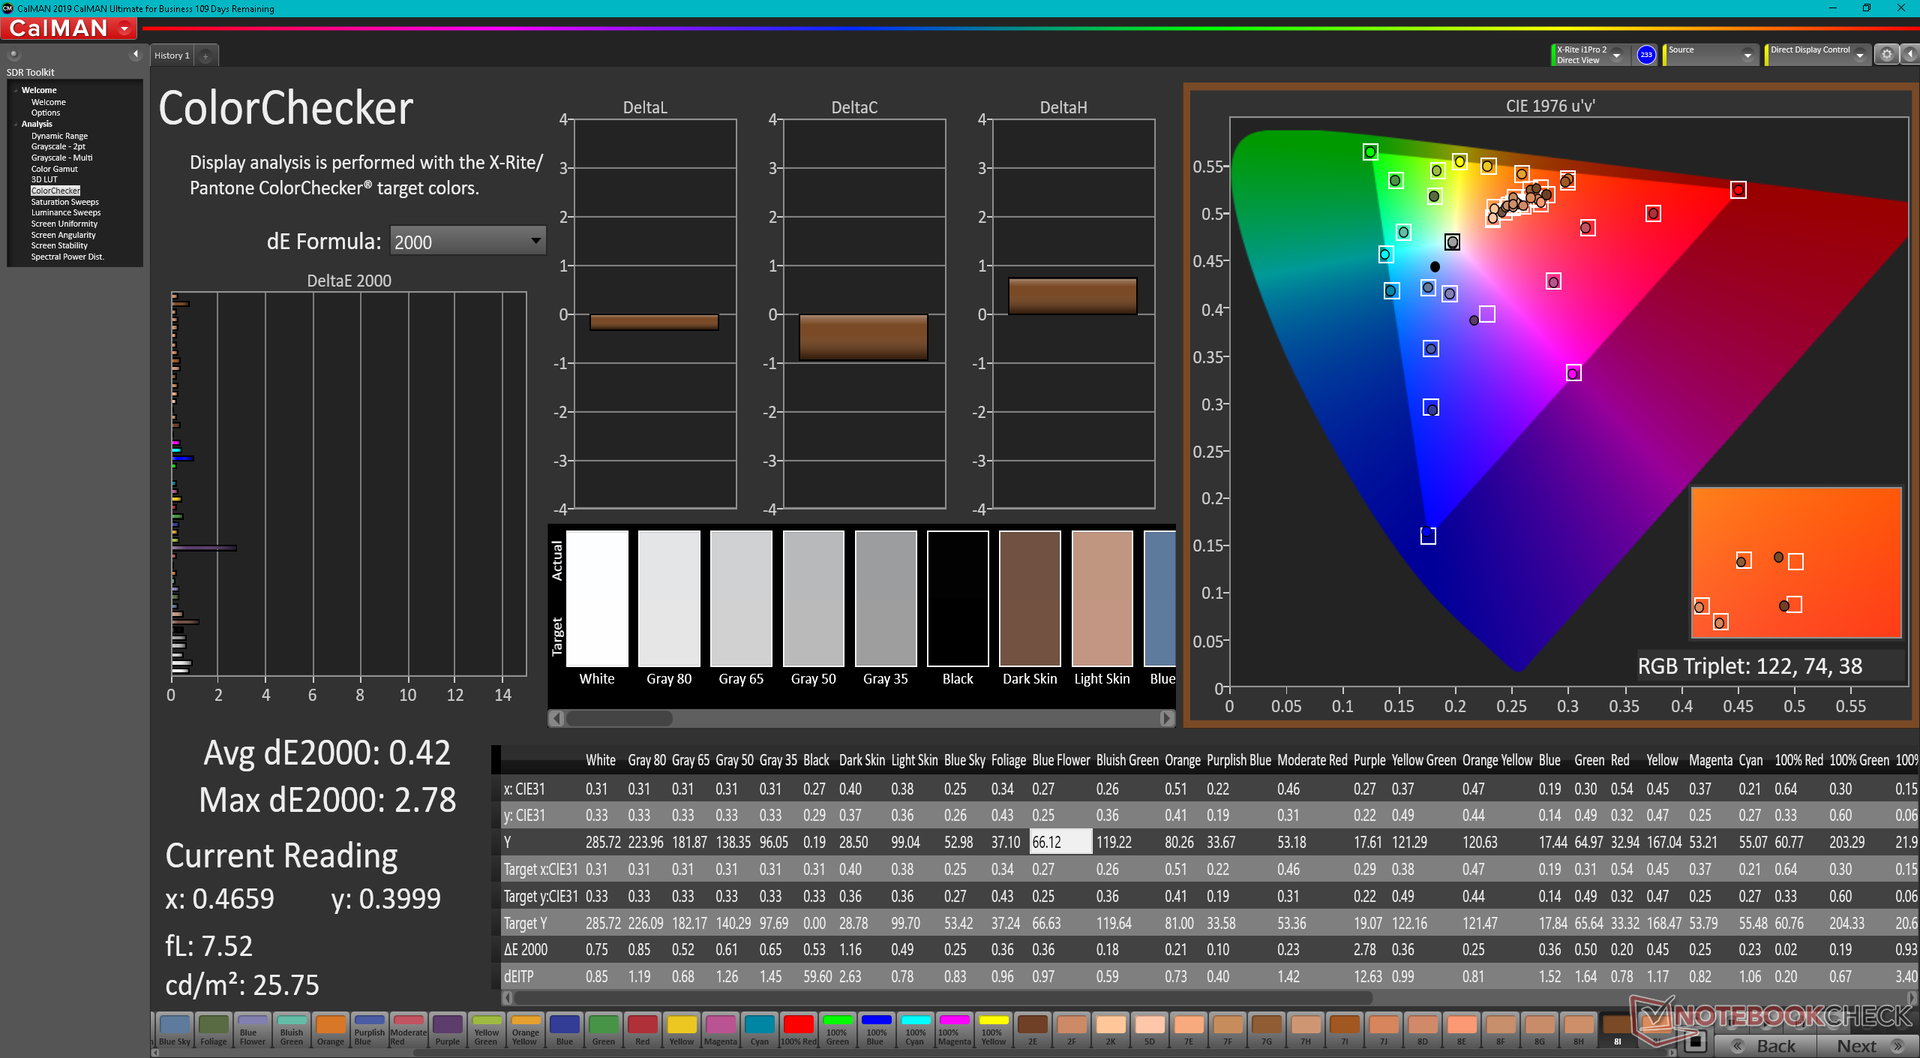
O display está bem calibrado fora da caixa, muito parecido com o que descobrimos no 7610. Os valores médios da escala de cinza e da cor DeltaE ficariam em 1,4 e 1,88, respectivamente, enquanto nossas próprias tentativas de calibração melhorariam ainda mais as médias para apenas 0,5 e 0,42. Se você valoriza os displays precisos sRGB, então você vai gostar do que verá aqui.
Exibir tempos de resposta
| ↔ Tempo de resposta preto para branco | ||
|---|---|---|
| 28 ms ... ascensão ↗ e queda ↘ combinadas | ↗ 13.2 ms ascensão | 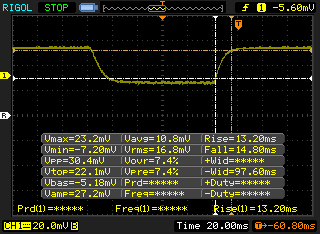 |
| ↘ 14.8 ms queda | ||
| A tela mostra taxas de resposta relativamente lentas em nossos testes e pode ser muito lenta para os jogadores. Em comparação, todos os dispositivos testados variam de 0.1 (mínimo) a 240 (máximo) ms. » 71 % de todos os dispositivos são melhores. Isso significa que o tempo de resposta medido é pior que a média de todos os dispositivos testados (19.8 ms). | ||
| ↔ Tempo de resposta 50% cinza a 80% cinza | ||
| 38 ms ... ascensão ↗ e queda ↘ combinadas | ↗ 21.2 ms ascensão | 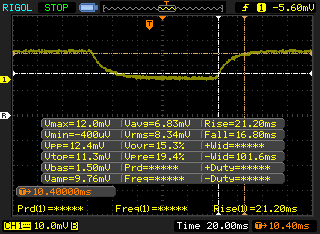 |
| ↘ 16.8 ms queda | ||
| A tela mostra taxas de resposta lentas em nossos testes e será insatisfatória para os jogadores. Em comparação, todos os dispositivos testados variam de 0.165 (mínimo) a 636 (máximo) ms. » 55 % de todos os dispositivos são melhores. Isso significa que o tempo de resposta medido é pior que a média de todos os dispositivos testados (31 ms). | ||
Cintilação da tela / PWM (modulação por largura de pulso)
| Tela tremeluzindo / PWM não detectado | 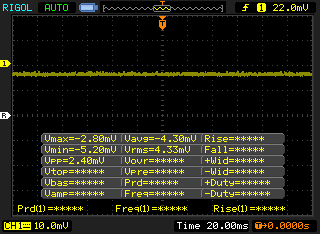 | ||
[pwm_comparison] Em comparação: 52 % de todos os dispositivos testados não usam PWM para escurecer a tela. Se PWM foi detectado, uma média de 7757 (mínimo: 5 - máximo: 343500) Hz foi medida. | |||
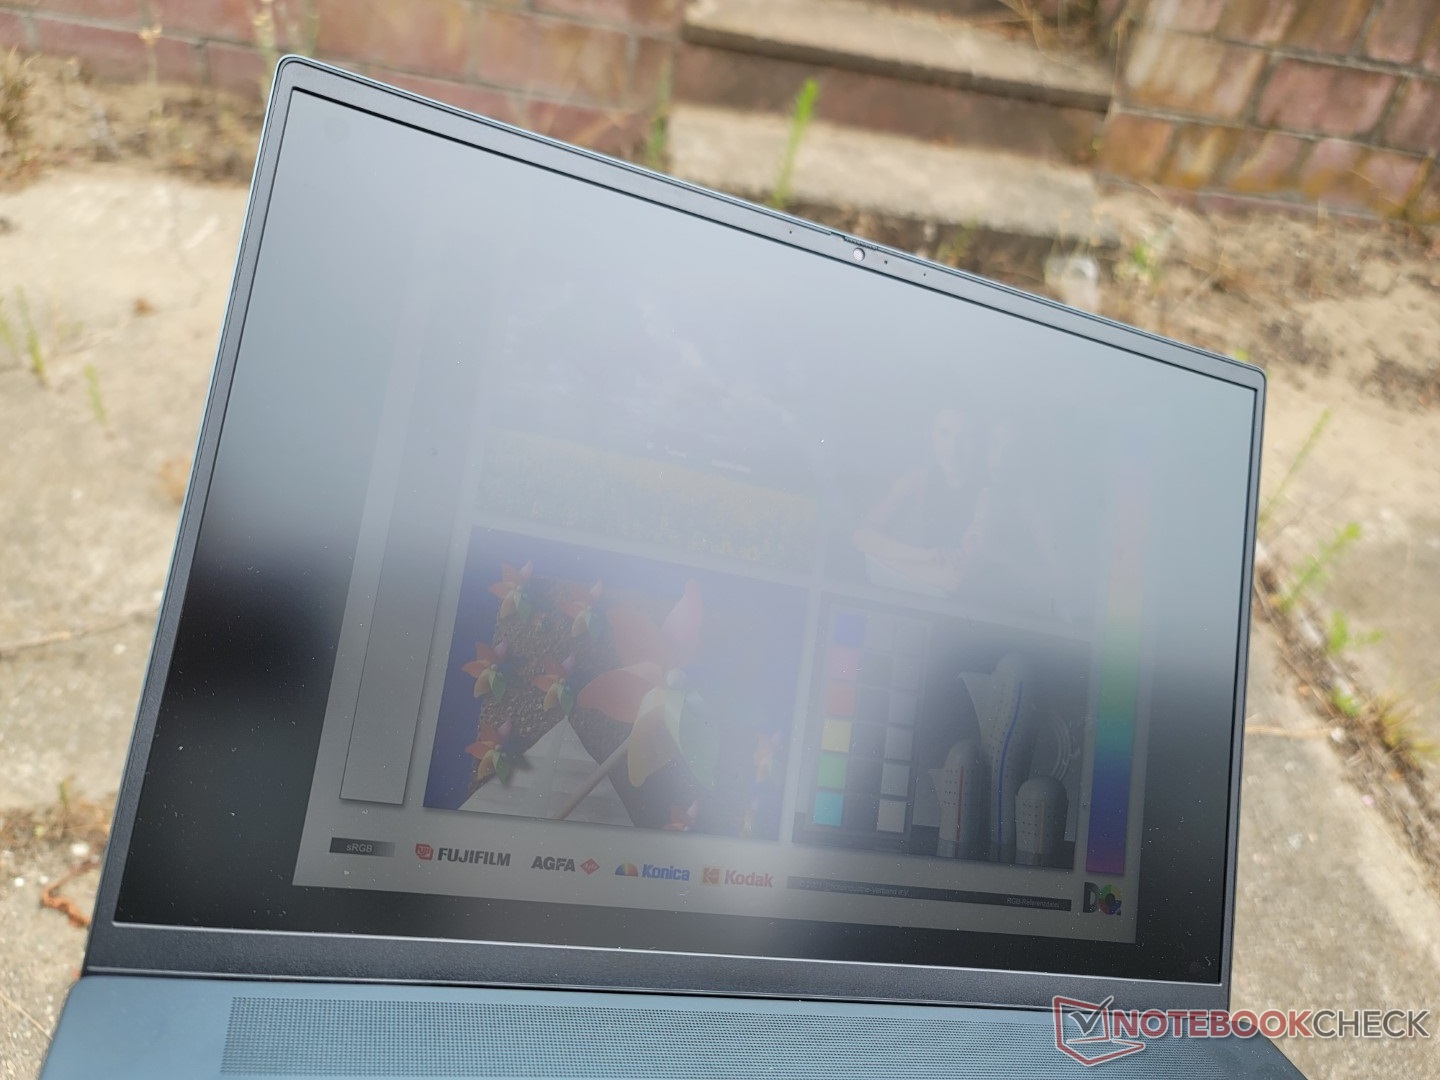
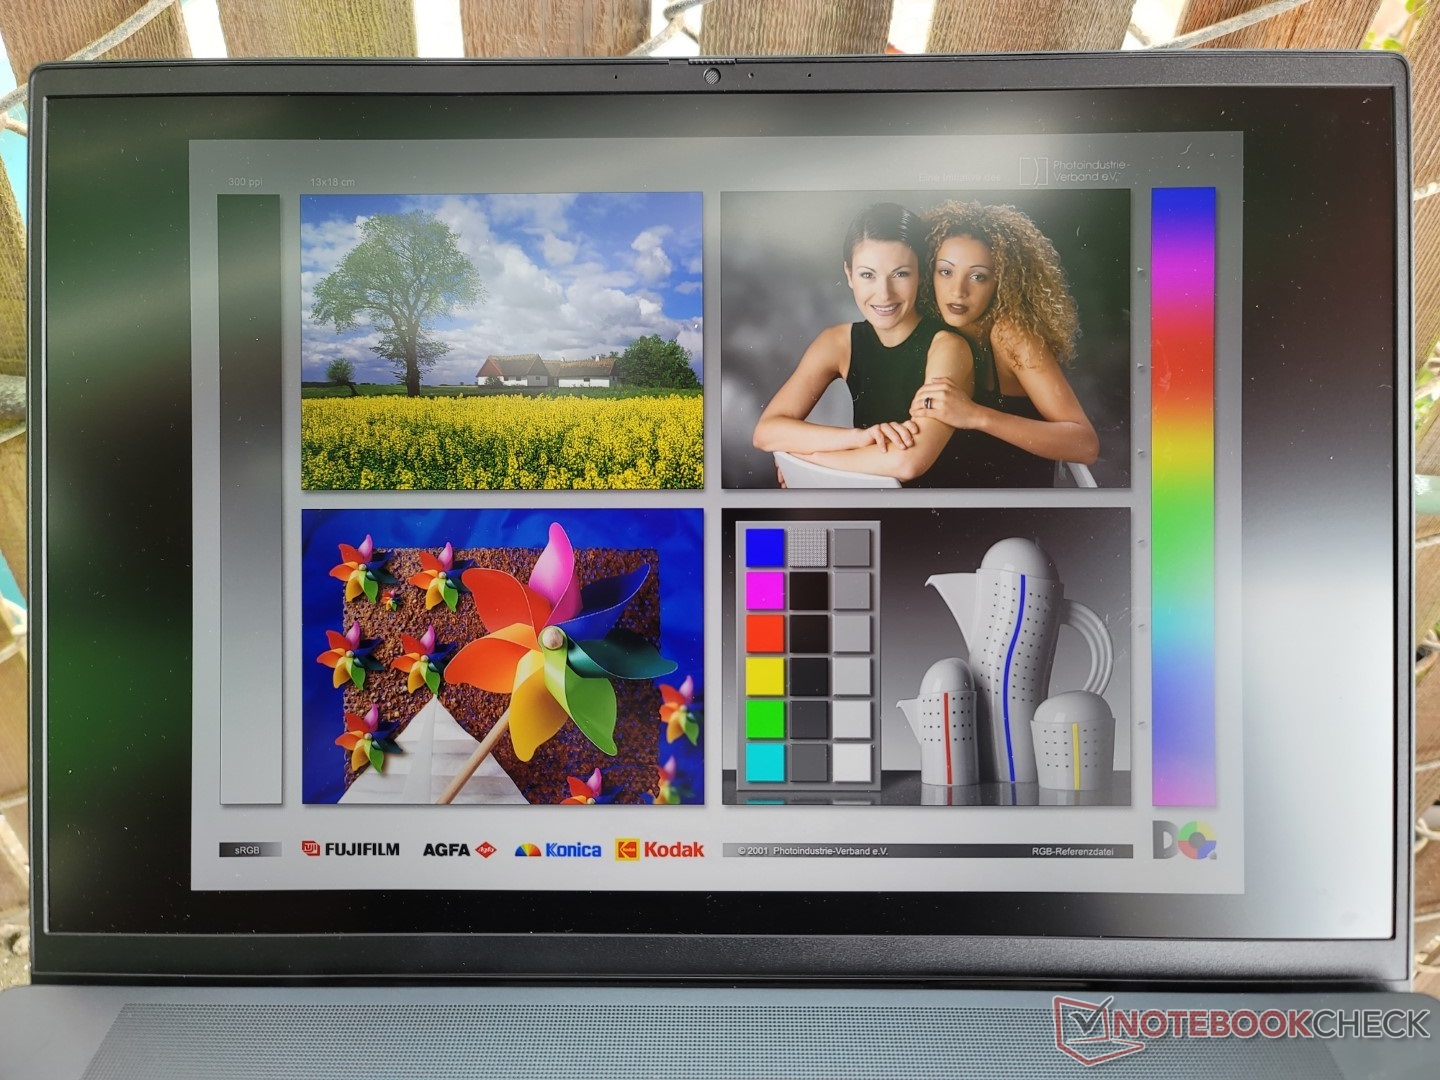
A visibilidade ao ar livre é comparável ao modelo do ano passado, já que o brilho máximo não mudou. A Lenovo Yoga 7 ou Asus VivoBook Pro 16X têm visores mais brilhantes, mas o brilho de suas sobreposições brilhantes é mais difícil de evitar.
Desempenho - A 12ª geração traz maior desempenho e consumo de energia
Condições de teste
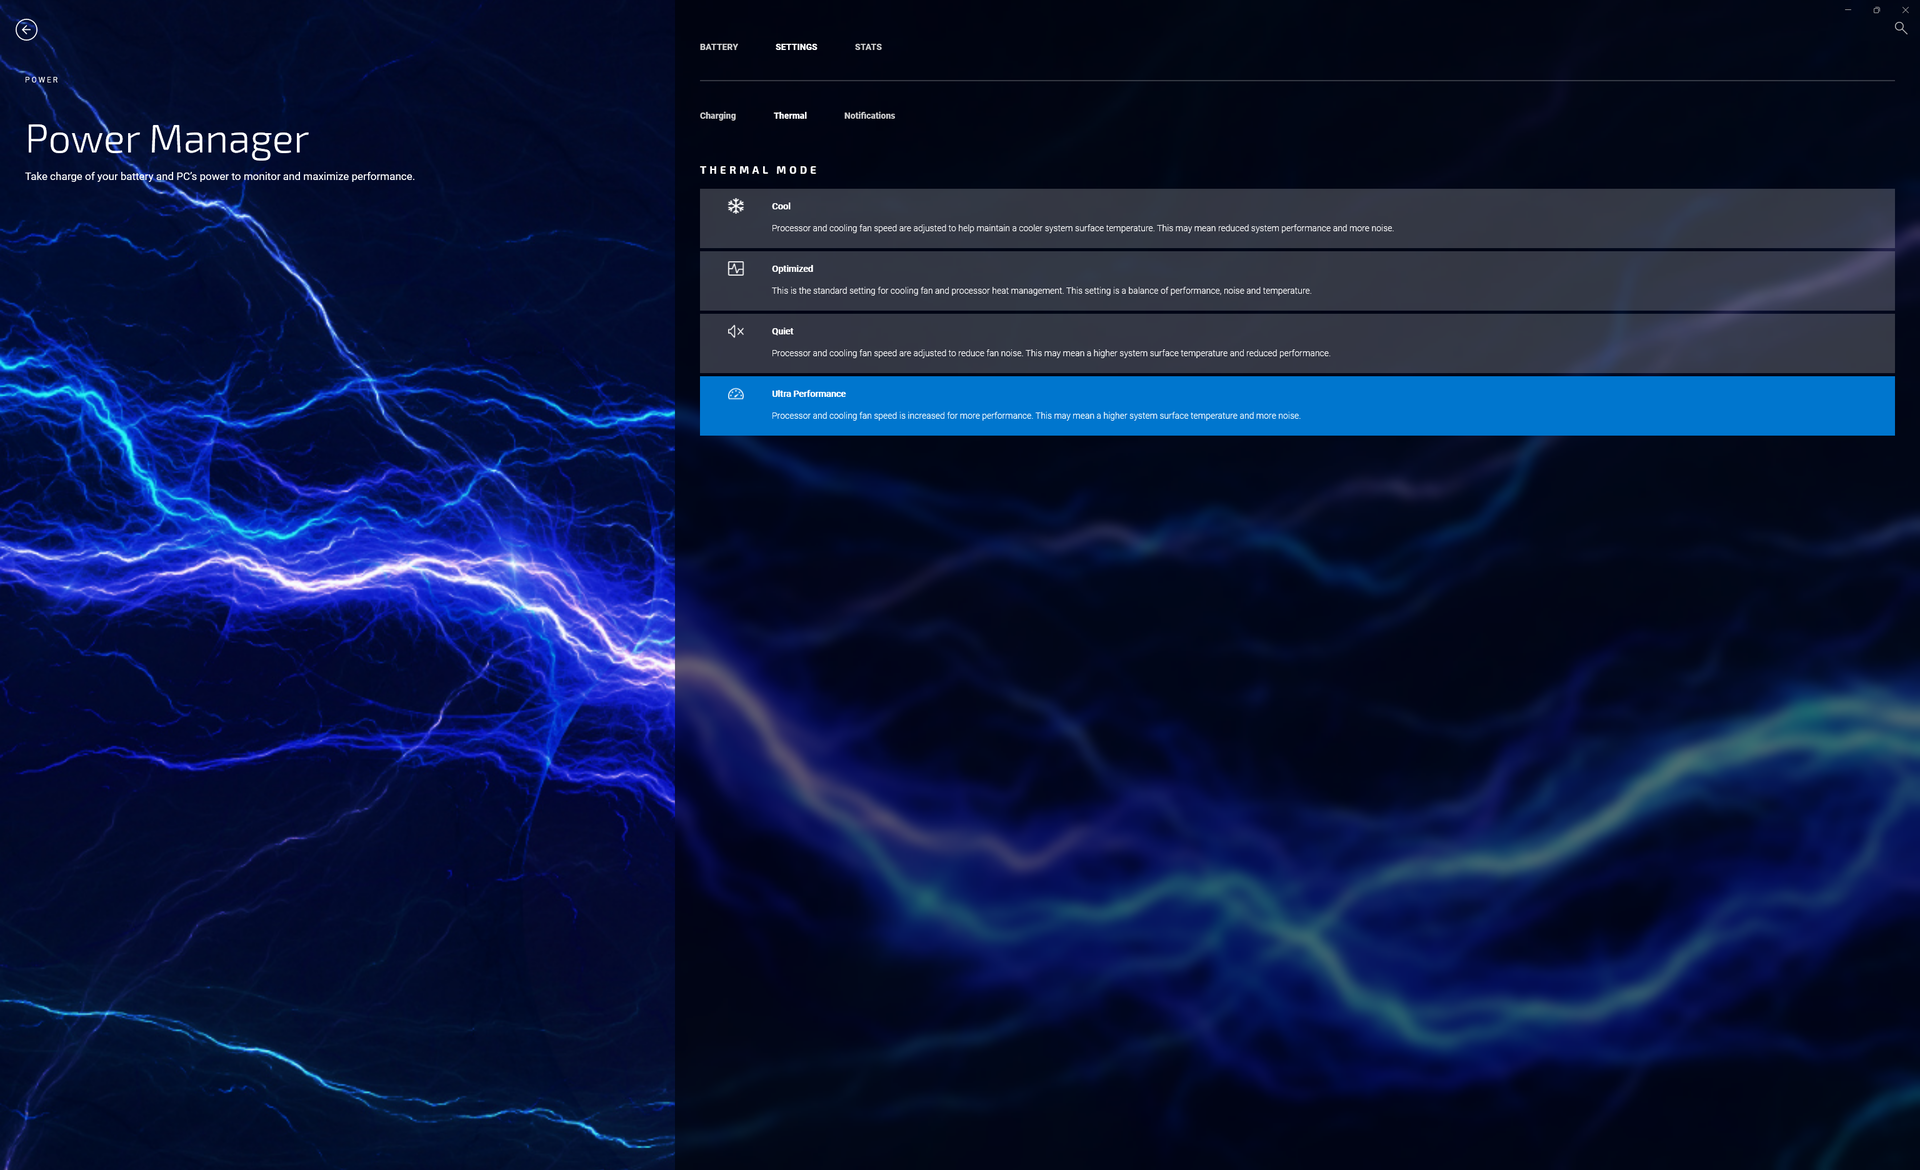
Ajustamos nossa unidade para o modo Performance via Windows e Ultra Performance via software MyDell pré-instalado antes de executar quaisquer benchmarks abaixo. Os usuários devem se familiarizar com o MyDell, pois ele é o centro das preocupações com garantia, registro do produto, configurações de carga da bateria e modos de desempenho
Nvidia Optimus vem de série sem opção MUX.
Processador
O desempenho bruto multi-fio é cerca de 30 a 50% mais rápido do que a última geração Núcleo i7-11800H para representar um impulso bastante significativo ano após ano. A sustentabilidade do desempenho poderia ser um pouco melhor, entretanto, já que as pontuações do CineBench R15 xT cairiam cerca de 18% ao executar o benchmark em um loop. Não temos certeza do quanto os usuários de desempenho deveriam esperar se descesse para o Núcleo i5-12500H configuração como ainda não testamos qualquer laptop com uma CPU como esta escrita.
Cinebench R15 Multi Loop
Cinebench R23: Multi Core | Single Core
Cinebench R15: CPU Multi 64Bit | CPU Single 64Bit
Blender: v2.79 BMW27 CPU
7-Zip 18.03: 7z b 4 | 7z b 4 -mmt1
Geekbench 5.5: Multi-Core | Single-Core
HWBOT x265 Benchmark v2.2: 4k Preset
LibreOffice : 20 Documents To PDF
R Benchmark 2.5: Overall mean
| HWBOT x265 Benchmark v2.2 / 4k Preset | |
| MSI Creator Z16P B12UHST | |
| Gigabyte Aero 16 YE5 | |
| Razer Blade 15 2022 | |
| Média Intel Core i7-12700H (4.67 - 21.8, n=64) | |
| Dell Inspiron 16 Plus 7620 | |
| HP Victus 16-e0145ng | |
| Lenovo Yoga 7 16IAP7 | |
| Dell Inspiron 16 Plus 7610-MHJ8F | |
| Dell Inspiron 14 7420 2-in-1 | |
| Acer Swift X SFX16-51G-5388 | |
| HP Pavilion Gaming 16-a0242ng | |
* ... menor é melhor
AIDA64: FP32 Ray-Trace | FPU Julia | CPU SHA3 | CPU Queen | FPU SinJulia | FPU Mandel | CPU AES | CPU ZLib | FP64 Ray-Trace | CPU PhotoWorxx
| Performance rating | |
| Asus Vivobook Pro 16X-M7600QE | |
| Dell Inspiron 16 Plus 7620 | |
| Média Intel Core i7-12700H | |
| Huawei MateBook D 16 2022 | |
| Lenovo Yoga 7 16IAP7 | |
| Acer Swift X SFX16-51G-5388 | |
| Dell Inspiron 16 Plus 7610 -9! | |
| AIDA64 / FP32 Ray-Trace | |
| Asus Vivobook Pro 16X-M7600QE | |
| Asus Vivobook Pro 16X-M7600QE | |
| Dell Inspiron 16 Plus 7620 | |
| Huawei MateBook D 16 2022 | |
| Média Intel Core i7-12700H (2585 - 17957, n=64) | |
| Lenovo Yoga 7 16IAP7 | |
| Acer Swift X SFX16-51G-5388 | |
| AIDA64 / FPU Julia | |
| Asus Vivobook Pro 16X-M7600QE | |
| Asus Vivobook Pro 16X-M7600QE | |
| Dell Inspiron 16 Plus 7620 | |
| Huawei MateBook D 16 2022 | |
| Média Intel Core i7-12700H (12439 - 90760, n=64) | |
| Lenovo Yoga 7 16IAP7 | |
| Acer Swift X SFX16-51G-5388 | |
| AIDA64 / CPU SHA3 | |
| Asus Vivobook Pro 16X-M7600QE | |
| Asus Vivobook Pro 16X-M7600QE | |
| Média Intel Core i7-12700H (833 - 4242, n=64) | |
| Dell Inspiron 16 Plus 7620 | |
| Huawei MateBook D 16 2022 | |
| Lenovo Yoga 7 16IAP7 | |
| Acer Swift X SFX16-51G-5388 | |
| AIDA64 / CPU Queen | |
| Asus Vivobook Pro 16X-M7600QE | |
| Asus Vivobook Pro 16X-M7600QE | |
| Média Intel Core i7-12700H (57923 - 103202, n=63) | |
| Huawei MateBook D 16 2022 | |
| Dell Inspiron 16 Plus 7620 | |
| Lenovo Yoga 7 16IAP7 | |
| Acer Swift X SFX16-51G-5388 | |
| AIDA64 / FPU SinJulia | |
| Asus Vivobook Pro 16X-M7600QE | |
| Asus Vivobook Pro 16X-M7600QE | |
| Média Intel Core i7-12700H (3249 - 9939, n=64) | |
| Dell Inspiron 16 Plus 7620 | |
| Huawei MateBook D 16 2022 | |
| Lenovo Yoga 7 16IAP7 | |
| Acer Swift X SFX16-51G-5388 | |
| AIDA64 / FPU Mandel | |
| Asus Vivobook Pro 16X-M7600QE | |
| Asus Vivobook Pro 16X-M7600QE | |
| Dell Inspiron 16 Plus 7620 | |
| Média Intel Core i7-12700H (7135 - 44760, n=64) | |
| Huawei MateBook D 16 2022 | |
| Lenovo Yoga 7 16IAP7 | |
| Acer Swift X SFX16-51G-5388 | |
| AIDA64 / CPU AES | |
| Asus Vivobook Pro 16X-M7600QE | |
| Asus Vivobook Pro 16X-M7600QE | |
| Huawei MateBook D 16 2022 | |
| Média Intel Core i7-12700H (31839 - 144360, n=64) | |
| Dell Inspiron 16 Plus 7620 | |
| Acer Swift X SFX16-51G-5388 | |
| Lenovo Yoga 7 16IAP7 | |
| AIDA64 / FP64 Ray-Trace | |
| Asus Vivobook Pro 16X-M7600QE | |
| Asus Vivobook Pro 16X-M7600QE | |
| Dell Inspiron 16 Plus 7620 | |
| Média Intel Core i7-12700H (1437 - 9692, n=64) | |
| Huawei MateBook D 16 2022 | |
| Lenovo Yoga 7 16IAP7 | |
| Acer Swift X SFX16-51G-5388 | |
| AIDA64 / CPU PhotoWorxx | |
| Lenovo Yoga 7 16IAP7 | |
| Huawei MateBook D 16 2022 | |
| Acer Swift X SFX16-51G-5388 | |
| Dell Inspiron 16 Plus 7620 | |
| Média Intel Core i7-12700H (12863 - 52207, n=64) | |
| Asus Vivobook Pro 16X-M7600QE | |
| Asus Vivobook Pro 16X-M7600QE | |
Desempenho do sistema
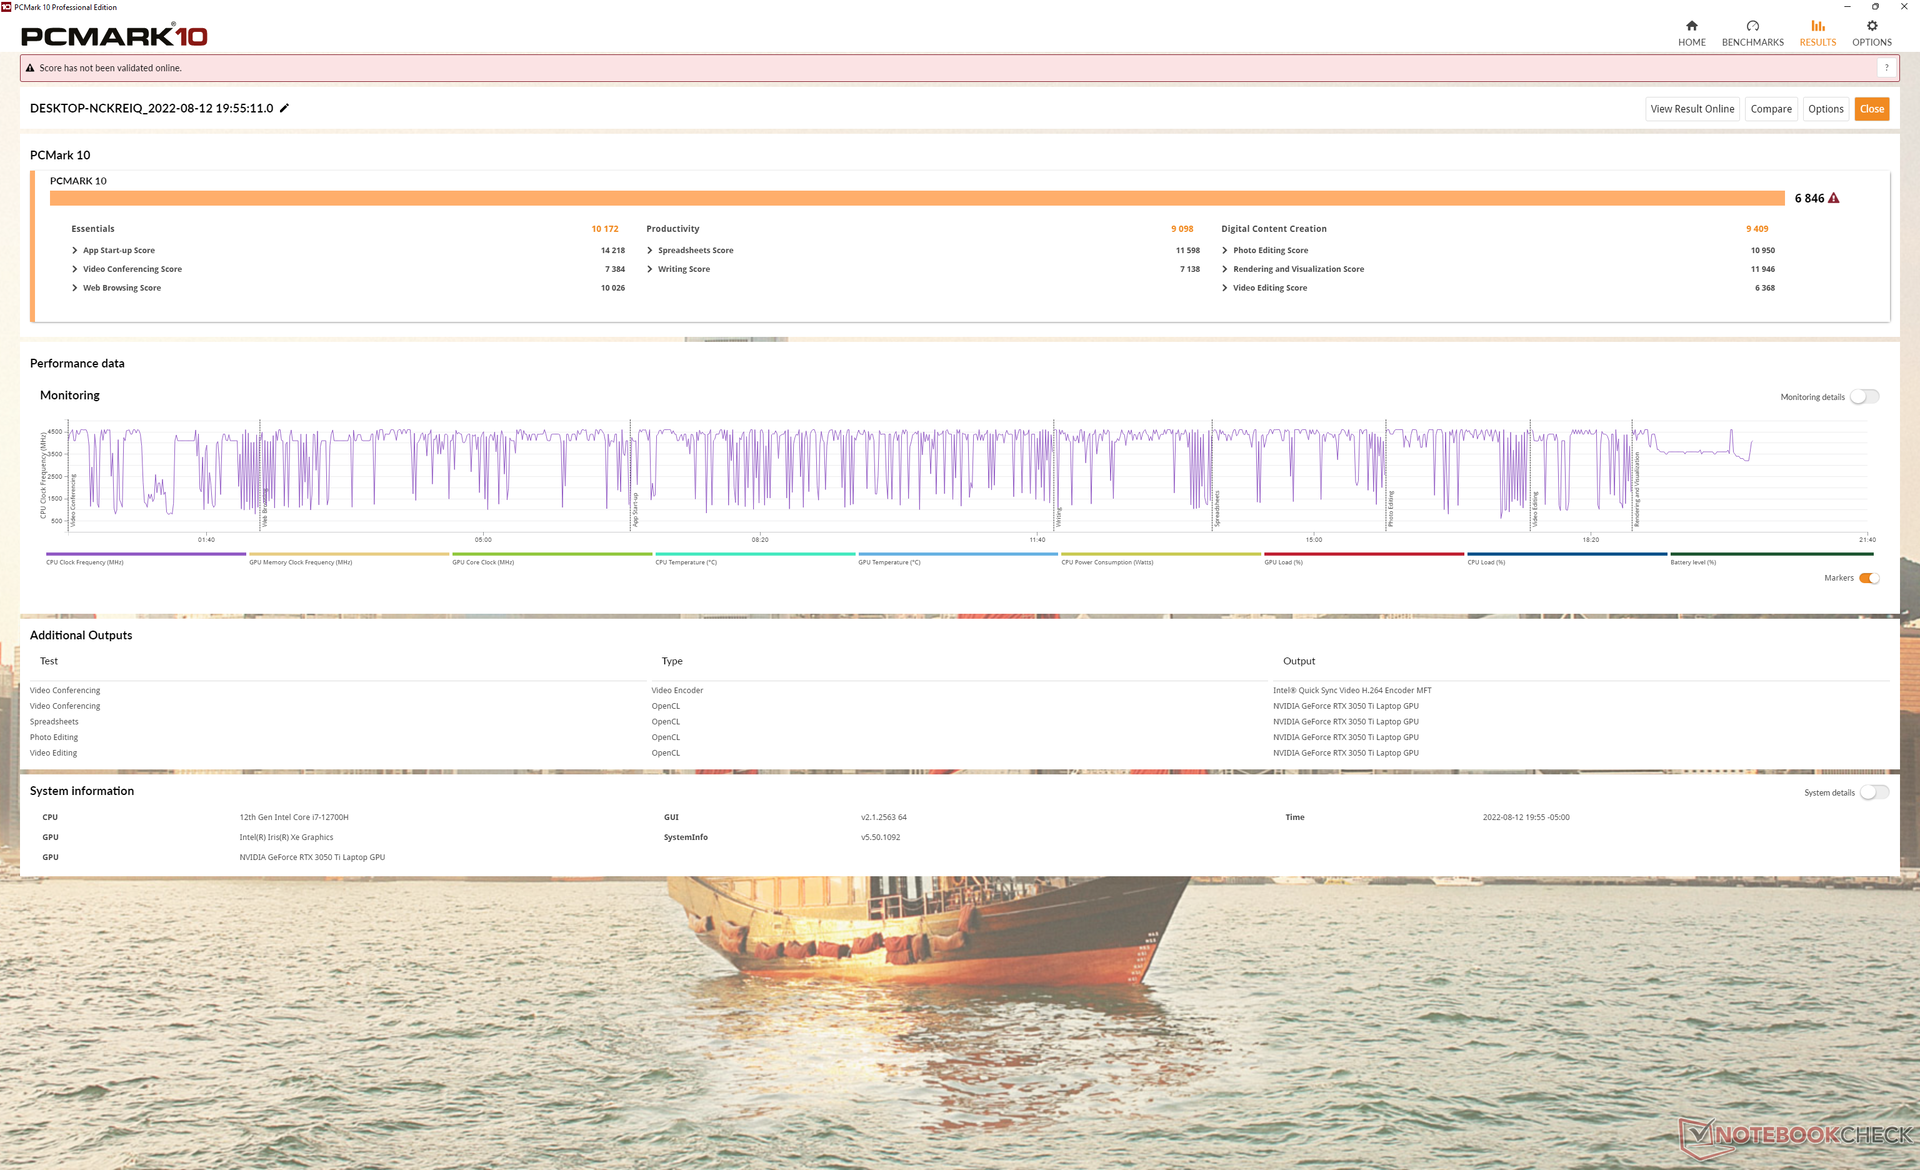
Os resultados do PCMark 10 são consistentemente superiores aos da geração anterior Inspiron 16 Plus 7610, assim como da maioria dos outros laptops multimídia de 16 polegadas.
CrossMark: Overall | Productivity | Creativity | Responsiveness
| PCMark 10 / Score | |
| Dell Inspiron 16 Plus 7620 | |
| Média Intel Core i7-12700H, NVIDIA GeForce RTX 3050 Ti Laptop GPU (6623 - 7075, n=5) | |
| Asus Vivobook Pro 16X-M7600QE | |
| Dell Inspiron 16 Plus 7610 | |
| Huawei MateBook D 16 2022 | |
| Lenovo Yoga 7 16IAP7 | |
| Acer Swift X SFX16-51G-5388 | |
| PCMark 10 / Essentials | |
| Huawei MateBook D 16 2022 | |
| Lenovo Yoga 7 16IAP7 | |
| Asus Vivobook Pro 16X-M7600QE | |
| Média Intel Core i7-12700H, NVIDIA GeForce RTX 3050 Ti Laptop GPU (9540 - 10970, n=5) | |
| Dell Inspiron 16 Plus 7620 | |
| Dell Inspiron 16 Plus 7610 | |
| Acer Swift X SFX16-51G-5388 | |
| PCMark 10 / Productivity | |
| Asus Vivobook Pro 16X-M7600QE | |
| Dell Inspiron 16 Plus 7620 | |
| Média Intel Core i7-12700H, NVIDIA GeForce RTX 3050 Ti Laptop GPU (8530 - 9555, n=5) | |
| Acer Swift X SFX16-51G-5388 | |
| Dell Inspiron 16 Plus 7610 | |
| Huawei MateBook D 16 2022 | |
| Lenovo Yoga 7 16IAP7 | |
| PCMark 10 / Digital Content Creation | |
| Dell Inspiron 16 Plus 7620 | |
| Média Intel Core i7-12700H, NVIDIA GeForce RTX 3050 Ti Laptop GPU (8855 - 9542, n=5) | |
| Dell Inspiron 16 Plus 7610 | |
| Asus Vivobook Pro 16X-M7600QE | |
| Lenovo Yoga 7 16IAP7 | |
| Huawei MateBook D 16 2022 | |
| Acer Swift X SFX16-51G-5388 | |
| CrossMark / Overall | |
| Huawei MateBook D 16 2022 | |
| Dell Inspiron 16 Plus 7620 | |
| Média Intel Core i7-12700H, NVIDIA GeForce RTX 3050 Ti Laptop GPU (1654 - 1872, n=5) | |
| Lenovo Yoga 7 16IAP7 | |
| Acer Swift X SFX16-51G-5388 | |
| CrossMark / Productivity | |
| Huawei MateBook D 16 2022 | |
| Média Intel Core i7-12700H, NVIDIA GeForce RTX 3050 Ti Laptop GPU (1595 - 1792, n=5) | |
| Dell Inspiron 16 Plus 7620 | |
| Lenovo Yoga 7 16IAP7 | |
| Acer Swift X SFX16-51G-5388 | |
| CrossMark / Creativity | |
| Huawei MateBook D 16 2022 | |
| Dell Inspiron 16 Plus 7620 | |
| Lenovo Yoga 7 16IAP7 | |
| Média Intel Core i7-12700H, NVIDIA GeForce RTX 3050 Ti Laptop GPU (1699 - 1993, n=5) | |
| Acer Swift X SFX16-51G-5388 | |
| CrossMark / Responsiveness | |
| Huawei MateBook D 16 2022 | |
| Média Intel Core i7-12700H, NVIDIA GeForce RTX 3050 Ti Laptop GPU (1383 - 1768, n=5) | |
| Dell Inspiron 16 Plus 7620 | |
| Lenovo Yoga 7 16IAP7 | |
| Acer Swift X SFX16-51G-5388 | |
| PCMark 10 Score | 6846 pontos | |
Ajuda | ||
| AIDA64 / Memory Copy | |
| Lenovo Yoga 7 16IAP7 | |
| Huawei MateBook D 16 2022 | |
| Acer Swift X SFX16-51G-5388 | |
| Dell Inspiron 16 Plus 7620 | |
| Média Intel Core i7-12700H (25615 - 80511, n=64) | |
| Asus Vivobook Pro 16X-M7600QE | |
| Asus Vivobook Pro 16X-M7600QE | |
| AIDA64 / Memory Read | |
| Lenovo Yoga 7 16IAP7 | |
| Dell Inspiron 16 Plus 7620 | |
| Média Intel Core i7-12700H (25586 - 79442, n=64) | |
| Huawei MateBook D 16 2022 | |
| Acer Swift X SFX16-51G-5388 | |
| Asus Vivobook Pro 16X-M7600QE | |
| Asus Vivobook Pro 16X-M7600QE | |
| AIDA64 / Memory Write | |
| Acer Swift X SFX16-51G-5388 | |
| Lenovo Yoga 7 16IAP7 | |
| Huawei MateBook D 16 2022 | |
| Dell Inspiron 16 Plus 7620 | |
| Média Intel Core i7-12700H (23679 - 88660, n=64) | |
| Asus Vivobook Pro 16X-M7600QE | |
| Asus Vivobook Pro 16X-M7600QE | |
| AIDA64 / Memory Latency | |
| Acer Swift X SFX16-51G-5388 | |
| Huawei MateBook D 16 2022 | |
| Lenovo Yoga 7 16IAP7 | |
| Dell Inspiron 16 Plus 7620 | |
| Média Intel Core i7-12700H (76.2 - 133.9, n=62) | |
| Asus Vivobook Pro 16X-M7600QE | |
| Asus Vivobook Pro 16X-M7600QE | |
| Dell Inspiron 16 Plus 7610 | |
* ... menor é melhor
Latência do DPC
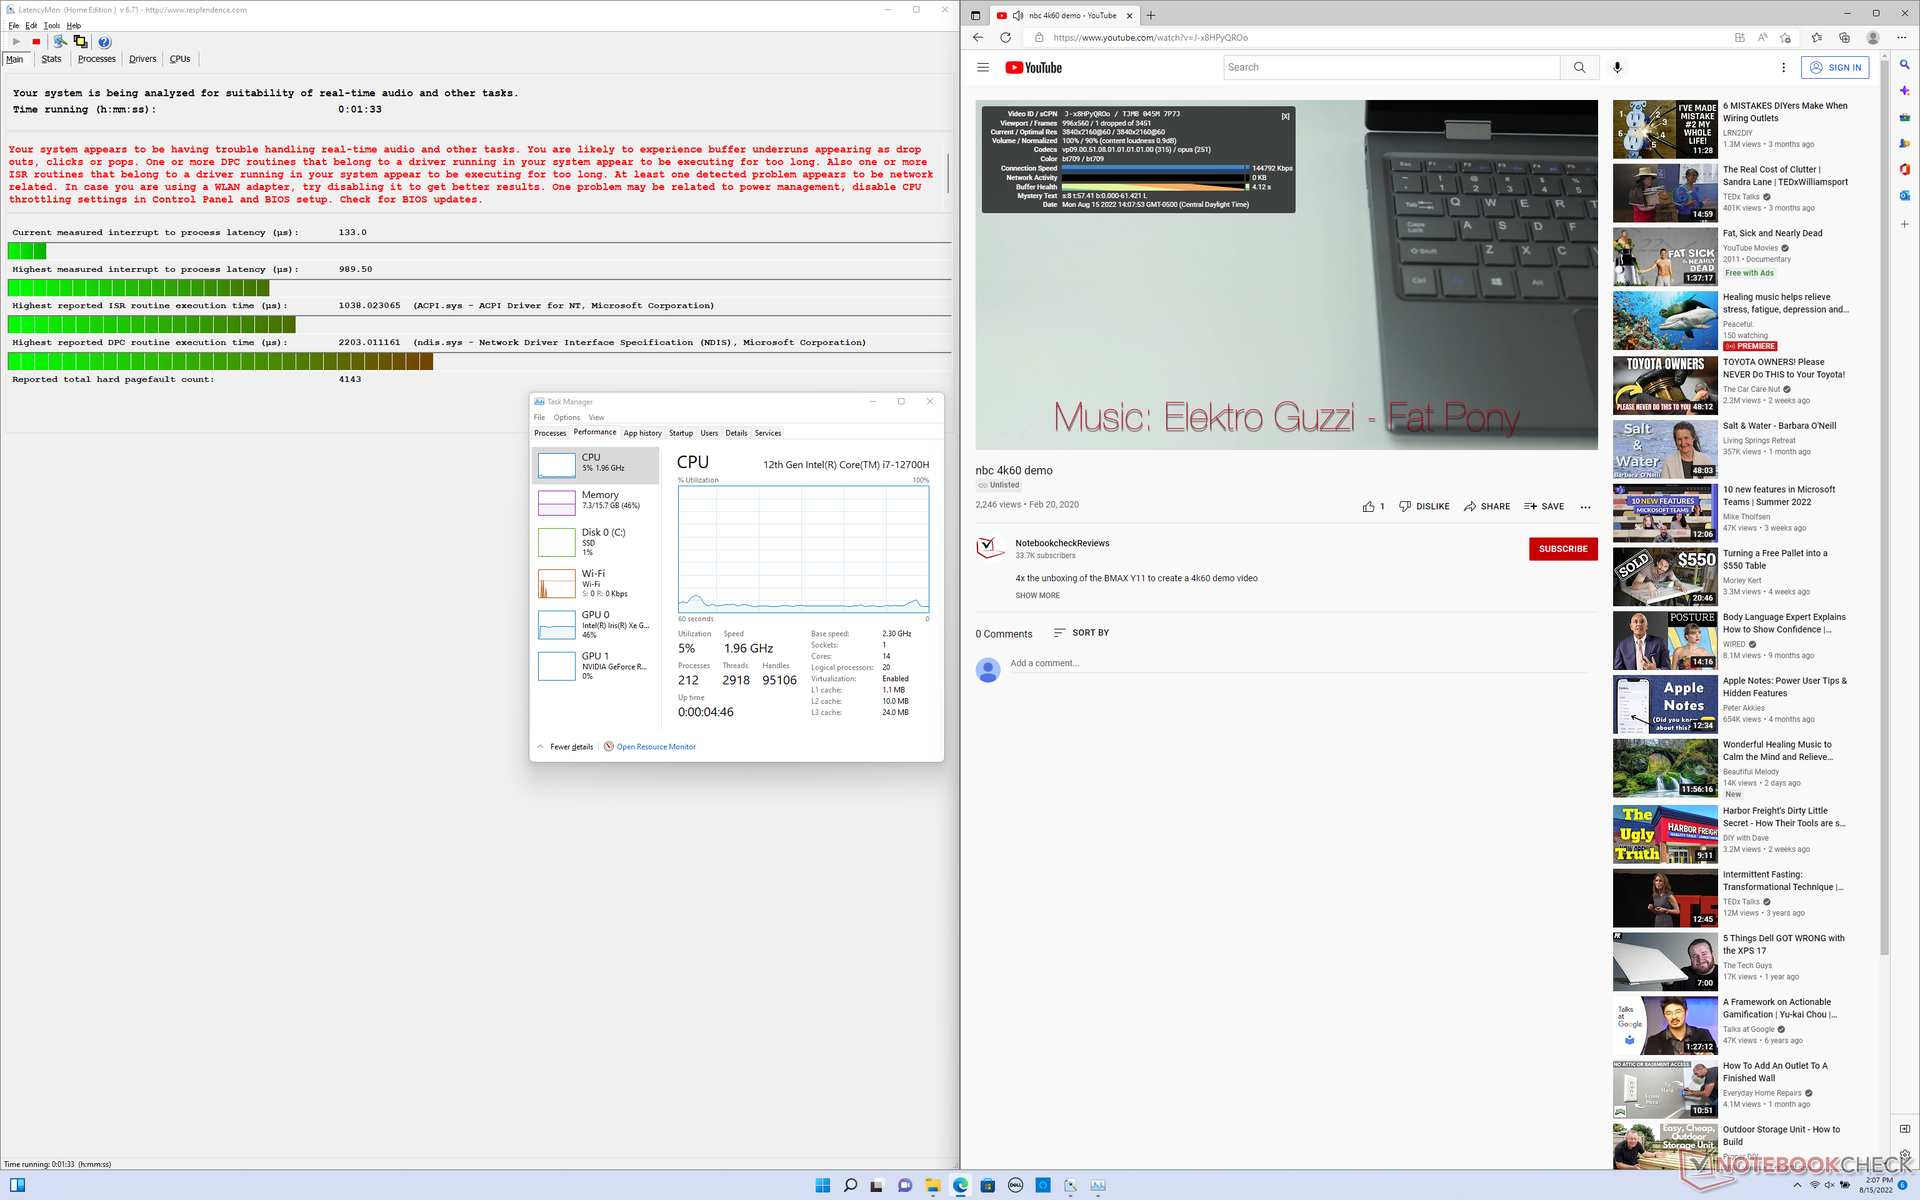
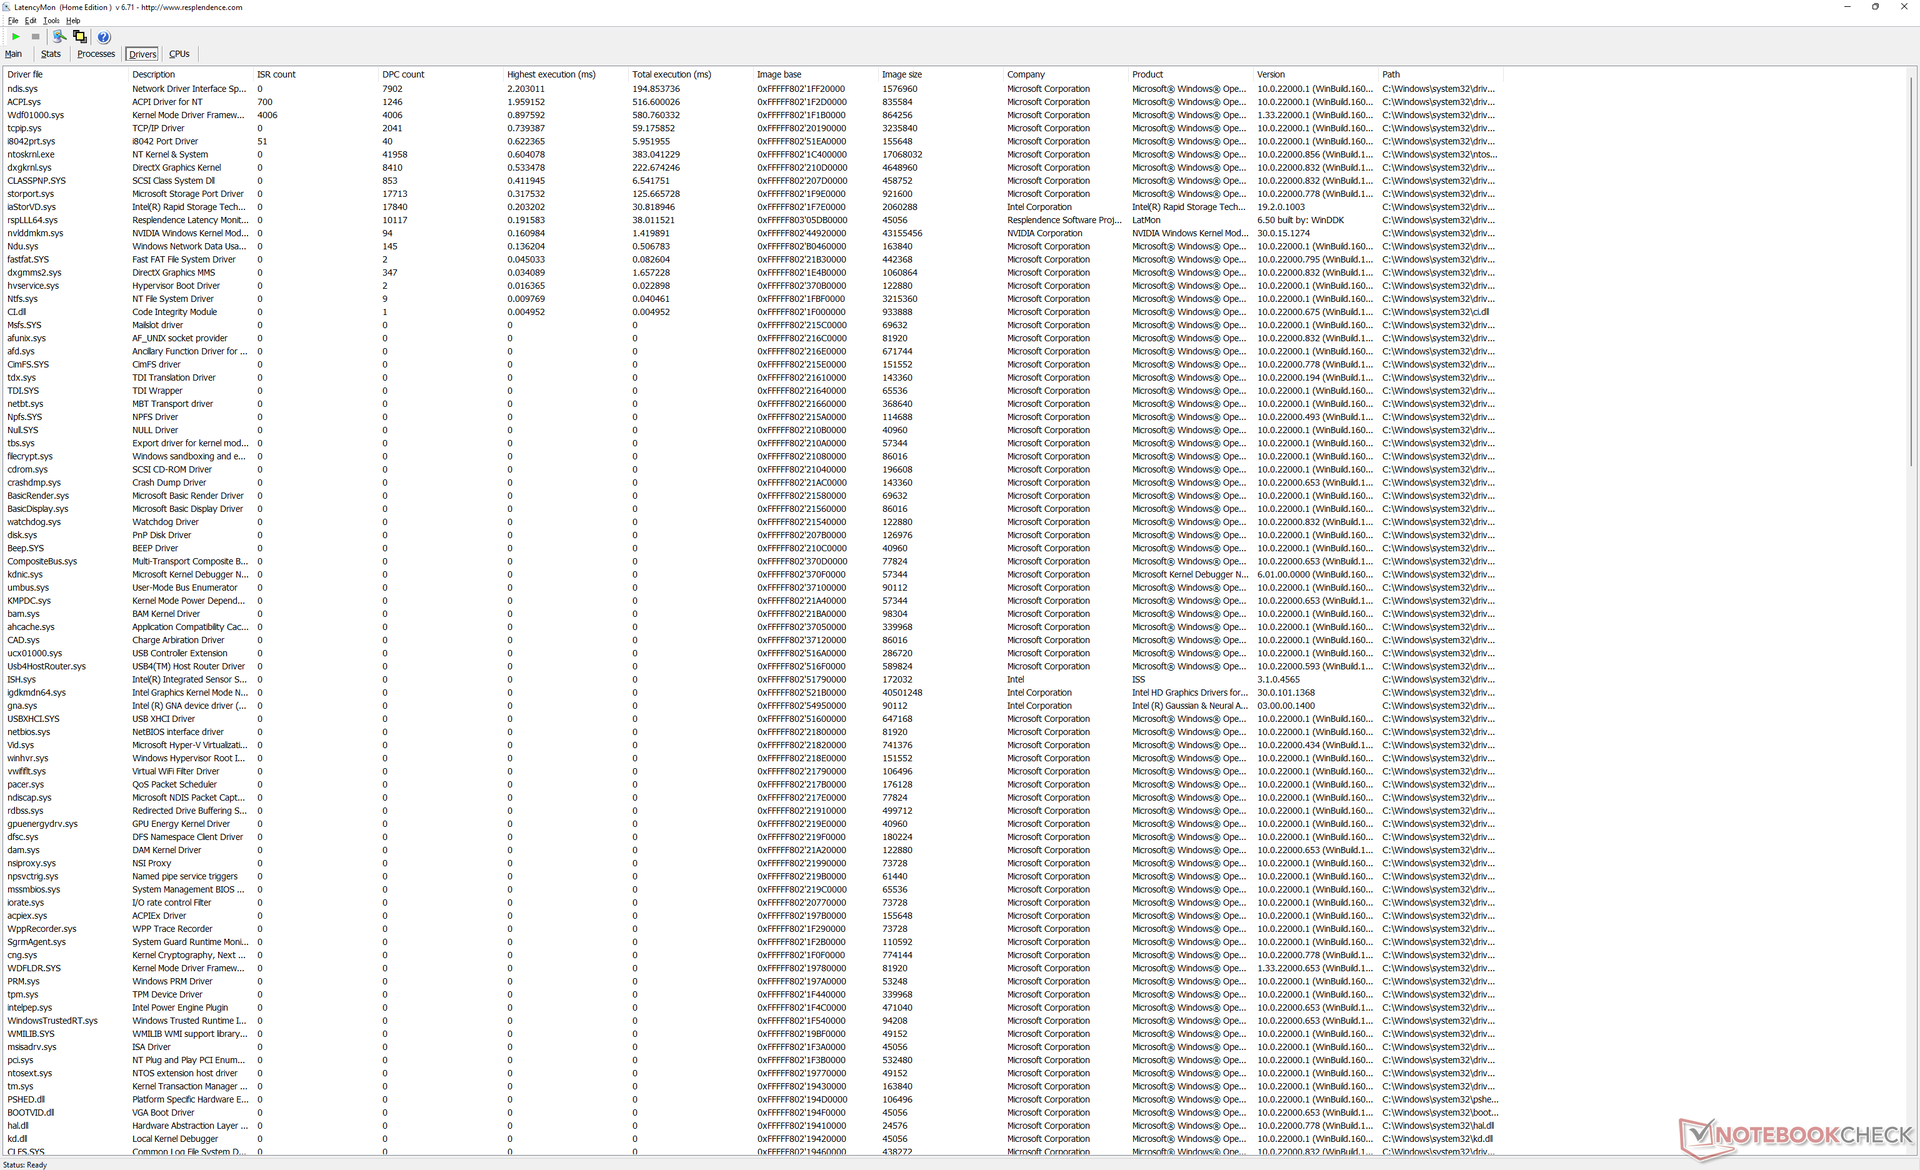
LatencyMon revela pequenos problemas de DPC ao abrir várias abas do navegador em nossa página inicial. a reprodução do vídeo de 4K a 60 FPS é, de outra forma, suave com apenas um único frame caído durante nosso vídeo de teste de minutos.
| DPC Latencies / LatencyMon - interrupt to process latency (max), Web, Youtube, Prime95 | |
| Acer Swift X SFX16-51G-5388 | |
| Asus Vivobook Pro 16X-M7600QE | |
| Dell Inspiron 16 Plus 7610 | |
| Dell Inspiron 16 Plus 7620 | |
| Huawei MateBook D 16 2022 | |
| Lenovo Yoga 7 16IAP7 | |
* ... menor é melhor
Dispositivos de armazenamento
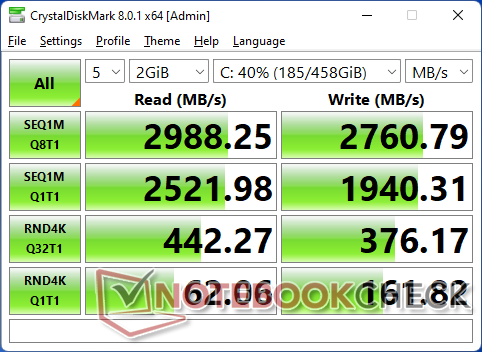
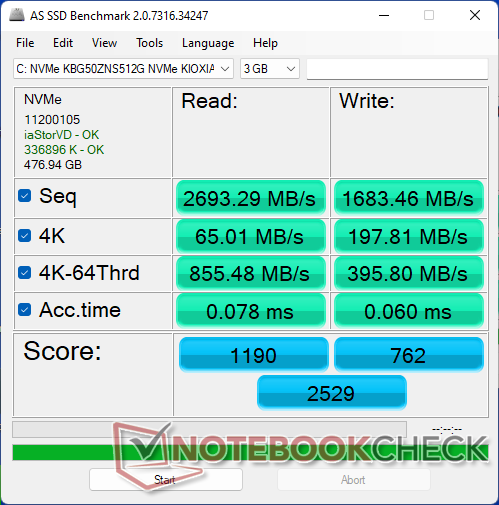
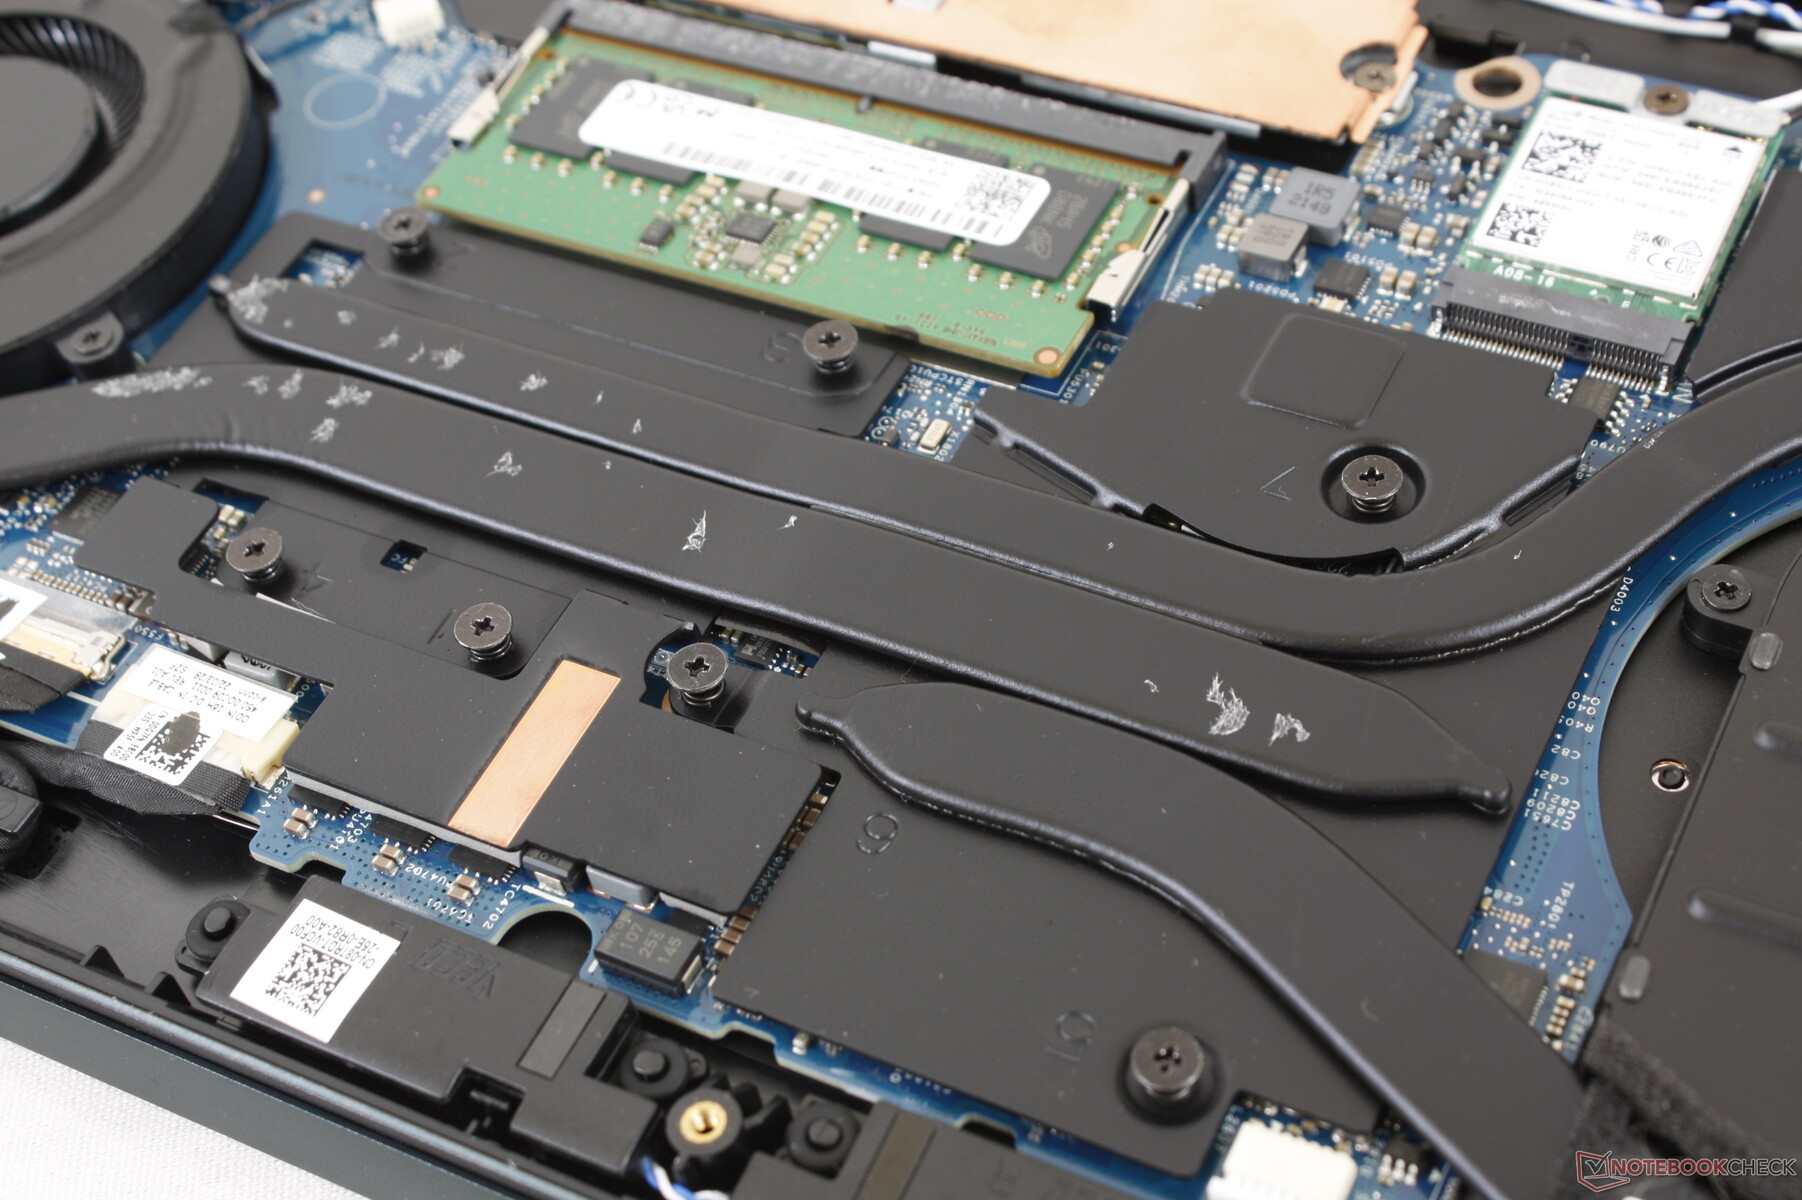
Nossa unidade de teste vem com um orçamento de 512 GB PCIe4 x4 M.2Kioxia SSD para taxas sequenciais de leitura e escrita de até ~2700 MB/s cada. Um espalhador de calor de cobre fica em cima para auxiliar no resfriamento. O acionamento em nossa unidade não exibiria problemas de estrangulamento de desempenho ao executar o DiskSpd em loop.

| Drive Performance rating - Percent | |
| Huawei MateBook D 16 2022 | |
| Asus Vivobook Pro 16X-M7600QE | |
| Lenovo Yoga 7 16IAP7 | |
| Dell Inspiron 16 Plus 7620 | |
| Acer Swift X SFX16-51G-5388 | |
| Dell Inspiron 16 Plus 7610 | |
* ... menor é melhor
Disk Throttling: DiskSpd Read Loop, Queue Depth 8
Desempenho da GPU - Um pouco mais rápido que antes
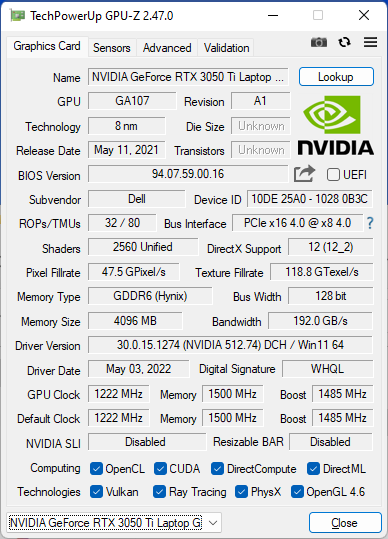
Desempenho gráfico de nosso GeForce RTX 3050 Ti é apenas cerca de 10% mais rápido do que o RTX 3050 no modelo do ano passado. Embora a série RTX 3050 seja geralmente decepcionante desde o modelo mais antigo e mais barato GTX 1660 Ti é superior, pelo menos a implementação da Dell aqui é mais rápida do que a maioria dos outros laptops com a mesma GPU
A atualização para a configuração RTX 3060 deverá aumentar a performance gráfica em até 20 por cento. A GPU seria limitada a um TGP de 60 W, no entanto, que está na parte inferior do espectro para as opções móveis RTX 3060.
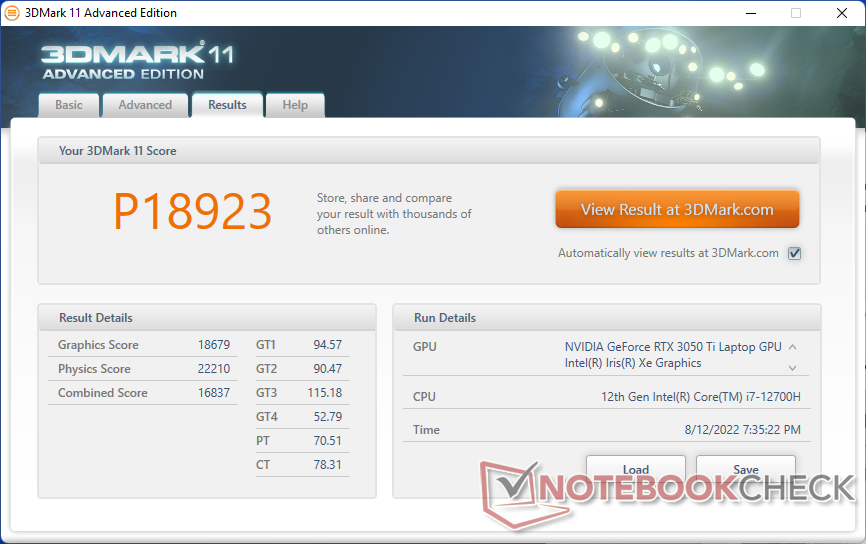
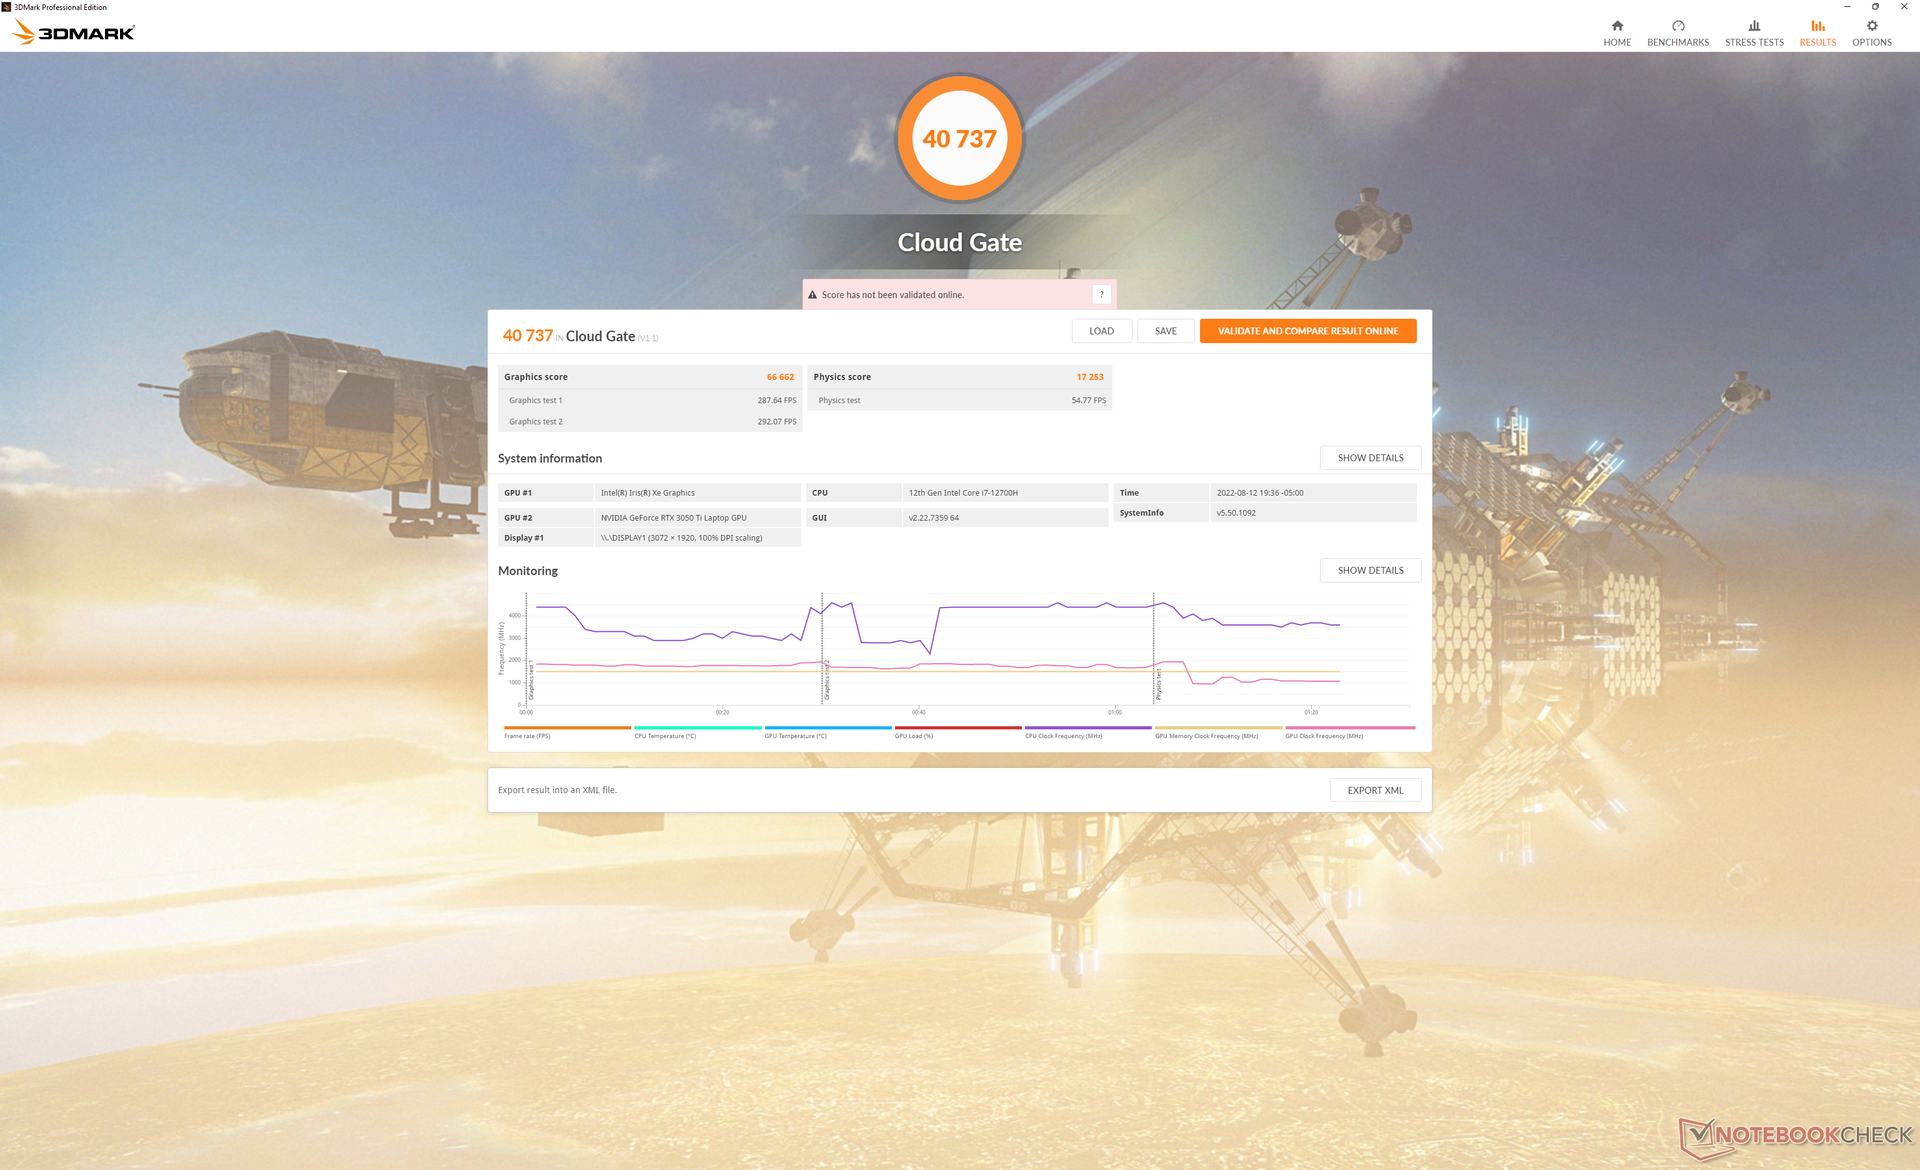
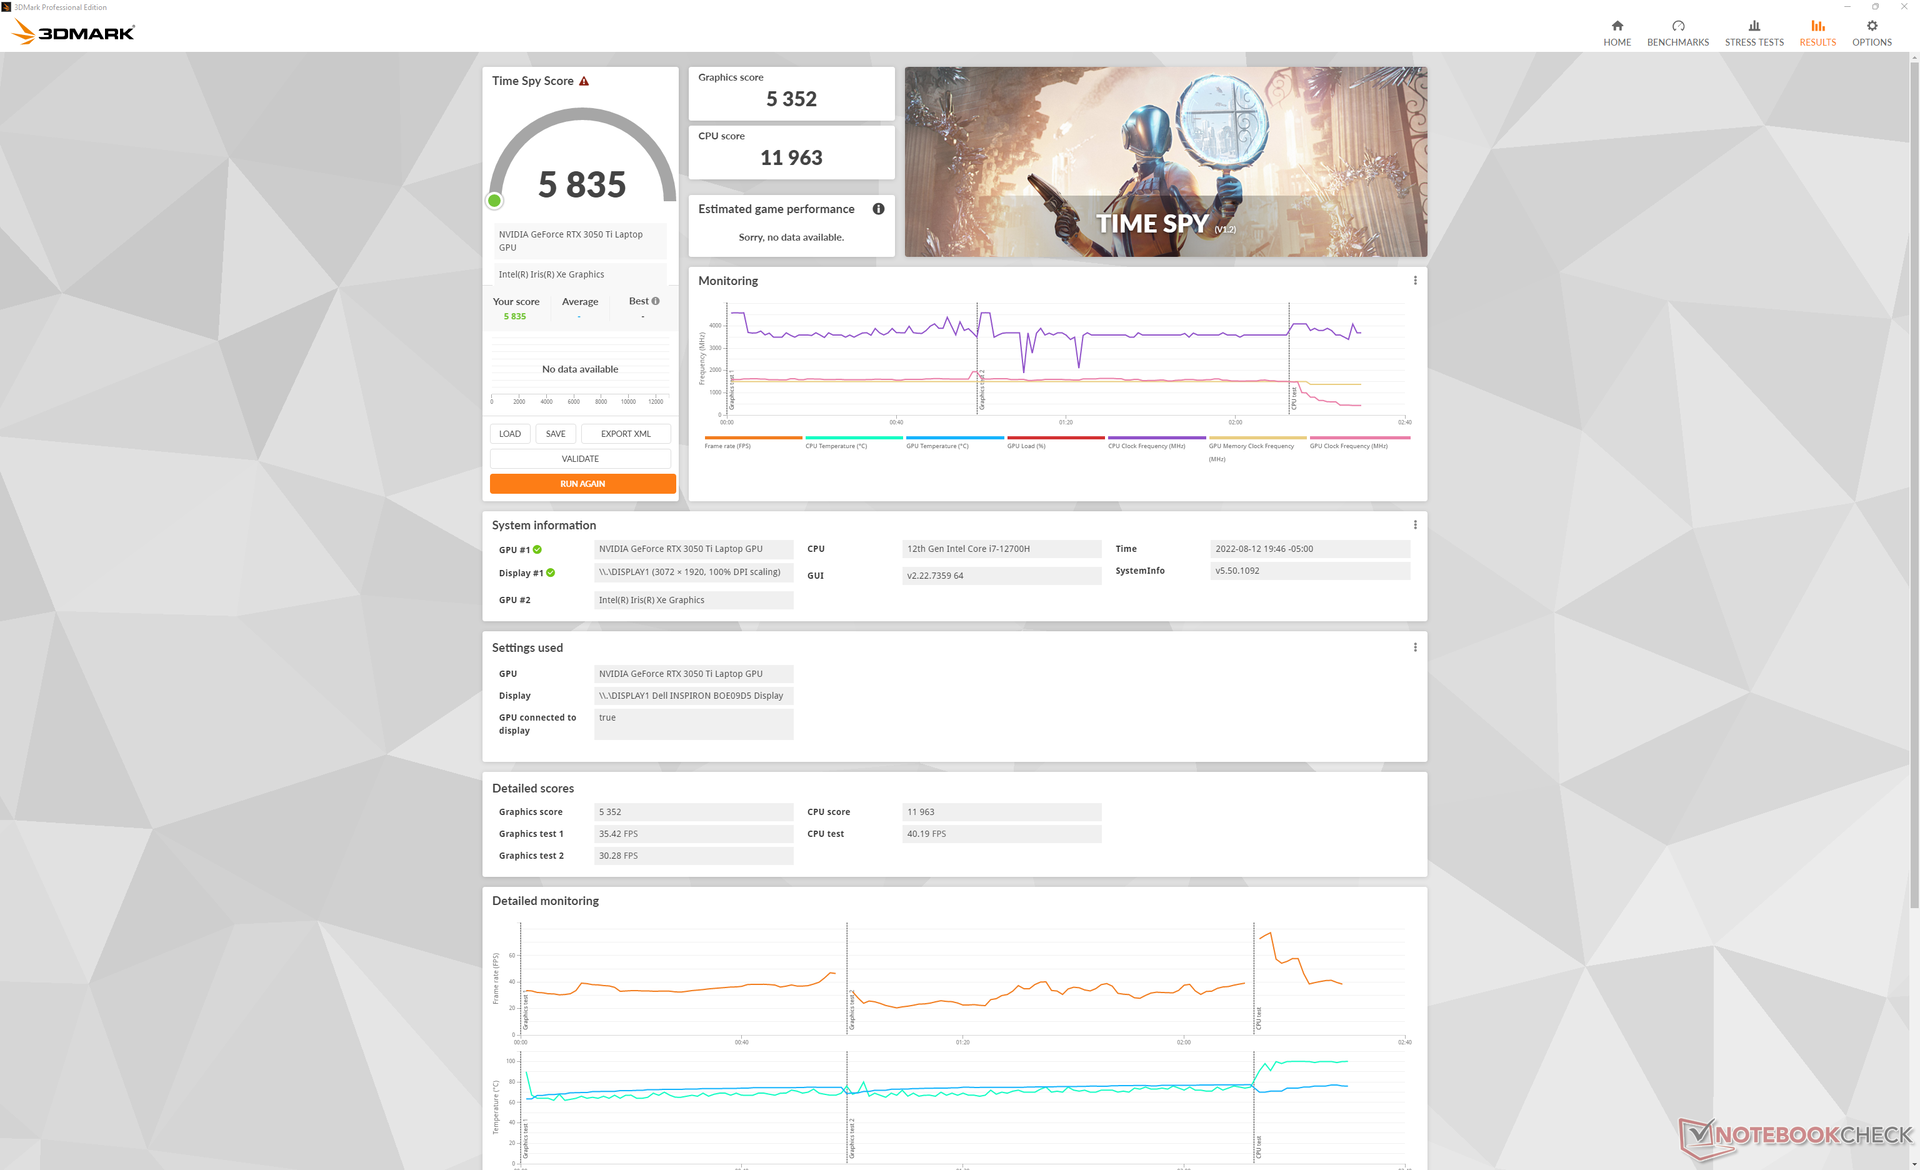
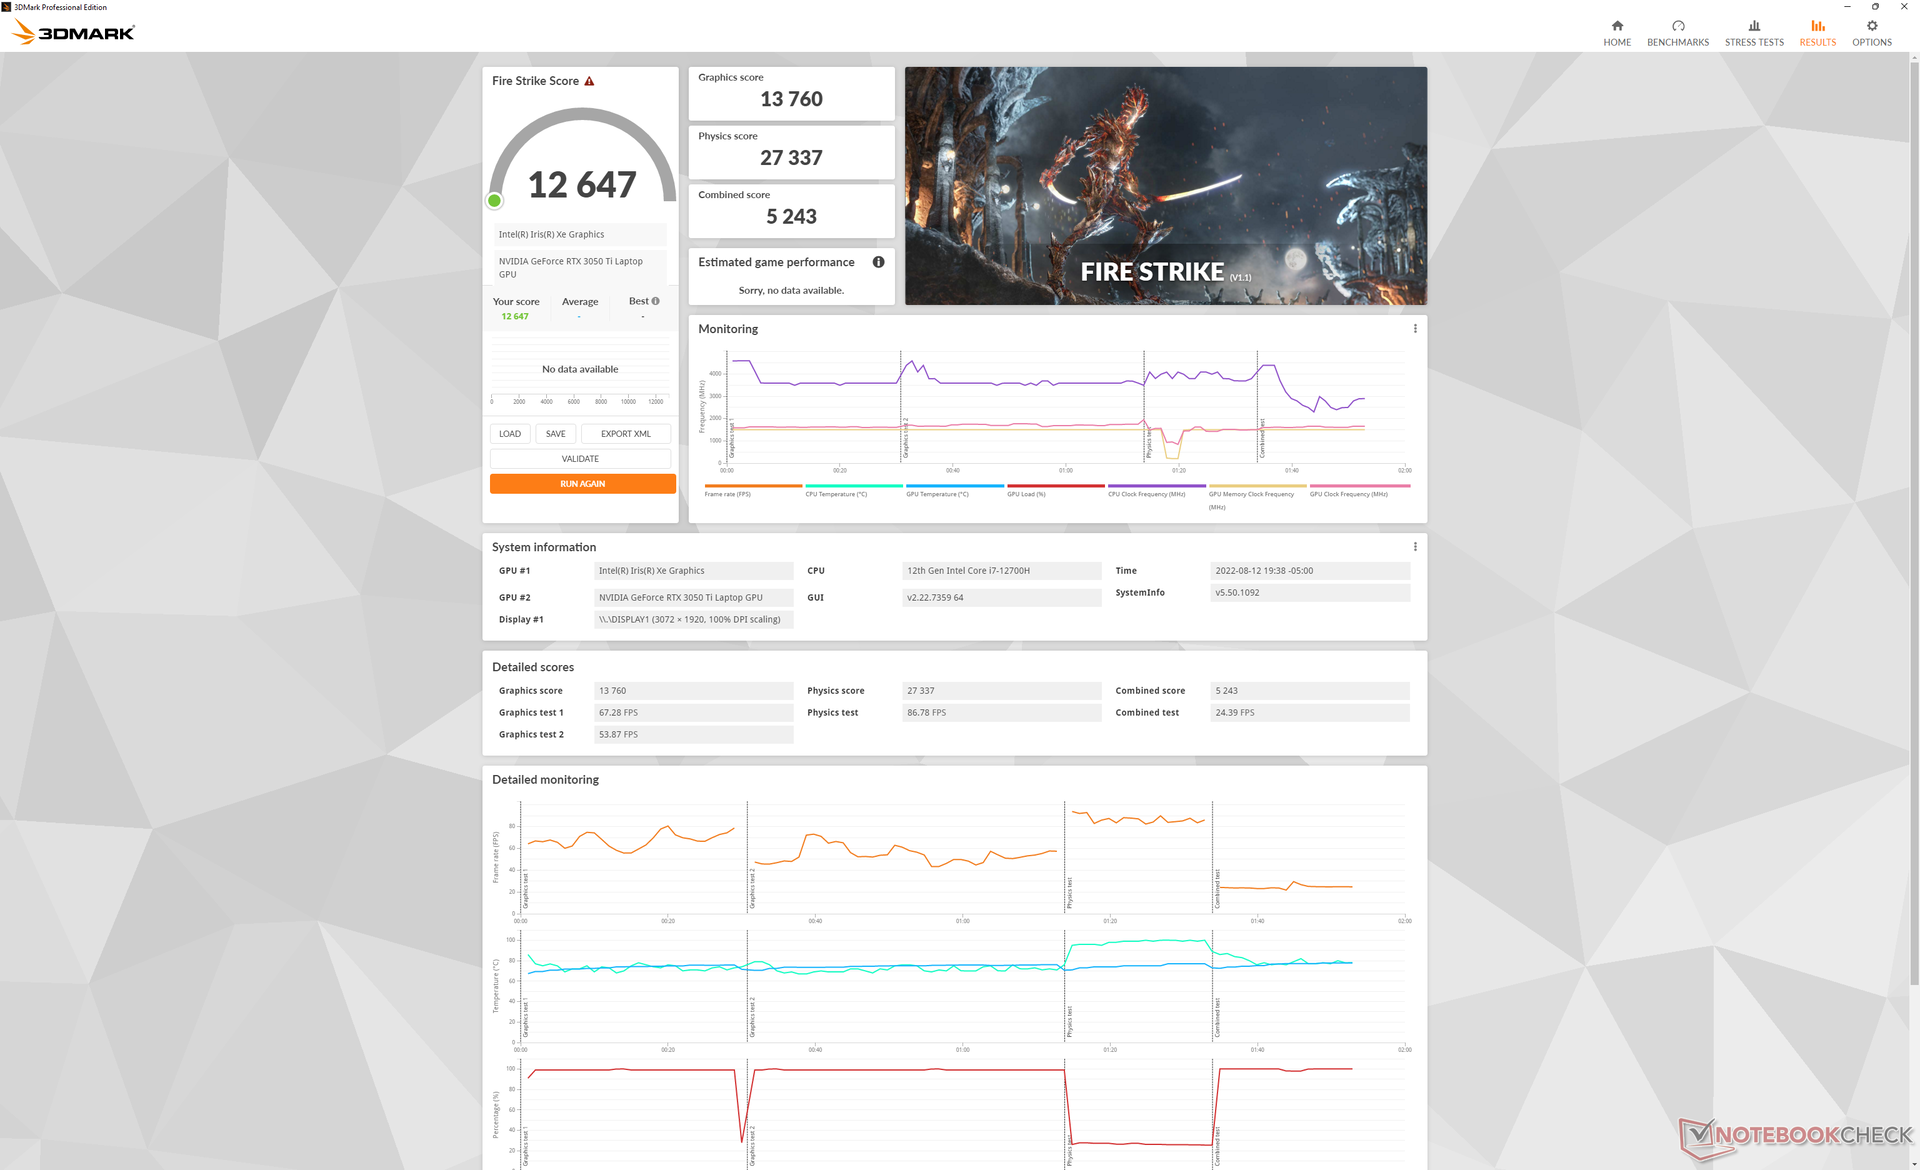
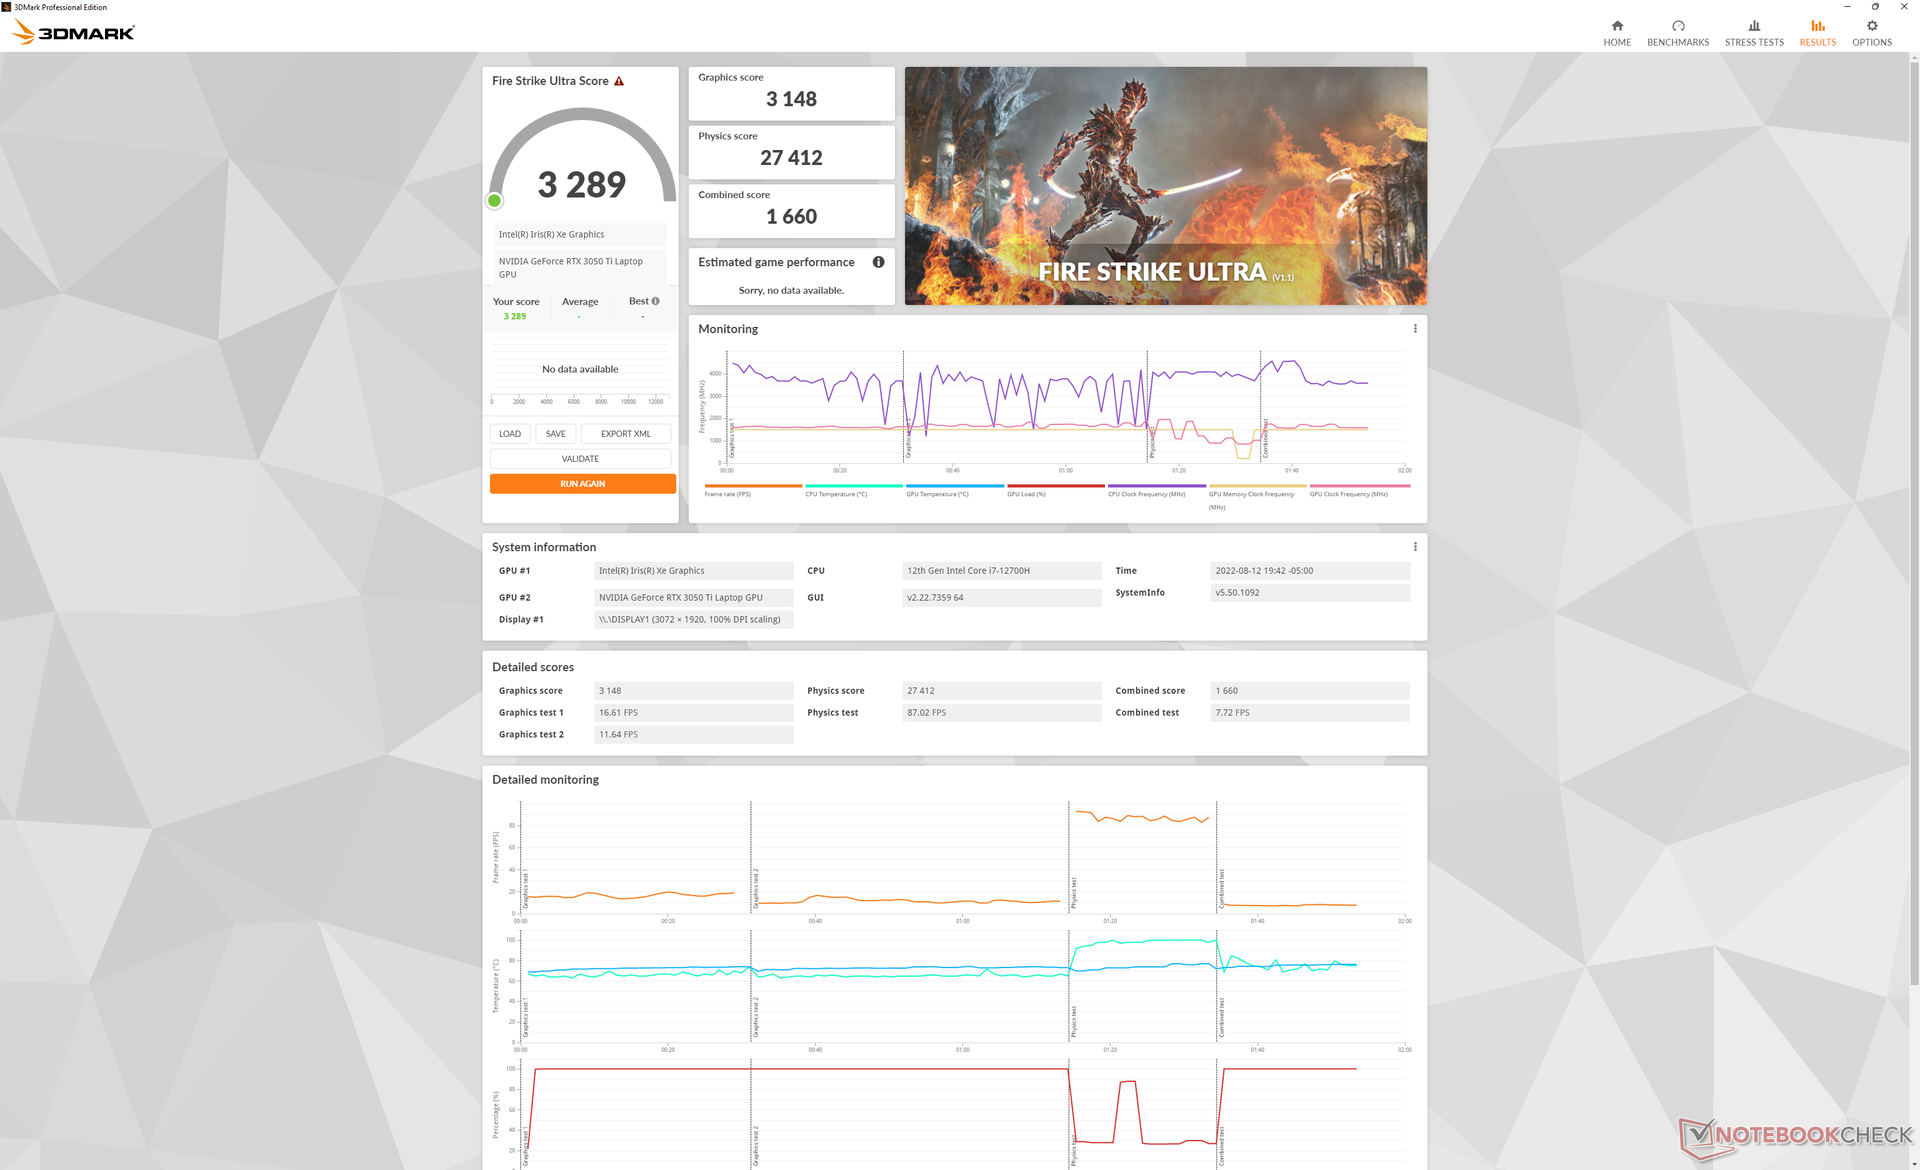
| 3DMark 11 Performance | 18923 pontos | |
| 3DMark Cloud Gate Standard Score | 40737 pontos | |
| 3DMark Fire Strike Score | 12647 pontos | |
| 3DMark Time Spy Score | 5835 pontos | |
Ajuda | ||
| Final Fantasy XV Benchmark | |
| 1280x720 Lite Quality | |
| MSI RTX 2060 Gaming Z 6G | |
| Dell Inspiron 16 Plus 7620 | |
| Dell Inspiron 16 Plus 7610 | |
| Média NVIDIA GeForce RTX 3050 Ti Laptop GPU (55.9 - 138.9, n=18) | |
| Asus Vivobook Pro 16X-M7600QE | |
| Acer Swift X SFX16-51G-5388 | |
| Huawei MateBook D 16 2022 | |
| Lenovo Yoga 7 16IAP7 | |
| 1920x1080 Standard Quality | |
| MSI RTX 2060 Gaming Z 6G | |
| Dell Inspiron 16 Plus 7620 | |
| Média NVIDIA GeForce RTX 3050 Ti Laptop GPU (33.4 - 106, n=24) | |
| Dell Inspiron 16 Plus 7610 | |
| Asus Vivobook Pro 16X-M7600QE | |
| Acer Swift X SFX16-51G-5388 | |
| Huawei MateBook D 16 2022 | |
| Lenovo Yoga 7 16IAP7 | |
| 1920x1080 High Quality | |
| MSI RTX 2060 Gaming Z 6G | |
| Dell Inspiron 16 Plus 7620 | |
| Média NVIDIA GeForce RTX 3050 Ti Laptop GPU (23.5 - 106, n=24) | |
| Dell Inspiron 16 Plus 7610 | |
| Asus Vivobook Pro 16X-M7600QE | |
| Acer Swift X SFX16-51G-5388 | |
| Huawei MateBook D 16 2022 | |
| Lenovo Yoga 7 16IAP7 | |
| 2560x1440 High Quality | |
| Dell Inspiron 16 Plus 7620 | |
| Dell Inspiron 16 Plus 7610 | |
| Média NVIDIA GeForce RTX 3050 Ti Laptop GPU (18.4 - 53.1, n=11) | |
| Asus Vivobook Pro 16X-M7600QE | |
| Cyberpunk 2077 1.6 | |
| 1920x1080 Low Preset | |
| Dell Inspiron 16 Plus 7620 | |
| Média NVIDIA GeForce RTX 3050 Ti Laptop GPU (48.2 - 81.9, n=9) | |
| Lenovo Yoga 7 16IAP7 | |
| 1920x1080 Medium Preset | |
| Dell Inspiron 16 Plus 7620 | |
| Média NVIDIA GeForce RTX 3050 Ti Laptop GPU (47.4 - 67.4, n=9) | |
| Lenovo Yoga 7 16IAP7 | |
| 1920x1080 High Preset | |
| Dell Inspiron 16 Plus 7620 | |
| Média NVIDIA GeForce RTX 3050 Ti Laptop GPU (39 - 51.5, n=9) | |
| Lenovo Yoga 7 16IAP7 | |
| 1920x1080 Ultra Preset | |
| Média NVIDIA GeForce RTX 3050 Ti Laptop GPU (31 - 50.5, n=9) | |
| Dell Inspiron 16 Plus 7620 | |
| Lenovo Yoga 7 16IAP7 | |
| 2560x1440 Ultra Preset | |
| Dell Inspiron 16 Plus 7620 | |
| Média NVIDIA GeForce RTX 3050 Ti Laptop GPU (20 - 25, n=4) | |
Witcher 3 FPS Chart
| baixo | média | alto | ultra | QHD | |
|---|---|---|---|---|---|
| GTA V (2015) | 181.7 | 176.1 | 148.7 | 75.4 | 53.4 |
| The Witcher 3 (2015) | 297.3 | 183 | 108.4 | 57 | |
| Dota 2 Reborn (2015) | 171.8 | 157.5 | 148 | 140.7 | |
| Final Fantasy XV Benchmark (2018) | 138.9 | 77.7 | 54.1 | 38.1 | |
| X-Plane 11.11 (2018) | 132.5 | 115.6 | 92.8 | ||
| Strange Brigade (2018) | 307 | 138.3 | 110.2 | 95.2 | 69.1 |
| Cyberpunk 2077 1.6 (2022) | 79.5 | 66.2 | 47.9 | 39.5 | 23.4 |
Emissões - Poderia ser mais silencioso
Ruído do sistema
O ruído dos ventiladores está sempre presente, pois ambos os ventiladores nunca estão realmente ociosos mesmo quando sentados na área de trabalho sem nenhuma aplicação em execução. Em seu nível mais silencioso, somos capazes de gravar um ruído de 25,7 dB(A) contra um fundo silencioso de 23,3 dB(A), mesmo quando ajustado para o perfil de potência "Silencioso". Além disso, demora um pouco para que o ruído do ventilador se acalme novamente depois de correr cargas altas como jogos. Após o fechamento Witcher 3por exemplo, os ventiladores permaneceriam barulhentos por vários minutos depois.
O ruído dos ventiladores se estabilizaria em 49,2 dB(A) quando em funcionamento Witcher 3 no modo Ultra Performance ou 46,1 dB(A) se no modo Balanceado for mais alto do que o Vivobook Pro 16X equipado com a mesma GPU RTX 3050 Ti. A alta faixa de 40 dB(A) tem mais em comum com os laptops de alta potência para jogos do que com outros laptops multimídia.
Barulho
| Ocioso |
| 25.7 / 26.1 / 30.6 dB |
| Carga |
| 46.2 / 49.4 dB |
 | ||
30 dB silencioso 40 dB(A) audível 50 dB(A) ruidosamente alto |
||
min: | ||
| Dell Inspiron 16 Plus 7620 GeForce RTX 3050 Ti Laptop GPU, i7-12700H, Kioxia BG5 KBG50ZNS512G | Dell Inspiron 16 Plus 7610 GeForce RTX 3050 4GB Laptop GPU, i7-11800H, Kingston OM3PDP3512B | Lenovo Yoga 7 16IAP7 Iris Xe G7 96EUs, i7-1260P, Micron 2450 512GB MTFDKCD512TFK | Huawei MateBook D 16 2022 Iris Xe G7 96EUs, i7-12700H, Silicon Motion PCIe-8 SSD | Acer Swift X SFX16-51G-5388 GeForce RTX 3050 4GB Laptop GPU, i5-11320H, Samsung PM991 MZVLQ512HBLU | Asus Vivobook Pro 16X-M7600QE GeForce RTX 3050 Ti Laptop GPU, R9 5900HX, SK Hynix HFM001TD3JX013N | |
|---|---|---|---|---|---|---|
| Noise | 3% | 14% | 8% | 3% | 1% | |
| desligado / ambiente * (dB) | 23.3 | 24.4 -5% | 23.6 -1% | 24.2 -4% | 25.4 -9% | 26 -12% |
| Idle Minimum * (dB) | 25.7 | 24.4 5% | 23.6 8% | 24.2 6% | 25.4 1% | 27 -5% |
| Idle Average * (dB) | 26.1 | 24.4 7% | 23.6 10% | 25.8 1% | 25.4 3% | 27 -3% |
| Idle Maximum * (dB) | 30.6 | 24.4 20% | 23.6 23% | 30.5 -0% | 27.8 9% | 27.5 10% |
| Load Average * (dB) | 46.2 | 48.3 -5% | 37.7 18% | 39.8 14% | 41 11% | 41.7 10% |
| Witcher 3 ultra * (dB) | 49.2 | 48.9 1% | 40 19% | 39.8 19% | ||
| Load Maximum * (dB) | 49.4 | 48.9 1% | 40.2 19% | 39.8 19% | 47 5% | 45.3 8% |
* ... menor é melhor
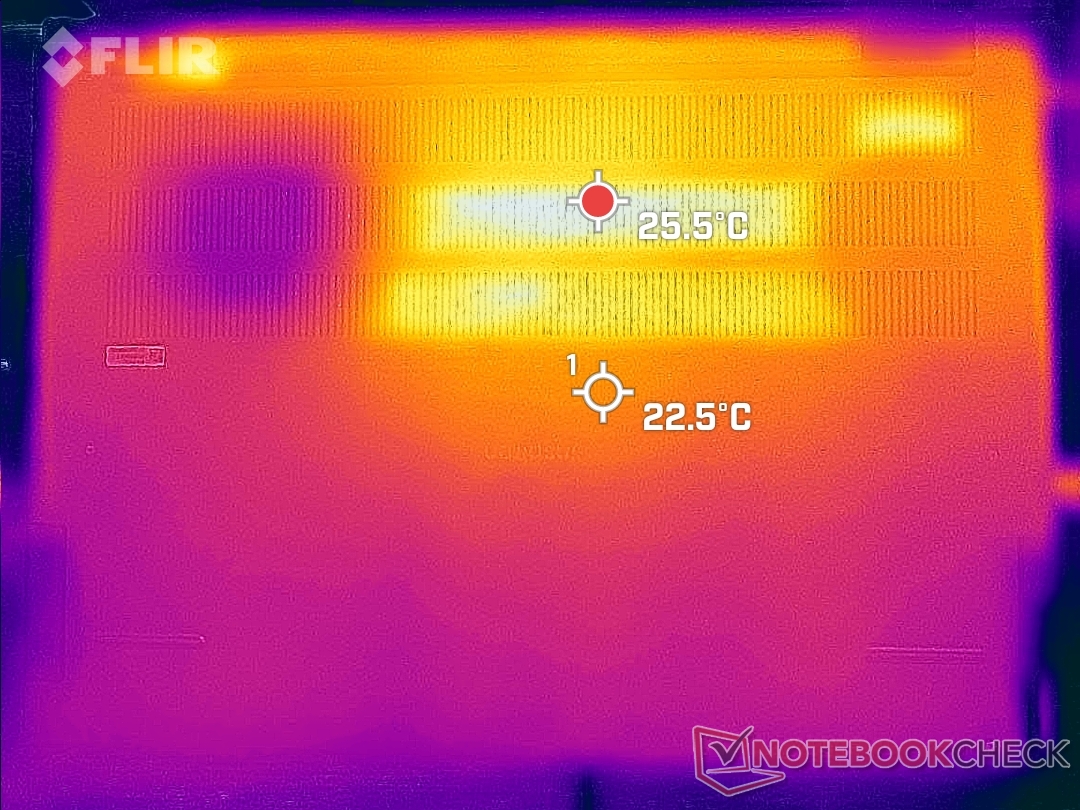
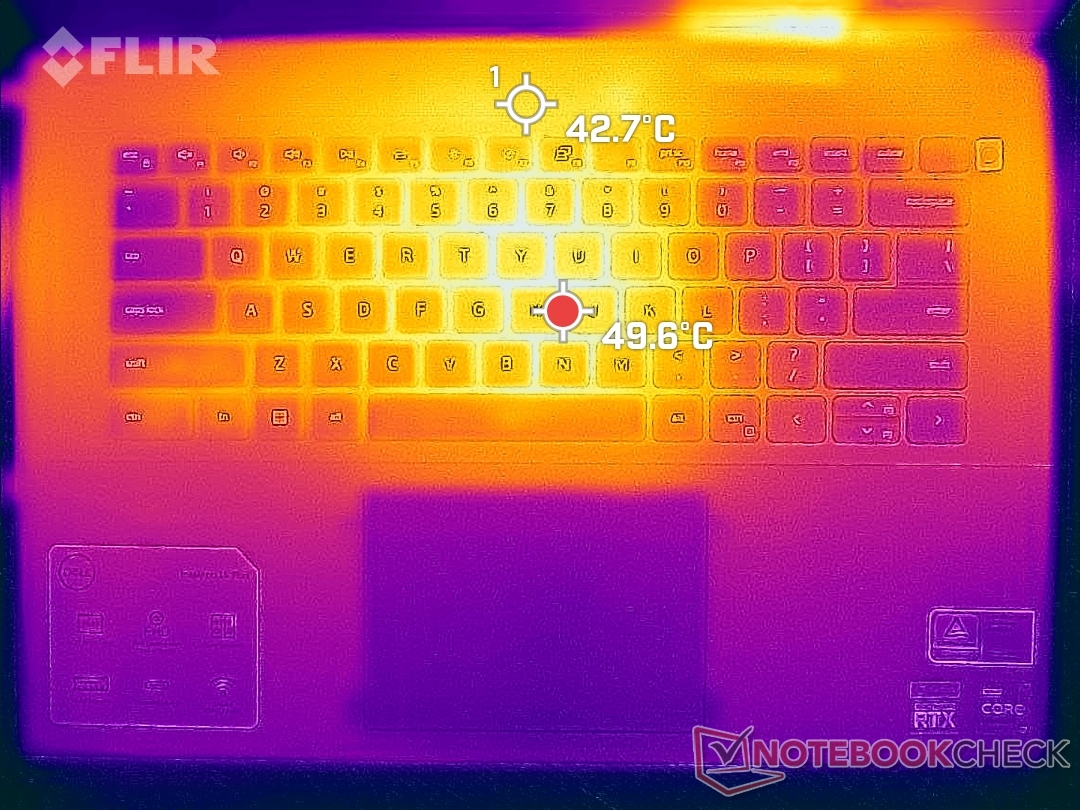
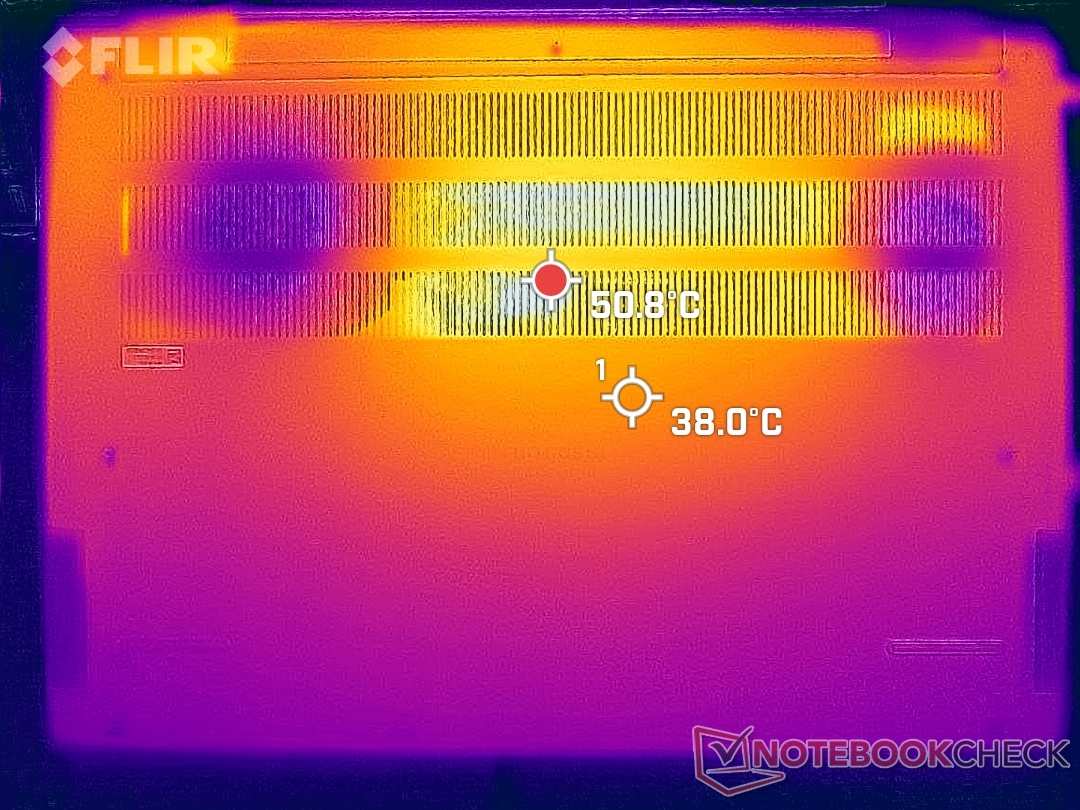
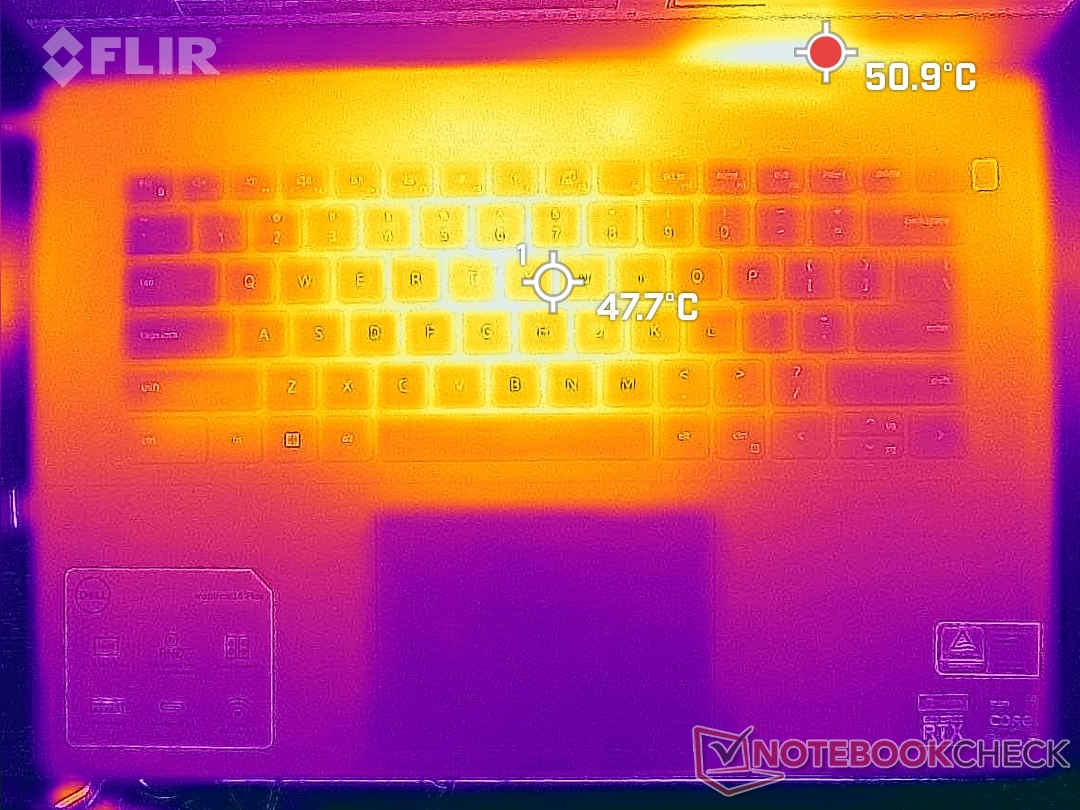
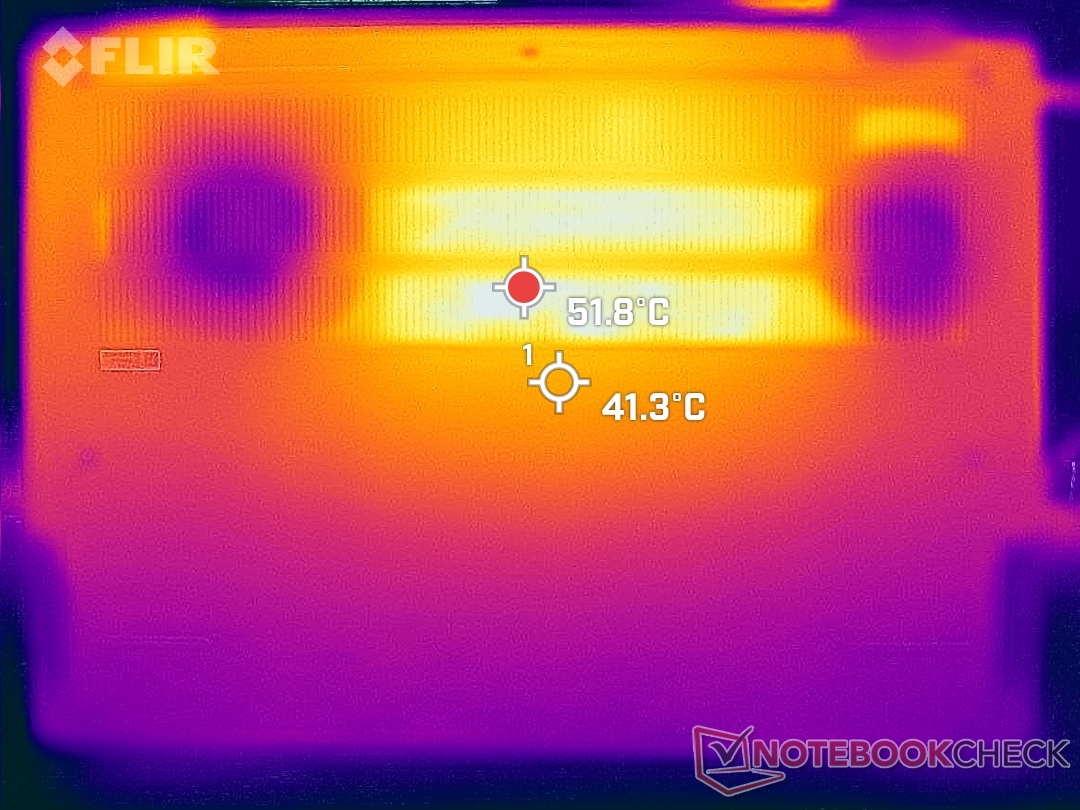
Temperatura
Os pontos quentes estão no centro do teclado, onde as temperaturas podem chegar a 50 C quando se corre com altas cargas como jogos. Outros laptops de 16 polegadas, como o Asus Vivobook Pro 16Xa Lenovo Yoga 7 e até mesmo a Inspiron 16 7610 mais antiga são mais frias em mais de alguns graus quando sob cargas similares. Os descansos da palma podem ser mais quentes do que o esperado também a 30 C, em comparação com a faixa mais comum em meados de 20 C. O Inspiron 16 Plus 7620 é certamente mais um laptop de mesa do que um laptop de colo.
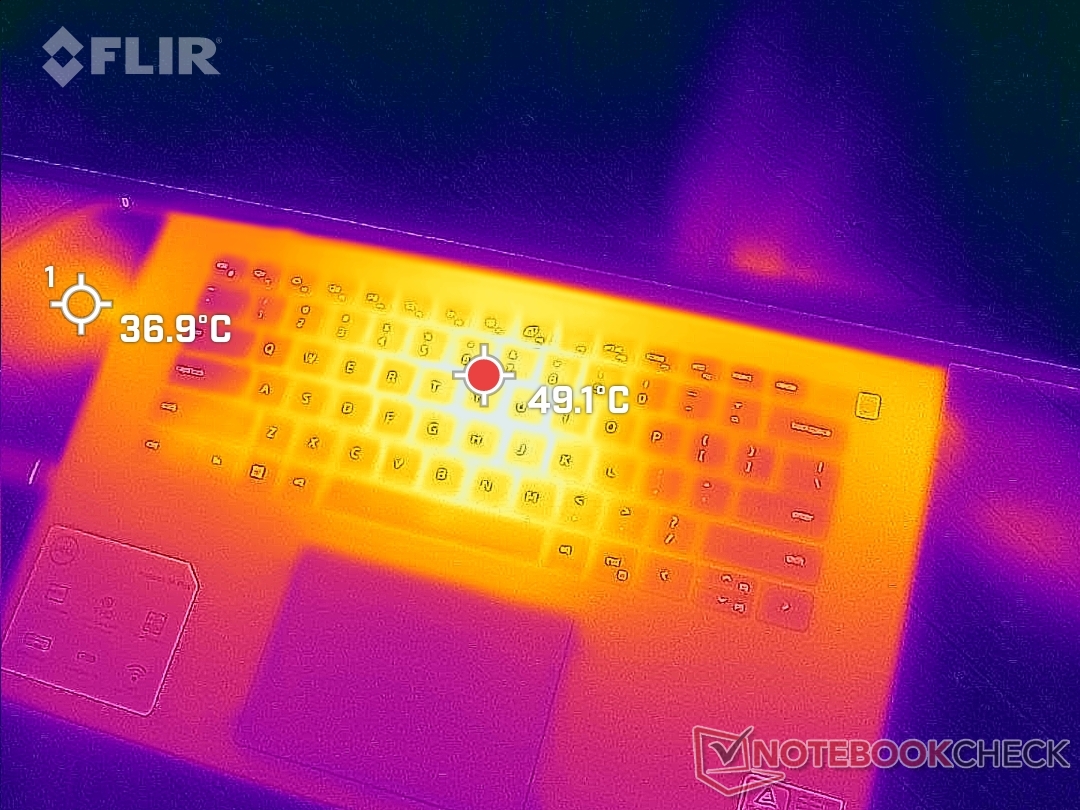
(-) A temperatura máxima no lado superior é 46 °C / 115 F, em comparação com a média de 36.8 °C / 98 F , variando de 21 a 71 °C para a classe Multimedia.
(-) A parte inferior aquece até um máximo de 45.8 °C / 114 F, em comparação com a média de 39.1 °C / 102 F
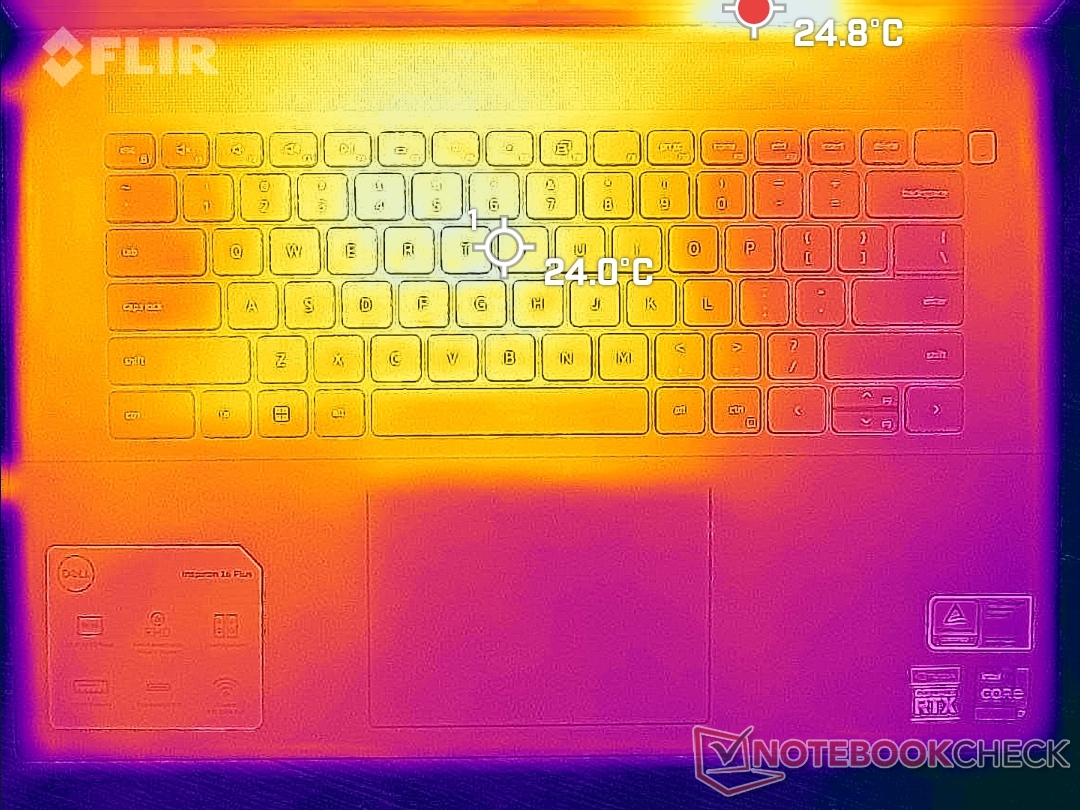
(+) Em uso inativo, a temperatura média para o lado superior é 26.8 °C / 80 F, em comparação com a média do dispositivo de 31.3 °C / ### class_avg_f### F.
(±) Jogando The Witcher 3, a temperatura média para o lado superior é 36.8 °C / 98 F, em comparação com a média do dispositivo de 31.3 °C / ## #class_avg_f### F.
(+) Os apoios para as mãos e o touchpad são mais frios que a temperatura da pele, com um máximo de 30.6 °C / 87.1 F e, portanto, são frios ao toque.
(±) A temperatura média da área do apoio para as mãos de dispositivos semelhantes foi 28.7 °C / 83.7 F (-1.9 °C / -3.4 F).
| Dell Inspiron 16 Plus 7620 Intel Core i7-12700H, NVIDIA GeForce RTX 3050 Ti Laptop GPU | Dell Inspiron 16 Plus 7610 Intel Core i7-11800H, NVIDIA GeForce RTX 3050 4GB Laptop GPU | Lenovo Yoga 7 16IAP7 Intel Core i7-1260P, Intel Iris Xe Graphics G7 96EUs | Huawei MateBook D 16 2022 Intel Core i7-12700H, Intel Iris Xe Graphics G7 96EUs | Acer Swift X SFX16-51G-5388 Intel Core i5-11320H, NVIDIA GeForce RTX 3050 4GB Laptop GPU | Asus Vivobook Pro 16X-M7600QE AMD Ryzen 9 5900HX, NVIDIA GeForce RTX 3050 Ti Laptop GPU | |
|---|---|---|---|---|---|---|
| Heat | -12% | 24% | 3% | -6% | 9% | |
| Maximum Upper Side * (°C) | 46 | 46.4 -1% | 39 15% | 41.8 9% | 52.4 -14% | 39.4 14% |
| Maximum Bottom * (°C) | 45.8 | 54.8 -20% | 34.2 25% | 47.3 -3% | 50 -9% | 43.6 5% |
| Idle Upper Side * (°C) | 29.2 | 31.4 -8% | 21.2 27% | 28.3 3% | 30.3 -4% | 27.6 5% |
| Idle Bottom * (°C) | 31 | 36.6 -18% | 21.6 30% | 30.2 3% | 30.4 2% | 27.5 11% |
* ... menor é melhor
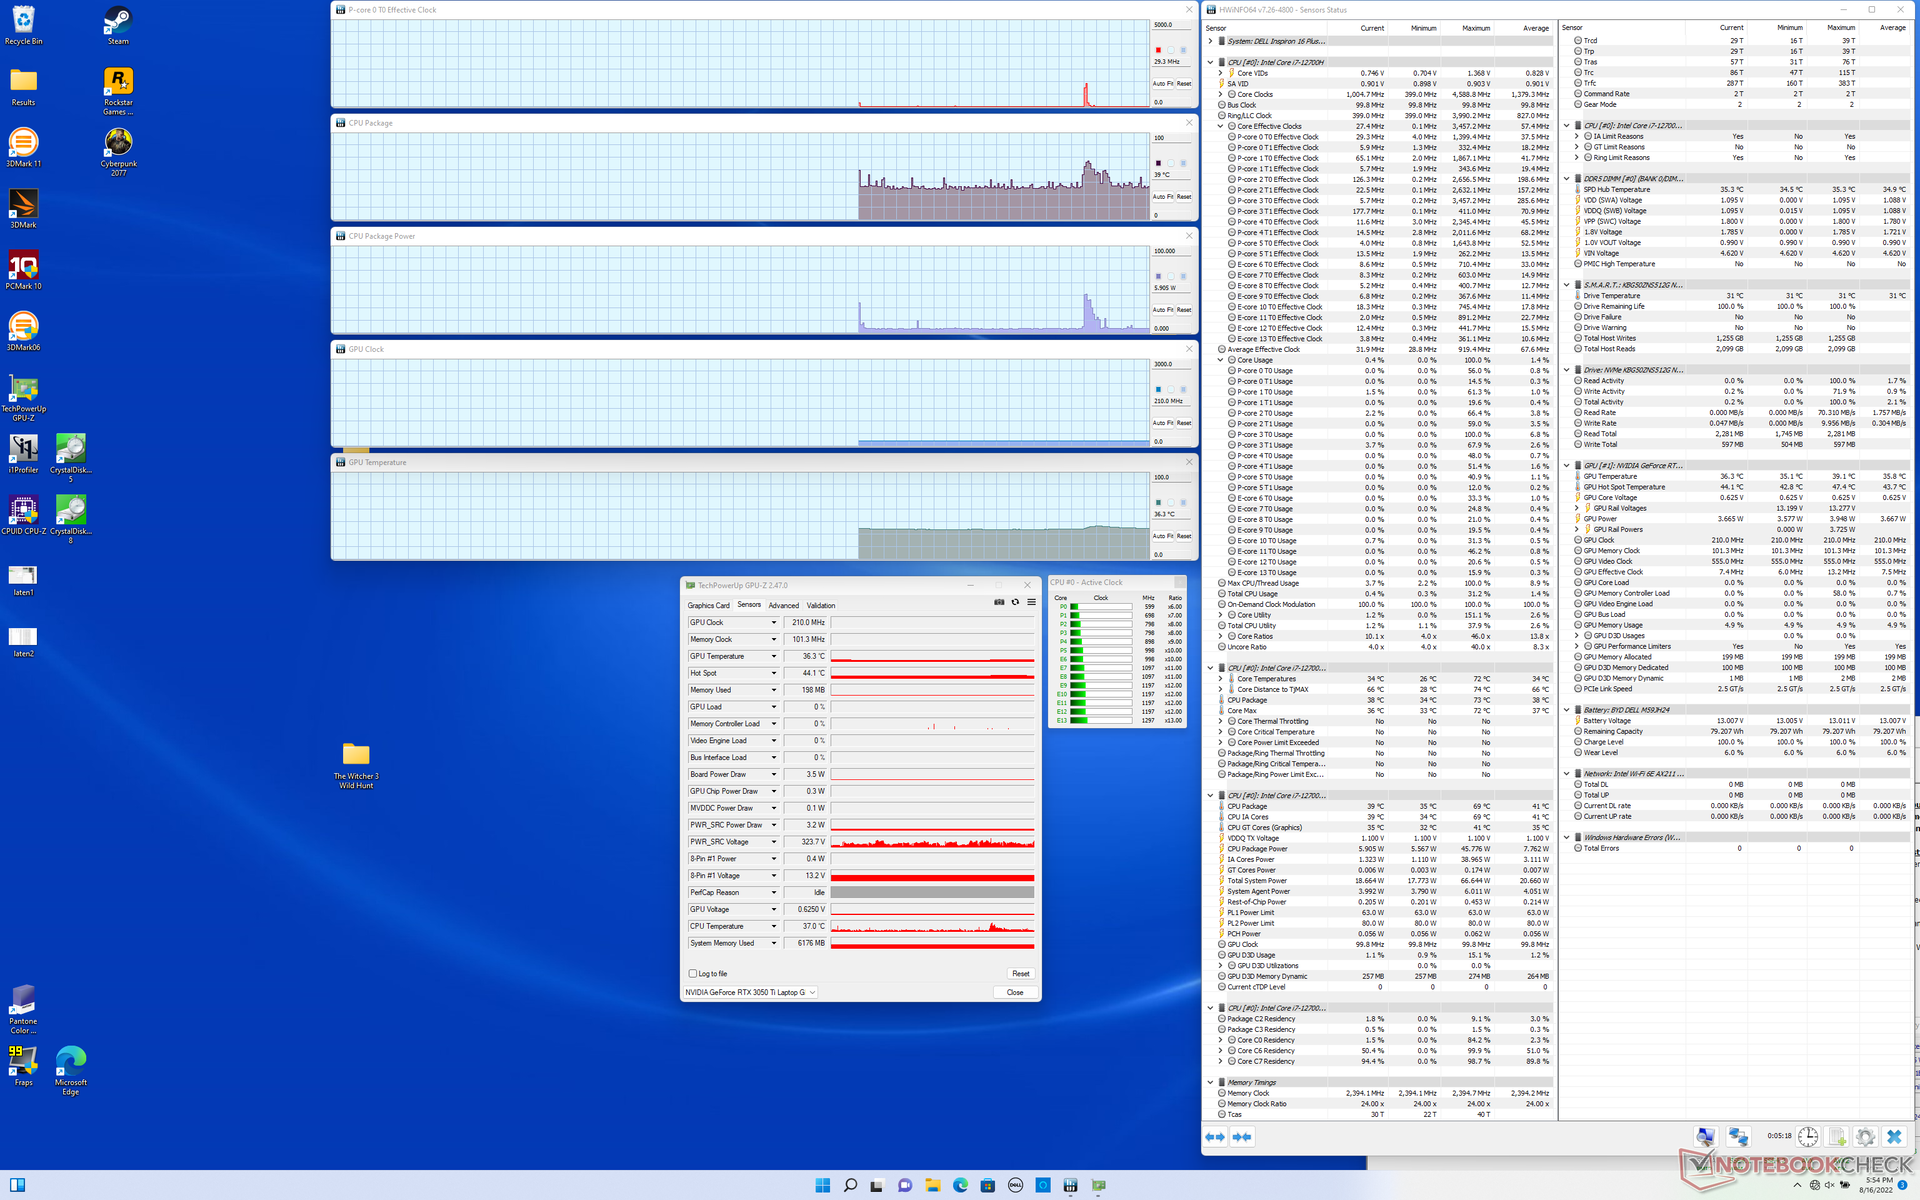
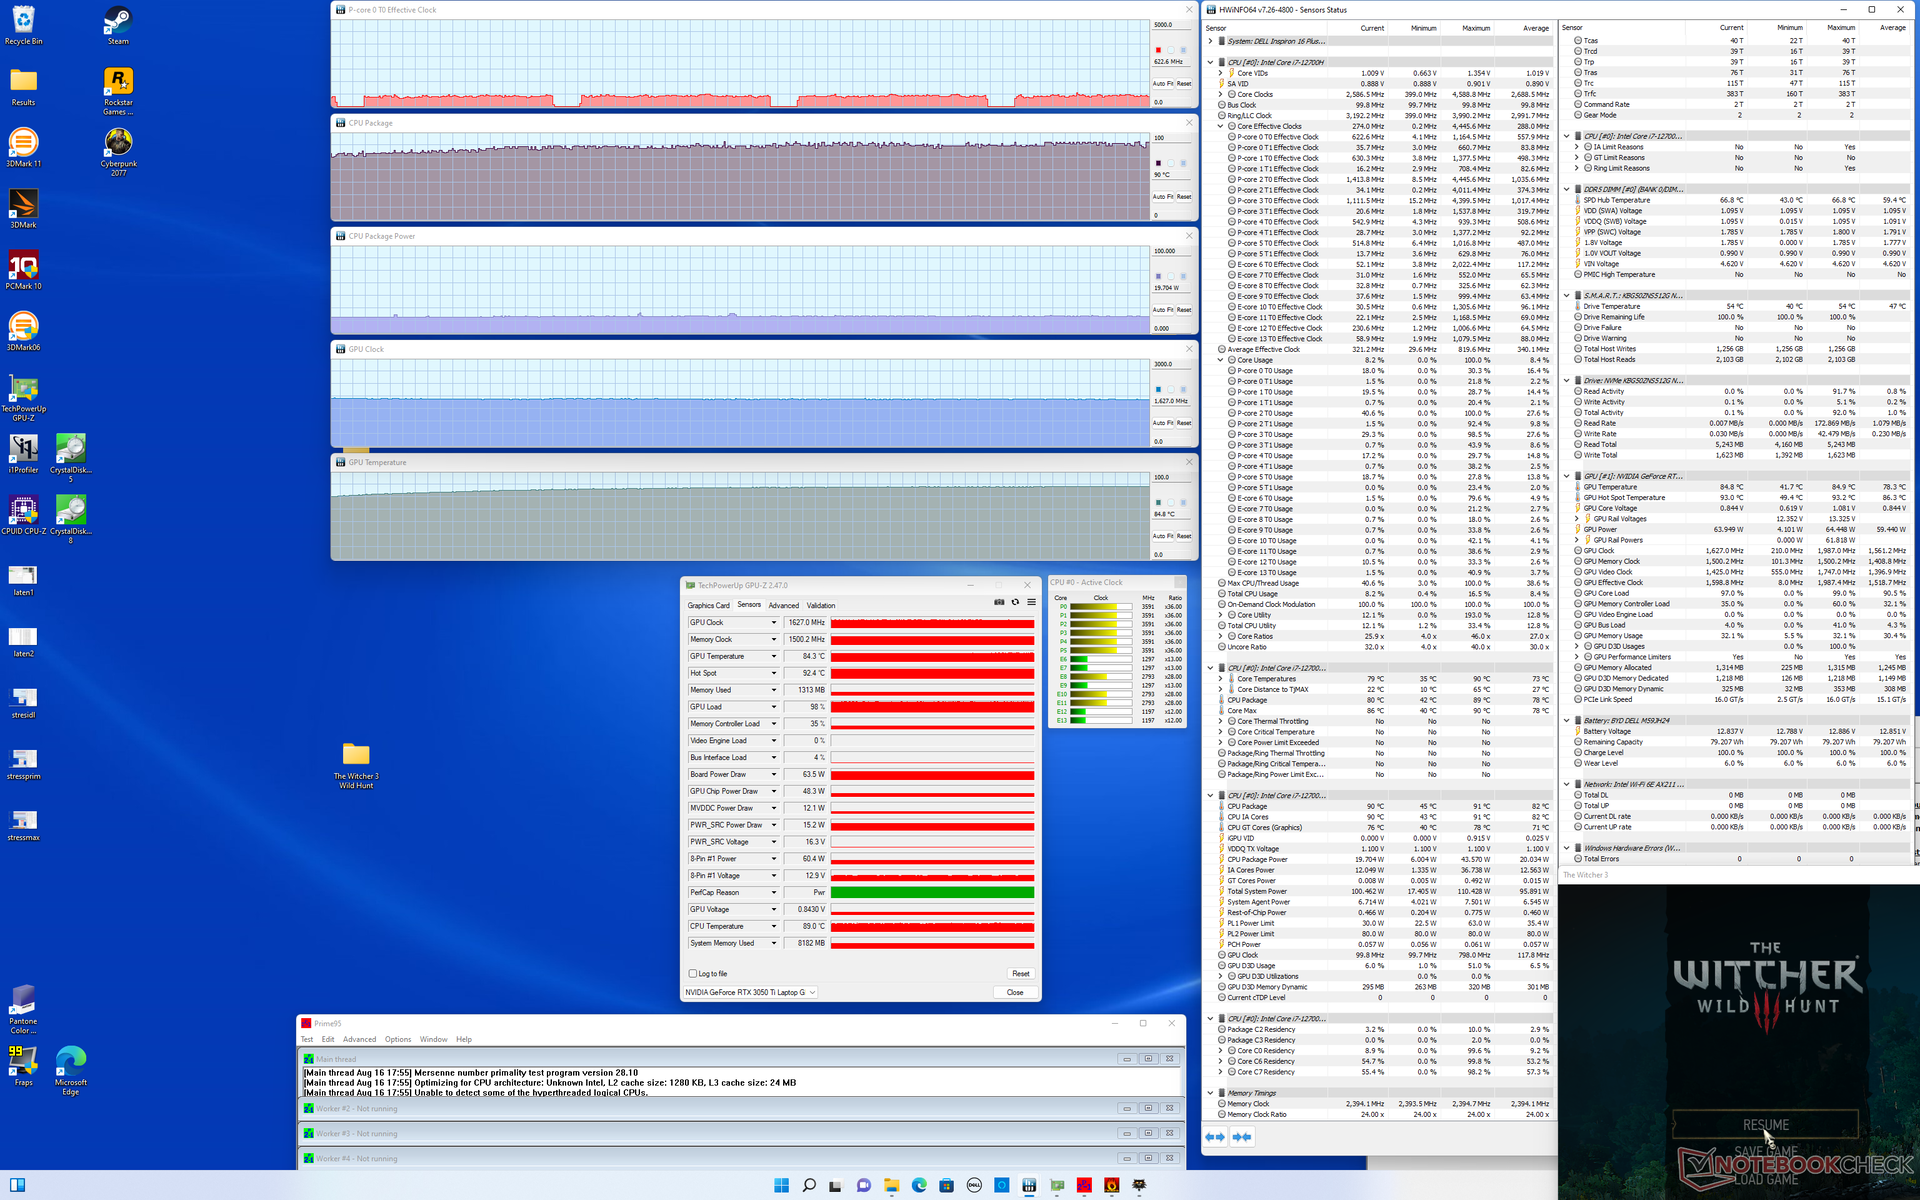
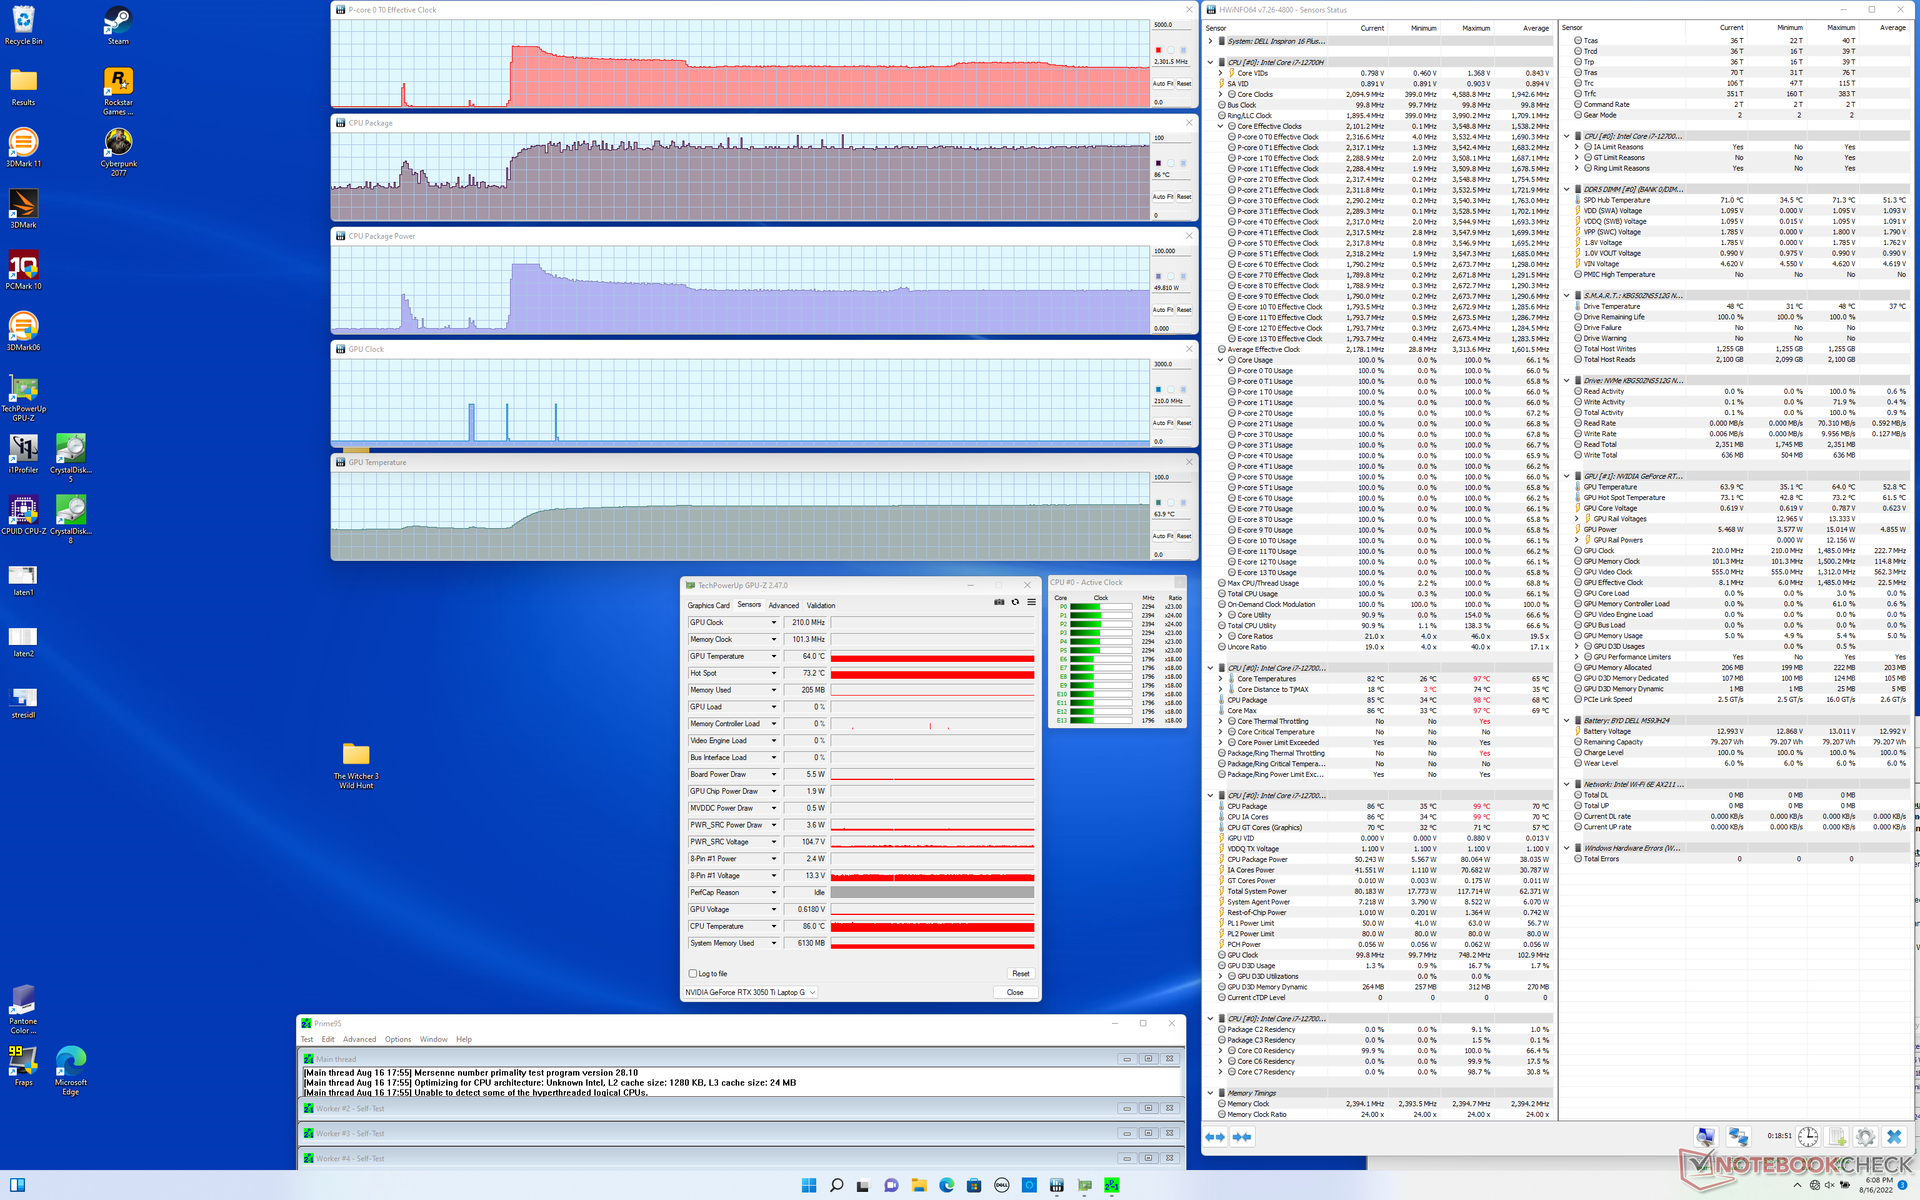
Teste de estresse
Ao executar Prime95 stress, a CPU alcançaria 3,5 GHz e 80 W durante os primeiros 15 segundos, aproximadamente, até a temperatura central atingir 90 C. Depois disso, as taxas de clock e o consumo de energia da placa cairiam gradualmente antes de estabilizarem em 2,3 GHz e 50 W, respectivamente, a fim de manter uma temperatura central de 86 C. A execução deste mesmo teste no modelo 2021 resultaria em temperaturas centrais ligeiramente mais baixas e um consumo de energia da placa de 83 C e 45 W, respectivamente.
A taxa de clock GPU, temperatura e consumo de energia da placa estabilizariam em 1627 MHz, 85 C e 64 W, respectivamente, quando em funcionamento Witcher 3 em comparação com 1837 MHz, 69 C, e 63 W no Inspiron 16 Plus 7610. Não há dúvida de que os processadores do modelo 2022 estão funcionando mais quentes para proporcionar níveis de desempenho mais altos.
A execução deste mesmo teste no modelo 2021 resultaria em temperaturas de núcleo ligeiramente mais baixas e um consumo de energia da placa de 83 C e 45 W, respectivamente. Um teste 3DMark 11 com baterias retornaria pontuações de Física e Gráficos de 10252 e 8609 pontos, respectivamente, em comparação com 22210 e 18923 pontos quando em rede elétrica.
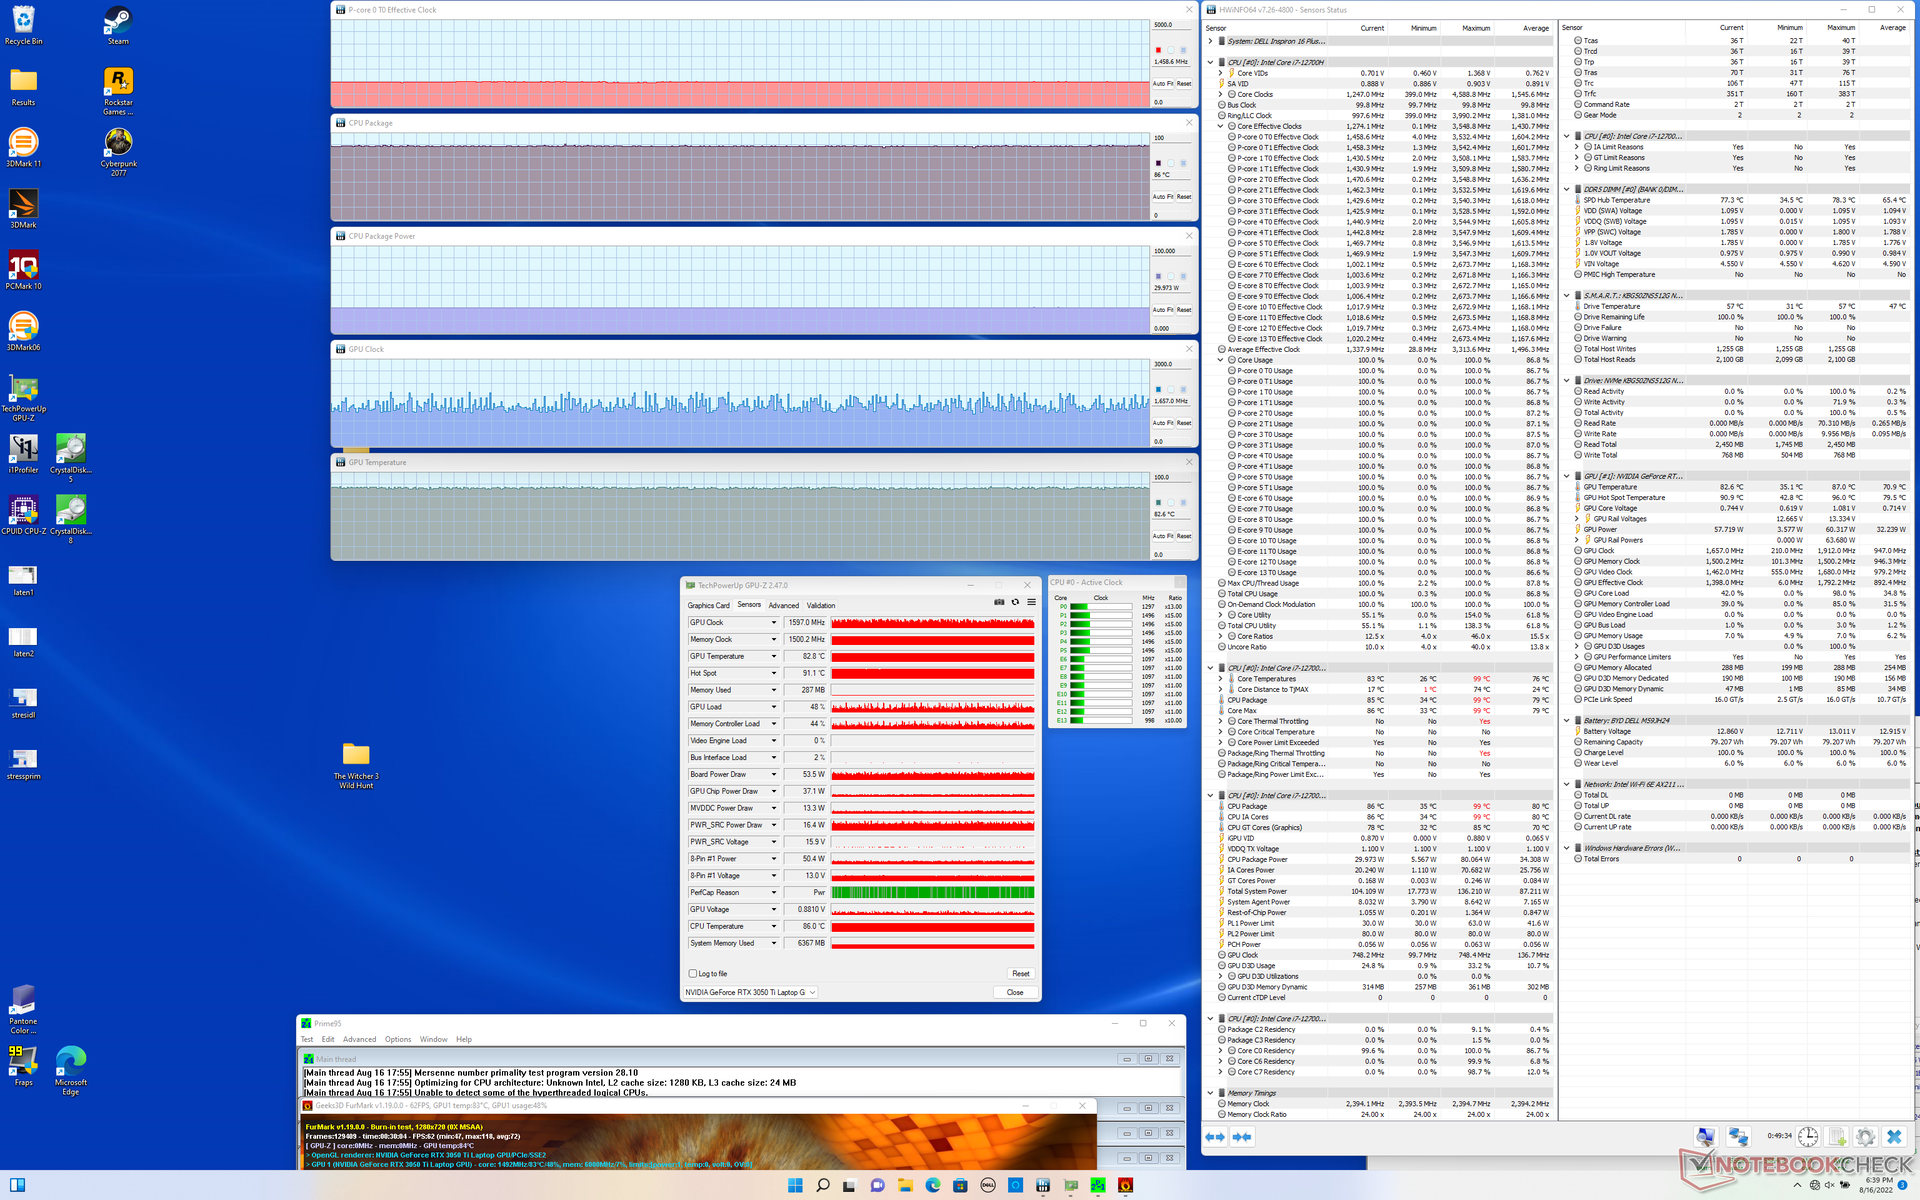
| Relógio CPU (GHz) | Relógio GPU (MHz) | Temperatura média da CPU (°C) | Temperatura média da GPU (°C) | |
| System Idle | -- | -- | 39 | 36 |
| Prime95 Stress | 2.3 | -- | 86 | 64 |
| Prime95 + FurMark Stress | 1.5 | ~1597 | 86 | 83 |
| Witcher 3 Estresse | ~0.6 | 1627 | 90 | 85 |
Oradores
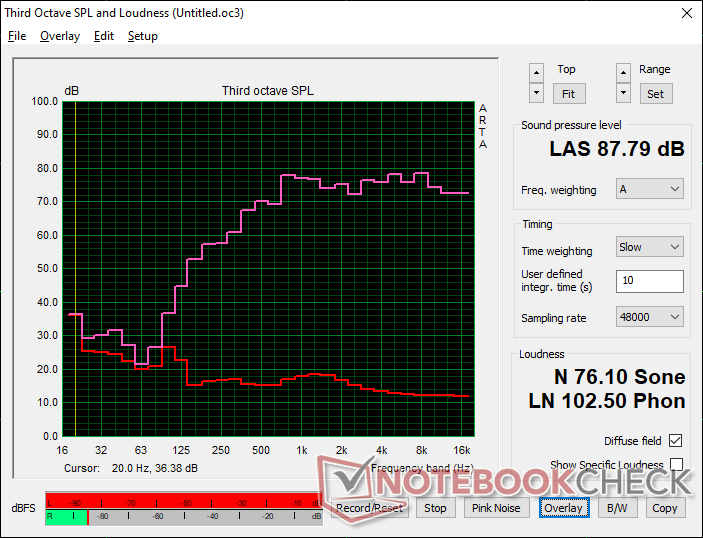
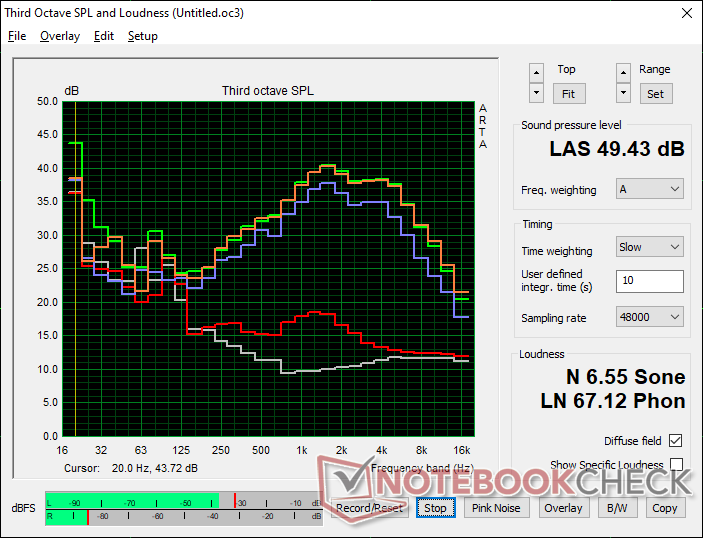
Dell Inspiron 16 Plus 7620 análise de áudio
(+) | os alto-falantes podem tocar relativamente alto (###valor### dB)
Graves 100 - 315Hz
(-) | quase nenhum baixo - em média 22.2% menor que a mediana
(±) | a linearidade dos graves é média (9.7% delta para a frequência anterior)
Médios 400 - 2.000 Hz
(+) | médios equilibrados - apenas 3.3% longe da mediana
(+) | médios são lineares (5.3% delta para frequência anterior)
Altos 2 - 16 kHz
(+) | agudos equilibrados - apenas 2.5% longe da mediana
(+) | os máximos são lineares (4.7% delta da frequência anterior)
Geral 100 - 16.000 Hz
(+) | o som geral é linear (13.4% diferença em relação à mediana)
Comparado com a mesma classe
» 28% de todos os dispositivos testados nesta classe foram melhores, 5% semelhantes, 68% piores
» O melhor teve um delta de 5%, a média foi 17%, o pior foi 45%
Comparado com todos os dispositivos testados
» 14% de todos os dispositivos testados foram melhores, 4% semelhantes, 82% piores
» O melhor teve um delta de 4%, a média foi 23%, o pior foi 134%
Apple MacBook Pro 16 2021 M1 Pro análise de áudio
(+) | os alto-falantes podem tocar relativamente alto (###valor### dB)
Graves 100 - 315Hz
(+) | bons graves - apenas 3.8% longe da mediana
(+) | o baixo é linear (5.2% delta para a frequência anterior)
Médios 400 - 2.000 Hz
(+) | médios equilibrados - apenas 1.3% longe da mediana
(+) | médios são lineares (2.1% delta para frequência anterior)
Altos 2 - 16 kHz
(+) | agudos equilibrados - apenas 1.9% longe da mediana
(+) | os máximos são lineares (2.7% delta da frequência anterior)
Geral 100 - 16.000 Hz
(+) | o som geral é linear (4.6% diferença em relação à mediana)
Comparado com a mesma classe
» 0% de todos os dispositivos testados nesta classe foram melhores, 0% semelhantes, 100% piores
» O melhor teve um delta de 5%, a média foi 17%, o pior foi 45%
Comparado com todos os dispositivos testados
» 0% de todos os dispositivos testados foram melhores, 0% semelhantes, 100% piores
» O melhor teve um delta de 4%, a média foi 23%, o pior foi 134%
Gerenciamento de energia - CPU com fome de energia
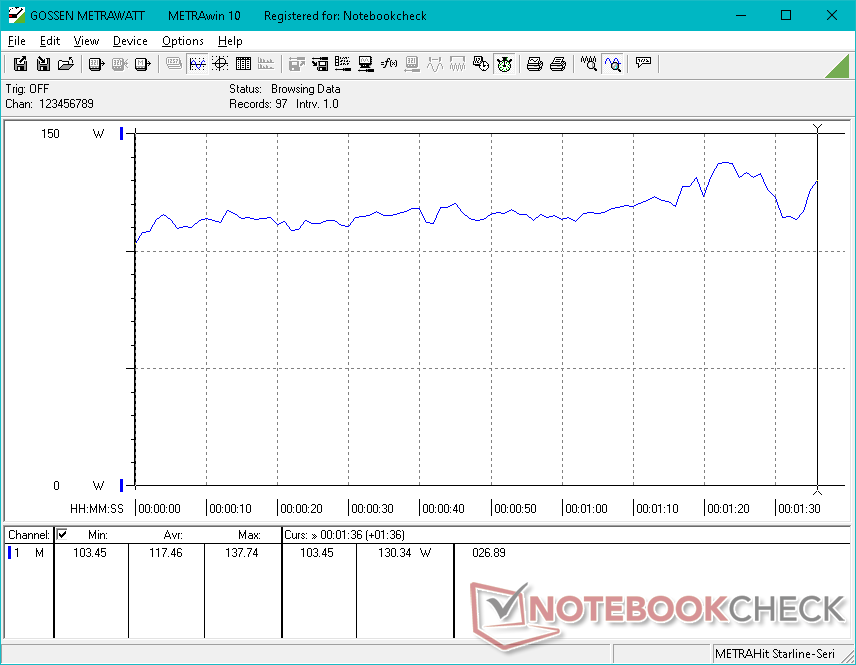
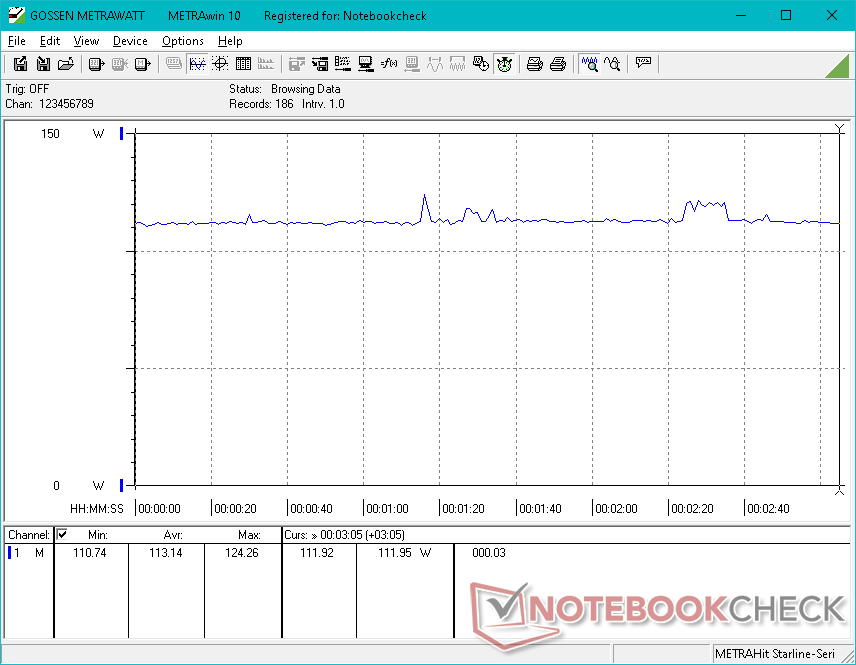
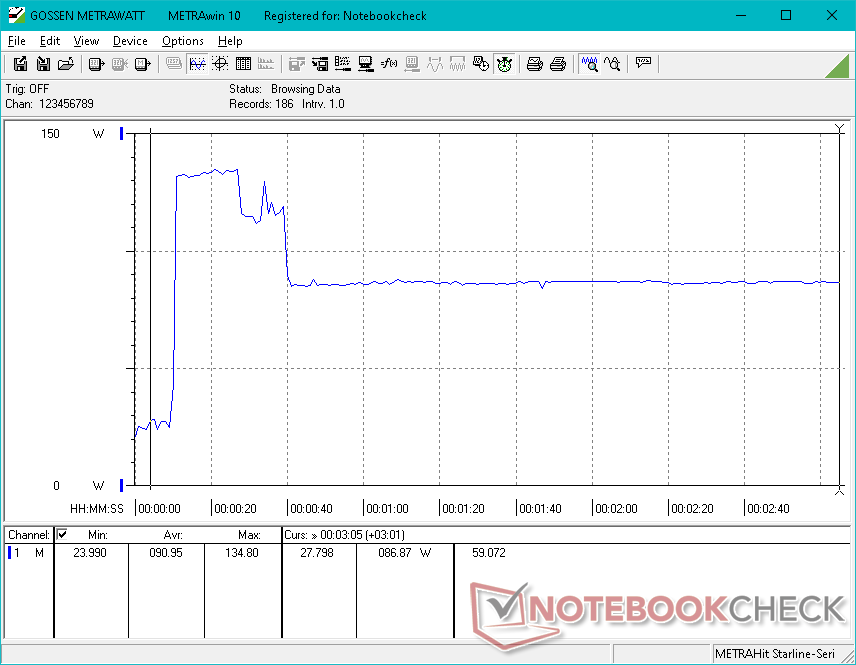
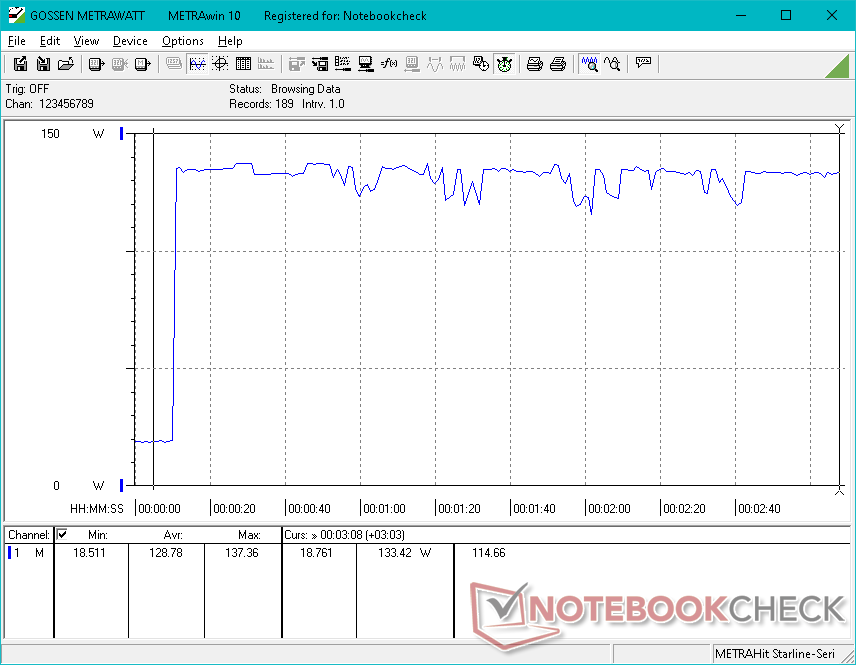
Consumo de energia
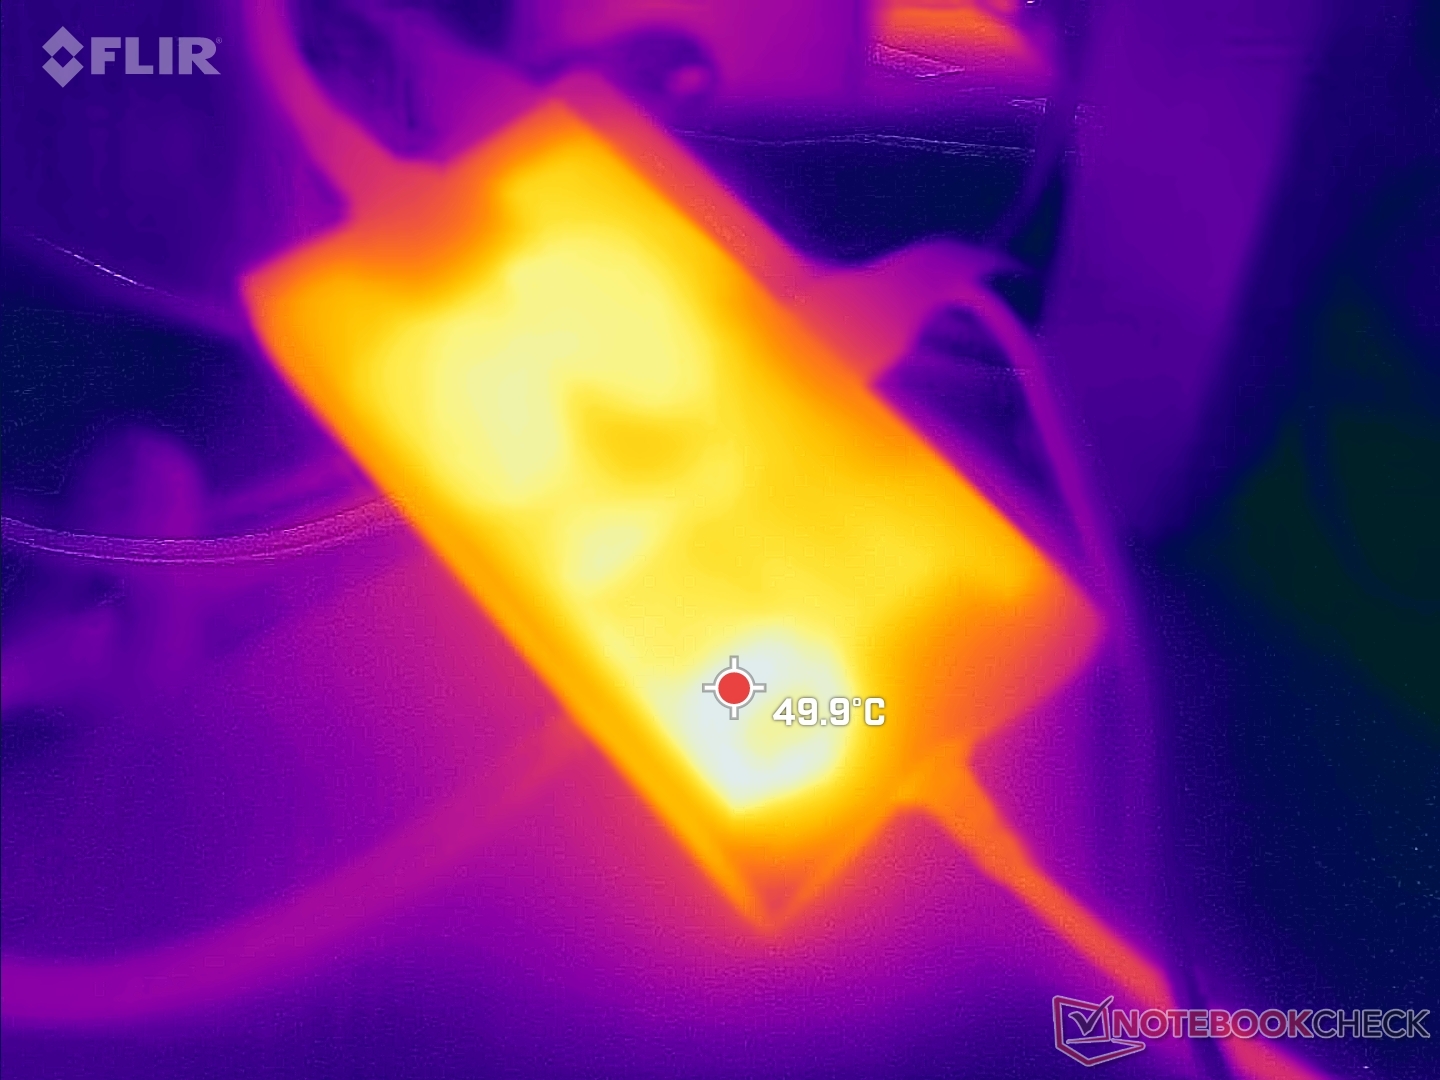
O consumo de energia é semelhante ao modelo 2021 quando ocioso na área de trabalho ou quando ocioso é executado com cargas muito baixas. Ao executar cargas mais altas, no entanto, o modelo 2022 torna-se mais exigente, especialmente se tais cargas forem de CPU intensiva. Rodando Witcher 3por exemplo, o Prime95 atrairia apenas 5% a mais de potência, enquanto o Prime95 atrairia 72% a mais. O consumo significativamente maior está em linha com a maioria dos outros laptops que testamos até agora alimentados por CPUs do 12º gênero Alder Lake
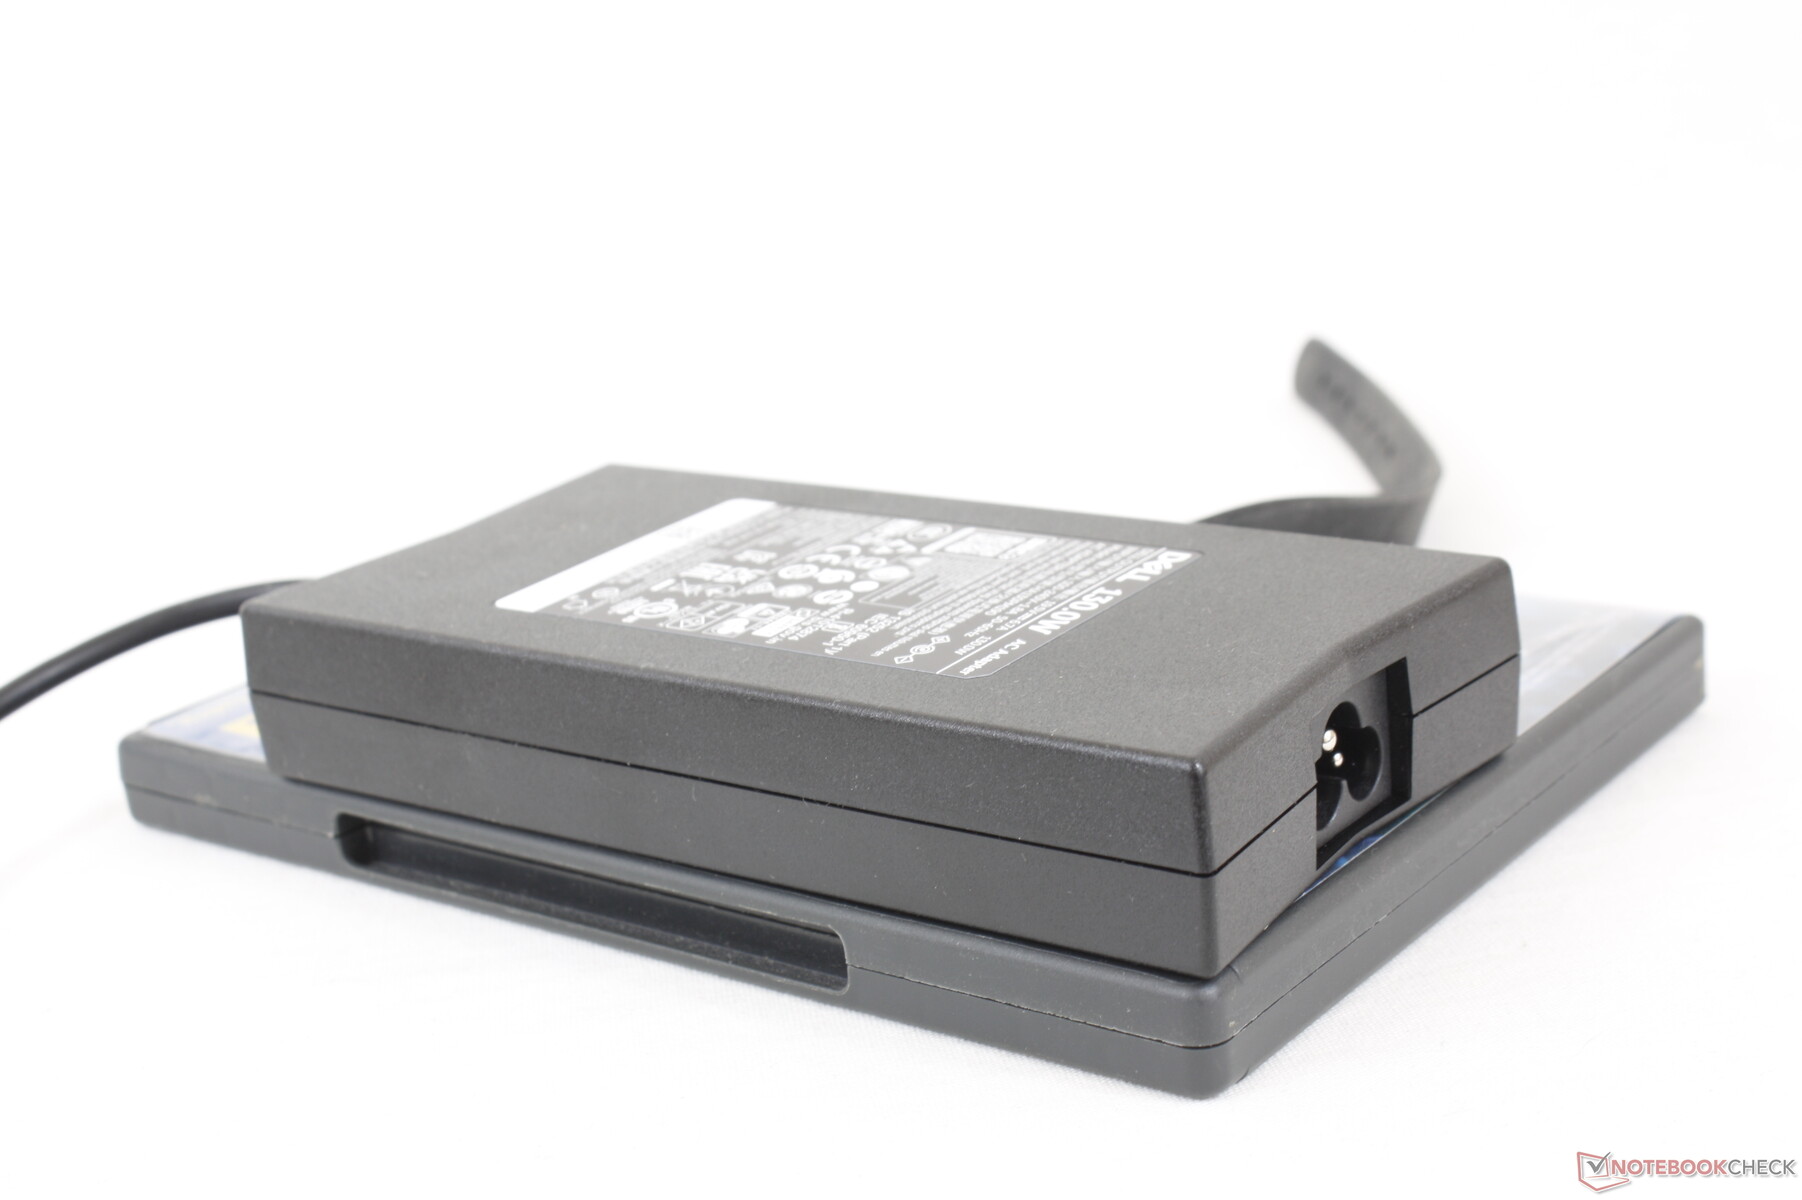
Somos capazes de registrar um consumo máximo de 137 W a partir do adaptador AC de 130 W (~15,3 x 7,5 x 2,6 cm) de tamanho médio. A Dell não fez nenhuma alteração no adaptador AC ou em sua capacidade nominal, apesar da CPU mais ávida de energia.
| desligado | |
| Ocioso | |
| Carga |
|
Key:
min: | |
| Dell Inspiron 16 Plus 7620 i7-12700H, GeForce RTX 3050 Ti Laptop GPU, Kioxia BG5 KBG50ZNS512G, IPS, 3072x1920, 16" | Dell Inspiron 16 Plus 7610 i7-11800H, GeForce RTX 3050 4GB Laptop GPU, Kingston OM3PDP3512B, IPS, 3072x1920, 16" | Lenovo Yoga 7 16IAP7 i7-1260P, Iris Xe G7 96EUs, Micron 2450 512GB MTFDKCD512TFK, IPS, 2560x1600, 16" | Huawei MateBook D 16 2022 i7-12700H, Iris Xe G7 96EUs, Silicon Motion PCIe-8 SSD, IPS, 1920x1200, 16" | Acer Swift X SFX16-51G-5388 i5-11320H, GeForce RTX 3050 4GB Laptop GPU, Samsung PM991 MZVLQ512HBLU, , 1920x1080, 16.1" | Asus Vivobook Pro 16X-M7600QE R9 5900HX, GeForce RTX 3050 Ti Laptop GPU, SK Hynix HFM001TD3JX013N, OLED, 3840x2400, 16.1" | |
|---|---|---|---|---|---|---|
| Power Consumption | 1% | 35% | 29% | 21% | 1% | |
| Idle Minimum * (Watt) | 6.8 | 7.7 -13% | 6.6 3% | 6.1 10% | 7 -3% | 8.2 -21% |
| Idle Average * (Watt) | 9.6 | 10.7 -11% | 8.3 14% | 10.6 -10% | 10.1 -5% | 16.2 -69% |
| Idle Maximum * (Watt) | 17 | 16.8 1% | 9.8 42% | 11.5 32% | 15 12% | 19.7 -16% |
| Load Average * (Watt) | 117.5 | 100.39 15% | 66 44% | 65.5 44% | 63.3 46% | 65.8 44% |
| Witcher 3 ultra * (Watt) | 113.1 | 108 5% | 52 54% | 61.2 46% | 63.3 44% | 65.6 42% |
| Load Maximum * (Watt) | 137.4 | 129 6% | 67.1 51% | 68.4 50% | 94 32% | 104 24% |
* ... menor é melhor
Power Consumption Witcher 3 / Stresstest
Power Consumption external Monitor
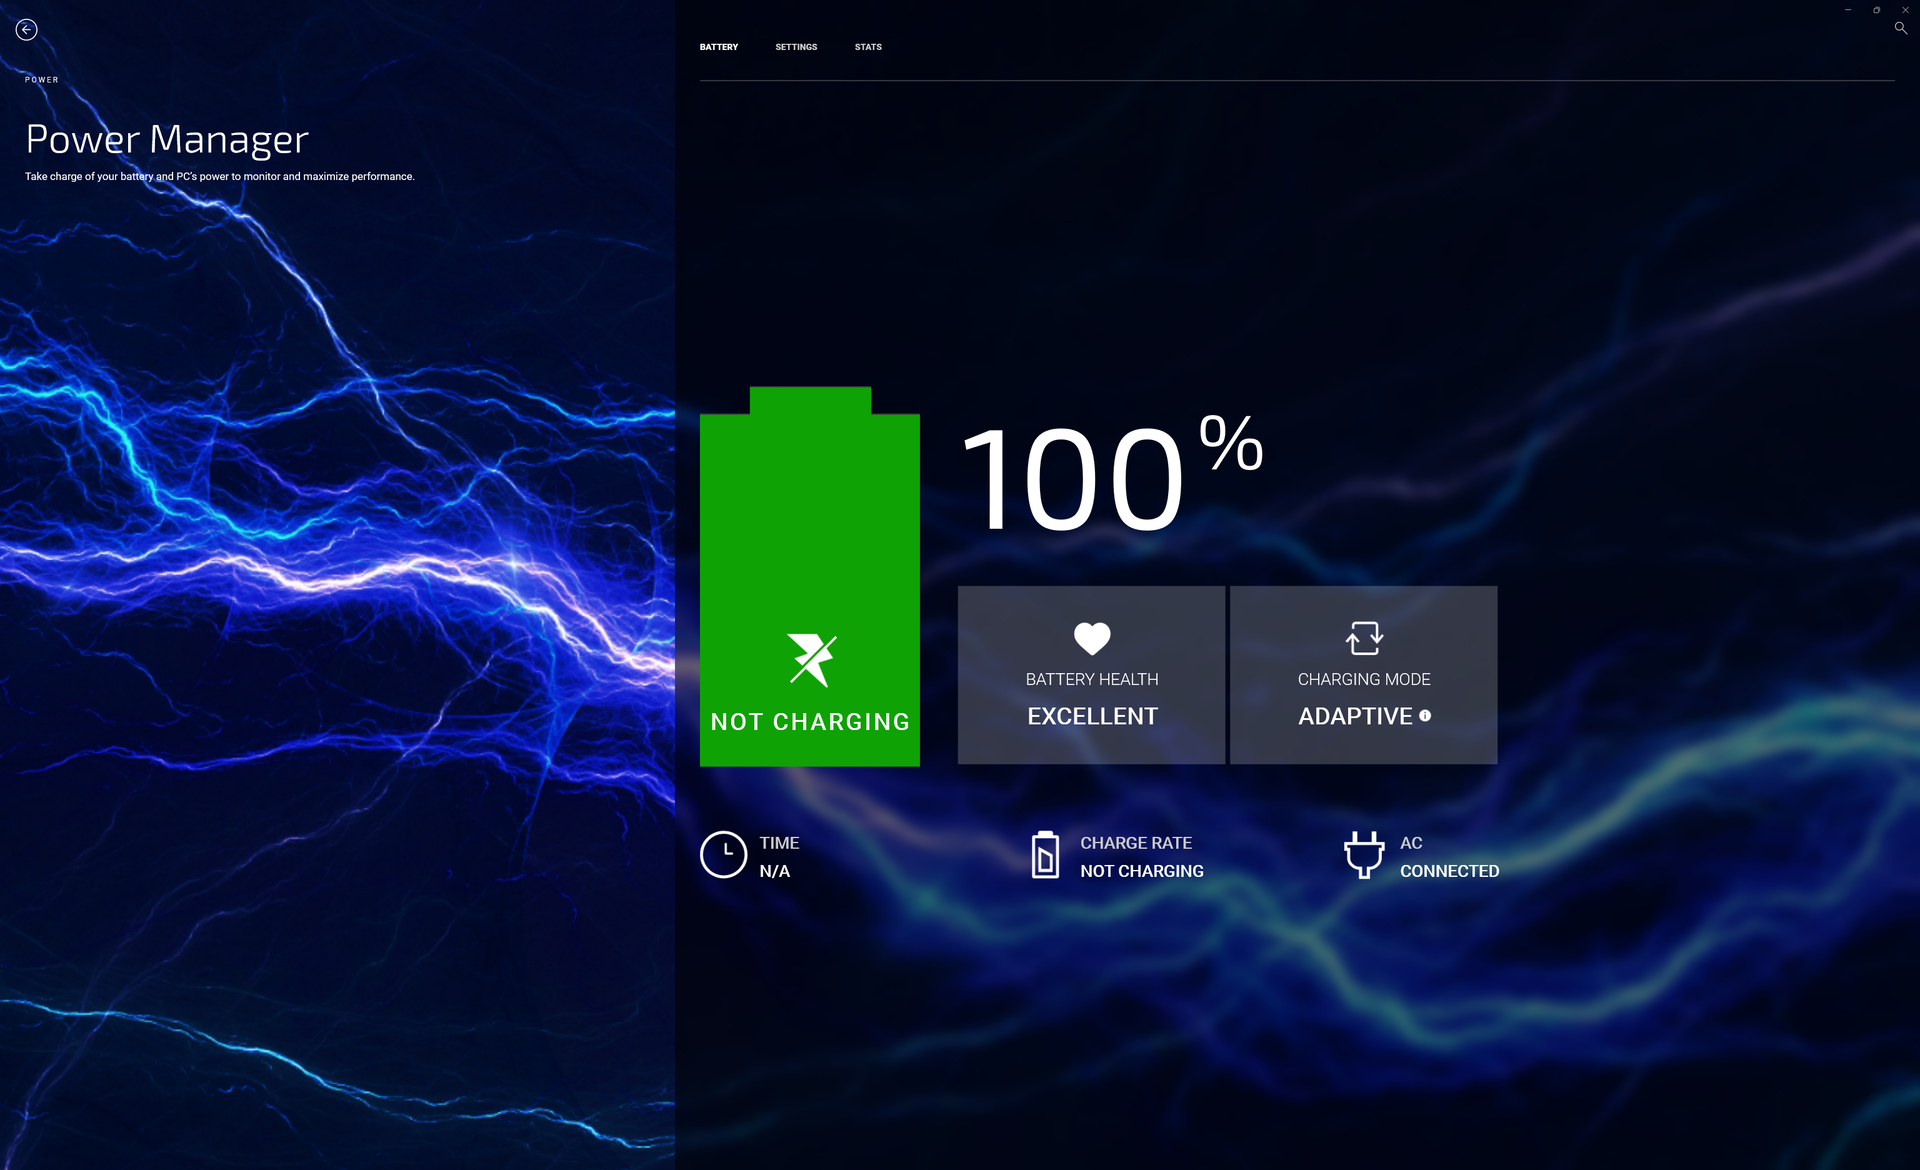
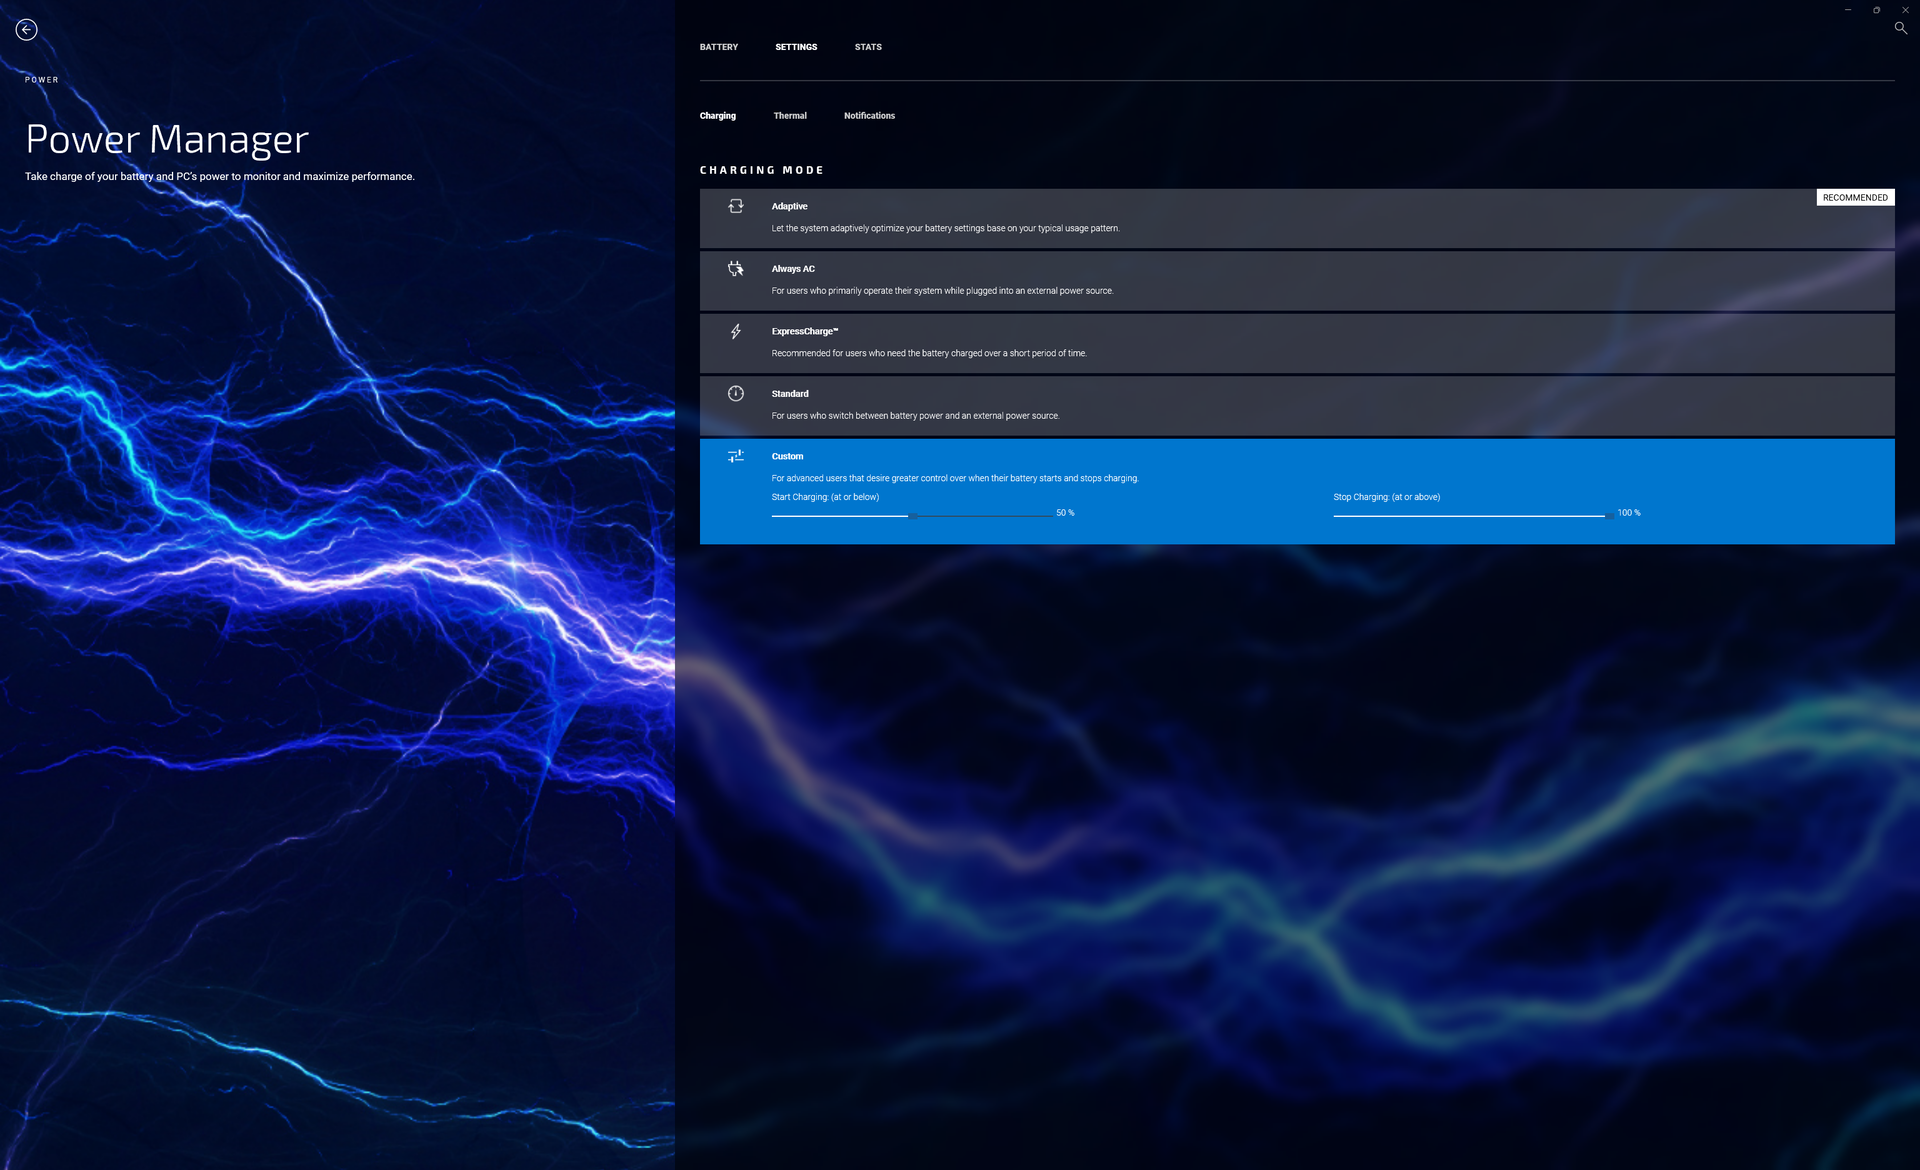
Vida útil da bateria
A capacidade da bateria não mudou em relação ao modelo do ano passado para tempos de execução similares entre eles. Os usuários podem esperar 9,5 horas de uso da WLAN no mundo real no perfil de potência balanceada. Uma opção de bateria menor de 56 Wh está disponível em alguns SKUs para um peso total mais leve.
O carregamento do vazio ao cheio leva cerca de 2 horas com o adaptador AC de barril incluído. O sistema também pode ser recarregado através de carregadores USB-C de terceiros.
| Dell Inspiron 16 Plus 7620 i7-12700H, GeForce RTX 3050 Ti Laptop GPU, 86 Wh | Dell Inspiron 16 Plus 7610 i7-11800H, GeForce RTX 3050 4GB Laptop GPU, 86 Wh | Lenovo Yoga 7 16IAP7 i7-1260P, Iris Xe G7 96EUs, 71 Wh | Huawei MateBook D 16 2022 i7-12700H, Iris Xe G7 96EUs, 60 Wh | Acer Swift X SFX16-51G-5388 i5-11320H, GeForce RTX 3050 4GB Laptop GPU, 58.7 Wh | Asus Vivobook Pro 16X-M7600QE R9 5900HX, GeForce RTX 3050 Ti Laptop GPU, 96 Wh | |
|---|---|---|---|---|---|---|
| Duração da bateria | 63% | 2% | -26% | 5% | 6% | |
| Reader / Idle (h) | 18.6 | 20.5 10% | 12.2 -34% | 20.3 9% | ||
| WiFi v1.3 (h) | 9.6 | 9.9 3% | 7.9 -18% | 7.1 -26% | 8.1 -16% | 11.3 18% |
| Load (h) | 1.2 | 3.3 175% | 1.9 58% | 1.5 25% | 1.1 -8% | |
| H.264 (h) | 8.4 | |||||
| Gaming (h) | 1.1 |
Pro
Contra
Veredicto - Part Multimedia, Part Creator, Part Gamer
A vantagem mais notável do Inspiron 16 Plus 7620 quando comparado com o 7610 é sua CPU Intel Core-H de 12ª geração, pois oferece até 50% mais rápido de desempenho multi-linhas. Se suas cargas de trabalho podem explorar o processador mais rápido, então o 7620 pode ser um investimento que vale a pena em relação ao seu predecessor.
A maioria das outras mudanças são um desvio para a série ou, na melhor das hipóteses, apenas atualizações relativamente pequenas. Por exemplo, a webcam de 2 MP de resolução mais alta é agradável, mas não está nem perto das webcams de 5 MP no HP Spectre ou Envy 16. O design revisado do chassi também é bom, mas não torna o sistema mais leve, menor ou mais forte do que o design 7610 mais antigo. Alternativas como o mais leve Asus VivoBook Pro 16X vêm com o RTX 3050 Ti e um painel OLED, o último dos quais nossa Dell ainda não oferece. Um painel de atualização mais rápido, como o painel de 120 Hz no HP Envy 16, seria uma ótima opção para se ter.
O Inspiron 16 Plus 7620 é muito mais rápido do que o 7610 quando se trata de desempenho da CPU. Caso contrário, a maioria de tudo o resto é em grande parte igual ou ainda pior, como as temperaturas mais quentes e menos ranhuras de expansão.
Enquanto isso, várias outras mudanças podem ser vistas como downgrades como o numpad omitido, clickpad menor, maior consumo de energia sob carga, temperaturas mais quentes e menor número de slots SODIMM e M.2 SSD. Ainda é um sistema poderoso com as cores e desempenho adequados para jogos casuais e criação de conteúdo, mas não é exatamente um homerun quando faltam algumas características.
Preço e Disponibilidade
Amazônia atualmente tem uma configuração disponível com o Core i7-12700H, 16 GB RAM, 512 GB SSD, 3K display, e RTX 3050 gráficos por $1450 USD. Recomendamos encomendar diretamente da Dell para mais opções.
Dell Inspiron 16 Plus 7620
- 08/18/2022 v7 (old)
Allen Ngo
Price comparison

