Revisão do laptop Dell XPS 15 9510 Core i5: Modelo básico com os freios acoplados
Conhecemos o Dell XPS 15 há anos como um laptop multimídia de alta qualidade que normalmente também é equipado com uma placa gráfica dedicada. No entanto, a Dell também oferece sempre um modelo com puro processador gráfico, caso você realmente não precise de uma placa de vídeo rápida. Mas como você tem que pagar 1599 euros (~$1862) pelo Core i5-11400H com 8 GB de RAM, um SSD PCIe de 512 GB, e o painel FHD mate (16:10), o dispositivo ainda não é acessível.
Há também alguns poucos concorrentes sem os GPUs dedicados, e muitas vezes eles são significativamente mais acessíveis. Com as novas Huawei MateBook 16que estamos testando atualmente, já há outro concorrente no início. Para obter informações detalhadas sobre o caso, dispositivos de entrada e alto-falantes, encaminhamos você para nossa revisão do modelo i7:
Possible Competitors in Comparison
Avaliação | Data | Modelo | Peso | Altura | Size | Resolução | Preço |
|---|---|---|---|---|---|---|---|
| 84.2 % v7 (old) | 10/2021 | Dell XPS 15 9510 i5 11400H FHD i5-11400H, UHD Graphics Xe 16EUs | 1.8 kg | 18 mm | 15.60" | 1920x1200 | |
| 88.6 % v7 (old) | 10/2021 | Huawei MateBook 14s i7 i7-11370H, Iris Xe G7 96EUs | 1.4 kg | 16.7 mm | 14.20" | 2520x1680 | |
| 86.4 % v7 (old) | 10/2021 | Acer Swift 3 SF316-51 i7-11370H, Iris Xe G7 96EUs | 1.7 kg | 15.9 mm | 16.10" | 1920x1080 | |
| 87.7 % v7 (old) | 12/2020 | Schenker Vision 15 i7-1165G7, Iris Xe G7 96EUs | 1.7 kg | 15 mm | 15.60" | 1920x1080 | |
| 84.5 % v7 (old) | 11/2020 | Honor MagicBook Pro (AMD) R5 4600H, Vega 6 | 1.7 kg | 16.9 mm | 16.10" | 1920x1080 | |
| 86.8 % v7 (old) | 06/2020 | Dell XPS 15 9500 Core i5 i5-10300H, UHD Graphics 630 | 1.8 kg | 18 mm | 15.60" | 1920x1200 |
Estojo e equipamento
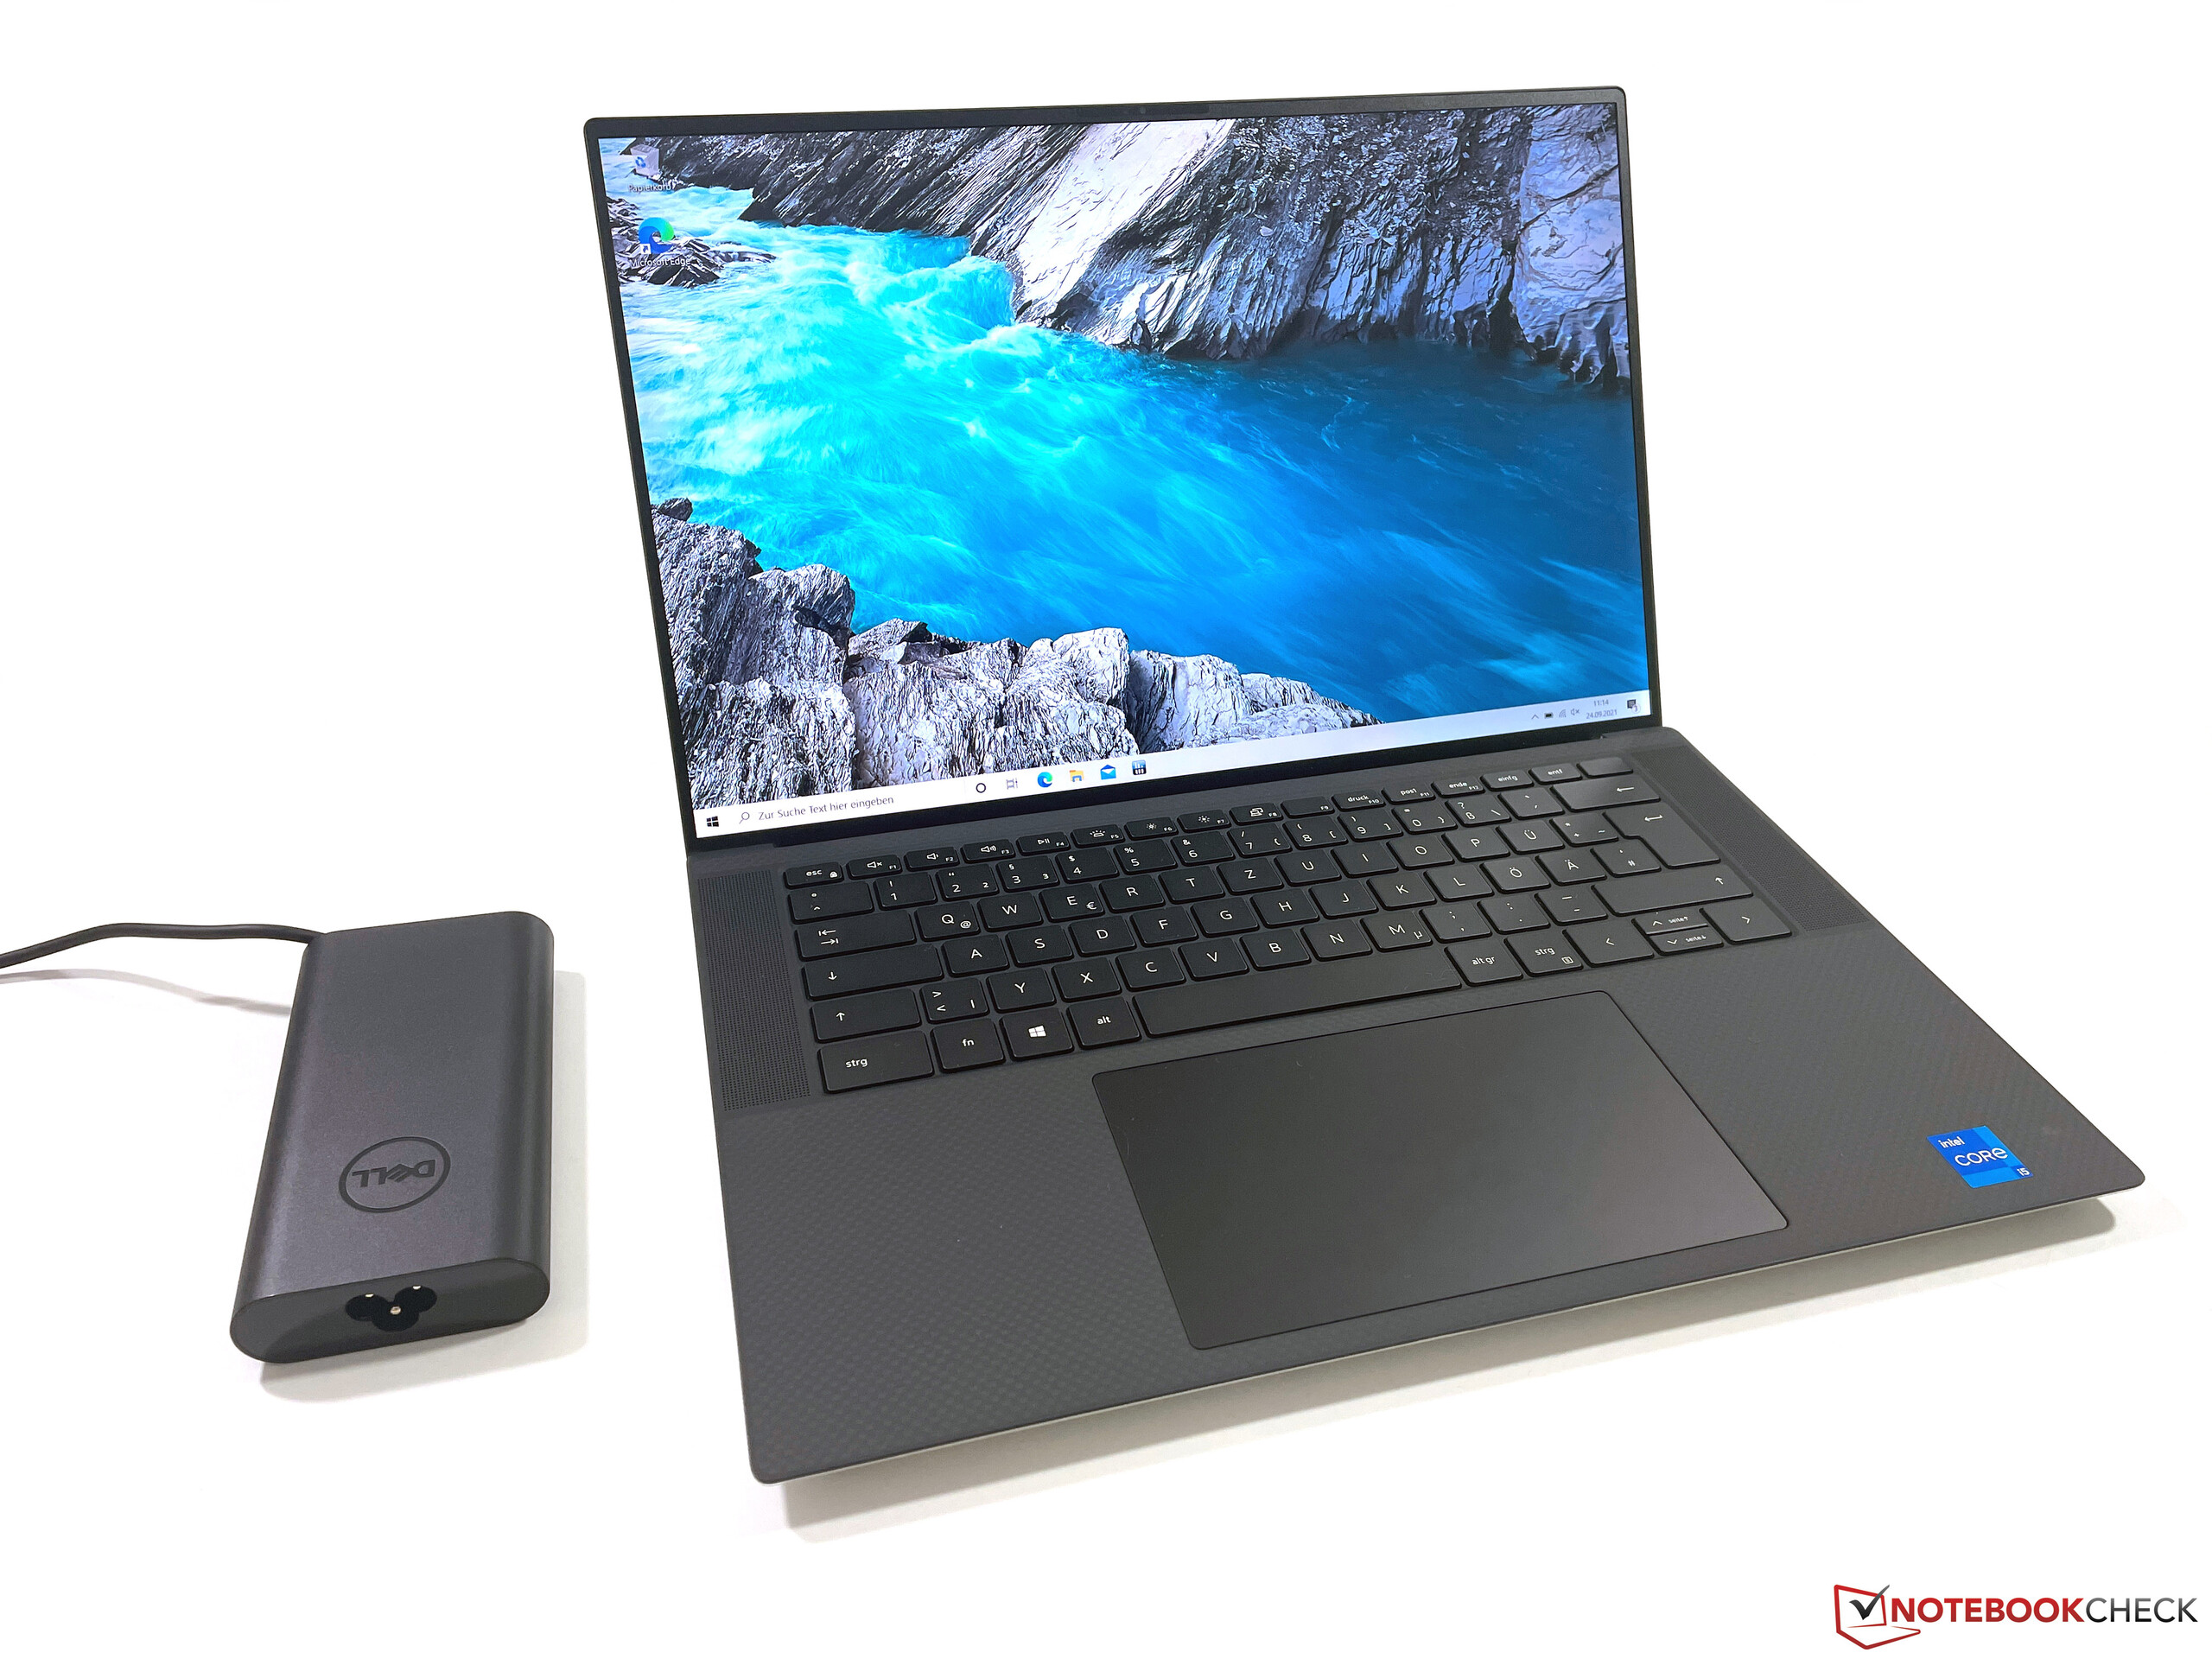
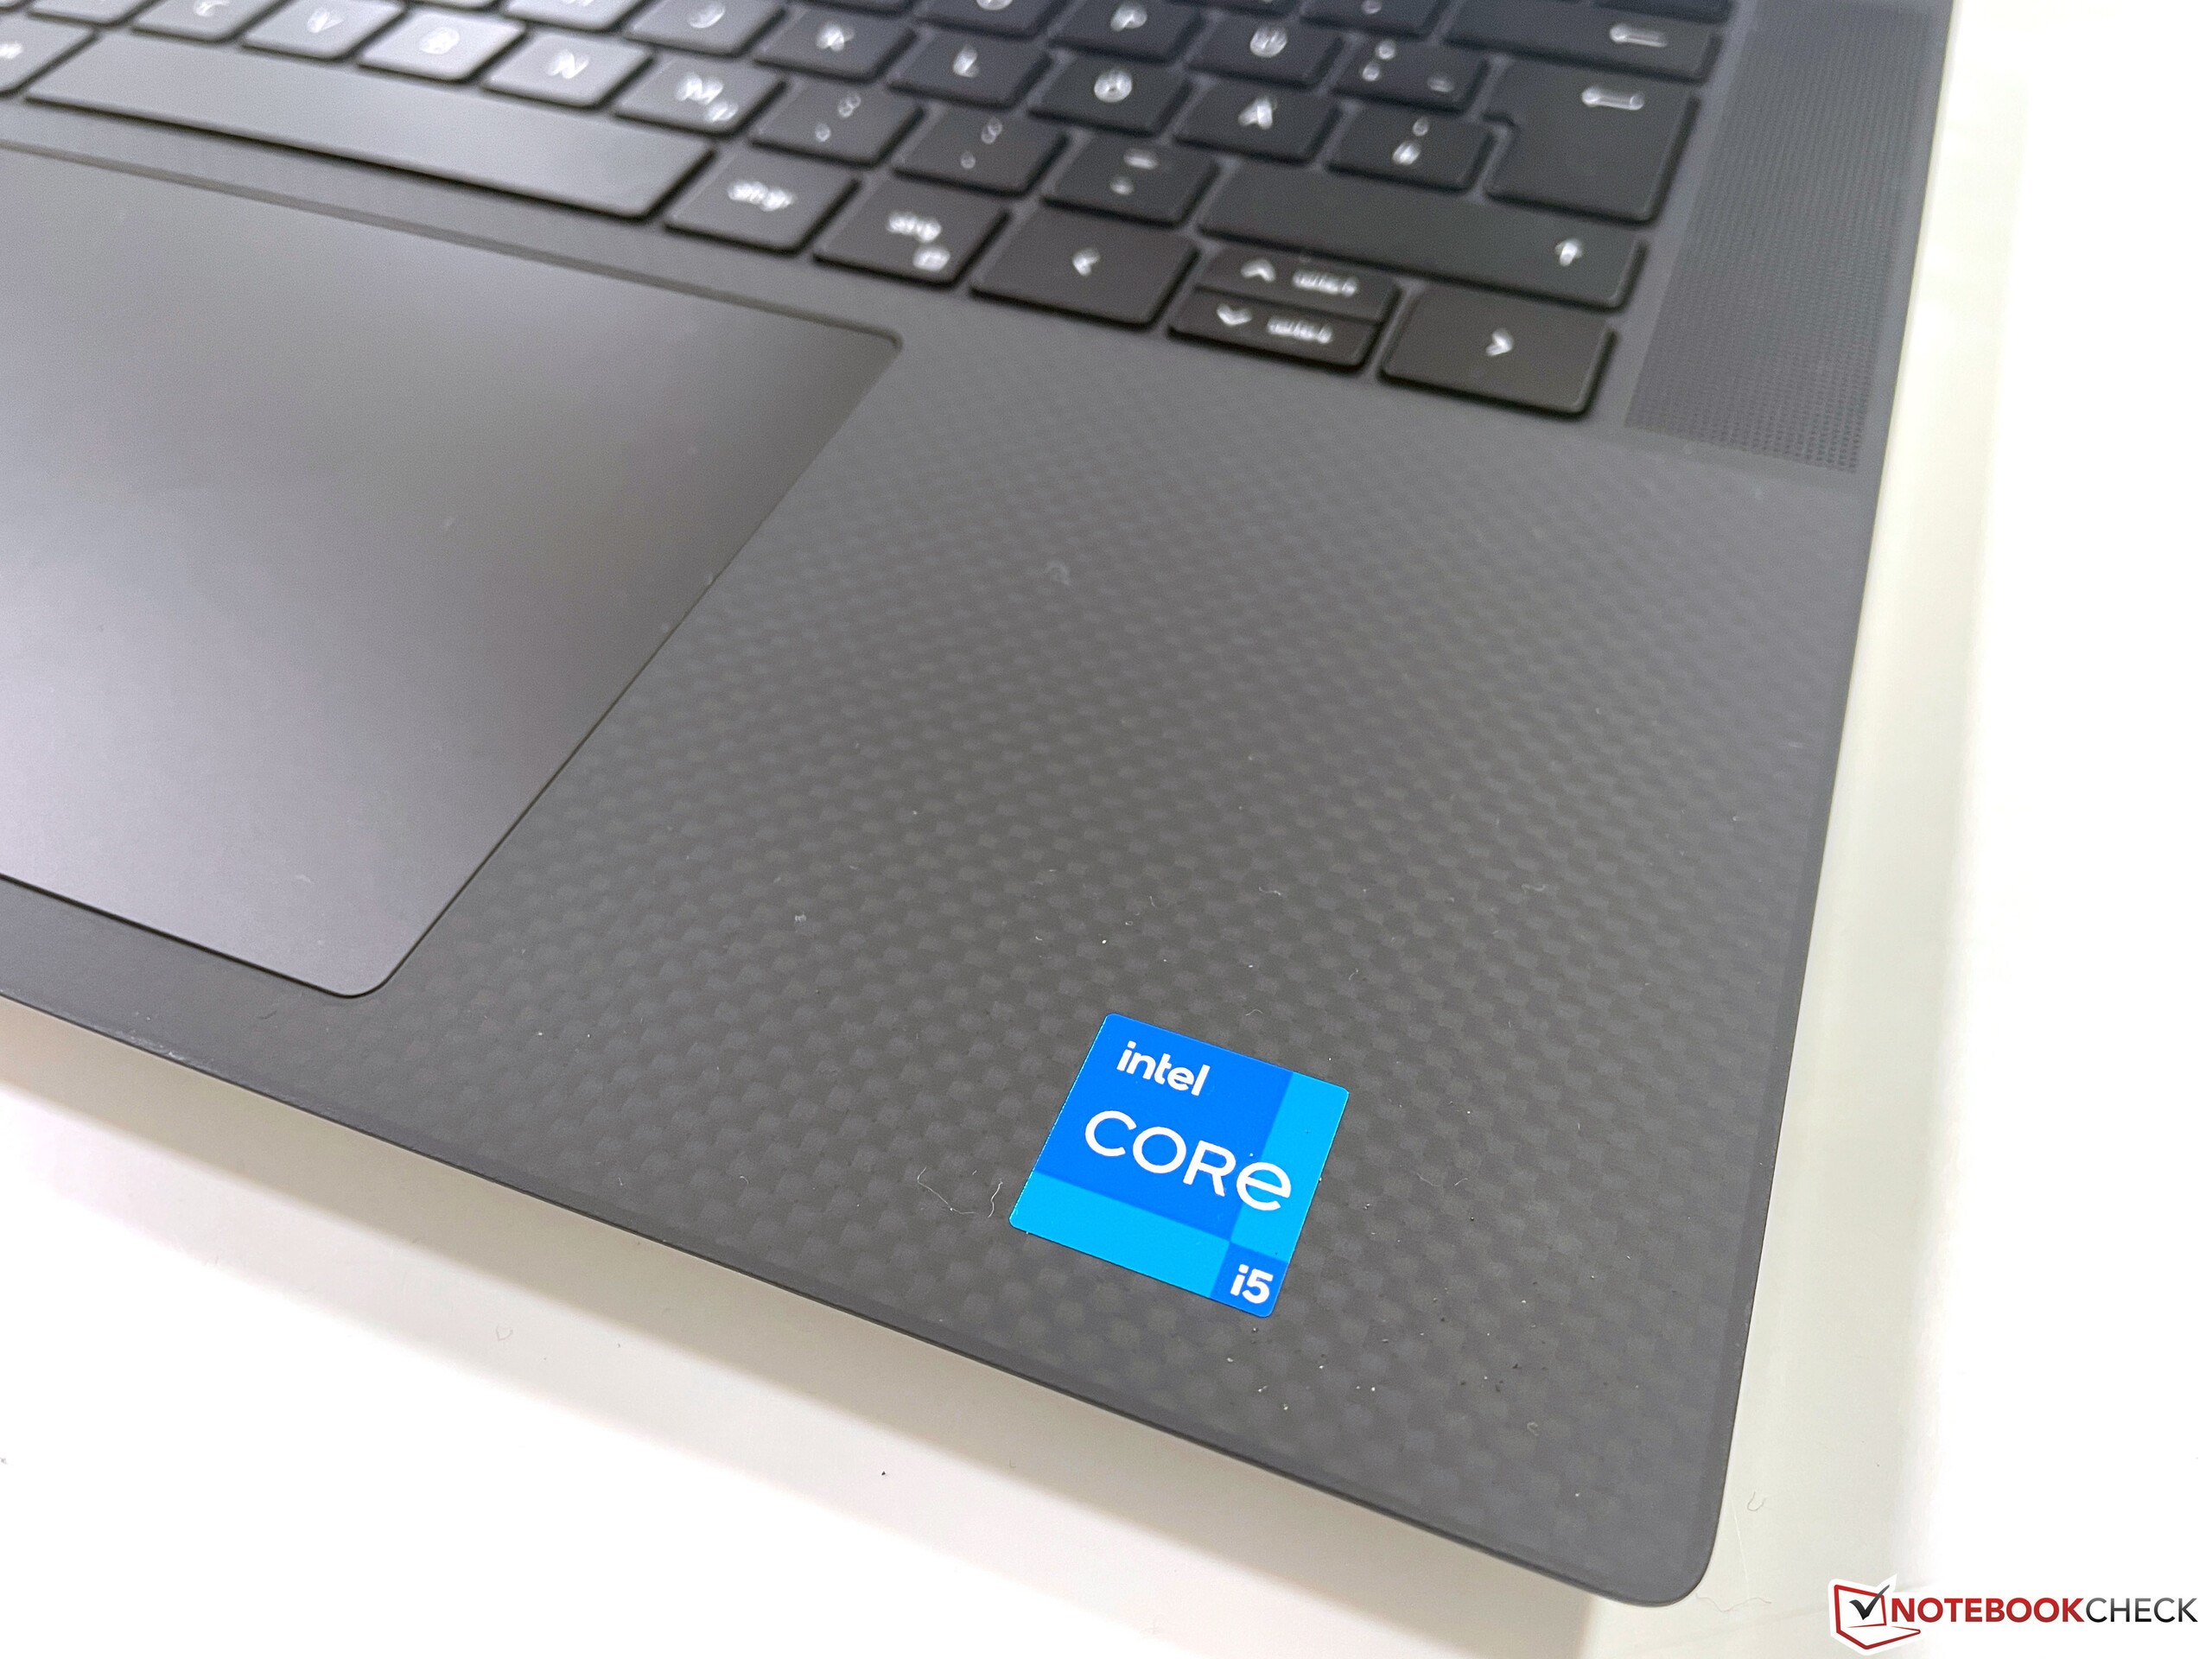
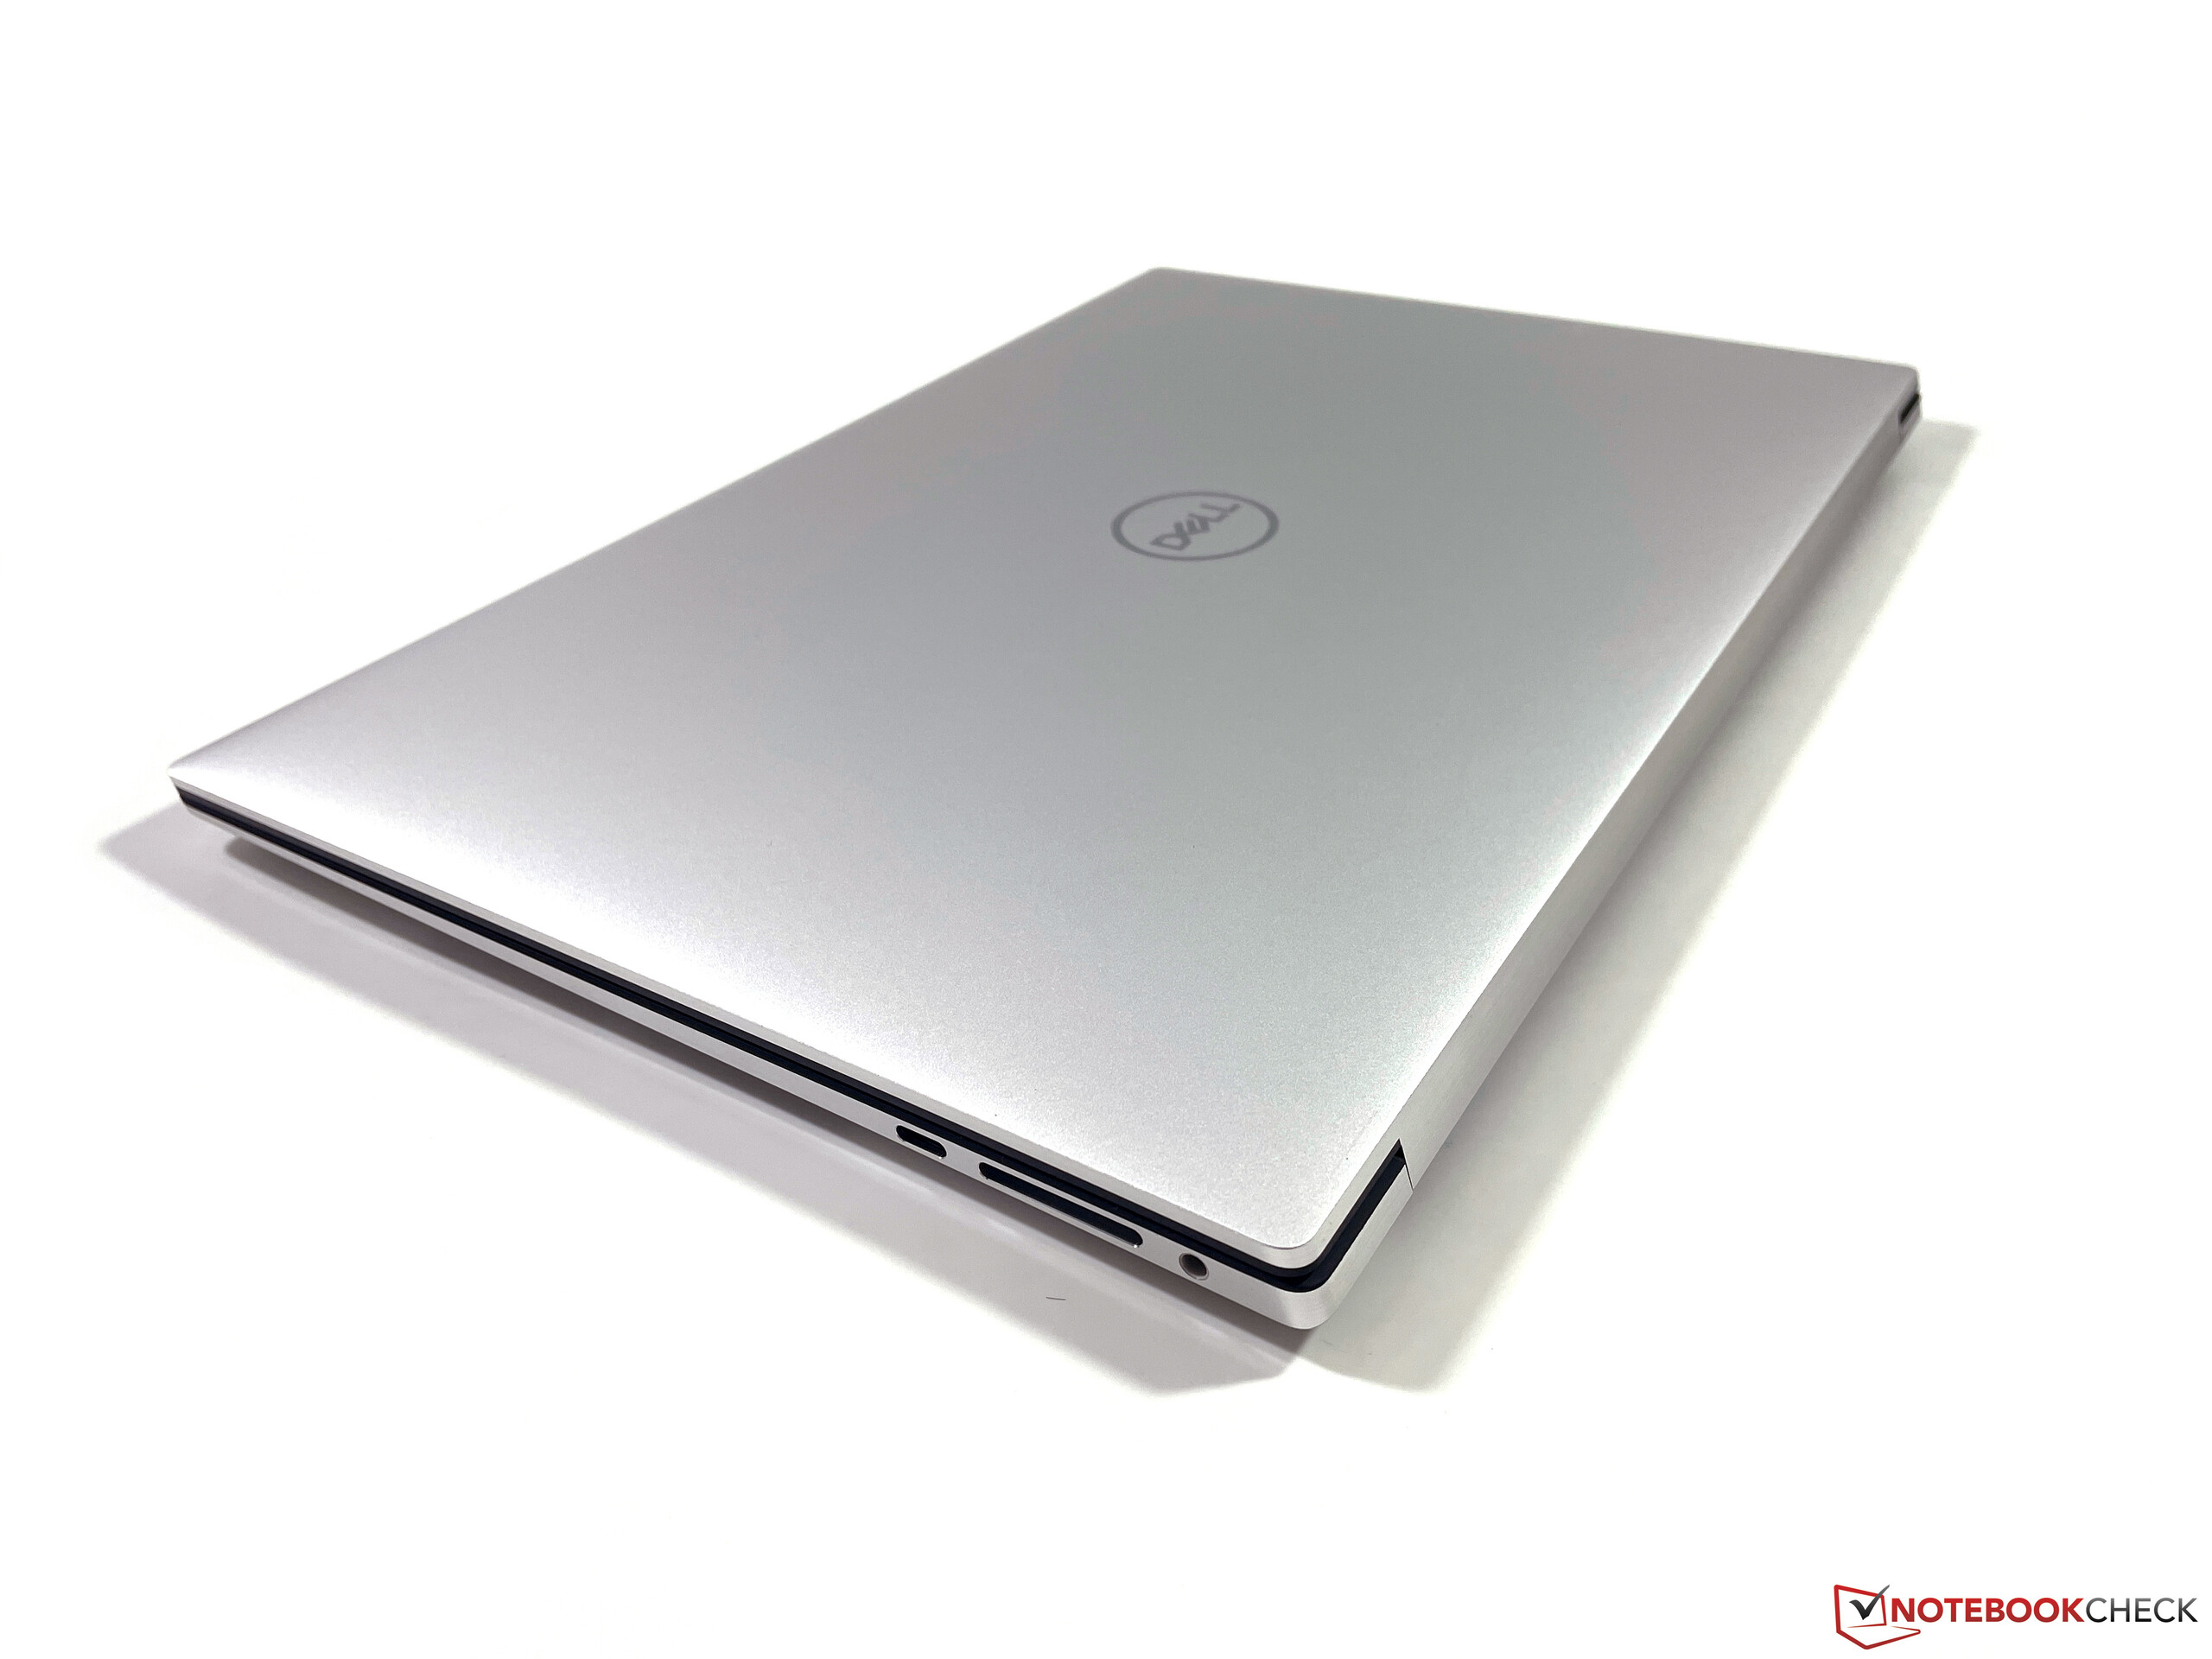
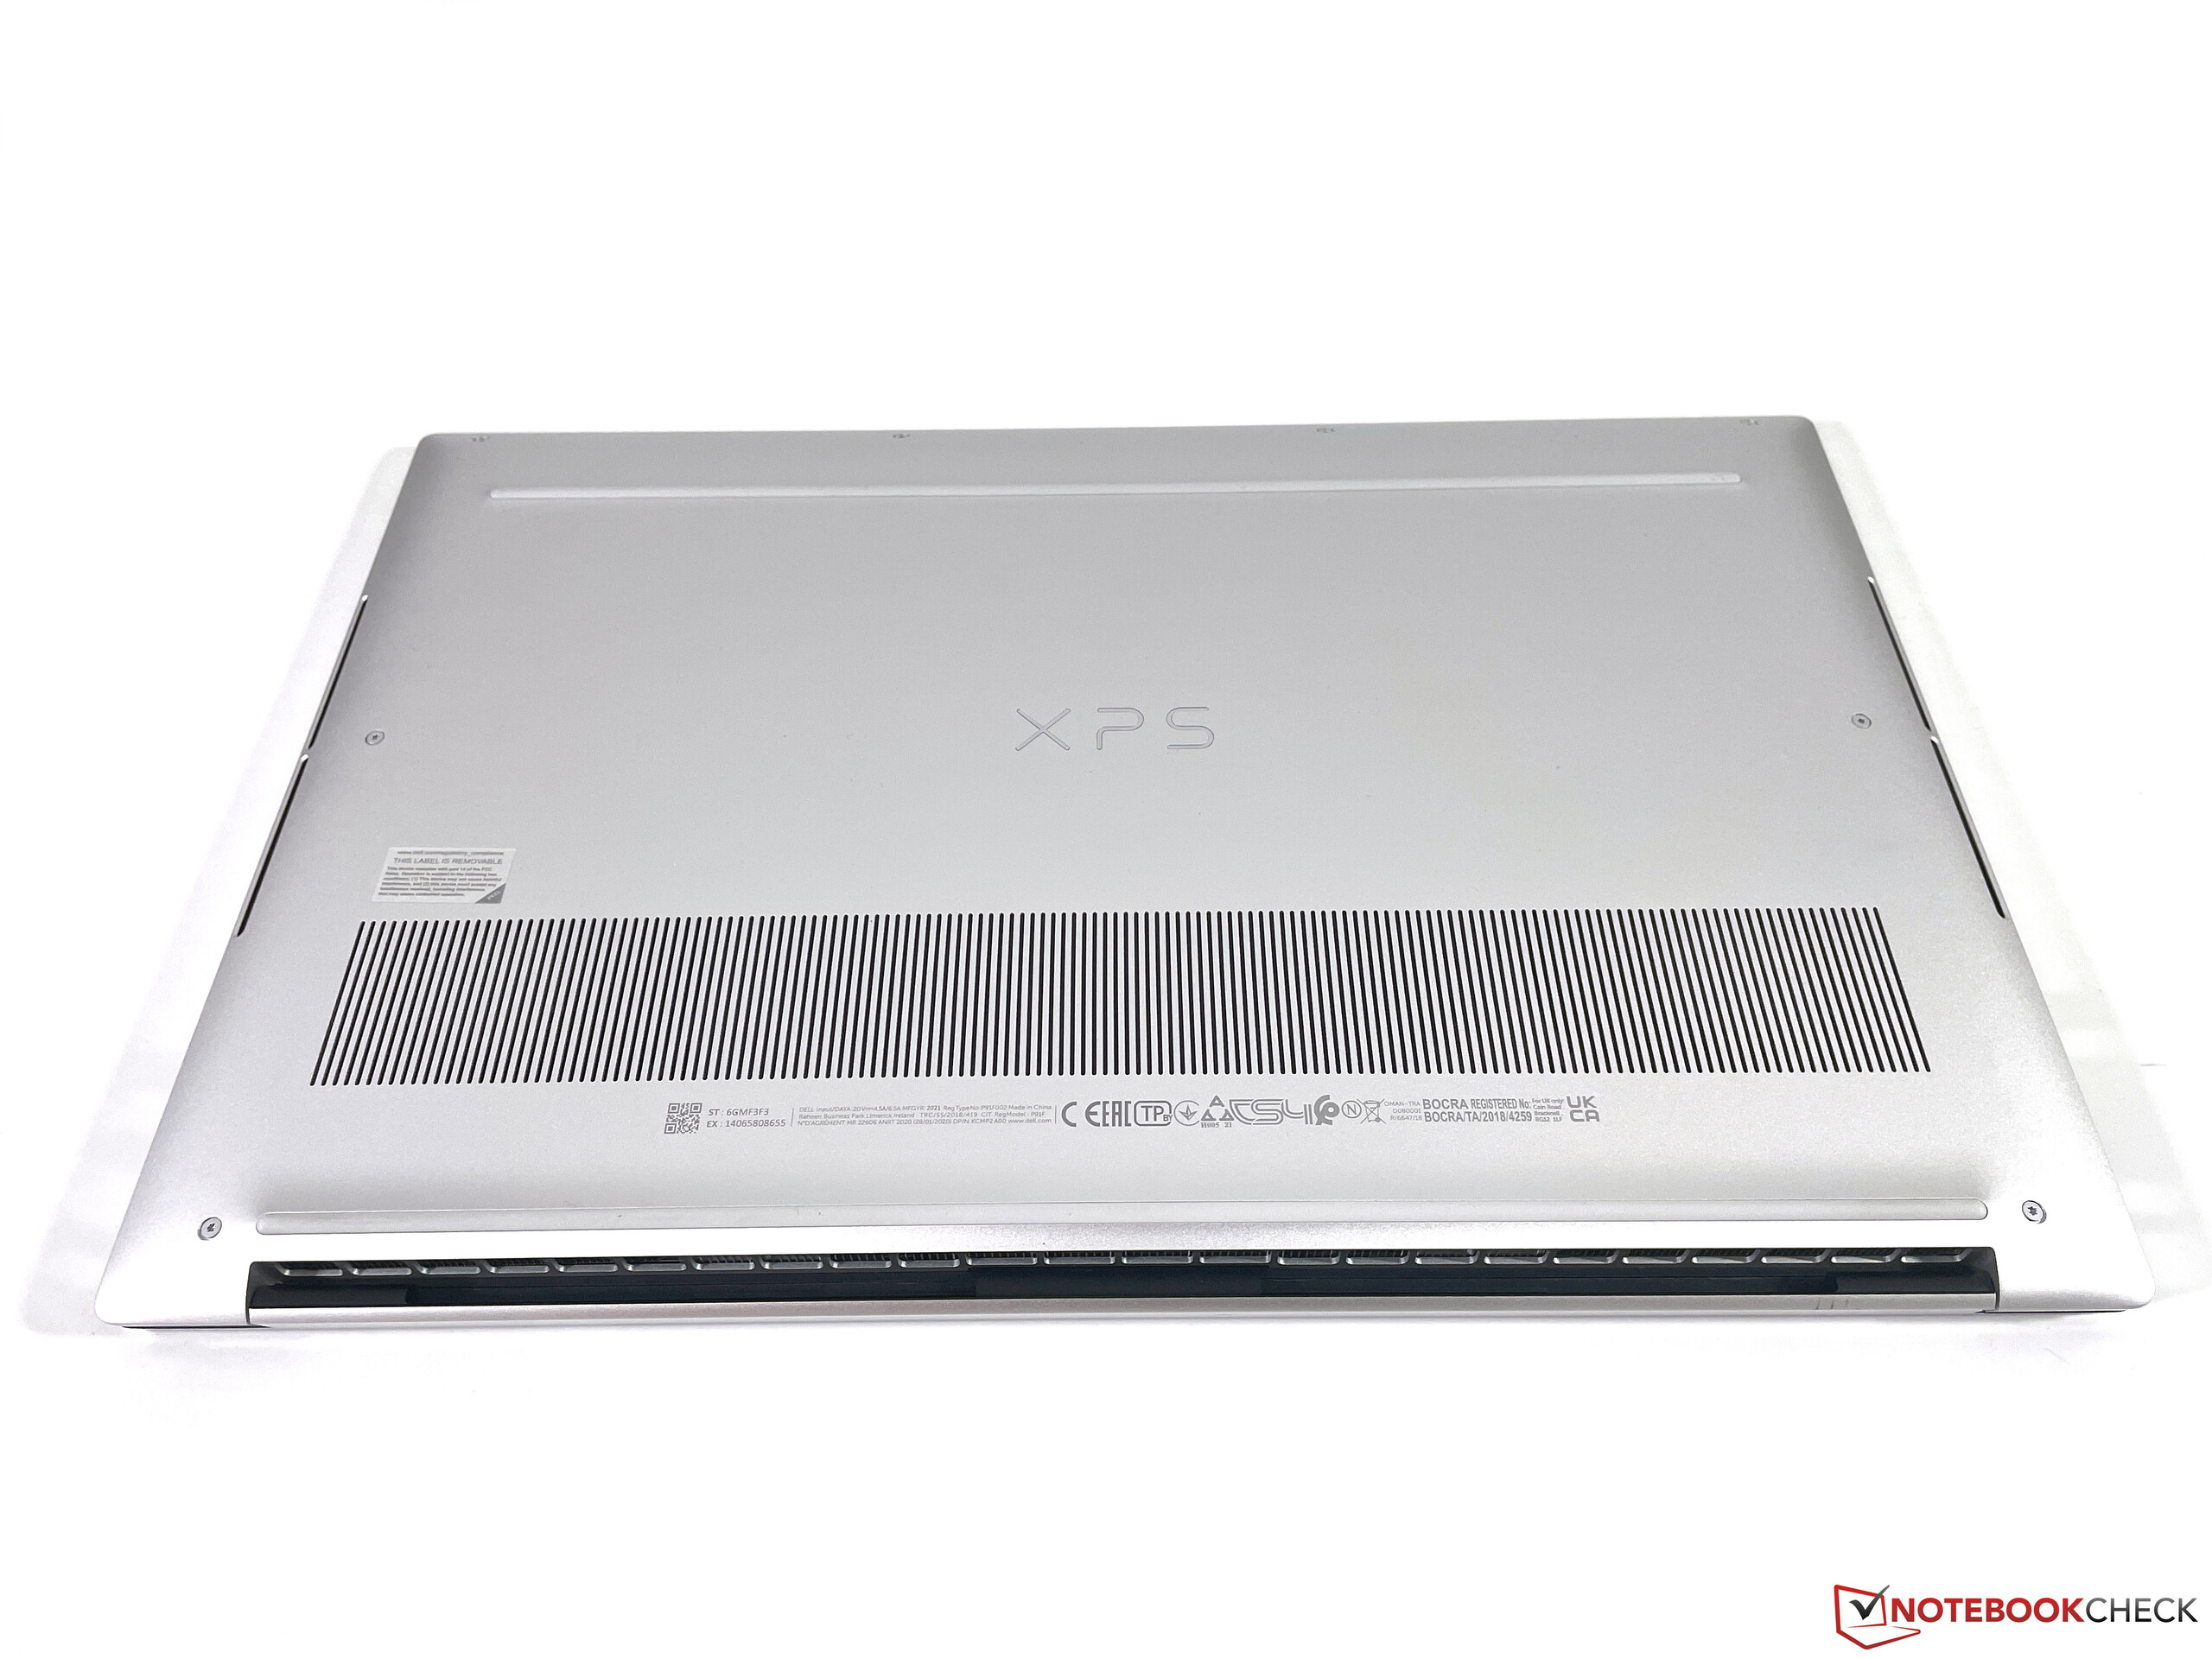
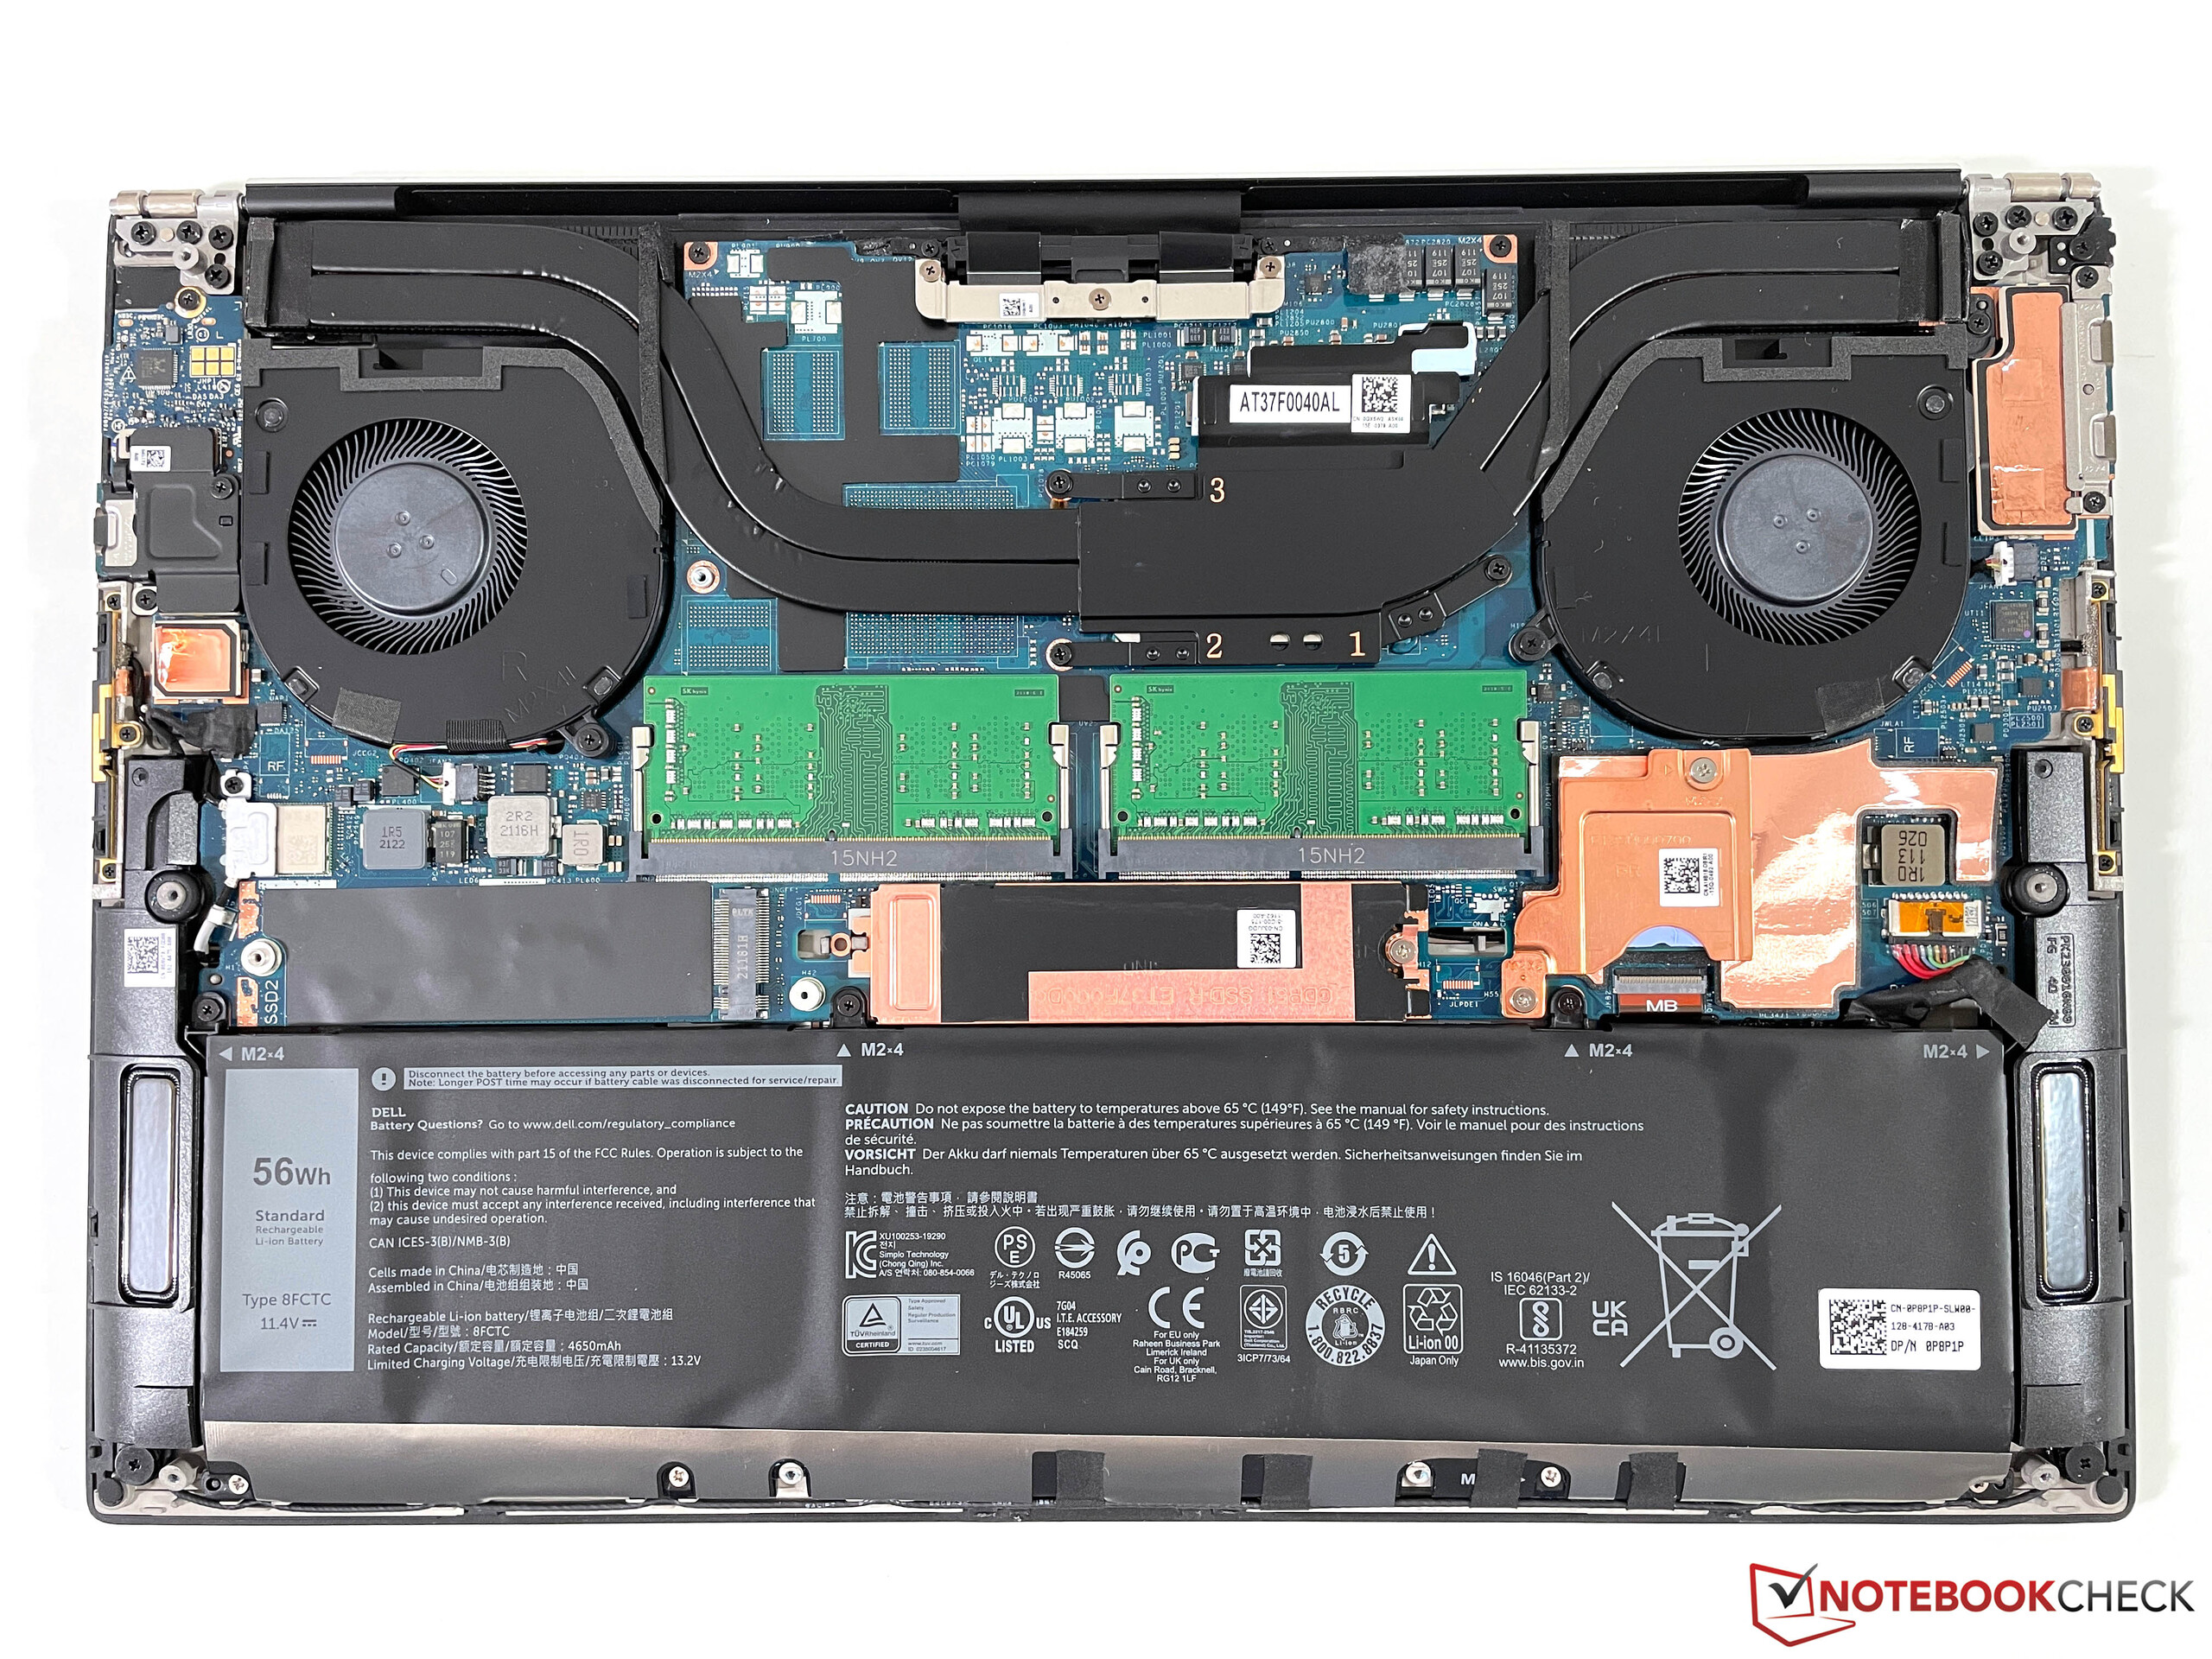
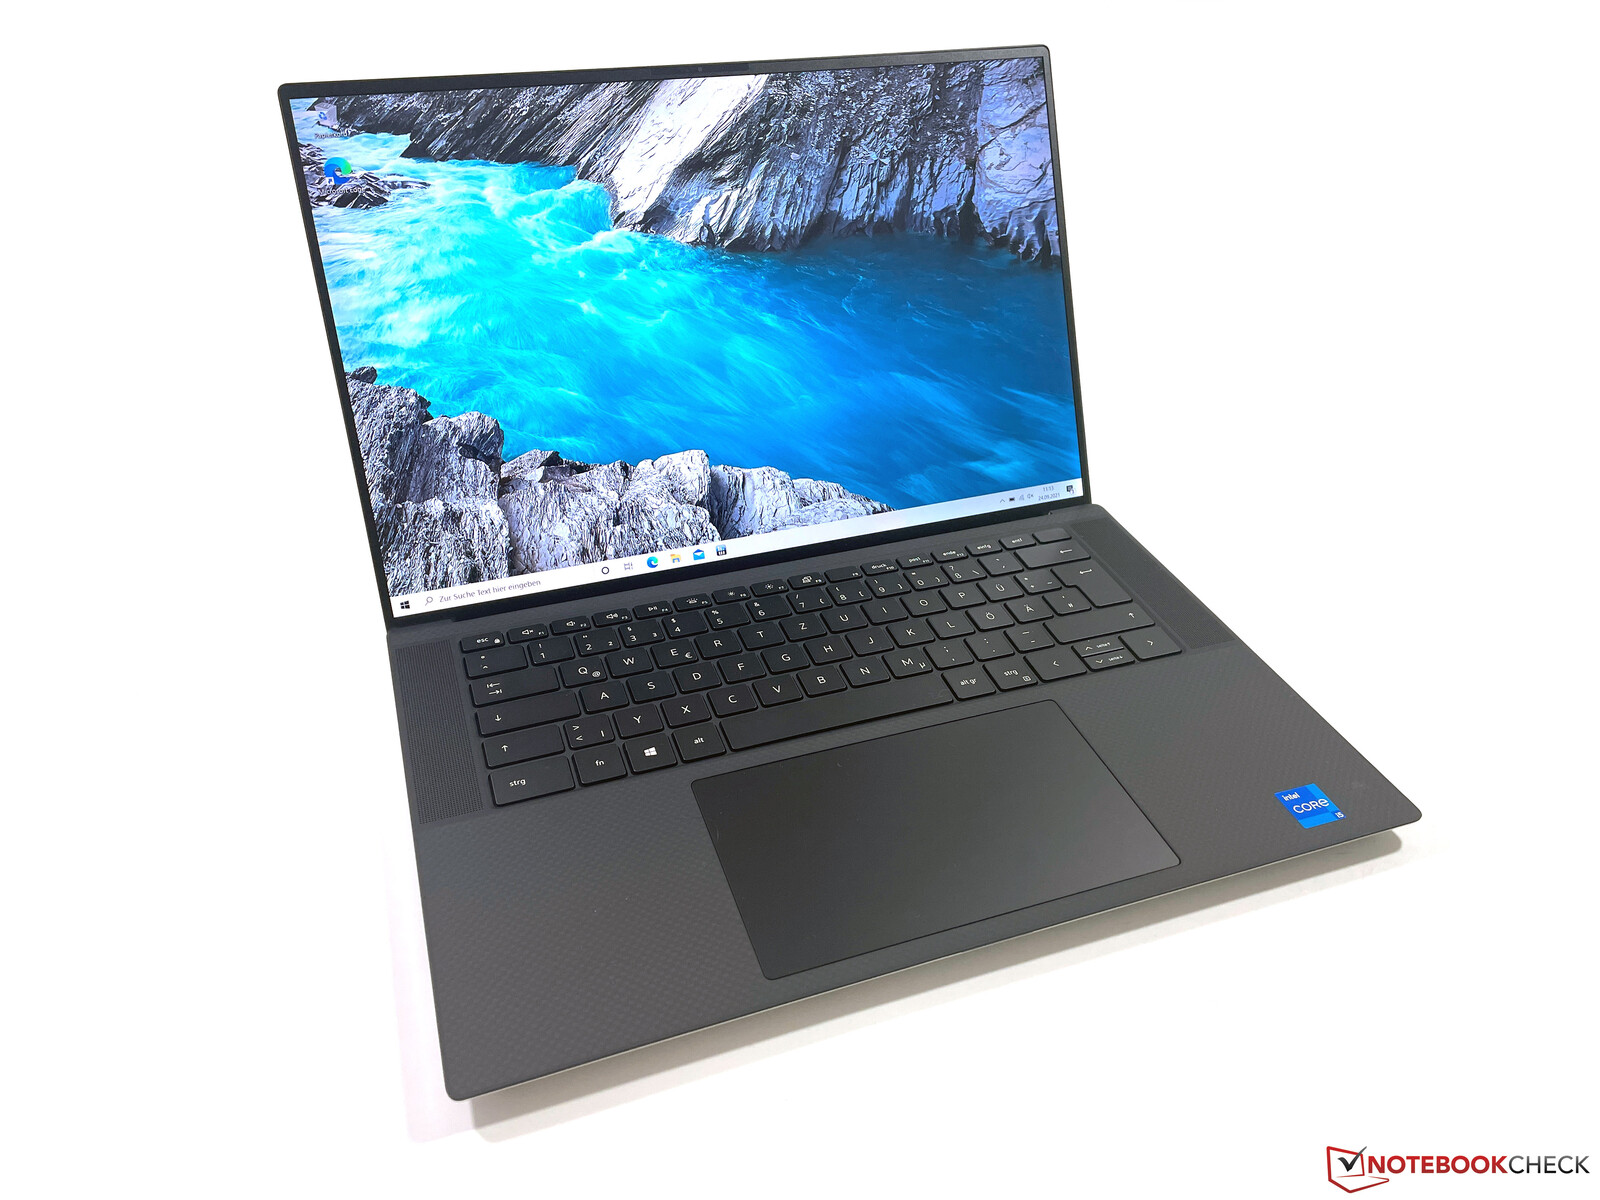
O caso é praticamente idêntico ao versão high-end do XPS 15 9510que já testamos. Entretanto, desta vez estamos testando o modelo com uma unidade de base preta e tampa prateada. Como já era o caso dos modelos anteriores, a superfície preta permanece suscetível a sujeira e a impressões digitais. Ao dar uma olhada no interior, você não verá nenhuma diferença, além da falta da GPU dedicada. O resfriamento também é idêntico, e a bateria tem o mesmo tamanho, mesmo que a capacidade seja significativamente menor a 56 em vez de 86 Wh. Pelo menos isto se torna perceptível em termos de peso, já que o modelo básico do XPS 15sem a tela sensível ao toque é cerca de 200 gramas (~7 oz) mais leve.
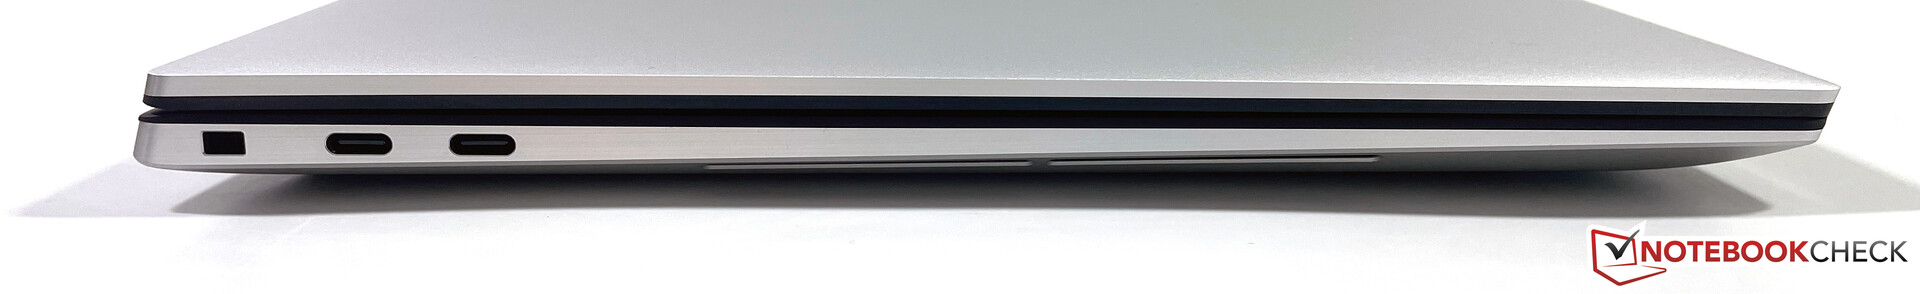
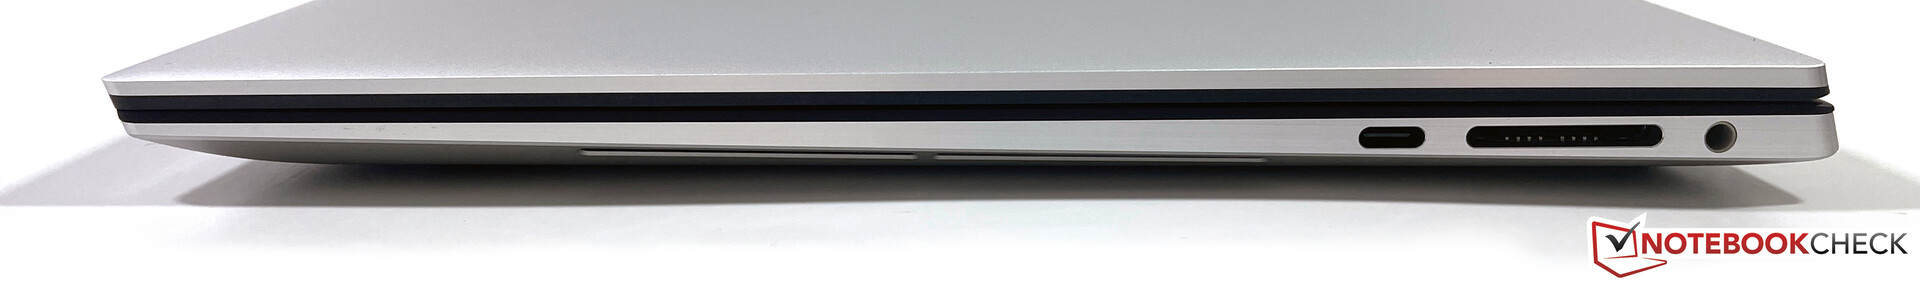
O resto do equipamento com as conexões Thunderbolt 4, o módulo rápido WLAN da Killer e o leitor de cartões SD é idêntico ao high-end XPS 15 9510.
Equipamento de conexão
| SD Card Reader | |
| average JPG Copy Test (av. of 3 runs) | |
| Dell XPS 15 9500 Core i5 (Toshiba Exceria Pro SDXC 64 GB UHS-II) | |
| Dell XPS 15 9510 i5 11400H FHD (AV Pro V60) | |
| Média da turma Multimedia (23 - 531, n=43, últimos 2 anos) | |
| maximum AS SSD Seq Read Test (1GB) | |
| Dell XPS 15 9510 i5 11400H FHD (AV Pro V60) | |
| Dell XPS 15 9500 Core i5 (Toshiba Exceria Pro SDXC 64 GB UHS-II) | |
| Média da turma Multimedia (27.9 - 1455, n=42, últimos 2 anos) | |


Display - Um display mate 1080p no formato 16:10
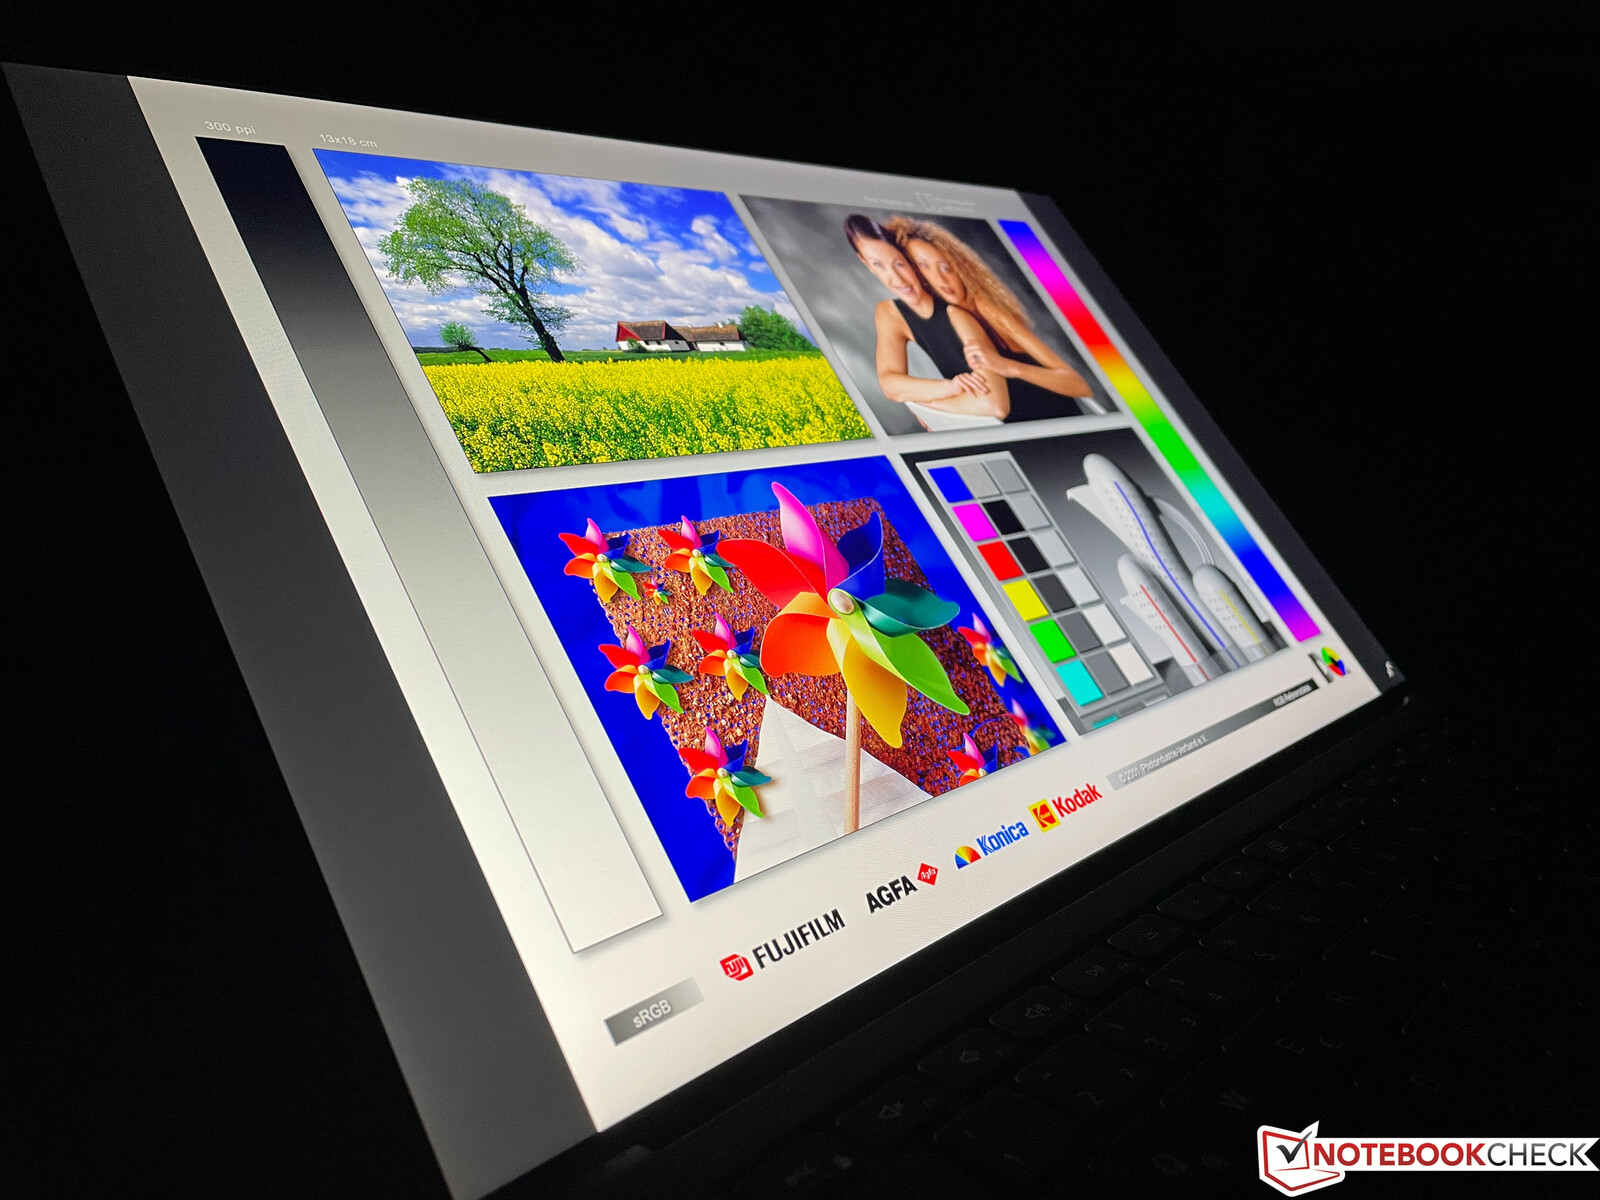
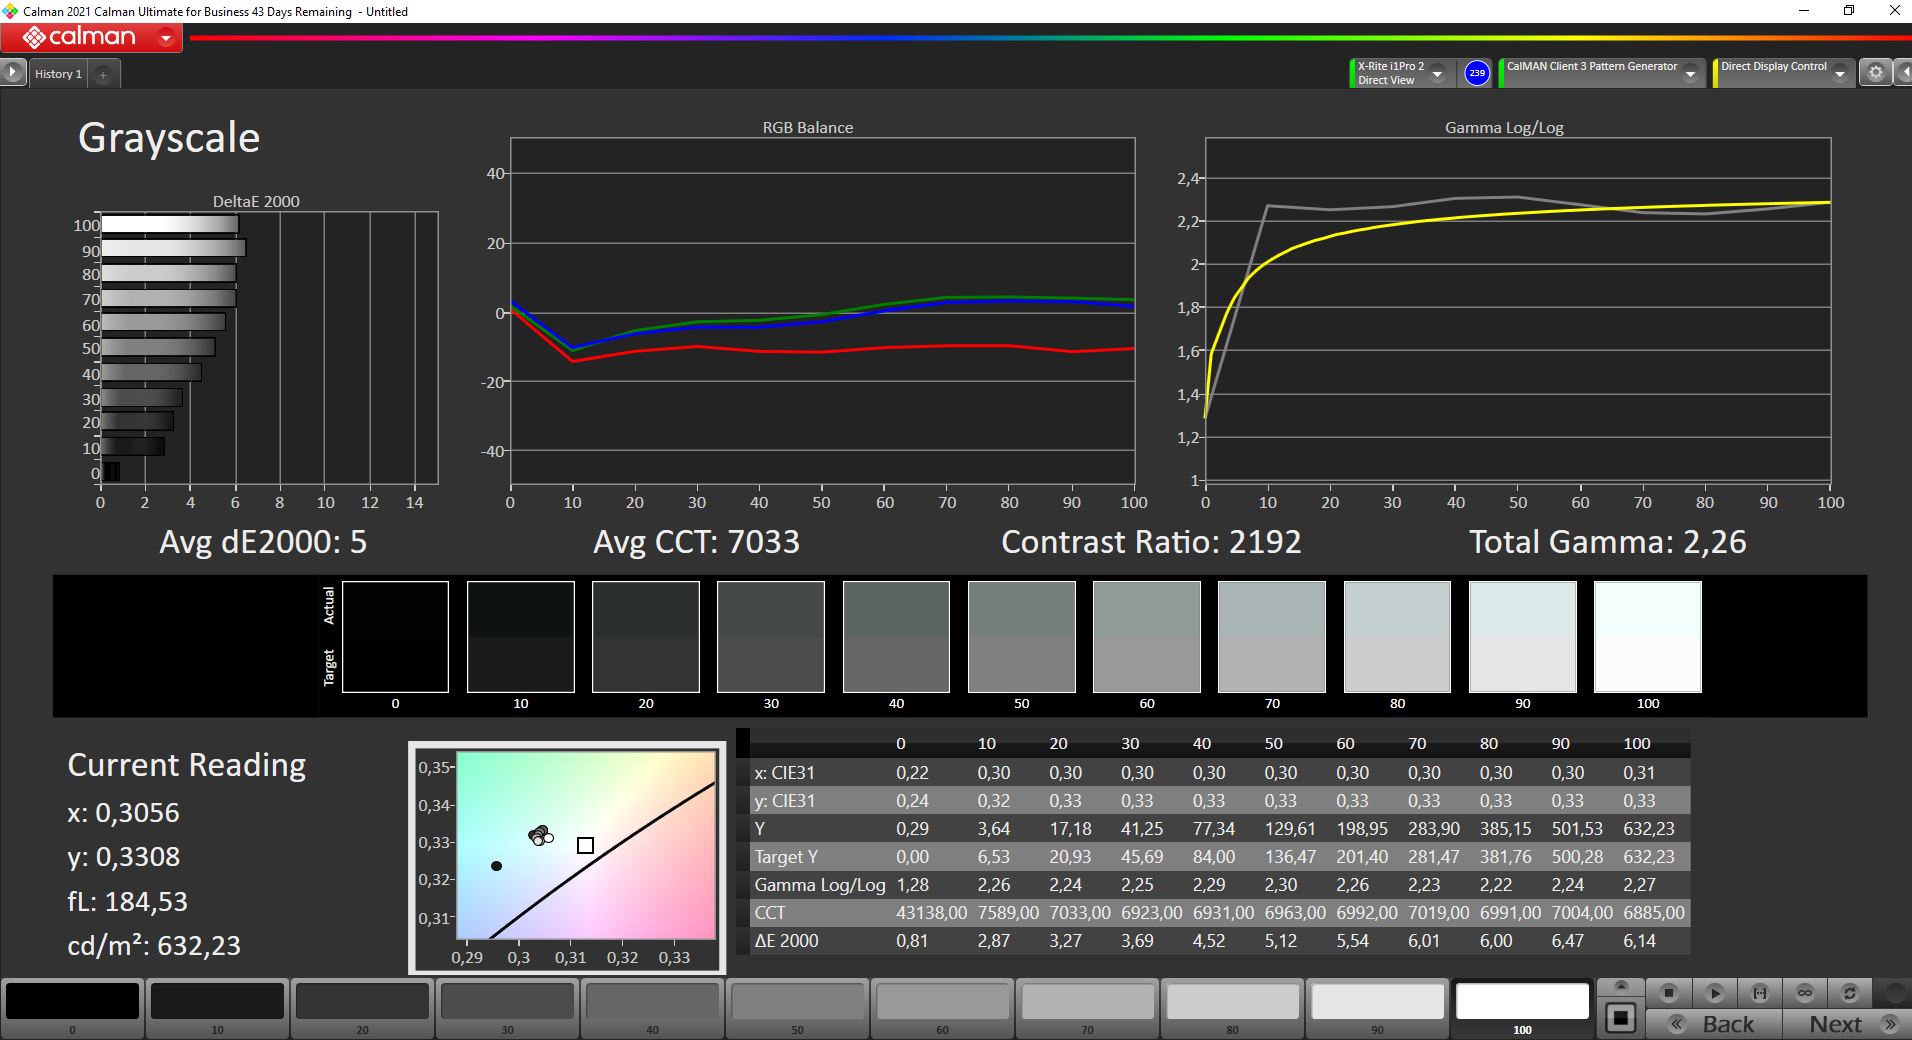
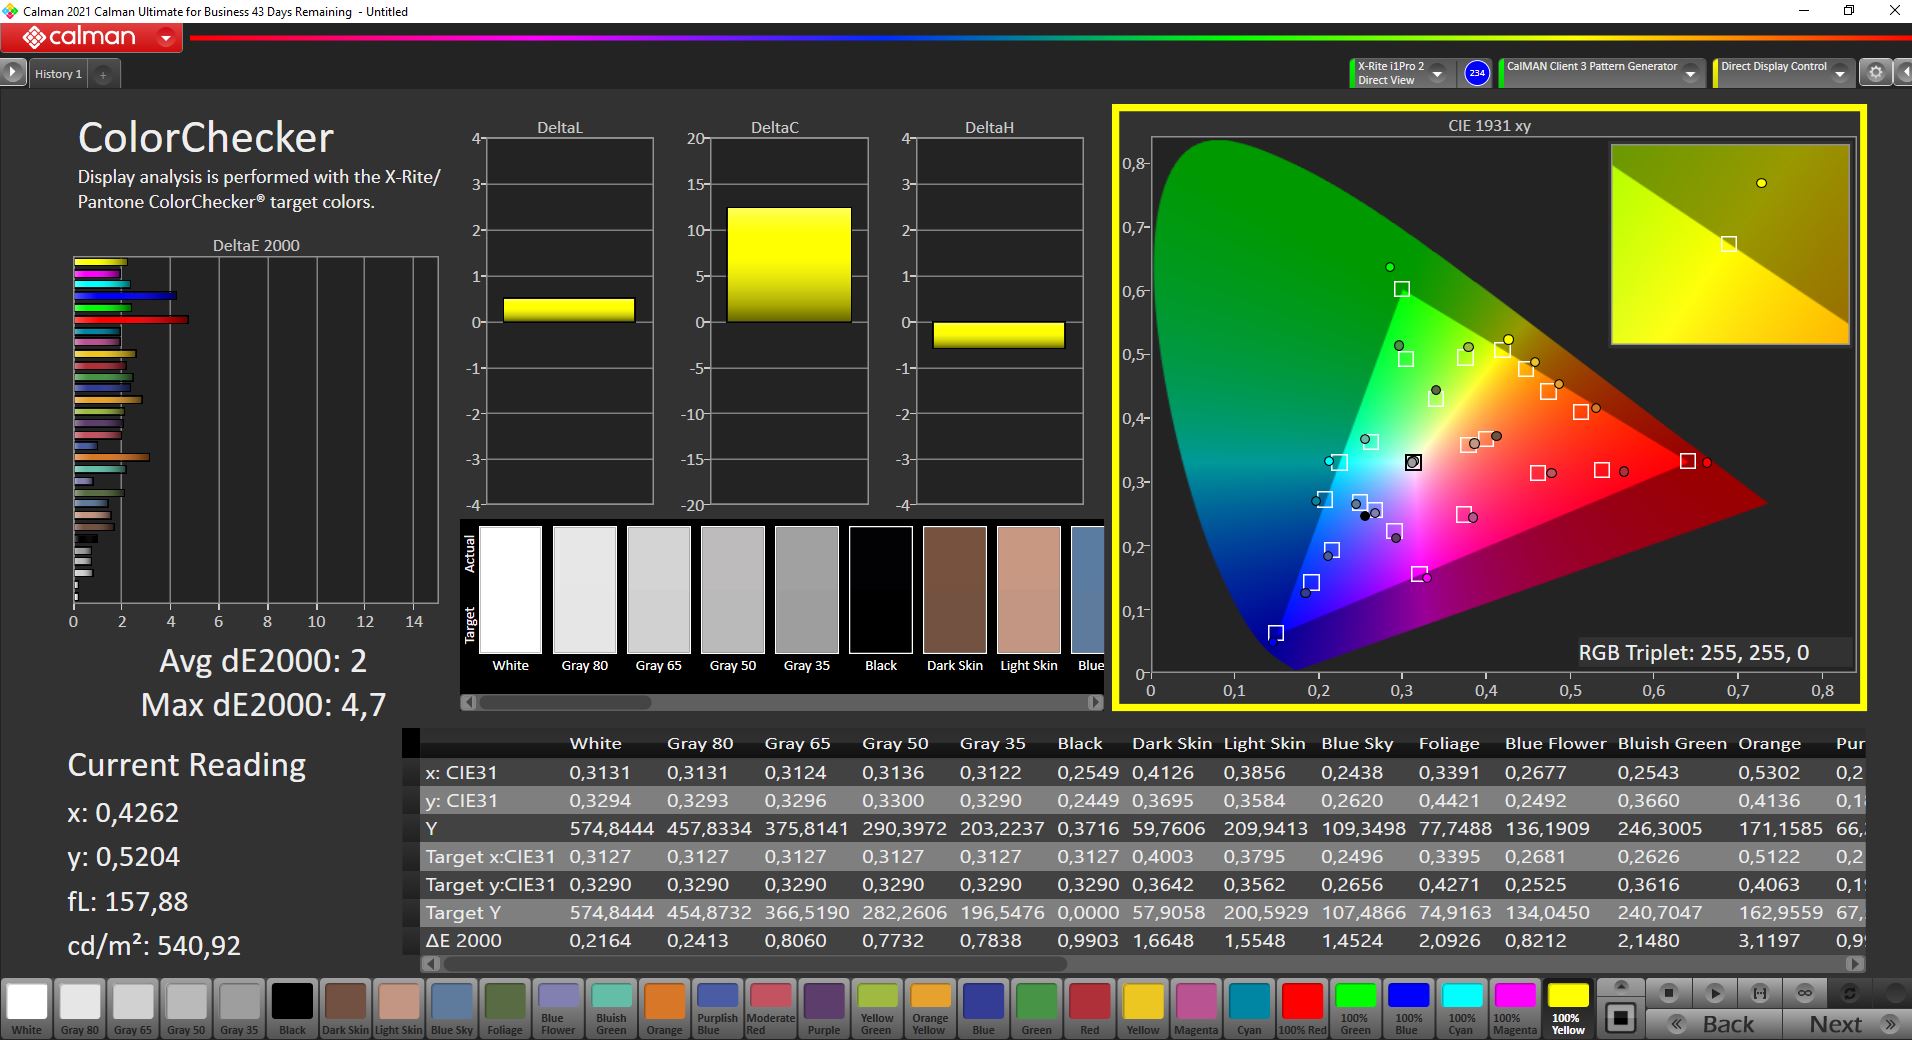
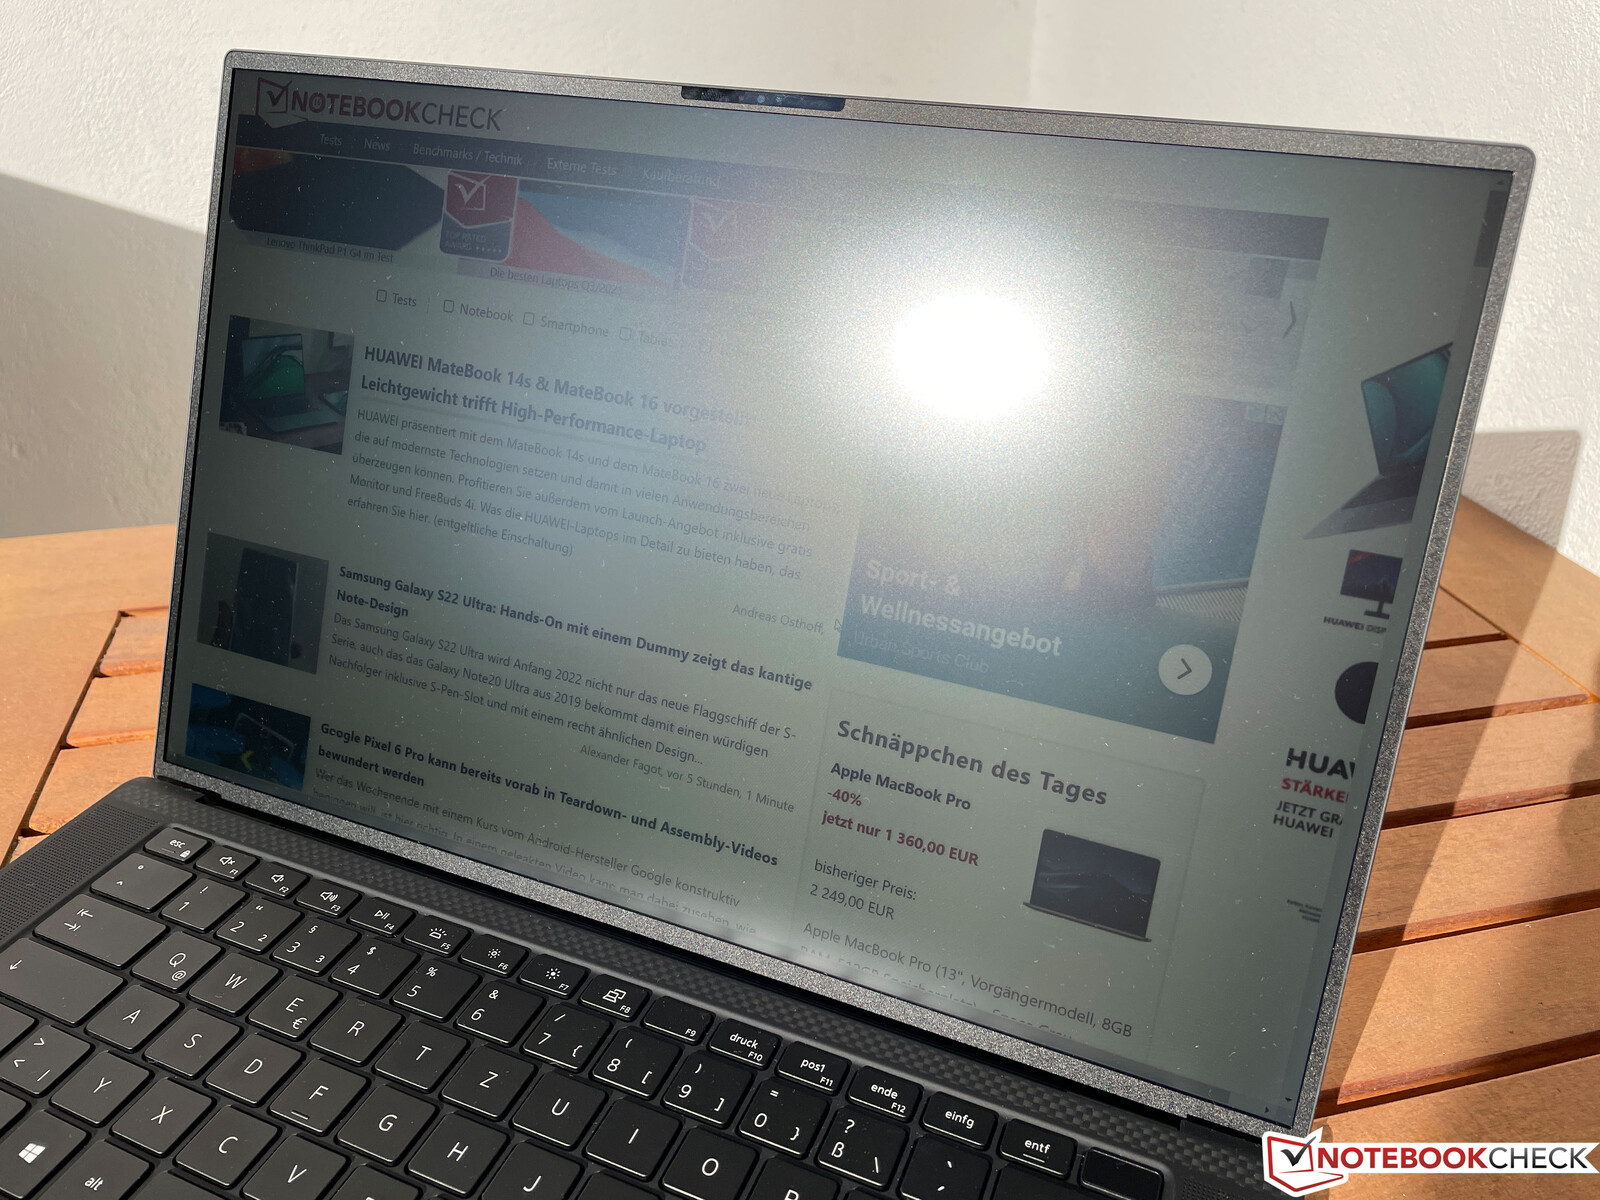
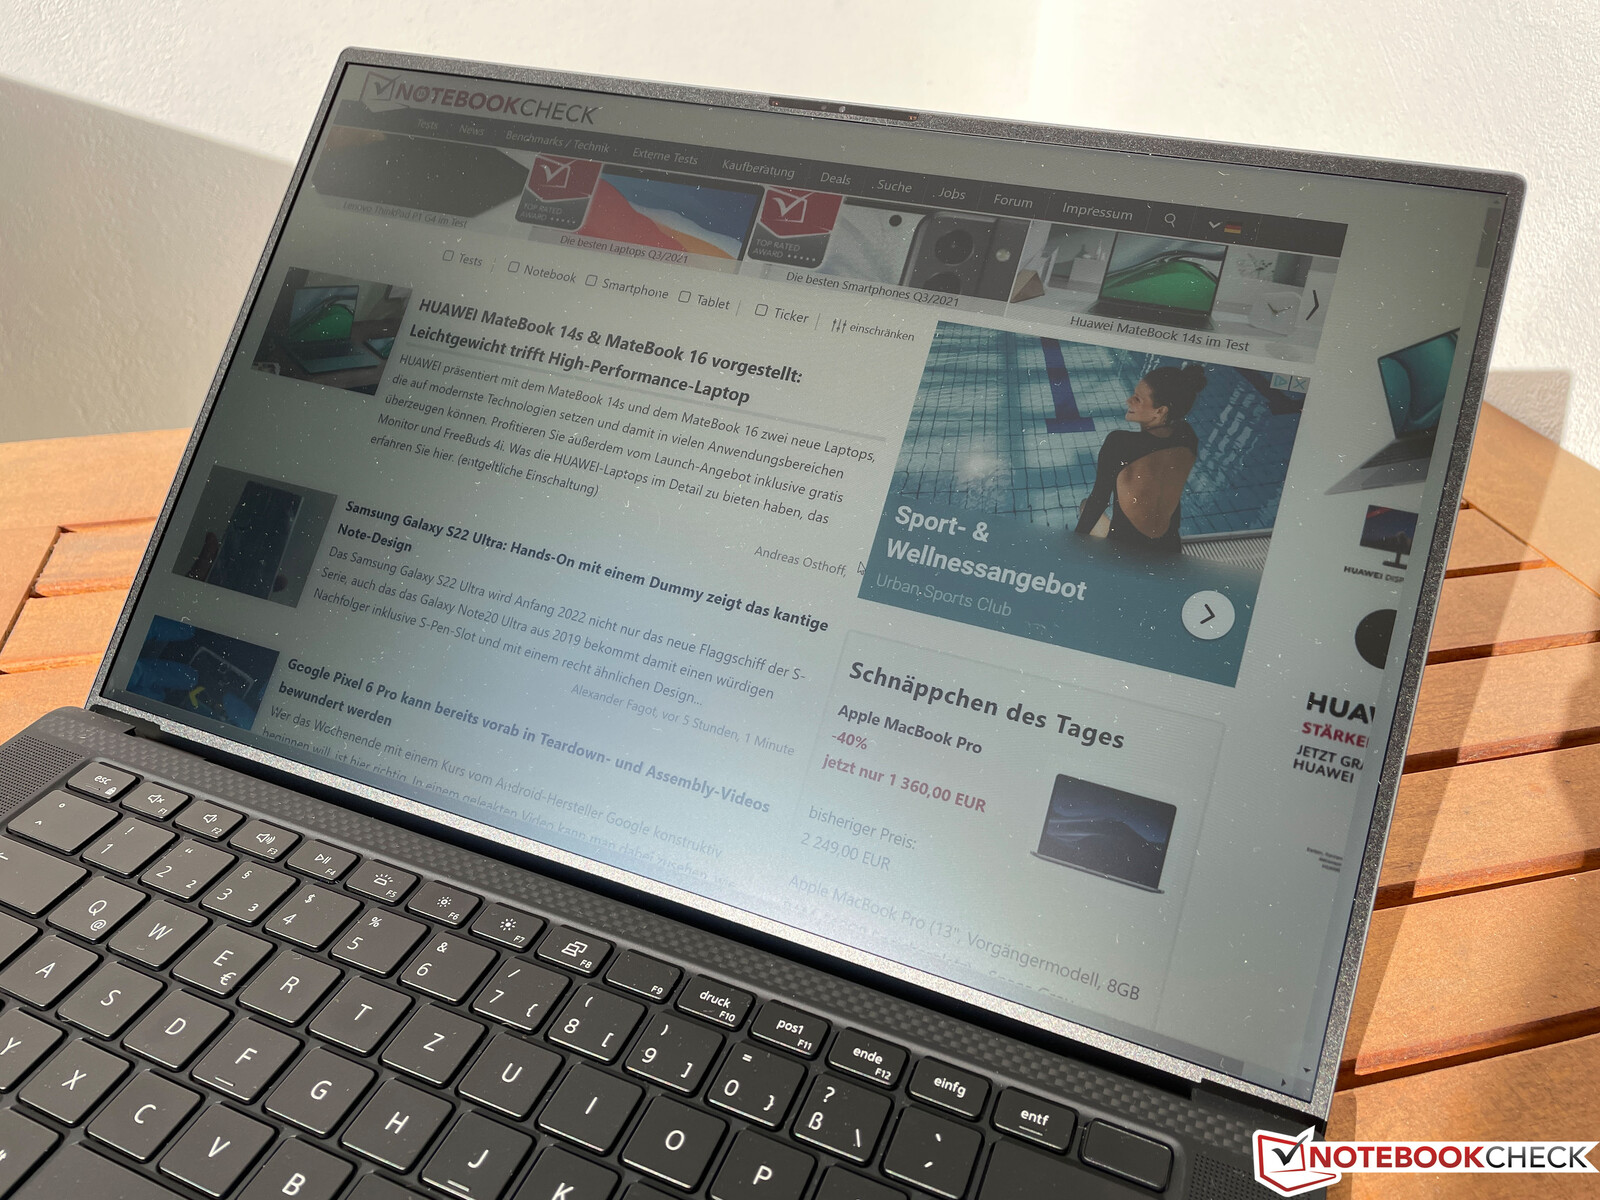
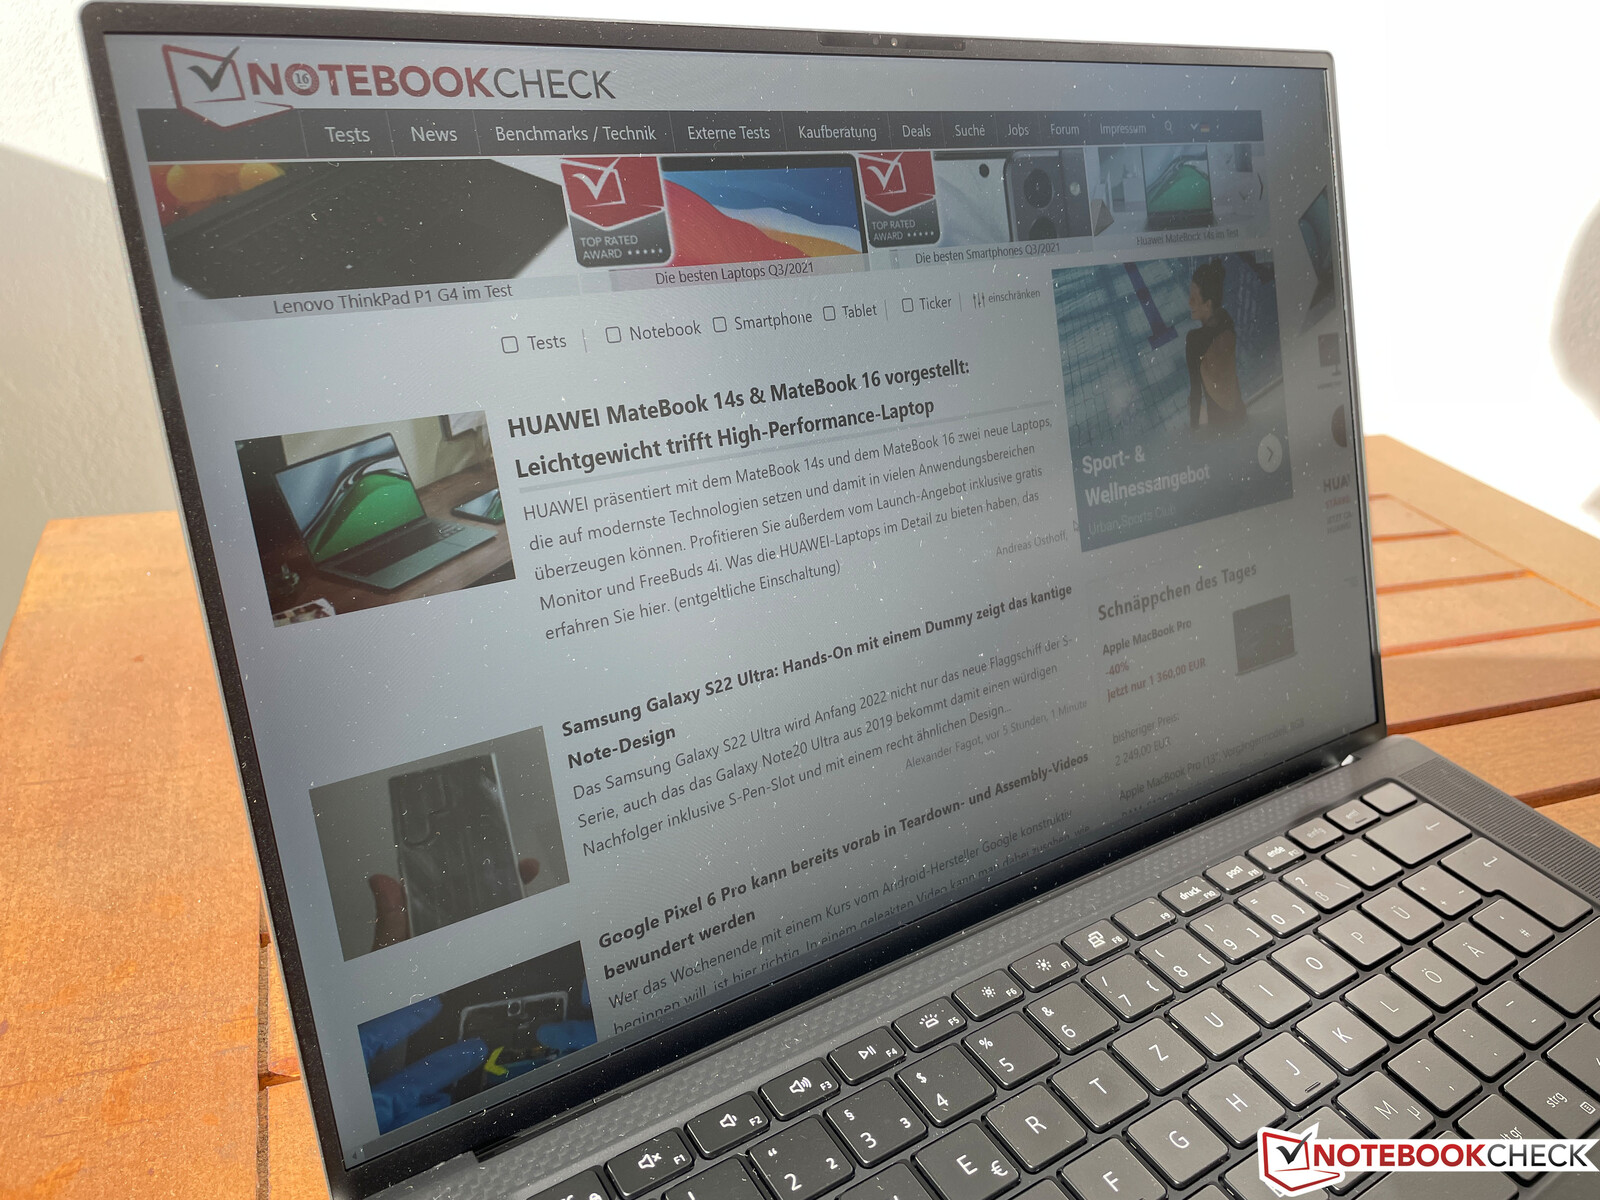
Já conhecemos o painel mate Full-HD da Sharp com uma resolução de 1920 x 1200 pixels da antiga XPS 15 9500. Com um brilho médio de mais de 600 cd/m², o painel continua sendo um dos mais brilhantes do mercado. O valor de preto é relativamente baixo, levando à razão de contraste extremamente alta de mais de 2000:1
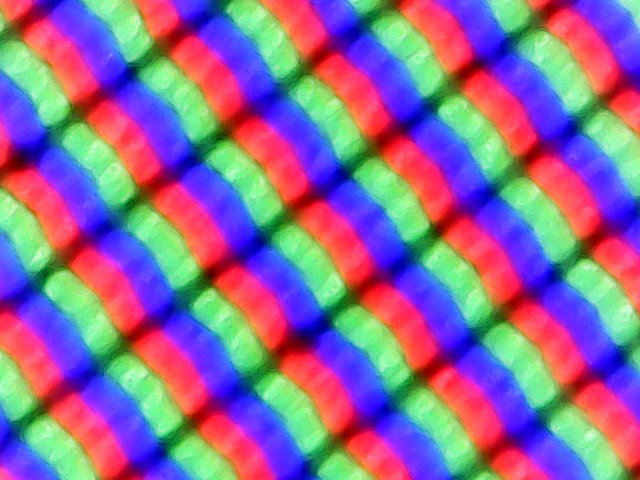
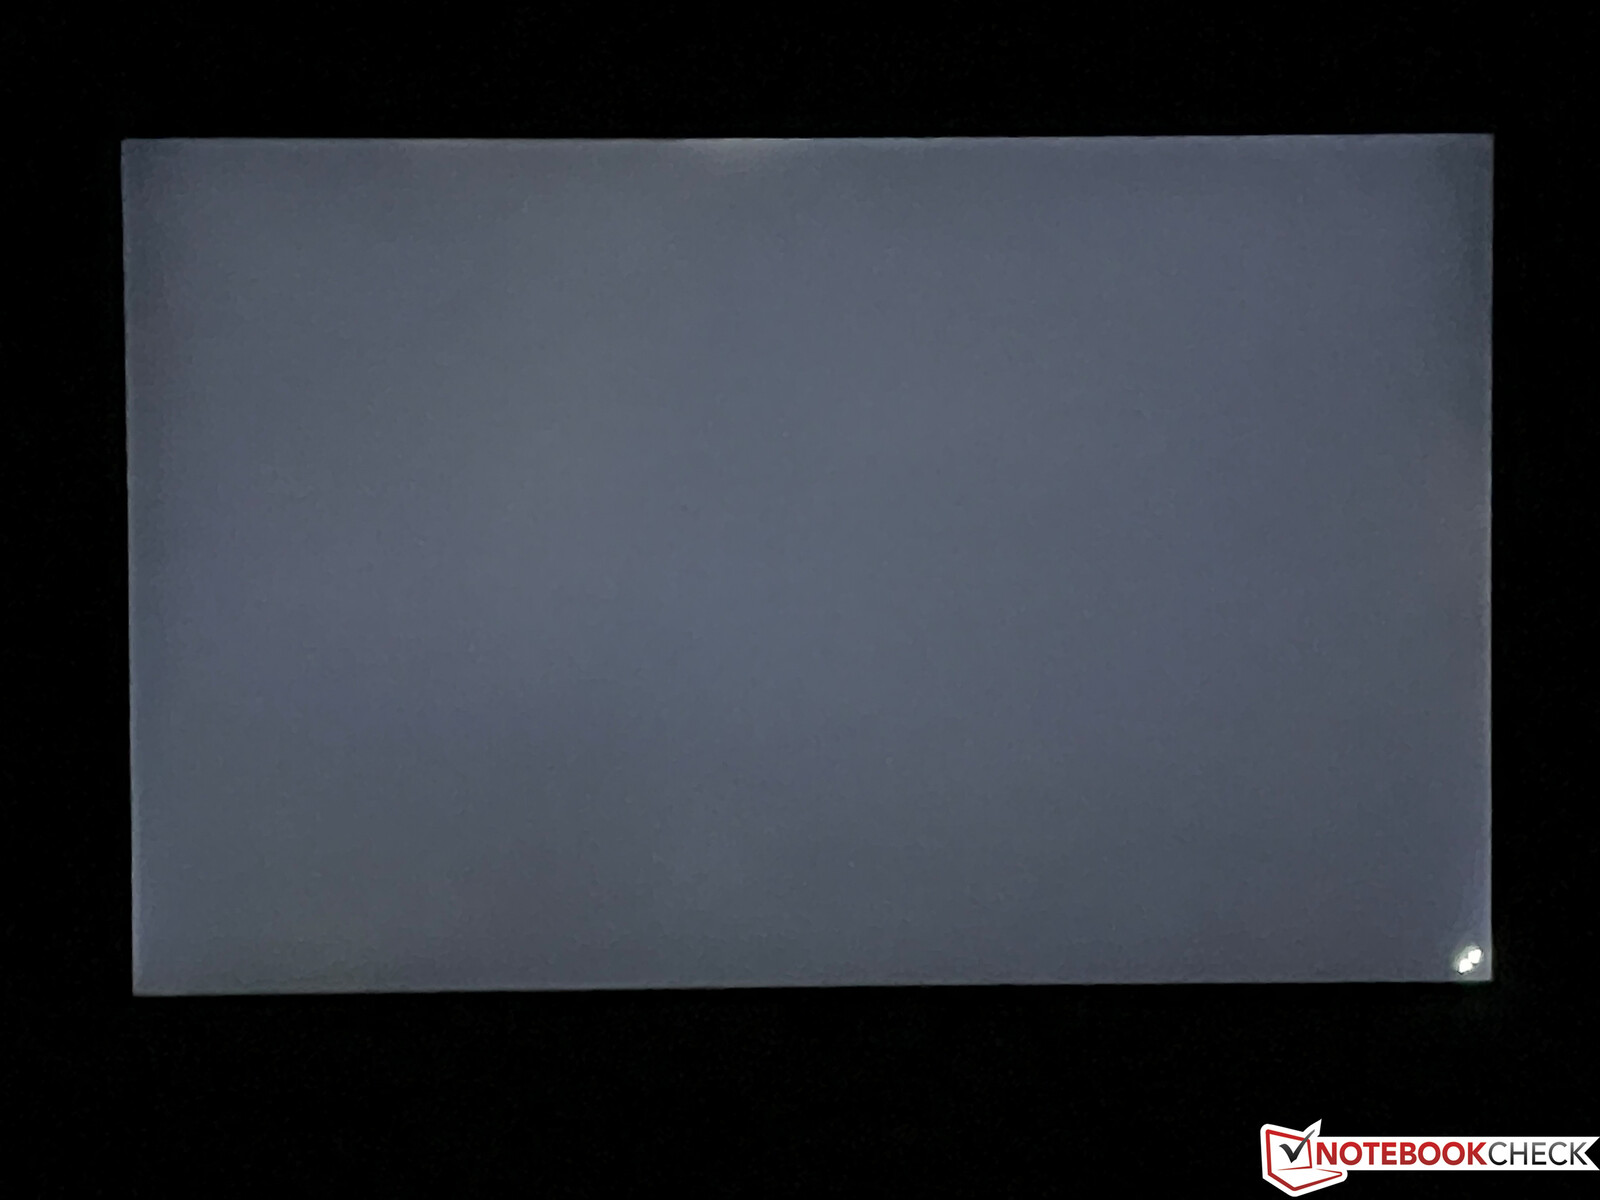
A impressão subjetiva da imagem é muito boa, e mesmo as áreas brilhantes não parecem muito granulosas. O predecessor foi ligeiramente mais problemático a este respeito (veja as imagens subpixel para comparação). Não há cintilação PWM e, apesar do alto brilho, o sangramento da tela também não é um problema. Observamos apenas uma área minimamente mais brilhante na borda superior. Na prática, a luminosidade pode ser controlada confortavelmente pelo sensor automático de luminosidade. A estabilidade do ângulo de visão do painel IPS é muito boa. O que é problemático é o tempo de resposta lento que também pode levar a fantasmas visíveis na prática.
| |||||||||||||||||||||||||
iluminação: 91 %
iluminação com acumulador: 634 cd/m²
Contraste: 2179:1 (Preto: 0.29 cd/m²)
ΔE ColorChecker Calman: 3.5 | ∀{0.5-29.43 Ø4.72}
calibrated: 2
ΔE Greyscale Calman: 5 | ∀{0.09-98 Ø4.97}
79.1% AdobeRGB 1998 (Argyll 3D)
100% sRGB (Argyll 3D)
80.9% Display P3 (Argyll 3D)
Gamma: 2.26
CCT: 7033 K
| Dell XPS 15 9510 i5 11400H FHD Sharp LQ156N1, IPS, 1920x1200, 15.6" | Huawei MateBook 14s i7 CSOTT3 U17B MNE208ZA1-3, LTPS, 2520x1680, 14.2" | Acer Swift 3 SF316-51 Chi Mei CMN160B, IPS, 1920x1080, 16.1" | Honor MagicBook Pro (AMD) N161HCA-EA3, IPS, 1920x1080, 16.1" | Dell XPS 15 9500 Core i5 Sharp LQ156N1, IPS, 1920x1200, 15.6" | Dell XPS 15 9510 11800H RTX 3050 Ti OLED SDC414D, OLED, 3456x2160, 15.6" | Schenker Vision 15 BOE08F5, IPS, 1920x1080, 15.6" | |
|---|---|---|---|---|---|---|---|
| Display | -10% | -10% | -20% | 1% | 16% | -10% | |
| Display P3 Coverage (%) | 80.9 | 67.8 -16% | 66.6 -18% | 67.5 -17% | 81.5 1% | 99.9 23% | 69.3 -14% |
| sRGB Coverage (%) | 100 | 98.3 -2% | 99.5 0% | 69.7 -30% | 100 0% | 100 0% | 94 -6% |
| AdobeRGB 1998 Coverage (%) | 79.1 | 70.1 -11% | 68.5 -13% | 69.7 -12% | 79.6 1% | 98.1 24% | 70.8 -10% |
| Response Times | 42% | 49% | 37% | 30% | 94% | 2% | |
| Response Time Grey 50% / Grey 80% * (ms) | 62.4 ? | 37.6 ? 40% | 32 ? 49% | 37.6 ? 40% | 42 ? 33% | 3.6 ? 94% | 60 ? 4% |
| Response Time Black / White * (ms) | 38.8 ? | 21.6 ? 44% | 20 ? 48% | 25.6 ? 34% | 28.8 ? 26% | 2.8 ? 93% | 39 ? -1% |
| PWM Frequency (Hz) | 27780 ? | 2500 ? | 25250 ? | 59.5 ? | |||
| Screen | 14% | 9% | 24% | -8% | 34% | -8% | |
| Brightness middle (cd/m²) | 632 | 419 -34% | 304 -52% | 337 -47% | 592 -6% | 362 -43% | 478 -24% |
| Brightness (cd/m²) | 606 | 407 -33% | 284 -53% | 312 -49% | 565 -7% | 367 -39% | 462 -24% |
| Brightness Distribution (%) | 91 | 93 2% | 88 -3% | 89 -2% | 85 -7% | 97 7% | 94 3% |
| Black Level * (cd/m²) | 0.29 | 0.23 21% | 0.165 43% | 0.2 31% | 0.46 -59% | 0.06 79% | 0.27 7% |
| Contrast (:1) | 2179 | 1822 -16% | 1842 -15% | 1685 -23% | 1287 -41% | 6033 177% | 1770 -19% |
| Colorchecker dE 2000 * | 3.5 | 1.9 46% | 1.44 59% | 0.8 77% | 3.19 9% | 2.1 40% | 3.2 9% |
| Colorchecker dE 2000 max. * | 6.4 | 3.6 44% | 3.62 43% | 1.1 83% | 5.45 15% | 4.1 36% | 8.4 -31% |
| Colorchecker dE 2000 calibrated * | 2 | 0.9 55% | 0.7 65% | 2.03 -1% | 2.5 -25% | 2 -0% | |
| Greyscale dE 2000 * | 5 | 2.9 42% | 2.6 48% | 1 80% | 3.9 22% | 1.4 72% | 4.5 10% |
| Gamma | 2.26 97% | 2.14 103% | 2.41 91% | 2.2 100% | 2.25 98% | 2.18 101% | 2.16 102% |
| CCT | 7033 92% | 6733 97% | 6527 100% | 6538 99% | 6522 100% | 6608 98% | 6788 96% |
| Color Space (Percent of AdobeRGB 1998) (%) | 68.5 | 63.8 | 71.6 | 63.1 | |||
| Color Space (Percent of sRGB) (%) | 99.5 | 99.5 | 100 | 93.6 | |||
| Média Total (Programa/Configurações) | 15% /
13% | 16% /
10% | 14% /
16% | 8% /
-1% | 48% /
38% | -5% /
-7% |
* ... menor é melhor
Exibir tempos de resposta
| ↔ Tempo de resposta preto para branco | ||
|---|---|---|
| 38.8 ms ... ascensão ↗ e queda ↘ combinadas | ↗ 20.8 ms ascensão | 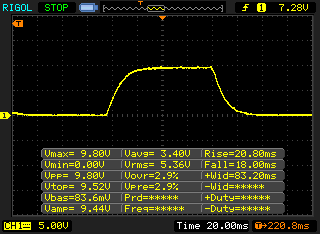 |
| ↘ 18 ms queda | ||
| A tela mostra taxas de resposta lentas em nossos testes e será insatisfatória para os jogadores. Em comparação, todos os dispositivos testados variam de 0.1 (mínimo) a 240 (máximo) ms. » 96 % de todos os dispositivos são melhores. Isso significa que o tempo de resposta medido é pior que a média de todos os dispositivos testados (19.9 ms). | ||
| ↔ Tempo de resposta 50% cinza a 80% cinza | ||
| 62.4 ms ... ascensão ↗ e queda ↘ combinadas | ↗ 31.6 ms ascensão | 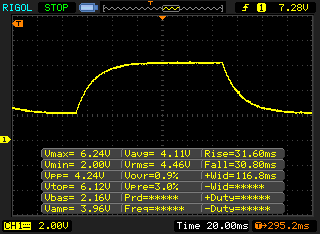 |
| ↘ 30.8 ms queda | ||
| A tela mostra taxas de resposta lentas em nossos testes e será insatisfatória para os jogadores. Em comparação, todos os dispositivos testados variam de 0.165 (mínimo) a 636 (máximo) ms. » 97 % de todos os dispositivos são melhores. Isso significa que o tempo de resposta medido é pior que a média de todos os dispositivos testados (31.1 ms). | ||
Cintilação da tela / PWM (modulação por largura de pulso)
| Tela tremeluzindo / PWM não detectado | 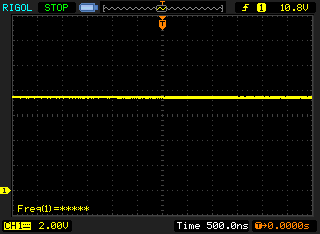 | ||
[pwm_comparison] Em comparação: 52 % de todos os dispositivos testados não usam PWM para escurecer a tela. Se PWM foi detectado, uma média de 7784 (mínimo: 5 - máximo: 343500) Hz foi medida. | |||
No estado de entrega, o painel não está particularmente bem calibrado, e há uma leve tonalidade verde em combinação com a temperatura da cor sendo muito fria. Nossa análise com o software profissional CalMAN e o Colorímetro X-Rite i1 Pro 2 também mostra desvios de cor que são ligeiramente altos demais. Com nossa calibração (perfil disponível para download gratuito na caixa de informações acima), somos capazes de melhorar a reprodução da escala de cinza em particular e também eliminar a tonalidade da cor. Os desvios de cor do espaço de cor de referência sRGB (que é completamente coberto pelo painel) também são reduzidos. Há apenas duas cores (100% vermelho e azul) que ainda estão minimamente acima do importante valor alvo de 3. No entanto, o painel ainda é adequado para o processamento de imagens.
Graças ao seu alto brilho, a tela está completamente em seu elemento ao ar livre. Se você evitar reflexos diretos de fontes de luz, você também pode usar o XPS 15 sem qualquer problema em ambientes muito brilhantes.
Desempenho - Tiger Lake H com 6 núcleos
O modelo básico é adequado principalmente para usuários que estão procurando um grande laptop multimídia e não querem usá-lo para jogos. A Dell equipou-o com um processador Intel Tiger Lake-H atual, que normalmente é executado em um TDP de 45 watts. Como o resfriamento é idêntico ao modelo high-end, isto não deve realmente criar nenhum problema. Entretanto, a Dell ainda decidiu executar o processador a apenas cerca de 40 watts, o que não podemos explicar. Com 8 GB, a quantidade de memória de trabalho também está no lado pequeno. Embora você possa facilmente atualizá-la com a disponibilidade de dois slots SODIMM, já que a Dell usa dois módulos de 4 GB, você tem que pagar mais dinheiro para substituí-los por 16 GB, por exemplo.
O Dell Power Manager pré-instalado também oferece a opção de ativar o modo Ultra Performance, mas veremos em um momento porque isto não tem muito efeito. As seguintes referências e medidas foram realizadas com a configuração padrão Otimizada.
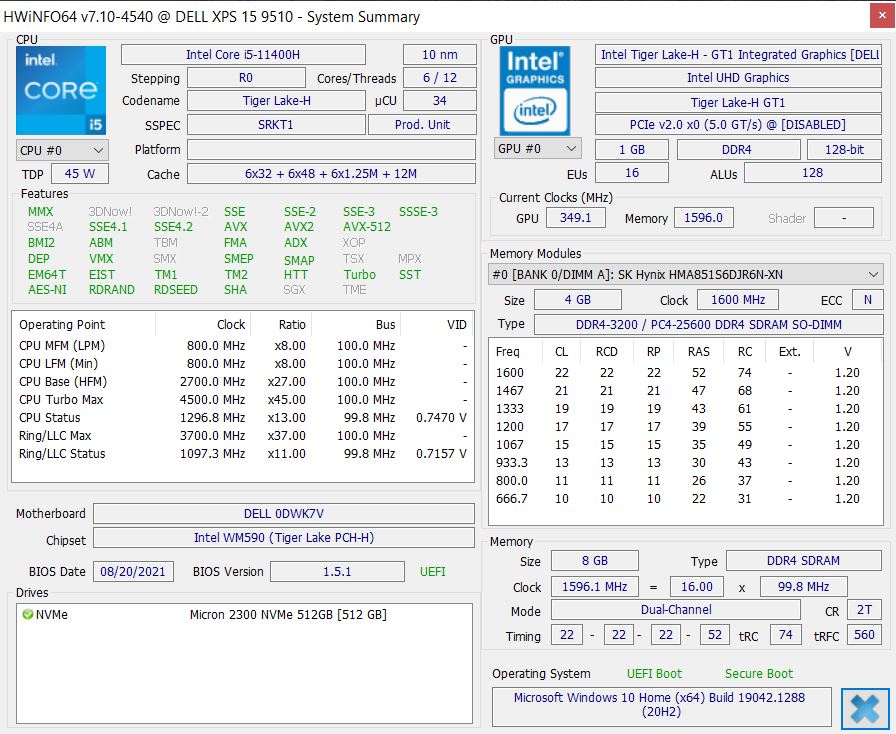
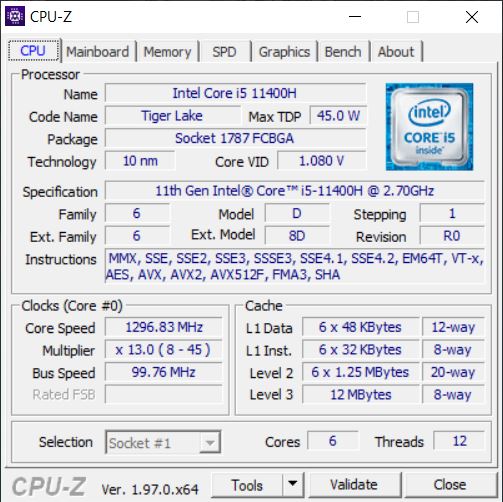
Processador - Núcleo i5-11400H
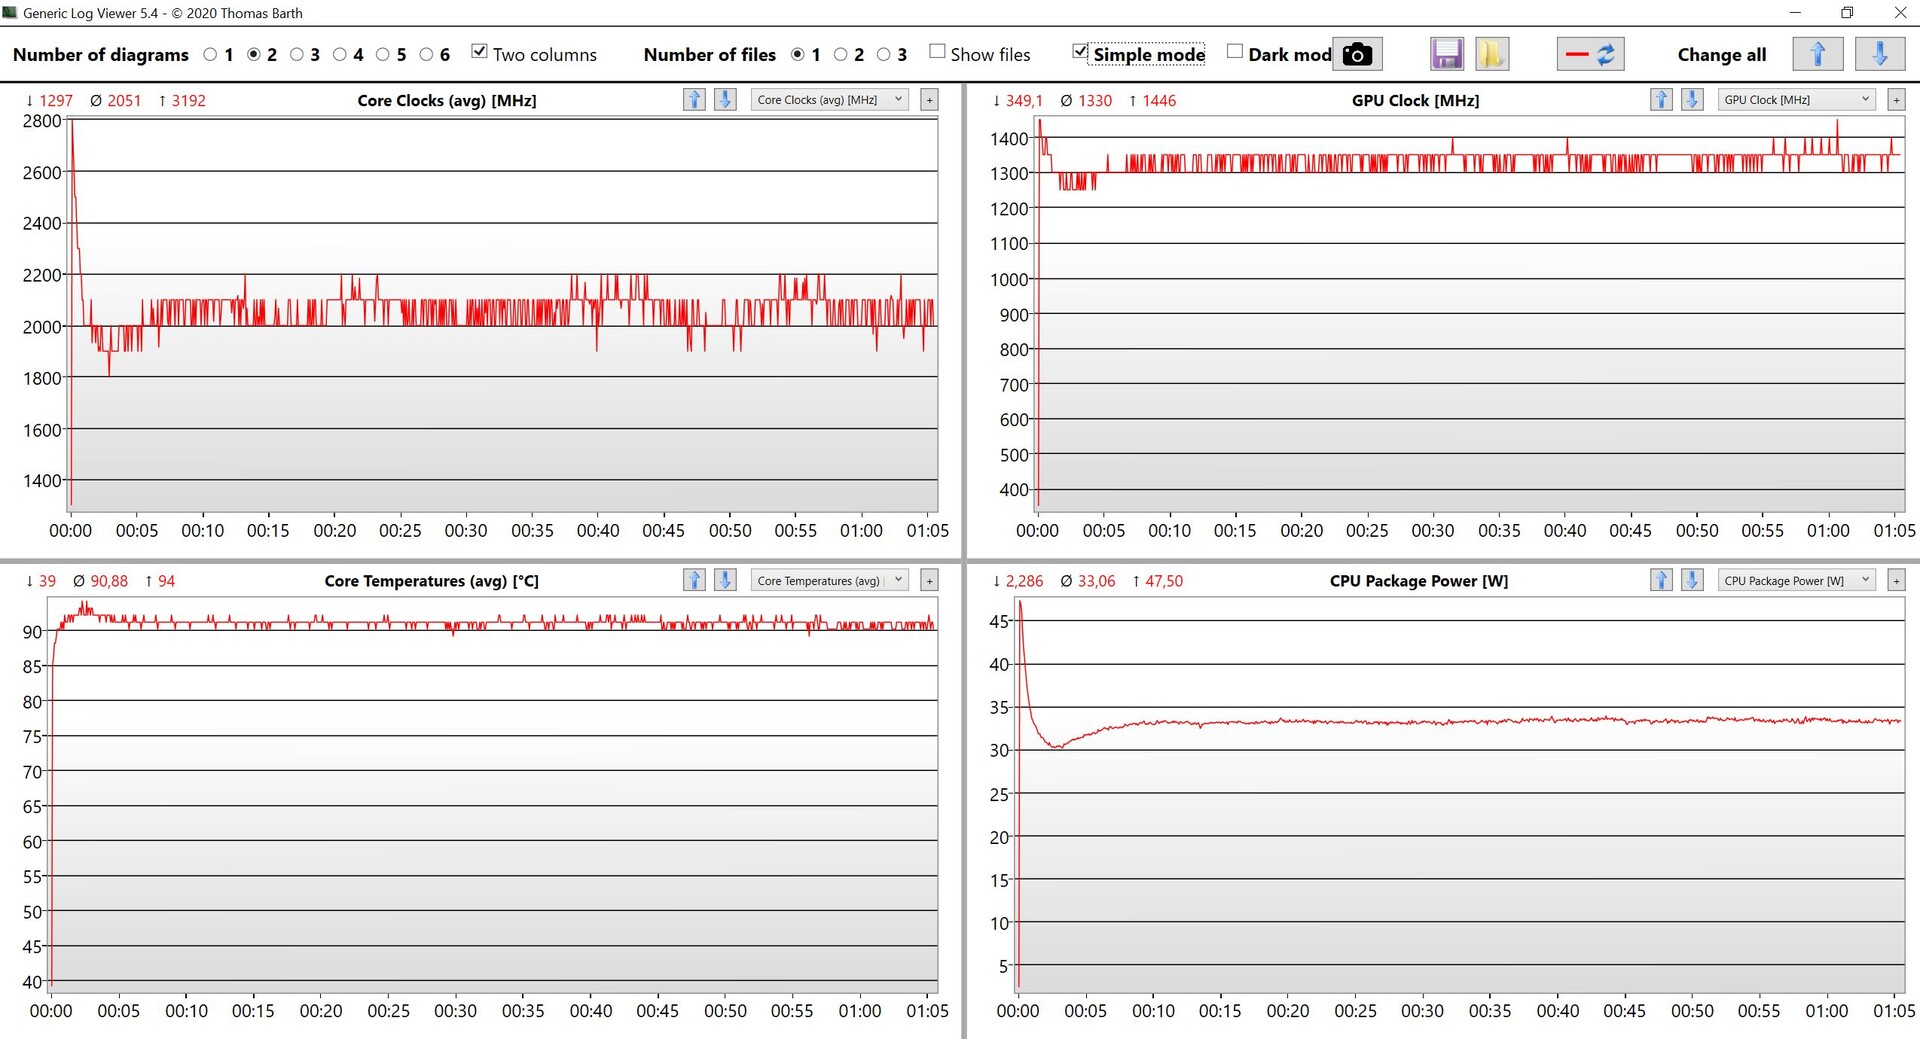
ONúcleo i5-11400Hé um processador hexacore capaz de atingir uma velocidade máxima de 4,5 GHz em um único núcleo e 4,1 GHz em todos os núcleos. No início, o processador se aproxima da marca de 50 watts, mas então ele se estabiliza rapidamente abaixo de 40 watts (ou a 40 watts no modo Ultra Performance). Devido ao resfriamento potente, teríamos esperado que ele fosse capaz de utilizar todo o potencial do núcleo i5-11400H.
Em comparação com os antigos Núcleo i5-10300H(quadcore) noXPS 15 9500Há uma vantagem de desempenho de cerca de 30%, mas o novo processador hexacore não é mais rápido do que o Núcleo i7-11370Hprocessador quadcore no MateBook 14s. O novoHuawei MateBook 16também mostra de forma impressionante o que é possível com um processador Ryzen atual de 45 watts da AMD (~70% mais rápido, em média, nos testes múltiplos @54 watts). Embora o desempenho seja, obviamente, completamente suficiente para as tarefas diárias, há claramente algum potencial desperdiçado aqui.
Na operação por bateria, o TDP é baixado para apenas 15 watts, fazendo com que o desempenho da CPU caia cerca de 50% nos testes multi-core (579 pontos @ CB R15 Multi). Você pode encontrar referências adicionais em nosso seção técnica.
Cinebench R15 Multi Constant Load Test
Cinebench R20: CPU (Multi Core) | CPU (Single Core)
Cinebench R15: CPU Multi 64Bit | CPU Single 64Bit
Blender: v2.79 BMW27 CPU
7-Zip 18.03: 7z b 4 | 7z b 4 -mmt1
Geekbench 5.5: Multi-Core | Single-Core
HWBOT x265 Benchmark v2.2: 4k Preset
LibreOffice : 20 Documents To PDF
R Benchmark 2.5: Overall mean
| Cinebench R23 / Multi Core | |
| Média da turma Multimedia (4861 - 33362, n=80, últimos 2 anos) | |
| Dell XPS 15 9510 11800H RTX 3050 Ti OLED | |
| Média Intel Core i5-11400H (6674 - 9406, n=7) | |
| Dell XPS 15 9510 i5 11400H FHD | |
| Huawei MateBook 14s i7 | |
| Acer Swift 3 SF316-51 | |
| Schenker Vision 15 | |
| Cinebench R23 / Single Core | |
| Média da turma Multimedia (1128 - 2459, n=72, últimos 2 anos) | |
| Acer Swift 3 SF316-51 | |
| Huawei MateBook 14s i7 | |
| Dell XPS 15 9510 11800H RTX 3050 Ti OLED | |
| Média Intel Core i5-11400H (1349 - 1472, n=6) | |
| Dell XPS 15 9510 i5 11400H FHD | |
| Schenker Vision 15 | |
| Cinebench R20 / CPU (Multi Core) | |
| Média da turma Multimedia (1887 - 12912, n=63, últimos 2 anos) | |
| Dell XPS 15 9510 11800H RTX 3050 Ti OLED | |
| Honor MagicBook Pro (AMD) | |
| Média Intel Core i5-11400H (2550 - 3740, n=7) | |
| Dell XPS 15 9510 i5 11400H FHD | |
| Huawei MateBook 14s i7 | |
| Acer Swift 3 SF316-51 | |
| Dell XPS 15 9500 Core i5 | |
| Schenker Vision 15 | |
| Cinebench R20 / CPU (Single Core) | |
| Média da turma Multimedia (425 - 853, n=63, últimos 2 anos) | |
| Acer Swift 3 SF316-51 | |
| Huawei MateBook 14s i7 | |
| Dell XPS 15 9510 11800H RTX 3050 Ti OLED | |
| Dell XPS 15 9510 i5 11400H FHD | |
| Média Intel Core i5-11400H (522 - 569, n=6) | |
| Schenker Vision 15 | |
| Honor MagicBook Pro (AMD) | |
| Dell XPS 15 9500 Core i5 | |
| Cinebench R15 / CPU Multi 64Bit | |
| Média da turma Multimedia (856 - 5224, n=67, últimos 2 anos) | |
| Dell XPS 15 9510 11800H RTX 3050 Ti OLED | |
| Dell XPS 15 9510 11800H RTX 3050 Ti OLED | |
| Honor MagicBook Pro (AMD) | |
| Média Intel Core i5-11400H (1014 - 1532, n=7) | |
| Dell XPS 15 9510 i5 11400H FHD | |
| Dell XPS 15 9510 i5 11400H FHD | |
| Huawei MateBook 14s i7 | |
| Schenker Vision 15 | |
| Acer Swift 3 SF316-51 | |
| Dell XPS 15 9500 Core i5 | |
| Cinebench R15 / CPU Single 64Bit | |
| Média da turma Multimedia (184.8 - 326, n=65, últimos 2 anos) | |
| Huawei MateBook 14s i7 | |
| Acer Swift 3 SF316-51 | |
| Schenker Vision 15 | |
| Dell XPS 15 9510 11800H RTX 3050 Ti OLED | |
| Média Intel Core i5-11400H (202 - 219, n=6) | |
| Dell XPS 15 9510 i5 11400H FHD | |
| Dell XPS 15 9500 Core i5 | |
| Honor MagicBook Pro (AMD) | |
| Blender / v2.79 BMW27 CPU | |
| Schenker Vision 15 | |
| Dell XPS 15 9500 Core i5 | |
| Acer Swift 3 SF316-51 | |
| Huawei MateBook 14s i7 | |
| Dell XPS 15 9510 i5 11400H FHD | |
| Média Intel Core i5-11400H (340 - 483, n=6) | |
| Honor MagicBook Pro (AMD) | |
| Dell XPS 15 9510 11800H RTX 3050 Ti OLED | |
| Média da turma Multimedia (100 - 557, n=64, últimos 2 anos) | |
| 7-Zip 18.03 / 7z b 4 | |
| Média da turma Multimedia (29095 - 130368, n=61, últimos 2 anos) | |
| Dell XPS 15 9510 11800H RTX 3050 Ti OLED | |
| Honor MagicBook Pro (AMD) | |
| Média Intel Core i5-11400H (27615 - 40268, n=6) | |
| Dell XPS 15 9510 i5 11400H FHD | |
| Huawei MateBook 14s i7 | |
| Acer Swift 3 SF316-51 | |
| Schenker Vision 15 | |
| Dell XPS 15 9500 Core i5 | |
| 7-Zip 18.03 / 7z b 4 -mmt1 | |
| Média da turma Multimedia (3666 - 7545, n=62, últimos 2 anos) | |
| Dell XPS 15 9510 11800H RTX 3050 Ti OLED | |
| Acer Swift 3 SF316-51 | |
| Huawei MateBook 14s i7 | |
| Média Intel Core i5-11400H (4802 - 5343, n=6) | |
| Schenker Vision 15 | |
| Dell XPS 15 9510 i5 11400H FHD | |
| Dell XPS 15 9500 Core i5 | |
| Honor MagicBook Pro (AMD) | |
| Geekbench 5.5 / Multi-Core | |
| Média da turma Multimedia (4652 - 20422, n=61, últimos 2 anos) | |
| Dell XPS 15 9510 11800H RTX 3050 Ti OLED | |
| Média Intel Core i5-11400H (4679 - 7018, n=7) | |
| Acer Swift 3 SF316-51 | |
| Honor MagicBook Pro (AMD) | |
| Huawei MateBook 14s i7 | |
| Dell XPS 15 9510 i5 11400H FHD | |
| Schenker Vision 15 | |
| Dell XPS 15 9500 Core i5 | |
| Geekbench 5.5 / Single-Core | |
| Média da turma Multimedia (805 - 2974, n=61, últimos 2 anos) | |
| Acer Swift 3 SF316-51 | |
| Huawei MateBook 14s i7 | |
| Schenker Vision 15 | |
| Dell XPS 15 9510 11800H RTX 3050 Ti OLED | |
| Dell XPS 15 9510 i5 11400H FHD | |
| Média Intel Core i5-11400H (1396 - 1528, n=7) | |
| Dell XPS 15 9500 Core i5 | |
| Honor MagicBook Pro (AMD) | |
| HWBOT x265 Benchmark v2.2 / 4k Preset | |
| Média da turma Multimedia (5.26 - 36.1, n=62, últimos 2 anos) | |
| Dell XPS 15 9510 11800H RTX 3050 Ti OLED | |
| Honor MagicBook Pro (AMD) | |
| Média Intel Core i5-11400H (8.19 - 11.3, n=6) | |
| Dell XPS 15 9510 i5 11400H FHD | |
| Huawei MateBook 14s i7 | |
| Acer Swift 3 SF316-51 | |
| Schenker Vision 15 | |
| Dell XPS 15 9500 Core i5 | |
| LibreOffice / 20 Documents To PDF | |
| Dell XPS 15 9500 Core i5 | |
| Honor MagicBook Pro (AMD) | |
| Média da turma Multimedia (23.9 - 146.7, n=63, últimos 2 anos) | |
| Dell XPS 15 9510 11800H RTX 3050 Ti OLED | |
| Média Intel Core i5-11400H (41.4 - 53, n=6) | |
| Dell XPS 15 9510 i5 11400H FHD | |
| Schenker Vision 15 | |
| Huawei MateBook 14s i7 | |
| Acer Swift 3 SF316-51 | |
| R Benchmark 2.5 / Overall mean | |
| Dell XPS 15 9500 Core i5 | |
| Honor MagicBook Pro (AMD) | |
| Média Intel Core i5-11400H (0.581 - 0.644, n=6) | |
| Dell XPS 15 9510 i5 11400H FHD | |
| Schenker Vision 15 | |
| Dell XPS 15 9510 11800H RTX 3050 Ti OLED | |
| Huawei MateBook 14s i7 | |
| Acer Swift 3 SF316-51 | |
| Média da turma Multimedia (0.3604 - 0.947, n=62, últimos 2 anos) | |
* ... menor é melhor
Desempenho do sistema
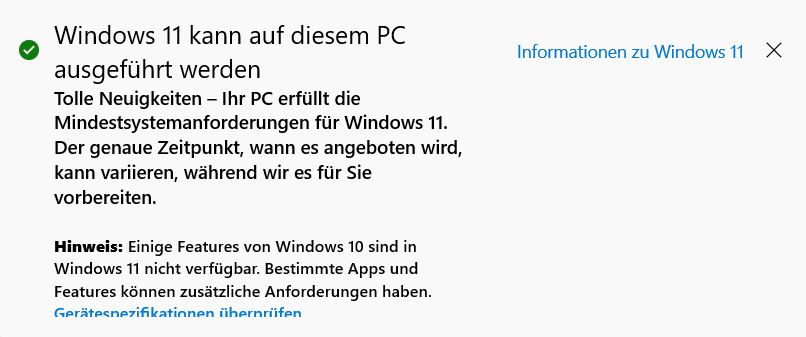
Devido à combinação CPU/iGPU relativamente fraca, o XPS 15 9510 mal se posiciona à frente do antigo XPS 15no final do grupo de comparação nos benchmarks sintéticos PCMark 10. Entretanto, nas tarefas cotidianas isto não é perceptível, e o XPS 15 é simplesmente um computador muito responsivo, o que, naturalmente, também se deve à rápida SSD PCIe. O XPS 15 9510 é compatível com o Windows 11.
| PCMark 10 / Score | |
| Média da turma Multimedia (4325 - 10386, n=57, últimos 2 anos) | |
| Dell XPS 15 9510 11800H RTX 3050 Ti OLED | |
| Acer Swift 3 SF316-51 | |
| Huawei MateBook 14s i7 | |
| Schenker Vision 15 | |
| Honor MagicBook Pro (AMD) | |
| Média Intel Core i5-11400H, Intel UHD Graphics Xe 16EUs (4502 - 4525, n=2) | |
| Dell XPS 15 9510 i5 11400H FHD | |
| Dell XPS 15 9500 Core i5 | |
| PCMark 10 / Essentials | |
| Huawei MateBook 14s i7 | |
| Schenker Vision 15 | |
| Média da turma Multimedia (8025 - 11664, n=56, últimos 2 anos) | |
| Acer Swift 3 SF316-51 | |
| Dell XPS 15 9500 Core i5 | |
| Dell XPS 15 9510 11800H RTX 3050 Ti OLED | |
| Média Intel Core i5-11400H, Intel UHD Graphics Xe 16EUs (9463 - 9513, n=2) | |
| Dell XPS 15 9510 i5 11400H FHD | |
| Honor MagicBook Pro (AMD) | |
| PCMark 10 / Productivity | |
| Média da turma Multimedia (7323 - 18233, n=56, últimos 2 anos) | |
| Dell XPS 15 9510 11800H RTX 3050 Ti OLED | |
| Acer Swift 3 SF316-51 | |
| Honor MagicBook Pro (AMD) | |
| Huawei MateBook 14s i7 | |
| Dell XPS 15 9500 Core i5 | |
| Schenker Vision 15 | |
| Média Intel Core i5-11400H, Intel UHD Graphics Xe 16EUs (6466 - 6495, n=2) | |
| Dell XPS 15 9510 i5 11400H FHD | |
| PCMark 10 / Digital Content Creation | |
| Média da turma Multimedia (3651 - 16240, n=56, últimos 2 anos) | |
| Dell XPS 15 9510 11800H RTX 3050 Ti OLED | |
| Acer Swift 3 SF316-51 | |
| Huawei MateBook 14s i7 | |
| Honor MagicBook Pro (AMD) | |
| Schenker Vision 15 | |
| Média Intel Core i5-11400H, Intel UHD Graphics Xe 16EUs (4047 - 4072, n=2) | |
| Dell XPS 15 9510 i5 11400H FHD | |
| Dell XPS 15 9500 Core i5 | |
| PCMark 10 Score | 4502 pontos | |
Ajuda | ||
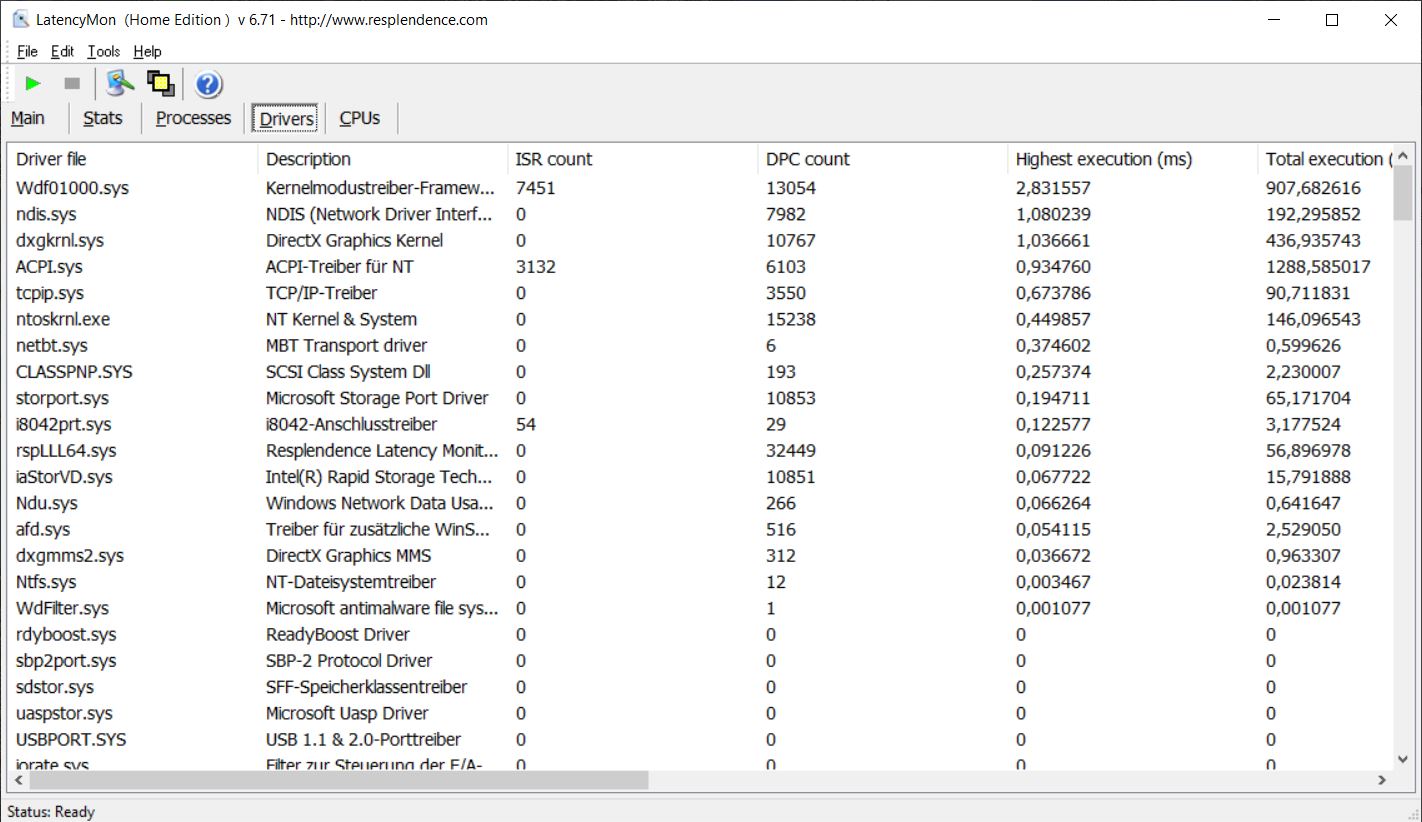
Latências DPC
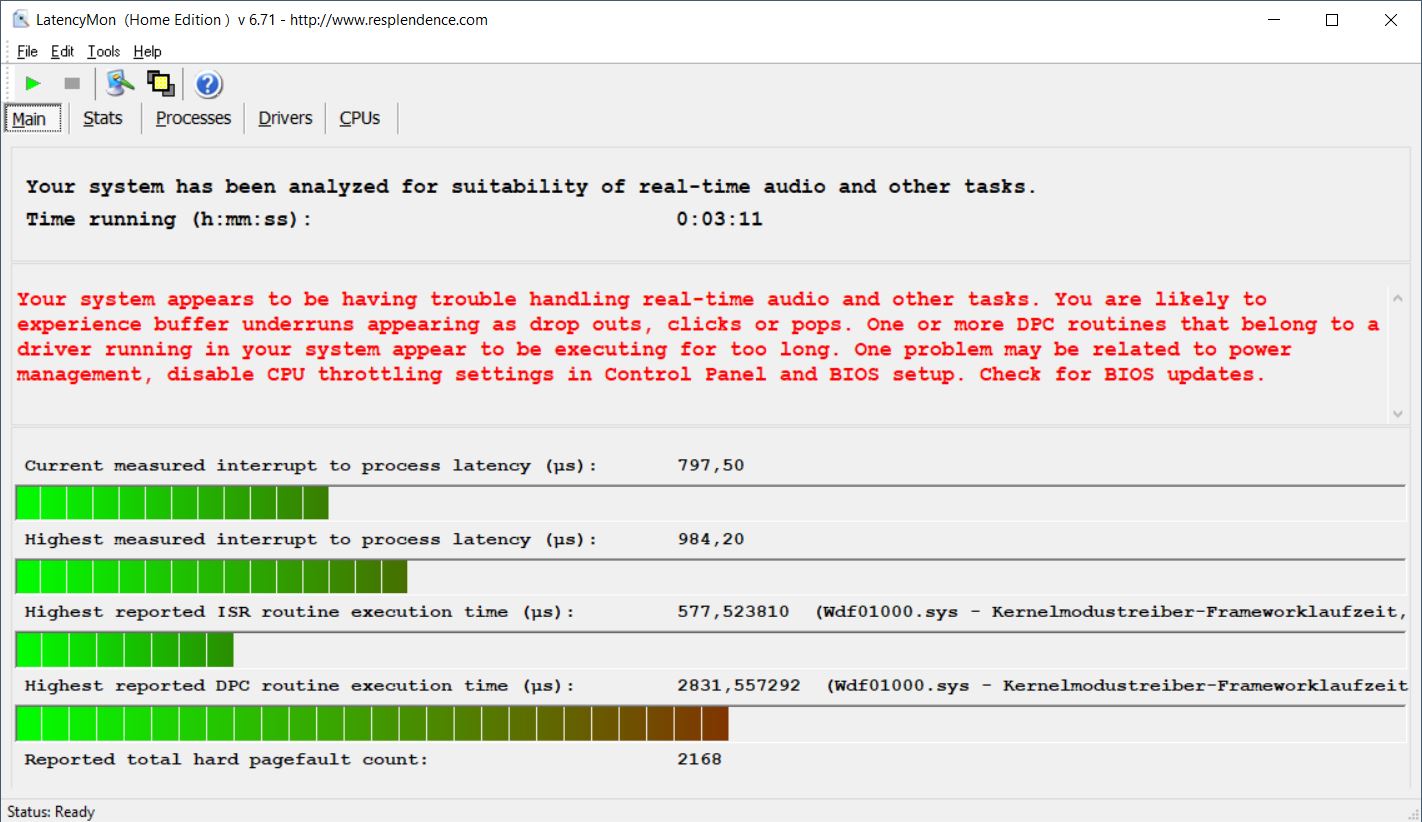
| DPC Latencies / LatencyMon - interrupt to process latency (max), Web, Youtube, Prime95 | |
| Schenker Vision 15 | |
| Dell XPS 15 9510 11800H RTX 3050 Ti OLED | |
| Dell XPS 15 9500 Core i5 | |
| Honor MagicBook Pro (AMD) | |
| Dell XPS 15 9510 i5 11400H FHD | |
| Huawei MateBook 14s i7 | |
| Acer Swift 3 SF316-51 | |
* ... menor é melhor
Solução de armazenamento
Nossa unidade de teste é equipada com um rápido SSD PCIe 3.0 da Micron, que oferece uma capacidade de armazenamento de 512 GB (411 GB disponíveis após ligá-lo pela primeira vez). Graças ao segundo slot M.2 2280, a capacidade de armazenamento pode ser facilmente expandida, se necessário. Você pode encontrar referências adicionais de SSD aqui.
| Dell XPS 15 9510 i5 11400H FHD Micron 2300 512GB MTFDHBA512TDV | Huawei MateBook 14s i7 Toshiba XG6 KXG60ZNV512G | Acer Swift 3 SF316-51 Micron 2210 MTFDHBA512QFD | Honor MagicBook Pro (AMD) WDC PC SN730 SDBPNTY-512G | Dell XPS 15 9500 Core i5 Toshiba KBG40ZNS256G NVMe | Dell XPS 15 9510 11800H RTX 3050 Ti OLED Micron 2300 512GB MTFDHBA512TDV | Schenker Vision 15 Samsung SSD 980 Pro 1TB MZ-V8P1T0BW | Média Micron 2300 512GB MTFDHBA512TDV | Média da turma Multimedia | |
|---|---|---|---|---|---|---|---|---|---|
| CrystalDiskMark 5.2 / 6 | 28% | -2% | -6% | -30% | -2% | 88% | -1% | 42% | |
| Write 4K (MB/s) | 110.3 | 209.4 90% | 171.8 56% | 156.9 42% | 93.3 -15% | 109.3 -1% | 238.1 116% | 105.5 ? -4% | 163.2 ? 48% |
| Read 4K (MB/s) | 57.1 | 56.8 -1% | 79.4 39% | 48.81 -15% | 45.9 -20% | 53.9 -6% | 79.2 39% | 51.2 ? -10% | 67.7 ? 19% |
| Write Seq (MB/s) | 1958 | 1099 -44% | 1050 -46% | 1211 -38% | 1991 2% | 4139 111% | 2041 ? 4% | 2694 ? 38% | |
| Read Seq (MB/s) | 1781 | 1847 4% | 2517 41% | 1633 -8% | 1759 -1% | 4133 132% | 1845 ? 4% | 3159 ? 77% | |
| Write 4K Q32T1 (MB/s) | 495.7 | 606 22% | 539 9% | 408.7 -18% | 273.1 -45% | 499.8 1% | 697 41% | 494 ? 0% | 456 ? -8% |
| Read 4K Q32T1 (MB/s) | 474.4 | 792 67% | 555 17% | 504 6% | 356 -25% | 438.8 -8% | 758 60% | 445 ? -6% | 580 ? 22% |
| Write Seq Q32T1 (MB/s) | 2839 | 2322 -18% | 1095 -61% | 1087 -62% | 1198 -58% | 2835 0% | 5187 83% | 2867 ? 1% | 4616 ? 63% |
| Read Seq Q32T1 (MB/s) | 3243 | 3511 8% | 1988 -39% | 3407 5% | 2269 -30% | 3235 0% | 7117 119% | 3272 ? 1% | 5814 ? 79% |
| Write 4K Q8T8 (MB/s) | 1573 | 1077 ? | |||||||
| Read 4K Q8T8 (MB/s) | 1202 | 1365 ? | |||||||
| AS SSD | 46% | 11% | 74% | -55% | -8% | 135% | 10% | 76% | |
| Seq Read (MB/s) | 2602 | 2961 14% | 2015 -23% | 2749 6% | 1423 -45% | 1362 -48% | 5427 109% | 2300 ? -12% | 4468 ? 72% |
| Seq Write (MB/s) | 976 | 2098 115% | 1055 8% | 2348 141% | 766 -22% | 1440 48% | 3886 298% | 1550 ? 59% | 3062 ? 214% |
| 4K Read (MB/s) | 42.99 | 53 23% | 73.9 72% | 44.22 3% | 42.21 -2% | 38.43 -11% | 72.9 70% | 45 ? 5% | 61.1 ? 42% |
| 4K Write (MB/s) | 127.1 | 186.9 47% | 223.2 76% | 140.5 11% | 74.8 -41% | 121.4 -4% | 219.3 73% | 106.6 ? -16% | 185.7 ? 46% |
| 4K-64 Read (MB/s) | 383.3 | 1131 195% | 589 54% | 1450 278% | 973 154% | 370.5 -3% | 2209 476% | 676 ? 76% | 1069 ? 179% |
| 4K-64 Write (MB/s) | 1346 | 1502 12% | 1029 -24% | 2346 74% | 218.8 -84% | 1054 -22% | 2265 68% | 1616 ? 20% | 2217 ? 65% |
| Access Time Read * (ms) | 0.037 | 0.029 22% | 0.056 -51% | 0.079 -114% | 0.125 -238% | 0.042 -14% | 0.033 11% | 0.059 ? -59% | 0.05738 ? -55% |
| Access Time Write * (ms) | 0.117 | 0.026 78% | 0.039 67% | 0.027 77% | 0.552 -372% | 0.135 -15% | 0.02 83% | 0.1807 ? -54% | 0.07592 ? 35% |
| Score Read (Points) | 687 | 1480 115% | 865 26% | 1769 157% | 1157 68% | 545 -21% | 2825 311% | 952 ? 39% | 1577 ? 130% |
| Score Write (Points) | 1571 | 1899 21% | 1358 -14% | 2721 73% | 370 -76% | 1319 -16% | 2873 83% | 1877 ? 19% | 2709 ? 72% |
| Score Total (Points) | 2541 | 4102 61% | 2644 4% | 5376 112% | 2094 -18% | 2160 -15% | 7069 178% | 3290 ? 29% | 5035 ? 98% |
| Copy ISO MB/s (MB/s) | 1074 | 1512 41% | 1186 10% | 1151 7% | 1406 31% | 2775 158% | 1603 ? 49% | 2821 ? 163% | |
| Copy Program MB/s (MB/s) | 874 | 376.3 -57% | 782 -11% | 499.4 -43% | 844 -3% | 662 -24% | 843 ? -4% | 863 ? -1% | |
| Copy Game MB/s (MB/s) | 1805 | 1115 -38% | 1028 -43% | 733 -59% | 1353 -25% | 1655 -8% | 1570 ? -13% | 1749 ? -3% | |
| Média Total (Programa/Configurações) | 37% /
41% | 5% /
6% | 34% /
41% | -43% /
-46% | -5% /
-6% | 112% /
118% | 5% /
6% | 59% /
63% |
* ... menor é melhor

Constant Performance Reading: DiskSpd Read Loop, Queue Depth 8
Placa Gráfica
A maior diferença entre as CPUs i5-11400H e outras Tiger Lake H45 é a GPU integrada, uma vez que há apenas um chip gráfico fino UHD Graphics Xe com 16 EUs (Core i7-11800H: 32 EUs, Core i7-11370H: 96 EUs). O desempenho gráfico puro está, portanto, apenas no nível do antigo XPS 15 9500 com oUHD Graphics 630Embora a RAM de dois canais já seja utilizada. A única vantagem do novo iGPU é o decodificador de vídeo melhorado da geração Tiger Lake, que reduz significativamente a carga da GPU durante a reprodução de vídeo 4K (~30% vs. 60% para o antigo UHD Graphics 630).
Com esta configuração, o XPS 15 dificilmente é adequado para jogos, e muitos jogos não funcionam bem mesmo com o mínimo de detalhes. Aqueles que ainda querem jogar devem se concentrar em jogos simples da loja do Windows.
A performance gráfica permanece estável sob carga constante, assim como durante a operação com bateria. Você pode encontrar referências adicionais aqui.
| 3DMark 06 Standard Score | 12803 pontos | |
| 3DMark Vantage P Result | 7609 pontos | |
| 3DMark 11 Performance | 1979 pontos | |
| 3DMark Ice Storm Standard Score | 57212 pontos | |
| 3DMark Cloud Gate Standard Score | 10288 pontos | |
| 3DMark Fire Strike Score | 1298 pontos | |
| 3DMark Time Spy Score | 433 pontos | |
Ajuda | ||
| baixo | média | alto | ultra | |
|---|---|---|---|---|
| GTA V (2015) | 62.8 | 50 | 9.2 | |
| The Witcher 3 (2015) | 27 | 17 | 9 | 5 |
| Dota 2 Reborn (2015) | 108 | 57 | 23.1 | 21.5 |
| Final Fantasy XV Benchmark (2018) | 14.6 | 6.87 | 4.79 | |
| X-Plane 11.11 (2018) | 18.4 | 16.8 | 15.4 | |
| Strange Brigade (2018) | 31 | 12 | 11 | 7 |
| F1 2020 (2020) | 26 | 12 | ||
| F1 2021 (2021) | 34 |
Emissions and Power
Emissões sonoras
A vantagem do baixo desempenho reside nos ventiladores silenciosos que você praticamente nunca ouve no dia-a-dia (navegando na Internet, streaming de vídeo). Mesmo sob carga máxima, leva alguns minutos até que o nível máximo de quase 38 dB(A) seja alcançado. Não notamos nenhum outro ruído eletrônico, como choro de bobina.
Barulho
| Ocioso |
| 24.4 / 24.4 / 24.4 dB |
| Carga |
| 26.1 / 37.7 dB |
 | ||
30 dB silencioso 40 dB(A) audível 50 dB(A) ruidosamente alto |
||
min: | ||
| Dell XPS 15 9510 i5 11400H FHD UHD Graphics Xe 16EUs, i5-11400H, Micron 2300 512GB MTFDHBA512TDV | Huawei MateBook 14s i7 Iris Xe G7 96EUs, i7-11370H, Toshiba XG6 KXG60ZNV512G | Acer Swift 3 SF316-51 Iris Xe G7 96EUs, i7-11370H, Micron 2210 MTFDHBA512QFD | Honor MagicBook Pro (AMD) Vega 6, R5 4600H, WDC PC SN730 SDBPNTY-512G | Dell XPS 15 9500 Core i5 UHD Graphics 630, i5-10300H, Toshiba KBG40ZNS256G NVMe | Dell XPS 15 9510 11800H RTX 3050 Ti OLED GeForce RTX 3050 Ti Laptop GPU, i7-11800H, Micron 2300 512GB MTFDHBA512TDV | Schenker Vision 15 Iris Xe G7 96EUs, i7-1165G7, Samsung SSD 980 Pro 1TB MZ-V8P1T0BW | |
|---|---|---|---|---|---|---|---|
| Noise | -8% | -11% | -14% | -13% | -6% | -25% | |
| desligado / ambiente * (dB) | 24.4 | 24.3 -0% | 26 -7% | 29.7 -22% | 28 -15% | 23.8 2% | 29.8 -22% |
| Idle Minimum * (dB) | 24.4 | 24.3 -0% | 26 -7% | 29.7 -22% | 28 -15% | 23.8 2% | 29.8 -22% |
| Idle Average * (dB) | 24.4 | 24.3 -0% | 26 -7% | 29.7 -22% | 28 -15% | 23.8 2% | 29.8 -22% |
| Idle Maximum * (dB) | 24.4 | 28.4 -16% | 27.7 -14% | 30.5 -25% | 28 -15% | 23.8 2% | 31.1 -27% |
| Load Average * (dB) | 26.1 | 31.7 -21% | 32.7 -25% | 31 -19% | 28 -7% | 36 -38% | 40.5 -55% |
| Witcher 3 ultra * (dB) | 33.2 | 31.7 5% | 31.3 6% | 36 -8% | 40.5 -22% | ||
| Load Maximum * (dB) | 37.7 | 46.8 -24% | 39 -3% | 36.7 3% | 41.9 -11% | 38.2 -1% | 40.5 -7% |
* ... menor é melhor
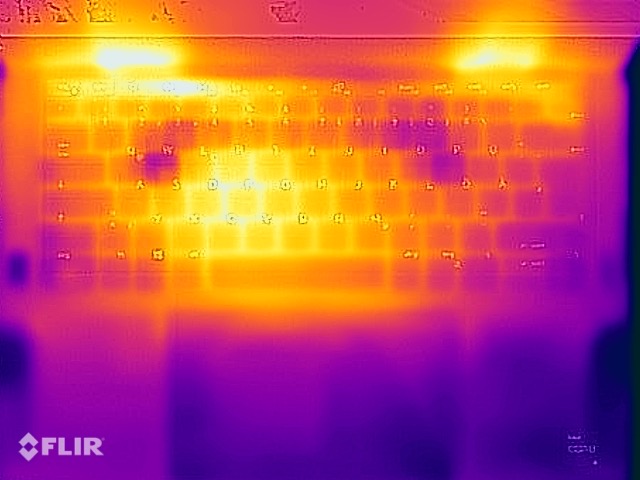
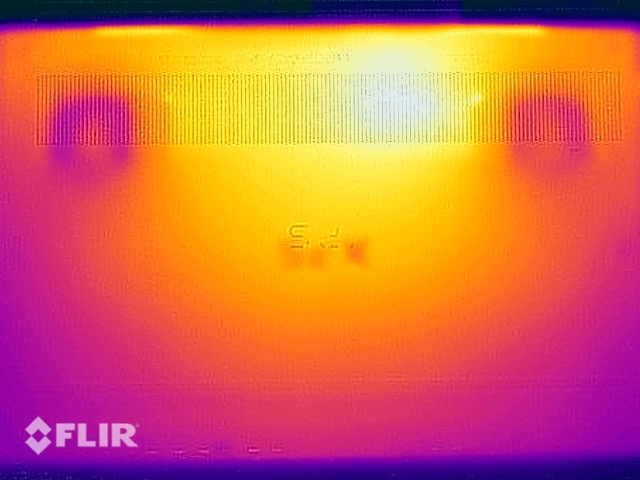
Temperatura
As temperaturas de superfície não dão motivo de preocupação em nenhuma situação, e você pode colocar seu computador sobre seu colo mesmo sob carga. Durante o teste de estresse, o desempenho é ainda mais reduzido, e ele se eleva a apenas 34 watts (CPU: ~2 GHz, iGPU: ~1,3 GHz), o que novamente é muito pouco.
(±) A temperatura máxima no lado superior é 42.8 °C / 109 F, em comparação com a média de 36.8 °C / 98 F , variando de 21 a 71 °C para a classe Multimedia.
(±) A parte inferior aquece até um máximo de 41.2 °C / 106 F, em comparação com a média de 39.1 °C / 102 F
(+) Em uso inativo, a temperatura média para o lado superior é 25.2 °C / 77 F, em comparação com a média do dispositivo de 31.3 °C / ### class_avg_f### F.
(±) Jogando The Witcher 3, a temperatura média para o lado superior é 34.5 °C / 94 F, em comparação com a média do dispositivo de 31.3 °C / ## #class_avg_f### F.
(+) Os apoios para as mãos e o touchpad são mais frios que a temperatura da pele, com um máximo de 31.5 °C / 88.7 F e, portanto, são frios ao toque.
(-) A temperatura média da área do apoio para as mãos de dispositivos semelhantes foi 28.7 °C / 83.7 F (-2.8 °C / -5 F).
Oradores
Dell XPS 15 9510 i5 11400H FHD análise de áudio
(+) | os alto-falantes podem tocar relativamente alto (###valor### dB)
Graves 100 - 315Hz
(±) | graves reduzidos - em média 5.6% menor que a mediana
(+) | o baixo é linear (4.3% delta para a frequência anterior)
Médios 400 - 2.000 Hz
(+) | médios equilibrados - apenas 3.9% longe da mediana
(+) | médios são lineares (4.1% delta para frequência anterior)
Altos 2 - 16 kHz
(+) | agudos equilibrados - apenas 2.4% longe da mediana
(+) | os máximos são lineares (4.9% delta da frequência anterior)
Geral 100 - 16.000 Hz
(+) | o som geral é linear (8.4% diferença em relação à mediana)
Comparado com a mesma classe
» 9% de todos os dispositivos testados nesta classe foram melhores, 2% semelhantes, 89% piores
» O melhor teve um delta de 5%, a média foi 17%, o pior foi 45%
Comparado com todos os dispositivos testados
» 2% de todos os dispositivos testados foram melhores, 1% semelhantes, 97% piores
» O melhor teve um delta de 4%, a média foi 24%, o pior foi 134%
Acer Swift 3 SF316-51 análise de áudio
(±) | o volume do alto-falante é médio, mas bom (###valor### dB)
Graves 100 - 315Hz
(-) | quase nenhum baixo - em média 25.5% menor que a mediana
(±) | a linearidade dos graves é média (12.1% delta para a frequência anterior)
Médios 400 - 2.000 Hz
(+) | médios equilibrados - apenas 2.7% longe da mediana
(+) | médios são lineares (5.2% delta para frequência anterior)
Altos 2 - 16 kHz
(+) | agudos equilibrados - apenas 3.8% longe da mediana
(+) | os máximos são lineares (2.9% delta da frequência anterior)
Geral 100 - 16.000 Hz
(±) | a linearidade do som geral é média (17.7% diferença em relação à mediana)
Comparado com a mesma classe
» 51% de todos os dispositivos testados nesta classe foram melhores, 7% semelhantes, 42% piores
» O melhor teve um delta de 5%, a média foi 17%, o pior foi 45%
Comparado com todos os dispositivos testados
» 35% de todos os dispositivos testados foram melhores, 8% semelhantes, 57% piores
» O melhor teve um delta de 4%, a média foi 24%, o pior foi 134%
Consumo de energia
Considerando o display grande e muito brilhante, o consumo ocioso do XPS 15 é muito baixo. A propósito, o modelo básico é fornecido com uma fonte de alimentação mais fraca de 90 Watt (USB-C), enquanto o XPS 15 de alta qualidade inclui uma fonte de alimentação de 130 Watt). No entanto, como o consumo máximo durante o teste de estresse é de apenas 76 watts e, em seguida, rapidamente se eleva a 57 watts, a fonte de alimentação de 90 watts é completamente suficiente.
| desligado | |
| Ocioso | |
| Carga |
|
Key:
min: | |
Power Consumption Witcher 3 / Stress Test
Vida útil da bateria
O eficiente painel FHD também se torna notável em termos de duração da bateria e, apesar da bateria menor, na prática, uma duração de 6,5 a 7,5 horas é possível em nosso teste WLAN (dependendo do brilho; 150 cd/m² @24%). Entretanto, há também algum potencial desperdiçado aqui, já que com a bateria maior de 86Wh, provavelmente 10-11 horas seriam possíveis aqui. Mesmo que o i5 XPS ainda se coloque à frente de seu Irmão OLEDA comparação de dados, que acaba sendo a última do nosso grupo de comparação em geral.
Pro
Contra
Veredicto - O XPS 15 9510 com o Core i5 & iGPU é muito caro
Em princípio, o conceito de oferecer um laptop multimídia de alta qualidade sem uma placa gráfica dedicada definitivamente faz sentido, porque nem todos também querem jogar jogos com seu laptop. Entretanto, o novo XPS 15 9510 não parece ser bem pensado a este respeito, e o i5-11400H utilizado é inadequado. Sabe-se que a Dell não usa CPUs AMD para o XPS 15, mas teria sido melhor usar o Core i7-11370H. Apesar de ter dois núcleos de CPU a menos, o desempenho da CPU na operação diária não é notavelmente pior, mas a GPU integrada é significativamente mais rápida
Em geral, o desempenho real da unidade de teste é muito decepcionante. Apesar de ter o mesmo resfriamento que o modelo high-end, o TDP é limitado a 40 watts já após vários segundos. O desempenho gráfico também não melhorou em comparação com o modelo antigo XPS 15 9500 iGPU. Mas pelo menos o XPS 15 permanece quase sempre silencioso na operação diária com isto, e os ventiladores permanecem muito silenciosos mesmo sob carga. Embora isto seja provavelmente positivo na operação cotidiana, pelo menos no modo opcional Ultra Performance, teríamos gostado do desempenho máximo da CPU, mesmo que os ventiladores sejam mais altos então.
O modelo iGPU do novo XPS 15 9510 é simplesmente muito caro para o desempenho oferecido. Para aqueles que estão interessados em um XPS 15 sem GPU dedicado, recomendamos o antigo XPS 15 9500, que continua disponível na Dell por 1250 euros (~$1456) e quase não é mais lento.
A tela Matte Full-HD continua a ser extremamente brilhante e, portanto, muito bem adequada para ser usada ao ar livre. O consumo de energia também permanece dentro dos limites, mas infelizmente a Dell também usa uma bateria menor em seu modelo básico, o que significa que a vida útil da bateria também não é particularmente boa. Há definitivamente algum potencial desperdiçado aqui. De modo geral, a Schenker Visão 15é uma alternativa melhor, e há também muitos laptops multimídia com uma relação preço-desempenho muito melhor, tais como o Honor MagicBook ProoAcer Swift 3 16e também o Huawei MateBook 14scom sua grande tela 3:2. Além disso, outro concorrente é apresentado com o MateBook 16que oferece um desempenho significativamente maior graças ao Processador Ryzen 7-5800H. Mas se for absolutamente o XPS 15 com o brilhante painel FHD, recomendamos o XPS 15 9500predecessor, que não oferece praticamente nenhum desempenho menor da CPU para tarefas diárias e continua disponível na Dell por 1250 euros (~$1456).
Preço e Disponibilidade
Nossa configuração de teste está disponível em Dell por cerca de $1300com muitas outras configurações também disponíveis. Por exemplo, o modelo com o Core i7-11800H, dedicado GeForce RTX 3050, 16 GB de RAM, o painel FHD fosco, e a bateria maior custa cerca de $1900.
Dell XPS 15 9510 i5 11400H FHD
- 10/20/2021 v7 (old)
Andreas Osthoff
Price comparison

