Análises para Intel Core i5-11400H processador
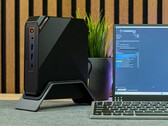
Análise do mini PC Blackview MP200 - Pequeno PC desktop com Intel Core i5-11400H em um gabinete atraente
Já conhecemos a Blackview pelo segmento de smartphones e tablets, mas, neste momento, o fabricante também inclui vários Mini PCs em seu portfólio. Com o MP200, damos uma olhada em um PC compacto visualmente atraente para o trabalho diário de escritório. Entretanto, o processador não é mais um dos mais novos. Descubra nesta análise o que o SoC Tiger Lake do Blackview MP200 é capaz de fazer.
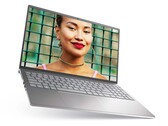
Intel Core i5-11400H, UHD Graphics Xe 16EUs, 678 gRevisão do laptop Dell Inspiron 15 Plus: Perto de ser o perfeito all-rounder
Com o Inspiron 15 Plus, a Dell oferece um laptop multimídia elegante e compacto que é adequado para todos os tipos de finalidades. Demos uma olhada detalhada no laptop de 15 polegadas.
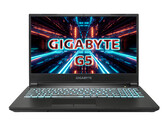
Intel Core i5-11400H, NVIDIA GeForce RTX 3050 4GB Laptop GPU, 15.6", 1.9 kgGigabyte G5 GD em revisão: Laptop para jogos de baixo custo sem Windows
Por pouco menos de 750 Euros (~$848), você pode obter o G5 GD, um laptop para jogos equipado com um processador hexa-core Tiger Lake e um GPU para laptop GeForce RTX 3050. O laptop oferece espaço para até três unidades de armazenamento.
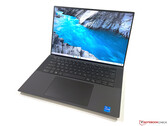
Intel Core i5-11400H, NVIDIA GeForce RTX 3050 4GB Laptop GPU, 15.6", 2.1 kgRevisão do laptop Dell XPS 15 9510 Core i5: Modelo básico com os freios acoplados
O Dell XPS 15 continua sendo um dos poucos laptops multimídia de alto nível que opcionalmente também é oferecido sem uma placa gráfica dedicada. Portanto, enquanto aqueles que estão procurando apenas um processador rápido devem realmente estar no lugar certo aqui, a Dell também limita o desempenho da CPU desnecessariamente.
Intel Core i5-11400H, UHD Graphics Xe 16EUs, 15.6", 1.8 kgAcer Nitro 5 AN515-57, GTX 1650: NVIDIA GeForce GTX 1650 Mobile, 15.60", 2.3 kg
ánalise externa » Acer Nitro 5 AN515-57, GTX 1650
Asus TUF Gaming F17 FX706HF: NVIDIA GeForce RTX 2050 Mobile, 17.30", 2.6 kg
ánalise externa » Asus TUF Gaming F17 FX706HF
Asus TUF Gaming F15 FX506HF: NVIDIA GeForce RTX 2050 Mobile, 15.60", 2.3 kg
ánalise externa » Asus TUF Gaming FX506HF
MSI GF63 Thin 11UC-680NL: NVIDIA GeForce RTX 3050 4GB Laptop GPU, 15.60", 1.9 kg
ánalise externa » MSI GF63 Thin 11UC-680NL
HP Victus 16-d0019ns: NVIDIA GeForce GTX 1650 Mobile, 16.10", 2.5 kg
ánalise externa » HP Victus 16-d0019ns
Asus TUF Gaming F17 FX706HC-HX007W: NVIDIA GeForce RTX 3050 4GB Laptop GPU, 17.30", 2.6 kg
ánalise externa » Asus TUF Gaming F17 FX706HC-HX007W
Asus TUF Gaming F15 FX506HC-HN004: NVIDIA GeForce RTX 3050 4GB Laptop GPU, 15.60", 2.3 kg
ánalise externa » Asus TUF Gaming F15 FX506HC-HN004
MSI GF63 Thin 11SC: NVIDIA GeForce GTX 1650 Mobile, 15.60", 1.9 kg
ánalise externa » MSI GF63 Thin 11SC
MSI GV15 Thin 11SC-633: NVIDIA GeForce GTX 1650 Max-Q, 15.60", 1.9 kg
ánalise externa » MSI GV15 Thin 11SC-633
Acer Predator Triton 300 PT315-53-54XN: NVIDIA GeForce RTX 3050 Ti Laptop GPU, 15.60", 2.1 kg
ánalise externa » Acer Predator Triton 300 PT315-53-54XN
Acer Nitro 5 AN515-57-505V: NVIDIA GeForce RTX 3050 Ti Laptop GPU, 15.60", 2.2 kg
ánalise externa » Acer Nitro 5 AN515-57-505V
Gigabyte G7 GD: NVIDIA GeForce RTX 3050 4GB Laptop GPU, 17.30", 2.4 kg
ánalise externa » Gigabyte G7 GD
Acer Predator Helios 300 PH315-54 NH.QC5EP.00A: NVIDIA GeForce RTX 3050 Ti Laptop GPU, 15.60", 2.2 kg
ánalise externa » Acer Predator Helios 300 PH315-54 NH.QC5EP.00A
Acer Predator Helios 300 PH315-54-582Q: NVIDIA GeForce RTX 3050 Ti Laptop GPU, 15.60", 2.9 kg
ánalise externa » Acer Predator Helios 300 PH315-54-582Q
Asus TUF Gaming F15 FX506HE-HN012: NVIDIA GeForce RTX 3050 Ti Laptop GPU, 15.60", 2.3 kg
ánalise externa » Asus TUF Gaming F15 FX506HE-HN012
MSI GF63 Thin 11UC-447XES: NVIDIA GeForce RTX 3050 4GB Laptop GPU, 15.60", 1.9 kg
ánalise externa » MSI GF63 Thin 11UC-447XES
MSI Katana GF66 11UD-1222PL: NVIDIA GeForce RTX 3050 Ti Laptop GPU, 15.60", 2.1 kg
ánalise externa » MSI Katana GF66 11UD-1222PL
HP Envy 15-ep1008ns: NVIDIA GeForce RTX 3050 4GB Laptop GPU, 15.60", 2.2 kg
ánalise externa » HP Envy 15-ep1008ns
MSI Katana GF66 11UD-480XUA: NVIDIA GeForce RTX 3050 Ti Laptop GPU, 15.60", 2.1 kg
ánalise externa » MSI Katana GF66 11UD-480XUA
Asus TUF Gaming F15 FX506HCB-HN256T: NVIDIA GeForce RTX 3050 4GB Laptop GPU, 15.60", 2.3 kg
ánalise externa » Asus TUF Gaming F15 FX506HCB-HN256T
Gigabyte G5 KD-52DE123SD: NVIDIA GeForce RTX 3060 Laptop GPU, 15.60", 2 kg
ánalise externa » Gigabyte G5 KD-52DE123SD
Dell Vostro 15 7510, i5-11400H RTX 3050: NVIDIA GeForce RTX 3050 4GB Laptop GPU, 15.60", 1.9 kg
ánalise externa » Dell Vostro 15 7510, i5-11400H RTX 3050
HP Victus 16-d0206nf: NVIDIA GeForce RTX 3060 Laptop GPU, 16.10", 2.5 kg
ánalise externa » HP Victus 16-d0206nf
HP Victus 16-d0655ng: NVIDIA GeForce RTX 3060 Laptop GPU, 16.10", 2.5 kg
ánalise externa » HP Victus 16-d0655ng
Dell XPS 15 9510 i5 11400H FHD: Intel UHD Graphics Xe 16EUs, 15.60", 1.8 kg
ánalise externa » Dell XPS 15 9510 i5 11400H FHD
Asus TUF Gaming F15 FX506HM-HN016: NVIDIA GeForce RTX 3060 Laptop GPU, 15.60", 2.3 kg
ánalise externa » Asus TUF Gaming F15 FX506HM-HN016
Asus TUF Gaming F15 FX506HCB-HN243T: NVIDIA GeForce RTX 3050 Ti Laptop GPU, 15.60", 2.3 kg
ánalise externa » Asus TUF Gaming F15 FX506HCB-HN243T
Lenovo Legion 5 17ITH6H-82JM000FGE: NVIDIA GeForce RTX 3060 Laptop GPU, 17.30", 3 kg
ánalise externa » Lenovo Legion 5 17ITH6H-82JM000FGE
Gigabyte G5 GD: NVIDIA GeForce RTX 3050 4GB Laptop GPU, 15.60", 2.1 kg
ánalise externa » Gigabyte G5 GD
HP Victus 16-d0367ng: NVIDIA GeForce RTX 3050 Ti Laptop GPU, 16.10", 2.5 kg
ánalise externa » HP Victus 16-d0367ng
Asus TUF Gaming F15 FX506HM-HN184: NVIDIA GeForce RTX 3060 Laptop GPU, 15.60", 2.3 kg
ánalise externa » Asus TUF Gaming F15 FX506HM-HN184
Gigabyte G5 MD-51US123SH: NVIDIA GeForce RTX 3050 Ti Laptop GPU, 15.60", 2.2 kg
ánalise externa » Gigabyte G5 MD-51US123SH
MSI Katana GF66 11UD-836XFR: NVIDIA GeForce RTX 3050 Ti Laptop GPU, 15.60", 2.1 kg
ánalise externa » MSI Katana GF66 11UD-836XFR
Acer Nitro 5 AN515-57-56HH: NVIDIA GeForce RTX 3050 4GB Laptop GPU, 15.60", 2.3 kg
ánalise externa » Acer Nitro 5 AN515-57-56HH
HP Victus 16-d0146ng: NVIDIA GeForce RTX 3050 4GB Laptop GPU, 16.10", 2.5 kg
ánalise externa » HP Victus 16-d0146ng
MSI Sword 15 A11UE: NVIDIA GeForce RTX 3060 Laptop GPU, 15.60", 2.3 kg
ánalise externa » MSI Sword 15 A11UE
HP Victus 16-d0057ng: NVIDIA GeForce RTX 3050 4GB Laptop GPU, 16.10", 2.5 kg
ánalise externa » HP Victus 16-d0057ng
Acer Nitro 5 AN515-57-545N: NVIDIA GeForce RTX 3060 Laptop GPU, 15.60", 2.3 kg
ánalise externa » Acer Nitro 5 AN515-57-545N
MSI Katana GF66 11UC-093: NVIDIA GeForce RTX 3050 4GB Laptop GPU, 15.60", 2.1 kg
ánalise externa » MSI Katana GF66 11UC-093
Blackview MP200: Intel UHD Graphics Xe 16EUs, 0.7 kg
» O mini PC Blackview MP200 é um destaque visual na mesa