Um segundo olhar sobre o Vermeer - AMD Ryzen 9 5950X e AMD Ryzen 5 5600X Revisão
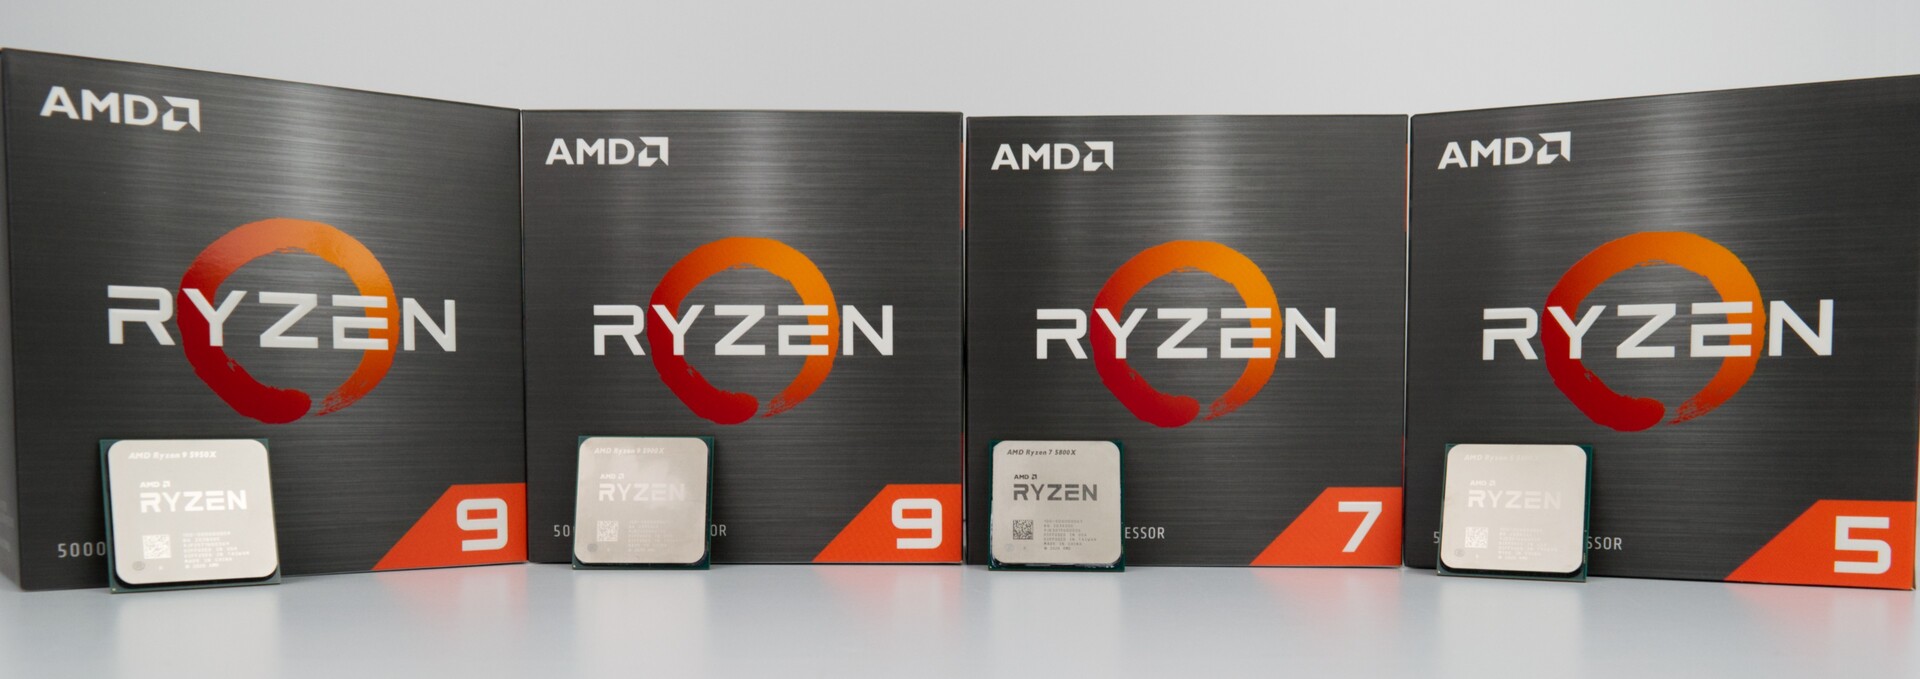
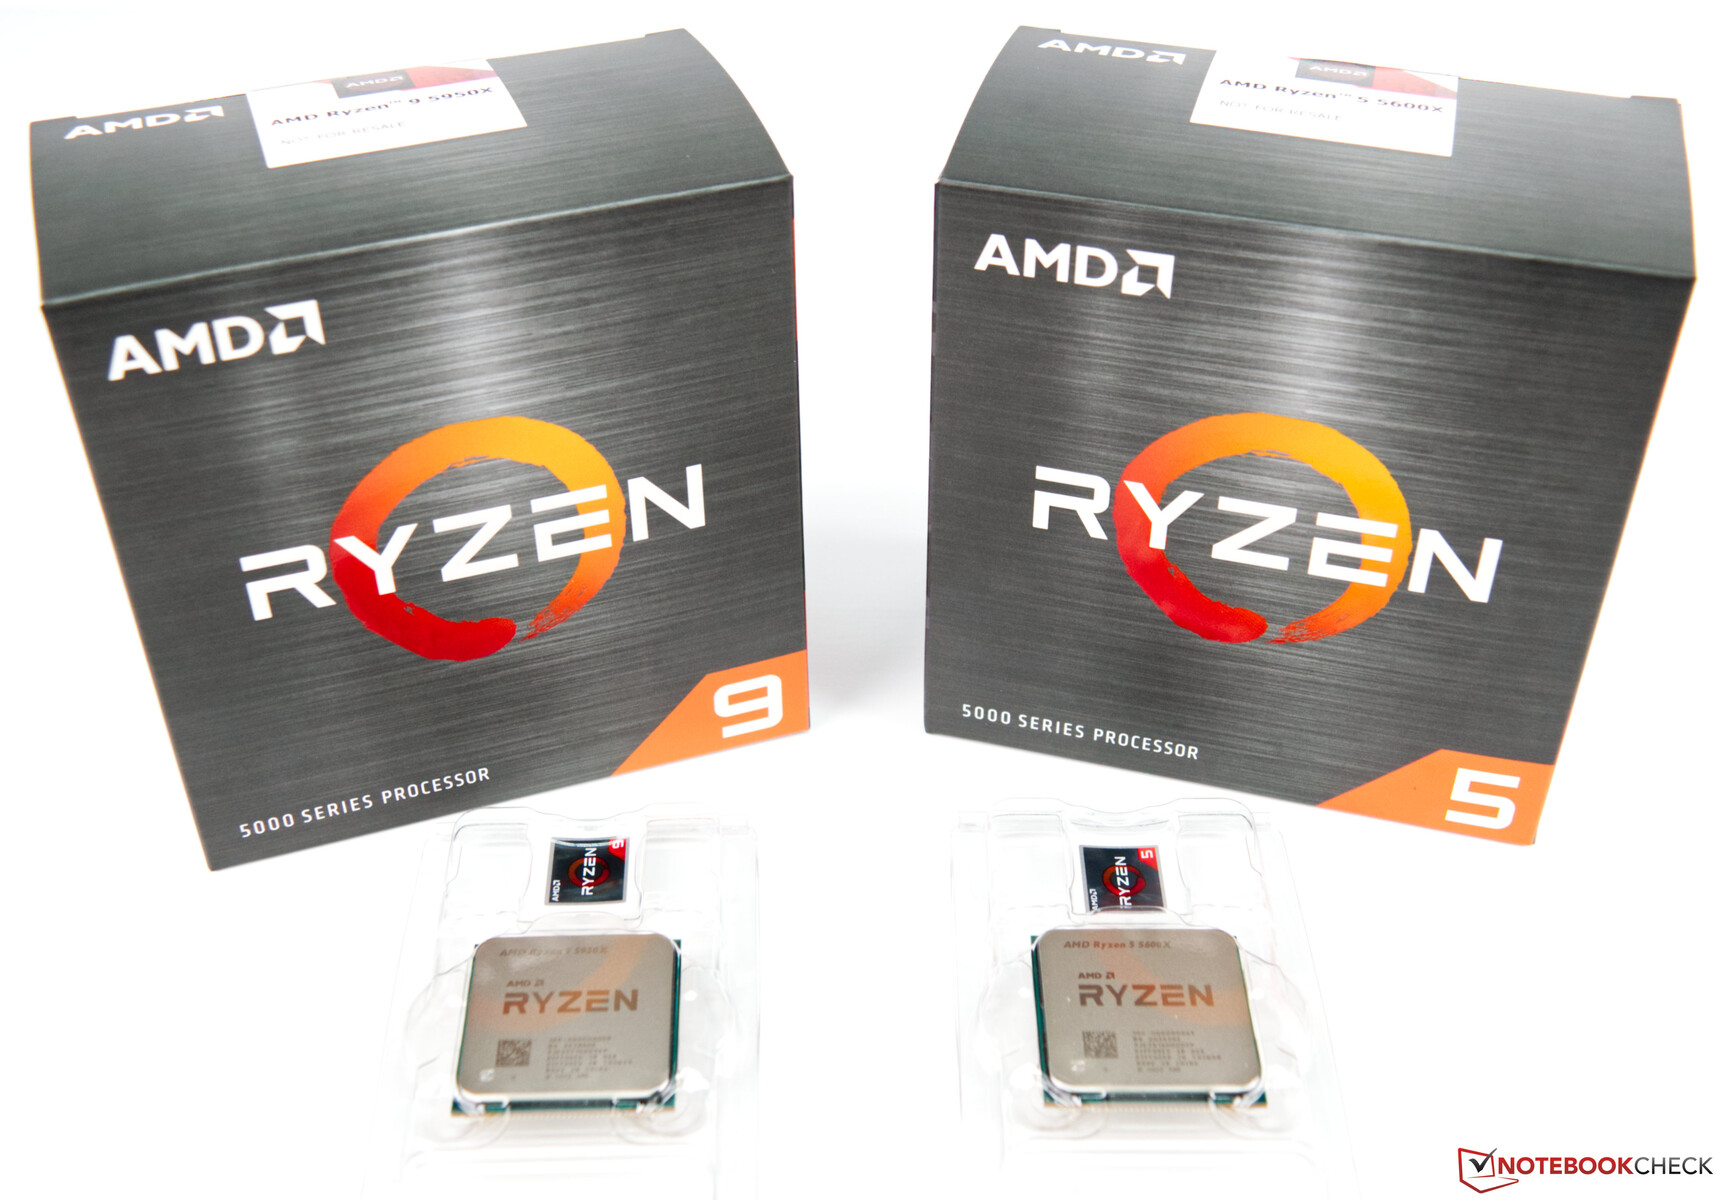
Depois de termos avaliado previamente o AMD Ryzen 9 5900X e AMD Ryzen 7 5800X em profundidade, nesta revisão, daremos uma olhada no AMD Ryzen 9 5950X e no AMD Ryzen 5 5600X. Com estes processadores, a AMD estende a parte superior e inferior da novasérie Vermeer em seunovo portfólio.
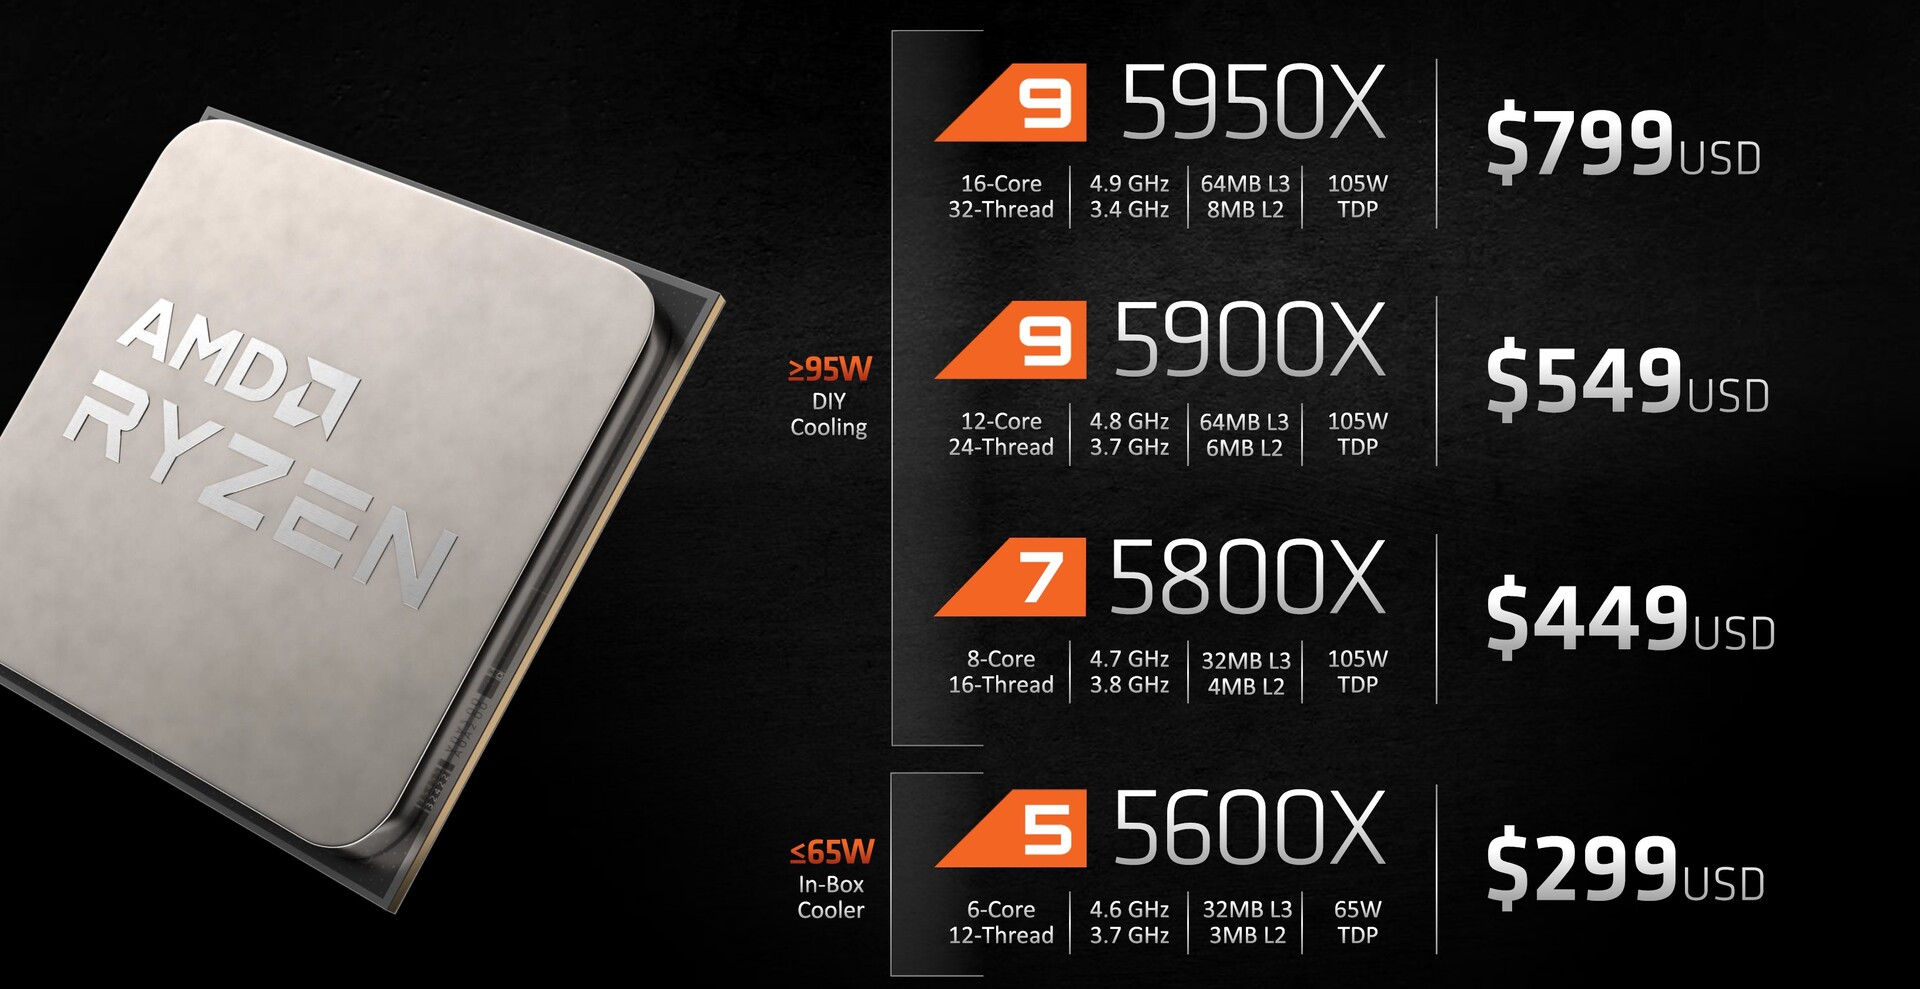
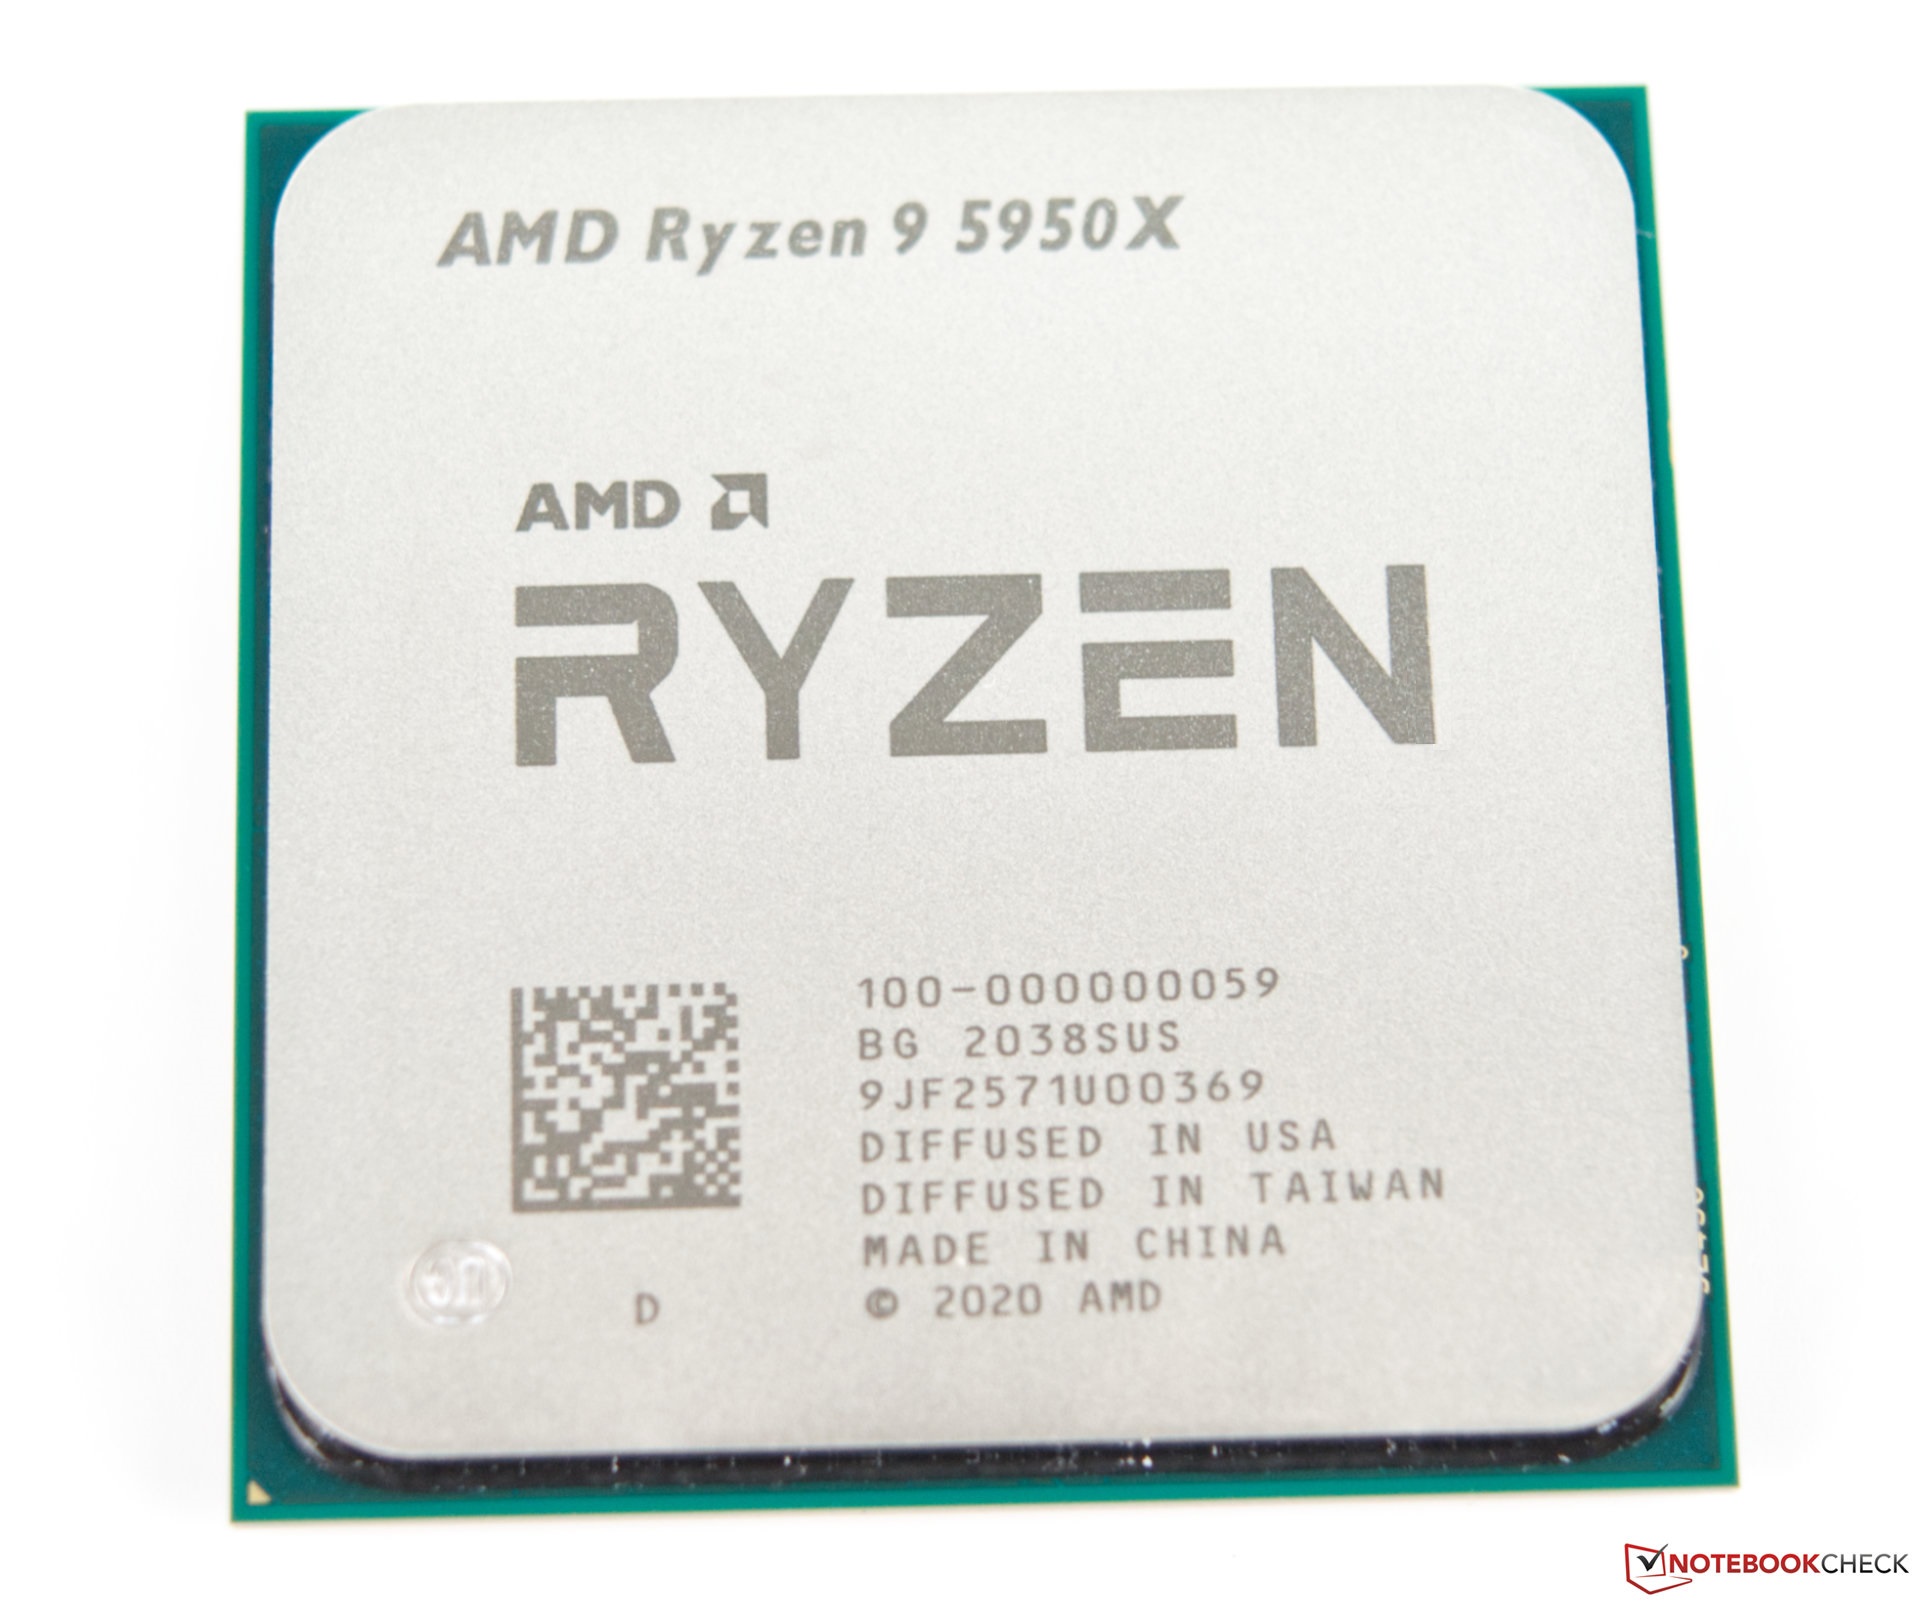
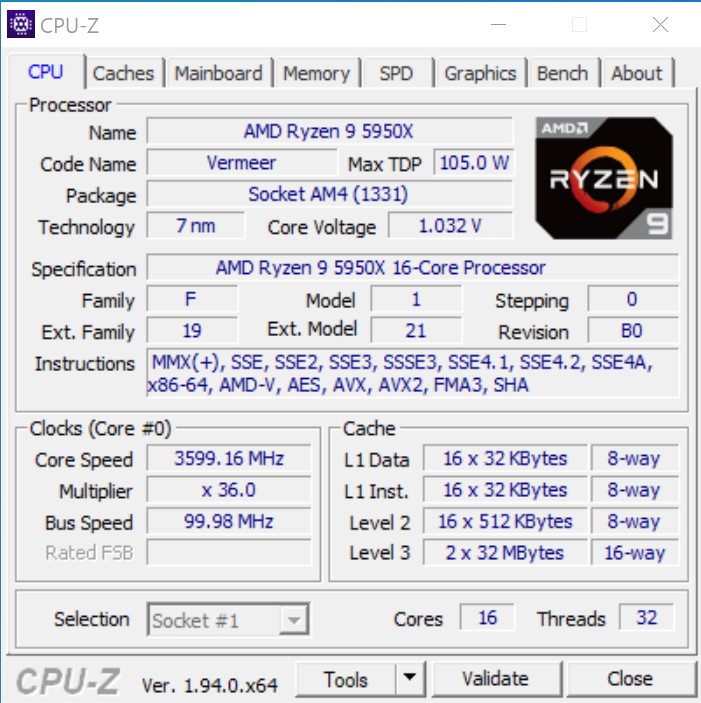
O AMD Ryzen 9 5950X é um sucessor do AMD Ryzen 9 3950X e também oferece 16 núcleos e 32 roscas. As muitas inovações da arquitetura Vermeer também prometem um salto de desempenho decente. Ao mesmo tempo, o novo top model não consome mais energia do que seu antecessor, já que a AMD também especifica um TDP de 105 watts. Se este valor também se reflete na realidade, explicaremos em um ponto posterior.
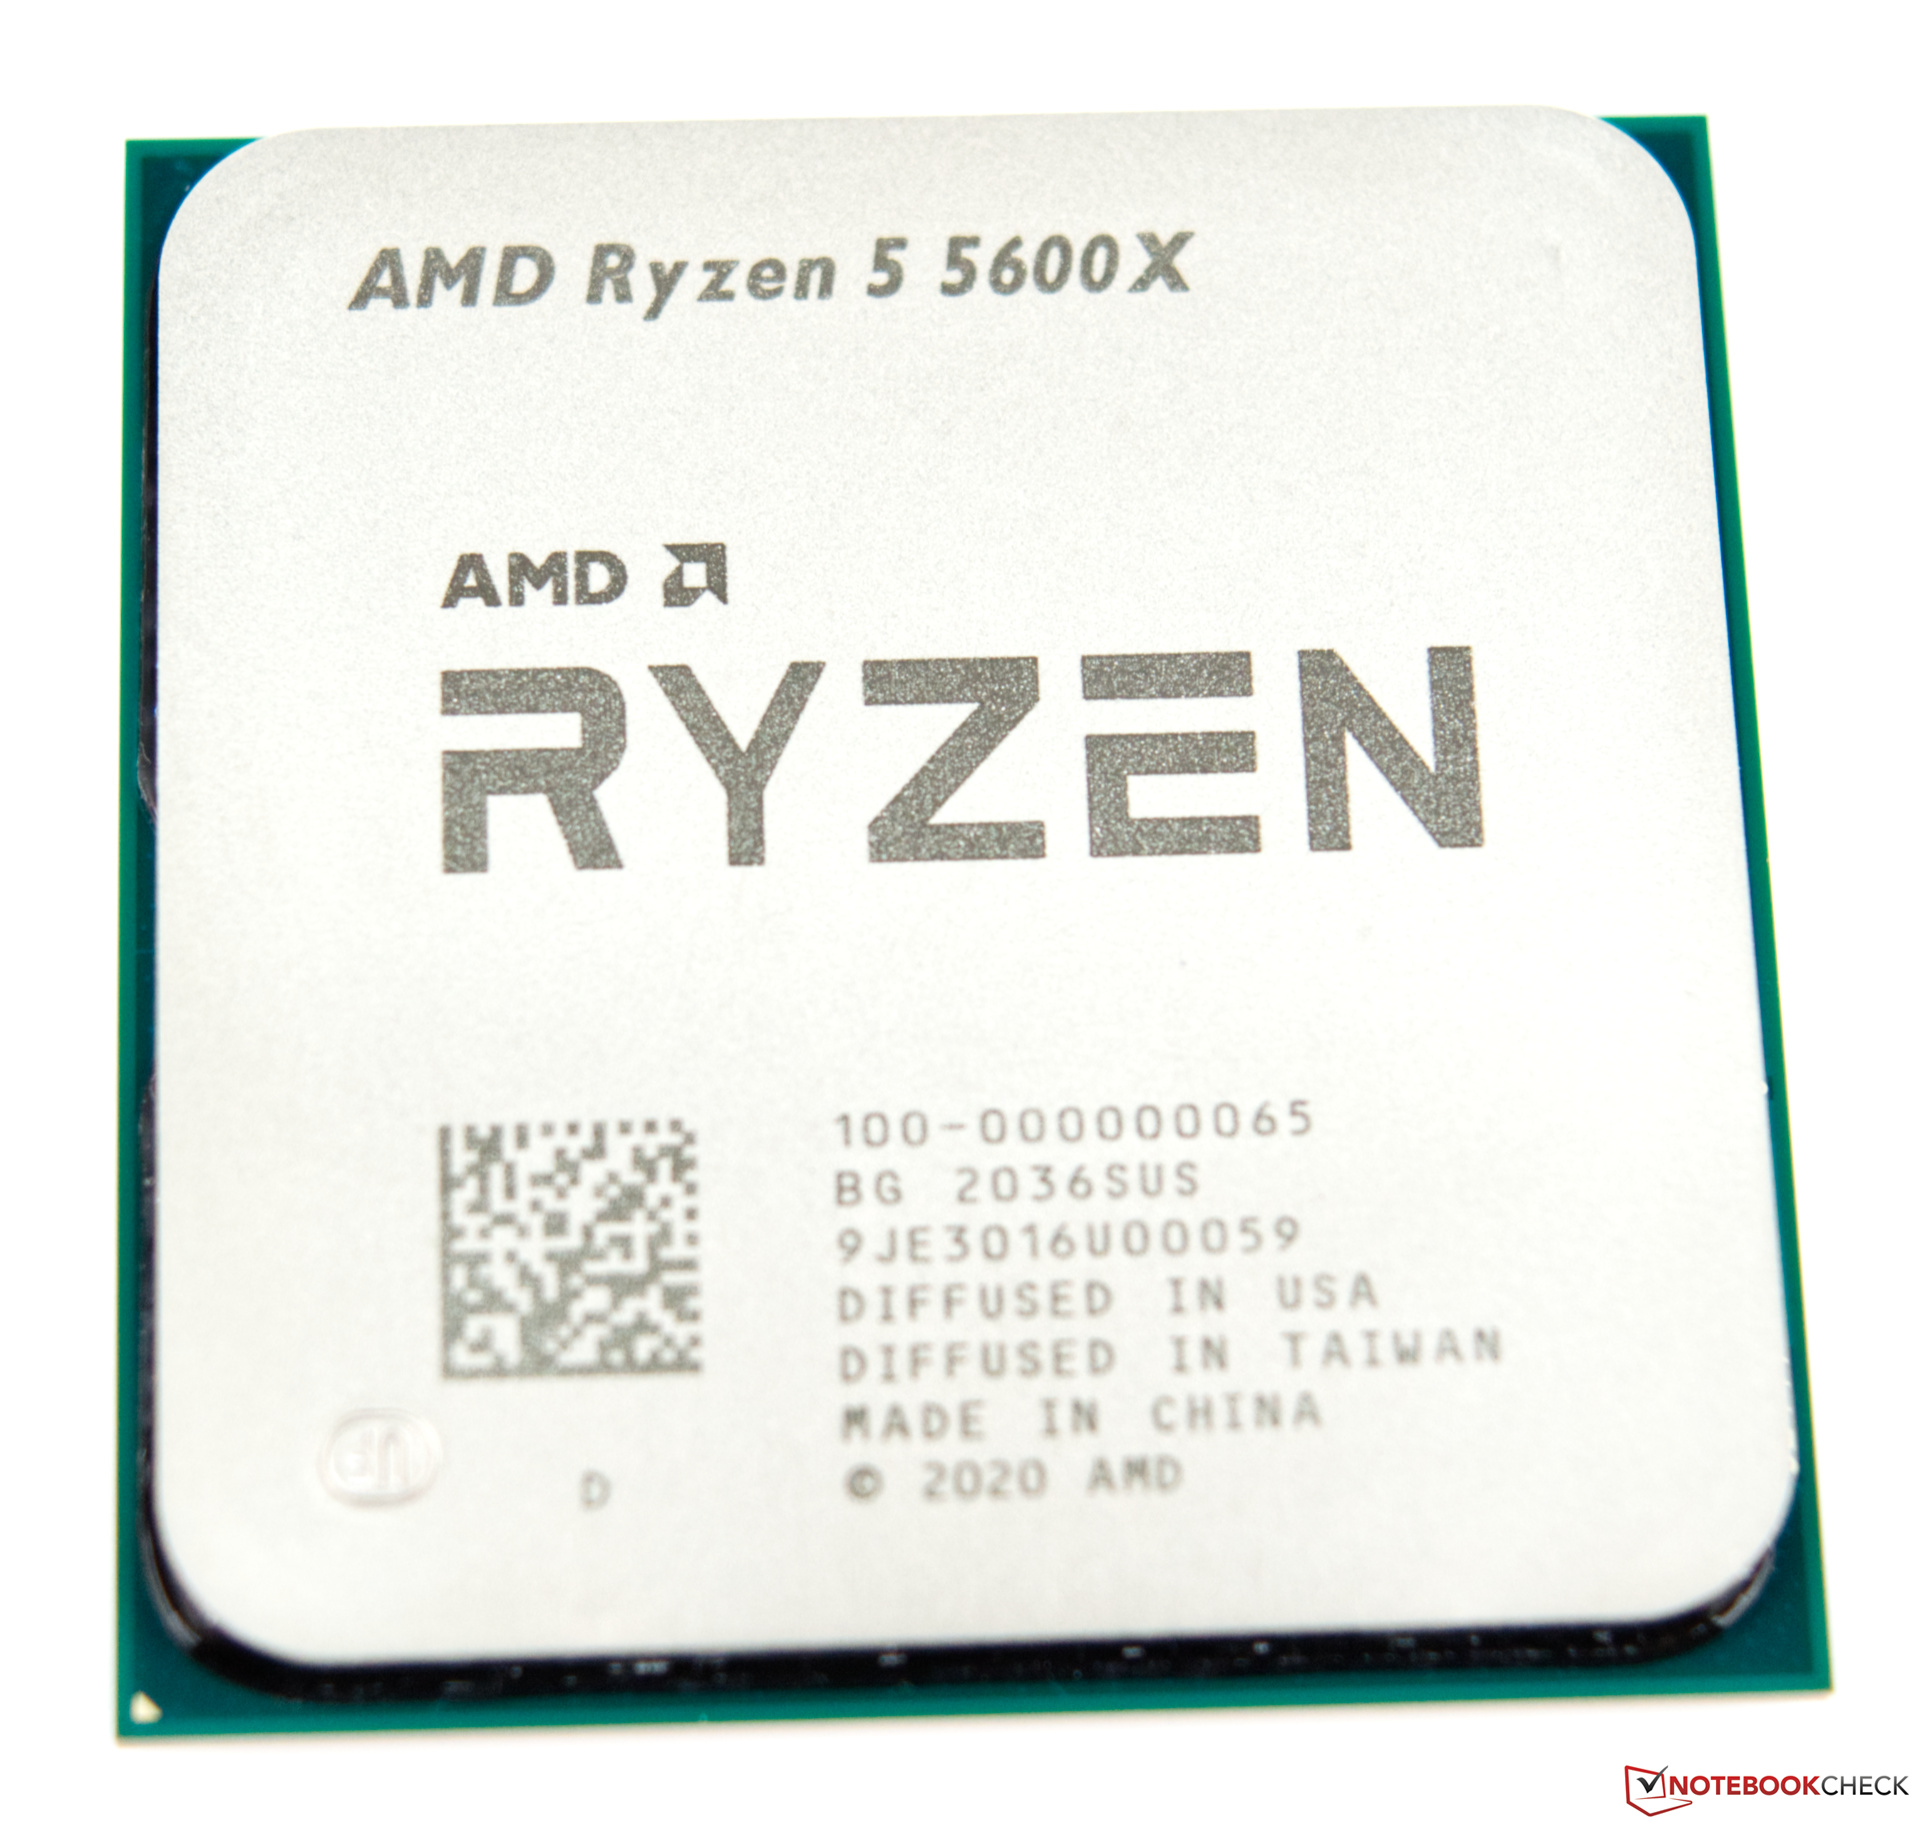
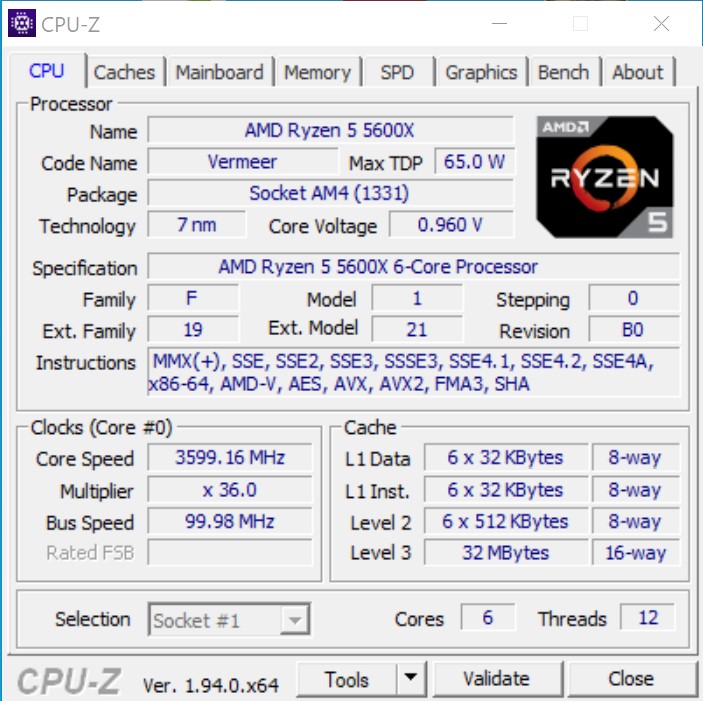
Finalmente, o AMD Ryzen 5 5600X não é apenas o menor Ryzen com 6 núcleos e 12 fios, mas com um TDP de 65 watts, também o mais eficiente, se você comparar as especificações puramente técnicas.
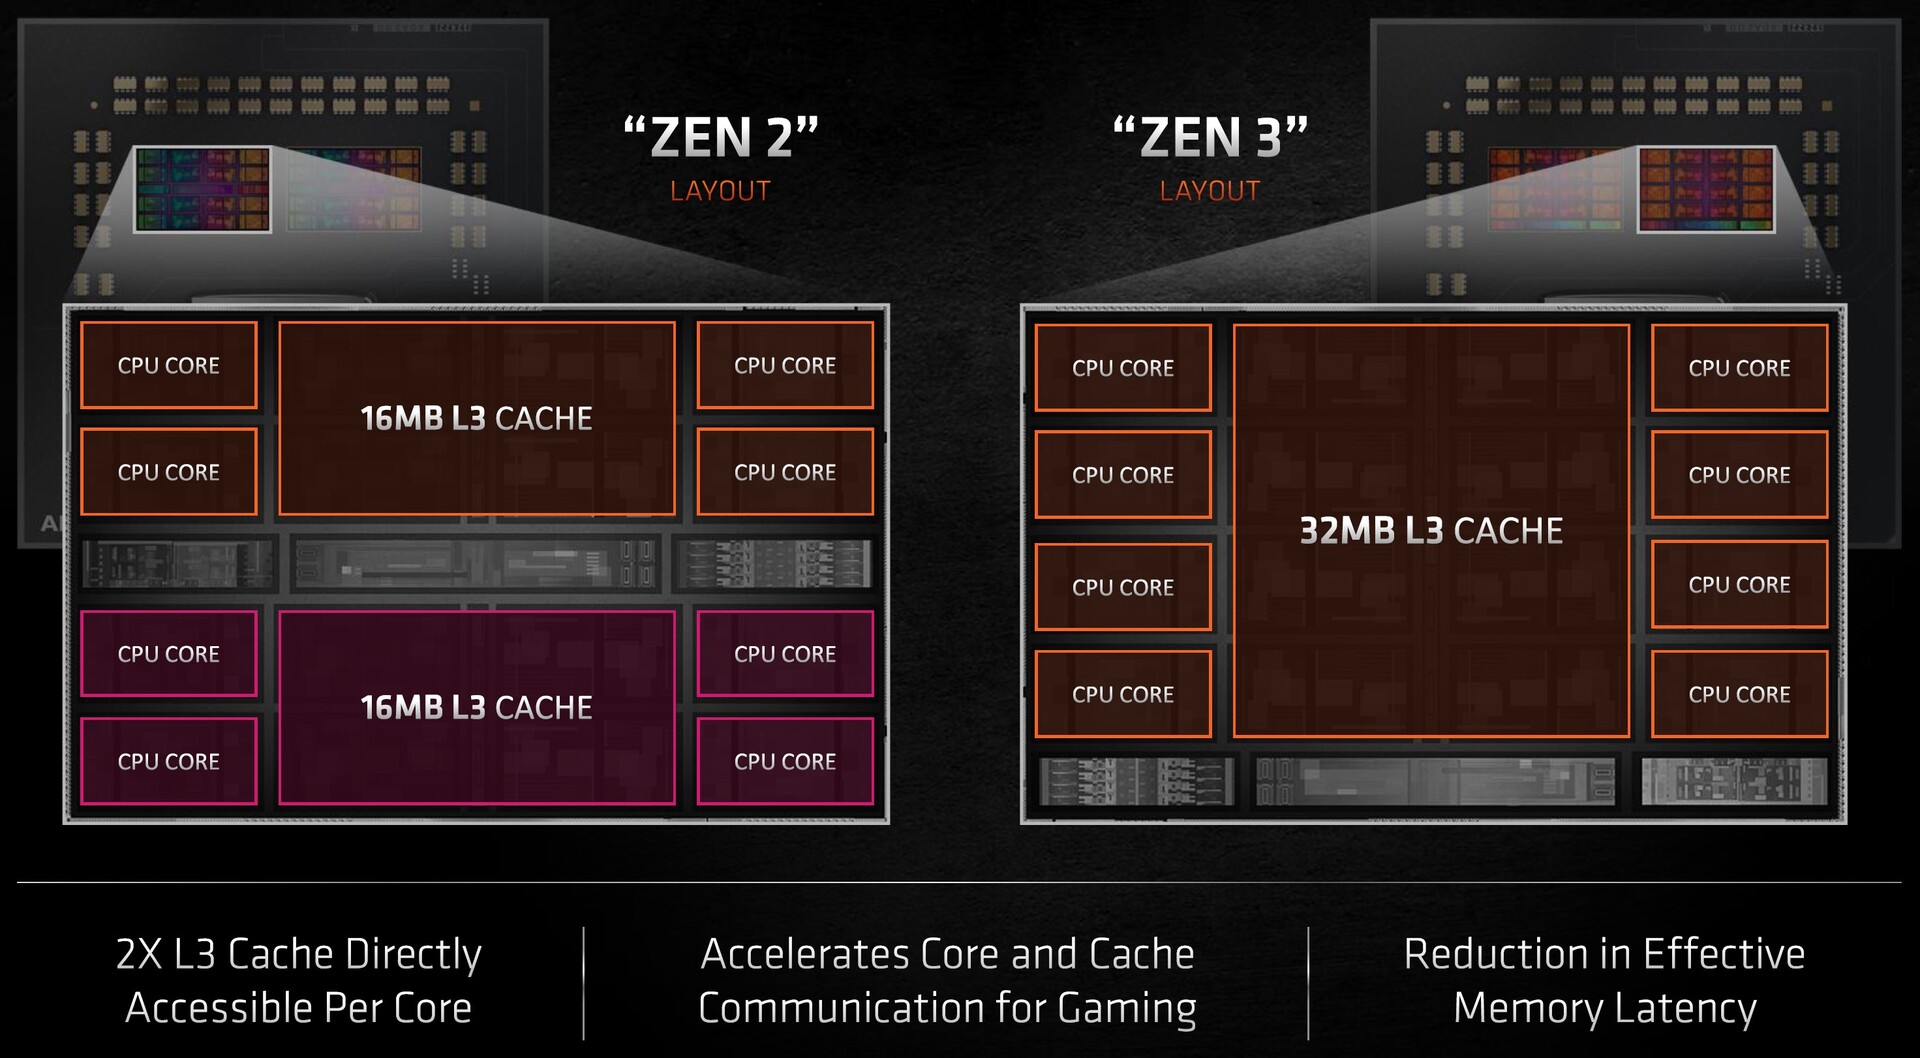
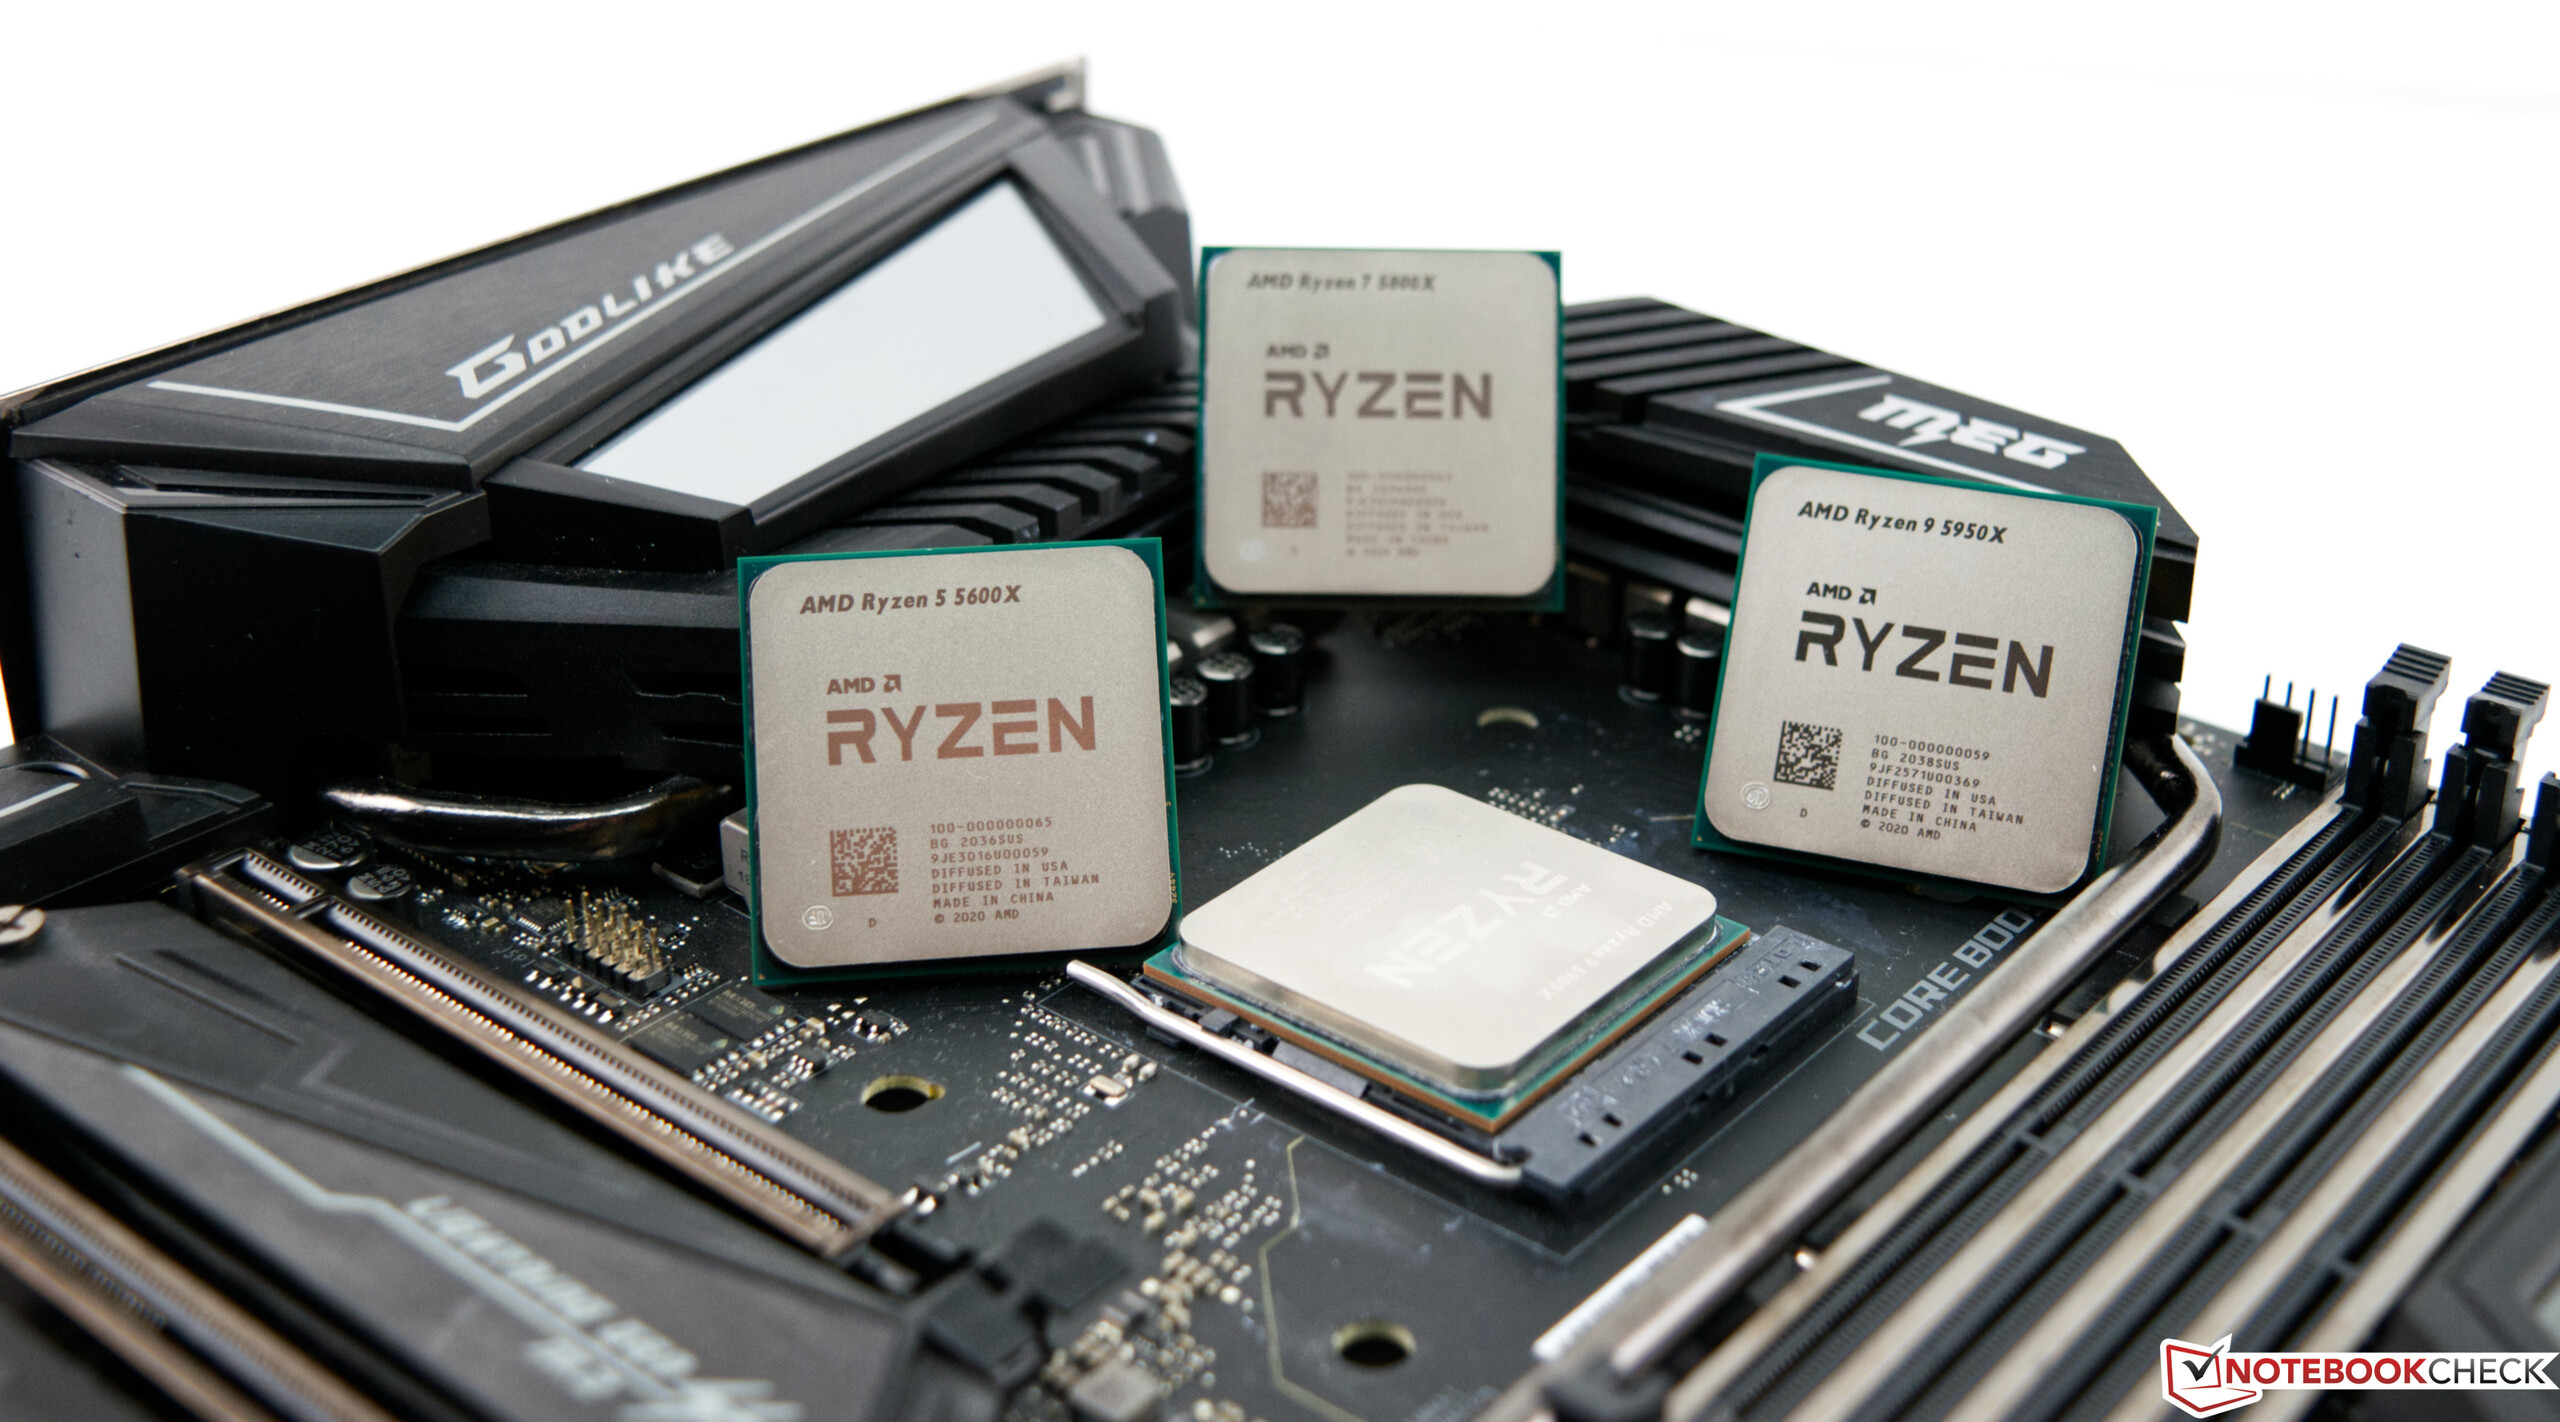
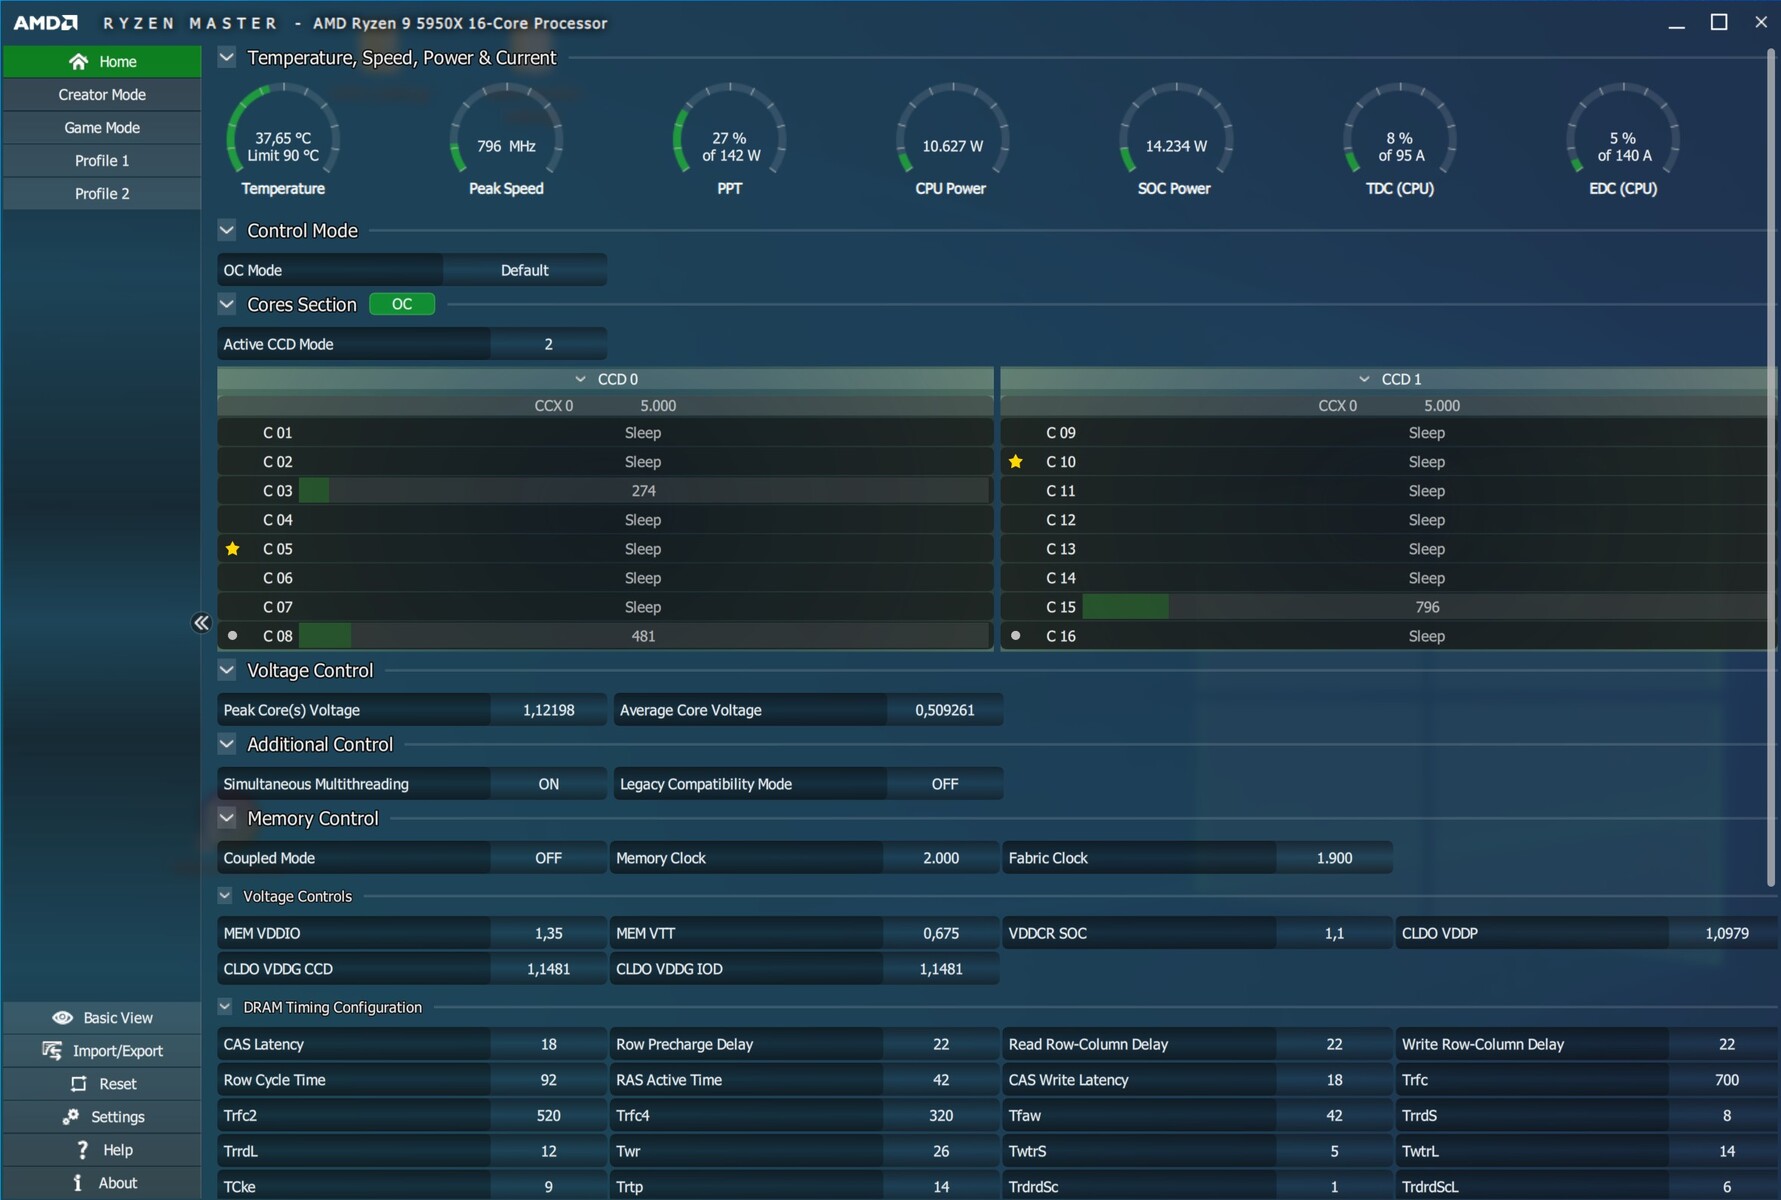
Em termos de sua maquiagem interna, como modelo top, o Ryzen 9 5950X usa 2 CCDs com 8 núcleos cada um. No Ryzen 5 5600X, apenas 6 núcleos de um CCD estão ativos. Em comparação com a Intel (PL2 250 watts), o modelo top também é significativamente mais eficiente com 142 watts ao usar o PL2. Já avaliamos inovações adicionais da arquitetura Zen-3 neste teste.
Visão geral dos processadores Ryzen AMD
| Modelo | Cores/Threads | Velocidade do relógio | Velocidade do relógio | L3 Cache | TDP | Preço de lançamento |
|---|---|---|---|---|---|---|
| Ryzen 9 5950X | 16/32 | 3.4 GHz | 4.9 GHz | 64MB | 105Watt | 799USD |
| Ryzen 9 3950X | 16/32 | 3,5 GHz | 4,7 GHz | 64 MB | 105 Watt | 749 USD |
| Ryzen 9 5900X | 12/24 | 3.7 GHz | 4.8 GHz | 64MB | 105Watt | 549USD |
| Ryzen 9 3900XT | 12/24 | 3,8 GHz | 4,7 GHz | 64 MB | 105 Watt | 499 USD |
| Ryzen 9 3900X | 12/24 | 3,8 GHz | 4,6 GHz | 64 MB | 105 Watt | 499 USD |
| Ryzen 7 5800X | 8/16 | 3,8 GHz | 4,7 GHz | 32 MB | 105Watt | 449USD |
| Ryzen 7 3800XT | 8/16 | 3,9 GHz | 4,7 GHz | 32 MB | 105 Watt | 399 USD |
| Ryzen 7 3800X | 8/16 | 3,9 GHz | 4,5 GHz | 32 MB | 105 Watt | 399 USD |
| Ryzen 7 3700X | 8/16 | 3,6 GHz | 4,4 GHz | 32 MB | 65 Watt | 329 USD |
| Ryzen 5 5600X | 6/12 | 3,7 GHz | 4,6 GHz | 32MB | 65Watt | 299USD |
| Ryzen 5 3600XT | 6/12 | 3,8 GHz | 4,5 GHz | 32 MB | 95 Watt | 249 USD |
| Ryzen 5 3600X | 6/12 | 3.8 GHz | 4.4 GHz | 32 MB | 95 Watt | 229 USD |
| Ryzen 5 3600 | 6/12 | 3,6 GHz | 4,2 GHz | 32 MB | 65 Watt | 199 USD |
Detalhes de nosso sistema de teste
Utilizamos o seguinte sistema para os parâmetros de referência abaixo:
- Raijintek Pean Benchtable
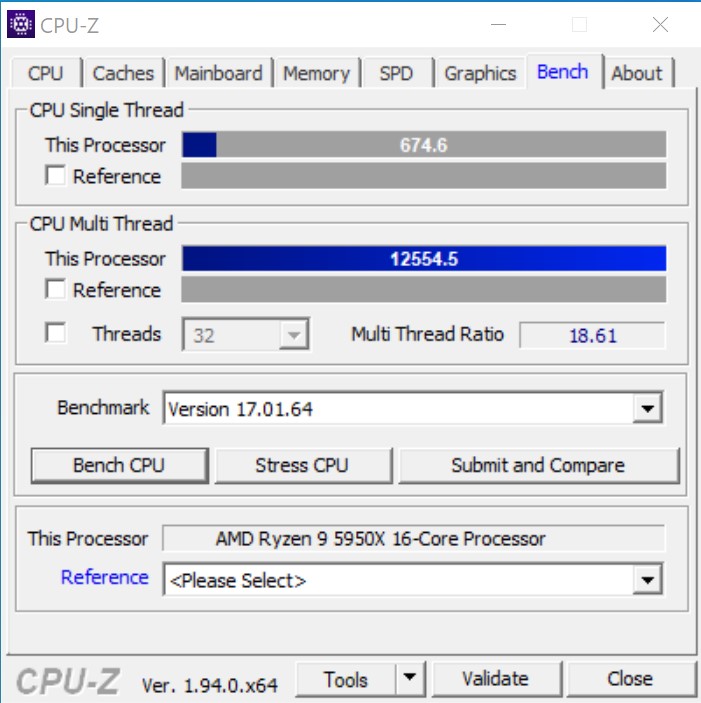
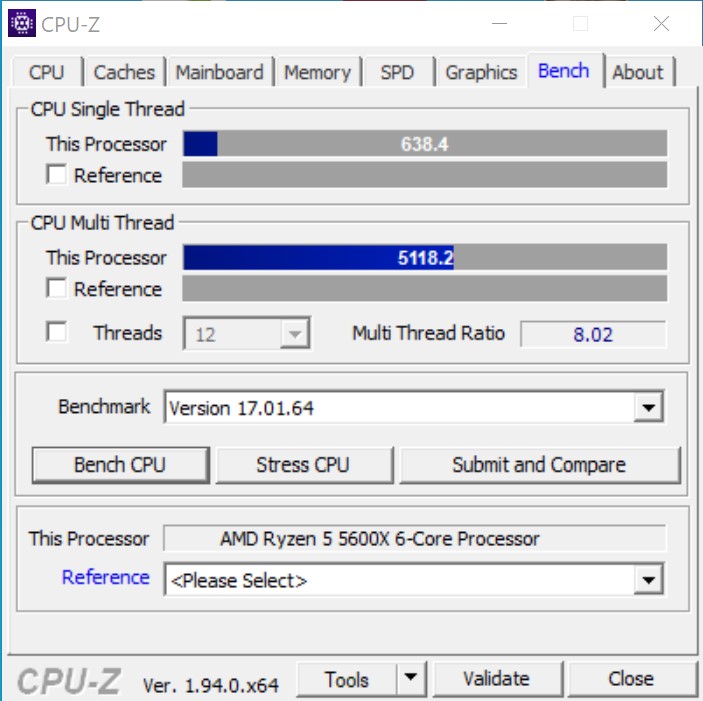
- AMD Ryzen 9 5950X, AMD Ryzen 5 5600X
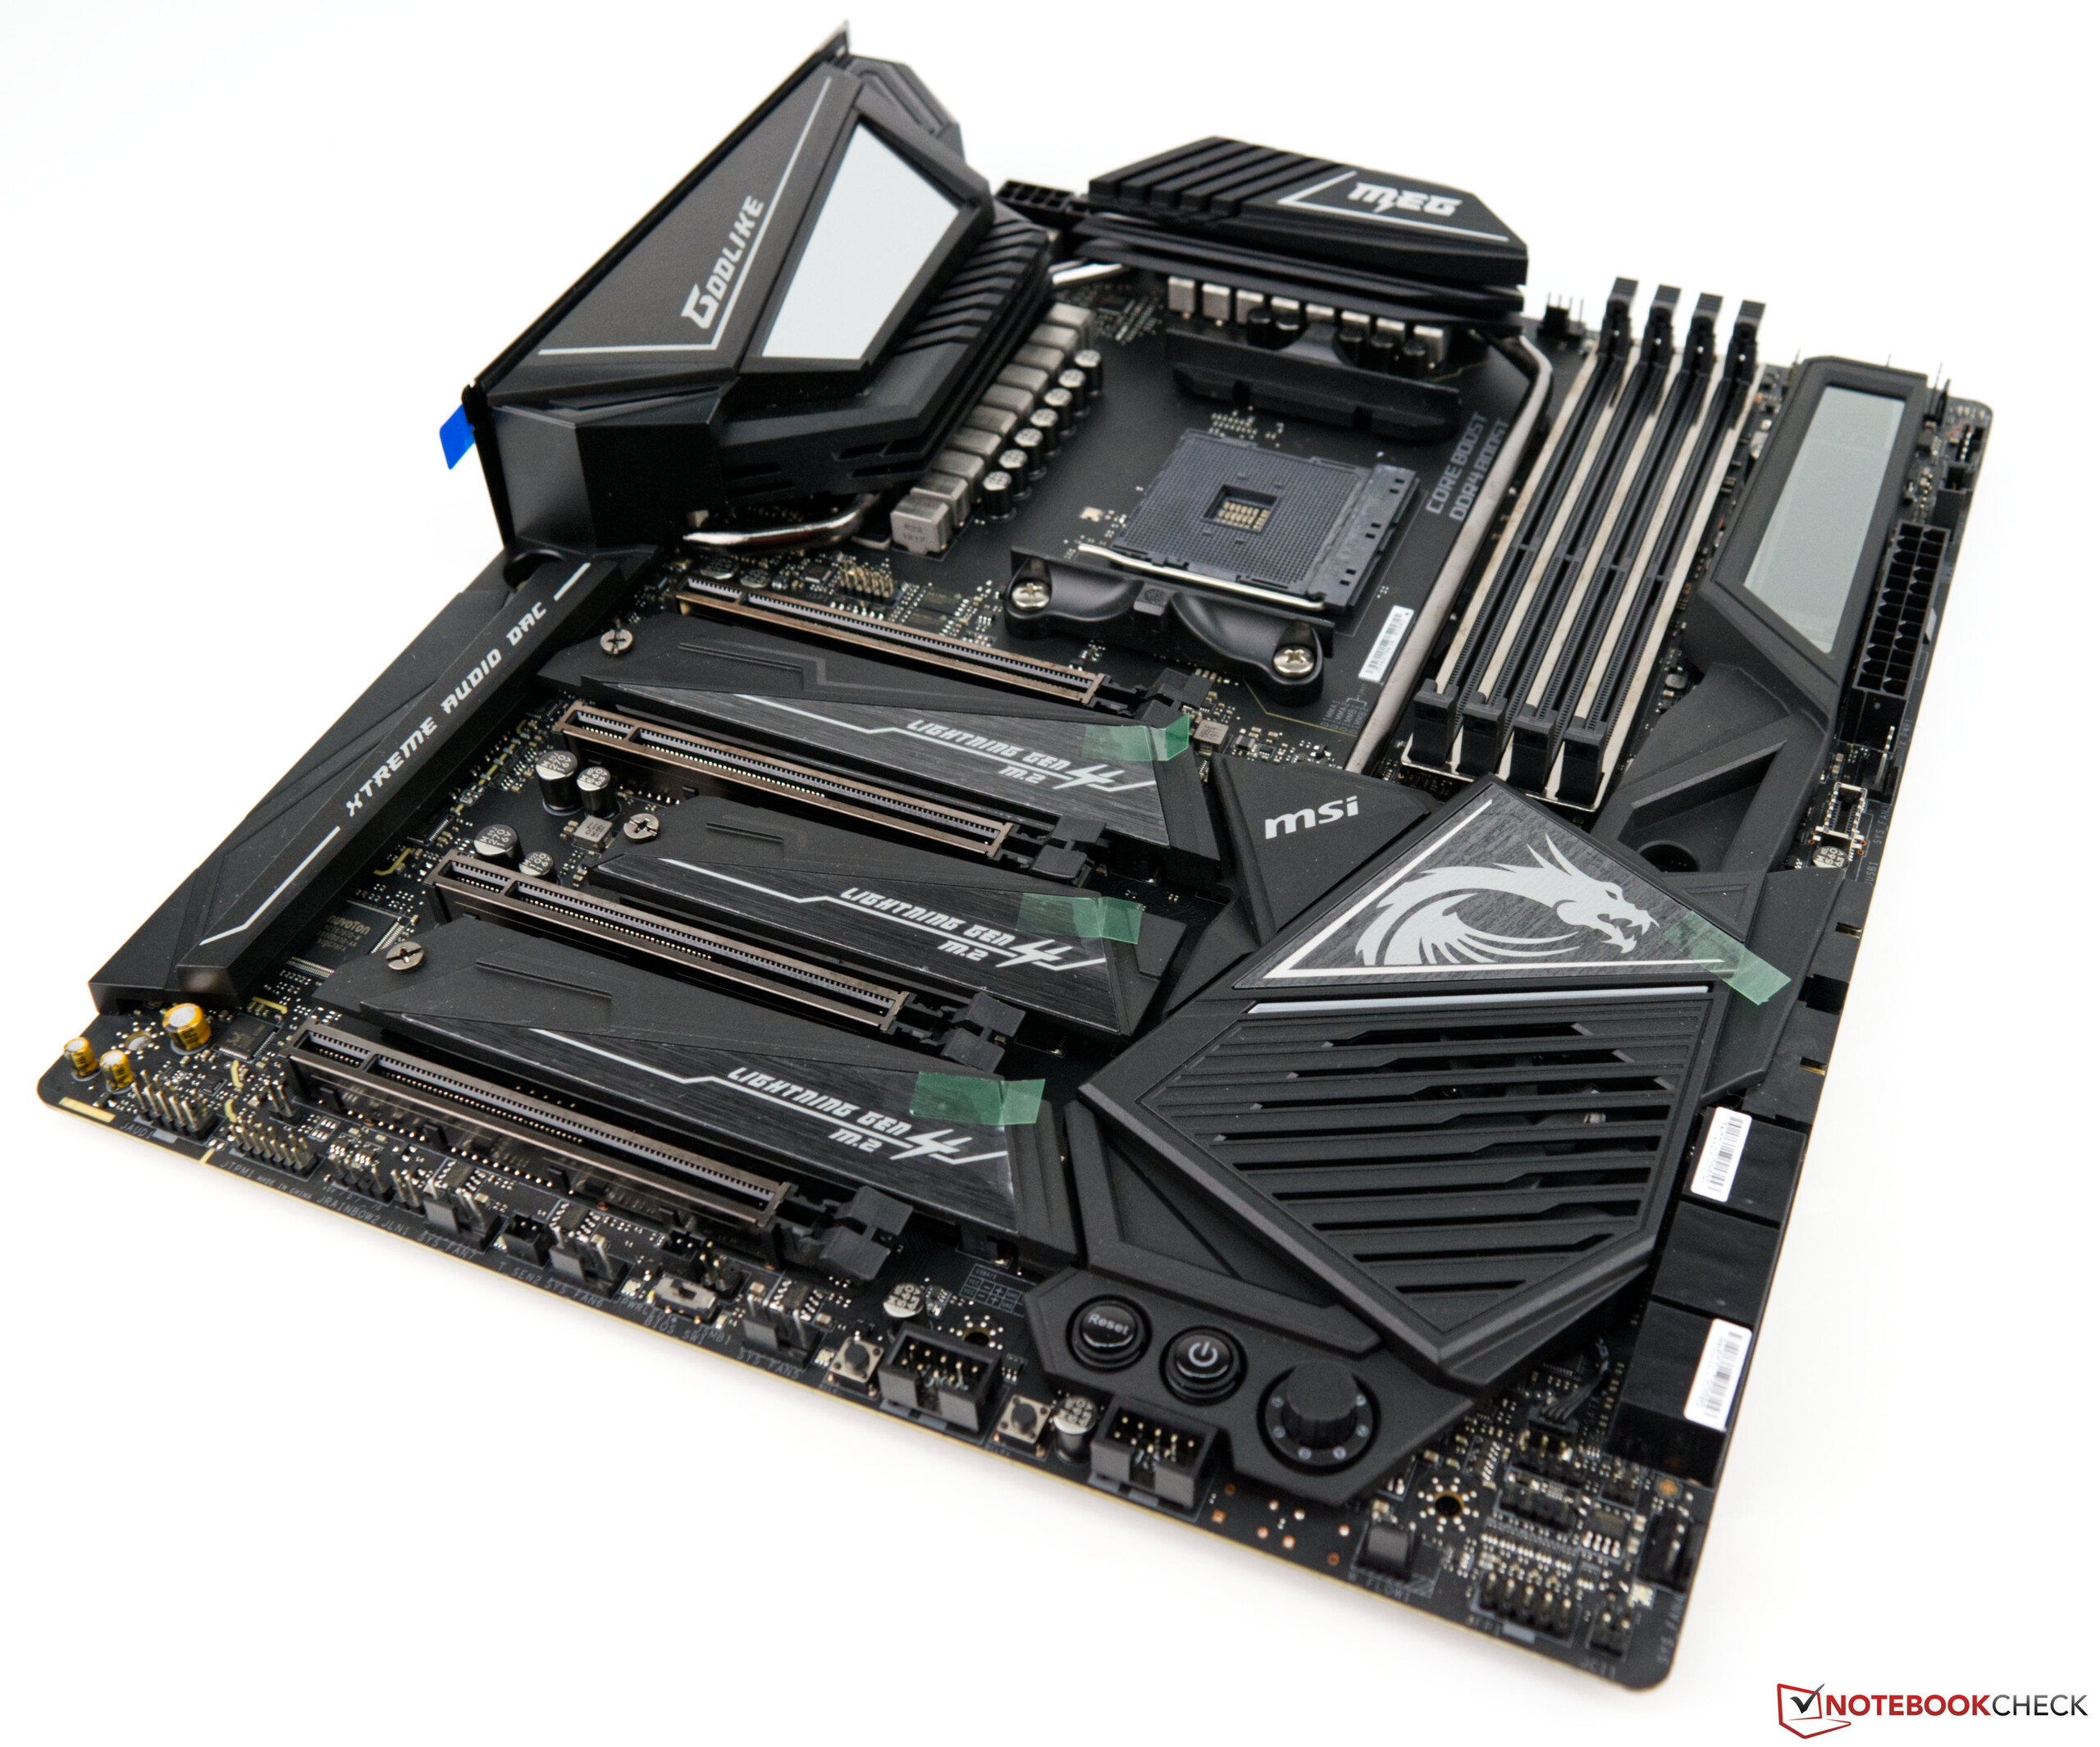
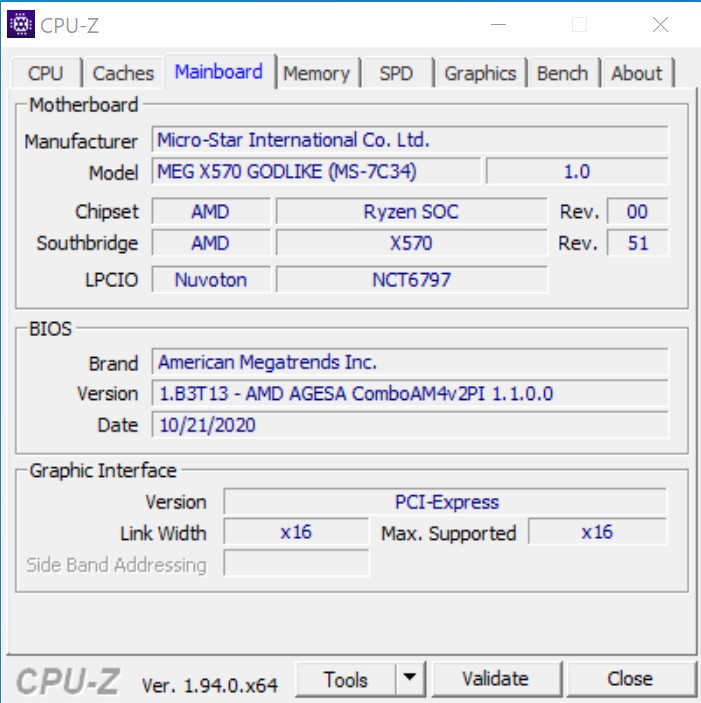
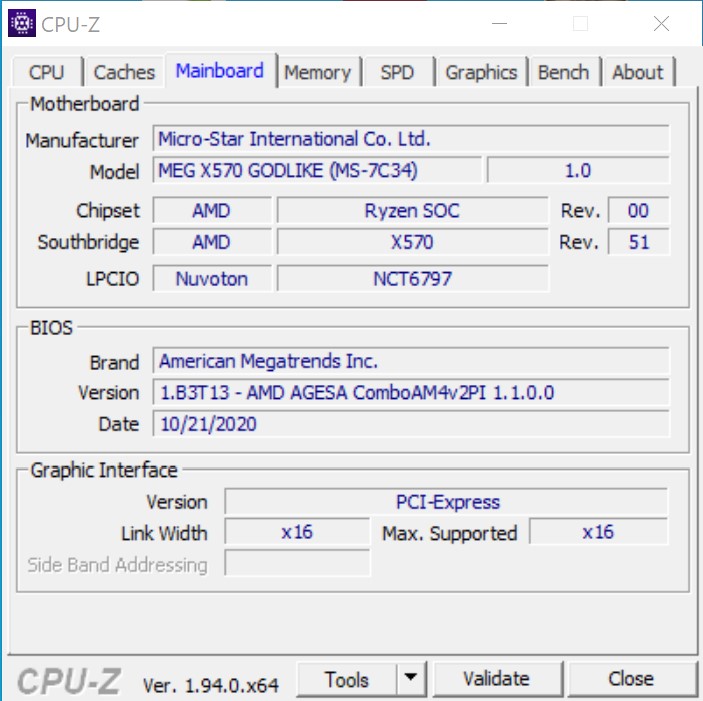
- MSI MEG X570 Parecido com Deus
- Alphacool Eisbear 280 AiO
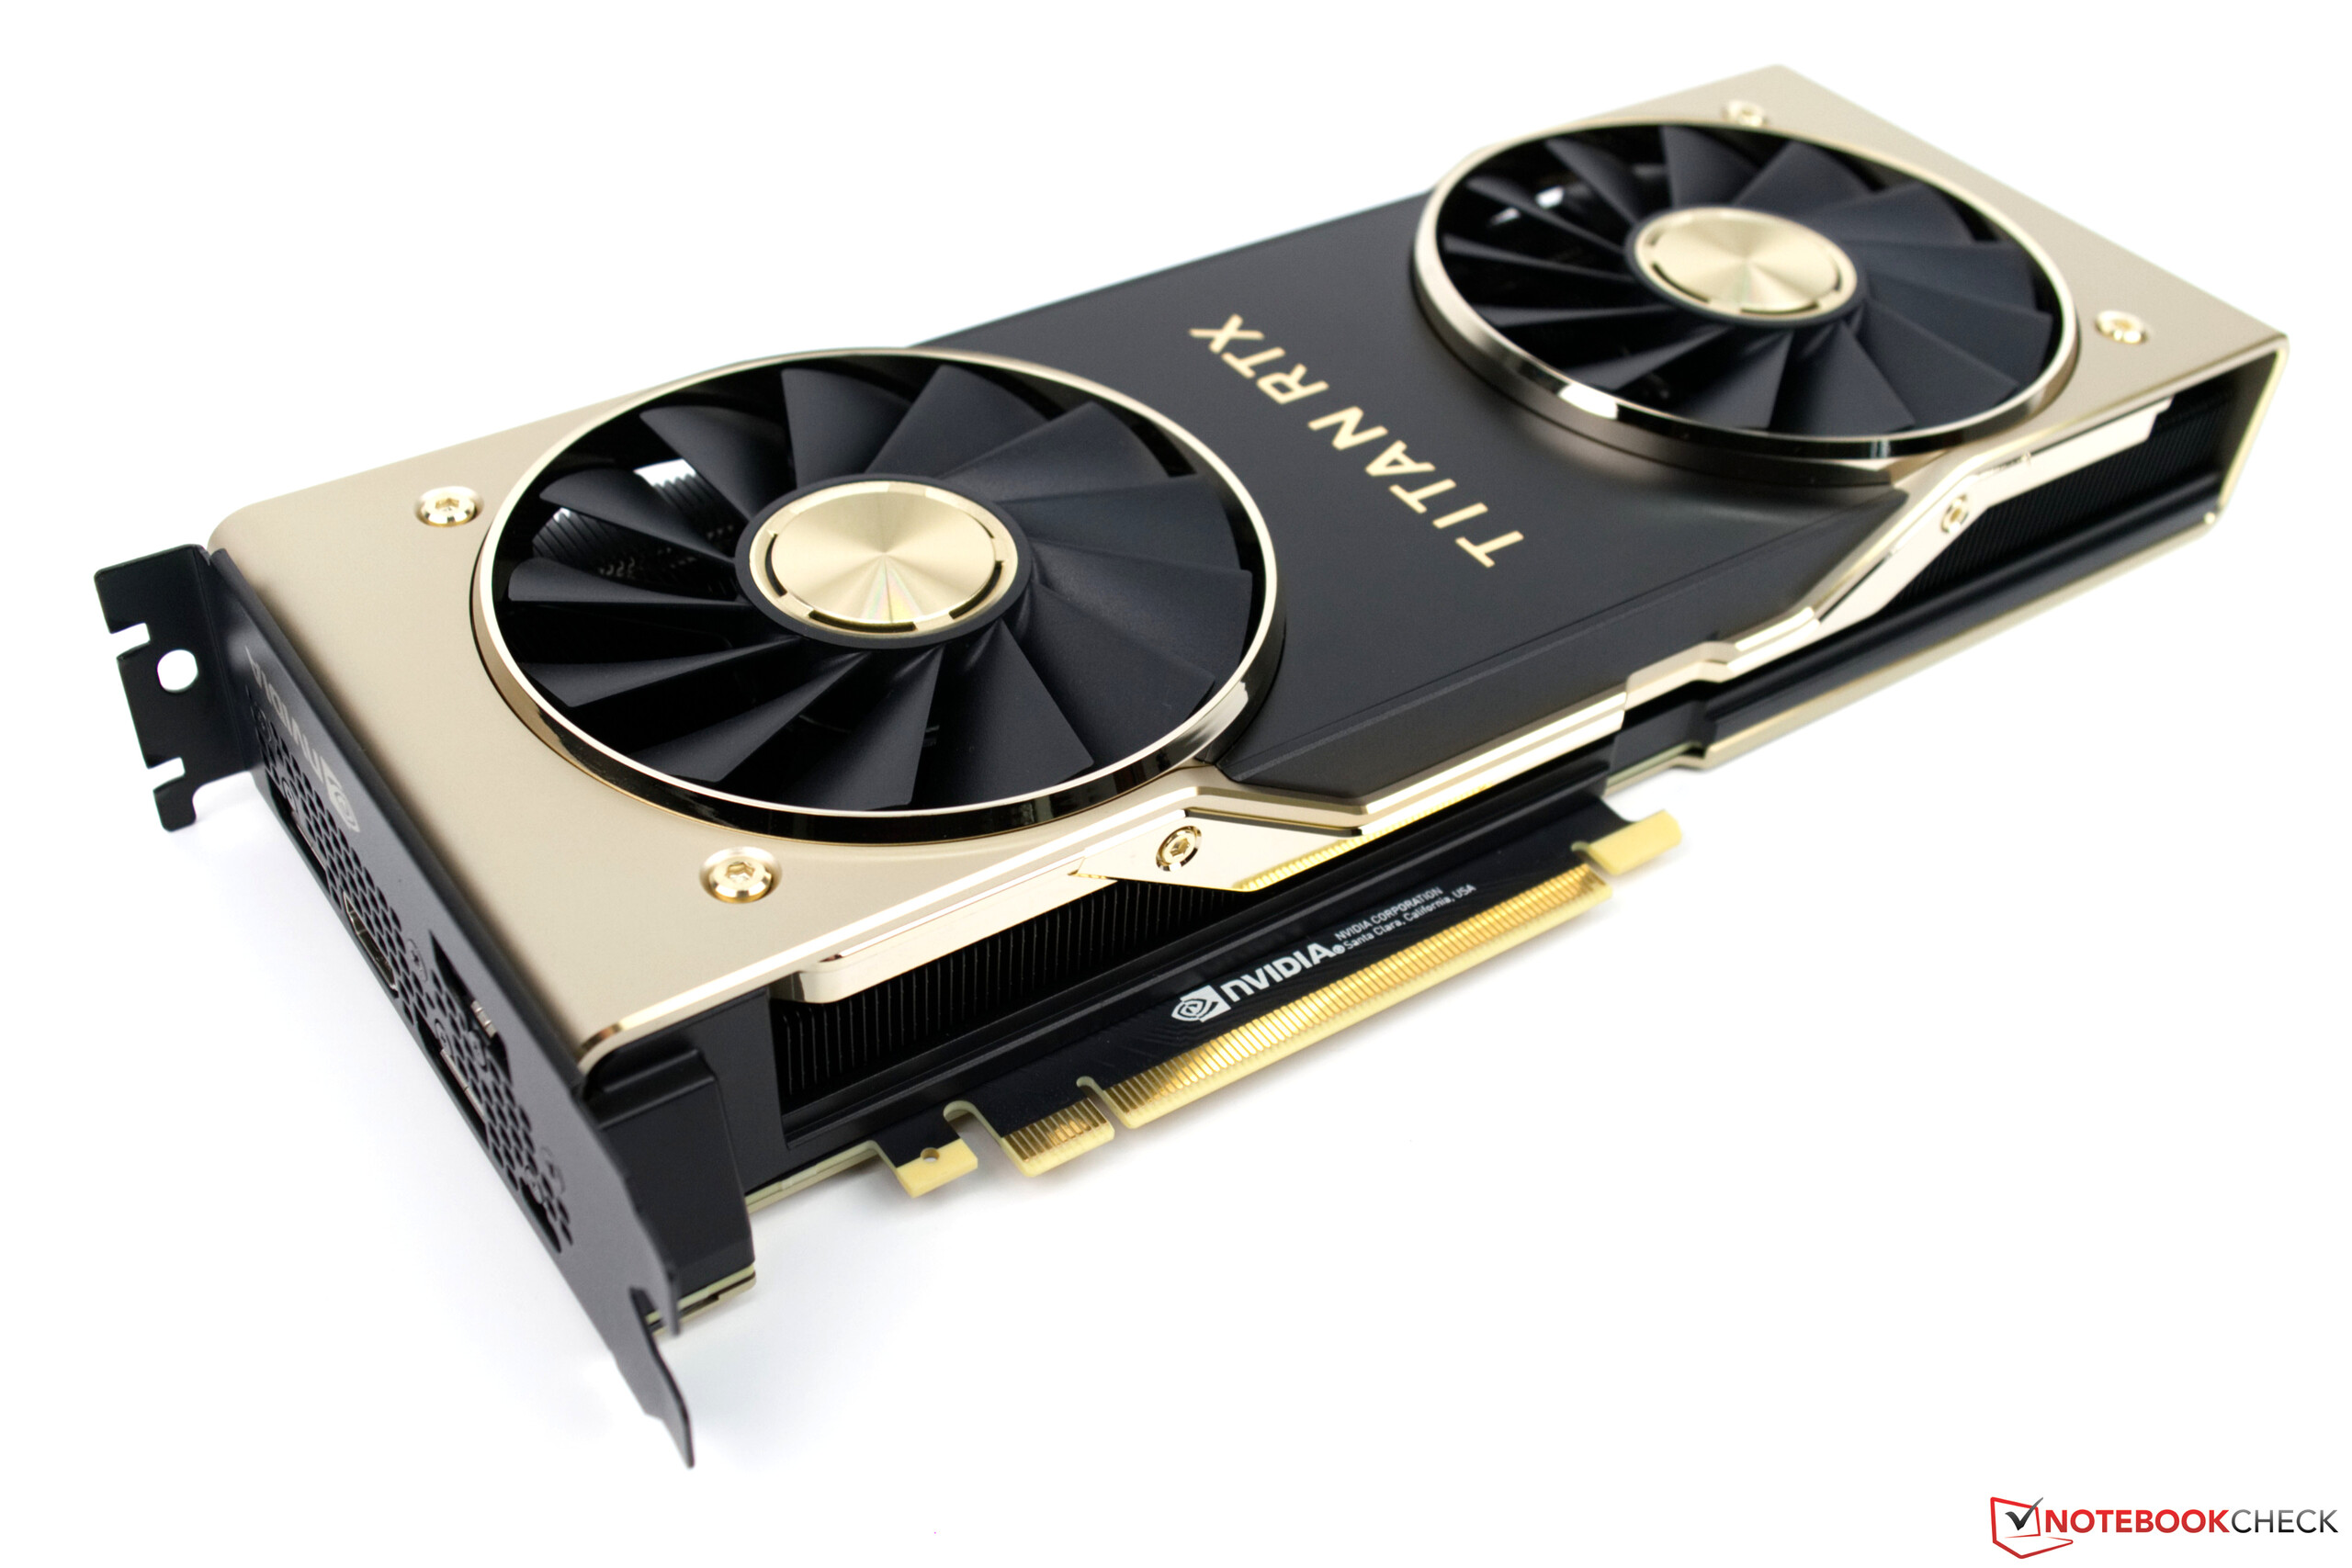
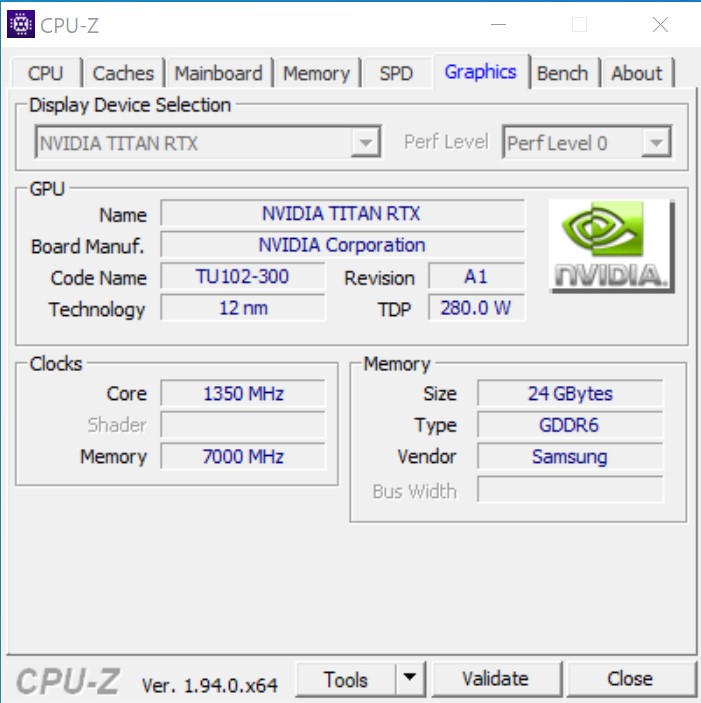
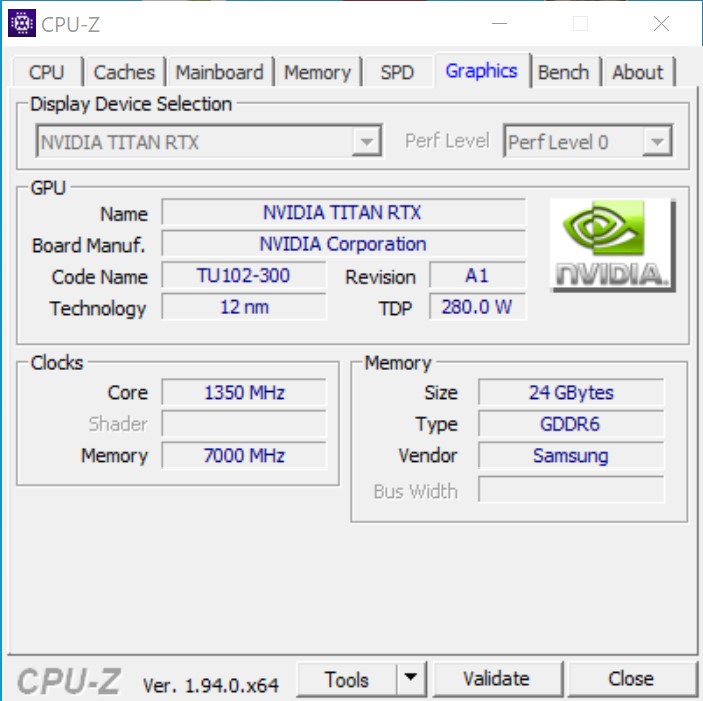
- Nvidia Titan RTX
- Fonte de alimentação Corsair HX 1200i
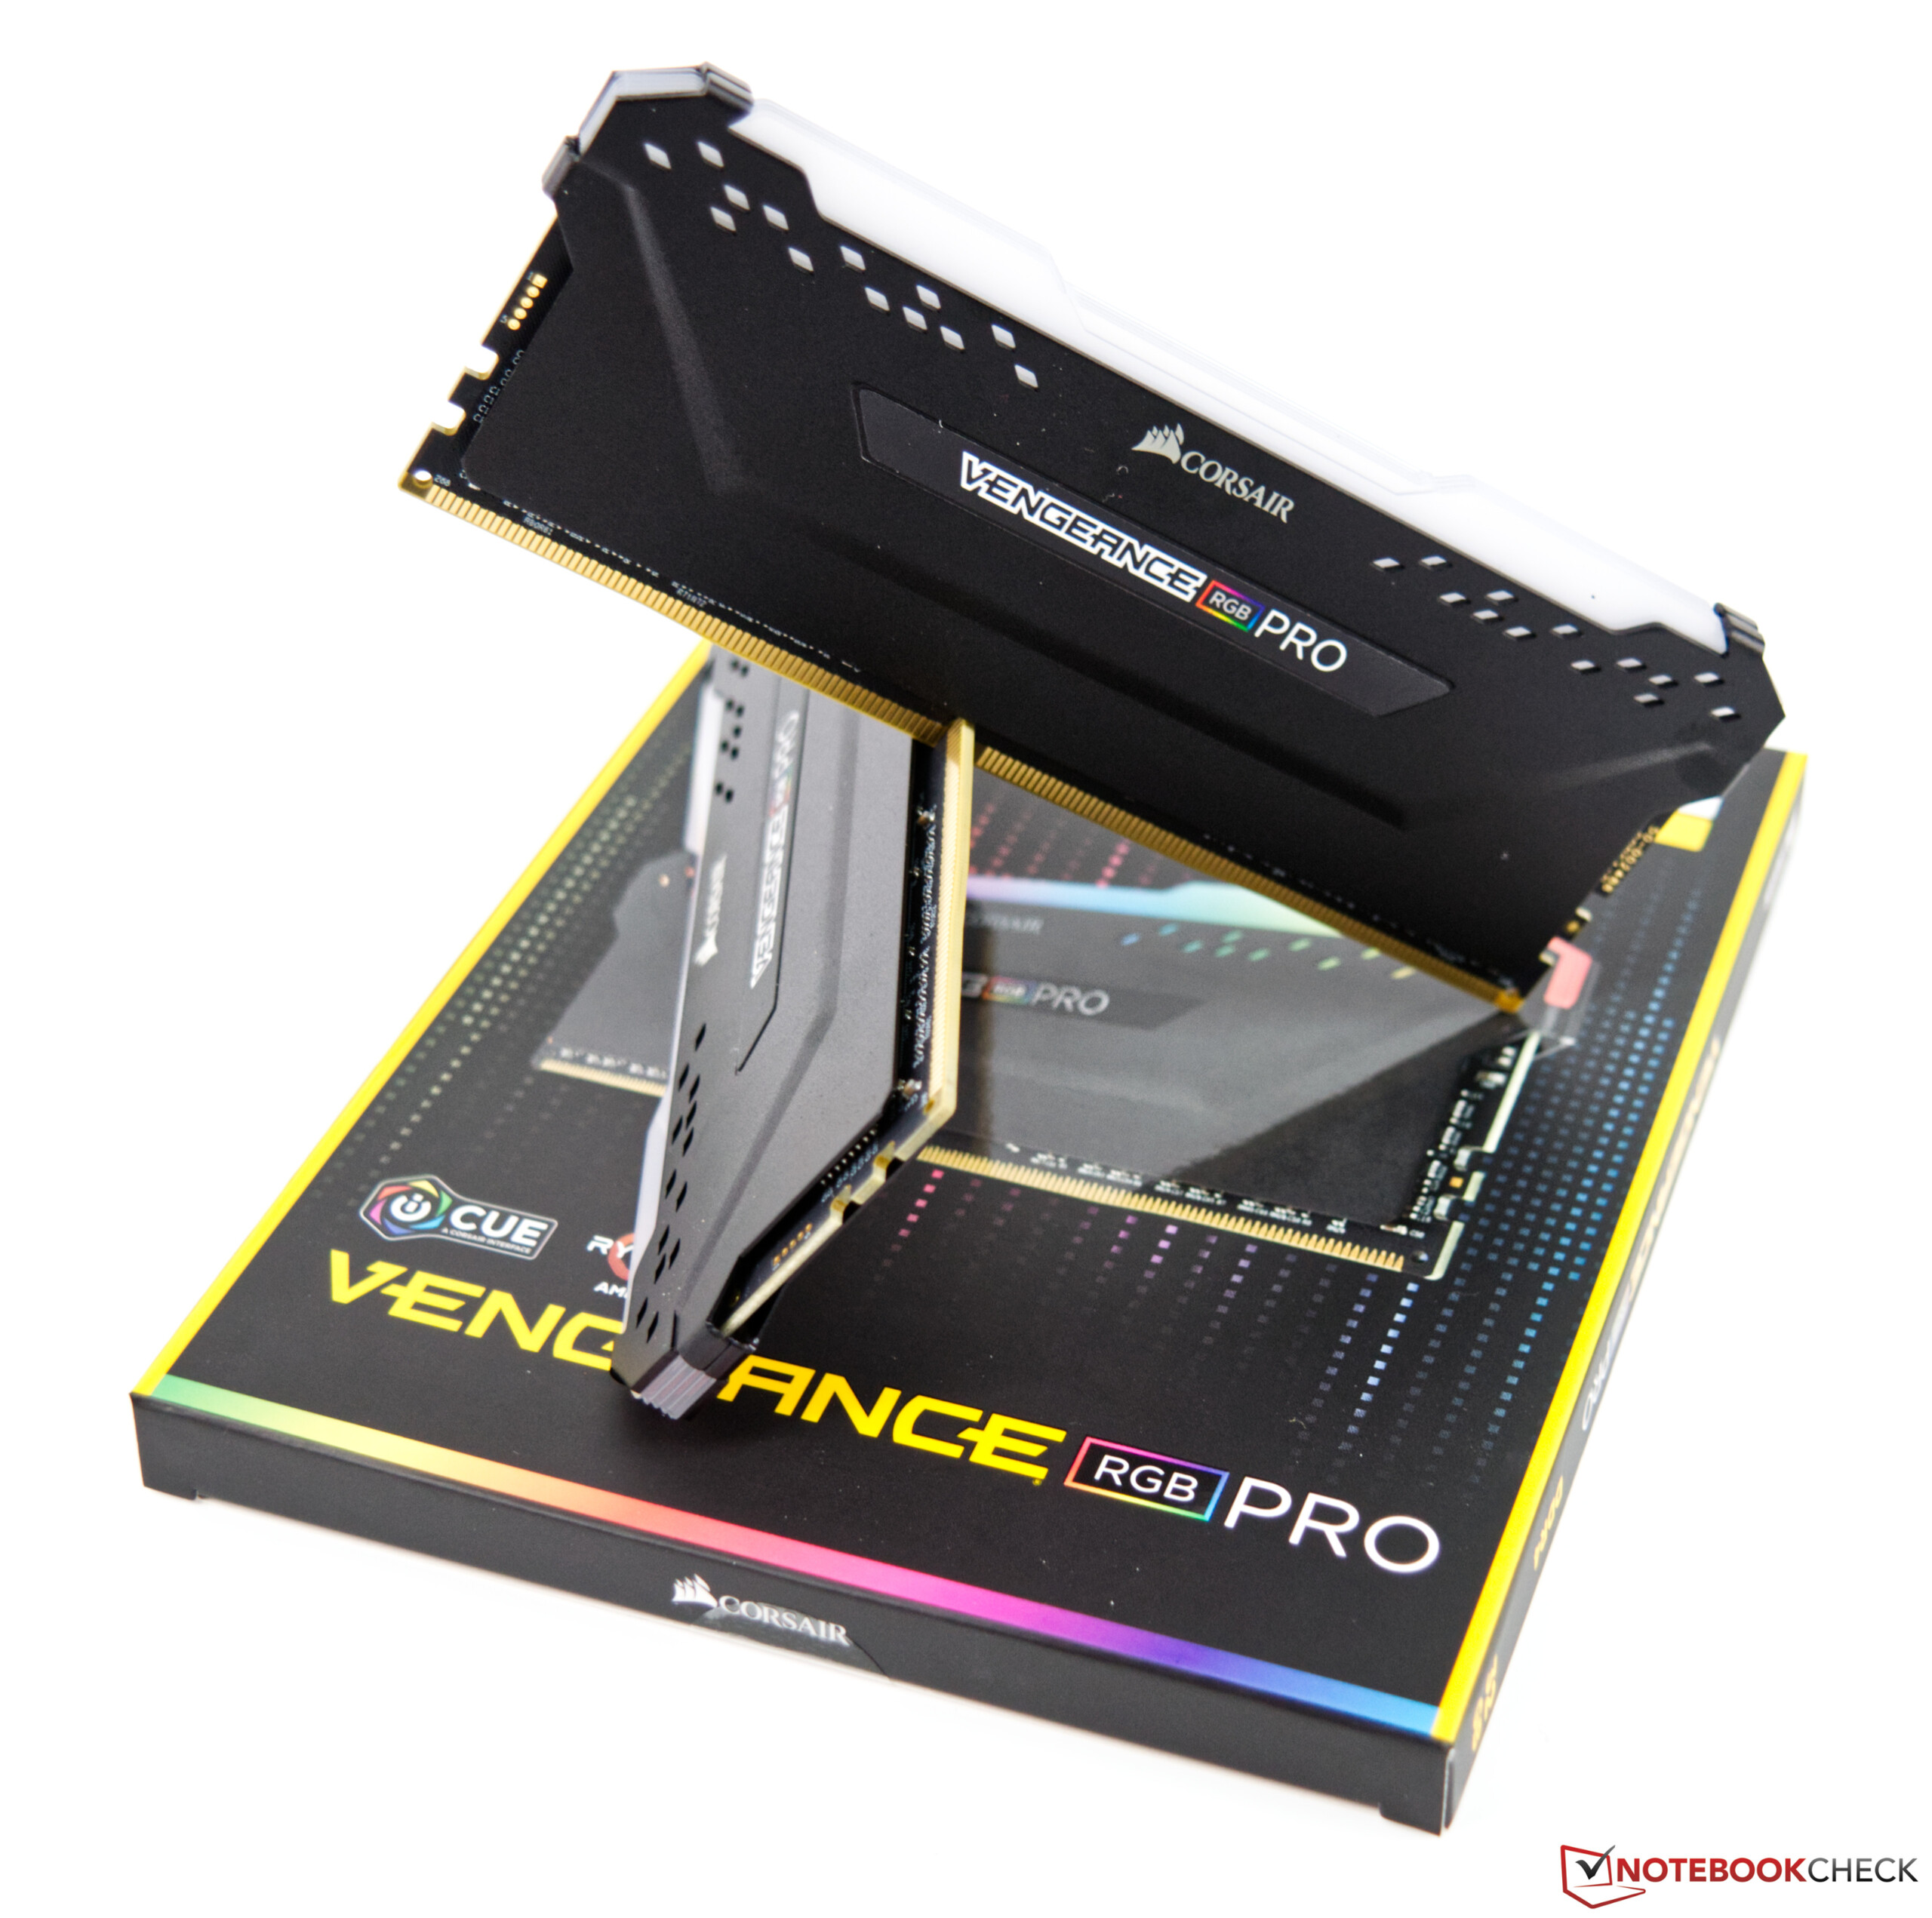
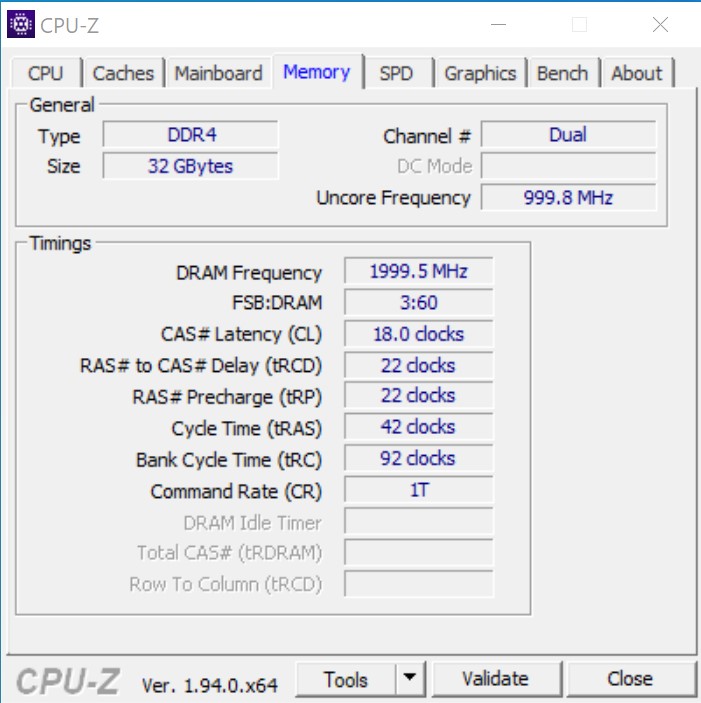
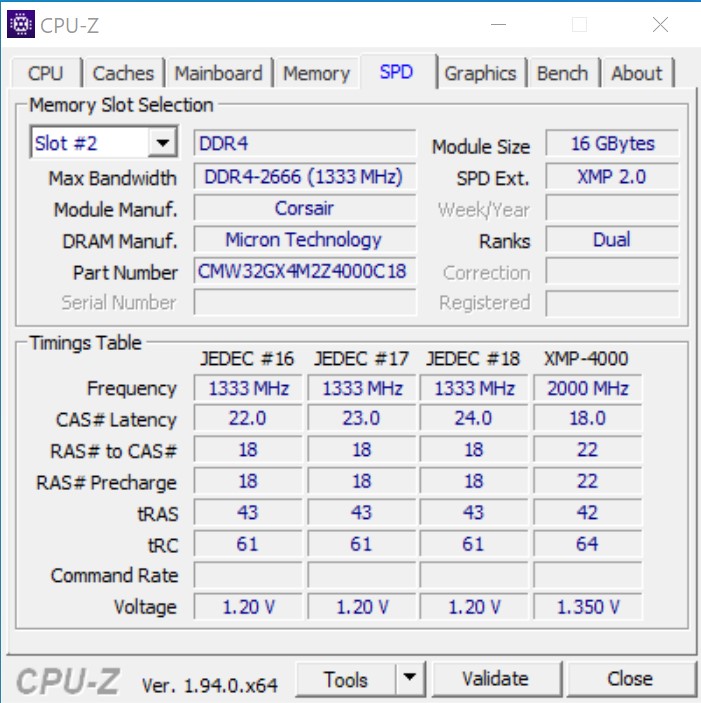
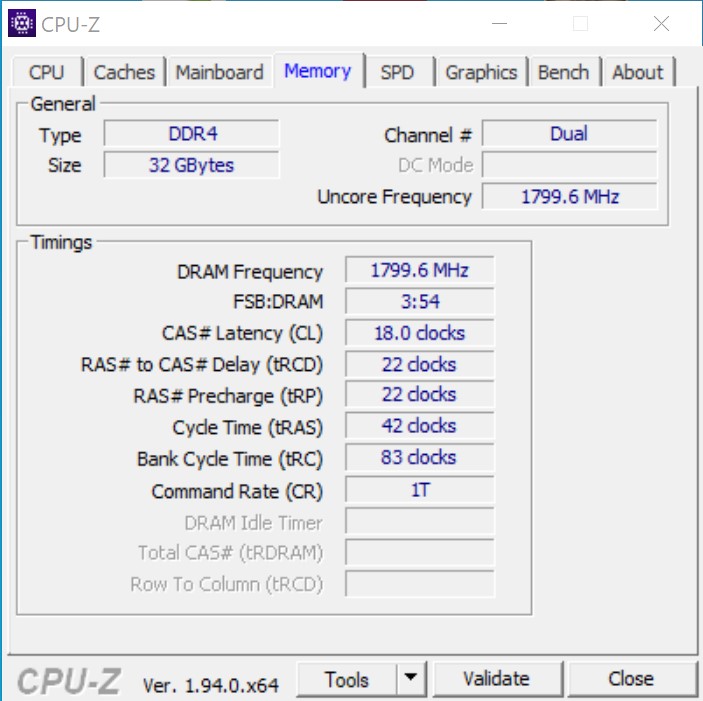
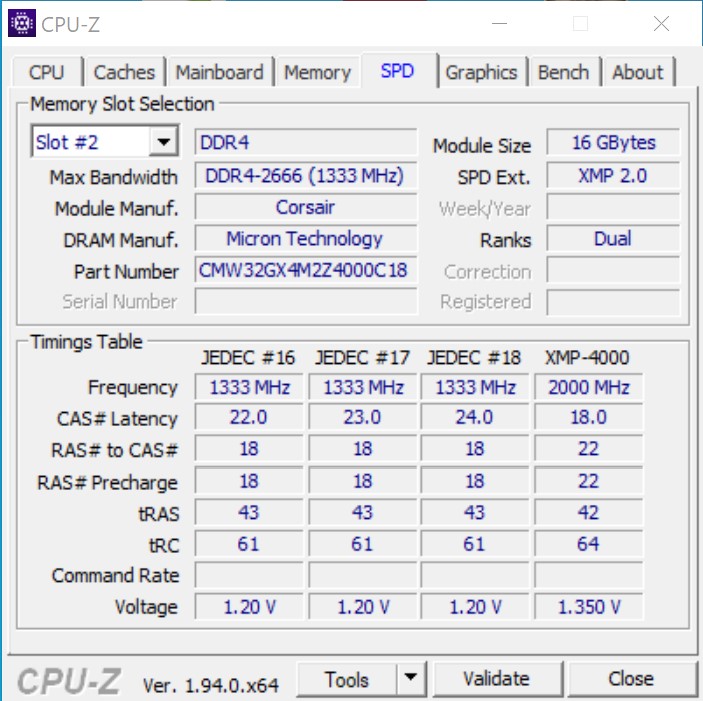
- Kit de armazenamento Corsair Vengeance RGB Pro DDR4-4000 2 x 16 GB
- SSD Intel Optane 905P 480GB PCIe
- Microsoft Windows 10 Professional 64-Bit (Versão 2004)
Neste ponto, gostaríamos de agradecer à Caseking por nos emprestar o Raijintek Pean, que também foi individualizado com gravuras a laser. A AMD Direct forneceu a placa principal, que foi incluída no kit de imprensa no lançamento dos processadores AMD Ryzen 9 3900X e AMD Ryzen 7 3700X Zen 2. Como resfriamento, usamos o Alphacool Eisbear 280 que a Alphacool nos forneceu. Gostaríamos também de agradecer a Corsair por seu apoio à memória de trabalho


Benchmarks de Processador
Já fomos capazes de determinar que as inovações da arquitetura Zen 3 foram bem sucedidas. Com o processador de 16 núcleos, a AMD está agora aumentando a fasquia mais uma vez, não apenas aumentando o desempenho multi-core. Devido ao maior impulso, o desempenho de um só núcleo também é aumentado em comparação com o AMD Ryzen 9 5900X. O processador não pára em 4,9 GHz, mas muitas vezes ultrapassa até mesmo o limite de 5 GHz. Como esperado, o AMD Ryzen 5 5600X coloca atrás de seus irmãos maiores. Entretanto, o desempenho do processador de 6 núcleos não deve ser subestimado, já que muitas vezes ele supera até mesmo o Intel Core i9-10900K na comparação de núcleo único. No desempenho de múltiplos núcleos, é quase suficiente aproximar-se do AMD Ryzen 7 3700X, mesmo que isso ofereça mais dois núcleos.
Você pode encontrar referências adicionais sobre os processadores . aqui
AMD Ryzen 9 5950X
AMD Ryzen 5 5600X
| Cinebench R20 | |
| CPU (Single Core) | |
| AMD Ryzen 9 5950X | |
| AMD Ryzen 9 5900X | |
| AMD Ryzen 7 5800X | |
| AMD Ryzen 5 5600X | |
| Intel Core i9-10900K | |
| AMD Ryzen 9 3950X | |
| AMD Ryzen 9 3900X | |
| AMD Ryzen 7 3700X | |
| AMD Ryzen 3 3300X | |
| CPU (Multi Core) | |
| AMD Ryzen 9 5950X | |
| AMD Ryzen 9 3950X | |
| AMD Ryzen 9 5900X | |
| AMD Ryzen 9 3900X | |
| Intel Core i9-10900K | |
| AMD Ryzen 7 5800X | |
| AMD Ryzen 7 3700X | |
| AMD Ryzen 5 5600X | |
| AMD Ryzen 3 3300X | |
| Cinebench R15 | |
| CPU Single 64Bit | |
| AMD Ryzen 9 5950X | |
| AMD Ryzen 9 5900X | |
| AMD Ryzen 7 5800X | |
| AMD Ryzen 5 5600X | |
| Intel Core i9-10900K | |
| AMD Ryzen 9 3900X | |
| AMD Ryzen 9 3950X | |
| AMD Ryzen 7 3700X | |
| AMD Ryzen 3 3300X | |
| CPU Multi 64Bit | |
| AMD Ryzen 9 5950X | |
| AMD Ryzen 9 3950X | |
| AMD Ryzen 9 5900X | |
| AMD Ryzen 9 3900X | |
| Intel Core i9-10900K | |
| AMD Ryzen 7 5800X | |
| AMD Ryzen 7 3700X | |
| AMD Ryzen 5 5600X | |
| AMD Ryzen 3 3300X | |
| Cinebench R11.5 | |
| CPU Single 64Bit | |
| AMD Ryzen 9 5900X | |
| AMD Ryzen 9 5950X | |
| AMD Ryzen 7 5800X | |
| AMD Ryzen 5 5600X | |
| Intel Core i9-10900K | |
| AMD Ryzen 9 3950X | |
| AMD Ryzen 9 3900X | |
| AMD Ryzen 7 3700X | |
| AMD Ryzen 3 3300X | |
| CPU Multi 64Bit | |
| AMD Ryzen 9 5950X | |
| AMD Ryzen 9 3950X | |
| AMD Ryzen 9 5900X | |
| AMD Ryzen 9 3900X | |
| AMD Ryzen 7 5800X | |
| Intel Core i9-10900K | |
| AMD Ryzen 7 3700X | |
| AMD Ryzen 5 5600X | |
| AMD Ryzen 3 3300X | |
| Cinebench R10 | |
| Rendering Single CPUs 64Bit | |
| AMD Ryzen 9 5950X | |
| AMD Ryzen 7 5800X | |
| AMD Ryzen 9 5900X | |
| AMD Ryzen 5 5600X | |
| Intel Core i9-10900K | |
| AMD Ryzen 9 3950X | |
| AMD Ryzen 9 3900X | |
| AMD Ryzen 3 3300X | |
| AMD Ryzen 7 3700X | |
| Rendering Multiple CPUs 64Bit | |
| AMD Ryzen 9 5950X | |
| AMD Ryzen 9 5900X | |
| AMD Ryzen 9 3950X | |
| AMD Ryzen 7 5800X | |
| Intel Core i9-10900K | |
| AMD Ryzen 9 3900X | |
| AMD Ryzen 5 5600X | |
| AMD Ryzen 7 3700X | |
| AMD Ryzen 3 3300X | |
| Blender - v2.79 BMW27 CPU | |
| AMD Ryzen 3 3300X | |
| AMD Ryzen 5 5600X | |
| AMD Ryzen 7 5800X | |
| AMD Ryzen 7 3700X | |
| Intel Core i9-10900K | |
| AMD Ryzen 9 3900X | |
| AMD Ryzen 9 5900X | |
| AMD Ryzen 9 3950X | |
| AMD Ryzen 9 5950X | |
| wPrime 2.10 | |
| 32m | |
| AMD Ryzen 3 3300X | |
| AMD Ryzen 9 3950X | |
| AMD Ryzen 5 5600X | |
| AMD Ryzen 7 3700X | |
| Intel Core i9-10900K | |
| AMD Ryzen 7 5800X | |
| AMD Ryzen 9 3900X | |
| AMD Ryzen 9 5950X | |
| 1024m | |
| AMD Ryzen 3 3300X | |
| AMD Ryzen 5 5600X | |
| AMD Ryzen 7 3700X | |
| AMD Ryzen 7 5800X | |
| Intel Core i9-10900K | |
| AMD Ryzen 9 5950X | |
| AMD Ryzen 9 3900X | |
| AMD Ryzen 9 3950X | |
| X264 HD Benchmark 4.0 | |
| Pass 1 | |
| AMD Ryzen 7 5800X | |
| AMD Ryzen 9 5950X | |
| AMD Ryzen 9 5900X | |
| AMD Ryzen 5 5600X | |
| Intel Core i9-10900K | |
| AMD Ryzen 7 3700X | |
| AMD Ryzen 9 3900X | |
| AMD Ryzen 9 3950X | |
| AMD Ryzen 3 3300X | |
| Pass 2 | |
| AMD Ryzen 9 5950X | |
| AMD Ryzen 9 5900X | |
| AMD Ryzen 9 3950X | |
| AMD Ryzen 7 5800X | |
| Intel Core i9-10900K | |
| AMD Ryzen 9 3900X | |
| AMD Ryzen 5 5600X | |
| AMD Ryzen 7 3700X | |
| AMD Ryzen 3 3300X | |
| WinRAR - Result | |
| AMD Ryzen 7 5800X | |
| AMD Ryzen 9 5900X | |
| AMD Ryzen 5 5600X | |
| AMD Ryzen 9 5950X | |
| Intel Core i9-10900K | |
| AMD Ryzen 9 3900X | |
| AMD Ryzen 7 3700X | |
| AMD Ryzen 9 3950X | |
| AMD Ryzen 3 3300X | |
| TrueCrypt | |
| AES Mean 100MB | |
| AMD Ryzen 9 5950X | |
| AMD Ryzen 9 5900X | |
| AMD Ryzen 7 5800X | |
| Intel Core i9-10900K | |
| AMD Ryzen 7 3700X | |
| AMD Ryzen 9 3900X | |
| AMD Ryzen 9 3950X | |
| AMD Ryzen 5 5600X | |
| AMD Ryzen 3 3300X | |
| Twofish Mean 100MB | |
| AMD Ryzen 9 5950X | |
| AMD Ryzen 9 3950X | |
| AMD Ryzen 9 3900X | |
| AMD Ryzen 9 5900X | |
| Intel Core i9-10900K | |
| AMD Ryzen 7 3700X | |
| AMD Ryzen 7 5800X | |
| AMD Ryzen 5 5600X | |
| AMD Ryzen 3 3300X | |
| Serpent Mean 100MB | |
| AMD Ryzen 9 5950X | |
| AMD Ryzen 9 3950X | |
| AMD Ryzen 9 5900X | |
| AMD Ryzen 9 3900X | |
| Intel Core i9-10900K | |
| AMD Ryzen 7 5800X | |
| AMD Ryzen 7 3700X | |
| AMD Ryzen 5 5600X | |
| AMD Ryzen 3 3300X | |
| Geekbench 5.5 | |
| Multi-Core | |
| AMD Ryzen 9 5950X | |
| AMD Ryzen 9 5900X | |
| AMD Ryzen 9 3950X | |
| Intel Core i9-10900K | |
| AMD Ryzen 7 5800X | |
| AMD Ryzen 9 3900X | |
| AMD Ryzen 5 5600X | |
| AMD Ryzen 7 3700X | |
| AMD Ryzen 3 3300X | |
| Single-Core | |
| AMD Ryzen 9 5950X | |
| AMD Ryzen 9 5900X | |
| AMD Ryzen 7 5800X | |
| AMD Ryzen 5 5600X | |
| Intel Core i9-10900K | |
| AMD Ryzen 9 3950X | |
| AMD Ryzen 7 3700X | |
| AMD Ryzen 3 3300X | |
| AMD Ryzen 9 3900X | |
| Geekbench 5.0 | |
| 5.0 Multi-Core | |
| AMD Ryzen 9 5950X | |
| AMD Ryzen 9 3950X | |
| AMD Ryzen 9 5900X | |
| Intel Core i9-10900K | |
| AMD Ryzen 7 5800X | |
| AMD Ryzen 9 3900X | |
| AMD Ryzen 5 5600X | |
| AMD Ryzen 3 3300X | |
| 5.0 Single-Core | |
| AMD Ryzen 9 5950X | |
| AMD Ryzen 7 5800X | |
| AMD Ryzen 9 5900X | |
| AMD Ryzen 5 5600X | |
| Intel Core i9-10900K | |
| AMD Ryzen 9 3950X | |
| AMD Ryzen 3 3300X | |
| AMD Ryzen 9 3900X | |
| Geekbench 4.4 | |
| 64 Bit Single-Core Score | |
| AMD Ryzen 7 5800X | |
| AMD Ryzen 9 5900X | |
| AMD Ryzen 9 5950X | |
| AMD Ryzen 5 5600X | |
| Intel Core i9-10900K | |
| AMD Ryzen 9 3900X | |
| AMD Ryzen 7 3700X | |
| AMD Ryzen 3 3300X | |
| AMD Ryzen 9 3950X | |
| 64 Bit Multi-Core Score | |
| AMD Ryzen 9 5950X | |
| AMD Ryzen 9 5900X | |
| AMD Ryzen 9 3950X | |
| AMD Ryzen 7 5800X | |
| AMD Ryzen 9 3900X | |
| Intel Core i9-10900K | |
| AMD Ryzen 5 5600X | |
| AMD Ryzen 7 3700X | |
| AMD Ryzen 3 3300X | |
| 3DMark 11 - 1280x720 Performance Physics | |
| AMD Ryzen 9 5950X | |
| AMD Ryzen 9 5900X | |
| AMD Ryzen 7 5800X | |
| Intel Core i9-10900K | |
| AMD Ryzen 9 3950X | |
| AMD Ryzen 5 5600X | |
| AMD Ryzen 9 3900X | |
| AMD Ryzen 7 3700X | |
| AMD Ryzen 3 3300X | |
| 7-Zip 18.03 | |
| 7z b 4 | |
| AMD Ryzen 9 5950X | |
| AMD Ryzen 9 3950X | |
| AMD Ryzen 9 5900X | |
| AMD Ryzen 9 3900X | |
| AMD Ryzen 7 5800X | |
| Intel Core i9-10900K | |
| AMD Ryzen 7 3700X | |
| AMD Ryzen 5 5600X | |
| AMD Ryzen 3 3300X | |
| 7z b 4 -mmt1 | |
| AMD Ryzen 9 5950X | |
| AMD Ryzen 7 5800X | |
| AMD Ryzen 9 5900X | |
| AMD Ryzen 5 5600X | |
| Intel Core i9-10900K | |
| AMD Ryzen 9 3900X | |
| AMD Ryzen 9 3950X | |
| AMD Ryzen 7 3700X | |
| AMD Ryzen 3 3300X | |
| HWBOT x265 Benchmark v2.2 - 4k Preset | |
| AMD Ryzen 9 5950X | |
| AMD Ryzen 9 5900X | |
| Intel Core i9-10900K | |
| AMD Ryzen 9 3900X | |
| AMD Ryzen 7 5800X | |
| AMD Ryzen 9 3950X | |
| AMD Ryzen 5 5600X | |
| AMD Ryzen 7 3700X | |
| AMD Ryzen 3 3300X | |
| R Benchmark 2.5 - Overall mean | |
| AMD Ryzen 9 3900X | |
| AMD Ryzen 3 3300X | |
| Intel Core i9-10900K | |
| AMD Ryzen 9 3950X | |
| AMD Ryzen 5 5600X | |
| AMD Ryzen 9 5950X | |
| AMD Ryzen 9 5900X | |
| AMD Ryzen 7 5800X | |
| LibreOffice - 20 Documents To PDF | |
| Intel Core i9-10900K | |
| AMD Ryzen 9 3900X | |
| AMD Ryzen 9 3950X | |
| AMD Ryzen 3 3300X | |
| AMD Ryzen 9 5900X | |
| AMD Ryzen 9 5950X | |
| AMD Ryzen 5 5600X | |
| AMD Ryzen 7 5800X | |
| WebXPRT 3 - Overall | |
| AMD Ryzen 7 5800X | |
| AMD Ryzen 9 5950X | |
| AMD Ryzen 5 5600X | |
| AMD Ryzen 9 5900X | |
| Intel Core i9-10900K | |
| AMD Ryzen 9 3950X | |
| AMD Ryzen 3 3300X | |
| Mozilla Kraken 1.1 - Total | |
| AMD Ryzen 3 3300X | |
| Intel Core i9-10900K | |
| AMD Ryzen 9 3950X | |
| AMD Ryzen 5 5600X | |
| AMD Ryzen 9 5900X | |
| AMD Ryzen 7 5800X | |
| AMD Ryzen 9 5950X | |
| 3DMark | |
| 3840x2160 Fire Strike Ultra Physics | |
| AMD Ryzen 9 5950X | |
| AMD Ryzen 9 5900X | |
| AMD Ryzen 9 3950X | |
| AMD Ryzen 7 5800X | |
| Intel Core i9-10900K | |
| AMD Ryzen 9 3900X | |
| AMD Ryzen 5 5600X | |
| AMD Ryzen 7 3700X | |
| AMD Ryzen 3 3300X | |
| 1920x1080 Fire Strike Physics | |
| AMD Ryzen 9 5950X | |
| AMD Ryzen 9 5900X | |
| AMD Ryzen 9 3950X | |
| AMD Ryzen 7 5800X | |
| Intel Core i9-10900K | |
| AMD Ryzen 9 3900X | |
| AMD Ryzen 5 5600X | |
| AMD Ryzen 7 3700X | |
| AMD Ryzen 3 3300X | |
| 2560x1440 Time Spy CPU | |
| Intel Core i9-10900K | |
| AMD Ryzen 9 5950X | |
| AMD Ryzen 9 5900X | |
| AMD Ryzen 9 3950X | |
| AMD Ryzen 9 3900X | |
| AMD Ryzen 7 5800X | |
| AMD Ryzen 7 3700X | |
| AMD Ryzen 5 5600X | |
| AMD Ryzen 3 3300X | |
* ... menor é melhor
Teste de carga com o Cinebench R15 Multi Loop
No teste de carga com o Cinebench R15 multi loop, nem o AMD Ryzen 9 5950X nem o AMD Ryzen 5 5600X têm qualquer problema. O AiO incorporado junto com o radiador de 280 milímetros (11 pol.) não têm problemas para resfriar os processadores de forma confiável. A propósito, é significativamente mais fácil resfriar oAMD Ryzen 5 5600X devido ao seu menor consumo de energia.
O desempenho do jogo dos processadores Ryzen 3000
Desde 11/5/2020, é oficial que a AMD oferece a CPU de jogos mais rápida neste momento. No entanto, a AMD Ryzen 9 5950X ainda é capaz de espremer mais alguns FPS da Nvidia Titan RTX em alguns jogos. No entanto, isto não faz uma diferença notável para a diversão dos jogos. Com o aumento da resolução e da qualidade, as vantagens das CPUs começam a derreter, de modo que até mesmo o AMD Ryzen 5 5600X é capaz de acompanhar o AMD Ryzen 9 5950X. Se você só está preocupado com o desempenho puro dos jogos, não está cometendo nenhum erro se decidir pelo processador de nível básico. Os criadores de conteúdo, bem como as streamers, por exemplo, são capazes de se dar bem sem um PC de streaming separado, se escolherem o AMD Ryzen 9 5950X. Isto oferece recursos suficientes para lidar também com o streaming online, além do jogo puro.
| 3DMark 11 - 1280x720 Performance GPU | |
| Intel Core i7-10700K | |
| Intel Core i9-10900K | |
| AMD Ryzen 9 5950X | |
| AMD Ryzen 7 5800X | |
| AMD Ryzen 5 5600X | |
| AMD Ryzen 7 3800XT | |
| AMD Ryzen 3 3300X | |
| AMD Ryzen 9 5900X | |
| AMD Ryzen 3 3100 | |
| AMD Ryzen 9 3950X | |
| AMD Ryzen 5 1600 | |
| AMD Ryzen 3 3100 | |
| AMD Ryzen 9 3900X | |
| AMD Ryzen 7 2700X | |
| 3DMark | |
| 2560x1440 Time Spy Graphics | |
| AMD Ryzen 9 5900X | |
| AMD Ryzen 9 5950X | |
| AMD Ryzen 5 5600X | |
| AMD Ryzen 7 3800XT | |
| AMD Ryzen 7 5800X | |
| AMD Ryzen 3 3300X | |
| Intel Core i9-10900K | |
| AMD Ryzen 9 3900X | |
| AMD Ryzen 5 1600 | |
| AMD Ryzen 3 3100 | |
| Intel Core i7-10700K | |
| AMD Ryzen 9 3950X | |
| AMD Ryzen 7 2700X | |
| 1280x720 Sky Diver Graphics | |
| Intel Core i7-10700K | |
| Intel Core i9-10900K | |
| AMD Ryzen 9 5900X | |
| AMD Ryzen 7 5800X | |
| AMD Ryzen 5 5600X | |
| AMD Ryzen 9 3900X | |
| AMD Ryzen 9 5950X | |
| AMD Ryzen 9 3950X | |
| AMD Ryzen 7 3800XT | |
| AMD Ryzen 3 3300X | |
| AMD Ryzen 7 2700X | |
| AMD Ryzen 5 1600 | |
| AMD Ryzen 3 3100 | |
| 1280x720 Cloud Gate Standard Graphics | |
| Intel Core i7-10700K | |
| Intel Core i9-10900K | |
| AMD Ryzen 7 5800X | |
| AMD Ryzen 9 5900X | |
| AMD Ryzen 5 5600X | |
| AMD Ryzen 9 5950X | |
| AMD Ryzen 9 3900X | |
| AMD Ryzen 9 3950X | |
| AMD Ryzen 7 3800XT | |
| AMD Ryzen 3 3300X | |
| AMD Ryzen 3 3100 | |
| AMD Ryzen 5 1600 | |
| AMD Ryzen 7 2700X | |
| 1920x1080 Fire Strike Graphics | |
| Intel Core i7-10700K | |
| AMD Ryzen 7 5800X | |
| Intel Core i9-10900K | |
| AMD Ryzen 9 5950X | |
| AMD Ryzen 5 5600X | |
| AMD Ryzen 3 3100 | |
| AMD Ryzen 3 3100 | |
| AMD Ryzen 3 3300X | |
| AMD Ryzen 7 3800XT | |
| AMD Ryzen 7 2700X | |
| AMD Ryzen 9 3900X | |
| AMD Ryzen 9 5900X | |
| AMD Ryzen 5 1600 | |
| AMD Ryzen 9 3950X | |
| Unigine Heaven 4.0 | |
| Extreme Preset DX11 | |
| AMD Ryzen 9 5900X | |
| AMD Ryzen 9 5950X | |
| AMD Ryzen 7 5800X | |
| AMD Ryzen 9 3900X | |
| AMD Ryzen 5 5600X | |
| AMD Ryzen 7 2700X | |
| Extreme Preset OpenGL | |
| AMD Ryzen 7 5800X | |
| AMD Ryzen 9 5900X | |
| AMD Ryzen 9 5950X | |
| AMD Ryzen 9 3900X | |
| AMD Ryzen 5 5600X | |
| AMD Ryzen 7 2700X | |
| Unigine Valley 1.0 | |
| 1920x1080 Extreme HD Preset OpenGL AA:x8 | |
| AMD Ryzen 9 5900X | |
| AMD Ryzen 7 5800X | |
| AMD Ryzen 9 5950X | |
| AMD Ryzen 5 5600X | |
| AMD Ryzen 9 3900X | |
| AMD Ryzen 7 2700X | |
| 1920x1080 Extreme HD DirectX AA:x8 | |
| AMD Ryzen 9 5950X | |
| AMD Ryzen 9 5900X | |
| AMD Ryzen 7 5800X | |
| AMD Ryzen 5 5600X | |
| AMD Ryzen 9 3900X | |
| AMD Ryzen 7 2700X | |
| Unigine Superposition | |
| 1280x720 720p Low | |
| AMD Ryzen 7 5800X | |
| AMD Ryzen 5 5600X | |
| AMD Ryzen 9 5950X | |
| AMD Ryzen 9 5900X | |
| AMD Ryzen 9 3900X | |
| 1920x1080 1080p Extreme | |
| AMD Ryzen 9 5900X | |
| AMD Ryzen 7 5800X | |
| AMD Ryzen 9 5950X | |
| AMD Ryzen 5 5600X | |
| AMD Ryzen 9 3900X | |
| 7680x4320 8k Optimized | |
| AMD Ryzen 9 5900X | |
| AMD Ryzen 5 5600X | |
| AMD Ryzen 7 5800X | |
| AMD Ryzen 9 5950X | |
| AMD Ryzen 9 3900X | |
Ryzen 9 5950X with Nvidia Titan RTX
| baixo | média | alto | ultra | QHD | 4K | |
|---|---|---|---|---|---|---|
| GTA V (2015) | 187 | 186 | 182 | 121 | 113 | 134 |
| The Witcher 3 (2015) | 594 | 420 | 271 | 141 | 102 | |
| Dota 2 Reborn (2015) | 214.5 | 192.3 | 193.3 | 179.2 | 161.6 | |
| Final Fantasy XV Benchmark (2018) | 225 | 183 | 141 | 105 | 63.4 | |
| X-Plane 11.11 (2018) | 168 | 152 | 117 | 101 | ||
| Far Cry 5 (2018) | 201 | 174 | 166 | 154 | 137 | 80 |
| Strange Brigade (2018) | 604 | 350 | 286 | 241 | 183 | 110 |
| Shadow of the Tomb Raider (2018) | 225.1 | 184.2 | 177.9 | 166.1 | 120.1 | 66.4 |
| Far Cry New Dawn (2019) | 165 | 142 | 123 | 115 | 82 | |
| Metro Exodus (2019) | 232 | 172 | 133 | 106 | 86.1 | 56.4 |
| Borderlands 3 (2019) | 217 | 182 | 141 | 117 | 84.4 | 46.6 |
Ryzen 5 5600X with Nvidia Titan RTX
| baixo | média | alto | ultra | QHD | 4K | |
|---|---|---|---|---|---|---|
| GTA V (2015) | 187 | 186 | 181 | 118 | 109 | 133 |
| The Witcher 3 (2015) | 570 | 413 | 268 | 139 | 101 | |
| Dota 2 Reborn (2015) | 228.9 | 200.7 | 191 | 180 | 168.3 | |
| Final Fantasy XV Benchmark (2018) | 225 | 179 | 138 | 104 | 63.2 | |
| X-Plane 11.11 (2018) | 172 | 156 | 123 | 105 | ||
| Far Cry 5 (2018) | 200 | 171 | 166 | 153 | 135 | 80 |
| Strange Brigade (2018) | 643 | 351 | 286 | 243 | 184 | 110 |
| Shadow of the Tomb Raider (2018) | 217 | 185 | 178 | 165 | 121 | 66.5 |
| Far Cry New Dawn (2019) | 164 | 144 | 136 | 123 | 116 | 81 |
| Metro Exodus (2019) | 236 | 172 | 133 | 107 | 85.4 | 54.6 |
| Borderlands 3 (2019) | 214 | 177 | 138 | 115 | 83.9 | 46.5 |
Desempenho de aplicação
Como já vimos nos benchmarks de CPU, todos os novos processadores Vermeer estão em uma trajetória muito boa em termos de desempenho. Isto também se reflete em nossa aplicação e testes. O sistema inteiro funciona muito rápido, mesmo que o SSD não utilize o mais novo padrão PCI Express 4.0. No entanto, no uso diário isto não é uma desvantagem, uma vez que o Intel Optane 905P ainda pertence aos SSDs PCIe mais rápidos.
No PCMark 10, o AMD Ryzen 9 5950X é capaz de sair por cima e alcançar uma pequena vantagem de 4% em comparação com o AMD Ryzen 9 5900X. O menor Ryzen 5 5600X está ao nível dos olhos com o AMD Ryzen 7 5800X
, mas claramente melhor do que o modelo superior mais antigo, o AMD Ryzen 9 3950X. Os processadores Intel só podem ser encontrados no meio do campo com uma desvantagem de 15% em comparação com o Ryzen 9 5950X.
Nos testes de renderização, o resultado geral parece mais misto, já que a placa gráfica é o fator limitante aqui. No entanto, é possível ver em alguns testes que com um número crescente de núcleos, o desempenho também está aumentando, embora o número de núcleos de CPU não tenha importância em algumas cargas de trabalho. Aqui, você tem que pesar cuidadosamente o que é mais importante para você, se você não estiver sempre disposto a escolher o modelo top.
| PCMark 10 - Score | |
| AMD Ryzen 9 5950X, NVIDIA Titan RTX, Intel Optane 905P 480GB 2.5 | |
| AMD Ryzen 9 5900X, NVIDIA Titan RTX, Intel Optane 905P 480GB 2.5 | |
| AMD Ryzen 5 5600X, NVIDIA Titan RTX, Intel Optane 905P 480GB 2.5 | |
| AMD Ryzen 7 5800X, NVIDIA Titan RTX, Intel Optane 905P 480GB 2.5 | |
| AMD Ryzen 9 3950X, NVIDIA Titan RTX, Intel Optane 905P 480GB 2.5 | |
| AMD Ryzen 7 3800XT, NVIDIA Titan RTX, Intel Optane 905P 480GB 2.5 | |
| Intel Core i9-10900K, NVIDIA Titan RTX, WDC PC SN720 SDAQNTW-512G | |
| Intel Core i7-10700K, NVIDIA Titan RTX, Intel Optane 905P 480GB 2.5 | |
| AMD Ryzen 9 3900X, NVIDIA Titan RTX, Corsair MP600 | |
| AMD Ryzen 3 3300X, NVIDIA Titan RTX, Intel Optane 905P 480GB 2.5 | |
| AMD Ryzen 3 3100, NVIDIA Titan RTX, Intel Optane 905P 480GB 2.5 | |
| AMD Ryzen 5 1600, NVIDIA Titan RTX, Intel Optane 905P 480GB 2.5 | |
| SPECviewperf 12 | |
| 1900x1060 Solidworks (sw-03) | |
| AMD Ryzen 7 5800X, NVIDIA Titan RTX, Intel Optane 905P 480GB 2.5 | |
| AMD Ryzen 9 5950X, NVIDIA Titan RTX, Intel Optane 905P 480GB 2.5 | |
| AMD Ryzen 5 5600X, NVIDIA Titan RTX, Intel Optane 905P 480GB 2.5 | |
| AMD Ryzen 9 5900X, NVIDIA Titan RTX, Intel Optane 905P 480GB 2.5 | |
| Intel Core i9-10900K, NVIDIA Titan RTX, WDC PC SN720 SDAQNTW-512G | |
| Intel Core i7-10700K, NVIDIA Titan RTX, Intel Optane 905P 480GB 2.5 | |
| AMD Ryzen 7 3800XT, NVIDIA Titan RTX, Intel Optane 905P 480GB 2.5 | |
| AMD Ryzen 9 3950X, NVIDIA Titan RTX, Intel Optane 905P 480GB 2.5 | |
| AMD Ryzen 9 3900X, NVIDIA Titan RTX, Corsair MP600 | |
| AMD Ryzen 3 3300X, NVIDIA Titan RTX, Intel Optane 905P 480GB 2.5 | |
| AMD Ryzen 7 2700X, NVIDIA Titan RTX, ADATA Premier Pro SP900NS38 512 GB | |
| AMD Ryzen 5 1600, NVIDIA Titan RTX, Intel Optane 905P 480GB 2.5 | |
| AMD Ryzen 3 3100, NVIDIA Titan RTX, Intel Optane 905P 480GB 2.5 | |
| 1900x1060 Siemens NX (snx-02) | |
| Intel Core i7-10700K, NVIDIA Titan RTX, Intel Optane 905P 480GB 2.5 | |
| AMD Ryzen 9 5900X, NVIDIA Titan RTX, Intel Optane 905P 480GB 2.5 | |
| AMD Ryzen 7 5800X, NVIDIA Titan RTX, Intel Optane 905P 480GB 2.5 | |
| AMD Ryzen 5 5600X, NVIDIA Titan RTX, Intel Optane 905P 480GB 2.5 | |
| AMD Ryzen 9 3900X, NVIDIA Titan RTX, Corsair MP600 | |
| AMD Ryzen 9 5950X, NVIDIA Titan RTX, Intel Optane 905P 480GB 2.5 | |
| Intel Core i9-10900K, NVIDIA Titan RTX, WDC PC SN720 SDAQNTW-512G | |
| AMD Ryzen 7 3800XT, NVIDIA Titan RTX, Intel Optane 905P 480GB 2.5 | |
| AMD Ryzen 7 2700X, NVIDIA Titan RTX, ADATA Premier Pro SP900NS38 512 GB | |
| AMD Ryzen 9 3950X, NVIDIA Titan RTX, Intel Optane 905P 480GB 2.5 | |
| AMD Ryzen 3 3300X, NVIDIA Titan RTX, Intel Optane 905P 480GB 2.5 | |
| AMD Ryzen 5 1600, NVIDIA Titan RTX, Intel Optane 905P 480GB 2.5 | |
| AMD Ryzen 3 3100, NVIDIA Titan RTX, Intel Optane 905P 480GB 2.5 | |
| 1900x1060 Showcase (showcase-01) | |
| Intel Core i7-10700K, NVIDIA Titan RTX, Intel Optane 905P 480GB 2.5 | |
| Intel Core i9-10900K, NVIDIA Titan RTX, WDC PC SN720 SDAQNTW-512G | |
| AMD Ryzen 5 5600X, NVIDIA Titan RTX, Intel Optane 905P 480GB 2.5 | |
| AMD Ryzen 7 2700X, NVIDIA Titan RTX, ADATA Premier Pro SP900NS38 512 GB | |
| AMD Ryzen 9 5900X, NVIDIA Titan RTX, Intel Optane 905P 480GB 2.5 | |
| AMD Ryzen 9 3900X, NVIDIA Titan RTX, Corsair MP600 | |
| AMD Ryzen 9 5950X, NVIDIA Titan RTX, Intel Optane 905P 480GB 2.5 | |
| AMD Ryzen 7 5800X, NVIDIA Titan RTX, Intel Optane 905P 480GB 2.5 | |
| AMD Ryzen 3 3300X, NVIDIA Titan RTX, Intel Optane 905P 480GB 2.5 | |
| AMD Ryzen 5 1600, NVIDIA Titan RTX, Intel Optane 905P 480GB 2.5 | |
| AMD Ryzen 7 3800XT, NVIDIA Titan RTX, Intel Optane 905P 480GB 2.5 | |
| AMD Ryzen 9 3950X, NVIDIA Titan RTX, Intel Optane 905P 480GB 2.5 | |
| AMD Ryzen 3 3100, NVIDIA Titan RTX, Intel Optane 905P 480GB 2.5 | |
| 1900x1060 Medical (medical-01) | |
| Intel Core i9-10900K, NVIDIA Titan RTX, WDC PC SN720 SDAQNTW-512G | |
| Intel Core i7-10700K, NVIDIA Titan RTX, Intel Optane 905P 480GB 2.5 | |
| AMD Ryzen 9 5900X, NVIDIA Titan RTX, Intel Optane 905P 480GB 2.5 | |
| AMD Ryzen 7 3800XT, NVIDIA Titan RTX, Intel Optane 905P 480GB 2.5 | |
| AMD Ryzen 7 5800X, NVIDIA Titan RTX, Intel Optane 905P 480GB 2.5 | |
| AMD Ryzen 5 5600X, NVIDIA Titan RTX, Intel Optane 905P 480GB 2.5 | |
| AMD Ryzen 9 3950X, NVIDIA Titan RTX, Intel Optane 905P 480GB 2.5 | |
| AMD Ryzen 9 5950X, NVIDIA Titan RTX, Intel Optane 905P 480GB 2.5 | |
| AMD Ryzen 3 3300X, NVIDIA Titan RTX, Intel Optane 905P 480GB 2.5 | |
| AMD Ryzen 5 1600, NVIDIA Titan RTX, Intel Optane 905P 480GB 2.5 | |
| AMD Ryzen 7 2700X, NVIDIA Titan RTX, ADATA Premier Pro SP900NS38 512 GB | |
| AMD Ryzen 9 3900X, NVIDIA Titan RTX, Corsair MP600 | |
| AMD Ryzen 3 3100, NVIDIA Titan RTX, Intel Optane 905P 480GB 2.5 | |
| 1900x1060 Maya (maya-04) | |
| AMD Ryzen 7 5800X, NVIDIA Titan RTX, Intel Optane 905P 480GB 2.5 | |
| AMD Ryzen 5 5600X, NVIDIA Titan RTX, Intel Optane 905P 480GB 2.5 | |
| AMD Ryzen 9 5950X, NVIDIA Titan RTX, Intel Optane 905P 480GB 2.5 | |
| Intel Core i9-10900K, NVIDIA Titan RTX, WDC PC SN720 SDAQNTW-512G | |
| AMD Ryzen 9 5900X, NVIDIA Titan RTX, Intel Optane 905P 480GB 2.5 | |
| Intel Core i7-10700K, NVIDIA Titan RTX, Intel Optane 905P 480GB 2.5 | |
| AMD Ryzen 7 3800XT, NVIDIA Titan RTX, Intel Optane 905P 480GB 2.5 | |
| AMD Ryzen 9 3950X, NVIDIA Titan RTX, Intel Optane 905P 480GB 2.5 | |
| AMD Ryzen 3 3300X, NVIDIA Titan RTX, Intel Optane 905P 480GB 2.5 | |
| AMD Ryzen 9 3900X, NVIDIA Titan RTX, Corsair MP600 | |
| AMD Ryzen 7 2700X, NVIDIA Titan RTX, ADATA Premier Pro SP900NS38 512 GB | |
| AMD Ryzen 3 3100, NVIDIA Titan RTX, Intel Optane 905P 480GB 2.5 | |
| AMD Ryzen 5 1600, NVIDIA Titan RTX, Intel Optane 905P 480GB 2.5 | |
| 1900x1060 Energy (energy-01) | |
| Intel Core i9-10900K, NVIDIA Titan RTX, WDC PC SN720 SDAQNTW-512G | |
| Intel Core i7-10700K, NVIDIA Titan RTX, Intel Optane 905P 480GB 2.5 | |
| AMD Ryzen 9 5900X, NVIDIA Titan RTX, Intel Optane 905P 480GB 2.5 | |
| AMD Ryzen 5 1600, NVIDIA Titan RTX, Intel Optane 905P 480GB 2.5 | |
| AMD Ryzen 7 3800XT, NVIDIA Titan RTX, Intel Optane 905P 480GB 2.5 | |
| AMD Ryzen 9 3950X, NVIDIA Titan RTX, Intel Optane 905P 480GB 2.5 | |
| AMD Ryzen 3 3300X, NVIDIA Titan RTX, Intel Optane 905P 480GB 2.5 | |
| AMD Ryzen 7 2700X, NVIDIA Titan RTX, ADATA Premier Pro SP900NS38 512 GB | |
| AMD Ryzen 3 3100, NVIDIA Titan RTX, Intel Optane 905P 480GB 2.5 | |
| AMD Ryzen 9 5950X, NVIDIA Titan RTX, Intel Optane 905P 480GB 2.5 | |
| AMD Ryzen 7 5800X, NVIDIA Titan RTX, Intel Optane 905P 480GB 2.5 | |
| AMD Ryzen 9 3900X, NVIDIA Titan RTX, Corsair MP600 | |
| AMD Ryzen 5 5600X, NVIDIA Titan RTX, Intel Optane 905P 480GB 2.5 | |
| 1900x1060 Creo (creo-01) | |
| AMD Ryzen 7 5800X, NVIDIA Titan RTX, Intel Optane 905P 480GB 2.5 | |
| AMD Ryzen 9 5900X, NVIDIA Titan RTX, Intel Optane 905P 480GB 2.5 | |
| AMD Ryzen 5 5600X, NVIDIA Titan RTX, Intel Optane 905P 480GB 2.5 | |
| Intel Core i9-10900K, NVIDIA Titan RTX, WDC PC SN720 SDAQNTW-512G | |
| Intel Core i7-10700K, NVIDIA Titan RTX, Intel Optane 905P 480GB 2.5 | |
| AMD Ryzen 9 5950X, NVIDIA Titan RTX, Intel Optane 905P 480GB 2.5 | |
| AMD Ryzen 7 3800XT, NVIDIA Titan RTX, Intel Optane 905P 480GB 2.5 | |
| AMD Ryzen 9 3950X, NVIDIA Titan RTX, Intel Optane 905P 480GB 2.5 | |
| AMD Ryzen 9 3900X, NVIDIA Titan RTX, Corsair MP600 | |
| AMD Ryzen 3 3300X, NVIDIA Titan RTX, Intel Optane 905P 480GB 2.5 | |
| AMD Ryzen 3 3100, NVIDIA Titan RTX, Intel Optane 905P 480GB 2.5 | |
| AMD Ryzen 5 1600, NVIDIA Titan RTX, Intel Optane 905P 480GB 2.5 | |
| AMD Ryzen 7 2700X, NVIDIA Titan RTX, ADATA Premier Pro SP900NS38 512 GB | |
| 1900x1060 Catia (catia-04) | |
| AMD Ryzen 7 5800X, NVIDIA Titan RTX, Intel Optane 905P 480GB 2.5 | |
| AMD Ryzen 5 5600X, NVIDIA Titan RTX, Intel Optane 905P 480GB 2.5 | |
| AMD Ryzen 9 5900X, NVIDIA Titan RTX, Intel Optane 905P 480GB 2.5 | |
| AMD Ryzen 9 5950X, NVIDIA Titan RTX, Intel Optane 905P 480GB 2.5 | |
| Intel Core i9-10900K, NVIDIA Titan RTX, WDC PC SN720 SDAQNTW-512G | |
| AMD Ryzen 7 3800XT, NVIDIA Titan RTX, Intel Optane 905P 480GB 2.5 | |
| AMD Ryzen 9 3950X, NVIDIA Titan RTX, Intel Optane 905P 480GB 2.5 | |
| AMD Ryzen 9 3900X, NVIDIA Titan RTX, Corsair MP600 | |
| Intel Core i7-10700K, NVIDIA Titan RTX, Intel Optane 905P 480GB 2.5 | |
| AMD Ryzen 3 3300X, NVIDIA Titan RTX, Intel Optane 905P 480GB 2.5 | |
| AMD Ryzen 7 2700X, NVIDIA Titan RTX, ADATA Premier Pro SP900NS38 512 GB | |
| AMD Ryzen 3 3100, NVIDIA Titan RTX, Intel Optane 905P 480GB 2.5 | |
| AMD Ryzen 5 1600, NVIDIA Titan RTX, Intel Optane 905P 480GB 2.5 | |
| 1900x1060 3ds Max (3dsmax-05) | |
| AMD Ryzen 5 5600X, NVIDIA Titan RTX, Intel Optane 905P 480GB 2.5 | |
| Intel Core i9-10900K, NVIDIA Titan RTX, WDC PC SN720 SDAQNTW-512G | |
| AMD Ryzen 7 5800X, NVIDIA Titan RTX, Intel Optane 905P 480GB 2.5 | |
| Intel Core i7-10700K, NVIDIA Titan RTX, Intel Optane 905P 480GB 2.5 | |
| AMD Ryzen 9 5900X, NVIDIA Titan RTX, Intel Optane 905P 480GB 2.5 | |
| AMD Ryzen 9 5950X, NVIDIA Titan RTX, Intel Optane 905P 480GB 2.5 | |
| AMD Ryzen 9 3900X, NVIDIA Titan RTX, Corsair MP600 | |
| AMD Ryzen 7 3800XT, NVIDIA Titan RTX, Intel Optane 905P 480GB 2.5 | |
| AMD Ryzen 9 3950X, NVIDIA Titan RTX, Intel Optane 905P 480GB 2.5 | |
| AMD Ryzen 7 2700X, NVIDIA Titan RTX, ADATA Premier Pro SP900NS38 512 GB | |
| AMD Ryzen 3 3300X, NVIDIA Titan RTX, Intel Optane 905P 480GB 2.5 | |
| AMD Ryzen 3 3100, NVIDIA Titan RTX, Intel Optane 905P 480GB 2.5 | |
| AMD Ryzen 5 1600, NVIDIA Titan RTX, Intel Optane 905P 480GB 2.5 | |
| SPECviewperf 13 | |
| Solidworks (sw-04) | |
| AMD Ryzen 7 5800X, NVIDIA Titan RTX, Intel Optane 905P 480GB 2.5 | |
| AMD Ryzen 9 5900X, NVIDIA Titan RTX, Intel Optane 905P 480GB 2.5 | |
| AMD Ryzen 5 5600X, NVIDIA Titan RTX, Intel Optane 905P 480GB 2.5 | |
| AMD Ryzen 9 5950X, NVIDIA Titan RTX, Intel Optane 905P 480GB 2.5 | |
| Intel Core i9-10900K, NVIDIA Titan RTX, WDC PC SN720 SDAQNTW-512G | |
| Intel Core i7-10700K, NVIDIA Titan RTX, Intel Optane 905P 480GB 2.5 | |
| AMD Ryzen 7 3800XT, NVIDIA Titan RTX, Intel Optane 905P 480GB 2.5 | |
| AMD Ryzen 9 3950X, NVIDIA Titan RTX, Intel Optane 905P 480GB 2.5 | |
| AMD Ryzen 9 3900X, NVIDIA Titan RTX, Corsair MP600 | |
| AMD Ryzen 3 3300X, NVIDIA Titan RTX, Intel Optane 905P 480GB 2.5 | |
| AMD Ryzen 7 2700X, NVIDIA Titan RTX, ADATA Premier Pro SP900NS38 512 GB | |
| AMD Ryzen 3 3100, NVIDIA Titan RTX, Intel Optane 905P 480GB 2.5 | |
| AMD Ryzen 5 1600, NVIDIA Titan RTX, Intel Optane 905P 480GB 2.5 | |
| Siemens NX (snx-03) | |
| Intel Core i7-10700K, NVIDIA Titan RTX, Intel Optane 905P 480GB 2.5 | |
| AMD Ryzen 9 5900X, NVIDIA Titan RTX, Intel Optane 905P 480GB 2.5 | |
| AMD Ryzen 7 5800X, NVIDIA Titan RTX, Intel Optane 905P 480GB 2.5 | |
| AMD Ryzen 5 5600X, NVIDIA Titan RTX, Intel Optane 905P 480GB 2.5 | |
| AMD Ryzen 9 5950X, NVIDIA Titan RTX, Intel Optane 905P 480GB 2.5 | |
| AMD Ryzen 9 3900X, NVIDIA Titan RTX, Corsair MP600 | |
| Intel Core i9-10900K, NVIDIA Titan RTX, WDC PC SN720 SDAQNTW-512G | |
| AMD Ryzen 7 3800XT, NVIDIA Titan RTX, Intel Optane 905P 480GB 2.5 | |
| AMD Ryzen 7 2700X, NVIDIA Titan RTX, ADATA Premier Pro SP900NS38 512 GB | |
| AMD Ryzen 9 3950X, NVIDIA Titan RTX, Intel Optane 905P 480GB 2.5 | |
| AMD Ryzen 3 3300X, NVIDIA Titan RTX, Intel Optane 905P 480GB 2.5 | |
| AMD Ryzen 5 1600, NVIDIA Titan RTX, Intel Optane 905P 480GB 2.5 | |
| AMD Ryzen 3 3100, NVIDIA Titan RTX, Intel Optane 905P 480GB 2.5 | |
| Showcase (showcase-02) | |
| Intel Core i7-10700K, NVIDIA Titan RTX, Intel Optane 905P 480GB 2.5 | |
| Intel Core i9-10900K, NVIDIA Titan RTX, WDC PC SN720 SDAQNTW-512G | |
| AMD Ryzen 7 2700X, NVIDIA Titan RTX, ADATA Premier Pro SP900NS38 512 GB | |
| AMD Ryzen 7 5800X, NVIDIA Titan RTX, Intel Optane 905P 480GB 2.5 | |
| AMD Ryzen 9 3900X, NVIDIA Titan RTX, Corsair MP600 | |
| AMD Ryzen 9 5950X, NVIDIA Titan RTX, Intel Optane 905P 480GB 2.5 | |
| AMD Ryzen 5 5600X, NVIDIA Titan RTX, Intel Optane 905P 480GB 2.5 | |
| AMD Ryzen 9 5900X, NVIDIA Titan RTX, Intel Optane 905P 480GB 2.5 | |
| AMD Ryzen 3 3300X, NVIDIA Titan RTX, Intel Optane 905P 480GB 2.5 | |
| AMD Ryzen 5 1600, NVIDIA Titan RTX, Intel Optane 905P 480GB 2.5 | |
| AMD Ryzen 7 3800XT, NVIDIA Titan RTX, Intel Optane 905P 480GB 2.5 | |
| AMD Ryzen 9 3950X, NVIDIA Titan RTX, Intel Optane 905P 480GB 2.5 | |
| AMD Ryzen 3 3100, NVIDIA Titan RTX, Intel Optane 905P 480GB 2.5 | |
| Medical (medical-02) | |
| AMD Ryzen 9 5900X, NVIDIA Titan RTX, Intel Optane 905P 480GB 2.5 | |
| AMD Ryzen 7 5800X, NVIDIA Titan RTX, Intel Optane 905P 480GB 2.5 | |
| Intel Core i7-10700K, NVIDIA Titan RTX, Intel Optane 905P 480GB 2.5 | |
| AMD Ryzen 9 5950X, NVIDIA Titan RTX, Intel Optane 905P 480GB 2.5 | |
| AMD Ryzen 5 5600X, NVIDIA Titan RTX, Intel Optane 905P 480GB 2.5 | |
| AMD Ryzen 7 3800XT, NVIDIA Titan RTX, Intel Optane 905P 480GB 2.5 | |
| AMD Ryzen 9 3950X, NVIDIA Titan RTX, Intel Optane 905P 480GB 2.5 | |
| AMD Ryzen 9 3900X, NVIDIA Titan RTX, Corsair MP600 | |
| AMD Ryzen 7 2700X, NVIDIA Titan RTX, ADATA Premier Pro SP900NS38 512 GB | |
| AMD Ryzen 3 3300X, NVIDIA Titan RTX, Intel Optane 905P 480GB 2.5 | |
| Intel Core i9-10900K, NVIDIA Titan RTX, WDC PC SN720 SDAQNTW-512G | |
| AMD Ryzen 3 3100, NVIDIA Titan RTX, Intel Optane 905P 480GB 2.5 | |
| AMD Ryzen 5 1600, NVIDIA Titan RTX, Intel Optane 905P 480GB 2.5 | |
| Maya (maya-05) | |
| AMD Ryzen 9 5950X, NVIDIA Titan RTX, Intel Optane 905P 480GB 2.5 | |
| AMD Ryzen 7 5800X, NVIDIA Titan RTX, Intel Optane 905P 480GB 2.5 | |
| AMD Ryzen 9 5900X, NVIDIA Titan RTX, Intel Optane 905P 480GB 2.5 | |
| AMD Ryzen 5 5600X, NVIDIA Titan RTX, Intel Optane 905P 480GB 2.5 | |
| AMD Ryzen 7 3800XT, NVIDIA Titan RTX, Intel Optane 905P 480GB 2.5 | |
| Intel Core i7-10700K, NVIDIA Titan RTX, Intel Optane 905P 480GB 2.5 | |
| Intel Core i9-10900K, NVIDIA Titan RTX, WDC PC SN720 SDAQNTW-512G | |
| AMD Ryzen 9 3900X, NVIDIA Titan RTX, Corsair MP600 | |
| AMD Ryzen 9 3950X, NVIDIA Titan RTX, Intel Optane 905P 480GB 2.5 | |
| AMD Ryzen 7 2700X, NVIDIA Titan RTX, ADATA Premier Pro SP900NS38 512 GB | |
| AMD Ryzen 3 3300X, NVIDIA Titan RTX, Intel Optane 905P 480GB 2.5 | |
| AMD Ryzen 3 3100, NVIDIA Titan RTX, Intel Optane 905P 480GB 2.5 | |
| AMD Ryzen 5 1600, NVIDIA Titan RTX, Intel Optane 905P 480GB 2.5 | |
| Energy (energy-02) | |
| AMD Ryzen 5 1600, NVIDIA Titan RTX, Intel Optane 905P 480GB 2.5 | |
| AMD Ryzen 3 3100, NVIDIA Titan RTX, Intel Optane 905P 480GB 2.5 | |
| AMD Ryzen 3 3300X, NVIDIA Titan RTX, Intel Optane 905P 480GB 2.5 | |
| Intel Core i9-10900K, NVIDIA Titan RTX, WDC PC SN720 SDAQNTW-512G | |
| AMD Ryzen 9 3950X, NVIDIA Titan RTX, Intel Optane 905P 480GB 2.5 | |
| AMD Ryzen 7 3800XT, NVIDIA Titan RTX, Intel Optane 905P 480GB 2.5 | |
| Intel Core i7-10700K, NVIDIA Titan RTX, Intel Optane 905P 480GB 2.5 | |
| AMD Ryzen 9 3900X, NVIDIA Titan RTX, Corsair MP600 | |
| AMD Ryzen 7 5800X, NVIDIA Titan RTX, Intel Optane 905P 480GB 2.5 | |
| AMD Ryzen 5 5600X, NVIDIA Titan RTX, Intel Optane 905P 480GB 2.5 | |
| AMD Ryzen 9 5900X, NVIDIA Titan RTX, Intel Optane 905P 480GB 2.5 | |
| AMD Ryzen 9 5950X, NVIDIA Titan RTX, Intel Optane 905P 480GB 2.5 | |
| AMD Ryzen 7 2700X, NVIDIA Titan RTX, ADATA Premier Pro SP900NS38 512 GB | |
| Creo (creo-02) | |
| Intel Core i7-10700K, NVIDIA Titan RTX, Intel Optane 905P 480GB 2.5 | |
| AMD Ryzen 7 5800X, NVIDIA Titan RTX, Intel Optane 905P 480GB 2.5 | |
| AMD Ryzen 5 5600X, NVIDIA Titan RTX, Intel Optane 905P 480GB 2.5 | |
| AMD Ryzen 9 5900X, NVIDIA Titan RTX, Intel Optane 905P 480GB 2.5 | |
| AMD Ryzen 9 3900X, NVIDIA Titan RTX, Corsair MP600 | |
| AMD Ryzen 7 3800XT, NVIDIA Titan RTX, Intel Optane 905P 480GB 2.5 | |
| AMD Ryzen 9 5950X, NVIDIA Titan RTX, Intel Optane 905P 480GB 2.5 | |
| Intel Core i9-10900K, NVIDIA Titan RTX, WDC PC SN720 SDAQNTW-512G | |
| AMD Ryzen 9 3950X, NVIDIA Titan RTX, Intel Optane 905P 480GB 2.5 | |
| AMD Ryzen 3 3300X, NVIDIA Titan RTX, Intel Optane 905P 480GB 2.5 | |
| AMD Ryzen 7 2700X, NVIDIA Titan RTX, ADATA Premier Pro SP900NS38 512 GB | |
| AMD Ryzen 3 3100, NVIDIA Titan RTX, Intel Optane 905P 480GB 2.5 | |
| AMD Ryzen 5 1600, NVIDIA Titan RTX, Intel Optane 905P 480GB 2.5 | |
| Catia (catia-05) | |
| AMD Ryzen 9 5950X, NVIDIA Titan RTX, Intel Optane 905P 480GB 2.5 | |
| AMD Ryzen 5 5600X, NVIDIA Titan RTX, Intel Optane 905P 480GB 2.5 | |
| AMD Ryzen 7 5800X, NVIDIA Titan RTX, Intel Optane 905P 480GB 2.5 | |
| AMD Ryzen 9 5900X, NVIDIA Titan RTX, Intel Optane 905P 480GB 2.5 | |
| AMD Ryzen 7 3800XT, NVIDIA Titan RTX, Intel Optane 905P 480GB 2.5 | |
| Intel Core i9-10900K, NVIDIA Titan RTX, WDC PC SN720 SDAQNTW-512G | |
| AMD Ryzen 9 3950X, NVIDIA Titan RTX, Intel Optane 905P 480GB 2.5 | |
| Intel Core i7-10700K, NVIDIA Titan RTX, Intel Optane 905P 480GB 2.5 | |
| AMD Ryzen 9 3900X, NVIDIA Titan RTX, Corsair MP600 | |
| AMD Ryzen 3 3300X, NVIDIA Titan RTX, Intel Optane 905P 480GB 2.5 | |
| AMD Ryzen 7 2700X, NVIDIA Titan RTX, ADATA Premier Pro SP900NS38 512 GB | |
| AMD Ryzen 3 3100, NVIDIA Titan RTX, Intel Optane 905P 480GB 2.5 | |
| AMD Ryzen 5 1600, NVIDIA Titan RTX, Intel Optane 905P 480GB 2.5 | |
| 3ds Max (3dsmax-06) | |
| AMD Ryzen 5 5600X, NVIDIA Titan RTX, Intel Optane 905P 480GB 2.5 | |
| AMD Ryzen 7 5800X, NVIDIA Titan RTX, Intel Optane 905P 480GB 2.5 | |
| Intel Core i9-10900K, NVIDIA Titan RTX, WDC PC SN720 SDAQNTW-512G | |
| AMD Ryzen 9 5900X, NVIDIA Titan RTX, Intel Optane 905P 480GB 2.5 | |
| Intel Core i7-10700K, NVIDIA Titan RTX, Intel Optane 905P 480GB 2.5 | |
| AMD Ryzen 9 5950X, NVIDIA Titan RTX, Intel Optane 905P 480GB 2.5 | |
| AMD Ryzen 9 3900X, NVIDIA Titan RTX, Corsair MP600 | |
| AMD Ryzen 9 3950X, NVIDIA Titan RTX, Intel Optane 905P 480GB 2.5 | |
| AMD Ryzen 7 3800XT, NVIDIA Titan RTX, Intel Optane 905P 480GB 2.5 | |
| AMD Ryzen 7 2700X, NVIDIA Titan RTX, ADATA Premier Pro SP900NS38 512 GB | |
| AMD Ryzen 3 3300X, NVIDIA Titan RTX, Intel Optane 905P 480GB 2.5 | |
| AMD Ryzen 3 3100, NVIDIA Titan RTX, Intel Optane 905P 480GB 2.5 | |
| AMD Ryzen 5 1600, NVIDIA Titan RTX, Intel Optane 905P 480GB 2.5 | |
* ... menor é melhor
Consumo de energia
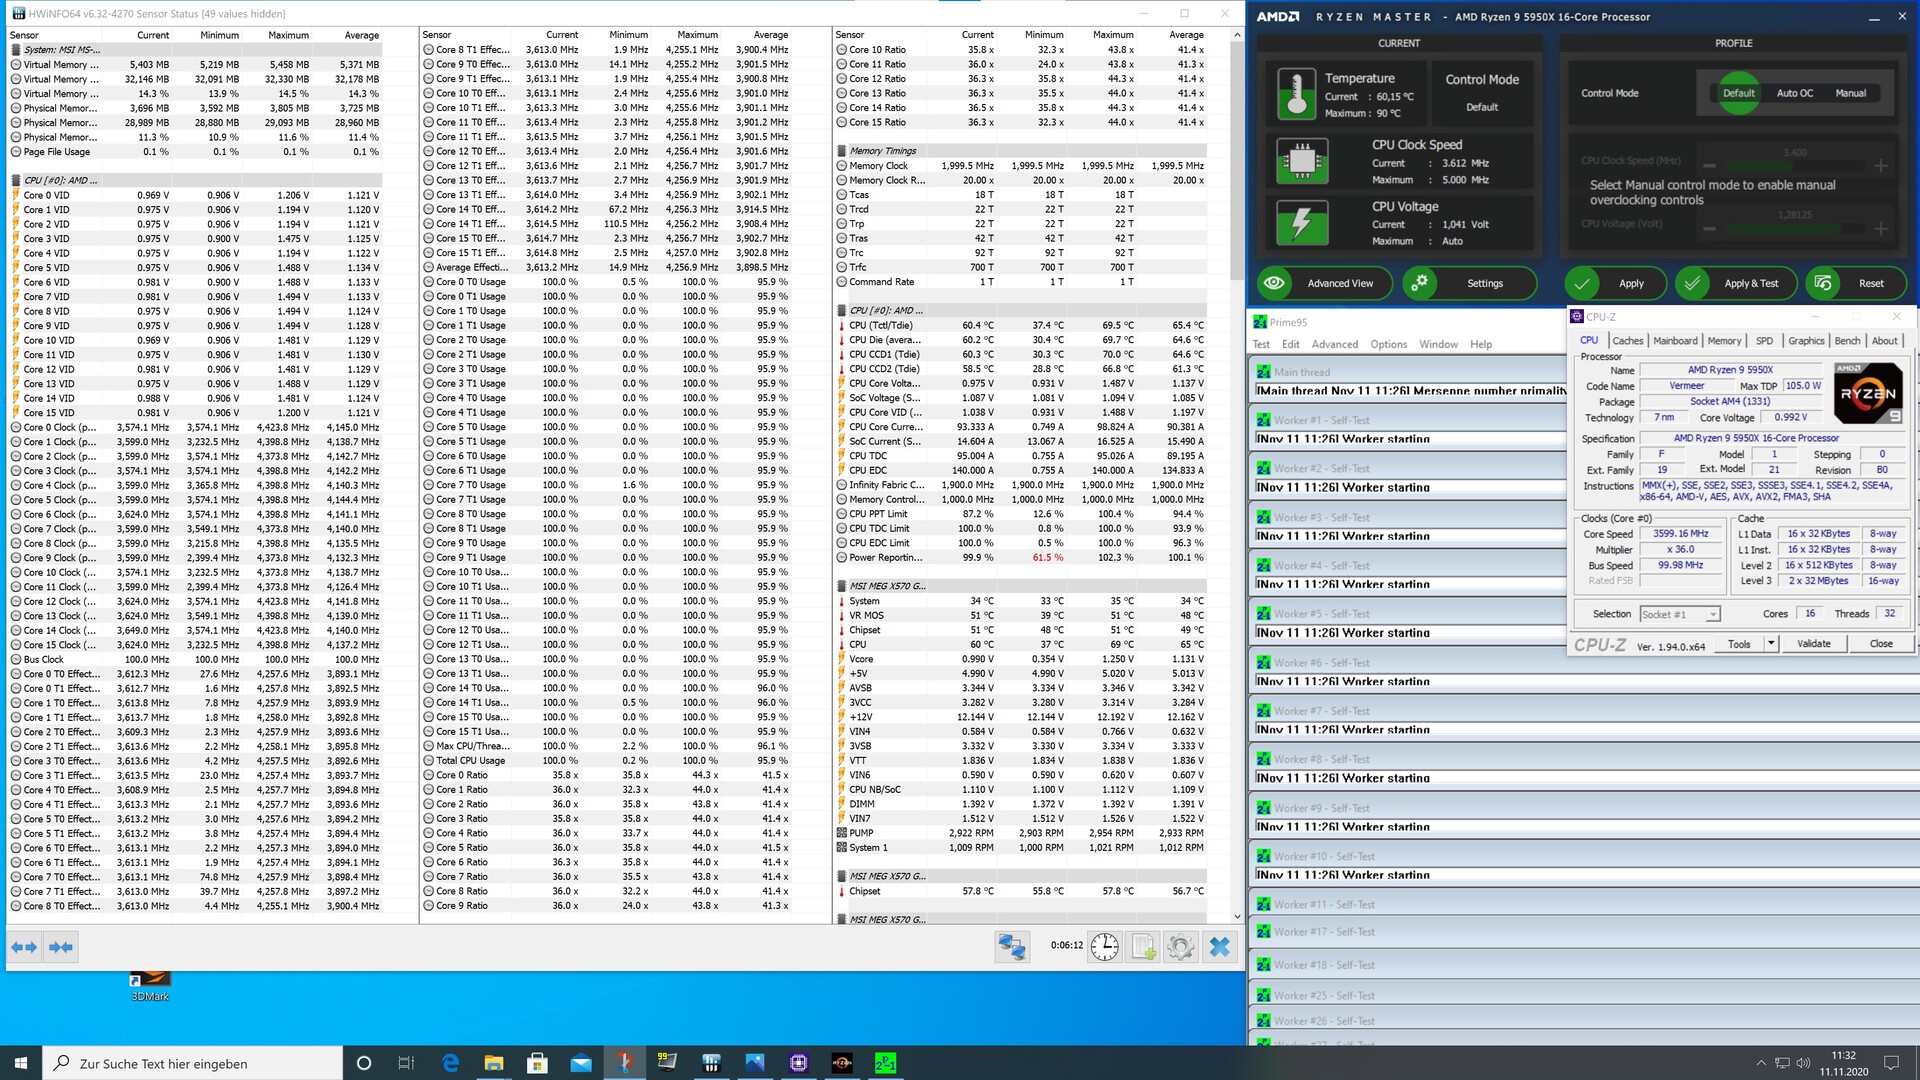
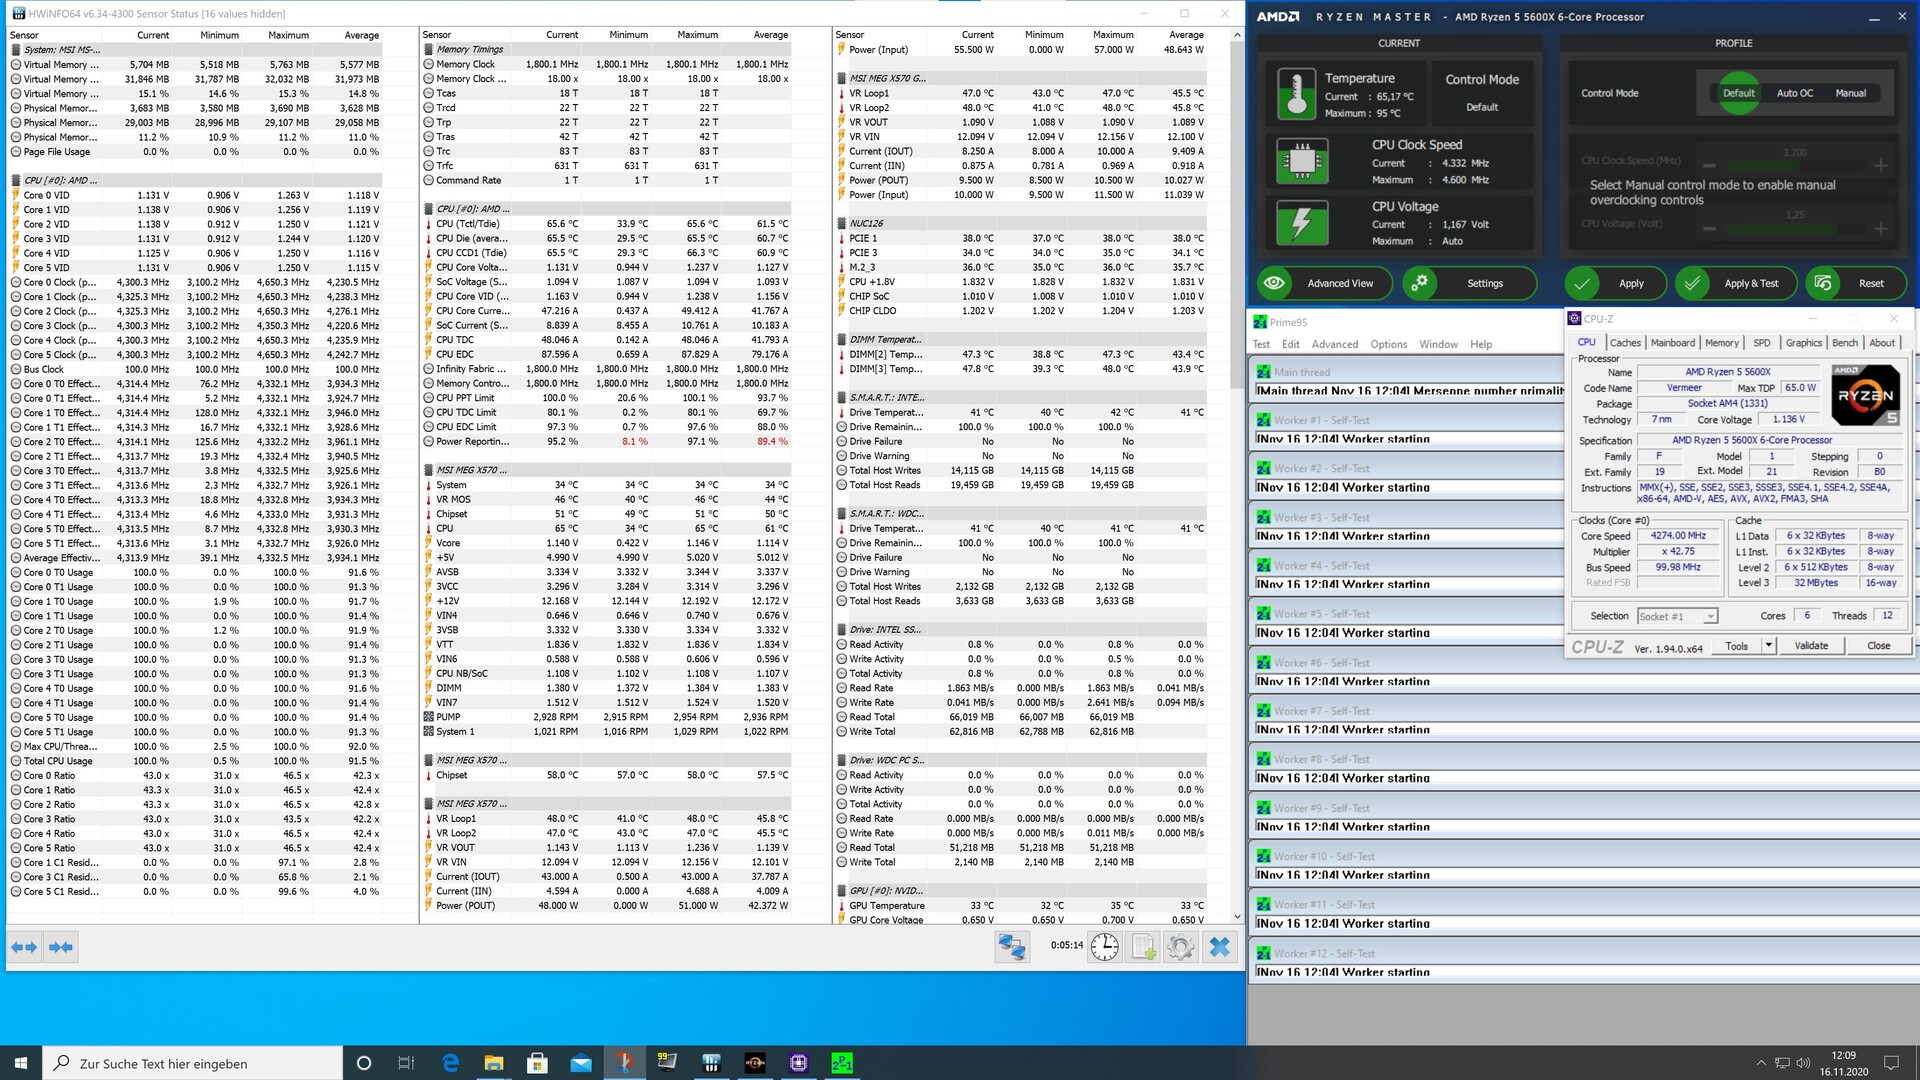
Como já ocorria anteriormente para o Ryzen 9 5900X e Ryzen 7 5800X, a AMD também especifica um TDP de 105 watts para o Ryzen 9 5950X. Com isto, ele permanece dentro das especificações da plataforma X570, já que a AMD não introduziu um novo chipset com a geração Vermeer. No entanto, no final, os 105 watts não são suficientes, já que o limite de potência da CPU é de 142 watts, que o processador de 16 núcleos realmente consome sob carga.
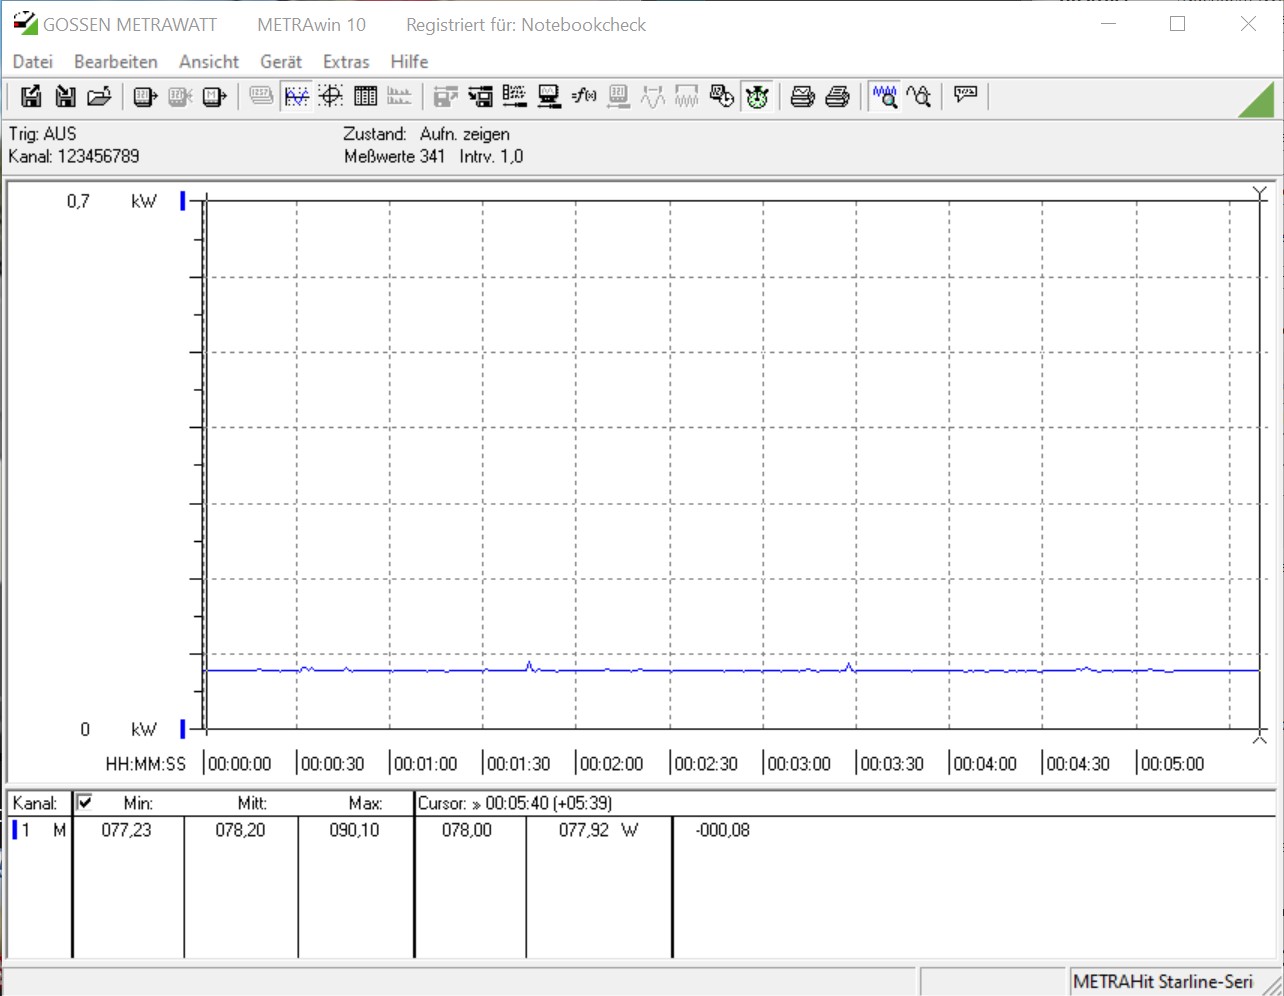
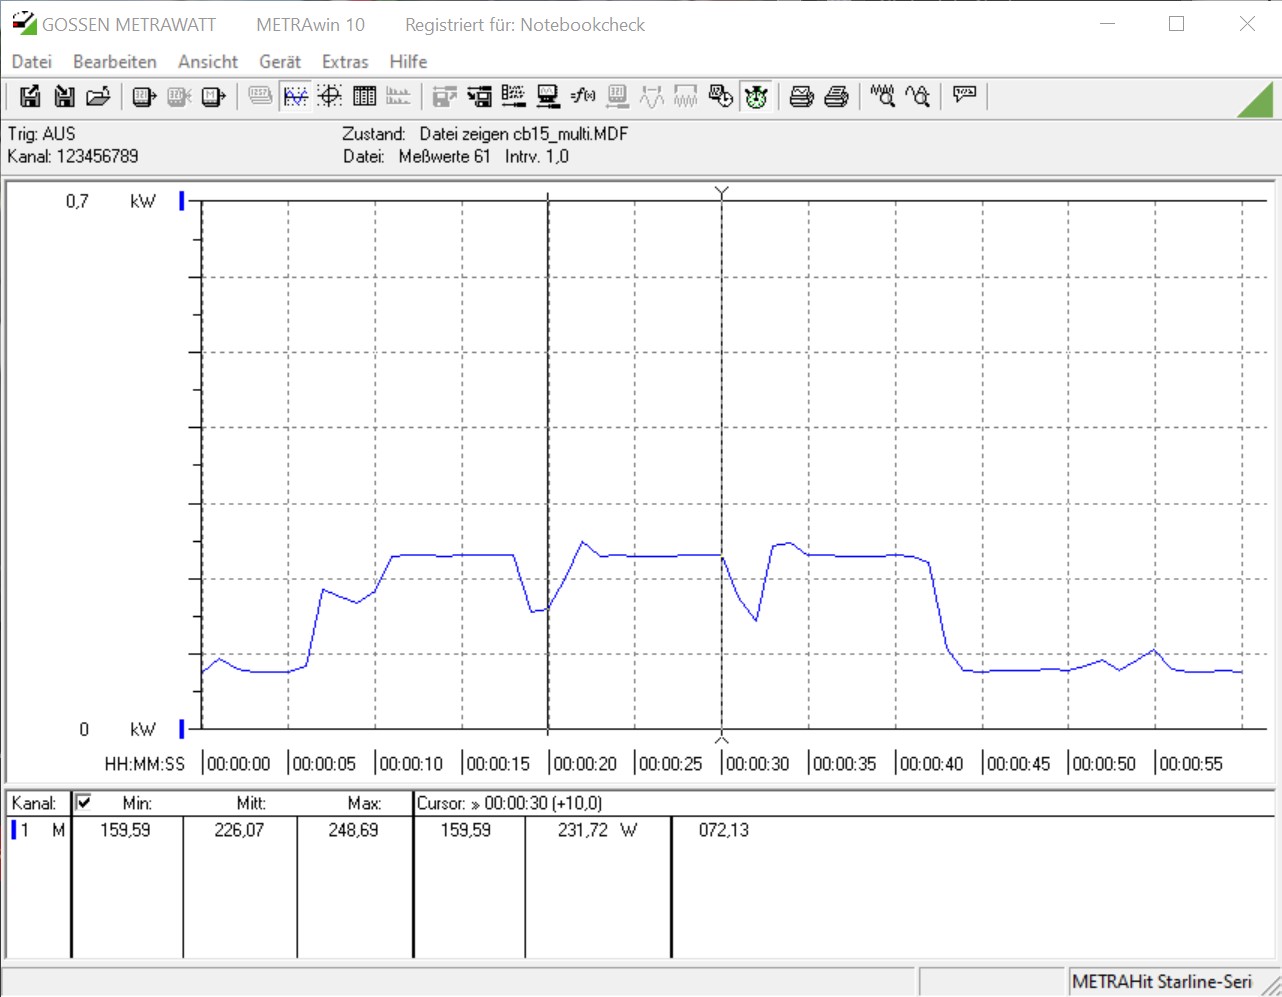
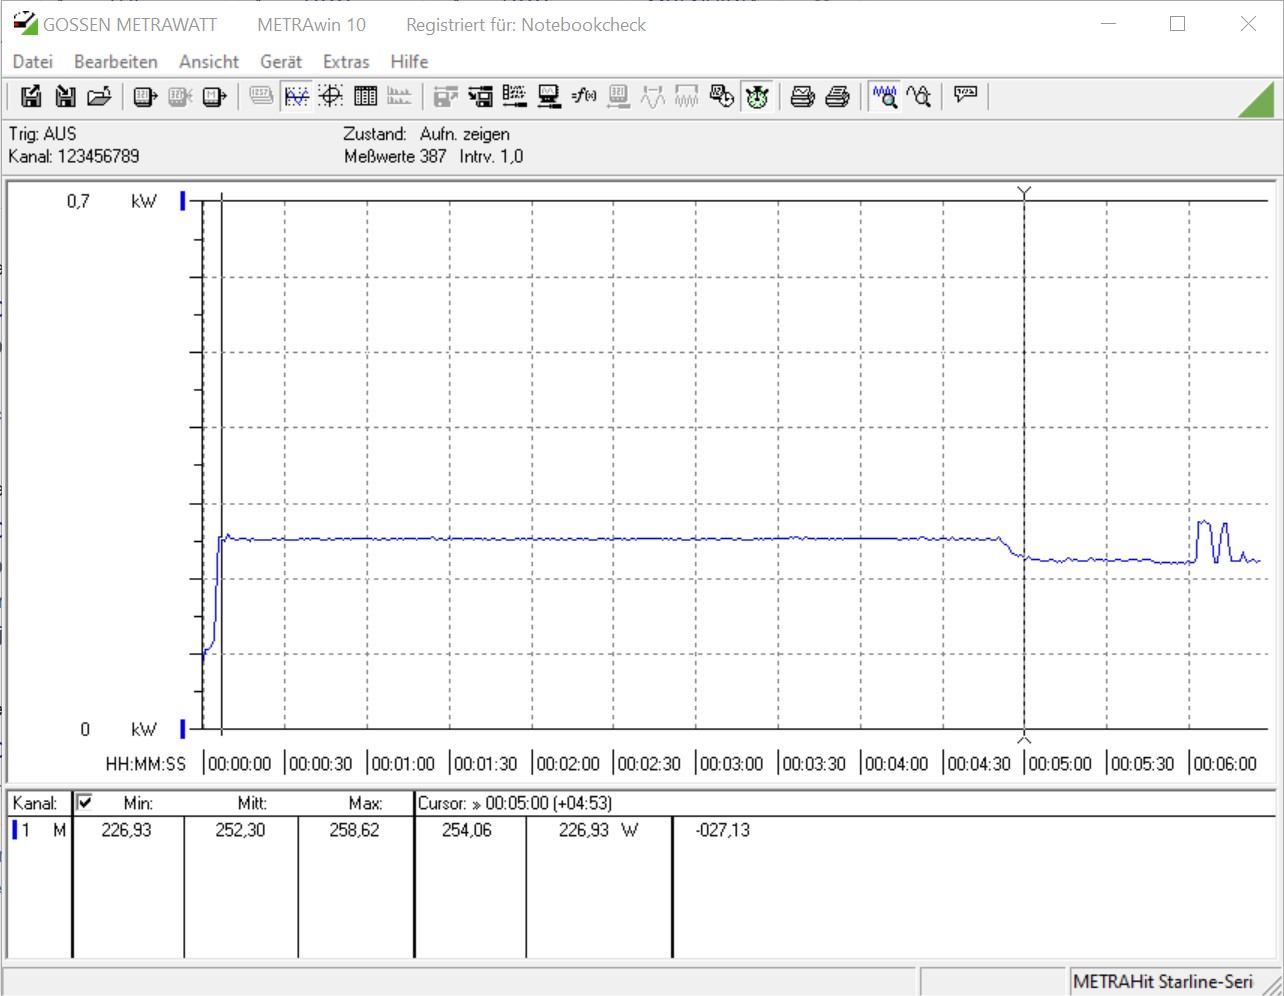
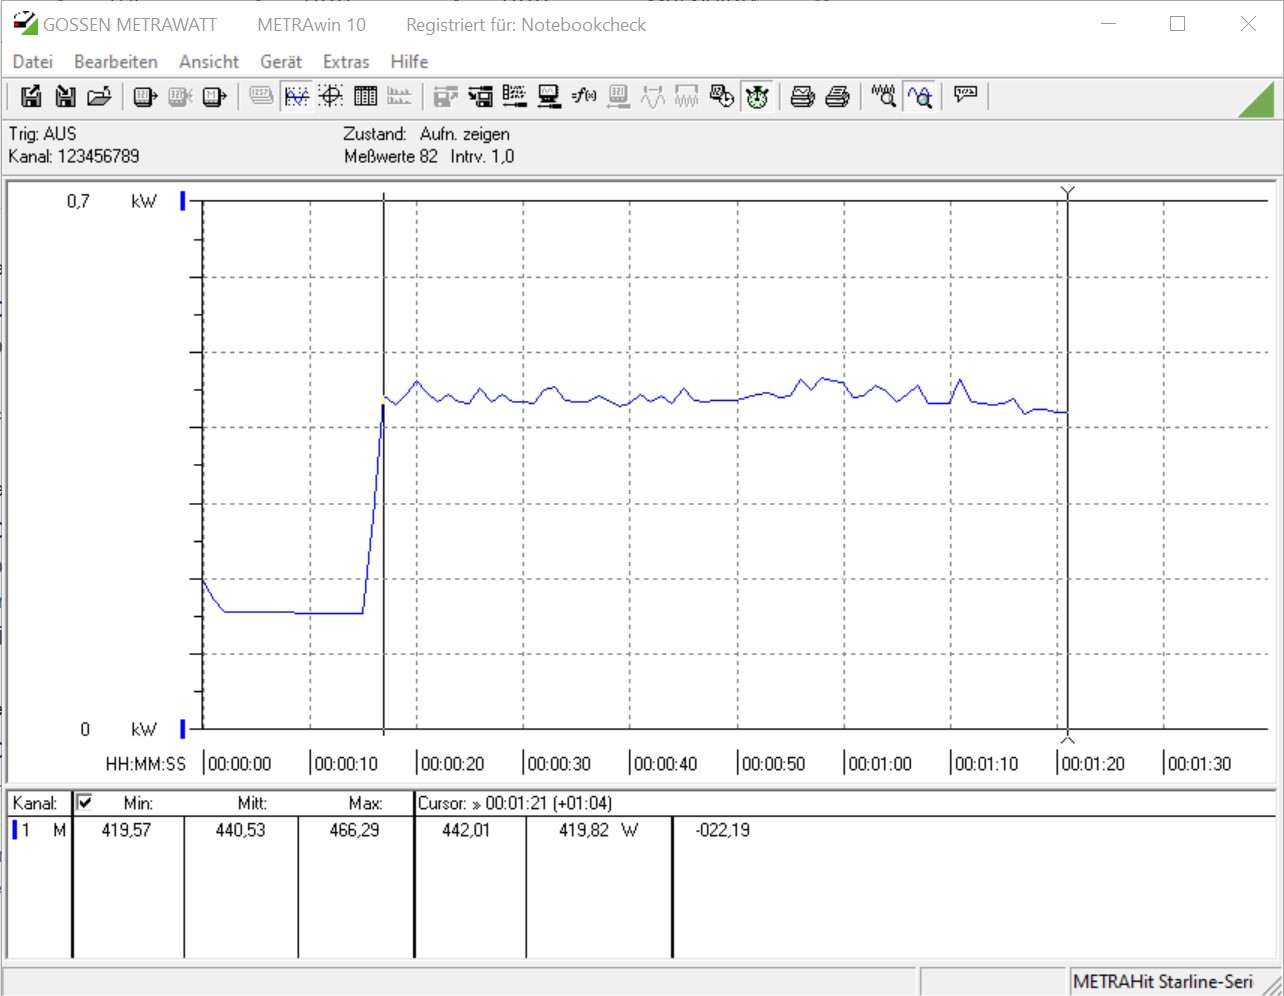
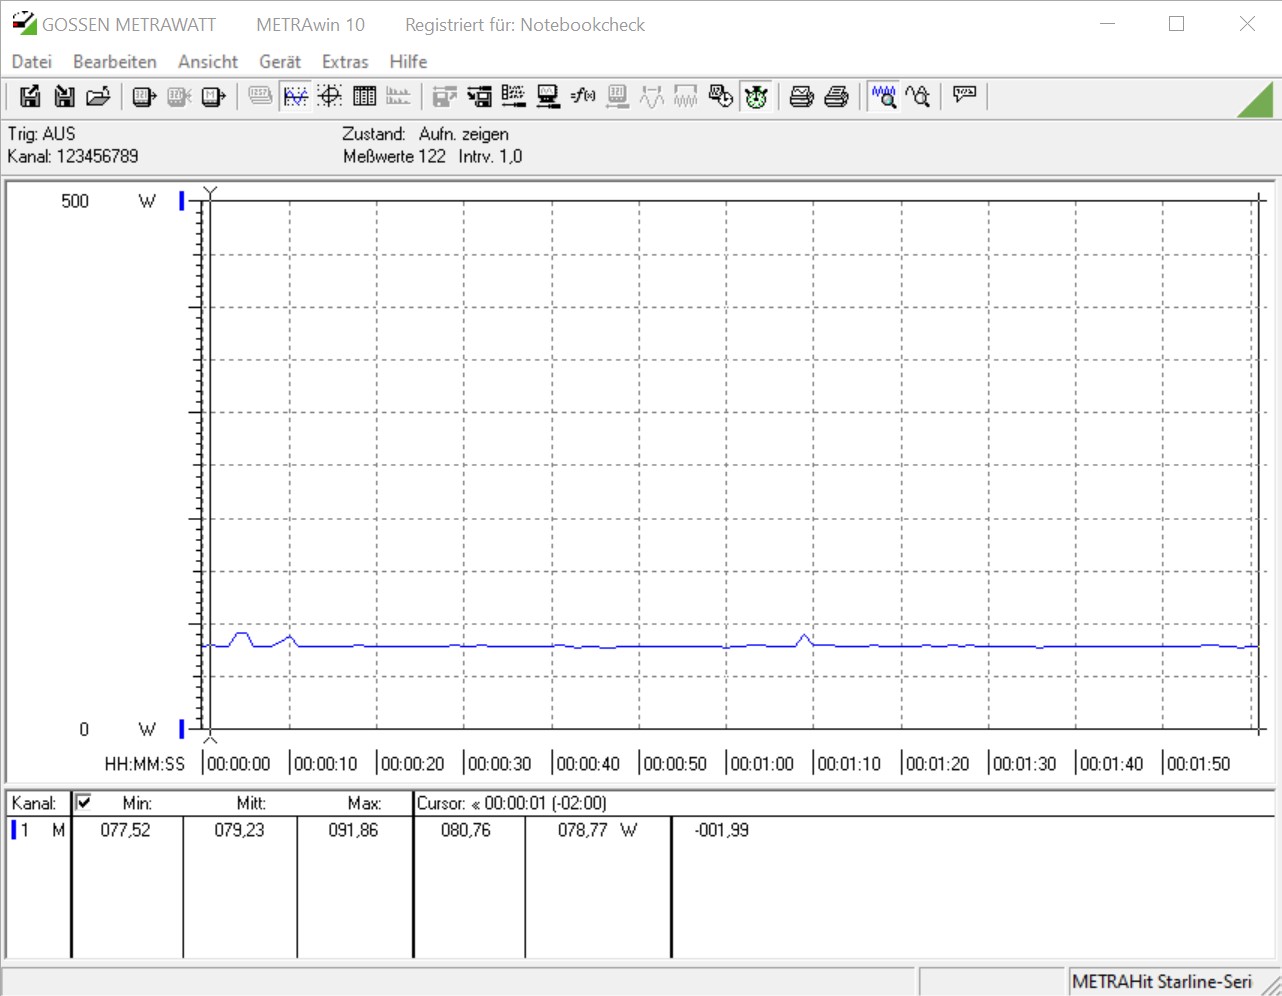
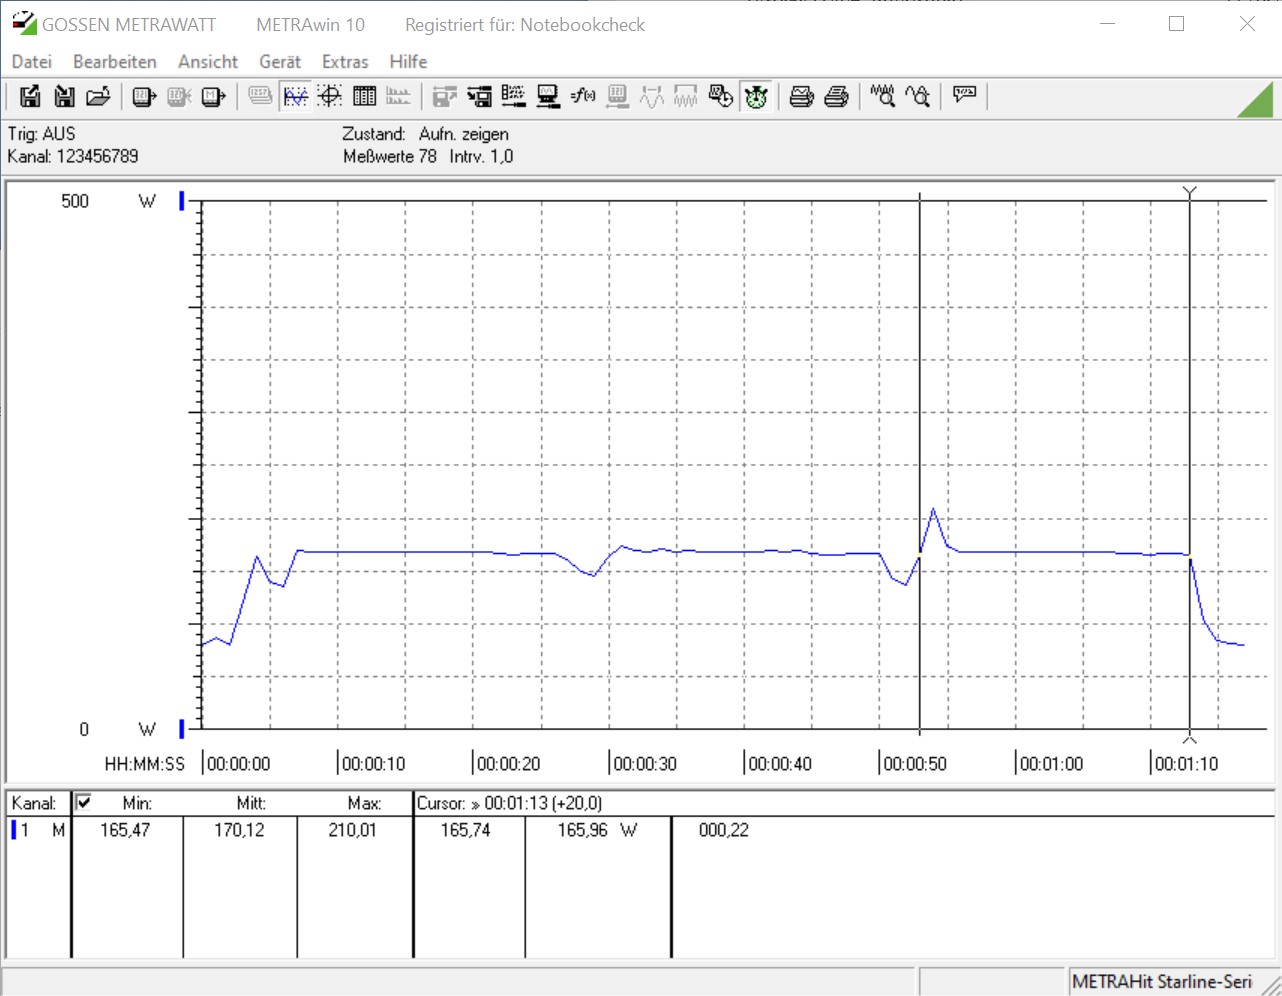
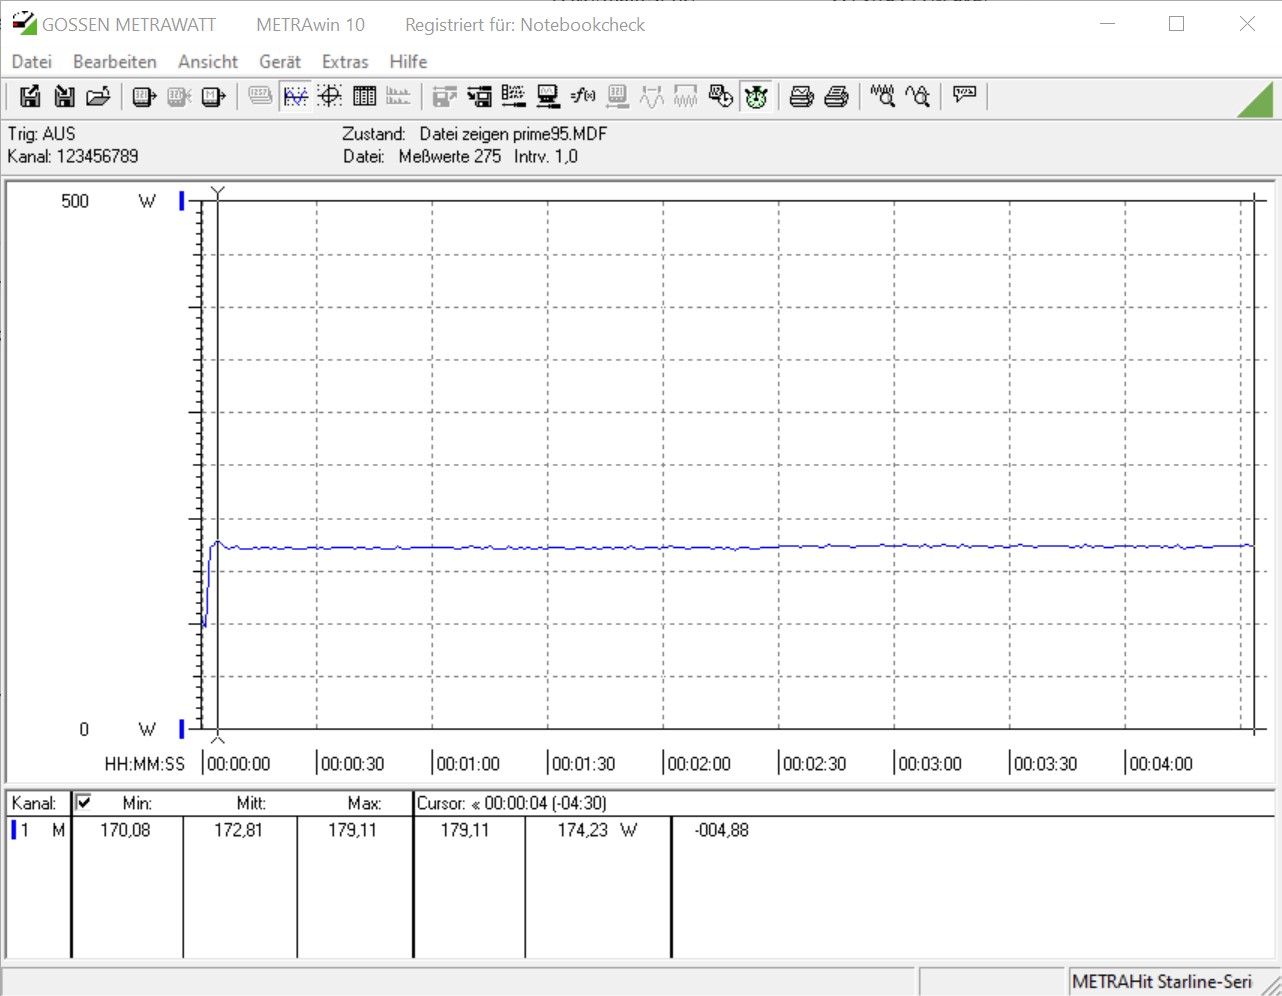
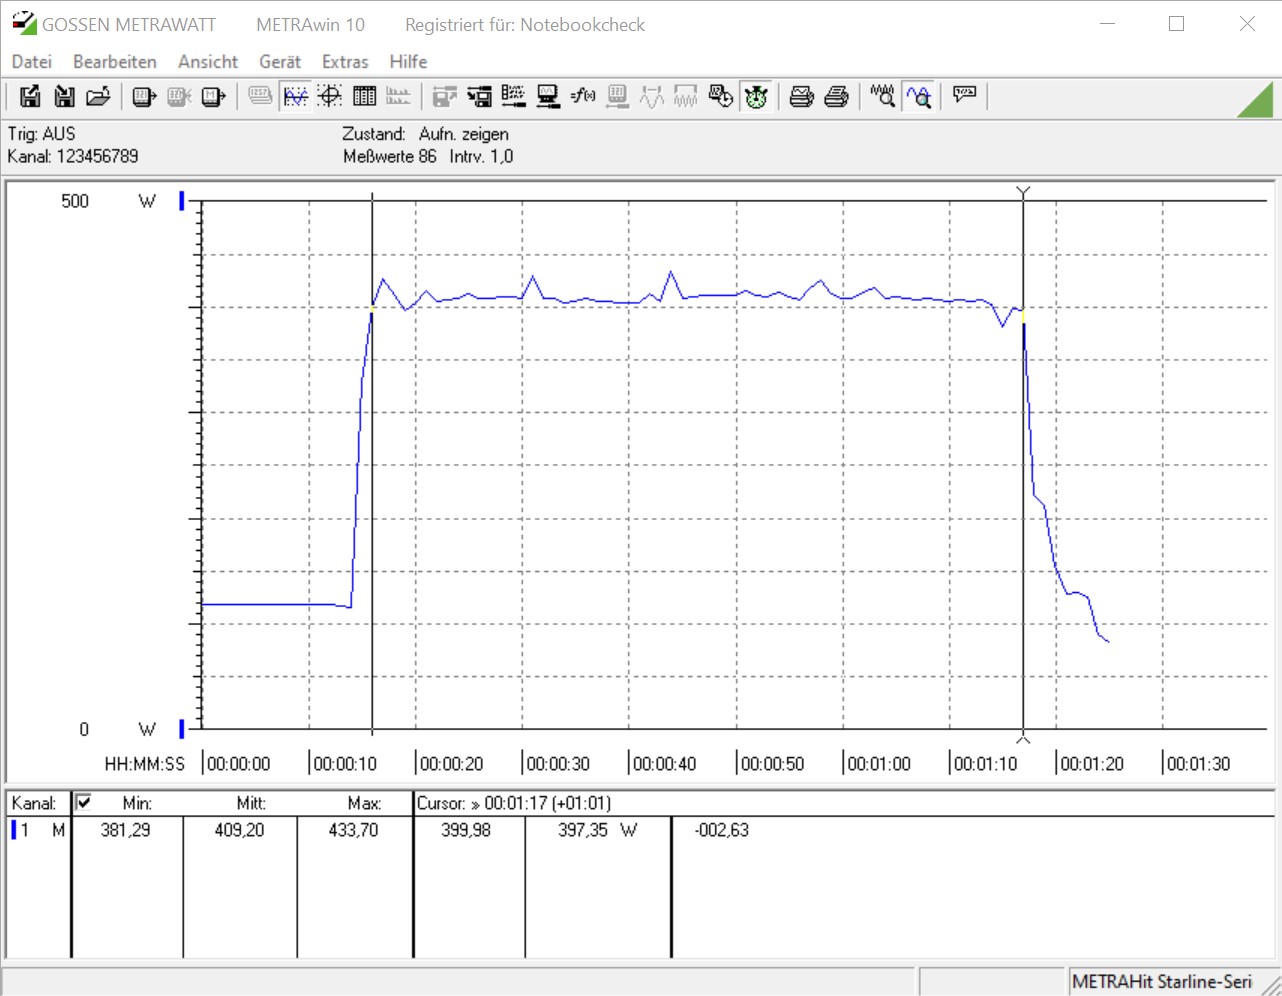
Sem carga, não há mudanças em relação às outras duas CPUs Vermeer, e medimos pouco menos de 80 watts entre a tomada e a fonte de alimentação com nosso dispositivo de medição. Sob carga, o consumo aumenta. No teste múltiplo Cinebench R15, determinamos 226 watts para o processador de 16 núcleos. Com o Ryzen 5 5600X, o consumo do sistema de teste fica em 170 watts no mesmo teste. Este é um bom resultado para ambos os candidatos. Enquanto joga, o AMD Ryzen 9 5950X está liderando o pacote com 440 watts. Entretanto, com 439 watts, nosso sistema de teste com o AMD Ryzen 5 5900X não é muito mais frugal. Com o AMD Ryzen 5 5600X, o consumo de energia cai ligeiramente em cerca de 30 watts. Entretanto, sob carga total, também é necessário calcular cerca de 280 watts para a placa gráfica, que sempre desempenha um papel durante o teste de jogo.
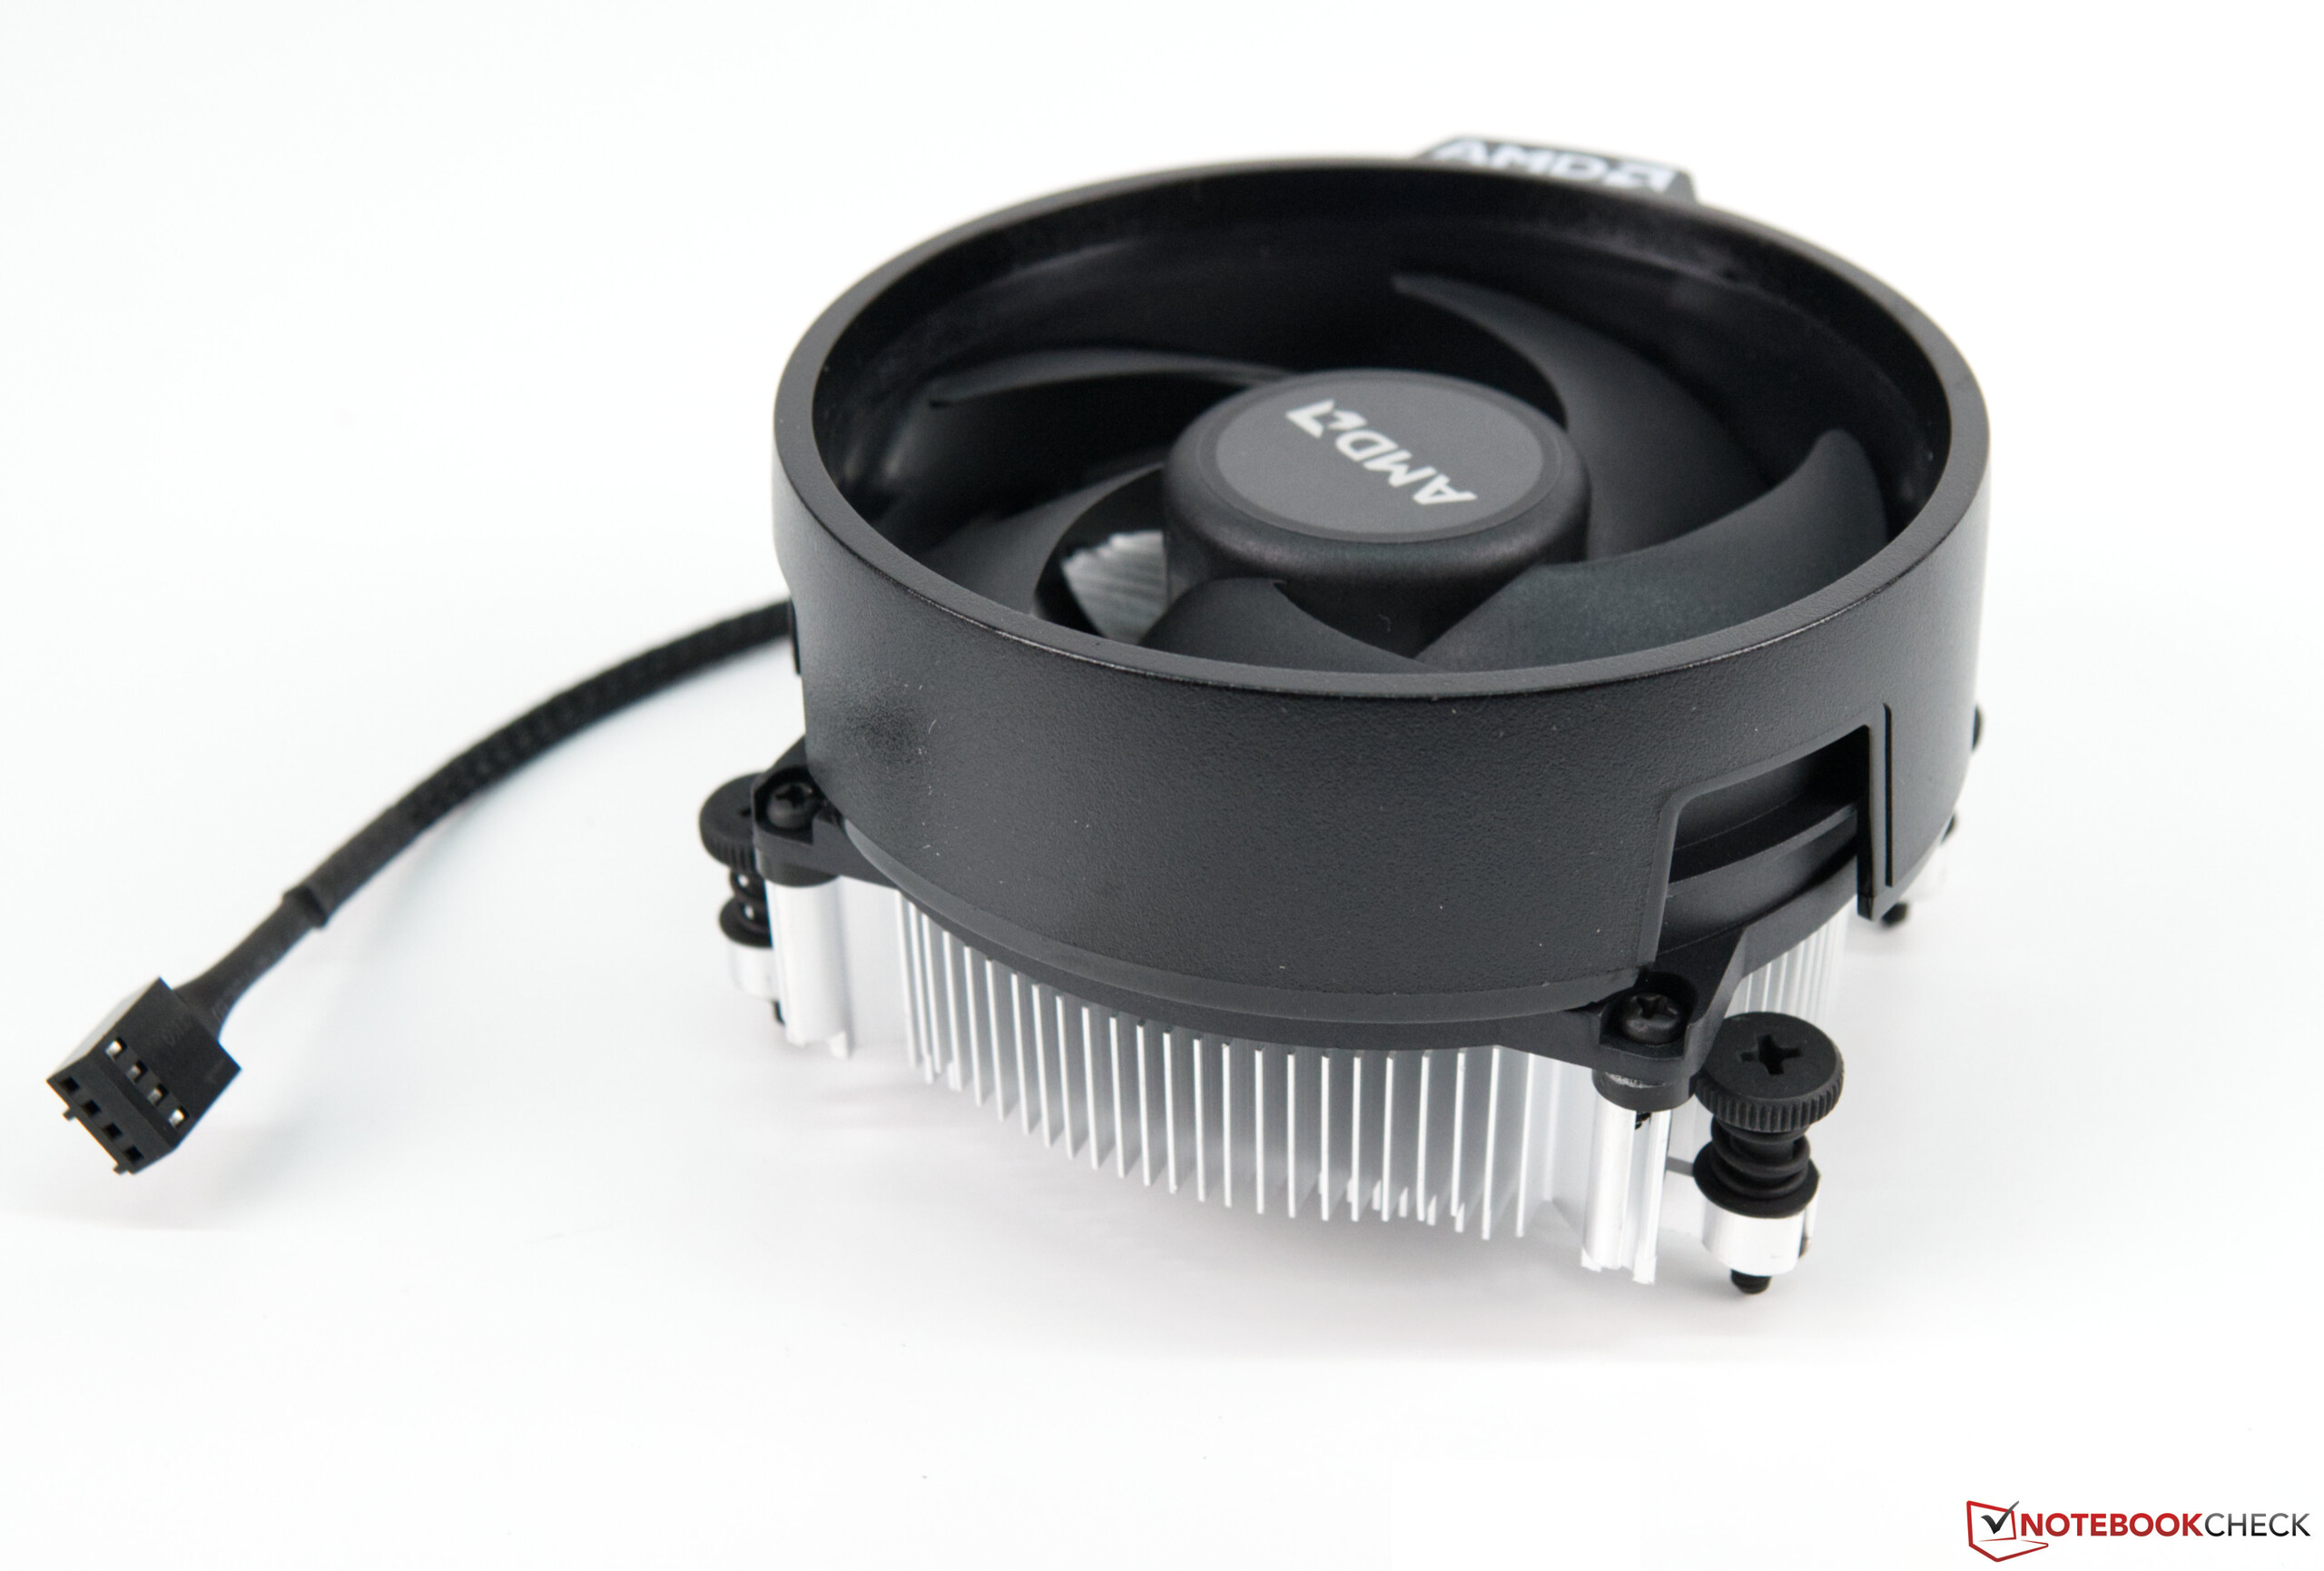
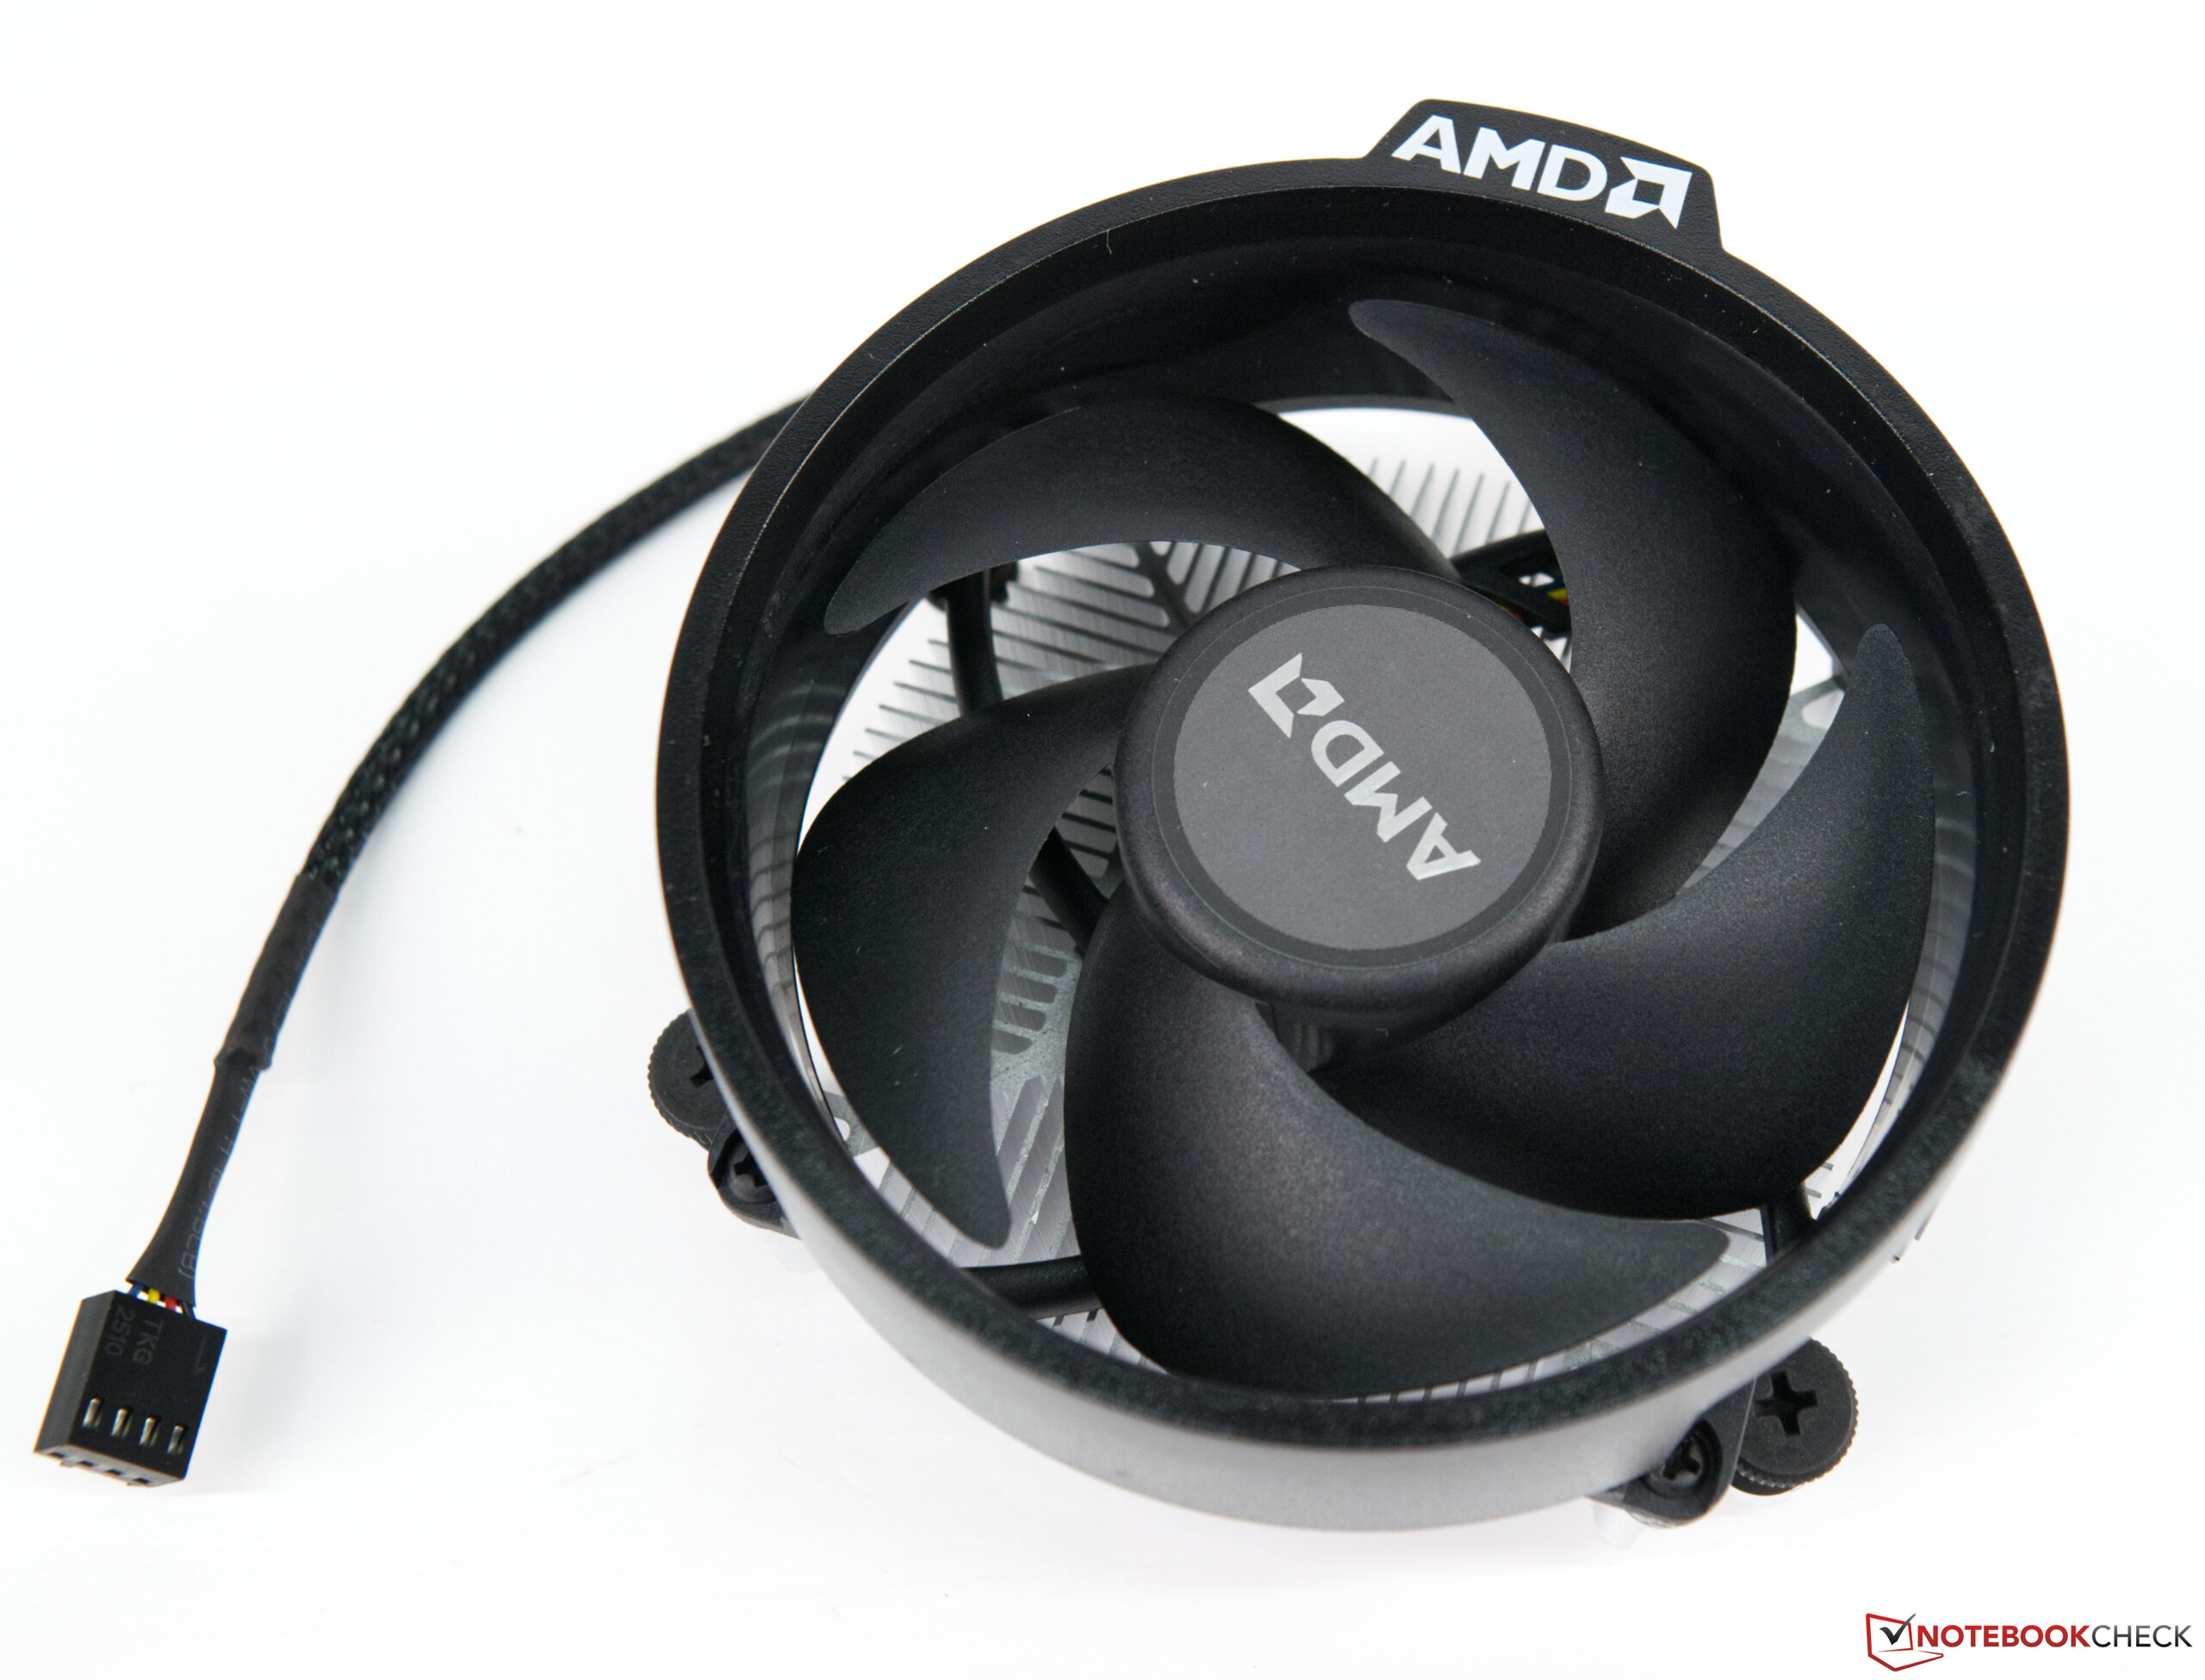
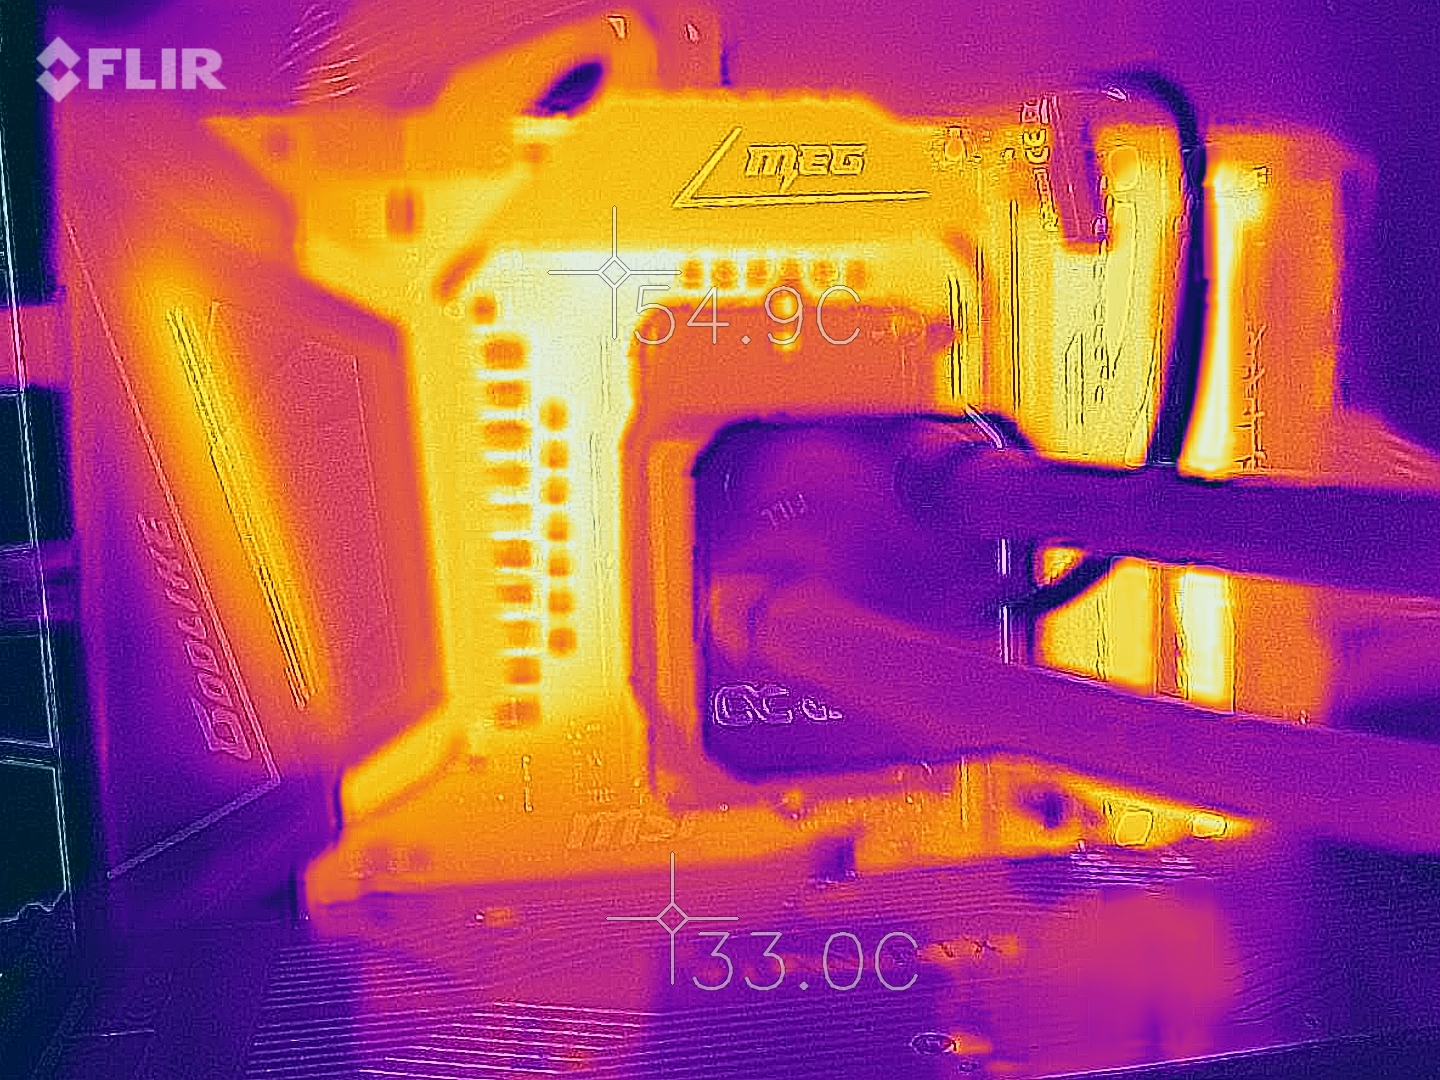
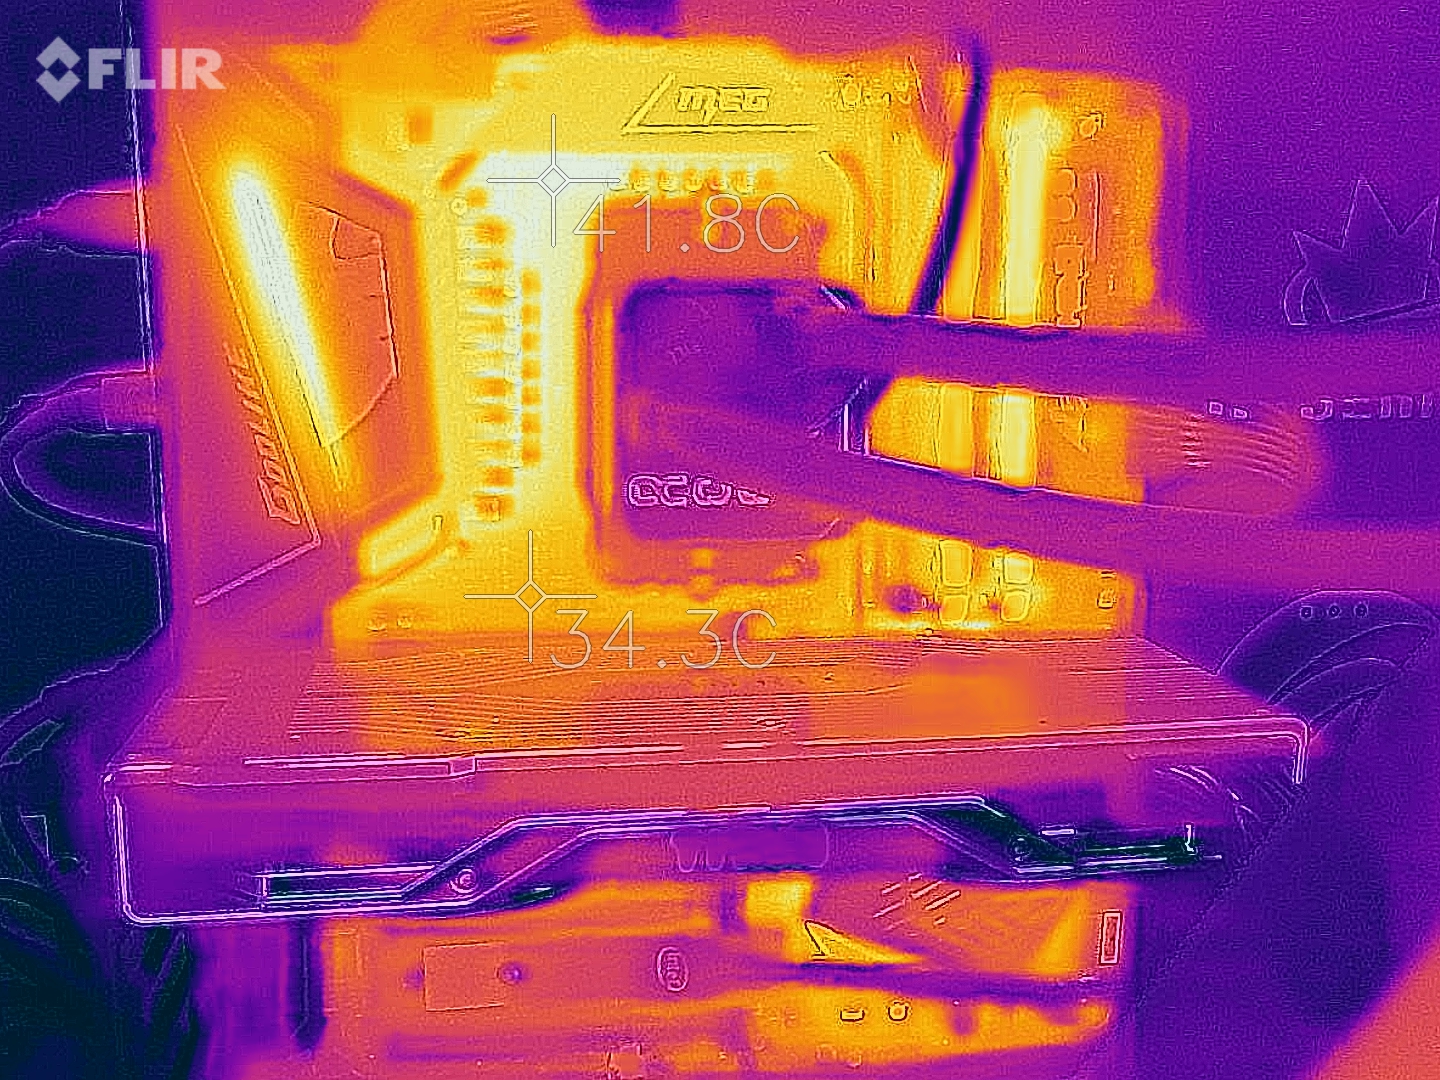
Não há preocupações com as temperaturas. No teste de estresse, o Ryzen 9 5950X atingiu apenas 70 °C (158 °F), embora o Ryzen 5 5600X tenha permanecido ligeiramente mais frio a quase 66 °C (151 °F). Portanto, o AiO da Alphacool que foi usado não tem nenhum problema em manter o modelo superior fiavelmente frio. AMD inclui um pequeno resfriador em caixa com o Ryzen 5 5600X.
AMD Ryzen 9 5950X
AMD Ryzen 5 5600X
| Power Consumption / The Witcher 3 ultra (external Monitor) | |
| AMD Ryzen 9 5950X, NVIDIA Titan RTX (Idle: 78 W) | |
| AMD Ryzen 9 5900X, NVIDIA Titan RTX (Idle: 78.1 W) | |
| AMD Ryzen 7 2700X, NVIDIA Titan RTX | |
| AMD Ryzen 9 3950X, NVIDIA Titan RTX (Idle: 95 W) | |
| AMD Ryzen 9 3900X, NVIDIA Titan RTX (Idle: 87.4 W) | |
| AMD Ryzen 7 5800X, NVIDIA Titan RTX (Idle: 77.5 W) | |
| AMD Ryzen 7 3800XT, NVIDIA Titan RTX (Idle: 96.1 W) | |
| AMD Ryzen 5 5600X, NVIDIA Titan RTX (Idle: 79.23 W) | |
| AMD Ryzen 5 1600, NVIDIA Titan RTX (Idle: 85.9 W) | |
| Intel Core i7-10700K, NVIDIA Titan RTX (Idle: 67.7 W) | |
| AMD Ryzen 3 3300X, NVIDIA Titan RTX (Idle: 88.8 W) | |
| Intel Core i9-10900K, NVIDIA Titan RTX (Idle: 52.3 W) | |
| AMD Ryzen 3 3100, NVIDIA Titan RTX (Idle: 86 W) | |
| Power Consumption / Prime95 V2810 Stress (external Monitor) | |
| Intel Core i9-10900K, NVIDIA Titan RTX (Idle: 52.3 W) | |
| AMD Ryzen 9 5950X, NVIDIA Titan RTX (Idle: 78 W) | |
| AMD Ryzen 7 5800X, NVIDIA Titan RTX (Idle: 77.5 W) | |
| AMD Ryzen 9 5900X, NVIDIA Titan RTX (Idle: 78.1 W) | |
| Intel Core i7-10700K, NVIDIA Titan RTX (Idle: 67.7 W) | |
| AMD Ryzen 9 3950X, NVIDIA Titan RTX (Idle: 95 W) | |
| AMD Ryzen 9 3900X, NVIDIA Titan RTX (Idle: 87.4 W) | |
| AMD Ryzen 7 3800XT, NVIDIA Titan RTX (Idle: 96.1 W) | |
| AMD Ryzen 5 1600, NVIDIA Titan RTX (Idle: 85.9 W) | |
| AMD Ryzen 5 5600X, NVIDIA Titan RTX (Idle: 79.23 W) | |
| AMD Ryzen 3 3300X, NVIDIA Titan RTX (Idle: 88.8 W) | |
| AMD Ryzen 3 3100, NVIDIA Titan RTX (Idle: 86 W) | |
| Power Consumption / Cinebench R15 Multi (external Monitor) | |
| Intel Core i9-10900K, NVIDIA Titan RTX (Idle: 52.3 W) | |
| AMD Ryzen 9 5900X, NVIDIA Titan RTX (Idle: 78.1 W) | |
| AMD Ryzen 9 5950X, NVIDIA Titan RTX (Idle: 78 W) | |
| AMD Ryzen 7 5800X, NVIDIA Titan RTX (Idle: 77.5 W) | |
| AMD Ryzen 9 3950X, NVIDIA Titan RTX (Idle: 95 W) | |
| AMD Ryzen 9 3900X, NVIDIA Titan RTX (Idle: 87.4 W) | |
| Intel Core i7-10700K, NVIDIA Titan RTX (Idle: 67.7 W) | |
| AMD Ryzen 7 3800XT, NVIDIA Titan RTX (Idle: 96.1 W) | |
| AMD Ryzen 5 5600X, NVIDIA Titan RTX (Idle: 79.23 W) | |
| AMD Ryzen 5 1600, NVIDIA Titan RTX (Idle: 85.9 W) | |
| AMD Ryzen 3 3300X, NVIDIA Titan RTX (Idle: 88.8 W) | |
| AMD Ryzen 3 3100, NVIDIA Titan RTX (Idle: 86 W) | |
| Power Consumption / Cinebench R20 Multi (external Monitor) | |
| AMD Ryzen 9 5950X, NVIDIA Titan RTX (78) | |
| AMD Ryzen 5 5600X, NVIDIA Titan RTX (79.23) | |
| Power Consumption / Cinebench R20 Single (external Monitor) | |
| AMD Ryzen 9 5950X, NVIDIA Titan RTX (78) | |
| AMD Ryzen 5 5600X, NVIDIA Titan RTX (79.23) | |
* ... menor é melhor
Pro
Contra
Veredicto - Muito rápido AMD Ryzen 5000
Após a primeira revisão da nova série Ryzen 5000, já estávamos positivamente surpresos com o desempenho. A fraqueza anterior do desempenho do núcleo único em comparação com a Intel é coisa do passado desde a introdução da nova família Ryzen 5000. Mesmo o pequeno Ryzen 5 5600X é capaz de facilmente superar um Intel Core i9-10900K. Ao mesmo tempo, temos que esperar se a Intel será capaz de contra-atacar com o Rocket Lake
num futuro próximo.
Mas até lá, a AMD é capaz de usar a coroa da CPU de jogo mais rápida. Já atestamos isto para a AMD Ryzen 9 5900X
. A AMD Ryzen 9 5950X é até mesmo capaz de melhorar neste aspecto em termos de desempenho de linha única. Entretanto, nada mais é capaz de acompanhar o AMD Ryzen 9 5950X em desempenho multi-tarefa. A AMD até mesmo rebaixa claramente o AMD Ryzen 9 3950X.
Enquanto você pode falar sobre o preço, o modelo top está atualmente listado em 899 euros (~$1063). Isto é 100 Euros (~$118) a mais do que o preço de varejo recomendado na introdução, o que se deve à atual falta de disponibilidade. Para o modelo básico, a disponibilidade não parece muito melhor, resultando em preços atuais muito mais altos que o preço de varejo recomendado de 299 Euros (~$353). Aqueles que consideram a compra de um novo Ryzen 5000 devem planejar a longo prazo neste ponto, já que atualmente é muito caro. Uma vez que os estoques nas lojas se recuperaram um pouco, os preços devem retornar a níveis mais razoáveis. Mas, por enquanto, há algum problema de disponibilidade. As novas placas gráficas AMD Radeon RX 6800 também não estão disponíveis, e as coisas também não parecem diferentes para as placas GeForce RTX 3000 da Nvidia.
A AMD eleva a fasquia para a CPU de jogos mais poderosa a um novo nível, e as velocidades de relógio especificadas são quase sempre excedidas significativamente.
Aqueles afortunados que ainda forem capazes de pegar uma das novas CPUs Ryzen poderão confirmar o notável aumento de desempenho. Entretanto, cada um tem que decidir por si mesmo sobre qual CPU é a mais adequada para eles. Se for apenas uma questão de jogo, o AMD Ryzen 5 5600X é suficiente. Mas se você também quiser fazer o processamento de vídeo, o AMD Ryzen 7 5800X valeria a pena. E para os criadores de conteúdo, os modelos Ryzen 9 que também podem substituir um PC de streaming adicional valem a pena ser comprados.

