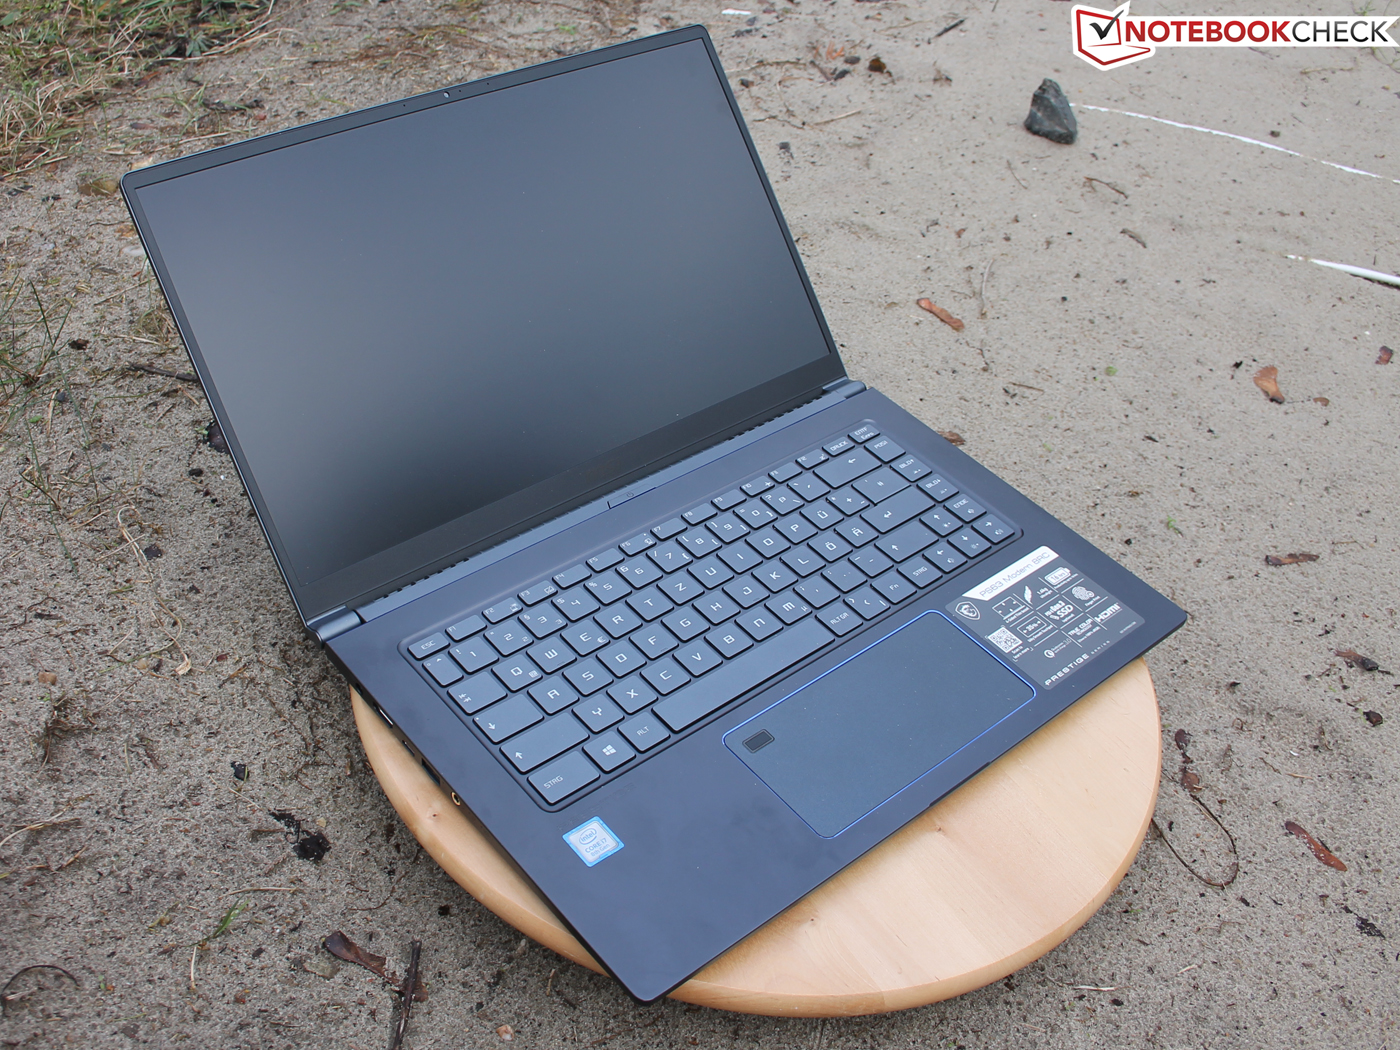
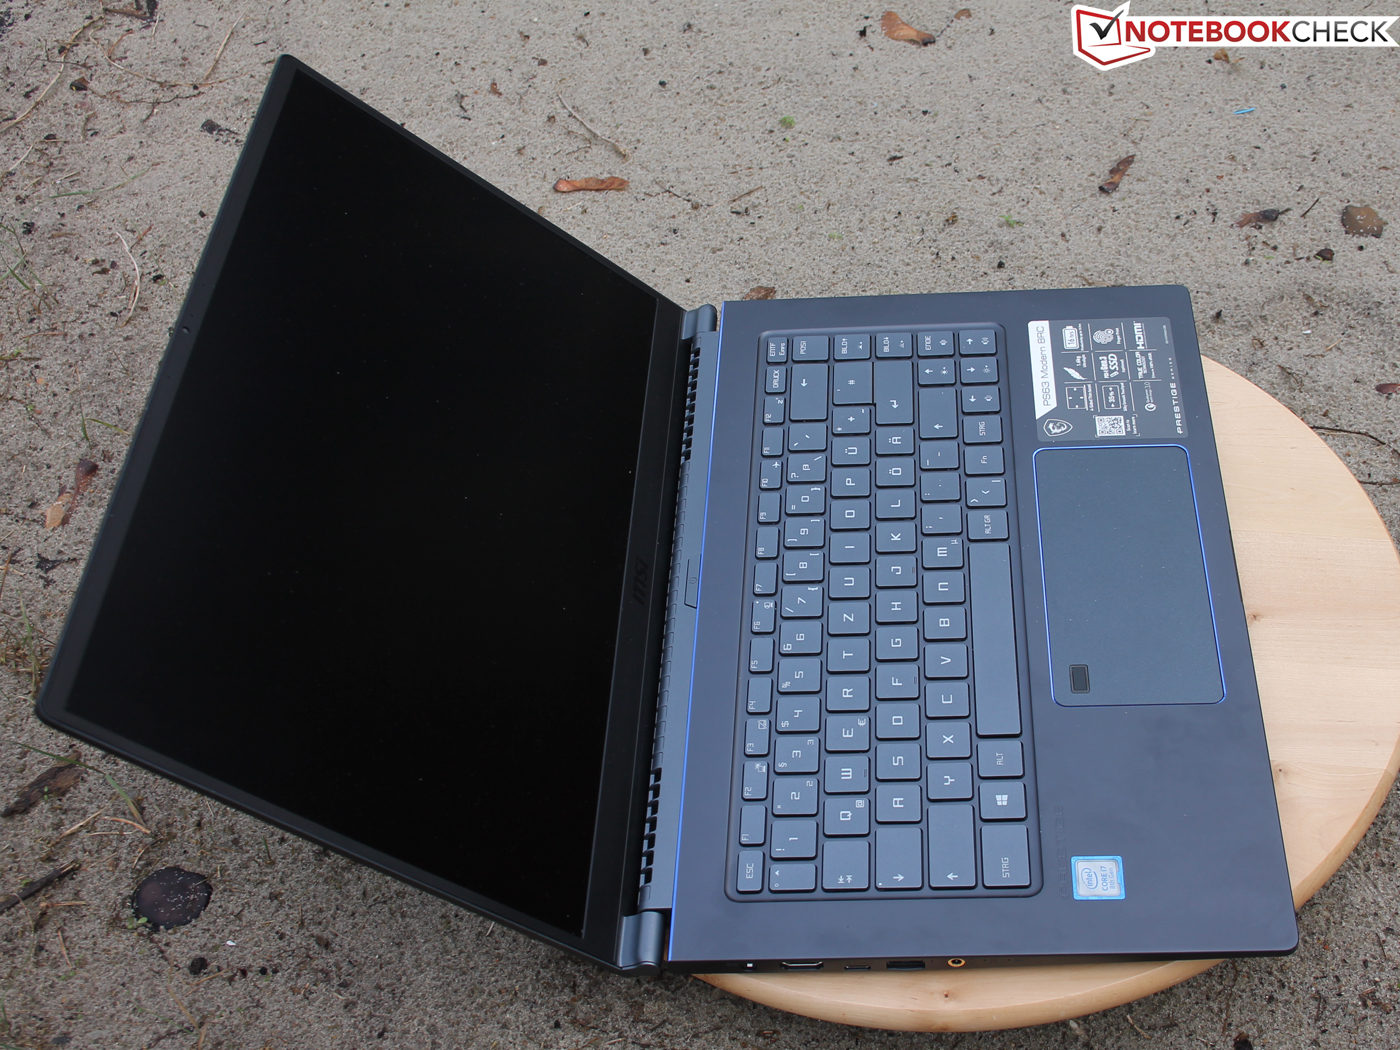
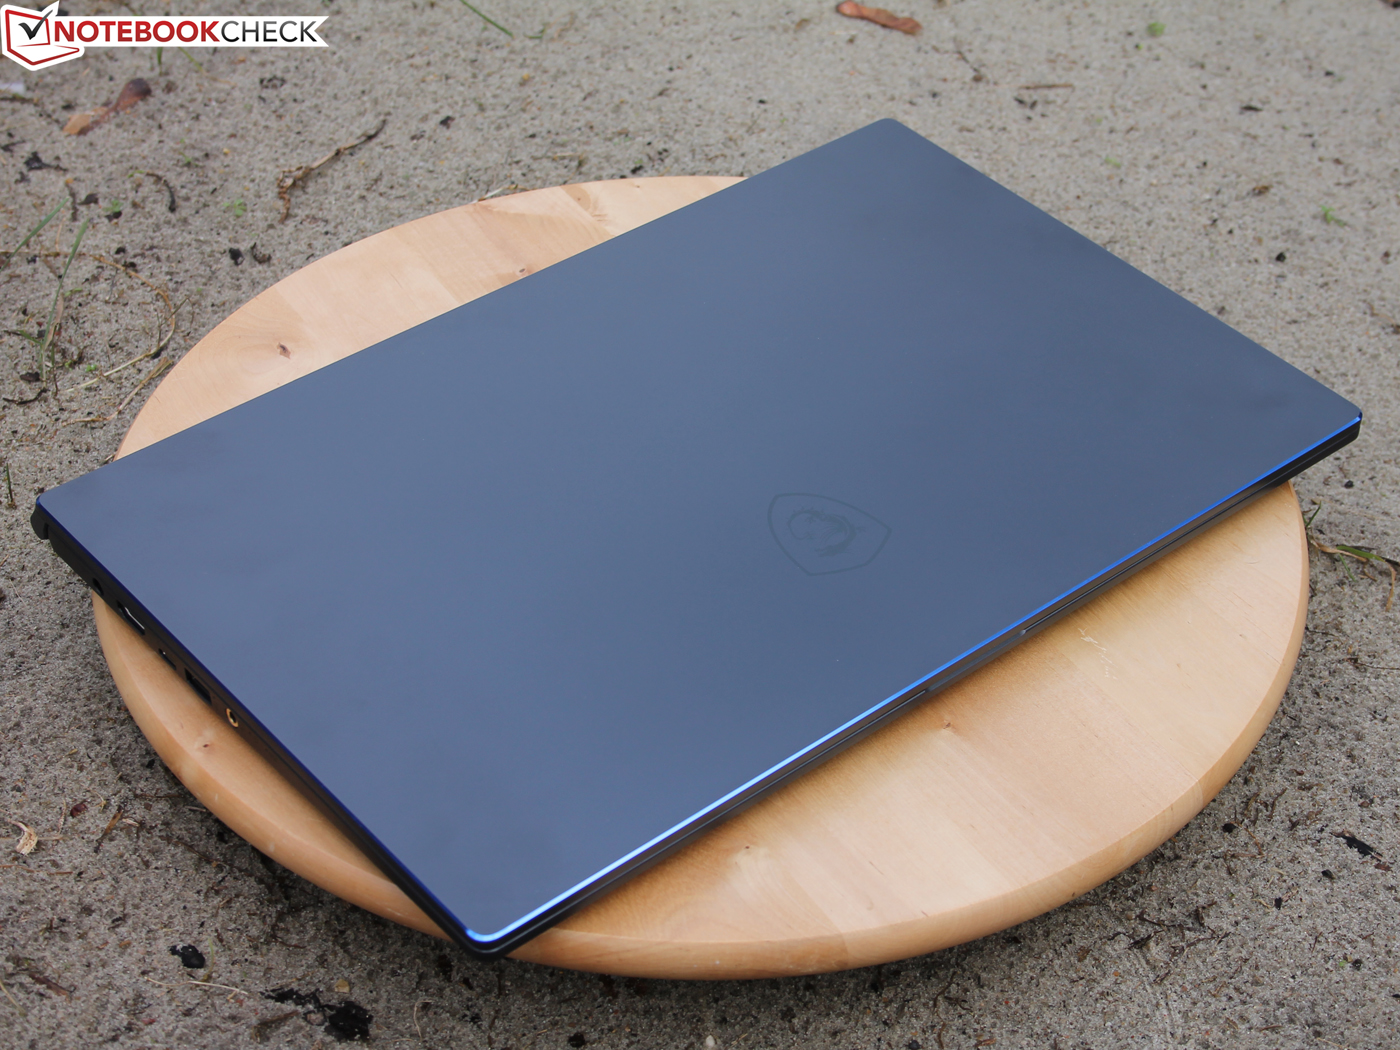
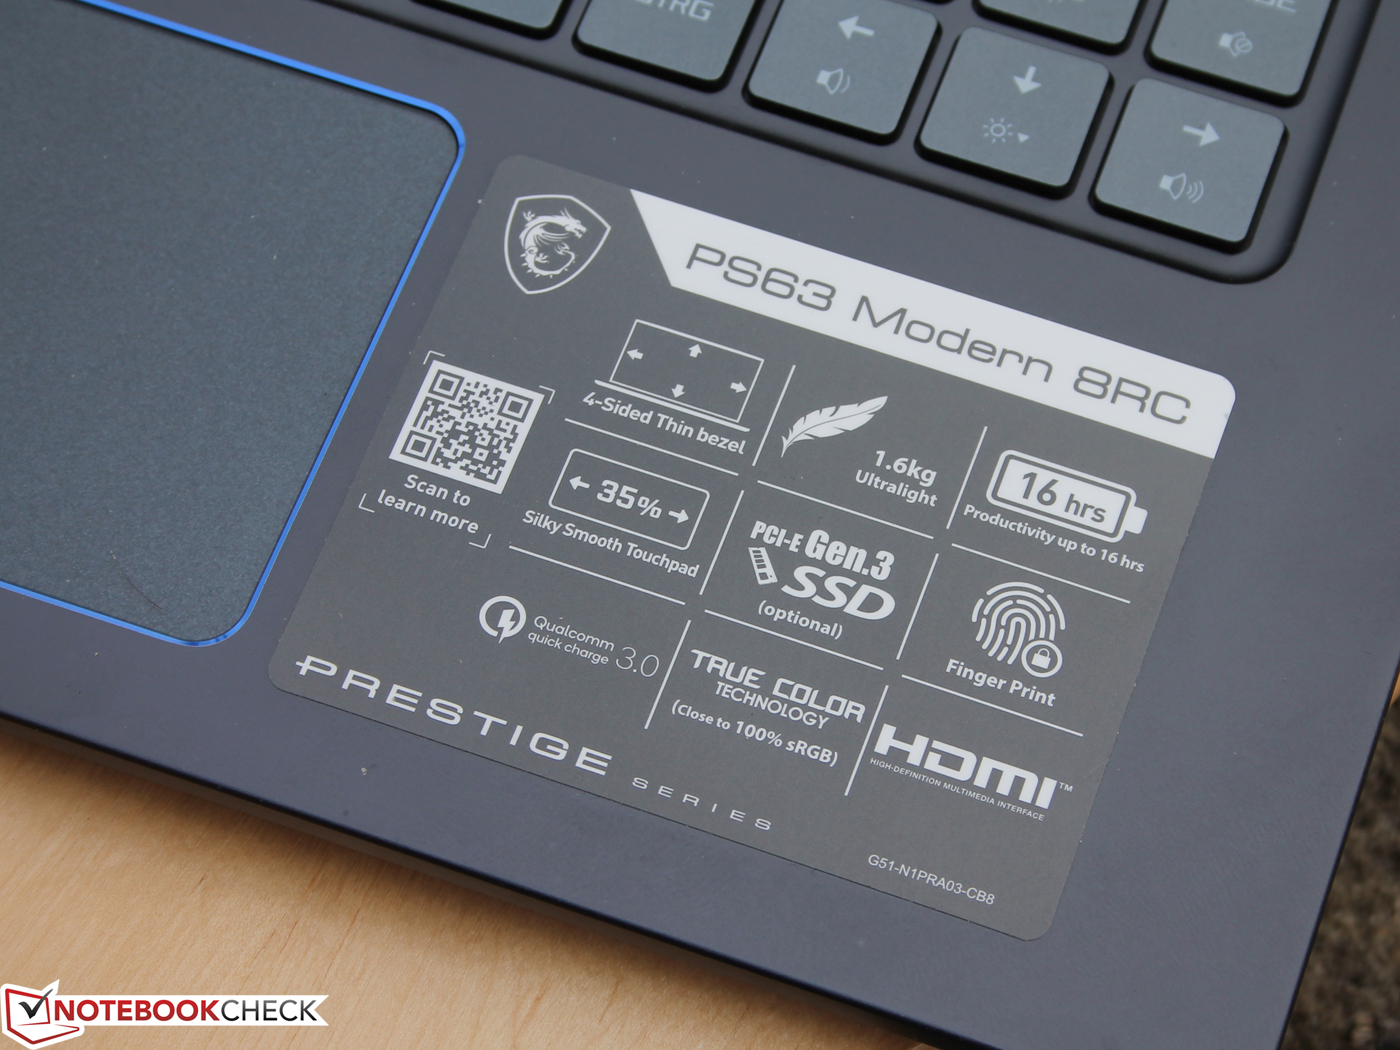
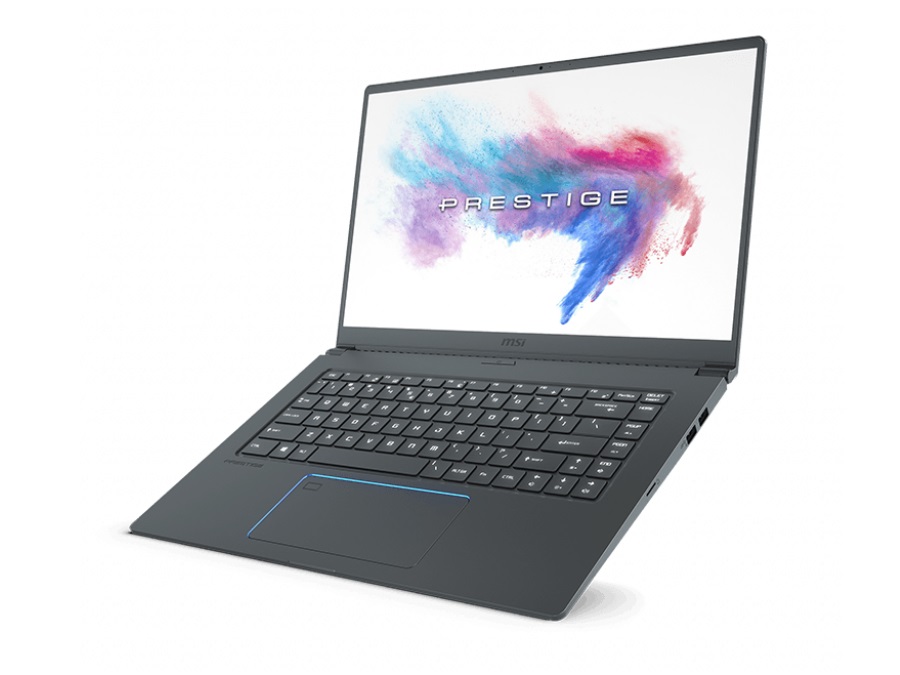
Um verdadeiro poli funcional: Breve Análise do Portátil MSI PS63 Modern 8SC
| Networking | |
| iperf3 transmit AX12 | |
| MSI PS63 Modern 8SC | |
| Acer Aspire 5 A515-52G-723L | |
| Asus ZenBook 15 UX533FD | |
| MSI PS63 Modern 8RC | |
| iperf3 receive AX12 | |
| MSI PS63 Modern 8SC | |
| Asus ZenBook 15 UX533FD | |
| MSI PS63 Modern 8RC | |
| Acer Aspire 5 A515-52G-723L | |
| |||||||||||||||||||||||||
iluminação: 84 %
iluminação com acumulador: 207 cd/m²
Contraste: 941:1 (Preto: 0.22 cd/m²)
ΔE ColorChecker Calman: 3.77 | ∀{0.5-29.43 Ø4.73}
calibrated: 2.59
ΔE Greyscale Calman: 3.22 | ∀{0.09-98 Ø4.97}
88% sRGB (Argyll 1.6.3 3D)
57% AdobeRGB 1998 (Argyll 1.6.3 3D)
64% AdobeRGB 1998 (Argyll 3D)
87.7% sRGB (Argyll 3D)
63.7% Display P3 (Argyll 3D)
Gamma: 2.42
CCT: 7072 K
| MSI PS63 Modern 8SC CMN N156HCE-EN1 (CMN15E8), IPS, 1920x1080 | MSI PS63 Modern 8RC Chi Mei CMN15E8 N156HCE/EN1, IPS, 1920x1080 | Asus ZenBook 15 UX533FD BOE07D8, IPS, 1920x1080 | Acer Aspire 5 A515-52G-723L BOE NV156FHM-N48, IPS, 1920x1080 | |
|---|---|---|---|---|
| Display | 0% | 2% | -35% | |
| Display P3 Coverage (%) | 63.7 | 63.5 0% | 67.2 5% | 40.02 -37% |
| sRGB Coverage (%) | 87.7 | 87.9 0% | 88.4 1% | 58.5 -33% |
| AdobeRGB 1998 Coverage (%) | 64 | 63.9 0% | 64.6 1% | 41.34 -35% |
| Response Times | 1% | -11% | -5% | |
| Response Time Grey 50% / Grey 80% * (ms) | 41.6 ? | 42 ? -1% | 45 ? -8% | 45 ? -8% |
| Response Time Black / White * (ms) | 32.8 ? | 32 ? 2% | 37 ? -13% | 33 ? -1% |
| PWM Frequency (Hz) | 25510 ? | 25000 ? | 250 ? | |
| Screen | 12% | -0% | -13% | |
| Brightness middle (cd/m²) | 207 | 289 40% | 311 50% | 278 34% |
| Brightness (cd/m²) | 199 | 262 32% | 303 52% | 271 36% |
| Brightness Distribution (%) | 84 | 75 -11% | 81 -4% | 89 6% |
| Black Level * (cd/m²) | 0.22 | 0.26 -18% | 0.24 -9% | 0.26 -18% |
| Contrast (:1) | 941 | 1112 18% | 1296 38% | 1069 14% |
| Colorchecker dE 2000 * | 3.77 | 2.9 23% | 5.1 -35% | 4.73 -25% |
| Colorchecker dE 2000 max. * | 5.98 | 5.71 5% | 8.91 -49% | 8.38 -40% |
| Colorchecker dE 2000 calibrated * | 2.59 | 2.88 -11% | 2.48 4% | 5.17 -100% |
| Greyscale dE 2000 * | 3.22 | 1.42 56% | 4.93 -53% | 2.59 20% |
| Gamma | 2.42 91% | 2.39 92% | 2.44 90% | 2.38 92% |
| CCT | 7072 92% | 6705 97% | 7641 85% | 6160 106% |
| Color Space (Percent of AdobeRGB 1998) (%) | 57 | 57 0% | 58 2% | 36 -37% |
| Color Space (Percent of sRGB) (%) | 88 | 87 -1% | 88 0% | 58 -34% |
| Média Total (Programa/Configurações) | 4% /
8% | -3% /
-1% | -18% /
-16% |
* ... menor é melhor
Exibir tempos de resposta
| ↔ Tempo de resposta preto para branco | ||
|---|---|---|
| 32.8 ms ... ascensão ↗ e queda ↘ combinadas | ↗ 22.8 ms ascensão | 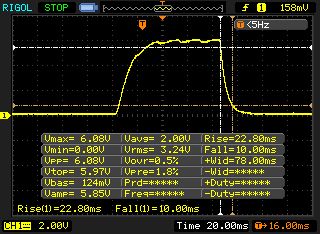 |
| ↘ 10 ms queda | ||
| A tela mostra taxas de resposta lentas em nossos testes e será insatisfatória para os jogadores. Em comparação, todos os dispositivos testados variam de 0.1 (mínimo) a 240 (máximo) ms. » 88 % de todos os dispositivos são melhores. Isso significa que o tempo de resposta medido é pior que a média de todos os dispositivos testados (19.9 ms). | ||
| ↔ Tempo de resposta 50% cinza a 80% cinza | ||
| 41.6 ms ... ascensão ↗ e queda ↘ combinadas | ↗ 23.6 ms ascensão | 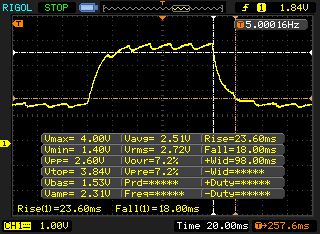 |
| ↘ 18 ms queda | ||
| A tela mostra taxas de resposta lentas em nossos testes e será insatisfatória para os jogadores. Em comparação, todos os dispositivos testados variam de 0.165 (mínimo) a 636 (máximo) ms. » 67 % de todos os dispositivos são melhores. Isso significa que o tempo de resposta medido é pior que a média de todos os dispositivos testados (31.1 ms). | ||
Cintilação da tela / PWM (modulação por largura de pulso)
| Tela tremeluzindo/PWM detectado | 25510 Hz | ≤ 28 % configuração de brilho | 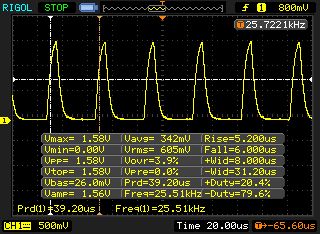 |
A luz de fundo da tela pisca em 25510 Hz (pior caso, por exemplo, utilizando PWM) Cintilação detectada em uma configuração de brilho de 28 % e abaixo. Não deve haver cintilação ou PWM acima desta configuração de brilho. A frequência de 25510 Hz é bastante alta, então a maioria dos usuários sensíveis ao PWM não deve notar nenhuma oscilação. [pwm_comparison] Em comparação: 52 % de todos os dispositivos testados não usam PWM para escurecer a tela. Se PWM foi detectado, uma média de 7798 (mínimo: 5 - máximo: 343500) Hz foi medida. | |||
| Cinebench R20 | |
| CPU (Single Core) | |
| Média da turma Multimedia (425 - 853, n=64, últimos 2 anos) | |
| MSI PS63 Modern 8SC | |
| Acer Aspire 5 A515-52G-723L | |
| CPU (Multi Core) | |
| Média da turma Multimedia (1887 - 12912, n=64, últimos 2 anos) | |
| MSI PS63 Modern 8SC | |
| Acer Aspire 5 A515-52G-723L | |
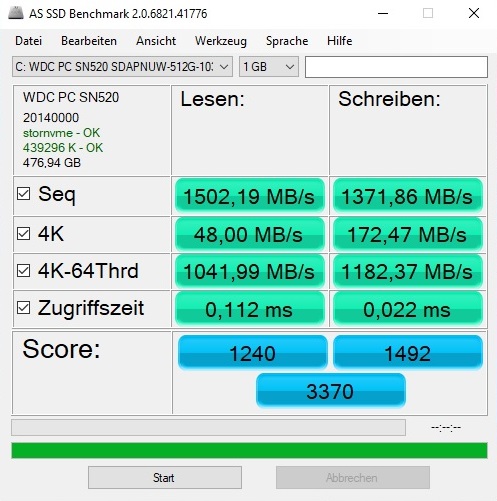
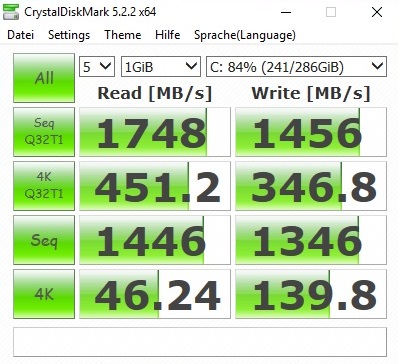
| MSI PS63 Modern 8SC WDC PC SN520 SDAPNUW-512G | MSI PS63 Modern 8RC WDC PC SN520 SDAPNUW-512G | Asus ZenBook 15 UX533FD WDC PC SN520 SDAPNUW-512G | Acer Aspire 5 A515-52G-723L WDC PC SN520 SDAPNUW-512G | |
|---|---|---|---|---|
| CrystalDiskMark 5.2 / 6 | -13% | -10% | -10% | |
| Write 4K (MB/s) | 139.8 | 121.3 -13% | 126.2 -10% | 130.1 -7% |
| Read 4K (MB/s) | 46.24 | 44.07 -5% | 41.2 -11% | 27.64 -40% |
| Write Seq (MB/s) | 1346 | 1176 -13% | 1055 -22% | 1438 7% |
| Read Seq (MB/s) | 1446 | 1139 -21% | 884 -39% | 1319 -9% |
| Write 4K Q32T1 (MB/s) | 346.8 | 257.8 -26% | 445.5 28% | 323.3 -7% |
| Read 4K Q32T1 (MB/s) | 451.2 | 325.9 -28% | 338.8 -25% | 359.9 -20% |
| Write Seq Q32T1 (MB/s) | 1456 | 1455 0% | 1453 0% | 1454 0% |
| Read Seq Q32T1 (MB/s) | 1748 | 1741 0% | 1734 -1% | 1740 0% |

| 3DMark 06 Standard Score | 31487 pontos | |
| 3DMark Vantage P Result | 30957 pontos | |
| 3DMark 11 Performance | 10471 pontos | |
| 3DMark Ice Storm Standard Score | 78312 pontos | |
| 3DMark Cloud Gate Standard Score | 21701 pontos | |
| 3DMark Fire Strike Score | 6850 pontos | |
| 3DMark Time Spy Score | 3004 pontos | |
Ajuda | ||
| 3DMark | |
| 1920x1080 Fire Strike Graphics | |
| Média da turma Multimedia (2328 - 48907, n=66, últimos 2 anos) | |
| MSI PS63 Modern 8SC | |
| MSI PS63 Modern 8RC | |
| Asus ZenBook 15 UX533FD | |
| Acer Aspire 5 A515-52G-723L | |
| 2560x1440 Time Spy Graphics | |
| Média da turma Multimedia (696 - 19403, n=67, últimos 2 anos) | |
| MSI PS63 Modern 8SC | |
| Acer Aspire 5 A515-52G-723L | |
| 3DMark 11 - 1280x720 Performance GPU | |
| Média da turma Multimedia (3765 - 60002, n=62, últimos 2 anos) | |
| MSI PS63 Modern 8SC | |
| MSI PS63 Modern 8RC | |
| Asus ZenBook 15 UX533FD | |
| Acer Aspire 5 A515-52G-723L | |
| The Witcher 3 | |
| 1920x1080 High Graphics & Postprocessing (Nvidia HairWorks Off) | |
| Média da turma Multimedia (22 - 224, n=13, últimos 2 anos) | |
| MSI PS63 Modern 8SC | |
| Asus ZenBook 15 UX533FD | |
| Acer Aspire 5 A515-52G-723L | |
| 1920x1080 Ultra Graphics & Postprocessing (HBAO+) | |
| Média da turma Multimedia (11 - 121, n=13, últimos 2 anos) | |
| Asus ZenBook 15 UX533FD | |
| MSI PS63 Modern 8SC | |
| Acer Aspire 5 A515-52G-723L | |
| baixo | média | alto | ultra | QHD | 4K | |
|---|---|---|---|---|---|---|
| The Witcher 3 (2015) | 48.1 | 28.8 | 17.6 | |||
| Rainbow Six Siege (2015) | 115 | 101 | 40 | |||
| Doom (2016) | 79.6 | 77.4 | 23.9 | |||
| Overwatch (2016) | 119 | 69.5 | 39.1 | |||
| Mirror's Edge Catalyst (2016) | 54.7 | 49.9 | 17.5 | |||
| Deus Ex Mankind Divided (2016) | 43 | 22.9 | 14.1 | |||
| Dishonored 2 (2016) | 53.9 | 44.8 | 21.2 | |||
| Resident Evil 7 (2017) | 146 | 78.8 | 65.2 | 21.5 | ||
| For Honor (2017) | 66.8 | 63.8 | 49.4 | 19.1 | ||
| Ghost Recon Wildlands (2017) | 48.5 | 44.4 | 21.7 | 14.6 | ||
| Prey (2017) | 97.5 | 77.3 | 67.1 | 23.6 | ||
| Rocket League (2017) | 128 | 86.5 | 42.7 | |||
| Playerunknown's Battlegrounds (PUBG) (2017) | 84.6 | 70.8 | 52.6 | 16.6 | ||
| Middle-earth: Shadow of War (2017) | 64 | 47 | 35 | 14 | ||
| ELEX (2017) | 61.1 | 48.6 | 37.3 | 24.5 | 12.2 | |
| Need for Speed Payback (2017) | 72.3 | 61.8 | 58.9 | 38.6 | 19.1 | |
| Star Wars Battlefront 2 (2017) | 72.2 | 62.3 | 46.5 | 29.4 | 5.6 | |
| Fortnite (2018) | 138 | 79.9 | 59.1 | 36.2 | 10.9 | |
| Final Fantasy XV Benchmark (2018) | 41.7 | 29.4 | 9.6 | |||
| Kingdom Come: Deliverance (2018) | 48.1 | 38 | 26.4 | 18.5 | 9.4 | |
| The Crew 2 (2018) | 59.3 | 49.1 | 42 | 26.4 | 13 | |
| Monster Hunter World (2018) | 46.3 | 40.1 | 31.4 | 19.2 | 8.9 | |
| Shadow of the Tomb Raider (2018) | 47 | 43 | 38 | 24 | 12 | |
| FIFA 19 (2018) | 195 | 179 | 173 | 124 | 64.8 | |
| Assassin´s Creed Odyssey (2018) | 49 | 41 | 20 | 17 | 8 | |
| Call of Duty Black Ops 4 (2018) | 62.7 | 58.5 | 50.9 | 32.7 | 10.9 | |
| Hitman 2 (2018) | 53.1 | 47.6 | 44.4 | 28.6 | 14.1 | |
| Battlefield V (2018) | 63.6 | 54.1 | 49.3 | 36.1 | 19.4 | |
| Farming Simulator 19 (2018) | 136 | 84 | 60.6 | 40.7 | ||
| Darksiders III (2018) | 67.4 | 53.4 | 47.1 | 29.3 | 9.7 | |
| Just Cause 4 (2018) | 59 | 42.6 | 39.7 | 26.2 | 13.2 | |
| Apex Legends (2019) | 69.7 | 57.6 | 54.3 | 39.7 | 21.9 | |
| Far Cry New Dawn (2019) | 53 | 50 | 46 | 32 | 16 | |
| Metro Exodus (2019) | 35.4 | 26.4 | 21.6 | 16.4 | 9.9 | |
| Anthem (2019) | 49.4 | 42.6 | 34.9 | 22.6 | 13.1 | |
| Dirt Rally 2.0 (2019) | 64 | 51.1 | 31.7 | 23.1 | ||
| The Division 2 (2019) | 51 | 41 | 30 | 20 | 9 | |
| Anno 1800 (2019) | 56.8 | 36.2 | 19.2 | 13.8 | 8.4 | |
| Rage 2 (2019) | 43 | 36.6 | 35.8 | 22.4 | 7.4 | |
| F1 2019 (2019) | 84 | 65 | 41 | 35 | 20 |
Barulho
| Ocioso |
| 32 / 33 / 34 dB |
| Carga |
| 44 / 45 dB |
 | ||
30 dB silencioso 40 dB(A) audível 50 dB(A) ruidosamente alto |
||
min: | ||
| MSI PS63 Modern 8SC i7-8565U, GeForce GTX 1650 Max-Q | MSI PS63 Modern 8RC i7-8565U, GeForce GTX 1050 Max-Q | Asus ZenBook 15 UX533FD i7-8565U, GeForce GTX 1050 Max-Q | Acer Aspire 5 A515-52G-723L i7-8565U, GeForce MX250 | Média da turma Multimedia | |
|---|---|---|---|---|---|
| Noise | 11% | 6% | 7% | 17% | |
| desligado / ambiente * (dB) | 30 | 30.4 -1% | 30.5 -2% | 29.9 -0% | 24.2 ? 19% |
| Idle Minimum * (dB) | 32 | 30.7 4% | 30.5 5% | 29.9 7% | 24.4 ? 24% |
| Idle Average * (dB) | 33 | 30.7 7% | 30.5 8% | 29.9 9% | 24.8 ? 25% |
| Idle Maximum * (dB) | 34 | 30.7 10% | 30.5 10% | 29.9 12% | 26.5 ? 22% |
| Load Average * (dB) | 44 | 34 23% | 40.8 7% | 41.7 5% | 37.6 ? 15% |
| Witcher 3 ultra * (dB) | 41 | ||||
| Load Maximum * (dB) | 45 | 33.7 25% | 41.8 7% | 41.7 7% | 45.9 ? -2% |
* ... menor é melhor
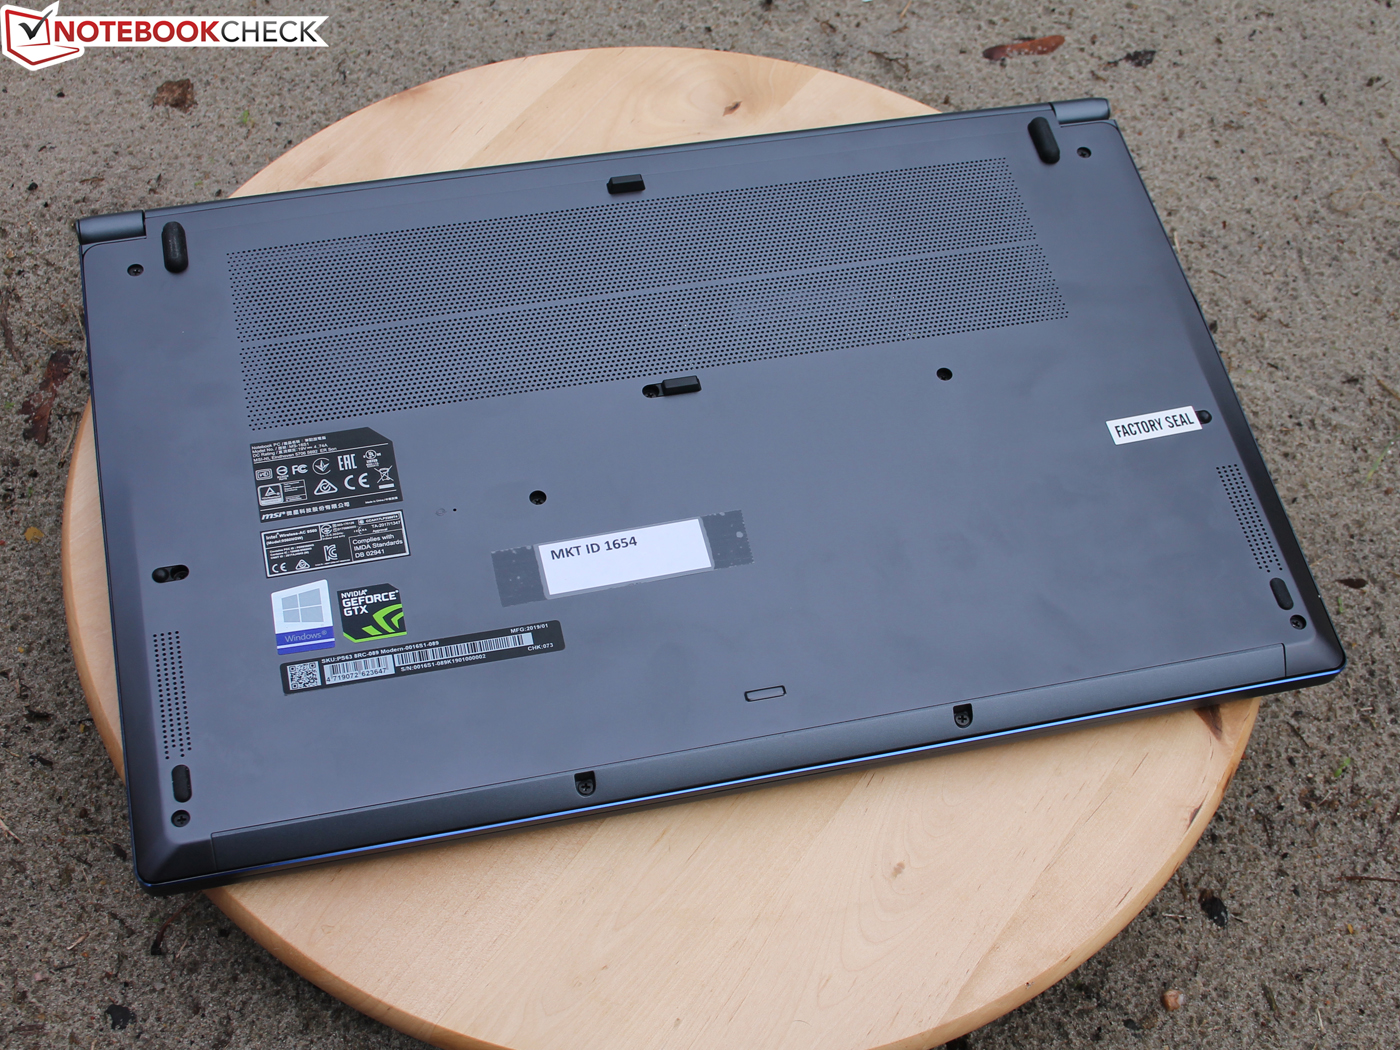
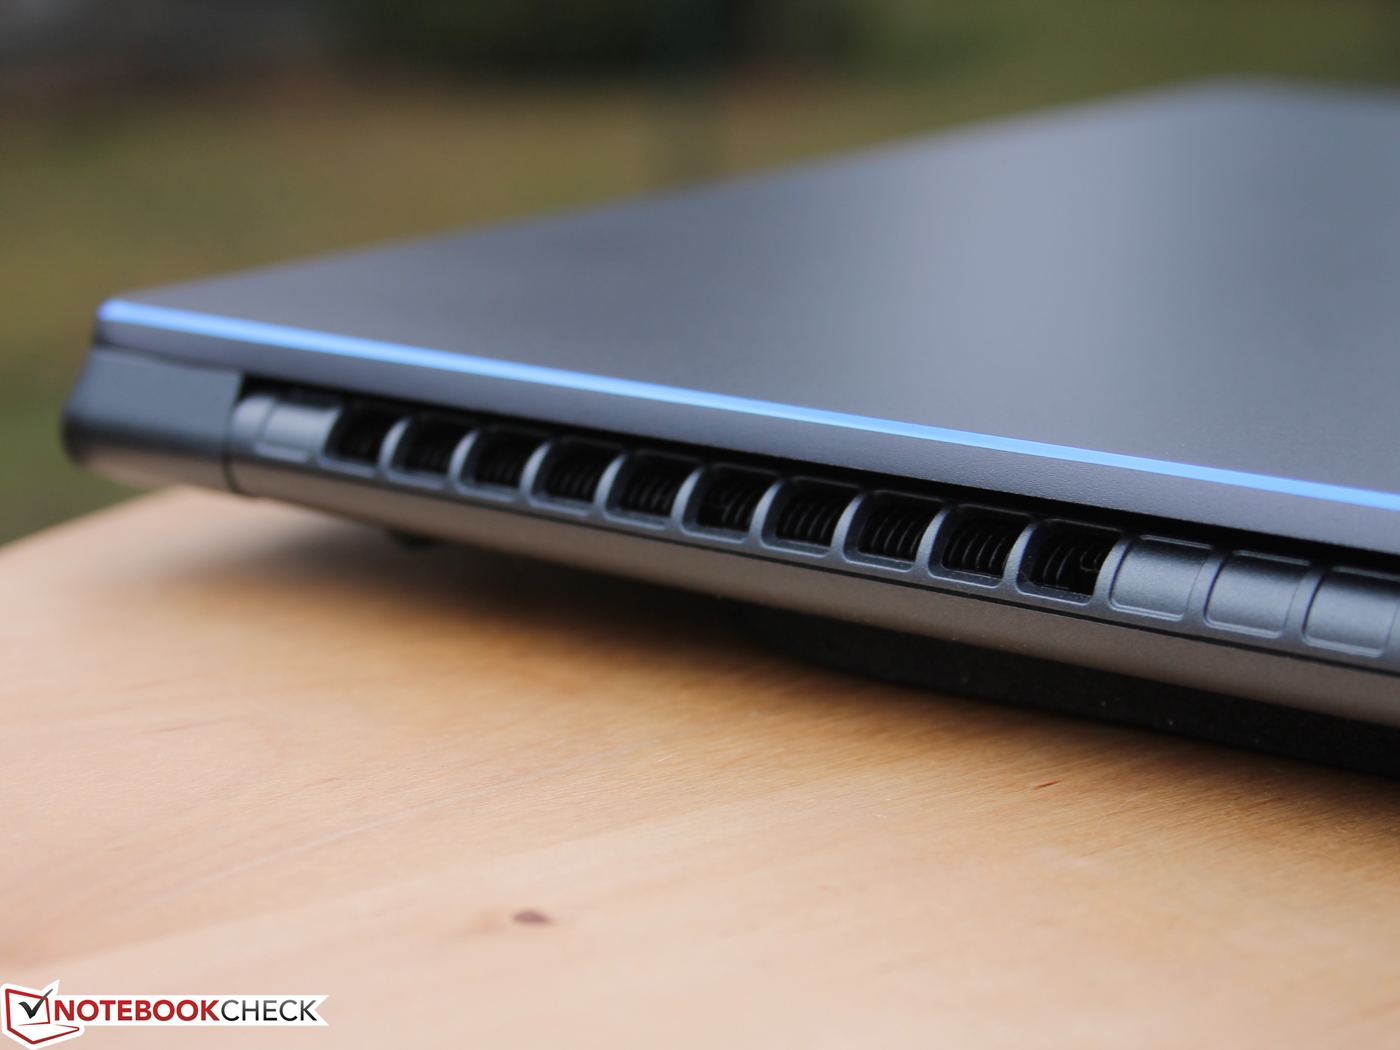
(-) A temperatura máxima no lado superior é 56 °C / 133 F, em comparação com a média de 36.8 °C / 98 F , variando de 21 a 71 °C para a classe Multimedia.
(-) A parte inferior aquece até um máximo de 60 °C / 140 F, em comparação com a média de 39.1 °C / 102 F
(+) Em uso inativo, a temperatura média para o lado superior é 27.2 °C / 81 F, em comparação com a média do dispositivo de 31.3 °C / ### class_avg_f### F.
(-) Jogando The Witcher 3, a temperatura média para o lado superior é 43 °C / 109 F, em comparação com a média do dispositivo de 31.3 °C / ## #class_avg_f### F.
(±) Os apoios para as mãos e o touchpad podem ficar muito quentes ao toque, com um máximo de 38 °C / 100.4 F.
(-) A temperatura média da área do apoio para as mãos de dispositivos semelhantes foi 28.7 °C / 83.7 F (-9.3 °C / -16.7 F).
| MSI PS63 Modern 8SC i7-8565U, GeForce GTX 1650 Max-Q | MSI PS63 Modern 8RC i7-8565U, GeForce GTX 1050 Max-Q | Asus ZenBook 15 UX533FD i7-8565U, GeForce GTX 1050 Max-Q | Acer Aspire 5 A515-52G-723L i7-8565U, GeForce MX250 | Média da turma Multimedia | |
|---|---|---|---|---|---|
| Heat | 3% | 13% | 2% | 14% | |
| Maximum Upper Side * (°C) | 56 | 58.6 -5% | 47.2 16% | 53.7 4% | 41.5 ? 26% |
| Maximum Bottom * (°C) | 60 | 60 -0% | 43.2 28% | 56 7% | 44.1 ? 26% |
| Idle Upper Side * (°C) | 29 | 26 10% | 27.7 4% | 28.4 2% | 27.1 ? 7% |
| Idle Bottom * (°C) | 27 | 25.2 7% | 25.6 5% | 28.9 -7% | 28 ? -4% |
* ... menor é melhor
MSI PS63 Modern 8SC análise de áudio
(+) | os alto-falantes podem tocar relativamente alto (###valor### dB)
Graves 100 - 315Hz
(-) | quase nenhum baixo - em média 24.3% menor que a mediana
(±) | a linearidade dos graves é média (10.3% delta para a frequência anterior)
Médios 400 - 2.000 Hz
(+) | médios equilibrados - apenas 4.2% longe da mediana
(±) | a linearidade dos médios é média (9.1% delta para frequência anterior)
Altos 2 - 16 kHz
(+) | agudos equilibrados - apenas 2.3% longe da mediana
(+) | os máximos são lineares (5.9% delta da frequência anterior)
Geral 100 - 16.000 Hz
(±) | a linearidade do som geral é média (19.1% diferença em relação à mediana)
Comparado com a mesma classe
» 61% de todos os dispositivos testados nesta classe foram melhores, 7% semelhantes, 32% piores
» O melhor teve um delta de 5%, a média foi 17%, o pior foi 45%
Comparado com todos os dispositivos testados
» 46% de todos os dispositivos testados foram melhores, 7% semelhantes, 47% piores
» O melhor teve um delta de 4%, a média foi 24%, o pior foi 134%
MSI P65 Creator 9SF-657 análise de áudio
(±) | o volume do alto-falante é médio, mas bom (###valor### dB)
Graves 100 - 315Hz
(-) | quase nenhum baixo - em média 23.6% menor que a mediana
(±) | a linearidade dos graves é média (9.9% delta para a frequência anterior)
Médios 400 - 2.000 Hz
(±) | médios mais altos - em média 8.4% maior que a mediana
(±) | a linearidade dos médios é média (7.8% delta para frequência anterior)
Altos 2 - 16 kHz
(±) | máximos mais altos - em média 6% maior que a mediana
(±) | a linearidade dos máximos é média (9.3% delta para frequência anterior)
Geral 100 - 16.000 Hz
(±) | a linearidade do som geral é média (28.3% diferença em relação à mediana)
Comparado com a mesma classe
» 94% de todos os dispositivos testados nesta classe foram melhores, 2% semelhantes, 5% piores
» O melhor teve um delta de 5%, a média foi 17%, o pior foi 45%
Comparado com todos os dispositivos testados
» 85% de todos os dispositivos testados foram melhores, 3% semelhantes, 12% piores
» O melhor teve um delta de 4%, a média foi 24%, o pior foi 134%
| desligado | |
| Ocioso | |
| Carga |
|
Key:
min: | |
| MSI PS63 Modern 8SC i7-8565U, GeForce GTX 1650 Max-Q | MSI PS63 Modern 8RC i7-8565U, GeForce GTX 1050 Max-Q | Asus ZenBook 15 UX533FD i7-8565U, GeForce GTX 1050 Max-Q | Acer Aspire 5 A515-52G-723L i7-8565U, GeForce MX250 | Média da turma Multimedia | |
|---|---|---|---|---|---|
| Power Consumption | -4% | 17% | 25% | -4% | |
| Idle Minimum * (Watt) | 6 | 6.8 -13% | 2.7 55% | 4.4 27% | 5.71 ? 5% |
| Idle Average * (Watt) | 8 | 9.8 -23% | 8 -0% | 6.9 14% | 10.1 ? -26% |
| Idle Maximum * (Watt) | 12 | 11.4 5% | 10.6 12% | 9.9 17% | 12.4 ? -3% |
| Load Average * (Watt) | 76 | 76 -0% | 74 3% | 55 28% | 65 ? 14% |
| Witcher 3 ultra * (Watt) | 60 | ||||
| Load Maximum * (Watt) | 102 | 93 9% | 89 13% | 63.4 38% | 112.2 ? -10% |
* ... menor é melhor
| MSI PS63 Modern 8SC i7-8565U, GeForce GTX 1650 Max-Q, 82 Wh | MSI PS63 Modern 8RC i7-8565U, GeForce GTX 1050 Max-Q, 82 Wh | Asus ZenBook 15 UX533FD i7-8565U, GeForce GTX 1050 Max-Q, 73 Wh | Acer Aspire 5 A515-52G-723L i7-8565U, GeForce MX250, 48 Wh | Média da turma Multimedia | |
|---|---|---|---|---|---|
| Duração da bateria | 22% | 47% | -10% | 38% | |
| Reader / Idle (h) | 12.1 | 14 16% | 26.5 119% | 12.9 7% | 25.2 ? 108% |
| WiFi v1.3 (h) | 9 | 11.4 27% | 8.7 -3% | 6.9 -23% | 12 ? 33% |
| Load (h) | 2.3 | 2.8 22% | 2.9 26% | 2 -13% | 1.675 ? -27% |
| H.264 (h) | 6.5 | 16.4 ? |
Pro
Contra
Olhando além da rigidez abaixo do ideal da carcaça e algumas desvantagens da tela (brilho, tempo de resposta, ...), o MSI PS63 8SC é um dos melhores e mais equilibrados portáteis multimídia, além de ser bem adequado para os criadores de conteúdo.
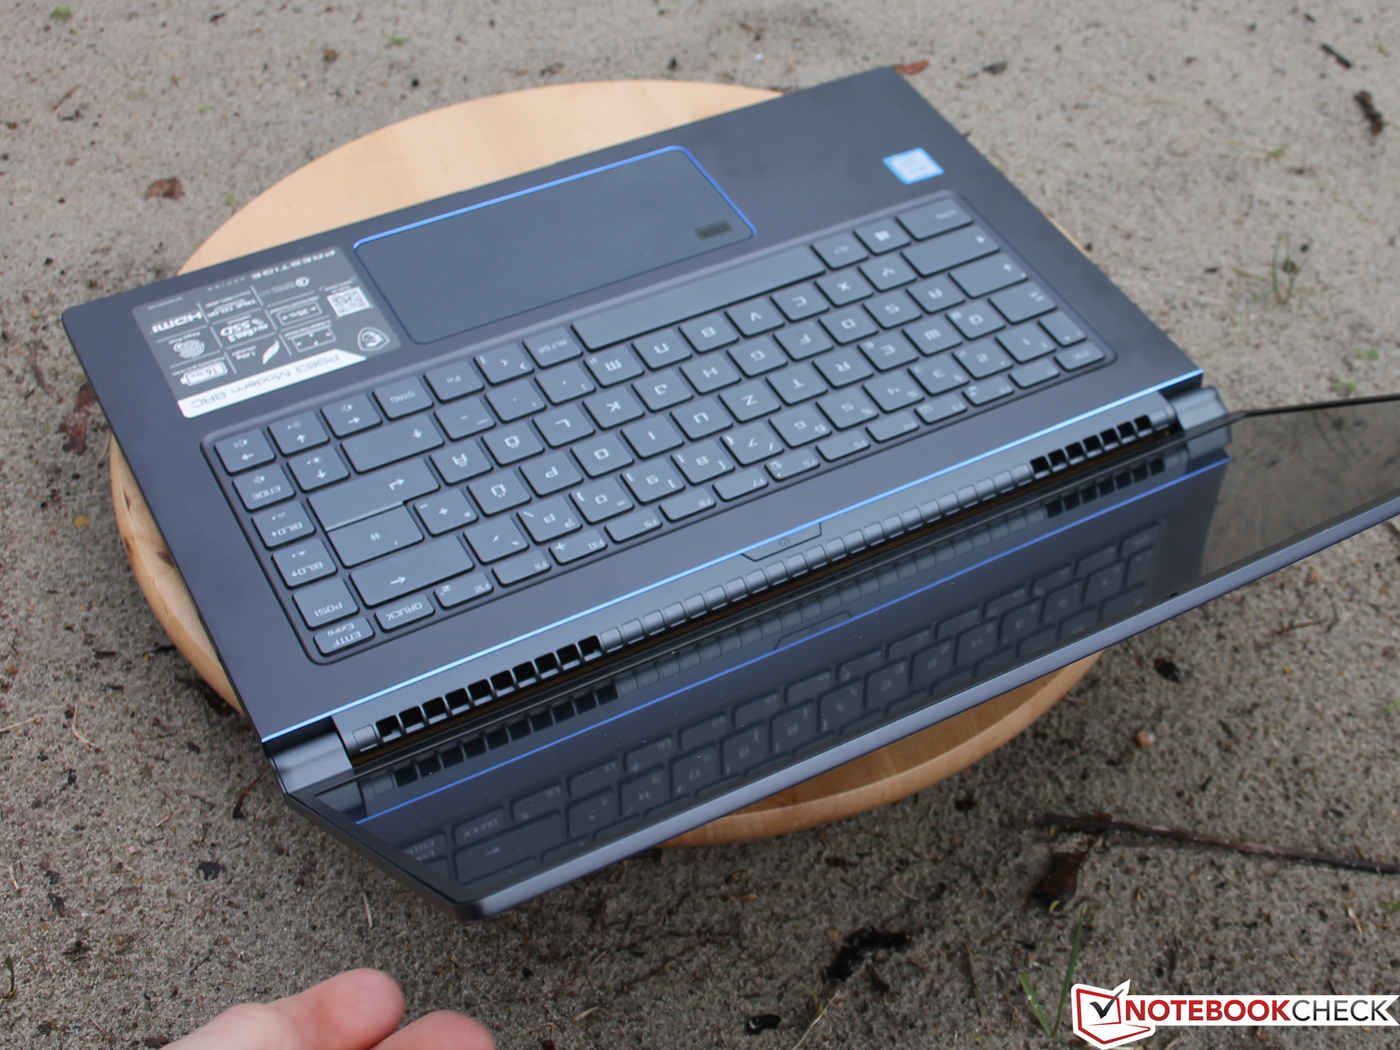
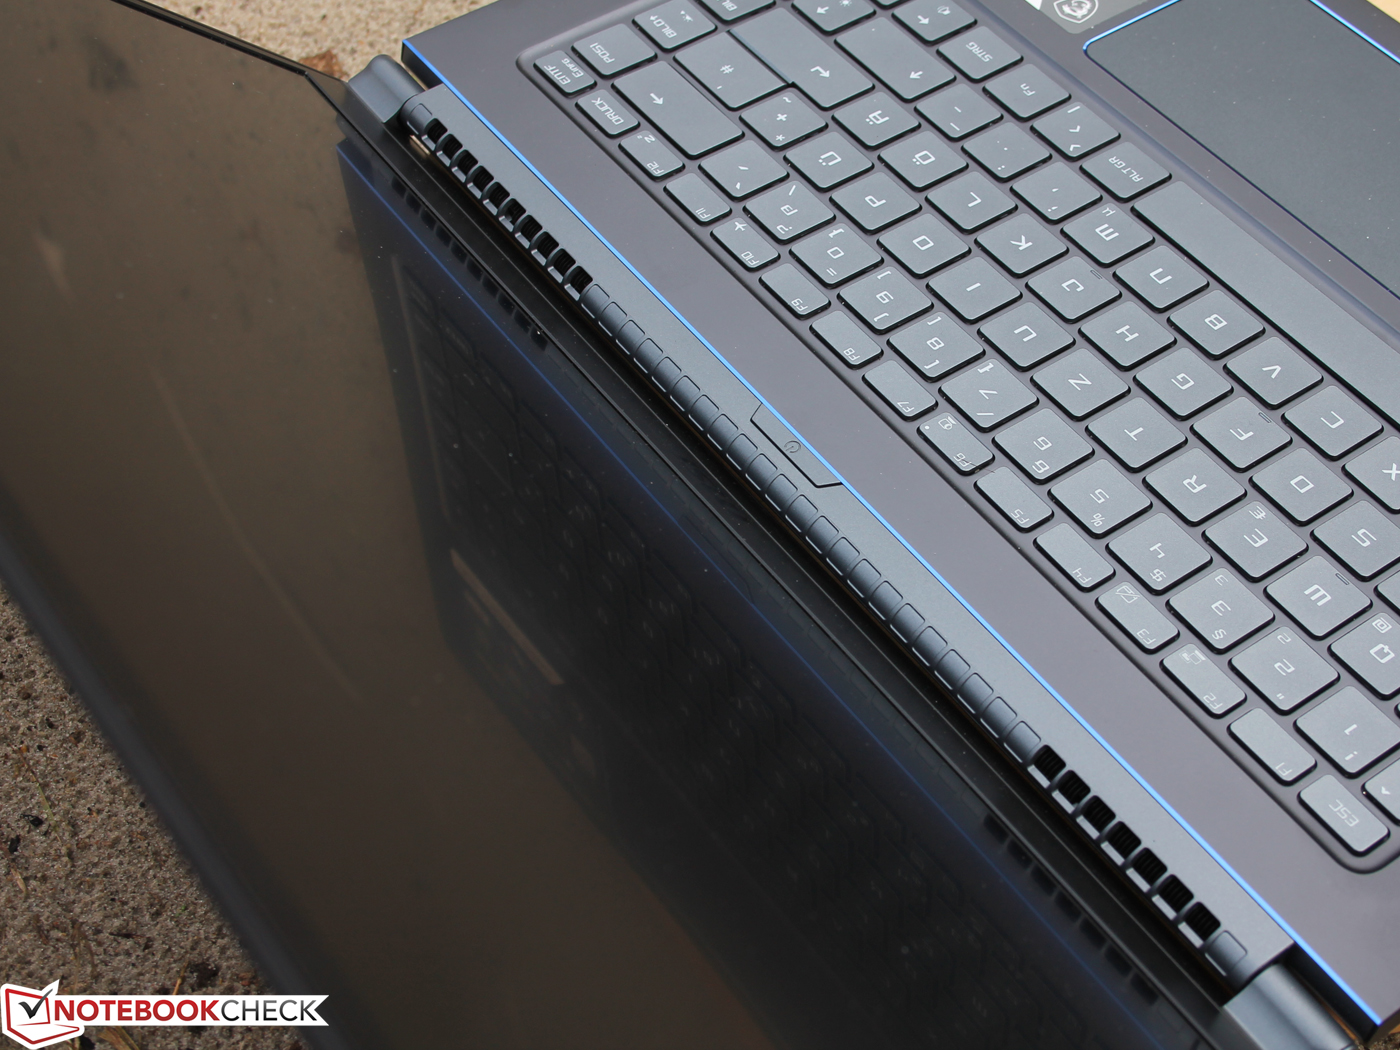
O chassi ultrafino e agradavelmente leve, com design de marcos finos e a longa duração da bateria, tornam o sistema de 15 polegadas um companheiro ideal.
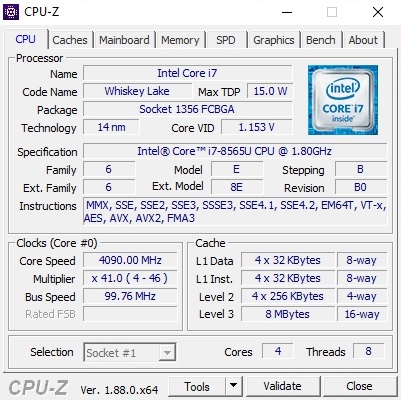
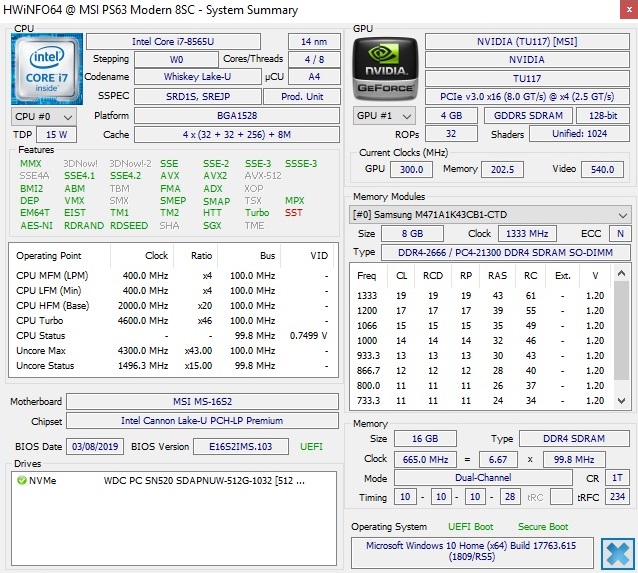
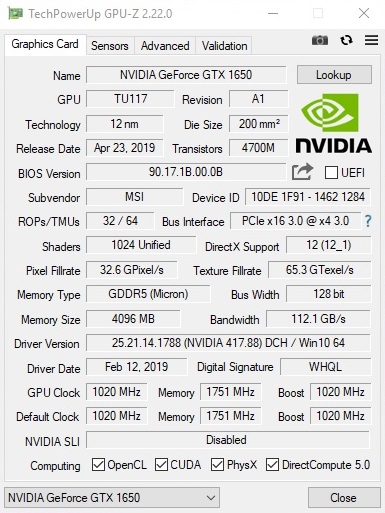
O PS63 8SC não sofre de falta de desempenho. A combinação de um Core i7-8550U, GeForce GTX 1650 Max-Q, 16 GB RAM e SSD PCIe se desempenha muito bem, no geral.
MSI PS63 Modern 8SC
- 05/14/2020 v7 (old)
Florian Glaser
Price comparison
