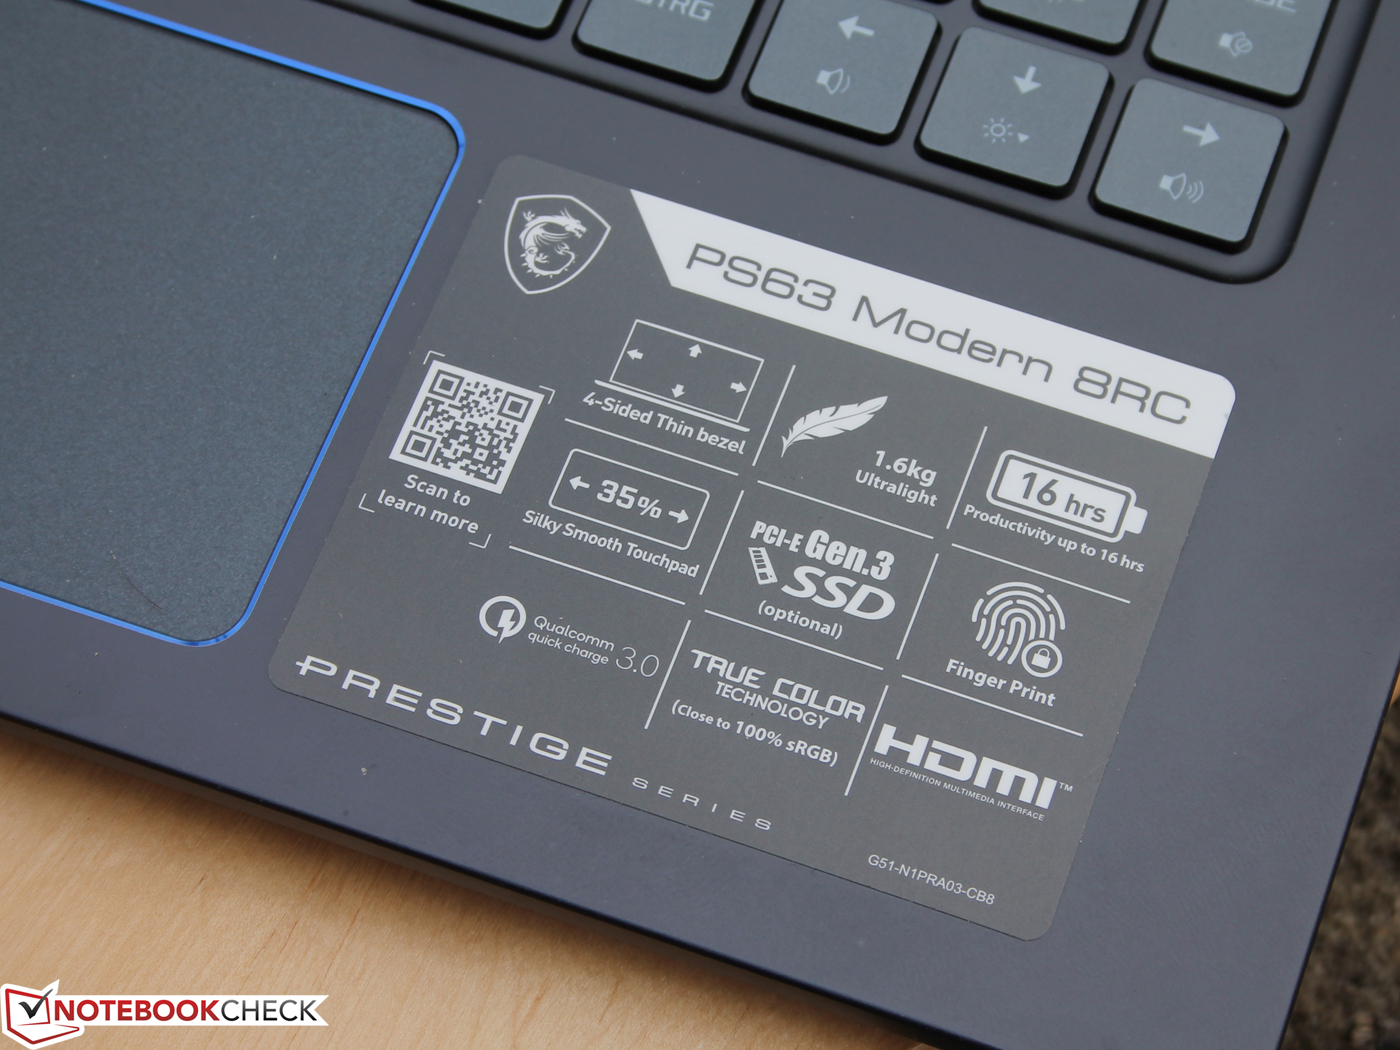
Breve Análise do Portátil MSI PS63 Modern 8RC (Core i7-8565U, GTX 1050 Max-Q)

| SD Card Reader | |
| average JPG Copy Test (av. of 3 runs) | |
| Gigabyte Aero 15X v8 (Toshiba Exceria Pro SDXC 64 GB UHS-II) | |
| Lenovo ThinkPad X1 Extreme-20MF000RGE (Toshiba Exceria Pro SDXC 64 GB UHS-II) | |
| Schenker Key 15 Coffee Lake (Toshiba Exceria Pro SDXC 64 GB UHS-II) | |
| Microsoft Surface Book 2 (Toshiba Exceria Pro SDXC 64 GB UHS-II) | |
| Média da turma Multimedia (23 - 531, n=37, últimos 2 anos) | |
| Dell XPS 15 2018 i5 FHD 97Wh | |
| Lenovo Ideapad 720S-15IKB 81AC001AGE (Toshiba Exceria Pro M501) | |
| Schenker XMG Neo 15 (Toshiba Exceria Pro SDXC 64 GB UHS-II) | |
| MSI PS63 Modern 8RC (Toshiba Exceria Pro SDXC 64 GB UHS-II) | |
| MSI Prestige PS42 8RB-059 (Toshiba Exceria Pro SDXC 64 GB UHS-II) | |
| maximum AS SSD Seq Read Test (1GB) | |
| Gigabyte Aero 15X v8 (Toshiba Exceria Pro SDXC 64 GB UHS-II) | |
| Microsoft Surface Book 2 (Toshiba Exceria Pro SDXC 64 GB UHS-II) | |
| Lenovo ThinkPad X1 Extreme-20MF000RGE (Toshiba Exceria Pro SDXC 64 GB UHS-II) | |
| Schenker Key 15 Coffee Lake (Toshiba Exceria Pro SDXC 64 GB UHS-II) | |
| Dell XPS 15 2018 i5 FHD 97Wh | |
| Média da turma Multimedia (37.3 - 1455, n=36, últimos 2 anos) | |
| Lenovo Ideapad 720S-15IKB 81AC001AGE (Toshiba Exceria Pro M501) | |
| Schenker XMG Neo 15 (Toshiba Exceria Pro SDXC 64 GB UHS-II) | |
| MSI PS63 Modern 8RC (Toshiba Exceria Pro SDXC 64 GB UHS-II) | |
| MSI Prestige PS42 8RB-059 (Toshiba Exceria Pro SDXC 64 GB UHS-II) | |
| |||||||||||||||||||||||||
iluminação: 75 %
iluminação com acumulador: 289 cd/m²
Contraste: 1112:1 (Preto: 0.26 cd/m²)
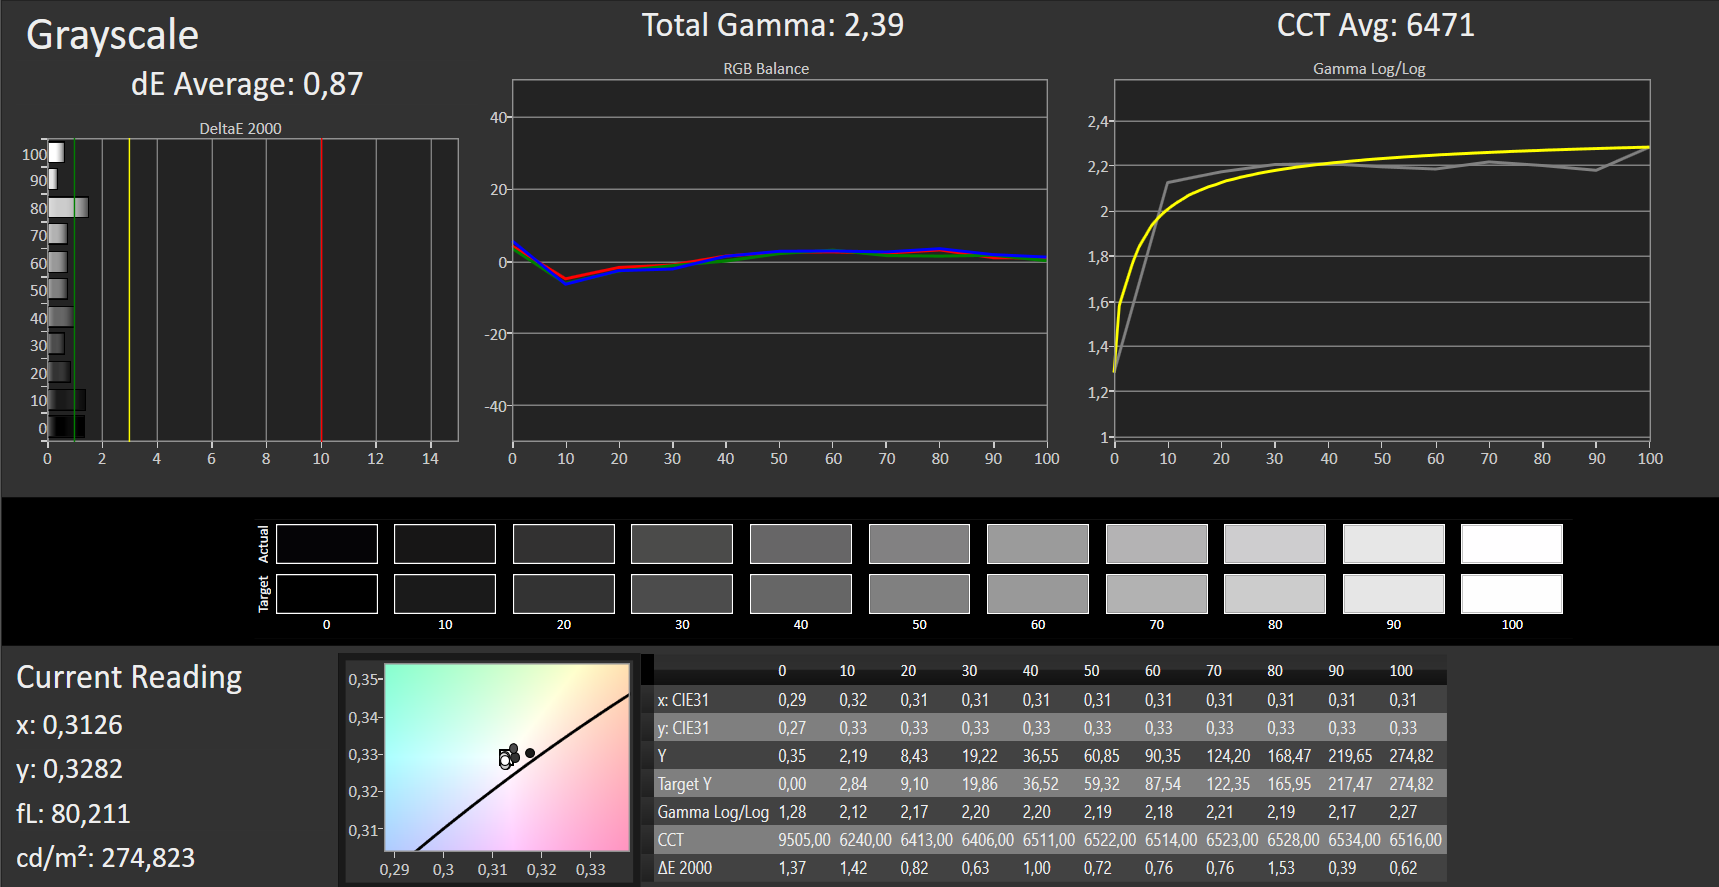
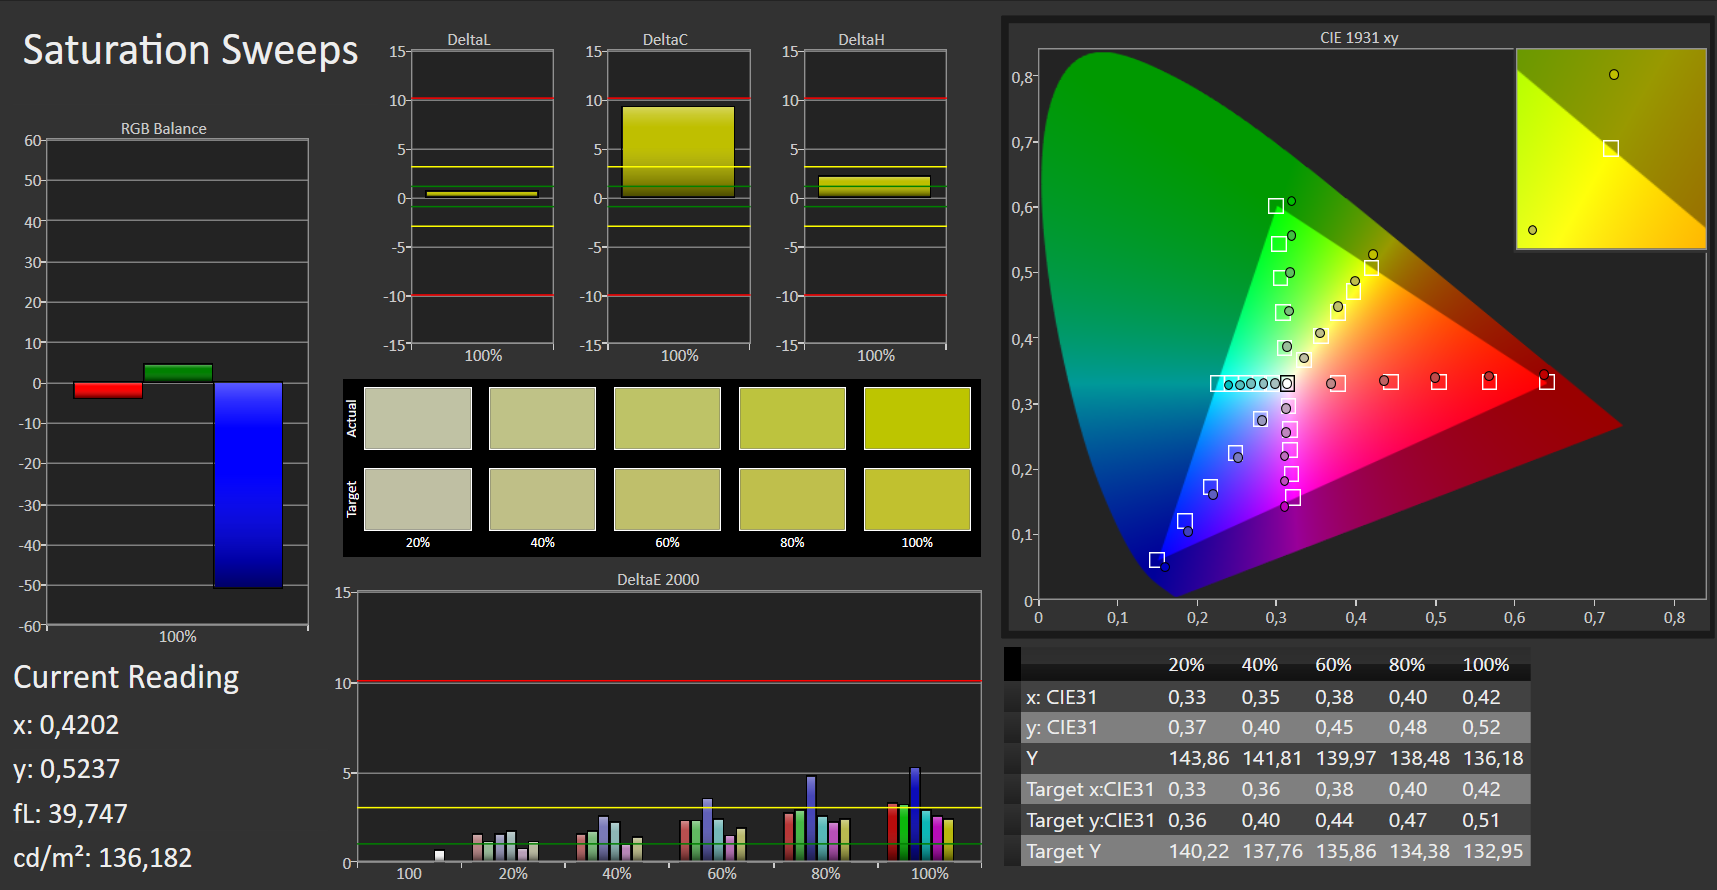
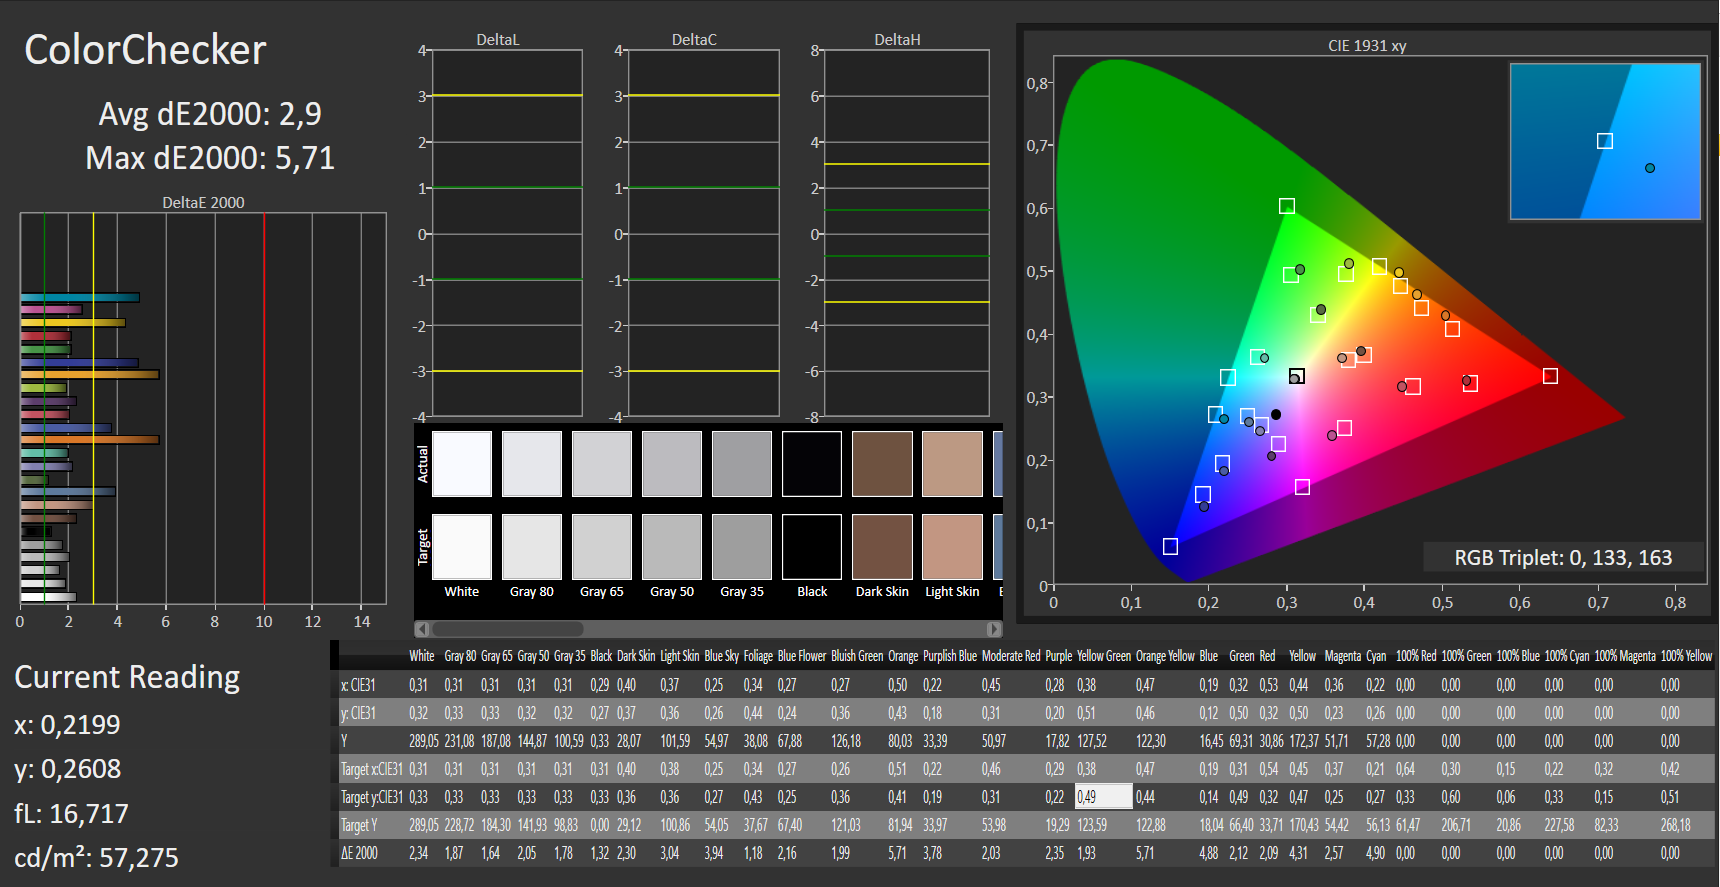
ΔE ColorChecker Calman: 2.9 | ∀{0.5-29.43 Ø4.71}
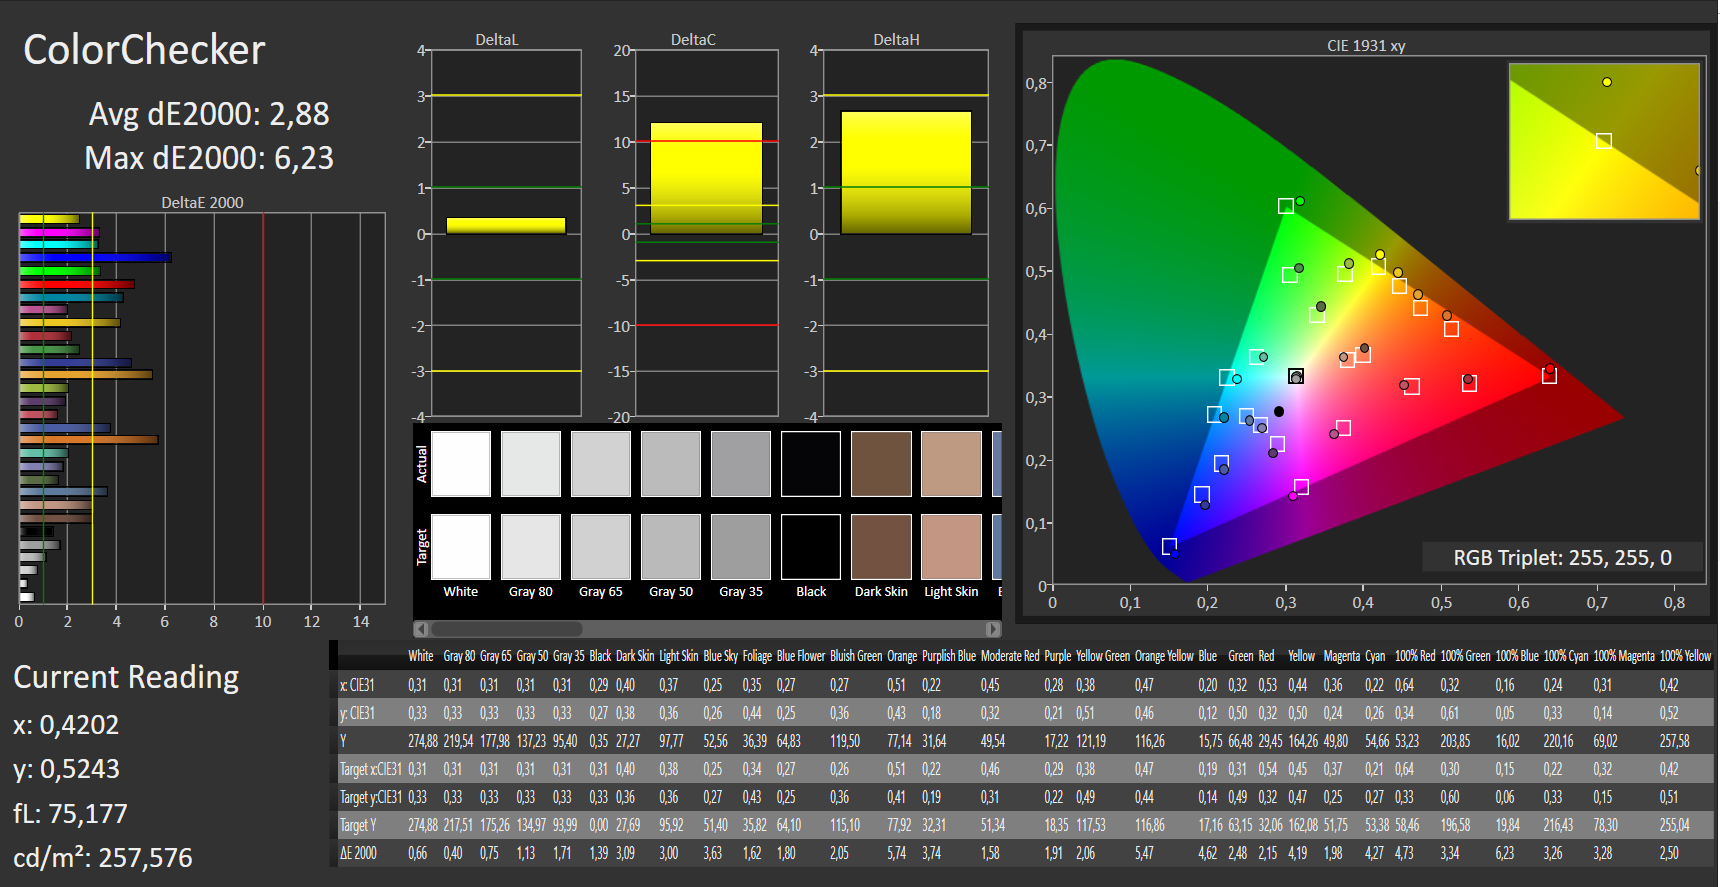
calibrated: 2.88
ΔE Greyscale Calman: 1.42 | ∀{0.09-98 Ø4.96}
87% sRGB (Argyll 1.6.3 3D)
57% AdobeRGB 1998 (Argyll 1.6.3 3D)
63.9% AdobeRGB 1998 (Argyll 3D)
87.9% sRGB (Argyll 3D)
63.5% Display P3 (Argyll 3D)
Gamma: 2.39
CCT: 6705 K
| MSI PS63 Modern 8RC Chi Mei CMN15E8 N156HCE/EN1, , 1920x1080, 15.6" | MSI Prestige PS42 8RB-059 CMN N140HCE-EN2, , 1920x1080, 14" | Schenker XMG Neo 15 LGD05C0, , 1920x1080, 15.6" | Gigabyte Aero 15X v8 LGD05C0, , 1920x1080, 15.6" | Schenker Key 15 Coffee Lake LGD05C0, , 1920x1080, 15.6" | Microsoft Surface Book 2 Panasonic MEI96A2 , , 3000x2000, 13.5" | Dell XPS 15 2018 i5 FHD 97Wh Sharp SHP149A LQ156M1, , 1920x1080, 15.6" | Lenovo ThinkPad X1 Extreme-20MF000RGE NV156FHM-N61, , 1920x1080, 15.6" | Apple MacBook Pro 15 2018 (2.6 GHz, 560X) APPA040, , 2880x1800, 15.4" | Lenovo Ideapad 720S-15IKB 81AC001AGE Chi Mei CMN15E8 / N156HCE-EN1 CMN, , 1920x1080, 15.6" | |
|---|---|---|---|---|---|---|---|---|---|---|
| Display | 9% | 3% | 3% | 2% | 8% | 6% | 3% | 35% | 1% | |
| Display P3 Coverage (%) | 63.5 | 67.5 6% | 64.3 1% | 63.6 0% | 63.4 0% | 67.9 7% | 66 4% | 68.6 8% | 98.7 55% | 63.6 0% |
| sRGB Coverage (%) | 87.9 | 98.6 12% | 94.1 7% | 93.8 7% | 93.3 6% | 95.7 9% | 96.5 10% | 88.7 1% | 99.9 14% | 89.4 2% |
| AdobeRGB 1998 Coverage (%) | 63.9 | 69.6 9% | 65.3 2% | 64.9 2% | 64.5 1% | 69.4 9% | 66.7 4% | 64.8 1% | 86.6 36% | 64.3 1% |
| Response Times | 20% | 66% | 63% | 65% | -10% | -6% | -20% | -1% | 21% | |
| Response Time Grey 50% / Grey 80% * (ms) | 42 ? | 34.4 ? 18% | 16 ? 62% | 16.8 ? 60% | 15.2 ? 64% | 52.8 ? -26% | 49 ? -17% | 52.8 ? -26% | 43.2 ? -3% | 34 ? 19% |
| Response Time Black / White * (ms) | 32 ? | 24.8 ? 22% | 9.6 ? 70% | 11.2 ? 65% | 11.2 ? 65% | 30 ? 6% | 30 ? 6% | 36 ? -13% | 31.2 ? 2% | 25 ? 22% |
| PWM Frequency (Hz) | 25000 ? | 25000 ? | 961 ? | 21370 ? | 117000 ? | 25000 ? | ||||
| Screen | 16% | 3% | 17% | -2% | 26% | 10% | -40% | 35% | -14% | |
| Brightness middle (cd/m²) | 289 | 285.4 -1% | 325 12% | 313 8% | 309 7% | 385 33% | 413 43% | 331 15% | 520 80% | 332 15% |
| Brightness (cd/m²) | 262 | 269 3% | 303 16% | 300 15% | 291 11% | 372 42% | 378 44% | 305 16% | 492 88% | 301 15% |
| Brightness Distribution (%) | 75 | 86 15% | 90 20% | 78 4% | 91 21% | 89 19% | 86 15% | 84 12% | 88 17% | 83 11% |
| Black Level * (cd/m²) | 0.26 | 0.31 -19% | 0.33 -27% | 0.33 -27% | 0.31 -19% | 0.21 19% | 0.29 -12% | 0.24 8% | 0.39 -50% | 0.29 -12% |
| Contrast (:1) | 1112 | 921 -17% | 985 -11% | 948 -15% | 997 -10% | 1833 65% | 1424 28% | 1379 24% | 1333 20% | 1145 3% |
| Colorchecker dE 2000 * | 2.9 | 1 66% | 2.69 7% | 1.29 56% | 2.96 -2% | 1.6 45% | 2.44 16% | 5.6 -93% | 1.2 59% | 3.73 -29% |
| Colorchecker dE 2000 max. * | 5.71 | 3.65 36% | 4.91 14% | 2.04 64% | 5.14 10% | 4.5 21% | 4.46 22% | 9.9 -73% | 2.3 60% | 6.6 -16% |
| Colorchecker dE 2000 calibrated * | 2.88 | 0.98 66% | 1.27 56% | 1.41 51% | 2.48 14% | 3 -4% | 2 31% | |||
| Greyscale dE 2000 * | 1.42 | 1.4 1% | 2.34 -65% | 0.69 51% | 2.88 -103% | 1.5 -6% | 2.48 -75% | 6.3 -344% | 1.3 8% | 3.96 -179% |
| Gamma | 2.39 92% | 2.25 98% | 2.38 92% | 2.43 91% | 2.33 94% | 2.22 99% | 2.43 91% | 2.33 94% | 2.18 101% | 2.4 92% |
| CCT | 6705 97% | 6699 97% | 6872 95% | 6550 99% | 6725 97% | 6502 100% | 7006 93% | 7152 91% | 6738 96% | 6921 94% |
| Color Space (Percent of AdobeRGB 1998) (%) | 57 | 63.82 12% | 60 5% | 60 5% | 60 5% | 64 12% | 62 9% | 58 2% | 58 2% | |
| Color Space (Percent of sRGB) (%) | 87 | 98.91 14% | 94 8% | 94 8% | 93 7% | 95.9 10% | 96 10% | 88.6 2% | 89 2% | |
| Média Total (Programa/Configurações) | 15% /
15% | 24% /
11% | 28% /
20% | 22% /
7% | 8% /
18% | 3% /
8% | -19% /
-29% | 23% /
30% | 3% /
-7% |
* ... menor é melhor


Exibir tempos de resposta
| ↔ Tempo de resposta preto para branco | ||
|---|---|---|
| 32 ms ... ascensão ↗ e queda ↘ combinadas | ↗ 20 ms ascensão | 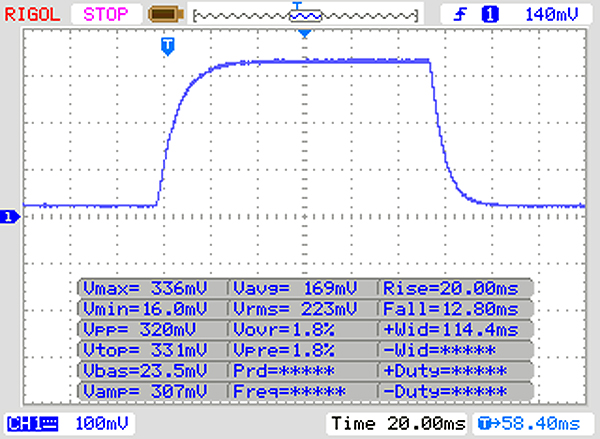 |
| ↘ 12 ms queda | ||
| A tela mostra taxas de resposta lentas em nossos testes e será insatisfatória para os jogadores. Em comparação, todos os dispositivos testados variam de 0.1 (mínimo) a 240 (máximo) ms. » 86 % de todos os dispositivos são melhores. Isso significa que o tempo de resposta medido é pior que a média de todos os dispositivos testados (19.8 ms). | ||
| ↔ Tempo de resposta 50% cinza a 80% cinza | ||
| 42 ms ... ascensão ↗ e queda ↘ combinadas | ↗ 23 ms ascensão | 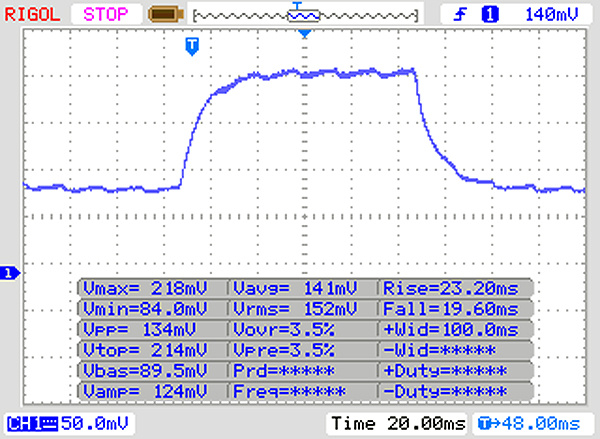 |
| ↘ 19 ms queda | ||
| A tela mostra taxas de resposta lentas em nossos testes e será insatisfatória para os jogadores. Em comparação, todos os dispositivos testados variam de 0.165 (mínimo) a 636 (máximo) ms. » 67 % de todos os dispositivos são melhores. Isso significa que o tempo de resposta medido é pior que a média de todos os dispositivos testados (31 ms). | ||
Cintilação da tela / PWM (modulação por largura de pulso)
| Tela tremeluzindo/PWM detectado | 25000 Hz | ≤ 20 % configuração de brilho | 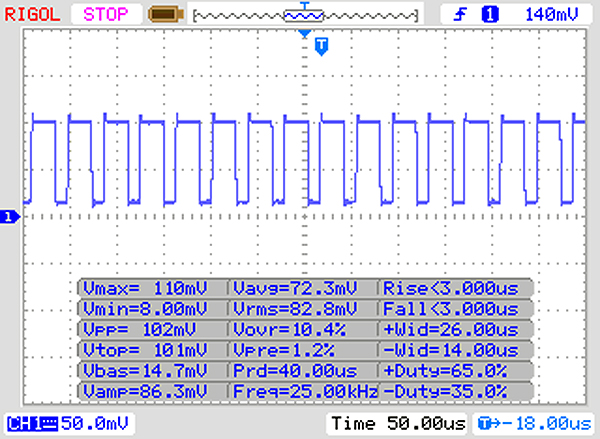 |
A luz de fundo da tela pisca em 25000 Hz (pior caso, por exemplo, utilizando PWM) Cintilação detectada em uma configuração de brilho de 20 % e abaixo. Não deve haver cintilação ou PWM acima desta configuração de brilho. A frequência de 25000 Hz é bastante alta, então a maioria dos usuários sensíveis ao PWM não deve notar nenhuma oscilação. [pwm_comparison] Em comparação: 52 % de todos os dispositivos testados não usam PWM para escurecer a tela. Se PWM foi detectado, uma média de 7754 (mínimo: 5 - máximo: 343500) Hz foi medida. | |||


| PCMark 8 Home Score Accelerated v2 | 3801 pontos | |
| PCMark 8 Creative Score Accelerated v2 | 4844 pontos | |
| PCMark 8 Work Score Accelerated v2 | 4905 pontos | |
| PCMark 10 Score | 4020 pontos | |
Ajuda | ||
| MSI PS63 Modern 8RC WDC PC SN520 SDAPNUW-512G | Gigabyte Aero 15X v8 Toshiba NVMe THNSN5512GPU7 | Schenker Key 15 Coffee Lake Samsung SSD 970 EVO 500GB | Microsoft Surface Book 2 Samsung PM961 MZVLW256HEHP | Dell XPS 15 2018 i5 FHD 97Wh Lite-On CA3-8D256-Q11 | Lenovo ThinkPad X1 Extreme-20MF000RGE Samsung SSD PM981 MZVLB256HAHQ | Apple MacBook Pro 15 2018 (2.6 GHz, 560X) Apple SSD AP0512 | Lenovo Ideapad 720S-15IKB 81AC001AGE Samsung SSD PM981 MZVLB512HAJQ | Média WDC PC SN520 SDAPNUW-512G | |
|---|---|---|---|---|---|---|---|---|---|
| CrystalDiskMark 5.2 / 6 | 7% | 29% | 4% | 4% | 20% | 3% | 46% | 15% | |
| Write 4K (MB/s) | 121.3 | 94.4 -22% | 113.5 -6% | 140.6 16% | 89.4 -26% | 109.4 -10% | 43.59 -64% 35.92 -70% | 139.3 15% | 138.5 ? 14% |
| Read 4K (MB/s) | 44.07 | 37.65 -15% | 43.49 -1% | 43.62 -1% | 44.64 1% | 41.5 -6% | 12.68 -71% 11.67 -74% | 46.78 6% | 44.2 ? 0% |
| Write Seq (MB/s) | 1176 | 1335 14% | 1466 25% | 343.3 -71% | 830 -29% | 1460 24% | 1605 36% 1522 29% | 2125 81% | 1265 ? 8% |
| Read Seq (MB/s) | 1139 | 1404 23% | 1200 5% | 1452 27% | 1774 56% | 1561 37% | 1595 40% 1528 34% | 2354 107% | 1237 ? 9% |
| Write 4K Q32T1 (MB/s) | 257.8 | 268.6 4% | 295.4 15% | 344.4 34% | 310.6 20% | 278.4 8% | 232.7 -10% 204.5 -21% | 298.4 16% | 404 ? 57% |
| Read 4K Q32T1 (MB/s) | 325.9 | 332.8 2% | 376.8 16% | 457.2 40% | 266.4 -18% | 354.9 9% | 404 24% 393.3 21% | 355.8 9% | 421 ? 29% |
| Write Seq Q32T1 (MB/s) | 1455 | 1375 -5% | 2498 72% | 344.3 -76% | 831 -43% | 1461 0% | 1770 22% 1756 21% | 2128 46% | 1491 ? 2% |
| Read Seq Q32T1 (MB/s) | 1741 | 2627 51% | 3549 104% | 2885 66% | 2962 70% | 3452 98% | 2993 72% 2805 61% | 3324 91% | 1741 ? 0% |
| Write 4K Q8T8 (MB/s) | 1415 | 715 ? | |||||||
| Read 4K Q8T8 (MB/s) | 572 | 1027 ? | |||||||
| AS SSD | -32% | 38% | -385% | 4% | -56% | 29% | -13% | ||
| Seq Read (MB/s) | 1372 | 2213 61% | 2685 96% | 1574 15% | 2612 90% | 2239 63% | 2469 80% | 1363 ? -1% | |
| Seq Write (MB/s) | 1244 | 1163 -7% | 2325 87% | 340.3 -73% | 1386 11% | 1644 32% | 1991 60% | 1227 ? -1% | |
| 4K Read (MB/s) | 43.34 | 23.36 -46% | 53.6 24% | 32.5 -25% | 53 22% | 9.46 -78% | 54.3 25% | 40.8 ? -6% | |
| 4K Write (MB/s) | 162.2 | 80.4 -50% | 131.9 -19% | 5.12 -97% | 119.4 -26% | 18.78 -88% | 99.8 -38% | 127.3 ? -22% | |
| 4K-64 Read (MB/s) | 1044 | 847 -19% | 1339 28% | 301.8 -71% | 764 -27% | 965 -8% | 1823 75% | 957 ? -8% | |
| 4K-64 Write (MB/s) | 1111 | 742 -33% | 1836 65% | 19.19 -98% | 1270 14% | 163.5 -85% | 1282 15% | 1081 ? -3% | |
| Access Time Read * (ms) | 0.058 | 0.119 -105% | 0.045 22% | 0.086 -48% | 0.062 -7% | 0.225 -288% | 0.042 28% | 0.07744 ? -34% | |
| Access Time Write * (ms) | 0.024 | 0.046 -92% | 0.029 -21% | 0.889 -3604% | 0.031 -29% | 0.039 -63% | 0.03671 ? -53% | ||
| Score Read (Points) | 1224 | 1092 -11% | 1661 36% | 492 -60% | 1078 -12% | 1199 -2% | 2125 74% | 1134 ? -7% | |
| Score Write (Points) | 1398 | 939 -33% | 2200 57% | 58 -96% | 1528 9% | 347 -75% | 1581 13% | 1331 ? -5% | |
| Score Total (Points) | 3249 | 2536 -22% | 4701 45% | 750 -77% | 3111 -4% | 2119 -35% | 4771 47% | 3046 ? -6% | |
| Copy ISO MB/s (MB/s) | 632 | 1637 | 1169 ? | ||||||
| Copy Program MB/s (MB/s) | 117.2 | 466.8 | 446 ? | ||||||
| Copy Game MB/s (MB/s) | 465.9 | 960 | 874 ? | ||||||
| Média Total (Programa/Configurações) | -13% /
-16% | 34% /
34% | 4% /
4% | -191% /
-221% | 12% /
11% | -27% /
-20% | 38% /
36% | 1% /
-1% |
* ... menor é melhor

| 3DMark 11 Performance | 7299 pontos | |
| 3DMark Cloud Gate Standard Score | 18526 pontos | |
| 3DMark Fire Strike Score | 5292 pontos | |
Ajuda | ||
| Thief - 1920x1080 Very High Preset AA:FXAA & High SS AF:8x | |
| MSI PS63 Modern 8RC | |
| Média NVIDIA GeForce GTX 1050 Max-Q (38 - 38.8, n=2) | |
| Shadow of the Tomb Raider - 1920x1080 Medium Preset | |
| Média da turma Multimedia (28 - 167, n=8, últimos 2 anos) | |
| MSI P65 8RF-451 - Creator | |
| MSI PS63 Modern 8RC | |
| Apple MacBook Pro 15 2018 (2.6 GHz, 560X) | |
| Média NVIDIA GeForce GTX 1050 Max-Q (27 - 33, n=2) | |
| Battlefield V - 1920x1080 Ultra Preset | |
| MSI PS63 Modern 8RC | |
| Média NVIDIA GeForce GTX 1050 Max-Q (n=1) | |
| Apple MacBook Pro 15 2018 (2.6 GHz, 560X) | |
| Darksiders III - 1920x1080 High | |
| MSI PS63 Modern 8RC | |
| Média NVIDIA GeForce GTX 1050 Max-Q (n=1) | |
| Apple MacBook Pro 15 2018 (2.6 GHz, 560X) | |
| baixo | média | alto | ultra | |
|---|---|---|---|---|
| BioShock Infinite (2013) | 147.7 | 62.1 | ||
| Thief (2014) | 56.5 | 57.2 | 38.8 | |
| Rise of the Tomb Raider (2016) | 41.4 | 34.6 | 28.7 | |
| Shadow of the Tomb Raider (2018) | 57 | 33 | 26 | 22 |
| FIFA 19 (2018) | 96.5 | 100.8 | ||
| Battlefield V (2018) | 46.1 | 39.7 | 36.5 | |
| Darksiders III (2018) | 33.6 | 37.2 | 31.5 |
Barulho
| Ocioso |
| 30.7 / 30.7 / 30.7 dB |
| Carga |
| 34 / 33.7 dB |
 | ||
30 dB silencioso 40 dB(A) audível 50 dB(A) ruidosamente alto |
||
min: | ||
(-) A temperatura máxima no lado superior é 58.6 °C / 137 F, em comparação com a média de 36.8 °C / 98 F , variando de 21 a 71 °C para a classe Multimedia.
(-) A parte inferior aquece até um máximo de 60 °C / 140 F, em comparação com a média de 39.1 °C / 102 F
(+) Em uso inativo, a temperatura média para o lado superior é 24.3 °C / 76 F, em comparação com a média do dispositivo de 31.3 °C / ### class_avg_f### F.
(+) Os apoios para as mãos e o touchpad estão atingindo a temperatura máxima da pele (33 °C / 91.4 F) e, portanto, não estão quentes.
(-) A temperatura média da área do apoio para as mãos de dispositivos semelhantes foi 28.7 °C / 83.7 F (-4.3 °C / -7.7 F).
MSI PS63 Modern 8RC análise de áudio
(±) | o volume do alto-falante é médio, mas bom (###valor### dB)
Graves 100 - 315Hz
(-) | quase nenhum baixo - em média 24.4% menor que a mediana
(±) | a linearidade dos graves é média (10.3% delta para a frequência anterior)
Médios 400 - 2.000 Hz
(±) | médios mais altos - em média 6% maior que a mediana
(±) | a linearidade dos médios é média (10.9% delta para frequência anterior)
Altos 2 - 16 kHz
(+) | agudos equilibrados - apenas 3.2% longe da mediana
(±) | a linearidade dos máximos é média (7.8% delta para frequência anterior)
Geral 100 - 16.000 Hz
(±) | a linearidade do som geral é média (26.5% diferença em relação à mediana)
Comparado com a mesma classe
» 92% de todos os dispositivos testados nesta classe foram melhores, 1% semelhantes, 6% piores
» O melhor teve um delta de 5%, a média foi 17%, o pior foi 45%
Comparado com todos os dispositivos testados
» 81% de todos os dispositivos testados foram melhores, 4% semelhantes, 15% piores
» O melhor teve um delta de 4%, a média foi 23%, o pior foi 134%
Dell XPS 15 2018 i5 FHD 97Wh análise de áudio
(±) | o volume do alto-falante é médio, mas bom (###valor### dB)
Graves 100 - 315Hz
(±) | graves reduzidos - em média 10.9% menor que a mediana
(+) | o baixo é linear (4.9% delta para a frequência anterior)
Médios 400 - 2.000 Hz
(±) | médios mais altos - em média 6.8% maior que a mediana
(+) | médios são lineares (6.8% delta para frequência anterior)
Altos 2 - 16 kHz
(+) | agudos equilibrados - apenas 3.7% longe da mediana
(+) | os máximos são lineares (6.9% delta da frequência anterior)
Geral 100 - 16.000 Hz
(±) | a linearidade do som geral é média (16.6% diferença em relação à mediana)
Comparado com a mesma classe
» 44% de todos os dispositivos testados nesta classe foram melhores, 7% semelhantes, 50% piores
» O melhor teve um delta de 5%, a média foi 17%, o pior foi 45%
Comparado com todos os dispositivos testados
» 29% de todos os dispositivos testados foram melhores, 6% semelhantes, 65% piores
» O melhor teve um delta de 4%, a média foi 23%, o pior foi 134%
Microsoft Surface Book 2 análise de áudio
(±) | o volume do alto-falante é médio, mas bom (###valor### dB)
Graves 100 - 315Hz
(±) | graves reduzidos - em média 12.4% menor que a mediana
(±) | a linearidade dos graves é média (12.3% delta para a frequência anterior)
Médios 400 - 2.000 Hz
(+) | médios equilibrados - apenas 1.9% longe da mediana
(+) | médios são lineares (3.6% delta para frequência anterior)
Altos 2 - 16 kHz
(+) | agudos equilibrados - apenas 4.8% longe da mediana
(±) | a linearidade dos máximos é média (9.3% delta para frequência anterior)
Geral 100 - 16.000 Hz
(±) | a linearidade do som geral é média (18.2% diferença em relação à mediana)
Comparado com a mesma classe
» 40% de todos os dispositivos testados nesta classe foram melhores, 7% semelhantes, 53% piores
» O melhor teve um delta de 6%, a média foi 20%, o pior foi 57%
Comparado com todos os dispositivos testados
» 39% de todos os dispositivos testados foram melhores, 8% semelhantes, 53% piores
» O melhor teve um delta de 4%, a média foi 23%, o pior foi 134%
| desligado | |
| Ocioso | |
| Carga |
|
Key:
min: | |
| MSI PS63 Modern 8RC i7-8565U, GeForce GTX 1050 Max-Q, WDC PC SN520 SDAPNUW-512G, IPS, 1920x1080, 15.6" | Schenker XMG Neo 15 i7-8750H, GeForce GTX 1060 Mobile, Samsung SSD 970 Pro 1TB, IPS, 1920x1080, 15.6" | Gigabyte Aero 15X v8 i7-8750H, GeForce GTX 1070 Max-Q, Toshiba NVMe THNSN5512GPU7, IPS, 1920x1080, 15.6" | Schenker Key 15 Coffee Lake i7-8750H, GeForce GTX 1070 Max-Q, Samsung SSD 970 EVO 500GB, IPS, 1920x1080, 15.6" | Microsoft Surface Book 2 i7-8650U, GeForce GTX 1050 Mobile, Samsung PM961 MZVLW256HEHP, IPS, 3000x2000, 13.5" | Dell XPS 15 2018 i5 FHD 97Wh i5-8300H, GeForce GTX 1050 Mobile, Lite-On CA3-8D256-Q11, LED IGZO IPS InfinityEdge, 1920x1080, 15.6" | Lenovo ThinkPad X1 Extreme-20MF000RGE i5-8300H, GeForce GTX 1050 Ti Max-Q, Samsung SSD PM981 MZVLB256HAHQ, IPS LED, 1920x1080, 15.6" | Média NVIDIA GeForce GTX 1050 Max-Q | Média da turma Multimedia | |
|---|---|---|---|---|---|---|---|---|---|
| Power Consumption | -51% | -78% | -75% | 0% | 23% | 7% | 4% | -1% | |
| Idle Minimum * (Watt) | 6.8 | 10 -47% | 14 -106% | 14 -106% | 4.7 31% | 2.9 57% | 4.14 39% | 4.48 ? 34% | 5.66 ? 17% |
| Idle Average * (Watt) | 9.8 | 13 -33% | 18 -84% | 17 -73% | 10.6 -8% | 5.8 41% | 7.3 26% | 9.58 ? 2% | 10.2 ? -4% |
| Idle Maximum * (Watt) | 11.4 | 18 -58% | 22 -93% | 22 -93% | 12.3 -8% | 7.5 34% | 11.5 -1% | 11.6 ? -2% | 12.5 ? -10% |
| Load Average * (Watt) | 76 | 95 -25% | 91 -20% | 102 -34% | 81 -7% | 77.5 -2% | 78.8 -4% | 77.3 ? -2% | 65.2 ? 14% |
| Load Maximum * (Watt) | 93 | 179 -92% | 173 -86% | 157 -69% | 100.3 -8% | 107 -15% | 118 -27% | 105.5 ? -13% | 113.5 ? -22% |
| Witcher 3 ultra * (Watt) | 114 | 142 | 130 | 97 | 84 | 82 |
* ... menor é melhor
| MSI PS63 Modern 8RC i7-8565U, GeForce GTX 1050 Max-Q, 82 Wh | MSI P65 8RF-451 - Creator i7-8750H, GeForce GTX 1070 Max-Q, 82 Wh | MSI GS65 Stealth Thin 8RE-051US i7-8750H, GeForce GTX 1060 Mobile, 82 Wh | Schenker Key 15 Coffee Lake i7-8750H, GeForce GTX 1070 Max-Q, 55 Wh | Microsoft Surface Book 2 i7-8650U, GeForce GTX 1050 Mobile, 75 Wh | MSI Prestige PS42 8RB-059 i5-8550U, GeForce MX150, 50 Wh | Schenker XMG Neo 15 i7-8750H, GeForce GTX 1060 Mobile, 46.7 Wh | Gigabyte Aero 15X v8 i7-8750H, GeForce GTX 1070 Max-Q, 94.24 Wh | Lenovo Ideapad 720S-15IKB 81AC001AGE i7-7700HQ, GeForce GTX 1050 Ti Max-Q, 79 Wh | Dell XPS 15 2018 i5 FHD 97Wh i5-8300H, GeForce GTX 1050 Mobile, 97 Wh | Apple MacBook Pro 15 2018 (2.6 GHz, 560X) i7-8850H, Radeon Pro 560X, 83 Wh | Lenovo ThinkPad X1 Extreme-20MF000RGE i5-8300H, GeForce GTX 1050 Ti Max-Q, 80 Wh | Média da turma Multimedia | |
|---|---|---|---|---|---|---|---|---|---|---|---|---|---|
| Duração da bateria | -45% | -52% | -59% | 29% | 7% | -48% | -14% | 3% | 3% | -11% | -1% | 15% | |
| Reader / Idle (h) | 14 | 7.5 -46% | 5 -64% | 24.5 75% | 16.8 20% | 6.7 -52% | 12.7 -9% | 22.6 61% | 21 50% | 24.9 ? 78% | |||
| WiFi v1.3 (h) | 11.4 | 7.1 -38% | 6.2 -46% | 3.7 -68% | 11.1 -3% | 14.9 31% | 4.4 -61% | 8.6 -25% | 9.8 -14% | 15.7 38% | 10.2 -11% | 9.4 -18% | 12.2 ? 7% |
| Load (h) | 2.8 | 1.4 -50% | 1.2 -57% | 1.5 -46% | 3.2 14% | 2 -29% | 1.9 -32% | 2.6 -7% | 1.7 -39% | 1.9 -32% | 1.8 -36% | 1.664 ? -41% | |
| H.264 (h) | 5.9 | 15.6 | 4.8 | 8.4 | 11.1 | 11.7 | 9.6 | 17.1 ? | |||||
| Witcher 3 ultra (h) | 3.8 | 1 | 1.5 |
Pro
Contra
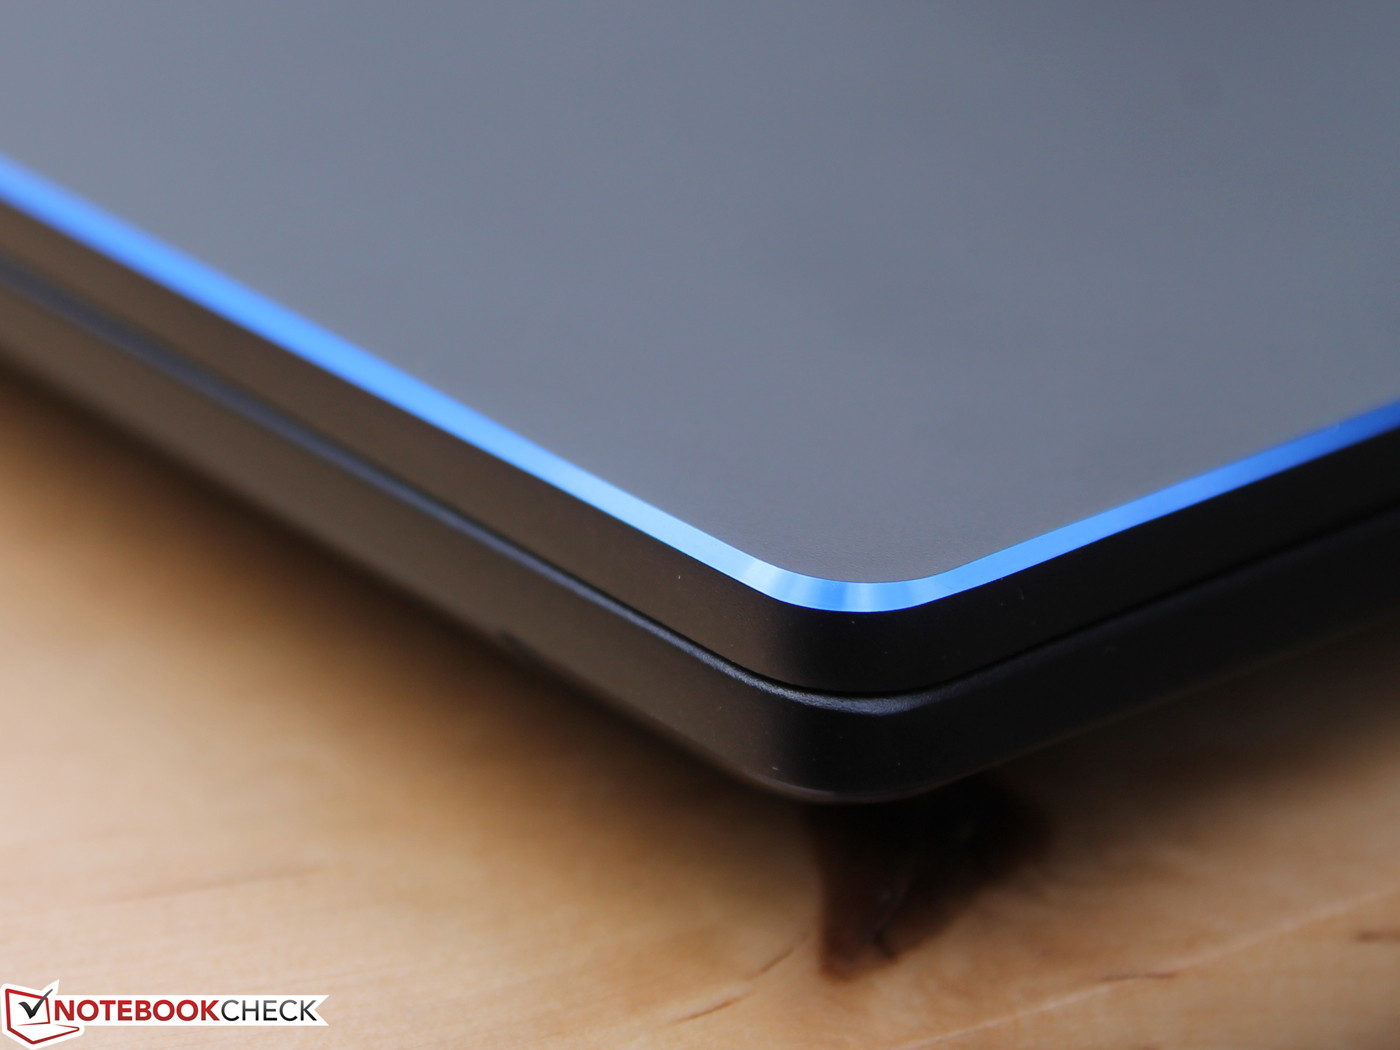
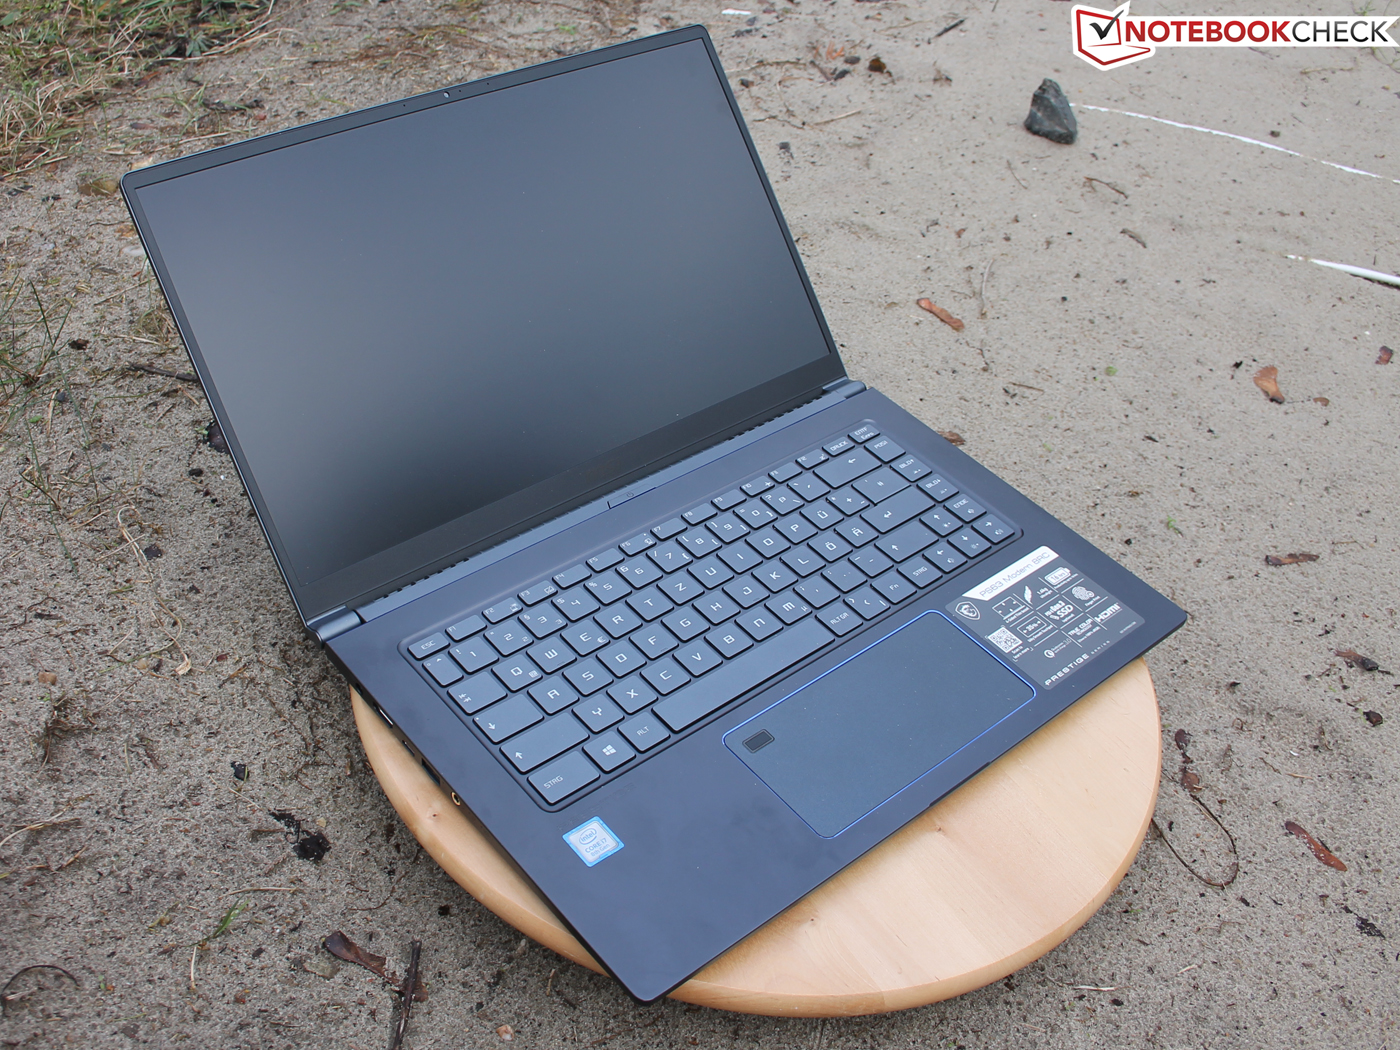
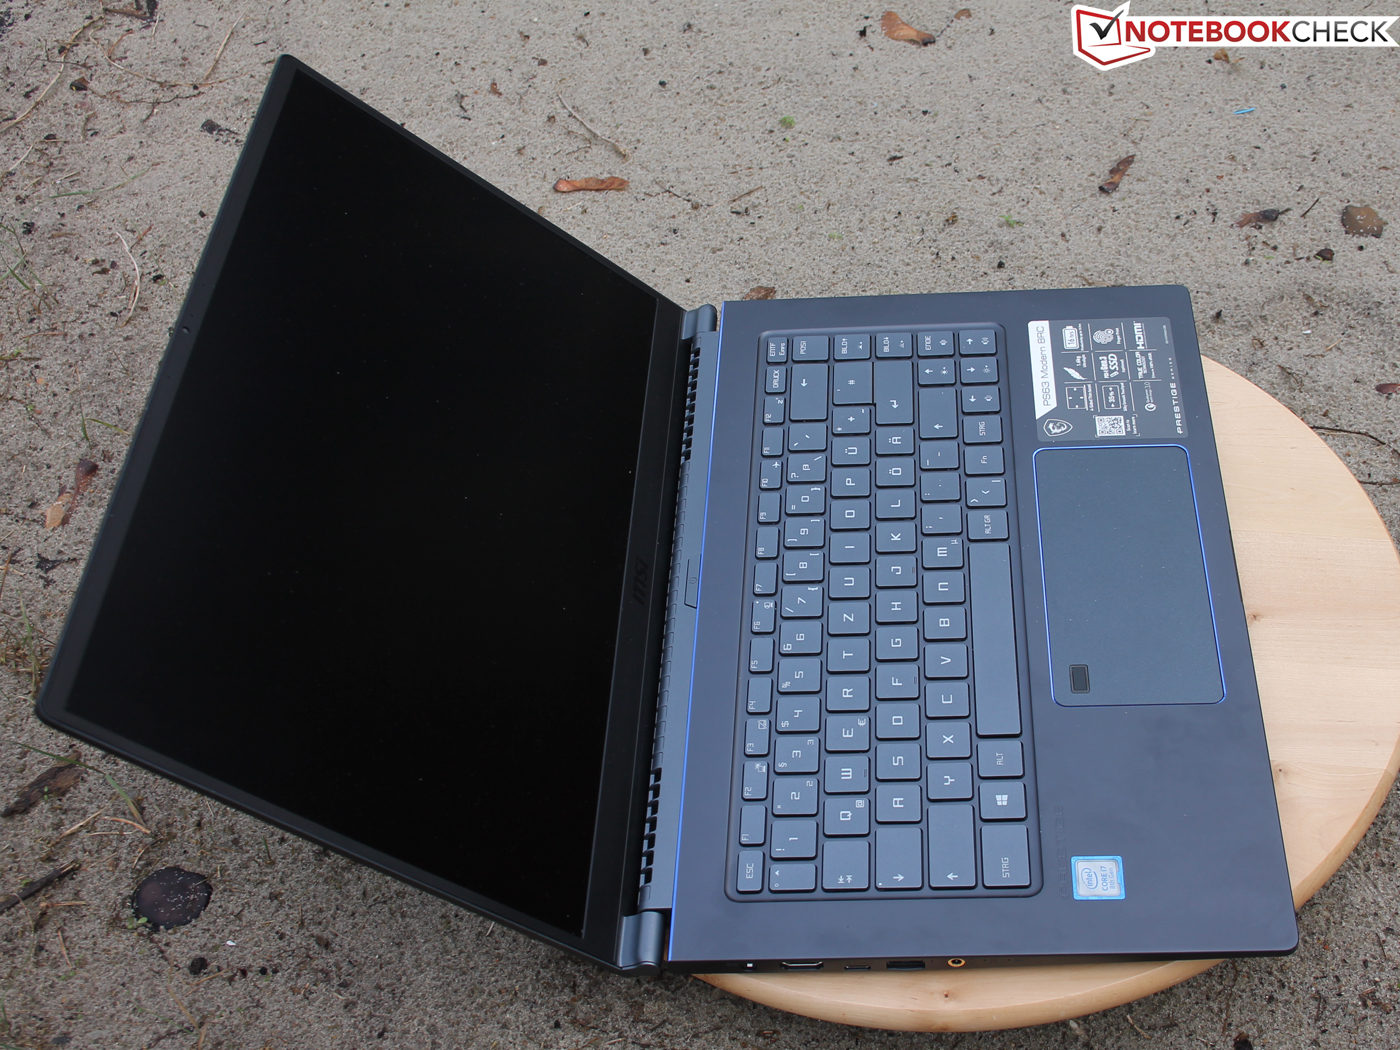
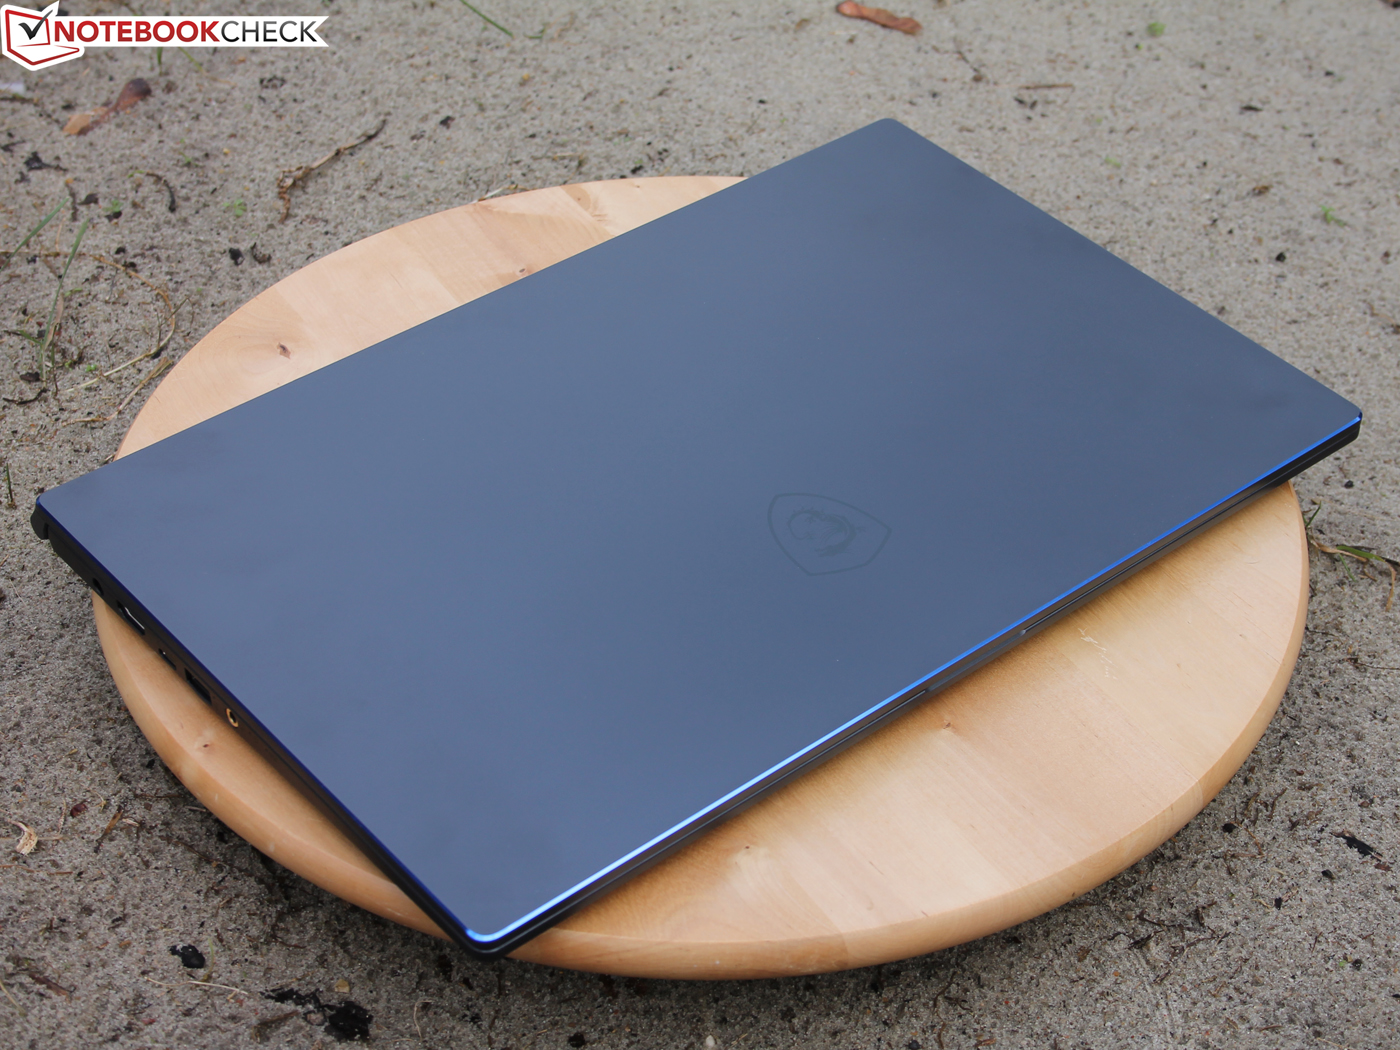
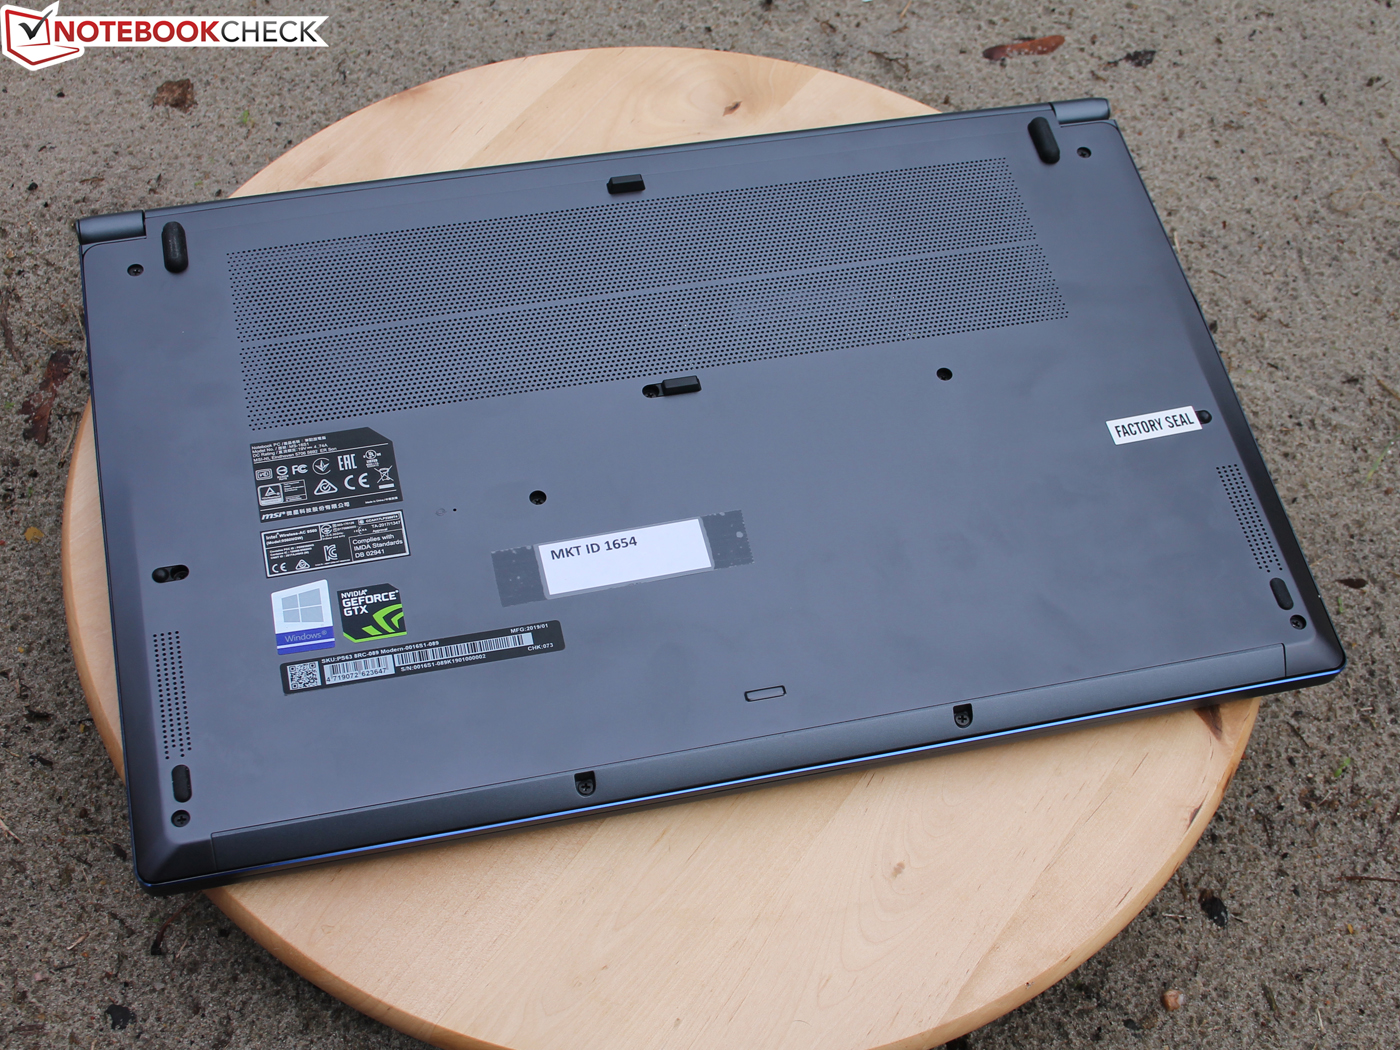
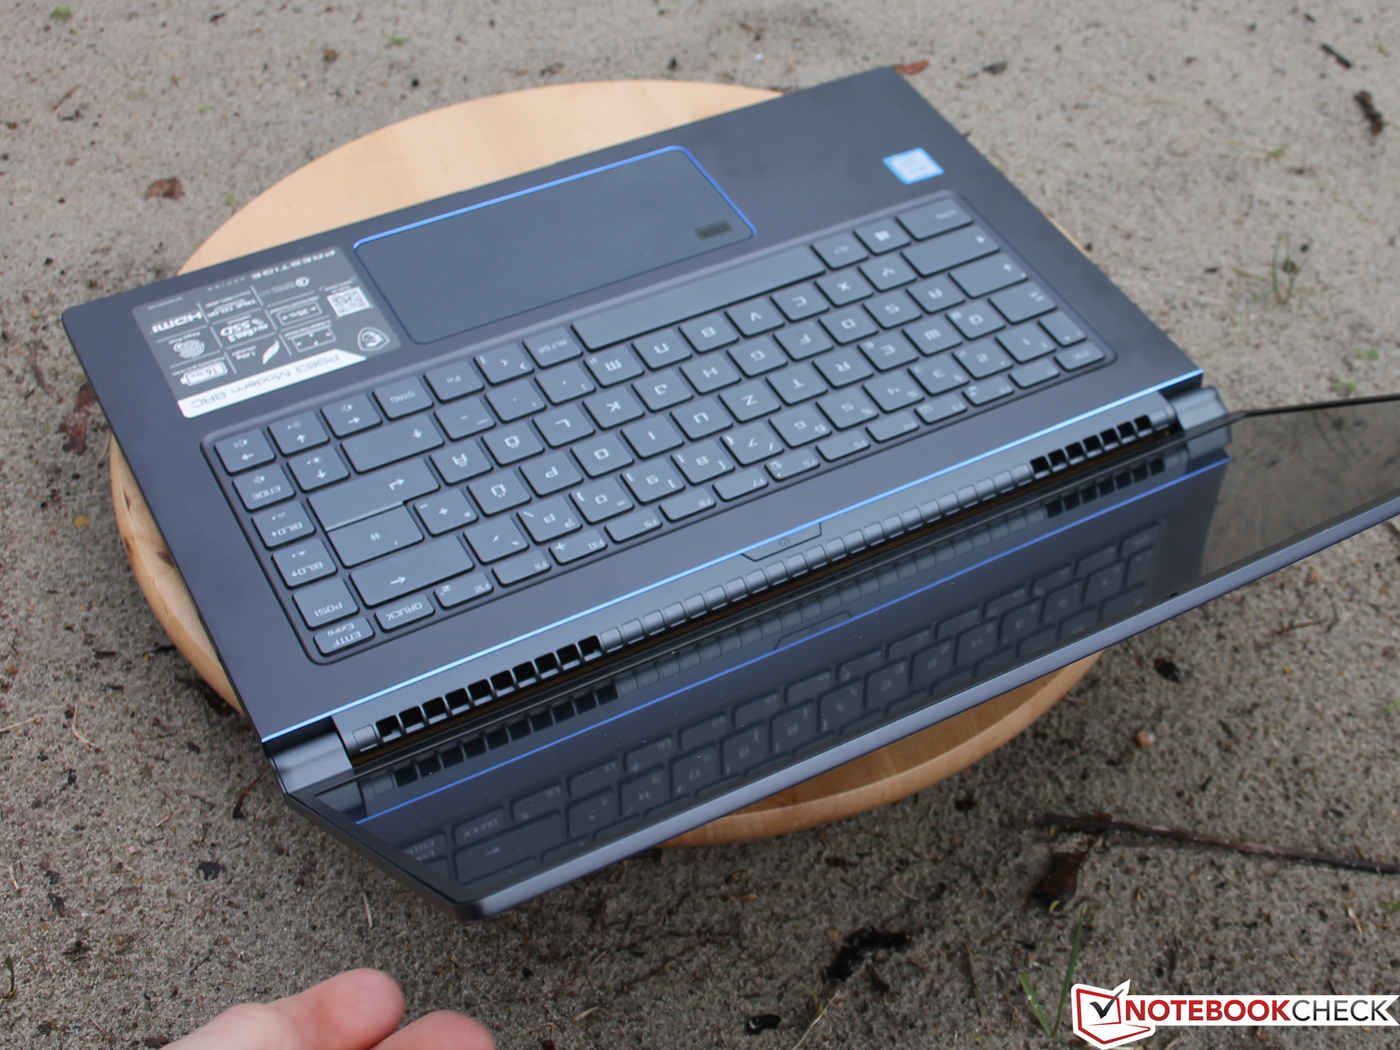
O MSI PS63 Modern 8RC é um portátil multimídia de gama média impressionante. Não ganhará prêmio algum por sua combinação de CPU, GPU e SSD, mas o dispositivo mostra seus pontos fortes em outras áreas. O PS63 é leve, compacto e fácil de consertar ou de fazer manutenção. Além disso, o dispositivo é elegante, bem construído e resistente graças ao seu design, em grande parte, de alumínio.
O MSI PS63 Modern 8RC é uma ótima opção se você estiver procurando por um portátil multimídia, mas não precisa do poder de uma CPU de 45 W. Ele oferece desempenho sólido e funciona silenciosamente, enquanto seus 80 Wh podem durar facilmente um dia inteiro de trabalho.
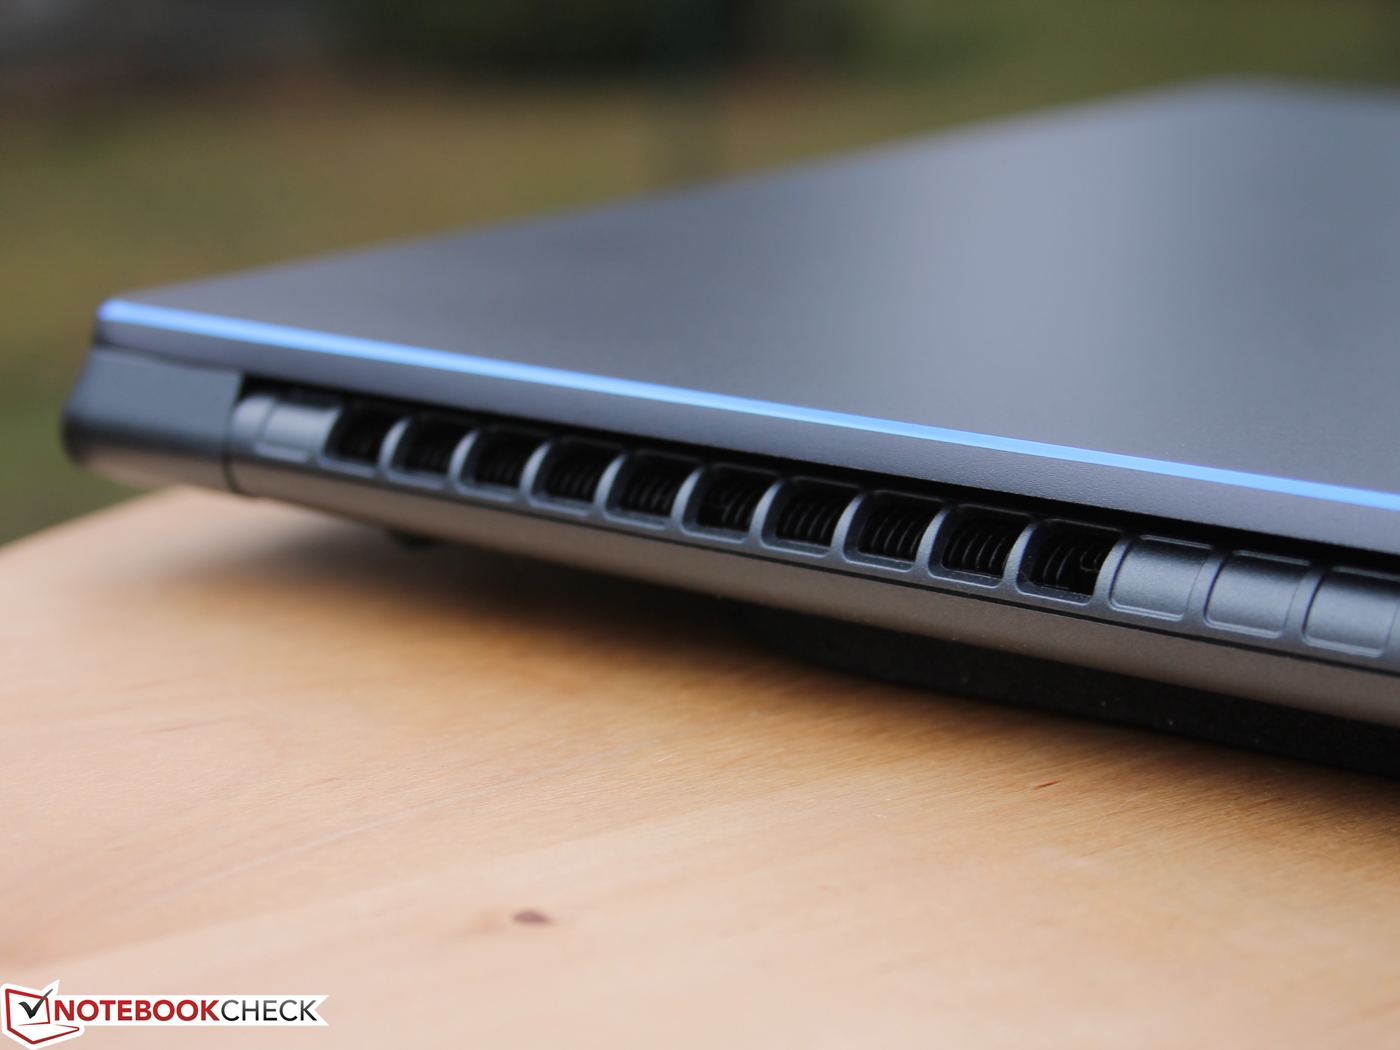
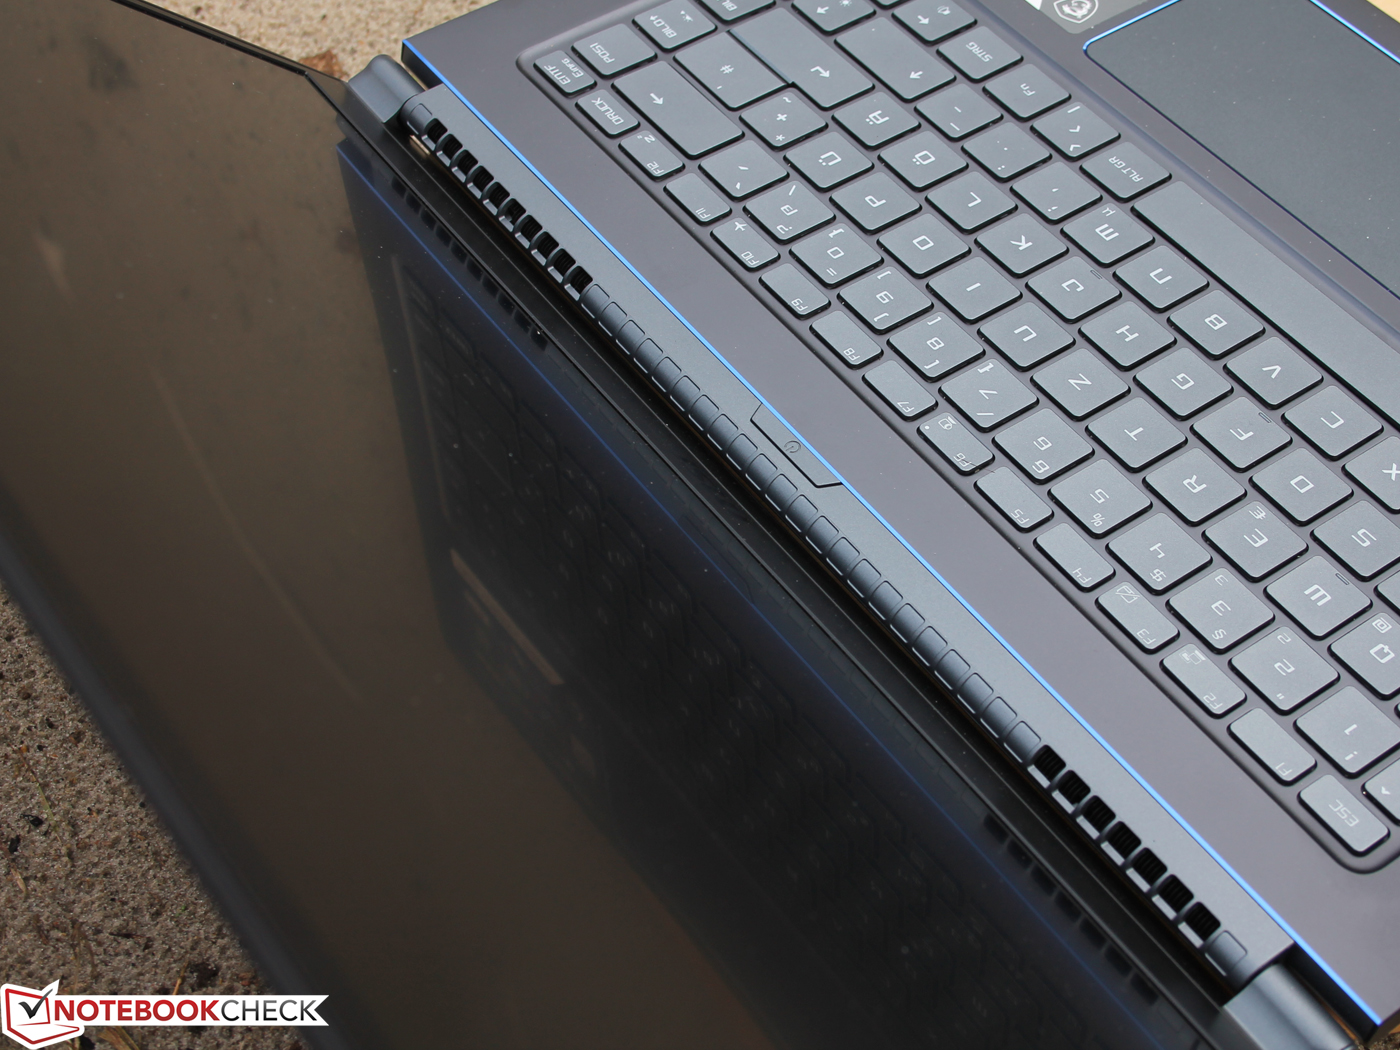
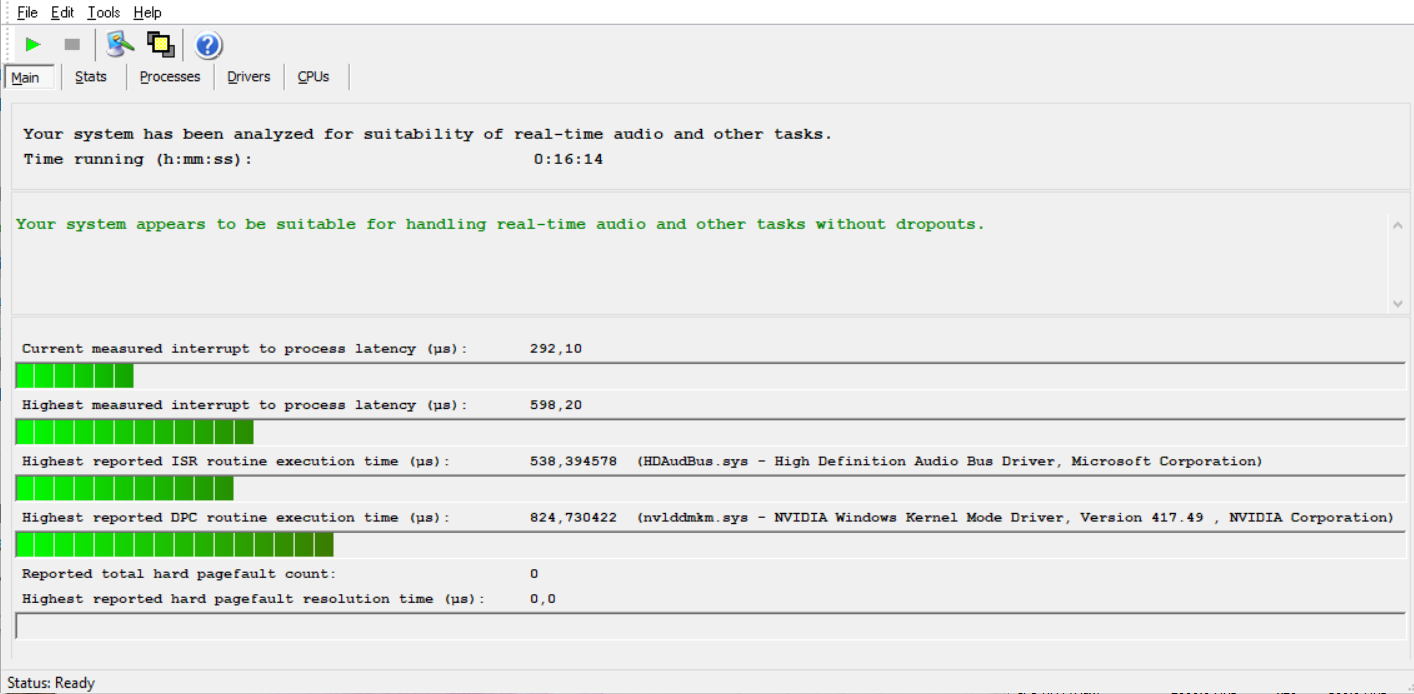
O dispositivo também geralmente funciona friamente, mas fica mais quente do que a maioria dos portáteis similares ao operar sob carga sustentada, o que pode ser uma preocupação para algumas pessoas. O único problema que temos com os ventiladores silenciosos do PS63 é que o dispositivo não aproveita o máximo do seu Core i7-8565U, que se afoga drasticamente quando chega a 75 °C, o que poderia impactar os tempos de renderização, por exemplo. No entanto, a GeForce GTX 1050 Max-Q não é afetada.
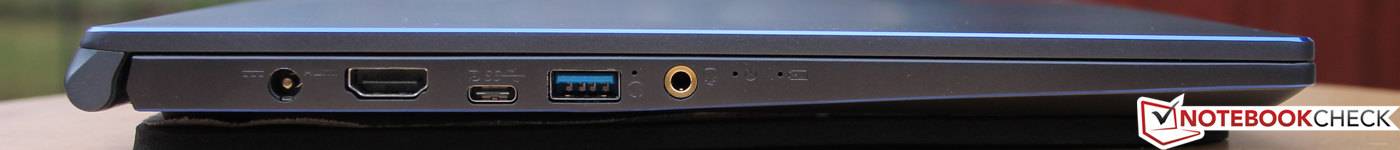
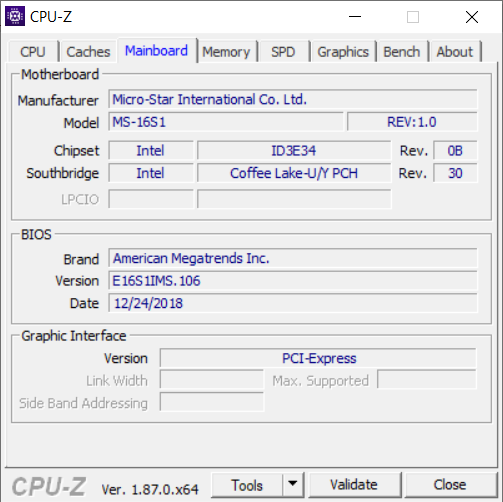
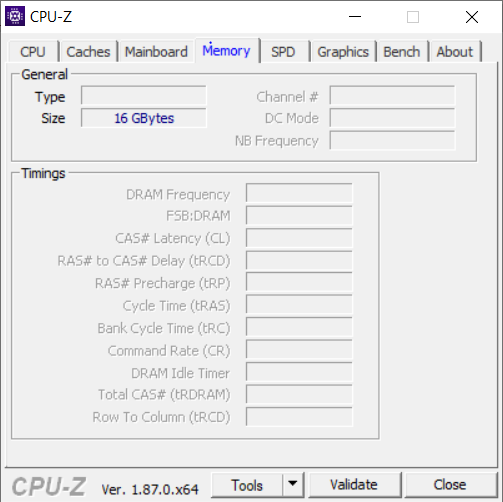
A MSI também colocou dois slots M.2, que nem todos os portáteis multimídia têm, e o fabricante deixou um slot livre de RAM, facilitando a atualização para 32 GB de RAM, se necessário. É uma pena que a MSI não tenha incluído uma porta Thunderbolt 3, mas o USB 3.1 Gen2 Type-C com saída DisplayPort é uma adição bem-vinda.
O PS63 Modern custa cerca de 1.700 Euros (~$1.938), o que não é exatamente pouco para uma carteira, especialmente porque você pode comprar um portátil mais potente como o Aero 15X V8 ou o XPS 15 9570 pelo mesmo preço. Porém, você vai sacrificar um pouco de mobilidade com qualquer um desses portáteis.
Se a mobilidade for um fator secundário, o Core i7-8850H ou o Core i5-8300H quad-core serão melhores opções do que o Core i7-8565U. A Dell vende configurações para qualquer CPU com seu XPS 15 9570, enquanto a MSI tem o P65 Creator ou o GS65 Stealth Thin. Decidir entre uma CPU de 15 W e 45 W, no final, é questão de preferência e se você precisa da potência adicional que um processador da série H traz. Vamos usar os requisitos do sistema VEGAS Pro 16 como um exemplo prático:
MSI PS63 Modern 8RC
- 10/25/2019 v7 (old)
Sebastian Jentsch
Price comparison
