Notebookcheck Logo

Zotac Gaming GeForce RTX 3070 Twin Edge Review: RTX 2080 Ti desempenho para todos

Rápido e quase tão furioso. A NVIDIA RTX 3070 oferece RTX 2080 Ti-levels de desempenho com menos da metade do MSRP deste último. A Zotac Gaming GeForce RTX 3070 Twin Edge traz toda a bondade da GPU Ampere GA104 em um formato compacto de 2 slots. Nesta revisão, avaliamos o desempenho do Zotac RTX 3070 Twin Edge e vemos se ele realmente está à altura do pedido.
Zotac Gaming GeForce RTX 3070 Twin Edge. (Fonte da imagem: Zotac)

Durante o lançamento do Ampere da NVIDIA no final do ano passado, muito se falou sobre como o GeForce RTX 3080 permite jogos mainstream 4K enquanto o RTX 3090 parece suplantar o Titan RTX. No meio de toda esta excitação, um dos cartões que se destacou foi o GeForce RTX 3070

O RTX 3070 vem com a promessa de oferecer níveis de desempenho RTX 2080 Ti por menos da metade do preço. O RTX 3070 não possui memória GDDR6X e tem menos VRAM e largura de banda de memória do que o RTX 2080 TI. Entretanto, a combinação de núcleos CUDA aumentados, núcleos Tensor de terceira geração, núcleos RT de segunda geração e relógios mais altos ajuda a colocar o RTX 3070 a par com a GPU Turing.

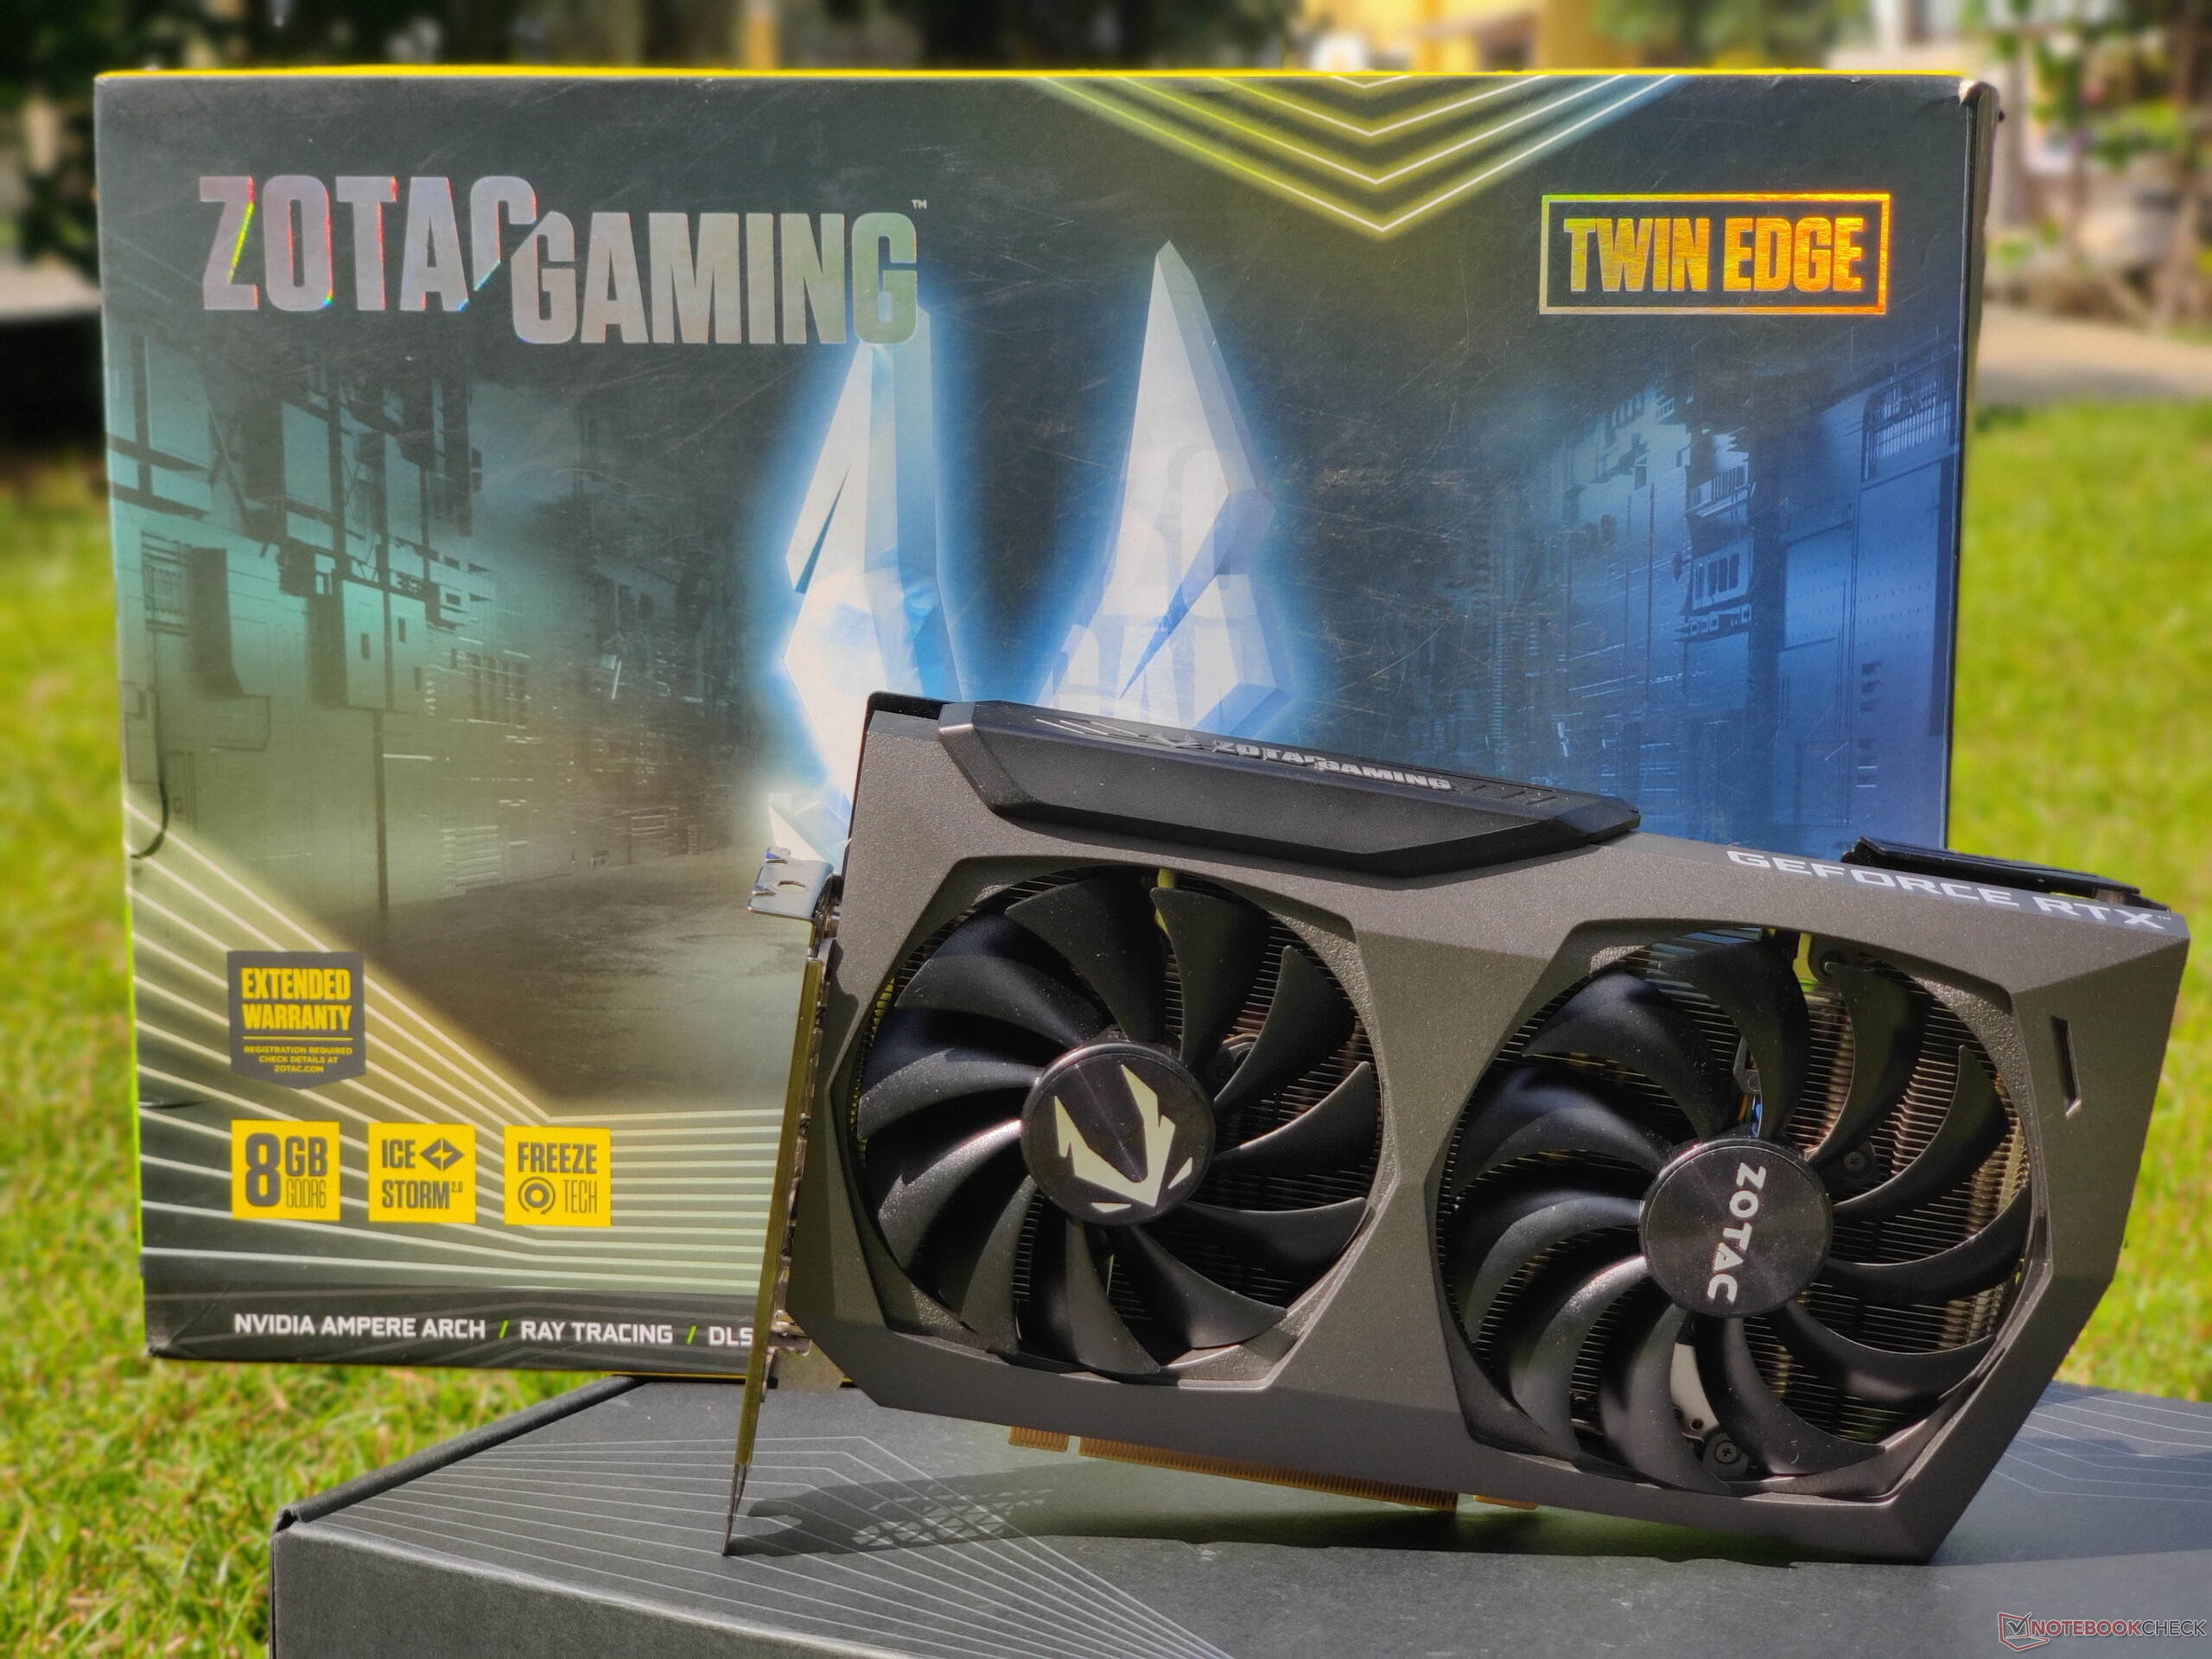
A Zotac Gaming GeForce RTX 3070 Twin Edge, como o nome indica, é uma carta com ventilador duplo que está disponível nas versões OC e não-OC. Temos a Twin Edge não-OC conosco para revisão. Esta carta é relógio um pouco menor do que a Edição Founders, enquanto oferece o mesmo envelope de 220 W de potência

A versão OC, por outro lado, tem um relógio apenas cerca de 5 MHz mais alto. Aqueles que preferem aumentos maiores fora da caixa podem optar pelas cartas Zotac RTX 3070 AMP Holo (240 W) e Super Mini (215 W) ou dar uma olhada no MSI GeForce RTX 3070 Gaming X Trio

Comparação do RTX 3070 com outras GPUs NVIDIA

Especificação RTX3090 RTX3080 FE ZotacRTX 3070 Twin Edge RTX3070 FE TitanRTX RTX2080 Ti RTX2080 RTX2070 S TITANX Pascal
Chip GA102 GA102 GA104 GA104 TU102 TU102 TU104 TU104 GP102
Processo FinFET 8 nm 8 nm 8 nm 8nm 8 nm 12 nm 12 nm 12 nm 12 nm
CUDA cores 10,496 8,704 5,888 5,888 4,608 4,352 2,944 2,560 3,584
Textureunits 328 272 184 184 288 272 184 160 224
Núcleos Tensores 328 3ª Gen. 272 3ª Gen. 184 Gen. 184 3ª Gen. 576 2ª Gen. 544 2ª Gen. 368 2ª Gen. 320 2ª Gen. -
RTcores 82 68 46 46 72 68 46 40 -
Relógio base GPU 1,395 MHz 1,440 MHz 1,500 MHz 1,500 MHz 1,350 MHz 1,350 MHz 1,515 MHz 1,605 MHz 1,417 MHz
Relógio de impulso GPU 1,695 MHz 1,710 MHz 1,725 MHz 1,750 MHz 1,770 MHz 1,545 MHz 1,710 MHz 1,770 MHz 1,531 MHz
Memorybus 384-bit 320-bit 256-bit 256-bit 384-bit 352-bit 256-bit 256-bit 384-bit
Largura de banda de memória 936 GB/s 760 GB/s 448GB/s 448 GB/s 672 GB/s 616 GB/s 448 GB/s 448 GB/s 480.4 GB/s
Memória de vídeo 24 GB GDDR6X 10 GB GDDR6X 8GB GDDR6 8 GB GDDR6 24 GB GDDR6 11 GB GDDR6 8 GB GDDR6 8 GB GDDR6 12 GB GDDR5X
Consumo de energia elétrica350 W 320 W 220W 220 W 280 W 250 W 215 W 215 W 250 W

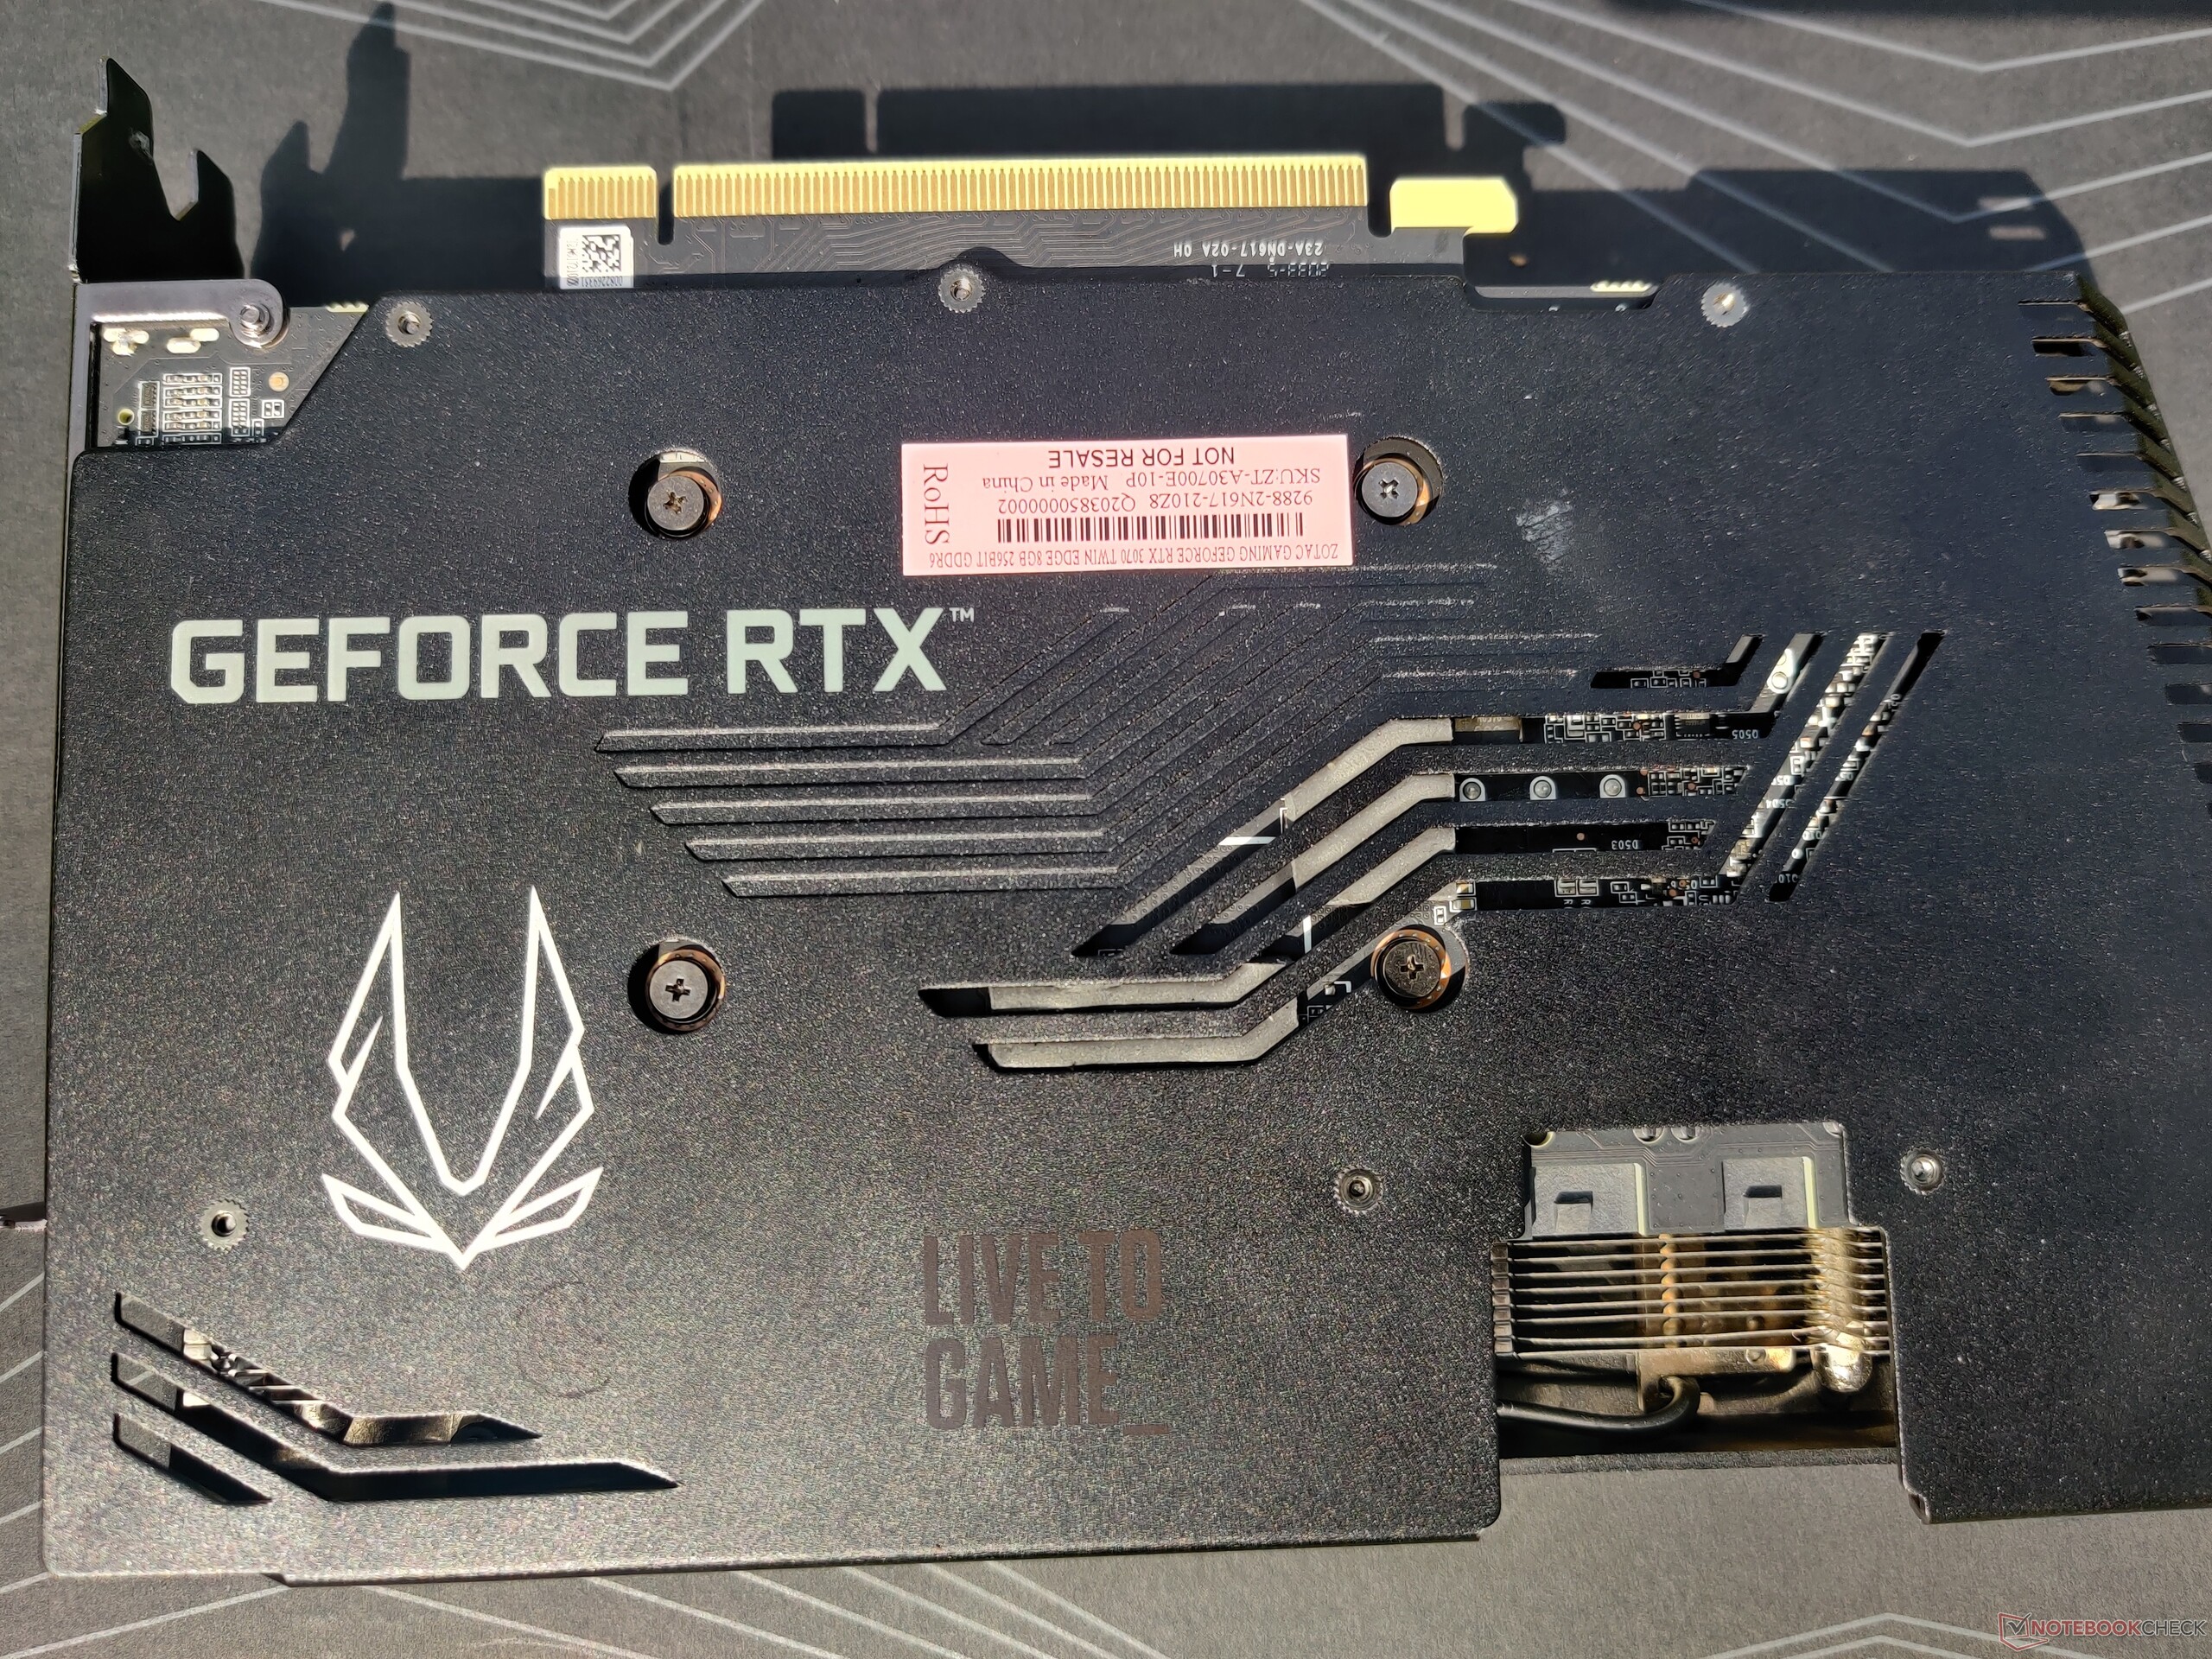
Uma visita ao Zotac Gaming GeForce RTX 3070 Twin Edge

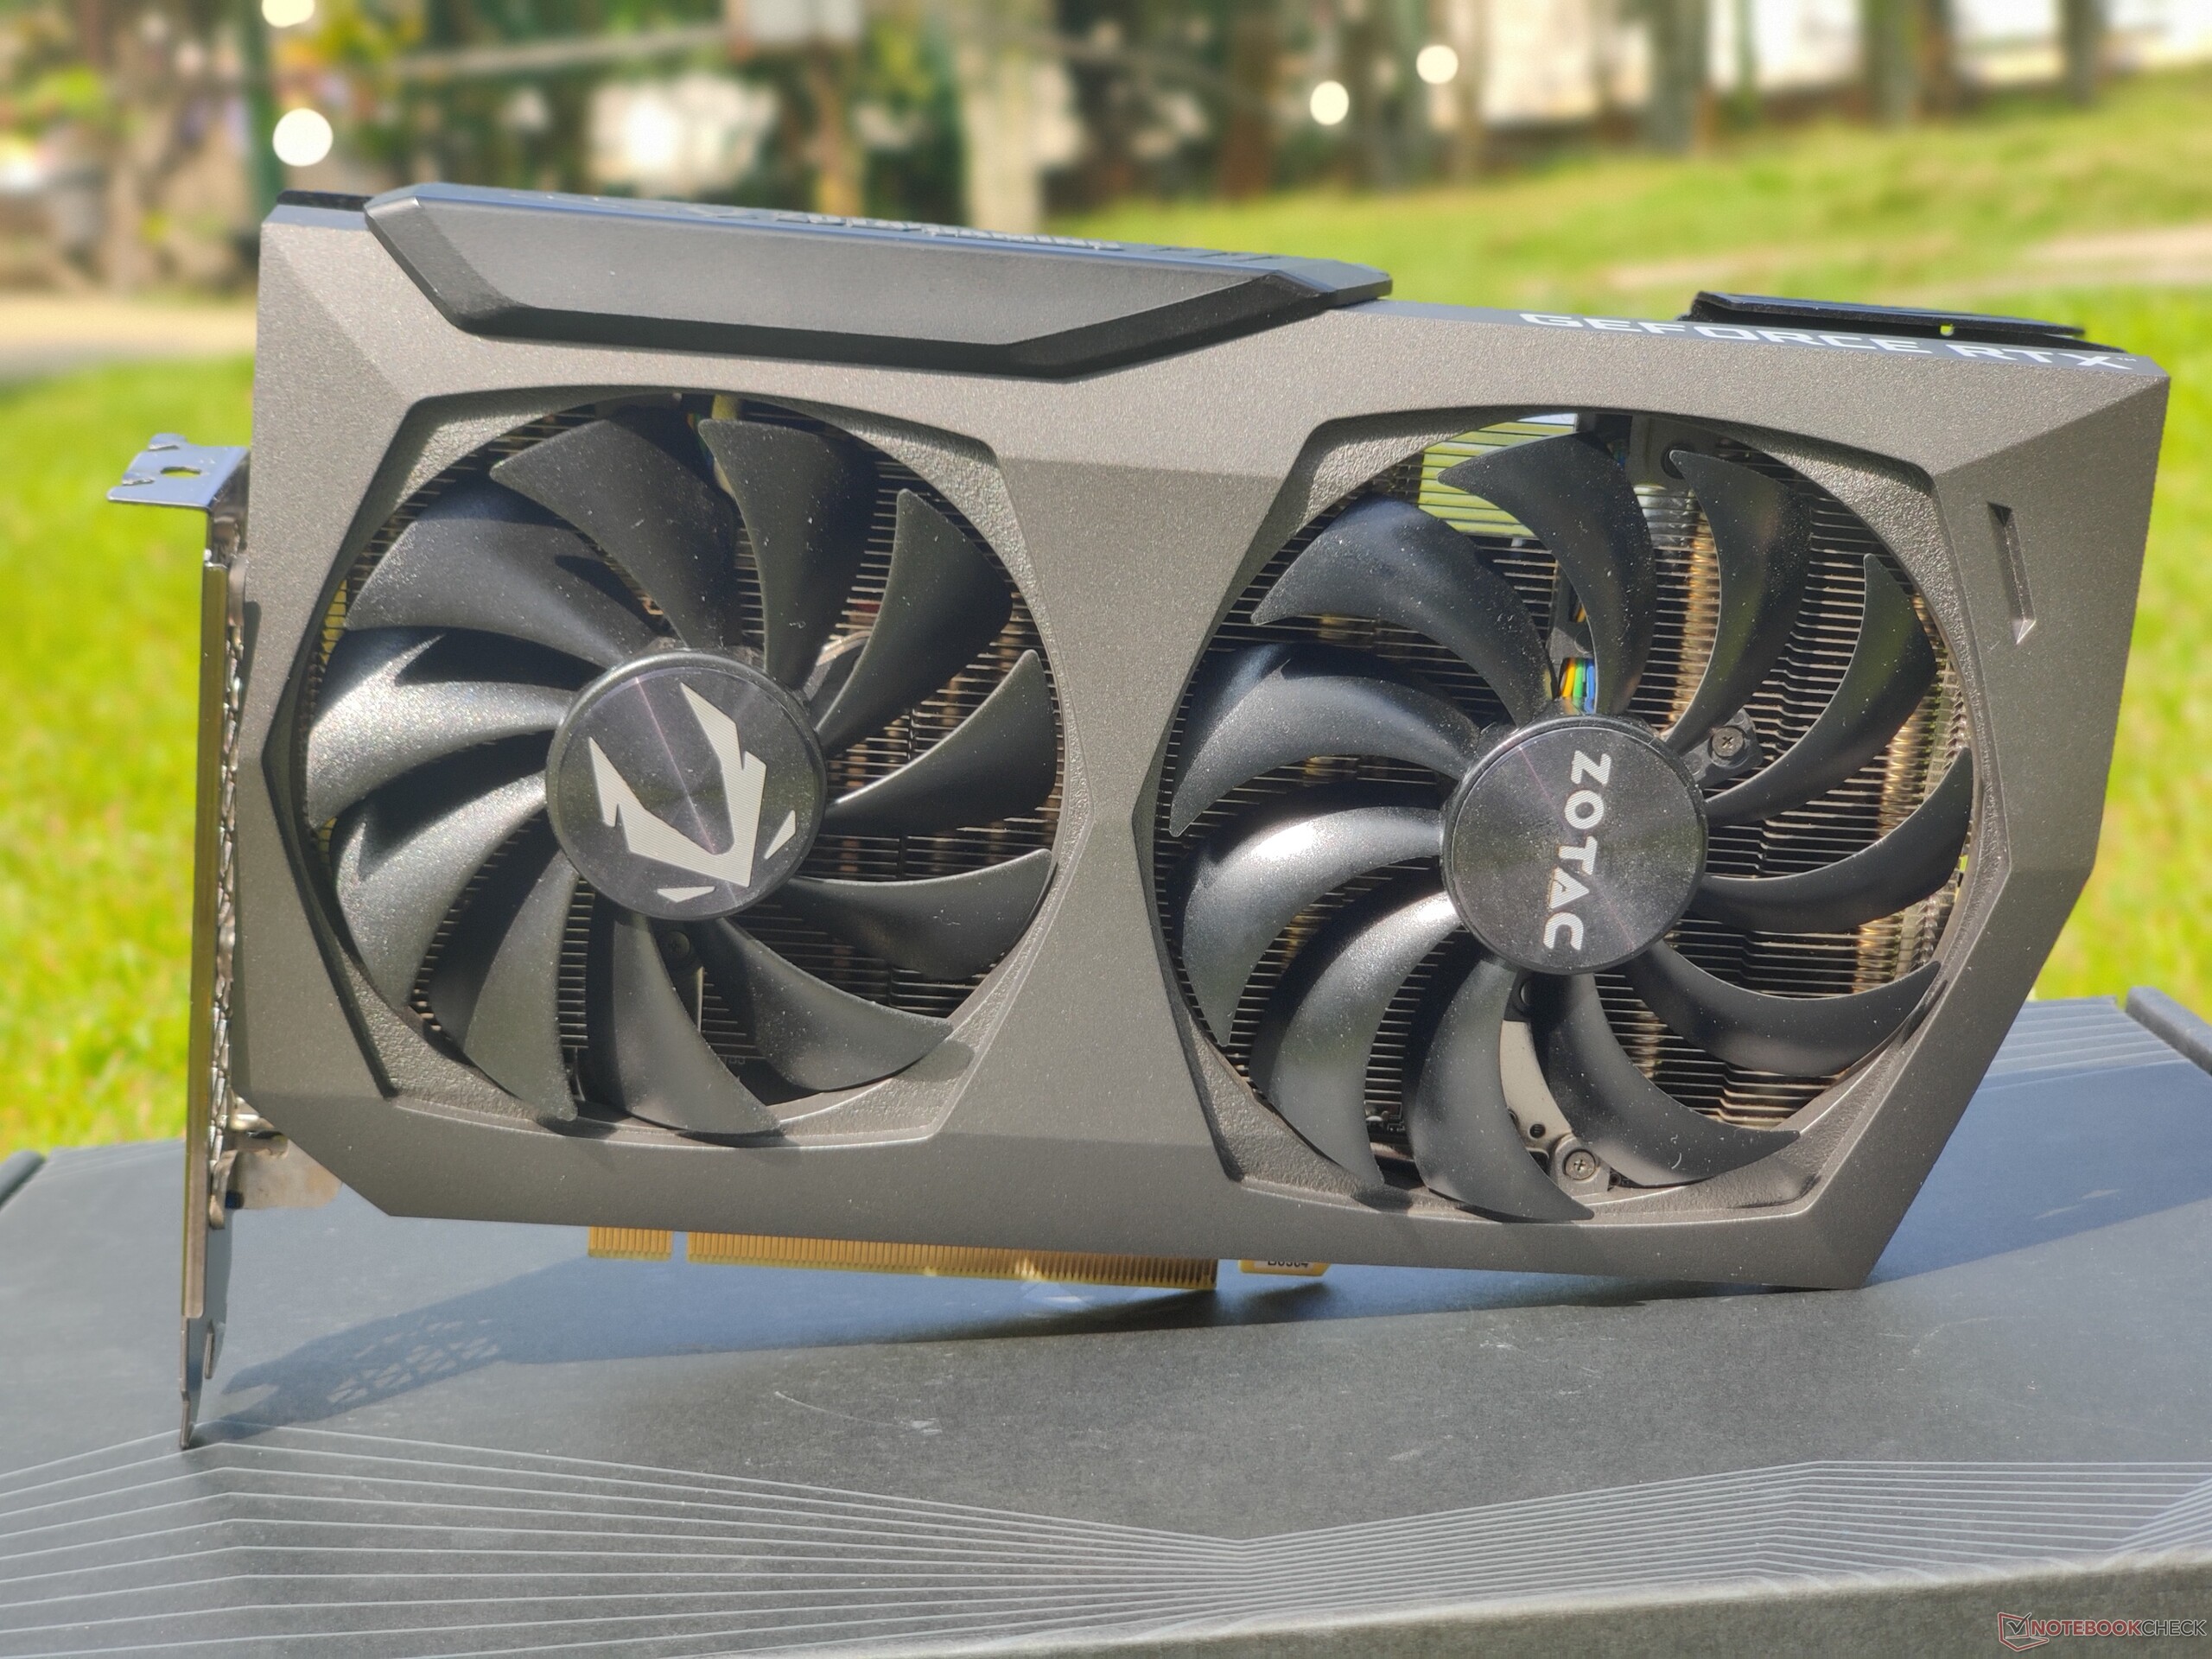
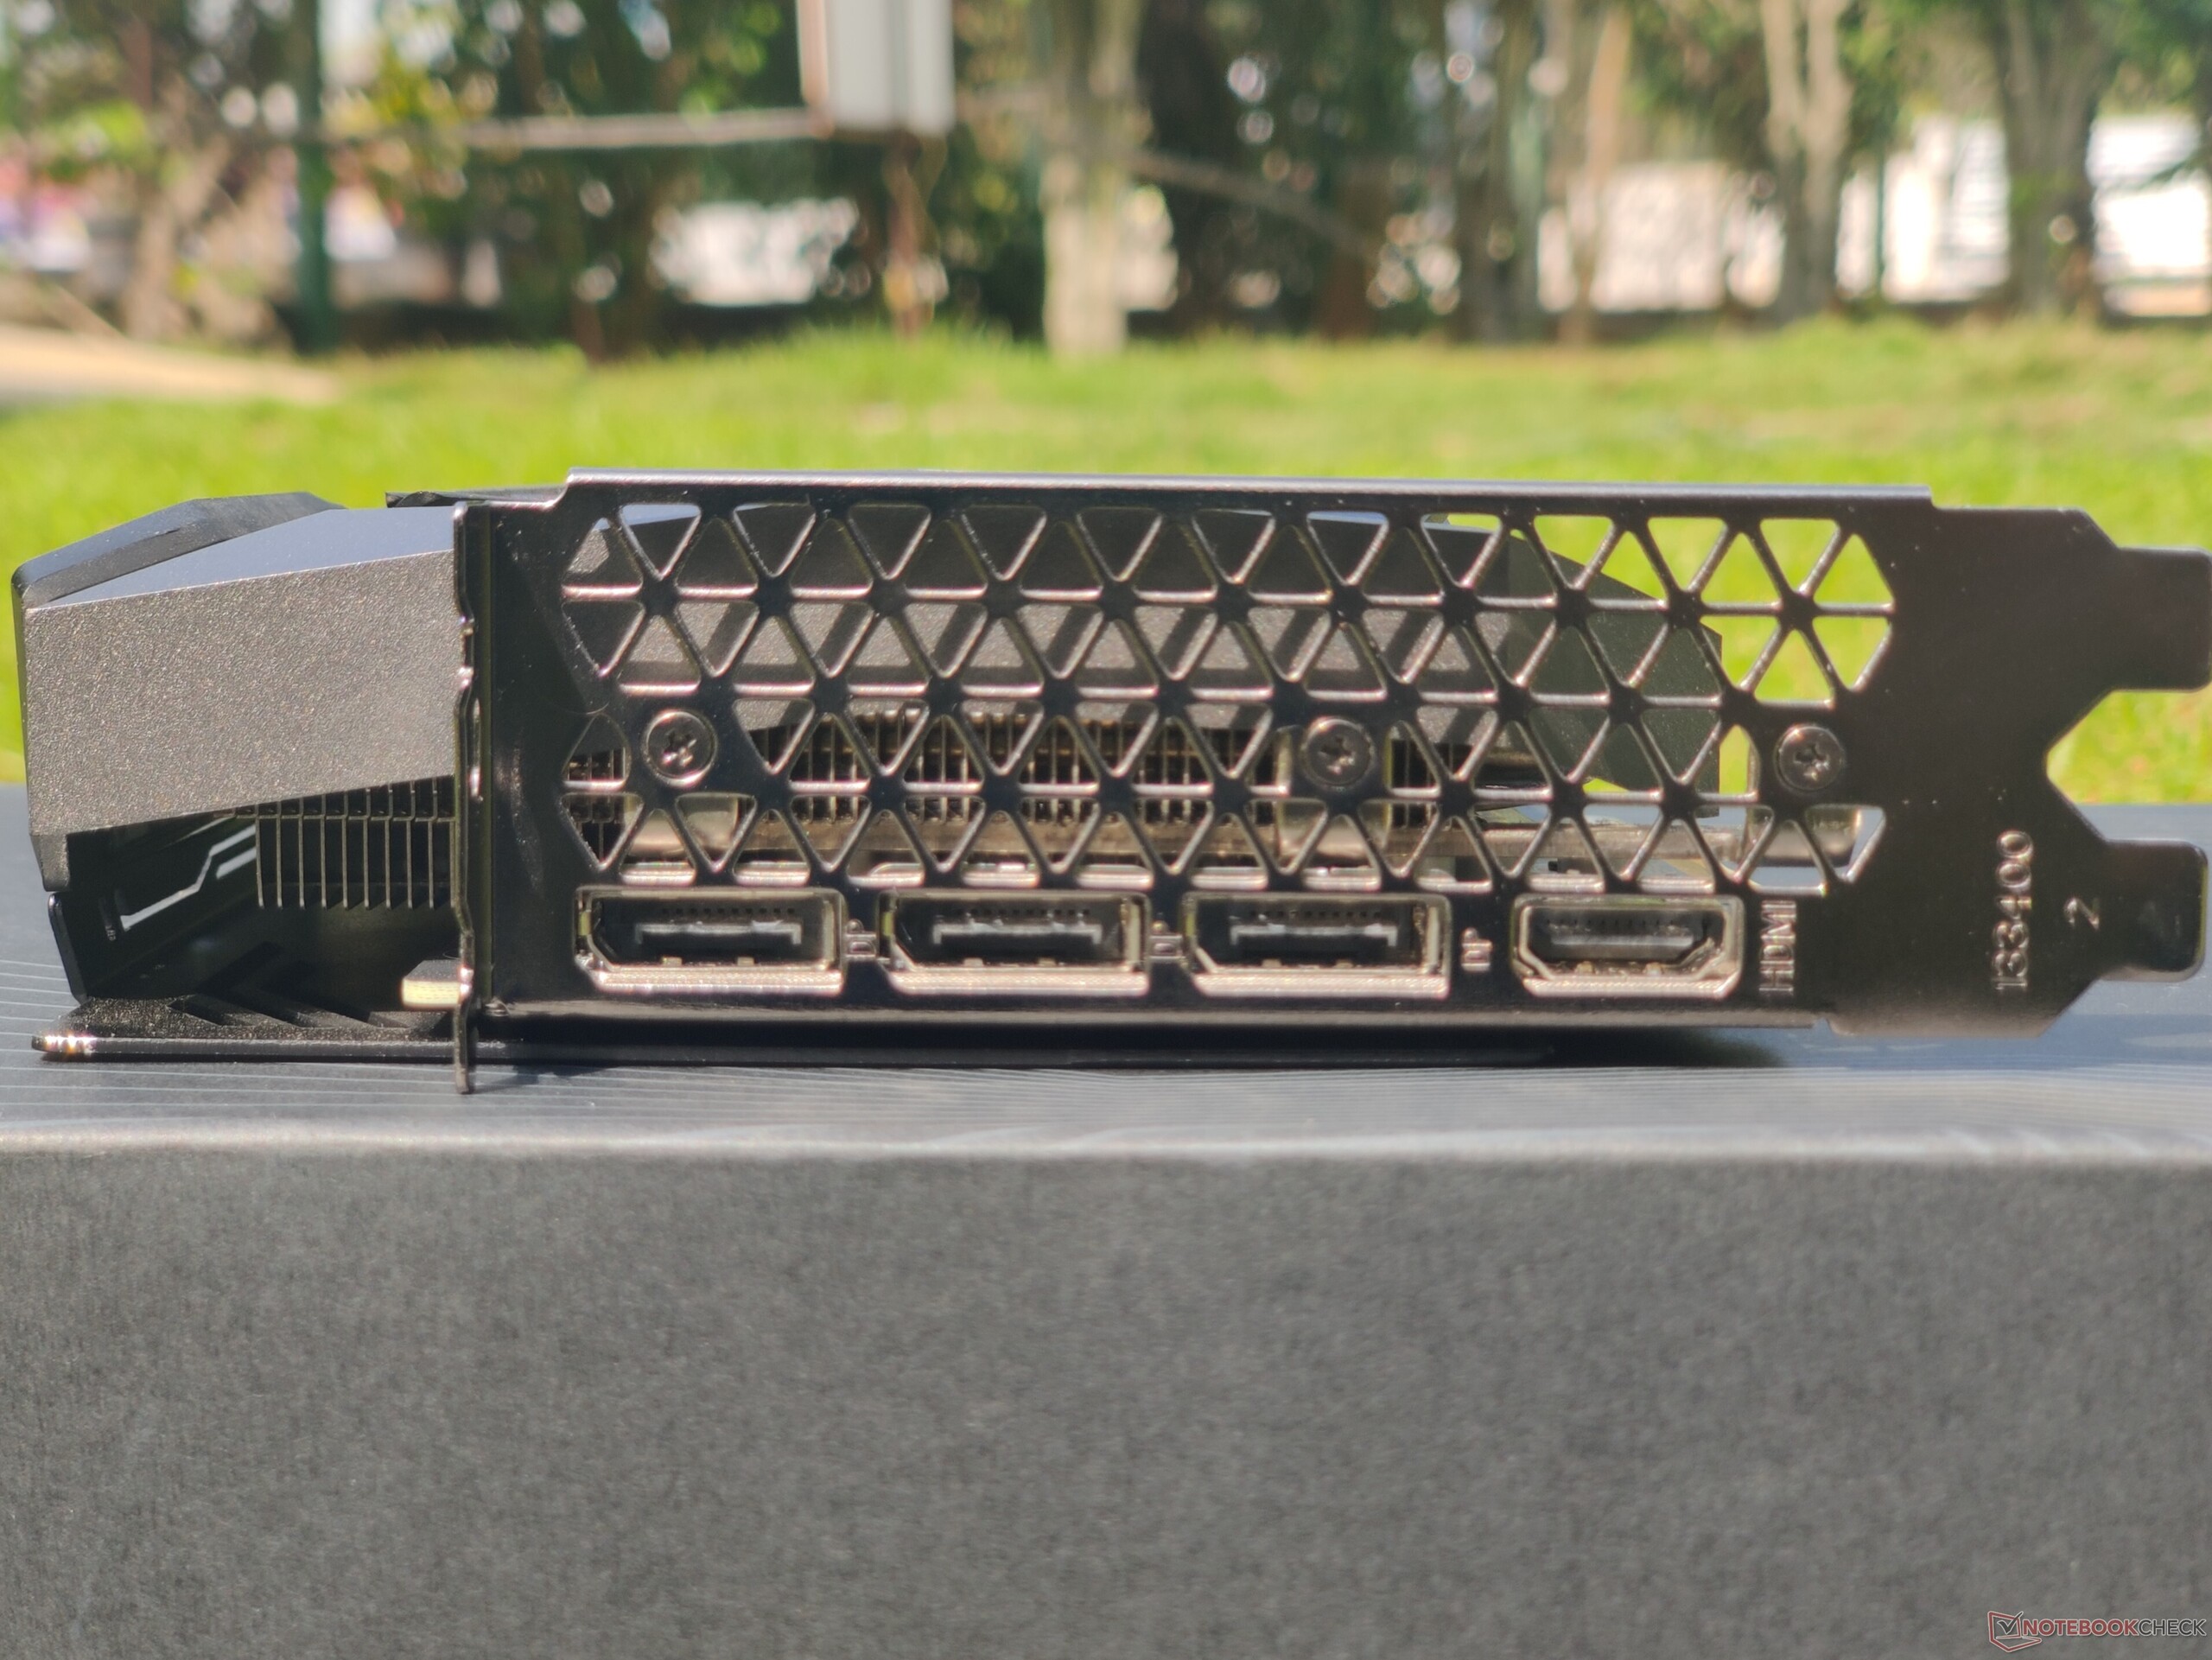
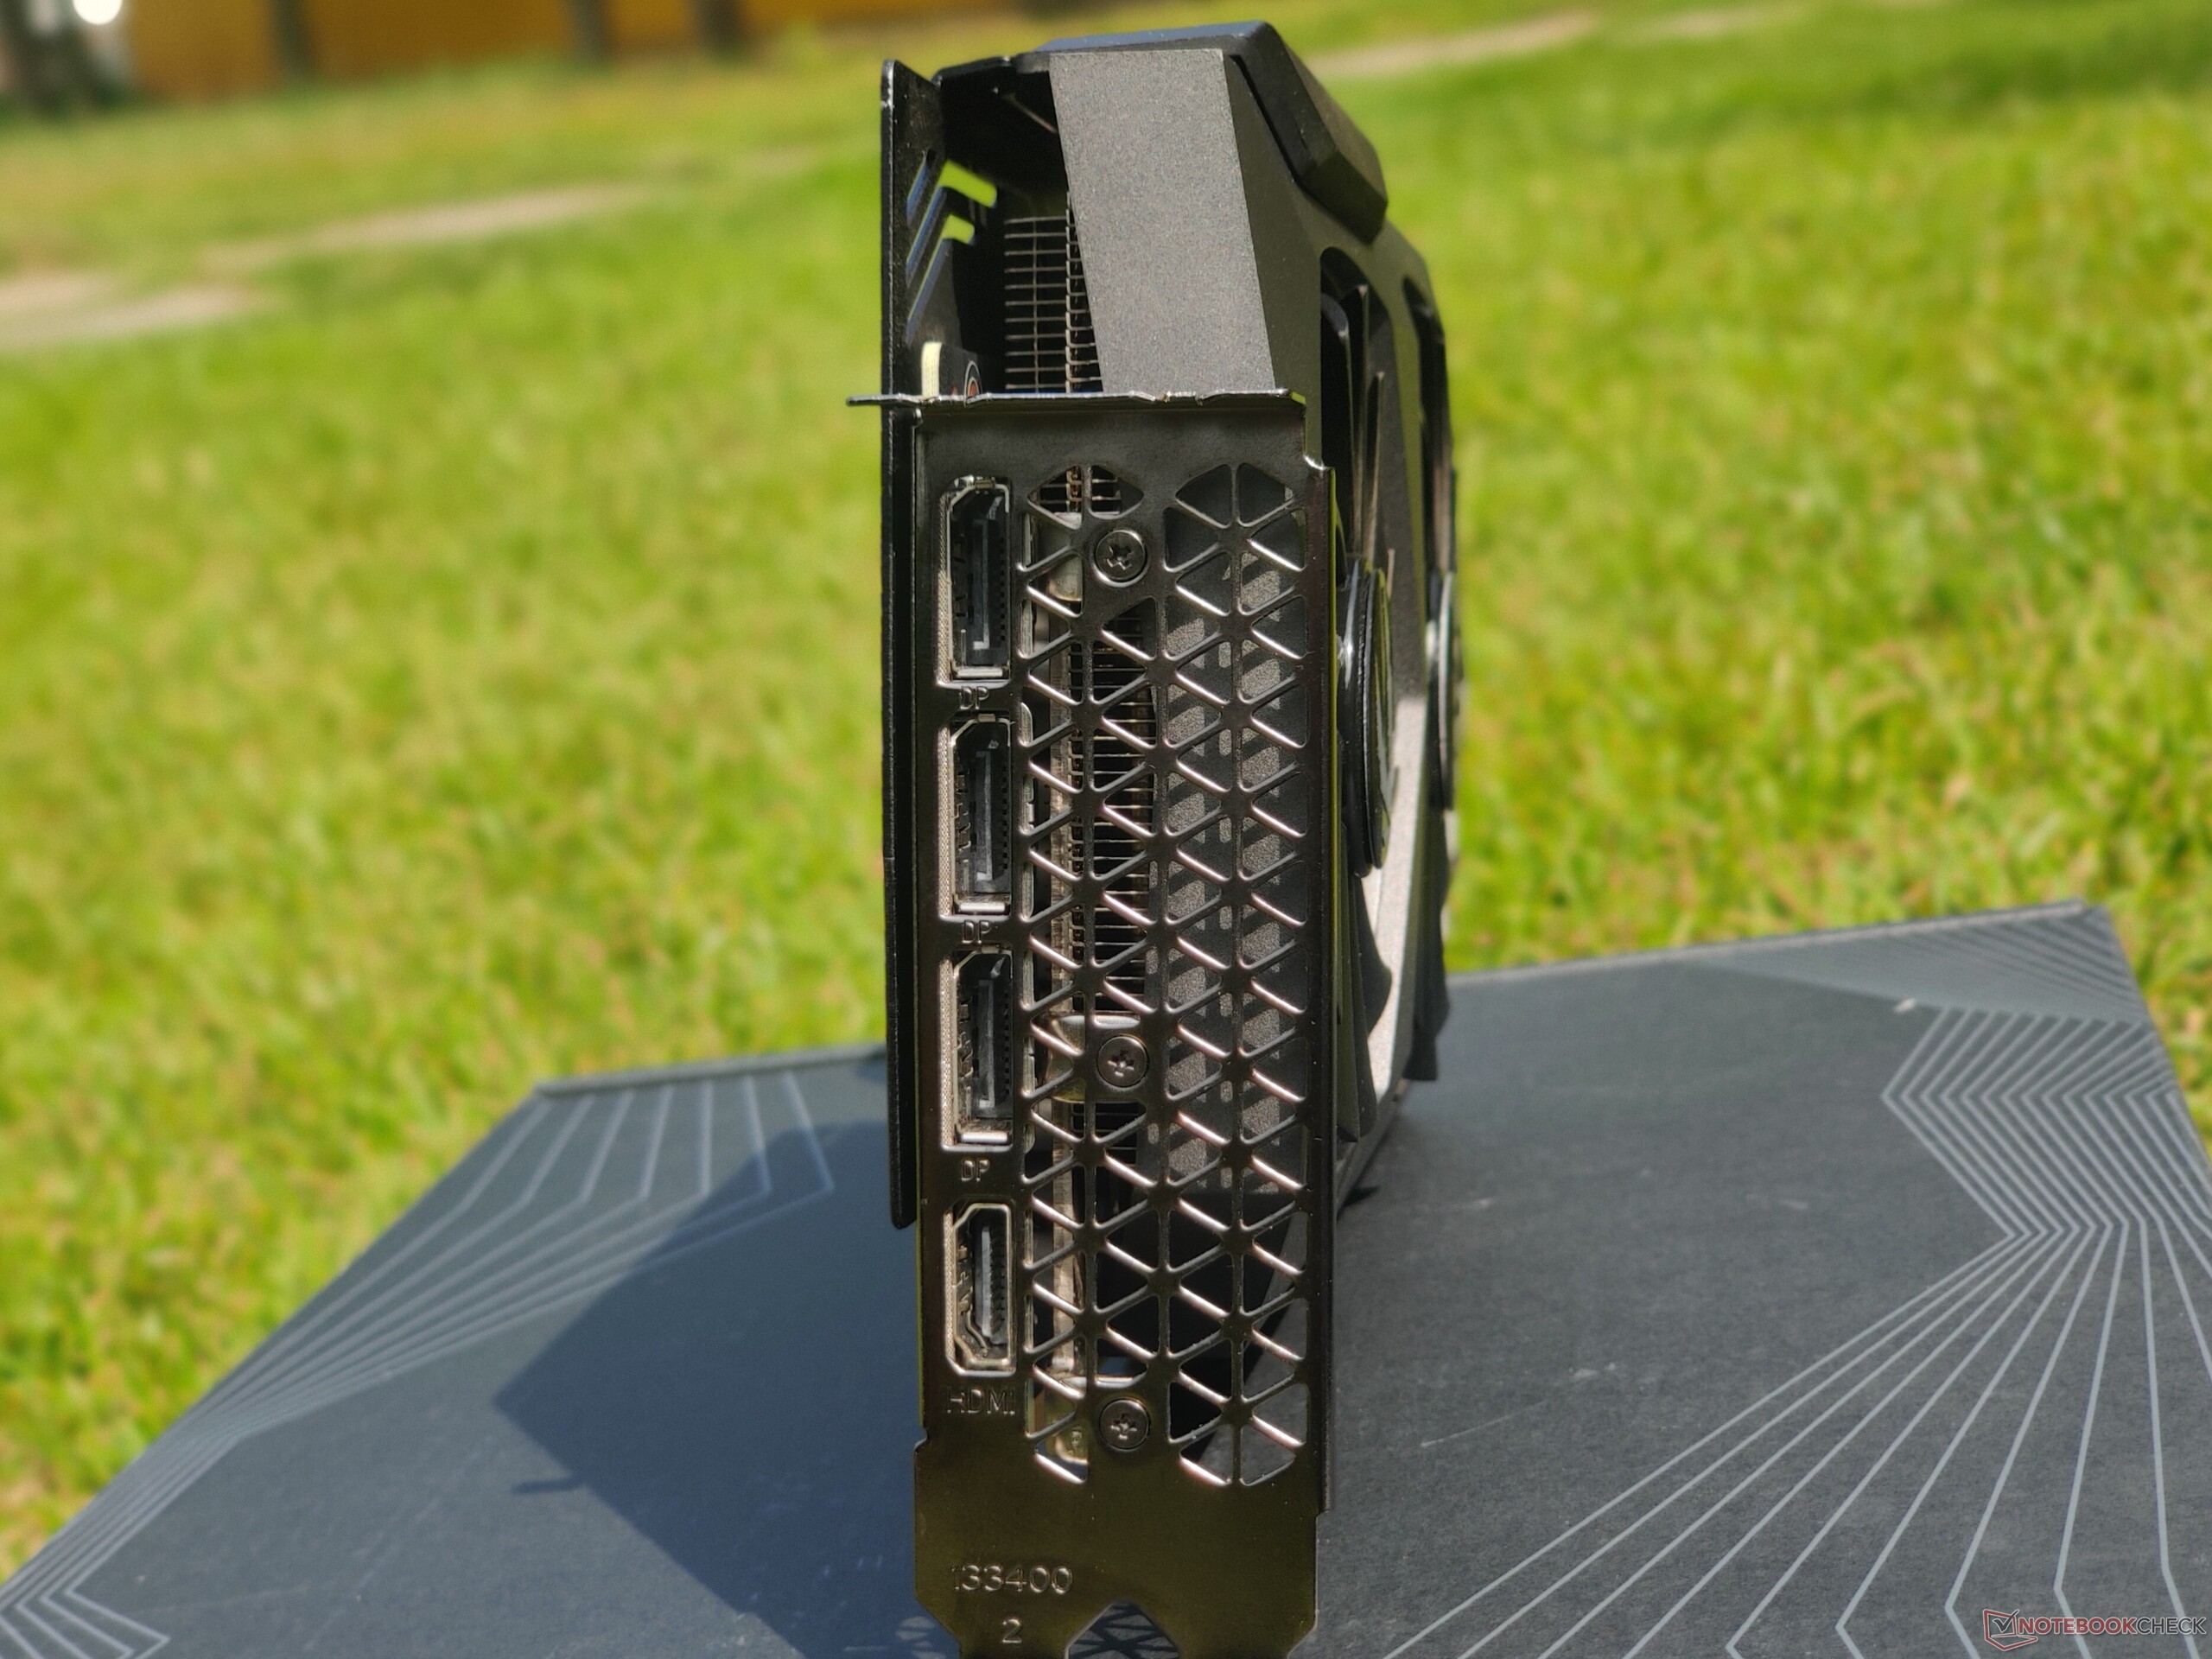
A Zotac Gaming RTX 3070 Twin Edge não vai exatamente virar cabeças em termos de aparência, mas ainda oferece um design minimalista e limpo. Não há bling RGB, e o logotipo da Zotac Gaming só acende em branco. A placa oferece dois conectores de alimentação de 8 pinos juntamente com quatro portas de saída de vídeo compostas de três DisplayPort 1.4a-out e um HDMI 2.1-out

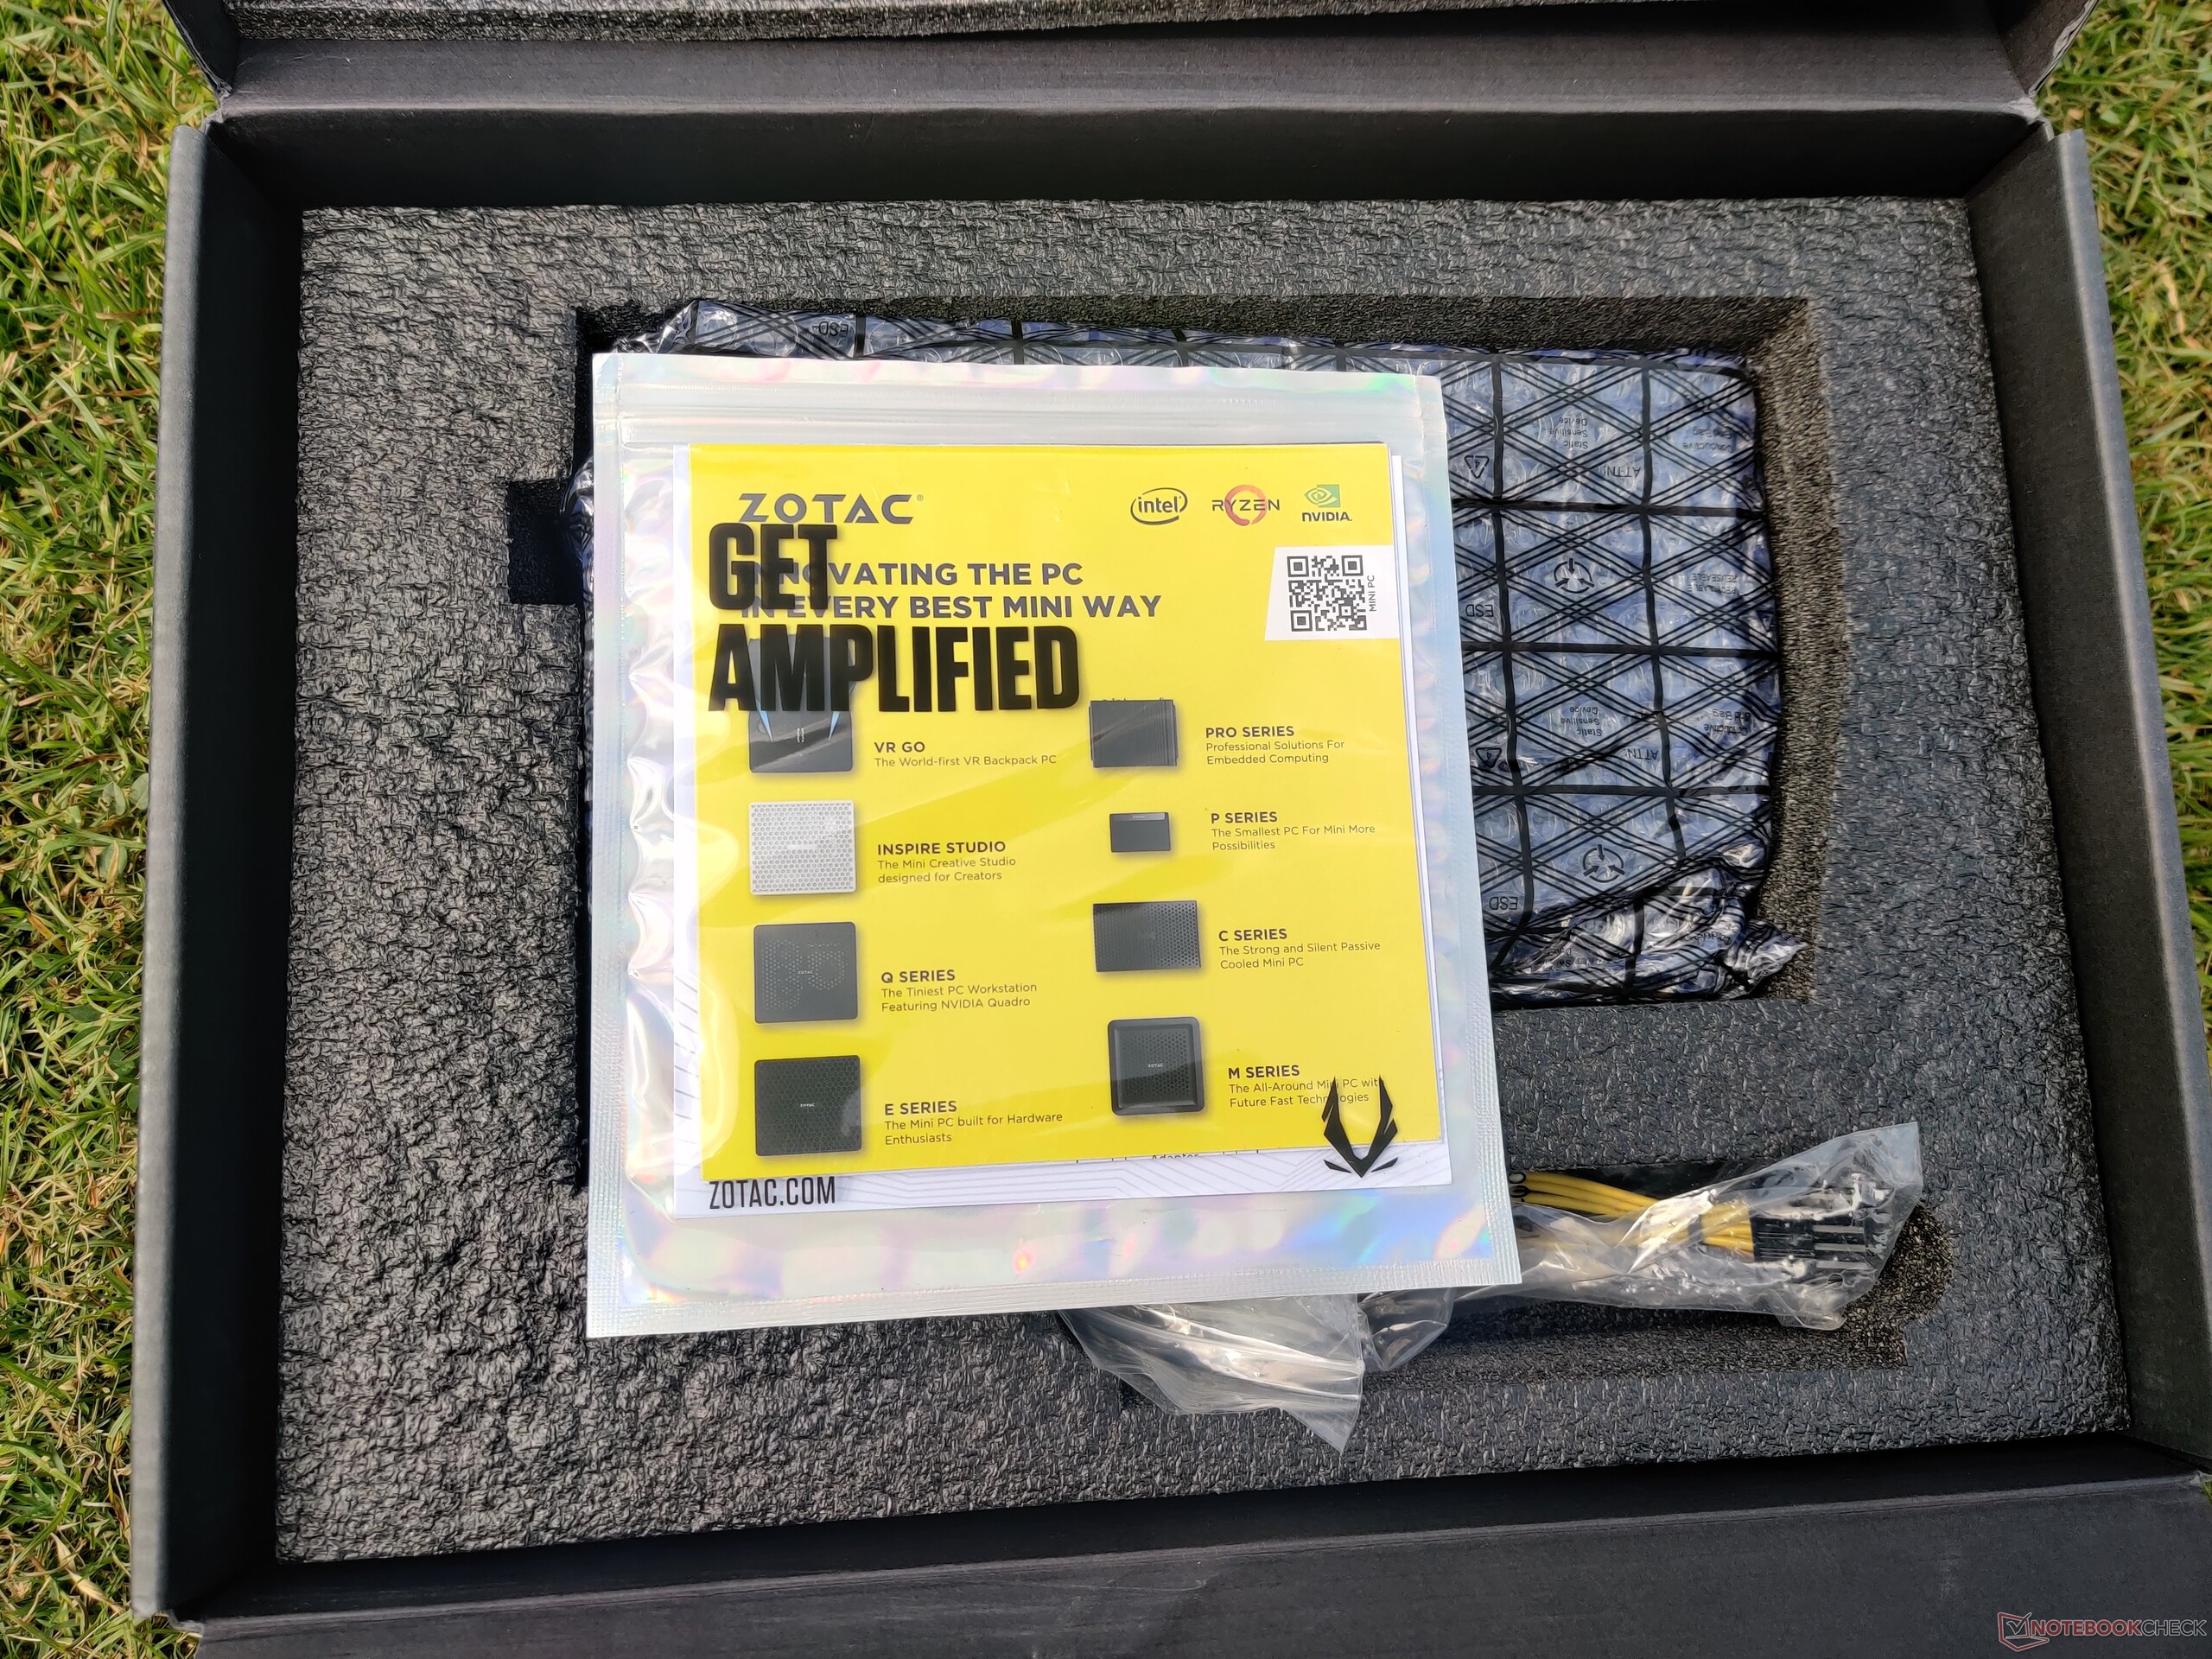
Os conectores de alimentação de 8 pinos duplos são colocados um pouco mais longe do interior da borda direita, como é o caso da maioria das cartas Zotac, de modo que alguns usuários podem achar que seus cabos PSU são um pouco curtos. O bom é que a Zotac fornece dois conectores de 6 a 8 pinos como acessórios, que podem ser usados como uma alternativa de trabalho. Não encontramos problemas de estabilidade ao executar a placa usando estes cabos.

A Zotac oferece uma garantia padrão de 3 anos para todos os cartões RTX 30, que pode ser estendida por mais dois anos se a compra for registrada no site da Zotac. Entretanto, esta política de garantia é aplicável apenas para as regiões EMEAI

Compradores na América do Norte (EUA e Canadá) recebem uma garantia padrão de 2 anos que pode ser estendida por mais um ano se o produto for registrado no site Zotac.com dentro de 30 dias após a compra.

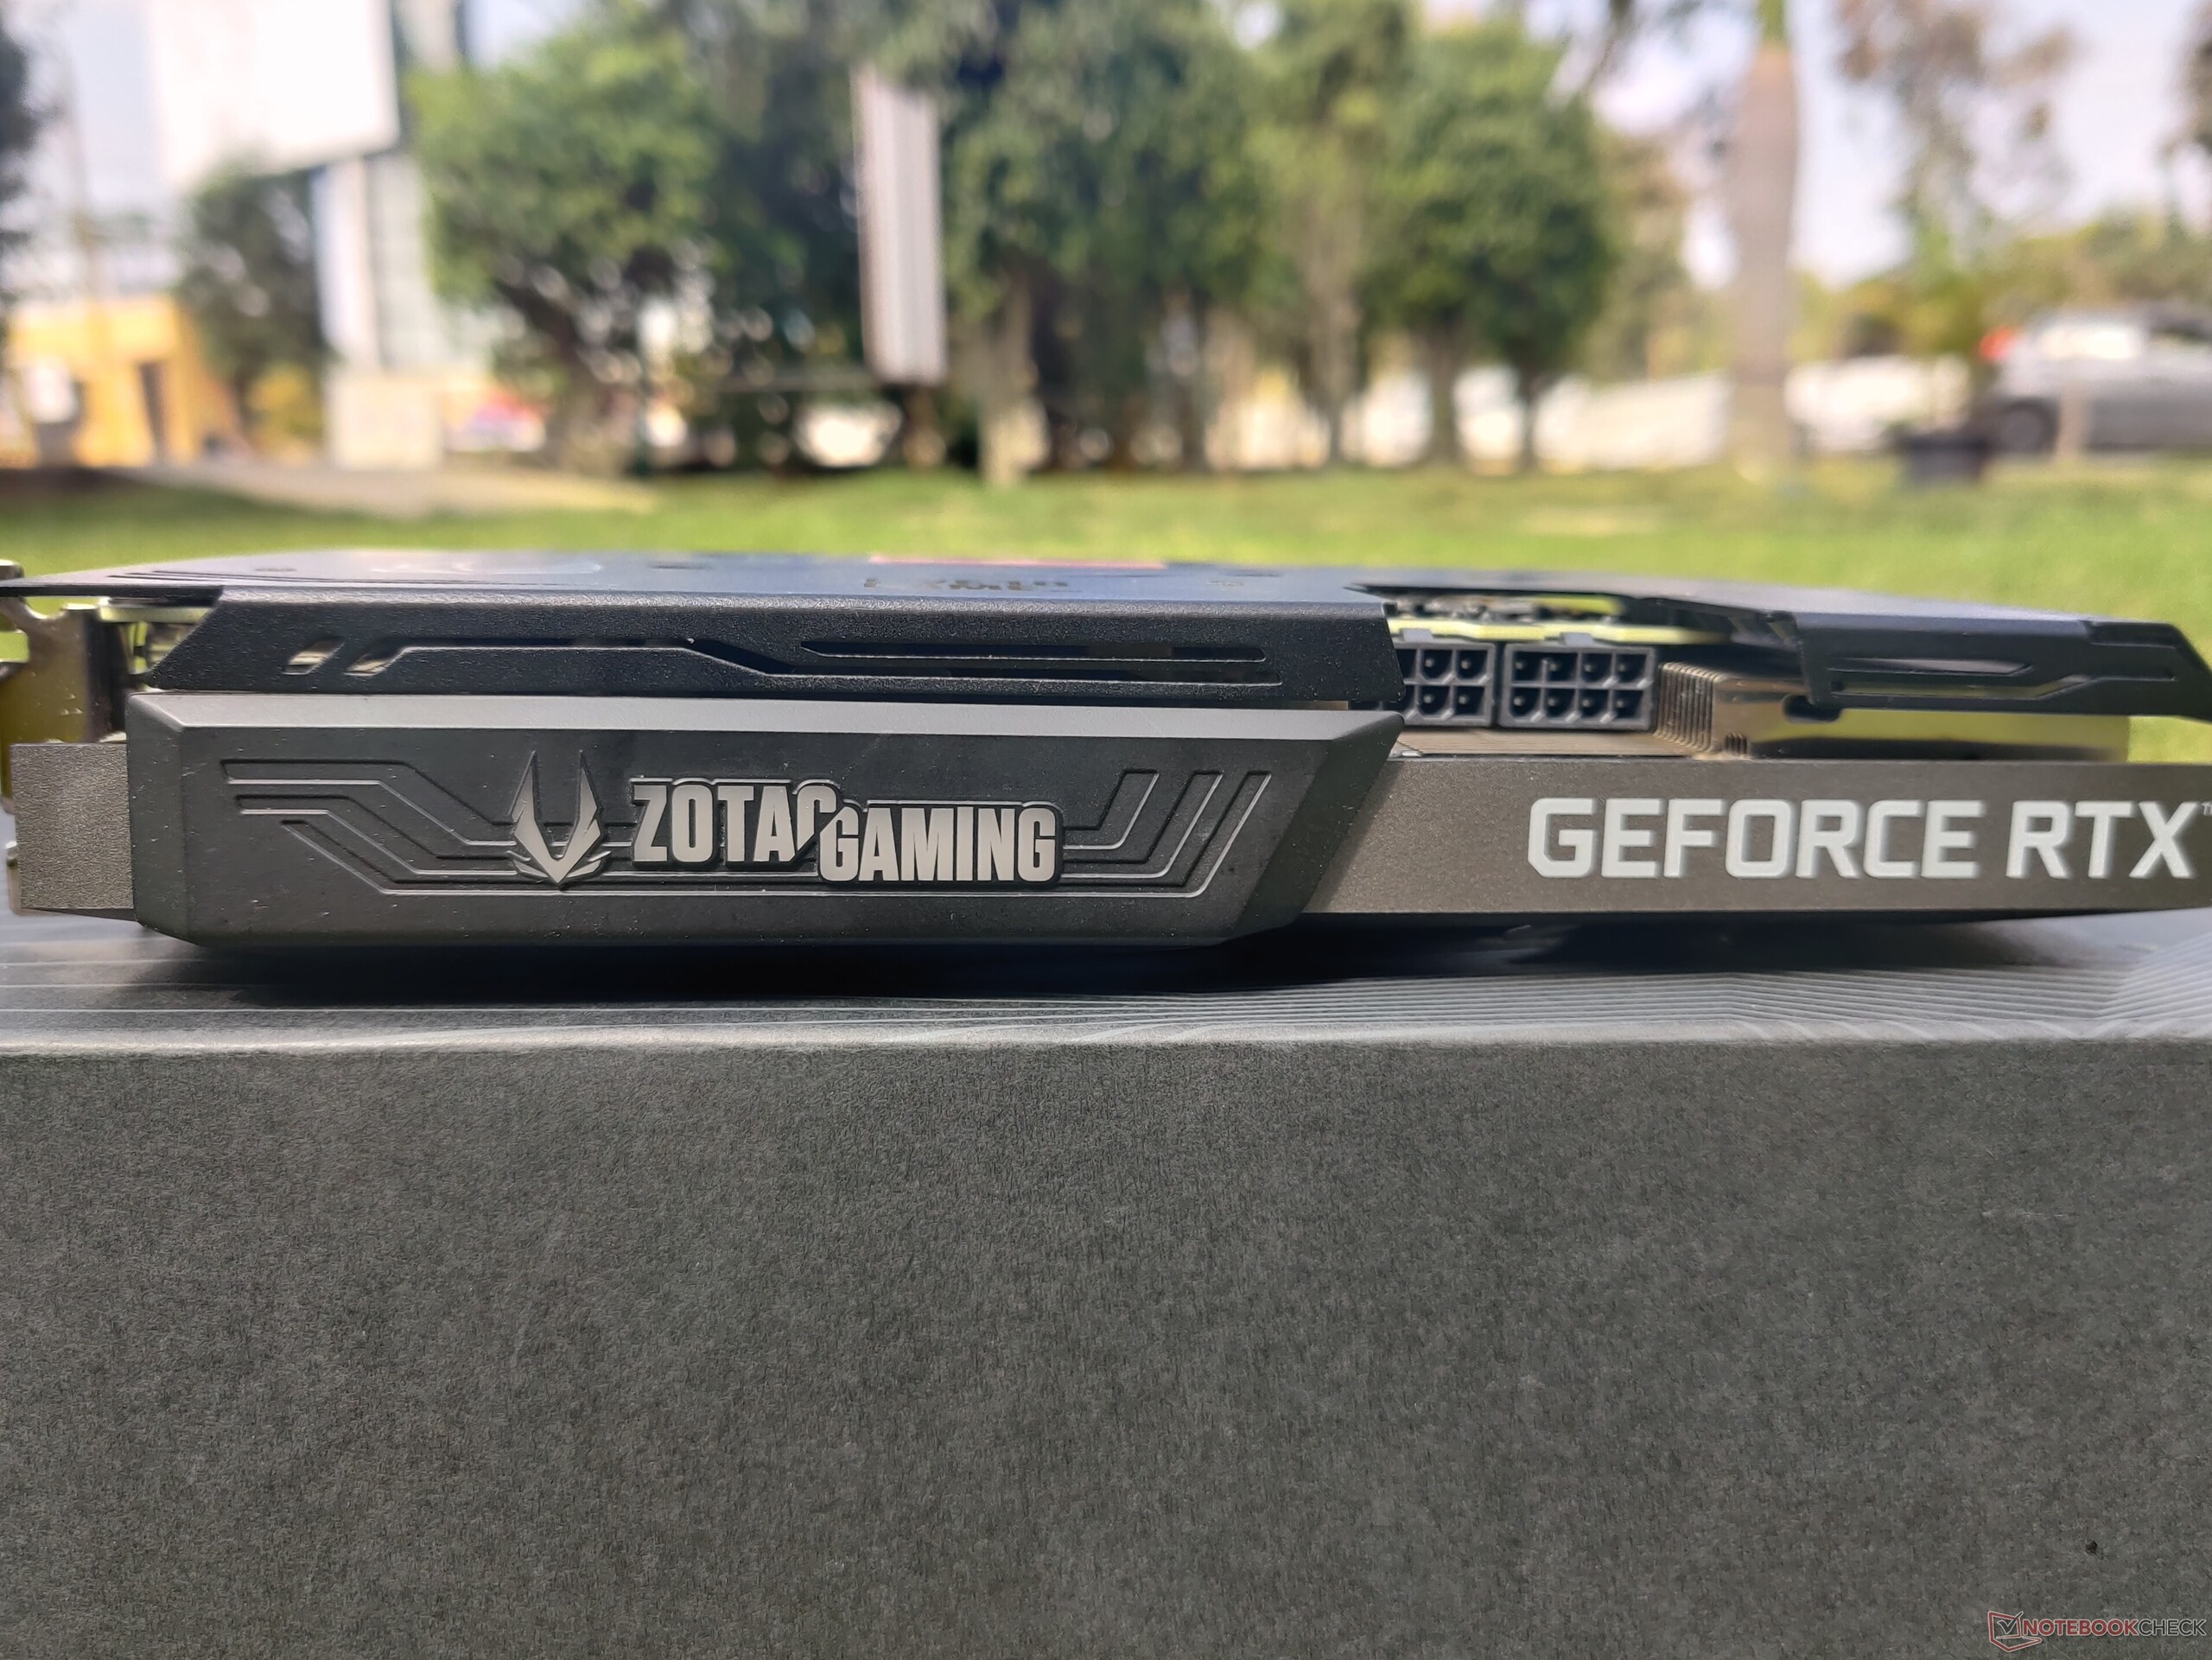
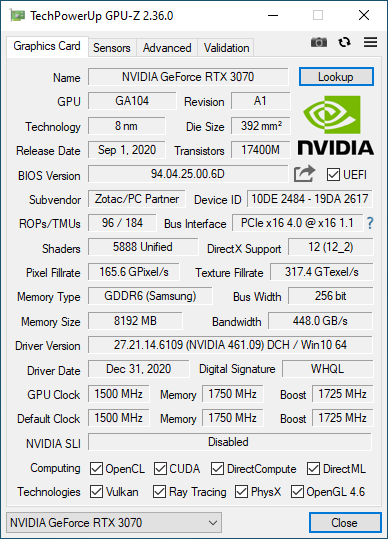
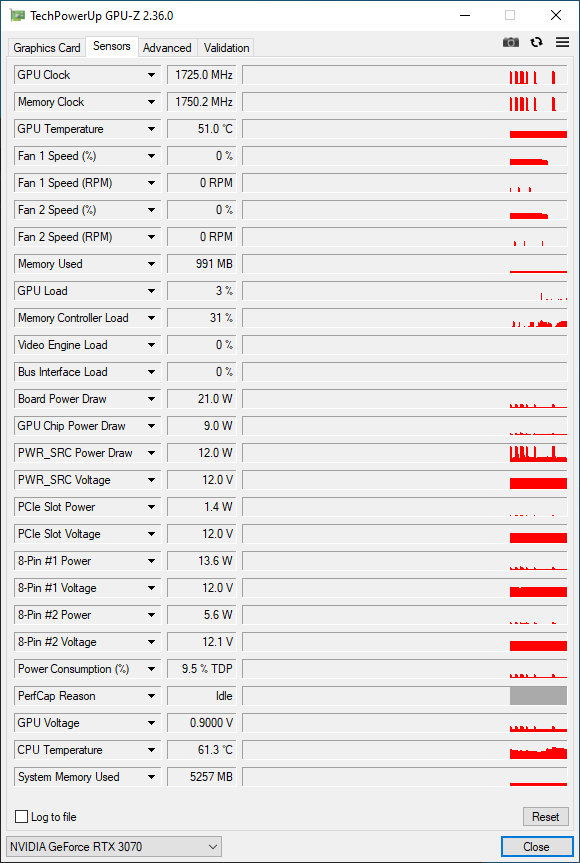
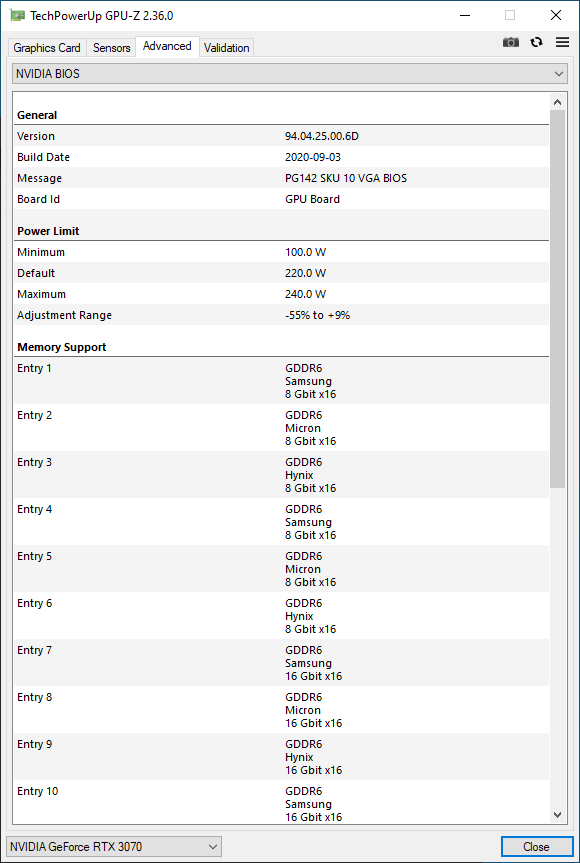
A GPU-Z não traz nenhuma surpresa, pois a Zotac não ajustou muito as especificações da Edição dos Fundadores. O RTX 3070 Twin Edge oferece um relógio de base de 1.500 MHz e um impulso de até 1.725 MHz. Embora o TGP do RTX 3070 seja avaliado em 220 W, é possível aumentá-lo em 9% até 240 W. Uma boa parte desta potência adicional é fornecida à própria GPU, pois a placa não tem RGB e tem apenas dois ventiladores

A bancada de teste

Nosso banco de testes é baseado na plataforma AMD Ryzen 5000 Zen 3 X570. O processador AMD Ryzen 9 5950X 16-core oferece um excelente desempenho em jogos que bate o Intel Core i9-10900K e é nosso processador de escolha para este teste. Um refrigerador Corsair iCUE H115i Elite Capellix AIO ajudou a manter esta CPU mamute fria

Usamos a placa-mãe MSI Prestige X570 Creation como base. O Ryzen 9 5950X foi emparelhado com 32 GB (16 GB x2) de G.SKILL Trident Z Neo DDR4-3600 RAM com temporizações de 16-19-19-39. O Windows 10 20H2 com as últimas atualizações cumulativas (Build 19041.662) foi instalado em um Gigabyte Aorus NVMe Gen4 1 TB SSD e dois Crucial MX500 SATA SSDs de 1 TB cada um foram usados para executar benchmarks e jogos

Toda a construção foi alojada em uma caixa iCUE 4000X RGB Corsair com um Thermaltake Toughpower Grand 850 W 80 Plus Gold como a fonte de energia de escolha. Todos os testes foram feitos com o estojo fechado para ser representativo de um cenário de uso normal

Gostaríamos de agradecer à AMD por fornecer o Ryzen 9 5950X e Corsair para o resfriador iCUE Elite Capellix e o estojo iCUE 4000X

Juntamos o RTX 3070 Twin Edge a uma TV inteligente OnePlus Série U 55U1 rodando a 4K 60 Hz. A saída de cores foi ajustada para RGB completo de 32 bits no painel de controle da NVIDIA e a escala da área de trabalho do Windows foi ajustada para 100%

CPU AMD Ryzen 9 5950X
MSI Prestige X570 Criação da placa-mãe. (Fonte da imagem: MSI)
Gigabyte Aorus NVMe Gen4 SSD. (Fonte da imagem: Gigabyte)
G.SKILL Trident Z Neo DDR4-3600 RAM. (Fonte da imagem: G.SKILL)

Padrões de referência sintéticos

O Zotac RTX 3070 Twin Edge tem um desempenho decente em nossos testes de referência sintética. Esta placa está ligada ao MSI GeForce RTX 3070 Ventus 3X OC na maioria dos testes 3DMark, pois ambos têm praticamente as mesmas especificações (o Ventus é apenas 25 MHz mais rápido)

Vemos também que o desempenho geral está em linha com um RTX 2080 Ti e é entre 13% e 20% mais rápido do que um RTX 2080 Super.

O delta de desempenho entre o RTX 3070 e o Titan RTX é significativamente reduzido nos referenciais Unigine Heaven 4.0 e Valley 1.0. Entretanto, o Titan RTX é visto como tendo uma vantagem em todos os subconjuntos do teste de Superposição

3DMark
1920x1080 Fire Strike Graphics
AMD Radeon RX 6800 XT
AMD Radeon RX 6800 XT, R9 5950X
49735 Points +59%
Zotac Gaming GeForce RTX 3090 Trinity
NVIDIA GeForce RTX 3090, R9 3900X
43404 Points +39%
MSI GeForce RTX 3090 Suprim X
NVIDIA GeForce RTX 3090, R9 5900X
42688 Points +37%
ASUS GeForce RTX 3080 ROG STRIX OC GAMING
NVIDIA GeForce RTX 3080, R9 5900X
40910 Points +31%
MSI GeForce RTX 3080 Gaming X Trio
NVIDIA GeForce RTX 3080, R9 5900X
37604 Points +20%
AMD Ryzen 9 5900X
NVIDIA Titan RTX, R9 5900X
34722 Points +11%
KFA2 GeForce RTX 2080 Ti EX
NVIDIA GeForce RTX 2080 Ti (Desktop), R9 3900X
32081 Points +3%
Zotac Gaming GeForce RTX 3070 Twin Edge
NVIDIA GeForce RTX 3070, R9 5950X
31252 Points
MSI GeForce RTX 3070 Gaming X Trio
NVIDIA GeForce RTX 3070, R9 5900X
31096 Points 0%
MSI GeForce RTX 3070 Ventus 3X
NVIDIA GeForce RTX 3070, R9 5900X
31020 Points -1%
Average NVIDIA GeForce RTX 3070
  (20357 - 33270, n=7)
28949 Points -7%
Nvidia GeForce RTX 2080 Super
NVIDIA GeForce RTX 2080 Super (Desktop), R7 2700X
27075 Points -13%
AMD Radeon RX 5700 XT
AMD Radeon RX 5700 XT (Desktop), R7 2700X
25383 Points -19%
Nvidia GeForce RTX 2070 Super
NVIDIA GeForce RTX 2070 Super (Desktop), R7 2700X
24151 Points -23%
Nvidia GeForce RTX 2060 Super
NVIDIA GeForce RTX 2060 Super (Desktop), R7 2700X
21970 Points -30%
3840x2160 Fire Strike Ultra Graphics
AMD Radeon RX 6800 XT
AMD Radeon RX 6800 XT, R9 5950X
12626 Points +57%
MSI GeForce RTX 3090 Suprim X
NVIDIA GeForce RTX 3090, R9 5900X
12371 Points +54%
Zotac Gaming GeForce RTX 3090 Trinity
NVIDIA GeForce RTX 3090, R9 3900X
11715 Points +46%
ASUS GeForce RTX 3080 ROG STRIX OC GAMING
NVIDIA GeForce RTX 3080, R9 5900X
10793 Points +34%
MSI GeForce RTX 3080 Gaming X Trio
NVIDIA GeForce RTX 3080, R9 5900X
10645 Points +32%
AMD Ryzen 9 5900X
NVIDIA Titan RTX, R9 5900X
8649 Points +8%
MSI GeForce RTX 3070 Gaming X Trio
NVIDIA GeForce RTX 3070, R9 5900X
8483 Points +5%
Average NVIDIA GeForce RTX 3070
  (8043 - 8483, n=5)
8250 Points +3%
MSI GeForce RTX 3070 Ventus 3X
NVIDIA GeForce RTX 3070, R9 5900X
8227 Points +2%
Zotac Gaming GeForce RTX 3070 Twin Edge
NVIDIA GeForce RTX 3070, R9 5950X
8043 Points
KFA2 GeForce RTX 2080 Ti EX
NVIDIA GeForce RTX 2080 Ti (Desktop), R9 3900X
7925 Points -1%
Nvidia GeForce RTX 2080 Super
NVIDIA GeForce RTX 2080 Super (Desktop), R7 2700X
6500 Points -19%
AMD Radeon RX 5700 XT
AMD Radeon RX 5700 XT (Desktop), R7 2700X
5955 Points -26%
Nvidia GeForce RTX 2070 Super
NVIDIA GeForce RTX 2070 Super (Desktop), R7 2700X
5786 Points -28%
Nvidia GeForce RTX 2060 Super
NVIDIA GeForce RTX 2060 Super (Desktop), R7 2700X
5175 Points -36%
Fire Strike Extreme Graphics
AMD Radeon RX 6800 XT
AMD Radeon RX 6800 XT, R9 5950X
25015 Points +61%
MSI GeForce RTX 3090 Suprim X
NVIDIA GeForce RTX 3090, R9 5900X
23114 Points +49%
Zotac Gaming GeForce RTX 3090 Trinity
NVIDIA GeForce RTX 3090, R9 3900X
22423 Points +45%
ASUS GeForce RTX 3080 ROG STRIX OC GAMING
NVIDIA GeForce RTX 3080, R9 5900X
20861 Points +35%
MSI GeForce RTX 3080 Gaming X Trio
NVIDIA GeForce RTX 3080, R9 5900X
20007 Points +29%
AMD Ryzen 9 5900X
NVIDIA Titan RTX, R9 5900X
17176 Points +11%
MSI GeForce RTX 3070 Gaming X Trio
NVIDIA GeForce RTX 3070, R9 5900X
16196 Points +4%
Average NVIDIA GeForce RTX 3070
  (15503 - 16276, n=5)
15859 Points +2%
MSI GeForce RTX 3070 Ventus 3X
NVIDIA GeForce RTX 3070, R9 5900X
15722 Points +1%
KFA2 GeForce RTX 2080 Ti EX
NVIDIA GeForce RTX 2080 Ti (Desktop), R9 3900X
15603 Points +1%
Zotac Gaming GeForce RTX 3070 Twin Edge
NVIDIA GeForce RTX 3070, R9 5950X
15503 Points
Nvidia GeForce RTX 2080 Super
NVIDIA GeForce RTX 2080 Super (Desktop), R7 2700X
12968 Points -16%
AMD Radeon RX 5700 XT
AMD Radeon RX 5700 XT (Desktop), R7 2700X
12209 Points -21%
Nvidia GeForce RTX 2070 Super
NVIDIA GeForce RTX 2070 Super (Desktop), R7 2700X
11634 Points -25%
Nvidia GeForce RTX 2060 Super
NVIDIA GeForce RTX 2060 Super (Desktop), R7 2700X
10481 Points -32%
2560x1440 Time Spy Graphics
MSI GeForce RTX 3090 Suprim X
NVIDIA GeForce RTX 3090, R9 5900X
19571 Points +50%
Zotac Gaming GeForce RTX 3090 Trinity
NVIDIA GeForce RTX 3090, R9 3900X
18863 Points +45%
MSI GeForce RTX 3080 Gaming X Trio
NVIDIA GeForce RTX 3080, R9 5900X
17604 Points +35%
AMD Radeon RX 6800 XT
AMD Radeon RX 6800 XT, R9 5950X
17603 Points +35%
ASUS GeForce RTX 3080 ROG STRIX OC GAMING
NVIDIA GeForce RTX 3080, R9 5900X
17467 Points +34%
AMD Ryzen 9 5900X
NVIDIA Titan RTX, R9 5900X
15283 Points +17%
KFA2 GeForce RTX 2080 Ti EX
NVIDIA GeForce RTX 2080 Ti (Desktop), R9 3900X
13744 Points +6%
MSI GeForce RTX 3070 Gaming X Trio
NVIDIA GeForce RTX 3070, R9 5900X
13579 Points +4%
MSI GeForce RTX 3070 Ventus 3X
NVIDIA GeForce RTX 3070, R9 5900X
13111 Points +1%
Zotac Gaming GeForce RTX 3070 Twin Edge
NVIDIA GeForce RTX 3070, R9 5950X
13024 Points
Average NVIDIA GeForce RTX 3070
  (11043 - 13579, n=7)
12616 Points -3%
Nvidia GeForce RTX 2080 Super
NVIDIA GeForce RTX 2080 Super (Desktop), R7 2700X
11477 Points -12%
Nvidia GeForce RTX 2070 Super
NVIDIA GeForce RTX 2070 Super (Desktop), R7 2700X
10094 Points -22%
Nvidia GeForce RTX 2060 Super
NVIDIA GeForce RTX 2060 Super (Desktop), R7 2700X
8795 Points -32%
AMD Radeon RX 5700 XT
AMD Radeon RX 5700 XT (Desktop), R7 2700X
8673 Points -33%
Unigine Heaven 4.0 - Extreme Preset DX11
MSI GeForce RTX 3090 Suprim X
NVIDIA GeForce RTX 3090, R9 5900X
283.5 fps +33%
Zotac Gaming GeForce RTX 3090 Trinity
NVIDIA GeForce RTX 3090, R9 3900X
272.4 (47.3min - 557.4max) fps +27%
MSI GeForce RTX 3080 Gaming X Trio
NVIDIA GeForce RTX 3080, R9 5900X
252.5 fps +18%
AMD Radeon RX 6800 XT
AMD Radeon RX 6800 XT, R9 5950X
247.9 fps +16%
AMD Ryzen 9 5900X
NVIDIA Titan RTX, R9 5900X
237.1 fps +11%
ASUS GeForce RTX 3080 ROG STRIX OC GAMING
NVIDIA GeForce RTX 3080, R9 5900X
232.6 fps +9%
KFA2 GeForce RTX 2080 Ti EX
NVIDIA GeForce RTX 2080 Ti (Desktop), R9 3900X
215.2 fps +1%
Zotac Gaming GeForce RTX 3070 Twin Edge
NVIDIA GeForce RTX 3070, R9 5950X
213.7 fps
Average NVIDIA GeForce RTX 3070
  (196.4 - 214, n=5)
206 fps -4%
MSI GeForce RTX 3070 Ventus 3X
NVIDIA GeForce RTX 3070, R9 5900X
203.2 fps -5%
MSI GeForce RTX 3070 Gaming X Trio
NVIDIA GeForce RTX 3070, R9 5900X
202.5 fps -5%
Nvidia GeForce RTX 2080 Super
NVIDIA GeForce RTX 2080 Super (Desktop), R7 2700X
175.2 fps -18%
Nvidia GeForce RTX 2070 Super
NVIDIA GeForce RTX 2070 Super (Desktop), R7 2700X
160.1 fps -25%
Nvidia GeForce RTX 2060 Super
NVIDIA GeForce RTX 2060 Super (Desktop), R7 2700X
141.7 fps -34%
AMD Radeon RX 5700 XT
AMD Radeon RX 5700 XT (Desktop), R7 2700X
132.5 fps -38%
Unigine Valley 1.0 - 1920x1080 Extreme HD DirectX AA:x8
MSI GeForce RTX 3090 Suprim X
NVIDIA GeForce RTX 3090, R9 5900X
196 fps +17%
AMD Radeon RX 6800 XT
AMD Radeon RX 6800 XT, R9 5950X
190.6 fps +13%
Zotac Gaming GeForce RTX 3090 Trinity
NVIDIA GeForce RTX 3090, R9 3900X
184.2 (47.3min - 301.5max) fps +10%
MSI GeForce RTX 3080 Gaming X Trio
NVIDIA GeForce RTX 3080, R9 5900X
181.8 fps +8%
AMD Ryzen 9 5900X
NVIDIA Titan RTX, R9 5900X
180.1 fps +7%
ASUS GeForce RTX 3080 ROG STRIX OC GAMING
NVIDIA GeForce RTX 3080, R9 5900X
176.2 fps +5%
Zotac Gaming GeForce RTX 3070 Twin Edge
NVIDIA GeForce RTX 3070, R9 5950X
168.1 fps
Average NVIDIA GeForce RTX 3070
  (155.1 - 168.5, n=5)
161.2 fps -4%
KFA2 GeForce RTX 2080 Ti EX
NVIDIA GeForce RTX 2080 Ti (Desktop), R9 3900X
159.4 fps -5%
MSI GeForce RTX 3070 Ventus 3X
NVIDIA GeForce RTX 3070, R9 5900X
157 fps -7%
MSI GeForce RTX 3070 Gaming X Trio
NVIDIA GeForce RTX 3070, R9 5900X
155.1 fps -8%
Nvidia GeForce RTX 2080 Super
NVIDIA GeForce RTX 2080 Super (Desktop), R7 2700X
120.2 fps -28%
Nvidia GeForce RTX 2070 Super
NVIDIA GeForce RTX 2070 Super (Desktop), R7 2700X
113.7 fps -32%
Nvidia GeForce RTX 2060 Super
NVIDIA GeForce RTX 2060 Super (Desktop), R7 2700X
106.9 fps -36%
AMD Radeon RX 5700 XT
AMD Radeon RX 5700 XT (Desktop), R7 2700X
106.3 fps -37%
Unigine Superposition
1280x720 720p Low
AMD Ryzen 9 5900X
NVIDIA Titan RTX, R9 5900X
40994 Points +4%
Zotac Gaming GeForce RTX 3070 Twin Edge
NVIDIA GeForce RTX 3070, R9 5950X
39277 Points
AMD Radeon RX 6800 XT
AMD Radeon RX 6800 XT, R9 5950X
36452 Points -7%
MSI GeForce RTX 3070 Ventus 3X
NVIDIA GeForce RTX 3070, R9 5900X
34602 Points -12%
Average NVIDIA GeForce RTX 3070
  (27330 - 40007, n=5)
34576 Points -12%
MSI GeForce RTX 3090 Suprim X
NVIDIA GeForce RTX 3090, R9 5900X
33329 Points -15%
MSI GeForce RTX 3080 Gaming X Trio
NVIDIA GeForce RTX 3080, R9 5900X
32183 Points -18%
MSI GeForce RTX 3070 Gaming X Trio
NVIDIA GeForce RTX 3070, R9 5900X
31666 Points -19%
ASUS GeForce RTX 3080 ROG STRIX OC GAMING
NVIDIA GeForce RTX 3080, R9 5900X
30851 Points -21%
1920x1080 1080p High
MSI GeForce RTX 3090 Suprim X
NVIDIA GeForce RTX 3090, R9 5900X
25953 Points +48%
Zotac Gaming GeForce RTX 3090 Trinity
NVIDIA GeForce RTX 3090, R9 3900X
23626 (113.62min - 236.69max) Points +35%
AMD Radeon RX 6800 XT
AMD Radeon RX 6800 XT, R9 5950X
22265 Points +27%
MSI GeForce RTX 3080 Gaming X Trio
NVIDIA GeForce RTX 3080, R9 5900X
21912 Points +25%
ASUS GeForce RTX 3080 ROG STRIX OC GAMING
NVIDIA GeForce RTX 3080, R9 5900X
21333 Points +22%
AMD Ryzen 9 5900X
NVIDIA Titan RTX, R9 5900X
20315 Points +16%
Zotac Gaming GeForce RTX 3070 Twin Edge
NVIDIA GeForce RTX 3070, R9 5950X
17491 Points
MSI GeForce RTX 3070 Gaming X Trio
NVIDIA GeForce RTX 3070, R9 5900X
17346 Points -1%
Average NVIDIA GeForce RTX 3070
  (17054 - 17491, n=5)
17312 Points -1%
MSI GeForce RTX 3070 Ventus 3X
NVIDIA GeForce RTX 3070, R9 5900X
17244 Points -1%
1920x1080 1080p Extreme
MSI GeForce RTX 3090 Suprim X
NVIDIA GeForce RTX 3090, R9 5900X
12694 Points +52%
Zotac Gaming GeForce RTX 3090 Trinity
NVIDIA GeForce RTX 3090, R9 3900X
11927 (69.49min - 121.03max) Points +43%
MSI GeForce RTX 3080 Gaming X Trio
NVIDIA GeForce RTX 3080, R9 5900X
10822 Points +30%
ASUS GeForce RTX 3080 ROG STRIX OC GAMING
NVIDIA GeForce RTX 3080, R9 5900X
10572 Points +27%
AMD Radeon RX 6800 XT
AMD Radeon RX 6800 XT, R9 5950X
10046 Points +21%
AMD Ryzen 9 5900X
NVIDIA Titan RTX, R9 5900X
9056 Points +9%
MSI GeForce RTX 3070 Gaming X Trio
NVIDIA GeForce RTX 3070, R9 5900X
8507 Points +2%
MSI GeForce RTX 3070 Ventus 3X
NVIDIA GeForce RTX 3070, R9 5900X
8365 Points 0%
Average NVIDIA GeForce RTX 3070
  (8276 - 8507, n=5)
8354 Points 0%
Zotac Gaming GeForce RTX 3070 Twin Edge
NVIDIA GeForce RTX 3070, R9 5950X
8336 Points
3840x2160 4k Optimized
MSI GeForce RTX 3090 Suprim X
NVIDIA GeForce RTX 3090, R9 5900X
16868 Points +58%
Zotac Gaming GeForce RTX 3090 Trinity
NVIDIA GeForce RTX 3090, R9 3900X
15888 (99.72min - 146.92max) Points +48%
MSI GeForce RTX 3080 Gaming X Trio
NVIDIA GeForce RTX 3080, R9 5900X
14243 Points +33%
ASUS GeForce RTX 3080 ROG STRIX OC GAMING
NVIDIA GeForce RTX 3080, R9 5900X
13984 Points +31%
AMD Radeon RX 6800 XT
AMD Radeon RX 6800 XT, R9 5950X
13471 Points +26%
AMD Ryzen 9 5900X
NVIDIA Titan RTX, R9 5900X
12186 Points +14%
MSI GeForce RTX 3070 Gaming X Trio
NVIDIA GeForce RTX 3070, R9 5900X
10755 Points 0%
Zotac Gaming GeForce RTX 3070 Twin Edge
NVIDIA GeForce RTX 3070, R9 5950X
10704 Points
MSI GeForce RTX 3070 Ventus 3X
NVIDIA GeForce RTX 3070, R9 5900X
10673 Points 0%
Average NVIDIA GeForce RTX 3070
  (10544 - 10755, n=5)
10667 Points 0%
7680x4320 8k Optimized
MSI GeForce RTX 3090 Suprim X
NVIDIA GeForce RTX 3090, R9 5900X
7521 Points +63%
Zotac Gaming GeForce RTX 3090 Trinity
NVIDIA GeForce RTX 3090, R9 3900X
6969 (43.54min - 60.14max) Points +51%
MSI GeForce RTX 3080 Gaming X Trio
NVIDIA GeForce RTX 3080, R9 5900X
6346 Points +38%
ASUS GeForce RTX 3080 ROG STRIX OC GAMING
NVIDIA GeForce RTX 3080, R9 5900X
6243 Points +36%
AMD Ryzen 9 5900X
NVIDIA Titan RTX, R9 5900X
5402 Points +17%
AMD Radeon RX 6800 XT
AMD Radeon RX 6800 XT, R9 5950X
5256 Points +14%
MSI GeForce RTX 3070 Gaming X Trio
NVIDIA GeForce RTX 3070, R9 5900X
4695 Points +2%
MSI GeForce RTX 3070 Ventus 3X
NVIDIA GeForce RTX 3070, R9 5900X
4639 Points +1%
Average NVIDIA GeForce RTX 3070
  (4587 - 4695, n=5)
4624 Points 0%
Zotac Gaming GeForce RTX 3070 Twin Edge
NVIDIA GeForce RTX 3070, R9 5950X
4602 Points
3DMark 11 Performance
36313 pontos
3DMark Fire Strike Score
29648 pontos
3DMark Fire Strike Extreme Score
15360 pontos
3DMark Time Spy Score
12696 pontos
Ajuda

Benchmarks de jogo

O Zotac RTX 3070 Twin Edge tem desempenho nas linhas previstas quando se trata de jogos. O RTX 3070 é bem adequado para jogar títulos modernos AAA a 1440p Ultra 60+ fps ou 1080p Ultra 100+ fps. O jogo 4K é o mais possível, pois vemos a maioria dos títulos atingindo as marcas de fps do final dos anos 40 e início dos anos 50. Ajustar algumas das configurações dentro do jogo deve resultar em poder jogar a 4K 60 fps sem afetar muito a fidelidade visual.

O cartão oferece 8 GB de RAM GDDR6 a bordo, o que deve ser adequado para a maioria dos jogos atuais. Embora os 16 GB de RAM no AMD Radeon RX 6800 possam parecer sedutores, não corremos para nenhum problema de limitação de VRAM com o RTX 3070 enquanto jogávamos nosso conjunto de jogos

O RTX 3070 Twin Edge administra em média cerca de 123 fps em O Witcher 3 1080p Ultra pré-definido. Este valor cai um pouco ocasionalmente, mas o cartão consegue oferecer um desempenho bastante consistente ao longo do tempo e nunca vai abaixo de 120 fps. Isto indica que a configuração de resfriamento do cartão está fazendo bem o seu trabalho para evitar qualquer estrangulamento

0102030405060708090100110120Tooltip
Zotac Gaming GeForce RTX 3070 Twin Edge NVIDIA GeForce RTX 3070, R9 5950X: Ø123.2 (120-126)
The Witcher 3
1920x1080 Ultra Graphics & Postprocessing (HBAO+)
MSI GeForce RTX 3090 Suprim X
AMD Ryzen 9 5900X, NVIDIA GeForce RTX 3090
160 (140min - 184max) fps +30%
AMD Radeon RX 6800 XT
AMD Ryzen 9 5950X, AMD Radeon RX 6800 XT
160 (138min - 179max) fps +30%
ASUS GeForce RTX 3080 ROG STRIX OC GAMING
AMD Ryzen 9 5900X, NVIDIA GeForce RTX 3080
152 (138min - 171max) fps +24%
MSI GeForce RTX 3080 Gaming X Trio
AMD Ryzen 9 5900X, NVIDIA GeForce RTX 3080
145 (123min - 154max) fps +18%
KFA2 GeForce RTX 2080 Ti EX
AMD Ryzen 9 3900X, NVIDIA GeForce RTX 2080 Ti (Desktop)
135 (118min - 158max) fps +10%
Zotac Gaming GeForce RTX 3070 Twin Edge
AMD Ryzen 9 5950X, NVIDIA GeForce RTX 3070
123 (120min, 121P1 - 126max) fps
MSI GeForce RTX 3070 Gaming X Trio
AMD Ryzen 9 5900X, NVIDIA GeForce RTX 3070
122 (110min - 138max) fps -1%
MSI GeForce RTX 3070 Ventus 3X
AMD Ryzen 9 5900X, NVIDIA GeForce RTX 3070
121 (112min - 134max) fps -2%
Nvidia GeForce RTX 2080 Super
AMD Ryzen 7 2700X, NVIDIA GeForce RTX 2080 Super (Desktop)
109 (81min - 123max) fps -11%
Average NVIDIA GeForce RTX 3070
  (52.8 - 132.2, n=7)
106.1 fps -14%
Nvidia GeForce RTX 2070 Super
AMD Ryzen 7 2700X, NVIDIA GeForce RTX 2070 Super (Desktop)
97 (83min - 109max) fps -21%
AMD Radeon RX 5700 XT
AMD Ryzen 7 2700X, AMD Radeon RX 5700 XT (Desktop)
92 (79min - 99max) fps -25%
Nvidia GeForce RTX 2060 Super
AMD Ryzen 7 2700X, NVIDIA GeForce RTX 2060 Super (Desktop)
79 (67min - 89max) fps -36%
3840x2160 High Graphics & Postprocessing (Nvidia HairWorks Off)
MSI GeForce RTX 3090 Suprim X
AMD Ryzen 9 5900X, NVIDIA GeForce RTX 3090
128 (117min - 138max) fps +43%
ASUS GeForce RTX 3080 ROG STRIX OC GAMING
AMD Ryzen 9 5900X, NVIDIA GeForce RTX 3080
115 (107min - 124max) fps +28%
MSI GeForce RTX 3080 Gaming X Trio
AMD Ryzen 9 5900X, NVIDIA GeForce RTX 3080
114 (106min - 122max) fps +27%
AMD Radeon RX 6800 XT
AMD Ryzen 9 5950X, AMD Radeon RX 6800 XT
110 (97min - 117max) fps +23%
KFA2 GeForce RTX 2080 Ti EX
AMD Ryzen 9 3900X, NVIDIA GeForce RTX 2080 Ti (Desktop)
96 (87min - 109max) fps +7%
MSI GeForce RTX 3070 Ventus 3X
AMD Ryzen 9 5900X, NVIDIA GeForce RTX 3070
90.9 (84min - 101max) fps +1%
Zotac Gaming GeForce RTX 3070 Twin Edge
AMD Ryzen 9 5950X, NVIDIA GeForce RTX 3070
89.6 (81min, 81P1 - 96max) fps
Average NVIDIA GeForce RTX 3070
  (84 - 93.9, n=5)
89.3 fps 0%
MSI GeForce RTX 3070 Gaming X Trio
AMD Ryzen 9 5900X, NVIDIA GeForce RTX 3070
88.2 (82min - 97max) fps -2%
Nvidia GeForce RTX 2080 Super
AMD Ryzen 7 2700X, NVIDIA GeForce RTX 2080 Super (Desktop)
79 (71min - 87max) fps -12%
Nvidia GeForce RTX 2070 Super
AMD Ryzen 7 2700X, NVIDIA GeForce RTX 2070 Super (Desktop)
68 (61min - 74max) fps -24%
Nvidia GeForce RTX 2060 Super
AMD Ryzen 7 2700X, NVIDIA GeForce RTX 2060 Super (Desktop)
57 (51min - 62max) fps -36%
AMD Radeon RX 5700 XT
AMD Ryzen 7 2700X, AMD Radeon RX 5700 XT (Desktop)
52.1 (47min - 57max) fps -42%
3840x2160 Ultra Graphics & Postprocessing (HBAO+)
MSI GeForce RTX 3080 Gaming X Trio
AMD Ryzen 9 5900X, NVIDIA GeForce RTX 3080
85.7 (80min - 93max) fps +45%
MSI GeForce RTX 3090 Suprim X
AMD Ryzen 9 5900X, NVIDIA GeForce RTX 3090
85.4 (79min - 92max) fps +45%
ASUS GeForce RTX 3080 ROG STRIX OC GAMING
AMD Ryzen 9 5900X, NVIDIA GeForce RTX 3080
78 (72min - 83max) fps +32%
KFA2 GeForce RTX 2080 Ti EX
AMD Ryzen 9 3900X, NVIDIA GeForce RTX 2080 Ti (Desktop)
65 (59min - 71max) fps +10%
MSI GeForce RTX 3070 Ventus 3X
AMD Ryzen 9 5900X, NVIDIA GeForce RTX 3070
60.3 (55min - 67max) fps +2%
Average NVIDIA GeForce RTX 3070
  (59 - 60.3, n=2)
59.7 fps +1%
Zotac Gaming GeForce RTX 3070 Twin Edge
AMD Ryzen 9 5950X, NVIDIA GeForce RTX 3070
59 (53min, 53.59P1 - 64max) fps
Nvidia GeForce RTX 2080 Super
AMD Ryzen 7 2700X, NVIDIA GeForce RTX 2080 Super (Desktop)
55.2 (49min - 61max) fps -6%
Nvidia GeForce RTX 2070 Super
AMD Ryzen 7 2700X, NVIDIA GeForce RTX 2070 Super (Desktop)
46.3 (41min - 50max) fps -22%
AMD Radeon RX 5700 XT
AMD Ryzen 7 2700X, AMD Radeon RX 5700 XT (Desktop)
39.7 (35min - 43max) fps -33%
Nvidia GeForce RTX 2060 Super
AMD Ryzen 7 2700X, NVIDIA GeForce RTX 2060 Super (Desktop)
38.4 (32min - 42max) fps -35%
Shadow of the Tomb Raider
1920x1080 Highest Preset AA:T
AMD Radeon RX 6800 XT
AMD Ryzen 9 5950X, AMD Radeon RX 6800 XT
194 fps +29%
MSI GeForce RTX 3090 Suprim X
AMD Ryzen 9 5900X, NVIDIA GeForce RTX 3090
188 fps +25%
ASUS GeForce RTX 3080 ROG STRIX OC GAMING
AMD Ryzen 9 5900X, NVIDIA GeForce RTX 3080
185 fps +23%
MSI GeForce RTX 3080 Gaming X Trio
AMD Ryzen 9 5900X, NVIDIA GeForce RTX 3080
177 fps +18%
MSI GeForce RTX 3070 Ventus 3X
AMD Ryzen 9 5900X, NVIDIA GeForce RTX 3070
160 fps +7%
Average NVIDIA GeForce RTX 3070
  (138 - 160, n=4)
151.3 fps +1%
Zotac Gaming GeForce RTX 3070 Twin Edge
AMD Ryzen 9 5950X, NVIDIA GeForce RTX 3070
150 fps
Zotac Gaming GeForce RTX 3090 Trinity
AMD Ryzen 9 3900X, NVIDIA GeForce RTX 3090
145 fps -3%
Zotac Gaming GeForce RTX 3090 Trinity
AMD Ryzen 9 3900X, NVIDIA GeForce RTX 3090
145 fps -3%
Zotac Gaming GeForce RTX 3090 Trinity
AMD Ryzen 9 3900X, NVIDIA GeForce RTX 3090
145 fps -3%
MSI GeForce RTX 3070 Gaming X Trio
AMD Ryzen 9 5900X, NVIDIA GeForce RTX 3070
138 fps -8%
KFA2 GeForce RTX 2080 Ti EX
AMD Ryzen 9 3900X, NVIDIA GeForce RTX 2080 Ti (Desktop)
130 fps -13%
Nvidia GeForce RTX 2080 Super
AMD Ryzen 7 2700X, NVIDIA GeForce RTX 2080 Super (Desktop)
110 fps -27%
AMD Radeon RX 5700 XT
AMD Ryzen 7 2700X, AMD Radeon RX 5700 XT (Desktop)
110 fps -27%
Nvidia GeForce RTX 2070 Super
AMD Ryzen 7 2700X, NVIDIA GeForce RTX 2070 Super (Desktop)
104 fps -31%
Nvidia GeForce RTX 2060 Super
AMD Ryzen 7 2700X, NVIDIA GeForce RTX 2060 Super (Desktop)
96 fps -36%
2560x1440 Highest Preset AA:T
MSI GeForce RTX 3090 Suprim X
AMD Ryzen 9 5900X, NVIDIA GeForce RTX 3090
162 fps +42%
MSI GeForce RTX 3080 Gaming X Trio
AMD Ryzen 9 5900X, NVIDIA GeForce RTX 3080
152 fps +33%
AMD Radeon RX 6800 XT
AMD Ryzen 9 5950X, AMD Radeon RX 6800 XT
148 fps +30%
ASUS GeForce RTX 3080 ROG STRIX OC GAMING
AMD Ryzen 9 5900X, NVIDIA GeForce RTX 3080
147 fps +29%
Zotac Gaming GeForce RTX 3090 Trinity
AMD Ryzen 9 3900X, NVIDIA GeForce RTX 3090
137 fps +20%
MSI GeForce RTX 3070 Ventus 3X
AMD Ryzen 9 5900X, NVIDIA GeForce RTX 3070
116 fps +2%
Zotac Gaming GeForce RTX 3070 Twin Edge
AMD Ryzen 9 5950X, NVIDIA GeForce RTX 3070
114 fps
Average NVIDIA GeForce RTX 3070
  (108 - 116, n=4)
113.2 fps -1%
KFA2 GeForce RTX 2080 Ti EX
AMD Ryzen 9 3900X, NVIDIA GeForce RTX 2080 Ti (Desktop)
108 fps -5%
MSI GeForce RTX 3070 Gaming X Trio
AMD Ryzen 9 5900X, NVIDIA GeForce RTX 3070
108 fps -5%
Nvidia GeForce RTX 2080 Super
AMD Ryzen 7 2700X, NVIDIA GeForce RTX 2080 Super (Desktop)
91 fps -20%
Nvidia GeForce RTX 2070 Super
AMD Ryzen 7 2700X, NVIDIA GeForce RTX 2070 Super (Desktop)
81 fps -29%
AMD Radeon RX 5700 XT
AMD Ryzen 7 2700X, AMD Radeon RX 5700 XT (Desktop)
76 fps -33%
Nvidia GeForce RTX 2060 Super
AMD Ryzen 7 2700X, NVIDIA GeForce RTX 2060 Super (Desktop)
69 fps -39%
3840x2160 Highest Preset AA:T
MSI GeForce RTX 3090 Suprim X
AMD Ryzen 9 5900X, NVIDIA GeForce RTX 3090
95.6 fps +54%
Zotac Gaming GeForce RTX 3090 Trinity
AMD Ryzen 9 3900X, NVIDIA GeForce RTX 3090
89.3 fps +44%
MSI GeForce RTX 3080 Gaming X Trio
AMD Ryzen 9 5900X, NVIDIA GeForce RTX 3080
87.9 fps +42%
ASUS GeForce RTX 3080 ROG STRIX OC GAMING
AMD Ryzen 9 5900X, NVIDIA GeForce RTX 3080
83.9 fps +35%
AMD Radeon RX 6800 XT
AMD Ryzen 9 5950X, AMD Radeon RX 6800 XT
79.6 fps +28%
MSI GeForce RTX 3070 Ventus 3X
AMD Ryzen 9 5900X, NVIDIA GeForce RTX 3070
63.5 fps +2%
Average NVIDIA GeForce RTX 3070
  (61 - 63.5, n=4)
62.3 fps 0%
Zotac Gaming GeForce RTX 3070 Twin Edge
AMD Ryzen 9 5950X, NVIDIA GeForce RTX 3070
62 fps
MSI GeForce RTX 3070 Gaming X Trio
AMD Ryzen 9 5900X, NVIDIA GeForce RTX 3070
61 fps -2%
KFA2 GeForce RTX 2080 Ti EX
AMD Ryzen 9 3900X, NVIDIA GeForce RTX 2080 Ti (Desktop)
60 fps -3%
Nvidia GeForce RTX 2080 Super
AMD Ryzen 7 2700X, NVIDIA GeForce RTX 2080 Super (Desktop)
49 fps -21%
Nvidia GeForce RTX 2070 Super
AMD Ryzen 7 2700X, NVIDIA GeForce RTX 2070 Super (Desktop)
43 fps -31%
AMD Radeon RX 5700 XT
AMD Ryzen 7 2700X, AMD Radeon RX 5700 XT (Desktop)
38 fps -39%
Nvidia GeForce RTX 2060 Super
AMD Ryzen 7 2700X, NVIDIA GeForce RTX 2060 Super (Desktop)
36 fps -42%
Borderlands 3
2560x1440 Badass Overall Quality (DX11)
MSI GeForce RTX 3090 Suprim X
AMD Ryzen 9 5900X, NVIDIA GeForce RTX 3090
117 fps +48%
Zotac Gaming GeForce RTX 3090 Trinity
AMD Ryzen 9 3900X, NVIDIA GeForce RTX 3090
109 fps +38%
ASUS GeForce RTX 3080 ROG STRIX OC GAMING
AMD Ryzen 9 5900X, NVIDIA GeForce RTX 3080
103 fps +30%
MSI GeForce RTX 3080 Gaming X Trio
AMD Ryzen 9 5900X, NVIDIA GeForce RTX 3080
95.7 fps +21%
AMD Radeon RX 6800 XT
AMD Ryzen 9 5950X, AMD Radeon RX 6800 XT
93.6 fps +18%
Zotac Gaming GeForce RTX 3070 Twin Edge
AMD Ryzen 9 5950X, NVIDIA GeForce RTX 3070
79 fps
KFA2 GeForce RTX 2080 Ti EX
AMD Ryzen 9 3900X, NVIDIA GeForce RTX 2080 Ti (Desktop)
78 fps -1%
Average NVIDIA GeForce RTX 3070
  (75.1 - 82.9, n=5)
77.7 fps -2%
MSI GeForce RTX 3070 Gaming X Trio
AMD Ryzen 9 5900X, NVIDIA GeForce RTX 3070
75.9 fps -4%
MSI GeForce RTX 3070 Ventus 3X
AMD Ryzen 9 5900X, NVIDIA GeForce RTX 3070
75.1 fps -5%
3840x2160 Badass Overall Quality (DX11)
MSI GeForce RTX 3090 Suprim X
AMD Ryzen 9 5900X, NVIDIA GeForce RTX 3090
73.4 fps +65%
Zotac Gaming GeForce RTX 3090 Trinity
AMD Ryzen 9 3900X, NVIDIA GeForce RTX 3090
71.5 fps +61%
MSI GeForce RTX 3080 Gaming X Trio
AMD Ryzen 9 5900X, NVIDIA GeForce RTX 3080
61.9 fps +39%
ASUS GeForce RTX 3080 ROG STRIX OC GAMING
AMD Ryzen 9 5900X, NVIDIA GeForce RTX 3080
61.5 fps +38%
AMD Radeon RX 6800 XT
AMD Ryzen 9 5950X, AMD Radeon RX 6800 XT
53.6 fps +20%
Zotac Gaming GeForce RTX 3070 Twin Edge
AMD Ryzen 9 5950X, NVIDIA GeForce RTX 3070
44.5 fps
Average NVIDIA GeForce RTX 3070
  (42.7 - 46.3, n=5)
44.3 fps 0%
MSI GeForce RTX 3070 Gaming X Trio
AMD Ryzen 9 5900X, NVIDIA GeForce RTX 3070
44.2 fps -1%
MSI GeForce RTX 3070 Ventus 3X
AMD Ryzen 9 5900X, NVIDIA GeForce RTX 3070
43.8 fps -2%
KFA2 GeForce RTX 2080 Ti EX
AMD Ryzen 9 3900X, NVIDIA GeForce RTX 2080 Ti (Desktop)
43.6 fps -2%
1920x1080 Badass Overall Quality (DX11)
MSI GeForce RTX 3090 Suprim X
AMD Ryzen 9 5900X, NVIDIA GeForce RTX 3090
135 fps +30%
ASUS GeForce RTX 3080 ROG STRIX OC GAMING
AMD Ryzen 9 5900X, NVIDIA GeForce RTX 3080
128 fps +23%
AMD Radeon RX 6800 XT
AMD Ryzen 9 5950X, AMD Radeon RX 6800 XT
120 fps +15%
Zotac Gaming GeForce RTX 3090 Trinity
AMD Ryzen 9 3900X, NVIDIA GeForce RTX 3090
117 fps +13%
MSI GeForce RTX 3080 Gaming X Trio
AMD Ryzen 9 5900X, NVIDIA GeForce RTX 3080
117 fps +13%
Zotac Gaming GeForce RTX 3070 Twin Edge
AMD Ryzen 9 5950X, NVIDIA GeForce RTX 3070
104 fps
KFA2 GeForce RTX 2080 Ti EX
AMD Ryzen 9 3900X, NVIDIA GeForce RTX 2080 Ti (Desktop)
101.3 fps -3%
Average NVIDIA GeForce RTX 3070
  (95.3 - 108.9, n=5)
100.6 fps -3%
MSI GeForce RTX 3070 Gaming X Trio
AMD Ryzen 9 5900X, NVIDIA GeForce RTX 3070
95.8 fps -8%
MSI GeForce RTX 3070 Ventus 3X
AMD Ryzen 9 5900X, NVIDIA GeForce RTX 3070
95.3 fps -8%
Call of Duty Black Ops Cold War
1920x1080 Highest Settings
MSI GeForce RTX 3090 Suprim X
AMD Ryzen 9 5900X, NVIDIA GeForce RTX 3090
161 (59.8min, 96.1P0.1, 111P1 - 312max) fps +34%
AMD Radeon RX 6800 XT
AMD Ryzen 9 5950X, AMD Radeon RX 6800 XT
144 (58.7min, 90.7P0.1, 105P1 - 365max) fps +20%
MSI GeForce RTX 3080 Gaming X Trio
AMD Ryzen 9 5900X, NVIDIA GeForce RTX 3080
127 (21.9min, 24.4P0.1, 83.5P1 - 285max) fps +6%
MSI GeForce RTX 3070 Gaming X Trio
AMD Ryzen 9 5900X, NVIDIA GeForce RTX 3070
122 (45min, 57.3P0.1, 67.9P1 - 301max) fps +2%
Zotac Gaming GeForce RTX 3070 Twin Edge
AMD Ryzen 9 5950X, NVIDIA GeForce RTX 3070
120 (49.7min, 76.4P0.1, 85.7P1 - 245max) fps
Average NVIDIA GeForce RTX 3070
  (95.7 - 122, n=3)
112.6 fps -6%
MSI GeForce RTX 3070 Ventus 3X
AMD Ryzen 9 5900X, NVIDIA GeForce RTX 3070
95.7 (21.6min, 37.6P0.1, 58P1 - 166max) fps -20%
2560x1440 Highest Settings
MSI GeForce RTX 3090 Suprim X
AMD Ryzen 9 5900X, NVIDIA GeForce RTX 3090
122 (54.5min, 84.4P0.1, 93.9P1 - 258max) fps +36%
MSI GeForce RTX 3070 Gaming X Trio
AMD Ryzen 9 5900X, NVIDIA GeForce RTX 3070
107 (43.6min, 54P0.1, 62.7P1 - 272max) fps +20%
MSI GeForce RTX 3080 Gaming X Trio
AMD Ryzen 9 5900X, NVIDIA GeForce RTX 3080
104 (19.1min, 20.4P0.1, 77.7P1 - 258max) fps +16%
Average NVIDIA GeForce RTX 3070
  (83 - 107, n=3)
93.2 fps +4%
Zotac Gaming GeForce RTX 3070 Twin Edge
AMD Ryzen 9 5950X, NVIDIA GeForce RTX 3070
89.5 (40.5min, 65.1P0.1, 70.3P1 - 219max) fps
MSI GeForce RTX 3070 Ventus 3X
AMD Ryzen 9 5900X, NVIDIA GeForce RTX 3070
83 (22.7min, 30P0.1, 52.1P1 - 158max) fps -7%
AMD Radeon RX 6800 XT
AMD Ryzen 9 5950X, AMD Radeon RX 6800 XT
80.4 (16.5min, 31.8P0.1, 64.3P1 - 285max) fps -10%
3840x2160 Highest Settings
MSI GeForce RTX 3090 Suprim X
AMD Ryzen 9 5900X, NVIDIA GeForce RTX 3090
76.1 (42.1min, 58.7P0.1, 61.9P1 - 221max) fps +74%
MSI GeForce RTX 3070 Gaming X Trio
AMD Ryzen 9 5900X, NVIDIA GeForce RTX 3070
74 (32.6min, 43.5P0.1, 50.6P1 - 270max) fps +69%
MSI GeForce RTX 3080 Gaming X Trio
AMD Ryzen 9 5900X, NVIDIA GeForce RTX 3080
65.6 (13.8min, 17.5P0.1, 51.4P1 - 229max) fps +50%
AMD Radeon RX 6800 XT
AMD Ryzen 9 5950X, AMD Radeon RX 6800 XT
64 (10.8min, 11.6P0.1, 50.8P1 - 159max) fps +46%
Average NVIDIA GeForce RTX 3070
  (43.8 - 74, n=3)
56 fps +28%
MSI GeForce RTX 3070 Ventus 3X
AMD Ryzen 9 5900X, NVIDIA GeForce RTX 3070
50.2 (16.1min, 25.6P0.1, 36.1P1 - 146max) fps +15%
Zotac Gaming GeForce RTX 3070 Twin Edge
AMD Ryzen 9 5950X, NVIDIA GeForce RTX 3070
43.8 (16.7min, 17.4P0.1, 33.8P1 - 80.3max) fps
1920x1080 Highest Settings + Ultra Ray Tracing
MSI GeForce RTX 3090 Suprim X
AMD Ryzen 9 5900X, NVIDIA GeForce RTX 3090
88.3 (22.4min, 29.5P0.1, 44.8P1 - 267max) fps +26%
MSI GeForce RTX 3080 Gaming X Trio
AMD Ryzen 9 5900X, NVIDIA GeForce RTX 3080
81.9 (17.3min, 30.1P0.1, 42.6P1 - 248max) fps +17%
Zotac Gaming GeForce RTX 3070 Twin Edge
AMD Ryzen 9 5950X, NVIDIA GeForce RTX 3070
70.1 (23.8min, 27.5P0.1, 42.6P1 - 217max) fps
MSI GeForce RTX 3070 Gaming X Trio
AMD Ryzen 9 5900X, NVIDIA GeForce RTX 3070
68.5 (19.1min, 22.3P0.1, 30.4P1 - 229max) fps -2%
Average NVIDIA GeForce RTX 3070
  (49.8 - 70.1, n=3)
62.8 fps -10%
MSI GeForce RTX 3070 Ventus 3X
AMD Ryzen 9 5900X, NVIDIA GeForce RTX 3070
49.8 (8.39min, 9.64P0.1, 25.1P1 - 146max) fps -29%
AMD Radeon RX 6800 XT
AMD Ryzen 9 5950X, AMD Radeon RX 6800 XT
21.8 (8.8min, 9.61P0.1, 16.2P1 - 49.5max) fps -69%
Watch Dogs Legion
1920x1080 Ultra Preset + Ultra Ray Tracing (DX12)
MSI GeForce RTX 3090 Suprim X
AMD Ryzen 9 5900X, NVIDIA GeForce RTX 3090
78.2 (53.58min, 63.39P1 - 115.63max) fps +51%
AMD Radeon RX 6800 XT
AMD Ryzen 9 5950X, AMD Radeon RX 6800 XT
71.4 (47.71min, 55.63P1 - 113.42max) fps +38%
MSI GeForce RTX 3080 Gaming X Trio
AMD Ryzen 9 5900X, NVIDIA GeForce RTX 3080
71.3 (24.22min, 56.02P1 - 112.08max) fps +38%
ASUS GeForce RTX 3080 ROG STRIX OC GAMING
AMD Ryzen 9 5900X, NVIDIA GeForce RTX 3080
70.9 (37.64min, 58.05P1 - 113.63max) fps +37%
Average NVIDIA GeForce RTX 3070
  (51.7 - 61, n=4)
55.1 fps +7%
MSI GeForce RTX 3070 Gaming X Trio
AMD Ryzen 9 5900X, NVIDIA GeForce RTX 3070
54.3 (18.74min, 40.53P1 - 81.06max) fps +5%
MSI GeForce RTX 3070 Ventus 3X
AMD Ryzen 9 5900X, NVIDIA GeForce RTX 3070
53.2 (13.35min, 28.3P1 - 83.71max) fps +3%
Zotac Gaming GeForce RTX 3070 Twin Edge
AMD Ryzen 9 5950X, NVIDIA GeForce RTX 3070
51.7 (15.03min, 25.28P1 - 71.97max) fps
3840x2160 Ultra Preset (DX12)
MSI GeForce RTX 3090 Suprim X
AMD Ryzen 9 5900X, NVIDIA GeForce RTX 3090
60.3 (34.68min, 51.05P1 - 78.14max) fps +55%
ASUS GeForce RTX 3080 ROG STRIX OC GAMING
AMD Ryzen 9 5900X, NVIDIA GeForce RTX 3080
54.1 (24.72min, 44.97P1 - 114.7max) fps +39%
MSI GeForce RTX 3080 Gaming X Trio
AMD Ryzen 9 5900X, NVIDIA GeForce RTX 3080
53.5 (33.98min, 42.85P1 - 79.6max) fps +38%
AMD Radeon RX 6800 XT
AMD Ryzen 9 5950X, AMD Radeon RX 6800 XT
49.3 (32.85min, 41.54P1 - 76.12max) fps +27%
MSI GeForce RTX 3070 Ventus 3X
AMD Ryzen 9 5900X, NVIDIA GeForce RTX 3070
39.2 (17.54min, 27.54P1 - 81.17max) fps +1%
Zotac Gaming GeForce RTX 3070 Twin Edge
AMD Ryzen 9 5950X, NVIDIA GeForce RTX 3070
38.9 (22.74min, 31.31P1 - 54.01max) fps
Average NVIDIA GeForce RTX 3070
  (37 - 39.2, n=4)
38 fps -2%
MSI GeForce RTX 3070 Gaming X Trio
AMD Ryzen 9 5900X, NVIDIA GeForce RTX 3070
37 (17.44min, 25.32P1 - 81.3max) fps -5%
2560x1440 Ultra Preset (DX12)
MSI GeForce RTX 3090 Suprim X
AMD Ryzen 9 5900X, NVIDIA GeForce RTX 3090
89.7 (59.87min, 73.02P1 - 132.92max) fps +37%
AMD Radeon RX 6800 XT
AMD Ryzen 9 5950X, AMD Radeon RX 6800 XT
84.5 (58.88min, 69.45P1 - 137.16max) fps +29%
ASUS GeForce RTX 3080 ROG STRIX OC GAMING
AMD Ryzen 9 5900X, NVIDIA GeForce RTX 3080
81.6 (44.31min, 65.35P1 - 139.28max) fps +25%
MSI GeForce RTX 3080 Gaming X Trio
AMD Ryzen 9 5900X, NVIDIA GeForce RTX 3080
81.1 (46.24min, 61.45P1 - 140.66max) fps +24%
MSI GeForce RTX 3070 Ventus 3X
AMD Ryzen 9 5900X, NVIDIA GeForce RTX 3070
66.3 (41min, 50.81P1 - 116.42max) fps +2%
Average NVIDIA GeForce RTX 3070
  (65.3 - 67, n=4)
66.1 fps +1%
MSI GeForce RTX 3070 Gaming X Trio
AMD Ryzen 9 5900X, NVIDIA GeForce RTX 3070
65.7 (25.01min, 51.86P1 - 96.9max) fps +1%
Zotac Gaming GeForce RTX 3070 Twin Edge
AMD Ryzen 9 5950X, NVIDIA GeForce RTX 3070
65.3 (41.29min, 53.17P1 - 88.97max) fps
1920x1080 Ultra Preset (DX12)
AMD Radeon RX 6800 XT
AMD Ryzen 9 5950X, AMD Radeon RX 6800 XT
112 (75.12min, 87.97P1 - 181.69max) fps +32%
ASUS GeForce RTX 3080 ROG STRIX OC GAMING
AMD Ryzen 9 5900X, NVIDIA GeForce RTX 3080
103 (55.63min, 83.65P1 - 156.57max) fps +21%
MSI GeForce RTX 3090 Suprim X
AMD Ryzen 9 5900X, NVIDIA GeForce RTX 3090
103 (30.26min, 75.96P1 - 155.81max) fps +21%
MSI GeForce RTX 3080 Gaming X Trio
AMD Ryzen 9 5900X, NVIDIA GeForce RTX 3080
99.3 (13.98min, 73.29P1 - 167.32max) fps +17%
MSI GeForce RTX 3070 Ventus 3X
AMD Ryzen 9 5900X, NVIDIA GeForce RTX 3070
86 (37.65min, 66.32P1 - 130.48max) fps +1%
Zotac Gaming GeForce RTX 3070 Twin Edge
AMD Ryzen 9 5950X, NVIDIA GeForce RTX 3070
84.9 (55.86min, 67.74P1 - 127.49max) fps
Average NVIDIA GeForce RTX 3070
  (79 - 89, n=4)
84.7 fps 0%
MSI GeForce RTX 3070 Gaming X Trio
AMD Ryzen 9 5900X, NVIDIA GeForce RTX 3070
79 (42.91min, 56.59P1 - 121.27max) fps -7%
Metro Exodus
1920x1080 Ultra Quality DXR AF:16x
MSI GeForce RTX 3090 Suprim X
AMD Ryzen 9 5900X, NVIDIA GeForce RTX 3090
116 (59.68min - 166.06max) fps +41%
MSI GeForce RTX 3080 Gaming X Trio
AMD Ryzen 9 5900X, NVIDIA GeForce RTX 3080
102 (54.36min - 150.53max) fps +24%
ASUS GeForce RTX 3080 ROG STRIX OC GAMING
AMD Ryzen 9 5900X, NVIDIA GeForce RTX 3080
91.5 (51.03min - 134.52max) fps +11%
Zotac Gaming GeForce RTX 3090 Trinity
AMD Ryzen 9 3900X, NVIDIA GeForce RTX 3090
87.8 (55.41min - 116.04max) fps +7%
AMD Radeon RX 6800 XT
AMD Ryzen 9 5950X, AMD Radeon RX 6800 XT
85.5 (52.71min - 120.38max) fps +4%
Zotac Gaming GeForce RTX 3070 Twin Edge
AMD Ryzen 9 5950X, NVIDIA GeForce RTX 3070
82.1 (47.4min - 134.03max) fps
Average NVIDIA GeForce RTX 3070
  (80.4 - 83, n=5)
81.6 fps -1%
MSI GeForce RTX 3070 Gaming X Trio
AMD Ryzen 9 5900X, NVIDIA GeForce RTX 3070
80.4 (43.5min - 124.3max) fps -2%
MSI GeForce RTX 3070 Ventus 3X
AMD Ryzen 9 5900X, NVIDIA GeForce RTX 3070
80.4 (44.72min - 124.72max) fps -2%
KFA2 GeForce RTX 2080 Ti EX
AMD Ryzen 9 3900X, NVIDIA GeForce RTX 2080 Ti (Desktop)
78.6 (43min - 115max) fps -4%
Nvidia GeForce RTX 2080 Super
AMD Ryzen 7 2700X, NVIDIA GeForce RTX 2080 Super (Desktop)
65 (37.62min - 97.62max) fps -21%
Nvidia GeForce RTX 2070 Super
AMD Ryzen 7 2700X, NVIDIA GeForce RTX 2070 Super (Desktop)
57.5 (34min - 85max) fps -30%
Nvidia GeForce RTX 2060 Super
AMD Ryzen 7 2700X, NVIDIA GeForce RTX 2060 Super (Desktop)
50.1 (30min - 72max) fps -39%
3840x2160 Ultra Quality AF:16x
MSI GeForce RTX 3090 Suprim X
AMD Ryzen 9 5900X, NVIDIA GeForce RTX 3090
76.3 (45.25min - 131.44max) fps +58%
Zotac Gaming GeForce RTX 3090 Trinity
AMD Ryzen 9 3900X, NVIDIA GeForce RTX 3090
71.7 (40.9min - 110.8max) fps +48%
MSI GeForce RTX 3080 Gaming X Trio
AMD Ryzen 9 5900X, NVIDIA GeForce RTX 3080
65.9 (38.48min - 122.03max) fps +36%
ASUS GeForce RTX 3080 ROG STRIX OC GAMING
AMD Ryzen 9 5900X, NVIDIA GeForce RTX 3080
64.1 (36.54min - 108.57max) fps +33%
AMD Radeon RX 6800 XT
AMD Ryzen 9 5950X, AMD Radeon RX 6800 XT
56.3 (40.14min - 64.28max) fps +17%
MSI GeForce RTX 3070 Gaming X Trio
AMD Ryzen 9 5900X, NVIDIA GeForce RTX 3070
49.1 (30.24min - 89.89max) fps +2%
Average NVIDIA GeForce RTX 3070
  (48.3 - 49.7, n=5)
48.9 fps +1%
MSI GeForce RTX 3070 Ventus 3X
AMD Ryzen 9 5900X, NVIDIA GeForce RTX 3070
48.6 (29.82min - 99.64max) fps +1%
Zotac Gaming GeForce RTX 3070 Twin Edge
AMD Ryzen 9 5950X, NVIDIA GeForce RTX 3070
48.3 (29.65min - 105.2max) fps
KFA2 GeForce RTX 2080 Ti EX
AMD Ryzen 9 3900X, NVIDIA GeForce RTX 2080 Ti (Desktop)
47.5 (31min - 69max) fps -2%
Nvidia GeForce RTX 2080 Super
AMD Ryzen 7 2700X, NVIDIA GeForce RTX 2080 Super (Desktop)
40 (25.84min - 59.35max) fps -17%
Nvidia GeForce RTX 2070 Super
AMD Ryzen 7 2700X, NVIDIA GeForce RTX 2070 Super (Desktop)
35 (23min - 51max) fps -28%
Nvidia GeForce RTX 2060 Super
AMD Ryzen 7 2700X, NVIDIA GeForce RTX 2060 Super (Desktop)
29.7 (20min - 42max) fps -39%
AMD Radeon RX 5700 XT
AMD Ryzen 7 2700X, AMD Radeon RX 5700 XT (Desktop)
29.6 (20.7min - 36.64max) fps -39%
2560x1440 Ultra Quality AF:16x
MSI GeForce RTX 3090 Suprim X
AMD Ryzen 9 5900X, NVIDIA GeForce RTX 3090
112 (58.69min - 182.42max) fps +49%
Zotac Gaming GeForce RTX 3090 Trinity
AMD Ryzen 9 3900X, NVIDIA GeForce RTX 3090
102 (61.16min - 146.03max) fps +35%
MSI GeForce RTX 3080 Gaming X Trio
AMD Ryzen 9 5900X, NVIDIA GeForce RTX 3080
97.4 (51.56min - 162.47max) fps +29%
AMD Radeon RX 6800 XT
AMD Ryzen 9 5950X, AMD Radeon RX 6800 XT
94.6 (55.44min - 143.68max) fps +25%
ASUS GeForce RTX 3080 ROG STRIX OC GAMING
AMD Ryzen 9 5900X, NVIDIA GeForce RTX 3080
92.2 (46.62min - 155.93max) fps +22%
Average NVIDIA GeForce RTX 3070
  (74.4 - 78.3, n=5)
75.8 fps +1%
Zotac Gaming GeForce RTX 3070 Twin Edge
AMD Ryzen 9 5950X, NVIDIA GeForce RTX 3070
75.4 (39.91min - 127.26max) fps
MSI GeForce RTX 3070 Ventus 3X
AMD Ryzen 9 5900X, NVIDIA GeForce RTX 3070
74.8 (41.41min - 120.5max) fps -1%
MSI GeForce RTX 3070 Gaming X Trio
AMD Ryzen 9 5900X, NVIDIA GeForce RTX 3070
74.4 (38.95min - 129.85max) fps -1%
KFA2 GeForce RTX 2080 Ti EX
AMD Ryzen 9 3900X, NVIDIA GeForce RTX 2080 Ti (Desktop)
71.9 (40min - 108max) fps -5%
Nvidia GeForce RTX 2080 Super
AMD Ryzen 7 2700X, NVIDIA GeForce RTX 2080 Super (Desktop)
61 (35.51min - 95.82max) fps -19%
AMD Radeon RX 5700 XT
AMD Ryzen 7 2700X, AMD Radeon RX 5700 XT (Desktop)
54.5 (31.85min - 78.06max) fps -28%
Nvidia GeForce RTX 2070 Super
AMD Ryzen 7 2700X, NVIDIA GeForce RTX 2070 Super (Desktop)
54.3 (32min - 83max) fps -28%
Nvidia GeForce RTX 2060 Super
AMD Ryzen 7 2700X, NVIDIA GeForce RTX 2060 Super (Desktop)
46.5 (28min - 69max) fps -38%
1920x1080 Ultra Quality AF:16x
MSI GeForce RTX 3090 Suprim X
AMD Ryzen 9 5900X, NVIDIA GeForce RTX 3090
132 (72.24min - 199.88max) fps +41%
MSI GeForce RTX 3080 Gaming X Trio
AMD Ryzen 9 5900X, NVIDIA GeForce RTX 3080
116 (56.76min - 185.19max) fps +24%
AMD Radeon RX 6800 XT
AMD Ryzen 9 5950X, AMD Radeon RX 6800 XT
115 (64.52min - 181.92max) fps +23%
ASUS GeForce RTX 3080 ROG STRIX OC GAMING
AMD Ryzen 9 5900X, NVIDIA GeForce RTX 3080
111 (57.16min - 183.25max) fps +19%
Zotac Gaming GeForce RTX 3090 Trinity
AMD Ryzen 9 3900X, NVIDIA GeForce RTX 3090
108 (64.8min - 150.67max) fps +15%
Average NVIDIA GeForce RTX 3070
  (91.3 - 97.7, n=5)
93.9 fps 0%
MSI GeForce RTX 3070 Ventus 3X
AMD Ryzen 9 5900X, NVIDIA GeForce RTX 3070
93.7 (46.52min - 161.6max) fps 0%
Zotac Gaming GeForce RTX 3070 Twin Edge
AMD Ryzen 9 5950X, NVIDIA GeForce RTX 3070
93.6 (45.01min - 161.08max) fps
MSI GeForce RTX 3070 Gaming X Trio
AMD Ryzen 9 5900X, NVIDIA GeForce RTX 3070
91.3 (46.36min - 152.74max) fps -2%
KFA2 GeForce RTX 2080 Ti EX
AMD Ryzen 9 3900X, NVIDIA GeForce RTX 2080 Ti (Desktop)
89.7 (46min - 140max) fps -4%
Nvidia GeForce RTX 2080 Super
AMD Ryzen 7 2700X, NVIDIA GeForce RTX 2080 Super (Desktop)
76 (38.54min - 122.4max) fps -19%
Nvidia GeForce RTX 2070 Super
AMD Ryzen 7 2700X, NVIDIA GeForce RTX 2070 Super (Desktop)
67.8 (36min - 110max) fps -28%
AMD Radeon RX 5700 XT
AMD Ryzen 7 2700X, AMD Radeon RX 5700 XT (Desktop)
61 (36.09min - 86.1max) fps -35%
Nvidia GeForce RTX 2060 Super
AMD Ryzen 7 2700X, NVIDIA GeForce RTX 2060 Super (Desktop)
58.9 (32min - 92max) fps -37%
baixo média alto ultraQHD4K
The Witcher 3 (2015) 548 449 244 123 89.6
Shadow of the Tomb Raider (2018) 165 161 157 150 114 62
Assassin´s Creed Odyssey (2018) 149 125 107 81 68 48
Metro Exodus (2019) 197 154 118 93.6 75.4 48.3
Total War: Three Kingdoms (2019) 371.5 206.4 136 103.5 67.5 33.1
Borderlands 3 (2019) 169 150 126 104 79 44.5
Red Dead Redemption 2 (2019) 175 160 118 77.9 63.2 42.6
Doom Eternal (2020) 547 358 322 311 244 136
Gears Tactics (2020) 342.6 204.9 150.8 136.2 98.2 53.5
Watch Dogs Legion (2020) 129 127 113 84.9 65.3 38.9
Assassin´s Creed Valhalla (2020) 130 100 85 77 65 43
Call of Duty Black Ops Cold War (2020) 239 146 124 120 89.5 43.8
Immortals Fenyx Rising (2020) 148 109 96 88 76 54
Cyberpunk 2077 1.0 (2020) 125 108 93.1 80.6 53.7 26.6

Emissões

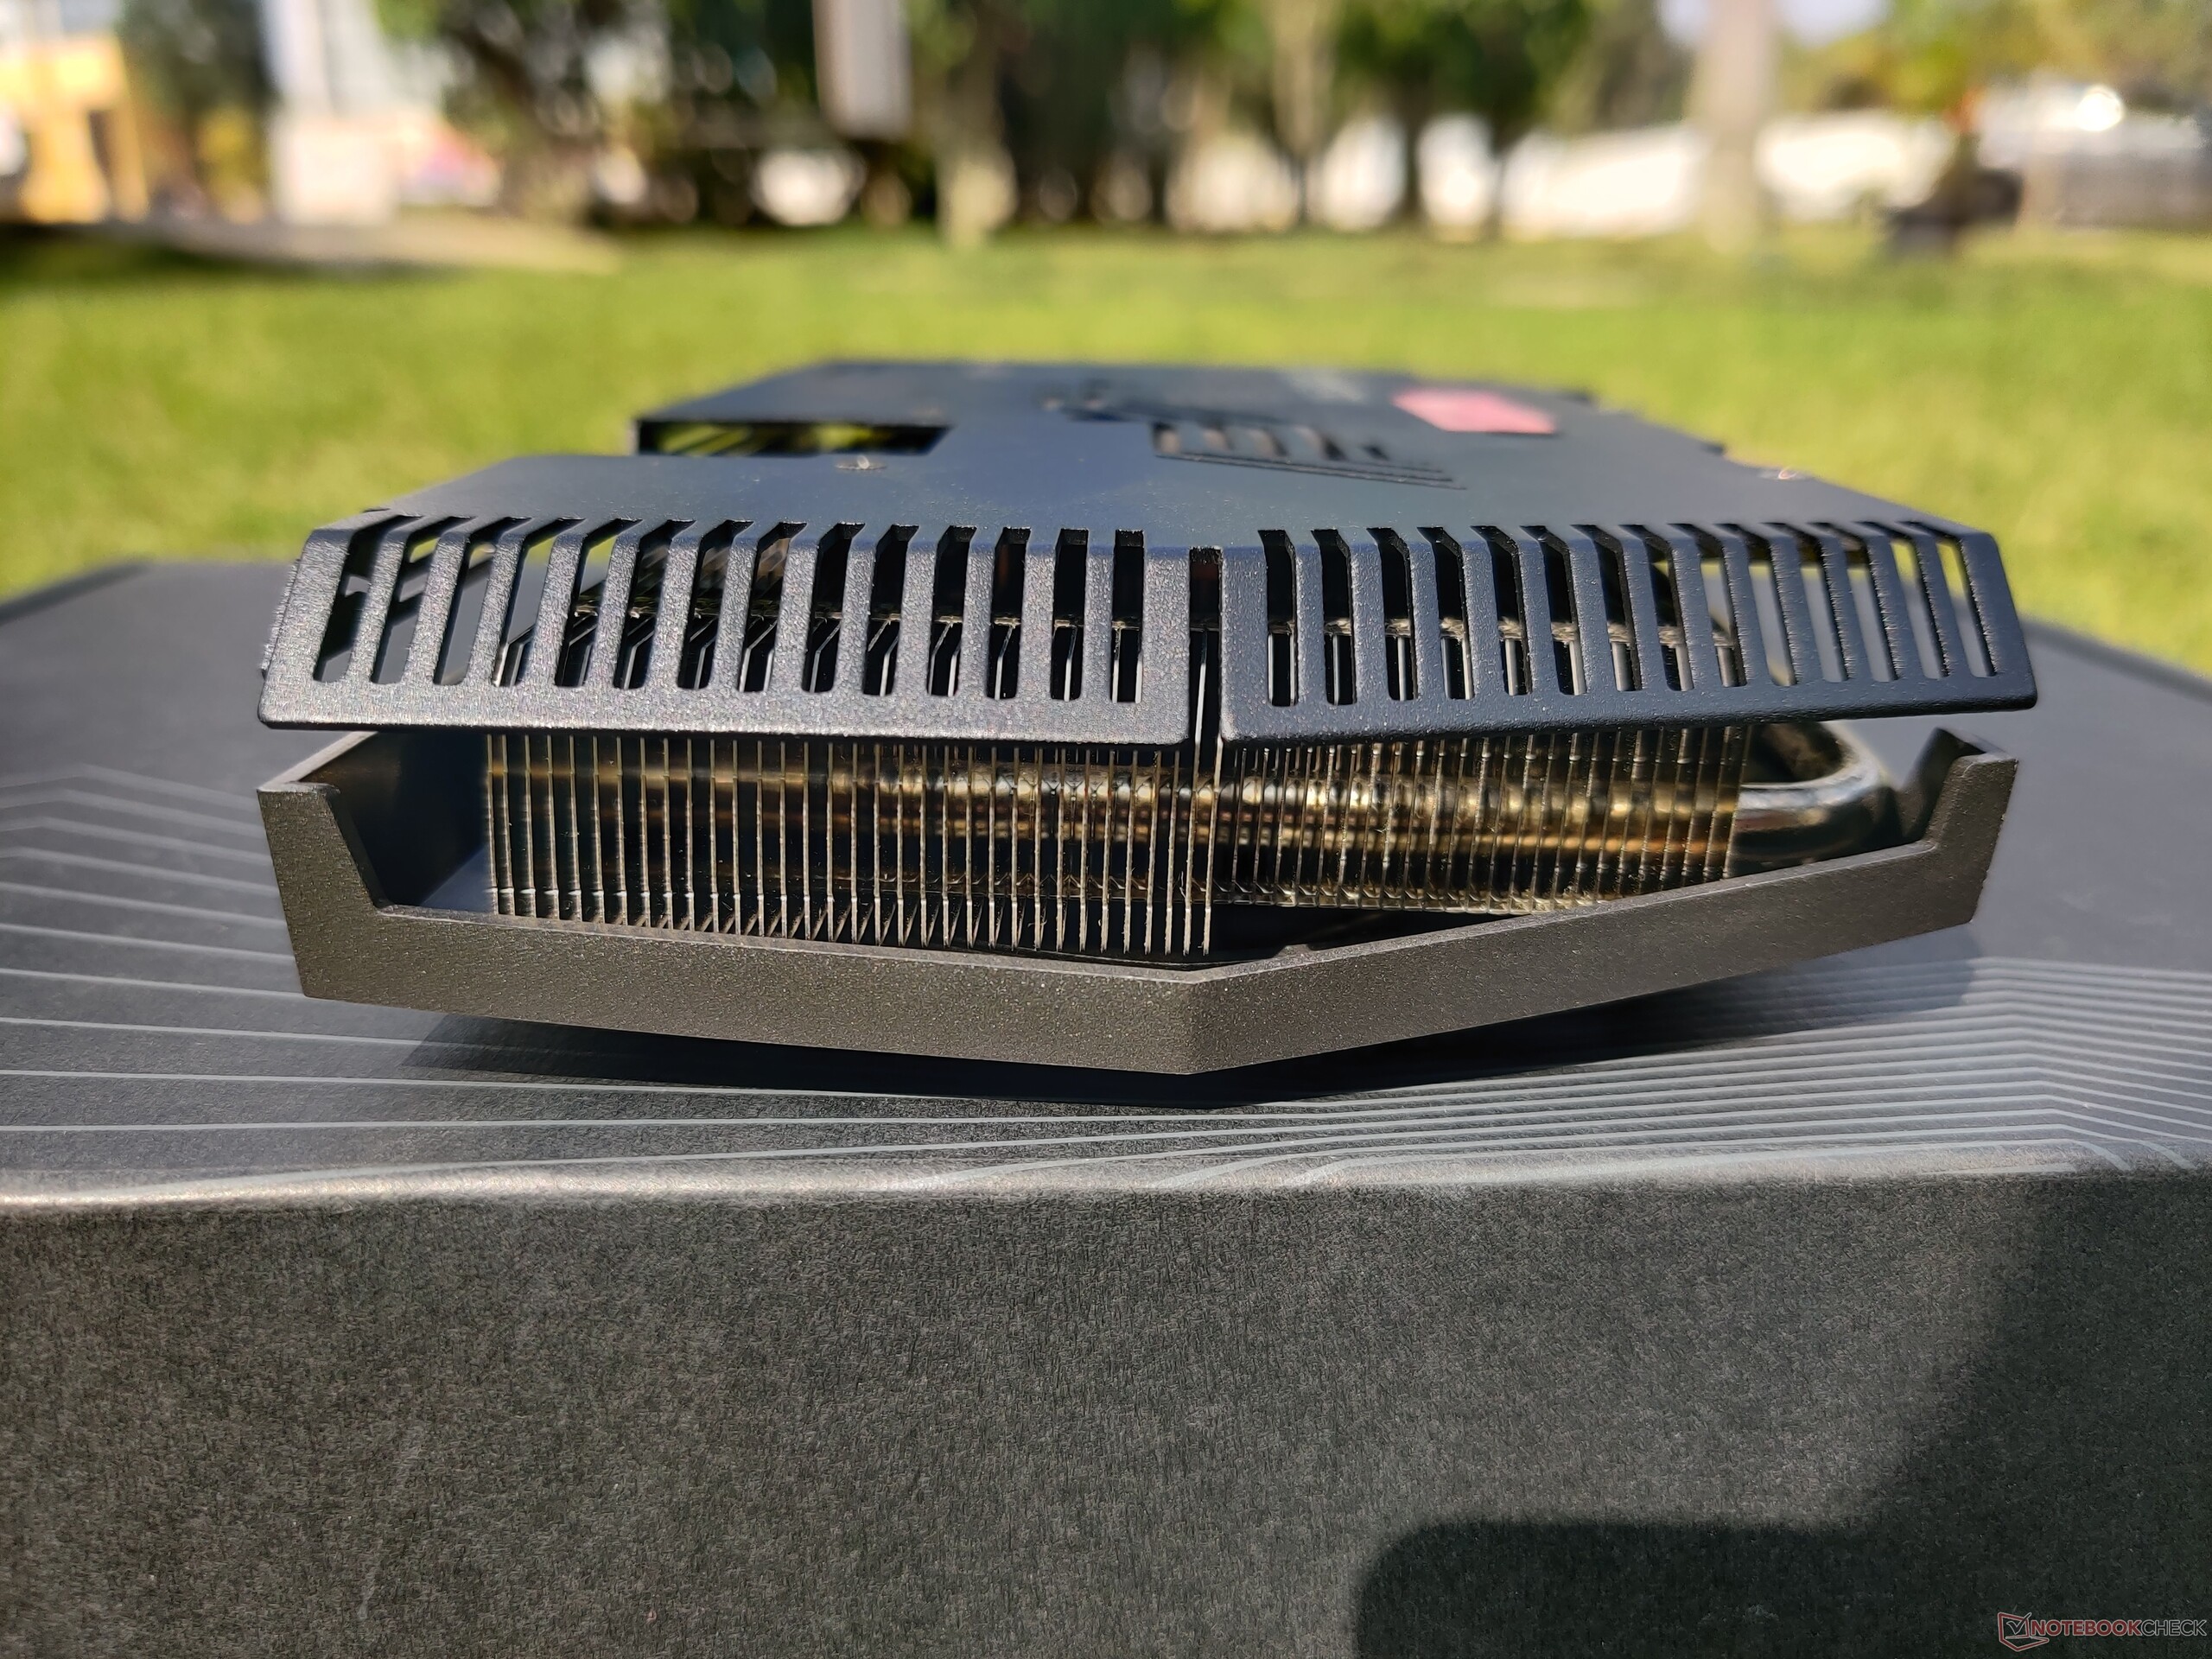
O RTX 3070 não é exatamente uma GPU conservadora quando se trata de saída de calor ou consumo de energia. A Zotac, no entanto, emprega alguns truques como, por exemplo, fazer o GPU um pouco mais baixo, implementar um sistema de refrigeração IceStorm 2.0 melhorado, e usar uma placa traseira metálica para melhor dissipação de calor

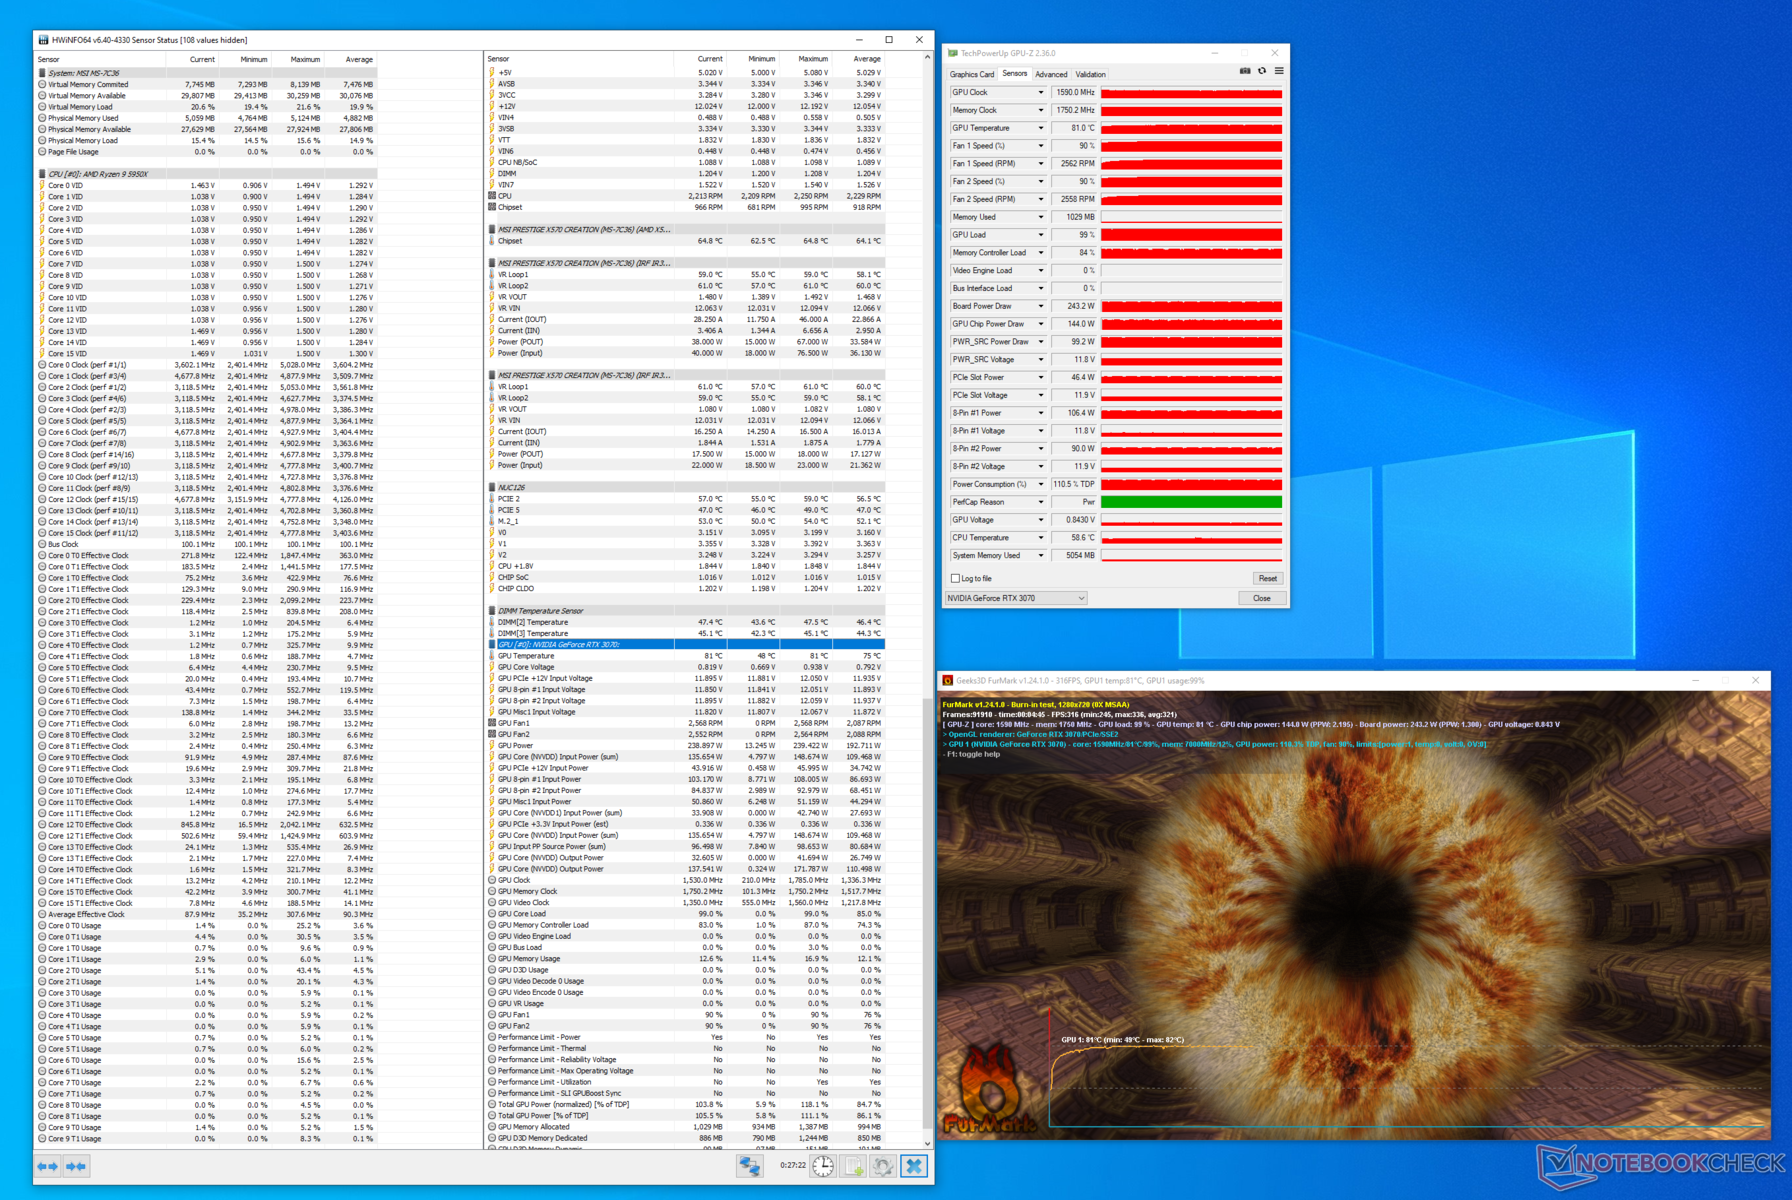
O estoque de 220 W TGP pode ser aumentado em 9% a 240 W para permitir aumentos de até 1.785 MHz, tornando-o cerca de 45 MHz mais lento que o OC out-of-the-box do MSI RTX 3070 Gaming X Trio.

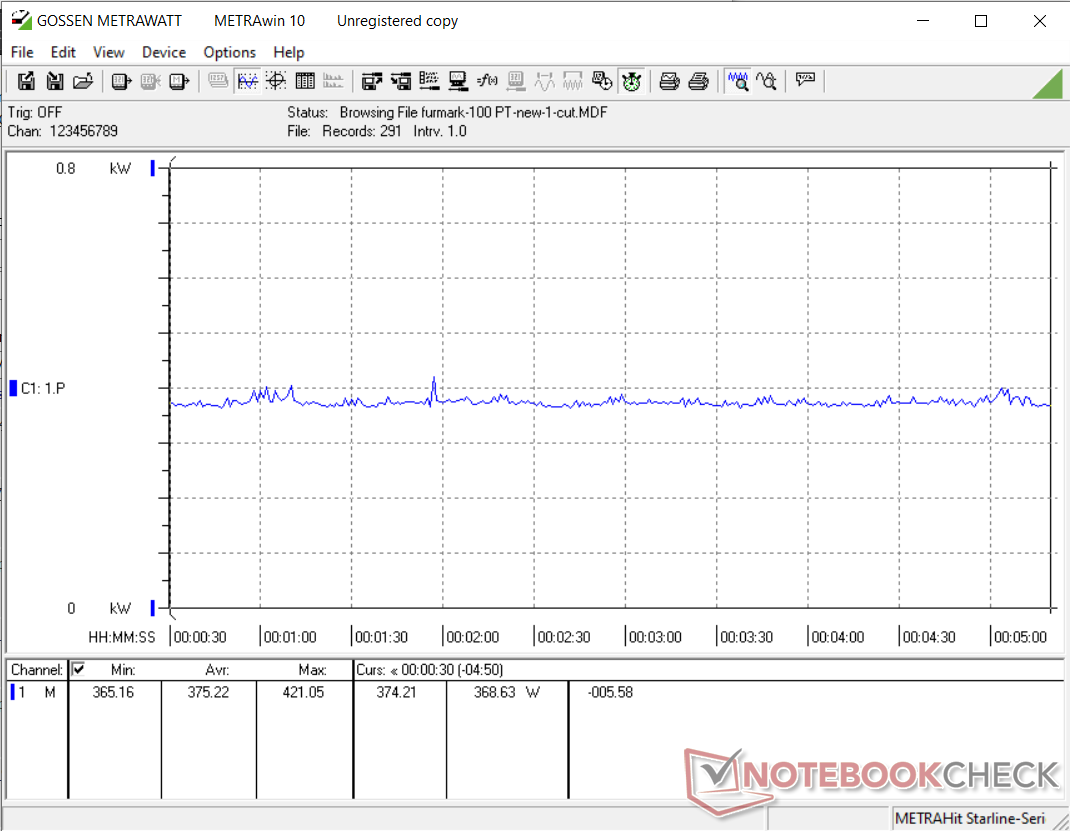
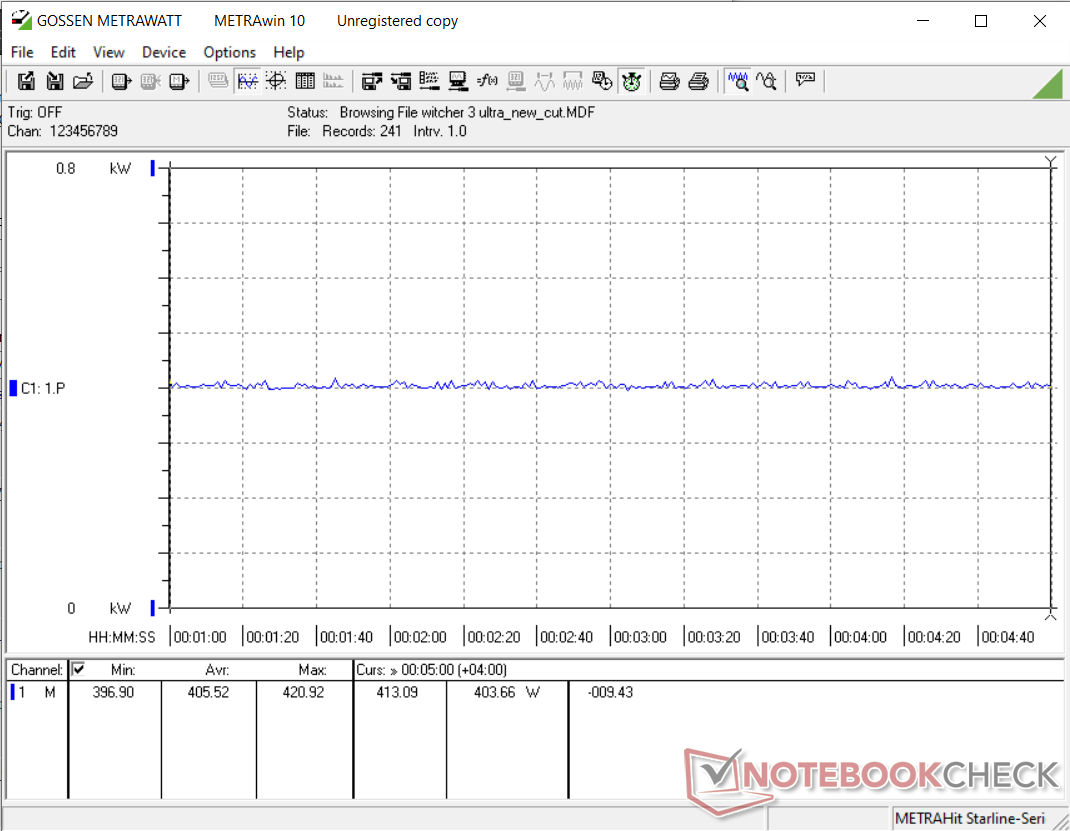
Usamos o teste de estresse FurMark em metas de potência de 100% e 109% para determinar os níveis de temperatura e ruído. O consumo total de energia do sistema foi verificado durante o stress com FurMark e The Witcher 3 a 1080p Ultra predefinidos em ambas as metas de energia
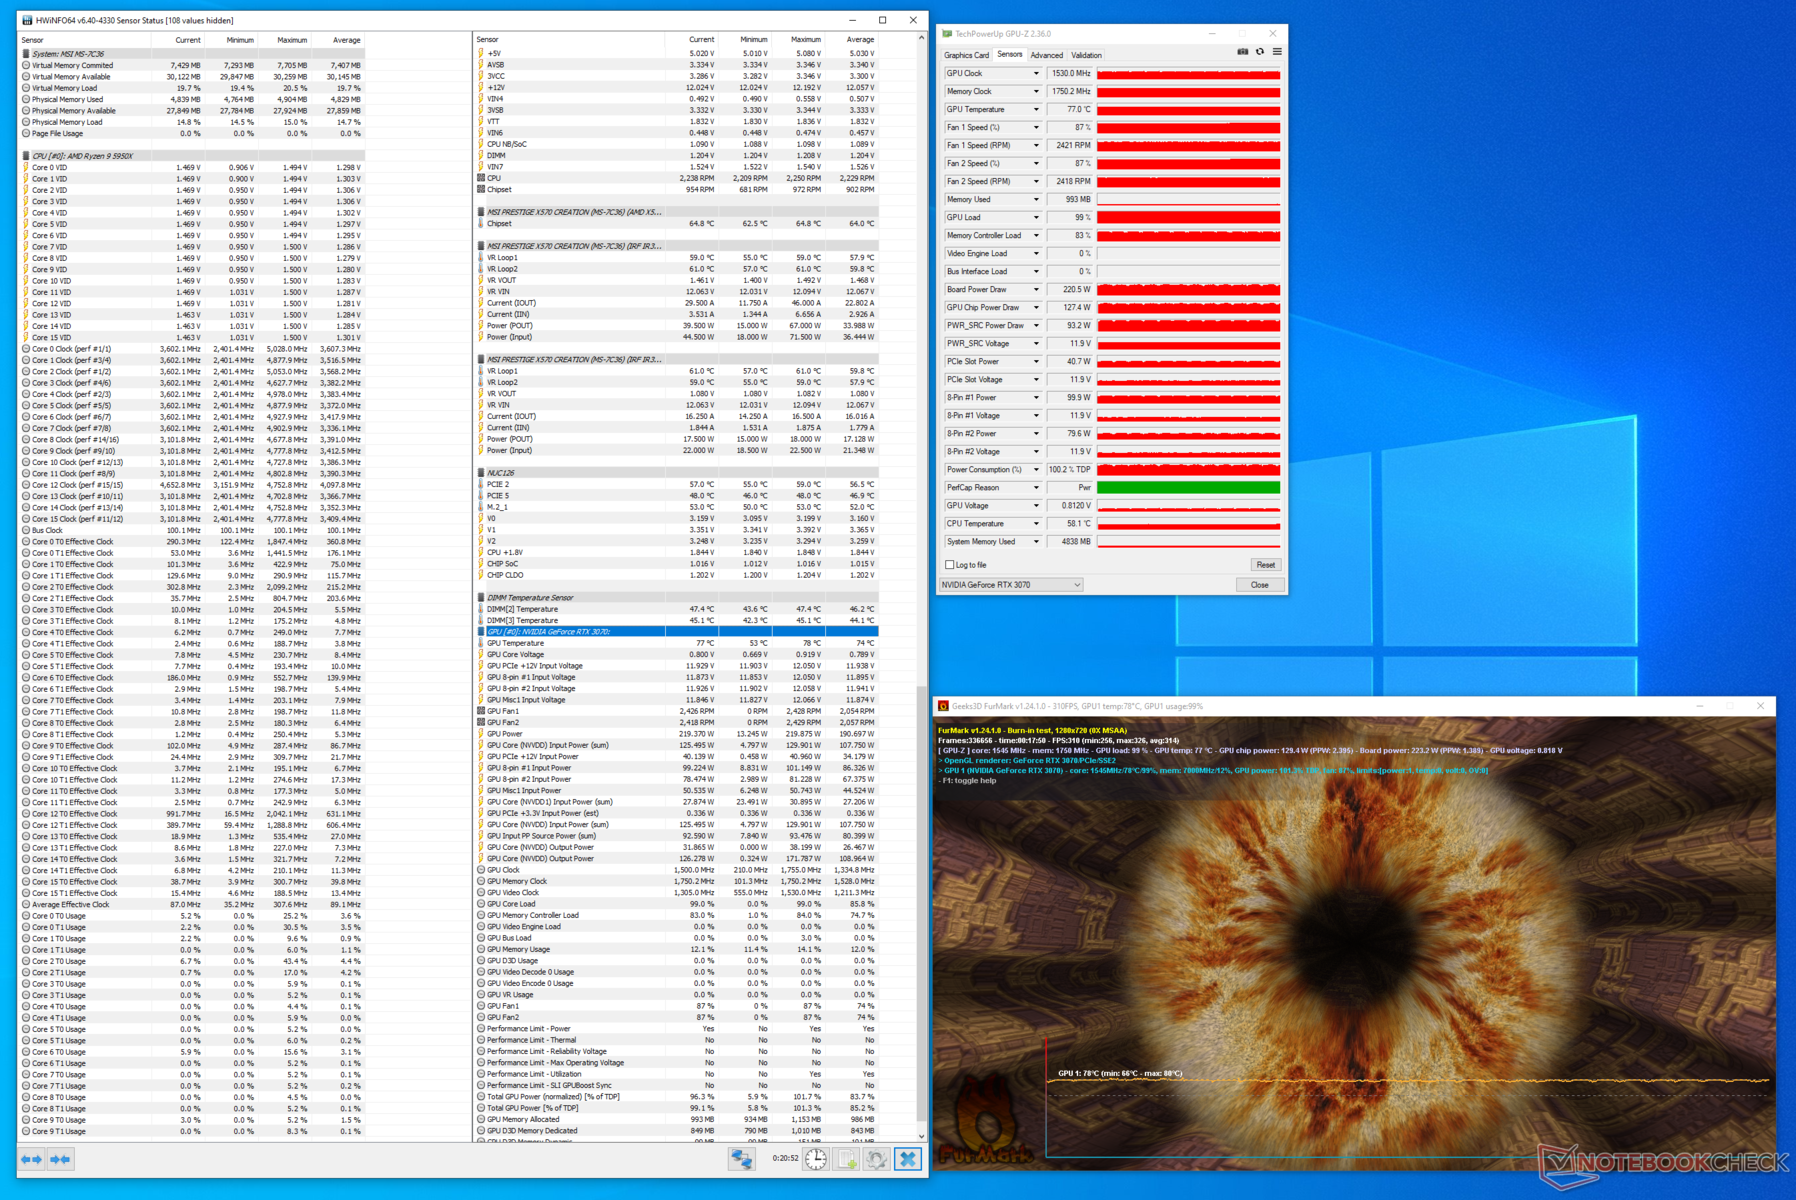
Tensão FurMark a 100% de potência
Tensão FurMark a 109% de potência alvo

Temperatura

Mapa de calor Zotac RTX 3070 Twin Edge.

O RTX 3070 Twin Edge parece ser um cliente relativamente legal graças aos ventiladores duplos de 11 lâminas, o que, segundo Zotac, aumenta o fluxo de ar em 10% a mais do que a geração anterior. No entanto, isto também significa que os ventiladores podem ficar consideravelmente barulhentos, como visto em nossos testes de ruído abaixo

O núcleo da GPU aquece até 77 °C sob carga total com o TGP padrão de 220 W. O aumento do TGP para 240 W faz com que o núcleo funcione mais quente a 81 °C

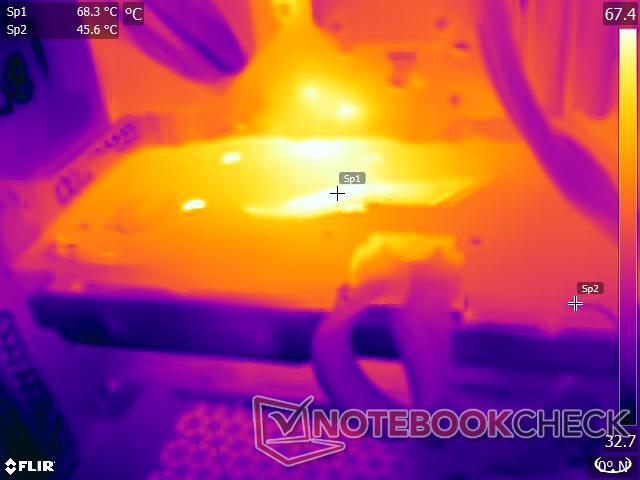
Encontramos a temperatura da superfície atingindo um máximo de 68,3 °C perto da área de GPU quando sob tensão enquanto as regiões afastadas do centro permanecem relativamente frias a cerca de 45 °C, como visto em nosso mapa de calor

As temperaturas de manuseio variam entre 48 °C e 53 °C durante o tempo em que os ventiladores são completamente desligados
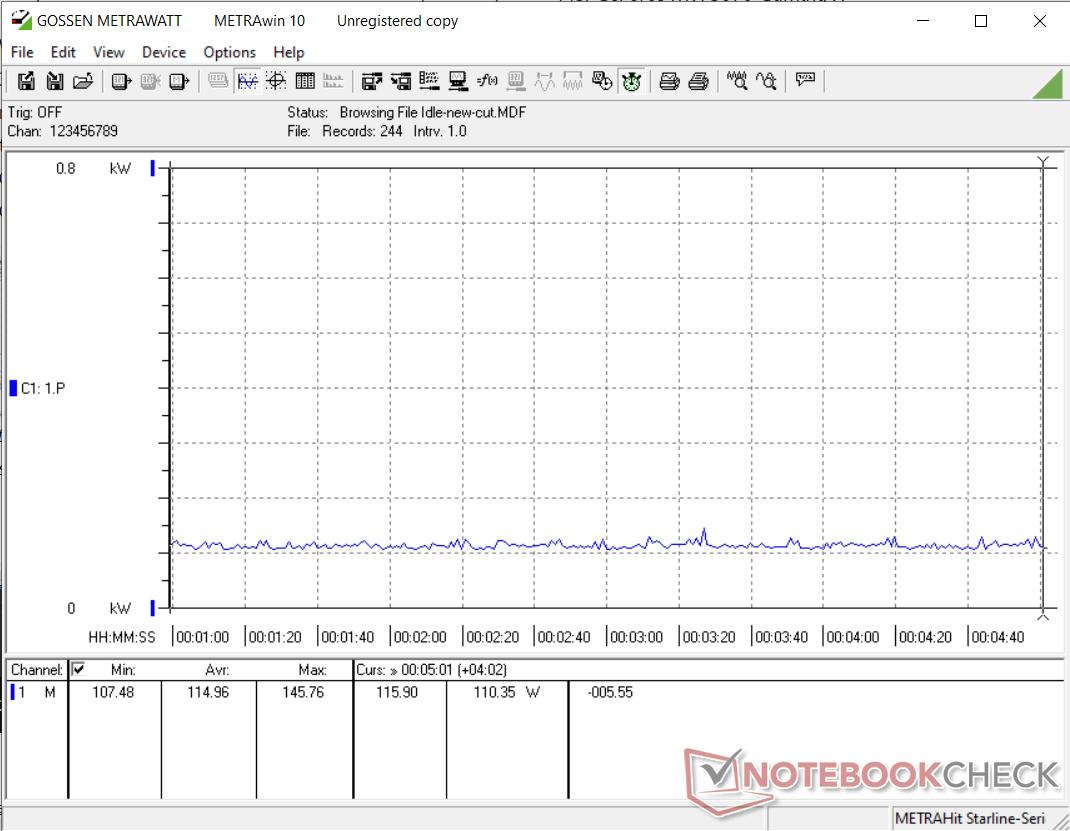
Consumo de energia

Nossa bancada de teste está ociosa a cerca de 115 W com toda a iluminação RGB desligada e um total de cinco ventiladores (três ventiladores de caixa Corsair SP 120 mm e dois ventiladores de radiador Corsair ML 120) e a bomba Elite Capellix funcionando em um perfil Balanceado.

Observamos um consumo médio total de energia do sistema de 375 W enquanto funcionava o FurMark na meta padrão de 100% de potência (PT). Isto é cerca de 6% menor que um RTX 2080 Ti e no mesmo nível de um RTX 2080 Super. Aumentar o PT para 109% resulta em um consumo de energia 5% maior a 393 W.

O RTX 3070 Twin Edge consome uma potência ligeiramente maior em comparação com o MSI RTX 3070 Gaming X Trio no The Witcher 3 a 1080p Ultra predefinido, mas ainda é um pouco econômico em comparação com o RTX 2080 Ti e o Titan RTX

Consumo de energia do sistema - ocioso
Consumo de energia do sistema - FurMark a 100% PT
Consumo de energia do sistema - FurMark a 109% PT
Consumo de energia do sistema - O Witcher 3 1080p Ultra pré-definido
Power Consumption
1920x1080 The Witcher 3 ultra (external Monitor)
MSI GeForce RTX 3090 Suprim X
NVIDIA GeForce RTX 3090, R9 5900X (Idle: 105.9 W)
597 (577min - 618max) Watt * -47%
ASUS GeForce RTX 3080 ROG STRIX OC GAMING
NVIDIA GeForce RTX 3080, R9 5900X (Idle: 88.3 W)
505 (389min - 543max) Watt * -24%
AMD Radeon RX 6800 XT
AMD Radeon RX 6800 XT, R9 5950X (Idle: 99.5 W)
505 (389min - 543max) Watt * -24%
MSI GeForce RTX 3080 Gaming X Trio
NVIDIA GeForce RTX 3080, R9 5900X (Idle: 103 W)
498.3 (487min - 523max) Watt * -23%
AMD Ryzen 9 5900X
NVIDIA Titan RTX, R9 5900X (Idle: 78.1 W)
439.6 (419min - 497max) Watt * -8%
KFA2 GeForce RTX 2080 Ti EX
NVIDIA GeForce RTX 2080 Ti (Desktop), R9 3900X (Idle: 100.5 W)
438.8 (431min - 463max) Watt * -8%
Zotac Gaming GeForce RTX 3070 Twin Edge
NVIDIA GeForce RTX 3070, R9 5950X (Idle: 114.96 W)
406 (397min, 399P1 - 421max) Watt *
Average NVIDIA GeForce RTX 3070
  (Idle: 317 - 550, n=5 W)
401 Watt * +1%
MSI GeForce RTX 3070 Gaming X Trio
NVIDIA GeForce RTX 3070, R9 5900X (Idle: 95.1 W)
394.5 (381min - 430max) Watt * +3%
Nvidia GeForce RTX 2080 Super
NVIDIA GeForce RTX 2080 Super (Desktop), R7 2700X (Idle: 78.87 W)
382.8 (360min - 410max) Watt * +6%
AMD Radeon RX 5700 XT
AMD Radeon RX 5700 XT (Desktop), R7 2700X (Idle: 69.8 W)
348.7 (341min - 359max) Watt * +14%
Nvidia GeForce RTX 2070 Super
NVIDIA GeForce RTX 2070 Super (Desktop), R7 2700X (96.8 fps, Idle: 80.5 W)
344.7 (335min - 370max) Watt * +15%
MSI GeForce RTX 3070 Ventus 3X
NVIDIA GeForce RTX 3070, R9 5900X (Idle: 91.46 W)
316.5 (309min - 329max) Watt * +22%
Nvidia GeForce RTX 2060 Super
NVIDIA GeForce RTX 2060 Super (Desktop), R7 2700X (82.7 fps, Idle: 77.12 W)
298.2 (293min - 322max) Watt * +27%
1280x720 FurMark 1.19 GPU Stress Test (external Monitor)
MSI GeForce RTX 3090 Suprim X
NVIDIA GeForce RTX 3090, R9 5900X (Idle: 105.9 W)
551 (521min - 582max) Watt * -40%
ASUS GeForce RTX 3080 ROG STRIX OC GAMING
NVIDIA GeForce RTX 3080, R9 5900X (Idle: 88.3 W)
505 (493min - 541max) Watt * -28%
MSI GeForce RTX 3080 Gaming X Trio
NVIDIA GeForce RTX 3080, R9 5900X (Idle: 103 W)
492 (485min - 514max) Watt * -25%
AMD Radeon RX 6800 XT
AMD Radeon RX 6800 XT, R9 5950X (Idle: 99.5 W)
447.9 (413min - 484max) Watt * -14%
KFA2 GeForce RTX 2080 Ti EX
NVIDIA GeForce RTX 2080 Ti (Desktop), R9 3900X (Idle: 100.5 W)
400.8 (354min - 432max) Watt * -2%
Zotac Gaming GeForce RTX 3070 Twin Edge
NVIDIA GeForce RTX 3070, R9 5950X (109% PT, Idle: 114.96 W)
393 (384min, 385P1 - 406max) Watt *
Zotac Gaming GeForce RTX 3070 Twin Edge
NVIDIA GeForce RTX 3070, R9 5950X (100% PT, Idle: 114.96 W)
375 (365min, 366P1 - 421max) Watt * +5%
MSI GeForce RTX 3070 Gaming X Trio
NVIDIA GeForce RTX 3070, R9 5900X (Idle: 95.1 W)
376.9 (369min - 433max) Watt * +4%
Nvidia GeForce RTX 2080 Super
NVIDIA GeForce RTX 2080 Super (Desktop), R7 2700X (Idle: 78.87 W)
376.8 (331min - 409max) Watt * +4%
Average NVIDIA GeForce RTX 3070
  (Idle: 281 - 393, n=6 W)
348 Watt * +11%
MSI GeForce RTX 3070 Ventus 3X
NVIDIA GeForce RTX 3070, R9 5900X (Idle: 91.46 W)
336.6 (330min - 365max) Watt * +14%
AMD Radeon RX 5700 XT
AMD Radeon RX 5700 XT (Desktop), R7 2700X (239 fps, Idle: 69.8 W)
326.6 (313min - 351max) Watt * +17%
Nvidia GeForce RTX 2070 Super
NVIDIA GeForce RTX 2070 Super (Desktop), R7 2700X (283 fps, Idle: 80.5 W)
326 (315min - 348max) Watt * +17%
Nvidia GeForce RTX 2060 Super
NVIDIA GeForce RTX 2060 Super (Desktop), R7 2700X (237 fps, Idle: 77.12 W)
281.4 (275min - 321max) Watt * +28%

* ... smaller is better

Níveis de ruídos

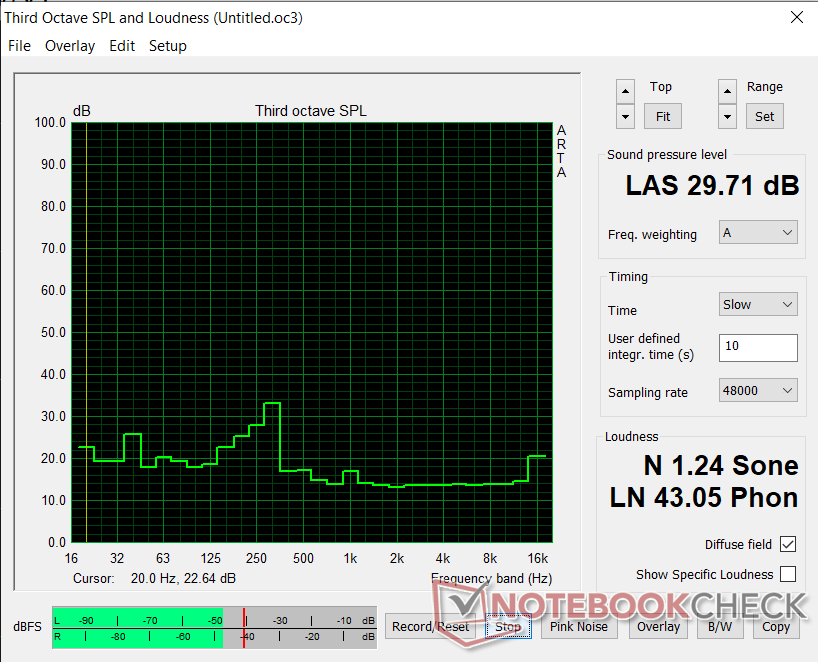
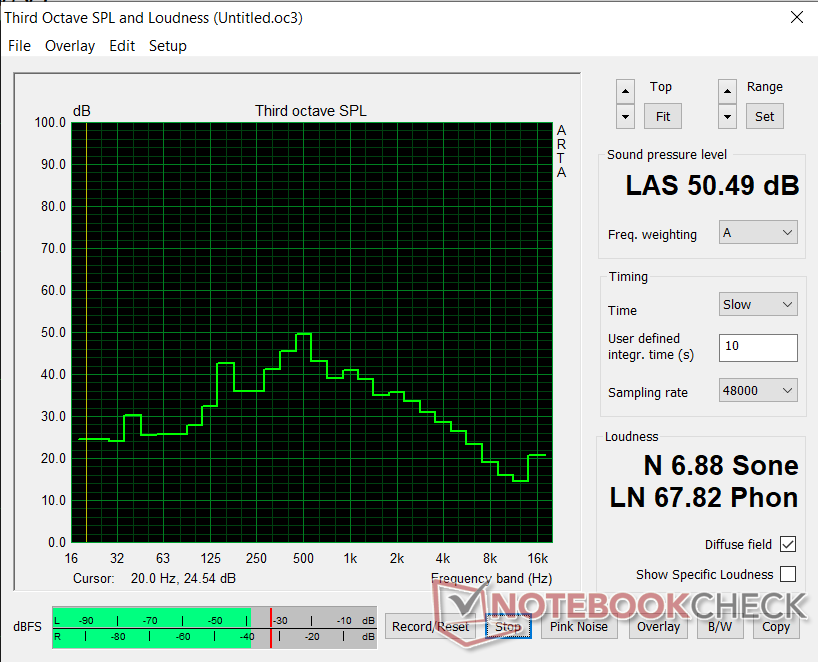
Ao ocioso, o Zotac RTX 3070 Twin Edge é uma carta silenciosa e o nível de pressão sonora (SPL) é mais ou menos igual ao valor ambiente de 29,71 dB(A) a uma distância de 20 cm da caixa. Entretanto, as coisas começam a ficar barulhentas sob estresse. Depois de tensionar a placa usando FurMark por cerca de 30 minutos, observamos os níveis SPL do ventilador para cruzar a marca de 50 db(A). Isto é provavelmente devido à presença de apenas dois ventiladores que trabalham duro para manter as temperaturas sob controle e ao fator de forma compacta da carda

Os usuários ainda podem ser capazes de afinar os níveis de ruído ajustando manualmente as curvas dos ventiladores, mas recomendamos um bom conjunto de fones de ouvido para afogar o ruído enquanto jogam em configurações de máxima exaustão

Níveis de ruído - Ocioso com os ventiladores fora do estojo
Níveis de ruído - FurMark stress com os ventiladores desligados

Pro

+ Fator de forma compacto de 2 slots
+ Boa construção
+ 2x adaptadores de 6 pinos a 8 pinos incluídos
+ Placa traseira metálica
+ Ventiladores duplos de 11 lâminas
+ Parada completa do ventilador em modo inativo
+ Desempenho no mesmo nível do RTX 2080 Ti
+ Ray tracing e funcionalidade DLSS 2.0 em jogos compatíveis
+ Opção de aumentar o TGP para 240 W
+ Temperaturas superficiais inferiores a 70 °C sob carga
+ 3+2 anos de garantia em regiões selecionadas

Contra

- A mortalha plástica poderia ser mais firme
- O logotipo Zotac brilha apenas em branco
- Relógio ligeiramente mais baixo do que a Edição dos Fundadores
- Altos níveis de ruído sob carga
- GDDR6 VRAM de 8 GB pode não ser à prova de futuro
- Estoques muito limitados
- Preços inflados

Veredicto

Zotac Gaming GeForce RTX 3070 Twin Edge. Unidade de revisão, cortesia da Zotac Índia.

A Zotac Gaming GeForce RTX 3070 Twin Edge é bem feita sem bordas afiadas, embora a cobertura de plástico pudesse ser um pouco mais firme. A carta ocupa um espaço mínimo e caberá na maioria dos casos com facilidade. A placa traseira de metal é uma adição bem-vinda para ajudar na dissipação adequada do calor

Os conhecedores da RGB ficarão desapontados que a Twin Edge oferece apenas iluminação branca estática para o logotipo da Zotac. Em combinação com um conjunto de cinco tubos de calor de cobre, os ventiladores duplos de 11 lâminas ajudam a manter as térmicas sob controle. No entanto, estes ventiladores podem ficar perceptíveis sob carga, o que pode ser desagradável em um ambiente silencioso.

O Zotac Gaming GeForce RTX 3070 Twin Edge marca todas as caixas certas para qualquer pessoa que olhe para uma placa adicional viável (AiB) RTX 3070 oferecendo. O desempenho é invejosamente próximo ou às vezes até marginalmente melhor do que uma RTX 2080 Ti, mas definitivamente há espaço para otimizar ainda mais o consumo de energia e os níveis de ruído dos ventiladores.

A Zotac RTX 3070 Twin Edge tem o mesmo desempenho que a RTX 2080 Ti, tanto em padrões sintéticos quanto em jogos, consumindo menos energia. O Zotac permite adicionar mais 20 W ao TGP, o que aumenta ainda mais os relógios em 60 MHz enquanto aumenta o consumo de energia em cerca de 5%.

Nossa principal queixa com o Zotac RTX 3070 Twin Edge é o preço atual de varejo. O MSRP da NVIDIA para o RTX 3070 é de US$499, enquanto o RTX 3070 Twin Edge originalmente vende a varejo por US$620. Entretanto, as restrições atuais de demanda e oferta significam que o RTX 3070 Twin Edge tem um preço exorbitante de US$950 na Amazônia. A menos que você tenha uma necessidade absolutamente urgente, sugerimos manter um controle sobre os preços até que eles caiam para níveis mais razoáveis

Preço e disponibilidade

A Zotac Gaming GeForce RTX 3070 Twin Edge pode ser comprada em várias lojas online, incluindo a Zotac Store, Amazon, e Newegg. Newegg oferece atualmente a RTX 3070 Twin Edge por US$649,99 e a Twin Edge OC por US$694,99. Sem surpresas, o cartão está listado como esgotado no momento da publicação.

O RTX 3070 Twin Edge está atualmente em estoque na Amazon por US$949,99. É uma marcação significativamente acentuada que diminui a proposta de valor deste cartão em comparação com o RTX 2080 Ti

Estoques limitados também estão disponíveis em

para uma edição RTX 3070 Twin Edge OC White Edition que está no varejo por US$899 no momento da publicação<br />

Pricecompare

Please share our article, every link counts!
> Análises e revisões de portáteis e celulares > Análises > Análises > Zotac Gaming GeForce RTX 3070 Twin Edge Review: RTX 2080 Ti desempenho para todos
Vaidyanathan Subramaniam, 2021-01-29 (Update: 2021-01-29)