 Deutsch
 English
 Español
 Français
 Italiano
 Nederlands
 Polski
 Português
 Русский
 Türkçe
 Svenska
 Chinese
 Magyar
Breve Análise do Portátil HP ProBook 645 G4 (Ryzen 5 Pro 2500U, SSD, FHD)
| SD Card Reader | |
| average JPG Copy Test (av. of 3 runs) | |
| Dell Latitude 5490-TD70X (Toshiba Exceria Pro SDXC 64 GB UHS-II) | |
| Lenovo ThinkPad L480-20LS001AGE (Toshiba Exceria Pro M501 microSDXC 64GB) | |
| HP ProBook 640 G3 Z2W33ET (Toshiba Exceria Pro SDXC 64 GB UHS-II) | |
| HP ProBook 645 G4 3UP62EA (Toshiba Exceria Pro M501 microSDXC 64GB) | |
| Fujitsu Lifebook E548 (Toshiba Exceria Pro SDXC 64 GB UHS-II) | |
| Average of class Office (8 - 82.7, n=49, last 2 years) | |
| maximum AS SSD Seq Read Test (1GB) | |
| Dell Latitude 5490-TD70X (Toshiba Exceria Pro SDXC 64 GB UHS-II) | |
| Lenovo ThinkPad L480-20LS001AGE (Toshiba Exceria Pro M501 microSDXC 64GB) | |
| HP ProBook 645 G4 3UP62EA (Toshiba Exceria Pro M501 microSDXC 64GB) | |
| Fujitsu Lifebook E548 (Toshiba Exceria Pro SDXC 64 GB UHS-II) | |
| Average of class Office (25 - 90.5, n=43, last 2 years) | |
| HP ProBook 640 G3 Z2W33ET (Toshiba Exceria Pro SDXC 64 GB UHS-II) | |
| |||||||||||||||||||||||||
iluminação: 89 %
iluminação com acumulador: 209 cd/m²
Contraste: 331:1 (Preto: 0.68 cd/m²)
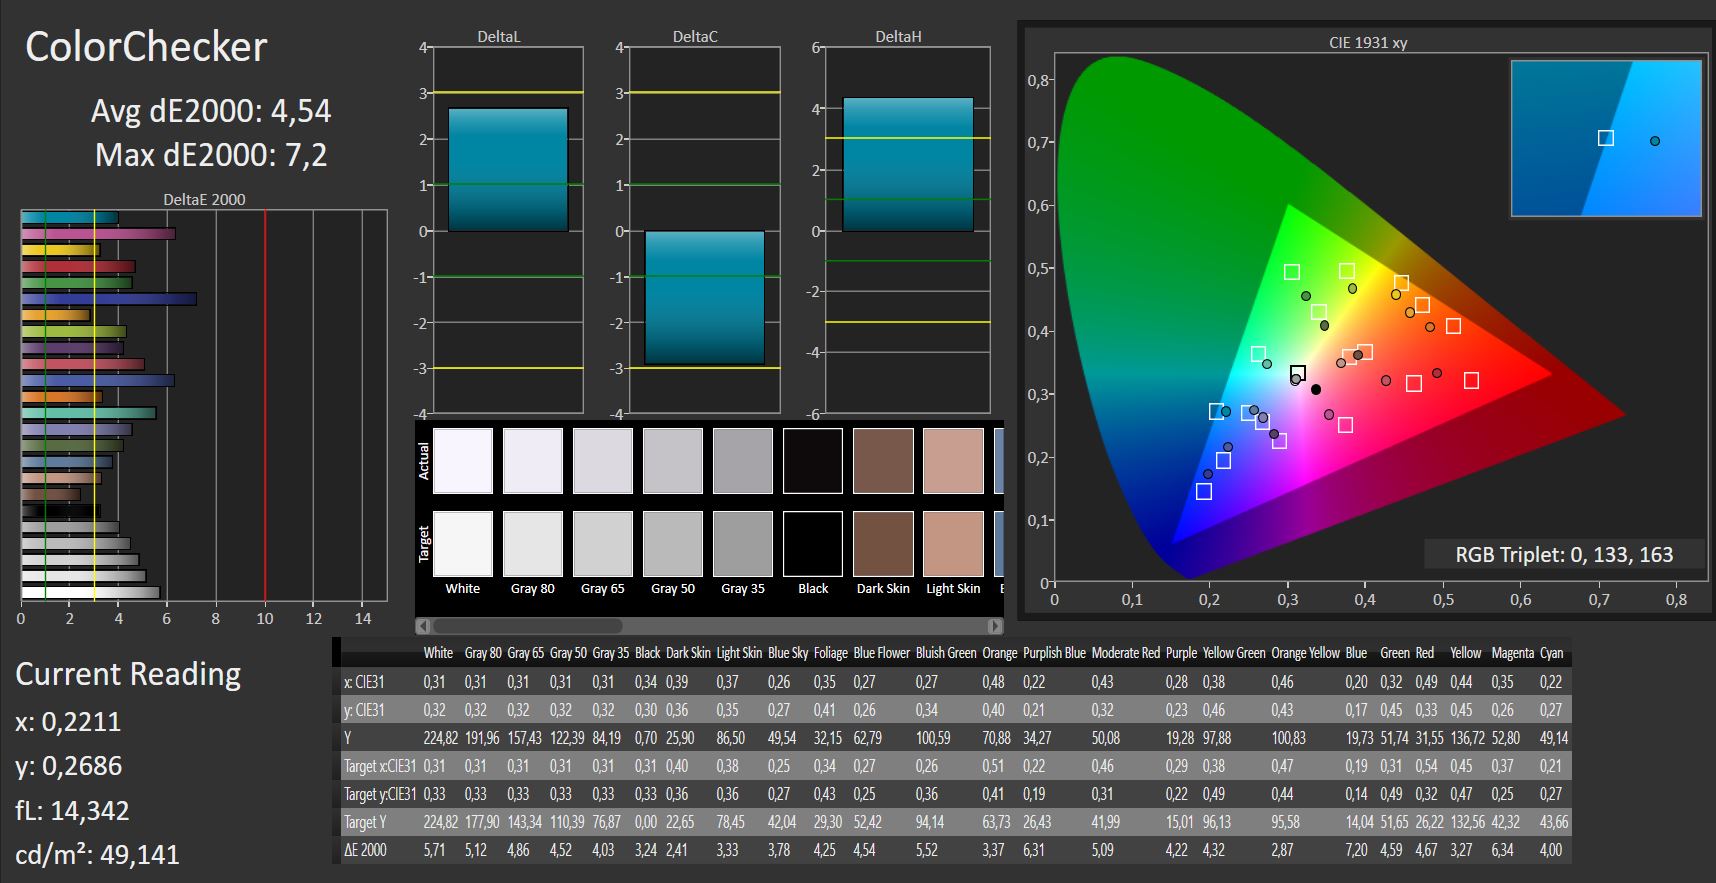
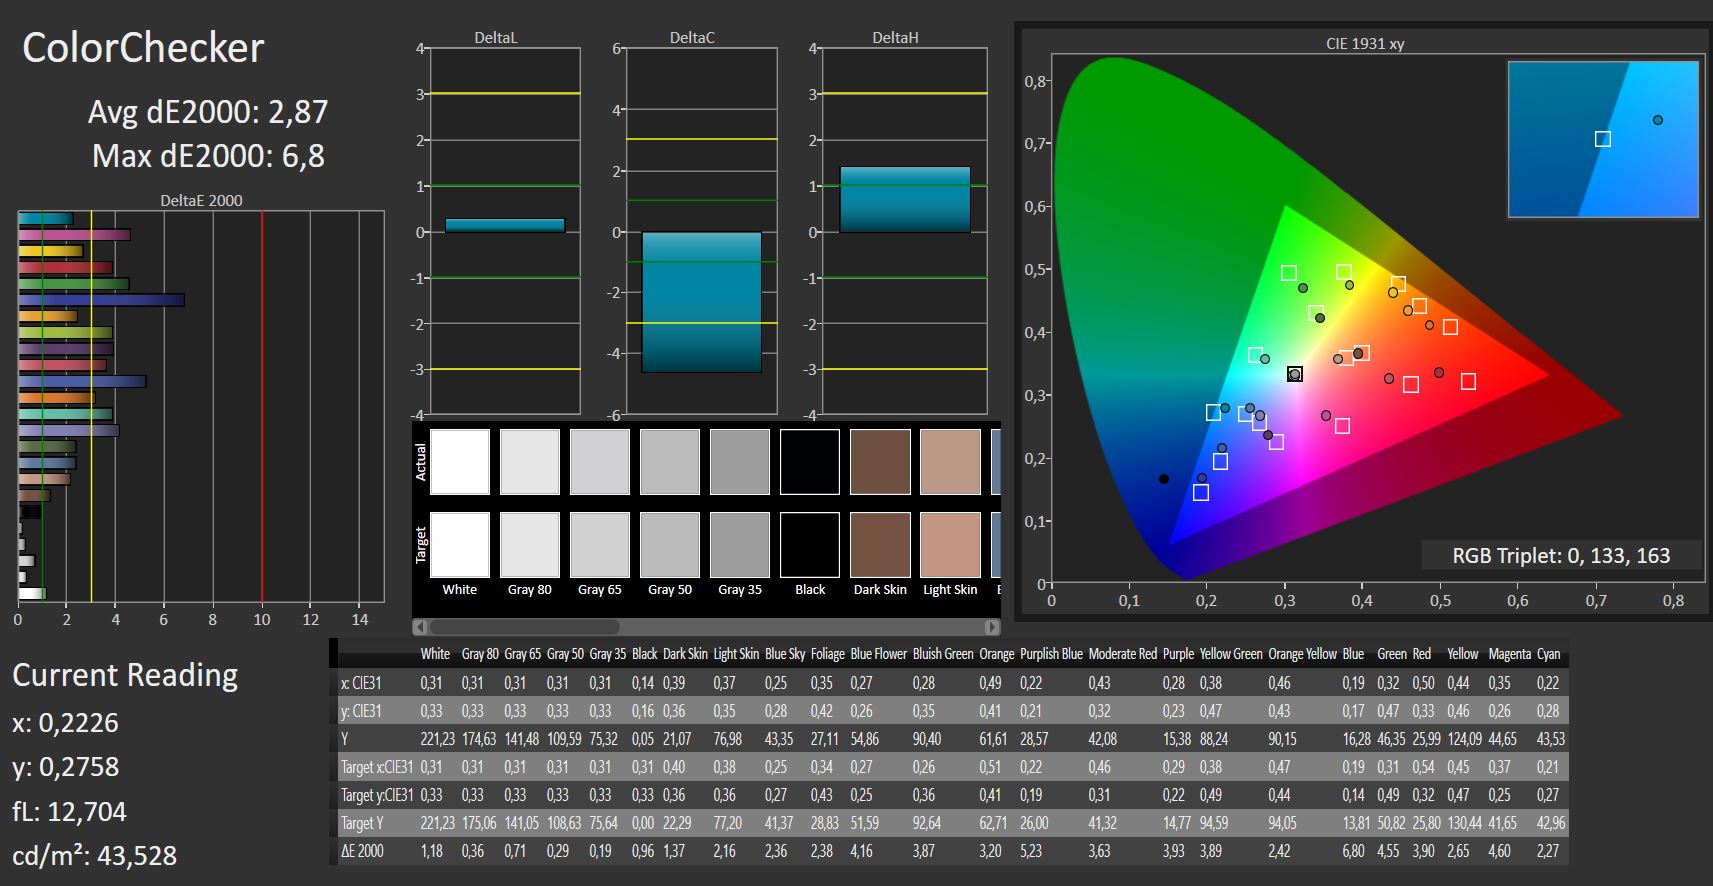
ΔE Color 4.54 | 0.5-29.43 Ø5, calibrated: 2.87
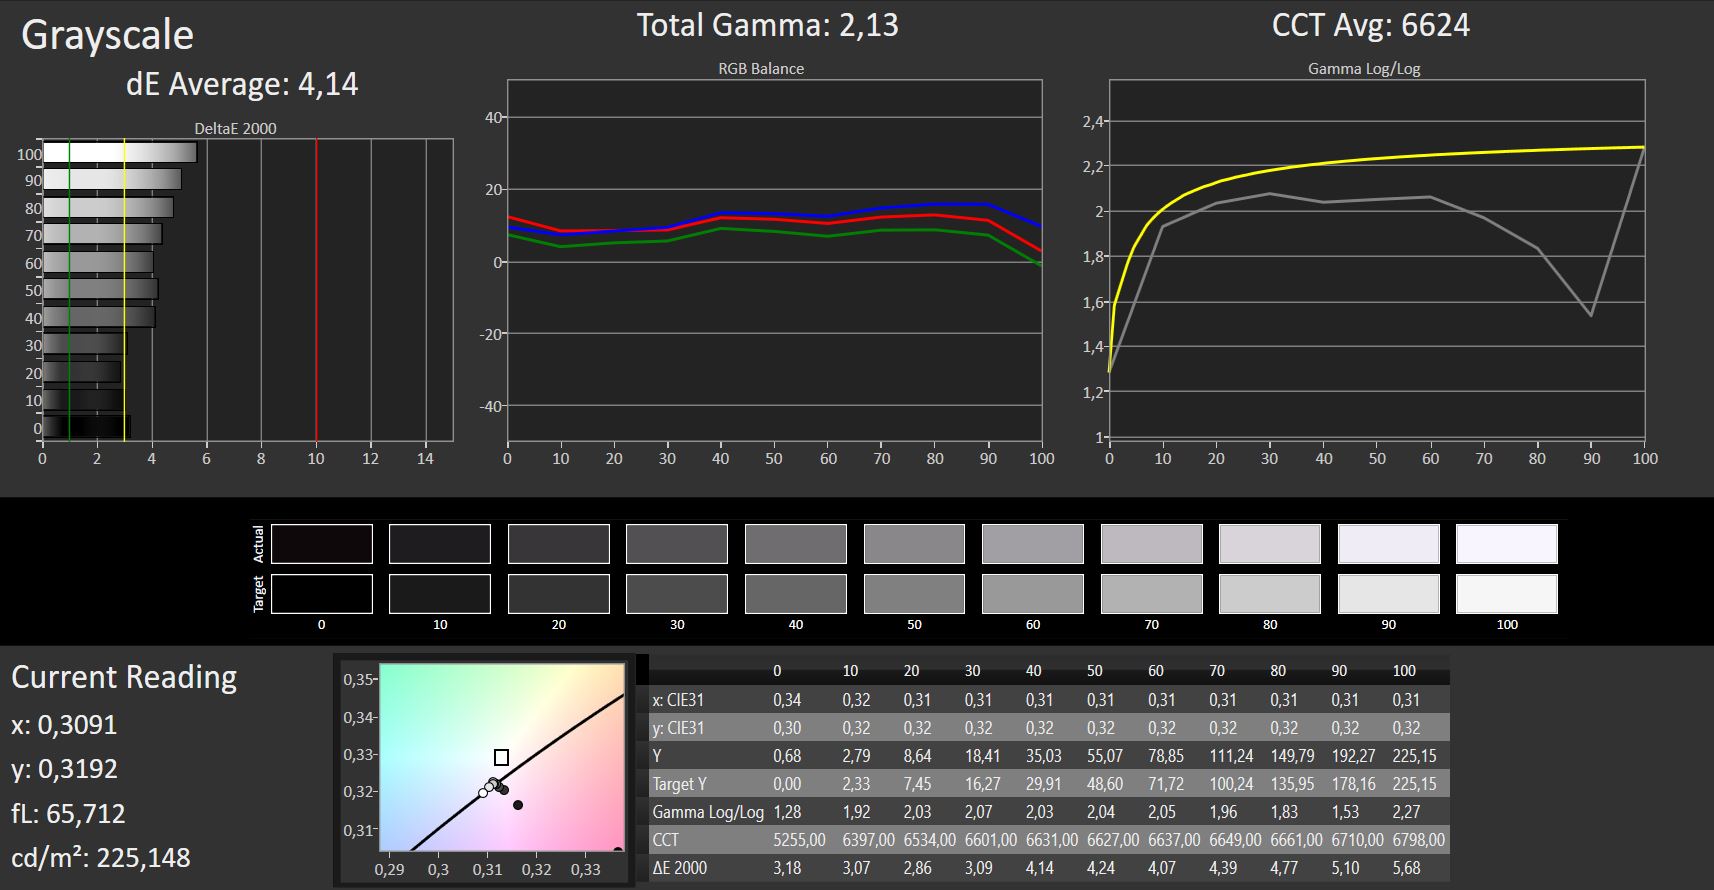
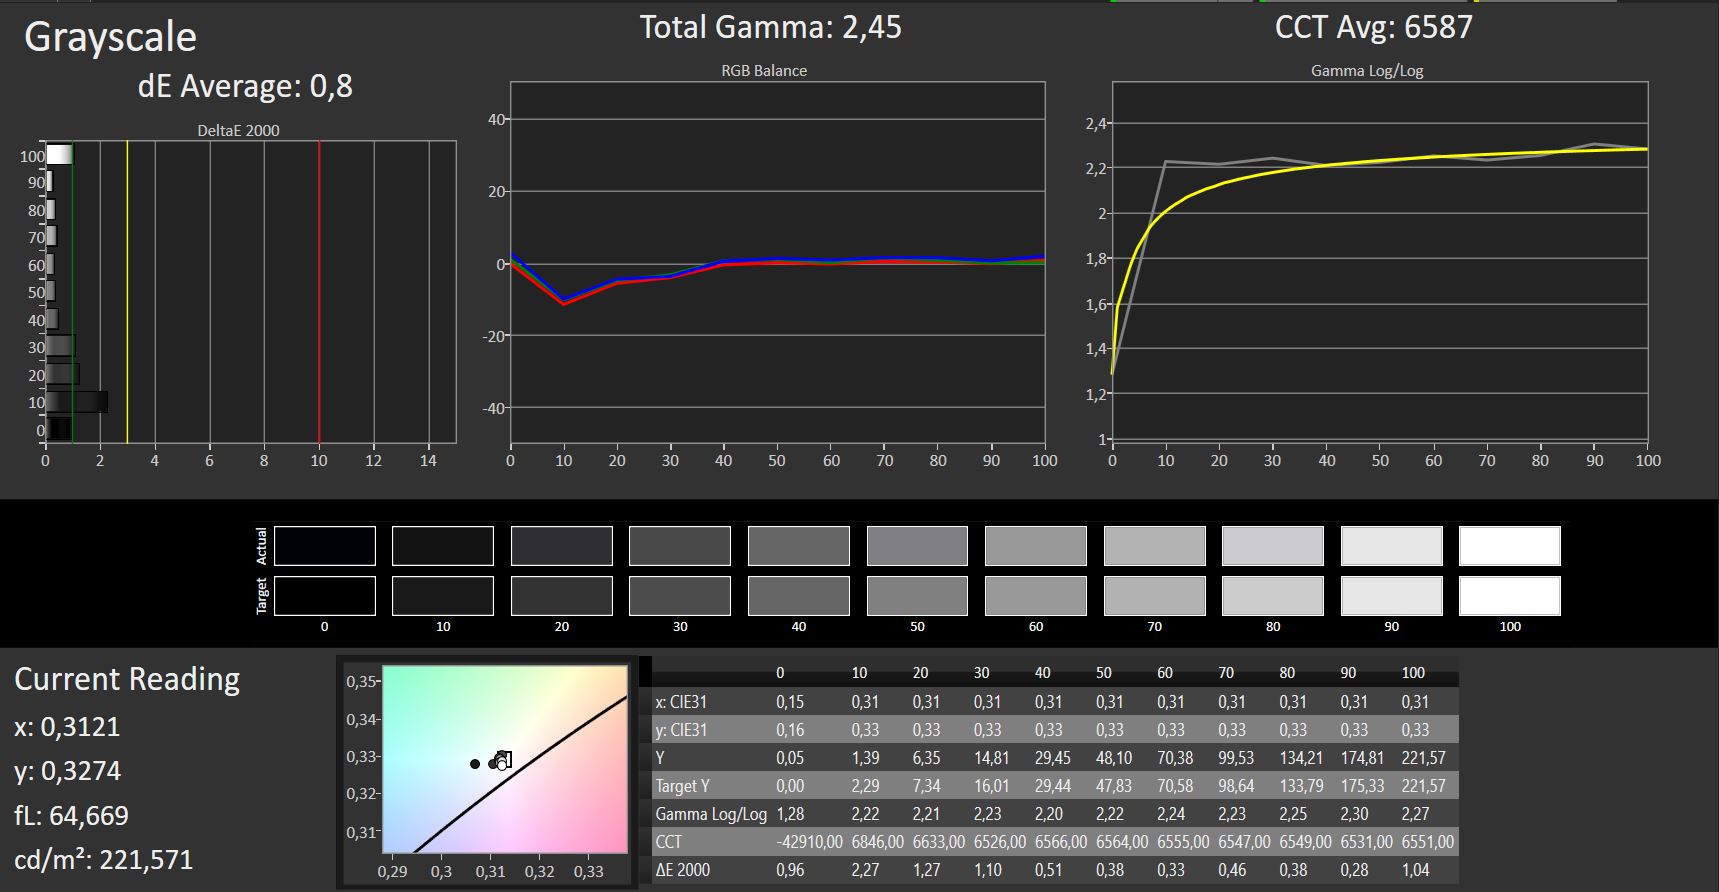
ΔE Greyscale 4.14 | 0.57-98 Ø5.3
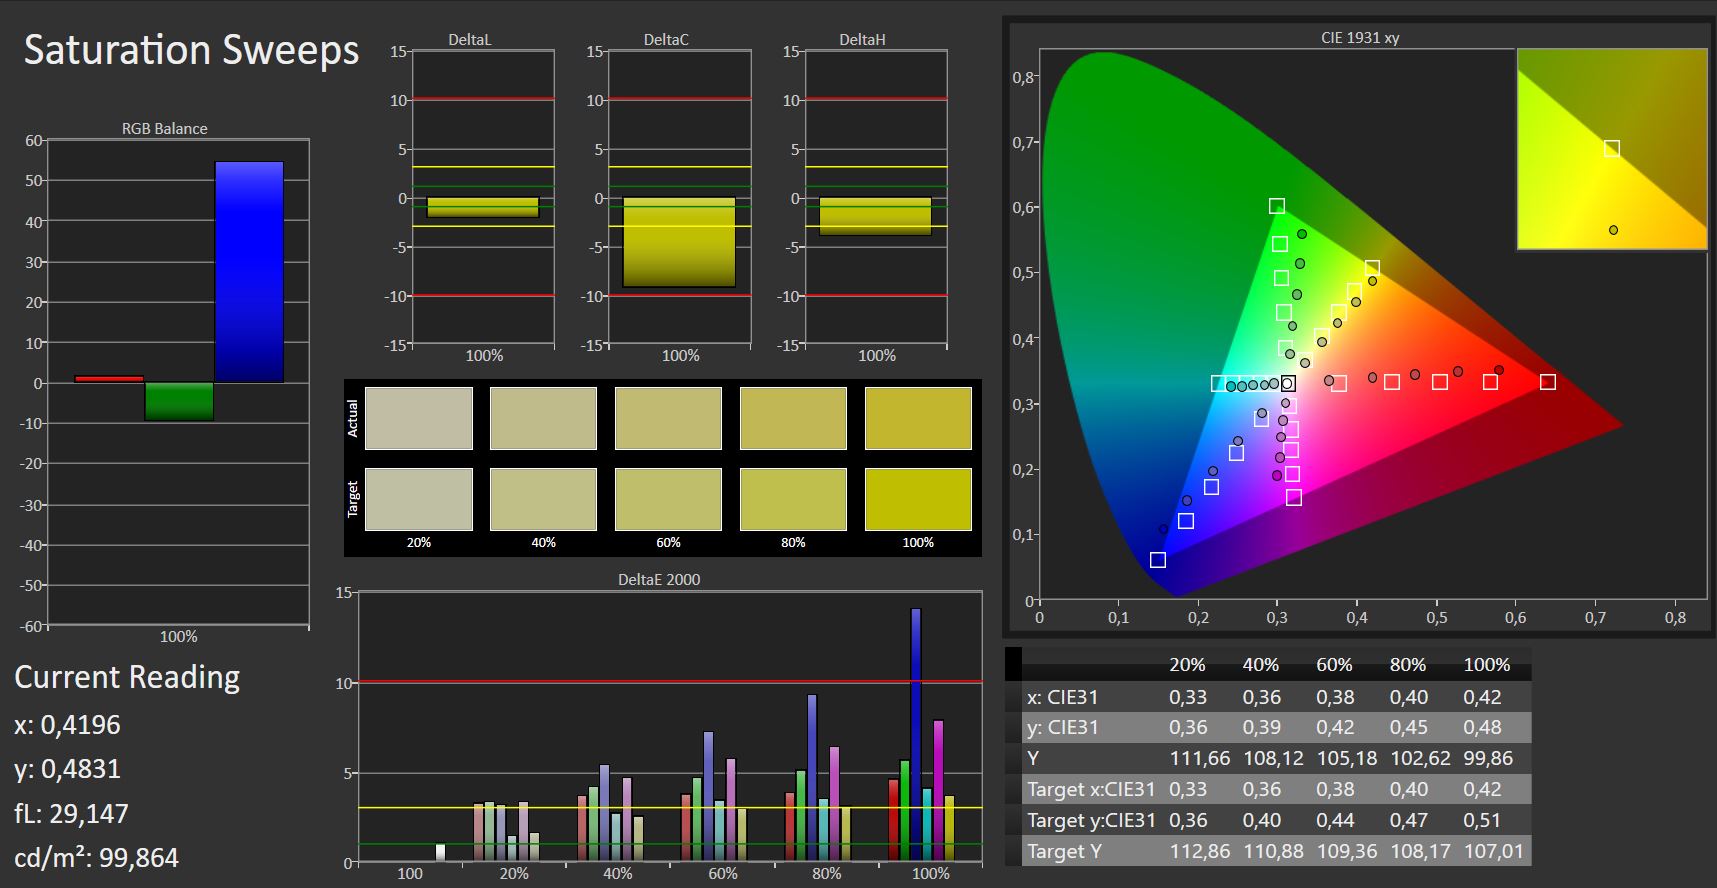
61% sRGB (Argyll 1.6.3 3D)
39% AdobeRGB 1998 (Argyll 1.6.3 3D)
42.03% AdobeRGB 1998 (Argyll 2.2.0 3D)
61.2% sRGB (Argyll 2.2.0 3D)
40.67% Display P3 (Argyll 2.2.0 3D)
Gamma: 2.13
| HP ProBook 645 G4 3UP62EA IPS, 1920x1080, 14.00 | HP ProBook 640 G3 Z2W33ET TN LED, 1920x1080, 14.00 | Dell Latitude 5490-TD70X IPS, 1920x1080, 14.00 | Fujitsu Lifebook E548 IPS, 1920x1080, 14.00 | Lenovo ThinkPad L480-20LS001AGE IPS, 1920x1080, 14.00 | |
|---|---|---|---|---|---|
| Display | 22% | -11% | -4% | -11% | |
| Display P3 Coverage | 40.67 | 49.46 22% | 36.28 -11% | 39.21 -4% | 36.37 -11% |
| sRGB Coverage | 61.2 | 74.5 22% | 54.6 -11% | 58.5 -4% | 54.7 -11% |
| AdobeRGB 1998 Coverage | 42.03 | 51.1 22% | 37.48 -11% | 40.56 -3% | 37.57 -11% |
| Response Times | 18% | -31% | 8% | -74% | |
| Response Time Grey 50% / Grey 80% * | 33 ? | 41 ? -24% | 46.9 ? -42% | 34 ? -3% | 73 ? -121% |
| Response Time Black / White * | 26 ? | 30 ? -15% | 31.2 ? -20% | 21 ? 19% | 33 ? -27% |
| PWM Frequency | 100 ? | 192 ? 92% | |||
| Screen | -14% | 12% | 9% | 40% | |
| Brightness middle | 225 | 343 52% | 227 1% | 278 24% | 222 -1% |
| Brightness | 209 | 332 59% | 211 1% | 240 15% | 209 0% |
| Brightness Distribution | 89 | 88 -1% | 88 -1% | 78 -12% | 73 -18% |
| Black Level * | 0.68 | 0.69 -1% | 0.19 72% | 0.27 60% | 0.17 75% |
| Contrast | 331 | 497 50% | 1195 261% | 1030 211% | 1306 295% |
| Colorchecker dE 2000 * | 4.54 | 9.06 -100% | 5.6 -23% | 5.57 -23% | 3.91 14% |
| Colorchecker dE 2000 max. * | 7.2 | 14.84 -106% | 22.4 -211% | 11.01 -53% | 7.74 -8% |
| Colorchecker dE 2000 calibrated * | 2.87 | 5.63 -96% | |||
| Greyscale dE 2000 * | 4.14 | 9.87 -138% | 2.4 42% | 4.94 -19% | 1.56 62% |
| Gamma | 2.13 103% | 2.5 88% | 2.44 90% | 2.6 85% | 2.53 87% |
| CCT | 6624 98% | 11115 58% | 6506 100% | 7322 89% | 6701 97% |
| Color Space (Percent of AdobeRGB 1998) | 39 | 47 21% | 34.5 -12% | 37 -5% | 35 -10% |
| Color Space (Percent of sRGB) | 61 | 75 23% | 54.4 -11% | 58 -5% | 55 -10% |
| Total Average (Program / Settings) | 9% /
-1% | -10% /
2% | 4% /
6% | -15% /
15% |
* ... smaller is better
Screen Flickering / PWM (Pulse-Width Modulation)
| Screen flickering / PWM detected | 100 Hz | ≤ 30 % brightness setting | 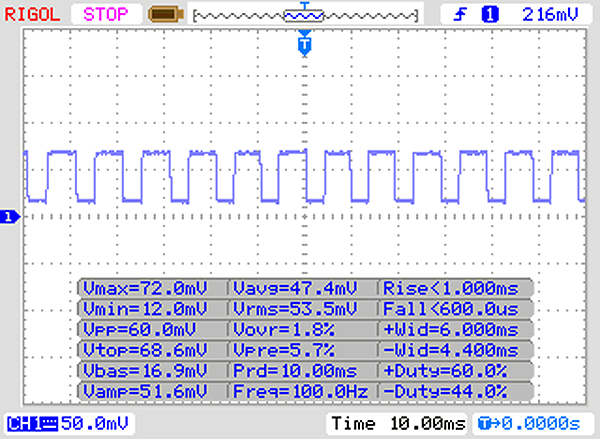 |
The display backlight flickers at 100 Hz (worst case, e.g., utilizing PWM) Flickering detected at a brightness setting of 30 % and below. There should be no flickering or PWM above this brightness setting. The frequency of 100 Hz is very low, so the flickering may cause eyestrain and headaches after extended use. In comparison: 53 % of all tested devices do not use PWM to dim the display. If PWM was detected, an average of 17900 (minimum: 5 - maximum: 3846000) Hz was measured. | |||
Display Response Times
| ↔ Response Time Black to White | ||
|---|---|---|
| 26 ms ... rise ↗ and fall ↘ combined | ↗ 16 ms rise | 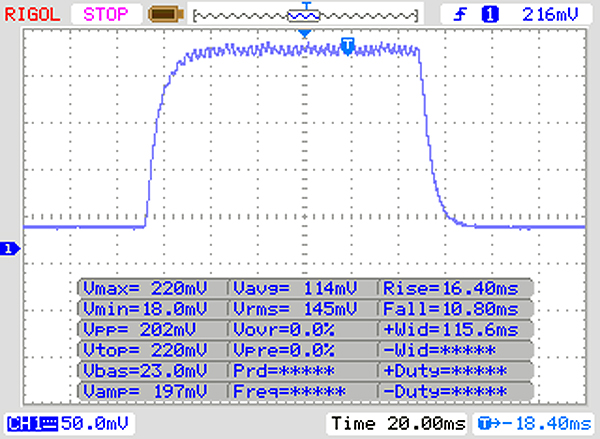 |
| ↘ 10 ms fall | ||
| The screen shows relatively slow response rates in our tests and may be too slow for gamers. In comparison, all tested devices range from 0.1 (minimum) to 240 (maximum) ms. » 57 % of all devices are better. This means that the measured response time is worse than the average of all tested devices (21.5 ms). | ||
| ↔ Response Time 50% Grey to 80% Grey | ||
| 33 ms ... rise ↗ and fall ↘ combined | ↗ 14 ms rise | 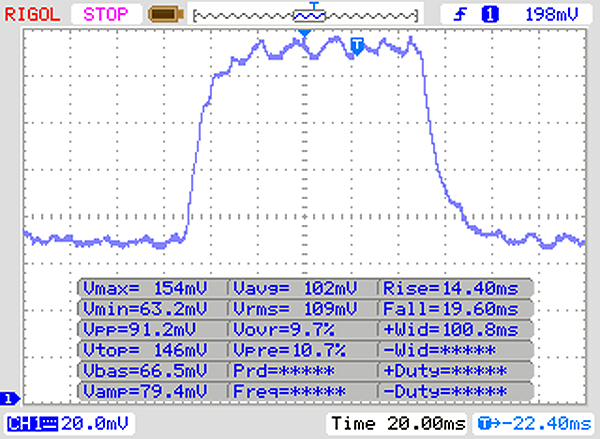 |
| ↘ 19 ms fall | ||
| The screen shows slow response rates in our tests and will be unsatisfactory for gamers. In comparison, all tested devices range from 0.2 (minimum) to 636 (maximum) ms. » 38 % of all devices are better. This means that the measured response time is similar to the average of all tested devices (33.7 ms). | ||
| Mozilla Kraken 1.1 - Total | |
| Average AMD Ryzen 5 PRO 2500U (1376 - 1659, n=3) | |
| HP ProBook 645 G4 3UP62EA (Edge 42) | |
| HP Envy x360 15-bq102ng (Edge 41) | |
| Acer Swift 3 SF315-41G-R6BR (Edge 42) | |
| Lenovo ThinkPad L480-20LS001AGE (Edge 41.16299.248.0) | |
| HP ProBook 640 G3 Z2W33ET (Edge 38) | |
| Average of class Office (479 - 1966, n=112, last 2 years) | |
| Octane V2 - Total Score | |
| Average of class Office (21416 - 93596, n=52, last 2 years) | |
| HP ProBook 640 G3 Z2W33ET (Edge 38) | |
| Lenovo ThinkPad L480-20LS001AGE (Edge 41.16299.248.0) | |
| Acer Swift 3 SF315-41G-R6BR (Edge 42) | |
| HP Envy x360 15-bq102ng (Edge 41) | |
| Average AMD Ryzen 5 PRO 2500U (23903 - 24713, n=2) | |
| HP ProBook 645 G4 3UP62EA (Edge 42) | |
| JetStream 1.1 - Total Score | |
| Average of class Office (117.1 - 544, n=18, last 2 years) | |
| Lenovo ThinkPad L480-20LS001AGE (Edge 41.16299.248.0) | |
| HP ProBook 640 G3 Z2W33ET (Edge 38) | |
| HP Envy x360 15-bq102ng (Edge 41) | |
| Acer Swift 3 SF315-41G-R6BR (Edge 42) | |
| HP ProBook 645 G4 3UP62EA (Edge 42) | |
| Fujitsu Lifebook E548 | |
| Average AMD Ryzen 5 PRO 2500U (117.7 - 182.9, n=3) | |
* ... smaller is better
| PCMark 7 Score | 5885 pontos | |
| PCMark 8 Home Score Accelerated v2 | 3594 pontos | |
| PCMark 8 Work Score Accelerated v2 | 4647 pontos | |
| PCMark 10 Score | 3376 pontos | |
Ajuda | ||

| HP ProBook 645 G4 3UP62EA Toshiba XG5 KXG50ZNV256G | Dell Latitude 5490-TD70X Toshiba KSG60ZMV512G | Fujitsu Lifebook E548 Samsung SSD PM871b MZNLN256HAJQ | Lenovo ThinkPad L480-20LS001AGE Toshiba KXG5AZNV256G | Average Toshiba XG5 KXG50ZNV256G | |
|---|---|---|---|---|---|
| CrystalDiskMark 5.2 / 6 | -12% | -21% | 13% | 9% | |
| Write 4K | 112.8 | 90.4 -20% | 83.2 -26% | 110.8 -2% | 112.9 ? 0% |
| Read 4K | 36.54 | 28.24 -23% | 16.66 -54% | 36.46 0% | 32.1 ? -12% |
| Write Seq | 370.8 | 433.7 17% | 384.3 4% | 482.4 30% | 412 ? 11% |
| Read Seq | 1870 | 469.3 -75% | 466.8 -75% | 1425 -24% | 1818 ? -3% |
| Write 4K Q32T1 | 226.3 | 297.6 32% | 269.7 19% | 355.6 57% | 328 ? 45% |
| Read 4K Q32T1 | 301.9 | 293.9 -3% | 260 -14% | 405.6 34% | 323 ? 7% |
| Write Seq Q32T1 | 343.5 | 534 55% | 532 55% | 495.2 44% | 447 ? 30% |
| Read Seq Q32T1 | 2742 | 531 -81% | 545 -80% | 1777 -35% | 2492 ? -9% |
| 3DMark 06 Standard Score | 10807 pontos | |
| 3DMark 11 Performance | 3014 pontos | |
| 3DMark Ice Storm Standard Score | 66295 pontos | |
| 3DMark Cloud Gate Standard Score | 9329 pontos | |
| 3DMark Fire Strike Score | 1606 pontos | |
| 3DMark Time Spy Score | 604 pontos | |
Ajuda | ||
| 3DMark 11 - 1280x720 Performance GPU | |
| Average of class Office (1474 - 13132, n=113, last 2 years) | |
| HP ProBook 645 G4 3UP62EA (Dual-Channel) | |
| Average AMD Radeon RX Vega 8 (Ryzen 2000/3000) (1668 - 4317, n=44) | |
| HP ProBook 645 G4 3UP62EA | |
| Lenovo ThinkPad L480-20LS001AGE | |
| Dell Latitude 5490-TD70X | |
| Fujitsu Lifebook E548 | |
| HP ProBook 640 G3 Z2W33ET | |
| 3DMark 06 - 1280x1024 Standard Score AA:0x AF:0x | |
| Average of class Office (9852 - 40490, n=15, last 2 years) | |
| HP ProBook 645 G4 3UP62EA (Dual-Channel) | |
| Average AMD Radeon RX Vega 8 (Ryzen 2000/3000) (10336 - 20501, n=6) | |
| HP ProBook 645 G4 3UP62EA | |
| HP ProBook 640 G3 Z2W33ET | |
| Geekbench 4.0 - Compute OpenCL Score | |
| Average AMD Radeon RX Vega 8 (Ryzen 2000/3000) (24762 - 38738, n=5) | |
| HP ProBook 645 G4 3UP62EA (Dual-Channel) | |
| HP ProBook 645 G4 3UP62EA | |
| HP ProBook 640 G3 Z2W33ET | |
| Geekbench 4.4 - Compute OpenCL Score | |
| Average of class Office (15919 - 85960, n=17, last 2 years) | |
| HP ProBook 645 G4 3UP62EA (Dual-Channel) | |
| Average AMD Radeon RX Vega 8 (Ryzen 2000/3000) (23233 - 39262, n=27) | |
| HP ProBook 645 G4 3UP62EA | |
| Dell Latitude 5490-TD70X | |
| baixo | média | alto | ultra | |
| Tomb Raider (2013) | 95.7 | 57 | 43 | 20.2 |
| BioShock Infinite (2013) | 81.4 | 52.4 | 41.2 | 12.7 |
| Rise of the Tomb Raider (2016) | 29.9 | 19.6 | 10.6 | 8.2 |
| BioShock Infinite - 1366x768 Medium Preset | |
| Average AMD Radeon RX Vega 8 (Ryzen 2000/3000) (50.2 - 83, n=15) | |
| HP ProBook 645 G4 3UP62EA (Dual-Channel) | |
| HP ProBook 645 G4 3UP62EA | |
| Lenovo ThinkPad L480-20LS001AGE | |
| Fujitsu Lifebook E548 | |
| HP ProBook 640 G3 Z2W33ET | |
| Tomb Raider - 1366x768 Normal Preset AA:FX AF:4x | |
| Average of class Office (last 2 years) | |
| HP ProBook 645 G4 3UP62EA (Dual-Channel) | |
| Average AMD Radeon RX Vega 8 (Ryzen 2000/3000) (57 - 71.9, n=3) | |
| HP ProBook 645 G4 3UP62EA | |
| HP ProBook 640 G3 Z2W33ET | |
| Rise of the Tomb Raider - 1024x768 Lowest Preset | |
| HP ProBook 645 G4 3UP62EA (Dual-Channel) | |
| Average AMD Radeon RX Vega 8 (Ryzen 2000/3000) (27.7 - 49.3, n=10) | |
| HP ProBook 645 G4 3UP62EA | |
| Dell Latitude 5490-TD70X | |
| Lenovo ThinkPad L480-20LS001AGE | |
Barulho
| Ocioso |
| 30.8 / 30.8 / 30.8 dB |
| Carga |
| 34.7 / 36.4 dB |
 | ||
30 dB silencioso 40 dB(A) audível 50 dB(A) ruidosamente alto |
||
min: | ||
| HP ProBook 645 G4 3UP62EA R5 PRO 2500U, Vega 8 | HP ProBook 640 G3 Z2W33ET i5-7200U, HD Graphics 620 | Dell Latitude 5490-TD70X i5-8350U, UHD Graphics 620 | Fujitsu Lifebook E548 i5-8250U, UHD Graphics 620 | Lenovo ThinkPad L480-20LS001AGE i5-8250U, UHD Graphics 620 | Average AMD Radeon RX Vega 8 (Ryzen 2000/3000) | Average of class Office | |
|---|---|---|---|---|---|---|---|
| Noise | 4% | 0% | 3% | 2% | 3% | 11% | |
| off / environment * | 30.8 | 30.7 -0% | 28.8 6% | 30 3% | 30.4 1% | 29.3 ? 5% | 24.5 ? 20% |
| Idle Minimum * | 30.8 | 30.7 -0% | 28.8 6% | 30 3% | 30.4 1% | 29.7 ? 4% | 24.7 ? 20% |
| Idle Average * | 30.8 | 30.7 -0% | 28.8 6% | 30 3% | 30.4 1% | 29.9 ? 3% | 25 ? 19% |
| Idle Maximum * | 30.8 | 31.5 -2% | 30.9 -0% | 30 3% | 30.4 1% | 30.2 ? 2% | 26 ? 16% |
| Load Average * | 34.7 | 31.4 10% | 35.6 -3% | 35.3 -2% | 32.3 7% | 33.8 ? 3% | 34.7 ? -0% |
| Load Maximum * | 36.4 | 31.1 15% | 41.4 -14% | 33.9 7% | 37 -2% | 36.1 ? 1% | 40 ? -10% |
* ... smaller is better
(+) The maximum temperature on the upper side is 36.5 °C / 98 F, compared to the average of 34.2 °C / 94 F, ranging from 21.2 to 62.5 °C for the class Office.
(+) The bottom heats up to a maximum of 34.7 °C / 94 F, compared to the average of 36.7 °C / 98 F
(+) In idle usage, the average temperature for the upper side is 27.2 °C / 81 F, compared to the device average of 29.5 °C / 85 F.
(+) The palmrests and touchpad are cooler than skin temperature with a maximum of 26.4 °C / 79.5 F and are therefore cool to the touch.
(±) The average temperature of the palmrest area of similar devices was 27.7 °C / 81.9 F (+1.3 °C / 2.4 F).
| HP ProBook 645 G4 3UP62EA R5 PRO 2500U, Vega 8 | HP ProBook 640 G3 Z2W33ET i5-7200U, HD Graphics 620 | Dell Latitude 5490-TD70X i5-8350U, UHD Graphics 620 | Fujitsu Lifebook E548 i5-8250U, UHD Graphics 620 | Lenovo ThinkPad L480-20LS001AGE i5-8250U, UHD Graphics 620 | Average AMD Radeon RX Vega 8 (Ryzen 2000/3000) | Average of class Office | |
|---|---|---|---|---|---|---|---|
| Heat | 10% | 1% | -7% | -3% | -6% | -7% | |
| Maximum Upper Side * | 36.5 | 34 7% | 38.3 -5% | 40.3 -10% | 43 -18% | 40.1 ? -10% | 41 ? -12% |
| Maximum Bottom * | 34.7 | 33.2 4% | 44.7 -29% | 42.6 -23% | 41.7 -20% | 42.7 ? -23% | 43.7 ? -26% |
| Idle Upper Side * | 29.6 | 25.6 14% | 23.7 20% | 28 5% | 25.7 13% | 28.1 ? 5% | 28.1 ? 5% |
| Idle Bottom * | 31 | 26 16% | 25.4 18% | 31 -0% | 27.1 13% | 29.4 ? 5% | 29.4 ? 5% |
* ... smaller is better
HP ProBook 645 G4 3UP62EA audio analysis
(-) | not very loud speakers (68.6 dB)
Bass 100 - 315 Hz
(-) | nearly no bass - on average 29.9% lower than median
(±) | linearity of bass is average (8.9% delta to prev. frequency)
Mids 400 - 2000 Hz
(+) | balanced mids - only 4.4% away from median
(±) | linearity of mids is average (9.8% delta to prev. frequency)
Highs 2 - 16 kHz
(+) | balanced highs - only 3.7% away from median
(+) | highs are linear (3.7% delta to prev. frequency)
Overall 100 - 16.000 Hz
(±) | linearity of overall sound is average (27.2% difference to median)
Compared to same class
» 82% of all tested devices in this class were better, 6% similar, 11% worse
» The best had a delta of 7%, average was 22%, worst was 53%
Compared to all devices tested
» 80% of all tested devices were better, 4% similar, 16% worse
» The best had a delta of 4%, average was 25%, worst was 134%
Apple MacBook 12 (Early 2016) 1.1 GHz audio analysis
(+) | speakers can play relatively loud (83.6 dB)
Bass 100 - 315 Hz
(±) | reduced bass - on average 11.3% lower than median
(±) | linearity of bass is average (14.2% delta to prev. frequency)
Mids 400 - 2000 Hz
(+) | balanced mids - only 2.4% away from median
(+) | mids are linear (5.5% delta to prev. frequency)
Highs 2 - 16 kHz
(+) | balanced highs - only 2% away from median
(+) | highs are linear (4.5% delta to prev. frequency)
Overall 100 - 16.000 Hz
(+) | overall sound is linear (10.2% difference to median)
Compared to same class
» 5% of all tested devices in this class were better, 2% similar, 93% worse
» The best had a delta of 5%, average was 19%, worst was 53%
Compared to all devices tested
» 3% of all tested devices were better, 1% similar, 96% worse
» The best had a delta of 4%, average was 25%, worst was 134%
| desligado | |
| Ocioso | |
| Carga |
|
| HP ProBook 645 G4 3UP62EA R5 PRO 2500U, Vega 8 | HP ProBook 640 G3 Z2W33ET i5-7200U, HD Graphics 620 | Dell Latitude 5490-TD70X i5-8350U, UHD Graphics 620 | Fujitsu Lifebook E548 i5-8250U, UHD Graphics 620 | Lenovo ThinkPad L480-20LS001AGE i5-8250U, UHD Graphics 620 | Average AMD Radeon RX Vega 8 (Ryzen 2000/3000) | Average of class Office | |
|---|---|---|---|---|---|---|---|
| Power Consumption | 46% | 16% | 43% | 27% | 8% | 9% | |
| Idle Minimum * | 7.2 | 2.3 68% | 3.3 54% | 3.1 57% | 3.3 54% | 5.68 ? 21% | 4.3 ? 40% |
| Idle Average * | 9.7 | 5.2 46% | 5.54 43% | 5 48% | 6.6 32% | 8.75 ? 10% | 7.35 ? 24% |
| Idle Maximum * | 10.3 | 5.6 46% | 6.59 36% | 6.1 41% | 7.3 29% | 10.1 ? 2% | 9.15 ? 11% |
| Load Average * | 42 | 27.2 35% | 42.4 -1% | 27 36% | 40.4 4% | 37.8 ? 10% | 41.1 ? 2% |
| Load Maximum * | 44.2 | 28.7 35% | 67.6 -53% | 29.7 33% | 37.4 15% | 46.2 ? -5% | 58.1 ? -31% |
* ... smaller is better
| HP ProBook 645 G4 3UP62EA R5 PRO 2500U, Vega 8, 48 Wh | HP ProBook 640 G3 Z2W33ET i5-7200U, HD Graphics 620, 46 Wh | Dell Latitude 5490-TD70X i5-8350U, UHD Graphics 620, 68 Wh | Fujitsu Lifebook E548 i5-8250U, UHD Graphics 620, 50 Wh | Lenovo ThinkPad L480-20LS001AGE i5-8250U, UHD Graphics 620, 45 Wh | Average of class Office | |
|---|---|---|---|---|---|---|
| Battery Runtime | 113% | 153% | 75% | 59% | 119% | |
| Reader / Idle | 560 | 1477 164% | 1556 178% | 1011 81% | 1436 ? 156% | |
| H.264 | 253 | 519 105% | 791 213% | 479 89% | 705 ? 179% | |
| WiFi v1.3 | 290 | 523 80% | 897 209% | 507 75% | 460 59% | 594 ? 105% |
| Load | 88 | 177 101% | 97 10% | 92 5% | 117.7 ? 34% |
Pro
Contra
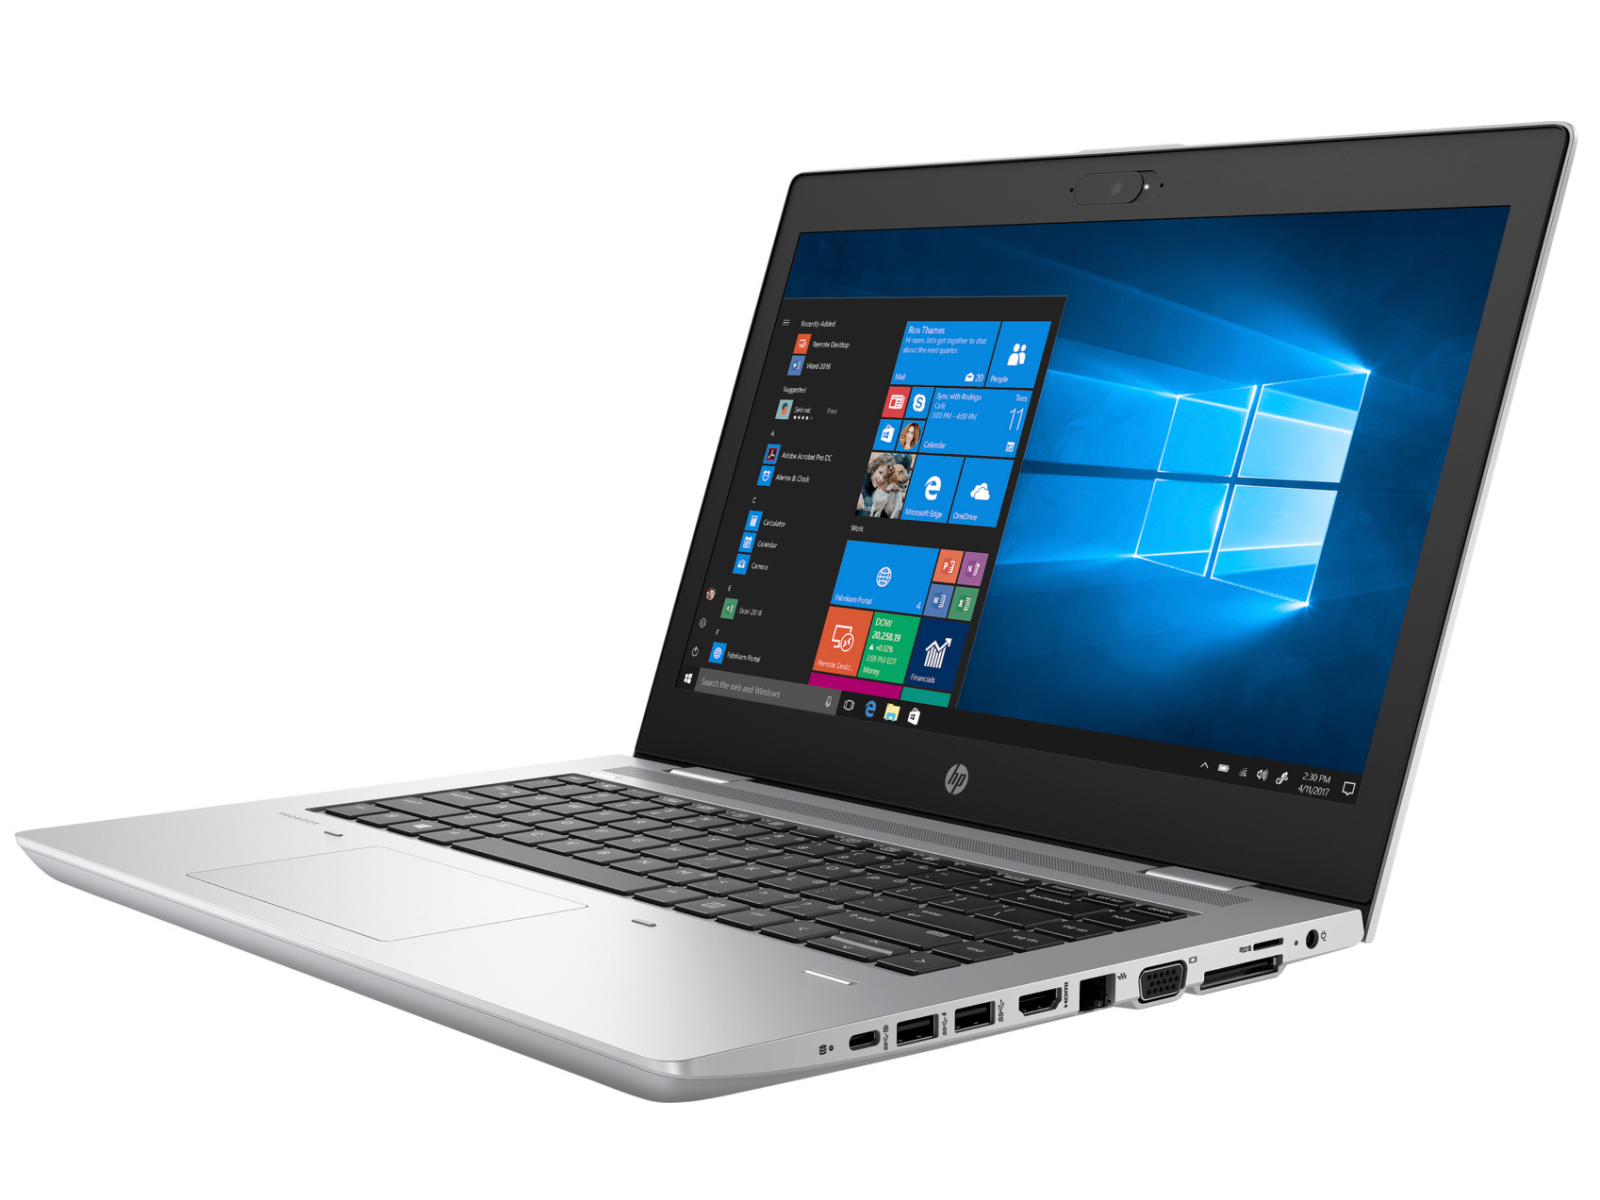
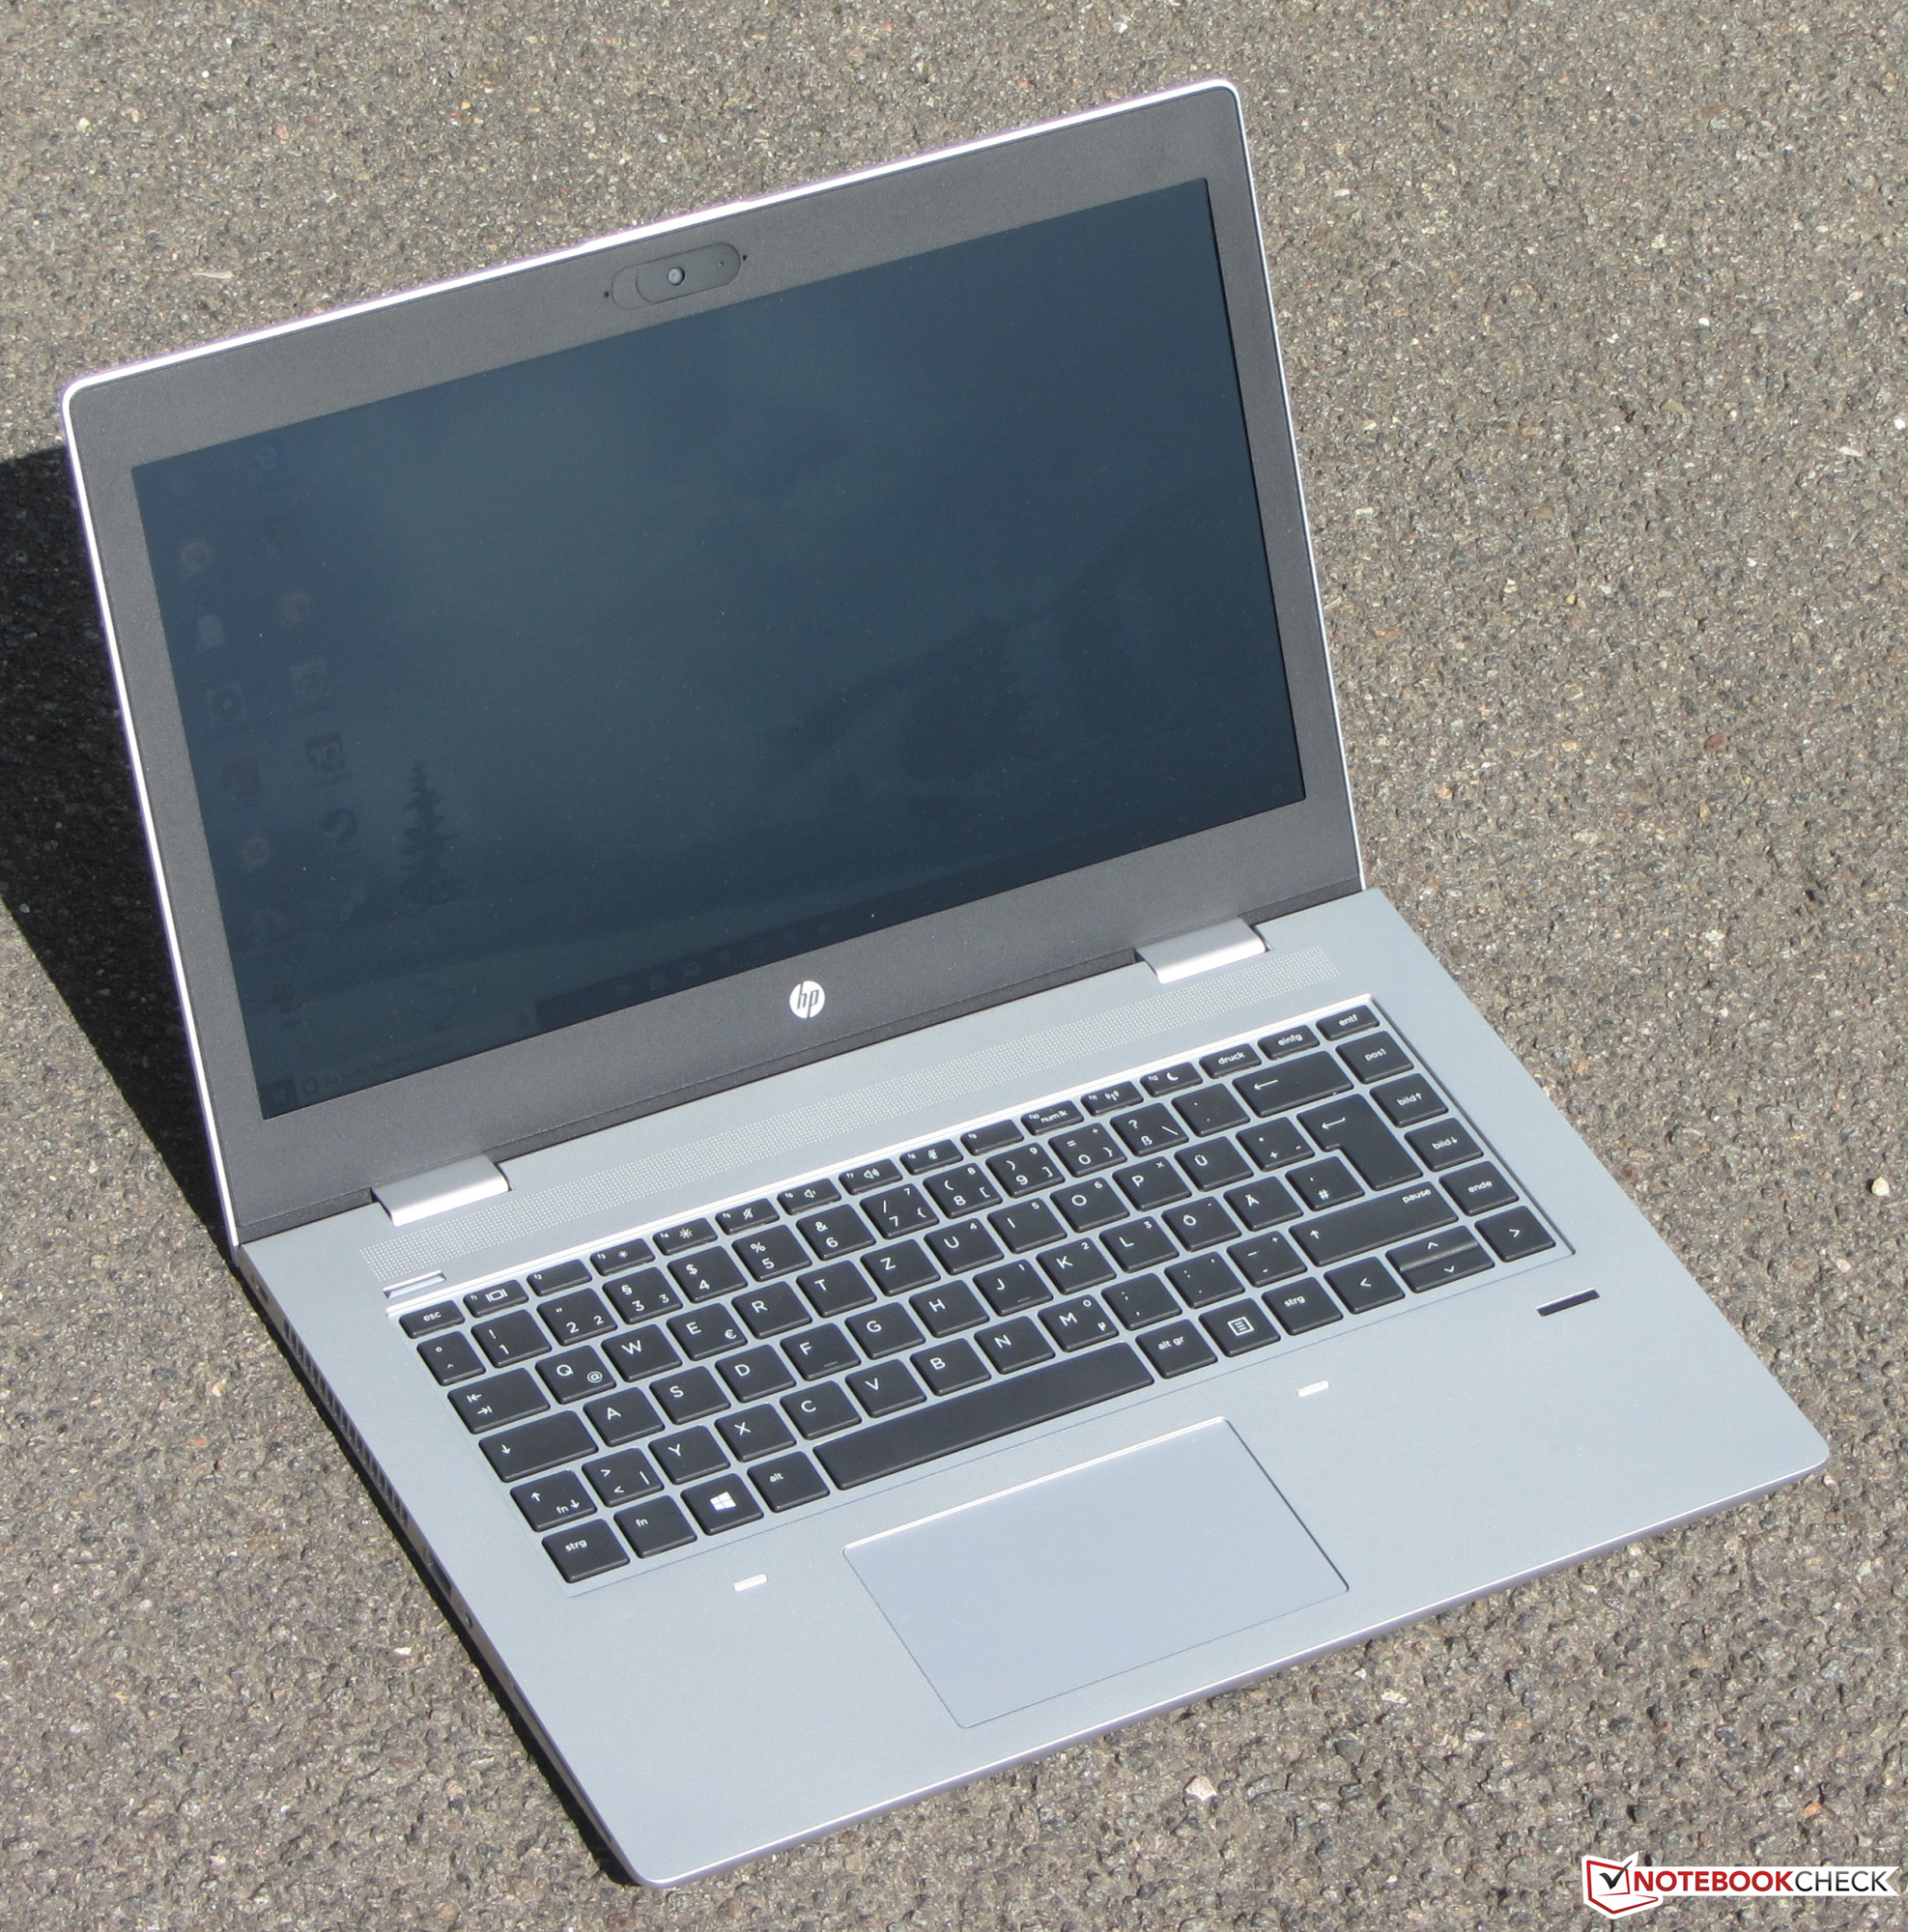
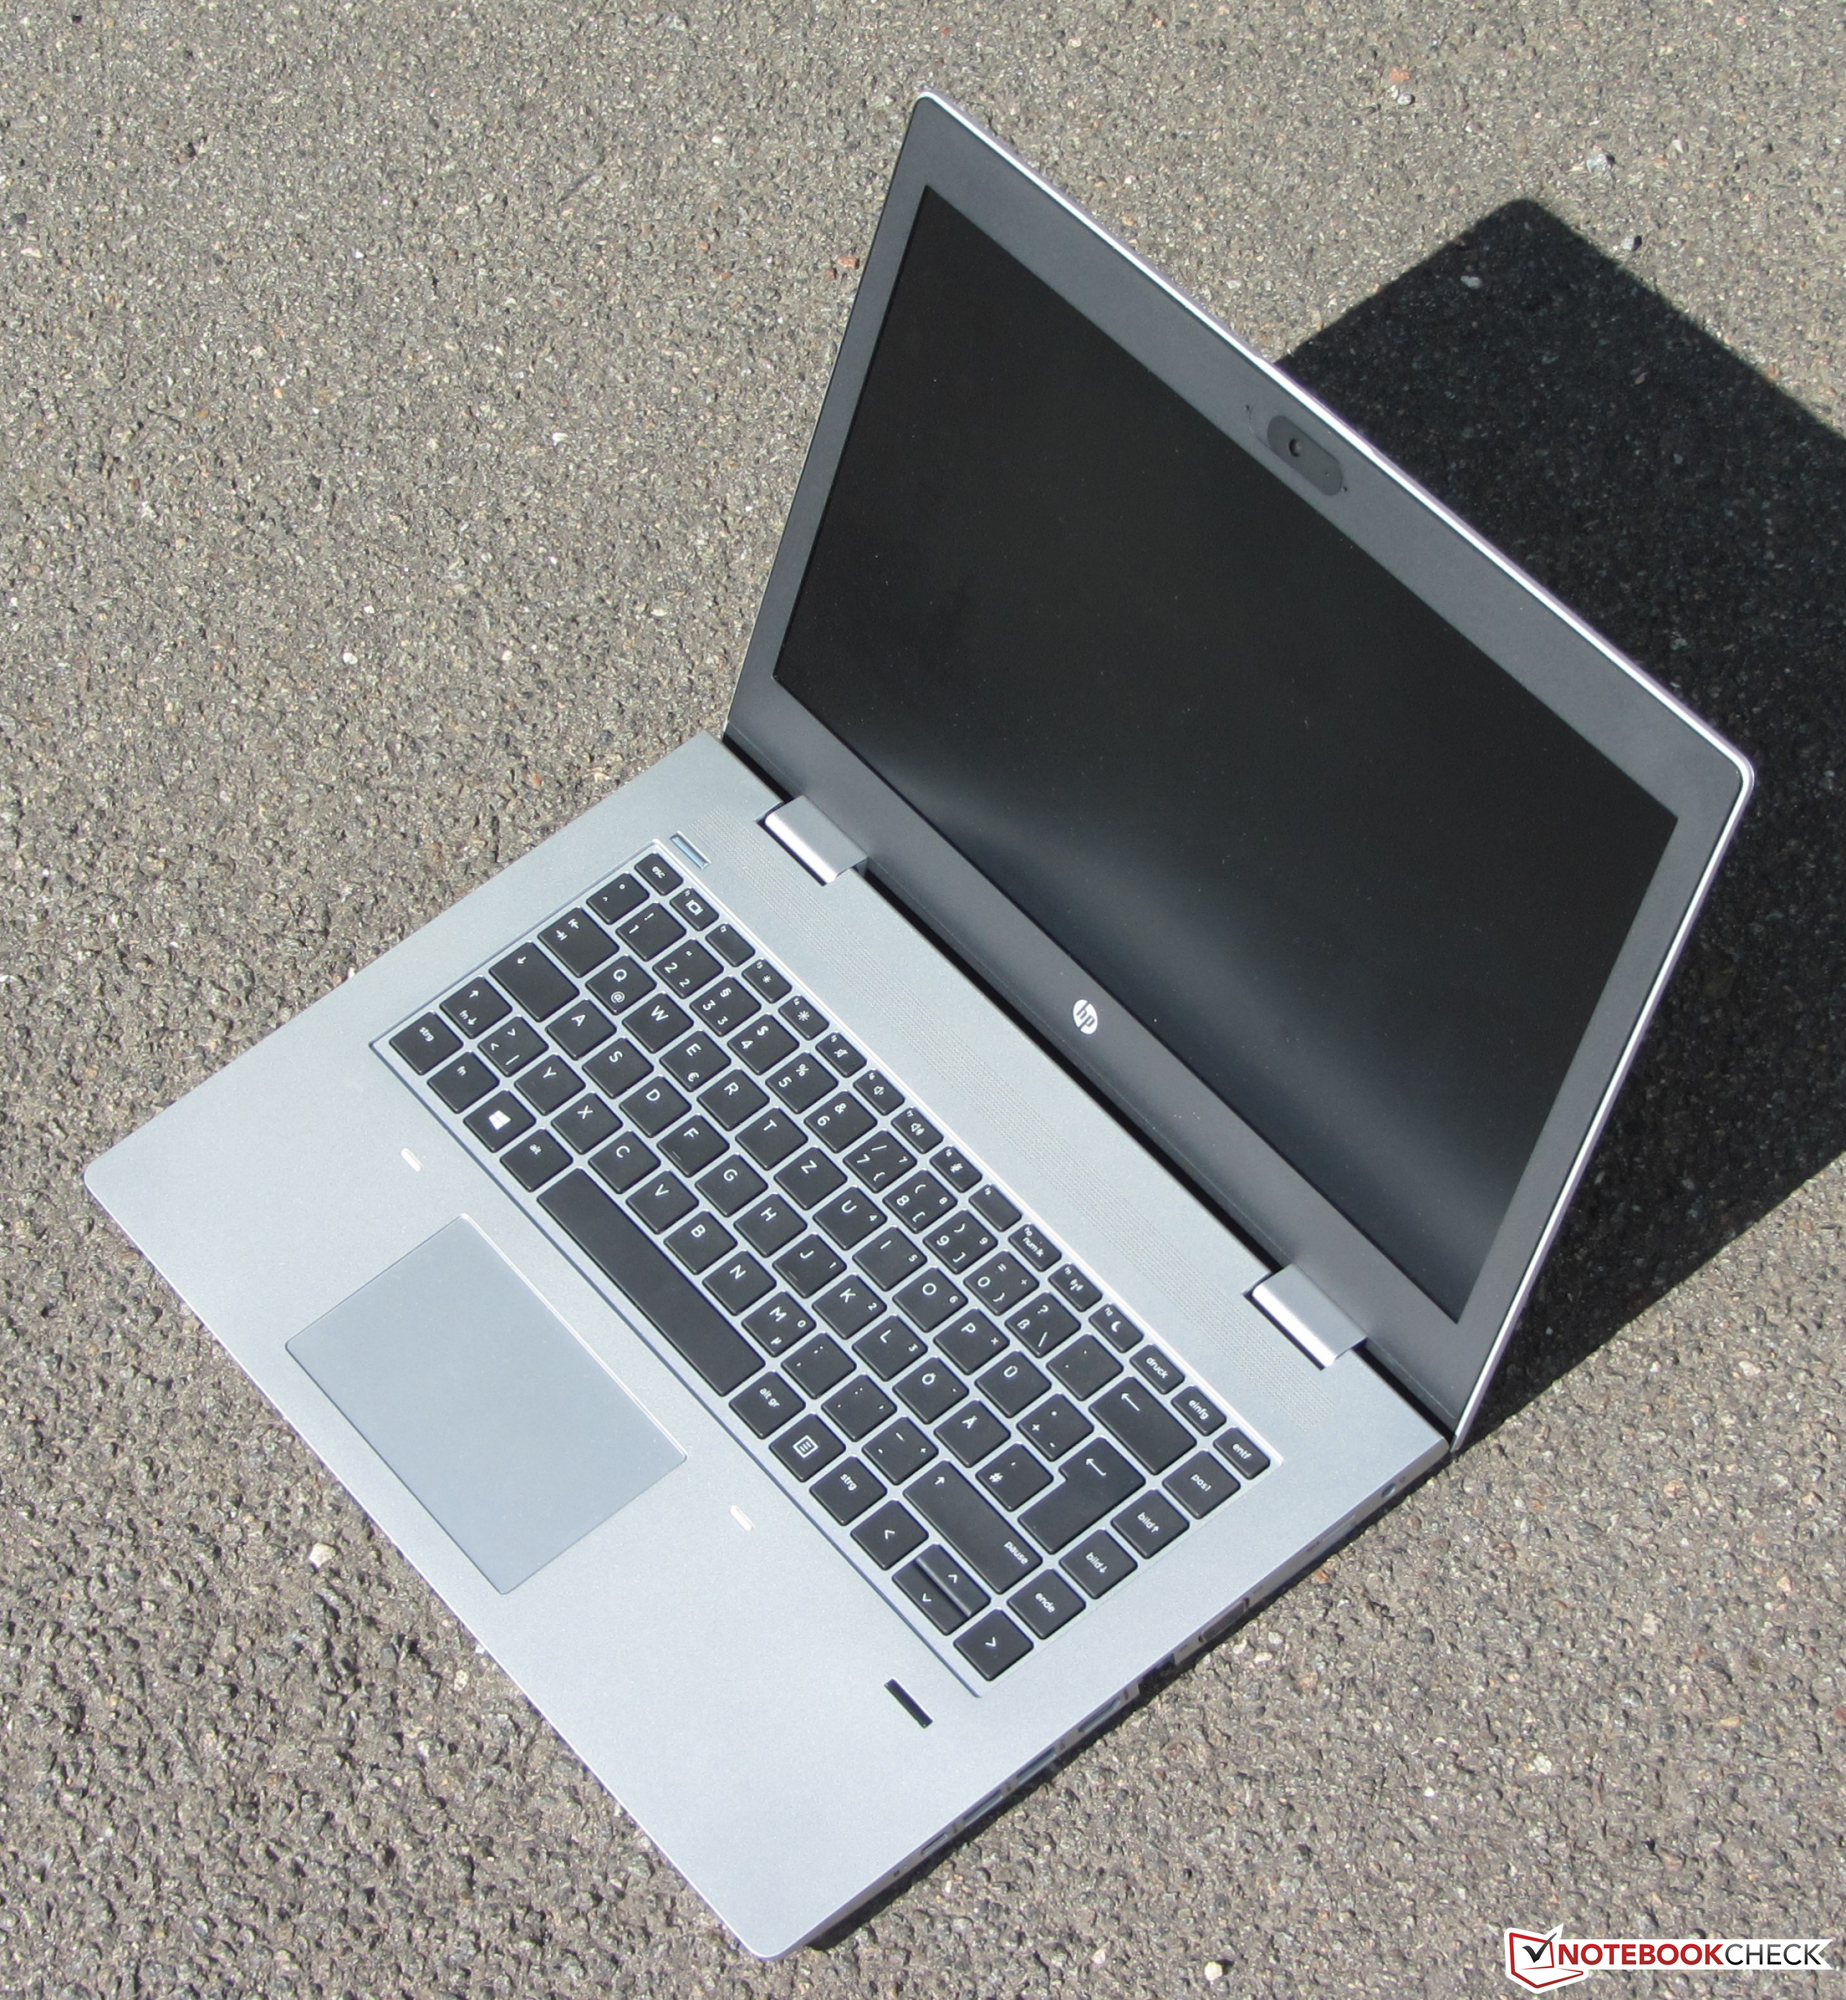
O ProBook 645 G4 é um portátil empresarial de gama média. Aqui a HP oferece uma carcaça completamente nova. Aqueles que esperam materiais de alto valor ficarão desapontados: A carcaça é feita inteiramente de plástico. Somente dispositivos de gama alta como o HP EliteBook 745 G1 oferecem uma carcaça de metal.
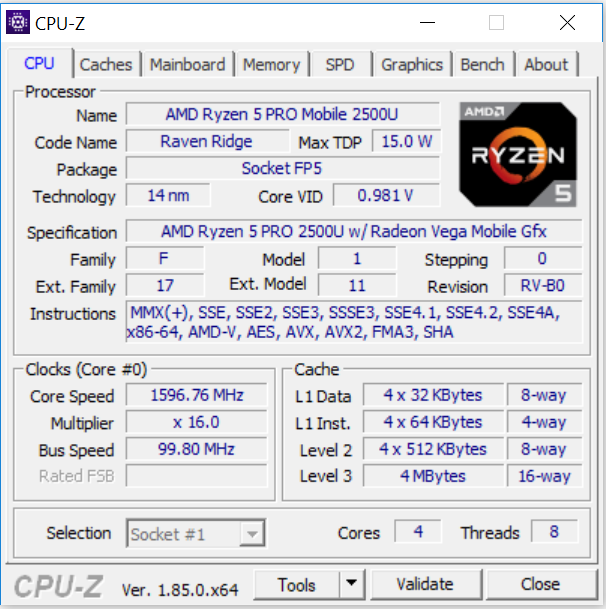
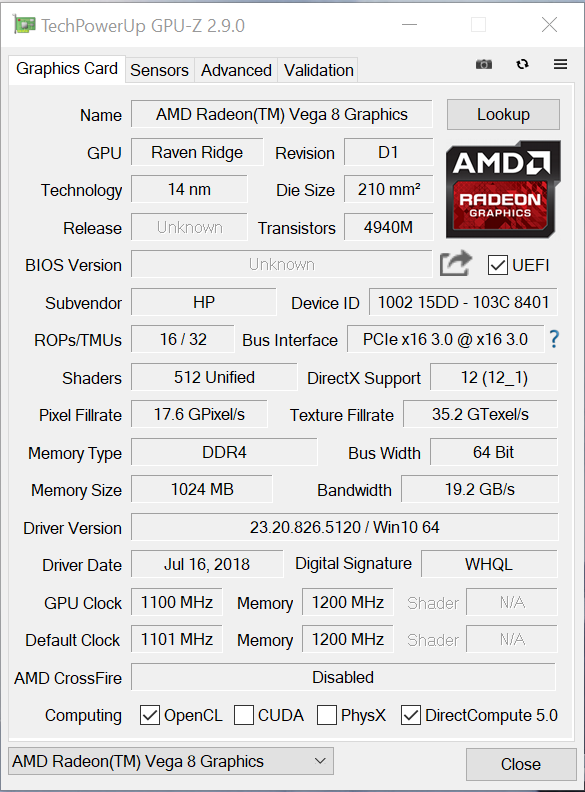
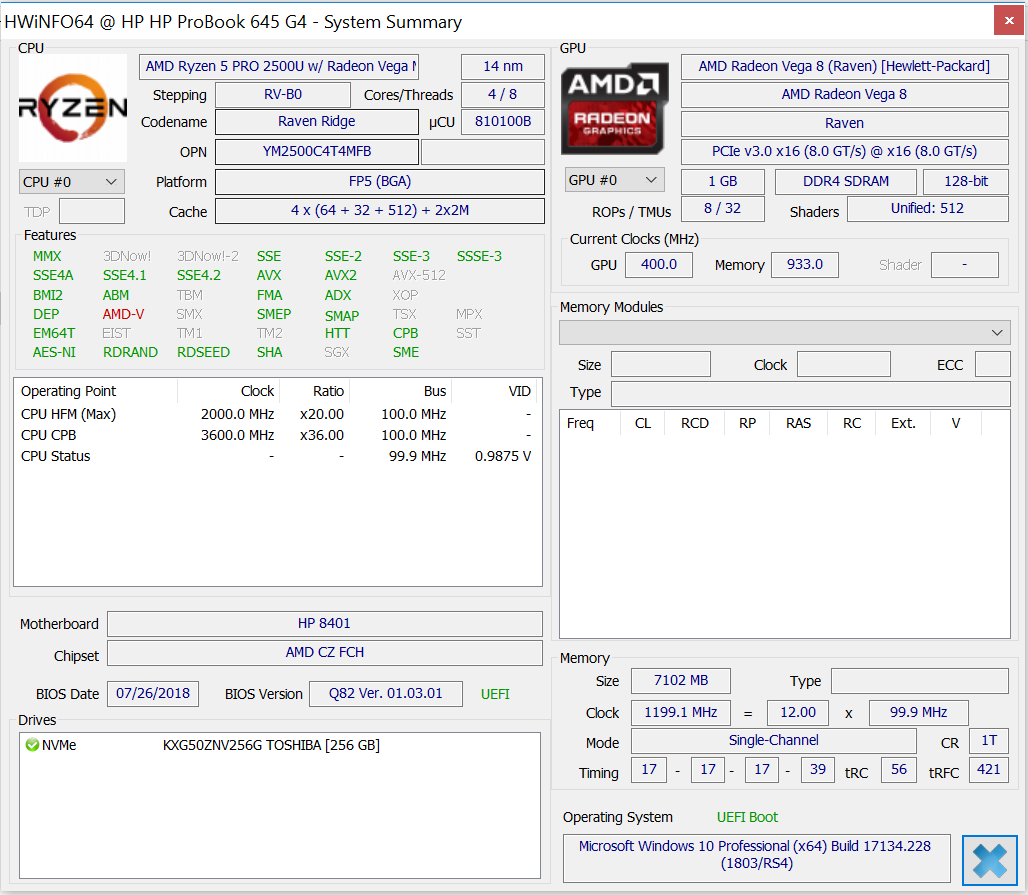
O portátil vem com uma APU Raven Ridge da AMD, que oferece desempenho mais que suficiente para todos os aplicativos atuais. A parte da CPU da APU fornece o mesmo nível de desempenho que os concorrentes baseados na Intel.
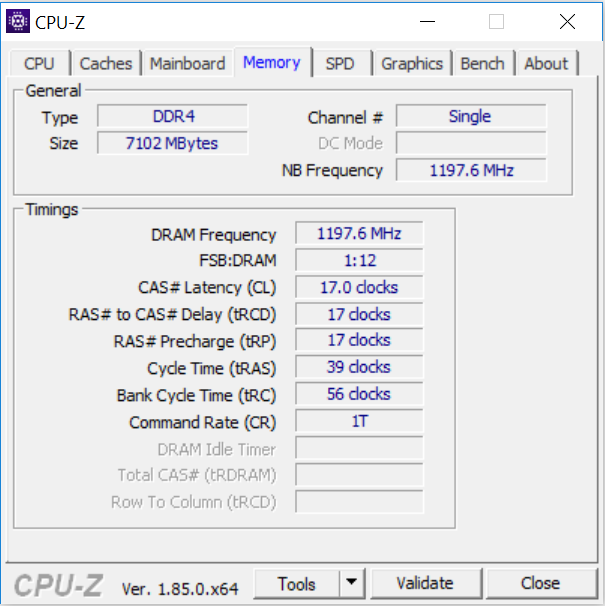
A GPU integrada oferece mais desempenho do que a solução da Intel (UHD Graphics 620) e pode executar muitos jogos com taxas de quadros fluentes. No entanto, a maioria dos jogos modernos é jogável apenas com resoluções e configurações baixas. Infelizmente, a HP não utiliza a GPU 100%, porque o sistema funciona no modo de canal único. Aqui, recomendamos a instalação de um segundo módulo de RAM para ativar o modo de canal duplo.
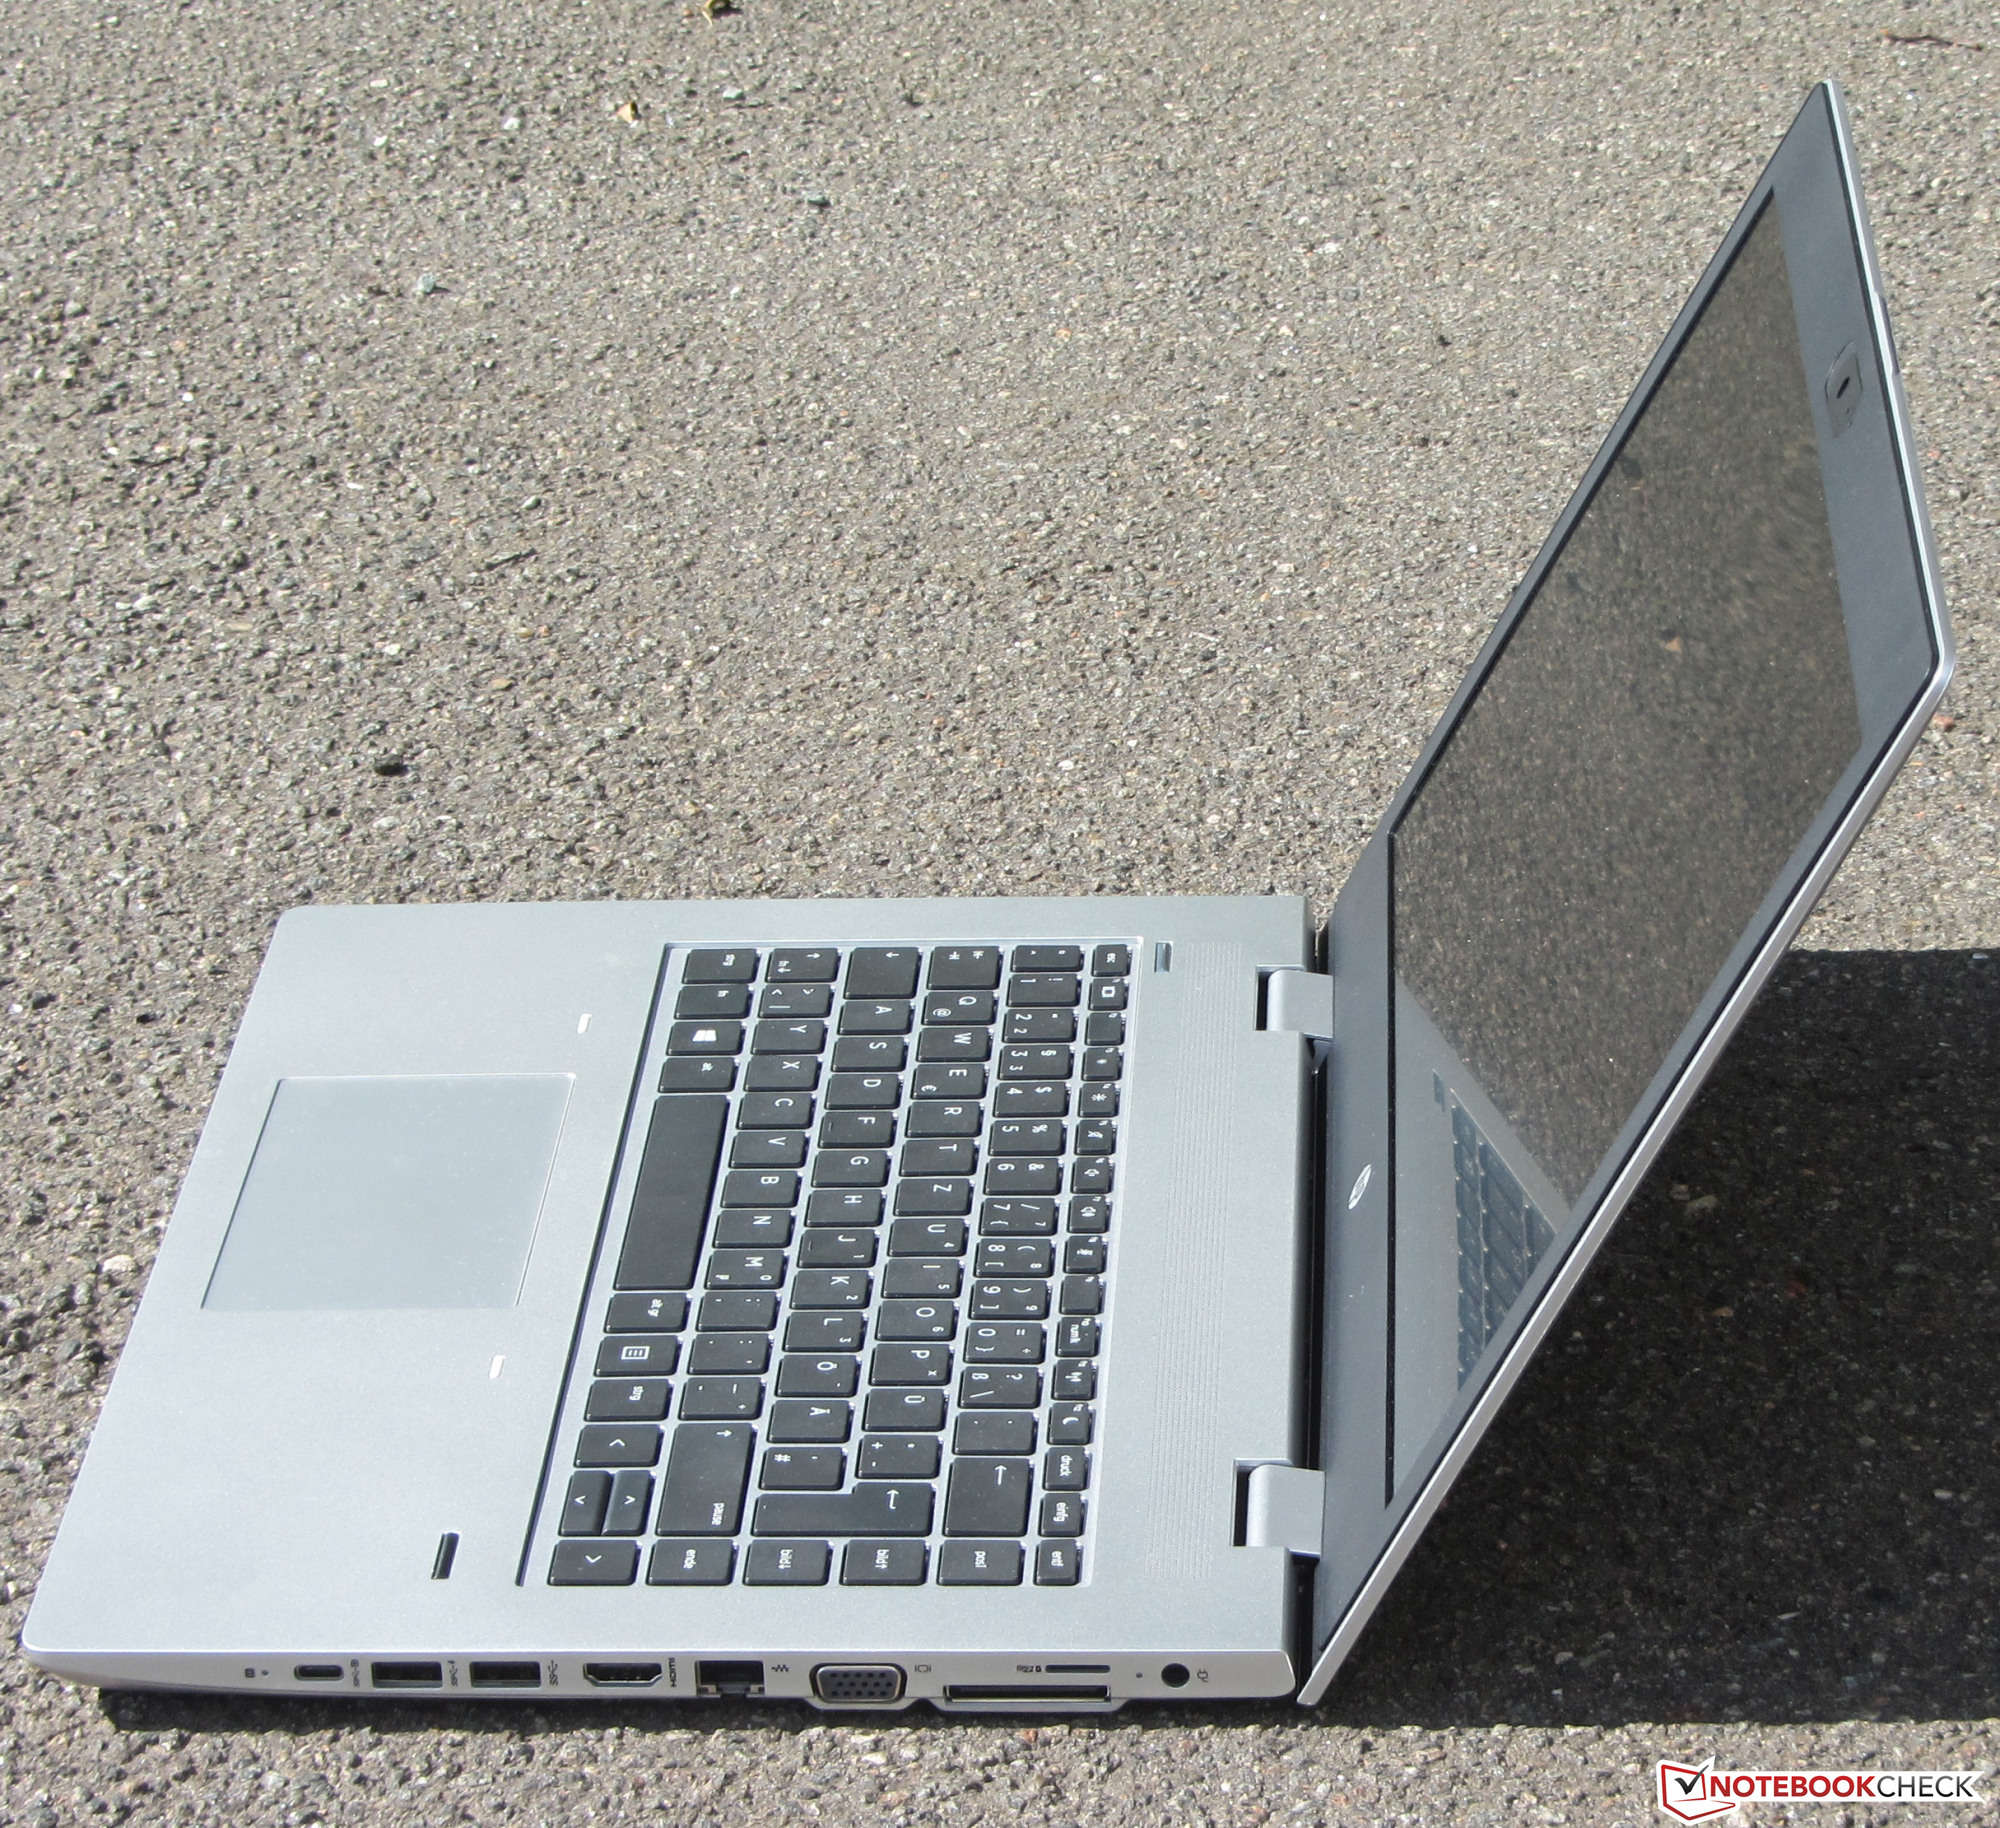
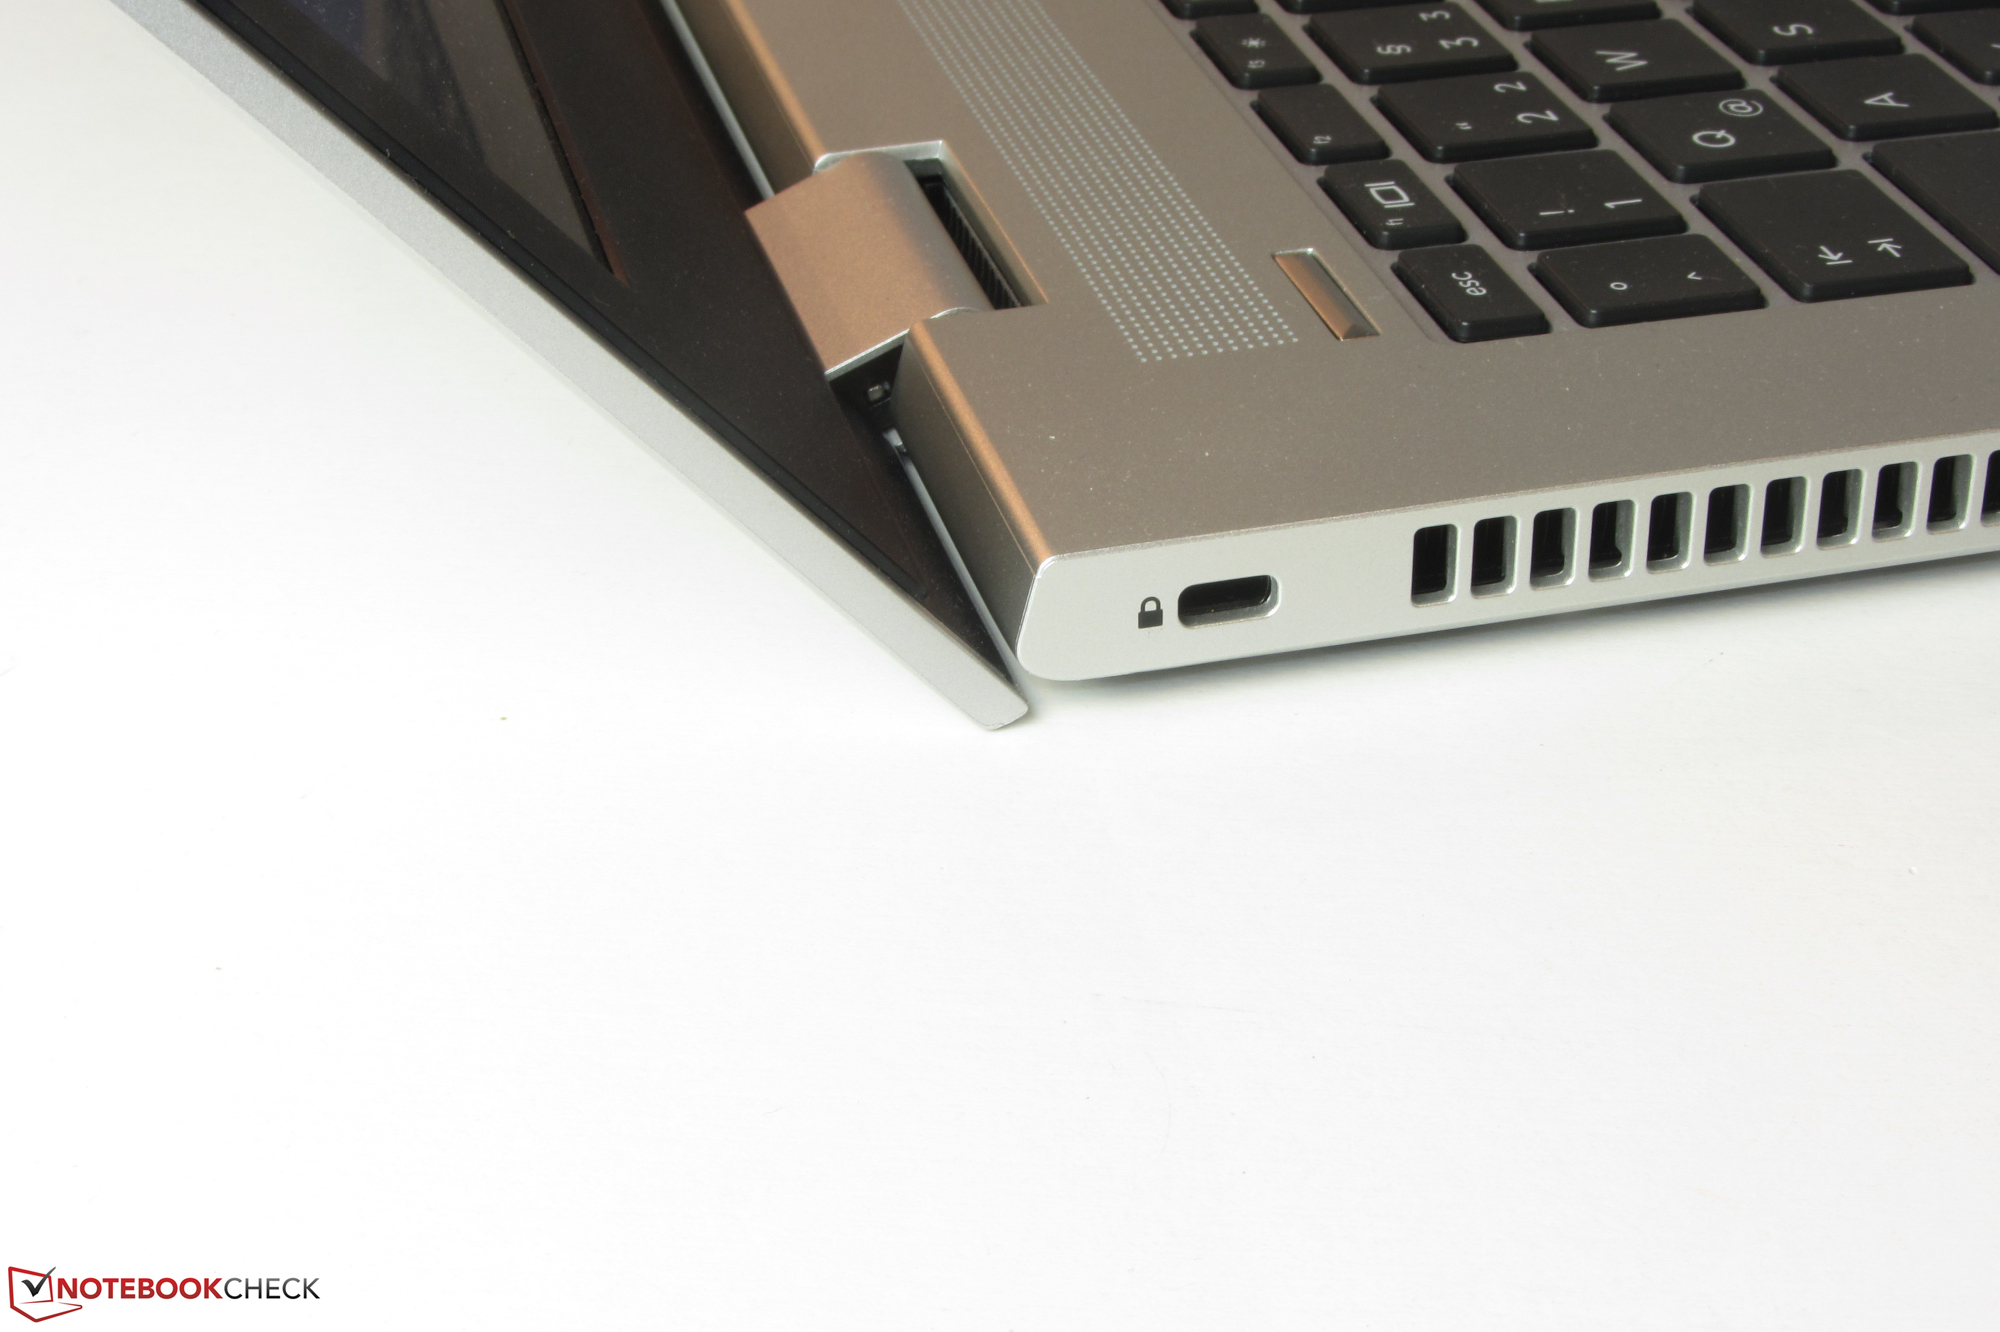
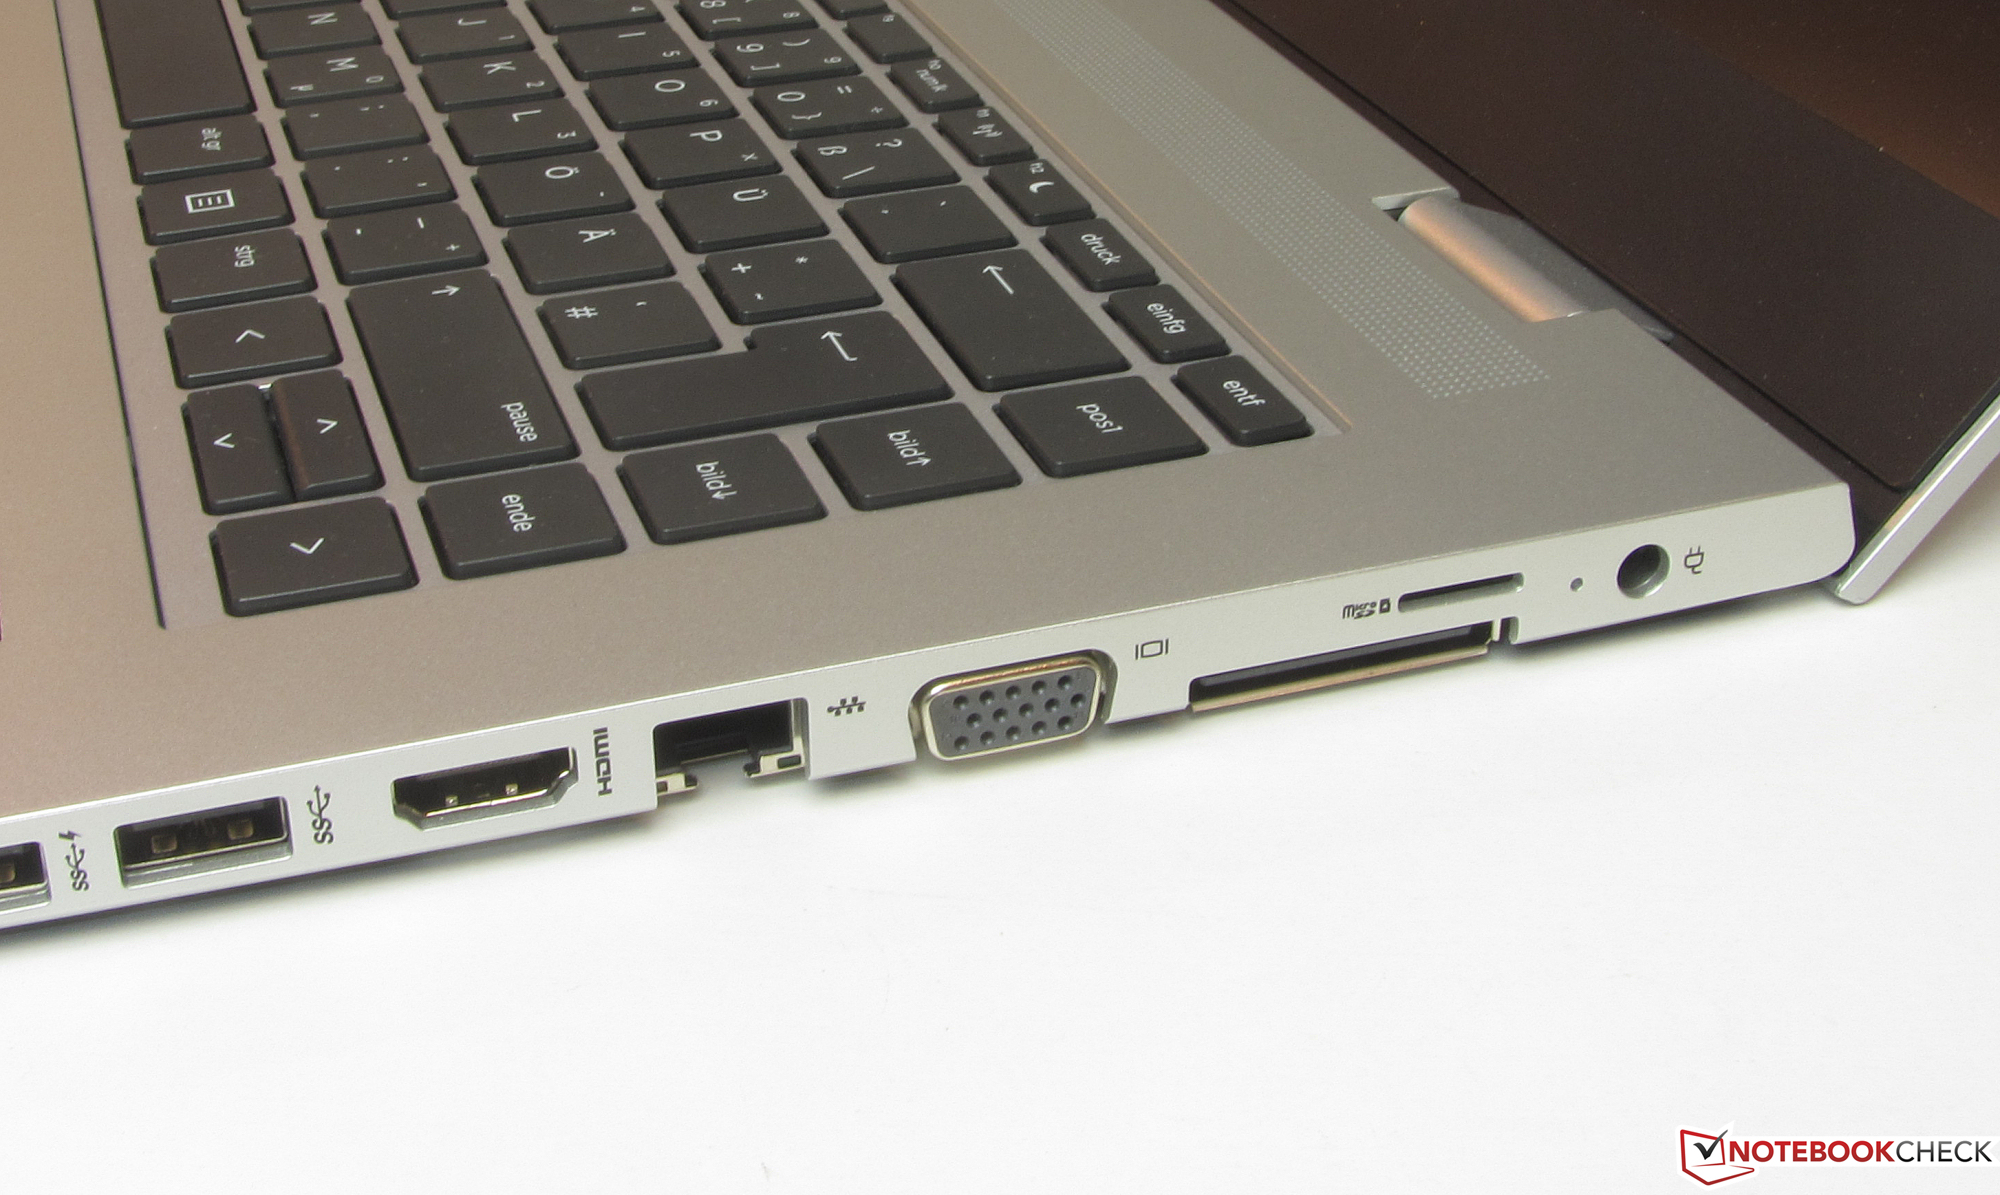
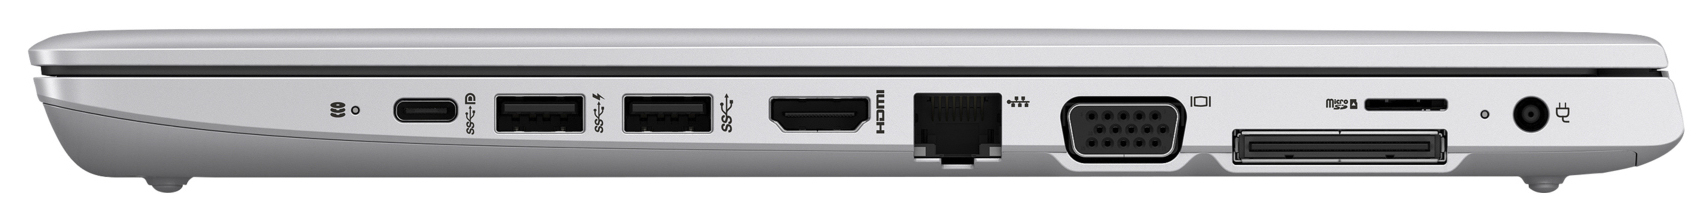
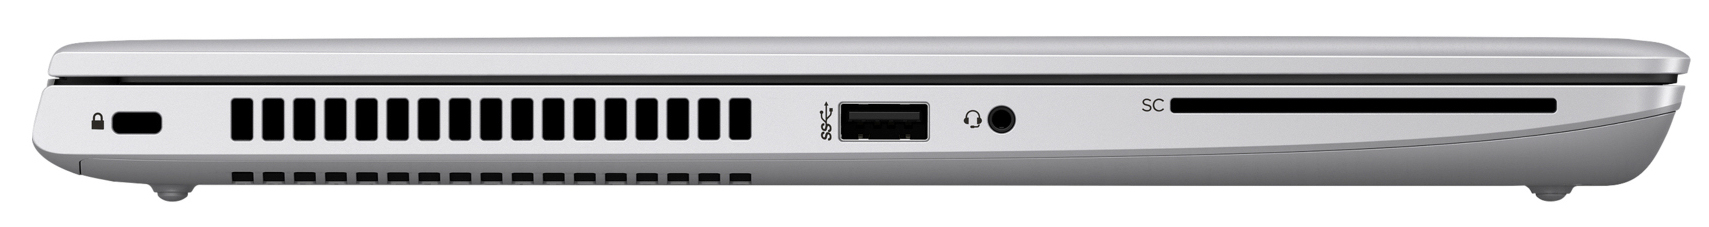
Um SSD NVMe resulta em um sistema muito responsivo. É possível substituir o SSD No entanto, para isso, um terá que remover a tampa inferior. Além de um SSD M.2-2280, um disco rígido de 2,5 polegadas também pode ser instalado dentro do ProBook 645 G4. Nosso dispositivo de teste não oferece um modem LTE. Dito isto, um modem LTE pode ser facilmente instalado após a compra. O teclado deixou uma impressão muito positiva. Está apto para a digitação regular. Infelizmente, não possui luz de fundo. No entanto, uma luz de fundo do teclado está disponível como um recurso opcional.
O ProBook revela falhas que um portátil de negócios não deveria ter.
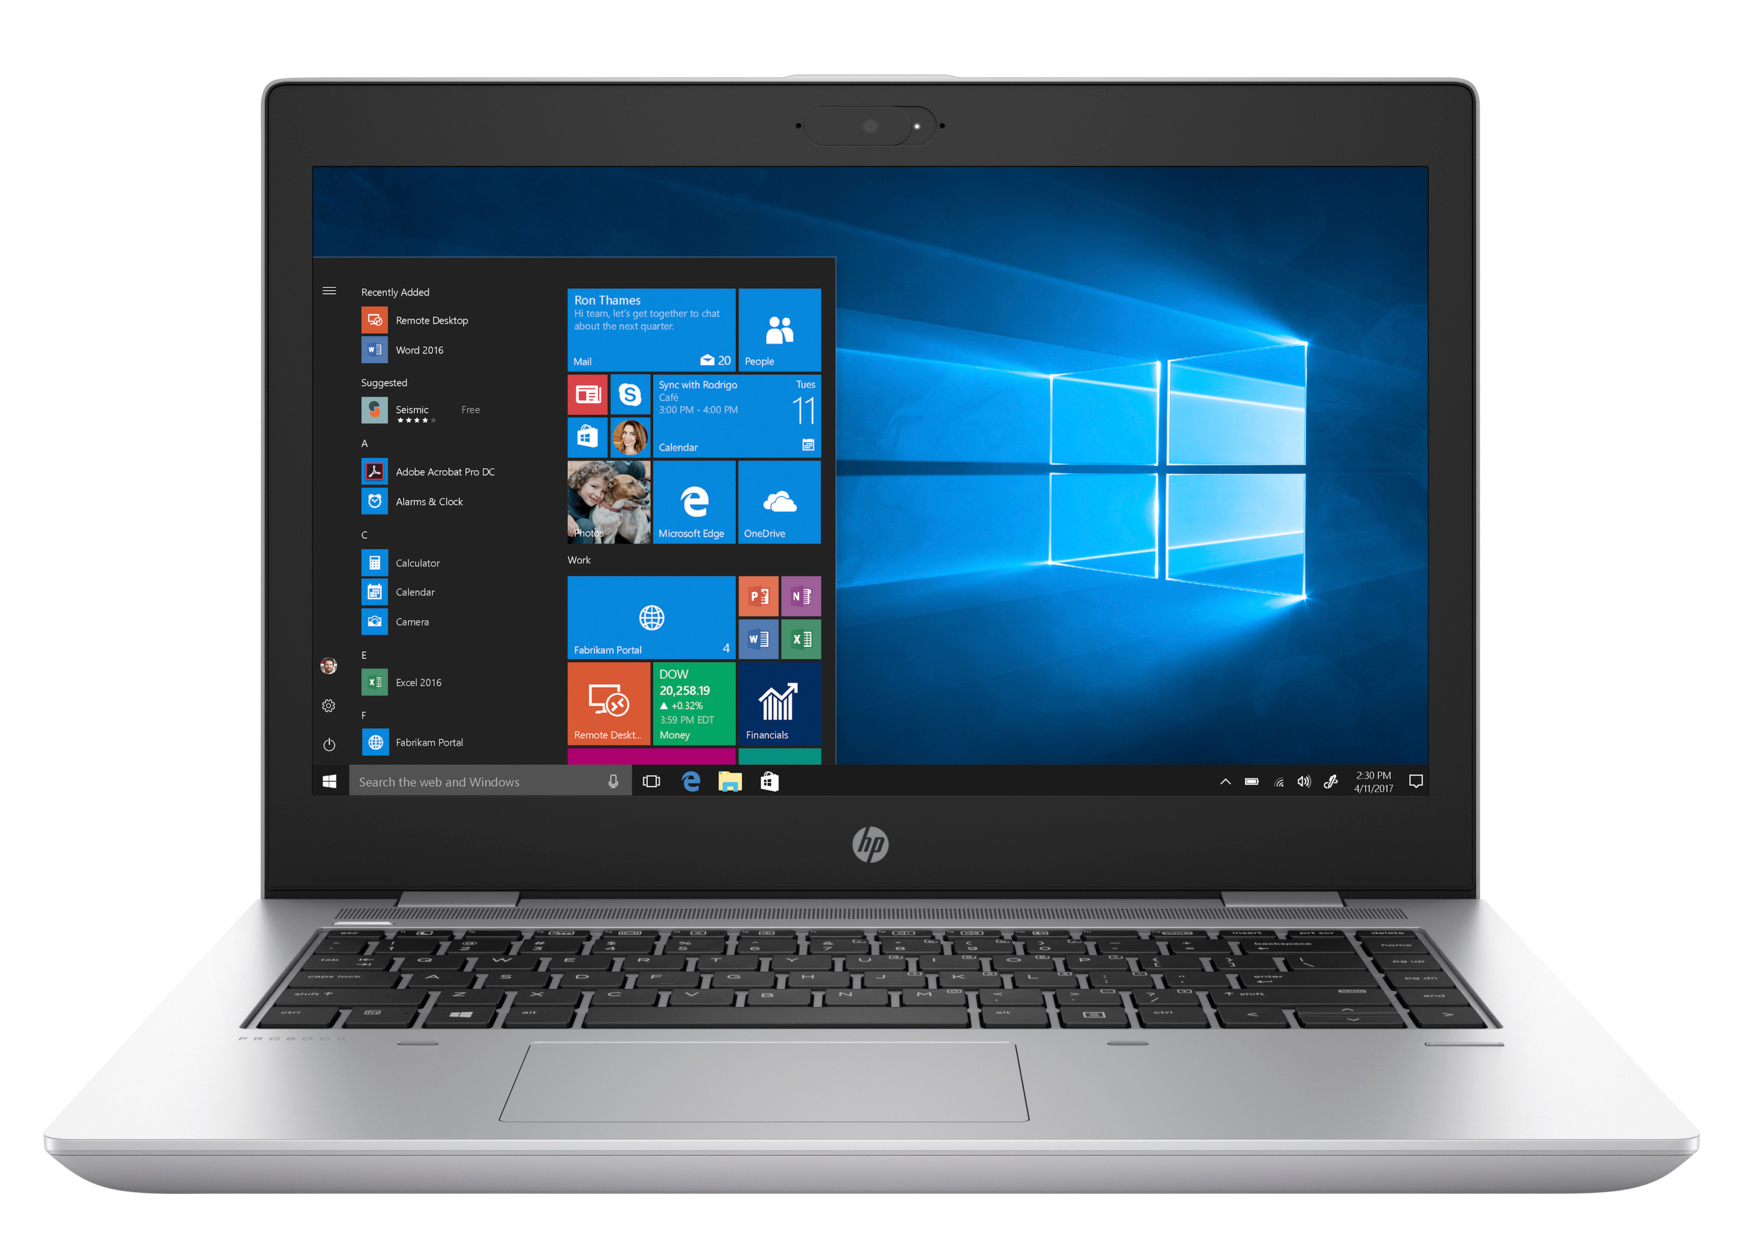
A tela IPS mate conta com bons ângulos de visão No entanto, também possui um brilho de tela baixo e uma baixa relação de contraste. Um portátil que custa 900 a 1000 Euros (~$1.051 a 1.167) deve oferecer mais a esse respeito. A duração da bateria é fraca. Em nosso teste de Wi-Fi praticamente orientado, o ProBook dura menos de 5 horas. Aqui, o portátil deveria ter durado pelo menos 2 a 3 horas a mais.
HP ProBook 645 G4 3UP62EA
-
08/28/2018 v6(old)
Sascha Mölck