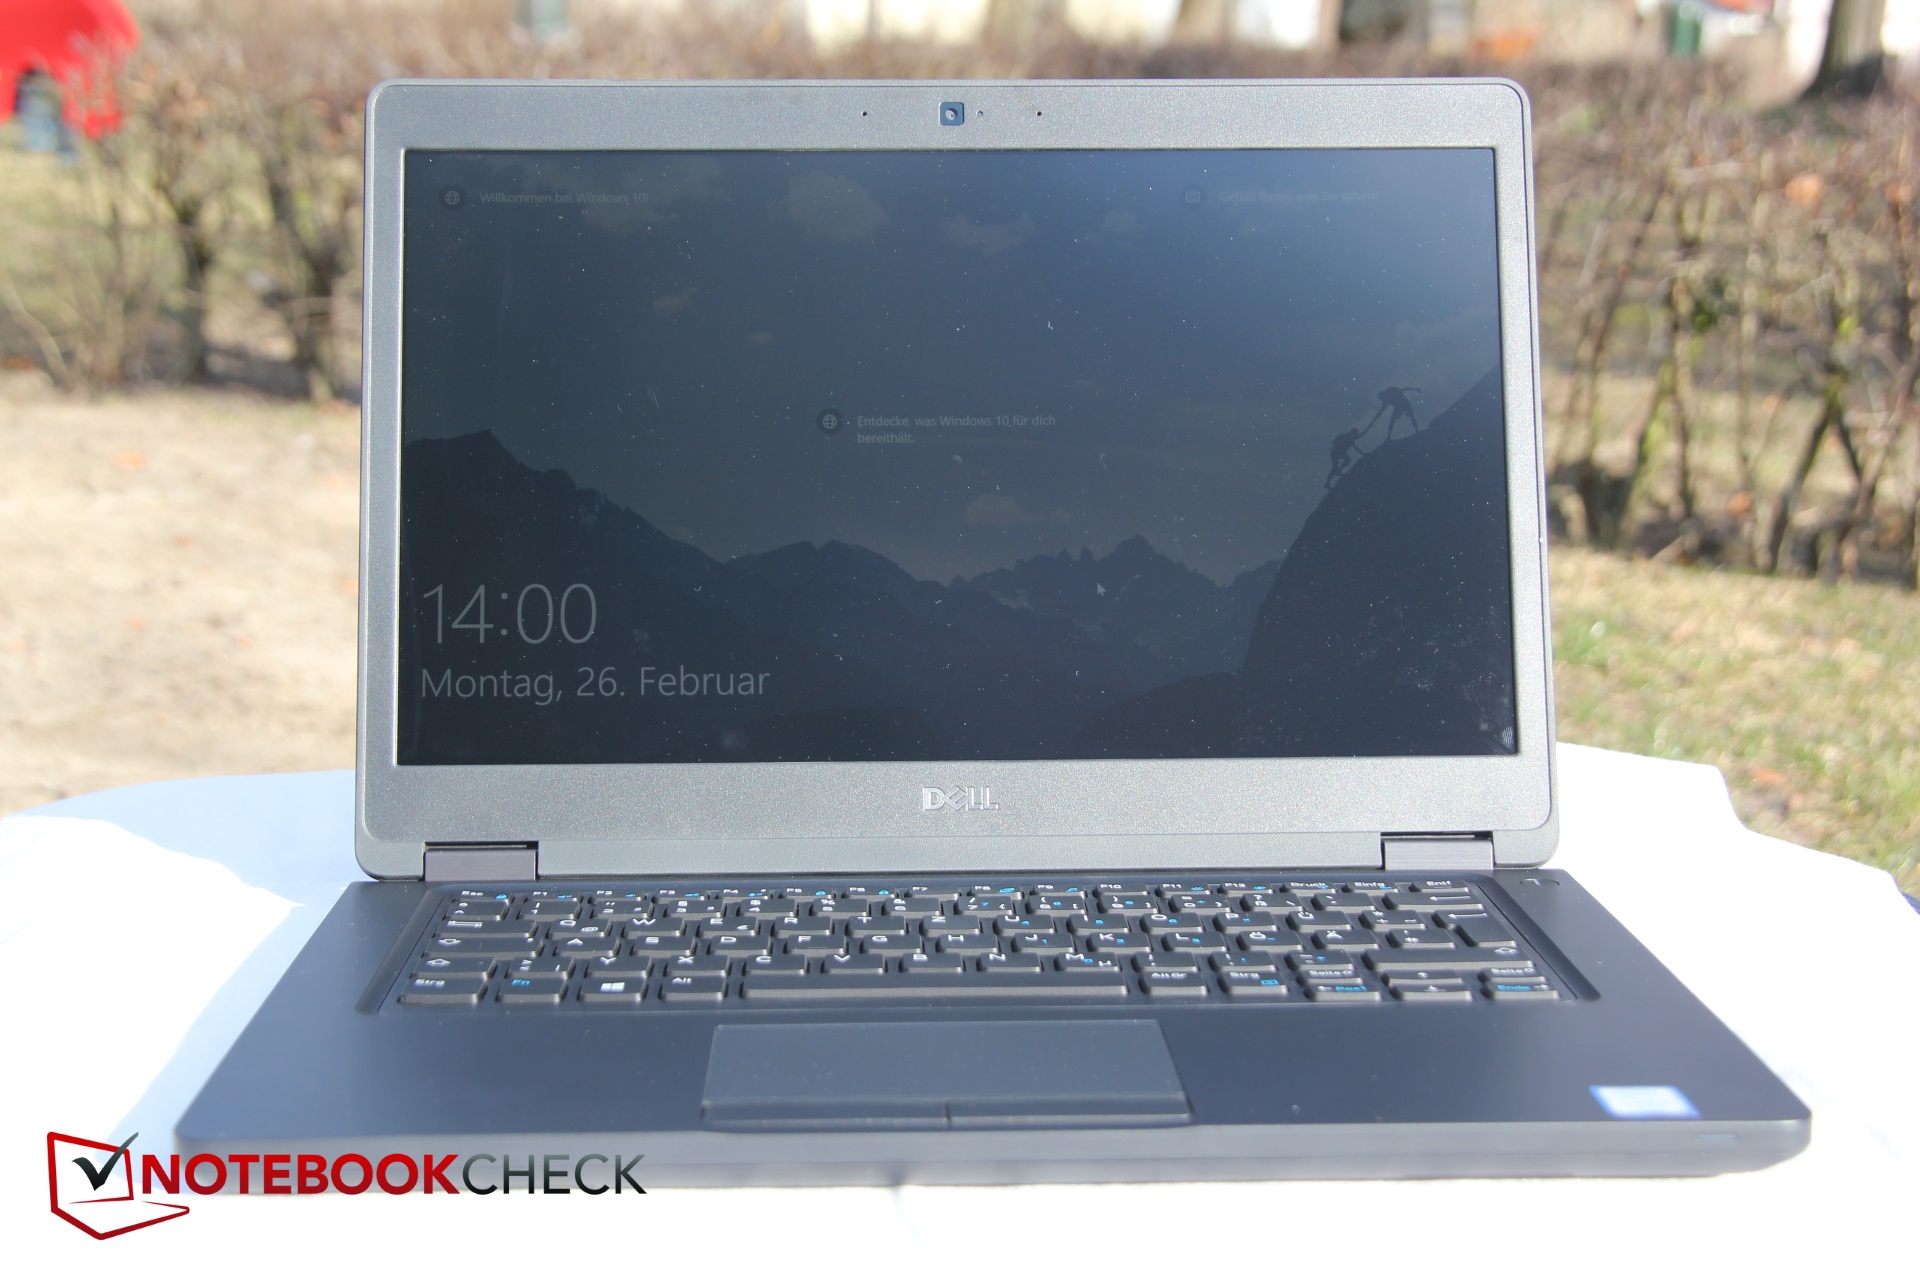
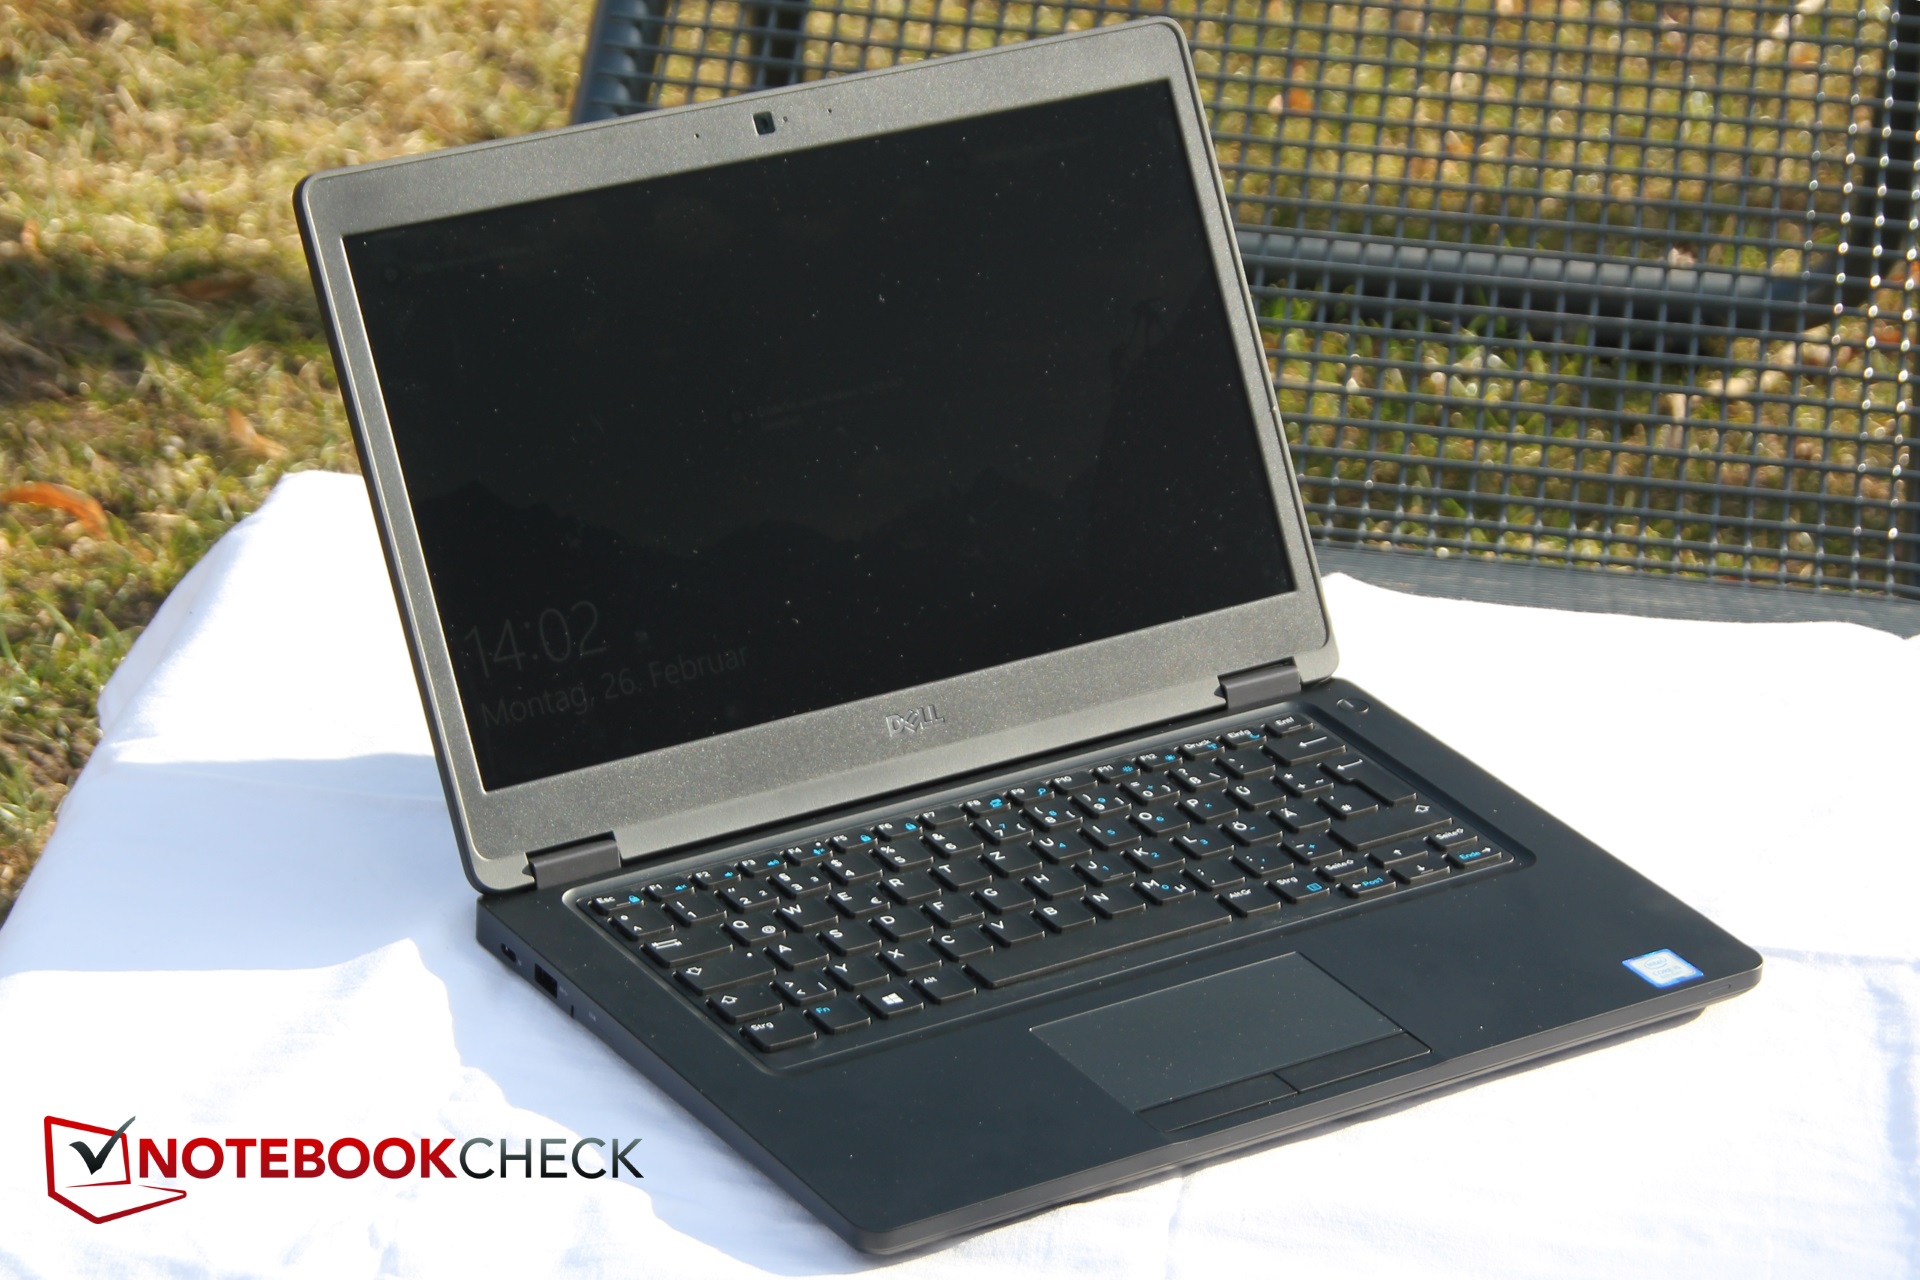
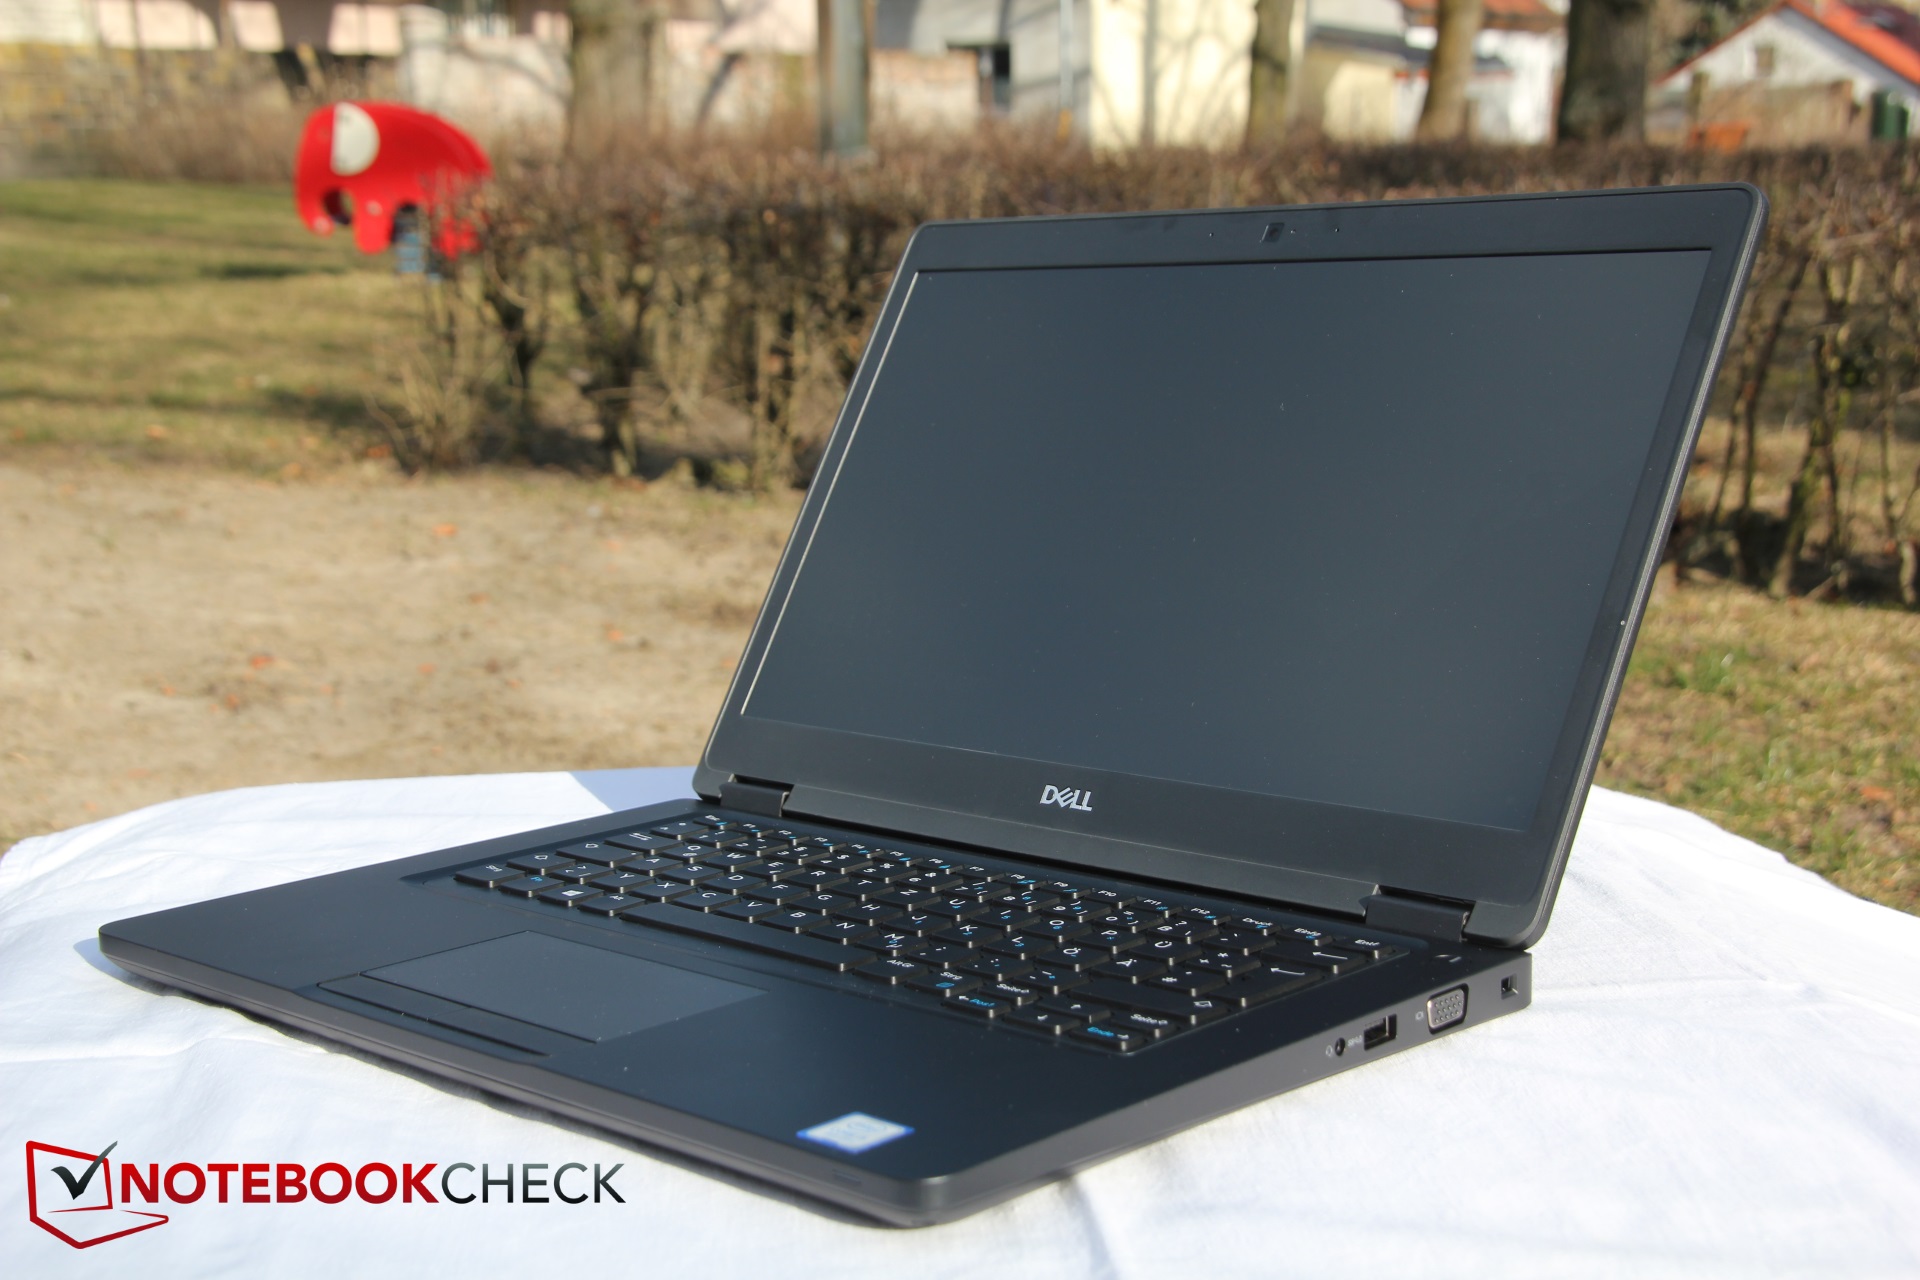
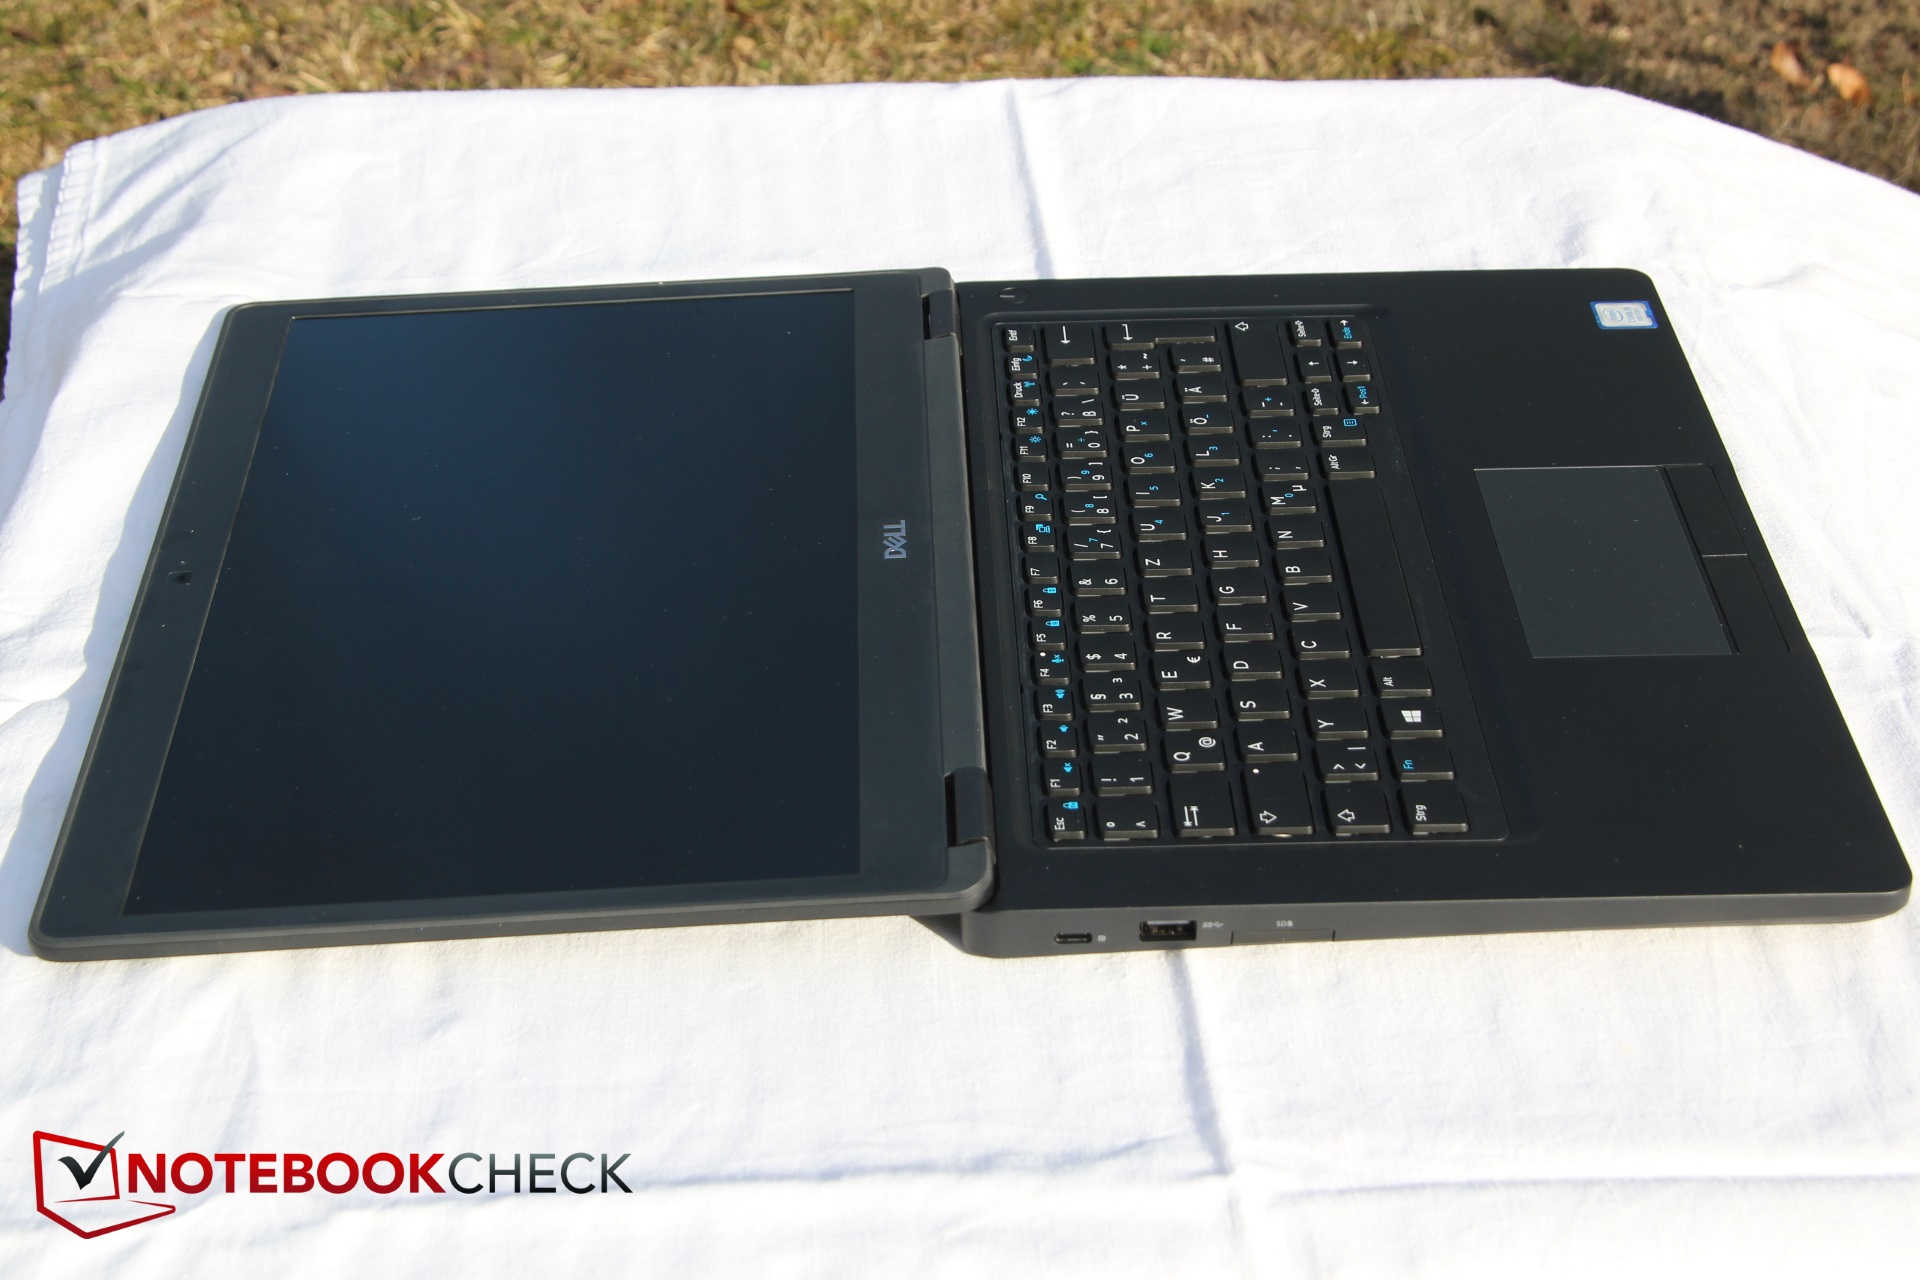
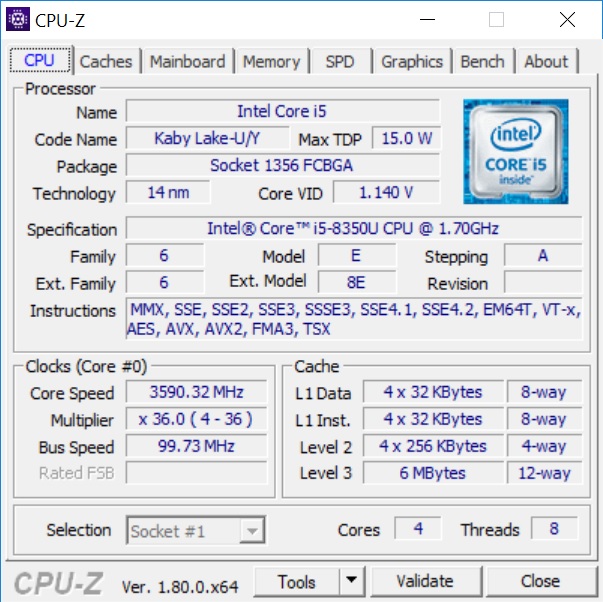
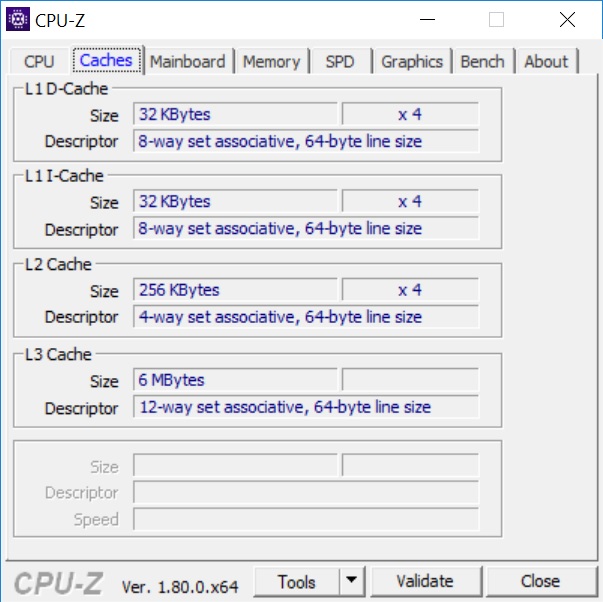
Breve Análise do Portátil Dell Latitude 5490 (i5-8350U, FHD)
| SD Card Reader | |
| average JPG Copy Test (av. of 3 runs) | |
| Dell Latitude 5490-TD70X (Toshiba Exceria Pro SDXC 64 GB UHS-II) | |
| Dell Latitude 5480 (Toshiba Exceria Pro SDXC 64 GB UHS-II) | |
| Acer TravelMate P648-G2-M-73T0 (Toshiba Exceria Pro SDXC 64 GB UHS-II) | |
| Lenovo ThinkPad T470-20HD002HGE (Toshiba Exceria Pro SDXC 64 GB UHS-II) | |
| HP EliteBook 840 G4-Z2V49ET ABD (Toshiba Exceria Pro SDXC 64 GB UHS-II) | |
| Fujitsu LifeBook U747 (Toshiba Exceria Pro SDXC 64 GB UHS-II) | |
| Média da turma Office (19.8 - 198.5, n=22, últimos 2 anos) | |
| maximum AS SSD Seq Read Test (1GB) | |
| Dell Latitude 5480 (Toshiba Exceria Pro SDXC 64 GB UHS-II) | |
| Dell Latitude 5490-TD70X (Toshiba Exceria Pro SDXC 64 GB UHS-II) | |
| Lenovo ThinkPad T470-20HD002HGE (Toshiba Exceria Pro SDXC 64 GB UHS-II) | |
| Acer TravelMate P648-G2-M-73T0 (Toshiba Exceria Pro SDXC 64 GB UHS-II) | |
| HP EliteBook 840 G4-Z2V49ET ABD (Toshiba Exceria Pro SDXC 64 GB UHS-II) | |
| Fujitsu LifeBook U747 (Toshiba Exceria Pro SDXC 64 GB UHS-II) | |
| Média da turma Office (27.4 - 249, n=21, últimos 2 anos) | |
| |||||||||||||||||||||||||
iluminação: 88 %
iluminação com acumulador: 223 cd/m²
Contraste: 1195:1 (Preto: 0.19 cd/m²)
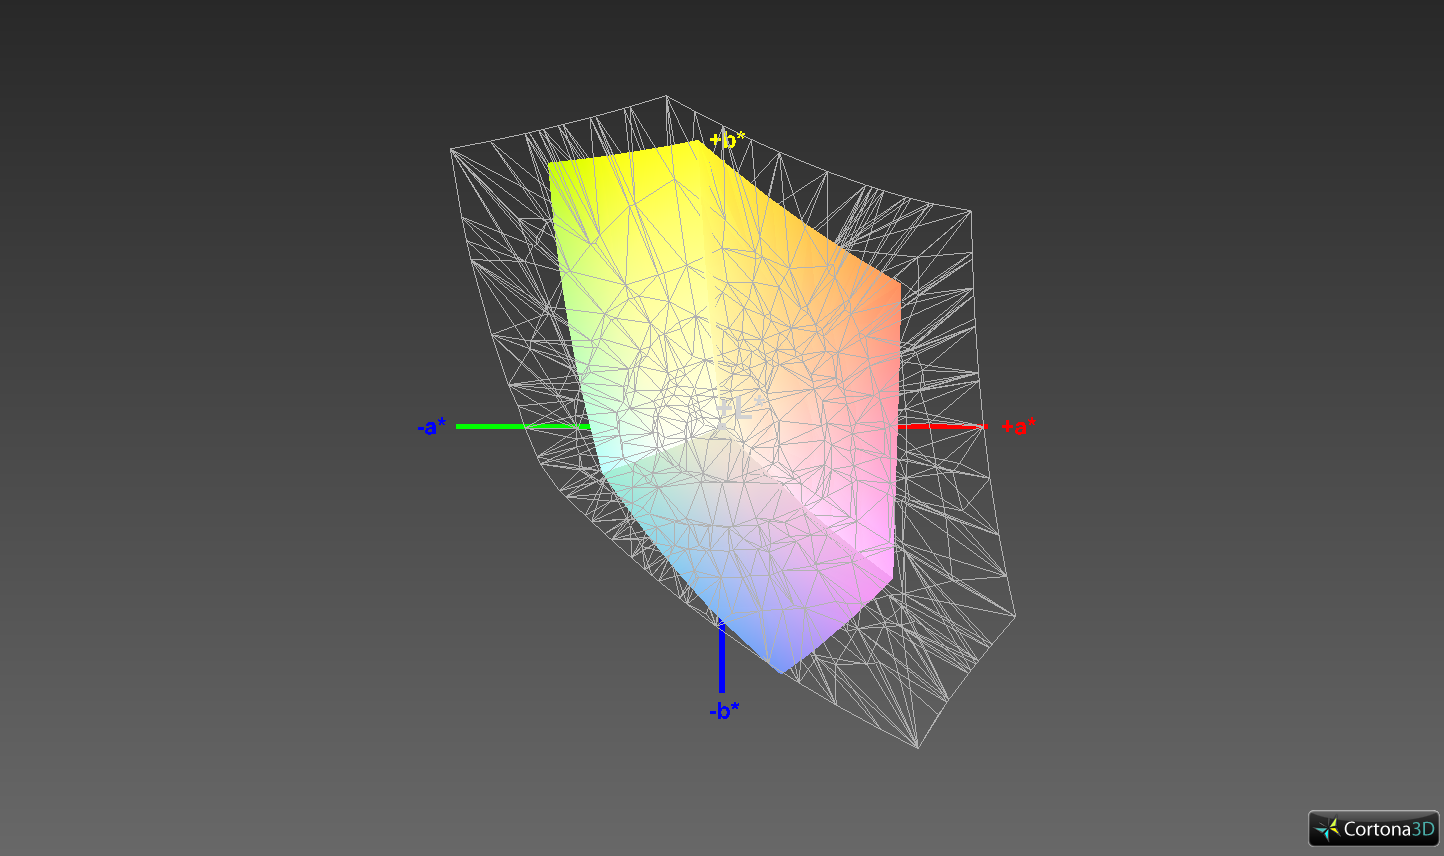
ΔE ColorChecker Calman: 5.6 | ∀{0.5-29.43 Ø4.71}
ΔE Greyscale Calman: 2.4 | ∀{0.09-98 Ø4.96}
54.4% sRGB (Argyll 1.6.3 3D)
34.5% AdobeRGB 1998 (Argyll 1.6.3 3D)
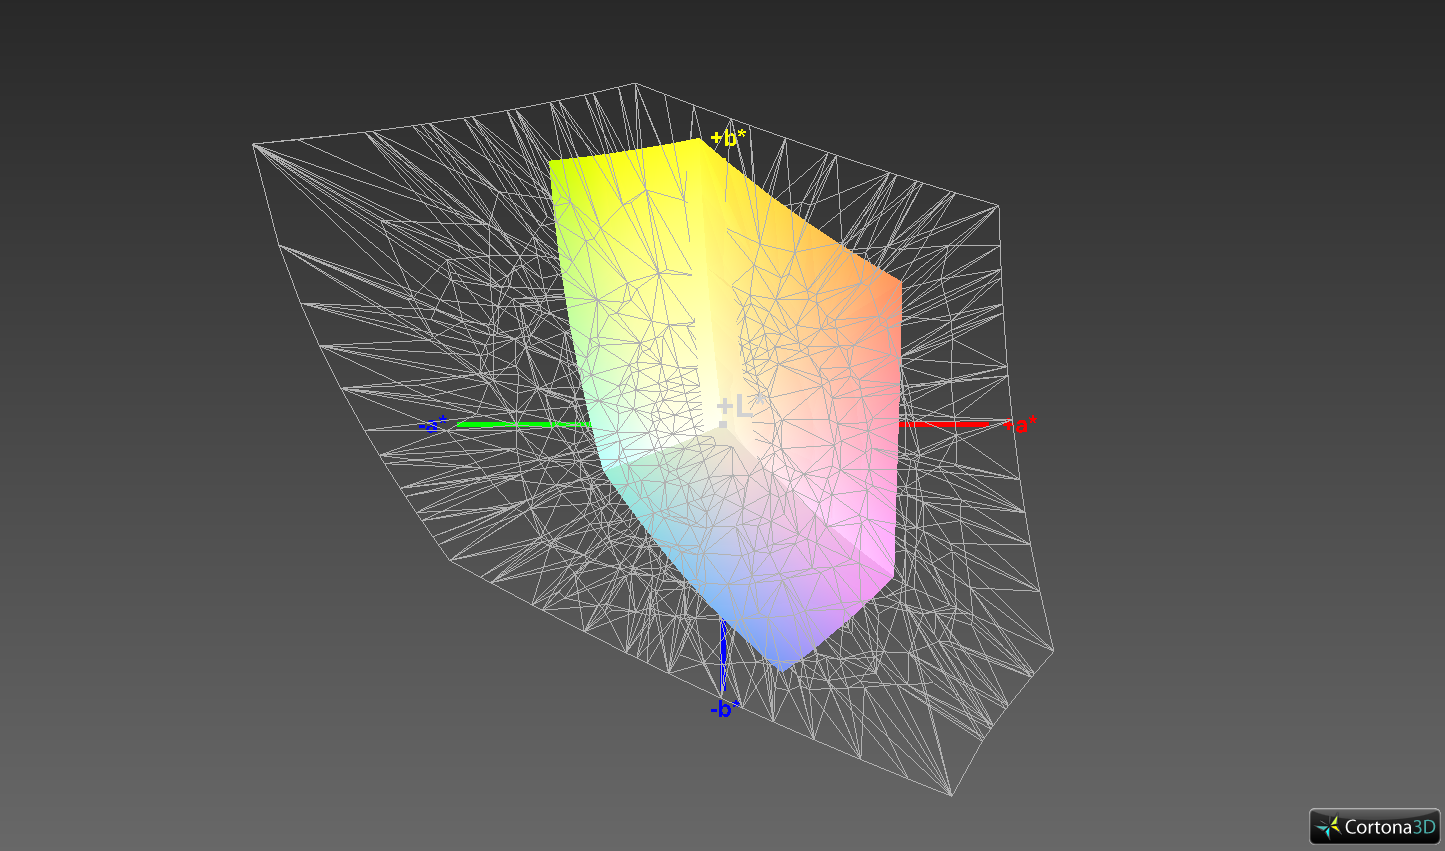
37.48% AdobeRGB 1998 (Argyll 3D)
54.6% sRGB (Argyll 3D)
36.28% Display P3 (Argyll 3D)
Gamma: 2.44
CCT: 6506 K
| Dell Latitude 5490-TD70X AU Optronics AUO263D, , 1920x1080, 14" | Dell Latitude 5480 LG Philips LGD0553, , 1920x1080, 14" | HP EliteBook 840 G4-Z2V49ET ABD AUO123D, , 1920x1080, 14" | Acer TravelMate P648-G2-M-73T0 1920x1080, 14" | Lenovo ThinkPad T470-20HD002HGE N140HCA-EAB, , 1920x1080, 14" | Fujitsu LifeBook U747 LG LP140WF3, , 1920x1080, 14" | |
|---|---|---|---|---|---|---|
| Display | 12% | 52% | 76% | 14% | 67% | |
| Display P3 Coverage (%) | 36.28 | 40.62 12% | 55.8 54% | 67.2 85% | 41.6 15% | 66.1 82% |
| sRGB Coverage (%) | 54.6 | 61.2 12% | 80.7 48% | 90.8 66% | 61.9 13% | 84.8 55% |
| AdobeRGB 1998 Coverage (%) | 37.48 | 41.96 12% | 57.7 54% | 66.4 77% | 43.06 15% | 62 65% |
| Response Times | 23% | 22% | 20% | 1% | 25% | |
| Response Time Grey 50% / Grey 80% * (ms) | 46.9 ? | 32.8 ? 30% | 39 ? 17% | 38 ? 19% | 41.6 ? 11% | 36 ? 23% |
| Response Time Black / White * (ms) | 31.2 ? | 26.4 ? 15% | 23 ? 26% | 25 ? 20% | 34 ? -9% | 23.2 ? 26% |
| PWM Frequency (Hz) | ||||||
| Screen | -3% | -60% | 14% | -9% | 10% | |
| Brightness middle (cd/m²) | 227 | 215.9 -5% | 346 52% | 275 21% | 306 35% | 291 28% |
| Brightness (cd/m²) | 211 | 205 -3% | 317 50% | 253 20% | 287 36% | 296 40% |
| Brightness Distribution (%) | 88 | 90 2% | 86 -2% | 85 -3% | 88 0% | 84 -5% |
| Black Level * (cd/m²) | 0.19 | 0.22 -16% | 0.86 -353% | 0.25 -32% | 0.3 -58% | 0.32 -68% |
| Contrast (:1) | 1195 | 981 -18% | 402 -66% | 1100 -8% | 1020 -15% | 909 -24% |
| Colorchecker dE 2000 * | 5.6 | 5.1 9% | 8.64 -54% | 3.49 38% | 6.2 -11% | 4.3 23% |
| Colorchecker dE 2000 max. * | 22.4 | 15.6 30% | 13.58 39% | 6.77 70% | 13.6 39% | 7.5 67% |
| Greyscale dE 2000 * | 2.4 | 4 -67% | 11.24 -368% | 4.91 -105% | 5.8 -142% | 4.3 -79% |
| Gamma | 2.44 90% | 2.41 91% | 2.62 84% | 2.39 92% | 2.04 108% | 2.31 95% |
| CCT | 6506 100% | 6856 95% | 12530 52% | 6271 104% | 6277 104% | 6529 100% |
| Color Space (Percent of AdobeRGB 1998) (%) | 34.5 | 41.96 22% | 52 51% | 59 71% | 39.62 15% | 55.46 61% |
| Color Space (Percent of sRGB) (%) | 54.4 | 61.15 12% | 80 47% | 91 67% | 61.44 13% | 84.77 56% |
| Média Total (Programa/Configurações) | 11% /
3% | 5% /
-27% | 37% /
27% | 2% /
-3% | 34% /
23% |
* ... menor é melhor
Exibir tempos de resposta
| ↔ Tempo de resposta preto para branco | ||
|---|---|---|
| 31.2 ms ... ascensão ↗ e queda ↘ combinadas | ↗ 18 ms ascensão | 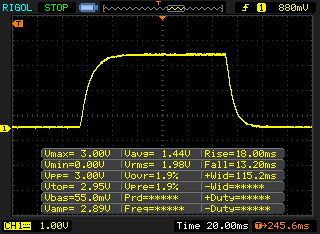 |
| ↘ 13.2 ms queda | ||
| A tela mostra taxas de resposta lentas em nossos testes e será insatisfatória para os jogadores. Em comparação, todos os dispositivos testados variam de 0.1 (mínimo) a 240 (máximo) ms. » 84 % de todos os dispositivos são melhores. Isso significa que o tempo de resposta medido é pior que a média de todos os dispositivos testados (19.8 ms). | ||
| ↔ Tempo de resposta 50% cinza a 80% cinza | ||
| 46.9 ms ... ascensão ↗ e queda ↘ combinadas | ↗ 23.6 ms ascensão | 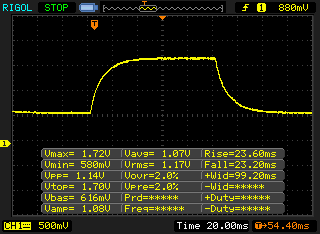 |
| ↘ 23.3 ms queda | ||
| A tela mostra taxas de resposta lentas em nossos testes e será insatisfatória para os jogadores. Em comparação, todos os dispositivos testados variam de 0.165 (mínimo) a 636 (máximo) ms. » 81 % de todos os dispositivos são melhores. Isso significa que o tempo de resposta medido é pior que a média de todos os dispositivos testados (31 ms). | ||
Cintilação da tela / PWM (modulação por largura de pulso)
| Tela tremeluzindo / PWM não detectado | 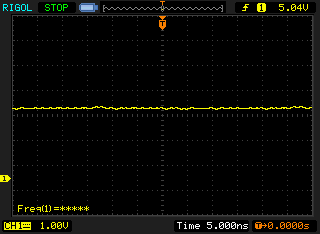 | ||
[pwm_comparison] Em comparação: 52 % de todos os dispositivos testados não usam PWM para escurecer a tela. Se PWM foi detectado, uma média de 7754 (mínimo: 5 - máximo: 343500) Hz foi medida. | |||
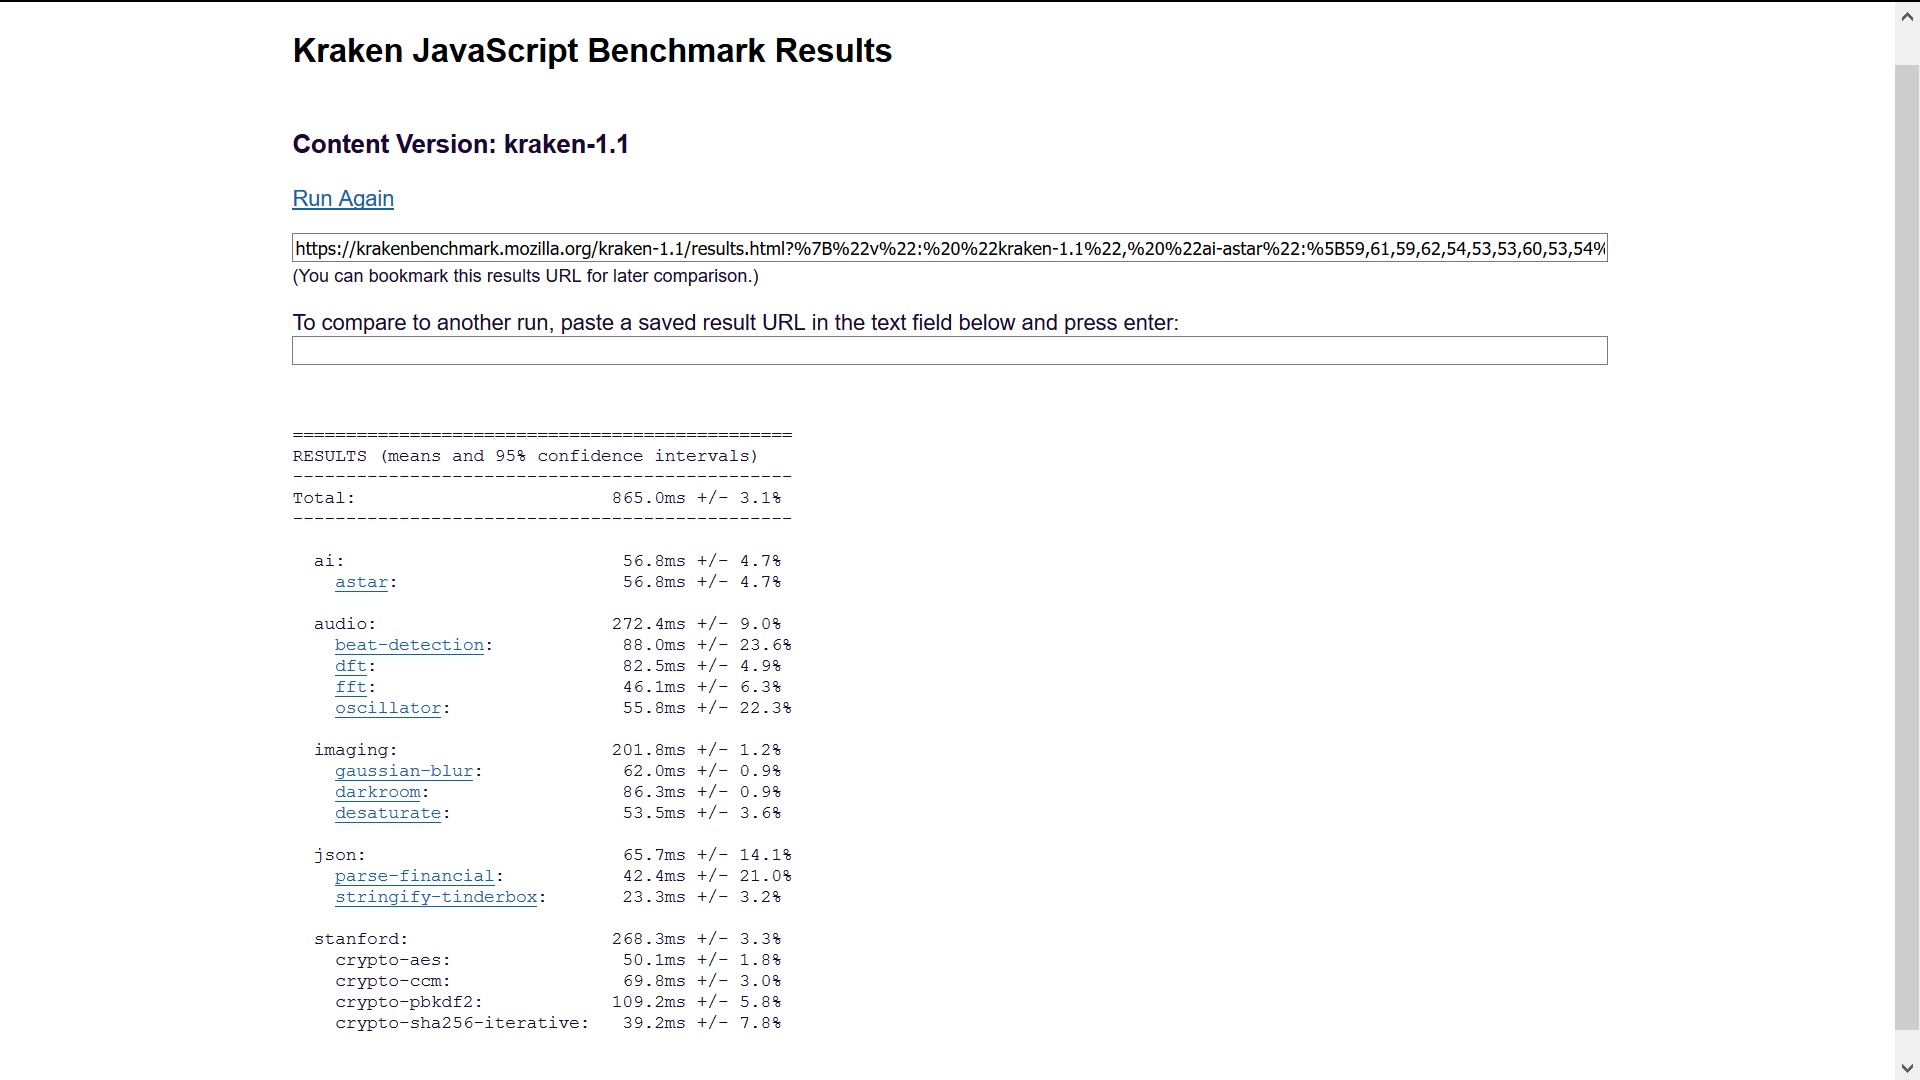
| Cinebench R10 | |
| Rendering Single CPUs 64Bit | |
| Média da turma Office (11106 - 15443, n=7, últimos 2 anos) | |
| Dell Latitude 5490-TD70X | |
| Média Intel Core i5-8350U (n=1) | |
| Rendering Multiple CPUs 64Bit | |
| Média da turma Office (48700 - 80160, n=7, últimos 2 anos) | |
| Dell Latitude 5490-TD70X | |
| Média Intel Core i5-8350U (n=1) | |
| PCMark 8 Home Score Accelerated v2 | 3695 pontos | |
| PCMark 8 Work Score Accelerated v2 | 4774 pontos | |
Ajuda | ||
| Dell Latitude 5490-TD70X Toshiba KSG60ZMV512G | Dell Latitude 5480 Toshiba SG5 256GB THNSNK256GVN8 | HP EliteBook 840 G4-Z2V49ET ABD Samsung PM961 MZVLW256HEHP | Acer TravelMate P648-G2-M-73T0 SK Hynix HFS256G39TND-N210A | Lenovo ThinkPad T470-20HD002HGE Samsung PM961 NVMe MZVLW512HMJP | Fujitsu LifeBook U747 Samsung MZYTY256HDHP | |
|---|---|---|---|---|---|---|
| CrystalDiskMark 3.0 | -6% | 131% | 1% | 100% | 6% | |
| Read Seq (MB/s) | 465.1 | 469.4 1% | 1819 291% | 518 11% | 1155 148% | 504 8% |
| Write Seq (MB/s) | 425 | 264.8 -38% | 1263 197% | 267.2 -37% | 1076 153% | 497.8 17% |
| Read 512 (MB/s) | 410.1 | 408.1 0% | 922 125% | 562 37% | 811 98% | 396.7 -3% |
| Write 512 (MB/s) | 360.7 | 265.5 -26% | 804 123% | 263.5 -27% | 862 139% | 283.4 -21% |
| Read 4k (MB/s) | 27.34 | 24.66 -10% | 61.4 125% | 32.88 20% | 55.5 103% | 35.73 31% |
| Write 4k (MB/s) | 89 | 114.8 29% | 157.1 77% | 85.6 -4% | 134.6 51% | 87.8 -1% |
| Read 4k QD32 (MB/s) | 295.6 | 380.3 29% | 513 74% | 351.3 19% | 496.2 68% | 399.1 35% |
| Write 4k QD32 (MB/s) | 300.2 | 207.2 -31% | 410.2 37% | 265.2 -12% | 425.4 42% | 249.7 -17% |

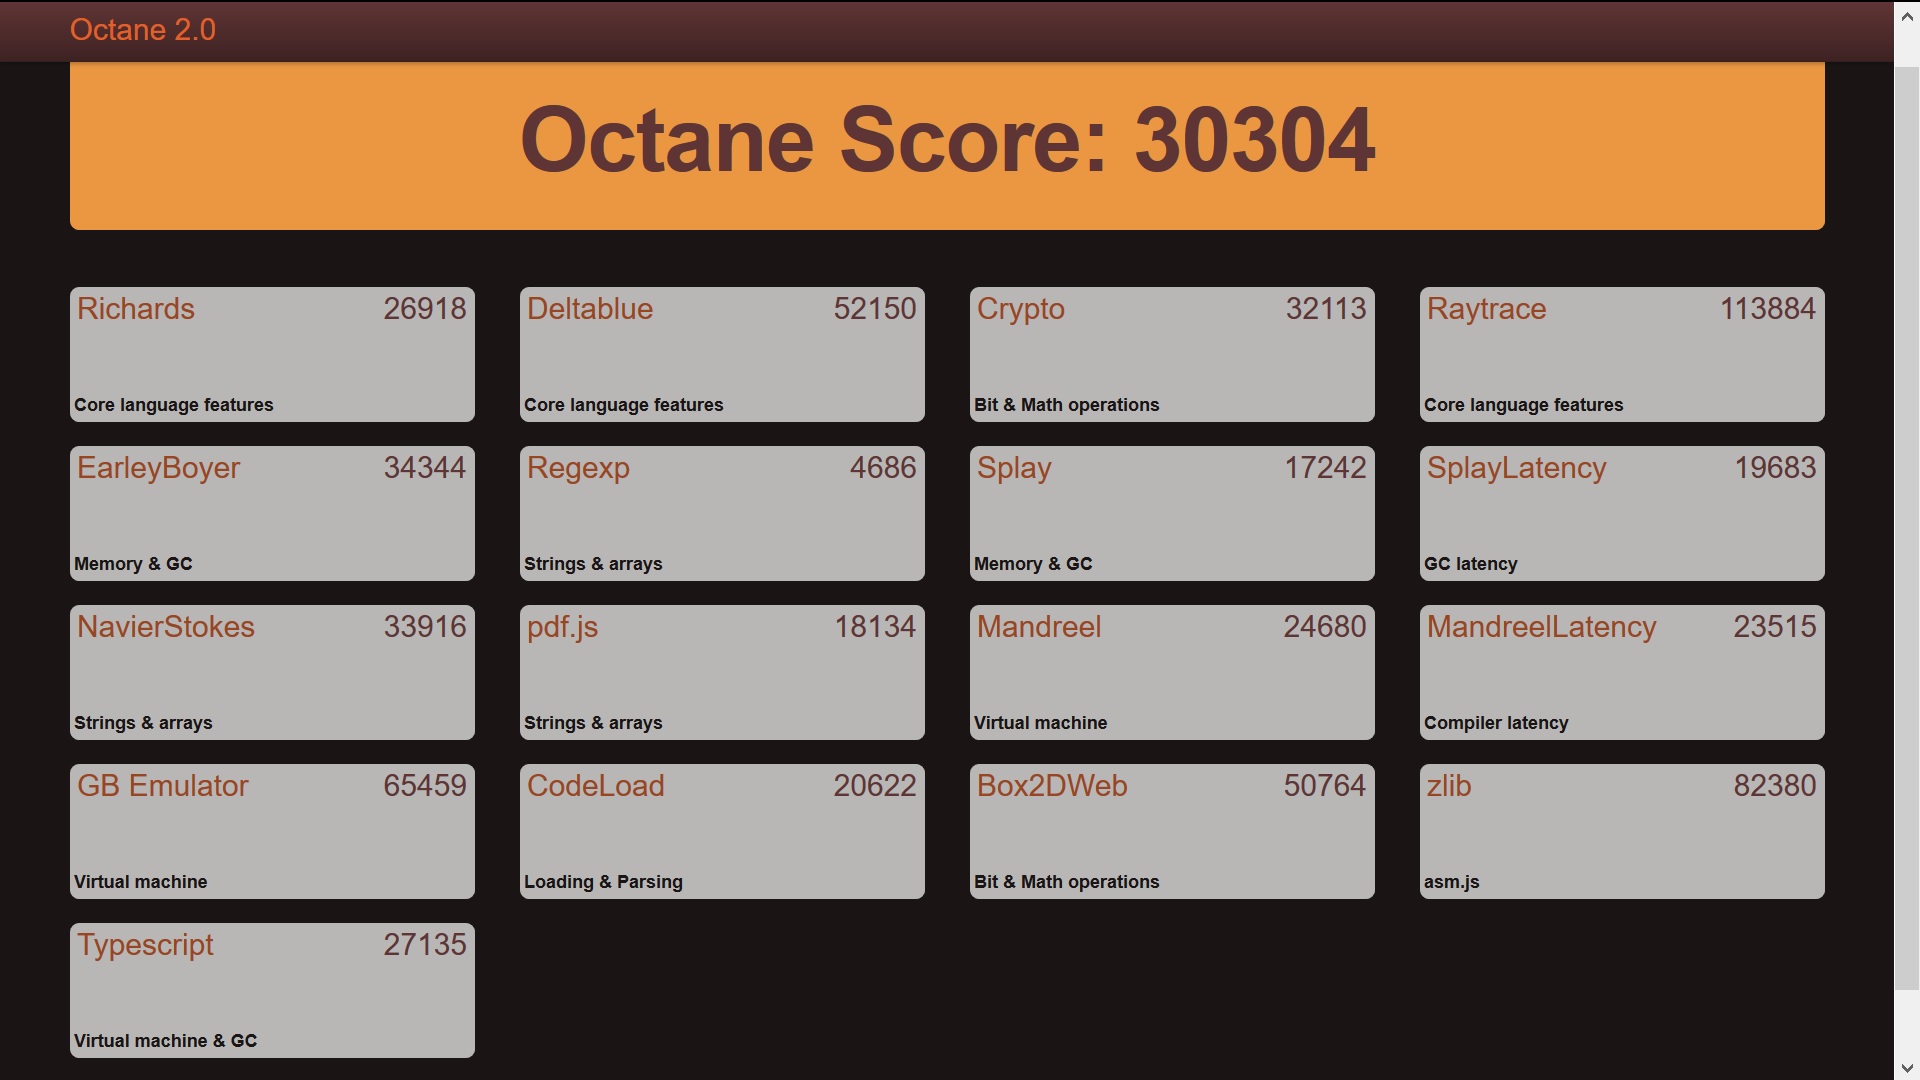
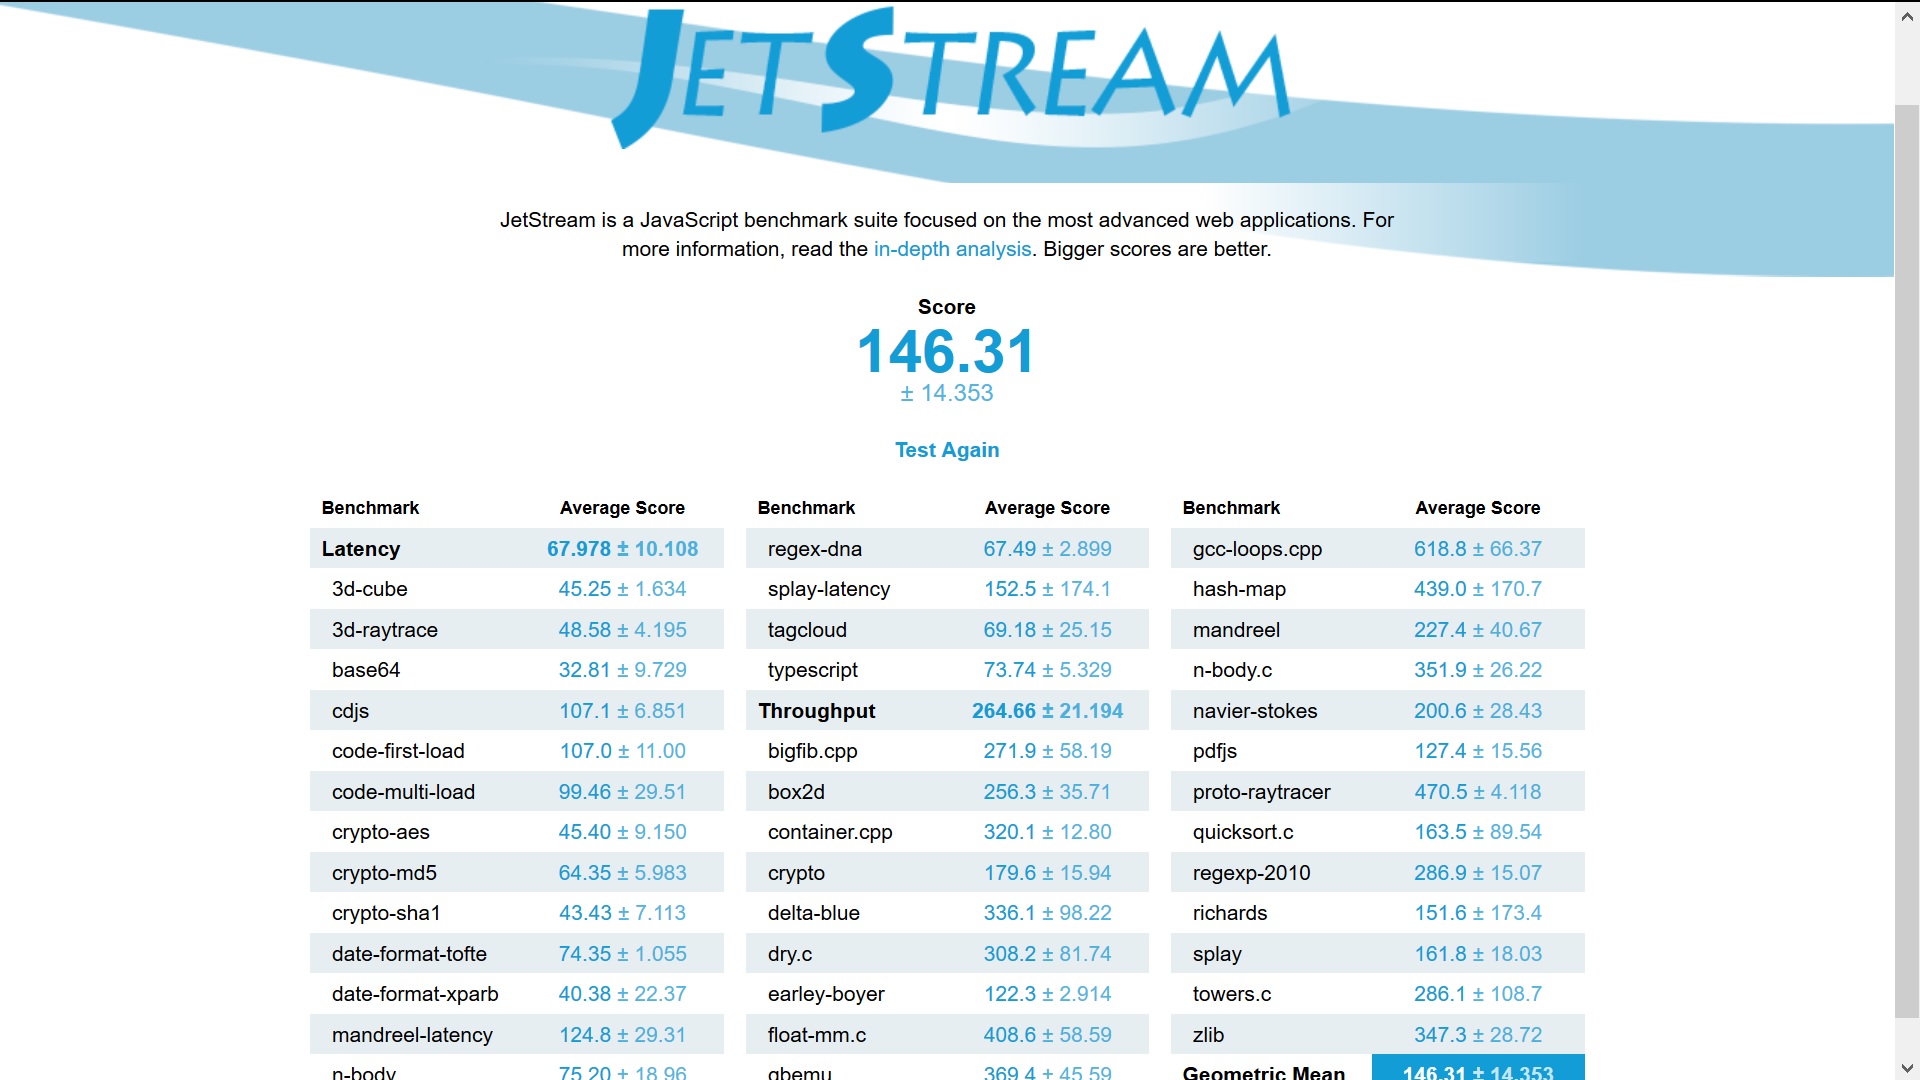
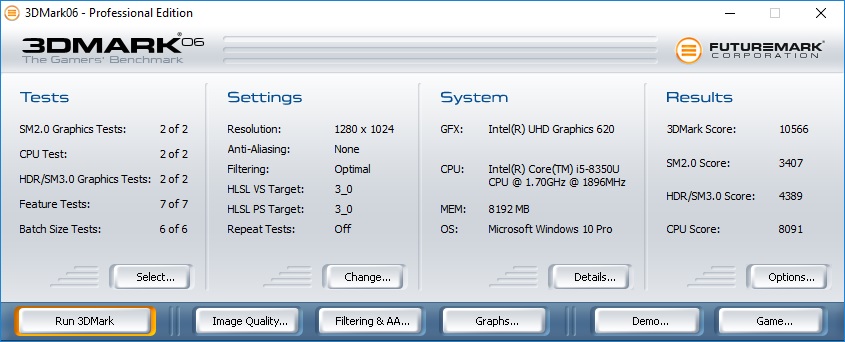
| 3DMark 11 Performance | 1770 pontos | |
| 3DMark Cloud Gate Standard Score | 7903 pontos | |
| 3DMark Fire Strike Score | 918 pontos | |
Ajuda | ||
| baixo | média | alto | ultra | |
|---|---|---|---|---|
| The Witcher 3 (2015) | 14.61 | 9.63 | ||
| Rise of the Tomb Raider (2016) | 18.68 | 11.1 | 5.5 | |
| Rocket League (2017) | 57.4 | 21.47 | 15.01 |
| Rise of the Tomb Raider | |
| 1024x768 Lowest Preset | |
| Média Intel UHD Graphics 620 (10.4 - 110.7, n=82) | |
| Dell Latitude 5490-TD70X | |
| Lenovo ThinkPad T470-20HD002HGE | |
| Acer TravelMate P648-G2-M-73T0 | |
| Fujitsu LifeBook U747 | |
| 1366x768 Medium Preset AF:2x | |
| Média Intel UHD Graphics 620 (6.5 - 49.3, n=62) | |
| Lenovo ThinkPad T470-20HD002HGE | |
| Dell Latitude 5490-TD70X | |
| Acer TravelMate P648-G2-M-73T0 | |
| 1920x1080 High Preset AA:FX AF:4x | |
| Média Intel UHD Graphics 620 (4.9 - 32, n=42) | |
| Dell Latitude 5490-TD70X | |
| Acer TravelMate P648-G2-M-73T0 | |
| Rocket League | |
| 1280x720 Performance | |
| Média Intel UHD Graphics 620 (20.1 - 95, n=26) | |
| Dell Latitude 5490-TD70X | |
| 1920x1080 Performance | |
| Média Intel UHD Graphics 620 (17.1 - 78.4, n=13) | |
| Dell Latitude 5490-TD70X | |
| 1920x1080 Quality AA:Medium FX | |
| Média Intel UHD Graphics 620 (13.1 - 43, n=24) | |
| Dell Latitude 5490-TD70X | |
| 1920x1080 High Quality AA:High FX | |
| Média Intel UHD Graphics 620 (13.2 - 24.7, n=21) | |
| Dell Latitude 5490-TD70X | |
| The Witcher 3 | |
| 1024x768 Low Graphics & Postprocessing | |
| Média da turma Office (32.2 - 135, n=3, últimos 2 anos) | |
| Média Intel UHD Graphics 620 (8.8 - 50.9, n=64) | |
| Dell Latitude 5490-TD70X | |
| Lenovo ThinkPad T470-20HD002HGE | |
| HP EliteBook 840 G4-Z2V49ET ABD | |
| 1366x768 Medium Graphics & Postprocessing | |
| Média da turma Office (44.7 - 90.4, n=3, últimos 2 anos) | |
| Média Intel UHD Graphics 620 (8 - 27.9, n=29) | |
| Dell Latitude 5490-TD70X | |
| Dell Latitude 5490-TD70X UHD Graphics 620, i5-8350U, Toshiba KSG60ZMV512G | Dell Latitude 5480 HD Graphics 620, i7-7600U, Toshiba SG5 256GB THNSNK256GVN8 | HP EliteBook 840 G4-Z2V49ET ABD HD Graphics 620, i5-7200U, Samsung PM961 MZVLW256HEHP | Acer TravelMate P648-G2-M-73T0 HD Graphics 620, i7-7500U, SK Hynix HFS256G39TND-N210A | Lenovo ThinkPad T470-20HD002HGE HD Graphics 620, i5-7200U, Samsung PM961 NVMe MZVLW512HMJP | Fujitsu LifeBook U747 HD Graphics 620, i5-7200U, Samsung MZYTY256HDHP | |
|---|---|---|---|---|---|---|
| Noise | -7% | 0% | 1% | 7% | 8% | |
| desligado / ambiente * (dB) | 28.8 | 31 -8% | 30.6 -6% | 28 3% | 28.2 2% | |
| Idle Minimum * (dB) | 28.8 | 29.6 -3% | 31 -8% | 30.6 -6% | 28 3% | 28.2 2% |
| Idle Average * (dB) | 28.8 | 29.6 -3% | 31 -8% | 30.6 -6% | 28 3% | 28.2 2% |
| Idle Maximum * (dB) | 30.9 | 29.6 4% | 31 -0% | 31 -0% | 29.4 5% | 28.2 9% |
| Load Average * (dB) | 35.6 | 42 -18% | 33.5 6% | 34.5 3% | 31.4 12% | 31.2 12% |
| Load Maximum * (dB) | 41.4 | 47.1 -14% | 33.7 19% | 32.4 22% | 34.6 16% | 33 20% |
* ... menor é melhor
Barulho
| Ocioso |
| 28.8 / 28.8 / 30.9 dB |
| Carga |
| 35.6 / 41.4 dB |
 | ||
30 dB silencioso 40 dB(A) audível 50 dB(A) ruidosamente alto |
||
min: | ||
(+) A temperatura máxima no lado superior é 38.3 °C / 101 F, em comparação com a média de 34.3 °C / 94 F , variando de 21.2 a 62.5 °C para a classe Office.
(±) A parte inferior aquece até um máximo de 44.7 °C / 112 F, em comparação com a média de 36.8 °C / 98 F
(+) Em uso inativo, a temperatura média para o lado superior é 22.9 °C / 73 F, em comparação com a média do dispositivo de 29.5 °C / ### class_avg_f### F.
(+) Os apoios para as mãos e o touchpad são mais frios que a temperatura da pele, com um máximo de 31.2 °C / 88.2 F e, portanto, são frios ao toque.
(-) A temperatura média da área do apoio para as mãos de dispositivos semelhantes foi 27.5 °C / 81.5 F (-3.7 °C / -6.7 F).
Dell Latitude 5490-TD70X análise de áudio
(+) | os alto-falantes podem tocar relativamente alto (###valor### dB)
Graves 100 - 315Hz
(-) | quase nenhum baixo - em média 20% menor que a mediana
(+) | o baixo é linear (6.7% delta para a frequência anterior)
Médios 400 - 2.000 Hz
(+) | médios equilibrados - apenas 4.1% longe da mediana
(+) | médios são lineares (5.4% delta para frequência anterior)
Altos 2 - 16 kHz
(+) | agudos equilibrados - apenas 4.2% longe da mediana
(+) | os máximos são lineares (5.8% delta da frequência anterior)
Geral 100 - 16.000 Hz
(±) | a linearidade do som geral é média (15.4% diferença em relação à mediana)
Comparado com a mesma classe
» 16% de todos os dispositivos testados nesta classe foram melhores, 4% semelhantes, 80% piores
» O melhor teve um delta de 7%, a média foi 21%, o pior foi 53%
Comparado com todos os dispositivos testados
» 23% de todos os dispositivos testados foram melhores, 4% semelhantes, 73% piores
» O melhor teve um delta de 4%, a média foi 23%, o pior foi 134%
Apple MacBook 12 (Early 2016) 1.1 GHz análise de áudio
(+) | os alto-falantes podem tocar relativamente alto (###valor### dB)
Graves 100 - 315Hz
(±) | graves reduzidos - em média 11.3% menor que a mediana
(±) | a linearidade dos graves é média (14.2% delta para a frequência anterior)
Médios 400 - 2.000 Hz
(+) | médios equilibrados - apenas 2.4% longe da mediana
(+) | médios são lineares (5.5% delta para frequência anterior)
Altos 2 - 16 kHz
(+) | agudos equilibrados - apenas 2% longe da mediana
(+) | os máximos são lineares (4.5% delta da frequência anterior)
Geral 100 - 16.000 Hz
(+) | o som geral é linear (10.2% diferença em relação à mediana)
Comparado com a mesma classe
» 7% de todos os dispositivos testados nesta classe foram melhores, 2% semelhantes, 90% piores
» O melhor teve um delta de 5%, a média foi 18%, o pior foi 53%
Comparado com todos os dispositivos testados
» 5% de todos os dispositivos testados foram melhores, 1% semelhantes, 94% piores
» O melhor teve um delta de 4%, a média foi 23%, o pior foi 134%
| desligado | |
| Ocioso | |
| Carga |
|
Key:
min: | |
| Dell Latitude 5490-TD70X i5-8350U, UHD Graphics 620, Toshiba KSG60ZMV512G, IPS, 1920x1080, 14" | Dell Latitude 5480 i7-7600U, HD Graphics 620, Toshiba SG5 256GB THNSNK256GVN8, IPS, 1920x1080, 14" | HP EliteBook 840 G4-Z2V49ET ABD i5-7200U, HD Graphics 620, Samsung PM961 MZVLW256HEHP, TN, 1920x1080, 14" | Acer TravelMate P648-G2-M-73T0 i7-7500U, HD Graphics 620, SK Hynix HFS256G39TND-N210A, IPS, 1920x1080, 14" | Lenovo ThinkPad T470-20HD002HGE i5-7200U, HD Graphics 620, Samsung PM961 NVMe MZVLW512HMJP, IPS, 1920x1080, 14" | Fujitsu LifeBook U747 i5-7200U, HD Graphics 620, Samsung MZYTY256HDHP, IPS LED, 1920x1080, 14" | |
|---|---|---|---|---|---|---|
| Power Consumption | -12% | 14% | -16% | 14% | -4% | |
| Idle Minimum * (Watt) | 3.3 | 6.64 -101% | 2.9 12% | 4.8 -45% | 3.21 3% | 4.11 -25% |
| Idle Average * (Watt) | 5.54 | 6.67 -20% | 5.6 -1% | 7.9 -43% | 6.15 -11% | 7.87 -42% |
| Idle Maximum * (Watt) | 6.59 | 7.78 -18% | 8.15 -24% | 10.7 -62% | 6.82 -3% | 8.74 -33% |
| Load Average * (Watt) | 42.4 | 30.83 27% | 30.6 28% | 35 17% | 28.5 33% | 30.2 29% |
| Load Maximum * (Watt) | 67.6 | 31.7 53% | 31 54% | 31.6 53% | 34.5 49% | 32.4 52% |
* ... menor é melhor
| Dell Latitude 5490-TD70X i5-8350U, UHD Graphics 620, 68 Wh | Dell Latitude 5480 i7-7600U, HD Graphics 620, 68 Wh | HP EliteBook 840 G4-Z2V49ET ABD i5-7200U, HD Graphics 620, 51 Wh | Acer TravelMate P648-G2-M-73T0 i7-7500U, HD Graphics 620, 54 Wh | Lenovo ThinkPad T470-20HD002HGE i5-7200U, HD Graphics 620, 48 Wh | Fujitsu LifeBook U747 i5-7200U, HD Graphics 620, 50 Wh | Média da turma Office | |
|---|---|---|---|---|---|---|---|
| Duração da bateria | 23% | 2% | -12% | -20% | -29% | 3% | |
| Reader / Idle (h) | 25.9 | 24.1 -7% | 19.3 -25% | 18.1 -30% | 13 -50% | 24.5 ? -5% | |
| H.264 (h) | 13.2 | 9.9 -25% | 10.4 -21% | 8.2 -38% | 15.5 ? 17% | ||
| WiFi v1.3 (h) | 15 | 16.1 7% | 9.5 -37% | 11.2 -25% | 7.3 -51% | 7.2 -52% | 13.2 ? -12% |
| Load (h) | 1.6 | 2.7 69% | 3.1 94% | 1.9 19% | 1.8 13% | 2 25% | 1.808 ? 13% |
Pro
Contra
O Dell Latitude 5490 possui muitos pontos positivos, especialmente para empresas e seus empregados: Durante o uso em escritório, é muito eficiente e, graças à operação sem ventilador, muito silencioso. Os dispositivos de entrada também são de alta qualidade, mas a maior vantagem deste portátil é sua incrível duração da bateria, permitindo um dia de uso com tarefas menos exigentes. A coleção completa e opcional de recursos de segurança pode ser um argumento de compra igualmente bom.
É por isso que nos chateia tanto em ver que a Dell não tenha resolvido o maior ponto de crítica encontrado no predecessor, a tela escura. Embora oferece maior contraste e melhores níveis de preto que antes, ainda não é muito brilhante. E para piorar, sofre de terríveis tempos de reação e descoloração. O ruído da ventoinha sob uso intenso também poderia ser melhorado.
O 5490 está claramente destinado para empresas e seus empregados. No entanto, deve-se selecionar com cuidado as inúmeras configurações em oferta para receber o conjunto de recursos desejado. Para clientes menos preocupados com a segurança, certamente existem alternativas mais leves, menores, e mais silenciosas sob uso intenso, que normalmente também podem ser mais acessíveis. Aqueles interessados receberão um portátil empresarial seguro, poderoso e duradouro com uma tela, infelizmente, muito escura.
O 5490 é um pouco mais fino que o seu predecessor, mas a atualização Kaby-Lake raramente resulta em um desempenho melhorado no uso real. Em muitos aplicativos, o 5480 é, de fato, um pouco mais veloz. Talvez poderia valr a pena dar uma olhada no predecessor, no entanto, devemos mencionar que o 5480 é ainda mais barulhento sob uso intenso.
Dell Latitude 5490-TD70X
- 03/04/2018 v6 (old)
Christian Hintze