Notebookcheck Logo

MSI WE76 em revisão: Estação de trabalho móvel vai para o máximo desempenho

Nvidia RTX A5000 com 155 watts. A MSI apresenta o WE76, uma poderosa estação de trabalho móvel que é baseada no laptop para jogos GE76. Além de uma GPU RTX profissional da Nvidia, o WE76 também impressiona com um teclado muito bom e uma tela mate 4K.

A MSI vendeu seus laptops para jogos com ligeiras modificações como estações de trabalho móveis no passado. Uma vez que os laptops para jogos também são projetados para alto desempenho, este movimento faz sentido. O novo MSI WE76 é baseado no MSI GE76, que já revisamos. Mas ao invés das unidades gráficas GeForce, o WE76 utiliza as novas GPUs RTX A profissionais da Nvidia, fornecendo também as certificações para software profissional.

Nossa unidade de revisão é a variante WE76 11UM-456 high-end que custa 4.799 Euros (~$5.419) e está equipada com o Processador principal i9-11980HKo profissional RTX A5000 GPU32 GB de RAM, um SSD PCIe 4.0 de 2 TB e um painel mate de 4K com cobertura total AdobeRGB. Há também o modelo alternativo WE76 11UK-464 que vem com o Núcleo i7-11800HoRTX A3000e um SSD menor de 1 TB por 3.099 Euros (~$3.499).

MSI WE76 11UM-456
Processador
Intel Core i9-11980HK 8 x 3.3 - 5 GHz, 84 W PL2 / Short Burst, 62 W PL1 / Sustained, Tiger Lake-HK
Placa gráfica
NVIDIA RTX A5000 Laptop GPU - 16 GB VRAM, Análises do: 1800 MHz, Memoría: 1750 MHz, 155 W TDP, GDDR6, 472.12, Optimus
Memória
32 GB 
, DDR4-3200, dual-channel, 2 slots, max. 64 GB
Pantalha
17.30 polegadas 16:9, 3840 x 2160 pixel 255 PPI, B173ZAN03.3, IPS, Brilhante: não, 120 Hz
placa mãe
Intel HM570
Disco rígido
Samsung PM9A1 MZVL22T0HBLB, 2048 GB 
, 1780 GB livre
Placa de Som
Intel Tiger Lake PCH-H - cAVS (Audio, Voice, Speech)
Conexões
3 USB 3.0, 1 USB 3.1 Gen2, 1 USB 4.0 40 Gbps, 1 Thunderbolt, 1 HDMI, 2 DisplayPort, Conexões Audio: 3.5 mm stereo audio jack, Card Reader: SDXC, 1 Leitor de Impressões Digitais
Funcionamento em rede
Realtek RTL8125 2.5GBe Family Ethernet Controller (10/100/1000/2500MBit/s), Intel Killer Wi-Fi 6E AX1675x (210NGW) (b/g/n = Wi-Fi 4/ac = Wi-Fi 5/ax = Wi-Fi 6/ Wi-Fi 6E 6 GHz), Bluetooth 5.2
Tamanho
altura x largura x profundidade (em mm): 25.9 x 397 x 284
Bateria
99.9 Wh, 6250 mAh Lítio-Polímero, 4-cell
Sistema Operativo
Microsoft Windows 10 Pro 64 Bit
Camera
Webcam: 1080p
Primary Camera: 2 MPix
Características adicionais
Alto falantes: stereo, Teclado: chiclet, 280-watt PSU, MSI Center Pro, 36 Meses Garantia
peso
2.922 kg, Suprimento de energia: 1.06 kg
Preço
4 Euro
Note: The manufacturer may use components from different suppliers including display panels, drives or memory sticks with similar specifications.


Possible contenders in comparison

Rating
Date
Model
Weight
Height
Size
Resolution
Best Price
88.6 %
12/2021
MSI WE76 11UM-456
i9-11980HK, RTX A5000 Laptop GPU
2.9 kg25.9 mm17.30"3840x2160
89.8 %
11/2021
Lenovo ThinkPad P1 G4-20Y4S0KS00
i7-11850H, GeForce RTX 3070 Laptop GPU
2 kg17.7 mm16.00"3840x2400
90.3 %
10/2021
HP ZBook Fury 15 G8
i9-11950H, RTX A5000 Laptop GPU
2.5 kg25.9 mm15.60"3840x2160
12/2021
Asus ProArt StudioBook 16 W7600H5A-2BL2
W-11955M, RTX A5000 Laptop GPU
2.4 kg21.4 mm16.00"3840x2400
87.8 %
10/2021
Lenovo ThinkPad P17 G2-20YU0025G
i7-11800H, RTX A2000 Laptop GPU
3.6 kg28.38 mm17.30"1920x1080
89.8 %
04/2021
HP ZBook Fury 17 G7 119W5EA
i9-10885H, Quadro RTX 4000 Max-Q
2.9 kg26.9 mm17.30"3840x2160

Estojo - MSI faz sem a iluminação

O caso do MSI WE76 é idêntico ao do modelo de jogos GE76, mas o fabricante omitiu a faixa de LED na borda frontal. O design lembra uma casa de força para jogos, mas as superfícies foscas em preto e cinza fazem a estação de trabalho móvel parecer bastante discreta, o que também deve se encaixar bem em um ambiente de escritório. Devido ao uso de uma tela 16:9 (o que também é o caso em muitos outros modelos de 17 polegadas), a moldura da tela abaixo da tela parece muito larga, e a proporção entre a tela e a caixa também é de apenas 73%.

Em termos de estabilidade e mão-de-obra, nossa amostra de revisão é excelente; a unidade base em particular é extremamente resistente à torção. A tampa é um pouco mais flexível, mas não podemos causar nenhuma distorção de imagem. As dobradiças também são fundamentalmente ajustadas adequadamente, embora não possam impedir que a tela oscilasse até certo ponto. Além disso, este projeto de dobradiças limita o ângulo máximo de abertura a 135 graus, o que não é tão generoso como em alguns outros concorrentes

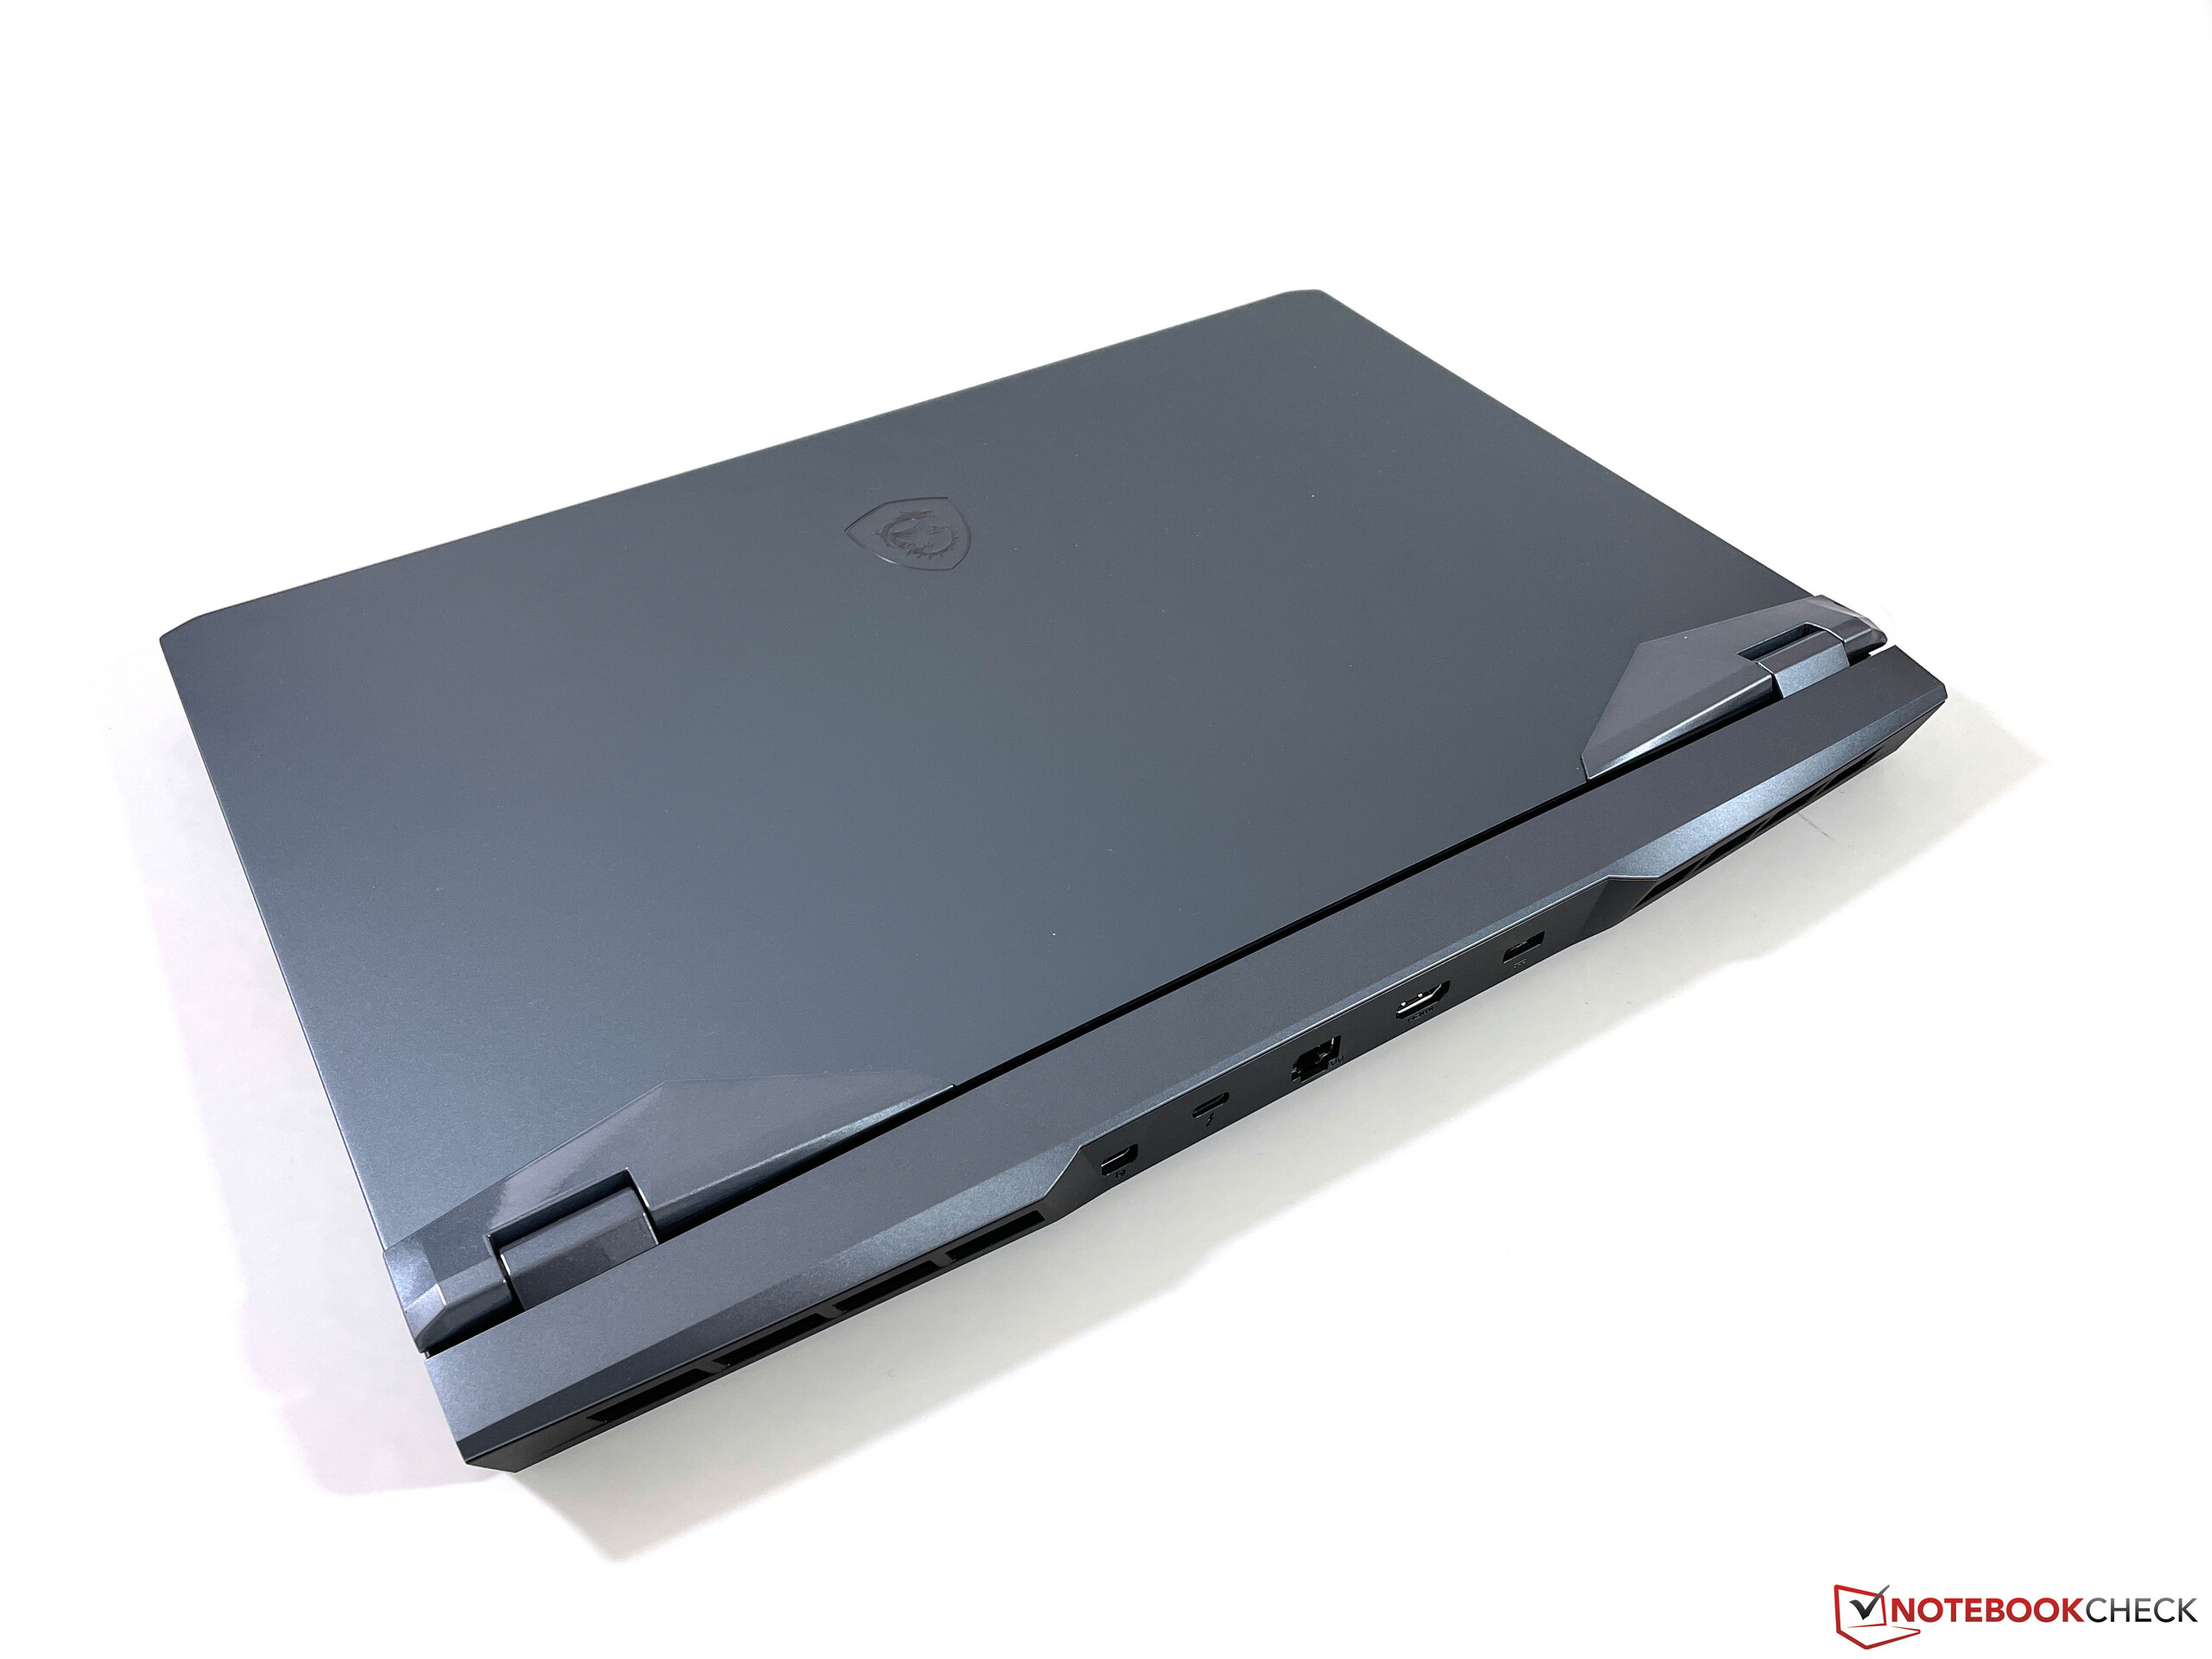
O WE76 é uma estação de trabalho móvel convencional com foco no desempenho. Consequentemente, o foco não estava em tornar o dispositivo tão fino e fino quanto possível. No entanto, a diferença é bastante pequena em comparação direta com nossos dois concorrentes de 17 polegadas, os PensePad P17e oZBook Fury 17. Nosso dispositivo de teste pesa 2.922 gramas, mas é preciso adicionar mais 1.060 gramas para o adaptador de energia volumoso ao transportar o laptop.

Size comparison

415.44 mm 280.81 mm 28.38 mm 3.6 kg398.4 mm 267.1 mm 26.9 mm 2.9 kg397 mm 268.5 mm 27.5 mm 2.6 kg397 mm 284 mm 25.9 mm 2.9 kg362 mm 264 mm 21.4 mm 2.4 kg357 mm 242.5 mm 25.9 mm 2.5 kg359.5 mm 253.8 mm 17.7 mm 2 kg297 mm 210 mm 1 mm 5.7 g

Conectividade - WE76 com Thunderbolt 4/USB 4

Quando se trata de portas, você encontrará tudo o que seu coração deseja, incluindo portas USB suficientes e a moderna interface Thunderbolt 4. As portas para o adaptador de energia, LAN e monitores externos (máximo de três) estão na parte traseira, enquanto as portas USB, bem como o leitor de cartões, foram colocados nas laterais para acesso rápido. Um leitor de cartão inteligente opcional, por outro lado, não está disponível

Certo: USB-A (3.2 Gen. 1), leitor SD, USB-A (3.2 Gen. 1)
Esquerda: USB-A (3.2 Gen. 1, alimentado), USB-C (3.2 Gen. 2), conector de áudio de 3,5 mm
Voltar: Mini DisplayPort, USB-C (4.0 com Thunderbolt 4), Ethernet (2.5 Gb/s), HDMI 2.1, fonte de alimentação

Leitor de cartões SD

O leitor de cartões SD completo à direita é mais rápido do que o do antigo WE75. Determinamos taxas de transferência de 80-90 MB/s com nosso cartão de referência (Angelbird AV Pro V60). Isto é aceitável, mas alguns dos concorrentes oferecem módulos consideravelmente mais rápidos. Um cartão SD inserido sobressai 4 milímetros da caixa

SD Card Reader
average JPG Copy Test (av. of 3 runs)
Lenovo ThinkPad P17 G2-20YU0025G
  (Toshiba Exceria Pro SDXC 64 GB UHS-II)
188 MB/s +125%
HP ZBook Fury 17 G7 119W5EA
  (AV Pro 60)
161.1 MB/s +93%
Average of class Workstation
  (54.8 - 200, n=16, last 2 years)
95.8 MB/s +15%
MSI WE76 11UM-456
  (AV Pro V60)
83.6 MB/s
HP ZBook Fury 15 G8
  (AV Pro V60)
75.6 MB/s -10%
Asus ProArt StudioBook 16 W7600H5A-2BL2
  (AV Pro SD microSD 128 GB V60)
68.3 MB/s -18%
MSI WE75 9TK
  (Toshiba Exceria Pro SDXC 64 GB UHS-II)
26.5 MB/s -68%
maximum AS SSD Seq Read Test (1GB)
Lenovo ThinkPad P17 G2-20YU0025G
  (Toshiba Exceria Pro SDXC 64 GB UHS-II)
205 MB/s +129%
HP ZBook Fury 17 G7 119W5EA
  (AV Pro 60)
172.7 MB/s +93%
Average of class Workstation
  (78.6 - 226, n=16, last 2 years)
125.6 MB/s +40%
MSI WE76 11UM-456
  (AV Pro V60)
89.5 MB/s
HP ZBook Fury 15 G8
  (AV Pro V60)
87.2 MB/s -3%
Asus ProArt StudioBook 16 W7600H5A-2BL2
  (AV Pro SD microSD 128 GB V60)
86.7 MB/s -3%
MSI WE75 9TK
  (Toshiba Exceria Pro SDXC 64 GB UHS-II)
31.57 MB/s -65%

Comunicação

A MSI usa o módulo rápido Killer AX1675x, que suporta o moderno padrão Wi-Fi 6E, bem como Bluetooth 5.2. As taxas de transferência são muito boas e estão no topo de nosso campo de comparação em nosso teste Wi-Fi padronizado com o roteador Netgear Nighthawk RAX120

Networking
iperf3 transmit AX12
MSI WE76 11UM-456
Intel Killer Wi-Fi 6E AX1675x (210NGW)
1393 (713min - 1475max) MBit/s
HP ZBook Fury 17 G7 119W5EA
Intel Wi-Fi 6 AX201
1346 (644min - 1421max) MBit/s -3%
Average Intel Killer Wi-Fi 6E AX1675x (210NGW)
  (1066 - 1499, n=8)
1272 MBit/s -9%
HP ZBook Fury 15 G8
Intel Wi-Fi 6 AX201
1211 (954min - 1321max) MBit/s -13%
Asus ProArt StudioBook 16 W7600H5A-2BL2
Intel Wi-Fi 6 AX201
884 (468min - 938max) MBit/s -37%
Lenovo ThinkPad P17 G2-20YU0025G
Intel Wi-Fi 6E AX210
767 (421min - 954max) MBit/s -45%
iperf3 receive AX12
MSI WE76 11UM-456
Intel Killer Wi-Fi 6E AX1675x (210NGW)
1456 (1371min - 1566max) MBit/s
HP ZBook Fury 17 G7 119W5EA
Intel Wi-Fi 6 AX201
1400 (636min - 1472max) MBit/s -4%
Lenovo ThinkPad P17 G2-20YU0025G
Intel Wi-Fi 6E AX210
1391 (1094min - 1575max) MBit/s -4%
Average Intel Killer Wi-Fi 6E AX1675x (210NGW)
  (1037 - 1469, n=8)
1309 MBit/s -10%
HP ZBook Fury 15 G8
Intel Wi-Fi 6 AX201
1249 (1170min - 1318max) MBit/s -14%
Asus ProArt StudioBook 16 W7600H5A-2BL2
Intel Wi-Fi 6 AX201
579 (368min - 652max) MBit/s -60%
050100150200250300350400450500550600650700750800850900950100010501100115012001250130013501400145015001550Tooltip
MSI WE76 11UM-456; iperf3 receive AX12; iperf 3.1.3: Ø1455 (1371-1566)
MSI WE76 11UM-456; iperf3 transmit AX12; iperf 3.1.3: Ø1369 (713-1475)

Webcam

Embora a webcam 1080p acima do visor ofereça uma resolução ligeiramente superior aos módulos usuais de 720p, a qualidade da imagem ainda não é particularmente boa. Tivemos que lidar com uma quantidade relativamente alta de ruído, em particular durante nossas gravações. Os vídeos Full HD podem ser filmados a 30 FPS

ColorChecker
14.4 ∆E
12.6 ∆E
13.9 ∆E
15.2 ∆E
12.7 ∆E
4.9 ∆E
11.8 ∆E
13.1 ∆E
16.1 ∆E
14.6 ∆E
6.3 ∆E
8.9 ∆E
11.9 ∆E
3.2 ∆E
20.2 ∆E
4.9 ∆E
15.2 ∆E
5.1 ∆E
3.8 ∆E
1.9 ∆E
4.3 ∆E
4.8 ∆E
4.5 ∆E
6.6 ∆E
ColorChecker MSI WE76 11UM-456: 9.63 ∆E min: 1.86 - max: 20.15 ∆E

Manutenção

Após soltar todos os parafusos cruzados, a tampa inferior completa pode ser removida. Além dos dois slots SODIMM, há também dois slots M.2-2280 disponíveis (1x PCIe 4.0 e 1x PCIe 3.0). O módulo Wi-Fi também pode ser substituído

Estrutura interna
Estrutura interna

Dispositivos de entrada - SteelSeries com teclado numérico

Teclado

Como seus irmãos de jogo, a estação de trabalho WE76 também conta com um teclado SteelSeries. No entanto, a luz de fundo colorida foi omitida; em vez disso, há apenas uma luz de fundo branca. As teclas oferecem uma viagem relativamente longa, e a sensação de digitação é muito boa e pode facilmente competir com os melhores teclados da concorrência da estação de trabalho estabelecida. Além disso, um teclado numérico completo está integrado no lado direito. Suas teclas são um pouco mais estreitas, mas isto não provou ser um problema na prática

Dispositivos de entrada
Retroiluminação do teclado

Touchpad

A 10,5 x 6,5 cm, o ClickPad não é particularmente grande pelos padrões atuais, mas o controle do mouse funciona sem problemas. A superfície lisa oferece boas propriedades de deslizamento, e o scanner de impressões digitais embutido, localizado no canto superior esquerdo, não atrapalha. No entanto, o touchpad parece um pouco confuso, porque há uma ligeira lacuna antes de se chegar ao mecanismo de clique real. Isto significa que a metade inferior pode ser pressionada notavelmente para baixo sem que um clique seja acionado. Além disso, o clique real é muito alto, o que o faz sentir-se barato.

Display - Painel Matte 4K com AdobeRGB e 120 Hz

Grelha subpixel
Grelha subpixel
Pequeno sangramento na tela

O WE76 está disponível exclusivamente com um painel mate 4K em uma relação de aspecto 16:9. De acordo com a MSI, o display também cobre o espaço de cor AdobeRGB em sua totalidade, e uma taxa de atualização de 120 Hz garante uma imagem suave, que também é habilitada por padrão. A MSI se abstém de usar os painéis ainda mais rápidos de suas versões de jogos aqui, o que faz sentido, no entanto.

A impressão subjetiva da imagem do painel é excelente. As imagens são extremamente nítidas, e mesmo as áreas brilhantes não parecem granulosas. No entanto, as cores não são tão vibrantes em comparação com os painéis OLED ou mini LED de alta qualidade. O brilho médio é pouco mais de 400 cd/m², e a relação de contraste excede 1.200:1. No geral, é uma melhoria notável em relação à tela de 1080p do antigo MSI WE75mas alguns dos painéis de alta resolução da concorrência oferecem melhores pontuações.

O PWM não é usado e os tempos de resposta são muito rápidos, o que significa que não há efeitos fantasmas. No brilho máximo, você pode notar um leve sangramento na tela nas bordas ao usar um fundo escuro, mas isto não é perceptível na prática.

422
cd/m²
434
cd/m²
424
cd/m²
412
cd/m²
419
cd/m²
404
cd/m²
412
cd/m²
414
cd/m²
407
cd/m²
Distribuição do brilho
B173ZAN03.3 tested with X-Rite i1Pro 2
Máximo: 434 cd/m² (Nits) Médio: 416.4 cd/m² Minimum: 19 cd/m²
iluminação: 93 %
iluminação com acumulador: 420 cd/m²
Contraste: 1232:1 (Preto: 0.34 cd/m²)
ΔE Color 1.5 | 0.5-29.43 Ø5, calibrated: 0.9
ΔE Greyscale 2 | 0.57-98 Ø5.3
96% AdobeRGB 1998 (Argyll 2.2.0 3D)
99.3% sRGB (Argyll 2.2.0 3D)
82.1% Display P3 (Argyll 2.2.0 3D)
Gamma: 2.17
MSI WE76 11UM-456
B173ZAN03.3, IPS, 3840x2160, 17.30
Lenovo ThinkPad P1 G4-20Y4S0KS00
LP160UQ1-SPB1, IPS LED, 3840x2400, 16.00
HP ZBook Fury 15 G8
BOE0969, IPS, 3840x2160, 15.60
Asus ProArt StudioBook 16 W7600H5A-2BL2
ATNA60YV02-0, OLED, 3840x2400, 16.00
Lenovo ThinkPad P17 G2-20YU0025G
LP173WF4-SPF7, IPS LED, 1920x1080, 17.30
HP ZBook Fury 17 G7 119W5EA
AUOCD8C, , 3840x2160, 17.30
MSI WE75 9TK
AU Optronics B173HAN04.2, IPS, 1920x1080, 17.30
Display
2%
3%
9%
-21%
4%
-22%
Display P3 Coverage
82.1
85.7
4%
95.9
17%
99.9
22%
67.9
-17%
99.3
21%
63.2
-23%
sRGB Coverage
99.3
99.4
0%
100
1%
100
1%
87.3
-12%
99.9
1%
89.9
-9%
AdobeRGB 1998 Coverage
96
98.9
3%
87.3
-9%
98.6
3%
63.9
-33%
86.9
-9%
64.3
-33%
Response Times
-202%
7%
85%
-115%
-244%
-132%
Response Time Grey 50% / Grey 80% *
17.6 ?(8.4, 9.2)
55.2 ?(26.8, 28.4)
-214%
14.8 ?(7.6, 7.2)
16%
2 ?(1, 1)
89%
39.2 ?(21.2, 18)
-123%
56 ?(26, 30)
-218%
30.8 ?(14.4, 16.4)
-75%
Response Time Black / White *
10.8 ?(5.6, 5.2)
31.2 ?(16.4, 14.8)
-189%
11 ?(7.6, 3.4)
-2%
2 ?(1, 1)
81%
22.4 ?(11.6, 10.8)
-107%
40 ?(22, 18)
-270%
31.2 ?(18.8, 12.4)
-189%
PWM Frequency
240 ?(80)
Screen
0%
-59%
-39%
-101%
5%
-50%
Brightness middle
419
630
50%
626
49%
353
-16%
361
-14%
573
37%
287.3
-31%
Brightness
416
622
50%
589
42%
360
-13%
334
-20%
586
41%
280
-33%
Brightness Distribution
93
90
-3%
87
-6%
96
3%
87
-6%
91
-2%
89
-4%
Black Level *
0.34
0.41
-21%
0.58
-71%
0.35
-3%
0.38
-12%
0.26
24%
Contrast
1232
1537
25%
1079
-12%
1031
-16%
1508
22%
1105
-10%
Colorchecker dE 2000 *
1.5
2.2
-47%
5.41
-261%
2.45
-63%
5.4
-260%
1.9
-27%
2.98
-99%
Colorchecker dE 2000 max. *
4.7
5
-6%
9.05
-93%
3.75
20%
9.9
-111%
4.2
11%
5.08
-8%
Colorchecker dE 2000 calibrated *
0.9
1
-11%
0.6
33%
2.77
-208%
3.2
-256%
0.7
22%
3.06
-240%
Greyscale dE 2000 *
2
2.7
-35%
6.2
-210%
1.88
6%
6.5
-225%
2.9
-45%
3
-50%
Gamma
2.17 101%
2.26 97%
2.66 83%
2.31 95%
2.23 99%
2.1 105%
2.28 96%
CCT
6629 98%
6886 94%
6101 107%
6441 101%
7351 88%
6217 105%
6993 93%
Color Space (Percent of AdobeRGB 1998)
77.6
58.1
Color Space (Percent of sRGB)
100
89.5
Total Average (Program / Settings)
-67% / -28%
-16% / -36%
18% / -6%
-79% / -86%
-78% / -31%
-68% / -56%

* ... smaller is better

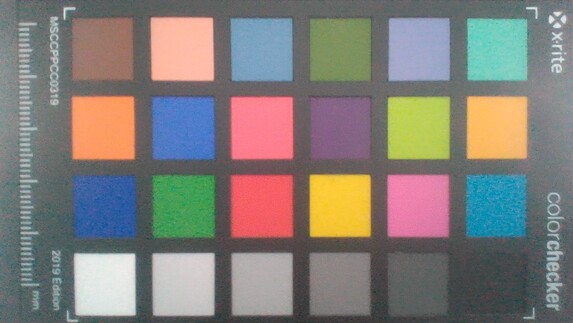
De acordo com o fabricante, a tela de 4K cobre o espaço de cores AdobeRGB em sua totalidade; medimos uma taxa de 96%. A MSI instalou o software TrueColor, que pode ser usado para mudar o espaço de cores. Usamos o modo padrão AdobeRGB

vs. sRGB
vs. sRGB
vs. DCI-P3
vs. DCI-P3
vs. AdobeRGB
vs. AdobeRGB

Nossa análise (CalMAN e X-Rite i1 Pro 2) mostra que todas as cores estão abaixo do importante desvio de 3, mesmo fora da caixa. No entanto, ainda conseguimos melhorar um pouco a reprodução em escala de cinza com nossa calibração (o perfil correspondente está disponível para download acima). Portanto, o painel 4K é adequado para editar imagens/vídeos sem nenhum problema, mas o conteúdo HDR não é suportado

CalMAN - Grayscales (espaço de cor alvo AdobeRGB)
CalMAN - Saturação (espaço de cor de destino AdobeRGB)
CalMAN - ColorChecker (espaço de cor de destino AdobeRGB)
CalMAN - Grayscales calibrado (espaço de cor alvo AdobeRGB)
CalMAN - Saturação calibrada (espaço de cor alvo AdobeRGB)
CalMAN - ColorChecker calibrado (espaço de cor alvo AdobeRGB)

Display Response Times

Display response times show how fast the screen is able to change from one color to the next. Slow response times can lead to afterimages and can cause moving objects to appear blurry (ghosting). Gamers of fast-paced 3D titles should pay special attention to fast response times.
       Response Time Black to White
10.8 ms ... rise ↗ and fall ↘ combined↗ 5.6 ms rise
↘ 5.2 ms fall
The screen shows good response rates in our tests, but may be too slow for competitive gamers.
In comparison, all tested devices range from 0.1 (minimum) to 240 (maximum) ms. » 24 % of all devices are better.
This means that the measured response time is better than the average of all tested devices (21.4 ms).
       Response Time 50% Grey to 80% Grey
17.6 ms ... rise ↗ and fall ↘ combined↗ 8.4 ms rise
↘ 9.2 ms fall
The screen shows good response rates in our tests, but may be too slow for competitive gamers.
In comparison, all tested devices range from 0.2 (minimum) to 636 (maximum) ms. » 26 % of all devices are better.
This means that the measured response time is better than the average of all tested devices (33.7 ms).

Screen Flickering / PWM (Pulse-Width Modulation)

To dim the screen, some notebooks will simply cycle the backlight on and off in rapid succession - a method called Pulse Width Modulation (PWM) . This cycling frequency should ideally be undetectable to the human eye. If said frequency is too low, users with sensitive eyes may experience strain or headaches or even notice the flickering altogether.
Screen flickering / PWM not detected

In comparison: 53 % of all tested devices do not use PWM to dim the display. If PWM was detected, an average of 17803 (minimum: 5 - maximum: 3846000) Hz was measured.

O WE76 certamente não é um dispositivo que será usado com freqüência em movimento, mas a superfície mate do painel é naturalmente benéfica ao ar livre, e é muito confortável para usá-lo em dias nublados, pelo menos. A estabilidade do visor do IPS não deixa espaço para críticas

Ao ar livre (nublado)
Estabilidade do ângulo de visão

Desempenho - WE76 com Core i9 e RTX A5000

Condições de teste

Além das configurações normais do Windows, a MSI oferece diferentes configurações de desempenho com o MSI Center Pro pré-instalado. Fizemos os seguintes testes usando a predefinição Equilibrada, mas em alguns aspectos, também vamos dar uma olhada nos efeitos dos outros modos de desempenho. O modo de alto desempenho afeta principalmente o desempenho no teste de estresse, que é quando se estressa tanto a CPU quanto a GPU

Processador

A MSI optou pela IntelNúcleo i9-11980HK que tem um desempenho muito bom em nossos testes e pode muitas vezes se colocar no topo do campo de comparação. O processador pode consumir um máximo de 84 watts, mas se estabiliza rapidamente a 70 watts e mais tarde a ~62 watts. Isto também seria possível com umNúcleo i7-11800H como podemos ver no PensePad P17 Gen 2. No entanto, a AMDRyzen 9 5900HX é um pouco mais rápido sob uma configuração TDP comparável (~64 watts no caso do Asus ROG Zephyrus Duo 15).

O desempenho da CPU é visivelmente reduzido com a energia da bateria, já que o TDP cai rapidamente para apenas 45 watts e depois 35 watts. Portanto, você deve esperar um déficit de cerca de 30%-40% ao usar todos os núcleos. Outras comparações estão disponíveis em nosso Artigo de CPU Benchmarks.

Cinebench R15 Multi endurance test

011523034546057569080592010351150126513801495161017251840195520702185Tooltip
MSI WE76 11UM-456 Intel Core i9-11980HK: Ø2021 (1955.32-2192.14)
Lenovo ThinkPad P1 G4-20Y4S0KS00 Intel Core i7-11850H: Ø1803 (1759.48-1988.07)
HP ZBook Fury 15 G8 Intel Core i9-11950H: Ø1775 (1695.06-1826.82)
Asus ProArt StudioBook 16 W7600H5A-2BL2 Intel Xeon W-11955M: Ø1771 (1747.11-1845.61)
Lenovo ThinkPad P17 G2-20YU0025G Intel Core i7-11800H: Ø2018 (1959.15-2144.43)
HP ZBook Fury 17 G7 119W5EA Intel Core i9-10885H: Ø1456 (1429.34-1516.82)
MSI WE75 9TK Intel Core i7-9750H: Ø1149 (1132.57-1211.28)
Asus ROG Zephyrus Duo 15 SE GX551QS AMD Ryzen 9 5900HX: Ø2260 (2246.56-2267.32)
CPU Performance Rating: Percent
Cinebench R23: Multi Core | Single Core
Cinebench R20: CPU (Multi Core) | CPU (Single Core)
Cinebench R15: CPU Multi 64Bit | CPU Single 64Bit
Blender: v2.79 BMW27 CPU
7-Zip 18.03: 7z b 4 | 7z b 4 -mmt1
Geekbench 5.5: Multi-Core | Single-Core
HWBOT x265 Benchmark v2.2: 4k Preset
LibreOffice : 20 Documents To PDF
R Benchmark 2.5: Overall mean
CPU Performance Rating
Average of class Workstation
 
82.1 pt
MSI WE76 11UM-456 -1!
Intel Core i9-11980HK
77 pt
Lenovo ThinkPad P1 G4-20Y4S0KS00
Intel Core i7-11850H
69.8 pt
Average Intel Core i9-11980HK
 
69.6 pt
Lenovo ThinkPad P17 G2-20YU0025G
Intel Core i7-11800H
68.3 pt
Asus ProArt StudioBook 16 W7600H5A-2BL2
Intel Xeon W-11955M
67 pt
HP ZBook Fury 15 G8 -2!
Intel Core i9-11950H
66.1 pt
MSI WE75 9TK -10!
Intel Core i7-9750H
59.5 pt
HP ZBook Fury 17 G7 119W5EA
Intel Core i9-10885H
54.6 pt
Cinebench R23 / Multi Core
Average of class Workstation
  (4332 - 24560, n=29, last 2 years)
15473 Points +16%
MSI WE76 11UM-456
Intel Core i9-11980HK
13387 Points
Lenovo ThinkPad P17 G2-20YU0025G
Intel Core i7-11800H
12876 Points -4%
HP ZBook Fury 15 G8
Intel Core i9-11950H
12247 (11482min - 12246.8max) Points -9%
Lenovo ThinkPad P1 G4-20Y4S0KS00
Intel Core i7-11850H
11935 Points -11%
Average Intel Core i9-11980HK
  (8459 - 13387, n=2)
10923 Points -18%
Asus ProArt StudioBook 16 W7600H5A-2BL2
Intel Xeon W-11955M
10862 (10718min - 10862.2max) Points -19%
HP ZBook Fury 17 G7 119W5EA
Intel Core i9-10885H
8802 (8415.48min - 8801.64max) Points -34%
Cinebench R23 / Single Core
Average of class Workstation
  (1144 - 2106, n=29, last 2 years)
1761 Points +9%
MSI WE76 11UM-456
Intel Core i9-11980HK
1613 Points
HP ZBook Fury 15 G8
Intel Core i9-11950H
1596 Points -1%
Average Intel Core i9-11980HK
  (1505 - 1613, n=2)
1559 Points -3%
Lenovo ThinkPad P1 G4-20Y4S0KS00
Intel Core i7-11850H
1552 Points -4%
Lenovo ThinkPad P17 G2-20YU0025G
Intel Core i7-11800H
1508 Points -7%
Asus ProArt StudioBook 16 W7600H5A-2BL2
Intel Xeon W-11955M
1480 Points -8%
HP ZBook Fury 17 G7 119W5EA
Intel Core i9-10885H
1284 Points -20%
Cinebench R20 / CPU (Multi Core)
Average of class Workstation
  (1669 - 9329, n=30, last 2 years)
5876 Points +32%
Lenovo ThinkPad P17 G2-20YU0025G
Intel Core i7-11800H
5180 Points +17%
HP ZBook Fury 15 G8
Intel Core i9-11950H
4669 Points +5%
Lenovo ThinkPad P1 G4-20Y4S0KS00
Intel Core i7-11850H
4663 Points +5%
Average Intel Core i9-11980HK
  (3779 - 5256, n=8)
4578 Points +3%
MSI WE76 11UM-456
Intel Core i9-11980HK
4437 Points
Asus ProArt StudioBook 16 W7600H5A-2BL2
Intel Xeon W-11955M
4250 Points -4%
HP ZBook Fury 17 G7 119W5EA
Intel Core i9-10885H
3639 Points -18%
MSI WE75 9TK
Intel Core i7-9750H
2672 Points -40%
Cinebench R20 / CPU (Single Core)
Average of class Workstation
  (528 - 816, n=30, last 2 years)
685 Points +10%
MSI WE76 11UM-456
Intel Core i9-11980HK
622 Points
HP ZBook Fury 15 G8
Intel Core i9-11950H
618 Points -1%
Lenovo ThinkPad P1 G4-20Y4S0KS00
Intel Core i7-11850H
607 Points -2%
Average Intel Core i9-11980HK
  (572 - 622, n=7)
593 Points -5%
Lenovo ThinkPad P17 G2-20YU0025G
Intel Core i7-11800H
582 Points -6%
Asus ProArt StudioBook 16 W7600H5A-2BL2
Intel Xeon W-11955M
568 Points -9%
HP ZBook Fury 17 G7 119W5EA
Intel Core i9-10885H
489 Points -21%
MSI WE75 9TK
Intel Core i7-9750H
465 Points -25%
Cinebench R15 / CPU Multi 64Bit
Average of class Workstation
  (706 - 3625, n=29, last 2 years)
2411 Points +10%
MSI WE76 11UM-456
Intel Core i9-11980HK
2192 (1955.32min - 2192.14max) Points
Lenovo ThinkPad P17 G2-20YU0025G
Intel Core i7-11800H
2144 (1959.15min - 2144.43max) Points -2%
Average Intel Core i9-11980HK
  (1696 - 2287, n=7)
2055 Points -6%
Lenovo ThinkPad P1 G4-20Y4S0KS00
Intel Core i7-11850H
1988 (1759.48min - 1988.07max) Points -9%
Asus ProArt StudioBook 16 W7600H5A-2BL2
Intel Xeon W-11955M
1846 (1747.11min - 1845.61max) Points -16%
HP ZBook Fury 15 G8
Intel Core i9-11950H
1827 (1695.06min - 1826.82max) Points -17%
HP ZBook Fury 17 G7 119W5EA
Intel Core i9-10885H
1517 (1429.34min - 1516.82max) Points -31%
MSI WE75 9TK
Intel Core i7-9750H
1211 Points -45%
Cinebench R15 / CPU Single 64Bit
Average of class Workstation
  (166.2 - 301, n=29, last 2 years)
256 Points +5%
MSI WE76 11UM-456
Intel Core i9-11980HK
244 Points
HP ZBook Fury 15 G8
Intel Core i9-11950H
241 Points -1%
Lenovo ThinkPad P1 G4-20Y4S0KS00
Intel Core i7-11850H
233 Points -5%
Lenovo ThinkPad P17 G2-20YU0025G
Intel Core i7-11800H
231 Points -5%
Average Intel Core i9-11980HK
  (224 - 244, n=6)
231 Points -5%
Asus ProArt StudioBook 16 W7600H5A-2BL2
Intel Xeon W-11955M
230 Points -6%
HP ZBook Fury 17 G7 119W5EA
Intel Core i9-10885H
211 Points -14%
MSI WE75 9TK
Intel Core i7-9750H
191 Points -22%
Blender / v2.79 BMW27 CPU
HP ZBook Fury 17 G7 119W5EA
Intel Core i9-10885H
302 Seconds *
Asus ProArt StudioBook 16 W7600H5A-2BL2
Intel Xeon W-11955M
276 Seconds *
HP ZBook Fury 15 G8
Intel Core i9-11950H
261 Seconds *
Lenovo ThinkPad P1 G4-20Y4S0KS00
Intel Core i7-11850H
257 Seconds *
Average Intel Core i9-11980HK
  (231 - 284, n=4)
257 Seconds *
Lenovo ThinkPad P17 G2-20YU0025G
Intel Core i7-11800H
250 Seconds *
Average of class Workstation
  (137 - 684, n=29, last 2 years)
248 Seconds *
7-Zip 18.03 / 7z b 4
Average of class Workstation
  (20087 - 99351, n=29, last 2 years)
61988 MIPS +16%
MSI WE76 11UM-456
Intel Core i9-11980HK
53426 MIPS
Average Intel Core i9-11980HK
  (45226 - 56759, n=5)
51899 MIPS -3%
Lenovo ThinkPad P1 G4-20Y4S0KS00
Intel Core i7-11850H
50552 MIPS -5%
HP ZBook Fury 15 G8
Intel Core i9-11950H
50060 MIPS -6%
Lenovo ThinkPad P17 G2-20YU0025G
Intel Core i7-11800H
49079 MIPS -8%
Asus ProArt StudioBook 16 W7600H5A-2BL2
Intel Xeon W-11955M
47264 MIPS -12%
HP ZBook Fury 17 G7 119W5EA
Intel Core i9-10885H
41823 MIPS -22%
7-Zip 18.03 / 7z b 4 -mmt1
Average of class Workstation
  (4777 - 6670, n=29, last 2 years)
5878 MIPS +3%
Lenovo ThinkPad P1 G4-20Y4S0KS00
Intel Core i7-11850H
5762 MIPS +1%
HP ZBook Fury 15 G8
Intel Core i9-11950H
5755 MIPS +1%
MSI WE76 11UM-456
Intel Core i9-11980HK
5726 MIPS
Average Intel Core i9-11980HK
  (5428 - 5735, n=5)
5643 MIPS -1%
HP ZBook Fury 17 G7 119W5EA
Intel Core i9-10885H
5589 MIPS -2%
Lenovo ThinkPad P17 G2-20YU0025G
Intel Core i7-11800H
5444 MIPS -5%
Asus ProArt StudioBook 16 W7600H5A-2BL2
Intel Xeon W-11955M
5222 MIPS -9%
Geekbench 5.5 / Multi-Core
Average of class Workstation
  (5022 - 17487, n=29, last 2 years)
11836 Points +17%
MSI WE76 11UM-456
Intel Core i9-11980HK
10081 Points
Average Intel Core i9-11980HK
  (8786 - 10081, n=5)
9523 Points -6%
Lenovo ThinkPad P1 G4-20Y4S0KS00
Intel Core i7-11850H
9451 Points -6%
Asus ProArt StudioBook 16 W7600H5A-2BL2
Intel Xeon W-11955M
8349 Points -17%
Lenovo ThinkPad P17 G2-20YU0025G
Intel Core i7-11800H
8147 Points -19%
HP ZBook Fury 17 G7 119W5EA
Intel Core i9-10885H
6529 Points -35%
Geekbench 5.5 / Single-Core
Average of class Workstation
  (1474 - 2095, n=29, last 2 years)
1829 Points +9%
MSI WE76 11UM-456
Intel Core i9-11980HK
1679 Points
Lenovo ThinkPad P1 G4-20Y4S0KS00
Intel Core i7-11850H
1659 Points -1%
Average Intel Core i9-11980HK
  (1561 - 1679, n=5)
1625 Points -3%
Lenovo ThinkPad P17 G2-20YU0025G
Intel Core i7-11800H
1557 Points -7%
Asus ProArt StudioBook 16 W7600H5A-2BL2
Intel Xeon W-11955M
1487 Points -11%
HP ZBook Fury 17 G7 119W5EA
Intel Core i9-10885H
1317 Points -22%
HWBOT x265 Benchmark v2.2 / 4k Preset
Average of class Workstation
  (5.09 - 26, n=29, last 2 years)
17.2 fps +9%
MSI WE76 11UM-456
Intel Core i9-11980HK
15.8 fps
Average Intel Core i9-11980HK
  (13.1 - 16.3, n=5)
14.9 fps -6%
Lenovo ThinkPad P17 G2-20YU0025G
Intel Core i7-11800H
14.6 fps -8%
Lenovo ThinkPad P1 G4-20Y4S0KS00
Intel Core i7-11850H
14.4 fps -9%
HP ZBook Fury 15 G8
Intel Core i9-11950H
14.2 fps -10%
Asus ProArt StudioBook 16 W7600H5A-2BL2
Intel Xeon W-11955M
13.4 fps -15%
HP ZBook Fury 17 G7 119W5EA
Intel Core i9-10885H
11.3 fps -28%
LibreOffice / 20 Documents To PDF
HP ZBook Fury 17 G7 119W5EA
Intel Core i9-10885H
54.8 s * -15%
HP ZBook Fury 15 G8
Intel Core i9-11950H
52.2 s * -9%
Lenovo ThinkPad P17 G2-20YU0025G
Intel Core i7-11800H
50.7 s * -6%
MSI WE76 11UM-456
Intel Core i9-11980HK
47.7 s *
Average of class Workstation
  (36.5 - 95.2, n=29, last 2 years)
47.7 s * -0%
Lenovo ThinkPad P1 G4-20Y4S0KS00
Intel Core i7-11850H
45.8 s * +4%
Average Intel Core i9-11980HK
  (40.6 - 47.7, n=5)
43.1 s * +10%
Asus ProArt StudioBook 16 W7600H5A-2BL2
Intel Xeon W-11955M
23 s * +52%
R Benchmark 2.5 / Overall mean
HP ZBook Fury 17 G7 119W5EA
Intel Core i9-10885H
0.571 sec * -5%
Asus ProArt StudioBook 16 W7600H5A-2BL2
Intel Xeon W-11955M
0.57 sec * -5%
Lenovo ThinkPad P17 G2-20YU0025G
Intel Core i7-11800H
0.569 sec * -4%
Average Intel Core i9-11980HK
  (0.545 - 0.565, n=5)
0.552 sec * -1%
MSI WE76 11UM-456
Intel Core i9-11980HK
0.545 sec *
HP ZBook Fury 15 G8
Intel Core i9-11950H
0.544 sec * -0%
Lenovo ThinkPad P1 G4-20Y4S0KS00
Intel Core i7-11850H
0.541 sec * +1%
Average of class Workstation
  (0.3876 - 0.544, n=29, last 2 years)
0.4611 sec * +15%

* ... smaller is better

Cinebench R15 CPU Multi 64Bit
2192 Points
Cinebench R15 OpenGL 64Bit
302 fps
Cinebench R15 Ref. Match 64Bit
99.6 %
Cinebench R15 CPU Single 64Bit
244 Points
Ajuda
Performance Rating
Average of class Workstation
 
94.3 pt
MSI WE76 11UM-456
Intel Core i9-11980HK, RTX A5000 Laptop GPU
91.6 pt
HP ZBook Fury 15 G8
Intel Core i9-11950H, RTX A5000 Laptop GPU
87.3 pt
Average Intel Core i9-11980HK
 
85.7 pt
HP ZBook Fury 17 G7 119W5EA
Intel Core i9-10885H, Quadro RTX 4000 Max-Q
70.6 pt
Lenovo ThinkPad P1 G4-20Y4S0KS00 -9!
Intel Core i7-11850H, GeForce RTX 3070 Laptop GPU
0 pt
Asus ProArt StudioBook 16 W7600H5A-2BL2 -9!
Intel Xeon W-11955M, RTX A5000 Laptop GPU
0 pt
Lenovo ThinkPad P17 G2-20YU0025G -9!
Intel Core i7-11800H, RTX A2000 Laptop GPU
0 pt
AIDA64 / FP32 Ray-Trace
Average of class Workstation
  (2619 - 25776, n=29, last 2 years)
15717 KRay/s 0%
MSI WE76 11UM-456
Intel Core i9-11980HK, RTX A5000 Laptop GPU
15661 KRay/s
Average Intel Core i9-11980HK
  (14180 - 15661, n=2)
14921 KRay/s -5%
HP ZBook Fury 15 G8
Intel Core i9-11950H, RTX A5000 Laptop GPU
14775 KRay/s -6%
HP ZBook Fury 17 G7 119W5EA
Intel Core i9-10885H, Quadro RTX 4000 Max-Q
12196 KRay/s -22%
AIDA64 / FPU Julia
Average of class Workstation
  (12909 - 109059, n=29, last 2 years)
78470 Points +23%
MSI WE76 11UM-456
Intel Core i9-11980HK, RTX A5000 Laptop GPU
64043 Points
Average Intel Core i9-11980HK
  (59177 - 64043, n=2)
61610 Points -4%
HP ZBook Fury 15 G8
Intel Core i9-11950H, RTX A5000 Laptop GPU
61337 Points -4%
HP ZBook Fury 17 G7 119W5EA
Intel Core i9-10885H, Quadro RTX 4000 Max-Q
59301 Points -7%
AIDA64 / CPU SHA3
MSI WE76 11UM-456
Intel Core i9-11980HK, RTX A5000 Laptop GPU
4220 MB/s
Average Intel Core i9-11980HK
  (3928 - 4220, n=2)
4074 MB/s -3%
HP ZBook Fury 15 G8
Intel Core i9-11950H, RTX A5000 Laptop GPU
4032 MB/s -4%
Average of class Workstation
  (824 - 4981, n=29, last 2 years)
3489 MB/s -17%
HP ZBook Fury 17 G7 119W5EA
Intel Core i9-10885H, Quadro RTX 4000 Max-Q
2945 MB/s -30%
AIDA64 / CPU Queen
MSI WE76 11UM-456
Intel Core i9-11980HK, RTX A5000 Laptop GPU
98443 Points
Average Intel Core i9-11980HK
  (97901 - 98443, n=2)
98172 Points 0%
Average of class Workstation
  (26716 - 131931, n=29, last 2 years)
97982 Points 0%
HP ZBook Fury 15 G8
Intel Core i9-11950H, RTX A5000 Laptop GPU
97840 Points -1%
HP ZBook Fury 17 G7 119W5EA
Intel Core i9-10885H, Quadro RTX 4000 Max-Q
93364 Points -5%
AIDA64 / FPU SinJulia
MSI WE76 11UM-456
Intel Core i9-11980HK, RTX A5000 Laptop GPU
10494 Points
Average of class Workstation
  (3105 - 14742, n=29, last 2 years)
10371 Points -1%
Average Intel Core i9-11980HK
  (10028 - 10494, n=2)
10261 Points -2%
HP ZBook Fury 17 G7 119W5EA
Intel Core i9-10885H, Quadro RTX 4000 Max-Q
10168 Points -3%
HP ZBook Fury 15 G8
Intel Core i9-11950H, RTX A5000 Laptop GPU
10001 Points -5%
AIDA64 / FPU Mandel
Average of class Workstation
  (6967 - 58181, n=29, last 2 years)
39314 Points +2%
MSI WE76 11UM-456
Intel Core i9-11980HK, RTX A5000 Laptop GPU
38635 Points
Average Intel Core i9-11980HK
  (35500 - 38635, n=2)
37068 Points -4%
HP ZBook Fury 15 G8
Intel Core i9-11950H, RTX A5000 Laptop GPU
36771 Points -5%
HP ZBook Fury 17 G7 119W5EA
Intel Core i9-10885H, Quadro RTX 4000 Max-Q
30011 Points -22%
AIDA64 / CPU AES
Average Intel Core i9-11980HK
  (90742 - 141352, n=2)
116047 MB/s +28%
MSI WE76 11UM-456
Intel Core i9-11980HK, RTX A5000 Laptop GPU
90742 MB/s
HP ZBook Fury 15 G8
Intel Core i9-11950H, RTX A5000 Laptop GPU
83095 MB/s -8%
Average of class Workstation
  (19489 - 132156, n=29, last 2 years)
73296 MB/s -19%
HP ZBook Fury 17 G7 119W5EA
Intel Core i9-10885H, Quadro RTX 4000 Max-Q
38869 MB/s -57%
AIDA64 / CPU ZLib
Average of class Workstation
  (314 - 1472, n=29, last 2 years)
943 MB/s +12%
MSI WE76 11UM-456
Intel Core i9-11980HK, RTX A5000 Laptop GPU
839 MB/s
HP ZBook Fury 15 G8
Intel Core i9-11950H, RTX A5000 Laptop GPU
756 MB/s -10%
HP ZBook Fury 17 G7 119W5EA
Intel Core i9-10885H, Quadro RTX 4000 Max-Q
706 MB/s -16%
Average Intel Core i9-11980HK
  (769 - 839, n=5)
322 (769min - 839max) MB/s -62%
Lenovo ThinkPad P17 G2-20YU0025G
Intel Core i7-11800H, RTX A2000 Laptop GPU
0 MB/s -100%
Asus ProArt StudioBook 16 W7600H5A-2BL2
Intel Xeon W-11955M, RTX A5000 Laptop GPU
0 MB/s -100%
Asus ProArt StudioBook 16 W7600H5A-2BL2
Intel Xeon W-11955M, RTX A5000 Laptop GPU
0 MB/s -100%
Lenovo ThinkPad P1 G4-20Y4S0KS00
Intel Core i7-11850H, GeForce RTX 3070 Laptop GPU
0 MB/s -100%
AIDA64 / FP64 Ray-Trace
MSI WE76 11UM-456
Intel Core i9-11980HK, RTX A5000 Laptop GPU
8566 KRay/s
Average of class Workstation
  (1473 - 13800, n=29, last 2 years)
8443 KRay/s -1%
Average Intel Core i9-11980HK
  (7662 - 8566, n=2)
8114 KRay/s -5%
HP ZBook Fury 15 G8
Intel Core i9-11950H, RTX A5000 Laptop GPU
8075 KRay/s -6%
HP ZBook Fury 17 G7 119W5EA
Intel Core i9-10885H, Quadro RTX 4000 Max-Q
6497 KRay/s -24%
AIDA64 / CPU PhotoWorxx
Average of class Workstation
  (18157 - 51647, n=29, last 2 years)
37143 MPixel/s +43%
HP ZBook Fury 15 G8
Intel Core i9-11950H, RTX A5000 Laptop GPU
26370 MPixel/s +2%
MSI WE76 11UM-456
Intel Core i9-11980HK, RTX A5000 Laptop GPU
25908 MPixel/s
Average Intel Core i9-11980HK
  (23047 - 25908, n=2)
24478 MPixel/s -6%
HP ZBook Fury 17 G7 119W5EA
Intel Core i9-10885H, Quadro RTX 4000 Max-Q
11531 MPixel/s -55%

Desempenho do sistema

Como esperado, o desempenho geral do sistema é extremamente elevado. Isto pode ser confirmado tanto pela impressão subjetiva do desempenho quanto pelos resultados de referência. Não haverá nenhum gargalo nos próximos anos aqui

PCMark 10 / Score
Lenovo ThinkPad P1 G4-20Y4S0KS00
GeForce RTX 3070 Laptop GPU, i7-11850H, Samsung PM9A1 MZVL21T0HCLR
7156 Points +2%
MSI WE76 11UM-456
RTX A5000 Laptop GPU, i9-11980HK, Samsung PM9A1 MZVL22T0HBLB
7023 Points
Average Intel Core i9-11980HK, NVIDIA RTX A5000 Laptop GPU
  ()
7023 Points 0%
Asus ProArt StudioBook 16 W7600H5A-2BL2
RTX A5000 Laptop GPU, W-11955M, 2x Micron 2300 2TB MTFDHBA2T0TDV (RAID 0)
6951 Points -1%
Average of class Workstation
  (5488 - 8587, n=28, last 2 years)
6940 Points -1%
HP ZBook Fury 15 G8
RTX A5000 Laptop GPU, i9-11950H, Samsung PM981a MZVLB1T0HBLR
6789 Points -3%
Lenovo ThinkPad P17 G2-20YU0025G
RTX A2000 Laptop GPU, i7-11800H, Kioxia XG7 KXG7AZNV512G
6430 Points -8%
MSI WE75 9TK
Quadro RTX 3000 (Laptop), i7-9750H, Samsung SSD PM981 MZVLB512HAJQ
5815 Points -17%
HP ZBook Fury 17 G7 119W5EA
Quadro RTX 4000 Max-Q, i9-10885H, WDC PC SN730 SDBPNTY-1T00
5363 Points -24%
PCMark 10 / Essentials
Lenovo ThinkPad P1 G4-20Y4S0KS00
GeForce RTX 3070 Laptop GPU, i7-11850H, Samsung PM9A1 MZVL21T0HCLR
10894 Points +14%
Average of class Workstation
  (9151 - 12197, n=28, last 2 years)
10579 Points +10%
Asus ProArt StudioBook 16 W7600H5A-2BL2
RTX A5000 Laptop GPU, W-11955M, 2x Micron 2300 2TB MTFDHBA2T0TDV (RAID 0)
10145 Points +6%
Lenovo ThinkPad P17 G2-20YU0025G
RTX A2000 Laptop GPU, i7-11800H, Kioxia XG7 KXG7AZNV512G
10126 Points +6%
HP ZBook Fury 15 G8
RTX A5000 Laptop GPU, i9-11950H, Samsung PM981a MZVLB1T0HBLR
10037 Points +5%
MSI WE75 9TK
Quadro RTX 3000 (Laptop), i7-9750H, Samsung SSD PM981 MZVLB512HAJQ
9694 Points +1%
MSI WE76 11UM-456
RTX A5000 Laptop GPU, i9-11980HK, Samsung PM9A1 MZVL22T0HBLB
9591 Points
Average Intel Core i9-11980HK, NVIDIA RTX A5000 Laptop GPU
  ()
9591 Points 0%
HP ZBook Fury 17 G7 119W5EA
Quadro RTX 4000 Max-Q, i9-10885H, WDC PC SN730 SDBPNTY-1T00
8059 Points -16%
PCMark 10 / Productivity
MSI WE76 11UM-456
RTX A5000 Laptop GPU, i9-11980HK, Samsung PM9A1 MZVL22T0HBLB
9604 Points
Average Intel Core i9-11980HK, NVIDIA RTX A5000 Laptop GPU
  ()
9604 Points 0%
Average of class Workstation
  (7846 - 10820, n=28, last 2 years)
9195 Points -4%
Asus ProArt StudioBook 16 W7600H5A-2BL2
RTX A5000 Laptop GPU, W-11955M, 2x Micron 2300 2TB MTFDHBA2T0TDV (RAID 0)
8971 Points -7%
Lenovo ThinkPad P1 G4-20Y4S0KS00
GeForce RTX 3070 Laptop GPU, i7-11850H, Samsung PM9A1 MZVL21T0HCLR
8913 Points -7%
HP ZBook Fury 15 G8
RTX A5000 Laptop GPU, i9-11950H, Samsung PM981a MZVLB1T0HBLR
8491 Points -12%
Lenovo ThinkPad P17 G2-20YU0025G
RTX A2000 Laptop GPU, i7-11800H, Kioxia XG7 KXG7AZNV512G
8369 Points -13%
MSI WE75 9TK
Quadro RTX 3000 (Laptop), i7-9750H, Samsung SSD PM981 MZVLB512HAJQ
7693 Points -20%
HP ZBook Fury 17 G7 119W5EA
Quadro RTX 4000 Max-Q, i9-10885H, WDC PC SN730 SDBPNTY-1T00
7110 Points -26%
PCMark 10 / Digital Content Creation
Lenovo ThinkPad P1 G4-20Y4S0KS00
GeForce RTX 3070 Laptop GPU, i7-11850H, Samsung PM9A1 MZVL21T0HCLR
10241 Points 0%
MSI WE76 11UM-456
RTX A5000 Laptop GPU, i9-11980HK, Samsung PM9A1 MZVL22T0HBLB
10203 Points
Average Intel Core i9-11980HK, NVIDIA RTX A5000 Laptop GPU
  ()
10203 Points 0%
Asus ProArt StudioBook 16 W7600H5A-2BL2
RTX A5000 Laptop GPU, W-11955M, 2x Micron 2300 2TB MTFDHBA2T0TDV (RAID 0)
10015 Points -2%
HP ZBook Fury 15 G8
RTX A5000 Laptop GPU, i9-11950H, Samsung PM981a MZVLB1T0HBLR
9967 Points -2%
Average of class Workstation
  (5399 - 13947, n=28, last 2 years)
9443 Points -7%
Lenovo ThinkPad P17 G2-20YU0025G
RTX A2000 Laptop GPU, i7-11800H, Kioxia XG7 KXG7AZNV512G
8511 Points -17%
HP ZBook Fury 17 G7 119W5EA
Quadro RTX 4000 Max-Q, i9-10885H, WDC PC SN730 SDBPNTY-1T00
7427 Points -27%
MSI WE75 9TK
Quadro RTX 3000 (Laptop), i7-9750H, Samsung SSD PM981 MZVLB512HAJQ
7156 Points -30%
PCMark 10 Score
7023 pontos
Ajuda
AIDA64 / Memory Copy
Average of class Workstation
  (30324 - 95718, n=29, last 2 years)
61037 MB/s +29%
MSI WE76 11UM-456
Intel Core i9-11980HK, RTX A5000 Laptop GPU
47204 MB/s
Average Intel Core i9-11980HK
  (42653 - 47204, n=2)
44929 MB/s -5%
AIDA64 / Memory Read
Average of class Workstation
  (30787 - 86584, n=29, last 2 years)
59791 MB/s +29%
Average Intel Core i9-11980HK
  (46298 - 47729, n=2)
47014 MB/s +2%
MSI WE76 11UM-456
Intel Core i9-11980HK, RTX A5000 Laptop GPU
46298 MB/s
AIDA64 / Memory Write
Average of class Workstation
  (32728 - 93871, n=29, last 2 years)
64490 MB/s +42%
MSI WE76 11UM-456
Intel Core i9-11980HK, RTX A5000 Laptop GPU
45563 MB/s
Average Intel Core i9-11980HK
  (45456 - 45563, n=2)
45510 MB/s 0%
AIDA64 / Memory Latency
Average of class Workstation
  (83.4 - 140.8, n=29, last 2 years)
100.3 ns * -10%
MSI WE76 11UM-456
Intel Core i9-11980HK, RTX A5000 Laptop GPU
91.1 ns *
Average Intel Core i9-11980HK
  (91.1 - 98.1, n=5)
37.8 (91.1min - 98.1max) ns * +59%

* ... smaller is better

Latências DPC

Nossa amostra de revisão do WE76 mostra latências ligeiramente elevadas em nossos testes com a versão atual da BIOS, e também houve algumas quedas de quadros (quadros pulados) ao reproduzir um vídeo do YouTube em 4K. Isto significa que o dispositivo não é ideal para aplicações de áudio em tempo real, mas atualizações futuras podem potencialmente melhorar a situação

LatencyMon - Visão geral
LatencyMon - Motoristas
DPC Latencies / LatencyMon - interrupt to process latency (max), Web, Youtube, Prime95
Lenovo ThinkPad P17 G2-20YU0025G
RTX A2000 Laptop GPU, i7-11800H, Kioxia XG7 KXG7AZNV512G
6610 μs * -414%
HP ZBook Fury 17 G7 119W5EA
Quadro RTX 4000 Max-Q, i9-10885H, WDC PC SN730 SDBPNTY-1T00
5161 μs * -301%
Asus ProArt StudioBook 16 W7600H5A-2BL2
RTX A5000 Laptop GPU, W-11955M, 2x Micron 2300 2TB MTFDHBA2T0TDV (RAID 0)
1493 μs * -16%
MSI WE76 11UM-456
RTX A5000 Laptop GPU, i9-11980HK, Samsung PM9A1 MZVL22T0HBLB
1287 μs *
Lenovo ThinkPad P1 G4-20Y4S0KS00
GeForce RTX 3070 Laptop GPU, i7-11850H, Samsung PM9A1 MZVL21T0HCLR
737 μs * +43%
HP ZBook Fury 15 G8
RTX A5000 Laptop GPU, i9-11950H, Samsung PM981a MZVLB1T0HBLR
578 μs * +55%

* ... smaller is better

Armazenamento

Nosso dispositivo de teste está equipado com um Samsung PM9A1 com capacidade de armazenamento de 2 TB, dos quais 1,78 TB ainda está disponível após o primeiro arranque. Este é um drive PCIe 4.0 muito rápido que também pode ser adequadamente aproveitado pelo WE76, uma vez que impressiona com taxas de transferência muito boas nos índices de referência. Além disso, o WE76 oferece outro slot M.2-2280 para uma maneira fácil de expandir o armazenamento, mas o segundo slot "somente" utiliza a interface PCIe 3.0 x4. Você pode encontrar padrões de referência SSD adicionais aqui

Samsung PM9A1 MZVL22T0HBLB
CDM 5/6 Read Seq Q32T1: 6335 MB/s
CDM 5/6 Write Seq Q32T1: 5096 MB/s
CDM 5/6 Read 4K Q32T1: 582 MB/s
CDM 5/6 Write 4K Q32T1: 425.5 MB/s
CDM 5/6 Read 4K: 83.4 MB/s
CDM 5/6 Write 4K: 213.6 MB/s
CDM 6 Write 4K Q8T8: 1960 MB/s
CDM 6 Read 4K Q8T8: 2401 MB/s
Drive Performance Rating - Percent
Lenovo ThinkPad P1 G4-20Y4S0KS00
Samsung PM9A1 MZVL21T0HCLR
96.2 pt
MSI WE76 11UM-456
Samsung PM9A1 MZVL22T0HBLB
92.6 pt
Average Samsung PM9A1 MZVL22T0HBLB
 
87 pt
Average of class Workstation
 
70.9 pt
Lenovo ThinkPad P17 G2-20YU0025G
Kioxia XG7 KXG7AZNV512G
54.3 pt
HP ZBook Fury 17 G7 119W5EA
WDC PC SN730 SDBPNTY-1T00
53.9 pt
Asus ProArt StudioBook 16 W7600H5A-2BL2
2x Micron 2300 2TB MTFDHBA2T0TDV (RAID 0)
52.6 pt
MSI WE75 9TK -8!
Samsung SSD PM981 MZVLB512HAJQ
43.3 pt
HP ZBook Fury 15 G8
Samsung PM981a MZVLB1T0HBLR
42.6 pt
DiskSpd
seq read
Lenovo ThinkPad P1 G4-20Y4S0KS00
Samsung PM9A1 MZVL21T0HCLR
4273 (4264.35min - 4273.21max) MB/s +4%
MSI WE76 11UM-456
Samsung PM9A1 MZVL22T0HBLB
4108 (4076.21min - 4108.28max) MB/s
Average Samsung PM9A1 MZVL22T0HBLB
  (2376 - 5676, n=29)
3919 MB/s -5%
Average of class Workstation
  (1844 - 5715, n=28, last 2 years)
3426 MB/s -17%
Asus ProArt StudioBook 16 W7600H5A-2BL2
2x Micron 2300 2TB MTFDHBA2T0TDV (RAID 0)
2419 (2064.08min - 2418.84max) MB/s -41%
Asus ProArt StudioBook 16 W7600H5A-2BL2
2x Micron 2300 2TB MTFDHBA2T0TDV (RAID 0)
2388 (2192.8min - 2388.07max) MB/s -42%
Lenovo ThinkPad P17 G2-20YU0025G
Kioxia XG7 KXG7AZNV512G
2245 (2233.05min - 2244.71max) MB/s -45%
HP ZBook Fury 15 G8
Samsung PM981a MZVLB1T0HBLR
2213 (2206.83min - 2213.36max) MB/s -46%
HP ZBook Fury 17 G7 119W5EA
WDC PC SN730 SDBPNTY-1T00
2053 (1931.06min - 2052.78max) MB/s -50%
seq write
Lenovo ThinkPad P1 G4-20Y4S0KS00
Samsung PM9A1 MZVL21T0HCLR
4295 (4283.22min - 4294.77max) MB/s +1%
MSI WE76 11UM-456
Samsung PM9A1 MZVL22T0HBLB
4236 (4228min - 4235.95max) MB/s
Average Samsung PM9A1 MZVL22T0HBLB
  (2461 - 7628, n=29)
4204 MB/s -1%
Average of class Workstation
  (1309 - 7289, n=28, last 2 years)
3771 MB/s -11%
Asus ProArt StudioBook 16 W7600H5A-2BL2
2x Micron 2300 2TB MTFDHBA2T0TDV (RAID 0)
2755 (2420.1min - 2754.55max) MB/s -35%
Asus ProArt StudioBook 16 W7600H5A-2BL2
2x Micron 2300 2TB MTFDHBA2T0TDV (RAID 0)
2720 (2204.11min - 2719.6max) MB/s -36%
Lenovo ThinkPad P17 G2-20YU0025G
Kioxia XG7 KXG7AZNV512G
2700 (1328.55min - 2699.72max) MB/s -36%
HP ZBook Fury 17 G7 119W5EA
WDC PC SN730 SDBPNTY-1T00
2423 (2406.49min - 2422.82max) MB/s -43%
HP ZBook Fury 15 G8
Samsung PM981a MZVLB1T0HBLR
1889 (1868.98min - 1888.7max) MB/s -55%
seq q8 t1 read
Average Samsung PM9A1 MZVL22T0HBLB
  (3471 - 12556, n=29)
7139 MB/s +27%
Lenovo ThinkPad P1 G4-20Y4S0KS00
Samsung PM9A1 MZVL21T0HCLR
6680 (5888.14min - 6680.33max) MB/s +19%
Average of class Workstation
  (3361 - 12631, n=28, last 2 years)
6519 MB/s +16%
Asus ProArt StudioBook 16 W7600H5A-2BL2
2x Micron 2300 2TB MTFDHBA2T0TDV (RAID 0)
6274 (5892.58min - 6274.29max) MB/s +12%
Asus ProArt StudioBook 16 W7600H5A-2BL2
2x Micron 2300 2TB MTFDHBA2T0TDV (RAID 0)
6053 (5002.76min - 6052.8max) MB/s +8%
MSI WE76 11UM-456
Samsung PM9A1 MZVL22T0HBLB
5604 (4075.63min - 5603.92max) MB/s
HP ZBook Fury 15 G8
Samsung PM981a MZVLB1T0HBLR
3408 (3377.67min - 3408.19max) MB/s -39%
HP ZBook Fury 17 G7 119W5EA
WDC PC SN730 SDBPNTY-1T00
3396 (3173.36min - 3395.84max) MB/s -39%
Lenovo ThinkPad P17 G2-20YU0025G
Kioxia XG7 KXG7AZNV512G
3223 (3041.71min - 3222.9max) MB/s -42%
seq q8 t1 write
Average Samsung PM9A1 MZVL22T0HBLB
  (3537 - 10261, n=29)
5515 MB/s +12%
Average of class Workstation
  (2526 - 9890, n=28, last 2 years)
5502 MB/s +12%
Asus ProArt StudioBook 16 W7600H5A-2BL2
2x Micron 2300 2TB MTFDHBA2T0TDV (RAID 0)
5154 (5111.23min - 5153.51max) MB/s +5%
Asus ProArt StudioBook 16 W7600H5A-2BL2
2x Micron 2300 2TB MTFDHBA2T0TDV (RAID 0)
5146 (4733.66min - 5145.56max) MB/s +4%
Lenovo ThinkPad P1 G4-20Y4S0KS00
Samsung PM9A1 MZVL21T0HCLR
4955 (4937.34min - 4954.89max) MB/s +1%
MSI WE76 11UM-456
Samsung PM9A1 MZVL22T0HBLB
4928 (4907.59min - 4927.89max) MB/s
Lenovo ThinkPad P17 G2-20YU0025G
Kioxia XG7 KXG7AZNV512G
3643 (1995.86min - 3643.44max) MB/s -26%
HP ZBook Fury 15 G8
Samsung PM981a MZVLB1T0HBLR
2769 (2761.53min - 2769.29max) MB/s -44%
HP ZBook Fury 17 G7 119W5EA
WDC PC SN730 SDBPNTY-1T00
2683 (2659.19min - 2682.76max) MB/s -46%
4k q1 t1 read
Lenovo ThinkPad P1 G4-20Y4S0KS00
Samsung PM9A1 MZVL21T0HCLR
90.6 (90.4min - 90.59max) MB/s +5%
MSI WE76 11UM-456
Samsung PM9A1 MZVL22T0HBLB
86.4 (85.47min - 86.36max) MB/s
Average Samsung PM9A1 MZVL22T0HBLB
  (56.2 - 91.2, n=29)
78.5 MB/s -9%
Average of class Workstation
  (45.4 - 92.2, n=28, last 2 years)
64.3 MB/s -26%
Asus ProArt StudioBook 16 W7600H5A-2BL2
2x Micron 2300 2TB MTFDHBA2T0TDV (RAID 0)
50.9 (43.69min - 50.91max) MB/s -41%
Asus ProArt StudioBook 16 W7600H5A-2BL2
2x Micron 2300 2TB MTFDHBA2T0TDV (RAID 0)
44.1 (38.83min - 44.09max) MB/s -49%
Lenovo ThinkPad P17 G2-20YU0025G
Kioxia XG7 KXG7AZNV512G
46.7 (46.55min - 46.68max) MB/s -46%
HP ZBook Fury 17 G7 119W5EA
WDC PC SN730 SDBPNTY-1T00
45.6 (45.39min - 45.62max) MB/s -47%
HP ZBook Fury 15 G8
Samsung PM981a MZVLB1T0HBLR
39 (38.93min - 39.04max) MB/s -55%
4k q1 t1 write
Lenovo ThinkPad P1 G4-20Y4S0KS00
Samsung PM9A1 MZVL21T0HCLR
237 (235.61min - 236.6max) MB/s +7%
MSI WE76 11UM-456
Samsung PM9A1 MZVL22T0HBLB
222 (221.05min - 221.86max) MB/s
Average Samsung PM9A1 MZVL22T0HBLB
  (134 - 295, n=29)
219 MB/s -1%
Average of class Workstation
  (106.8 - 251, n=28, last 2 years)
152.1 MB/s -31%
Lenovo ThinkPad P17 G2-20YU0025G
Kioxia XG7 KXG7AZNV512G
142 (141.3min - 142.06max) MB/s -36%
HP ZBook Fury 17 G7 119W5EA
WDC PC SN730 SDBPNTY-1T00
125 (124.7min - 125.4max) MB/s -44%
Asus ProArt StudioBook 16 W7600H5A-2BL2
2x Micron 2300 2TB MTFDHBA2T0TDV (RAID 0)
106 (104.21min - 105.58max) MB/s -52%
Asus ProArt StudioBook 16 W7600H5A-2BL2
2x Micron 2300 2TB MTFDHBA2T0TDV (RAID 0)
102 (100.51min - 101.6max) MB/s -54%
HP ZBook Fury 15 G8
Samsung PM981a MZVLB1T0HBLR
96.6 (95.43min - 96.57max) MB/s -56%
4k q32 t16 read
Lenovo ThinkPad P1 G4-20Y4S0KS00
Samsung PM9A1 MZVL21T0HCLR
4185 (2647.96min - 4185.28max) MB/s +6%
MSI WE76 11UM-456
Samsung PM9A1 MZVL22T0HBLB
3953 (3766.95min - 3953.14max) MB/s
Average Samsung PM9A1 MZVL22T0HBLB
  (663 - 4075, n=29)
2978 MB/s -25%
HP ZBook Fury 17 G7 119W5EA
WDC PC SN730 SDBPNTY-1T00
2266 (2247.66min - 2265.92max) MB/s -43%
Lenovo ThinkPad P17 G2-20YU0025G
Kioxia XG7 KXG7AZNV512G
2256 (2243.27min - 2255.8max) MB/s -43%
Average of class Workstation
  (561 - 3965, n=28, last 2 years)
1308 MB/s -67%
HP ZBook Fury 15 G8
Samsung PM981a MZVLB1T0HBLR
792 (785.81min - 791.55max) MB/s -80%
Asus ProArt StudioBook 16 W7600H5A-2BL2
2x Micron 2300 2TB MTFDHBA2T0TDV (RAID 0)
783 (693.78min - 782.9max) MB/s -80%
Asus ProArt StudioBook 16 W7600H5A-2BL2
2x Micron 2300 2TB MTFDHBA2T0TDV (RAID 0)
769 (682.08min - 768.78max) MB/s -81%
4k q32 t16 write
Lenovo ThinkPad P1 G4-20Y4S0KS00
Samsung PM9A1 MZVL21T0HCLR
3512 (1778.55min - 3512.14max) MB/s +14%
MSI WE76 11UM-456
Samsung PM9A1 MZVL22T0HBLB
3069 (2955.28min - 3069.23max) MB/s
Average Samsung PM9A1 MZVL22T0HBLB
  (422 - 3548, n=29)
2271 MB/s -26%
HP ZBook Fury 17 G7 119W5EA
WDC PC SN730 SDBPNTY-1T00
2145 (1812.02min - 2145.19max) MB/s -30%
Lenovo ThinkPad P17 G2-20YU0025G
Kioxia XG7 KXG7AZNV512G
1438 (1199.27min - 1438.1max) MB/s -53%
Average of class Workstation
  (360 - 3306, n=28, last 2 years)
906 MB/s -70%
Asus ProArt StudioBook 16 W7600H5A-2BL2
2x Micron 2300 2TB MTFDHBA2T0TDV (RAID 0)
443 (434.35min - 442.99max) MB/s -86%
Asus ProArt StudioBook 16 W7600H5A-2BL2
2x Micron 2300 2TB MTFDHBA2T0TDV (RAID 0)
434 (421.48min - 433.64max) MB/s -86%
HP ZBook Fury 15 G8
Samsung PM981a MZVLB1T0HBLR
354 (344.74min - 354.13max) MB/s -88%
AS SSD
Score Total
Lenovo ThinkPad P1 G4-20Y4S0KS00
Samsung PM9A1 MZVL21T0HCLR
8821 Points +4%
MSI WE76 11UM-456
Samsung PM9A1 MZVL22T0HBLB
8461 Points
Average Samsung PM9A1 MZVL22T0HBLB
  (4850 - 9031, n=28)
7378 Points -13%
Lenovo ThinkPad P17 G2-20YU0025G
Kioxia XG7 KXG7AZNV512G
5700 Points -33%
Average of class Workstation
  (2512 - 8992, n=27, last 2 years)
5495 Points -35%
HP ZBook Fury 17 G7 119W5EA
WDC PC SN730 SDBPNTY-1T00
5047 Points -40%
MSI WE75 9TK
Samsung SSD PM981 MZVLB512HAJQ
4594 Points -46%
Asus ProArt StudioBook 16 W7600H5A-2BL2
2x Micron 2300 2TB MTFDHBA2T0TDV (RAID 0)
4256 Points -50%
HP ZBook Fury 15 G8
Samsung PM981a MZVLB1T0HBLR
4046 Points -52%
Score Read
Lenovo ThinkPad P1 G4-20Y4S0KS00
Samsung PM9A1 MZVL21T0HCLR
3287 Points +6%
MSI WE76 11UM-456
Samsung PM9A1 MZVL22T0HBLB
3107 Points
Average Samsung PM9A1 MZVL22T0HBLB
  (1535 - 3399, n=28)
2746 Points -12%
Average of class Workstation
  (983 - 26650, n=27, last 2 years)
2640 Points -15%
Lenovo ThinkPad P17 G2-20YU0025G
Kioxia XG7 KXG7AZNV512G
2605 Points -16%
HP ZBook Fury 17 G7 119W5EA
WDC PC SN730 SDBPNTY-1T00
1915 Points -38%
Asus ProArt StudioBook 16 W7600H5A-2BL2
2x Micron 2300 2TB MTFDHBA2T0TDV (RAID 0)
1765 Points -43%
MSI WE75 9TK
Samsung SSD PM981 MZVLB512HAJQ
1689 Points -46%
HP ZBook Fury 15 G8
Samsung PM981a MZVLB1T0HBLR
1211 Points -61%
Score Write
Lenovo ThinkPad P1 G4-20Y4S0KS00
Samsung PM9A1 MZVL21T0HCLR
3876 Points +1%
MSI WE76 11UM-456
Samsung PM9A1 MZVL22T0HBLB
3839 Points
Average Samsung PM9A1 MZVL22T0HBLB
  (1081 - 3999, n=28)
3296 Points -14%
Average of class Workstation
  (742 - 4410, n=27, last 2 years)
2935 Points -24%
HP ZBook Fury 15 G8
Samsung PM981a MZVLB1T0HBLR
2271 Points -41%
HP ZBook Fury 17 G7 119W5EA
WDC PC SN730 SDBPNTY-1T00
2215 Points -42%
MSI WE75 9TK
Samsung SSD PM981 MZVLB512HAJQ
2008 Points -48%
Lenovo ThinkPad P17 G2-20YU0025G
Kioxia XG7 KXG7AZNV512G
1918 Points -50%
Asus ProArt StudioBook 16 W7600H5A-2BL2
2x Micron 2300 2TB MTFDHBA2T0TDV (RAID 0)
1722 Points -55%
Seq Read
Average Samsung PM9A1 MZVL22T0HBLB
  (2591 - 9971, n=28)
5538 MB/s +2%
MSI WE76 11UM-456
Samsung PM9A1 MZVL22T0HBLB
5414 MB/s
Average of class Workstation
  (2873 - 7437, n=27, last 2 years)
5183 MB/s -4%
Lenovo ThinkPad P1 G4-20Y4S0KS00
Samsung PM9A1 MZVL21T0HCLR
4526 MB/s -16%
Asus ProArt StudioBook 16 W7600H5A-2BL2
2x Micron 2300 2TB MTFDHBA2T0TDV (RAID 0)
4317 MB/s -20%
Lenovo ThinkPad P17 G2-20YU0025G
Kioxia XG7 KXG7AZNV512G
3997 MB/s -26%
HP ZBook Fury 15 G8
Samsung PM981a MZVLB1T0HBLR
2937 MB/s -46%
HP ZBook Fury 17 G7 119W5EA
WDC PC SN730 SDBPNTY-1T00
2423 MB/s -55%
MSI WE75 9TK
Samsung SSD PM981 MZVLB512HAJQ
1308 MB/s -76%
Seq Write
Average Samsung PM9A1 MZVL22T0HBLB
  (1900 - 8590, n=28)
4074 MB/s +5%
Lenovo ThinkPad P1 G4-20Y4S0KS00
Samsung PM9A1 MZVL21T0HCLR
3988 MB/s +3%
MSI WE76 11UM-456
Samsung PM9A1 MZVL22T0HBLB
3865 MB/s
Average of class Workstation
  (1785 - 6302, n=27, last 2 years)
3232 MB/s -16%
Asus ProArt StudioBook 16 W7600H5A-2BL2
2x Micron 2300 2TB MTFDHBA2T0TDV (RAID 0)
2037 MB/s -47%
MSI WE75 9TK
Samsung SSD PM981 MZVLB512HAJQ
1871 MB/s -52%
HP ZBook Fury 15 G8
Samsung PM981a MZVLB1T0HBLR
1688 MB/s -56%
HP ZBook Fury 17 G7 119W5EA
WDC PC SN730 SDBPNTY-1T00
1203 MB/s -69%
Lenovo ThinkPad P17 G2-20YU0025G
Kioxia XG7 KXG7AZNV512G
1049 MB/s -73%
4K Read
Lenovo ThinkPad P1 G4-20Y4S0KS00
Samsung PM9A1 MZVL21T0HCLR
82.9 MB/s +5%
MSI WE76 11UM-456
Samsung PM9A1 MZVL22T0HBLB
79.2 MB/s
Average Samsung PM9A1 MZVL22T0HBLB
  (49.8 - 86.4, n=28)
73.2 MB/s -8%
Average of class Workstation
  (46.6 - 84, n=27, last 2 years)
62.8 MB/s -21%
Asus ProArt StudioBook 16 W7600H5A-2BL2
2x Micron 2300 2TB MTFDHBA2T0TDV (RAID 0)
48.97 MB/s -38%
MSI WE75 9TK
Samsung SSD PM981 MZVLB512HAJQ
48.35 MB/s -39%
Lenovo ThinkPad P17 G2-20YU0025G
Kioxia XG7 KXG7AZNV512G
44.96 MB/s -43%
HP ZBook Fury 15 G8
Samsung PM981a MZVLB1T0HBLR
44.27 MB/s -44%
HP ZBook Fury 17 G7 119W5EA
WDC PC SN730 SDBPNTY-1T00
42.24 MB/s -47%
4K Write
Lenovo ThinkPad P1 G4-20Y4S0KS00
Samsung PM9A1 MZVL21T0HCLR
207.5 MB/s +5%
Average Samsung PM9A1 MZVL22T0HBLB
  (112.6 - 254, n=28)
202 MB/s +2%
MSI WE76 11UM-456
Samsung PM9A1 MZVL22T0HBLB
198.2 MB/s
Average of class Workstation
  (97.9 - 237, n=27, last 2 years)
169.3 MB/s -15%
HP ZBook Fury 17 G7 119W5EA
WDC PC SN730 SDBPNTY-1T00
115.5 MB/s -42%
Lenovo ThinkPad P17 G2-20YU0025G
Kioxia XG7 KXG7AZNV512G
115.3 MB/s -42%
Asus ProArt StudioBook 16 W7600H5A-2BL2
2x Micron 2300 2TB MTFDHBA2T0TDV (RAID 0)
112.4 MB/s -43%
MSI WE75 9TK
Samsung SSD PM981 MZVLB512HAJQ
106.6 MB/s -46%
HP ZBook Fury 15 G8
Samsung PM981a MZVLB1T0HBLR
105.8 MB/s -47%
4K-64 Read
Lenovo ThinkPad P1 G4-20Y4S0KS00
Samsung PM9A1 MZVL21T0HCLR
2751 MB/s +11%
MSI WE76 11UM-456
Samsung PM9A1 MZVL22T0HBLB
2486 MB/s
Lenovo ThinkPad P17 G2-20YU0025G
Kioxia XG7 KXG7AZNV512G
2160 MB/s -13%
Average Samsung PM9A1 MZVL22T0HBLB
  (918 - 2811, n=28)
2119 MB/s -15%
HP ZBook Fury 17 G7 119W5EA
WDC PC SN730 SDBPNTY-1T00
1630 MB/s -34%
MSI WE75 9TK
Samsung SSD PM981 MZVLB512HAJQ
1510 MB/s -39%
Asus ProArt StudioBook 16 W7600H5A-2BL2
2x Micron 2300 2TB MTFDHBA2T0TDV (RAID 0)
1253 MB/s -50%
Average of class Workstation
  (421 - 2790, n=27, last 2 years)
1170 MB/s -53%
HP ZBook Fury 15 G8
Samsung PM981a MZVLB1T0HBLR
873 MB/s -65%
4K-64 Write
Lenovo ThinkPad P1 G4-20Y4S0KS00
Samsung PM9A1 MZVL21T0HCLR
3270 MB/s 0%
MSI WE76 11UM-456
Samsung PM9A1 MZVL22T0HBLB
3254 MB/s
Average Samsung PM9A1 MZVL22T0HBLB
  (567 - 3414, n=28)
2687 MB/s -17%
Average of class Workstation
  (431 - 3818, n=27, last 2 years)
2442 MB/s -25%
HP ZBook Fury 15 G8
Samsung PM981a MZVLB1T0HBLR
1996 MB/s -39%
HP ZBook Fury 17 G7 119W5EA
WDC PC SN730 SDBPNTY-1T00
1979 MB/s -39%
MSI WE75 9TK
Samsung SSD PM981 MZVLB512HAJQ
1715 MB/s -47%
Lenovo ThinkPad P17 G2-20YU0025G
Kioxia XG7 KXG7AZNV512G
1697 MB/s -48%
Asus ProArt StudioBook 16 W7600H5A-2BL2
2x Micron 2300 2TB MTFDHBA2T0TDV (RAID 0)
1473 MB/s -55%
Access Time Read
Lenovo ThinkPad P17 G2-20YU0025G
Kioxia XG7 KXG7AZNV512G
0.156 ms * -457%
MSI WE75 9TK
Samsung SSD PM981 MZVLB512HAJQ
0.103 ms * -268%
HP ZBook Fury 17 G7 119W5EA
WDC PC SN730 SDBPNTY-1T00
0.057 ms * -104%
HP ZBook Fury 15 G8
Samsung PM981a MZVLB1T0HBLR
0.048 ms * -71%
Asus ProArt StudioBook 16 W7600H5A-2BL2
2x Micron 2300 2TB MTFDHBA2T0TDV (RAID 0)
0.045 ms * -61%
Average of class Workstation
  (0.017 - 0.092, n=27, last 2 years)
0.04441 ms * -59%
Average Samsung PM9A1 MZVL22T0HBLB
  (0.018 - 0.078, n=28)
0.03364 ms * -20%
MSI WE76 11UM-456
Samsung PM9A1 MZVL22T0HBLB
0.028 ms *
Lenovo ThinkPad P1 G4-20Y4S0KS00
Samsung PM9A1 MZVL21T0HCLR
0.024 ms * +14%
Access Time Write
HP ZBook Fury 15 G8
Samsung PM981a MZVLB1T0HBLR
0.107 ms * -410%
MSI WE75 9TK
Samsung SSD PM981 MZVLB512HAJQ
0.106 ms * -405%
Asus ProArt StudioBook 16 W7600H5A-2BL2
2x Micron 2300 2TB MTFDHBA2T0TDV (RAID 0)
0.083 ms * -295%
Average of class Workstation
  (0.017 - 0.092, n=27, last 2 years)
0.04456 ms * -112%
Lenovo ThinkPad P17 G2-20YU0025G
Kioxia XG7 KXG7AZNV512G
0.036 ms * -71%
HP ZBook Fury 17 G7 119W5EA
WDC PC SN730 SDBPNTY-1T00
0.033 ms * -57%
Average Samsung PM9A1 MZVL22T0HBLB
  (0.017 - 0.076, n=28)
0.02943 ms * -40%
Lenovo ThinkPad P1 G4-20Y4S0KS00
Samsung PM9A1 MZVL21T0HCLR
0.021 ms * -0%
MSI WE76 11UM-456
Samsung PM9A1 MZVL22T0HBLB
0.021 ms *

* ... smaller is better

Continuous load read: DiskSpd Read Loop, Queue Depth 8

02805608401120140016801960224025202800308033603640392042004480476050405320Tooltip
MSI WE76 11UM-456: Ø5515 (5160.72-5536.73)

Placa gráfica

GPU-Z Nvidia RTX A5000

Com oNvidia RTX A5000 (Nvidia deixou de usar o "Quadro" dos nomes enquanto isso), a MSI instalou a GPU móvel profissional mais poderosa atualmente disponível no mercado. Com 16 GB de RAM e os drivers profissionais incluindo as certificações para software profissional, a WE76 é especialmente adequada para aplicações CAD/CAM complexas ou grandes projetos gráficos que incluem traçado de raio. Com um TDP máximo de 155 watts (embora tenhamos visto picos de até 180 watts às vezes), o GPU é claramente um dos modelos mais rápidos do mercado. A solução de comutação gráfica Optimus da Nvidia é suportada, o que significa que o iGPU do processador é usado para tarefas simples.

Podemos ver isso também nos benchmarks, onde o WE76 consegue se colocar à frente da concorrência. O RTX A5000 no HP ZBook Fury 15 Gpor exemplo, é 10%-30% mais lento, dependendo do benchmark. O modo opcional Alta Performance não afeta diretamente a performance da GPU, e a performance é estável em ambos os modos. Entretanto, o consumo de energia é limitado a 55 watts na potência da bateria, o que leva a uma perda de performance de cerca de 50%. Por favor, consulte nosso Artigo de referência da GPUpara mais comparações.

3DMark Performance Rating - Percent
Asus ProArt StudioBook 16 W7600H5A-2BL2 -10!
NVIDIA RTX A5000 Laptop GPU, Intel Xeon W-11955M
94.8 pt
MSI WE76 11UM-456
NVIDIA RTX A5000 Laptop GPU, Intel Core i9-11980HK
94.4 pt
Average NVIDIA RTX A5000 Laptop GPU
 
90.3 pt
HP ZBook Fury 15 G8
NVIDIA RTX A5000 Laptop GPU, Intel Core i9-11950H
82.7 pt
Average of class Workstation
 
76.7 pt
MSI WE75 9TK -16!
NVIDIA Quadro RTX 3000 (Laptop), Intel Core i7-9750H
63.9 pt
Lenovo ThinkPad P17 G2-20YU0025G -8!
NVIDIA RTX A2000 Laptop GPU, Intel Core i7-11800H
59.8 pt
HP ZBook Fury 17 G7 119W5EA
NVIDIA Quadro RTX 4000 Max-Q, Intel Core i9-10885H
58.4 pt
Lenovo ThinkPad P1 G4-20Y4S0KS00
NVIDIA GeForce RTX 3070 Laptop GPU, Intel Core i7-11850H
57.7 pt
3DMark 11 - 1280x720 Performance GPU
MSI WE76 11UM-456
NVIDIA RTX A5000 Laptop GPU, Intel Core i9-11980HK
41904 Points
Average NVIDIA RTX A5000 Laptop GPU
  (30423 - 41904, n=2)
36164 Points -14%
HP ZBook Fury 15 G8
NVIDIA RTX A5000 Laptop GPU, Intel Core i9-11950H
30423 Points -27%
Lenovo ThinkPad P1 G4-20Y4S0KS00
NVIDIA GeForce RTX 3070 Laptop GPU, Intel Core i7-11850H
30237 Points -28%
Average of class Workstation
  (7432 - 54334, n=29, last 2 years)
24566 Points -41%
HP ZBook Fury 17 G7 119W5EA
NVIDIA Quadro RTX 4000 Max-Q, Intel Core i9-10885H
23684 Points -43%
MSI WE75 9TK
NVIDIA Quadro RTX 3000 (Laptop), Intel Core i7-9750H
20542 Points -51%
Lenovo ThinkPad P17 G2-20YU0025G
NVIDIA RTX A2000 Laptop GPU, Intel Core i7-11800H
19437 Points -54%
3DMark
1920x1080 Fire Strike Graphics
MSI WE76 11UM-456
NVIDIA RTX A5000 Laptop GPU, Intel Core i9-11980HK
29610 Points
Asus ProArt StudioBook 16 W7600H5A-2BL2
NVIDIA RTX A5000 Laptop GPU, Intel Xeon W-11955M
27271 Points -8%
Average NVIDIA RTX A5000 Laptop GPU
  (23579 - 29610, n=3)
26820 Points -9%
HP ZBook Fury 15 G8
NVIDIA RTX A5000 Laptop GPU, Intel Core i9-11950H
23579 Points -20%
Lenovo ThinkPad P1 G4-20Y4S0KS00
NVIDIA GeForce RTX 3070 Laptop GPU, Intel Core i7-11850H
22472 Points -24%
Average of class Workstation
  (4816 - 35868, n=29, last 2 years)
17159 Points -42%
HP ZBook Fury 17 G7 119W5EA
NVIDIA Quadro RTX 4000 Max-Q, Intel Core i9-10885H
17049 Points -42%
MSI WE75 9TK
NVIDIA Quadro RTX 3000 (Laptop), Intel Core i7-9750H
15881 Points -46%
Lenovo ThinkPad P17 G2-20YU0025G
NVIDIA RTX A2000 Laptop GPU, Intel Core i7-11800H
14627 Points -51%
2560x1440 Time Spy Graphics
MSI WE76 11UM-456
NVIDIA RTX A5000 Laptop GPU, Intel Core i9-11980HK
11580 Points
Asus ProArt StudioBook 16 W7600H5A-2BL2
NVIDIA RTX A5000 Laptop GPU, Intel Xeon W-11955M
10307 Points -11%
Average NVIDIA RTX A5000 Laptop GPU
  (8242 - 11580, n=3)
10043 Points -13%
Lenovo ThinkPad P1 G4-20Y4S0KS00
NVIDIA GeForce RTX 3070 Laptop GPU, Intel Core i7-11850H
8391 Points -28%
HP ZBook Fury 15 G8
NVIDIA RTX A5000 Laptop GPU, Intel Core i9-11950H
8242 Points -29%
Average of class Workstation
  (1882 - 16218, n=29, last 2 years)
6831 Points -41%
HP ZBook Fury 17 G7 119W5EA
NVIDIA Quadro RTX 4000 Max-Q, Intel Core i9-10885H
6764 Points -42%
MSI WE75 9TK
NVIDIA Quadro RTX 3000 (Laptop), Intel Core i7-9750H
6014 Points -48%
Lenovo ThinkPad P17 G2-20YU0025G
NVIDIA RTX A2000 Laptop GPU, Intel Core i7-11800H
5590 Points -52%
SPECviewperf 13
Solidworks (sw-04)
MSI WE76 11UM-456
NVIDIA RTX A5000 Laptop GPU, Intel Core i9-11980HK
157.7 fps
Average of class Workstation
  (91.8 - 227, n=28, last 2 years)
154 fps -2%
Average NVIDIA RTX A5000 Laptop GPU
  (144.9 - 157.7, n=2)
151.3 fps -4%
HP ZBook Fury 15 G8
NVIDIA RTX A5000 Laptop GPU, Intel Core i9-11950H
144.9 fps -8%
Lenovo ThinkPad P17 G2-20YU0025G
NVIDIA RTX A2000 Laptop GPU, Intel Core i7-11800H
139 fps -12%
MSI WE75 9TK
NVIDIA Quadro RTX 3000 (Laptop), Intel Core i7-9750H
122.1 fps -23%
HP ZBook Fury 17 G7 119W5EA
NVIDIA Quadro RTX 4000 Max-Q, Intel Core i9-10885H
112.1 fps -29%
Lenovo ThinkPad P1 G4-20Y4S0KS00
NVIDIA GeForce RTX 3070 Laptop GPU, Intel Core i7-11850H
91.6 fps -42%
Siemens NX (snx-03)
MSI WE76 11UM-456
NVIDIA RTX A5000 Laptop GPU, Intel Core i9-11980HK
319.2 fps
Average NVIDIA RTX A5000 Laptop GPU
  (276 - 319, n=2)
298 fps -7%
HP ZBook Fury 15 G8
NVIDIA RTX A5000 Laptop GPU, Intel Core i9-11950H
276 fps -14%
Average of class Workstation
  (48.9 - 551, n=28, last 2 years)
255 fps -20%
MSI WE75 9TK
NVIDIA Quadro RTX 3000 (Laptop), Intel Core i7-9750H
225.4 fps -29%
HP ZBook Fury 17 G7 119W5EA
NVIDIA Quadro RTX 4000 Max-Q, Intel Core i9-10885H
225.4 fps -29%
Lenovo ThinkPad P17 G2-20YU0025G
NVIDIA RTX A2000 Laptop GPU, Intel Core i7-11800H
185.5 fps -42%
Lenovo ThinkPad P1 G4-20Y4S0KS00
NVIDIA GeForce RTX 3070 Laptop GPU, Intel Core i7-11850H
17.36 fps -95%
Showcase (showcase-02)
MSI WE76 11UM-456
NVIDIA RTX A5000 Laptop GPU, Intel Core i9-11980HK
131.9 fps
Average NVIDIA RTX A5000 Laptop GPU
  (103.8 - 131.9, n=2)
117.9 fps -11%
Lenovo ThinkPad P1 G4-20Y4S0KS00
NVIDIA GeForce RTX 3070 Laptop GPU, Intel Core i7-11850H
114 fps -14%
HP ZBook Fury 15 G8
NVIDIA RTX A5000 Laptop GPU, Intel Core i9-11950H
103.8 fps -21%
HP ZBook Fury 17 G7 119W5EA
NVIDIA Quadro RTX 4000 Max-Q, Intel Core i9-10885H
89.3 fps -32%
Average of class Workstation
  (24.8 - 190.3, n=28, last 2 years)
84.9 fps -36%
MSI WE75 9TK
NVIDIA Quadro RTX 3000 (Laptop), Intel Core i7-9750H
80.9 fps -39%
Lenovo ThinkPad P17 G2-20YU0025G
NVIDIA RTX A2000 Laptop GPU, Intel Core i7-11800H
69.5 fps -47%
Medical (medical-02)
MSI WE76 11UM-456
NVIDIA RTX A5000 Laptop GPU, Intel Core i9-11980HK
119.1 fps
Average NVIDIA RTX A5000 Laptop GPU
  (109.4 - 119.1, n=2)
114.3 fps -4%
HP ZBook Fury 15 G8
NVIDIA RTX A5000 Laptop GPU, Intel Core i9-11950H
109.4 fps -8%
Average of class Workstation
  (34.5 - 250, n=28, last 2 years)
99.5 fps -16%
HP ZBook Fury 17 G7 119W5EA
NVIDIA Quadro RTX 4000 Max-Q, Intel Core i9-10885H
81.9 fps -31%
Lenovo ThinkPad P17 G2-20YU0025G
NVIDIA RTX A2000 Laptop GPU, Intel Core i7-11800H
72.9 fps -39%
MSI WE75 9TK
NVIDIA Quadro RTX 3000 (Laptop), Intel Core i7-9750H
65.6 fps -45%
Lenovo ThinkPad P1 G4-20Y4S0KS00
NVIDIA GeForce RTX 3070 Laptop GPU, Intel Core i7-11850H
60.7 fps -49%
Maya (maya-05)
MSI WE76 11UM-456
NVIDIA RTX A5000 Laptop GPU, Intel Core i9-11980HK
250.4 fps
Average NVIDIA RTX A5000 Laptop GPU
  (220 - 250, n=2)
235 fps -6%
Lenovo ThinkPad P1 G4-20Y4S0KS00
NVIDIA GeForce RTX 3070 Laptop GPU, Intel Core i7-11850H
231.5 fps -8%
Average of class Workstation
  (77.5 - 449, n=28, last 2 years)
227 fps -9%
HP ZBook Fury 15 G8
NVIDIA RTX A5000 Laptop GPU, Intel Core i9-11950H
219.7 fps -12%
MSI WE75 9TK
NVIDIA Quadro RTX 3000 (Laptop), Intel Core i7-9750H
194.7 fps -22%
Lenovo ThinkPad P17 G2-20YU0025G
NVIDIA RTX A2000 Laptop GPU, Intel Core i7-11800H
172 fps -31%
HP ZBook Fury 17 G7 119W5EA
NVIDIA Quadro RTX 4000 Max-Q, Intel Core i9-10885H
162 fps -35%
Energy (energy-02)
MSI WE76 11UM-456
NVIDIA RTX A5000 Laptop GPU, Intel Core i9-11980HK
74.3 fps
Average NVIDIA RTX A5000 Laptop GPU
  (53.2 - 74.3, n=2)
63.8 fps -14%
HP ZBook Fury 15 G8
NVIDIA RTX A5000 Laptop GPU, Intel Core i9-11950H
53.2 fps -28%
Average of class Workstation
  (7.71 - 109.7, n=28, last 2 years)
44.3 fps -40%
HP ZBook Fury 17 G7 119W5EA
NVIDIA Quadro RTX 4000 Max-Q, Intel Core i9-10885H
35.33 fps -52%
Lenovo ThinkPad P17 G2-20YU0025G
NVIDIA RTX A2000 Laptop GPU, Intel Core i7-11800H
33.98 fps -54%
MSI WE75 9TK
NVIDIA Quadro RTX 3000 (Laptop), Intel Core i7-9750H
30.55 fps -59%
Lenovo ThinkPad P1 G4-20Y4S0KS00
NVIDIA GeForce RTX 3070 Laptop GPU, Intel Core i7-11850H
22.6 fps -70%
Creo (creo-02)
MSI WE76 11UM-456
NVIDIA RTX A5000 Laptop GPU, Intel Core i9-11980HK
251.7 fps
Average NVIDIA RTX A5000 Laptop GPU
  (214 - 252, n=2)
233 fps -7%
HP ZBook Fury 15 G8
NVIDIA RTX A5000 Laptop GPU, Intel Core i9-11950H
214.3 fps -15%
Average of class Workstation
  (76.8 - 398, n=27, last 2 years)
212 fps -16%
MSI WE75 9TK
NVIDIA Quadro RTX 3000 (Laptop), Intel Core i7-9750H
196.2 fps -22%
Lenovo ThinkPad P17 G2-20YU0025G
NVIDIA RTX A2000 Laptop GPU, Intel Core i7-11800H
170.2 fps -32%
Lenovo ThinkPad P1 G4-20Y4S0KS00
NVIDIA GeForce RTX 3070 Laptop GPU, Intel Core i7-11850H
168.8 fps -33%
HP ZBook Fury 17 G7 119W5EA
NVIDIA Quadro RTX 4000 Max-Q, Intel Core i9-10885H
162.1 fps -36%
Catia (catia-05)
MSI WE76 11UM-456
NVIDIA RTX A5000 Laptop GPU, Intel Core i9-11980HK
280.9 fps
Average NVIDIA RTX A5000 Laptop GPU
  (243 - 281, n=2)
262 fps -7%
HP ZBook Fury 15 G8
NVIDIA RTX A5000 Laptop GPU, Intel Core i9-11950H
243.4 fps -13%
Average of class Workstation
  (99.5 - 409, n=28, last 2 years)
237 fps -16%
Lenovo ThinkPad P17 G2-20YU0025G
NVIDIA RTX A2000 Laptop GPU, Intel Core i7-11800H
210.8 fps -25%
MSI WE75 9TK
NVIDIA Quadro RTX 3000 (Laptop), Intel Core i7-9750H
205.2 fps -27%
HP ZBook Fury 17 G7 119W5EA
NVIDIA Quadro RTX 4000 Max-Q, Intel Core i9-10885H
181.6 fps -35%
Lenovo ThinkPad P1 G4-20Y4S0KS00
NVIDIA GeForce RTX 3070 Laptop GPU, Intel Core i7-11850H
133.1 fps -53%
3ds Max (3dsmax-06)
MSI WE76 11UM-456
NVIDIA RTX A5000 Laptop GPU, Intel Core i9-11980HK
208.1 fps
Average NVIDIA RTX A5000 Laptop GPU
  (183.8 - 208, n=2)
196 fps -6%
Lenovo ThinkPad P1 G4-20Y4S0KS00
NVIDIA GeForce RTX 3070 Laptop GPU, Intel Core i7-11850H
193.3 fps -7%
HP ZBook Fury 15 G8
NVIDIA RTX A5000 Laptop GPU, Intel Core i9-11950H
183.8 fps -12%
MSI WE75 9TK
NVIDIA Quadro RTX 3000 (Laptop), Intel Core i7-9750H
162.5 fps -22%
Average of class Workstation
  (61.6 - 284, n=27, last 2 years)
160.6 fps -23%
Lenovo ThinkPad P17 G2-20YU0025G
NVIDIA RTX A2000 Laptop GPU, Intel Core i7-11800H
137.9 fps -34%
HP ZBook Fury 17 G7 119W5EA
NVIDIA Quadro RTX 4000 Max-Q, Intel Core i9-10885H
129.5 fps -38%
SPECviewperf 2020
1920x1080 Solidworks (solidworks-05)
Asus ProArt StudioBook 16 W7600H5A-2BL2
NVIDIA RTX A5000 Laptop GPU, Intel Xeon W-11955M
199.4 fps +18%
Average NVIDIA RTX A5000 Laptop GPU
  (169 - 199.4, n=3)
181.5 fps +7%
HP ZBook Fury 15 G8
NVIDIA RTX A5000 Laptop GPU, Intel Core i9-11950H
176 fps +4%
Lenovo ThinkPad P1 G4-20Y4S0KS00
NVIDIA GeForce RTX 3070 Laptop GPU, Intel Core i7-11850H
175.5 fps +4%
MSI WE76 11UM-456
NVIDIA RTX A5000 Laptop GPU, Intel Core i9-11980HK
169 fps
Average of class Workstation
  (46.3 - 347, n=27, last 2 years)
156 fps -8%
Lenovo ThinkPad P17 G2-20YU0025G
NVIDIA RTX A2000 Laptop GPU, Intel Core i7-11800H
126.4 fps -25%
HP ZBook Fury 17 G7 119W5EA
NVIDIA Quadro RTX 4000 Max-Q, Intel Core i9-10885H
114.4 fps -32%
1920x1080 Siemens NX (snx-04)
Asus ProArt StudioBook 16 W7600H5A-2BL2
NVIDIA RTX A5000 Laptop GPU, Intel Xeon W-11955M
309.1 fps +19%
HP ZBook Fury 15 G8
NVIDIA RTX A5000 Laptop GPU, Intel Core i9-11950H
285.4 fps +10%
Average NVIDIA RTX A5000 Laptop GPU
  (261 - 309, n=3)
285 fps +9%
MSI WE76 11UM-456
NVIDIA RTX A5000 Laptop GPU, Intel Core i9-11980HK
260.5 fps
Average of class Workstation
  (48.5 - 554, n=29, last 2 years)
249 fps -4%
Lenovo ThinkPad P17 G2-20YU0025G
NVIDIA RTX A2000 Laptop GPU, Intel Core i7-11800H
186 fps -29%
HP ZBook Fury 17 G7 119W5EA
NVIDIA Quadro RTX 4000 Max-Q, Intel Core i9-10885H
181 fps -31%
Lenovo ThinkPad P1 G4-20Y4S0KS00
NVIDIA GeForce RTX 3070 Laptop GPU, Intel Core i7-11850H
17.03 fps -93%
1920x1080 Medical (medical-03)
Asus ProArt StudioBook 16 W7600H5A-2BL2
NVIDIA RTX A5000 Laptop GPU, Intel Xeon W-11955M
58.7 fps +4%
Average NVIDIA RTX A5000 Laptop GPU
  (56.6 - 58.7, n=3)
57.4 fps +1%
HP ZBook Fury 15 G8
NVIDIA RTX A5000 Laptop GPU, Intel Core i9-11950H
56.9 fps +1%
MSI WE76 11UM-456
NVIDIA RTX A5000 Laptop GPU, Intel Core i9-11980HK
56.6 fps
Average of class Workstation
  (13.5 - 140.9, n=29, last 2 years)
48.7 fps -14%
HP ZBook Fury 17 G7 119W5EA
NVIDIA Quadro RTX 4000 Max-Q, Intel Core i9-10885H
38.33 fps -32%
Lenovo ThinkPad P17 G2-20YU0025G
NVIDIA RTX A2000 Laptop GPU, Intel Core i7-11800H
34.49 fps -39%
Lenovo ThinkPad P1 G4-20Y4S0KS00
NVIDIA GeForce RTX 3070 Laptop GPU, Intel Core i7-11850H
27.94 fps -51%
1920x1080 Maya (maya-06)
Asus ProArt StudioBook 16 W7600H5A-2BL2
NVIDIA RTX A5000 Laptop GPU, Intel Xeon W-11955M
290 fps +7%
Average NVIDIA RTX A5000 Laptop GPU
  (258 - 290, n=3)
273 fps +1%
MSI WE76 11UM-456
NVIDIA RTX A5000 Laptop GPU, Intel Core i9-11980HK
270.1 fps
Lenovo ThinkPad P1 G4-20Y4S0KS00
NVIDIA GeForce RTX 3070 Laptop GPU, Intel Core i7-11850H
268.3 fps -1%
HP ZBook Fury 15 G8
NVIDIA RTX A5000 Laptop GPU, Intel Core i9-11950H
258.3 fps -4%
Average of class Workstation
  (86.9 - 460, n=29, last 2 years)
255 fps -6%
Lenovo ThinkPad P17 G2-20YU0025G
NVIDIA RTX A2000 Laptop GPU, Intel Core i7-11800H
191.5 fps -29%
HP ZBook Fury 17 G7 119W5EA
NVIDIA Quadro RTX 4000 Max-Q, Intel Core i9-10885H
159.9 fps -41%
1920x1080 Energy (energy-03)
MSI WE76 11UM-456
NVIDIA RTX A5000 Laptop GPU, Intel Core i9-11980HK
71.6 fps
Asus ProArt StudioBook 16 W7600H5A-2BL2
NVIDIA RTX A5000 Laptop GPU, Intel Xeon W-11955M
67.9 fps -5%
Average NVIDIA RTX A5000 Laptop GPU
  (55 - 71.6, n=3)
64.8 fps -9%
HP ZBook Fury 15 G8
NVIDIA RTX A5000 Laptop GPU, Intel Core i9-11950H
55 fps -23%
Average of class Workstation
  (6.72 - 109.7, n=29, last 2 years)
43.8 fps -39%
HP ZBook Fury 17 G7 119W5EA
NVIDIA Quadro RTX 4000 Max-Q, Intel Core i9-10885H
35.71 fps -50%
Lenovo ThinkPad P17 G2-20YU0025G
NVIDIA RTX A2000 Laptop GPU, Intel Core i7-11800H
33.85 fps -53%
Lenovo ThinkPad P1 G4-20Y4S0KS00
NVIDIA GeForce RTX 3070 Laptop GPU, Intel Core i7-11850H
22.47 fps -69%
1920x1080 Creo (creo-03)
Asus ProArt StudioBook 16 W7600H5A-2BL2
NVIDIA RTX A5000 Laptop GPU, Intel Xeon W-11955M
139.7 fps +5%
Average NVIDIA RTX A5000 Laptop GPU
  (132.6 - 139.7, n=3)
136.1 fps +3%
HP ZBook Fury 15 G8
NVIDIA RTX A5000 Laptop GPU, Intel Core i9-11950H
136 fps +3%
MSI WE76 11UM-456
NVIDIA RTX A5000 Laptop GPU, Intel Core i9-11980HK
132.6 fps
Average of class Workstation
  (44.5 - 169.5, n=29, last 2 years)
101.5 fps -23%
Lenovo ThinkPad P17 G2-20YU0025G
NVIDIA RTX A2000 Laptop GPU, Intel Core i7-11800H
98.3 fps -26%
HP ZBook Fury 17 G7 119W5EA
NVIDIA Quadro RTX 4000 Max-Q, Intel Core i9-10885H
88.3 fps -33%
Lenovo ThinkPad P1 G4-20Y4S0KS00
NVIDIA GeForce RTX 3070 Laptop GPU, Intel Core i7-11850H
64.2 fps -52%
1920x1080 CATIA (catia-06)
MSI WE76 11UM-456
NVIDIA RTX A5000 Laptop GPU, Intel Core i9-11980HK
106 fps
Average NVIDIA RTX A5000 Laptop GPU
  (93.6 - 106, n=3)
99.5 fps -6%
Asus ProArt StudioBook 16 W7600H5A-2BL2
NVIDIA RTX A5000 Laptop GPU, Intel Xeon W-11955M
98.8 fps -7%
HP ZBook Fury 15 G8
NVIDIA RTX A5000 Laptop GPU, Intel Core i9-11950H
93.6 fps -12%
Average of class Workstation
  (21 - 130, n=29, last 2 years)
68.3 fps -36%
HP ZBook Fury 17 G7 119W5EA
NVIDIA Quadro RTX 4000 Max-Q, Intel Core i9-10885H
60.5 fps -43%
Lenovo ThinkPad P17 G2-20YU0025G
NVIDIA RTX A2000 Laptop GPU, Intel Core i7-11800H
59.7 fps -44%
Lenovo ThinkPad P1 G4-20Y4S0KS00
NVIDIA GeForce RTX 3070 Laptop GPU, Intel Core i7-11850H
54.9 fps -48%
1920x1080 3ds Max (3dsmax-07)
MSI WE76 11UM-456
NVIDIA RTX A5000 Laptop GPU, Intel Core i9-11980HK
129.6 fps
Average NVIDIA RTX A5000 Laptop GPU
  (120 - 129.6, n=3)
124.2 fps -4%
Asus ProArt StudioBook 16 W7600H5A-2BL2
NVIDIA RTX A5000 Laptop GPU, Intel Xeon W-11955M
123.1 fps -5%
HP ZBook Fury 15 G8
NVIDIA RTX A5000 Laptop GPU, Intel Core i9-11950H
120 fps -7%
Lenovo ThinkPad P1 G4-20Y4S0KS00
NVIDIA GeForce RTX 3070 Laptop GPU, Intel Core i7-11850H
97.2 fps -25%
Average of class Workstation
  (28.3 - 174.7, n=29, last 2 years)
81.4 fps -37%
HP ZBook Fury 17 G7 119W5EA
NVIDIA Quadro RTX 4000 Max-Q, Intel Core i9-10885H
64.1 fps -51%
Lenovo ThinkPad P17 G2-20YU0025G
NVIDIA RTX A2000 Laptop GPU, Intel Core i7-11800H
59.7 fps -54%
3840x2160 Solidworks (solidworks-05)
Average of class Workstation
  (29.9 - 160.1, n=11, last 2 years)
93.7 fps +14%
Asus ProArt StudioBook 16 W7600H5A-2BL2
NVIDIA RTX A5000 Laptop GPU, Intel Xeon W-11955M
92.5 fps +12%
Lenovo ThinkPad P1 G4-20Y4S0KS00
NVIDIA GeForce RTX 3070 Laptop GPU, Intel Core i7-11850H
82.9 fps +1%
Average NVIDIA RTX A5000 Laptop GPU
  (72.8 - 92.5, n=3)
82.6 fps 0%
MSI WE76 11UM-456
NVIDIA RTX A5000 Laptop GPU, Intel Core i9-11980HK
82.4 fps
HP ZBook Fury 15 G8
NVIDIA RTX A5000 Laptop GPU, Intel Core i9-11950H
72.8 fps -12%
HP ZBook Fury 17 G7 119W5EA
NVIDIA Quadro RTX 4000 Max-Q, Intel Core i9-10885H
63.1 fps -23%
3840x2160 Siemens NX (snx-04)
Average of class Workstation
  (34.4 - 362, n=13, last 2 years)
192.6 fps +44%
Asus ProArt StudioBook 16 W7600H5A-2BL2
NVIDIA RTX A5000 Laptop GPU, Intel Xeon W-11955M
172.2 fps +29%
Average NVIDIA RTX A5000 Laptop GPU
  (133.4 - 172.2, n=3)
152.3 fps +14%
HP ZBook Fury 15 G8
NVIDIA RTX A5000 Laptop GPU, Intel Core i9-11950H
151.3 fps +13%
MSI WE76 11UM-456
NVIDIA RTX A5000 Laptop GPU, Intel Core i9-11980HK
133.4 fps
HP ZBook Fury 17 G7 119W5EA
NVIDIA Quadro RTX 4000 Max-Q, Intel Core i9-10885H
111.4 fps -16%
Lenovo ThinkPad P1 G4-20Y4S0KS00
NVIDIA GeForce RTX 3070 Laptop GPU, Intel Core i7-11850H
14.36 fps -89%
3840x2160 Medical (medical-03)
Average of class Workstation
  (8.89 - 58.5, n=13, last 2 years)
25.2 fps +7%
Asus ProArt StudioBook 16 W7600H5A-2BL2
NVIDIA RTX A5000 Laptop GPU, Intel Xeon W-11955M
23.58 fps 0%
MSI WE76 11UM-456
NVIDIA RTX A5000 Laptop GPU, Intel Core i9-11980HK
23.53 fps
Average NVIDIA RTX A5000 Laptop GPU
  (21.4 - 23.6, n=3)
22.8 fps -3%
HP ZBook Fury 15 G8
NVIDIA RTX A5000 Laptop GPU, Intel Core i9-11950H
21.42 fps -9%
HP ZBook Fury 17 G7 119W5EA
NVIDIA Quadro RTX 4000 Max-Q, Intel Core i9-10885H
14.57 fps -38%
Lenovo ThinkPad P1 G4-20Y4S0KS00
NVIDIA GeForce RTX 3070 Laptop GPU, Intel Core i7-11850H
9.93 fps -58%
3840x2160 Maya (maya-06)
Average of class Workstation
  (79.8 - 263, n=13, last 2 years)
160 fps +24%
Lenovo ThinkPad P1 G4-20Y4S0KS00
NVIDIA GeForce RTX 3070 Laptop GPU, Intel Core i7-11850H
138.6 fps +7%
Asus ProArt StudioBook 16 W7600H5A-2BL2
NVIDIA RTX A5000 Laptop GPU, Intel Xeon W-11955M
134.5 fps +4%
MSI WE76 11UM-456
NVIDIA RTX A5000 Laptop GPU, Intel Core i9-11980HK
129.5 fps
Average NVIDIA RTX A5000 Laptop GPU
  (119.2 - 134.5, n=3)
127.7 fps -1%
HP ZBook Fury 15 G8
NVIDIA RTX A5000 Laptop GPU, Intel Core i9-11950H
119.2 fps -8%
HP ZBook Fury 17 G7 119W5EA
NVIDIA Quadro RTX 4000 Max-Q, Intel Core i9-10885H
75.8 fps -41%
3840x2160 Energy (energy-03)
Asus ProArt StudioBook 16 W7600H5A-2BL2
NVIDIA RTX A5000 Laptop GPU, Intel Xeon W-11955M
138.7 fps +67%
Average NVIDIA RTX A5000 Laptop GPU
  (39.3 - 138.7, n=3)
87.1 fps +5%
MSI WE76 11UM-456
NVIDIA RTX A5000 Laptop GPU, Intel Core i9-11980HK
83.3 fps
HP ZBook Fury 17 G7 119W5EA
NVIDIA Quadro RTX 4000 Max-Q, Intel Core i9-10885H
41.38 fps -50%
HP ZBook Fury 15 G8
NVIDIA RTX A5000 Laptop GPU, Intel Core i9-11950H
39.3 fps -53%
Lenovo ThinkPad P1 G4-20Y4S0KS00
NVIDIA GeForce RTX 3070 Laptop GPU, Intel Core i7-11850H
35.24 fps -58%
Average of class Workstation
  (11.3 - 68.8, n=13, last 2 years)
31.8 fps -62%
3840x2160 Creo (creo-03)
MSI WE76 11UM-456
NVIDIA RTX A5000 Laptop GPU, Intel Core i9-11980HK
101.6 fps
Average NVIDIA RTX A5000 Laptop GPU
  (88.6 - 101.6, n=3)
93.3 fps -8%
HP ZBook Fury 15 G8
NVIDIA RTX A5000 Laptop GPU, Intel Core i9-11950H
89.8 fps -12%
Asus ProArt StudioBook 16 W7600H5A-2BL2
NVIDIA RTX A5000 Laptop GPU, Intel Xeon W-11955M
88.6 fps -13%
Average of class Workstation
  (49.2 - 117.5, n=13, last 2 years)
81.9 fps -19%
HP ZBook Fury 17 G7 119W5EA
NVIDIA Quadro RTX 4000 Max-Q, Intel Core i9-10885H
58.7 fps -42%
Lenovo ThinkPad P1 G4-20Y4S0KS00
NVIDIA GeForce RTX 3070 Laptop GPU, Intel Core i7-11850H
56.1 fps -45%
3840x2160 CATIA (catia-06)
MSI WE76 11UM-456
NVIDIA RTX A5000 Laptop GPU, Intel Core i9-11980HK
64.2 fps
Average NVIDIA RTX A5000 Laptop GPU
  (53 - 64.2, n=3)
58.4 fps -9%
Asus ProArt StudioBook 16 W7600H5A-2BL2
NVIDIA RTX A5000 Laptop GPU, Intel Xeon W-11955M
57.9 fps -10%
HP ZBook Fury 15 G8
NVIDIA RTX A5000 Laptop GPU, Intel Core i9-11950H
53 fps -17%
Average of class Workstation
  (23.1 - 75.3, n=13, last 2 years)
52 fps -19%
HP ZBook Fury 17 G7 119W5EA
NVIDIA Quadro RTX 4000 Max-Q, Intel Core i9-10885H
35.99 fps -44%
Lenovo ThinkPad P1 G4-20Y4S0KS00
NVIDIA GeForce RTX 3070 Laptop GPU, Intel Core i7-11850H
32.27 fps -50%
3840x2160 3ds Max (3dsmax-07)
Asus ProArt StudioBook 16 W7600H5A-2BL2
NVIDIA RTX A5000 Laptop GPU, Intel Xeon W-11955M
87.8 fps +1%
MSI WE76 11UM-456
NVIDIA RTX A5000 Laptop GPU, Intel Core i9-11980HK
86.9 fps
Average NVIDIA RTX A5000 Laptop GPU
  (77 - 87.8, n=3)
83.9 fps -3%
HP ZBook Fury 15 G8
NVIDIA RTX A5000 Laptop GPU, Intel Core i9-11950H
77 fps -11%
Average of class Workstation
  (26 - 99.5, n=13, last 2 years)
66.8 fps -23%
Lenovo ThinkPad P1 G4-20Y4S0KS00
NVIDIA GeForce RTX 3070 Laptop GPU, Intel Core i7-11850H
64 fps -26%
HP ZBook Fury 17 G7 119W5EA
NVIDIA Quadro RTX 4000 Max-Q, Intel Core i9-10885H
45.25 fps -48%
3DMark 11 Performance
32211 pontos
3DMark Cloud Gate Standard Score
35295 pontos
3DMark Fire Strike Score
24155 pontos
3DMark Time Spy Score
11185 pontos
Ajuda

Desempenho do jogo

O desempenho do WE76 nos jogos também é excelente e não tivemos nenhum problema com os motoristas profissionais durante nossos testes. A maioria dos títulos pode ser jogada sem problemas mesmo a 4K e com o máximo de detalhes. Apenas títulos muito exigentes, como o Cyberpunk 2077, requerem ou uma redução na resolução ou detalhes para que possam funcionar sem problemas. O desempenho dos jogos é menor com a energia da bateria; no The Witcher 3 (Ultra settings), por exemplo, o desempenho cai de 98 para 67 FPS. Mais benchmarks de jogos estão disponíveis aqui

The Witcher 3
1920x1080 High Graphics & Postprocessing (Nvidia HairWorks Off)
MSI WE76 11UM-456
Intel Core i9-11980HK, NVIDIA RTX A5000 Laptop GPU
179 fps
Lenovo ThinkPad P1 G4-20Y4S0KS00
Intel Core i7-11850H, NVIDIA GeForce RTX 3070 Laptop GPU
158 (131min) fps -12%
Average NVIDIA RTX A5000 Laptop GPU
  (124 - 179, n=3)
150.8 fps -16%
HP ZBook Fury 15 G8
Intel Core i9-11950H, NVIDIA RTX A5000 Laptop GPU
149.5 (141min) fps -16%
Asus ProArt StudioBook 16 W7600H5A-2BL2
Intel Xeon W-11955M, NVIDIA RTX A5000 Laptop GPU
124 fps -31%
Average of class Workstation
  (34.9 - 298, n=29, last 2 years)
119.5 fps -33%
MSI WE75 9TK
Intel Core i7-9750H, NVIDIA Quadro RTX 3000 (Laptop)
117 fps -35%
HP ZBook Fury 17 G7 119W5EA
Intel Core i9-10885H, NVIDIA Quadro RTX 4000 Max-Q
115 fps -36%
Lenovo ThinkPad P17 G2-20YU0025G
Intel Core i7-11800H, NVIDIA RTX A2000 Laptop GPU
95.8 (79min) fps -46%
1920x1080 Ultra Graphics & Postprocessing (HBAO+)
MSI WE76 11UM-456
Intel Core i9-11980HK, NVIDIA RTX A5000 Laptop GPU
98.3 (94min, 95P1) fps
Average NVIDIA RTX A5000 Laptop GPU
  (81.7 - 98.3, n=3)
90 fps -8%
Asus ProArt StudioBook 16 W7600H5A-2BL2
Intel Xeon W-11955M, NVIDIA RTX A5000 Laptop GPU
89.9 (87min, 88P1) fps -9%
Lenovo ThinkPad P1 G4-20Y4S0KS00
Intel Core i7-11850H, NVIDIA GeForce RTX 3070 Laptop GPU
86.8 (74min) fps -12%
HP ZBook Fury 15 G8
Intel Core i9-11950H, NVIDIA RTX A5000 Laptop GPU
81.7 (78min) fps -17%
Average of class Workstation
  (19.6 - 156.5, n=30, last 2 years)
65.9 fps -33%
HP ZBook Fury 17 G7 119W5EA
Intel Core i9-10885H, NVIDIA Quadro RTX 4000 Max-Q
62.6 (58min, 59P1) fps -36%
MSI WE75 9TK
Intel Core i7-9750H, NVIDIA Quadro RTX 3000 (Laptop)
59 fps -40%
Lenovo ThinkPad P17 G2-20YU0025G
Intel Core i7-11800H, NVIDIA RTX A2000 Laptop GPU
54 (45min) fps -45%
GTA V
1920x1080 High/On (Advanced Graphics Off) AA:2xMSAA + FX AF:8x
Lenovo ThinkPad P1 G4-20Y4S0KS00
Intel Core i7-11850H, NVIDIA GeForce RTX 3070 Laptop GPU
164 (5.21min, 90.9P1) fps +2%
MSI WE76 11UM-456
Intel Core i9-11980HK, NVIDIA RTX A5000 Laptop GPU
161 (4.08min, 90.9P1) fps
Asus ProArt StudioBook 16 W7600H5A-2BL2
Intel Xeon W-11955M, NVIDIA RTX A5000 Laptop GPU
158 (3.82min, 90.9P1) fps -2%
Average NVIDIA RTX A5000 Laptop GPU
  (131 - 161, n=3)
150 fps -7%
HP ZBook Fury 15 G8
Intel Core i9-11950H, NVIDIA RTX A5000 Laptop GPU
131 (11.7min, 35.7P1) fps -19%
Average of class Workstation
  (47.6 - 177.7, n=26, last 2 years)
127.6 fps -21%
Lenovo ThinkPad P17 G2-20YU0025G
Intel Core i7-11800H, NVIDIA RTX A2000 Laptop GPU
119 (15.9min, 76.9P1) fps -26%
1920x1080 Highest Settings possible AA:4xMSAA + FX AF:16x
MSI WE76 11UM-456
Intel Core i9-11980HK, NVIDIA RTX A5000 Laptop GPU
94.6 (5.49min, 58.8P1) fps
Lenovo ThinkPad P1 G4-20Y4S0KS00
Intel Core i7-11850H, NVIDIA GeForce RTX 3070 Laptop GPU
88.1 (6.6min, 55.6P1) fps -7%
Asus ProArt StudioBook 16 W7600H5A-2BL2
Intel Xeon W-11955M, NVIDIA RTX A5000 Laptop GPU
85.8 (21.2min, 52.6P1) fps -9%
Average NVIDIA RTX A5000 Laptop GPU
  (76.1 - 94.6, n=3)
85.5 fps -10%
HP ZBook Fury 15 G8
Intel Core i9-11950H, NVIDIA RTX A5000 Laptop GPU
76.1 (5.43min, 28.6P1) fps -20%
Average of class Workstation
  (18.3 - 124.4, n=26, last 2 years)
70.9 fps -25%
Lenovo ThinkPad P17 G2-20YU0025G
Intel Core i7-11800H, NVIDIA RTX A2000 Laptop GPU
69.1 (7.03min, 45.5P1) fps -27%
Final Fantasy XV Benchmark
1920x1080 High Quality
MSI WE76 11UM-456
Intel Core i9-11980HK, NVIDIA RTX A5000 Laptop GPU
108 fps
Average NVIDIA RTX A5000 Laptop GPU
  (81.1 - 108, n=3)
93.6 fps -13%
Asus ProArt StudioBook 16 W7600H5A-2BL2
Intel Xeon W-11955M, NVIDIA RTX A5000 Laptop GPU
91.8 fps -15%
HP ZBook Fury 15 G8
Intel Core i9-11950H, NVIDIA RTX A5000 Laptop GPU
81.1 fps -25%
HP ZBook Fury 17 G7 119W5EA
Intel Core i9-10885H, NVIDIA Quadro RTX 4000 Max-Q
68.3 fps -37%
Average of class Workstation
  (21.2 - 149.1, n=30, last 2 years)
66.1 fps -39%
Lenovo ThinkPad P17 G2-20YU0025G
Intel Core i7-11800H, NVIDIA RTX A2000 Laptop GPU
51.6 fps -52%
2560x1440 High Quality
MSI WE76 11UM-456
Intel Core i9-11980HK, NVIDIA RTX A5000 Laptop GPU
83.6 fps
Average NVIDIA RTX A5000 Laptop GPU
  (62.6 - 83.6, n=3)
72.3 fps -14%
Asus ProArt StudioBook 16 W7600H5A-2BL2
Intel Xeon W-11955M, NVIDIA RTX A5000 Laptop GPU
70.6 fps -16%
HP ZBook Fury 15 G8
Intel Core i9-11950H, NVIDIA RTX A5000 Laptop GPU
62.6 fps -25%
Average of class Workstation
  (17.7 - 120, n=20, last 2 years)
60.1 fps -28%
HP ZBook Fury 17 G7 119W5EA
Intel Core i9-10885H, NVIDIA Quadro RTX 4000 Max-Q
46.3 fps -45%
Far Cry 5
1920x1080 High Preset AA:T
MSI WE76 11UM-456
Intel Core i9-11980HK, NVIDIA RTX A5000 Laptop GPU
113 fps
Average of class Workstation
  (35 - 138, n=15, last 2 years)
91.3 fps -19%
HP ZBook Fury 15 G8
Intel Core i9-11950H, NVIDIA RTX A5000 Laptop GPU
90 (38min) fps -20%
Average NVIDIA RTX A5000 Laptop GPU
  (62 - 113, n=3)
88.3 fps -22%
Asus ProArt StudioBook 16 W7600H5A-2BL2
Intel Xeon W-11955M, NVIDIA RTX A5000 Laptop GPU
62 fps -45%
1920x1080 Ultra Preset AA:T
MSI WE76 11UM-456
Intel Core i9-11980HK, NVIDIA RTX A5000 Laptop GPU
103 fps
Average of class Workstation
  (33 - 149, n=16, last 2 years)
90.2 fps -12%
HP ZBook Fury 15 G8
Intel Core i9-11950H, NVIDIA RTX A5000 Laptop GPU
85 (65min) fps -17%
Average NVIDIA RTX A5000 Laptop GPU
  (60 - 103, n=3)
82.7 fps -20%
Asus ProArt StudioBook 16 W7600H5A-2BL2
Intel Xeon W-11955M, NVIDIA RTX A5000 Laptop GPU
60 fps -42%
Cyberpunk 2077 1.0
1920x1080 Ultra Preset
MSI WE76 11UM-456
Intel Core i9-11980HK, NVIDIA RTX A5000 Laptop GPU
78 fps
Average NVIDIA RTX A5000 Laptop GPU
  (58.6 - 78, n=2)
68.3 fps -12%
Asus ProArt StudioBook 16 W7600H5A-2BL2
Intel Xeon W-11955M, NVIDIA RTX A5000 Laptop GPU
58.6 fps -25%
1920x1080 High Preset
MSI WE76 11UM-456
Intel Core i9-11980HK, NVIDIA RTX A5000 Laptop GPU
90 fps
Average NVIDIA RTX A5000 Laptop GPU
  (68.1 - 90, n=2)
79.1 fps -12%
Asus ProArt StudioBook 16 W7600H5A-2BL2
Intel Xeon W-11955M, NVIDIA RTX A5000 Laptop GPU
68.1 fps -24%
F1 2021
1920x1080 High Preset AA:T AF:16x
MSI WE76 11UM-456
Intel Core i9-11980HK, NVIDIA RTX A5000 Laptop GPU
161 (143min, 102P1) fps
Asus ProArt StudioBook 16 W7600H5A-2BL2
Intel Xeon W-11955M, NVIDIA RTX A5000 Laptop GPU
159 (137min, 100P1) fps -1%
Average NVIDIA RTX A5000 Laptop GPU
  (122 - 161, n=3)
147.3 fps -9%
HP ZBook Fury 15 G8
Intel Core i9-11950H, NVIDIA RTX A5000 Laptop GPU
122 (51min) fps -24%
Average of class Workstation
  (56.5 - 186.6, n=9, last 2 years)
112 fps -30%
Lenovo ThinkPad P17 G2-20YU0025G
Intel Core i7-11800H, NVIDIA RTX A2000 Laptop GPU
109 (72min, 62P1) fps -32%
1920x1080 Ultra High Preset + Raytracing AA:T AF:16x
MSI WE76 11UM-456
Intel Core i9-11980HK, NVIDIA RTX A5000 Laptop GPU
109 (93min, 79P1) fps
Asus ProArt StudioBook 16 W7600H5A-2BL2
Intel Xeon W-11955M, NVIDIA RTX A5000 Laptop GPU
104 (86min, 78P1) fps -5%
Average NVIDIA RTX A5000 Laptop GPU
  (85 - 109, n=3)
99.3 fps -9%
HP ZBook Fury 15 G8
Intel Core i9-11950H, NVIDIA RTX A5000 Laptop GPU
85 (27min) fps -22%
Average of class Workstation
  (36.1 - 99.2, n=9, last 2 years)
59.3 fps -46%
Lenovo ThinkPad P17 G2-20YU0025G
Intel Core i7-11800H, NVIDIA RTX A2000 Laptop GPU
50.6 (42min, 40P1) fps -54%
Far Cry 6
1920x1080 High Graphics Quality AA:T
MSI WE76 11UM-456
Intel Core i9-11980HK, NVIDIA RTX A5000 Laptop GPU
95 fps
Average NVIDIA RTX A5000 Laptop GPU
  ()
95 fps 0%
Average of class Workstation
  (54 - 104, n=3, last 2 years)
87.3 fps -8%
1920x1080 Ultra Graphics Quality + HD Textures AA:T
Average of class Workstation
  (87 - 95, n=2, last 2 years)
91 fps +2%
MSI WE76 11UM-456
Intel Core i9-11980HK, NVIDIA RTX A5000 Laptop GPU
89 fps
Average NVIDIA RTX A5000 Laptop GPU
  ()
89 fps 0%

The Witcher 3 FPS diagram

0102030405060708090100Tooltip
MSI WE76 11UM-456 i9-11980HK, RTX A5000 Laptop GPU: Ø98.3 (94-103)
baixo média alto ultraQHD4K
GTA V (2015) 181 175 161 94.6 84.3 92.5
The Witcher 3 (2015) 354 271 179 98.3 74
Final Fantasy XV Benchmark (2018) 184 144 108 83.6 51.1
X-Plane 11.11 (2018) 136 114 90.5 65.3
Far Cry 5 (2018) 121 113 103 92 50
Strange Brigade (2018) 412 251 213 191 146 86.8
Cyberpunk 2077 1.0 (2020) 118 104 90 78 51 25
F1 2021 (2021) 257 187 161 109 88.2 53.6
Far Cry 6 (2021) 120 103 95 89 79 51

Emissões - WE76 com refrigeração potente

Emissões sonoras

O controle do ventilador está definitivamente entre os pontos fracos do WE76. Mesmo sob carga baixa, os ventiladores são sempre audíveis, razão pela qual recomendamos sempre o uso do modo Silent para tarefas cotidianas, uma vez que os ventiladores são freqüentemente desativados naquela época. Se você precisar de mais desempenho (especialmente em termos de GPU), você ainda pode ajustar o modo Desempenho. Em geral, no entanto, a estação de trabalho móvel da MSI ou não é mais alta ou é apenas marginalmente mais alta sob carga do que a concorrência, que muitas vezes é equipada com componentes mais fracos. O perfil de Alto Desempenho aumenta o ruído máximo do ventilador de pouco menos de 48 para cerca de 54 dB(A), o que pode ser descrito como irritantemente alto. Com o modo CoolerBooster, você também pode ativar a maior velocidade do ventilador, o que leva a 58,9 dB(A). Recomendamos verificar o desempenho no modo Silent quando estiver jogando, já que só poderíamos medir 38,6 dB(A) no The Witcher 3, por exemplo, o que significa que você não precisa recorrer a fones de ouvido. No entanto, não pudemos detectar nenhum outro ruído eletrônico

Barulho

Ocioso
24.7 / 24.7 / 27.5 dB
Carga
43.7 / 47.7 dB
  red to green bar
 
 
30 dB
silencioso
40 dB(A)
audível
50 dB(A)
ruidosamente alto
 
min: dark, med: mid, max: light   Earthworks M23R, Arta (15 cm de distância)   environment noise: 24.7 dB(A)
dB(A) 0102030405060708090Deep BassMiddle BassHigh BassLower RangeMidsHigher MidsLower HighsMid HighsUpper HighsSuper Highs2032.132.532.728.833.231.927.62534.231.732.42732.729.627.73128.729.225.924.626.526.924.84031.330.931.330.128.627.625.75028.429.229.725.929.123.522.46329.327262826.923.422.98024.326.220.324.924.822.220.210023.823.821.421.722.120.619.512525.423.921.120.623.920.219.916022.922.318.218.120.119.317.120026.529.421.923.52119.919.925029.126.420.428.519.216.618.431527.926.919.222.218.916.717.540029.829.222.22526.916.92650032.231.216.927.319.513.321.663032.732.216.529.218.212.217.980033.634.515.727.818.511.119.2100033.532.61629.318.212.918.1125035.33414.531.516.511.116.7160037.736.917.833.717.912.318.4200036.135.314.931.115.711.516.1250037.736.213.933.414.511.515.2315037.635.713.634.91511.715.1400037.736.613.634.415.211.817.1500037.636.81331.313.412.215.1630033.832.712.730.312.912.413.4800029.528.2132612.712.612.6100002524.412.82212.712.512.61250021.221.812.818.312.612.412.51600015.82012.514.712.112.212.2SPL47.746.627.543.729.224.729.4N5.85.514.31.20.61.2median 32.2median 31.2median 15.7median 27.8median 17.9median 12.4median 17.1Delta5.35.63.14.83.12.52.2hearing rangehide median Fan NoiseMSI WE76 11UM-456
MSI WE76 11UM-456
RTX A5000 Laptop GPU, i9-11980HK, Samsung PM9A1 MZVL22T0HBLB
Lenovo ThinkPad P1 G4-20Y4S0KS00
GeForce RTX 3070 Laptop GPU, i7-11850H, Samsung PM9A1 MZVL21T0HCLR
HP ZBook Fury 15 G8
RTX A5000 Laptop GPU, i9-11950H, Samsung PM981a MZVLB1T0HBLR
Asus ProArt StudioBook 16 W7600H5A-2BL2
RTX A5000 Laptop GPU, W-11955M, 2x Micron 2300 2TB MTFDHBA2T0TDV (RAID 0)
Lenovo ThinkPad P17 G2-20YU0025G
RTX A2000 Laptop GPU, i7-11800H, Kioxia XG7 KXG7AZNV512G
HP ZBook Fury 17 G7 119W5EA
Quadro RTX 4000 Max-Q, i9-10885H, WDC PC SN730 SDBPNTY-1T00
MSI WE75 9TK
Quadro RTX 3000 (Laptop), i7-9750H, Samsung SSD PM981 MZVLB512HAJQ
Noise
3%
6%
1%
3%
-1%
-7%
off / environment *
24.7
23.8
4%
24.1
2%
26
-5%
26.4
-7%
24.4
1%
28.5
-15%
Idle Minimum *
24.7
23.8
4%
24.1
2%
26
-5%
26.4
-7%
24.4
1%
29
-17%
Idle Average *
24.7
23.8
4%
24.1
2%
26
-5%
26.4
-7%
26.6
-8%
29
-17%
Idle Maximum *
27.5
28.3
-3%
24.8
10%
26.5
4%
26.4
4%
29
-5%
31.5
-15%
Load Average *
43.7
38.6
12%
37.8
14%
42
4%
38.1
13%
40.2
8%
32
27%
Witcher 3 ultra *
46.6
47.4
-2%
44.2
5%
38.1
18%
48
-3%
44.7
4%
Load Maximum *
47.7
47.4
1%
44.2
7%
43
10%
45
6%
48
-1%
56.5
-18%

* ... smaller is better

Temperatura

O WE76 não tem nenhum problema de temperatura, pois o caso inteiro permanece muito frio durante tarefas simples. Embora haja uma área na parte traseira esquerda inferior sob carga onde podemos medir mais de 55 °C (~131 °F), não vemos isto como um problema, já que dificilmente você usará esta estação de trabalho móvel em seu colo. O teclado também fica visivelmente mais quente sob carga alta, mas a digitação não é afetada aqui.

Você pode ver a diferença entre os modos de desempenho no teste de estresse, já que o modo opcional Alto Desempenho aumenta o consumo de energia da CPU de ~42 para 60 watts. O consumo da GPU é constante em ~150 watts, no entanto, e os resultados são muito bons em geral.

Medidas de CPU e GPU durante o teste de estresse
 44.8 °C47.5 °C48.4 °C 
 39.3 °C44.3 °C42.8 °C 
 25.6 °C27.5 °C27.2 °C 
Máximo: 48.4 °C
Médio: 38.6 °C
56.2 °C49.4 °C51.1 °C
44 °C48.3 °C36.4 °C
25 °C24.8 °C24.4 °C
Máximo: 56.2 °C
Médio: 40 °C
alimentação elétrica  45.1 °C | Temperatura do quarto 20.8 °C | Fluke t3000FC (calibrated), Voltcraft IR-900
(-) The average temperature for the upper side under maximal load is 38.6 °C / 101 F, compared to the average of 32 °C / 90 F for the devices in the class Workstation.
(-) The maximum temperature on the upper side is 48.4 °C / 119 F, compared to the average of 38.2 °C / 101 F, ranging from 22.2 to 69.8 °C for the class Workstation.
(-) The bottom heats up to a maximum of 56.2 °C / 133 F, compared to the average of 41.2 °C / 106 F
(+) In idle usage, the average temperature for the upper side is 26 °C / 79 F, compared to the device average of 32 °C / 90 F.
(±) Playing The Witcher 3, the average temperature for the upper side is 37.6 °C / 100 F, compared to the device average of 32 °C / 90 F.
(+) The palmrests and touchpad are cooler than skin temperature with a maximum of 27.5 °C / 81.5 F and are therefore cool to the touch.
(±) The average temperature of the palmrest area of similar devices was 27.8 °C / 82 F (+0.3 °C / 0.5 F).
Temperaturas da superfície - teste de estresse (topo)
Temperaturas da superfície - teste de estresse (fundo)
MSI WE76 11UM-456
Intel Core i9-11980HK, NVIDIA RTX A5000 Laptop GPU
Lenovo ThinkPad P1 G4-20Y4S0KS00
Intel Core i7-11850H, NVIDIA GeForce RTX 3070 Laptop GPU
HP ZBook Fury 15 G8
Intel Core i9-11950H, NVIDIA RTX A5000 Laptop GPU
Asus ProArt StudioBook 16 W7600H5A-2BL2
Intel Xeon W-11955M, NVIDIA RTX A5000 Laptop GPU
Lenovo ThinkPad P17 G2-20YU0025G
Intel Core i7-11800H, NVIDIA RTX A2000 Laptop GPU
HP ZBook Fury 17 G7 119W5EA
Intel Core i9-10885H, NVIDIA Quadro RTX 4000 Max-Q
MSI WE75 9TK
Intel Core i7-9750H, NVIDIA Quadro RTX 3000 (Laptop)
Heat
2%
6%
-3%
7%
12%
8%
Maximum Upper Side *
48.4
51
-5%
45.6
6%
45.7
6%
49.6
-2%
46.1
5%
40.6
16%
Maximum Bottom *
56.2
53.5
5%
57.6
-2%
48.3
14%
52.1
7%
57.6
-2%
46
18%
Idle Upper Side *
28.6
28.8
-1%
26
9%
35.3
-23%
26
9%
23.4
18%
29.2
-2%
Idle Bottom *
31.8
29.3
8%
28.8
9%
34.4
-8%
27.6
13%
23.4
26%
32.4
-2%

* ... smaller is better

Oradores

A MSI instalou um sistema de som estéreo com um desempenho aceitável. Entretanto, o ruído do ventilador predomina especialmente quando os componentes estão sob carga elevada (independentemente de estarem em uso aplicações profissionais ou jogos), de modo que você não consegue ouvir muito bem os alto-falantes. Portanto, recomendamos o uso de fones de ouvido aqui

dB(A) 0102030405060708090Deep BassMiddle BassHigh BassLower RangeMidsHigher MidsLower HighsMid HighsUpper HighsSuper Highs2031.931.82529.636.53126.930.94027.636.55023.5306323.431.98022.236.310020.643.312520.247.516019.34920019.954.625016.65831516.76240016.965.650013.368.663012.270.880011.175.2100012.973.9125011.173.2160012.374.1200011.573250011.569315011.768.1400011.877.4500012.275.4630012.467.1800012.659.71000012.556.91250012.4531600012.250.9SPL24.784.6N0.660.2median 12.4median 67.1Delta2.59.227.832.225.928.830.534.528.831.826.43221.331.217.83721.74618.448.519.957.317.967.115.765.613.862.31261.812.363.810.864.710.76810.370.610.771.310.666.111.264.711.362.911.666.511.4681264.41265.212.158.91258.811.955.111.152.423.878.60.546median 12median 64.41.94.53130.625.83227.830.434.533.633.534.330.333.333.933.923.931.625.436.92437.822.946.821.852.118.754.917.358.316.663.215.163.214.867.914.170.713.171.212.963.812.66012.858.912.855.812.762.51361.512.857.912.956.212.952.912.746.612.745.926.476.60.936median 13.1median 57.93.27.2hearing rangehide median Pink NoiseMSI WE76 11UM-456HP ZBook Fury 17 G7 119W5EALenovo ThinkPad P17 G2-20YU0025G
Frequency diagram (checkboxes can be checked and unchecked to compare devices)
MSI WE76 11UM-456 audio analysis

(+) | speakers can play relatively loud (84.6 dB)
Bass 100 - 315 Hz
(±) | reduced bass - on average 14.7% lower than median
(±) | linearity of bass is average (7.8% delta to prev. frequency)
Mids 400 - 2000 Hz
(±) | higher mids - on average 5% higher than median
(+) | mids are linear (3.9% delta to prev. frequency)
Highs 2 - 16 kHz
(±) | higher highs - on average 5.6% higher than median
(±) | linearity of highs is average (9.1% delta to prev. frequency)
Overall 100 - 16.000 Hz
(±) | linearity of overall sound is average (16.3% difference to median)
Compared to same class
» 36% of all tested devices in this class were better, 10% similar, 55% worse
» The best had a delta of 7%, average was 18%, worst was 35%
Compared to all devices tested
» 22% of all tested devices were better, 5% similar, 73% worse
» The best had a delta of 4%, average was 25%, worst was 134%

HP ZBook Fury 17 G7 119W5EA audio analysis

(±) | speaker loudness is average but good (78.6 dB)
Bass 100 - 315 Hz
(±) | reduced bass - on average 7.9% lower than median
(±) | linearity of bass is average (11.1% delta to prev. frequency)
Mids 400 - 2000 Hz
(+) | balanced mids - only 2.8% away from median
(+) | mids are linear (3.9% delta to prev. frequency)
Highs 2 - 16 kHz
(+) | balanced highs - only 2.7% away from median
(+) | highs are linear (4.8% delta to prev. frequency)
Overall 100 - 16.000 Hz
(+) | overall sound is linear (10.9% difference to median)
Compared to same class
» 8% of all tested devices in this class were better, 3% similar, 90% worse
» The best had a delta of 7%, average was 18%, worst was 35%
Compared to all devices tested
» 4% of all tested devices were better, 1% similar, 94% worse
» The best had a delta of 4%, average was 25%, worst was 134%

Lenovo ThinkPad P17 G2-20YU0025G audio analysis

(±) | speaker loudness is average but good (76.6 dB)
Bass 100 - 315 Hz
(±) | reduced bass - on average 14.5% lower than median
(±) | linearity of bass is average (9.6% delta to prev. frequency)
Mids 400 - 2000 Hz
(±) | higher mids - on average 6.9% higher than median
(±) | linearity of mids is average (7.7% delta to prev. frequency)
Highs 2 - 16 kHz
(+) | balanced highs - only 2.6% away from median
(+) | highs are linear (6.6% delta to prev. frequency)
Overall 100 - 16.000 Hz
(±) | linearity of overall sound is average (20.1% difference to median)
Compared to same class
» 66% of all tested devices in this class were better, 6% similar, 28% worse
» The best had a delta of 7%, average was 18%, worst was 35%
Compared to all devices tested
» 46% of all tested devices were better, 8% similar, 45% worse
» The best had a delta of 4%, average was 25%, worst was 134%

Gestão de energia - Alto consumo de energia

Consumo de energia

Adaptador de energia de 280 watts

Não é surpresa que a estação de trabalho móvel exija muita energia. Graças à comutação automática dos gráficos, as taxas de inatividade ainda estão dentro dos limites com um máximo de 20 watts, mas sob carga, são atingidos até 281 watts, que depois se estabelecem rapidamente em 245 watts (~260 watts no modo High Performance). Você pode esperar cerca de 230 watts ao jogar. Isto significa que o adaptador de energia incluído de 280 watts tem uma capacidade adequada

Consumo de energia
desligadodarklight 0.31 / 1.2 Watt
Ociosodarkmidlight 10.5 / 18.6 / 20 Watt
Carga midlight 132.4 / 281.6 Watt
 color bar
Key: min: dark, med: mid, max: light        Metrahit Energy
Currently we use the Metrahit Energy, a professional single phase power quality and energy measurement digital multimeter, for our measurements. Find out more about it here. All of our test methods can be found here.
MSI WE76 11UM-456
i9-11980HK, RTX A5000 Laptop GPU, Samsung PM9A1 MZVL22T0HBLB, IPS, 3840x2160, 17.30
Lenovo ThinkPad P1 G4-20Y4S0KS00
i7-11850H, GeForce RTX 3070 Laptop GPU, Samsung PM9A1 MZVL21T0HCLR, IPS LED, 3840x2400, 16.00
HP ZBook Fury 15 G8
i9-11950H, RTX A5000 Laptop GPU, Samsung PM981a MZVLB1T0HBLR, IPS, 3840x2160, 15.60
Asus ProArt StudioBook 16 W7600H5A-2BL2
W-11955M, RTX A5000 Laptop GPU, 2x Micron 2300 2TB MTFDHBA2T0TDV (RAID 0), OLED, 3840x2400, 16.00
Lenovo ThinkPad P17 G2-20YU0025G
i7-11800H, RTX A2000 Laptop GPU, Kioxia XG7 KXG7AZNV512G, IPS LED, 1920x1080, 17.30
HP ZBook Fury 17 G7 119W5EA
i9-10885H, Quadro RTX 4000 Max-Q, WDC PC SN730 SDBPNTY-1T00, , 3840x2160, 17.30
MSI WE75 9TK
i7-9750H, Quadro RTX 3000 (Laptop), Samsung SSD PM981 MZVLB512HAJQ, IPS, 1920x1080, 17.30
Average NVIDIA RTX A5000 Laptop GPU
 
Average of class Workstation
 
Power Consumption
19%
15%
11%
38%
24%
15%
5%
26%
Idle Minimum *
10.5
8.1
23%
8.3
21%
12.4
-18%
6.1
42%
5.8
45%
12.1
-15%
Idle Average *
18.6
20.2
-9%
19.9
-7%
16.5
11%
10.9
41%
14.8
20%
18.4
1%
Idle Maximum *
20
21.9
-10%
21.8
-9%
25
-25%
12.3
38%
17
15%
18.8
6%
22.3 ?(20 - 25, n=3)
-12%
Load Average *
132.4
88.2
33%
110.9
16%
132
-0%
106.3
20%
120.4
9%
95.1
28%
Witcher 3 ultra *
232
149
36%
165
29%
132
43%
124
47%
168.4
27%
135.5
42%
Load Maximum *
281.6
170.6
39%
171.8
39%
134
52%
168.9
40%
199.8
29%
203.7
28%
195.8 ?(134 - 282, n=3)
30%

* ... smaller is better

Energy consumption during our The Witcher 3 test / stress test

0153045607590105120135150165180195210225240255270Tooltip
MSI WE76 11UM-456; Witcher 3 ultra: Ø232 (219-256)
MSI WE76 11UM-456; 1280x720 Prime95 28.10 and Furmark 1.25: Ø256 (218-282)

Energy consumption with an external monitor

0153045607590105120135150165180195210225240Tooltip
MSI WE76 11UM-456; Prime95 V2810 Stress (external Monitor): Ø102.7 (99-124)
MSI WE76 11UM-456; Cinebench R15 Multi (external Monitor): Ø110 (107-117)
MSI WE76 11UM-456; 1280x720 FurMark 1.19 GPU Stress Test (external Monitor): Ø216 (209-222)
MSI WE76 11UM-456; 1920x1080 The Witcher 3 ultra (external Monitor): Ø226 (221-251)

Duração da bateria

A bateria de 99,9 Wh é a capacidade máxima que ainda pode ser transportada em aviões. Os tempos de funcionamento da bateria são apropriados para o desempenho e os componentes. Com um pouco mais de 6 horas no teste Wi-Fi a 150 cd/m² (ou 4:30 horas em pleno brilho) e pouco menos de 7 horas no teste de vídeo, você pode definitivamente sobreviver a reuniões um pouco mais longas sem precisar de uma tomada elétrica. Pouco menos de 80 minutos é possível sob carga, mas isto só é possível devido ao desempenho significativamente reduzido

Tempo de Execução da Bateria
WiFi Websurfing (Edge 95)
6h 17min
WiFi Websurfing max. Brightness (Edge 95)
4h 36min
Big Buck Bunny H.264 1080p
6h 53min
Carga (máximo brilho)
1h 19min
MSI WE76 11UM-456
i9-11980HK, RTX A5000 Laptop GPU, 99.9 Wh
Lenovo ThinkPad P1 G4-20Y4S0KS00
i7-11850H, GeForce RTX 3070 Laptop GPU, 90 Wh
HP ZBook Fury 15 G8
i9-11950H, RTX A5000 Laptop GPU, 94 Wh
Asus ProArt StudioBook 16 W7600H5A-2BL2
W-11955M, RTX A5000 Laptop GPU, 90 Wh
Lenovo ThinkPad P17 G2-20YU0025G
i7-11800H, RTX A2000 Laptop GPU, 94 Wh
HP ZBook Fury 17 G7 119W5EA
i9-10885H, Quadro RTX 4000 Max-Q, 94 Wh
MSI WE75 9TK
i7-9750H, Quadro RTX 3000 (Laptop), 65 Wh
Average of class Workstation
 
Battery Runtime
3%
-2%
-47%
33%
34%
-23%
40%
H.264
413
429
4%
106
-74%
568
38%
615
49%
WiFi v1.3
377
417
11%
370
-2%
301
-20%
588
56%
455
21%
293
-22%
Load
79
74
-6%
84
6%
104
32%
61
-23%
Witcher 3 ultra
94
Reader / Idle
659

Pro

+ muito alto desempenho
+ painel 4K mate com cores precisas e AdobeRGB
+ teclado muito bom
+ muitos portos
+ Thunderbolt 4 , Wi-Fi 6, e PCIe 4.0

Contra

- ventilador errático sob carga baixa
- vida medíocre da bateria

Veredicto - MSI oferece muito desempenho

Em revisão: MSI WE76. Dispositivo de teste fornecido pela MSI Alemanha.

Com o WE76, a MSI oferece claramente uma estação de trabalho móvel tradicional que oferece muito desempenho e compete diretamente com modelos como o Dell Precision 7770, o HP ZBook Fury 17e o Lenovo ThinkPad P17 Gen 2. A mobilidade desempenha apenas um papel secundário nestes dispositivos, e o foco é o desempenho, que é onde a estação de trabalho MSI se sobressai.

O fato de o fabricante ter usado um laptop para jogos (GE76), pois sua referência não é um problema para nós. A iluminação extensiva foi omitida e também não há modelos de display 360 Hz, o que não caberia de forma alguma dado o grupo alvo. Em vez disso, há um painel mate 4K com cores precisas, uma cobertura quase completa de AdobeRGB e 120 Hz, o que também resulta em uma impressão de imagem visivelmente mais suave no uso diário. Além disso, há um teclado muito bom, incluindo um teclado numérico dedicado.

Em particular, o desempenho do profissionalNvidia RTX A5000 (antiga placa gráfica Quadro) é totalmente convincente. O desempenho do processador também é muito bom, embora deva ser dito aqui que as CPUs móveis da AMD são atualmente melhores, mas ainda não foram implementadas nas estações de trabalho (isto é verdade para todos os fabricantes).

Placa gráfica extremamente rápida, alto desempenho do sistema, visor mate 4K e ótimo teclado: O MSI WE76 é uma estação de trabalho móvel que se concentra principalmente no desempenho.

O comportamento dos ventiladores é um dos poucos pontos fracos, pois muitas vezes eles entram em ação mesmo durante o uso diário normal, o que os faz parecer um pouco erráticos. O modo silencioso opcional é recomendado aqui, pois mantém o dispositivo muito mais silencioso. Sob carga, porém, o volume máximo do ventilador é perfeitamente competitivo e não é excessivamente alto.

Os usuários que precisam de desempenho máximo não errarão com o WE76, e a MSI também tem vantagens sobre os contendores acima mencionados aqui. Os modelos ligeiramente menores, de 16 polegadas (os PensePad P1 Gen 4ou oAsus ProArt StudioBook 16por exemplo) são reconhecidamente mais compactos e mais móveis, mas também oferecem menos desempenho em troca.

Download your licensed rating image as SVG / PNG

Preço e disponibilidade

No momento de escrever, você pode encontrar o MSI WE76 com o Core i9-11980HK, o Quadro RTX A5000, 64 GB de RAM, um SSD NVME de 1 TB e o Windows 10 Pro em Amazon a partir de cerca de 4.300 dólares.

MSI WE76 11UM-456 - 12/06/2021 v7
Andreas Osthoff

Acabamento
79 / 98 → 81%
Teclado
91%
Mouse
78%
Conectividade
71 / 80 → 89%
Peso
57 / 10-66 → 84%
Bateria
70 / 95 → 73%
Pantalha
93%
Desempenho do jogos
97%
Desempenho da aplicação
96%
Temperatura
84 / 95 → 88%
Ruído
84 / 90 → 93%
Audio
79%
Camera
33 / 85 → 39%
Médio
79%
89%
Workstation - Médio equilibrado

Pricecompare

Please share our article, every link counts!
> Análises e revisões de portáteis e celulares > Análises > Análises > MSI WE76 em revisão: Estação de trabalho móvel vai para o máximo desempenho
Andreas Osthoff, 2021-12- 8 (Update: 2021-12- 8)