Asus ProArt StudioBook Pro 16 W7600 laptop em revisão: Estação de trabalho potente e leve
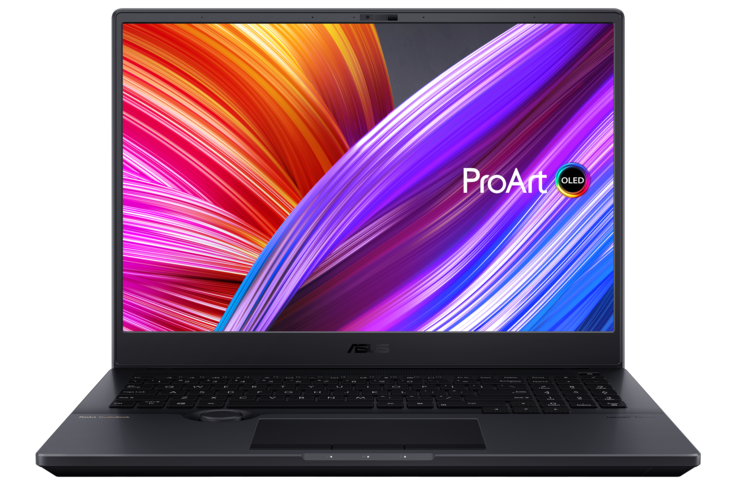
Com o ProArt Studiobook Pro 16, a Asus apresenta uma nova série de cadernos para profissionais criativos. O notebook criador apresenta um display OLED HDR 4K com formato 16:10, o que oferece assim uma superfície de trabalho maior. Além disso, há um Discador Asus, que pode ser usado para controlar uma variedade de ferramentas criativas e, portanto, é suposto simplificar o trabalho dos designers. O fabricante destaca as grandes armas em termos de equipamento, pois não só a CPU Xeon de terceira geração da Intel está a bordo, mas também a GPU da estação de trabalho Nvidia RTX A5000. A série é, portanto, destinada a usuários profissionais e deve lidar com tarefas complexas como renderização 3D ou edição de vídeo de alta resolução. Como a unidade de teste que nos foi fornecida pela Asus Alemanha é uma pré-amostra, o dispositivo ainda não recebe uma classificação da nossa parte.
Os concorrentes incluem o HP ZBook Fury 15 G8, que é uma estação de trabalho idêntica, assim como o HP ZBook Studio 15 G8 e o Dell Precision 5560
Possible competitors in comparison
Avaliação | Data | Modelo | Peso | Altura | Size | Resolução | Preço |
|---|---|---|---|---|---|---|---|
v (old) | 12/2021 | Asus ProArt StudioBook 16 W7600H5A-2BL2 W-11955M, RTX A5000 Laptop GPU | 2.4 kg | 21.4 mm | 16.00" | 3840x2400 | |
| 90.3 % v7 (old) | 10/2021 | HP ZBook Fury 15 G8 i9-11950H, RTX A5000 Laptop GPU | 2.5 kg | 25.9 mm | 15.60" | 3840x2160 | |
| 87.8 % v7 (old) | 08/2021 | HP ZBook Studio 15 G8 i9-11950H, GeForce RTX 3070 Laptop GPU | 1.9 kg | 18 mm | 15.60" | 3840x2160 | |
| 88.3 % v7 (old) | 10/2021 | Dell Precision 5000 5560 i7-11850H, RTX A2000 Laptop GPU | 2 kg | 18 mm | 15.60" | 3840x2400 |
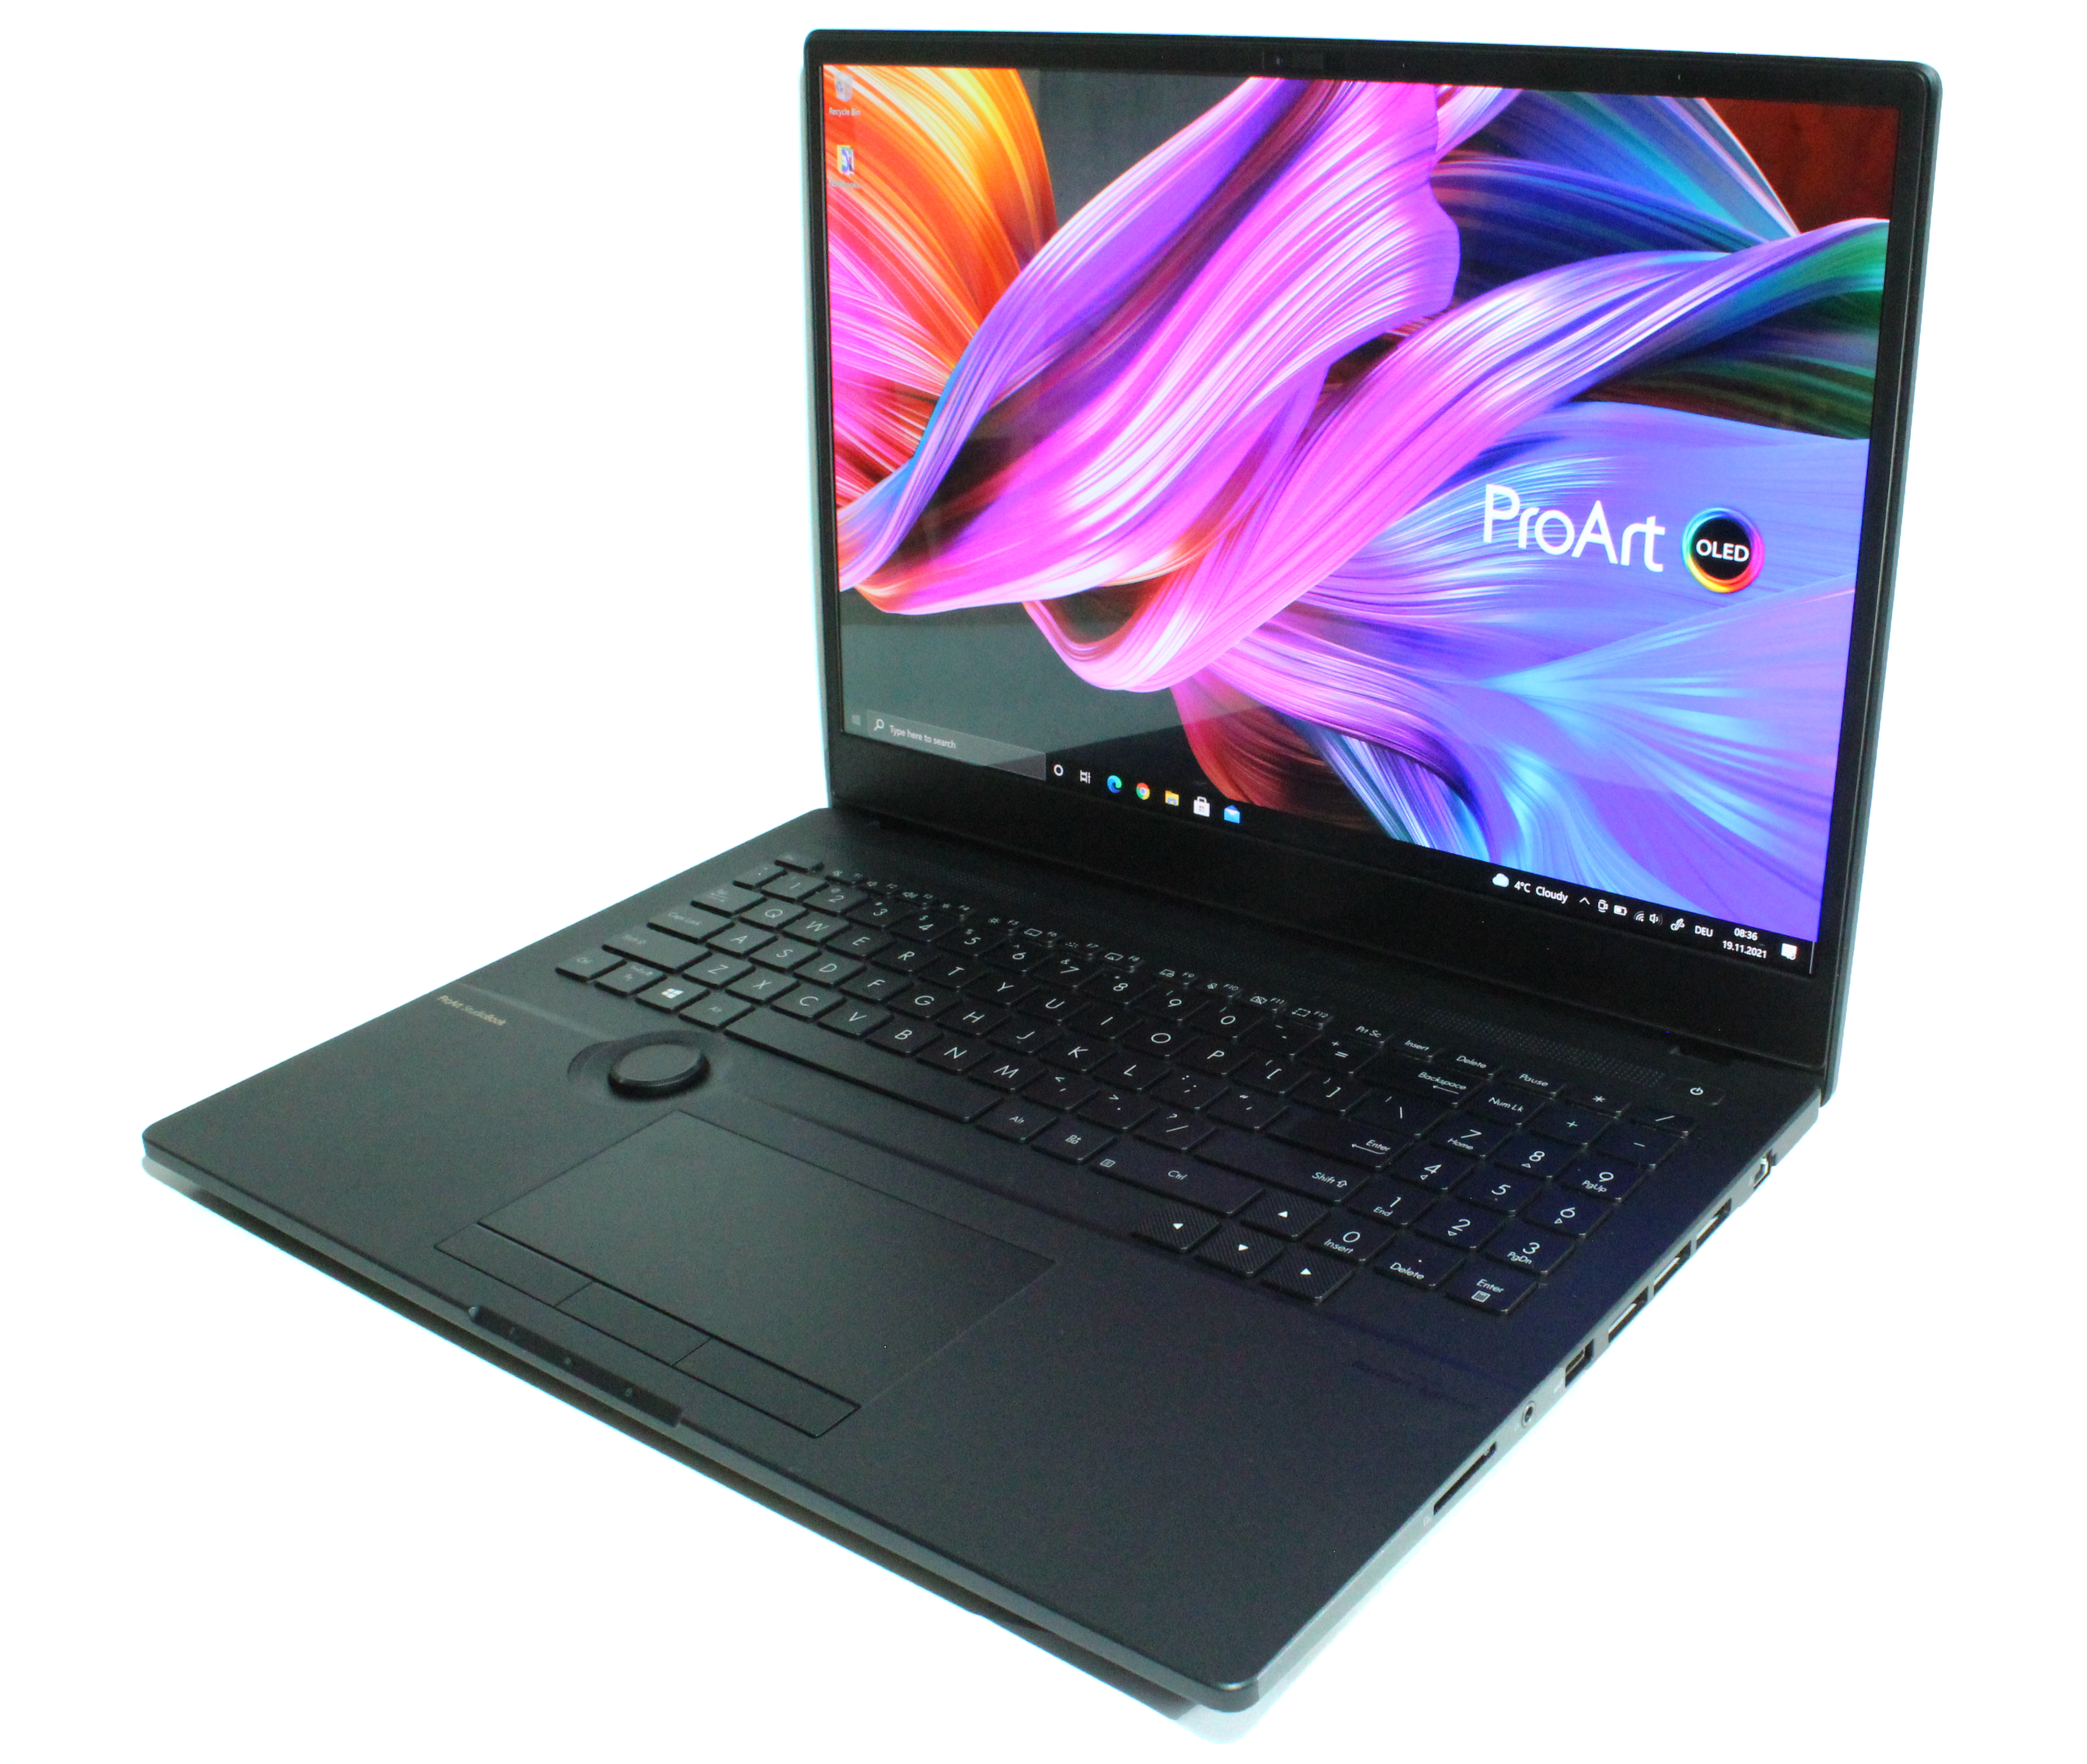
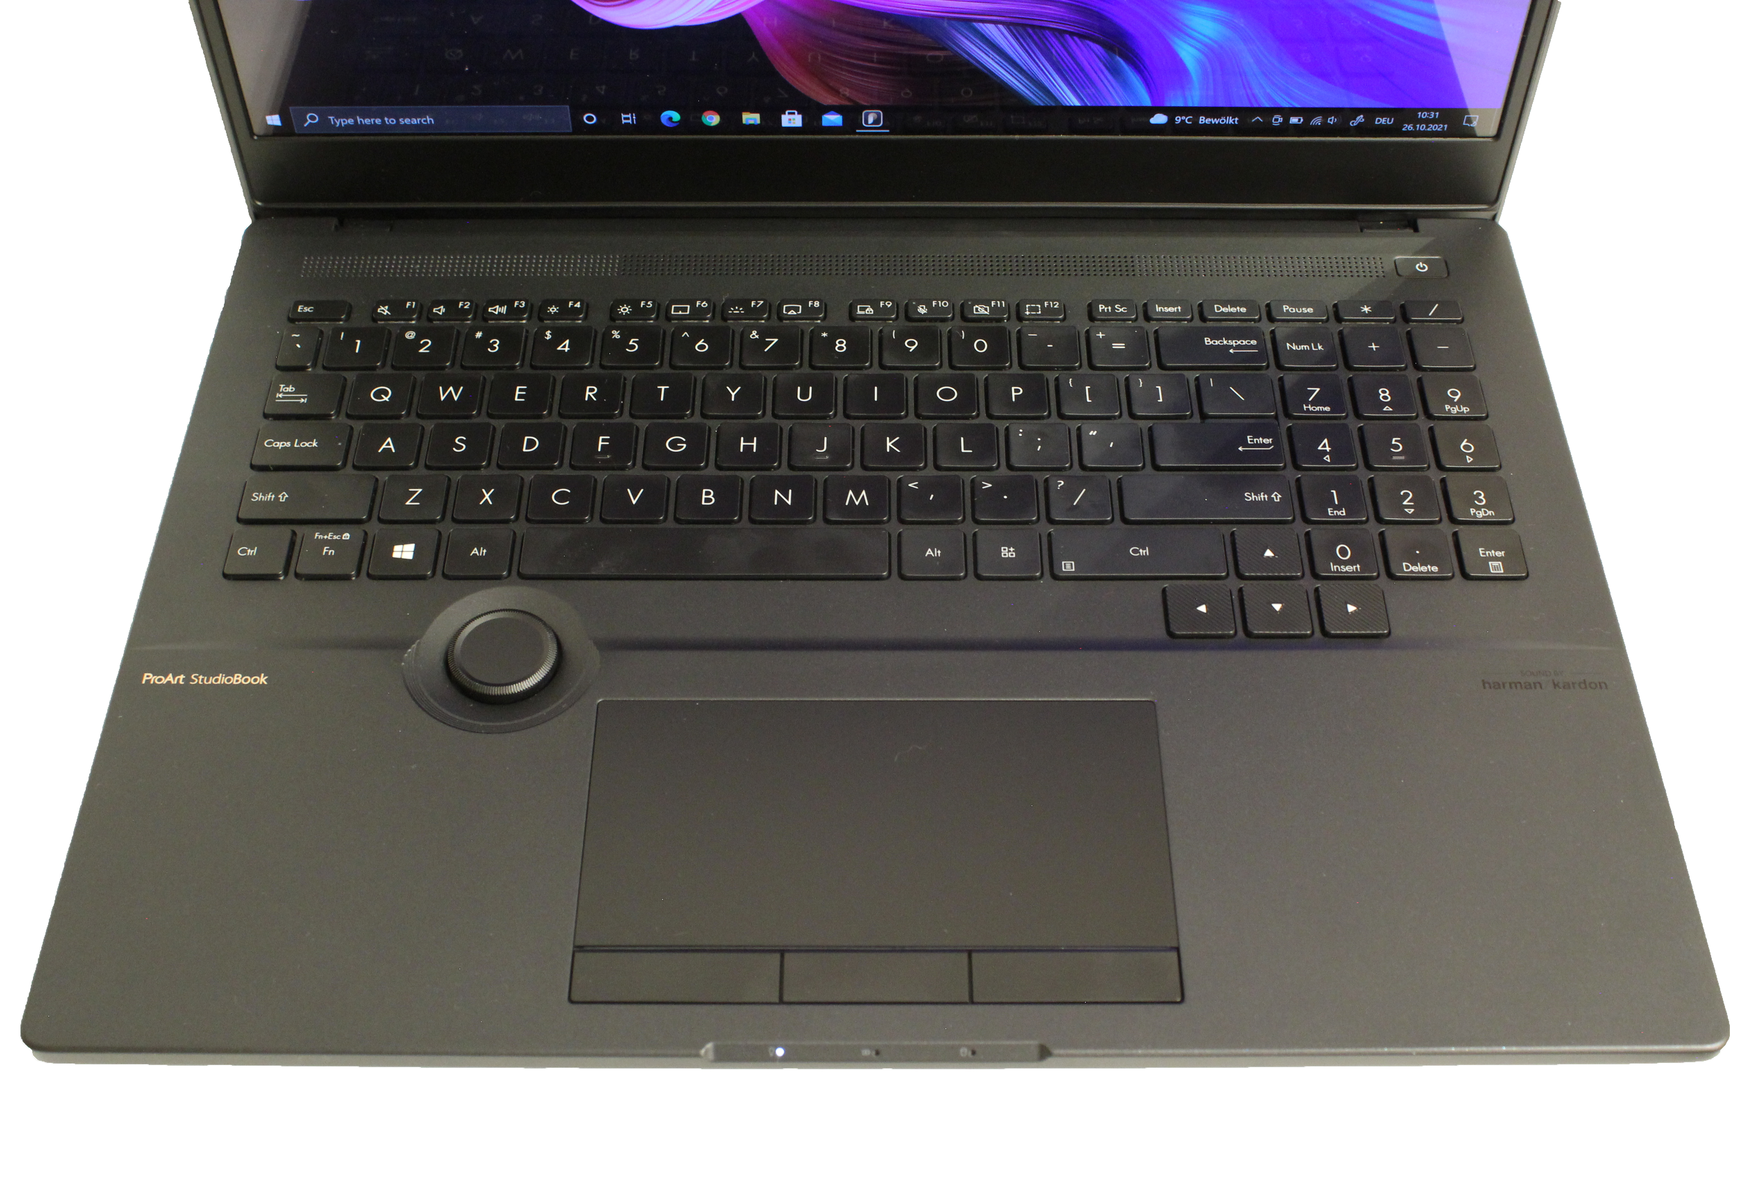
Caso
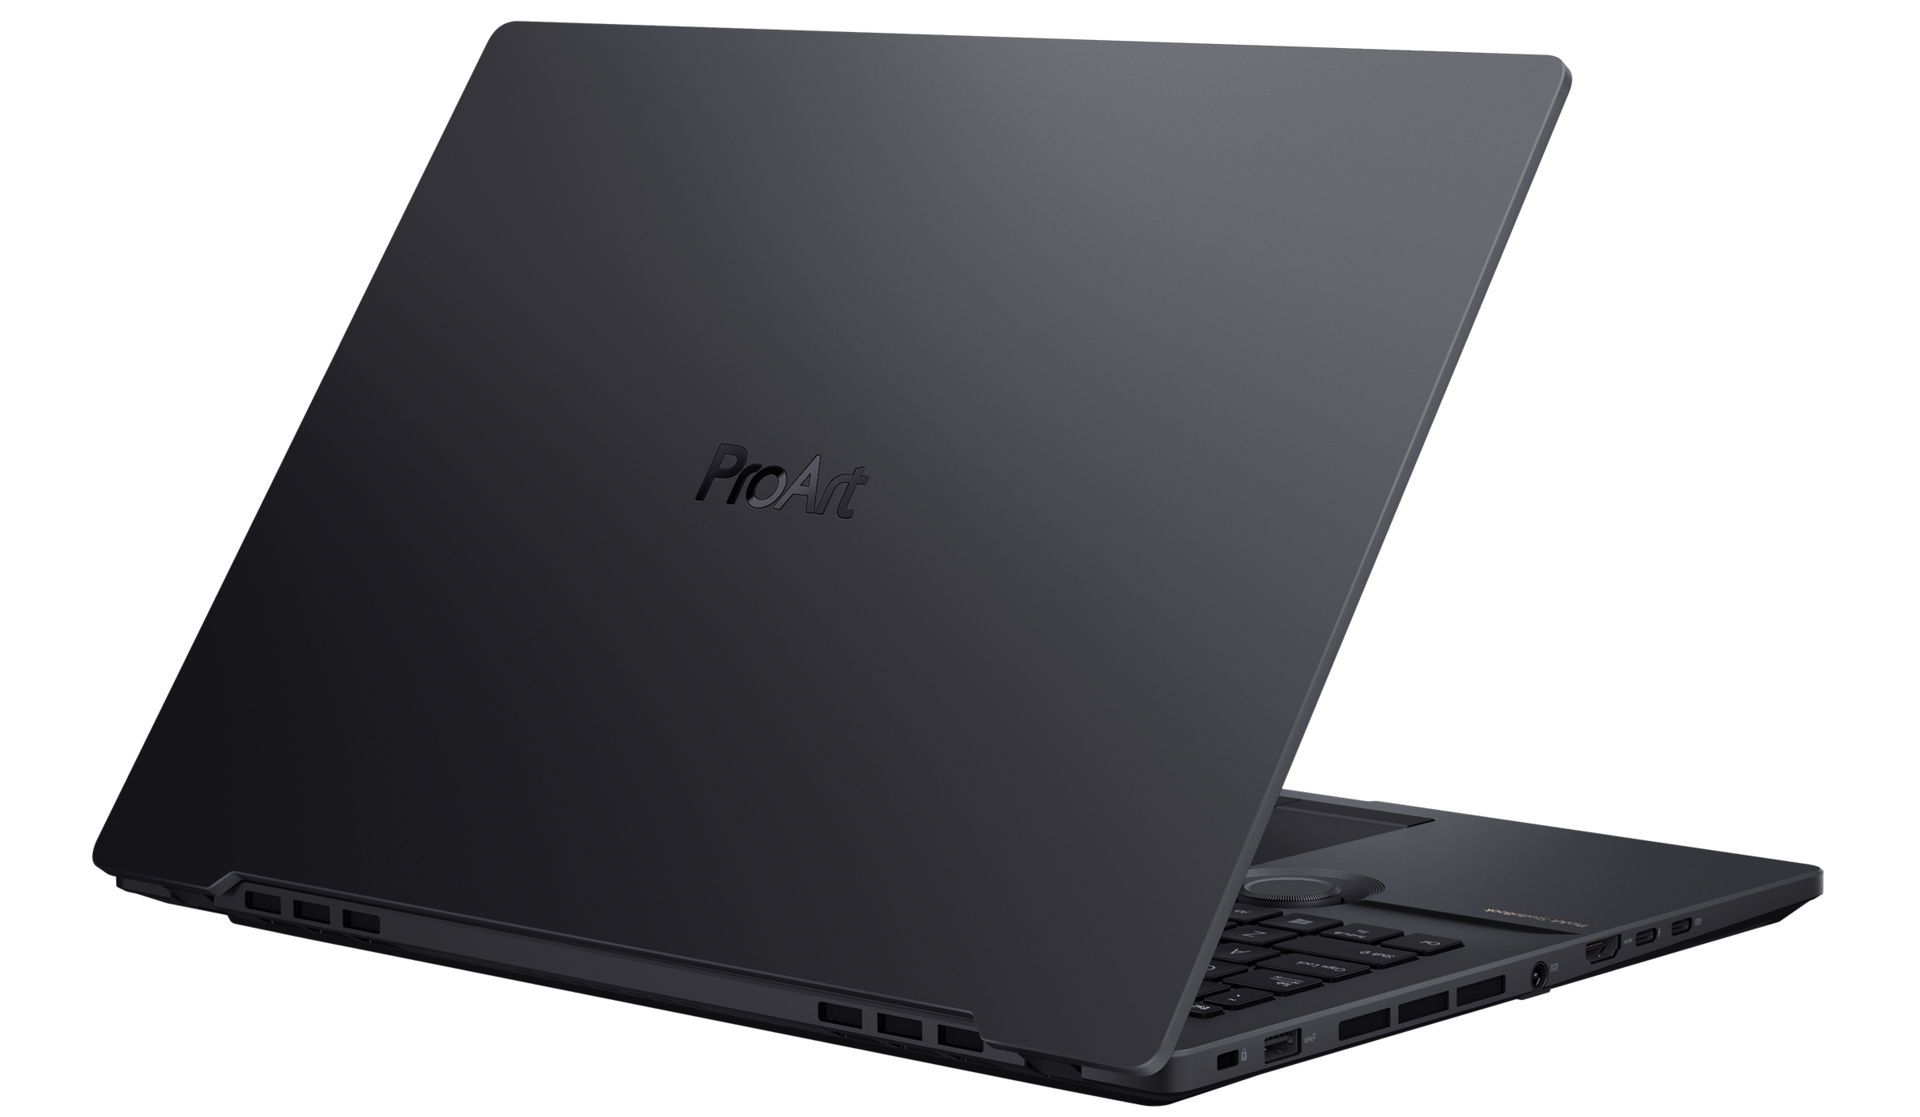
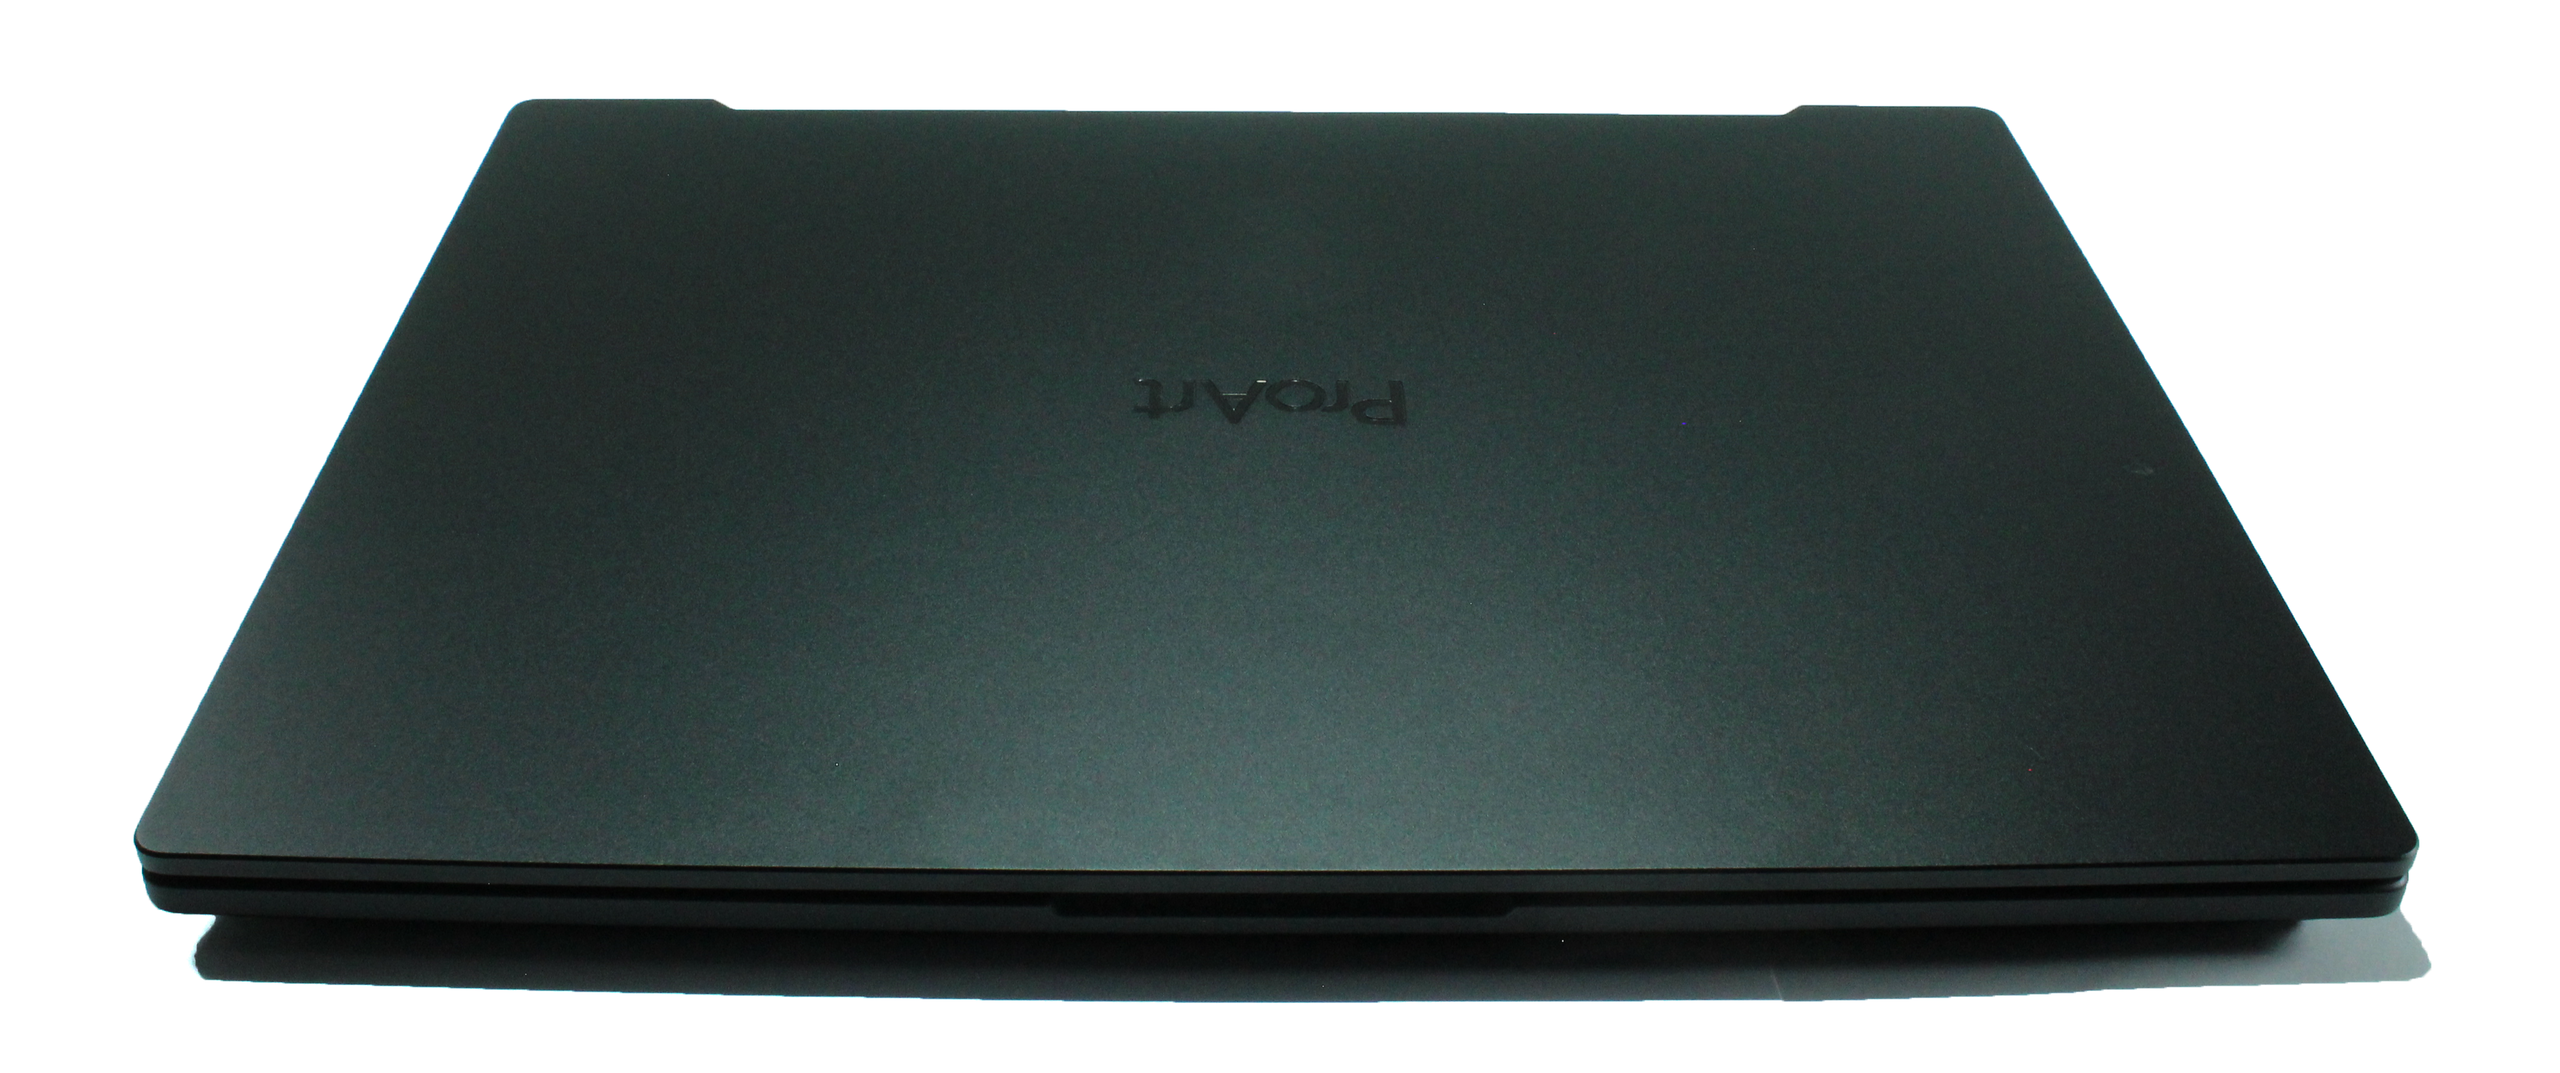
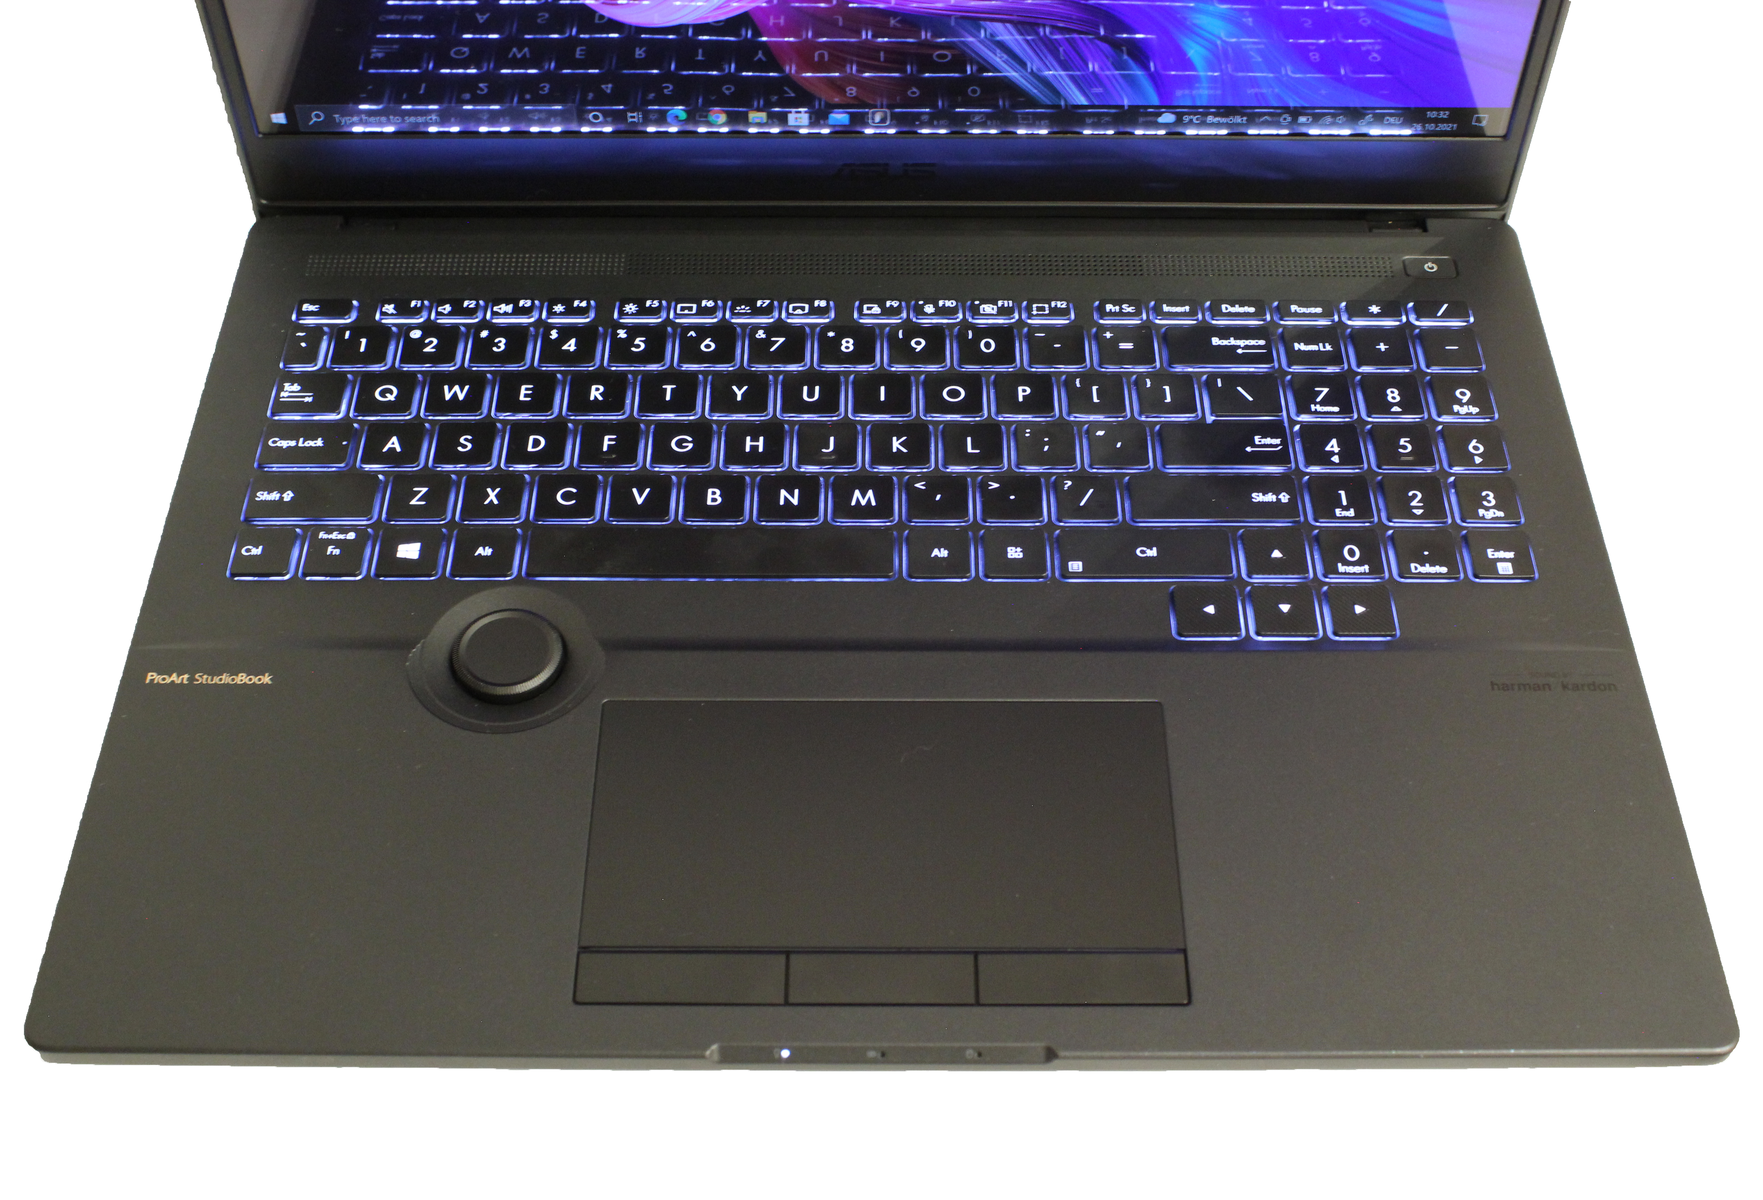
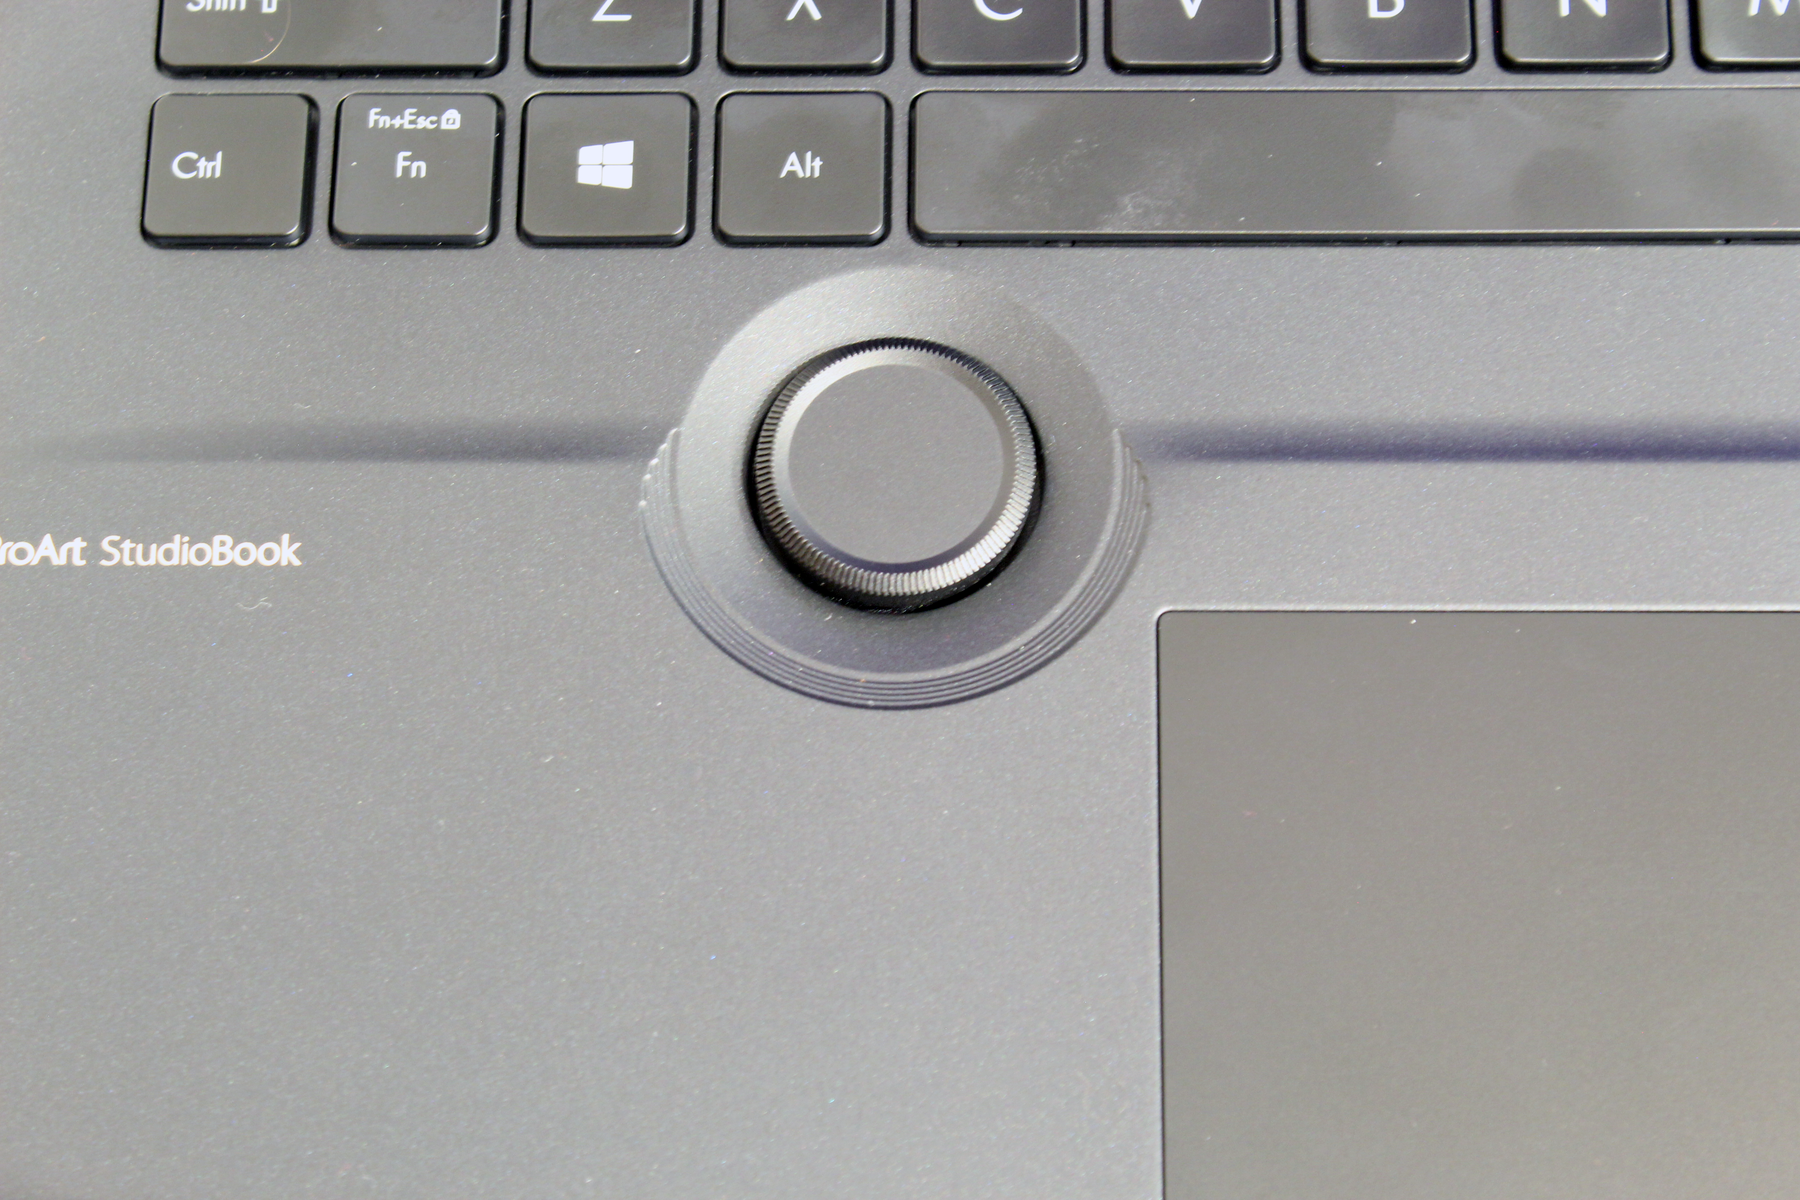
O caso do Asus ProArt StudioBook 16 é muito robusto e com 2,4 kg é relativamente leve para seu tamanho. A caixa é feita de metal com liga de magnésio revestida, o que lhe confere uma superfície fosca, brilhante e também mais áspera. Uma característica especial do dispositivo é o Controlador de Discagem Asus, que está embutido ao lado do trackpad e pode, por exemplo, tornar particularmente preciso o controle de algumas funções em programas de edição de imagem e vídeo. Além disso, o Controlador de Discagem Asus pode ser usado para ajuste mais rápido do brilho ou volume do sistema. O design do Asus ProArt StudioBook 16 é decente e fica muito bem com a disposição do teclado, trackpad e Asus Dial. O que também se destaca no estojo são os pés altos, que supostamente proporcionam ao usuário mais conforto ao digitar. Estes pés mais altos fazem com que o teclado seja mais alto do que o apoio da palma da mão. O Asus também fez um recesso no centro posterior do suporte que permite a passagem de mais ar fresco, a fim de otimizar o resfriamento do dispositivo.
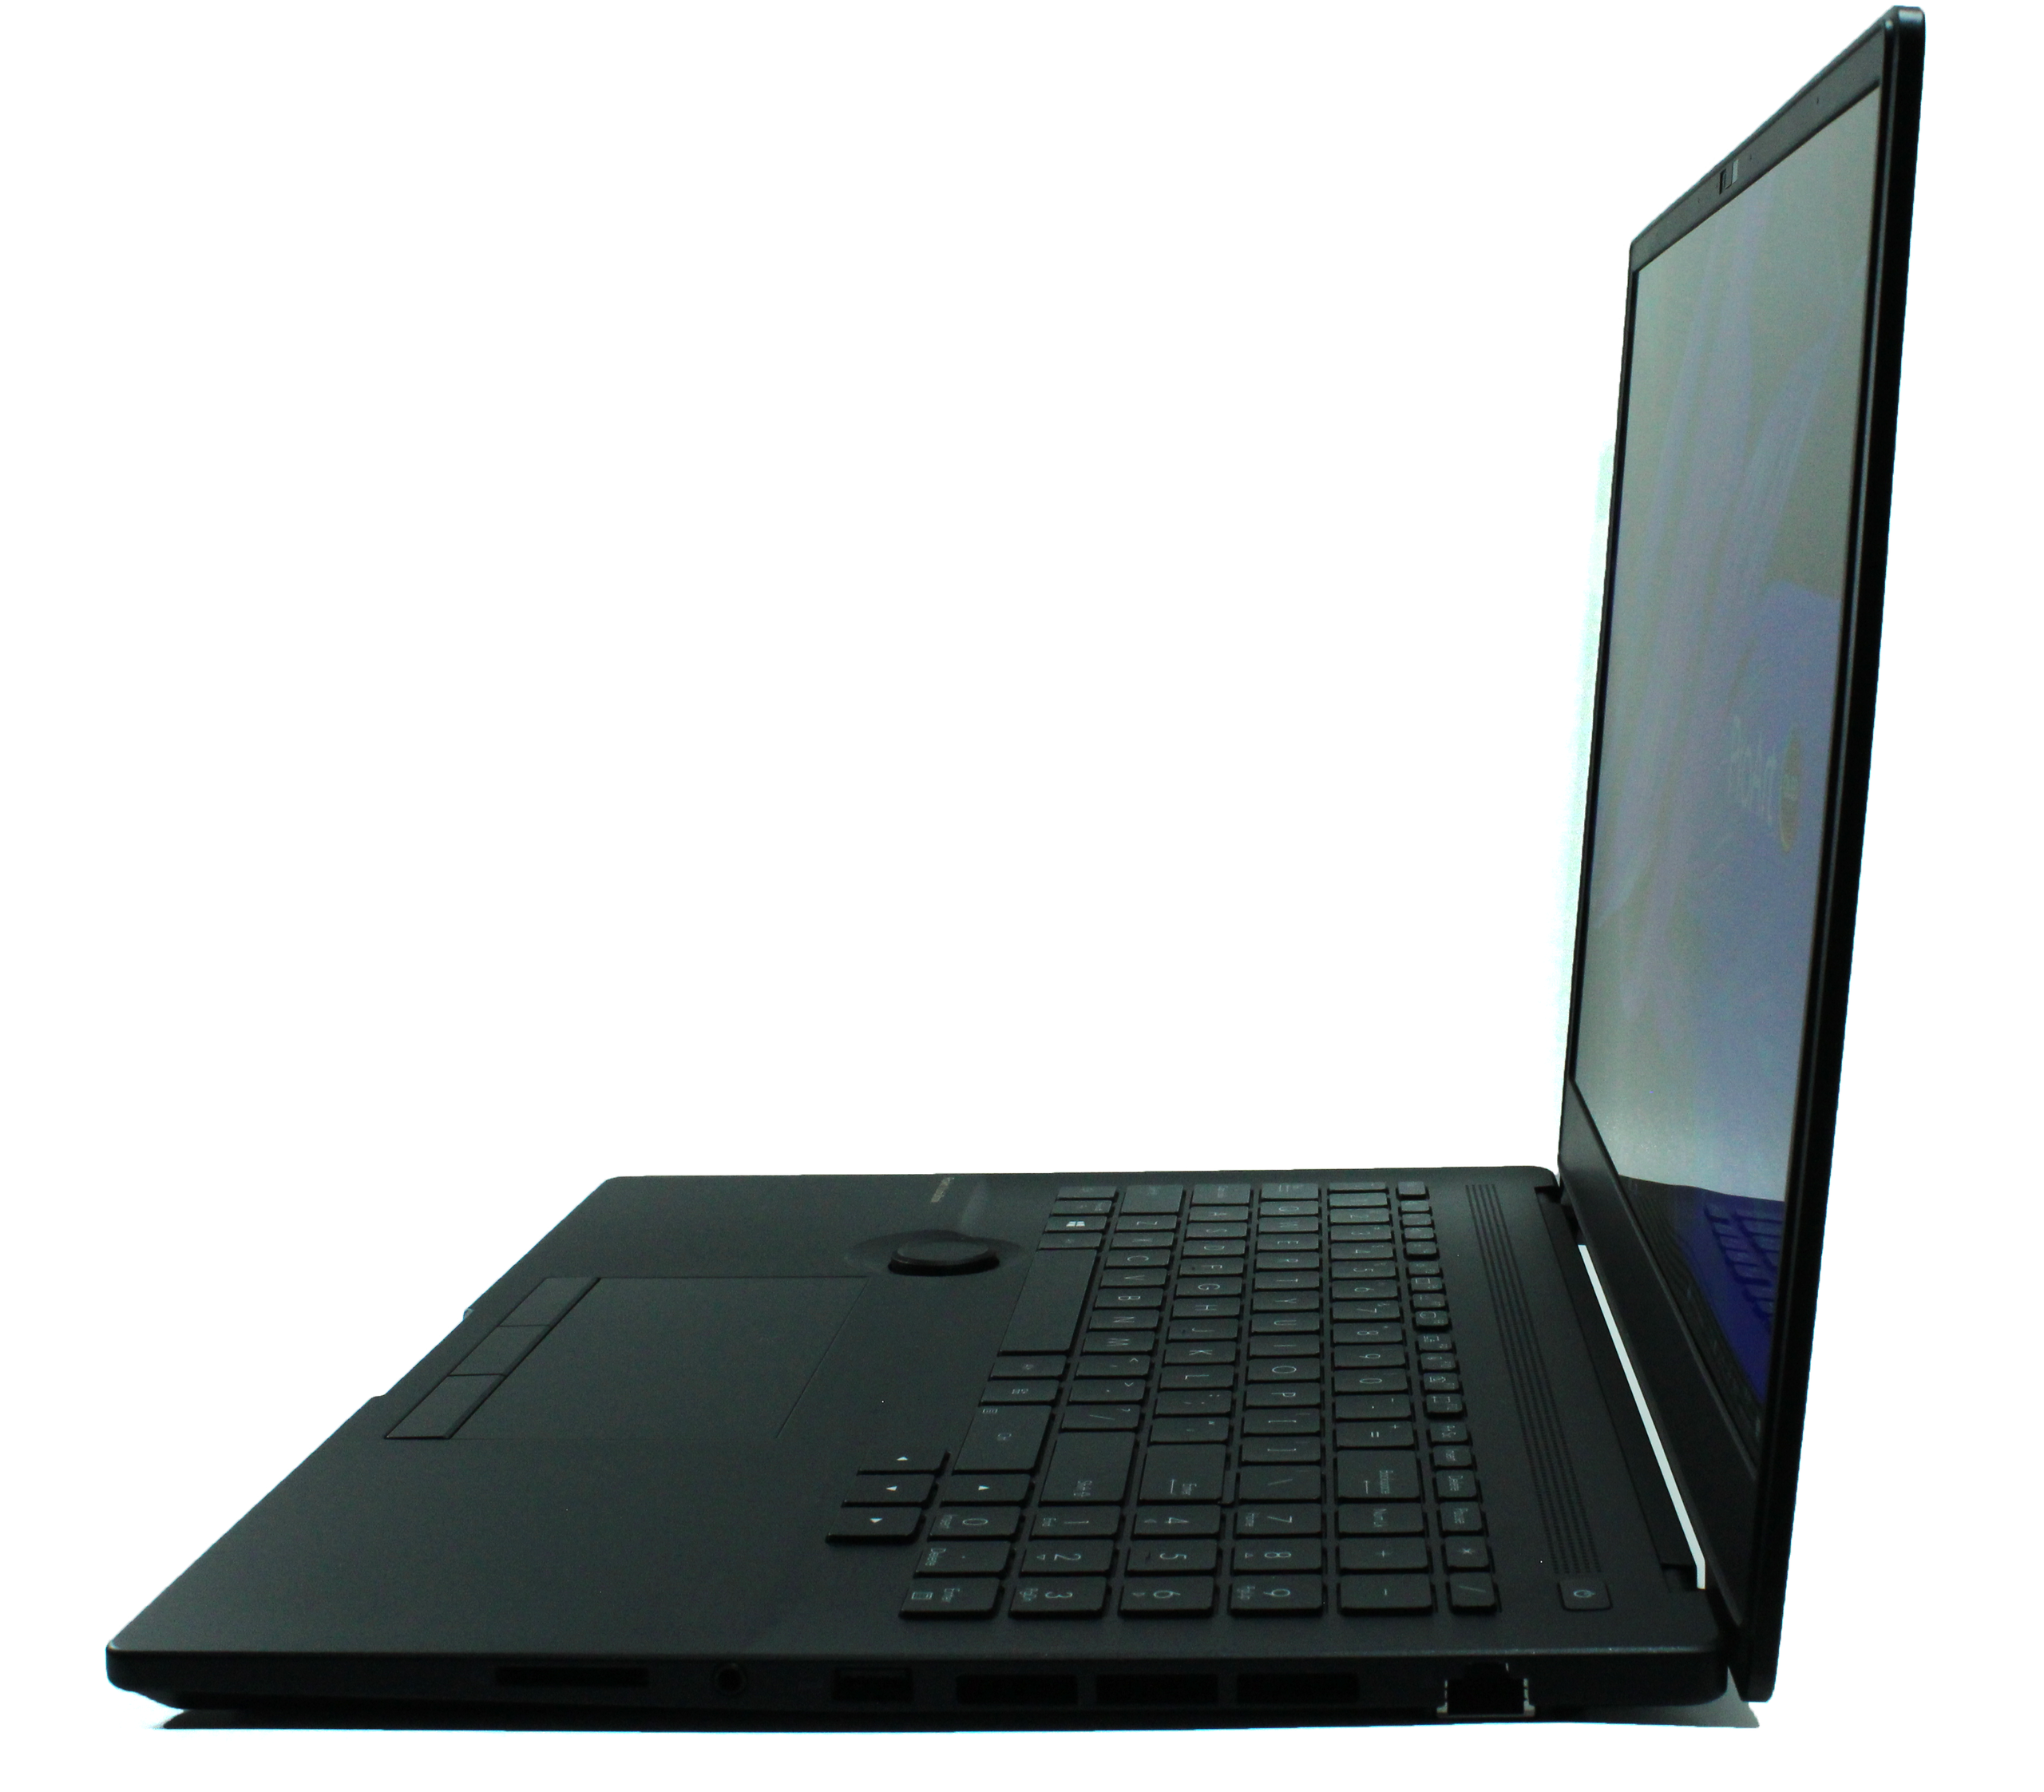
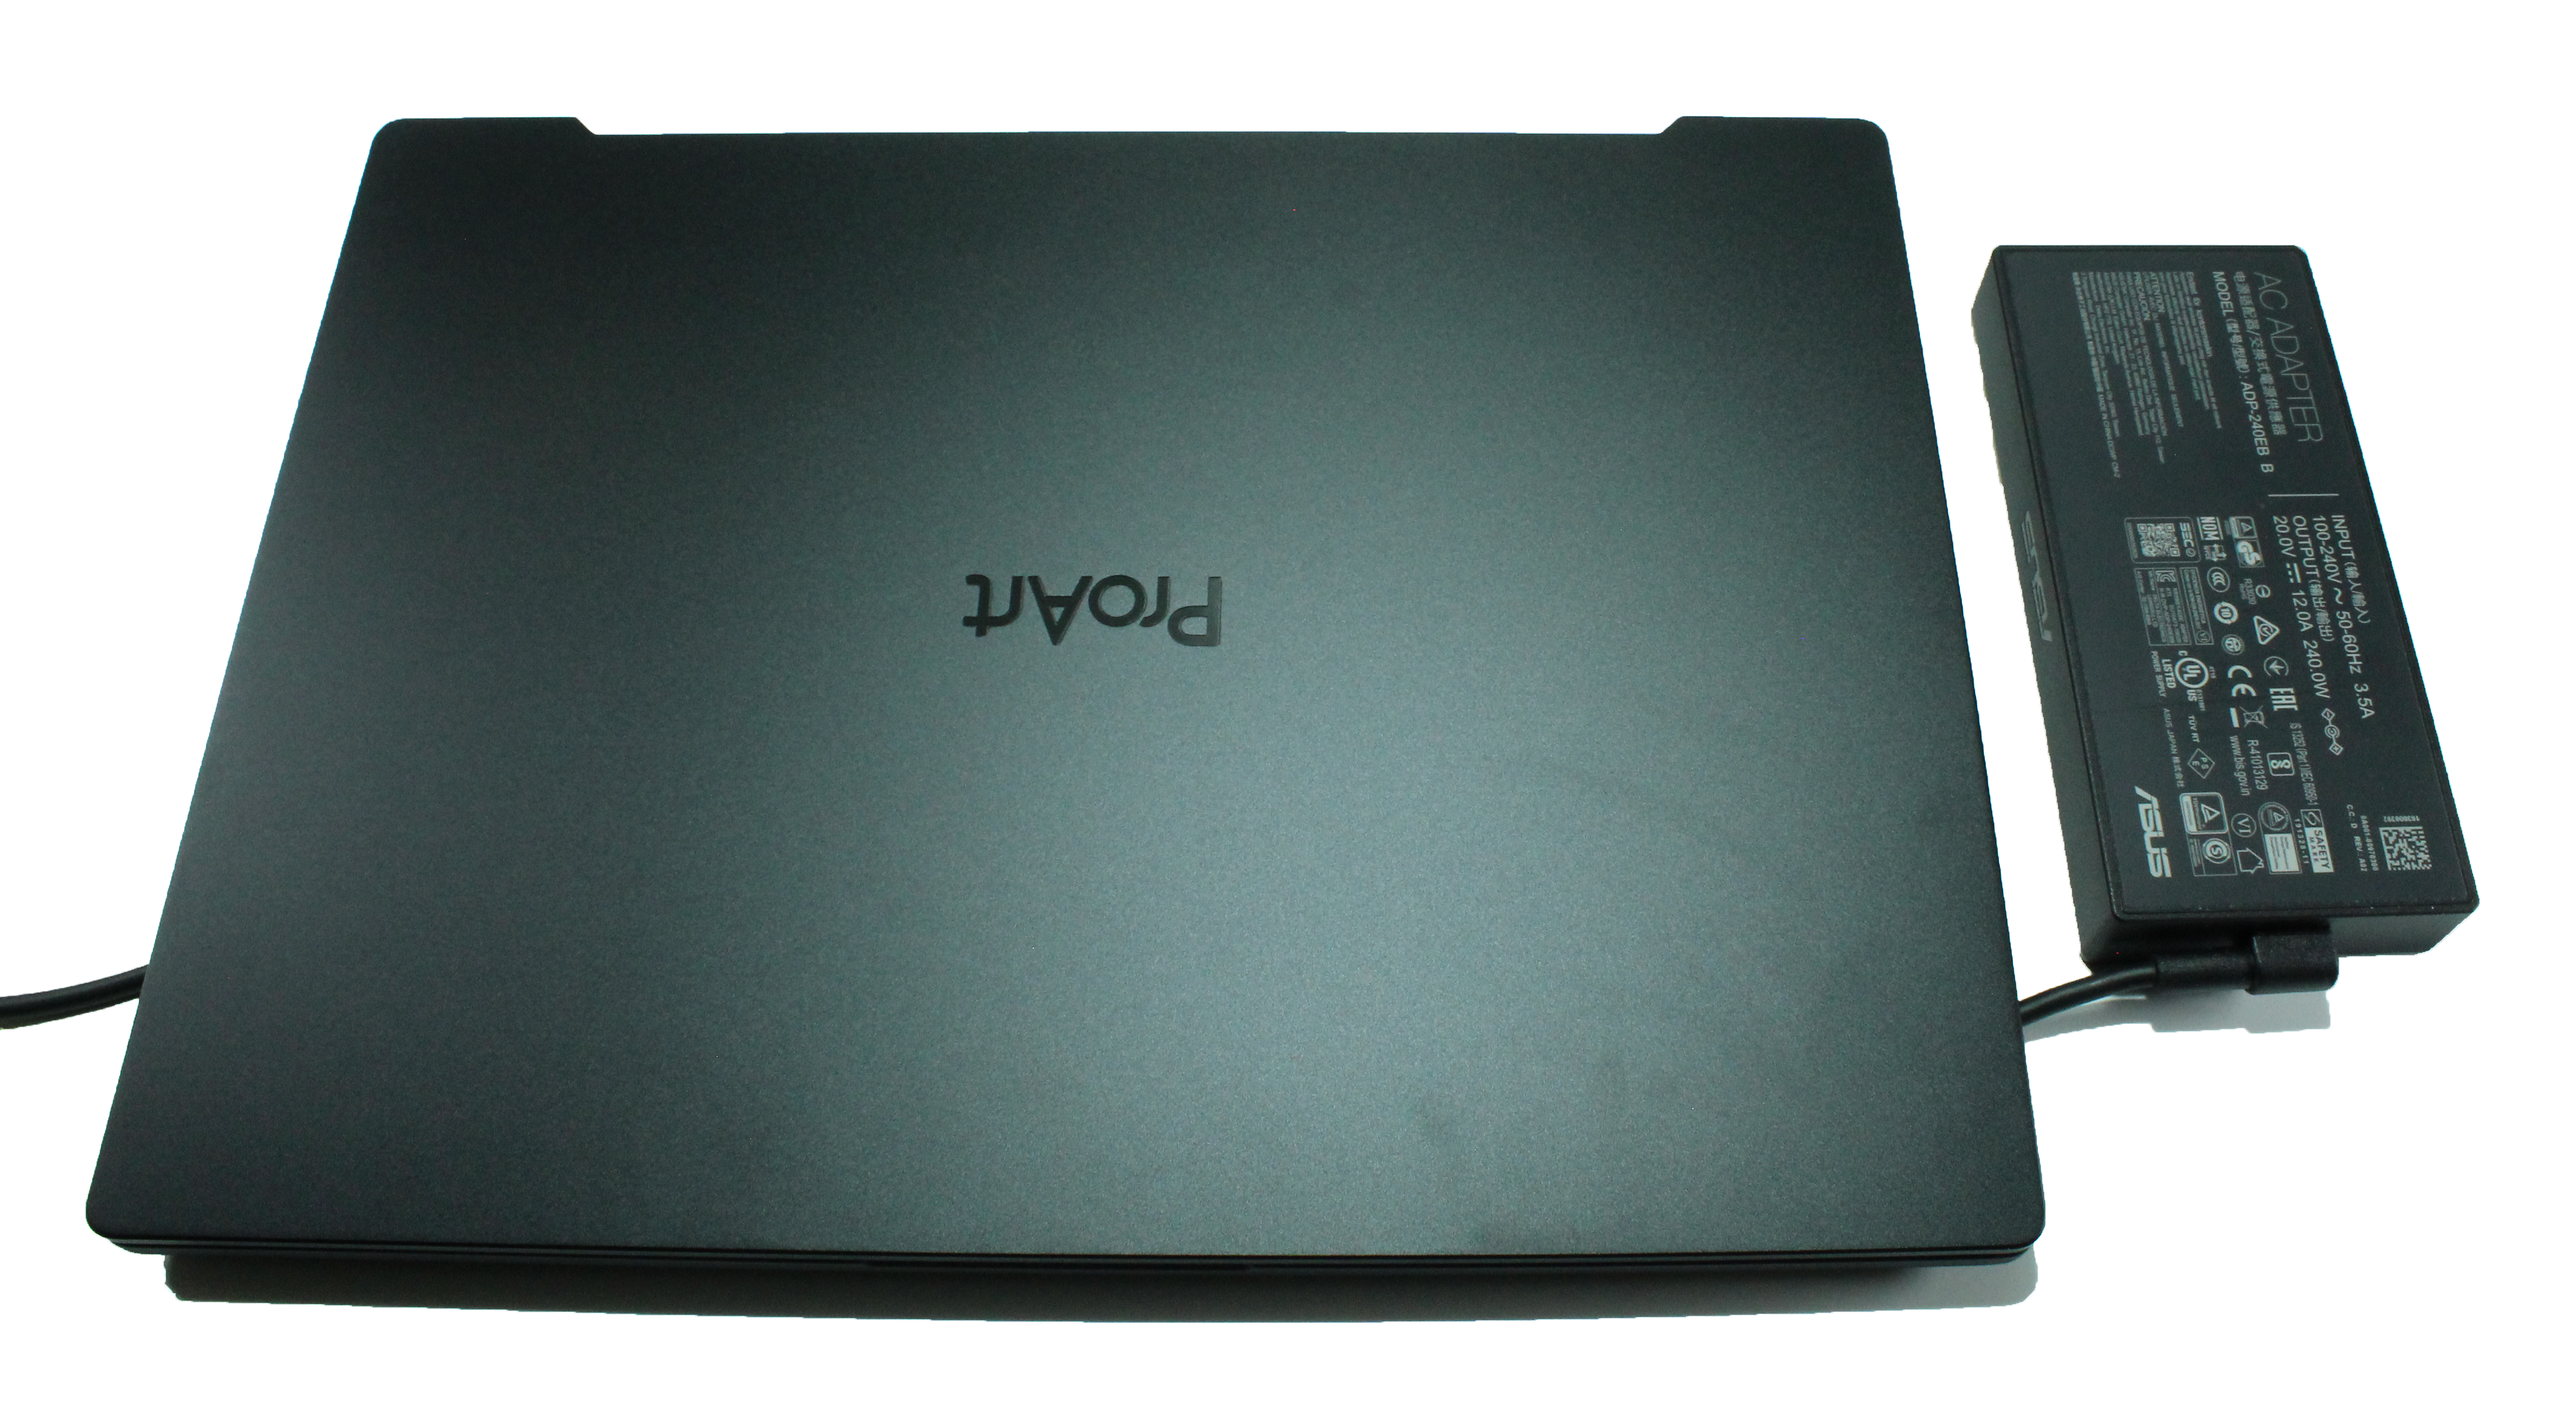
Com sua tela de 16 polegadas e uma altura total de apenas 2,1 centímetros, o Asus ProArt StudioBook é surpreendentemente fino. Enquanto o HP ZBook Fury com seu display menor é ligeiramente mais estreito por fora, é quase meio centímetro mais alto do que nosso dispositivo. Além do ZBook Fury, todos os rivais estão claramente à frente em termos de peso.
Equipamento
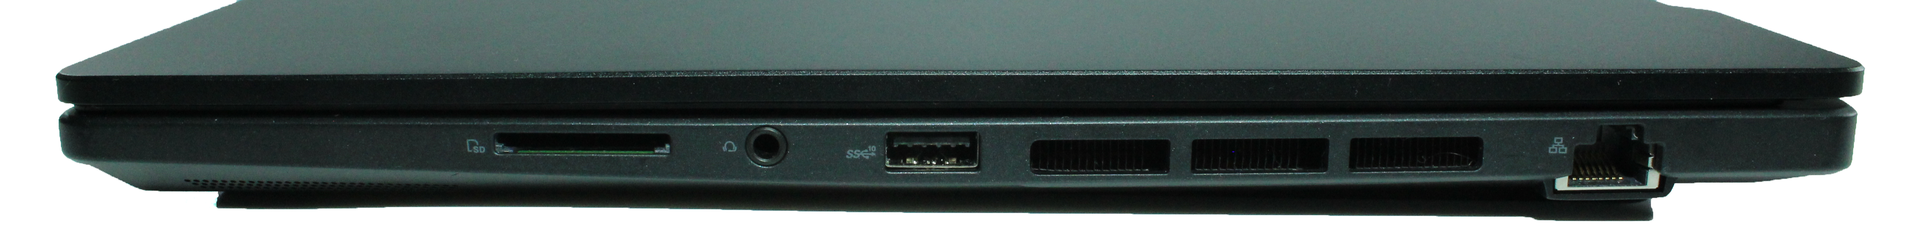
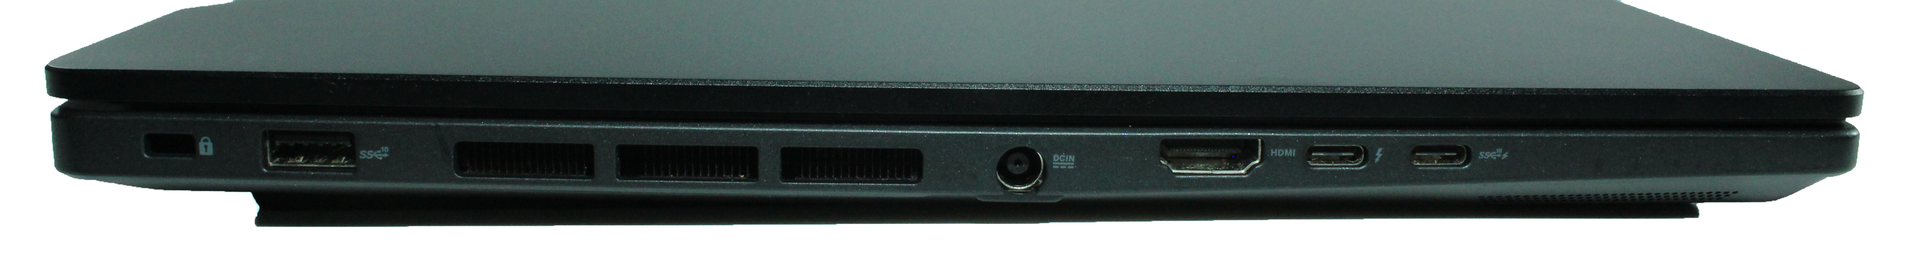
As portas do notebook são distribuídas em dois lados: no lado esquerdo, há a fechadura Kensington, USB-A 3.2 Gen.2, o conector de alimentação, HDMI 2.1, Thunderbolt 4, e uma porta USB-C 3.2 Gen 2, além das aberturas de ar do sistema de resfriamento. As saídas de ar se estendem pelo lado direito como no lado esquerdo. Há também um leitor de cartões SD de tamanho completo, um conector combinado de 3,5 mm, USB-A 3.2 Gen.2 e Gigabit LAN no lado direito. Tanto o Thunderbolt 4 quanto a porta USB-C suportam o fornecimento de energia e permitem conectar um display cada um. As portas estão espaçadas o suficiente e não afetam o conforto do usuário quando todas as portas estão ocupadas. Somente as saídas de ar do sistema de resfriamento estão localizadas na parte de trás do notebook.
Leitor de cartões SD
A taxa de transferência do leitor de cartões SD integrado é inferior em nosso dispositivo de pré-produção. Mesmo a taxa média de transferência de dados não é alcançada com nosso cartão de memória de referência AV PRO 128 GB V60.
| SD Card Reader | |
| average JPG Copy Test (av. of 3 runs) | |
| Dell Precision 5000 5560 (AV Pro V60) | |
| Média da turma Workstation (49.6 - 681, n=14, últimos 2 anos) | |
| HP ZBook Fury 15 G8 (AV Pro V60) | |
| HP ZBook Studio 15 G8 (AV Pro V60) | |
| Asus ProArt StudioBook 16 W7600H5A-2BL2 (AV Pro SD microSD 128 GB V60) | |
| maximum AS SSD Seq Read Test (1GB) | |
| Média da turma Workstation (87.6 - 1455, n=14, últimos 2 anos) | |
| Dell Precision 5000 5560 (AV Pro V60) | |
| HP ZBook Studio 15 G8 (AV Pro V60) | |
| HP ZBook Fury 15 G8 (AV Pro V60) | |
| Asus ProArt StudioBook 16 W7600H5A-2BL2 (AV Pro SD microSD 128 GB V60) | |
Comunicação
O Intel Wi-Fi AX201 instalado em nosso dispositivo de pré-produção não pode explorar seu potencial de desempenho em nosso teste de desempenho e termina 20 a 60 por cento atrás da média.
Webcam
A qualidade da câmera da webcam 720p em nosso dispositivo de teste é muito ruim. Como a maioria dos concorrentes, ela carece de nitidez de imagem e precisão de cor

")
")


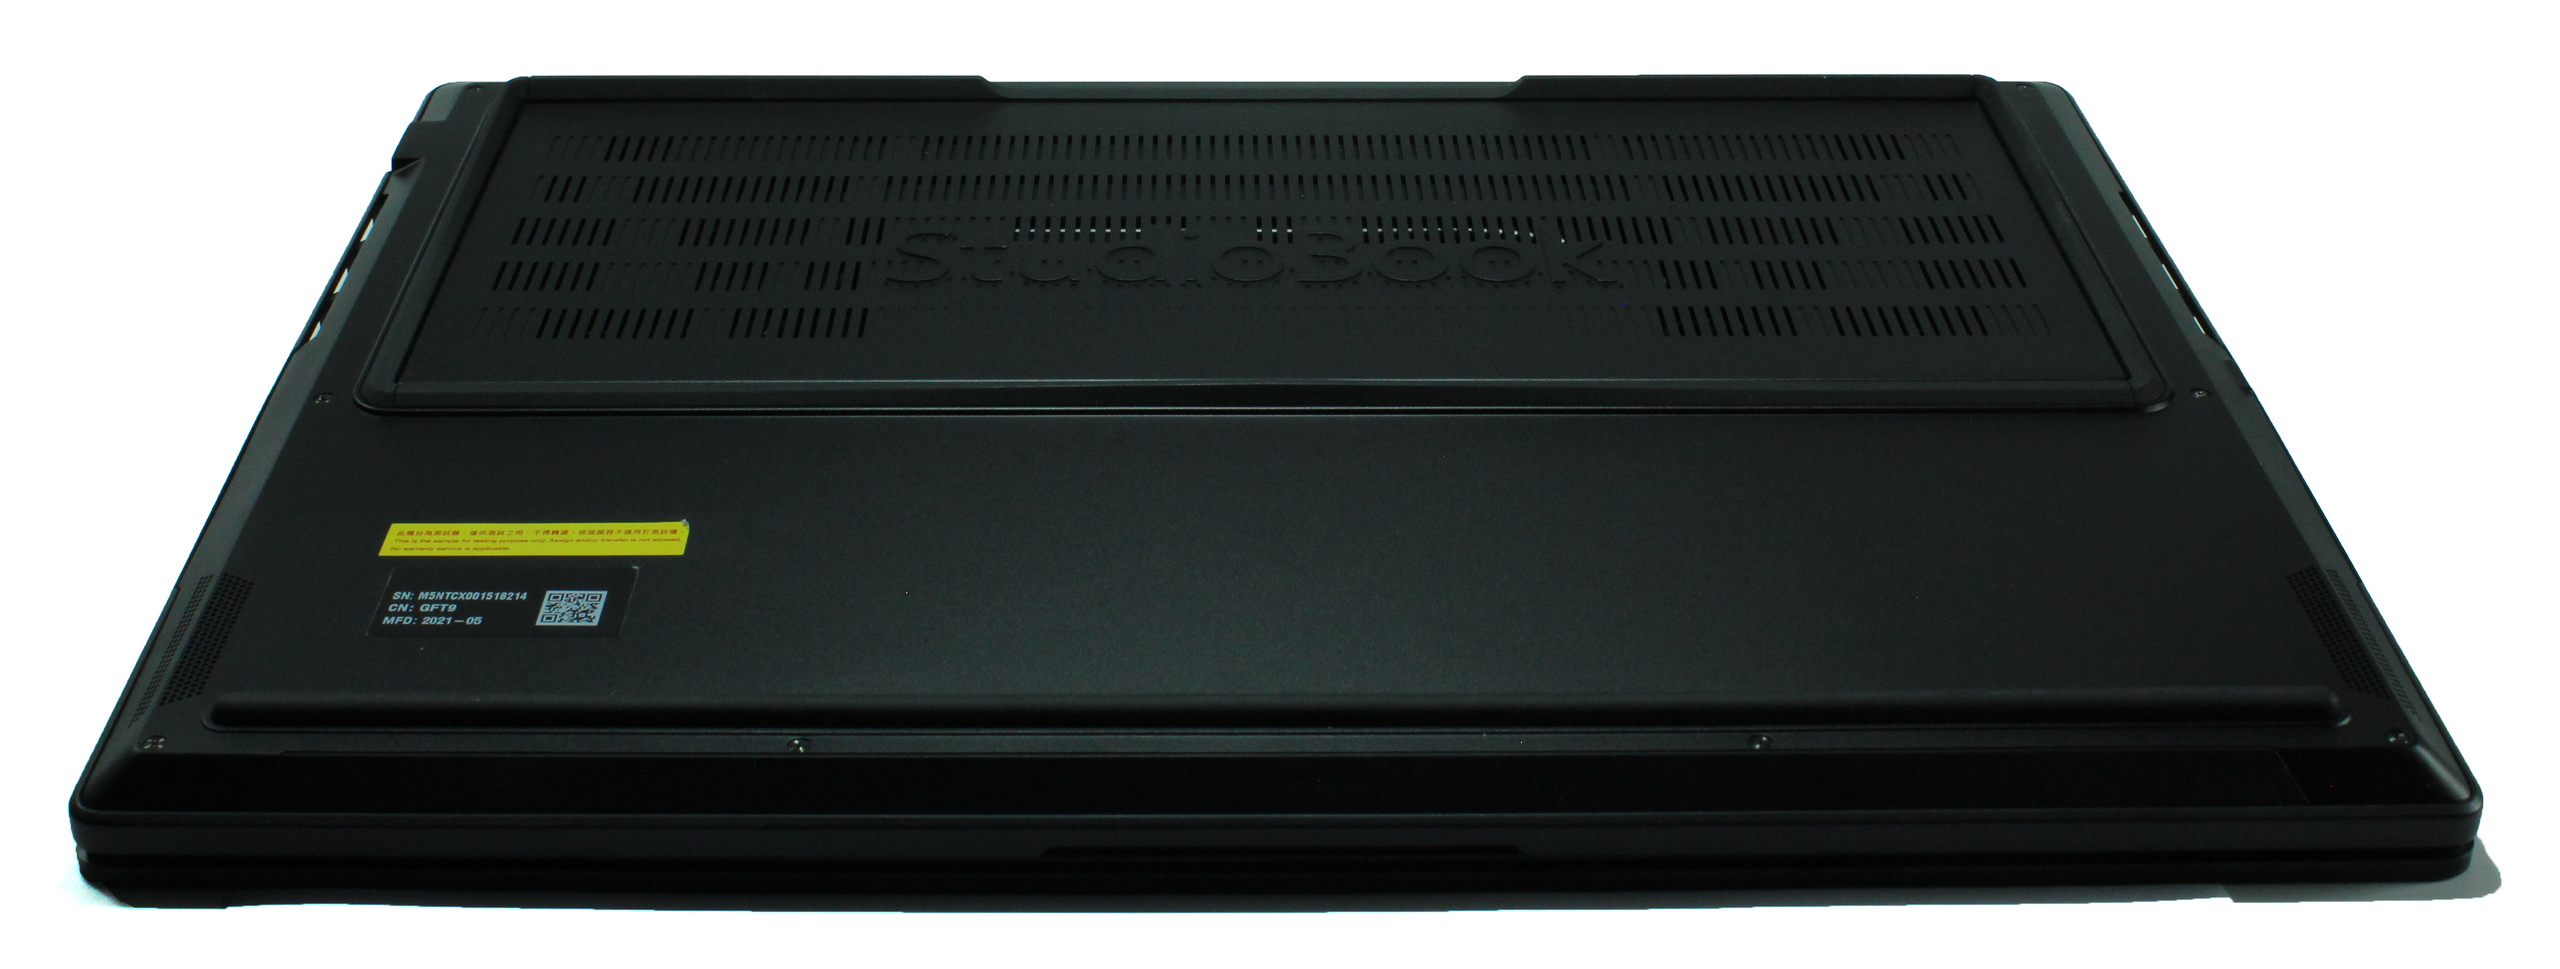
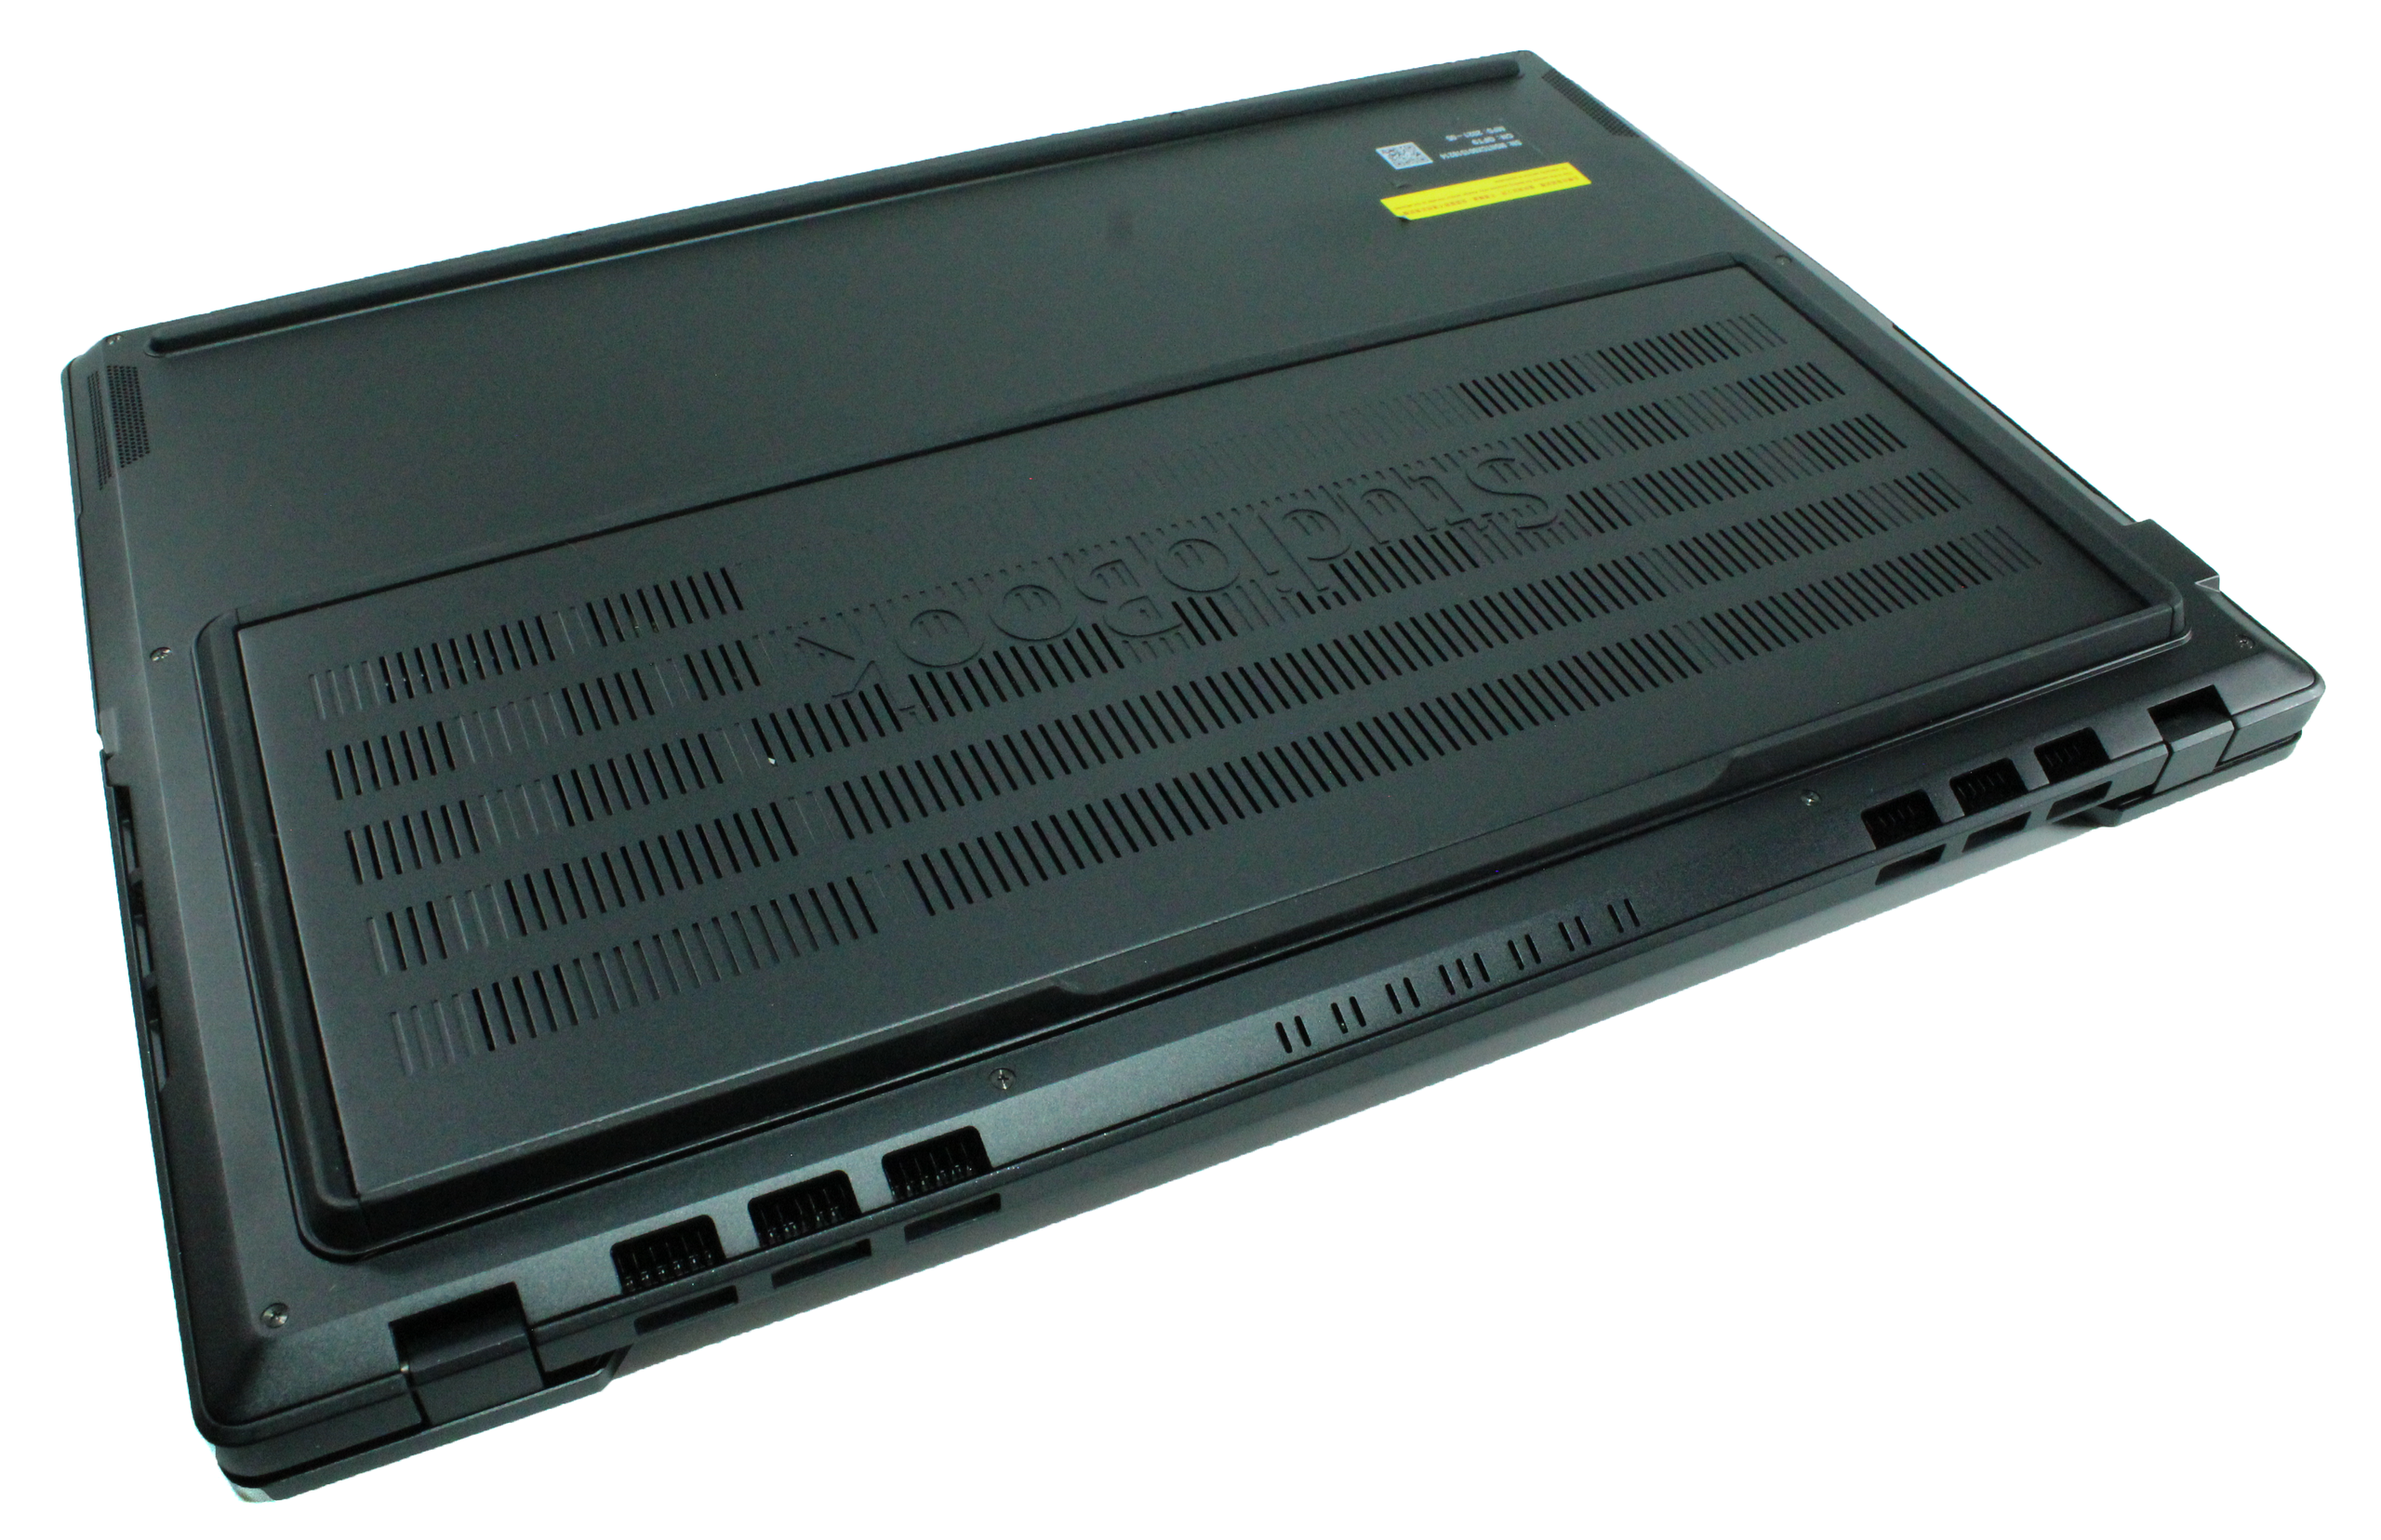
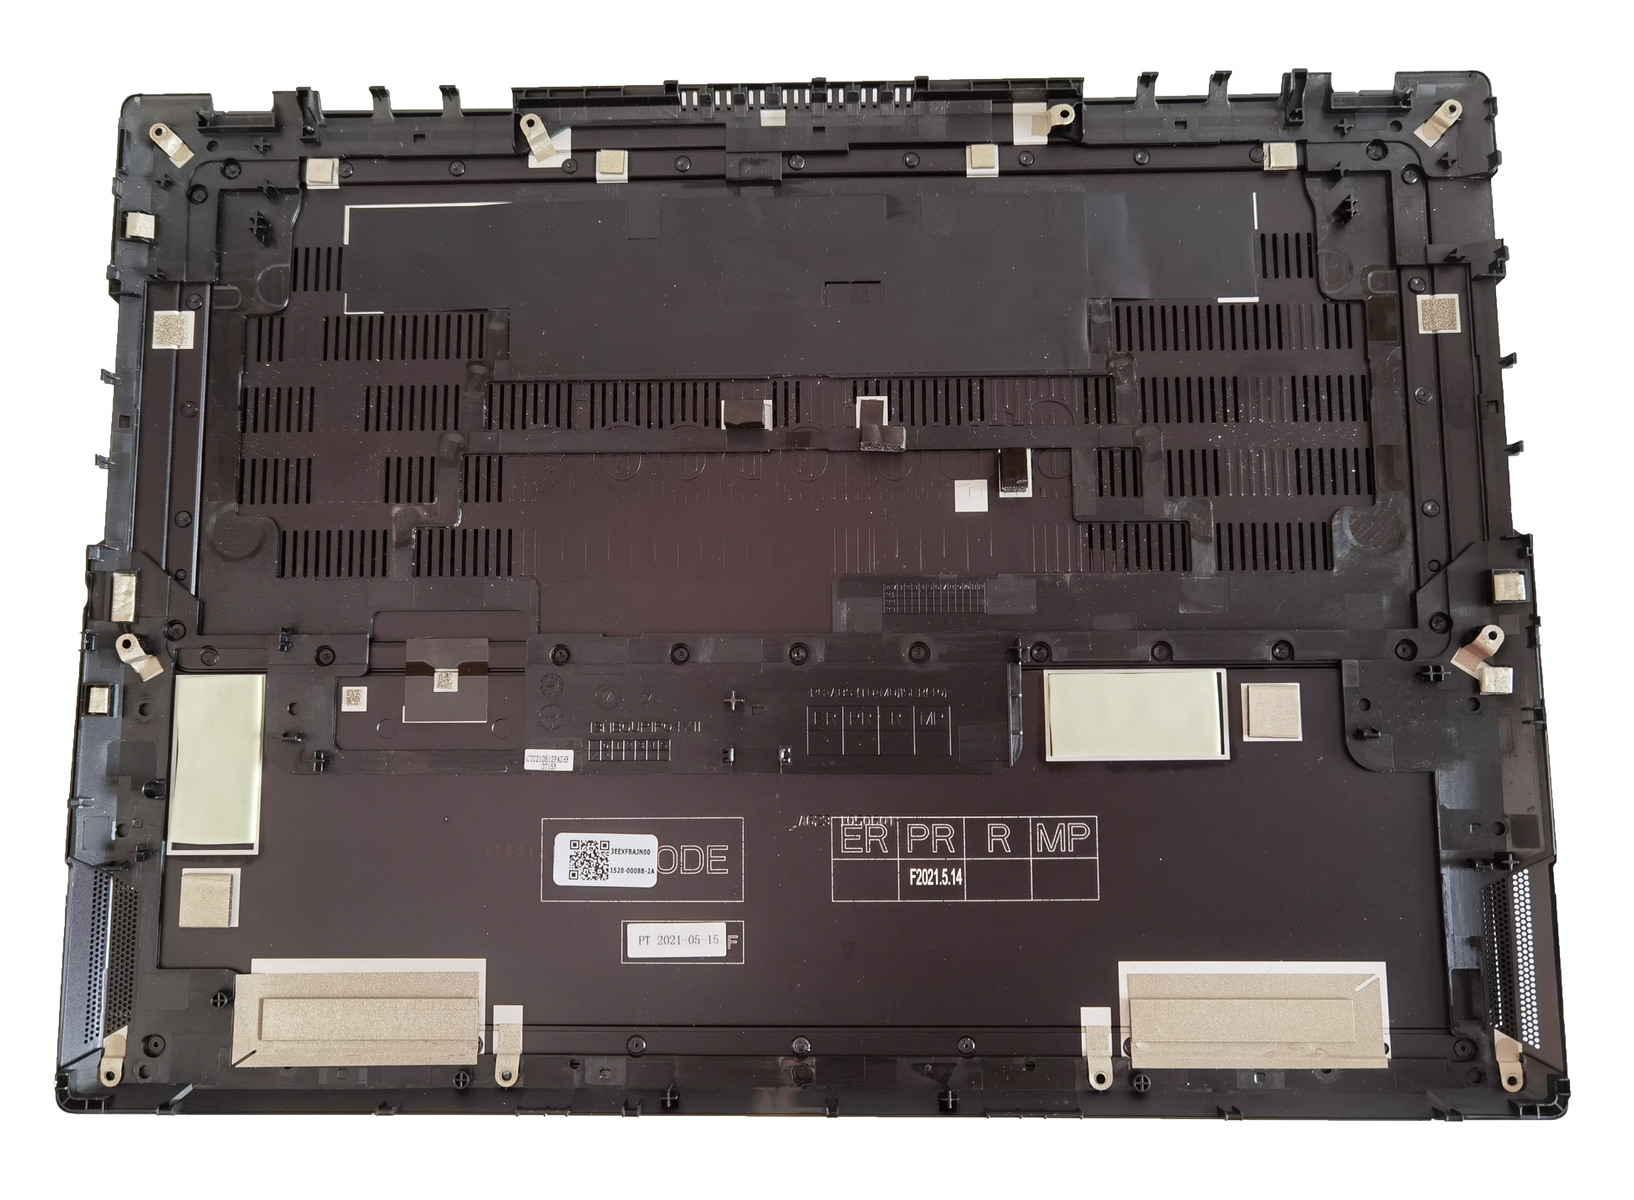
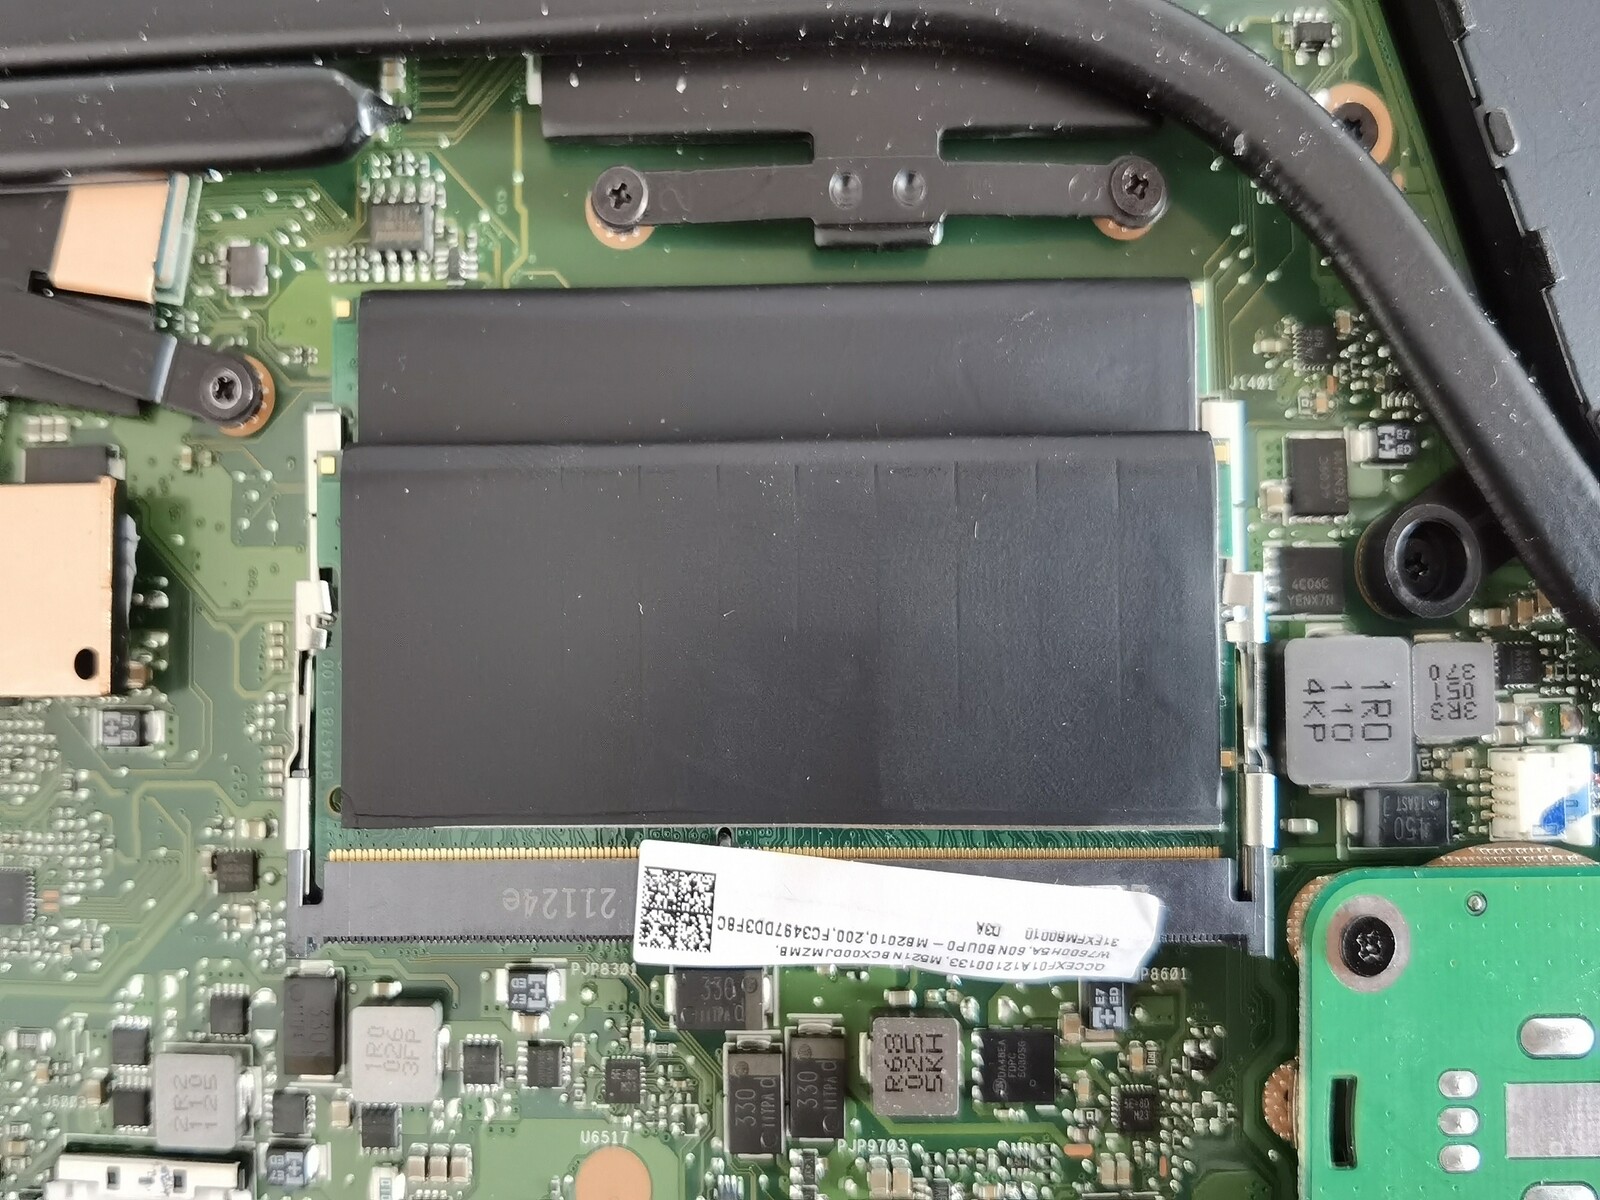
Manutenção
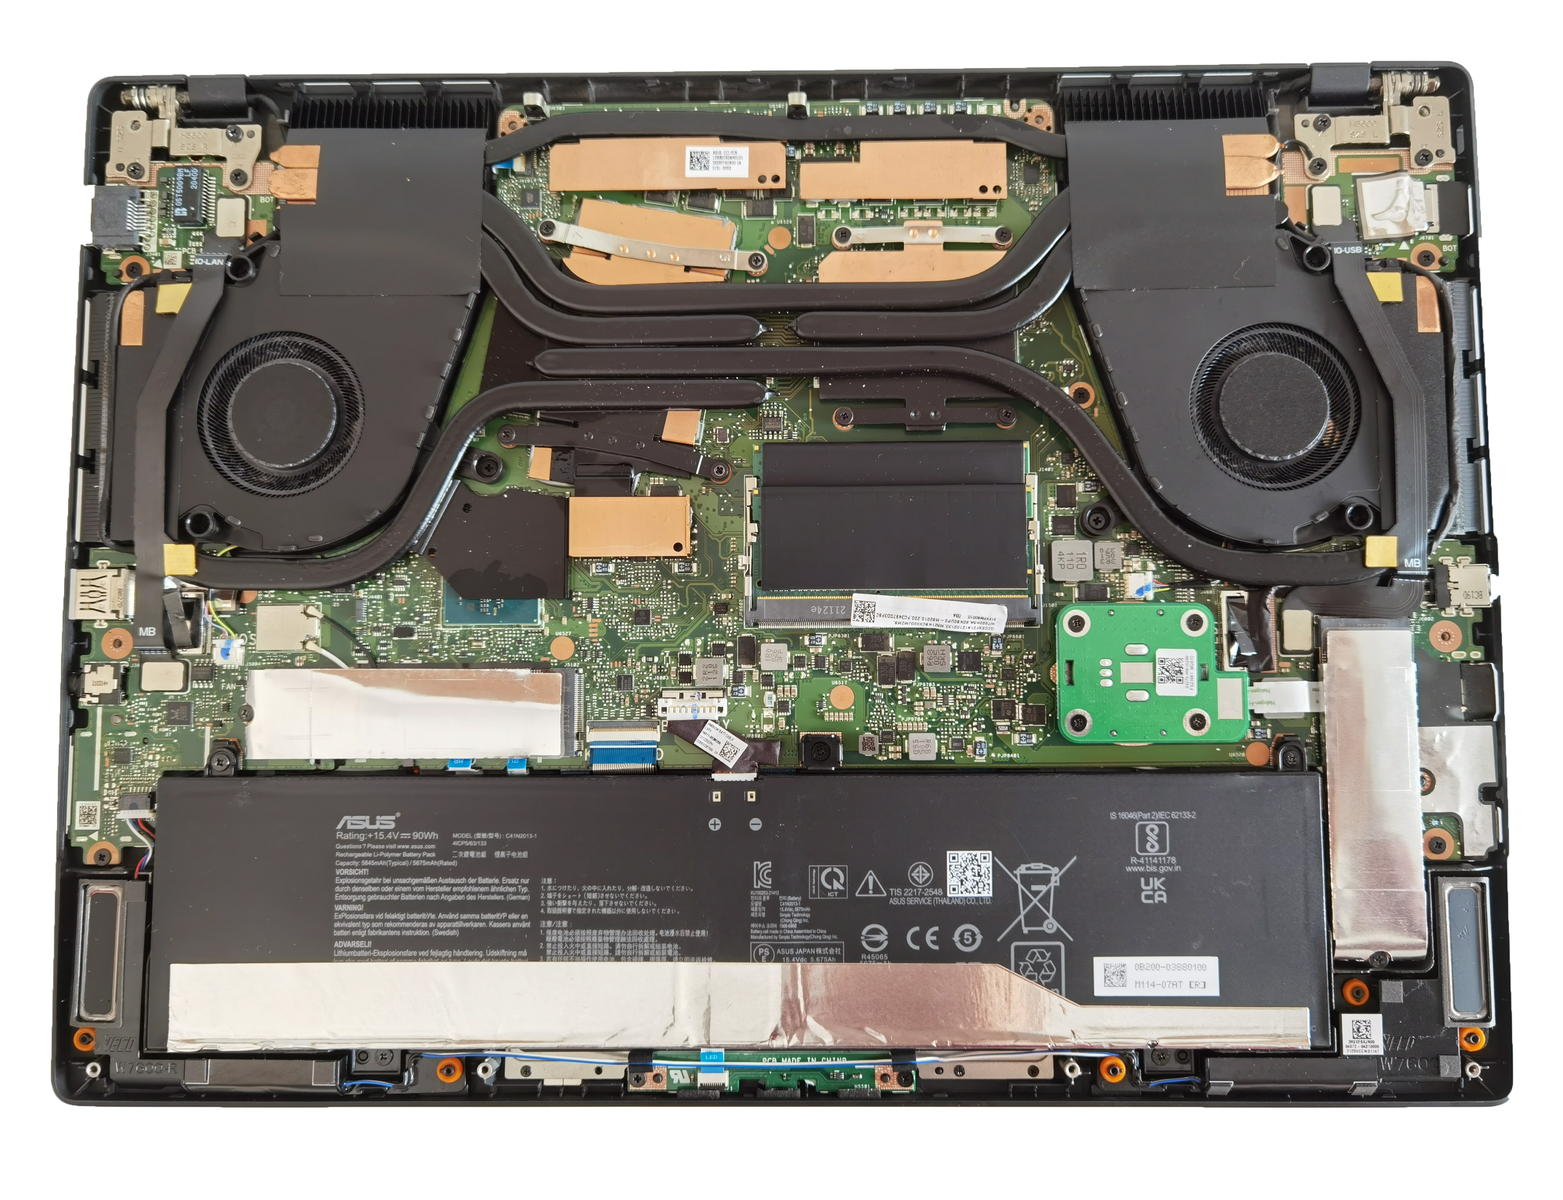
A placa base pode ser facilmente removida afrouxando dez parafusos cruzados. Os usuários internos terão acesso direto aos slots de RAM e SSD, que estão totalmente ocupados em nossa unidade de revisão. Desta forma, os ventiladores também podem ser limpos desta forma. Vale mencionar que o circuito de resfriamento também cobre o chipset e até mesmo a RAM e os SSDs têm resfriamento passivo. Para este último, há almofadas de condução de calor adicionais na placa de base
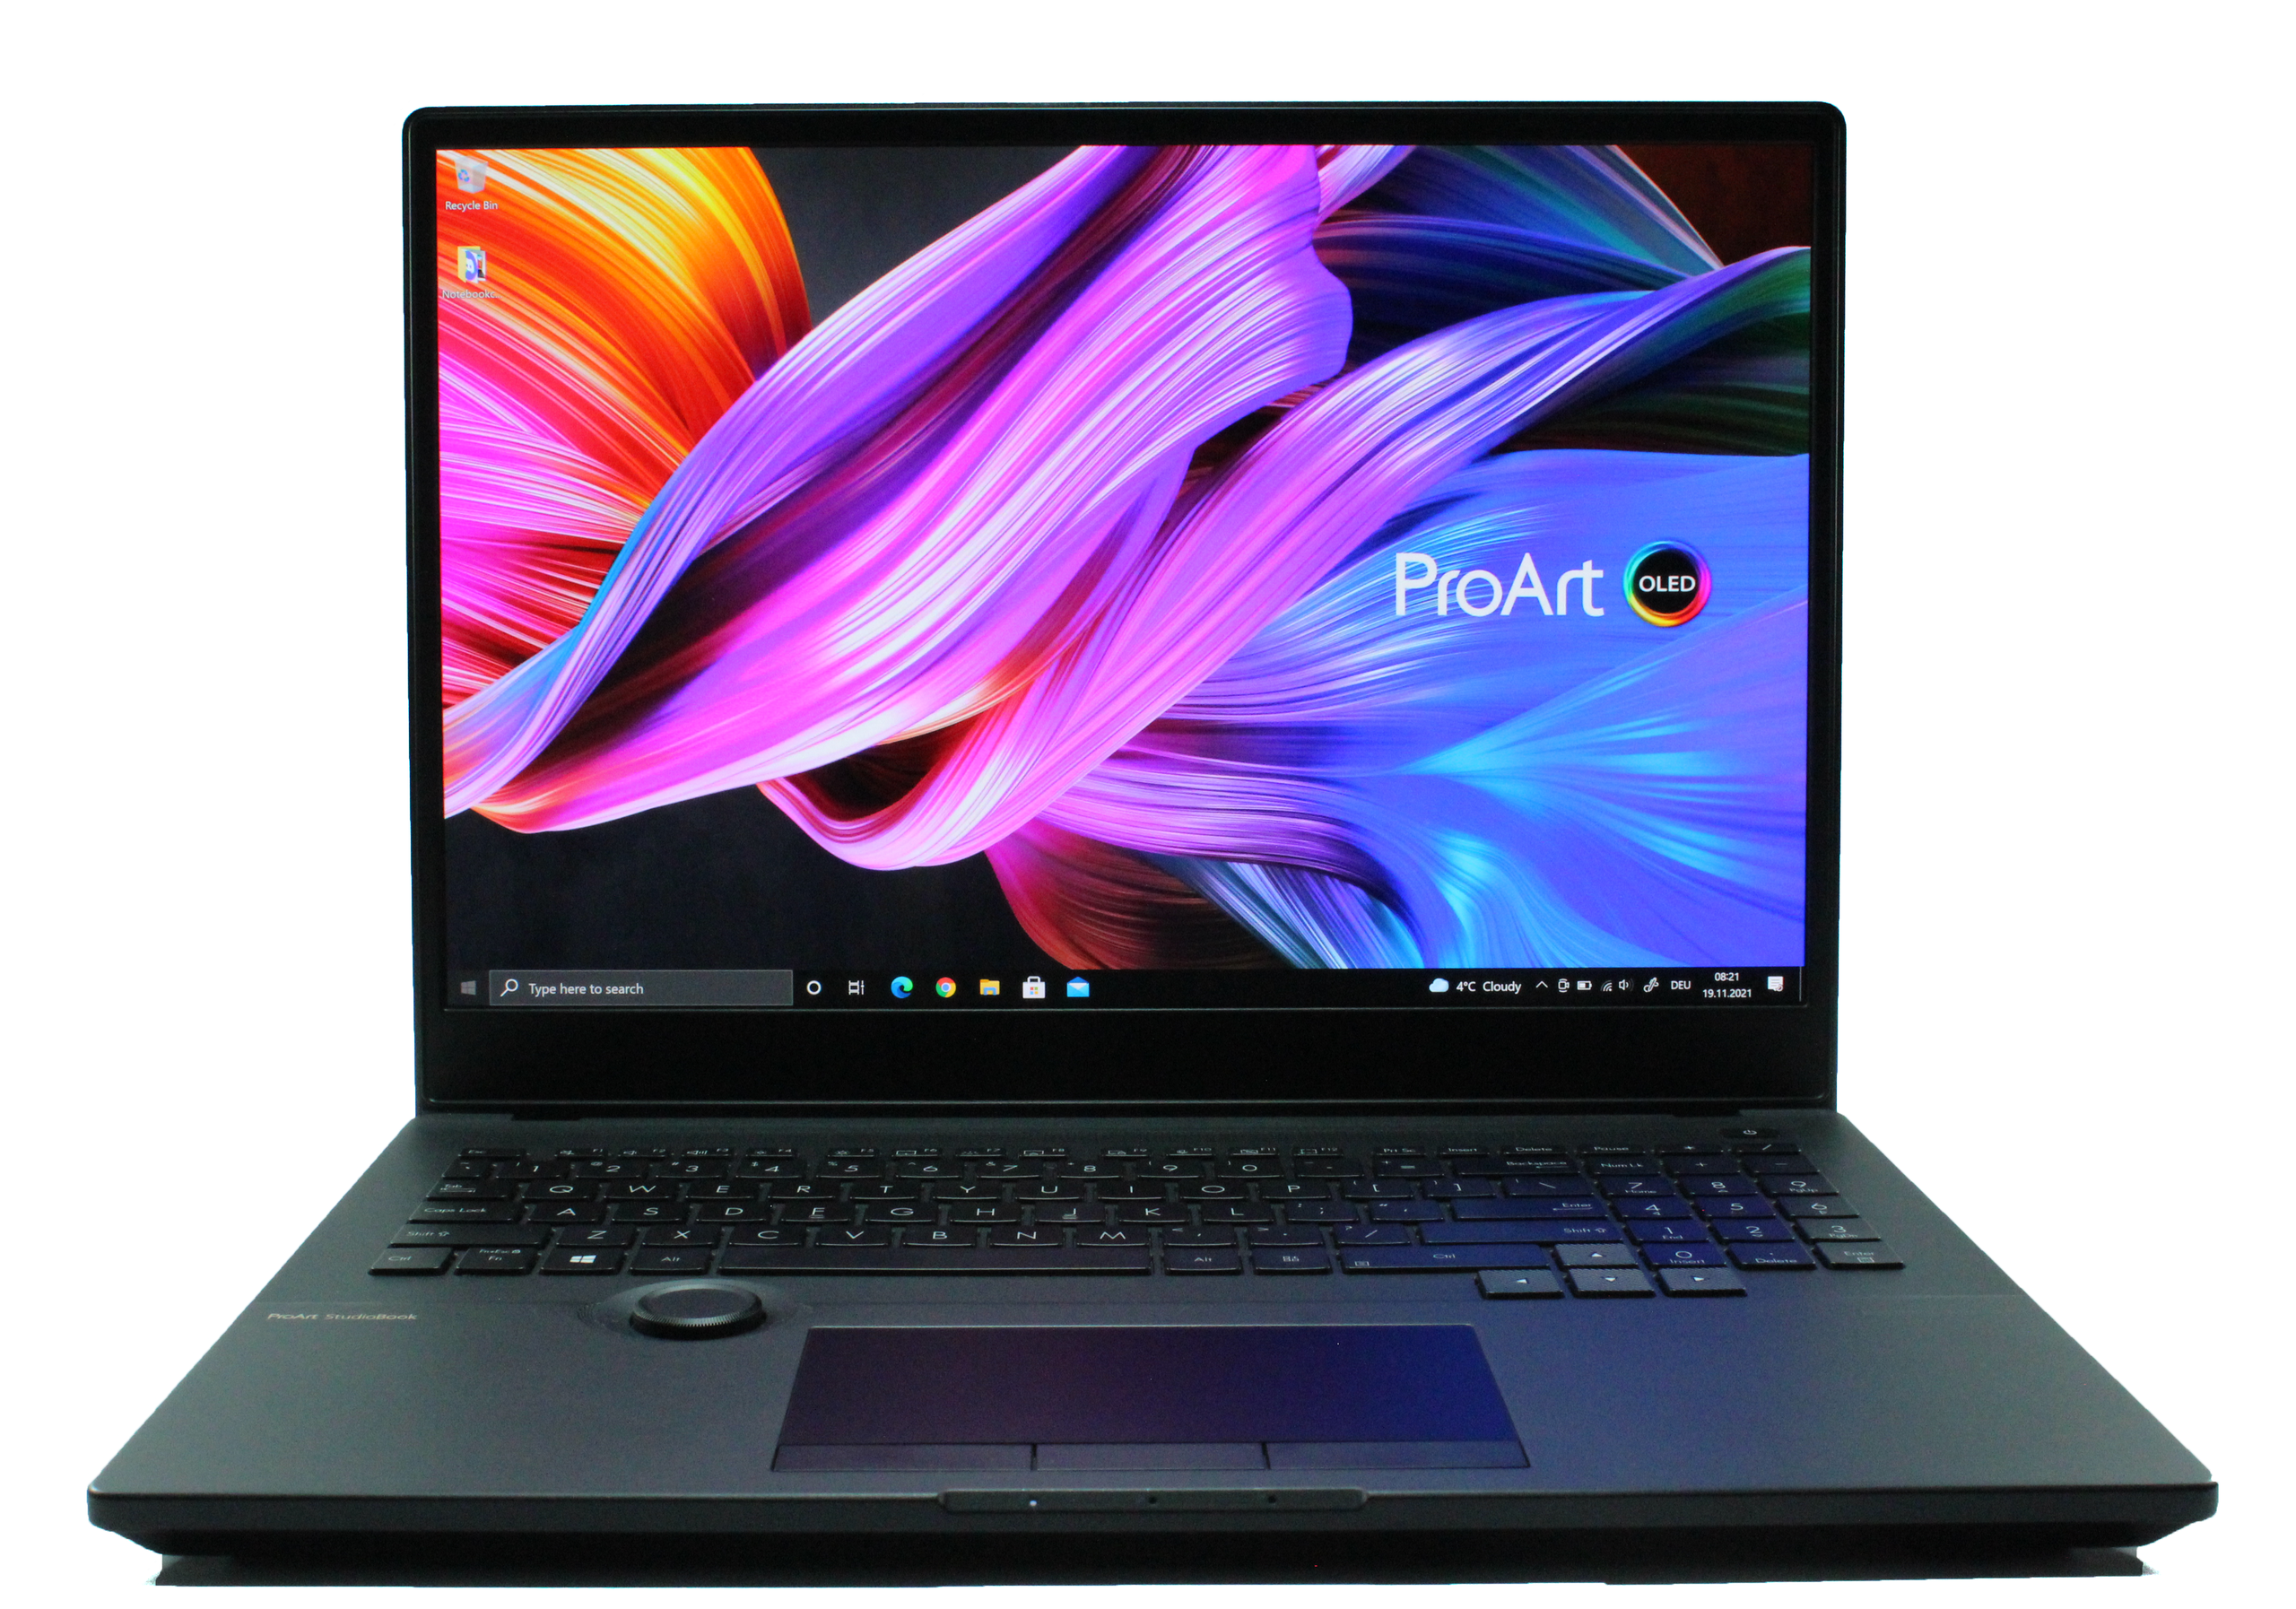
Dispositivos de entrada: Trabalho profissional com o Asus Dial
Teclado
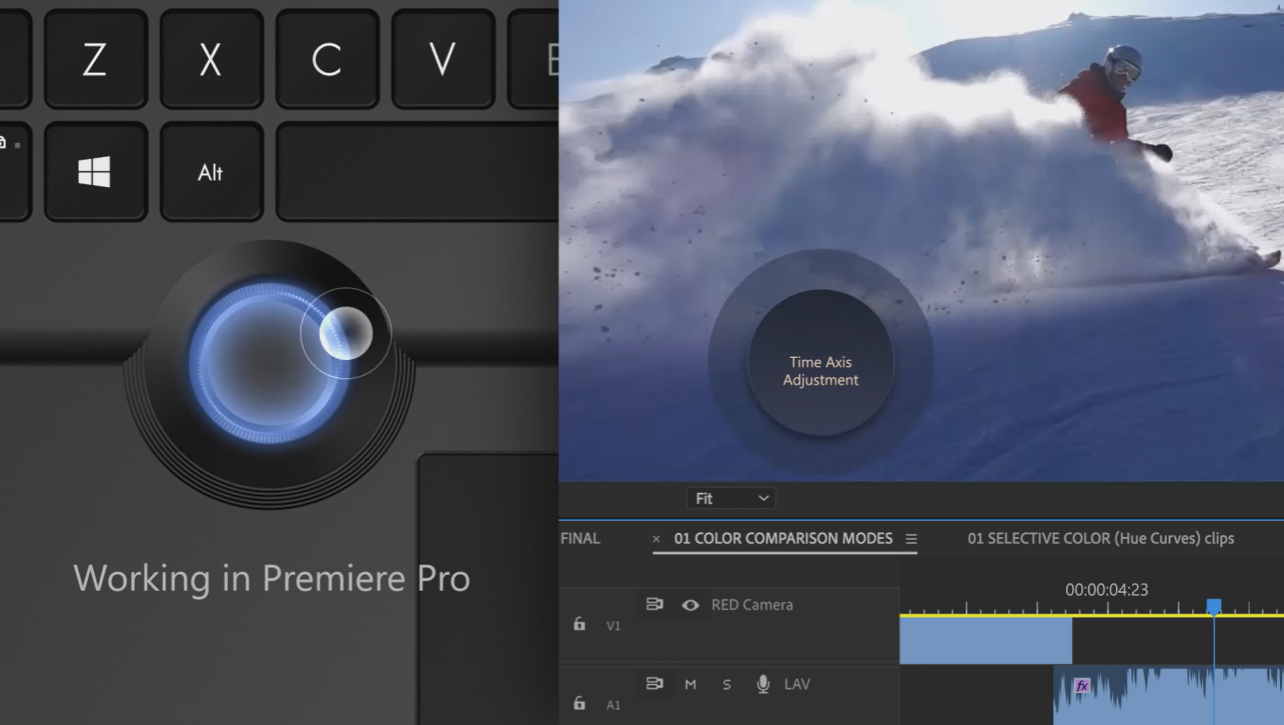
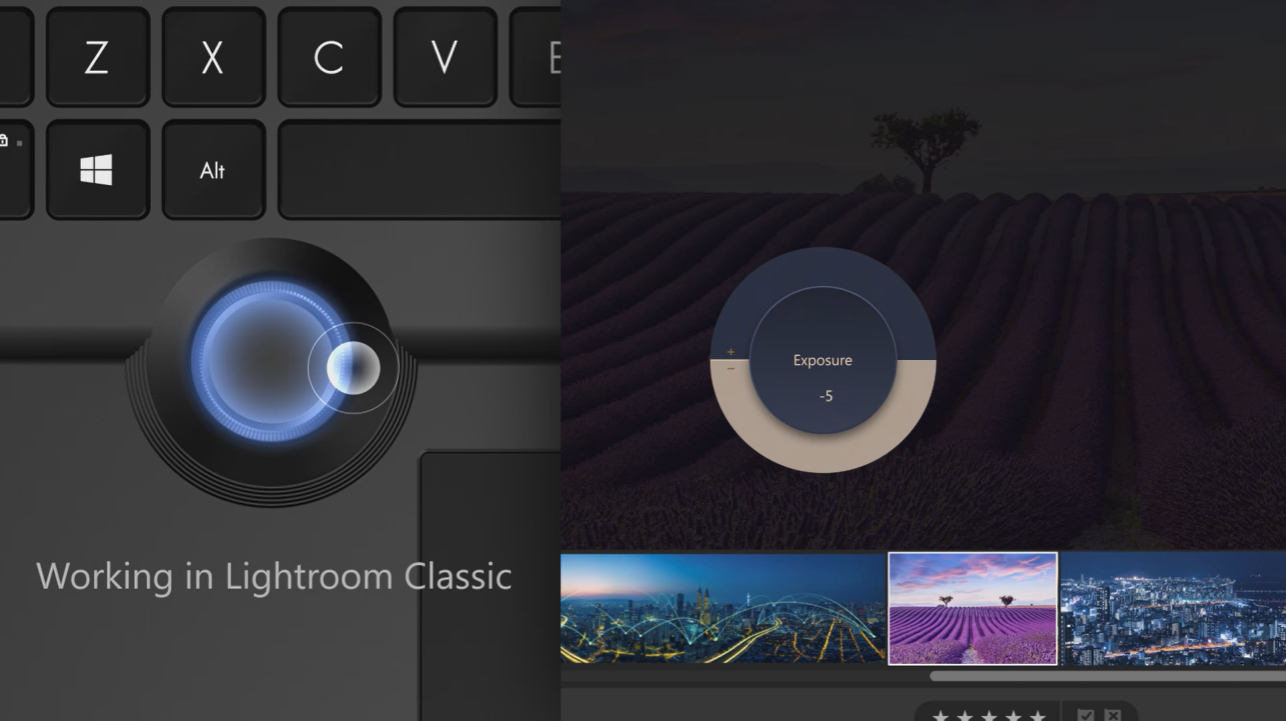
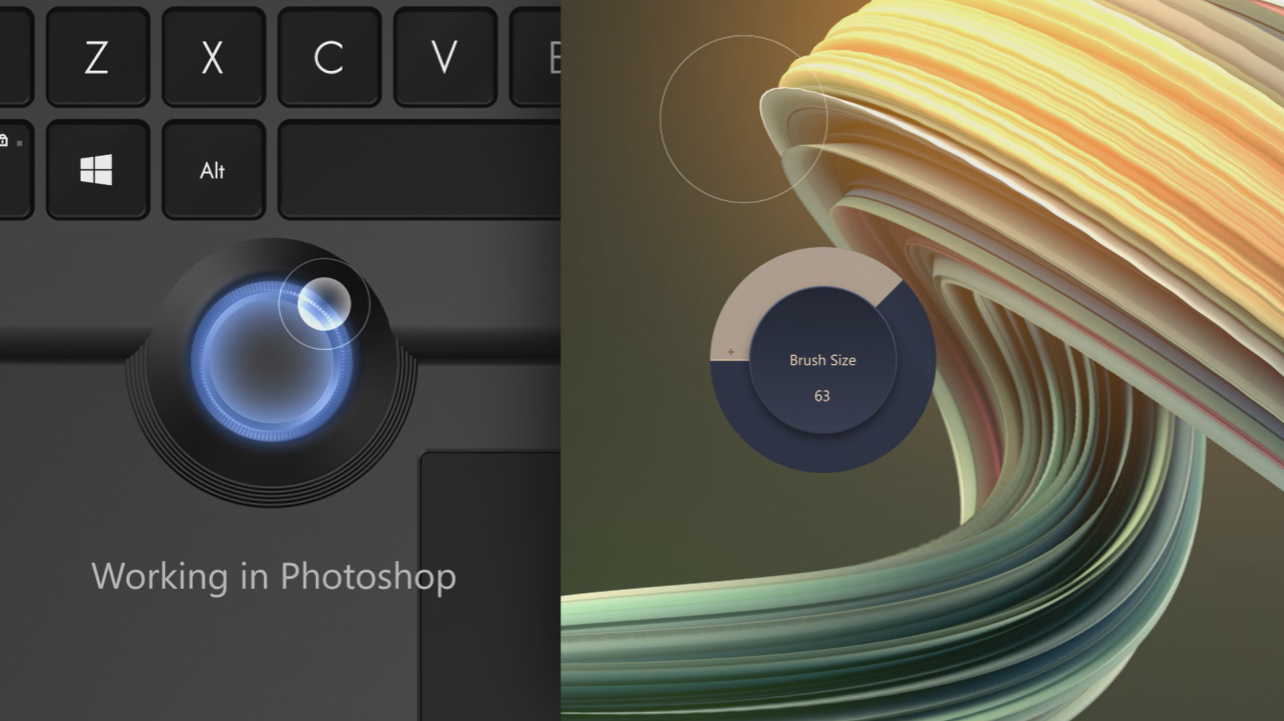
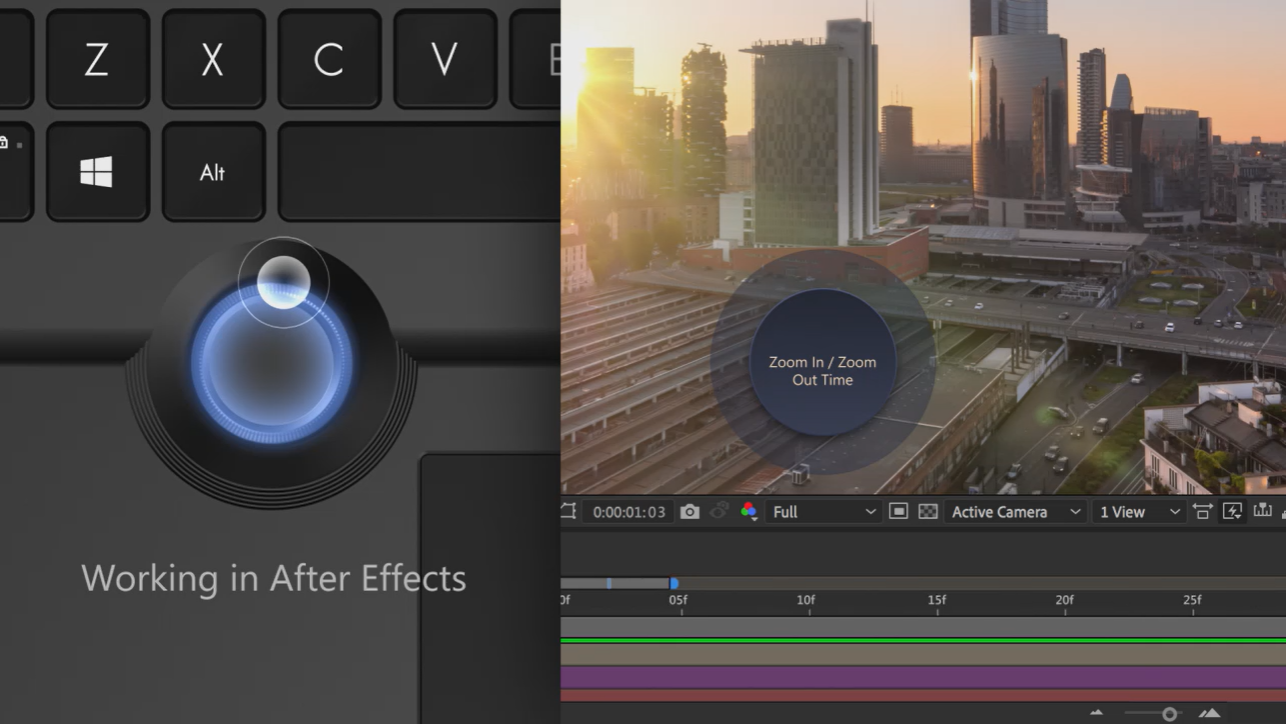
O teclado do Asus ProArt Studiobook 16 é caracterizado por um bom ponto de pressão. As teclas têm um tamanho normal e se sentem muito confortáveis ao digitar, apesar da superfície mais áspera. O ruído das teclas é bastante discreto e não é percebido como irritante. A iluminação do teclado pode ser ajustada em três níveis. Além disso, existe o controlador de discagem Asus: graças às bordas ergonômicas do controlador redondo, os ajustes podem ser feitos de forma muito precisa e também muito silenciosa. Por exemplo, você pode controlar intuitivamente o pincel no Photoshop ou mudar facilmente a camada através do mostrador. O zoom, a navegação ou o ajuste do equilíbrio de cores ou da tonalidade deve ser fácil com o Dial Controller. Nossa galeria de imagens mostra alguns exemplos de como usar o Dial Controller
Touchpad
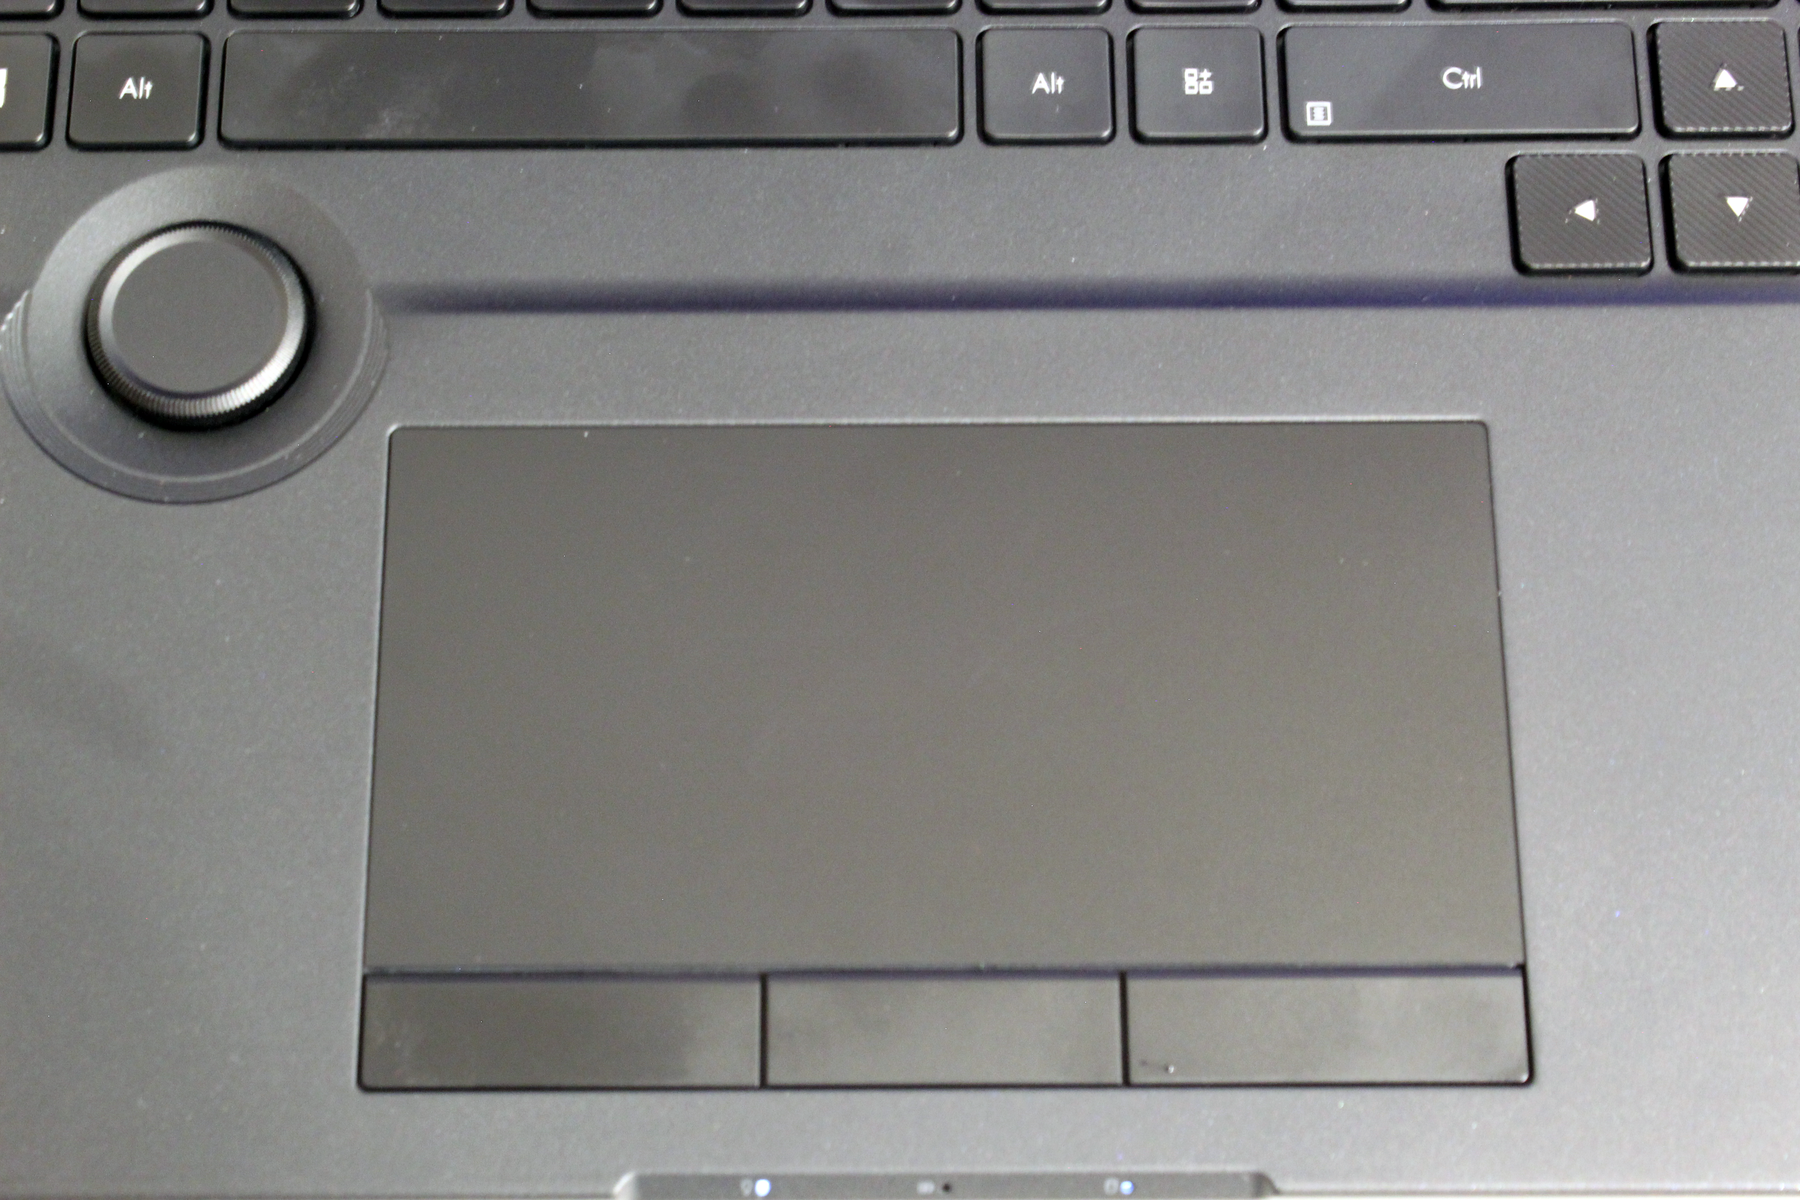
O touchpad de nossa amostra de pré-produção oferece ao usuário uma grande superfície, bem como muito boas propriedades de deslizamento. Da mesma forma, características multi-toque, como rolagem ou abas de comutação, funcionam bem aqui. O touchpad especial de 3 botões é adequado para designers 3D que precisam de controle centralizado para funções de aplicação como panorâmico, rotativo ou circular. Combinadas com o Dial Asus, estas duas características são uma verdadeira equipe de sonho para profissionais criativos.
Mostrar: O primeiro painel OLED HDR 4K do mundo no formato 16:10

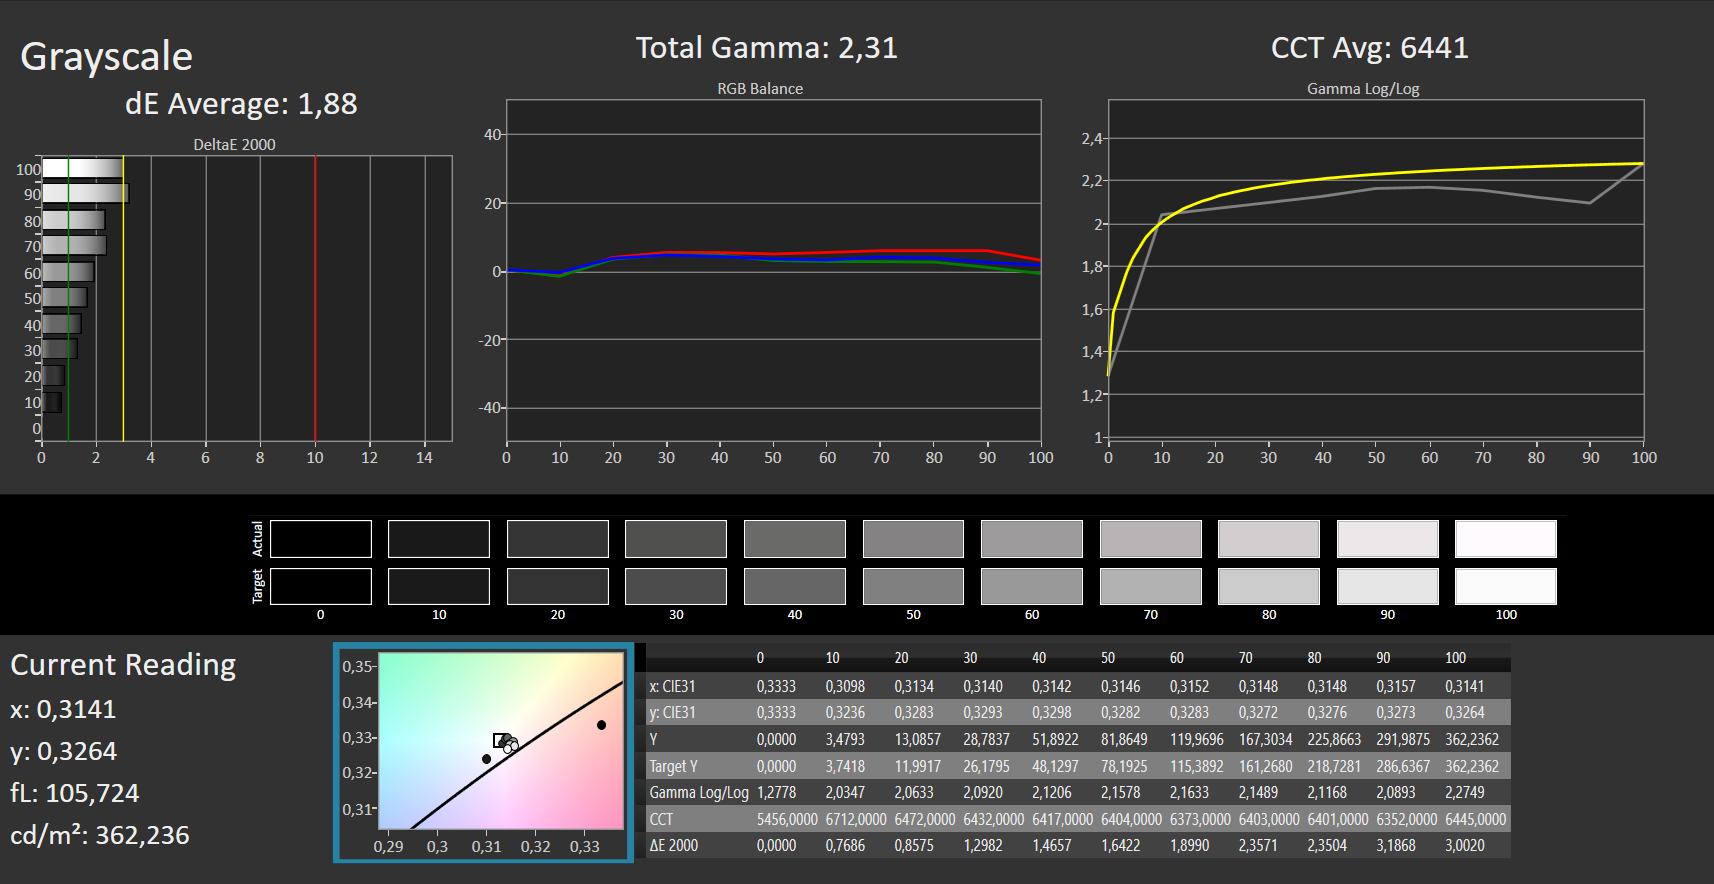
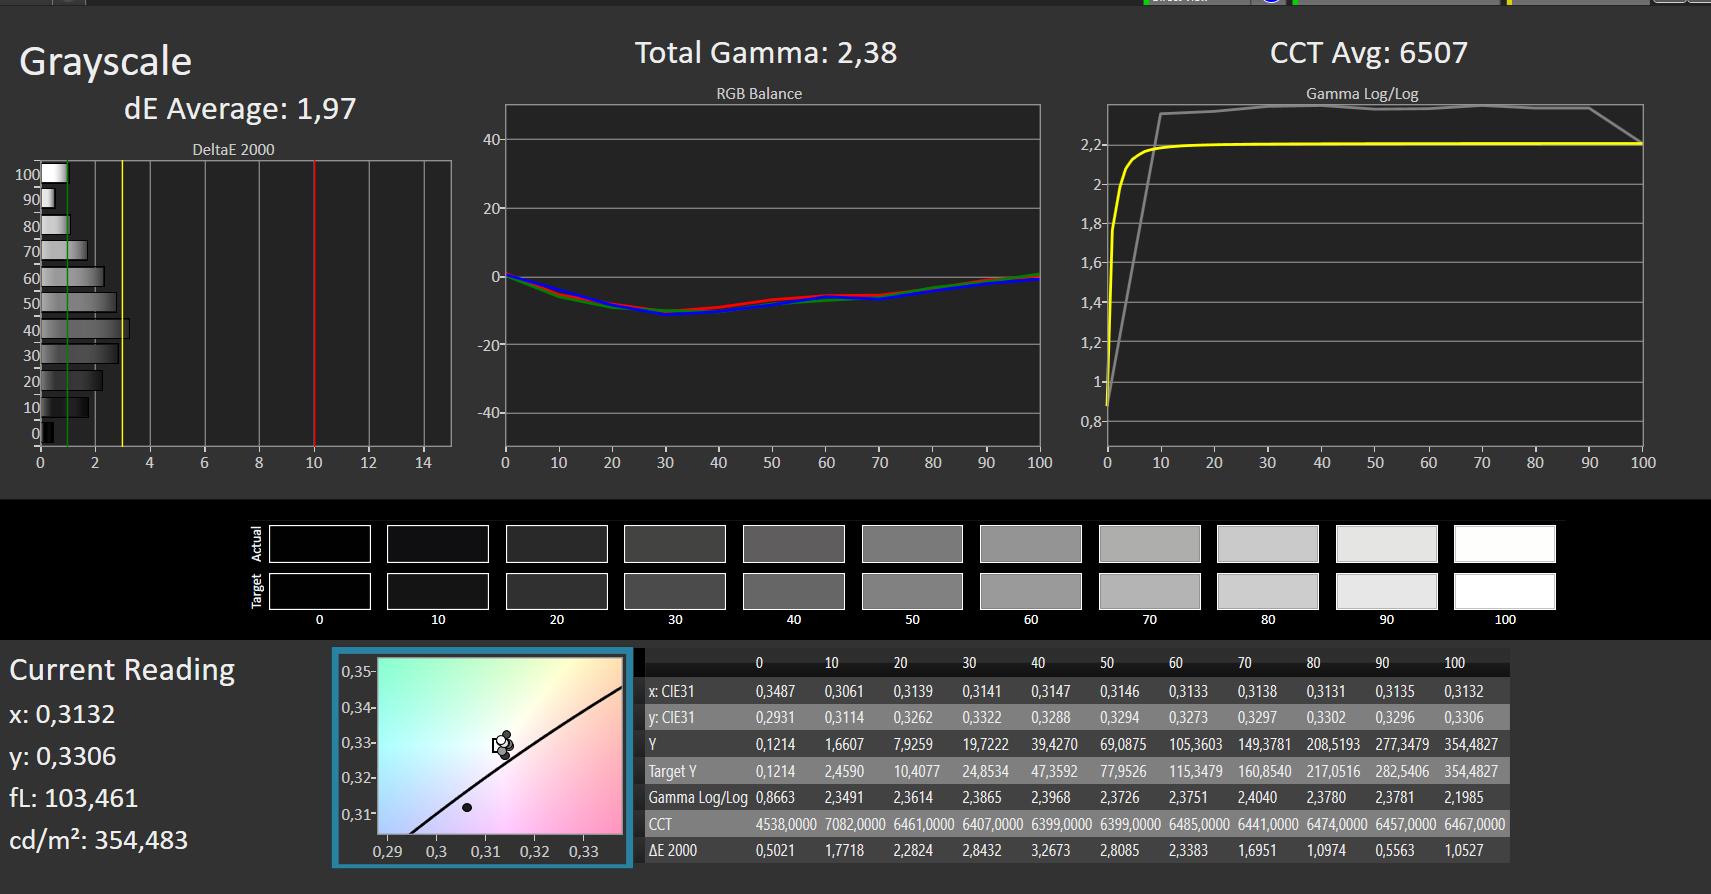
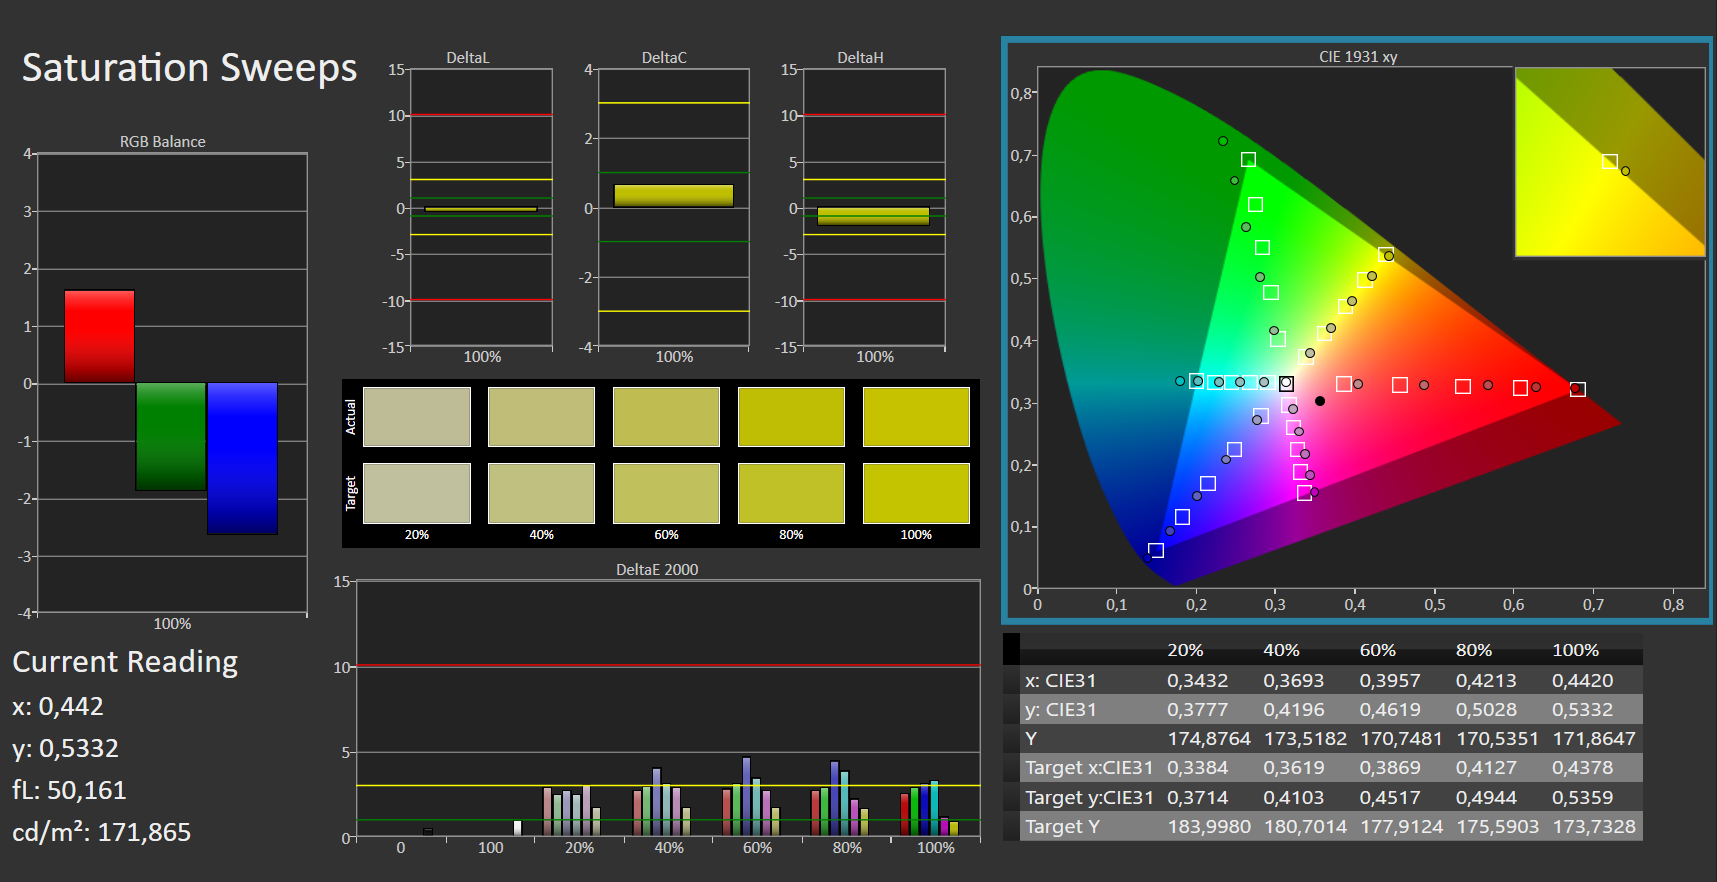
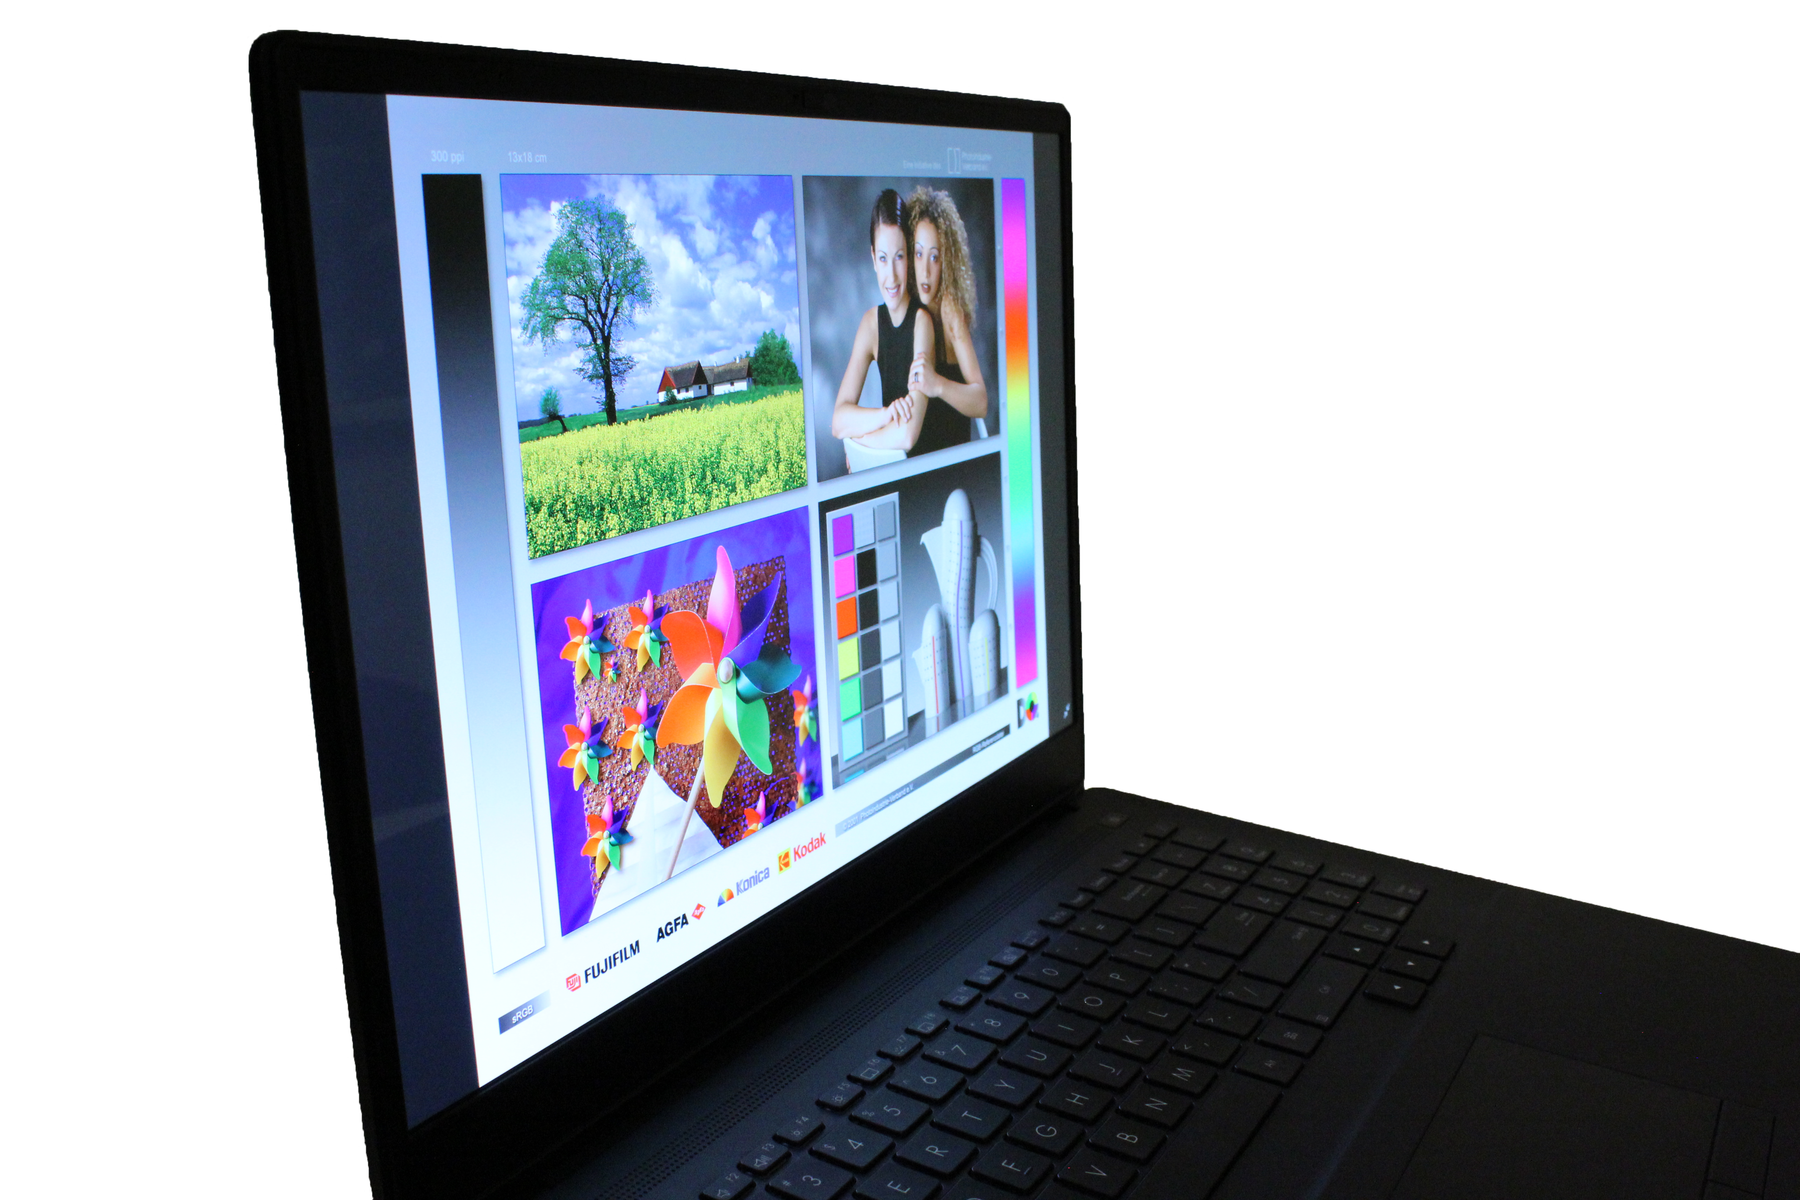
Nossa amostra de revisão tem painel OLED HDR de 4K com tela de 16 polegadas na diagonal e proporção 16:10. Causa uma boa impressão à primeira vista e oferece as vantagens típicas dos painéis OLED. Além disso, tem muito boa calibração de fábrica devido à certificação Pantone e, portanto, é perfeitamente adequado para a edição de fotos e vídeos. A iluminação de 96 por cento é muito boa, somente o brilho máximo poderia ser melhor. Além disso, no teste pudemos detectar PWM com escurecimento DC a uma freqüência de 240 Hz a partir de um nível de brilho de 80 por cento e abaixo. A competição também pode marcar alguns pontos: por exemplo, HP ZBook Fury está equipado com um display não-reflexivo de 120 Hz e um painel muito mais brilhante. Entretanto, também tem alguns inconvenientes, tais como uma impressão de imagem granulada, mais halos e uma calibração mais pobre
Como nossa amostra de pré-produção tem um painel OLED, não há sangramento na tela
| |||||||||||||||||||||||||
iluminação: 96 %
iluminação com acumulador: 354 cd/m²
Contraste: ∞:1 (Preto: 0 cd/m²)
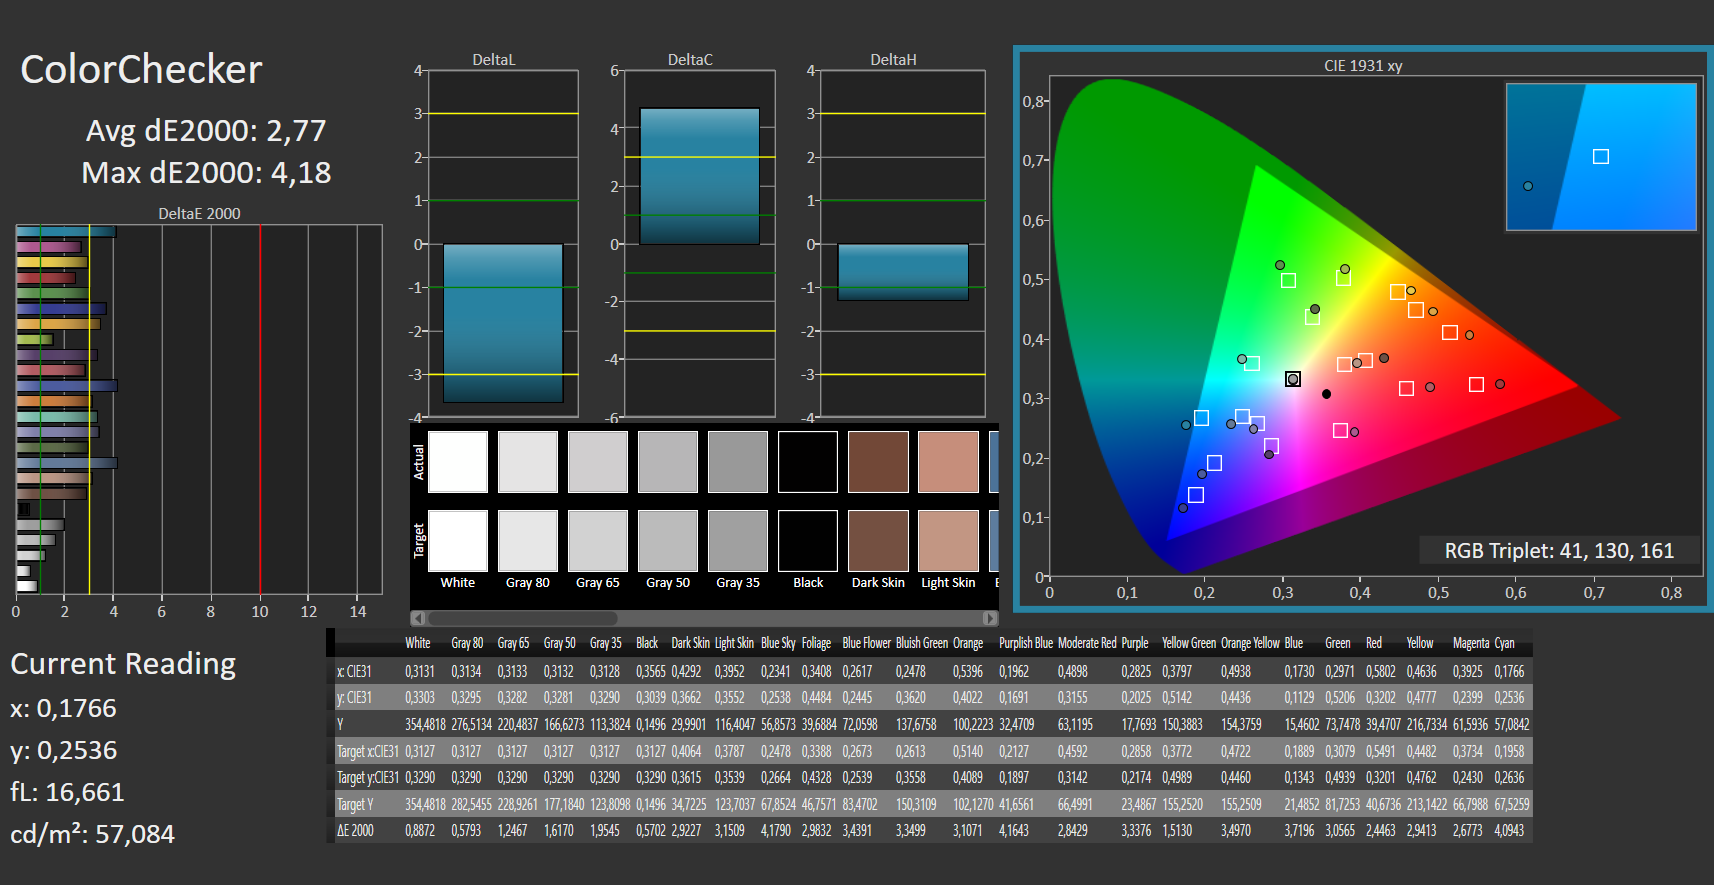
ΔE ColorChecker Calman: 2.45 | ∀{0.5-29.43 Ø4.71}
calibrated: 2.77
ΔE Greyscale Calman: 1.88 | ∀{0.09-98 Ø4.96}
98.6% AdobeRGB 1998 (Argyll 3D)
100% sRGB (Argyll 3D)
99.9% Display P3 (Argyll 3D)
Gamma: 2.31
CCT: 6441 K
| Asus ProArt StudioBook 16 W7600H5A-2BL2 ATNA60YV02-0, OLED, 3840x2400, 16" | HP ZBook Fury 15 G8 BOE0969, IPS, 3840x2160, 15.6" | HP ZBook Studio 15 G8 SDC4145, OLED, 3840x2160, 15.6" | Dell Precision 5000 5560 Sharp LQ156R1, IPS, 3840x2400, 15.6" | |
|---|---|---|---|---|
| Display | -5% | -1% | -1% | |
| Display P3 Coverage (%) | 99.9 | 95.9 -4% | 99.9 0% | 94.9 -5% |
| sRGB Coverage (%) | 100 | 100 0% | 100 0% | 100 0% |
| AdobeRGB 1998 Coverage (%) | 98.6 | 87.3 -11% | 95.3 -3% | 100 1% |
| Response Times | -545% | -20% | -1840% | |
| Response Time Grey 50% / Grey 80% * (ms) | 2 ? | 14.8 ? -640% | 2.4 ? -20% | 47.2 ? -2260% |
| Response Time Black / White * (ms) | 2 ? | 11 ? -450% | 2.4 ? -20% | 30.4 ? -1420% |
| PWM Frequency (Hz) | 240 ? | 240.4 ? | ||
| Screen | -40% | -36% | -24% | |
| Brightness middle (cd/m²) | 353 | 626 77% | 379.6 8% | 501.5 42% |
| Brightness (cd/m²) | 360 | 589 64% | 380 6% | 467 30% |
| Brightness Distribution (%) | 96 | 87 -9% | 95 -1% | 83 -14% |
| Black Level * (cd/m²) | 0.58 | 0.44 | ||
| Colorchecker dE 2000 * | 2.45 | 5.41 -121% | 5.15 -110% | 4.73 -93% |
| Colorchecker dE 2000 max. * | 3.75 | 9.05 -141% | 7.79 -108% | 8.45 -125% |
| Colorchecker dE 2000 calibrated * | 2.77 | 0.6 78% | 3.1 -12% | 0.51 82% |
| Greyscale dE 2000 * | 1.88 | 6.2 -230% | 2.6 -38% | 3.6 -91% |
| Gamma | 2.31 95% | 2.66 83% | 1.99 111% | 2.08 106% |
| CCT | 6441 101% | 6101 107% | 6166 105% | 6447 101% |
| Contrast (:1) | 1079 | 1140 | ||
| Média Total (Programa/Configurações) | -197% /
-116% | -19% /
-25% | -622% /
-321% |
* ... menor é melhor
Graças à tela 4K OLED HDR, nossa amostra de pré-produção oferece um contraste extremamente alto e pretos profundos e ricos. O painel cobre completamente os espaços de cor DCI-P3 e sRGB e também oferece valores muito bons no espaço de cor AdobeRGB 1998 com um total de 98,6%. Além disso, há uma nitidez de imagem muito alta que proporciona uma imagem muito boa, o que significa que o display atende aos requisitos de edição gráfica profissional


Nossa amostra de teste de pré-produção só é adequada para uso externo de forma limitada. Com um brilho de 350 cd/m² e a tela brilhante, você já tem uma visão fraca mesmo na sombra. Entre a concorrênciaHP ZBook Fury pode fazer melhor graças ao painel IPS instalado com um brilho de mais de 600 cd/m².
Exibir tempos de resposta
| ↔ Tempo de resposta preto para branco | ||
|---|---|---|
| 2 ms ... ascensão ↗ e queda ↘ combinadas | ↗ 1 ms ascensão |  |
| ↘ 1 ms queda | ||
| A tela mostra taxas de resposta muito rápidas em nossos testes e deve ser muito adequada para jogos em ritmo acelerado. Em comparação, todos os dispositivos testados variam de 0.1 (mínimo) a 240 (máximo) ms. » 11 % de todos os dispositivos são melhores. Isso significa que o tempo de resposta medido é melhor que a média de todos os dispositivos testados (19.8 ms). | ||
| ↔ Tempo de resposta 50% cinza a 80% cinza | ||
| 2 ms ... ascensão ↗ e queda ↘ combinadas | ↗ 1 ms ascensão |  |
| ↘ 1 ms queda | ||
| A tela mostra taxas de resposta muito rápidas em nossos testes e deve ser muito adequada para jogos em ritmo acelerado. Em comparação, todos os dispositivos testados variam de 0.165 (mínimo) a 636 (máximo) ms. » 10 % de todos os dispositivos são melhores. Isso significa que o tempo de resposta medido é melhor que a média de todos os dispositivos testados (31 ms). | ||
Cintilação da tela / PWM (modulação por largura de pulso)
| Tela tremeluzindo/PWM detectado | 240 Hz | ≤ 80 % configuração de brilho |  |
A luz de fundo da tela pisca em 240 Hz (pior caso, por exemplo, utilizando PWM) Cintilação detectada em uma configuração de brilho de 80 % e abaixo. Não deve haver cintilação ou PWM acima desta configuração de brilho. A frequência de 240 Hz é relativamente baixa, portanto, usuários sensíveis provavelmente notarão cintilação e sentirão fadiga ocular na configuração de brilho indicada e abaixo. [pwm_comparison] Em comparação: 52 % de todos os dispositivos testados não usam PWM para escurecer a tela. Se PWM foi detectado, uma média de 7754 (mínimo: 5 - máximo: 343500) Hz foi medida. | |||
Graças ao painel OLED HDR embutido, os visores-angles do Asus ProArt Studiobook Pro 16 OLED são estáveis mesmo em ângulos muito oblíquos.
Desempenho: Desempenho de classe superior com refrigeração sofisticada
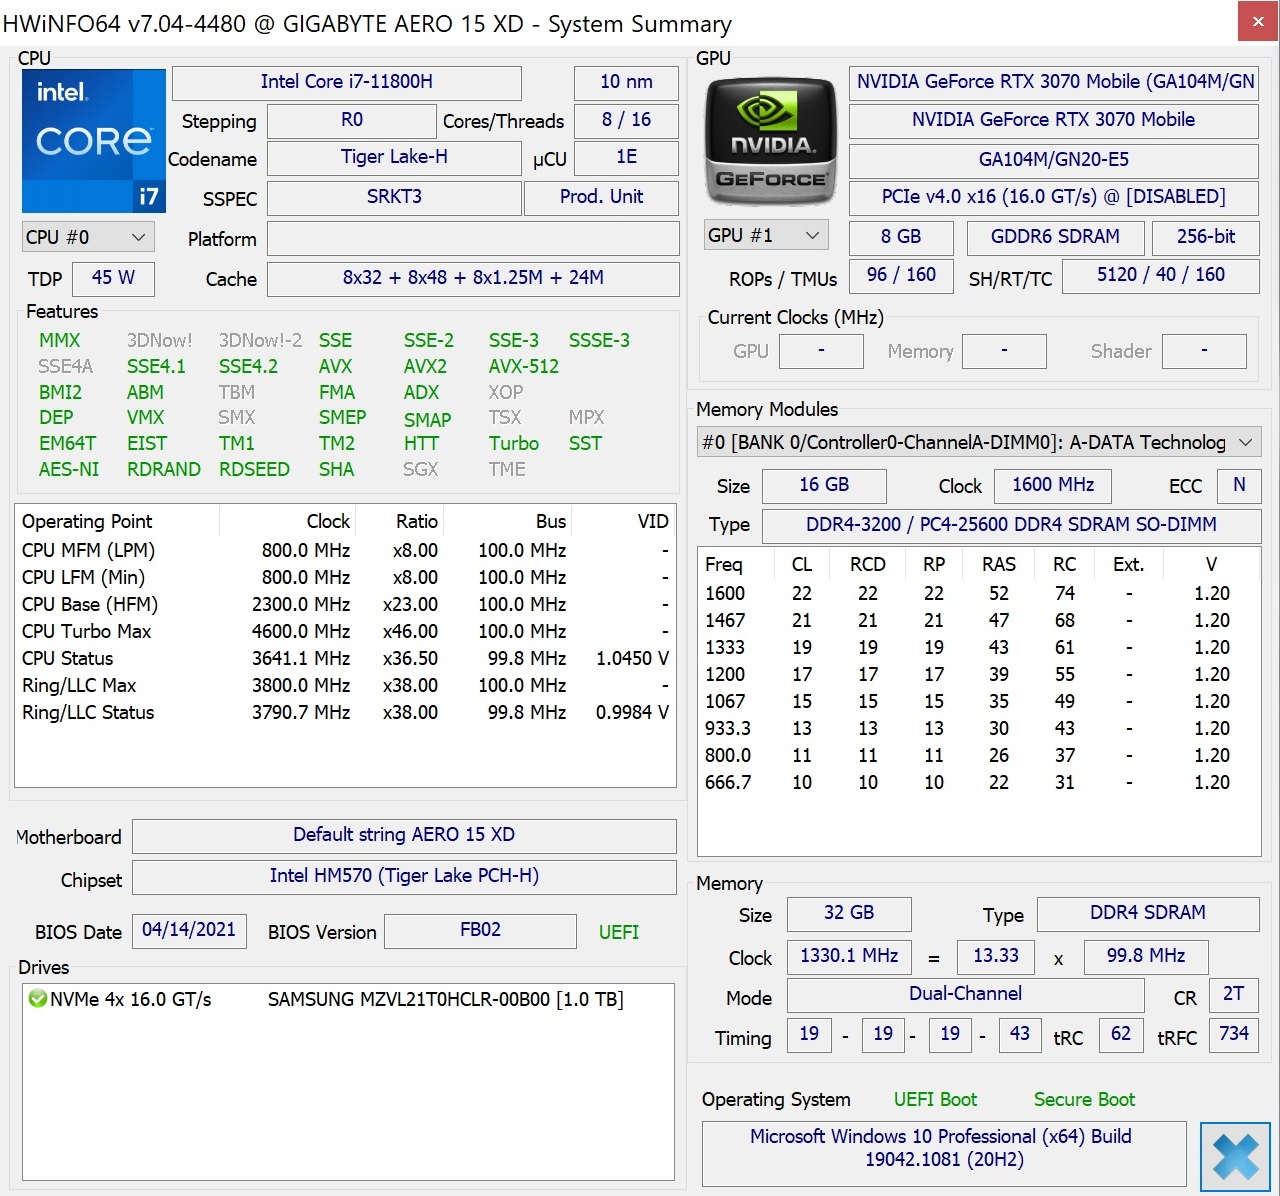
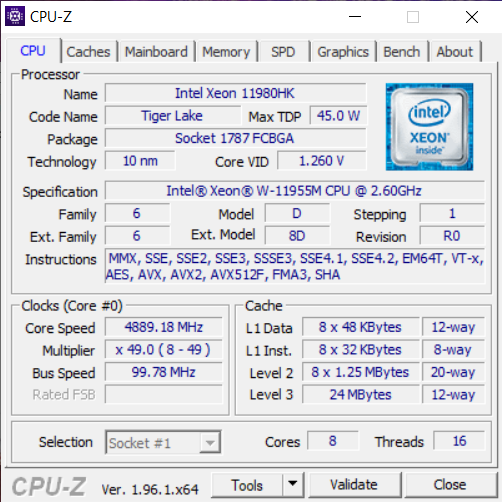
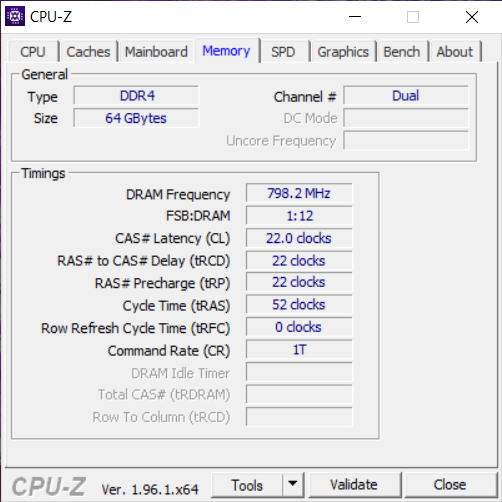
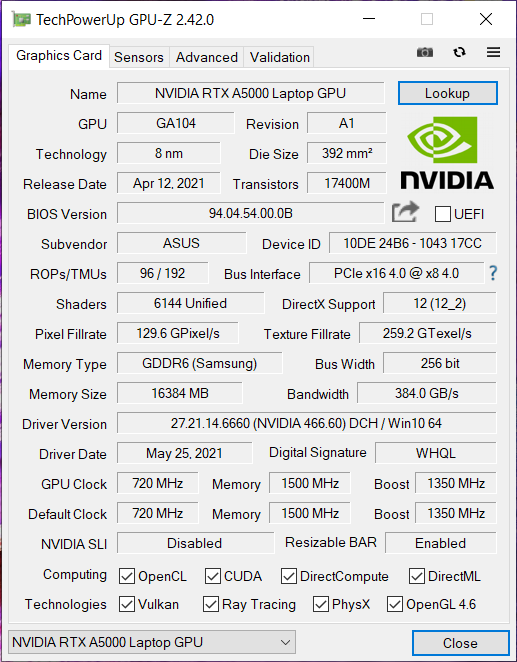
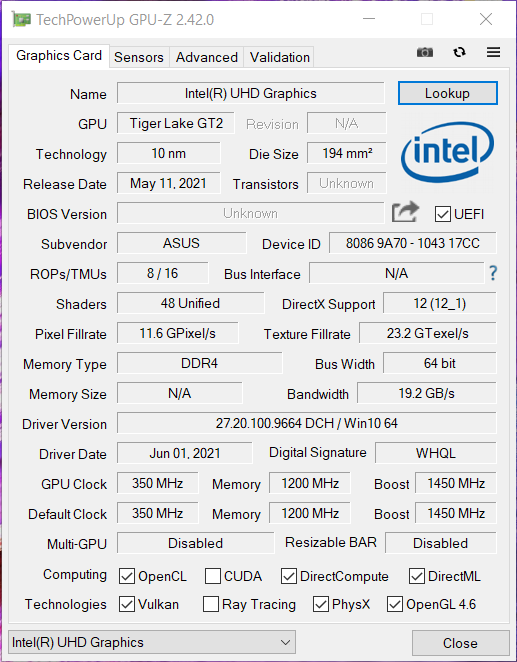
A Asus não faz nenhum compromisso e conta com os mais recentes e poderosos componentes que a Intel e a Nvidia oferecem atualmente para estações de trabalho. Portanto, um Intel Xeon W-11955 está trabalhando dentro em combinação com 64 GB DDR4 RAM e 2 TB NVMe SSD Raid 0 array. A carga gráfica é distribuída entreNvidia RTX A5000 e a Intel UHD Graphics com base na arquitetura XE. A memória de trabalho instalada em nosso dispositivo é a RAM ECC que relógios com 3200 MHz. Infelizmente, os slots SSD só suportam SSDs NVMe que utilizam PCIe Gen.3. Em vista do resto da configuração, a PCIe Gen.4 poderia ter sido mais apropriada. É questionável se outras configurações estarão disponíveis, mas isso ainda está para ser visto
Processador
Vamos agora falar sobre a CPU Tiger-Lake octa-core, que foi introduzida no 2º trimestre de 2021. O Intel Xeon W11955Mque é projetado para estações de trabalho móveis, é fabricado no novo processo SuperFin de 10 nm e, em comparação com o Intel Core i9-11950H além disso, oferece suporte para a memória ECC. O chip tem um TDP de 45 watts, que no entanto foi configurado mais alto em nossa amostra de teste e aumenta para 54 watts permanentes, dependendo do cenário de aplicação. Os núcleos do processador podem clock de 2,6 a 5 GHz e suportam memória DDR4-3200
Em nosso teste Cinebench Multi endurance, o desempenho está no nível esperado e, portanto, supera facilmente a HP ZBook Fury's Intel Core i9-11950H instalado. Por um lado, isto se deve também ao sistema de refrigeração instalado, que também foi projetado para um TDP combinado de 140W. Testamos o dispositivo no modo de desempenho, que está disponível no Asus ProArt Creator Hub e adapta dinamicamente o resfriamento às tarefas necessárias. Para as tarefas diárias existe o modo padrão, e o aplicativo também permite ajustar os ventiladores à velocidade máxima. Entretanto, isto não representou muito valor agregado nos testes, além da necessidade de usar o fone de ouvido quando os ventiladores funcionam a uma velocidade permanentemente alta de 5.600 RPM. No modo de bateria, o sistema reduz a velocidade de nosso dispositivo de 54 para 15 watts, o que também é notável no desempenho. Mais detalhes sobre o processador podem ser encontrados em nosso Seção CPU
Cinebench R15 Multi endurance test
Cinebench R20: CPU (Multi Core) | CPU (Single Core)
Cinebench R15: CPU Multi 64Bit | CPU Single 64Bit
Blender: v2.79 BMW27 CPU
7-Zip 18.03: 7z b 4 | 7z b 4 -mmt1
Geekbench 5.5: Multi-Core | Single-Core
HWBOT x265 Benchmark v2.2: 4k Preset
LibreOffice : 20 Documents To PDF
R Benchmark 2.5: Overall mean
SPECviewperf 2020: 1920x1080 Solidworks (solidworks-05) | 1920x1080 Siemens NX (snx-04) | 1920x1080 Medical (medical-03) | 1920x1080 Maya (maya-06) | 1920x1080 Energy (energy-03) | 1920x1080 Creo (creo-03) | 1920x1080 CATIA (catia-06) | 1920x1080 3ds Max (3dsmax-07) | 3840x2160 Solidworks (solidworks-05) | 3840x2160 Siemens NX (snx-04) | 3840x2160 Medical (medical-03) | 3840x2160 Maya (maya-06) | 3840x2160 Energy (energy-03) | 3840x2160 Creo (creo-03) | 3840x2160 CATIA (catia-06) | 3840x2160 3ds Max (3dsmax-07)
| Cinebench R23 / Multi Core | |
| Média da turma Workstation (14621 - 38520, n=23, últimos 2 anos) | |
| Schenker XMG Ultra 17 Rocket Lake | |
| MSI GS76 Stealth 11UH | |
| HP ZBook Fury 15 G8 | |
| HP ZBook Studio 15 G8 | |
| Média Intel Xeon W-11955M (10862 - 12412, n=2) | |
| Asus ProArt StudioBook 16 W7600H5A-2BL2 | |
| Dell Precision 5000 5560 | |
| Cinebench R23 / Single Core | |
| Média da turma Workstation (1712 - 2228, n=23, últimos 2 anos) | |
| Schenker XMG Ultra 17 Rocket Lake | |
| HP ZBook Fury 15 G8 | |
| MSI GS76 Stealth 11UH | |
| HP ZBook Studio 15 G8 | |
| Média Intel Xeon W-11955M (1480 - 1621, n=2) | |
| Dell Precision 5000 5560 | |
| Asus ProArt StudioBook 16 W7600H5A-2BL2 | |
| Cinebench R20 / CPU (Multi Core) | |
| Média da turma Workstation (5760 - 15043, n=23, últimos 2 anos) | |
| Schenker XMG Ultra 17 Rocket Lake | |
| MSI GS76 Stealth 11UH | |
| HP ZBook Fury 15 G8 | |
| HP ZBook Studio 15 G8 | |
| Asus ProArt StudioBook 16 W7600H5A-2BL2 | |
| Média Intel Xeon W-11955M (n=1) | |
| Dell Precision 5000 5560 | |
| Cinebench R20 / CPU (Single Core) | |
| Média da turma Workstation (671 - 857, n=23, últimos 2 anos) | |
| Schenker XMG Ultra 17 Rocket Lake | |
| HP ZBook Fury 15 G8 | |
| HP ZBook Studio 15 G8 | |
| MSI GS76 Stealth 11UH | |
| Dell Precision 5000 5560 | |
| Asus ProArt StudioBook 16 W7600H5A-2BL2 | |
| Média Intel Xeon W-11955M (n=1) | |
| Cinebench R15 / CPU Multi 64Bit | |
| Média da turma Workstation (2489 - 5810, n=23, últimos 2 anos) | |
| Schenker XMG Ultra 17 Rocket Lake | |
| MSI GS76 Stealth 11UH | |
| Asus ProArt StudioBook 16 W7600H5A-2BL2 | |
| Média Intel Xeon W-11955M (n=1) | |
| HP ZBook Studio 15 G8 | |
| HP ZBook Fury 15 G8 | |
| Dell Precision 5000 5560 | |
| Cinebench R15 / CPU Single 64Bit | |
| Média da turma Workstation (191.4 - 328, n=23, últimos 2 anos) | |
| Schenker XMG Ultra 17 Rocket Lake | |
| HP ZBook Fury 15 G8 | |
| MSI GS76 Stealth 11UH | |
| HP ZBook Studio 15 G8 | |
| Dell Precision 5000 5560 | |
| Asus ProArt StudioBook 16 W7600H5A-2BL2 | |
| Média Intel Xeon W-11955M (n=1) | |
| Blender / v2.79 BMW27 CPU | |
| Dell Precision 5000 5560 | |
| Asus ProArt StudioBook 16 W7600H5A-2BL2 | |
| Média Intel Xeon W-11955M (n=1) | |
| HP ZBook Fury 15 G8 | |
| HP ZBook Studio 15 G8 | |
| MSI GS76 Stealth 11UH | |
| Schenker XMG Ultra 17 Rocket Lake | |
| Média da turma Workstation (91 - 222, n=23, últimos 2 anos) | |
| 7-Zip 18.03 / 7z b 4 | |
| Média da turma Workstation (60489 - 116969, n=23, últimos 2 anos) | |
| Schenker XMG Ultra 17 Rocket Lake | |
| MSI GS76 Stealth 11UH | |
| HP ZBook Fury 15 G8 | |
| HP ZBook Studio 15 G8 | |
| Asus ProArt StudioBook 16 W7600H5A-2BL2 | |
| Média Intel Xeon W-11955M (n=1) | |
| Dell Precision 5000 5560 | |
| 7-Zip 18.03 / 7z b 4 -mmt1 | |
| Média da turma Workstation (5126 - 6960, n=23, últimos 2 anos) | |
| Schenker XMG Ultra 17 Rocket Lake | |
| HP ZBook Studio 15 G8 | |
| HP ZBook Fury 15 G8 | |
| Dell Precision 5000 5560 | |
| MSI GS76 Stealth 11UH | |
| Asus ProArt StudioBook 16 W7600H5A-2BL2 | |
| Média Intel Xeon W-11955M (n=1) | |
| Geekbench 5.5 / Multi-Core | |
| Média da turma Workstation (11542 - 25554, n=23, últimos 2 anos) | |
| Schenker XMG Ultra 17 Rocket Lake | |
| MSI GS76 Stealth 11UH | |
| Média Intel Xeon W-11955M (8349 - 9766, n=2) | |
| Asus ProArt StudioBook 16 W7600H5A-2BL2 | |
| HP ZBook Studio 15 G8 | |
| Geekbench 5.5 / Single-Core | |
| Média da turma Workstation (1783 - 2183, n=23, últimos 2 anos) | |
| Schenker XMG Ultra 17 Rocket Lake | |
| HP ZBook Studio 15 G8 | |
| MSI GS76 Stealth 11UH | |
| Média Intel Xeon W-11955M (1487 - 1686, n=2) | |
| Asus ProArt StudioBook 16 W7600H5A-2BL2 | |
| HWBOT x265 Benchmark v2.2 / 4k Preset | |
| Média da turma Workstation (17.8 - 40.5, n=23, últimos 2 anos) | |
| Schenker XMG Ultra 17 Rocket Lake | |
| MSI GS76 Stealth 11UH | |
| HP ZBook Studio 15 G8 | |
| HP ZBook Fury 15 G8 | |
| Asus ProArt StudioBook 16 W7600H5A-2BL2 | |
| Média Intel Xeon W-11955M (n=1) | |
| Dell Precision 5000 5560 | |
| LibreOffice / 20 Documents To PDF | |
| HP ZBook Fury 15 G8 | |
| MSI GS76 Stealth 11UH | |
| HP ZBook Studio 15 G8 | |
| Dell Precision 5000 5560 | |
| Média da turma Workstation (37.1 - 74.7, n=23, últimos 2 anos) | |
| Schenker XMG Ultra 17 Rocket Lake | |
| Asus ProArt StudioBook 16 W7600H5A-2BL2 | |
| Média Intel Xeon W-11955M (n=1) | |
| R Benchmark 2.5 / Overall mean | |
| Asus ProArt StudioBook 16 W7600H5A-2BL2 | |
| Média Intel Xeon W-11955M (n=1) | |
| HP ZBook Studio 15 G8 | |
| HP ZBook Fury 15 G8 | |
| Dell Precision 5000 5560 | |
| MSI GS76 Stealth 11UH | |
| Schenker XMG Ultra 17 Rocket Lake | |
| Média da turma Workstation (0.3825 - 0.603, n=23, últimos 2 anos) | |
| SPECviewperf 2020 / Solidworks (solidworks-05) | |
| Asus ProArt StudioBook 16 W7600H5A-2BL2 | |
| Média Intel Xeon W-11955M (n=1) | |
| Média da turma Workstation (50.6 - 542, n=9, últimos 2 anos) | |
| HP ZBook Fury 15 G8 | |
| Dell Precision 5000 5560 | |
| SPECviewperf 2020 / Siemens NX (snx-04) | |
| Média da turma Workstation (22.3 - 903, n=23, últimos 2 anos) | |
| Asus ProArt StudioBook 16 W7600H5A-2BL2 | |
| Média Intel Xeon W-11955M (n=1) | |
| HP ZBook Fury 15 G8 | |
| Dell Precision 5000 5560 | |
| SPECviewperf 2020 / Medical (medical-03) | |
| Média da turma Workstation (28.8 - 227, n=23, últimos 2 anos) | |
| Asus ProArt StudioBook 16 W7600H5A-2BL2 | |
| Média Intel Xeon W-11955M (n=1) | |
| HP ZBook Fury 15 G8 | |
| Dell Precision 5000 5560 | |
| SPECviewperf 2020 / Maya (maya-06) | |
| Média da turma Workstation (117.8 - 724, n=22, últimos 2 anos) | |
| Asus ProArt StudioBook 16 W7600H5A-2BL2 | |
| Média Intel Xeon W-11955M (n=1) | |
| HP ZBook Fury 15 G8 | |
| Dell Precision 5000 5560 | |
| SPECviewperf 2020 / Energy (energy-03) | |
| Média da turma Workstation (17.3 - 176.7, n=23, últimos 2 anos) | |
| Asus ProArt StudioBook 16 W7600H5A-2BL2 | |
| Média Intel Xeon W-11955M (n=1) | |
| HP ZBook Fury 15 G8 | |
| Dell Precision 5000 5560 | |
| SPECviewperf 2020 / Creo (creo-03) | |
| Asus ProArt StudioBook 16 W7600H5A-2BL2 | |
| Média Intel Xeon W-11955M (n=1) | |
| Média da turma Workstation (49.2 - 261, n=23, últimos 2 anos) | |
| HP ZBook Fury 15 G8 | |
| Dell Precision 5000 5560 | |
| SPECviewperf 2020 / CATIA (catia-06) | |
| Asus ProArt StudioBook 16 W7600H5A-2BL2 | |
| Média Intel Xeon W-11955M (n=1) | |
| HP ZBook Fury 15 G8 | |
| Média da turma Workstation (27.1 - 182.2, n=23, últimos 2 anos) | |
| Dell Precision 5000 5560 | |
| SPECviewperf 2020 / 3ds Max (3dsmax-07) | |
| Asus ProArt StudioBook 16 W7600H5A-2BL2 | |
| Média Intel Xeon W-11955M (n=1) | |
| Média da turma Workstation (24.7 - 251, n=23, últimos 2 anos) | |
| HP ZBook Fury 15 G8 | |
| Dell Precision 5000 5560 | |
| SPECviewperf 2020 / Solidworks (solidworks-05) | |
| Asus ProArt StudioBook 16 W7600H5A-2BL2 | |
| Média Intel Xeon W-11955M (n=1) | |
| HP ZBook Fury 15 G8 | |
| Dell Precision 5000 5560 | |
| SPECviewperf 2020 / Siemens NX (snx-04) | |
| Média da turma Workstation (30.6 - 561, n=11, últimos 2 anos) | |
| Asus ProArt StudioBook 16 W7600H5A-2BL2 | |
| Média Intel Xeon W-11955M (n=1) | |
| HP ZBook Fury 15 G8 | |
| Dell Precision 5000 5560 | |
| SPECviewperf 2020 / Medical (medical-03) | |
| Média da turma Workstation (20.3 - 96.8, n=12, últimos 2 anos) | |
| Média Intel Xeon W-11955M (n=1) | |
| Asus ProArt StudioBook 16 W7600H5A-2BL2 | |
| HP ZBook Fury 15 G8 | |
| Dell Precision 5000 5560 | |
| SPECviewperf 2020 / Maya (maya-06) | |
| Média da turma Workstation (132 - 380, n=12, últimos 2 anos) | |
| Asus ProArt StudioBook 16 W7600H5A-2BL2 | |
| Média Intel Xeon W-11955M (n=1) | |
| HP ZBook Fury 15 G8 | |
| Dell Precision 5000 5560 | |
| SPECviewperf 2020 / Energy (energy-03) | |
| Asus ProArt StudioBook 16 W7600H5A-2BL2 | |
| Média Intel Xeon W-11955M (n=1) | |
| Média da turma Workstation (15.8 - 74.3, n=12, últimos 2 anos) | |
| HP ZBook Fury 15 G8 | |
| Dell Precision 5000 5560 | |
| SPECviewperf 2020 / Creo (creo-03) | |
| Média da turma Workstation (47.2 - 185.7, n=12, últimos 2 anos) | |
| HP ZBook Fury 15 G8 | |
| Asus ProArt StudioBook 16 W7600H5A-2BL2 | |
| Média Intel Xeon W-11955M (n=1) | |
| Dell Precision 5000 5560 | |
| SPECviewperf 2020 / CATIA (catia-06) | |
| Média da turma Workstation (44 - 106, n=12, últimos 2 anos) | |
| Asus ProArt StudioBook 16 W7600H5A-2BL2 | |
| Média Intel Xeon W-11955M (n=1) | |
| HP ZBook Fury 15 G8 | |
| Dell Precision 5000 5560 | |
| SPECviewperf 2020 / 3ds Max (3dsmax-07) | |
| Média da turma Workstation (47.4 - 154.7, n=12, últimos 2 anos) | |
| Asus ProArt StudioBook 16 W7600H5A-2BL2 | |
| Média Intel Xeon W-11955M (n=1) | |
| HP ZBook Fury 15 G8 | |
| Dell Precision 5000 5560 | |
* ... menor é melhor
Desempenho do sistema
O desempenho do sistema também está - de acordo com as expectativas - acima do de todos os rivais. O Asus ProArt Studiobook 16 tem que admitir a derrota apenas para o equivalente de mesa Schenker XMG Ultra 17 com oIntel Core i9 11900K e o Lenovo Thinkpad P1. Não pudemos determinar nenhum problema com o sistema no uso diário e todas as tarefas foram implementadas sem atrasos. Apenas a pequena diferença entre o funcionamento da rede elétrica e o funcionamento da bateria é perceptível ao abrir e fechar programas
| PCMark 10 / Score | |
| Média da turma Workstation (6563 - 10409, n=19, últimos 2 anos) | |
| Schenker XMG Ultra 17 Rocket Lake | |
| Lenovo ThinkPad P1 G4-20Y4S0KS00 | |
| Asus ProArt StudioBook 16 W7600H5A-2BL2 | |
| Média Intel Xeon W-11955M, NVIDIA RTX A5000 Laptop GPU (n=1) | |
| HP ZBook Fury 15 G8 | |
| HP ZBook Studio 15 G8 | |
| Dell Precision 5000 5560 | |
| PCMark 10 / Essentials | |
| Schenker XMG Ultra 17 Rocket Lake | |
| Lenovo ThinkPad P1 G4-20Y4S0KS00 | |
| Dell Precision 5000 5560 | |
| Média da turma Workstation (9622 - 11157, n=19, últimos 2 anos) | |
| Asus ProArt StudioBook 16 W7600H5A-2BL2 | |
| Média Intel Xeon W-11955M, NVIDIA RTX A5000 Laptop GPU (n=1) | |
| HP ZBook Fury 15 G8 | |
| HP ZBook Studio 15 G8 | |
| PCMark 10 / Productivity | |
| Média da turma Workstation (8789 - 20616, n=19, últimos 2 anos) | |
| Schenker XMG Ultra 17 Rocket Lake | |
| Dell Precision 5000 5560 | |
| Asus ProArt StudioBook 16 W7600H5A-2BL2 | |
| Média Intel Xeon W-11955M, NVIDIA RTX A5000 Laptop GPU (n=1) | |
| Lenovo ThinkPad P1 G4-20Y4S0KS00 | |
| HP ZBook Fury 15 G8 | |
| HP ZBook Studio 15 G8 | |
| PCMark 10 / Digital Content Creation | |
| Média da turma Workstation (8108 - 15631, n=19, últimos 2 anos) | |
| Schenker XMG Ultra 17 Rocket Lake | |
| Lenovo ThinkPad P1 G4-20Y4S0KS00 | |
| Asus ProArt StudioBook 16 W7600H5A-2BL2 | |
| Média Intel Xeon W-11955M, NVIDIA RTX A5000 Laptop GPU (n=1) | |
| HP ZBook Fury 15 G8 | |
| HP ZBook Studio 15 G8 | |
| Dell Precision 5000 5560 | |
| PCMark 10 Score | 6951 pontos | |
Ajuda | ||
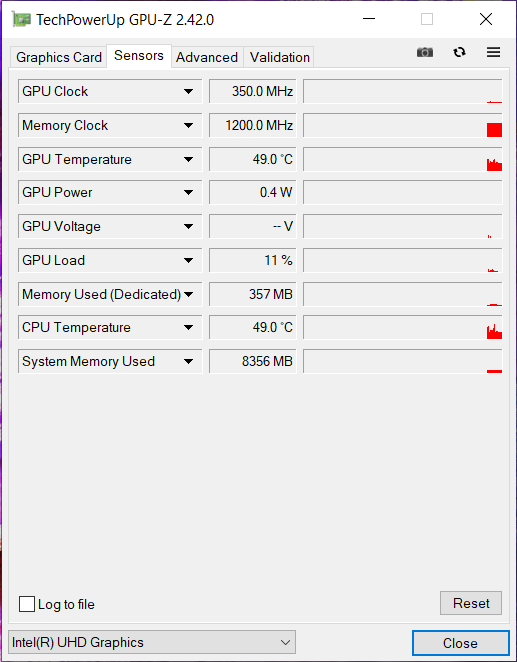
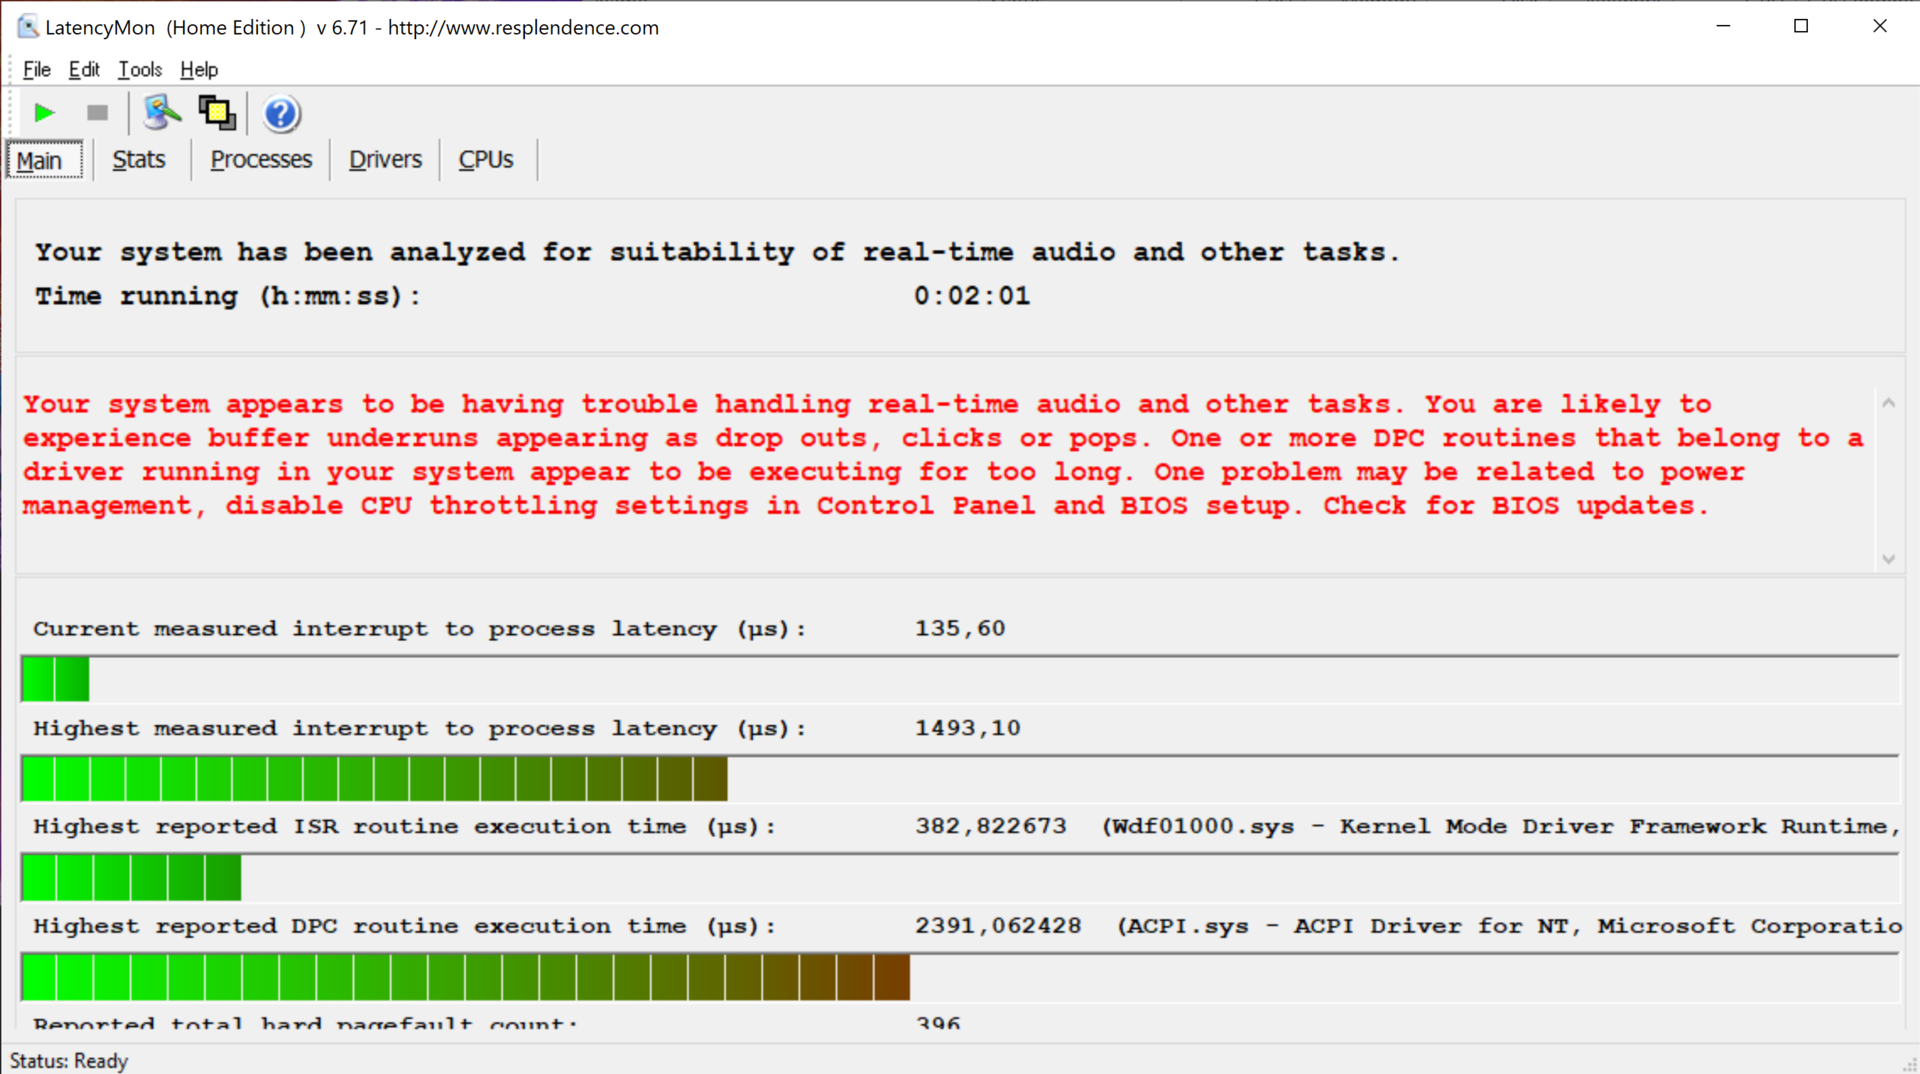
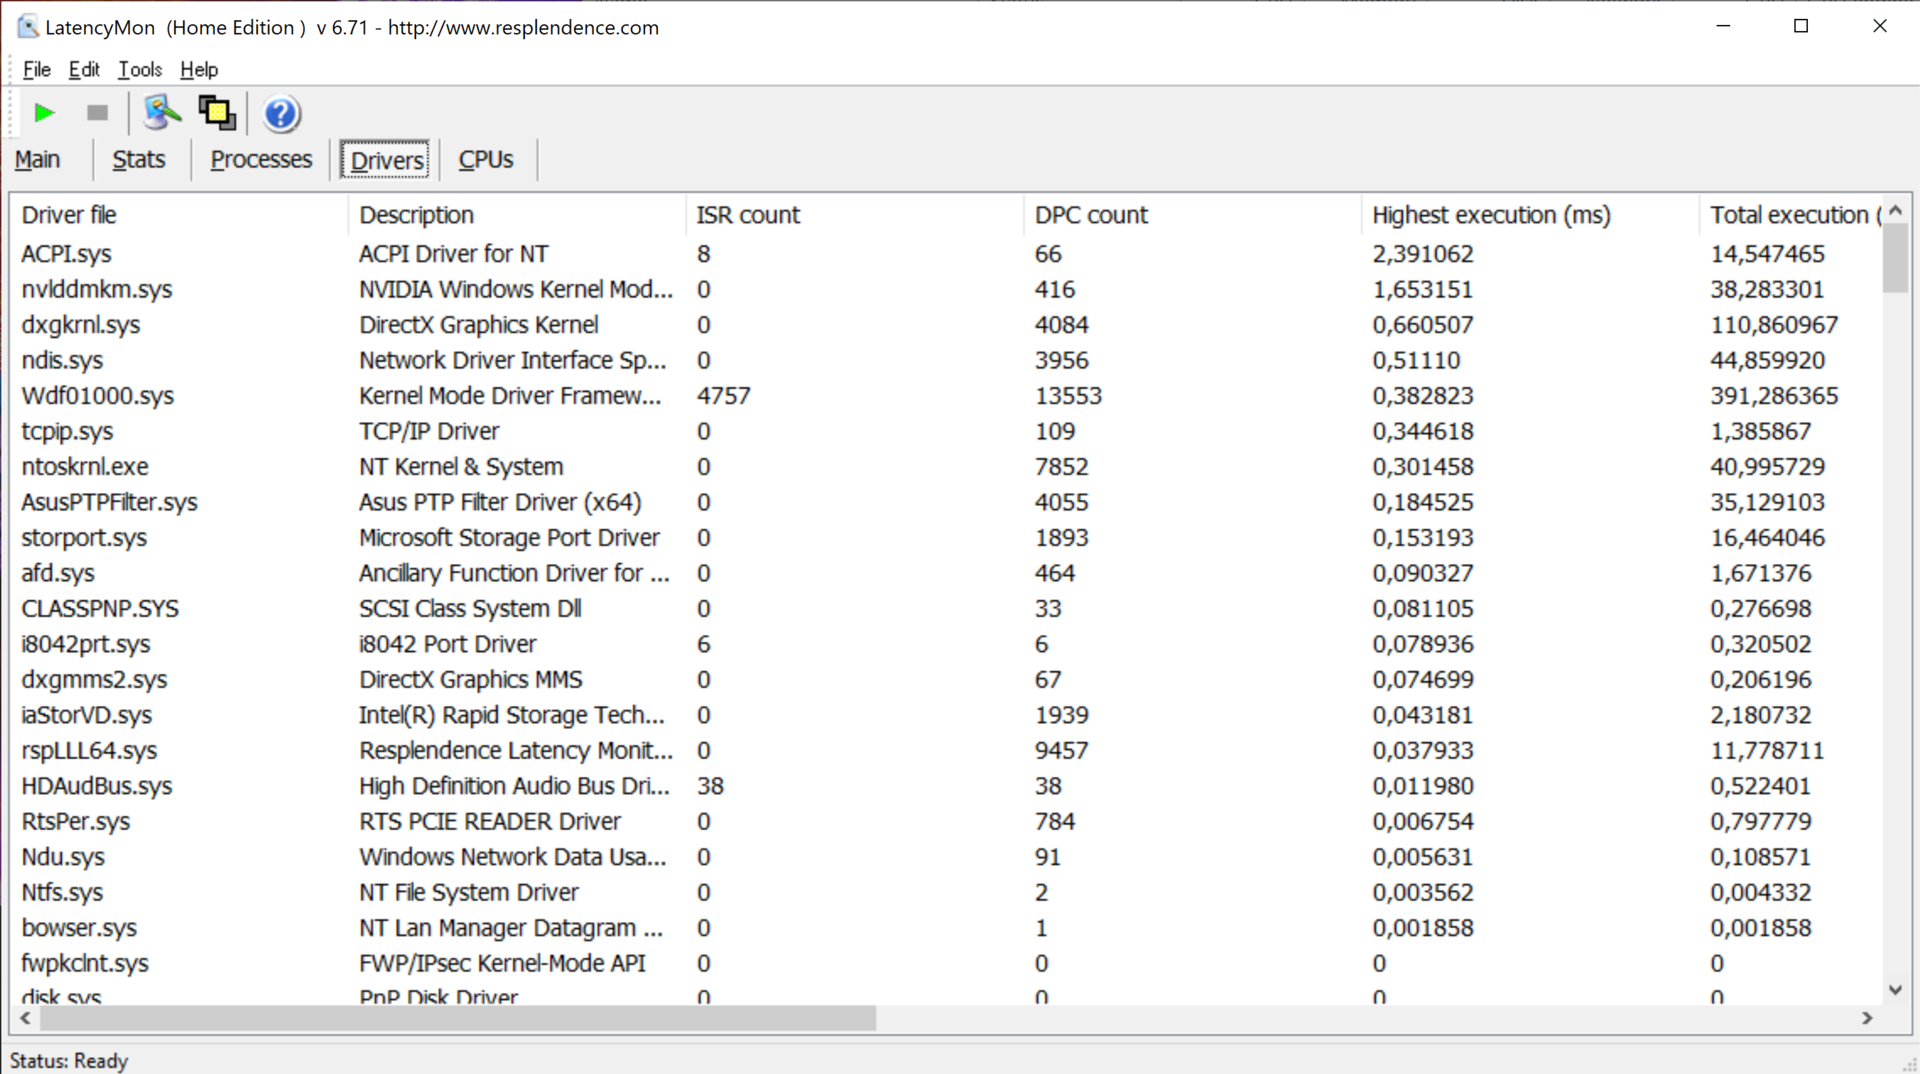
Latências DPC
Como o uso pretendido de nosso dispositivo de teste inclui o trabalho com arquivos de áudio e vídeo, as latências do DPC podem causar problemas. O teste mostrou a necessidade de otimização em termos de latências, e nosso próprio dispositivo havia perdido quadros durante nosso teste de vídeo no Youtube.
| DPC Latencies / LatencyMon - interrupt to process latency (max), Web, Youtube, Prime95 | |
| HP ZBook Studio 15 G8 | |
| Asus ProArt StudioBook 16 W7600H5A-2BL2 | |
| Dell Precision 5000 5560 | |
| HP ZBook Fury 15 G8 | |
* ... menor é melhor
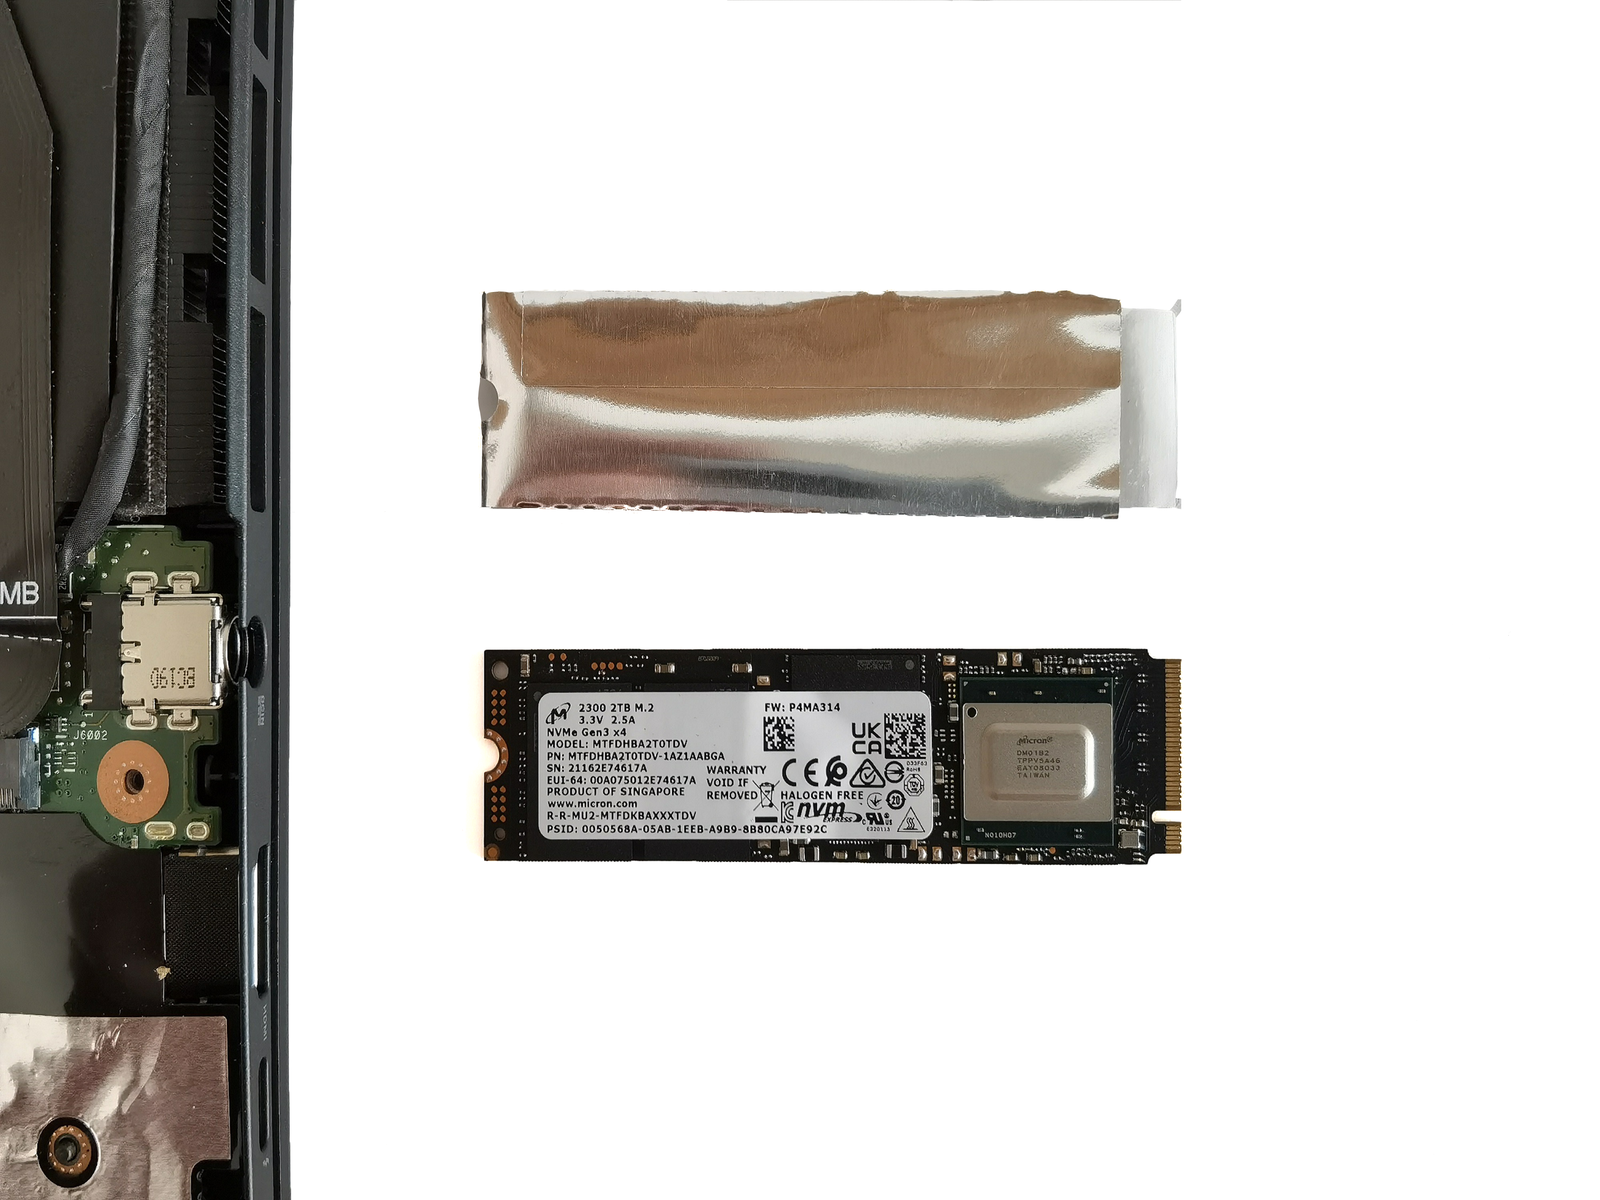
Armazenamento
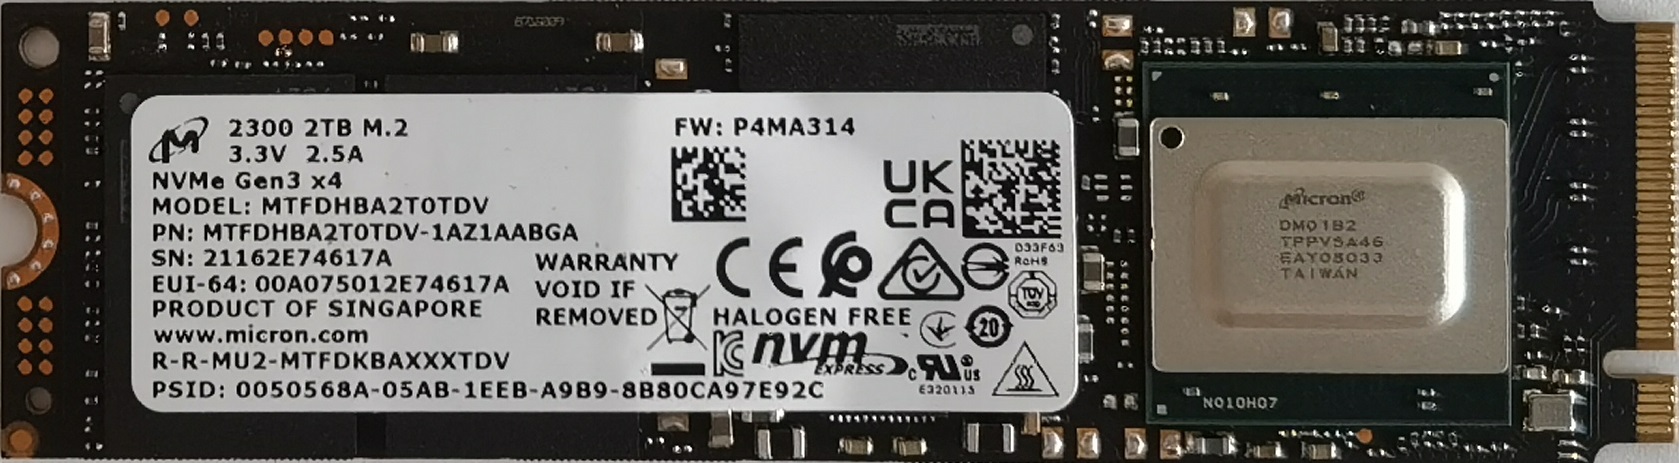
O dispositivo de pré-produção suporta teoricamente 2x um SSD M.2 NVMe com PCIe 4.0, então é questionável por que o Asus instala dois SSDs com PCIe 3.0 em uma configuração RAID 0 aqui. Estes têm um desempenho bastante medíocre no benchmark AS SSD e Crystal DiskMark, e até mesmo o único SSD PCIe 3.0 em HP Zbook Fury está por trás de nossa configuração em algumas seções de referência. Aqui, também, vemos uma necessidade de otimização: Asus poderia confiar em uma unidade de armazenamento PCIe 4.0 ou deveria otimizar os drivers
| Asus ProArt StudioBook 16 W7600H5A-2BL2 2x Micron 2300 2TB MTFDHBA2T0TDV (RAID 0) | HP ZBook Fury 15 G8 Samsung PM981a MZVLB1T0HBLR | Schenker XMG Ultra 17 Rocket Lake Samsung SSD 980 Pro 2TB MZ-V8P2T0 | HP ZBook Studio 15 G8 Samsung PM981a MZVLB2T0HALB | Dell Precision 5000 5560 Samsung PM9A1 MZVL22T0HBLB | Lenovo ThinkPad P1 G4-20Y4S0KS00 Samsung PM9A1 MZVL21T0HCLR | Média 2x Micron 2300 2TB MTFDHBA2T0TDV (RAID 0) | |
|---|---|---|---|---|---|---|---|
| CrystalDiskMark 5.2 / 6 | 38% | 174% | 44% | 110% | 0% | ||
| Write 4K (MB/s) | 105.6 | 96.3 -9% | 240 127% | 110.5 5% | 172.4 63% | 105.6 ? 0% | |
| Read 4K (MB/s) | 50.2 | 51.5 3% | 87.8 75% | 51.8 3% | 78.8 57% | 50.2 ? 0% | |
| Write Seq (MB/s) | 445.6 | 1942 336% | 4281 861% | 2071 365% | 2991 571% | 446 ? 0% | |
| Read Seq (MB/s) | 753 | 2504 233% | 4228 461% | 2505 233% | 3351 345% | 753 ? 0% | |
| Write 4K Q32T1 (MB/s) | 2713 | 346.6 -87% | 696 -74% | 429.8 -84% | 459.2 -83% | 2713 ? 0% | |
| Read 4K Q32T1 (MB/s) | 2399 | 408 -83% | 778 -68% | 418.3 -83% | 484.3 -80% | 2399 ? 0% | |
| Write Seq Q32T1 (MB/s) | 5378 | 3019 -44% | 5195 -3% | 3060 -43% | 4761 -11% | 5378 ? 0% | |
| Read Seq Q32T1 (MB/s) | 6189 | 3514 -43% | 7099 15% | 3539 -43% | 7071 14% | 6189 ? 0% | |
| AS SSD | -21% | 80% | 14% | 35% | 85% | 0% | |
| Seq Read (MB/s) | 4317 | 2937 -32% | 5010 16% | 2953 -32% | 5169 20% | 4526 5% | 4317 ? 0% |
| Seq Write (MB/s) | 2037 | 1688 -17% | 3974 95% | 1691 -17% | 1986 -3% | 3988 96% | 2037 ? 0% |
| 4K Read (MB/s) | 48.97 | 44.27 -10% | 51.9 6% | 43.98 -10% | 78 59% | 82.9 69% | 49 ? 0% |
| 4K Write (MB/s) | 112.4 | 105.8 -6% | 156.8 40% | 105.4 -6% | 214.6 91% | 207.5 85% | 112.4 ? 0% |
| 4K-64 Read (MB/s) | 1253 | 873 -30% | 2611 108% | 1065 -15% | 1232 -2% | 2751 120% | 1253 ? 0% |
| 4K-64 Write (MB/s) | 1473 | 1996 36% | 3859 162% | 1957 33% | 2719 85% | 3270 122% | 1473 ? 0% |
| Access Time Read * (ms) | 0.045 | 0.048 -7% | 0.072 -60% | 0.04 11% | 0.024 47% | 0.024 47% | 0.045 ? -0% |
| Access Time Write * (ms) | 0.083 | 0.107 -29% | 0.026 69% | 0.105 -27% | 0.059 29% | 0.021 75% | 0.083 ? -0% |
| Score Read (Points) | 1765 | 1211 -31% | 3164 79% | 1404 -20% | 1827 4% | 3287 86% | 1765 ? 0% |
| Score Write (Points) | 1722 | 2271 32% | 4414 156% | 2232 30% | 3133 82% | 3876 125% | 1722 ? 0% |
| Score Total (Points) | 4256 | 4046 -5% | 9134 115% | 4297 1% | 5753 35% | 8821 107% | 4256 ? 0% |
| Copy ISO MB/s (MB/s) | 2441 | 901 -63% | 3424 40% | 2474 1% | 3201 31% | 2441 ? 0% | |
| Copy Program MB/s (MB/s) | 395.7 | 118.7 -70% | 1091 176% | 1074 171% | 415.8 5% | 396 ? 0% | |
| Copy Game MB/s (MB/s) | 1115 | 372 -67% | 2365 112% | 1929 73% | 1212 9% | 1115 ? 0% | |
| Média Total (Programa/Configurações) | 9% /
0% | 127% /
114% | 29% /
25% | 73% /
62% | 85% /
85% | 0% /
0% |
* ... menor é melhor

Constant Performance Reading: DiskSpd Read Loop, Queue Depth 8
Placa gráfica
Graças ao sistema de resfriamento instalado e a um TDP de até 110 watts, o RTX A5000 com sua VRAM de 16 GB é convincente em termos de desempenho gráfico puro e, portanto, está 15 a 20 por cento à frente do HP ZBook Fury nos padrões de referência sintéticos.
| 3DMark Fire Strike Score | 22819 pontos | |
| 3DMark Fire Strike Extreme Score | 12825 pontos | |
| 3DMark Time Spy Score | 10157 pontos | |
Ajuda | ||
Desempenho do jogo
Embora nosso dispositivo de pré-produção não esteja otimizado para jogos, ele ainda gerencia a maioria dos títulos em QHD. No entanto, a exibição é limitada aos 60 Hz. Entre os concorrentes, apenas as potências de jogos reais - como o Schenker XMG Ultra - podem claramente superar nossa amostra de revisão. No geral, o desempenho em jogos do Asus ProArt Studiobook Pro 16 está no nível inferior de um RTX 3080
Como esperado, o desempenho do jogo é muito limitado na energia da bateria.
| The Witcher 3 | |
| 1920x1080 High Graphics & Postprocessing (Nvidia HairWorks Off) | |
| Schenker XMG Ultra 17 Rocket Lake | |
| MSI GS76 Stealth 11UH | |
| Média da turma Workstation (n=1últimos 2 anos) | |
| HP ZBook Studio 15 G8 | |
| Média NVIDIA RTX A5000 Laptop GPU (124 - 179, n=3) | |
| HP ZBook Fury 15 G8 | |
| Asus ProArt StudioBook 16 W7600H5A-2BL2 | |
| Dell Precision 5000 5560 | |
| 1920x1080 Ultra Graphics & Postprocessing (HBAO+) | |
| Schenker XMG Ultra 17 Rocket Lake | |
| MSI GS76 Stealth 11UH | |
| Média da turma Workstation (n=1últimos 2 anos) | |
| Média NVIDIA RTX A5000 Laptop GPU (81.7 - 98.3, n=3) | |
| Asus ProArt StudioBook 16 W7600H5A-2BL2 | |
| HP ZBook Fury 15 G8 | |
| HP ZBook Studio 15 G8 | |
| Dell Precision 5000 5560 | |
| Metro Exodus | |
| 3840x2160 Ultra Quality AF:16x | |
| HP ZBook Fury 15 G8 | |
| Média NVIDIA RTX A5000 Laptop GPU (24 - 28.5, n=2) | |
| Asus ProArt StudioBook 16 W7600H5A-2BL2 | |
| 2560x1440 Ultra Quality AF:16x | |
| HP ZBook Fury 15 G8 | |
| Média NVIDIA RTX A5000 Laptop GPU (41 - 46.3, n=2) | |
| Asus ProArt StudioBook 16 W7600H5A-2BL2 | |
| Dell Precision 5000 5560 | |
| 1920x1080 Ultra Quality AF:16x | |
| HP ZBook Fury 15 G8 | |
| Média NVIDIA RTX A5000 Laptop GPU (55 - 59.8, n=2) | |
| Asus ProArt StudioBook 16 W7600H5A-2BL2 | |
| Dell Precision 5000 5560 | |
| 1920x1080 High Quality AF:16x | |
| HP ZBook Fury 15 G8 | |
| Média NVIDIA RTX A5000 Laptop GPU (69 - 74.5, n=2) | |
| Asus ProArt StudioBook 16 W7600H5A-2BL2 | |
| Dell Precision 5000 5560 | |
| F1 2020 | |
| 3840x2160 Ultra High Preset AA:T AF:16x | |
| Asus ProArt StudioBook 16 W7600H5A-2BL2 | |
| Média NVIDIA RTX A5000 Laptop GPU (n=1) | |
| 1920x1080 Ultra High Preset AA:T AF:16x | |
| Asus ProArt StudioBook 16 W7600H5A-2BL2 | |
| Média NVIDIA RTX A5000 Laptop GPU (n=1) | |
| 1920x1080 High Preset AA:T AF:16x | |
| Asus ProArt StudioBook 16 W7600H5A-2BL2 | |
| Média NVIDIA RTX A5000 Laptop GPU (n=1) | |
| F1 2021 | |
| 3840x2160 Ultra High Preset + Raytracing AA:T AF:16x | |
| Asus ProArt StudioBook 16 W7600H5A-2BL2 | |
| MSI GS76 Stealth 11UH | |
| Média NVIDIA RTX A5000 Laptop GPU (38 - 53.6, n=3) | |
| HP ZBook Fury 15 G8 | |
| 2560x1440 Ultra High Preset + Raytracing AA:T AF:16x | |
| MSI GS76 Stealth 11UH | |
| Asus ProArt StudioBook 16 W7600H5A-2BL2 | |
| Média NVIDIA RTX A5000 Laptop GPU (59 - 88.2, n=3) | |
| HP ZBook Fury 15 G8 | |
| Dell Precision 5000 5560 | |
| 1920x1080 Ultra High Preset + Raytracing AA:T AF:16x | |
| MSI GS76 Stealth 11UH | |
| Asus ProArt StudioBook 16 W7600H5A-2BL2 | |
| Média NVIDIA RTX A5000 Laptop GPU (85 - 109, n=3) | |
| HP ZBook Fury 15 G8 | |
| Dell Precision 5000 5560 | |
| 1920x1080 High Preset AA:T AF:16x | |
| MSI GS76 Stealth 11UH | |
| Asus ProArt StudioBook 16 W7600H5A-2BL2 | |
| Média NVIDIA RTX A5000 Laptop GPU (122 - 161, n=3) | |
| HP ZBook Fury 15 G8 | |
| Dell Precision 5000 5560 | |
| Cyberpunk 2077 1.0 | |
| 3840x2160 Ultra Preset | |
| Média NVIDIA RTX A5000 Laptop GPU (16.7 - 25, n=2) | |
| Asus ProArt StudioBook 16 W7600H5A-2BL2 | |
| 2560x1440 Ultra Preset | |
| Média NVIDIA RTX A5000 Laptop GPU (37.1 - 51, n=2) | |
| Asus ProArt StudioBook 16 W7600H5A-2BL2 | |
| 1920x1080 Ultra Preset | |
| Schenker XMG Ultra 17 Rocket Lake | |
| Média NVIDIA RTX A5000 Laptop GPU (58.6 - 78, n=2) | |
| Asus ProArt StudioBook 16 W7600H5A-2BL2 | |
| 1920x1080 High Preset | |
| Schenker XMG Ultra 17 Rocket Lake | |
| Média NVIDIA RTX A5000 Laptop GPU (68.1 - 90, n=2) | |
| Asus ProArt StudioBook 16 W7600H5A-2BL2 | |
Em nosso teste de 60 minutos com o The Witcher 3 (FHD/Ultra), o desempenho permanece relativamente constante durante todo o teste.
Witcher 3 FPS Diagramm
| baixo | média | alto | ultra | QHD | 4K | |
|---|---|---|---|---|---|---|
| GTA V (2015) | 180 | 175 | 158 | 85.8 | 82.2 | 76.3 |
| The Witcher 3 (2015) | 321 | 217.9 | 124 | 89.9 | 54.8 | |
| Dota 2 Reborn (2015) | 144 | 136 | 124 | 117 | 118 | |
| Final Fantasy XV Benchmark (2018) | 184 | 123 | 91.8 | 70.6 | 41 | |
| X-Plane 11.11 (2018) | 117 | 102 | 81.6 | 52 | ||
| Far Cry 5 (2018) | 76 | 69 | 62 | 60 | 58 | 36 |
| Strange Brigade (2018) | 419 | 231 | 192 | 160 | 129 | |
| Metro Exodus (2019) | 148 | 126 | 69 | 55 | 41 | 24 |
| F1 2020 (2020) | 253 | 181 | 164 | 133 | 63.1 | |
| Cyberpunk 2077 1.0 (2020) | 114.6 | 83.1 | 68.1 | 58.6 | 37.1 | 16.7 |
| F1 2021 (2021) | 269 | 171 | 159 | 104 | 82.8 | 48.7 |
Emissões: O alto desempenho tem seu preço
Emissões sonoras
Mesmo em modo inativo, os ventiladores têm sua palavra a dizer e quase nunca ficam parados. Sob carga, os ventiladores são claramente audíveis e se adaptam ao desempenho exigido. Vários ajustes para a velocidade dos ventiladores podem ser feitos no ProArt Creator Hub. Os usuários podem escolher entre três modos: Modo padrão, modo Performance e Velocidade total do ventilador. No teste, verificou-se que as vantagens sob a velocidade total do ventilador são muito marginais.
Barulho
| Ocioso |
| 26 / 26 / 26.5 dB |
| Carga |
| 42 / 43 dB |
 | ||
30 dB silencioso 40 dB(A) audível 50 dB(A) ruidosamente alto |
||
min: | ||
Temperatura
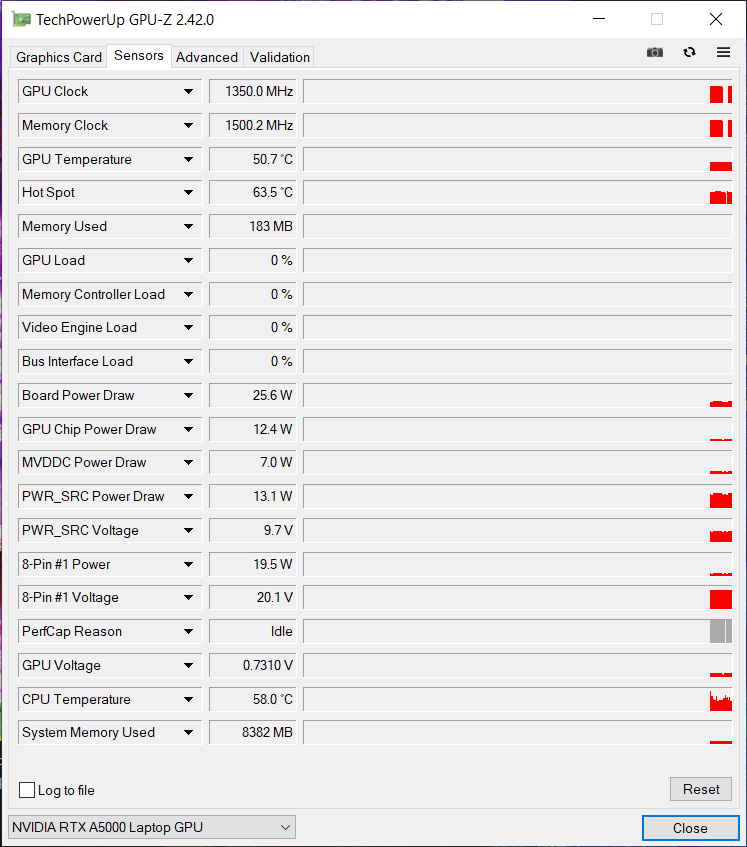
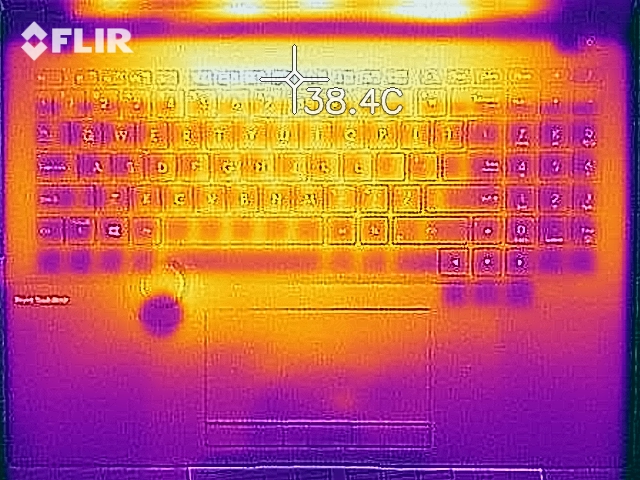
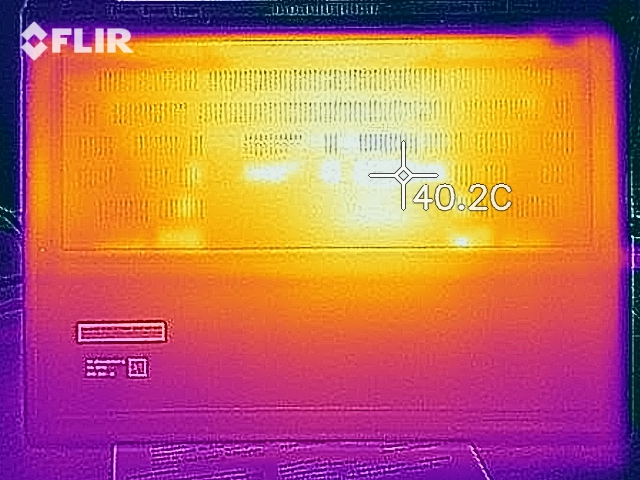
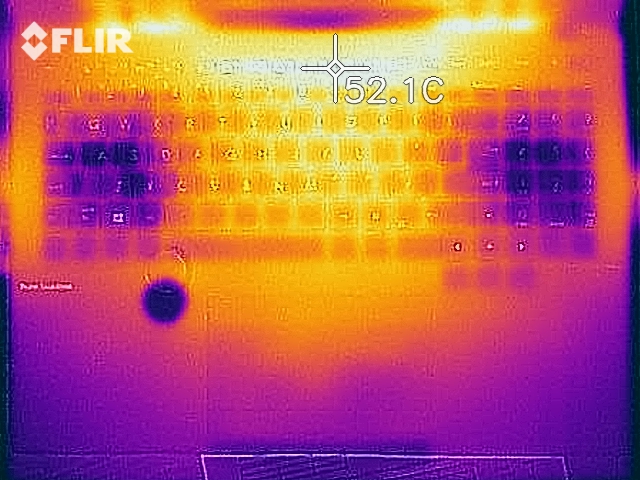
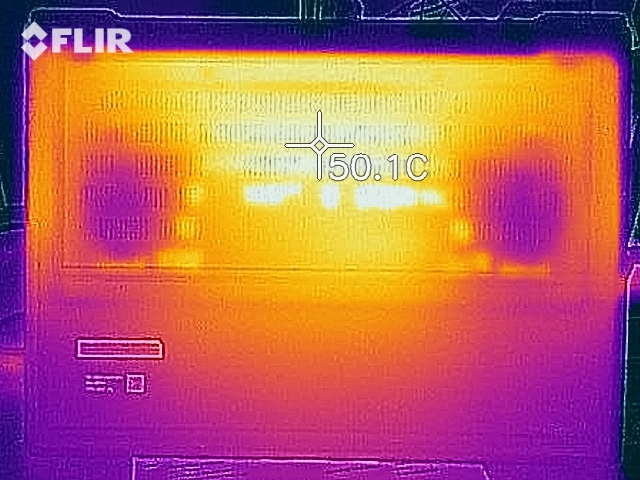
Muita energia gera muito calor desperdiçado. Este também é o caso em nossa amostra de pré-produção, porque o dispositivo nunca permanece realmente frio. Com o lote de carga na CPU, as temperaturas rapidamente excedem 100 °C. A GPU, por outro lado, faz um pouco melhor e só atinge pouco mais de 80 °C. As temperaturas de superfície são correspondentemente moderadas.
(-) A temperatura máxima no lado superior é 45.7 °C / 114 F, em comparação com a média de 38.2 °C / 101 F , variando de 22.2 a 69.8 °C para a classe Workstation.
(-) A parte inferior aquece até um máximo de 48.3 °C / 119 F, em comparação com a média de 41.1 °C / 106 F
(+) Em uso inativo, a temperatura média para o lado superior é 31.6 °C / 89 F, em comparação com a média do dispositivo de 32 °C / ### class_avg_f### F.
(+) Os apoios para as mãos e o touchpad estão atingindo a temperatura máxima da pele (35.2 °C / 95.4 F) e, portanto, não estão quentes.
(-) A temperatura média da área do apoio para as mãos de dispositivos semelhantes foi 27.8 °C / 82 F (-7.4 °C / -13.4 F).
Oradores
A qualidade de áudio do ProArt Studiobook Pro 16 é muito boa e muito equilibrada. O som bom, limpo e completo em volumes mais baixos e mais altos, bem como os graves ricos, são particularmente excelentes
Asus ProArt StudioBook 16 W7600H5A-2BL2 análise de áudio
(±) | o volume do alto-falante é médio, mas bom (###valor### dB)
Graves 100 - 315Hz
(-) | quase nenhum baixo - em média 17% menor que a mediana
(±) | a linearidade dos graves é média (10.4% delta para a frequência anterior)
Médios 400 - 2.000 Hz
(+) | médios equilibrados - apenas 1.2% longe da mediana
(+) | médios são lineares (5.1% delta para frequência anterior)
Altos 2 - 16 kHz
(±) | máximos mais altos - em média 5.1% maior que a mediana
(+) | os máximos são lineares (4.9% delta da frequência anterior)
Geral 100 - 16.000 Hz
(±) | a linearidade do som geral é média (16.5% diferença em relação à mediana)
Comparado com a mesma classe
» 46% de todos os dispositivos testados nesta classe foram melhores, 7% semelhantes, 47% piores
» O melhor teve um delta de 7%, a média foi 17%, o pior foi 35%
Comparado com todos os dispositivos testados
» 28% de todos os dispositivos testados foram melhores, 6% semelhantes, 66% piores
» O melhor teve um delta de 4%, a média foi 23%, o pior foi 134%
HP ZBook Fury 15 G8 análise de áudio
(±) | o volume do alto-falante é médio, mas bom (###valor### dB)
Graves 100 - 315Hz
(±) | graves reduzidos - em média 10.6% menor que a mediana
(±) | a linearidade dos graves é média (8.8% delta para a frequência anterior)
Médios 400 - 2.000 Hz
(+) | médios equilibrados - apenas 3.9% longe da mediana
(+) | médios são lineares (4.8% delta para frequência anterior)
Altos 2 - 16 kHz
(+) | agudos equilibrados - apenas 2.9% longe da mediana
(+) | os máximos são lineares (5.3% delta da frequência anterior)
Geral 100 - 16.000 Hz
(+) | o som geral é linear (11.9% diferença em relação à mediana)
Comparado com a mesma classe
» 17% de todos os dispositivos testados nesta classe foram melhores, 4% semelhantes, 79% piores
» O melhor teve um delta de 7%, a média foi 17%, o pior foi 35%
Comparado com todos os dispositivos testados
» 9% de todos os dispositivos testados foram melhores, 2% semelhantes, 89% piores
» O melhor teve um delta de 4%, a média foi 23%, o pior foi 134%
Gerenciamento de energia: Tempos de duração da bateria do Studiobook
Consumo de energia
O consumo de energia ociosa com um mínimo de 12,4 e um máximo de 25 watts é ligeiramente maior do que no HP ZBook Fury.
O fornecimento de energia é mais que adequadamente dimensionado com 240 watts, mas o consumo máximo de energia é de apenas 134 watts. Isto se torna ainda mais óbvio com o The Witcher 3, onde o consumo de energia permanece em 132 watts. Como esta é uma amostra de pré-produção, assumimos que o consumo máximo de energia ainda será ajustado em favor do desempenho.
| desligado | |
| Ocioso | |
| Carga |
|
Key:
min: | |
| Asus ProArt StudioBook 16 W7600H5A-2BL2 W-11955M, RTX A5000 Laptop GPU, 2x Micron 2300 2TB MTFDHBA2T0TDV (RAID 0), OLED, 3840x2400, 16" | HP ZBook Fury 15 G8 i9-11950H, RTX A5000 Laptop GPU, Samsung PM981a MZVLB1T0HBLR, IPS, 3840x2160, 15.6" | HP ZBook Studio 15 G8 i9-11950H, GeForce RTX 3070 Laptop GPU, Samsung PM981a MZVLB2T0HALB, OLED, 3840x2160, 15.6" | Dell Precision 5000 5560 i7-11850H, RTX A2000 Laptop GPU, Samsung PM9A1 MZVL22T0HBLB, IPS, 3840x2400, 15.6" | Lenovo ThinkPad P1 G4-20Y4S0KS00 i7-11850H, GeForce RTX 3070 Laptop GPU, Samsung PM9A1 MZVL21T0HCLR, IPS LED, 3840x2400, 16" | Schenker XMG Ultra 17 Rocket Lake i9-11900K, GeForce RTX 3080 Laptop GPU, Samsung SSD 980 Pro 2TB MZ-V8P2T0, IPS, 1920x1080, 17.3" | Média NVIDIA RTX A5000 Laptop GPU | Média da turma Workstation | |
|---|---|---|---|---|---|---|---|---|
| Power Consumption | -2% | -8% | 22% | 3% | -201% | -5% | 13% | |
| Idle Minimum * (Watt) | 12.4 | 8.3 33% | 11 11% | 6.2 50% | 8.1 35% | 62 -400% | 10.4 ? 16% | 9.11 ? 27% |
| Idle Average * (Watt) | 16.5 | 19.9 -21% | 18.8 -14% | 13.9 16% | 20.2 -22% | 64 -288% | 18.3 ? -11% | 13.8 ? 16% |
| Idle Maximum * (Watt) | 25 | 21.8 13% | 31.7 -27% | 23.8 5% | 21.9 12% | 69 -176% | 22.3 ? 11% | 17.9 ? 28% |
| Load Average * (Watt) | 132 | 110.9 16% | 105.2 20% | 95.7 27% | 88.2 33% | 183 -39% | 125.1 ? 5% | 96 ? 27% |
| Witcher 3 ultra * (Watt) | 132 | 165 -25% | 148 -12% | 87 34% | 149 -13% | 297 -125% | ||
| Load Maximum * (Watt) | 134 | 171.8 -28% | 171.8 -28% | 132.6 1% | 170.6 -27% | 368 -175% | 195.8 ? -46% | 180.3 ? -35% |
* ... menor é melhor
Energy consumption during The Witcher 3 / stress test
Duração da bateria
O tempo de funcionamento da bateria em nosso dispositivo de pré-produção é misto e está atrasado em relação a toda a concorrência. Em nosso teste WLAN padronizado, o dispositivo de teste fica sem ar após 300 minutos.
| Asus ProArt StudioBook 16 W7600H5A-2BL2 W-11955M, RTX A5000 Laptop GPU, 90 Wh | HP ZBook Fury 15 G8 i9-11950H, RTX A5000 Laptop GPU, 94 Wh | HP ZBook Studio 15 G8 i9-11950H, GeForce RTX 3070 Laptop GPU, 83 Wh | Dell Precision 5000 5560 i7-11850H, RTX A2000 Laptop GPU, 86 Wh | Lenovo ThinkPad P1 G4-20Y4S0KS00 i7-11850H, GeForce RTX 3070 Laptop GPU, 90 Wh | Média da turma Workstation | |
|---|---|---|---|---|---|---|
| Duração da bateria | 24% | 24% | 26% | 170% | 266% | |
| H.264 (h) | 1.8 | 7.2 300% | 10.1 ? 461% | |||
| WiFi v1.3 (h) | 5 | 6.2 24% | 6.2 24% | 6.3 26% | 7 40% | 8.55 ? 71% |
| Witcher 3 ultra (h) | 1.6 | |||||
| Load (h) | 1.8 | 1.8 | 1.2 | 1.441 ? | ||
| Reader / Idle (h) | 12.9 | 12 | 26.1 ? |
Veredicto
A primeira impressão do Asus ProArt Studiobook Pro 16 é bastante sólida. O estojo leve e elegante convence com sua liga de magnésio. Uma característica especial aqui é o Controlador de Discagem Asus embutido, que permite ao usuário executar algumas funções particulares em programas de edição de imagem e vídeo com muita precisão. O teclado pode não apenas segurar-se com um bom ponto de pressão, mas também com a digitação geralmente fornecida confortável. O touchpad oferece boas propriedades de deslizamento e tem uma superfície suficiente, mesmo que não seja muito grande. As portas estão bem colocadas e preenchem os requisitos modernos.
Os primeiros testes de desempenho da amostra de pré-produção deixam algumas perguntas sem resposta, mas nos dão uma imagem clara do desempenho esperado. O desempenho gráfico está no mesmo nível de um RTX 3080 de baixo-TDP. O desempenho do sistema é consistentemente bom e não nos deu nenhum motivo para críticas no uso diário. No entanto, pensamos que o Asus ainda tem algumas coisas a otimizar até o lançamento do produto. O consumo máximo de energia de cerca de 134 watts é impressionante, o que não faz justiça à fonte de alimentação de 240 watts.
O Asus ProArt Studiobook Pro 16 estabelece novos padrões para estações de trabalho móveis em termos de qualidade de imagem e cobertura de espaço de cor. Particularmente impressionante é a caixa de alta qualidade e leve, painel 4K OLED HDR no formato 16:10, bem como recursos como o Controlador de Discagem Asus.
O visor OLED, por outro lado, é de primeira linha e ostenta várias certificações e um formato 16:10. A muito boa calibração de fábrica também se destaca positivamente aqui e torna este painel adequado para edição profissional de imagens e vídeos. A qualidade de áudio do Asus ProArt Studiobook Pro 16 também é surpreendente: é muito bom e se destaca com o som limpo e o baixo rico. A característica dos ventiladores é bastante impulsiva em nossa unidade de pré-produção: os ventiladores quase nunca ficam parados e se comportam de forma adaptável ao desempenho exigido. No entanto, eles são claramente audíveis e produzem um ruído de fundo alto, mas aceitável para o desempenho e tamanho do dispositivo.
Preço e disponibilidade
Por ser um dispositivo pré-série, não damos uma classificação para este teste. Gostaríamos de ressaltar que muitas especificações ainda podem ser ajustadas pelo fabricante até o lançamento da série. Uma data de entrega e um preço esperados ainda não são conhecidos
Price comparison
