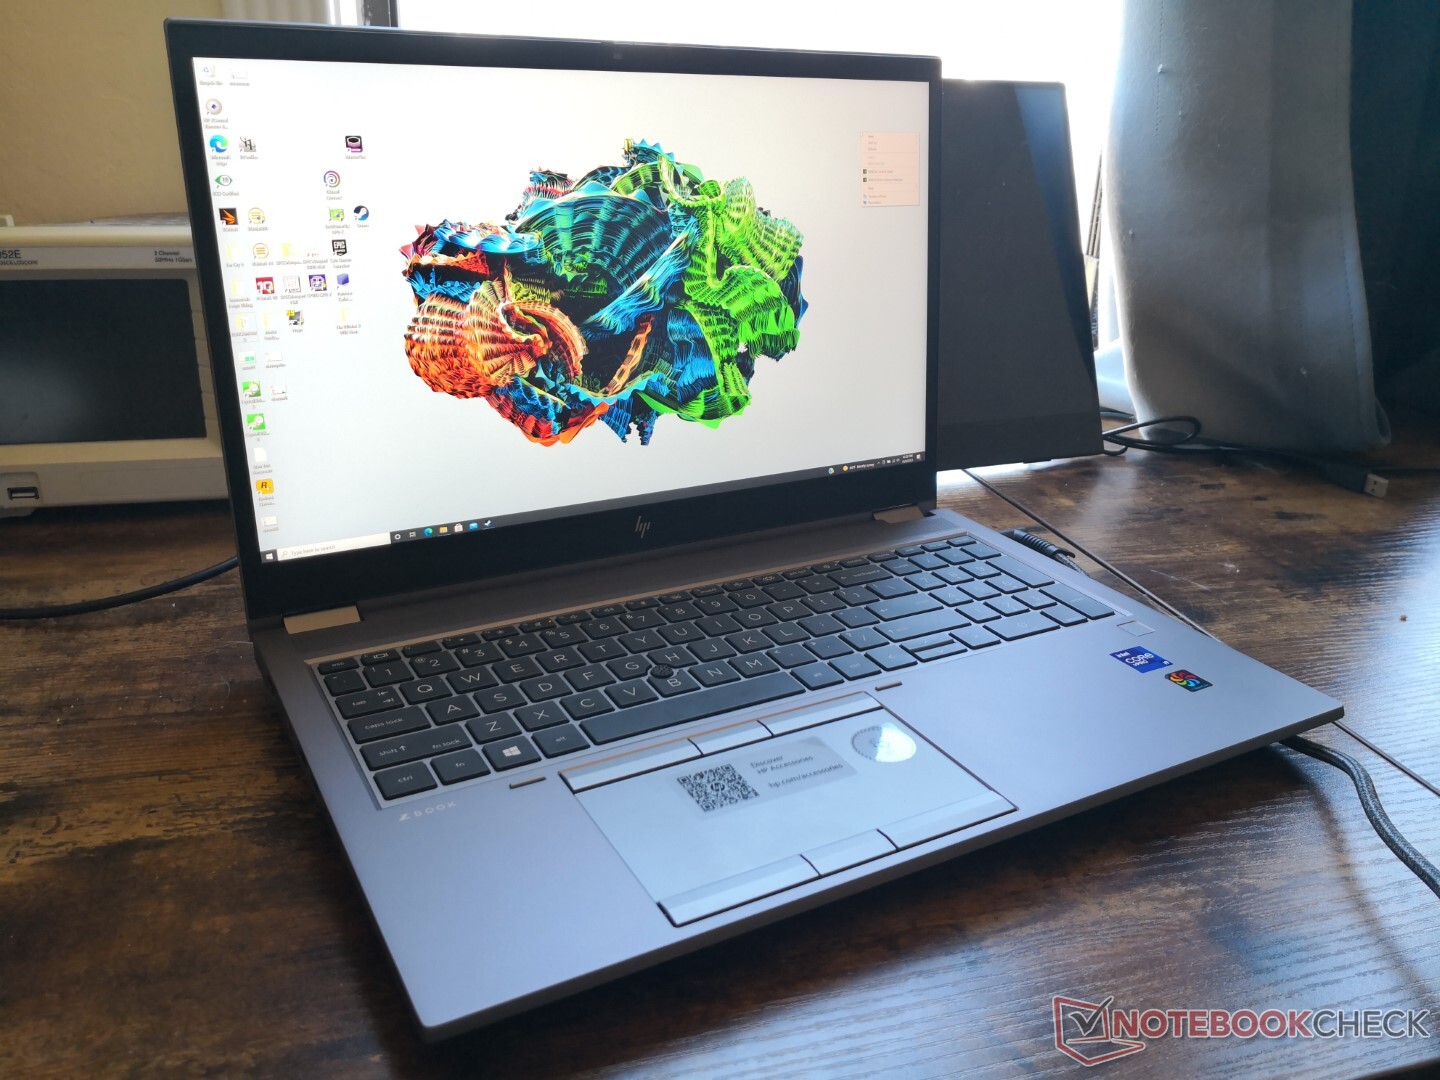
Revisão da estação de trabalho HP ZBook Fury 15 G8: O Quadro RTX A5000 é uma besta
Enquanto o ZBook Fury 15 G7 representou uma revisão maciça sobre o ZBook Fury 15 G6, o último ZBook Fury 15 G8 é uma atualização relativamente menor no geral. O modelo mais recente vem com Tiger Lake-H CPUs e GPUs Nvidia Ampere para substituir as opções Comet Lake-H e Nvidia Turing do ano passado. Sua tela também foi atualizada de 4K 60 Hz para 4K 120 Hz para ser um dos poucos laptops de 15 polegadas com tal opção de painel
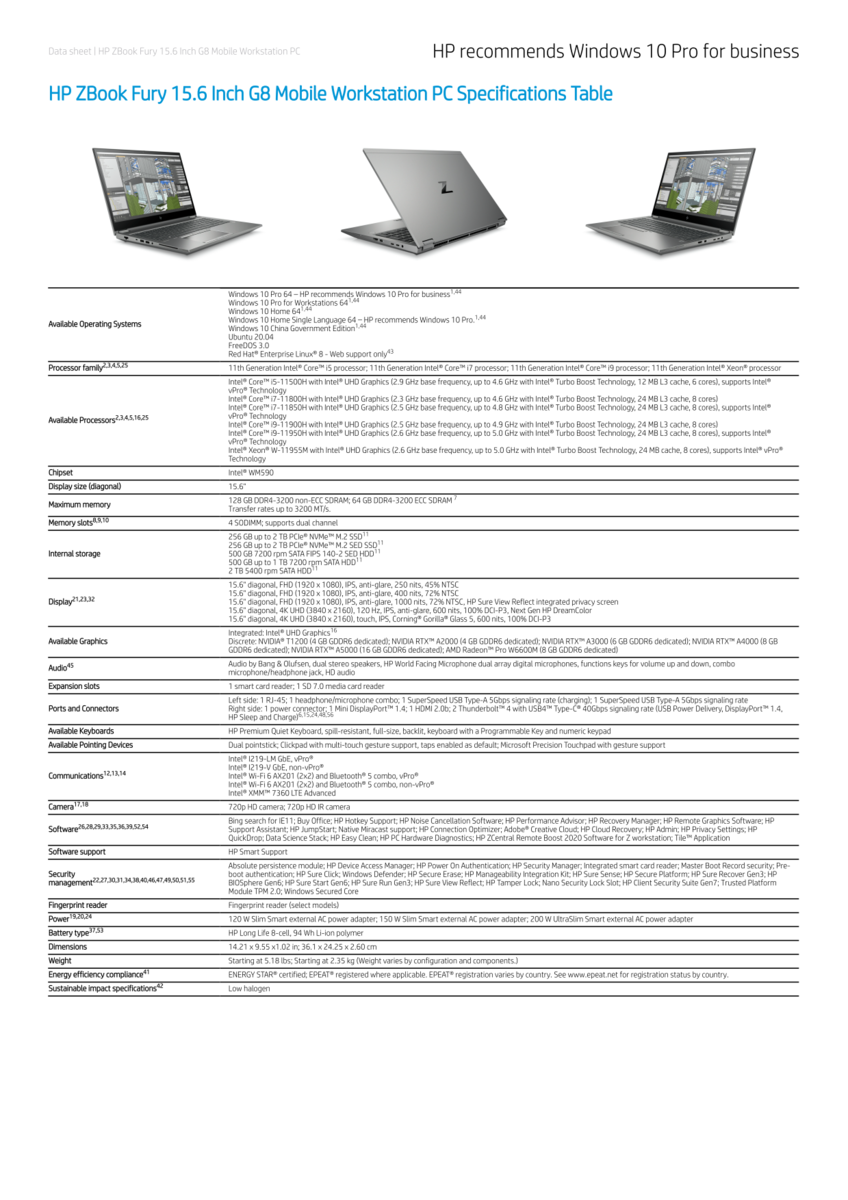
As SKUs vão desde a CPU Core i5-11500H com gráficos integrados e tela NTSC 1080p de 45% por aproximadamente US$ 2000 até a CPU Xeon W-11955M vPro com gráficos Quadro RTX A5000 e tela táctil brilhante 4K UHD 100% DCI-P3 por mais de US$ 6000. Nossa unidade de teste uma configuração superior com a tela Core i9-11950H, RTX A5000, e 4K120 matte por cerca de $5000
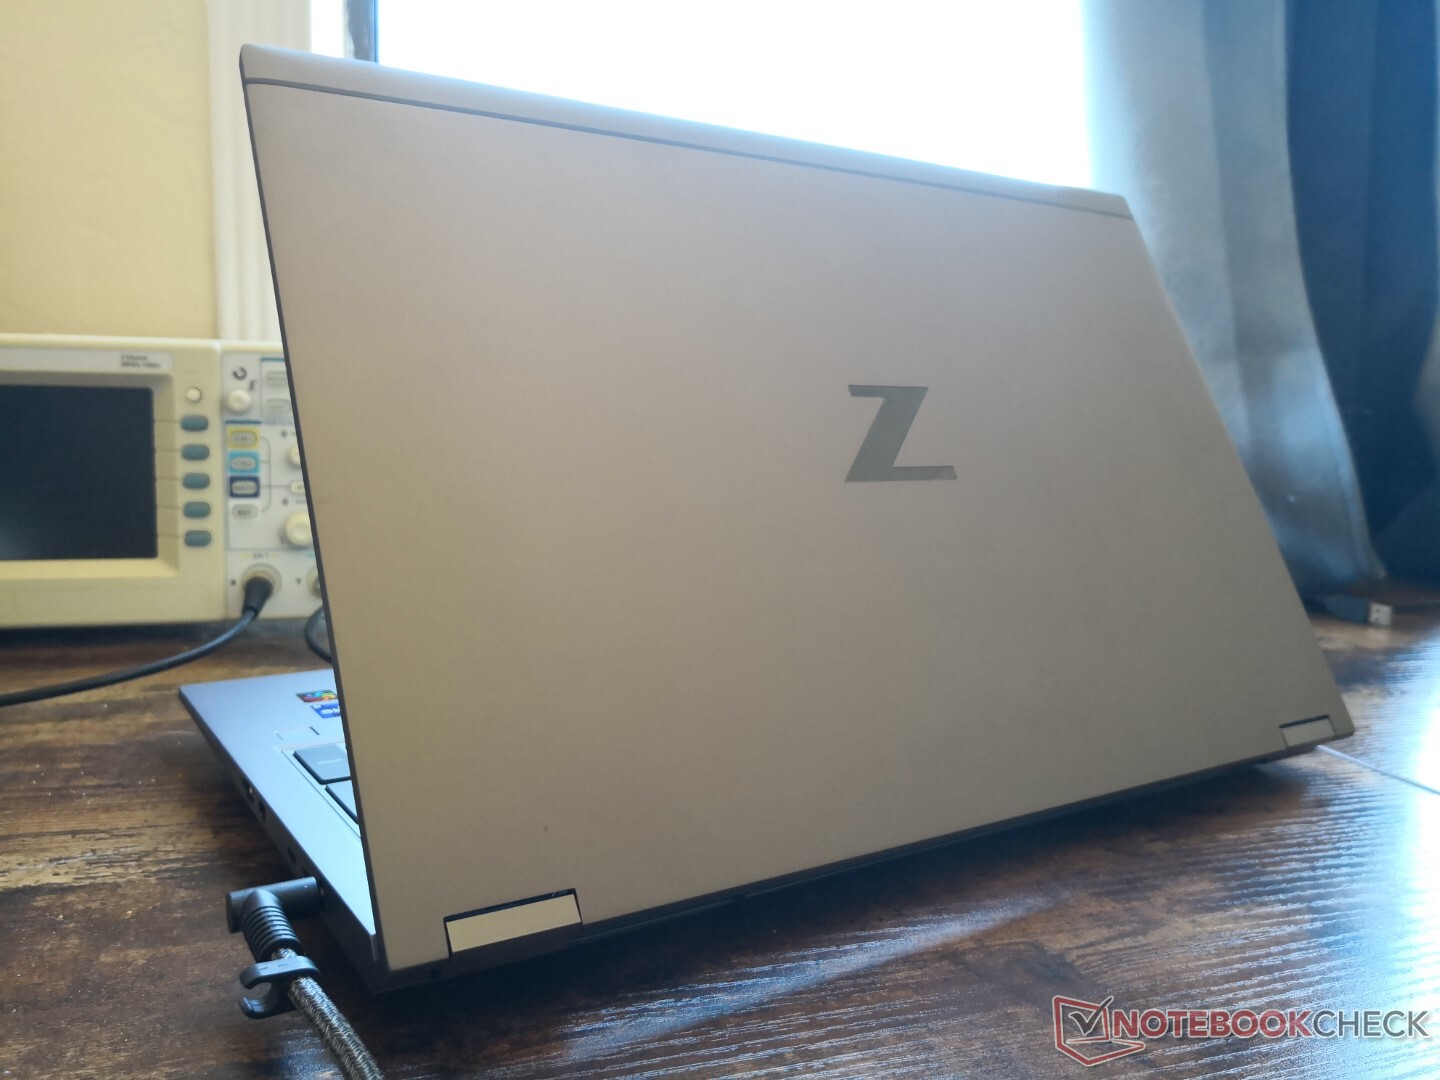
Os concorrentes neste espaço incluem outras estações de trabalho tradicionais de 15,6 polegadas, como a Dell Precision 7550,Lenovo ThinkPad P15 Gen 2e o Série Fujitsu Celsius. Recomendamos verificar nossa revisão existente sobre o ZBook Fury 15 G7 para mais informações sobre o chassi e suas características, uma vez que o Fury 15 G8 utiliza o mesmo esqueleto.
Mais revisões da HP
potential competitors in comparison
Avaliação | Data | Modelo | Peso | Altura | Size | Resolução | Preço |
|---|---|---|---|---|---|---|---|
| 90.3 % v7 (old) | 10/2021 | HP ZBook Fury 15 G8 i9-11950H, RTX A5000 Laptop GPU | 2.5 kg | 25.9 mm | 15.60" | 3840x2160 | |
| 90.2 % v7 (old) | 01/2021 | HP ZBook Fury 15 G7 W-10885M, Quadro RTX 5000 Max-Q | 2.4 kg | 25.9 mm | 15.60" | 3840x2160 | |
| 88.3 % v7 (old) | 10/2021 | Dell Precision 5000 5560 i7-11850H, RTX A2000 Laptop GPU | 2 kg | 18 mm | 15.60" | 3840x2400 | |
| 87.8 % v7 (old) | 08/2021 | HP ZBook Studio 15 G8 i9-11950H, GeForce RTX 3070 Laptop GPU | 1.9 kg | 18 mm | 15.60" | 3840x2160 | |
| 85.3 % v7 (old) | 06/2021 | Lenovo ThinkPad P15s Gen2-20W6000GGE i7-1165G7, T500 Laptop GPU | 1.9 kg | 19.1 mm | 15.60" | 3840x2160 | |
| 82.7 % v7 (old) | 10/2020 | HP ZBook Firefly 15 G7 i7-10610U, Quadro P520 | 1.8 kg | 19.2 mm | 15.60" | 3840x2160 |
Caso - Idêntico ao ZBook Fury 15 G7
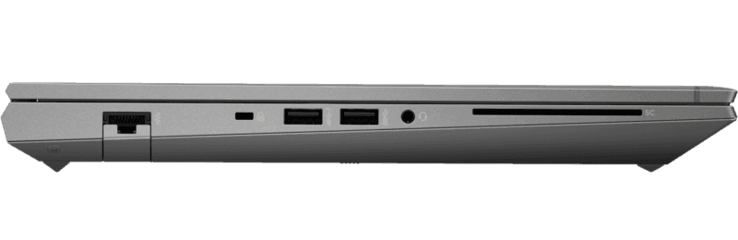
Conectividade
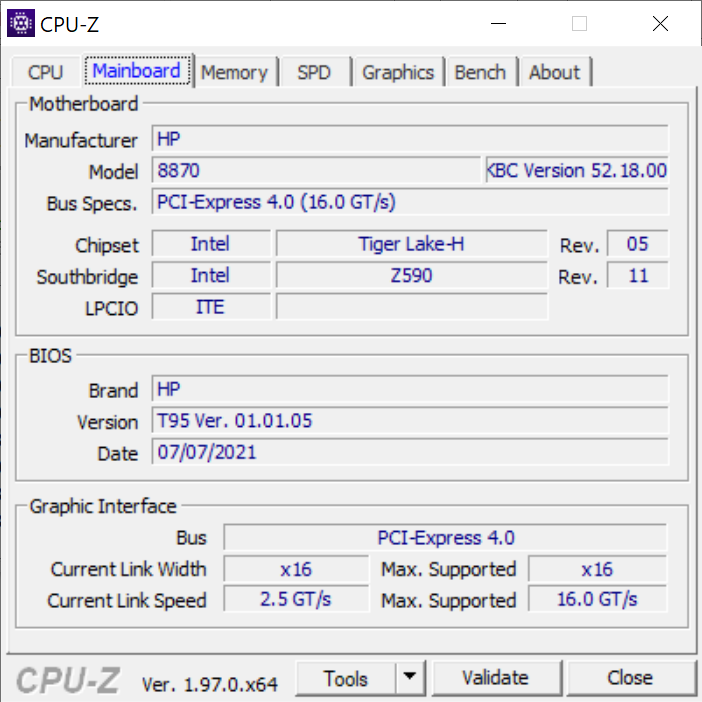
Thunderbolt 4 é suportado em vez de "apenas" Thunderbolt 3 no Fury 15 G7. Caso contrário, os portos permanecem idênticos ano após ano.
Leitor de cartões SD
| SD Card Reader | |
| average JPG Copy Test (av. of 3 runs) | |
| Dell Precision 5000 5560 (AV Pro V60) | |
| HP ZBook Fury 15 G7 (Toshiba Exceria Pro SDXC 64 GB UHS-II) | |
| HP ZBook Fury 15 G8 (AV Pro V60) | |
| HP ZBook Studio 15 G8 (AV Pro V60) | |
| Lenovo ThinkPad P15s Gen2-20W6000GGE (AV Pro V60) | |
| maximum AS SSD Seq Read Test (1GB) | |
| HP ZBook Fury 15 G7 (Toshiba Exceria Pro SDXC 64 GB UHS-II) | |
| Dell Precision 5000 5560 (AV Pro V60) | |
| Lenovo ThinkPad P15s Gen2-20W6000GGE (AV Pro V60) | |
| HP ZBook Studio 15 G8 (AV Pro V60) | |
| HP ZBook Fury 15 G8 (AV Pro V60) | |
Comunicação
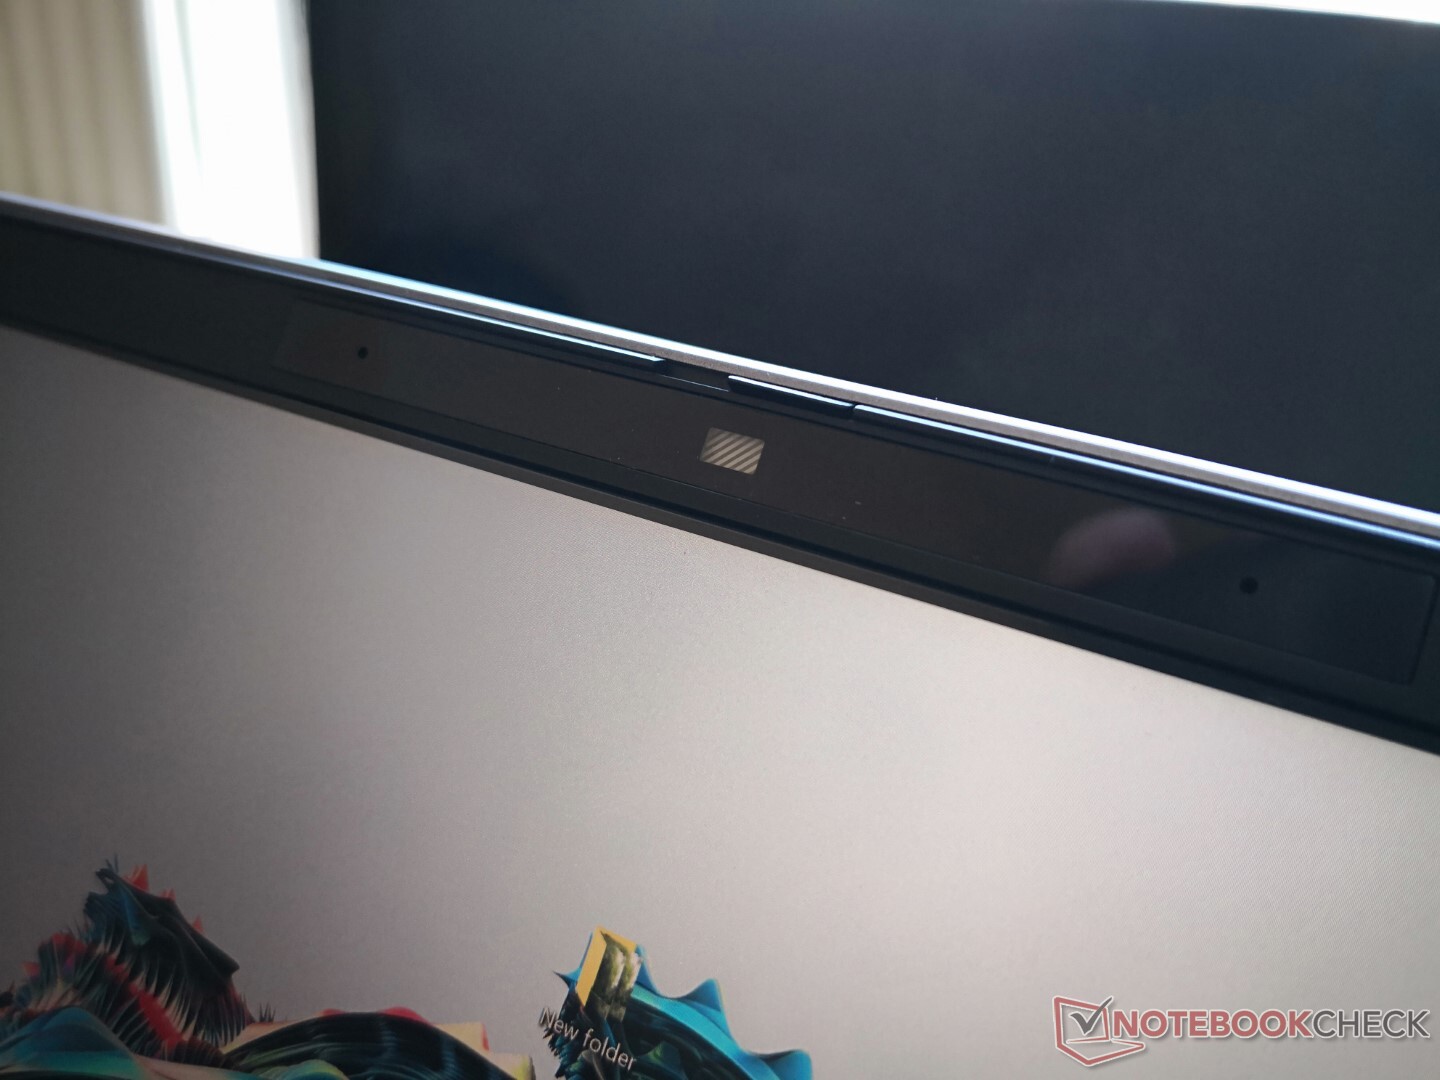
Webcam - Ainda 720p
A qualidade da câmera continua pobre a apenas 720p. Alguns fabricantes gostam de Razer desde então atualizaram suas webcams integradas de 720p para 1080p.


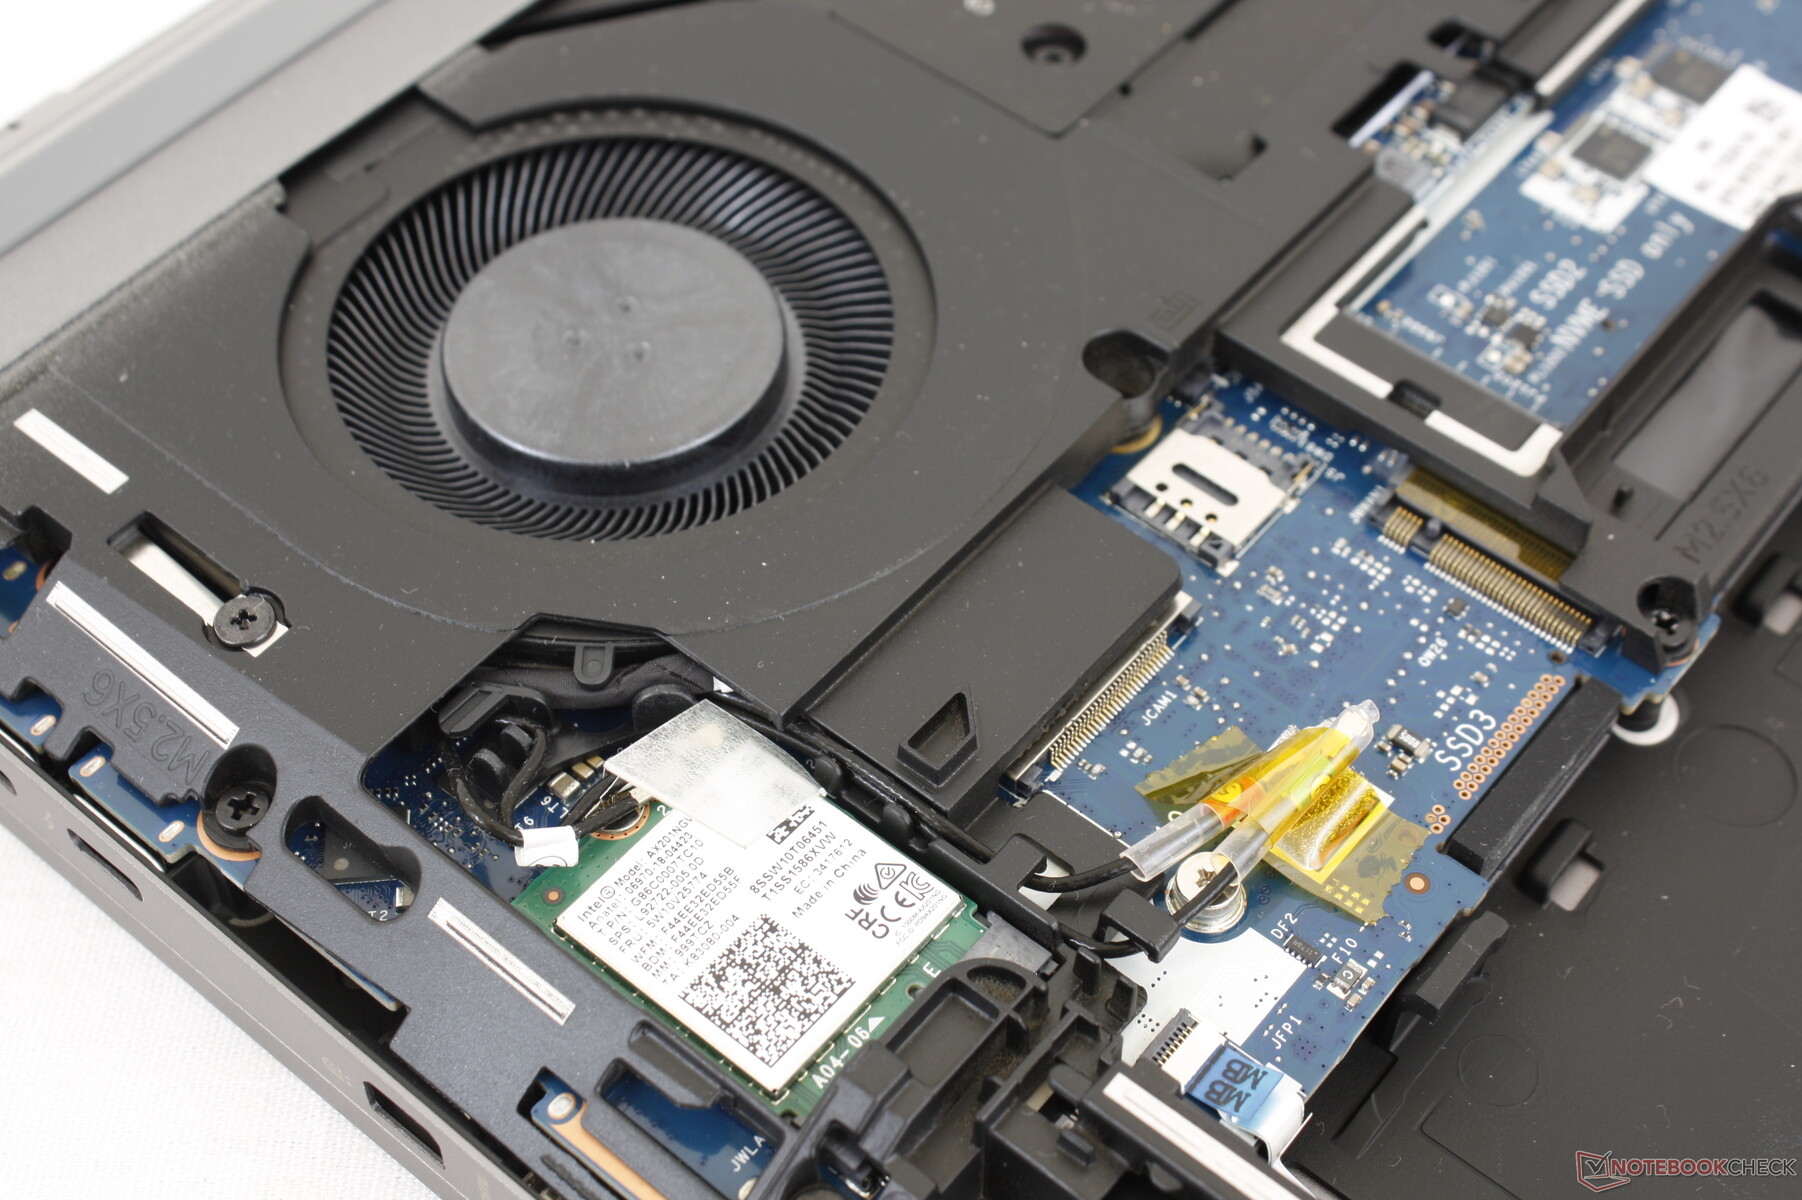
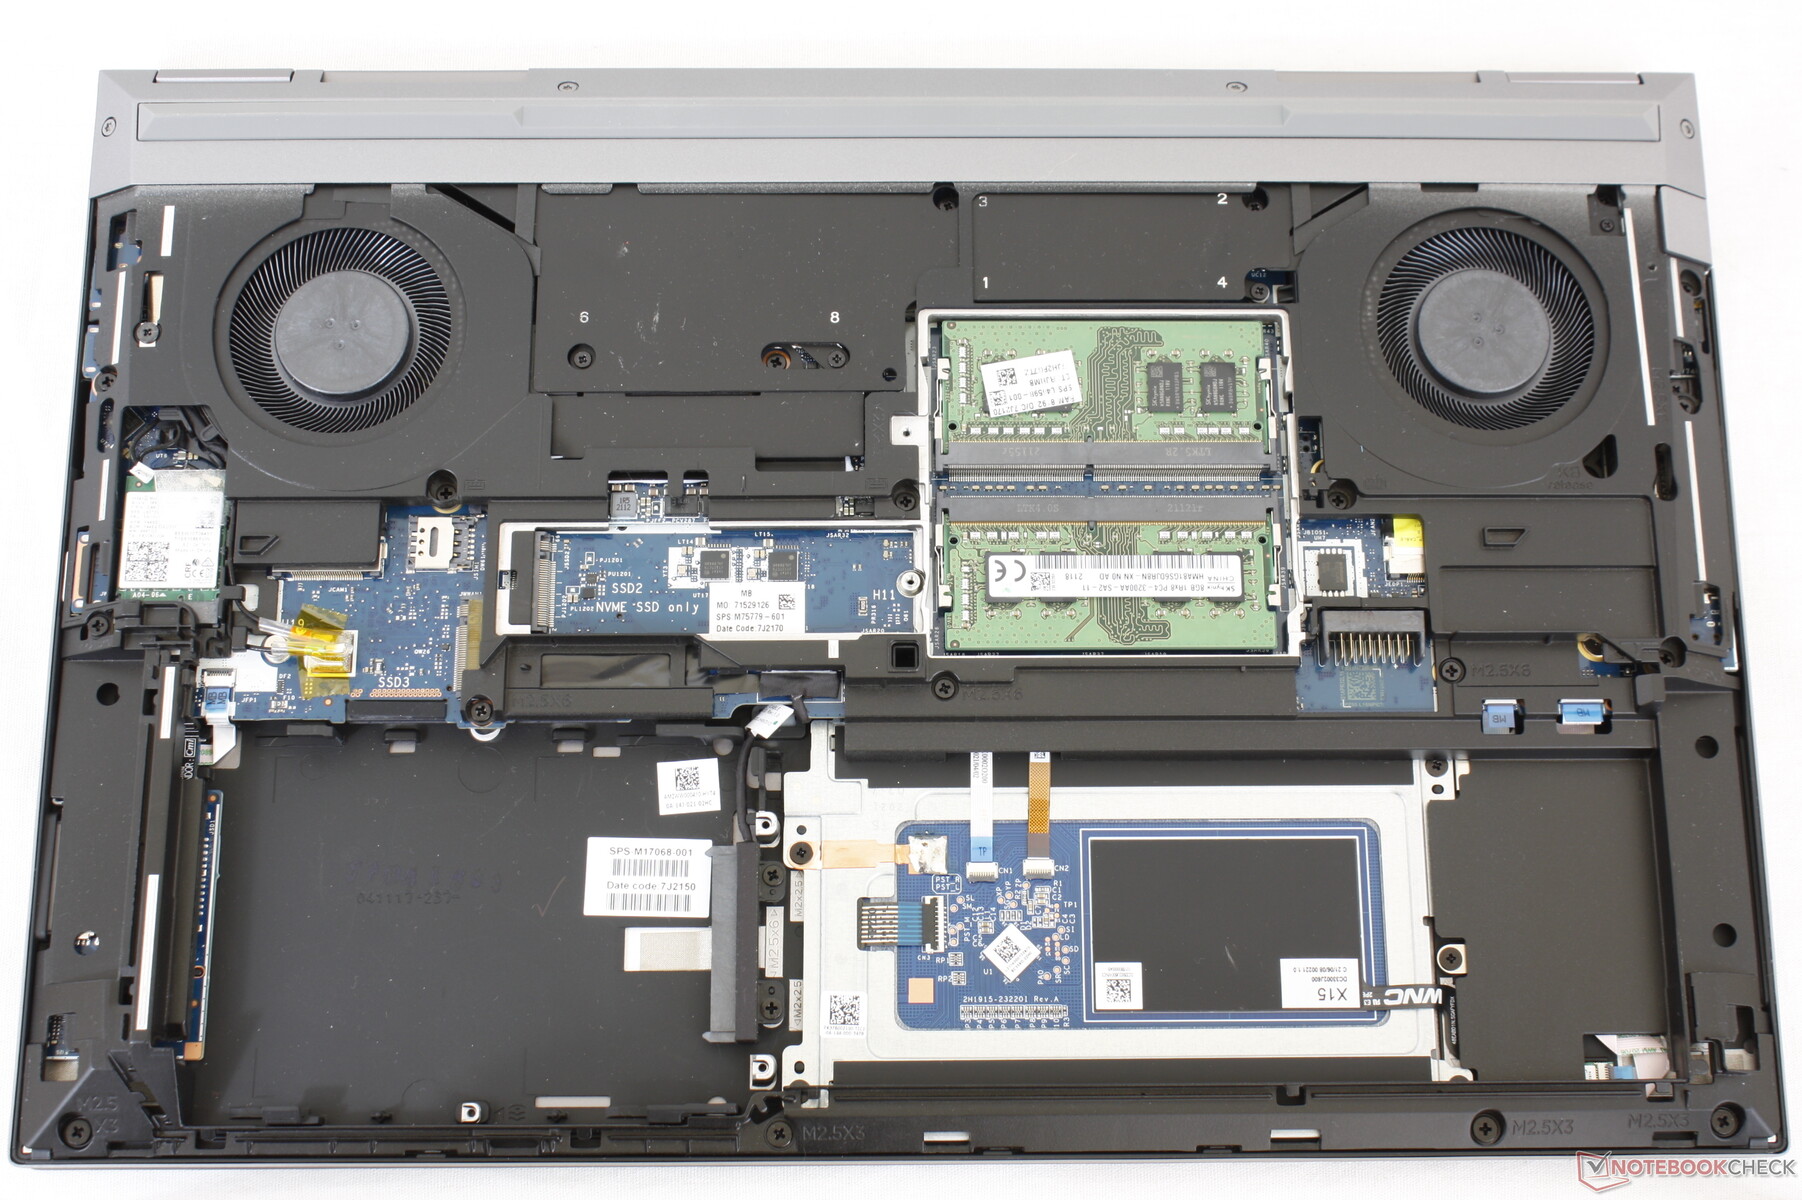
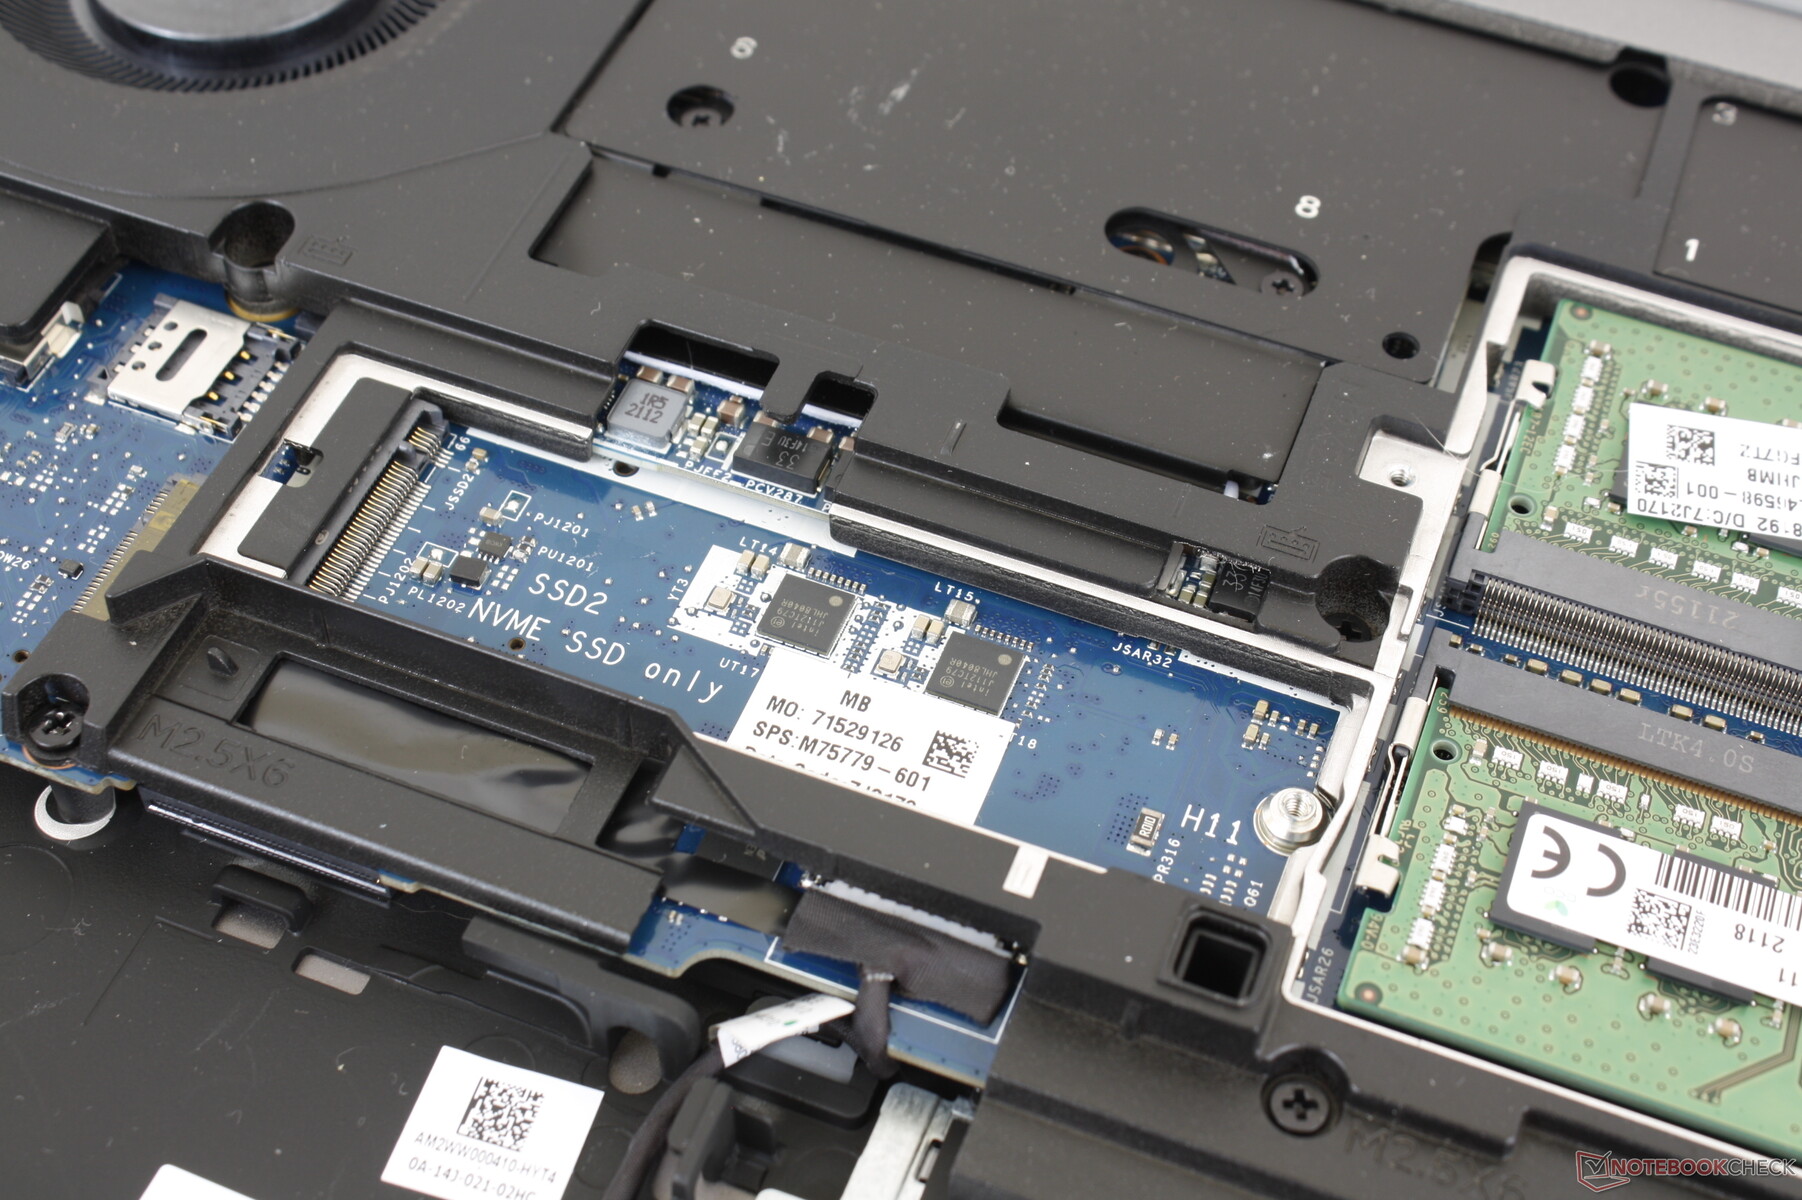
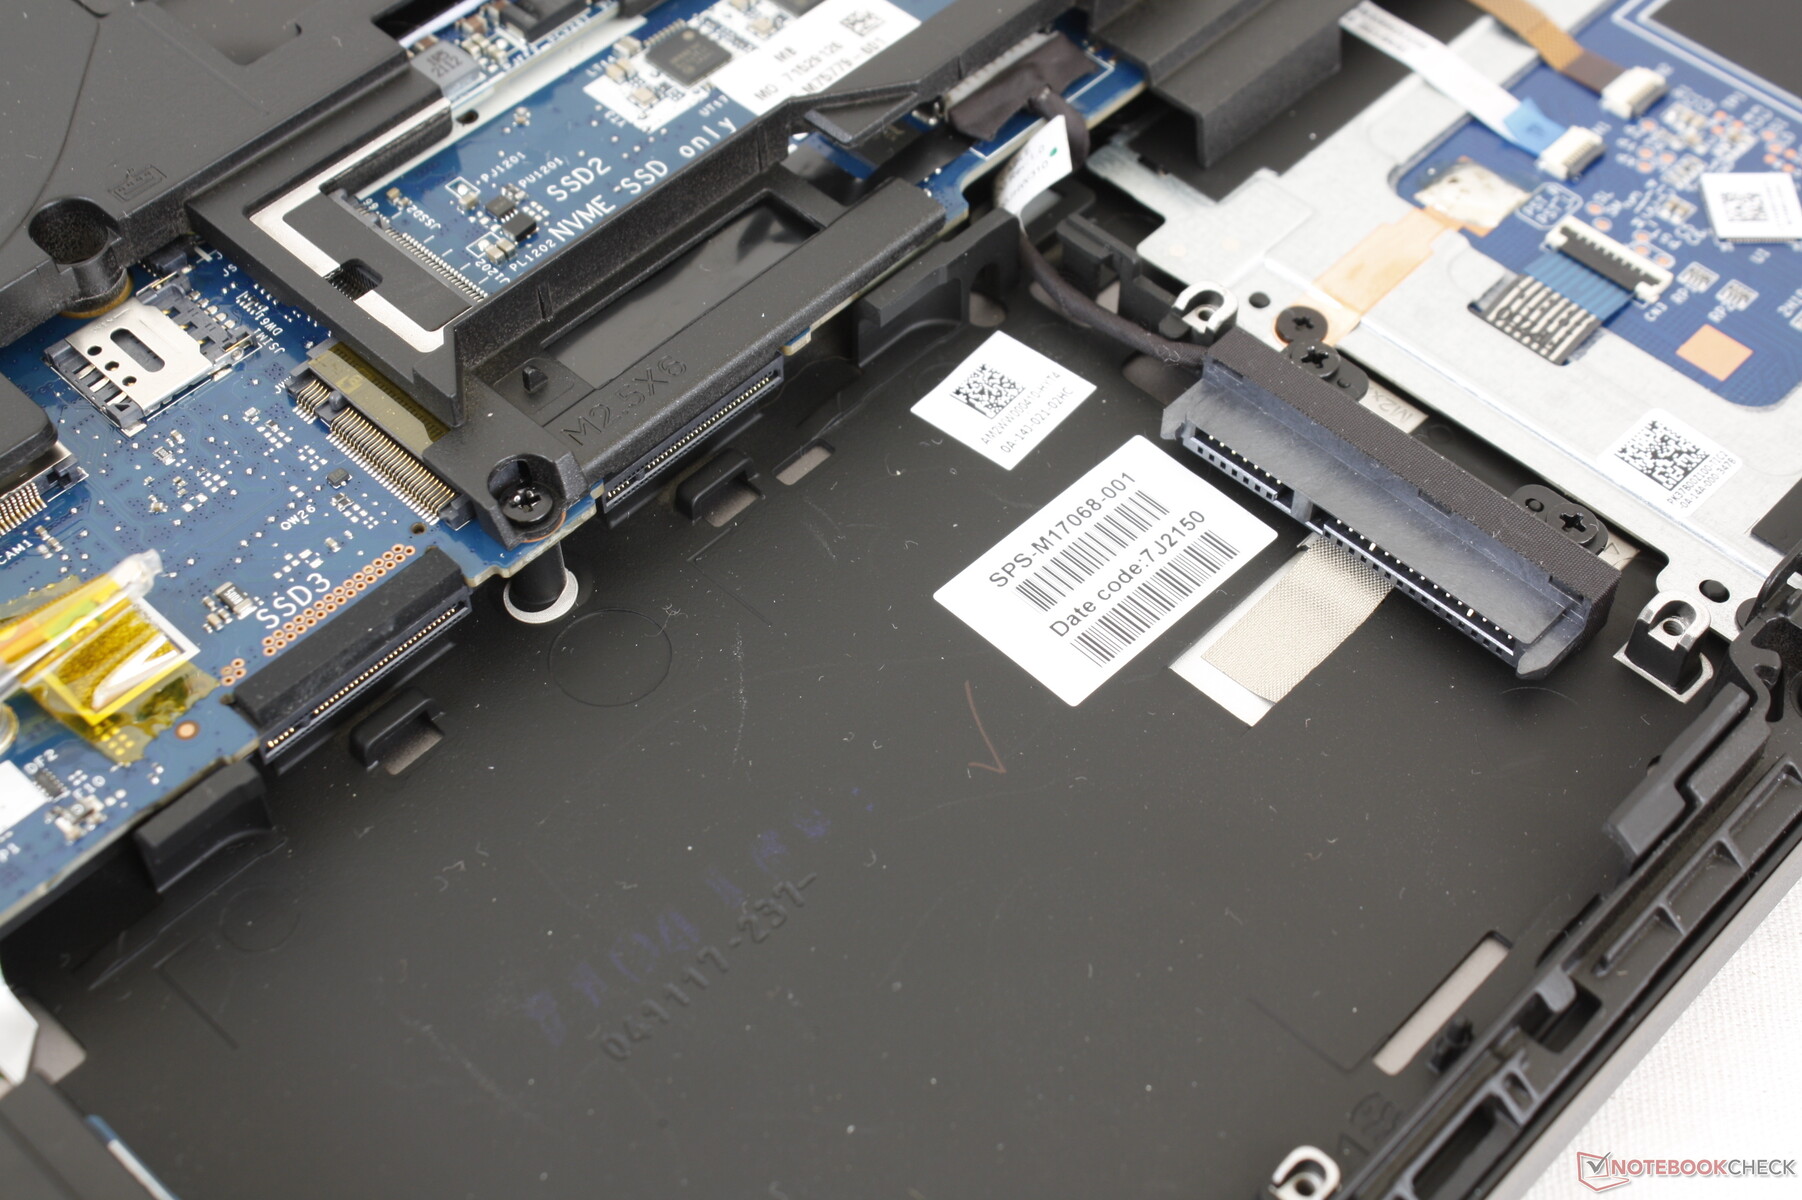
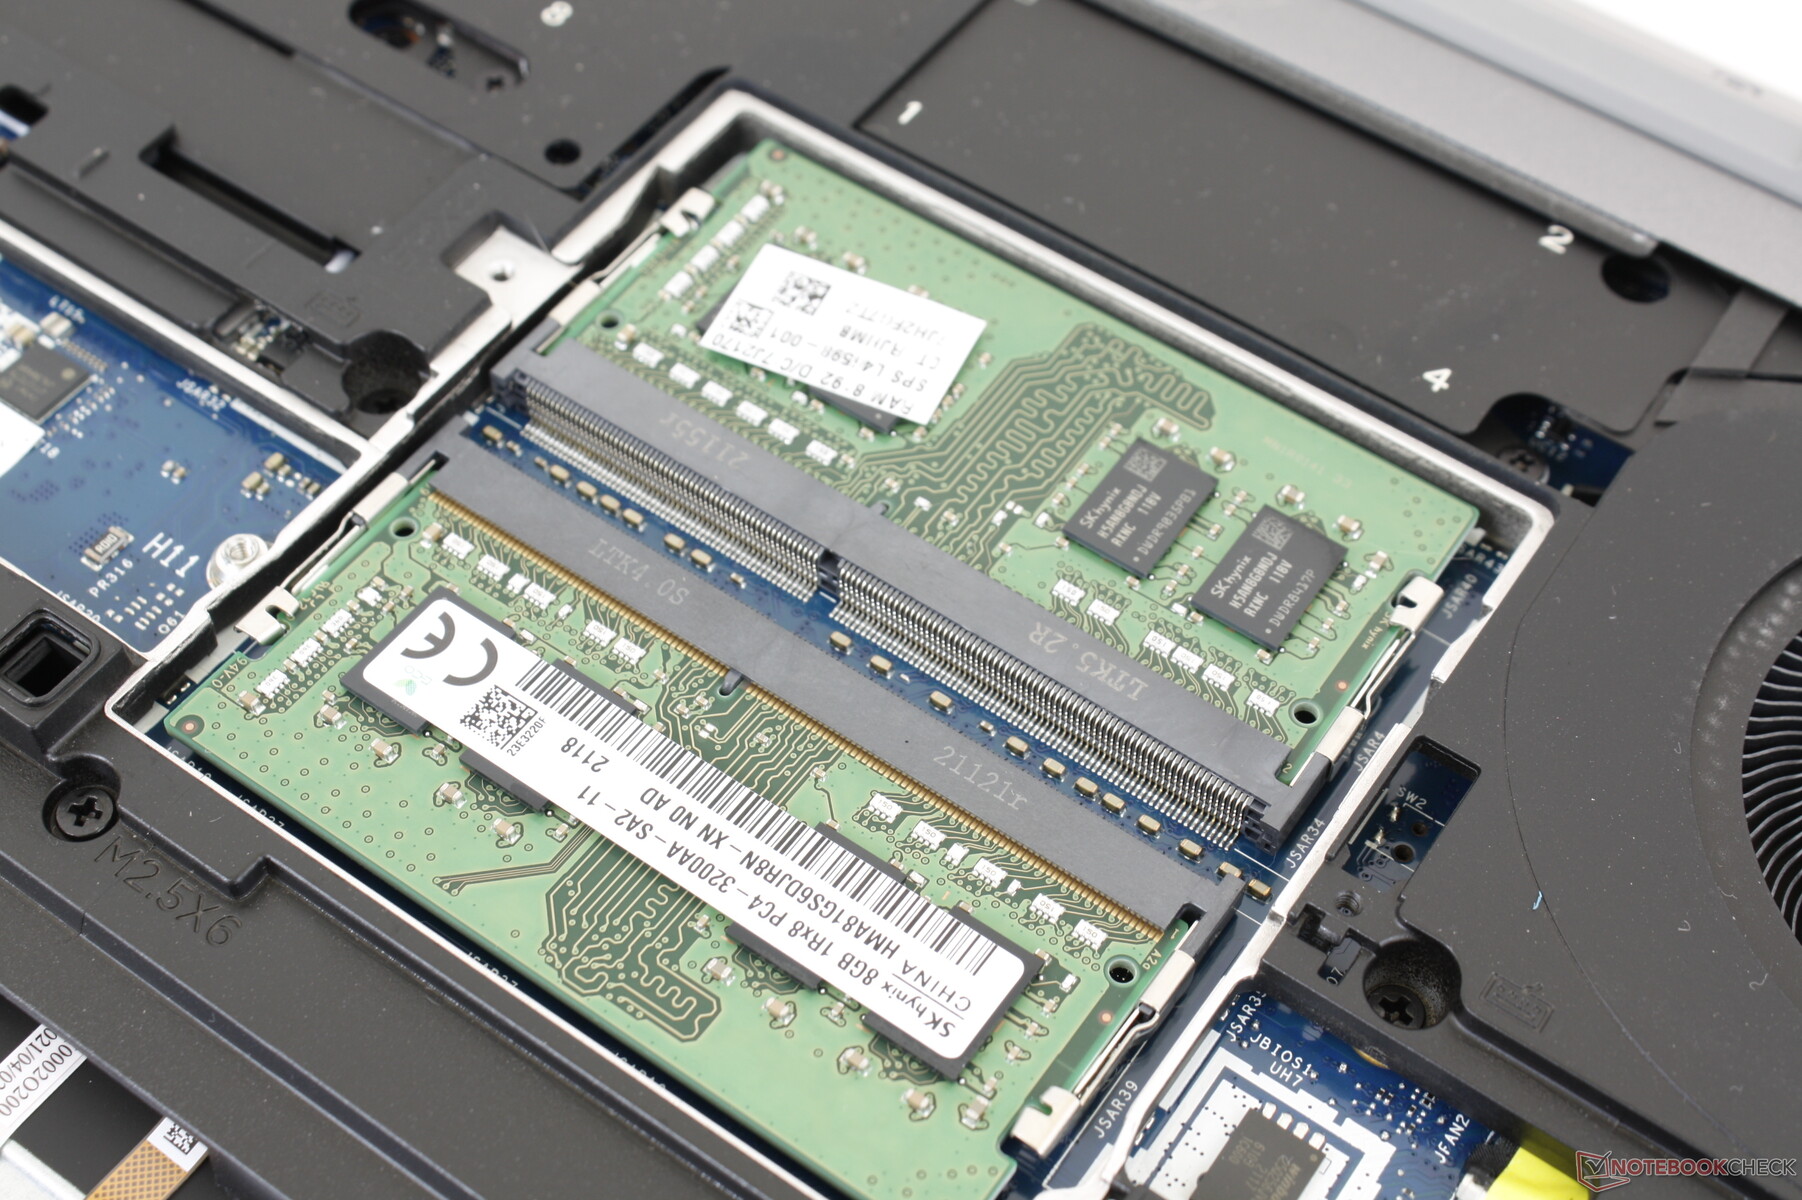
Manutenção - Tenha uma chave de fenda pronta
O painel inferior desliza facilmente - não são necessárias ferramentas ou chaves de fenda. Uma vez dentro, porém, a maioria dos componentes estão debaixo de placas metálicas que requerem uma chave de fenda Philips para serem removidas. RAM adicional e componentes de armazenamento estão do outro lado da placa-mãe e, portanto, não são tão facilmente acessíveis.
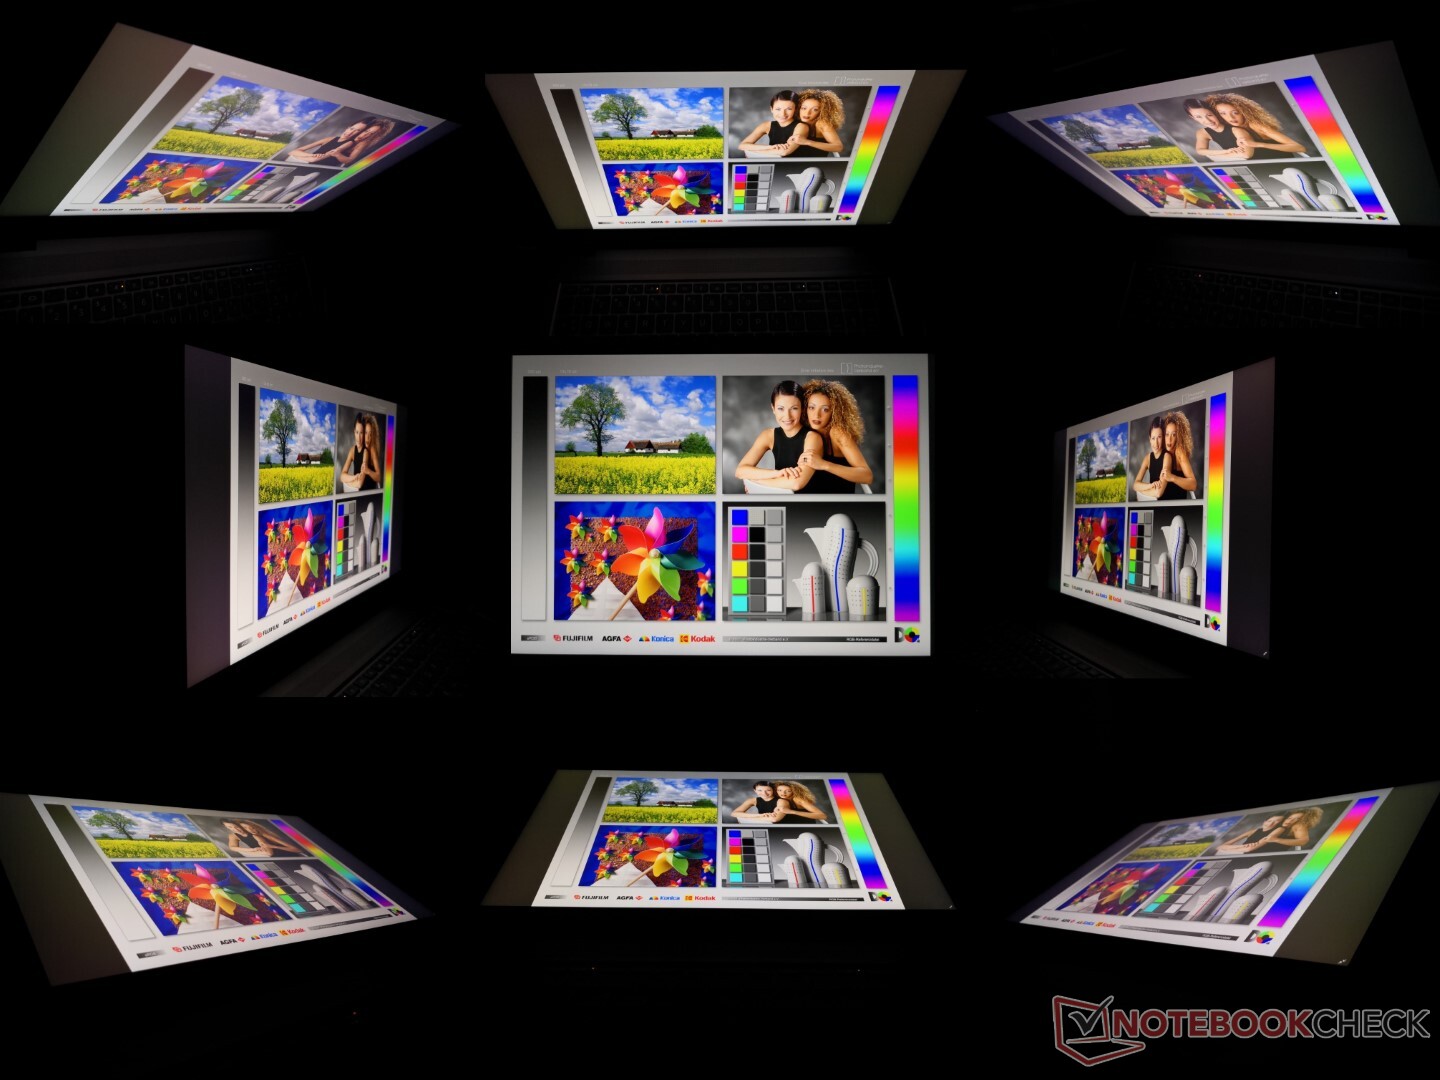
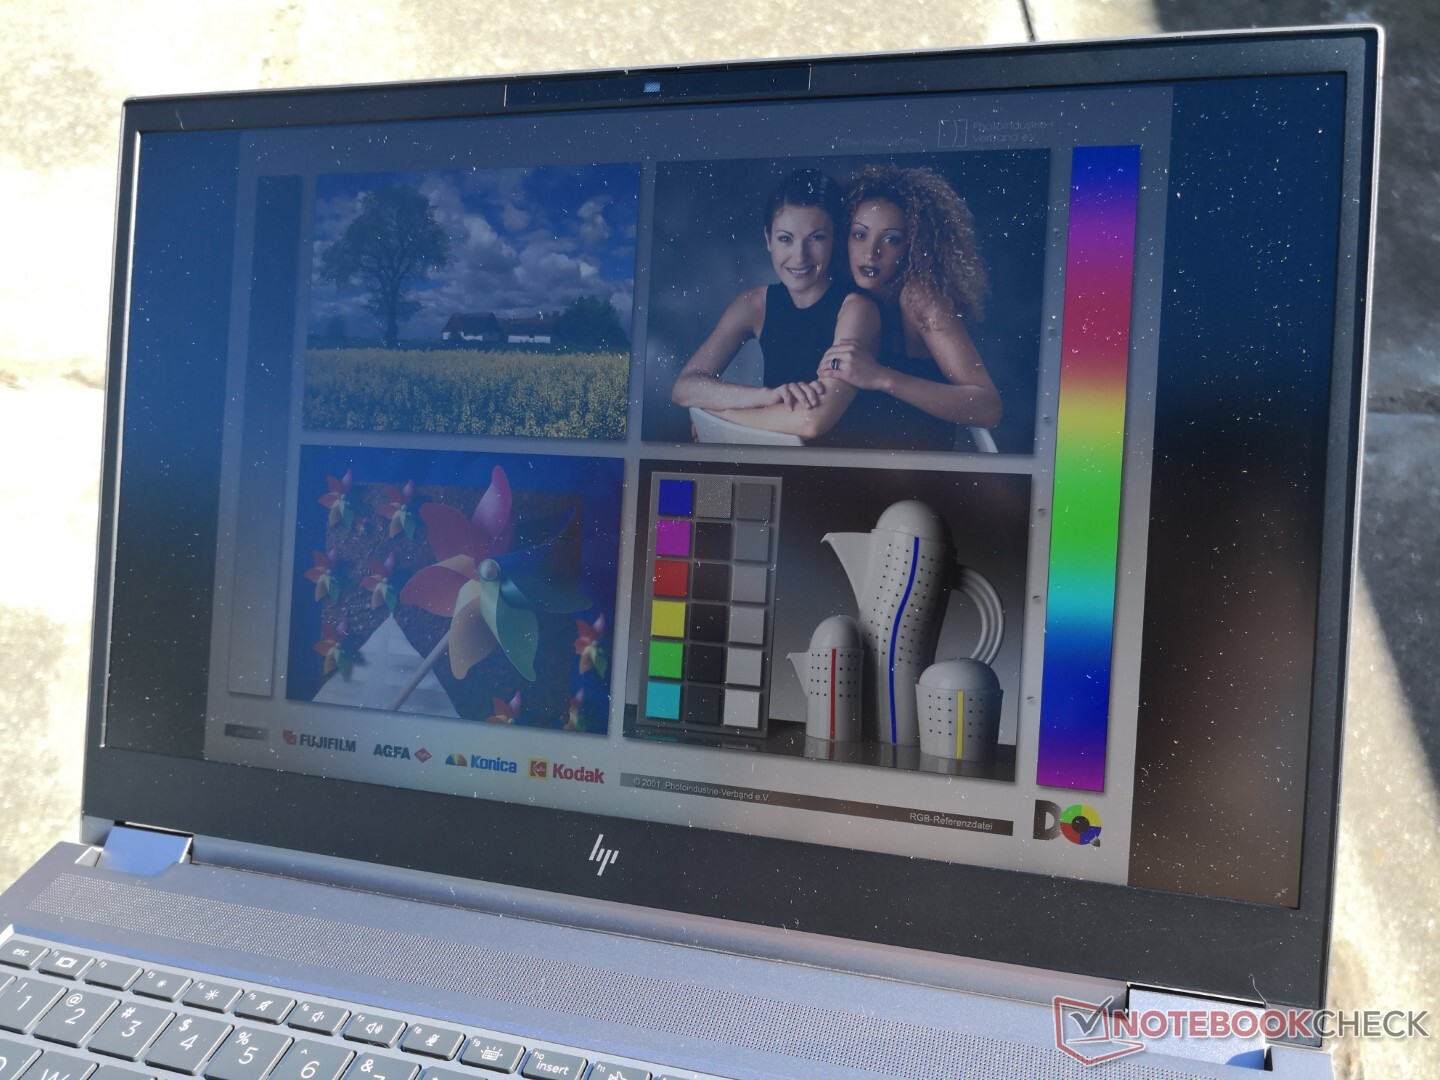
Visor - 120 Hz Faz toda a diferença
O novo painel 4K 120 Hz no Fury 15 G8 é uma melhoria significativa em relação ao painel 4K 60 Hz no Fury 15 G7, apesar de ter a mesma alta resolução nativa e ampla cobertura de cores. Além dos benefícios óbvios de passar de 60 Hz para 120 Hz, o painel mais novo oferece tempos de resposta muito mais rápidos em preto-branco e cinza-cinza em quase 4x para uma menor visibilidade de fantasmas, especialmente quando se trata de gráficos de movimento rápido. Tanto o brilho quanto o contraste permanecem altos em ~600:1 e >1000:1, respectivamente
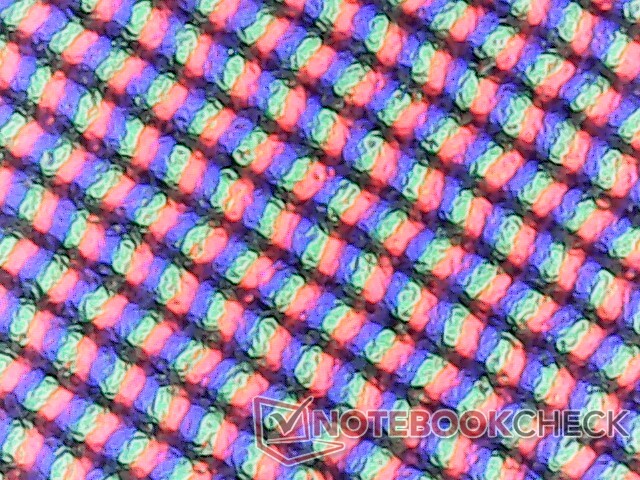
Talvez a maior desvantagem do painel 4K é que ele sofre de um pouco de granulosidade devido à sobreposição mate e por isso os textos e imagens não aparecem tão nítidos quanto poderiam ter sido, apesar do PPI muito alto. A HP oferece opções brilhantes para superar este inconveniente específico.
| |||||||||||||||||||||||||
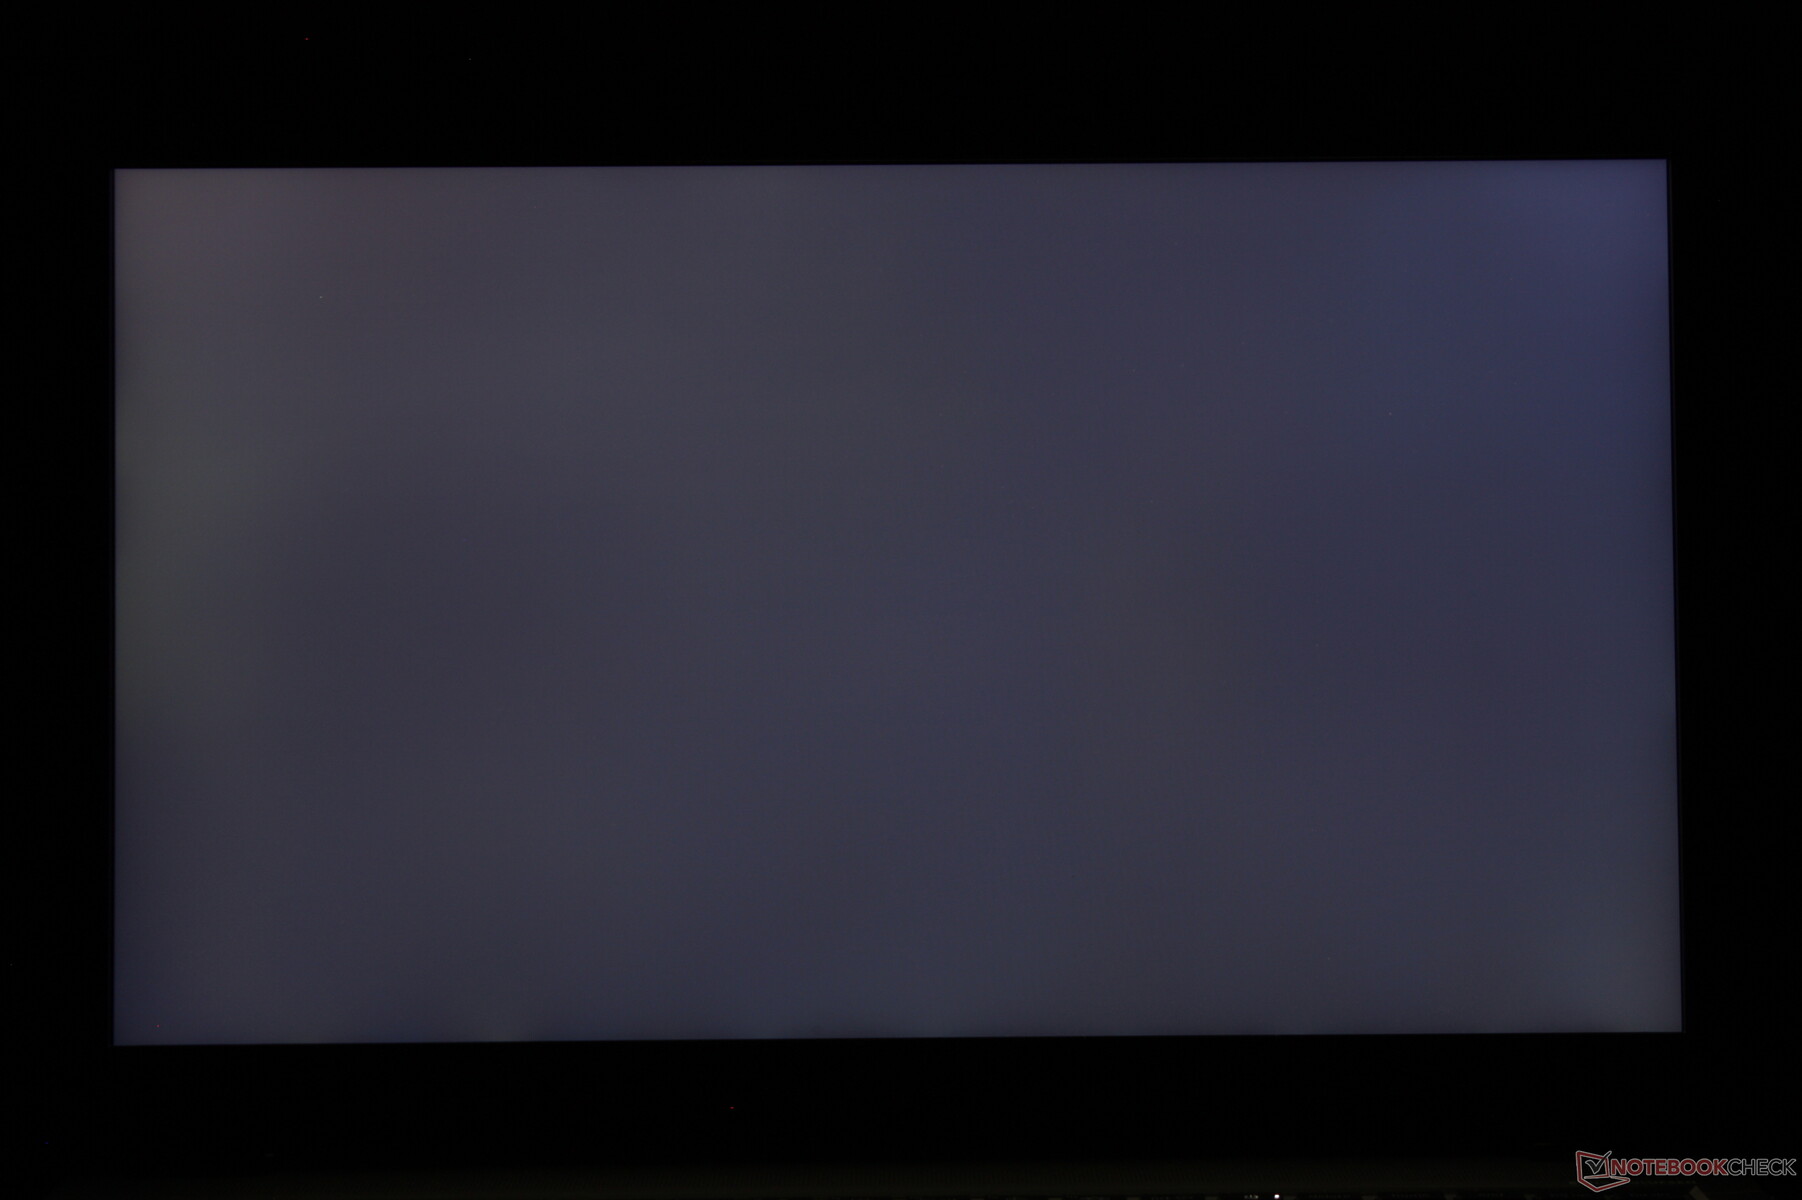
iluminação: 87 %
iluminação com acumulador: 626 cd/m²
Contraste: 1079:1 (Preto: 0.58 cd/m²)
ΔE ColorChecker Calman: 5.41 | ∀{0.5-29.43 Ø4.71}
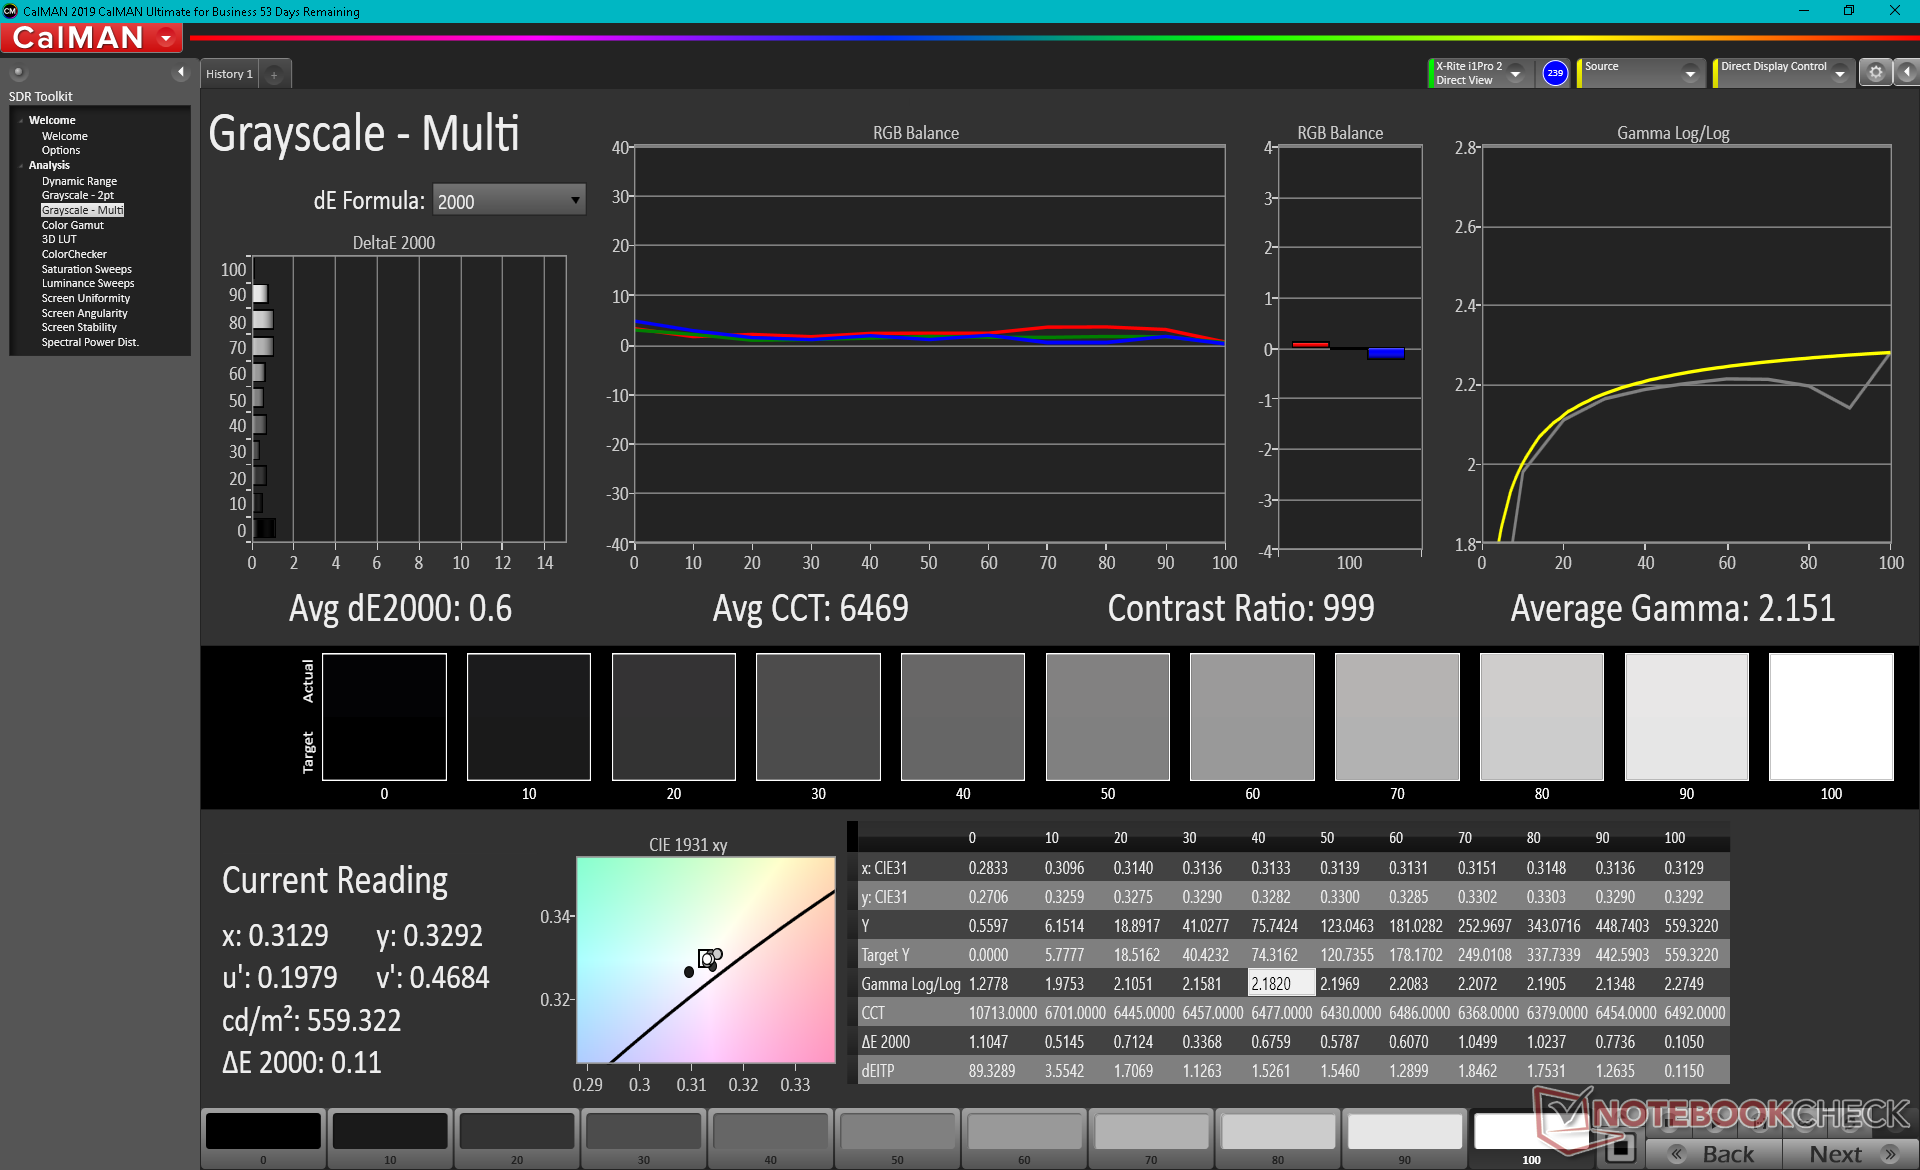
calibrated: 0.6
ΔE Greyscale Calman: 6.2 | ∀{0.09-98 Ø4.96}
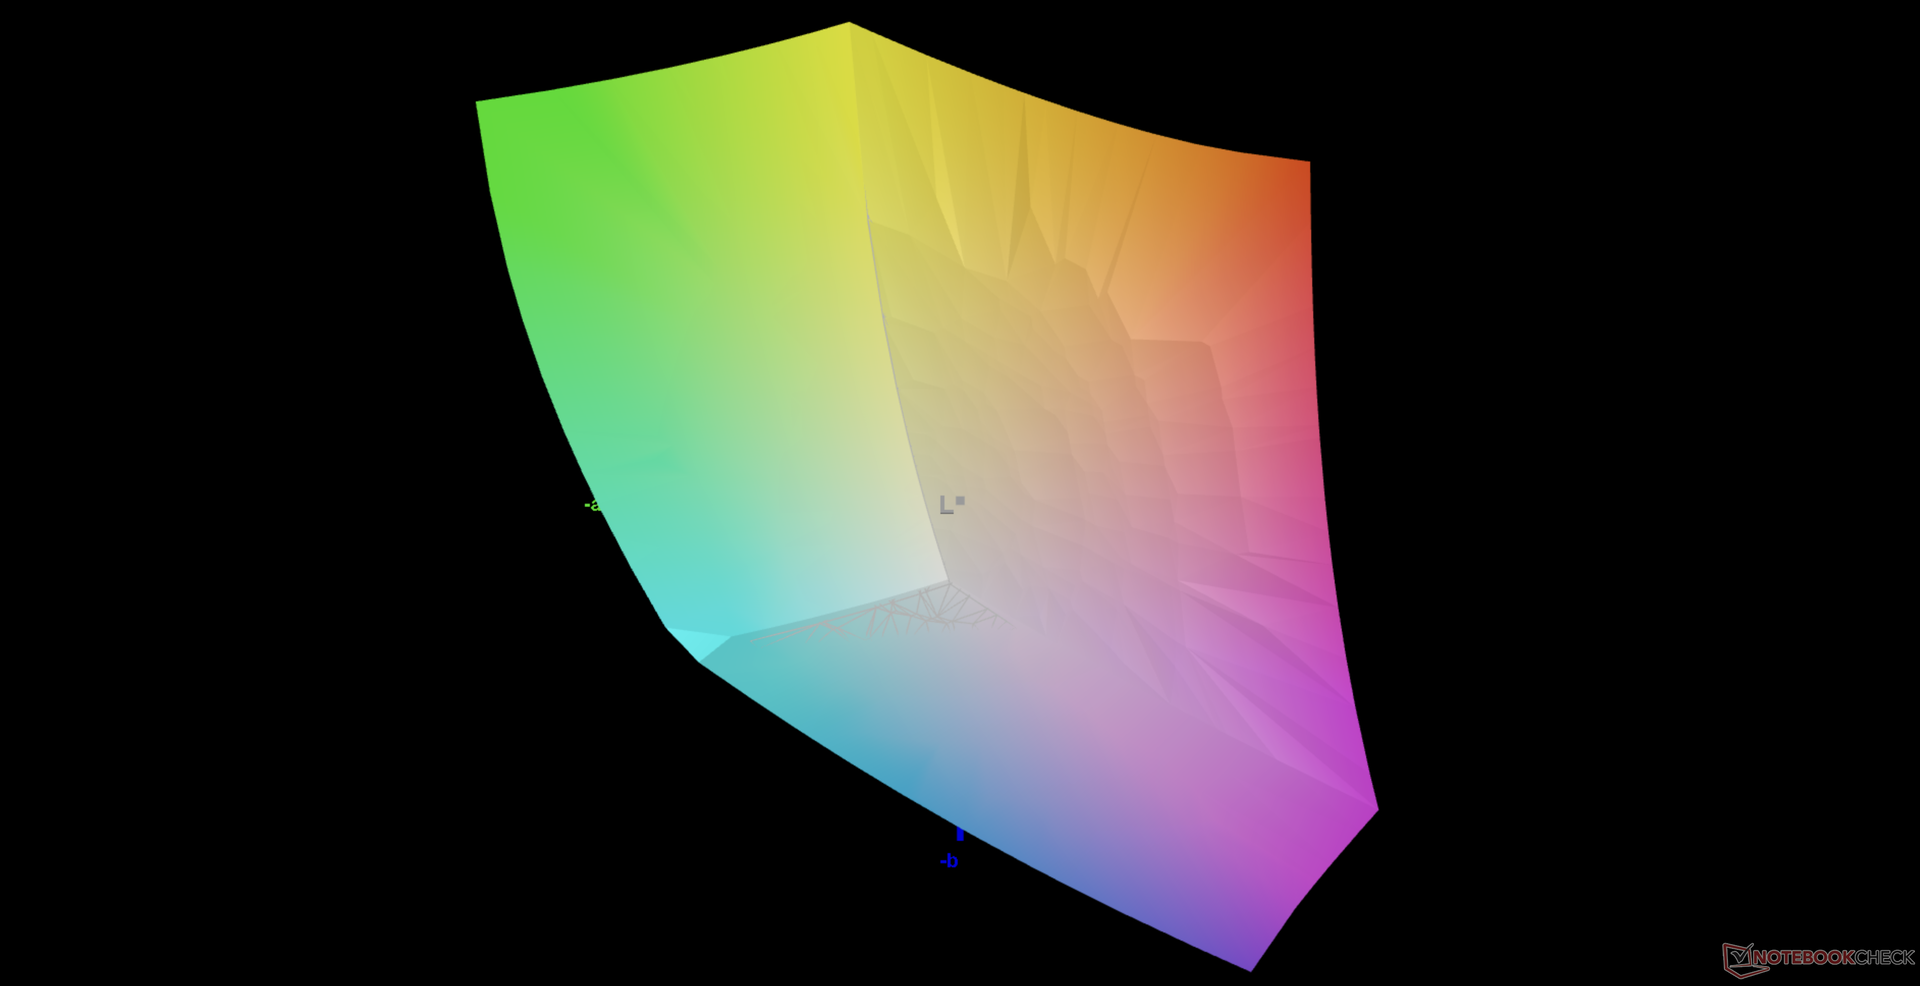
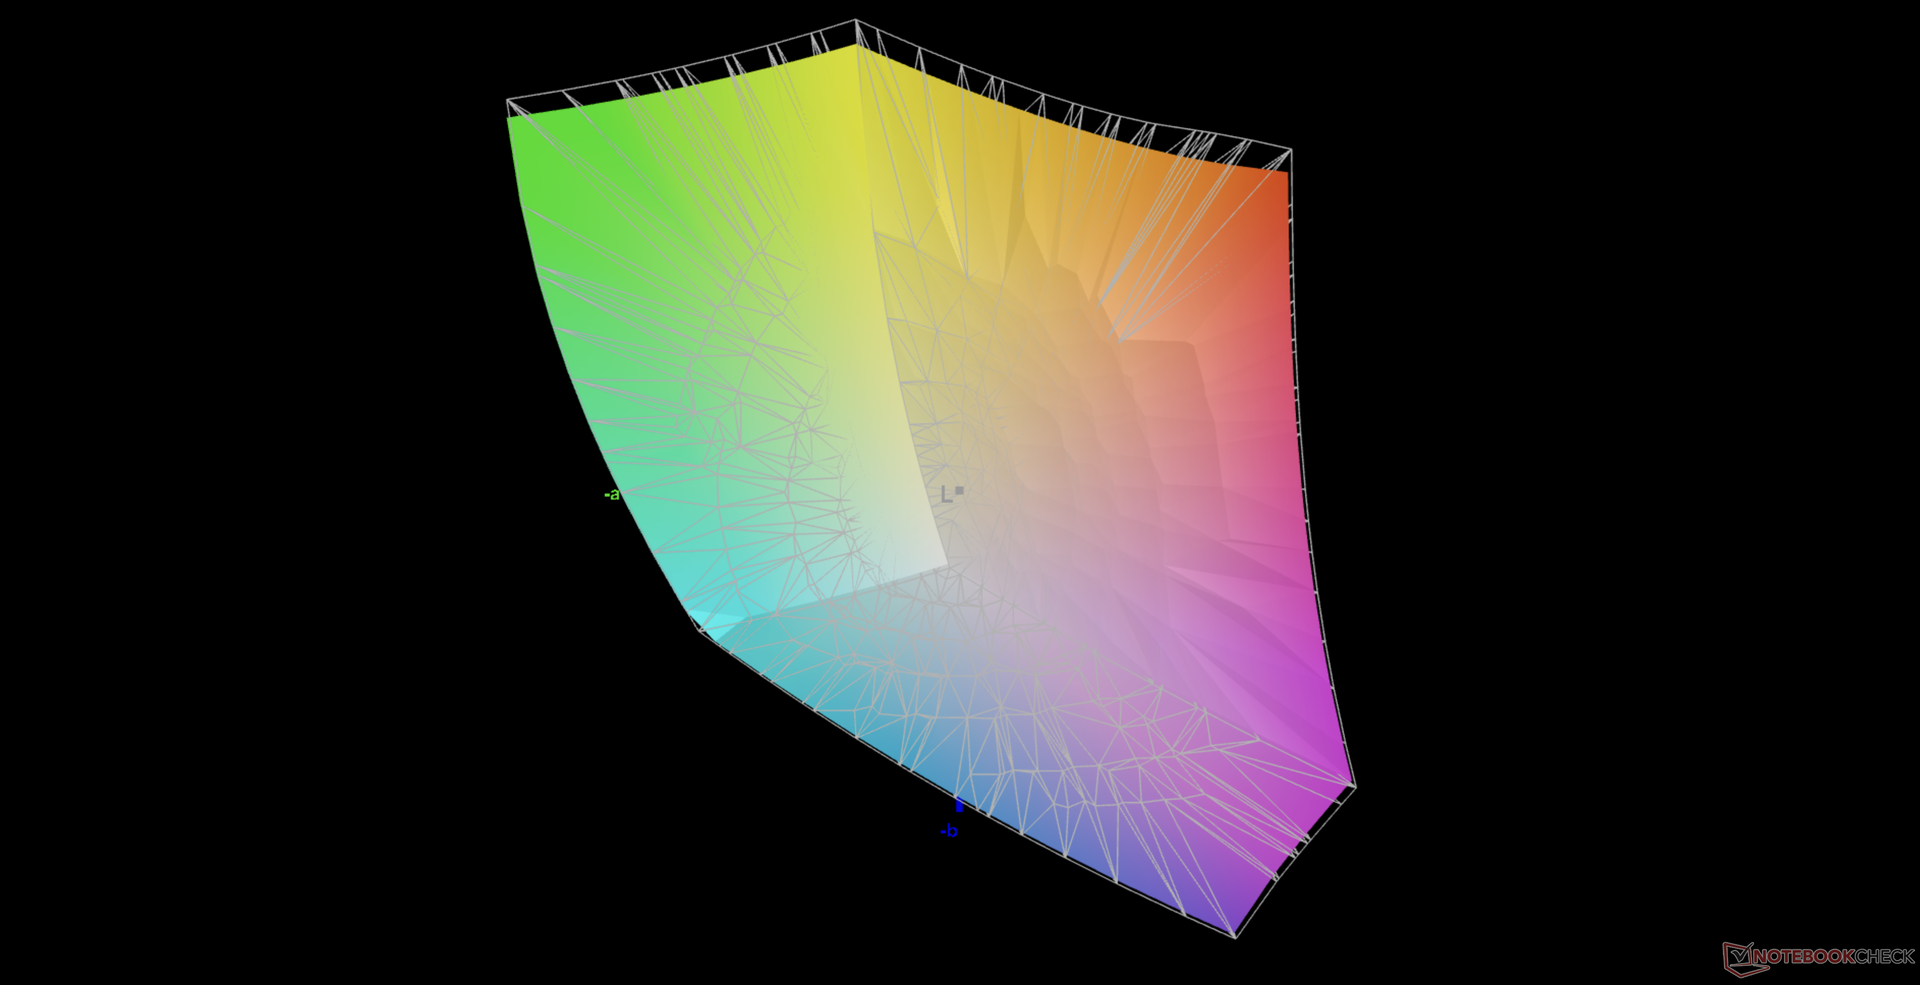
87.3% AdobeRGB 1998 (Argyll 3D)
100% sRGB (Argyll 3D)
95.9% Display P3 (Argyll 3D)
Gamma: 2.66
CCT: 6101 K
| HP ZBook Fury 15 G8 BOE0969, IPS, 15.6", 3840x2160 | HP ZBook Fury 15 G7 LG Philips LGD0661, IPS, 15.6", 3840x2160 | Dell Precision 5000 5560 Sharp LQ156R1, IPS, 15.6", 3840x2400 | HP ZBook Studio 15 G8 SDC4145, OLED, 15.6", 3840x2160 | Lenovo ThinkPad P15s Gen2-20W6000GGE MNF601EA1-1, IPS LED, 15.6", 3840x2160 | HP ZBook Firefly 15 G7 LGD064F, IPS LED, 15.6", 3840x2160 | |
|---|---|---|---|---|---|---|
| Display | -1% | 5% | 4% | -0% | -17% | |
| Display P3 Coverage (%) | 95.9 | 95.6 0% | 94.9 -1% | 99.9 4% | 84.5 -12% | 68.8 -28% |
| sRGB Coverage (%) | 100 | 99.8 0% | 100 0% | 100 0% | 98.7 -1% | 97.7 -2% |
| AdobeRGB 1998 Coverage (%) | 87.3 | 84.5 -3% | 100 15% | 95.3 9% | 97.8 12% | 69.8 -20% |
| Response Times | -253% | -198% | 81% | -141% | -189% | |
| Response Time Grey 50% / Grey 80% * (ms) | 14.8 ? | 56 ? -278% | 47.2 ? -219% | 2.4 ? 84% | 40 ? -170% | 44 ? -197% |
| Response Time Black / White * (ms) | 11 ? | 36 ? -227% | 30.4 ? -176% | 2.4 ? 78% | 23.2 ? -111% | 30.8 ? -180% |
| PWM Frequency (Hz) | 240.4 ? | |||||
| Screen | -29% | 7% | -58% | 35% | 5% | |
| Brightness middle (cd/m²) | 626 | 672.8 7% | 501.5 -20% | 379.6 -39% | 604 -4% | 381 -39% |
| Brightness (cd/m²) | 589 | 674 14% | 467 -21% | 380 -35% | 609 3% | 382 -35% |
| Brightness Distribution (%) | 87 | 89 2% | 83 -5% | 95 9% | 91 5% | 92 6% |
| Black Level * (cd/m²) | 0.58 | 0.5 14% | 0.44 24% | 0.34 41% | 0.21 64% | |
| Contrast (:1) | 1079 | 1346 25% | 1140 6% | 1776 65% | 1814 68% | |
| Colorchecker dE 2000 * | 5.41 | 3.48 36% | 4.73 13% | 5.15 5% | 0.9 83% | 3 45% |
| Colorchecker dE 2000 max. * | 9.05 | 9.44 -4% | 8.45 7% | 7.79 14% | 2.6 71% | 5.2 43% |
| Colorchecker dE 2000 calibrated * | 0.6 | 3.03 -405% | 0.51 15% | 3.1 -417% | 0.8 -33% | 1.5 -150% |
| Greyscale dE 2000 * | 6.2 | 3.1 50% | 3.6 42% | 2.6 58% | 1.1 82% | 3.5 44% |
| Gamma | 2.66 83% | 2.04 108% | 2.08 106% | 1.99 111% | 2.15 102% | 2.26 97% |
| CCT | 6101 107% | 6380 102% | 6447 101% | 6166 105% | 6656 98% | 7254 90% |
| Color Space (Percent of AdobeRGB 1998) (%) | 75.2 | 84.5 | 64.3 | |||
| Color Space (Percent of sRGB) (%) | 100 | 98.6 | 97.5 | |||
| Média Total (Programa/Configurações) | -94% /
-55% | -62% /
-23% | 9% /
-19% | -35% /
2% | -67% /
-27% |
* ... menor é melhor
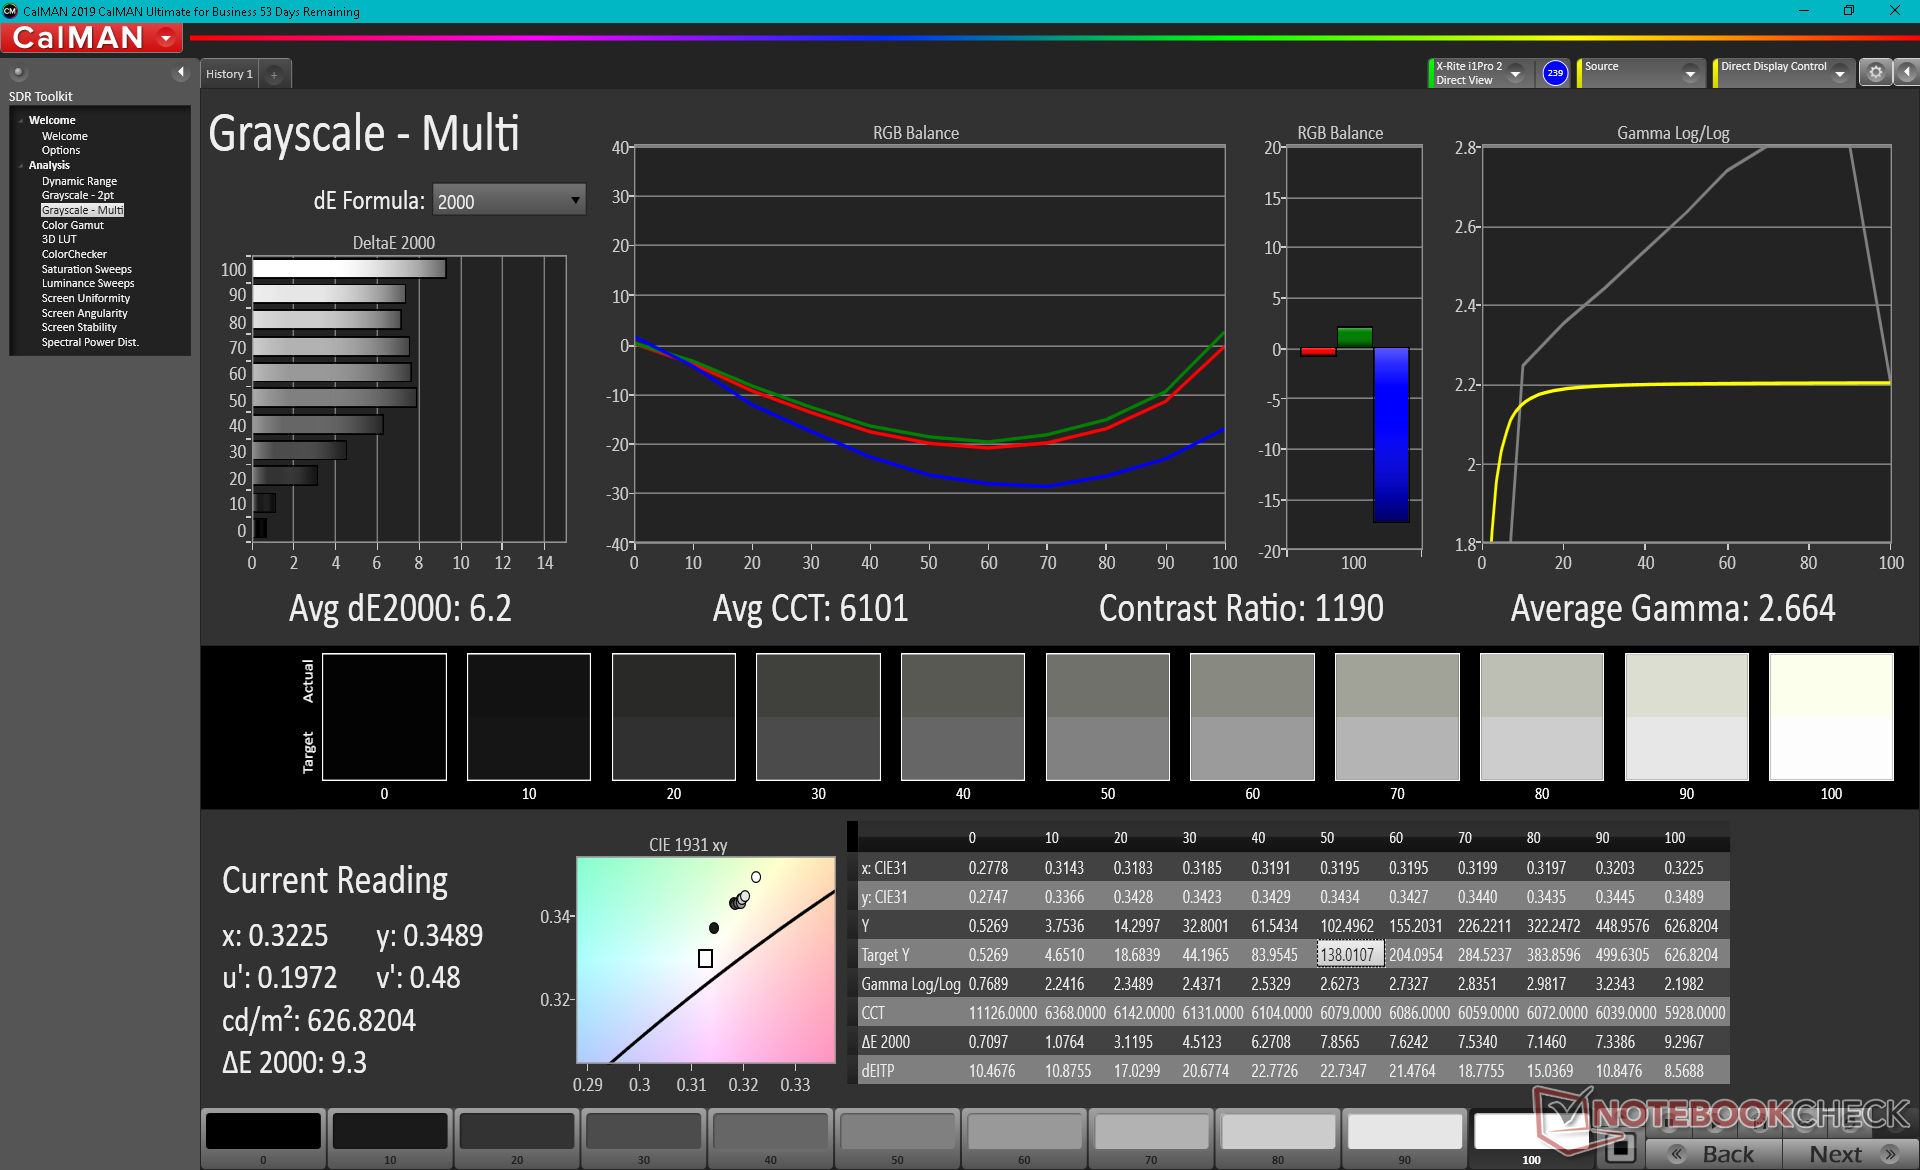
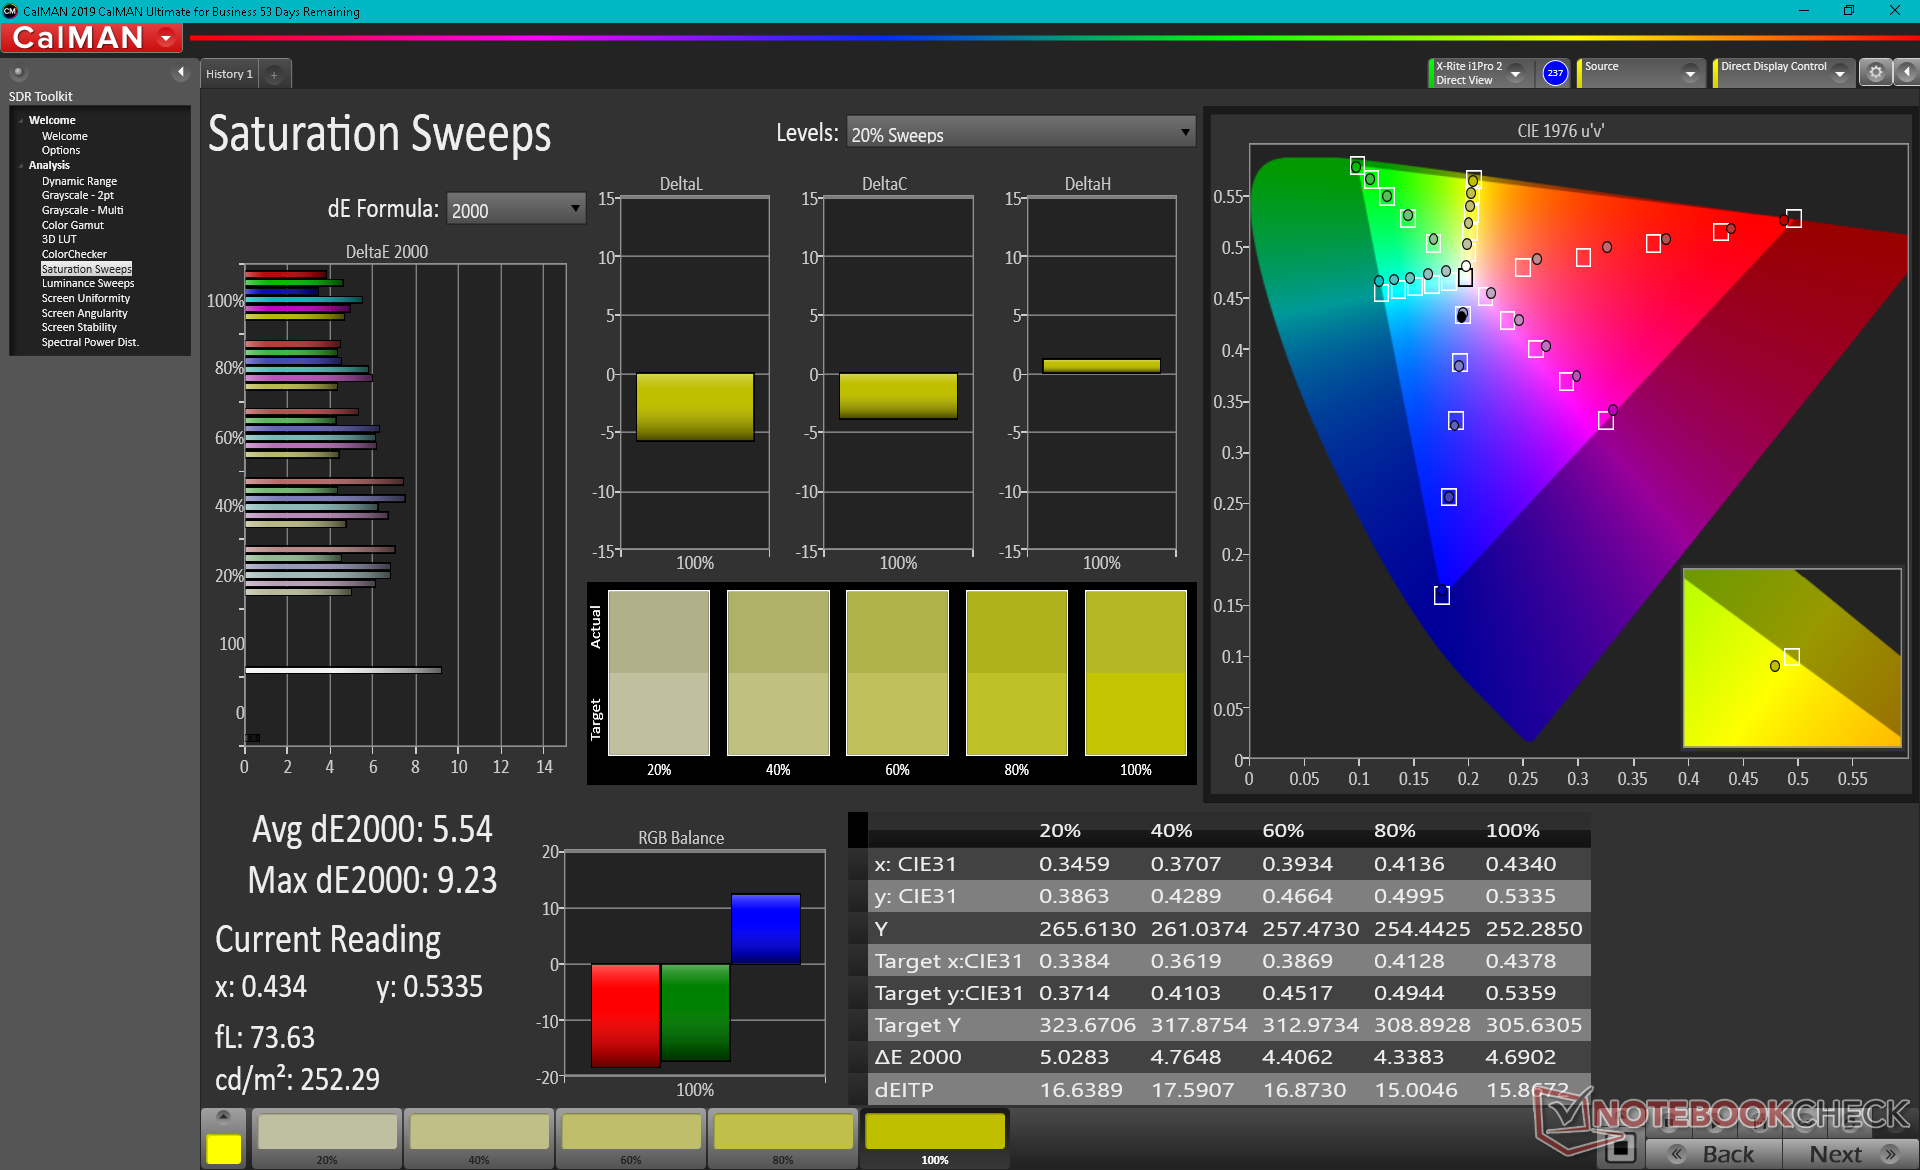
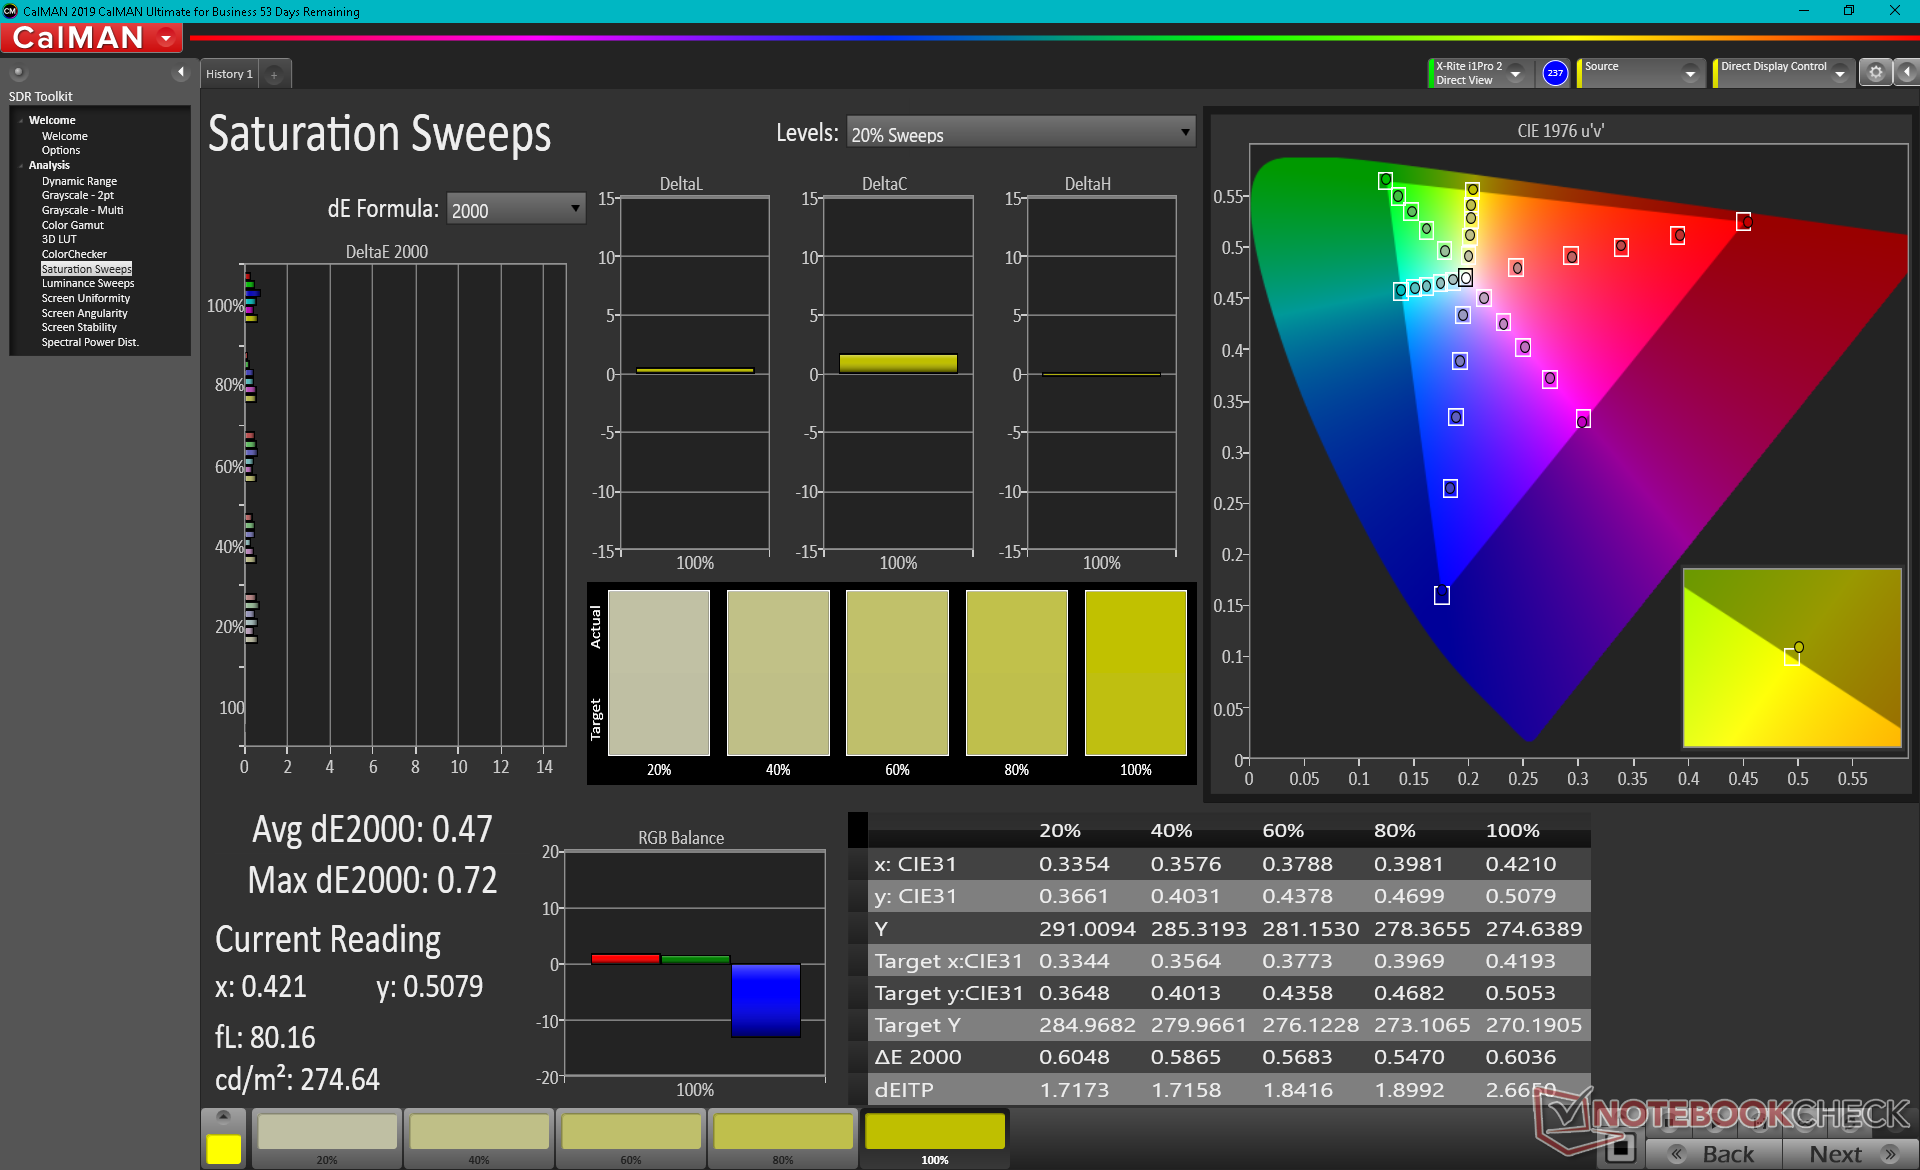
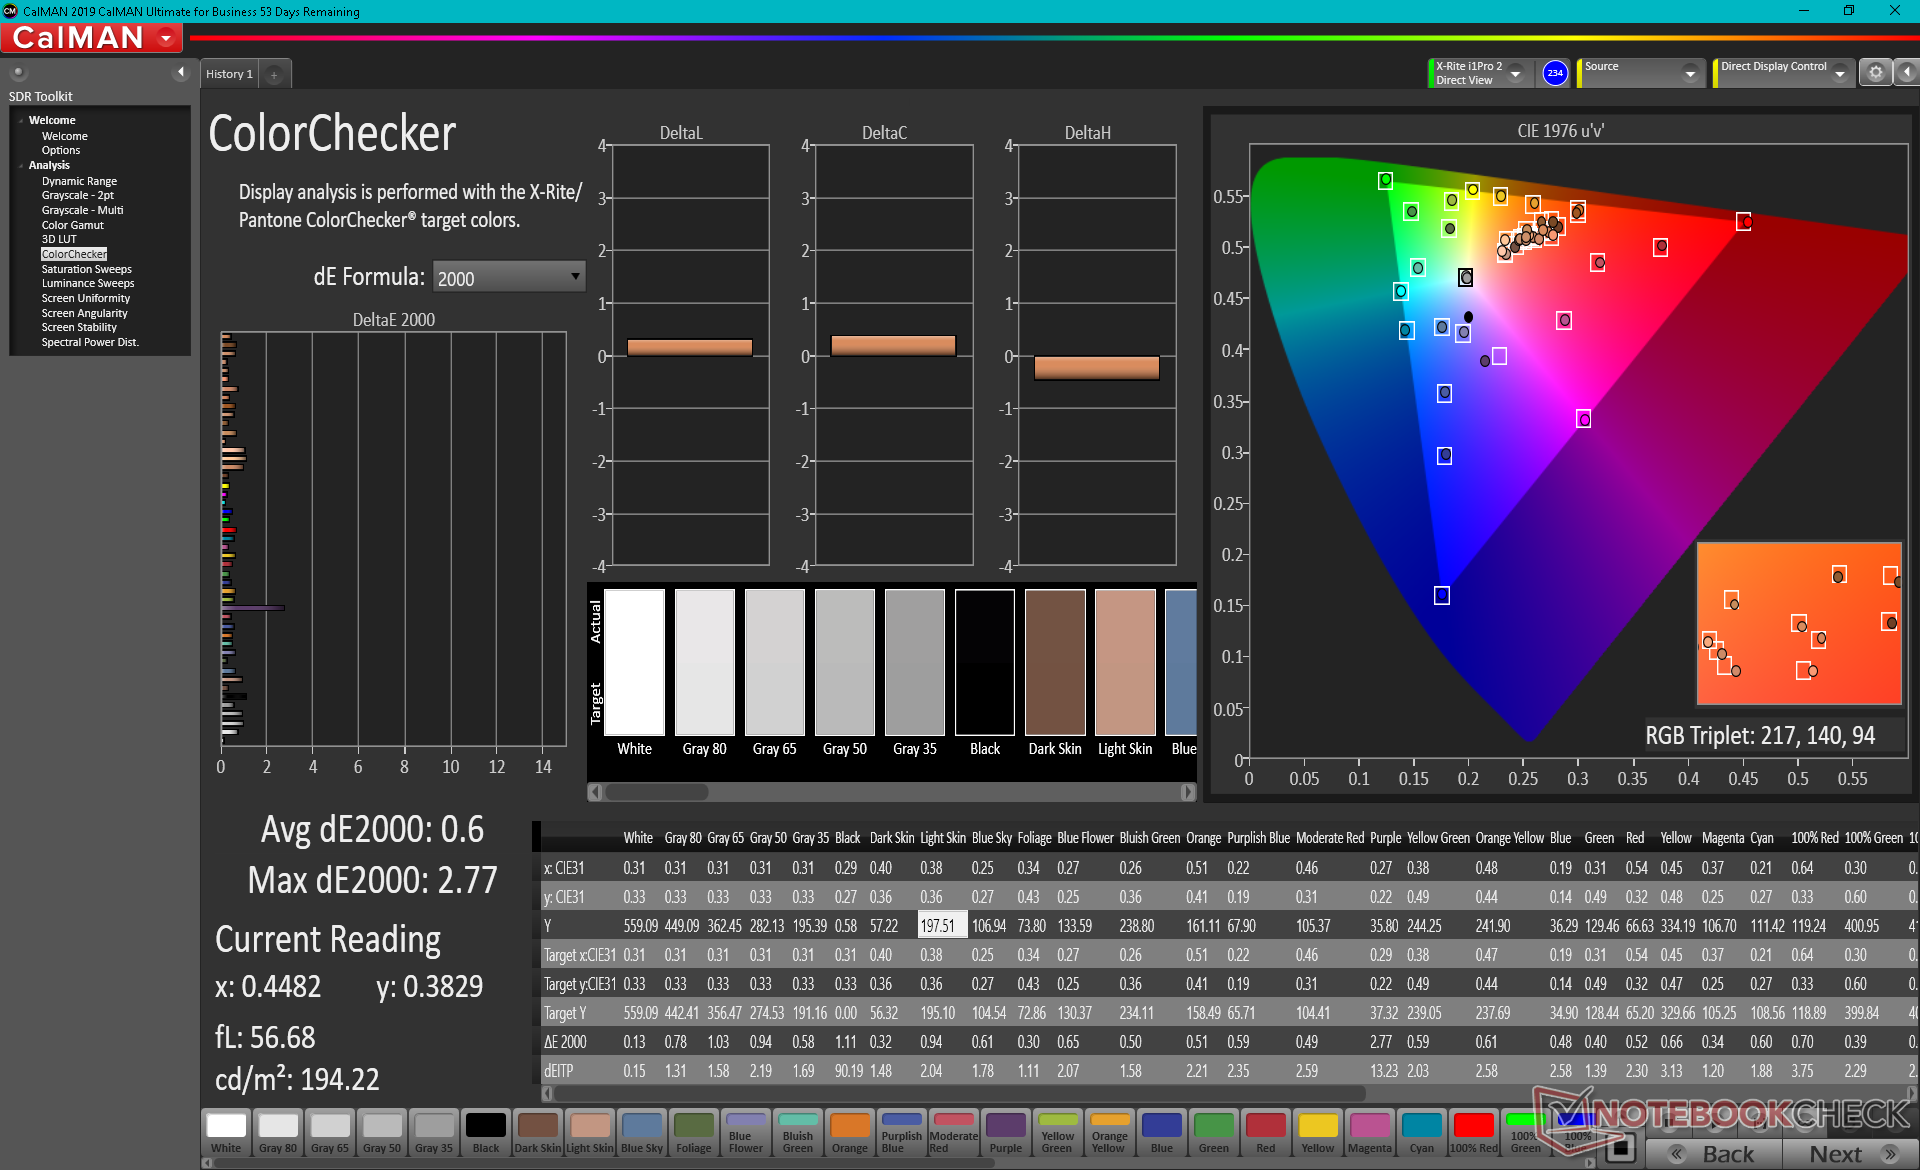
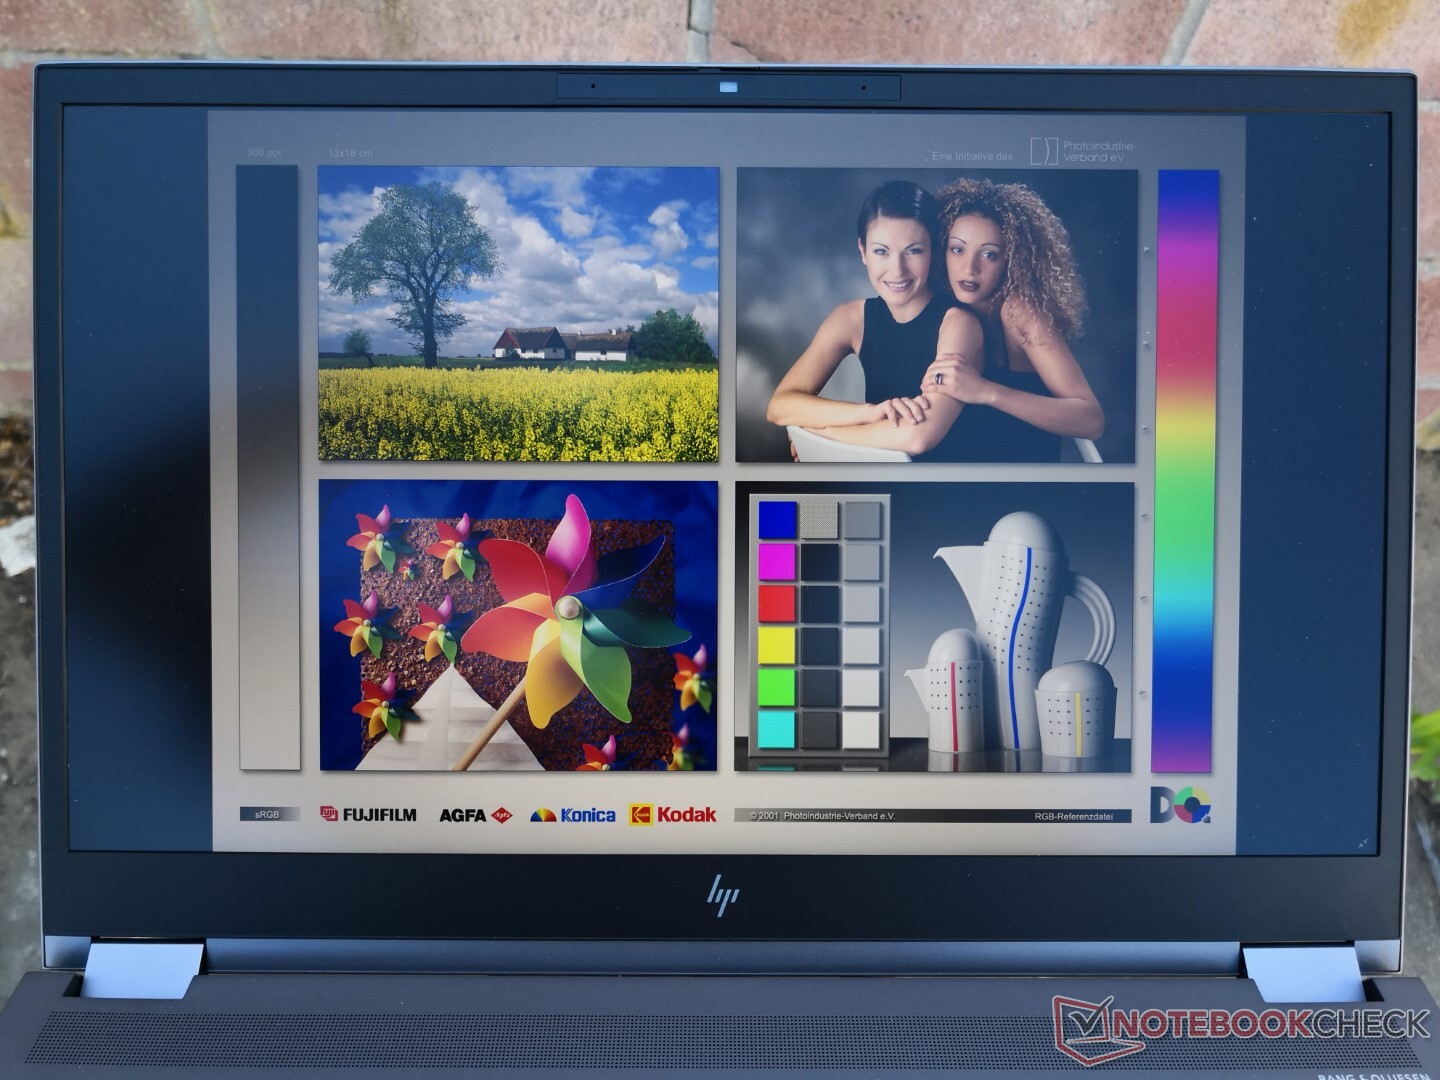
Nosso colorímetro X-Rite mostra uma cobertura de 96 por cento DCI-P3 contra os 100 por cento reivindicados pela HP. Combine as cores amplas com os tempos de resposta muito rápidos e você tem um painel de 4K que funciona extremamente bem tanto para edição gráfica profissional quanto para aplicações de jogos.
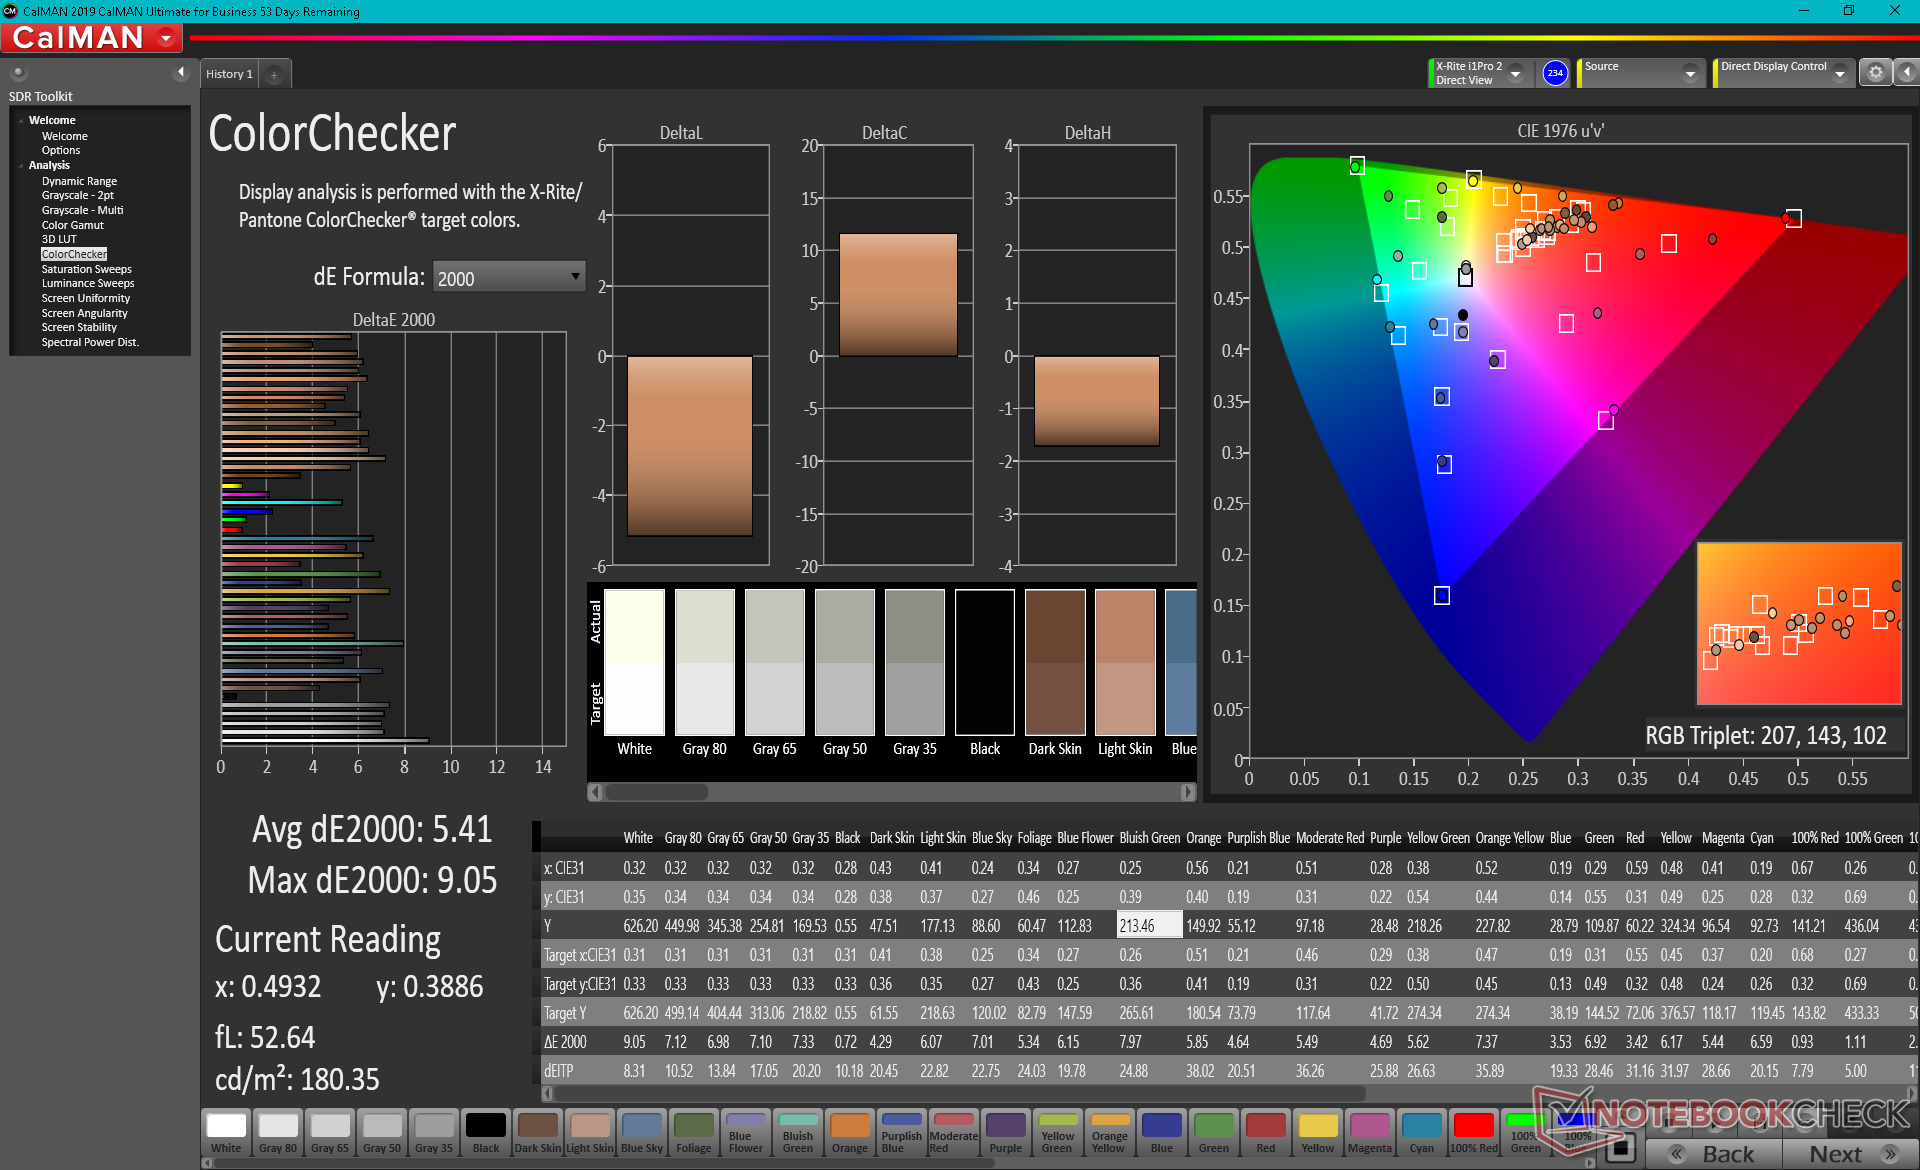
A tela poderia ter sido melhor calibrada fora da caixa em relação ao padrão DCI-P3. Os valores médios de escala de cinza e deltaE de cor fora da caixa estão em 6,2 e 5,41, respectivamente, com uma temperatura de cor muito quente de 6100. Calibrar nós mesmos o painel com um colorímetro X-Rite resolve essas deficiências.
Exibir tempos de resposta
| ↔ Tempo de resposta preto para branco | ||
|---|---|---|
| 11 ms ... ascensão ↗ e queda ↘ combinadas | ↗ 7.6 ms ascensão | 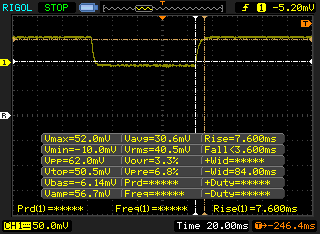 |
| ↘ 3.4 ms queda | ||
| A tela mostra boas taxas de resposta em nossos testes, mas pode ser muito lenta para jogadores competitivos. Em comparação, todos os dispositivos testados variam de 0.1 (mínimo) a 240 (máximo) ms. » 30 % de todos os dispositivos são melhores. Isso significa que o tempo de resposta medido é melhor que a média de todos os dispositivos testados (19.8 ms). | ||
| ↔ Tempo de resposta 50% cinza a 80% cinza | ||
| 14.8 ms ... ascensão ↗ e queda ↘ combinadas | ↗ 7.6 ms ascensão | 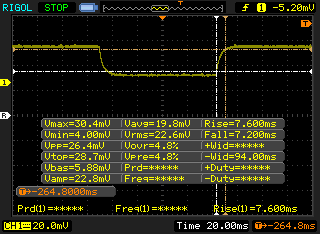 |
| ↘ 7.2 ms queda | ||
| A tela mostra boas taxas de resposta em nossos testes, mas pode ser muito lenta para jogadores competitivos. Em comparação, todos os dispositivos testados variam de 0.165 (mínimo) a 636 (máximo) ms. » 29 % de todos os dispositivos são melhores. Isso significa que o tempo de resposta medido é melhor que a média de todos os dispositivos testados (30.9 ms). | ||
Cintilação da tela / PWM (modulação por largura de pulso)
| Tela tremeluzindo / PWM não detectado | 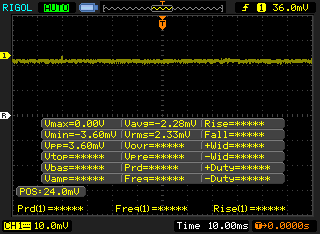 | ||
[pwm_comparison] Em comparação: 52 % de todos os dispositivos testados não usam PWM para escurecer a tela. Se PWM foi detectado, uma média de 7748 (mínimo: 5 - máximo: 343500) Hz foi medida. | |||
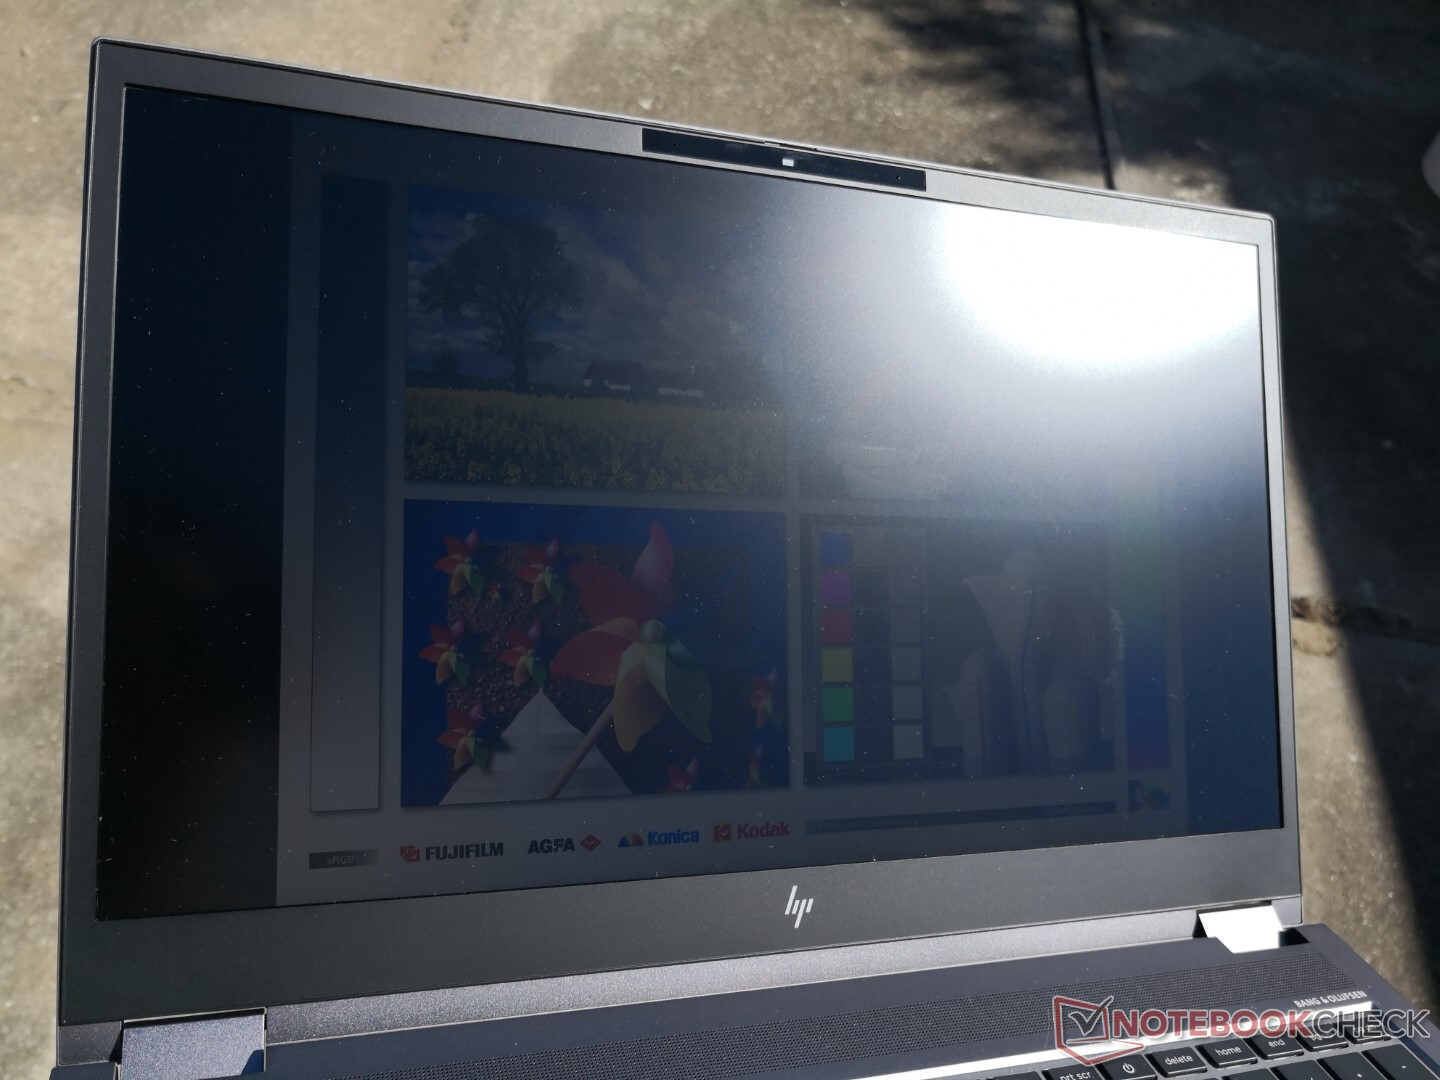
A visibilidade ao ar livre é melhor do que em muitas outras estações de trabalho devido à retroiluminação extra-brilho de 600 nit. Até mesmo a própria HPZBook Studio 15 G8 ou Firefly 15 G7 não se aproximam de 400 lêndeas cada uma em suas respectivas configurações de brilho máximo. No entanto, você ainda vai querer escalar a fonte adequadamente e trabalhar sob sombra para maximizar a capacidade de visualização.
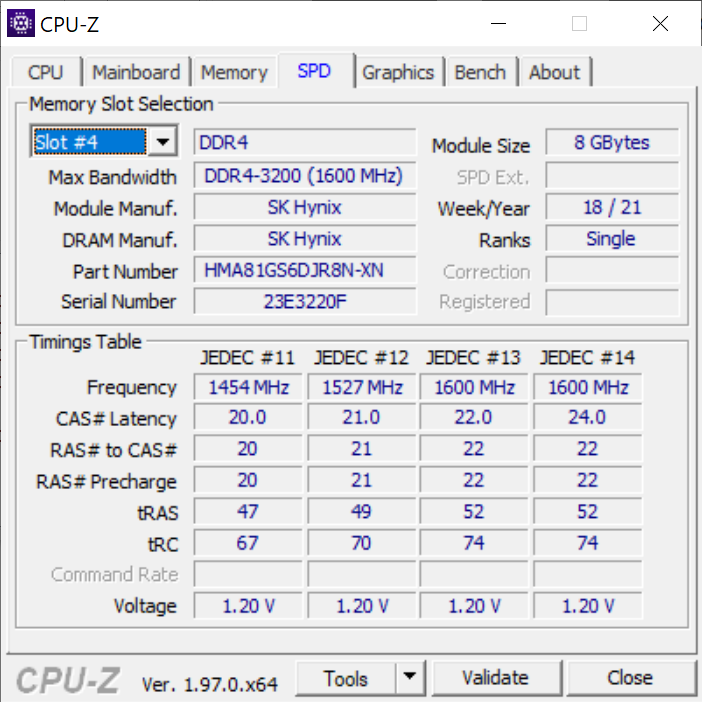
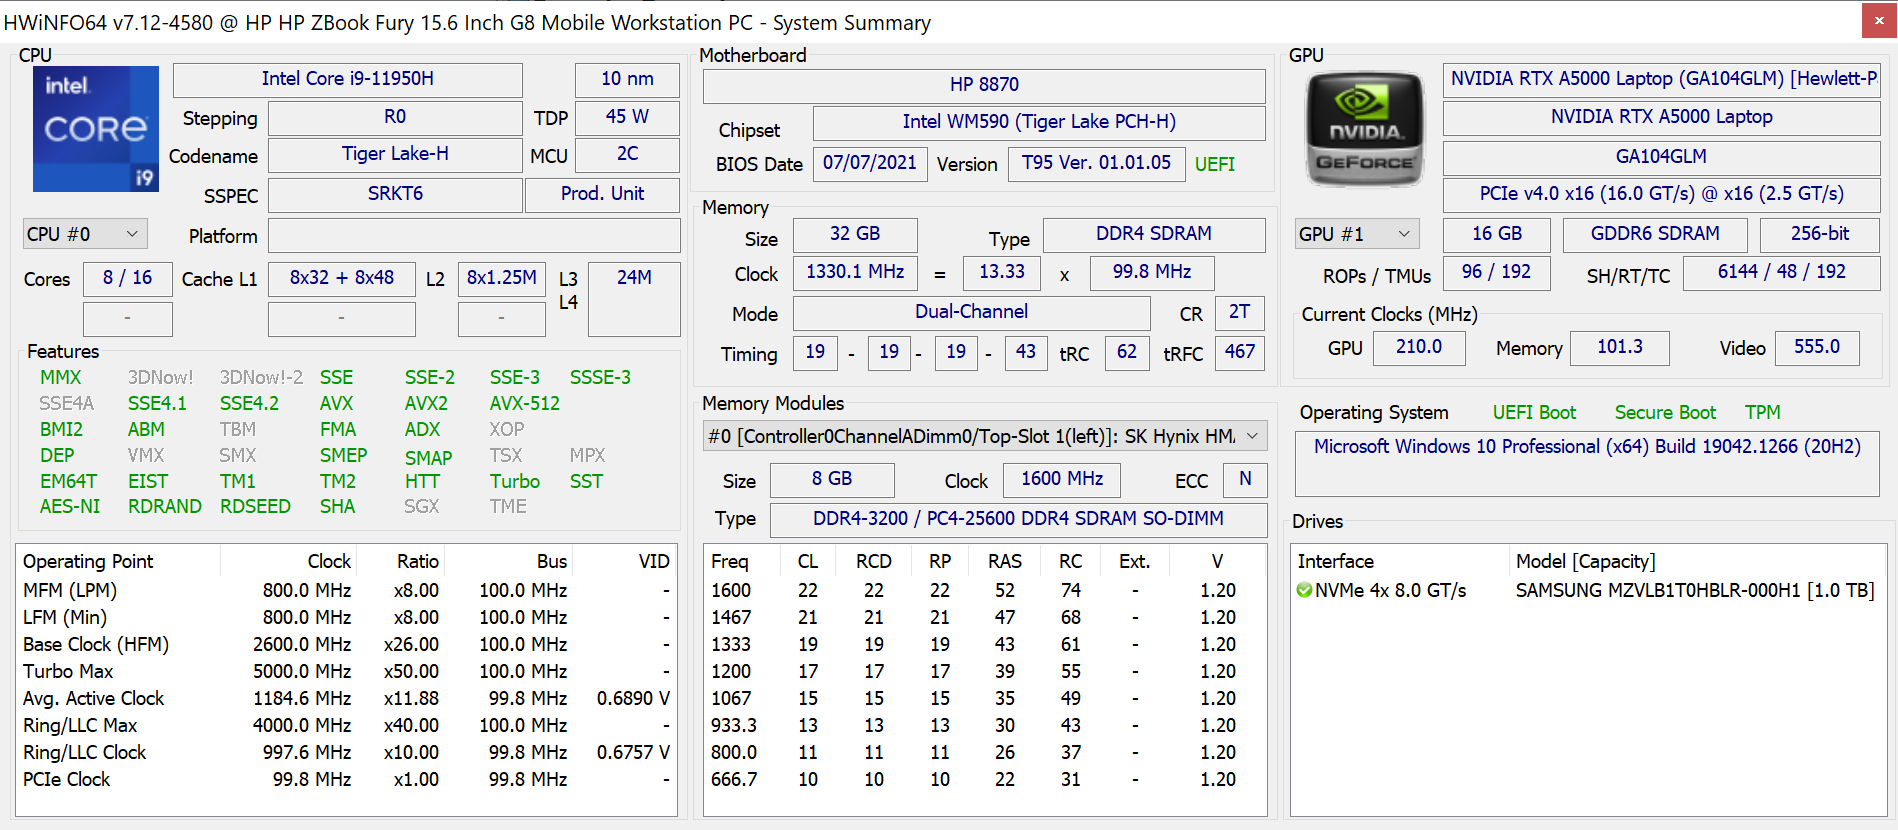
Desempenho - Intel 11th Gen
As opções de CPU abrangem Tiger Lake-H CPUs e ambas Nvidia T1200 e RTX Série A GPUs até o RTX A5000. As opções Xeon e mesmo Radeon Pro W6600M também estão disponíveis para uma gama muito ampla de opções configuráveis. As opções mais avançadas, em particular, são alguns dos mais rápidos processadores da classe de estação de trabalho móvel que você pode encontrar em qualquer laptop
Barra redimensionável e Dynamic Boost 2.0 são suportados enquanto Advanced Optimus e WhisperMode 2.0 não são. Também não há, infelizmente, uma chave gráfica manual.
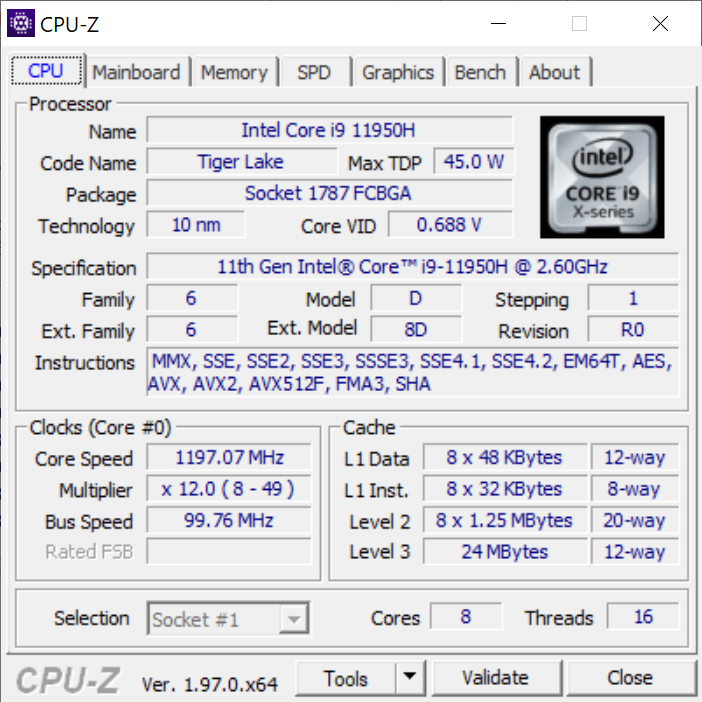
Processador
O desempenho da CPU de múltiplas roscas está alguns pontos percentuais abaixo do Núcleo i9-11900H como encontrado na concorrência MSI WS66 o que é de se esperar da integração das características vPro Núcleo i9-11950H no entanto, o desempenho de uma única linha continua excelente e em igualdade com sua contraparte não-profissional. O desempenho geral multifios é cerca de 15% maior do que o Xeon W-10885M na ZBook Fury 15 G7 do ano passado, mas sem qualquer apoio para a ECC RAM, é claro.
Cinebench R15 Multi Loop
Cinebench R23: Multi Core | Single Core
Cinebench R15: CPU Multi 64Bit | CPU Single 64Bit
Blender: v2.79 BMW27 CPU
7-Zip 18.03: 7z b 4 -mmt1 | 7z b 4
Geekbench 5.5: Single-Core | Multi-Core
HWBOT x265 Benchmark v2.2: 4k Preset
LibreOffice : 20 Documents To PDF
R Benchmark 2.5: Overall mean
| Cinebench R23 / Multi Core | |
| Lenovo Legion 5 15ACH-82JU00C6GE-FL | |
| MSI GS76 Stealth 11UH | |
| Média Intel Core i9-11950H (12048 - 13113, n=4) | |
| HP ZBook Fury 15 G8 | |
| Lenovo ThinkPad P15 G2-20YQ001JGE | |
| Dell Precision 5000 5560 | |
| Gigabyte Aero 15 OLED XC | |
| HP ZBook Fury 15 G7 | |
| Cinebench R23 / Single Core | |
| HP ZBook Fury 15 G8 | |
| Média Intel Core i9-11950H (1569 - 1633, n=4) | |
| MSI GS76 Stealth 11UH | |
| Dell Precision 5000 5560 | |
| Lenovo ThinkPad P15 G2-20YQ001JGE | |
| Lenovo Legion 5 15ACH-82JU00C6GE-FL | |
| HP ZBook Fury 15 G7 | |
| Gigabyte Aero 15 OLED XC | |
| Geekbench 5.5 / Single-Core | |
| Média Intel Core i9-11950H (1623 - 1702, n=3) | |
| MSI GS76 Stealth 11UH | |
| Lenovo ThinkPad P15 G2-20YQ001JGE | |
| Lenovo Legion 5 15ACH-82JU00C6GE-FL | |
| Acer Nitro 5 AN515-45-R05E | |
| HP ZBook Fury 15 G7 | |
| Dell Precision 5550 P91F | |
| Gigabyte Aero 15 OLED XC | |
| Geekbench 5.5 / Multi-Core | |
| MSI GS76 Stealth 11UH | |
| Lenovo ThinkPad P15 G2-20YQ001JGE | |
| Dell Precision 5550 P91F | |
| Média Intel Core i9-11950H (7286 - 8152, n=3) | |
| Gigabyte Aero 15 OLED XC | |
| Lenovo Legion 5 15ACH-82JU00C6GE-FL | |
| HP ZBook Fury 15 G7 | |
| Acer Nitro 5 AN515-45-R05E | |
| HWBOT x265 Benchmark v2.2 / 4k Preset | |
| Lenovo Legion 5 15ACH-82JU00C6GE-FL | |
| MSI GS76 Stealth 11UH | |
| HP ZBook Fury 15 G8 | |
| Média Intel Core i9-11950H (13.8 - 14.5, n=4) | |
| Lenovo ThinkPad P15 G2-20YQ001JGE | |
| Dell Precision 5000 5560 | |
| Gigabyte Aero 15 OLED XC | |
| Acer Nitro 5 AN515-45-R05E | |
| Dell Precision 5550 P91F | |
| HP ZBook Fury 15 G7 | |
| LibreOffice / 20 Documents To PDF | |
| Lenovo Legion 5 15ACH-82JU00C6GE-FL | |
| Gigabyte Aero 15 OLED XC | |
| HP ZBook Fury 15 G7 | |
| Acer Nitro 5 AN515-45-R05E | |
| HP ZBook Fury 15 G8 | |
| MSI GS76 Stealth 11UH | |
| Lenovo ThinkPad P15 G2-20YQ001JGE | |
| Média Intel Core i9-11950H (38.6 - 53.2, n=4) | |
| Dell Precision 5000 5560 | |
| Dell Precision 5550 P91F | |
* ... menor é melhor
Desempenho do sistema
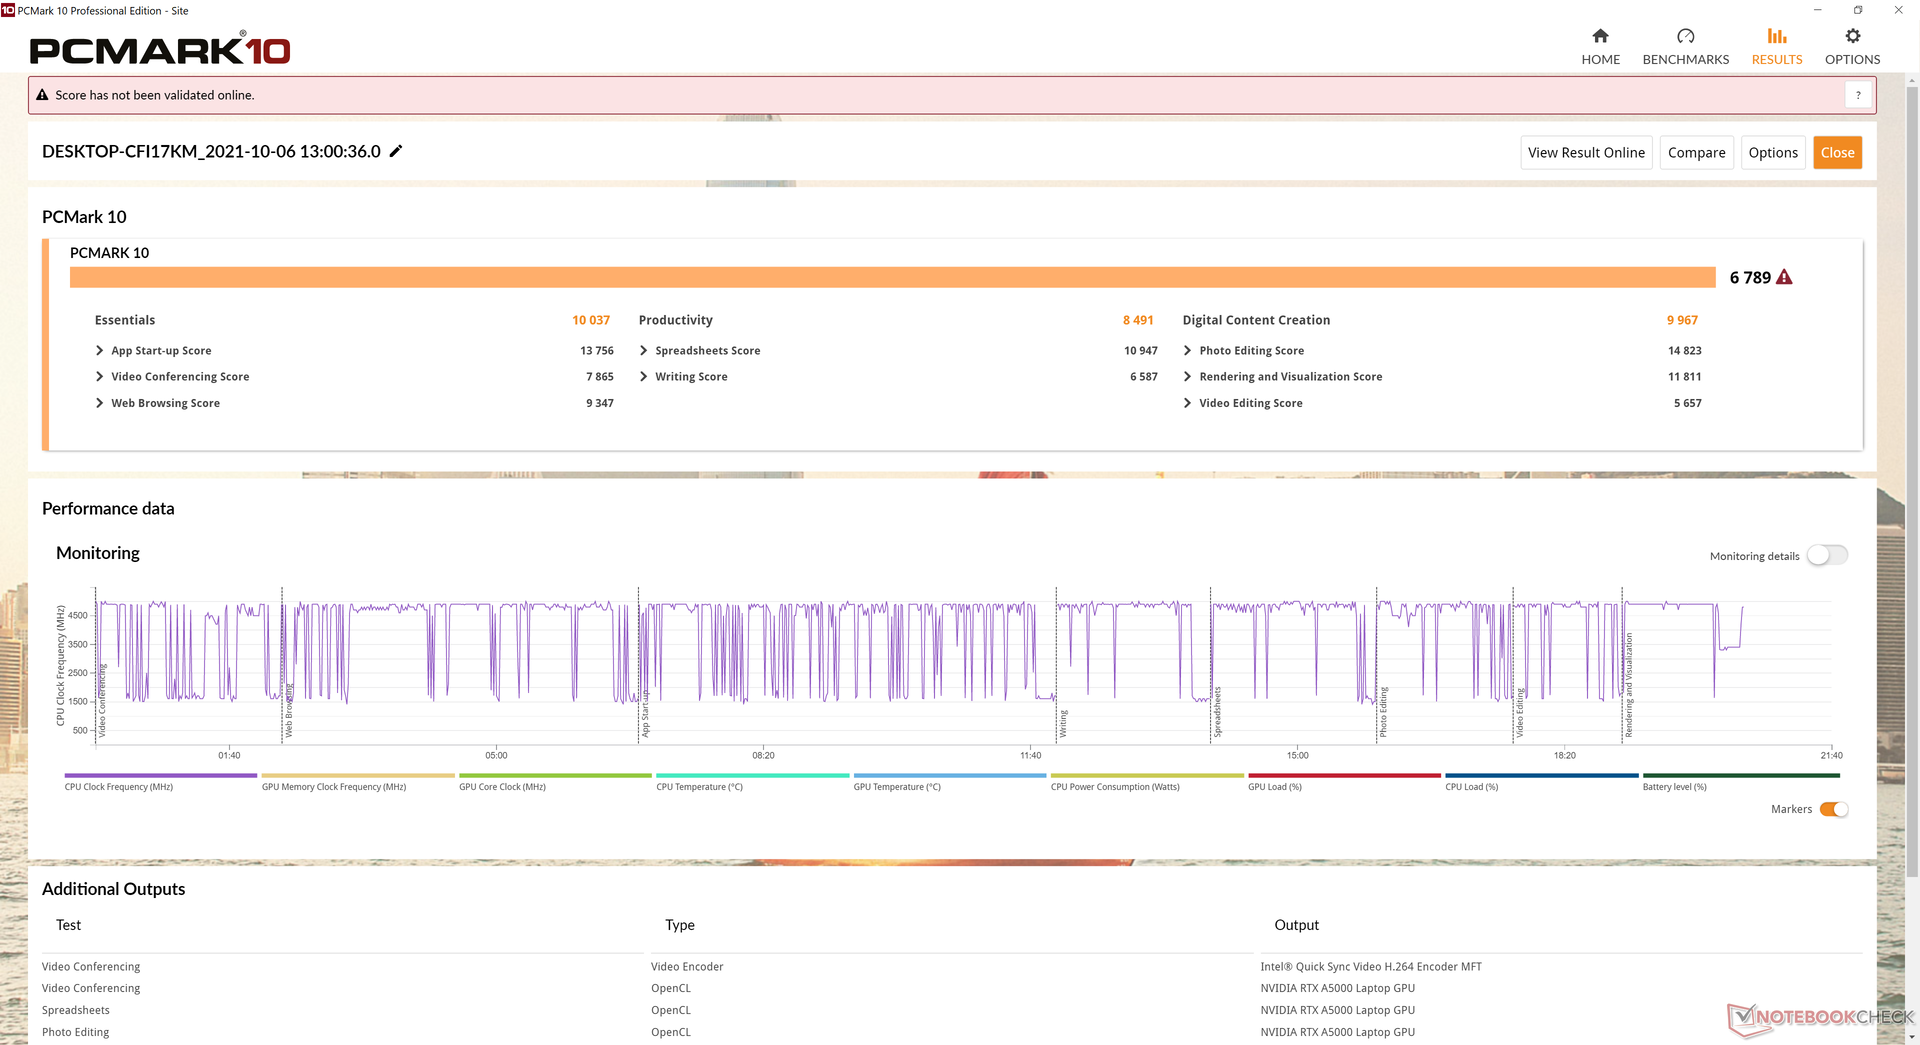
As pontuações PCMark são consistentemente mais altas do que as que gravamos no Fury 15 G7, sendo quase idênticas às que gravamos no Studio 15 G8 mais grosso com gráficos RTX 3070.
| PCMark 10 / Score | |
| HP ZBook Fury 15 G8 | |
| Média Intel Core i9-11950H, NVIDIA RTX A5000 Laptop GPU (n=1) | |
| HP ZBook Studio 15 G8 | |
| Dell Precision 5000 5560 | |
| HP ZBook Fury 15 G7 | |
| Lenovo ThinkPad P15s Gen2-20W6000GGE | |
| HP ZBook Firefly 15 G7 | |
| PCMark 10 / Essentials | |
| Dell Precision 5000 5560 | |
| HP ZBook Fury 15 G8 | |
| Média Intel Core i9-11950H, NVIDIA RTX A5000 Laptop GPU (n=1) | |
| HP ZBook Studio 15 G8 | |
| Lenovo ThinkPad P15s Gen2-20W6000GGE | |
| HP ZBook Fury 15 G7 | |
| HP ZBook Firefly 15 G7 | |
| PCMark 10 / Productivity | |
| Lenovo ThinkPad P15s Gen2-20W6000GGE | |
| Dell Precision 5000 5560 | |
| HP ZBook Fury 15 G8 | |
| Média Intel Core i9-11950H, NVIDIA RTX A5000 Laptop GPU (n=1) | |
| HP ZBook Studio 15 G8 | |
| HP ZBook Fury 15 G7 | |
| HP ZBook Firefly 15 G7 | |
| PCMark 10 / Digital Content Creation | |
| HP ZBook Fury 15 G8 | |
| Média Intel Core i9-11950H, NVIDIA RTX A5000 Laptop GPU (n=1) | |
| HP ZBook Studio 15 G8 | |
| Dell Precision 5000 5560 | |
| HP ZBook Fury 15 G7 | |
| Lenovo ThinkPad P15s Gen2-20W6000GGE | |
| HP ZBook Firefly 15 G7 | |
| PCMark 10 Score | 6789 pontos | |
Ajuda | ||
Latência do DPC
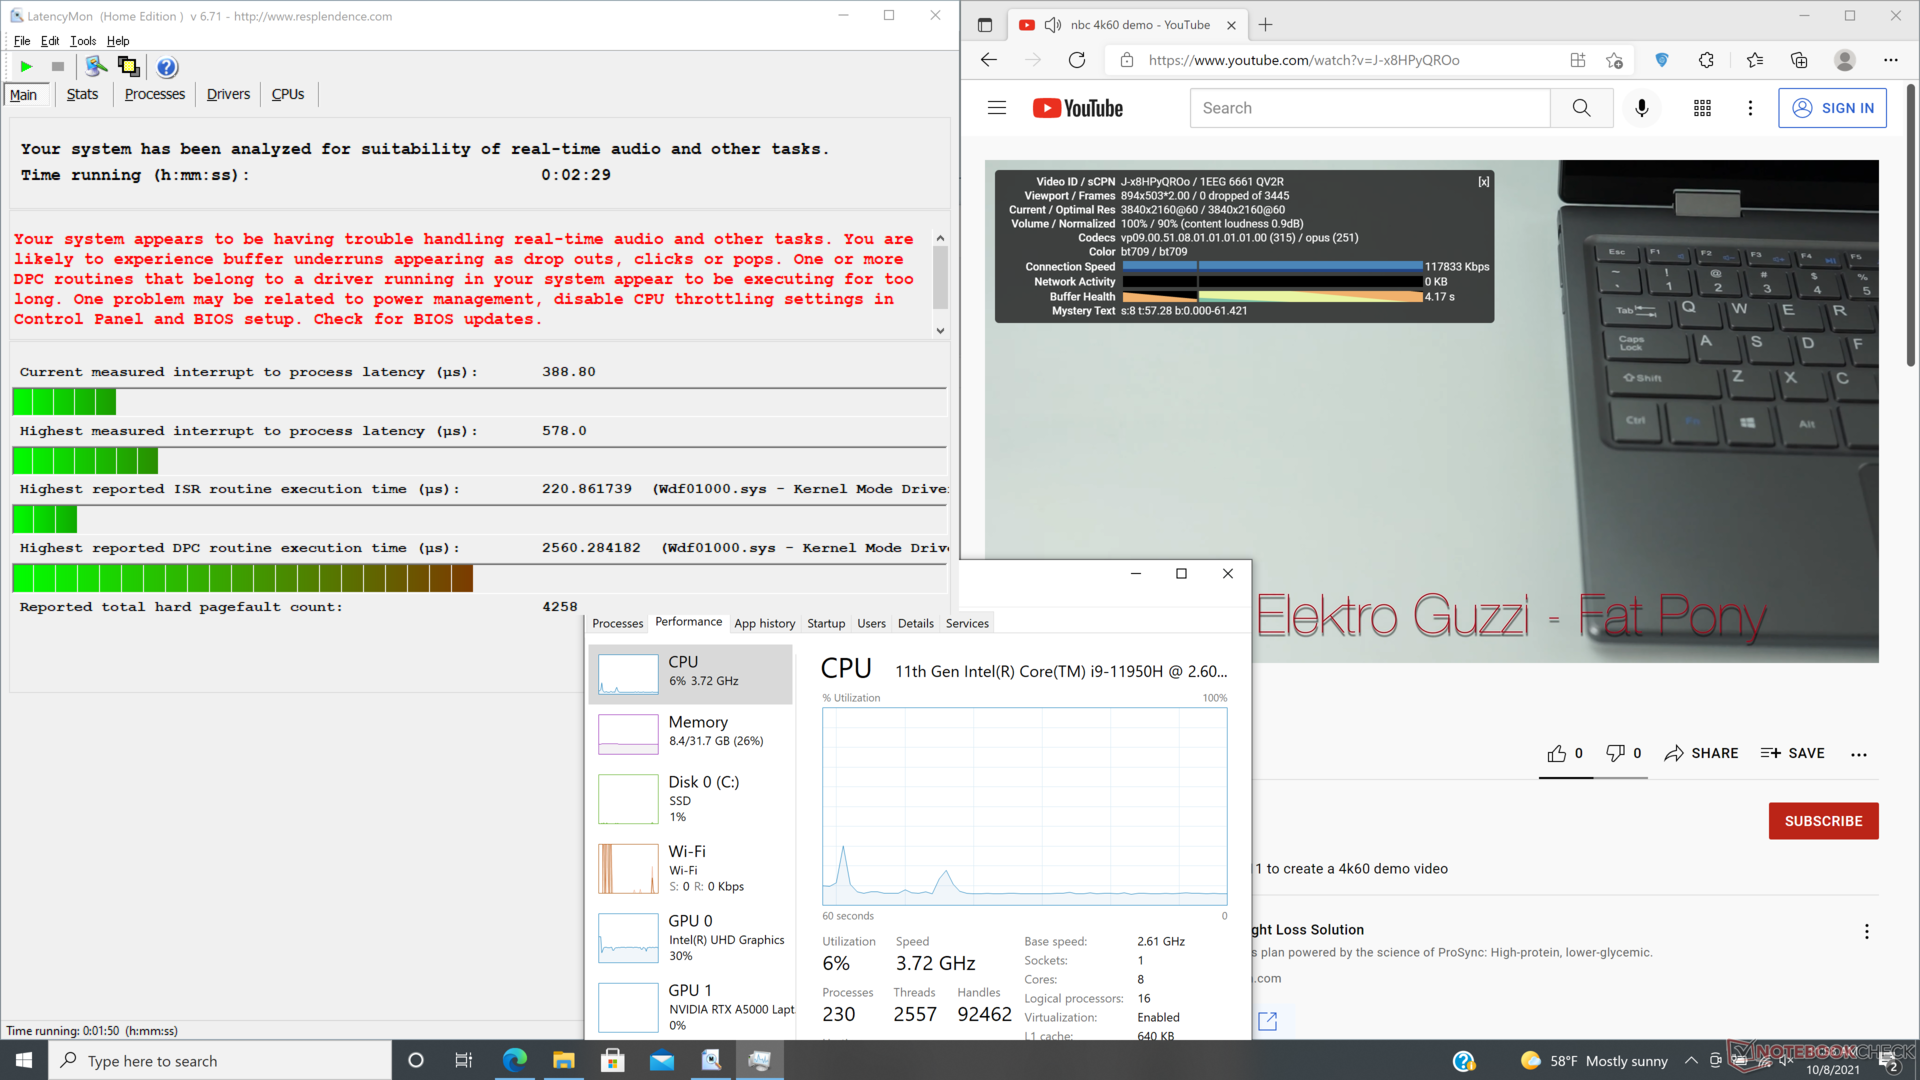
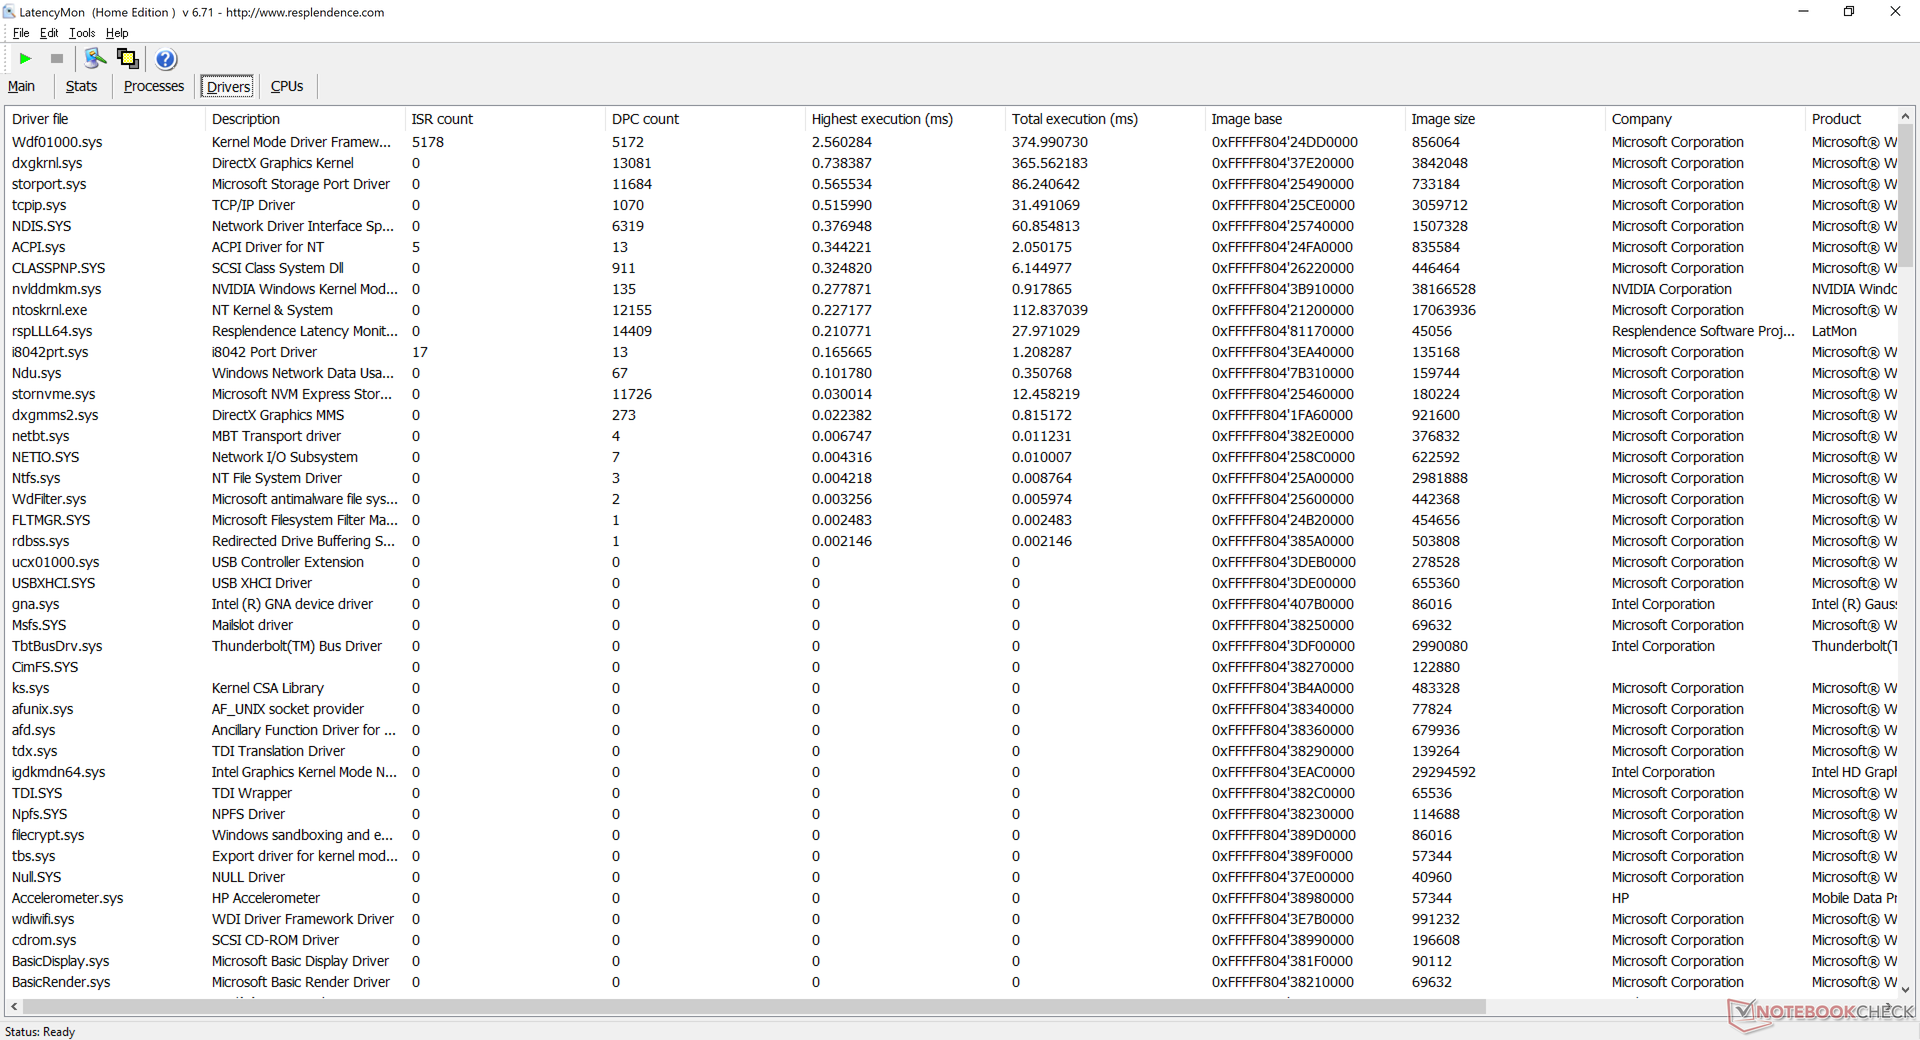
LatencyMon não revela grandes interrupções de latência ao abrir várias abas de navegadores em nossa página inicial ou ao executar Prime95 stress. Os tempos de rotina do DPC, no entanto, seriam muito parecidos com o que observamos no Fury 15 G7 do ano passado. A reprodução de vídeo de 4K a 60 FPS é de outra forma suave e sem queda de quadros.
| DPC Latencies / LatencyMon - interrupt to process latency (max), Web, Youtube, Prime95 | |
| Lenovo ThinkPad P15s Gen2-20W6000GGE | |
| HP ZBook Firefly 15 G7 | |
| HP ZBook Fury 15 G7 | |
| HP ZBook Studio 15 G8 | |
| Dell Precision 5000 5560 | |
| HP ZBook Fury 15 G8 | |
* ... menor é melhor
Dispositivos de armazenamento - Muitas opções
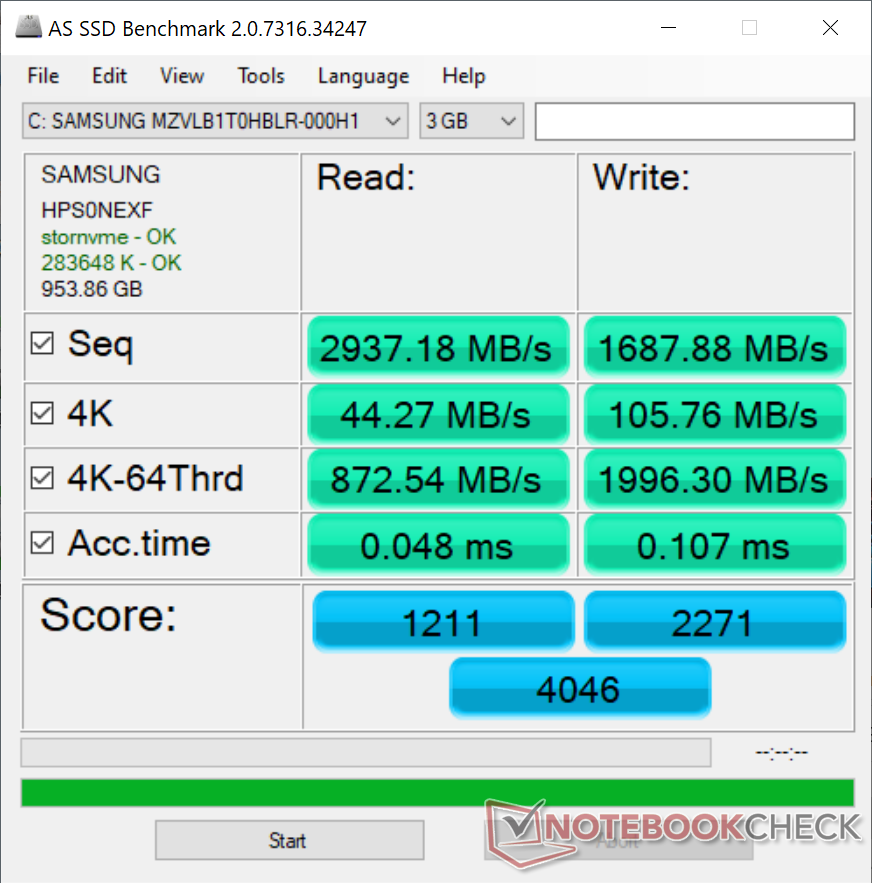
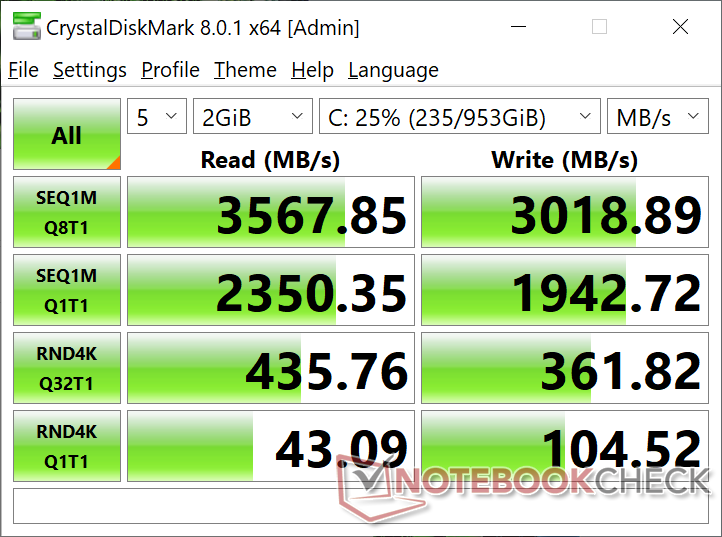
Nossa unidade pode suportar até quatro unidades de armazenamento interno (2x M.2 2280, 1x M.2 2242, 1x SATA III de 2,5 polegadas). Curiosamente, a HP não está oferecendo nenhuma opção PCIe4, pois todas as SKUs atuais vêm com SSDs PCIe3, tais como os familiares Samsung PM981a. Chegamos à HP para tentar confirmar se as velocidades PCIe4 NVMe são suportadas e atualizaremos esta página de acordo.
| HP ZBook Fury 15 G8 Samsung PM981a MZVLB1T0HBLR | HP ZBook Fury 15 G7 Samsung PM981a MZVLB1T0HBLR | Dell Precision 5000 5560 Samsung PM9A1 MZVL22T0HBLB | HP ZBook Studio 15 G8 Samsung PM981a MZVLB2T0HALB | Lenovo ThinkPad P15s Gen2-20W6000GGE WDC PC SN720 SDAQNTW-1T00 | HP ZBook Firefly 15 G7 Toshiba XG6 KXG60ZNV1T02 | |
|---|---|---|---|---|---|---|
| AS SSD | 24% | 93% | 104% | 19% | -1% | |
| Seq Read (MB/s) | 2937 | 2127 -28% | 5169 76% | 2953 1% | 2796 -5% | 2666 -9% |
| Seq Write (MB/s) | 1688 | 1296 -23% | 1986 18% | 1691 0% | 2525 50% | 1257 -26% |
| 4K Read (MB/s) | 44.27 | 54.8 24% | 78 76% | 43.98 -1% | 50.9 15% | 48.04 9% |
| 4K Write (MB/s) | 105.8 | 110.8 5% | 214.6 103% | 105.4 0% | 211.9 100% | 137.5 30% |
| 4K-64 Read (MB/s) | 873 | 1420 63% | 1232 41% | 1065 22% | 1505 72% | 977 12% |
| 4K-64 Write (MB/s) | 1996 | 2012 1% | 2719 36% | 1957 -2% | 949 -52% | 1142 -43% |
| Access Time Read * (ms) | 0.048 | 0.046 4% | 0.024 50% | 0.04 17% | 0.081 -69% | 0.053 -10% |
| Access Time Write * (ms) | 0.107 | 0.099 7% | 0.059 45% | 0.105 2% | 0.019 82% | 0.03 72% |
| Score Read (Points) | 1211 | 1687 39% | 1827 51% | 1404 16% | 1835 52% | 1292 7% |
| Score Write (Points) | 2271 | 2253 -1% | 3133 38% | 2232 -2% | 1413 -38% | 1406 -38% |
| Score Total (Points) | 4046 | 4770 18% | 5753 42% | 4297 6% | 4177 3% | 3297 -19% |
| Copy ISO MB/s (MB/s) | 901 | 2779 208% | 3201 255% | 2474 175% | ||
| Copy Program MB/s (MB/s) | 118.7 | 123.3 4% | 415.8 250% | 1074 805% | ||
| Copy Game MB/s (MB/s) | 372 | 440.8 18% | 1212 226% | 1929 419% | ||
| CrystalDiskMark 5.2 / 6 | 10% | 54% | 7% | 31% | 7% | |
| Write 4K (MB/s) | 96.3 | 114.1 18% | 172.4 79% | 110.5 15% | 237.6 147% | 133.1 38% |
| Read 4K (MB/s) | 51.5 | 57.2 11% | 78.8 53% | 51.8 1% | 54.7 6% | 51.6 0% |
| Write Seq (MB/s) | 1942 | 2580 33% | 2991 54% | 2071 7% | 2603 34% | 1986 2% |
| Read Seq (MB/s) | 2504 | 2527 1% | 3351 34% | 2505 0% | 1889 -25% | 2208 -12% |
| Write 4K Q32T1 (MB/s) | 346.6 | 480.2 39% | 459.2 32% | 429.8 24% | 505 46% | 462.3 33% |
| Read 4K Q32T1 (MB/s) | 408 | 387.6 -5% | 484.3 19% | 418.3 3% | 606 49% | 400.2 -2% |
| Write Seq Q32T1 (MB/s) | 3019 | 2996 -1% | 4761 58% | 3060 1% | 2795 -7% | 3074 2% |
| Read Seq Q32T1 (MB/s) | 3514 | 2853 -19% | 7071 101% | 3539 1% | 3448 -2% | 3268 -7% |
| Média Total (Programa/Configurações) | 17% /
19% | 74% /
79% | 56% /
69% | 25% /
24% | 3% /
2% |
* ... menor é melhor

Disk Throttling: DiskSpd Read Loop, Queue Depth 8
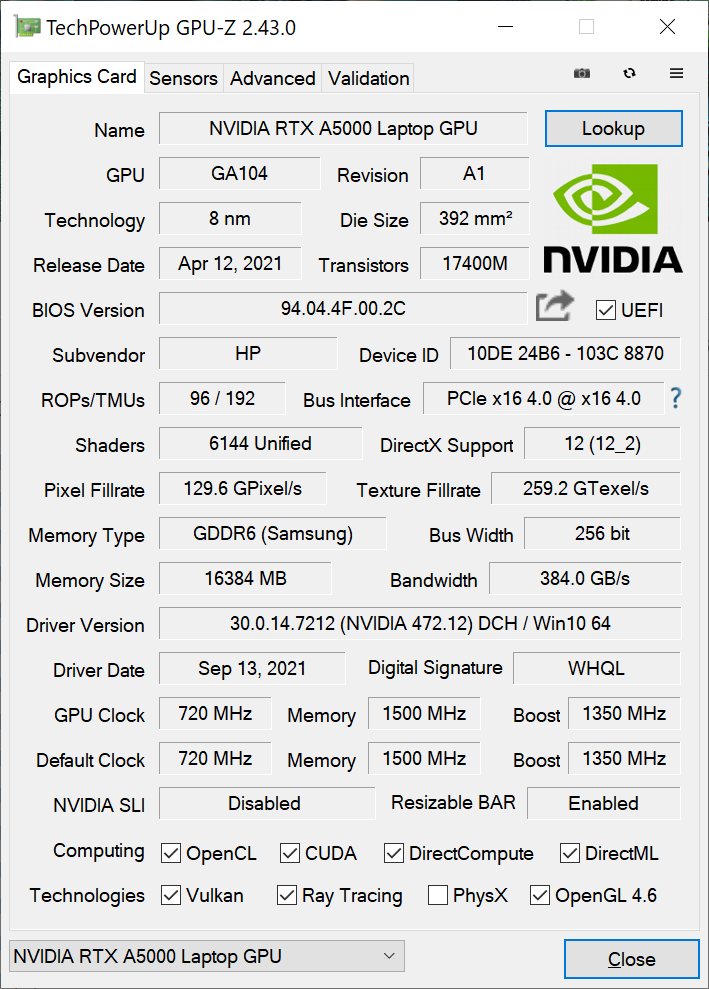
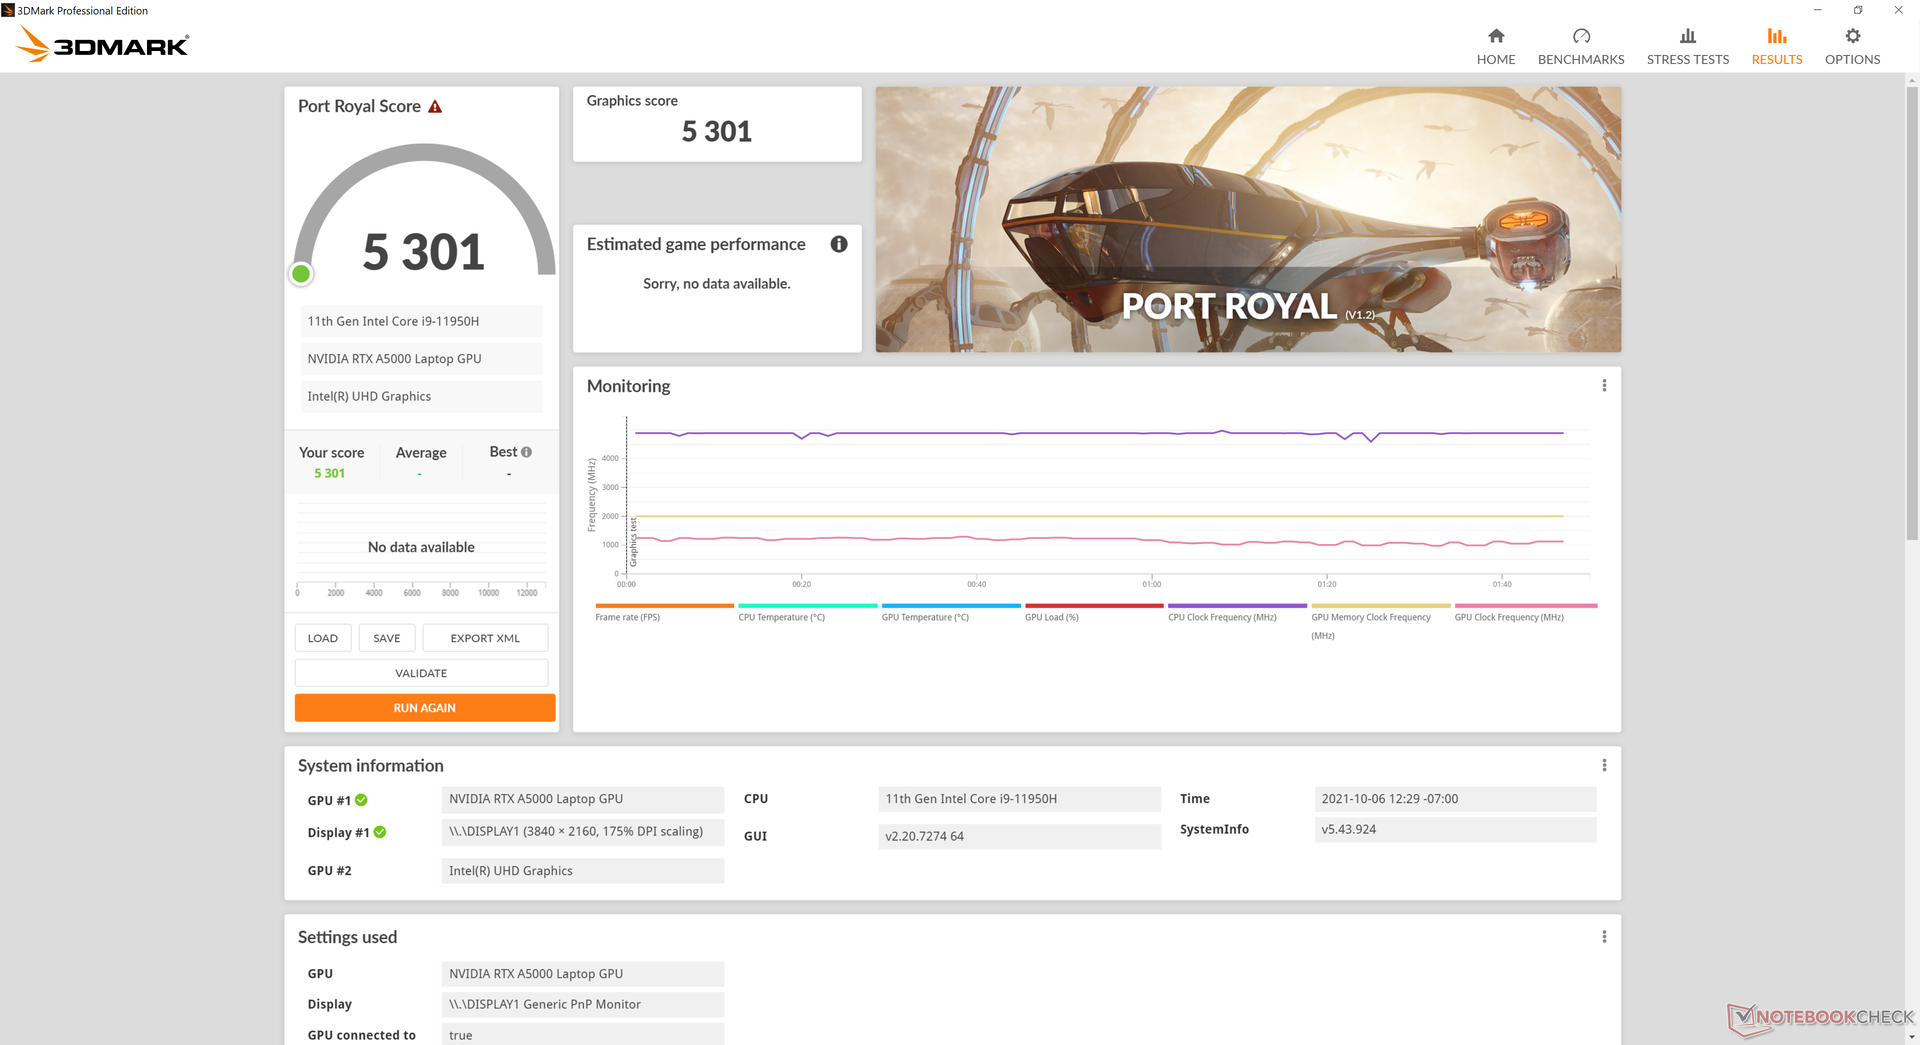
GPU Performance - Quadro RTX A5000 Powerhouse
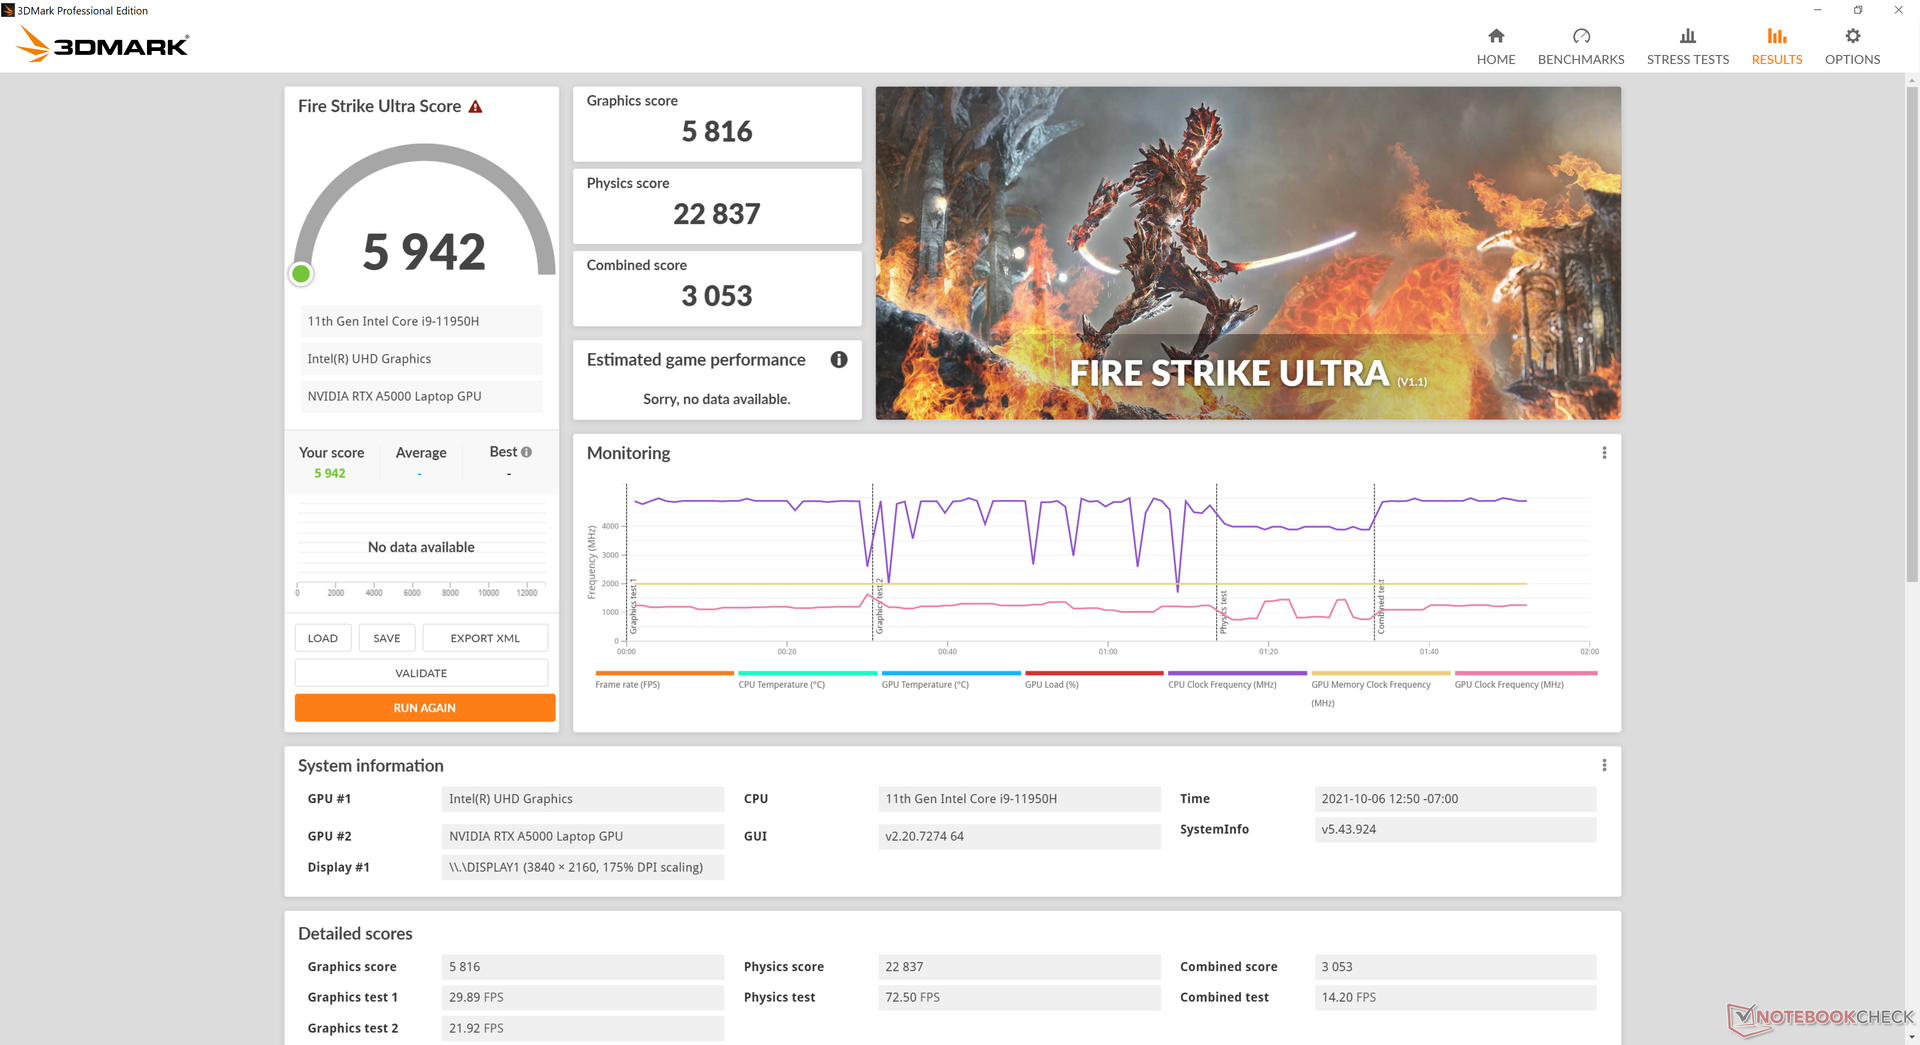
O desempenho gráfico bruto está entre o móvel GeForce RTX 3060 e móvel RTX 3070 ser cerca de 10 a 20 por cento mais rápido que o Quadro RTX 5000 Max-Q na antiga Fúria 15 G7. Alguns sub-benchmarks dentro do SpecViewPerf podem até mesmo ver uma melhoria de 40 a 50 por cento
Apesar de não estar otimizado para jogos, o sistema pode definitivamente alimentar até mesmo os títulos mais exigentes na resolução QHD. O desempenho geral dos jogos é semelhante ao do celular GeForce RTX 3060 na maioria dos casos.
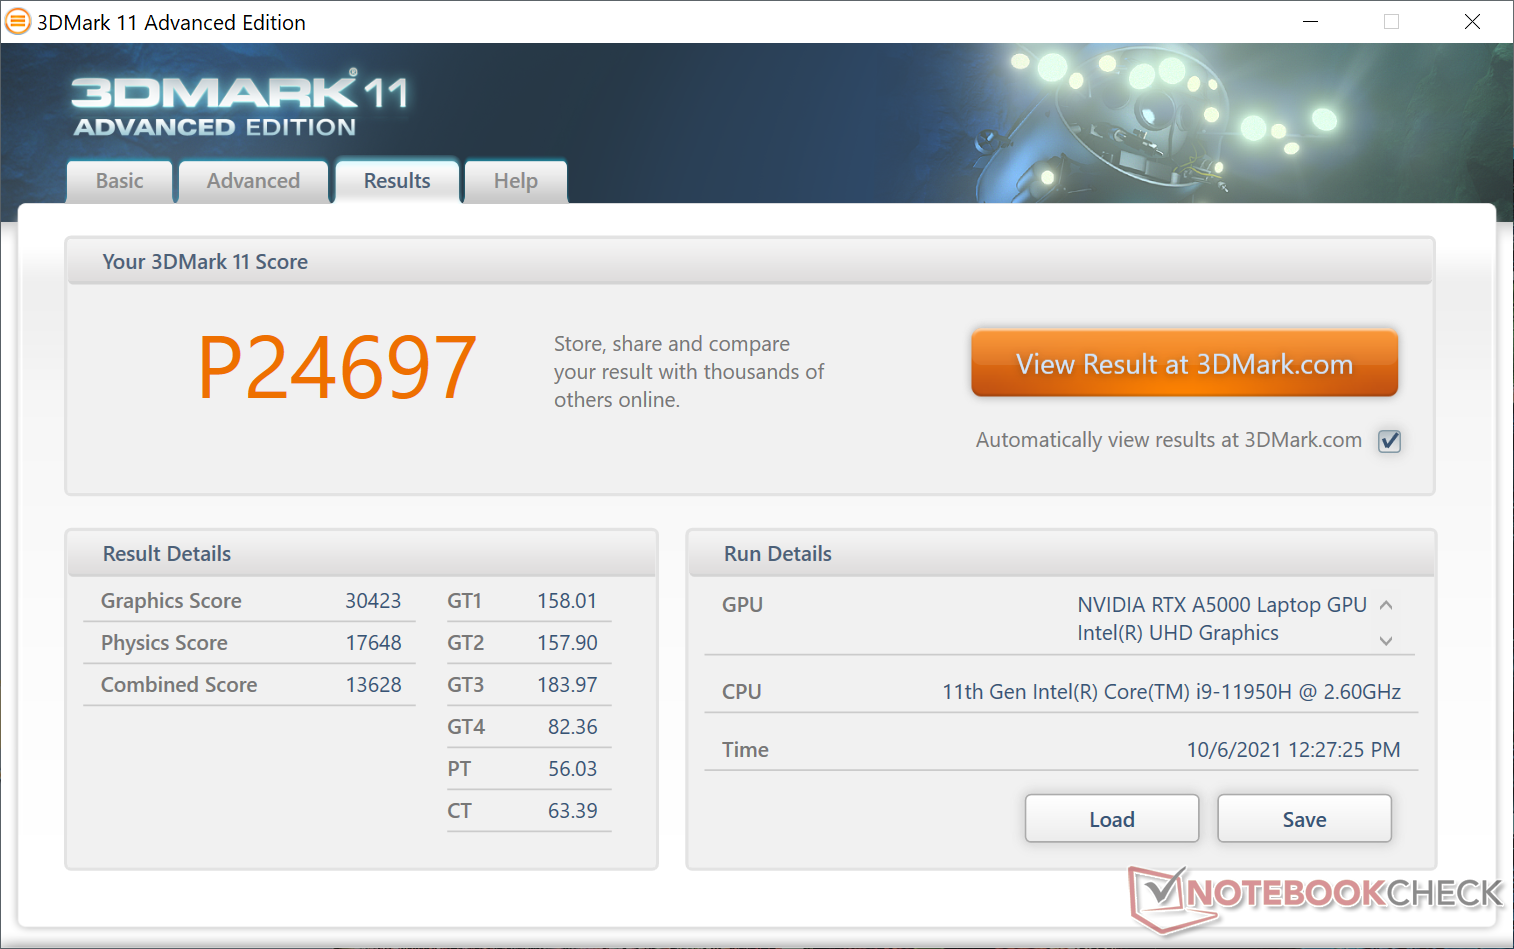
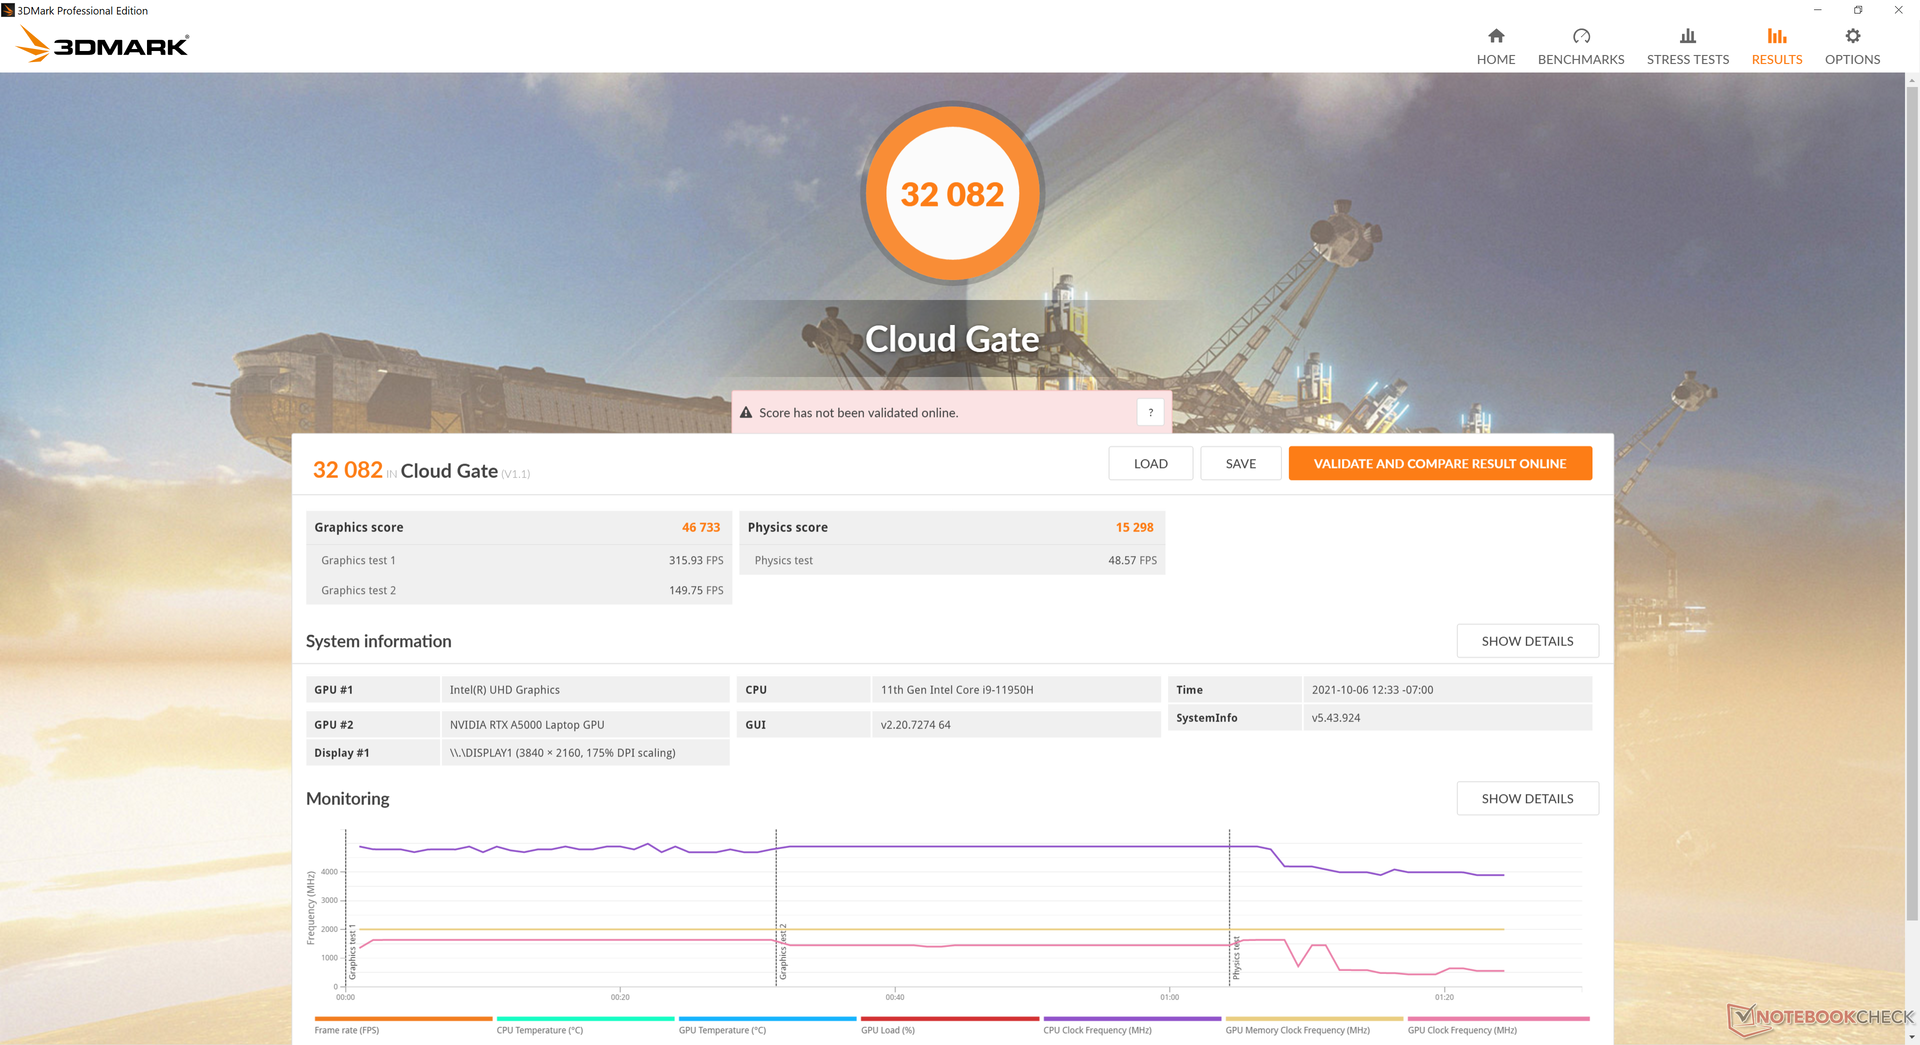
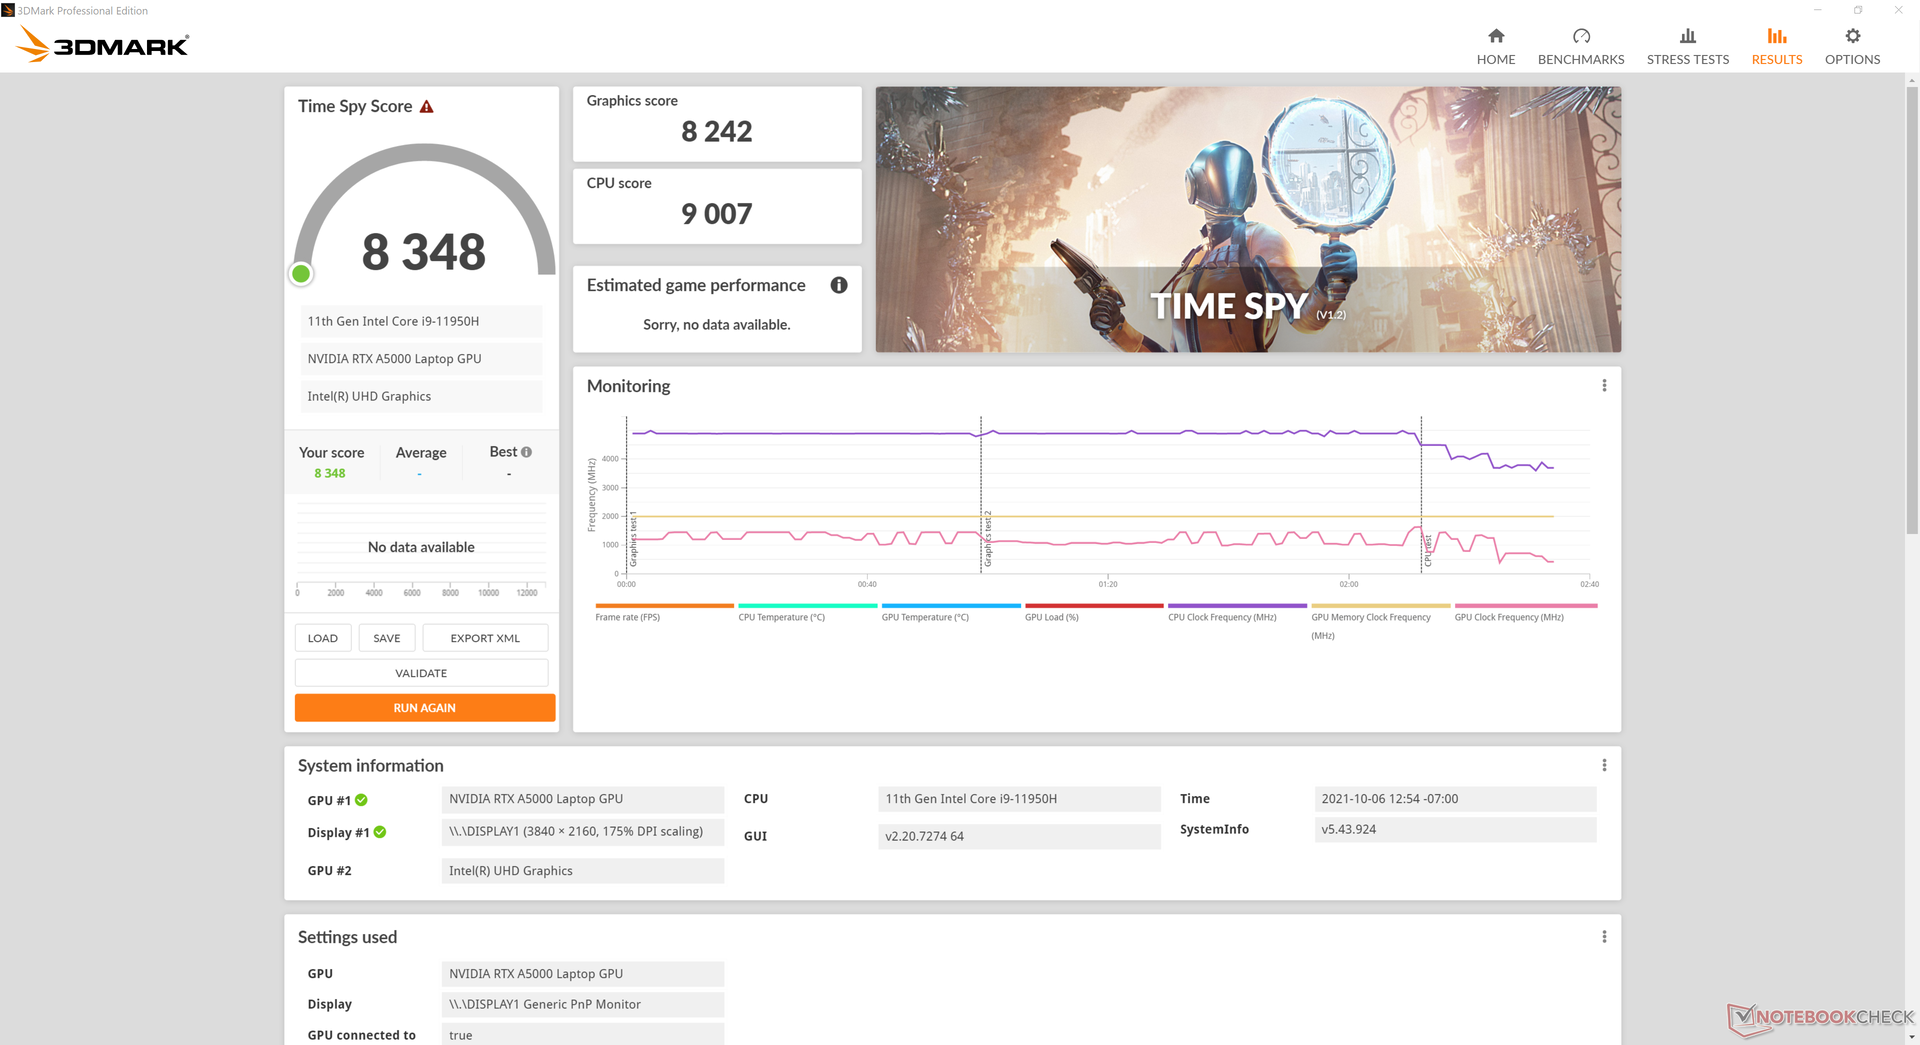
| 3DMark 11 Performance | 24697 pontos | |
| 3DMark Cloud Gate Standard Score | 32082 pontos | |
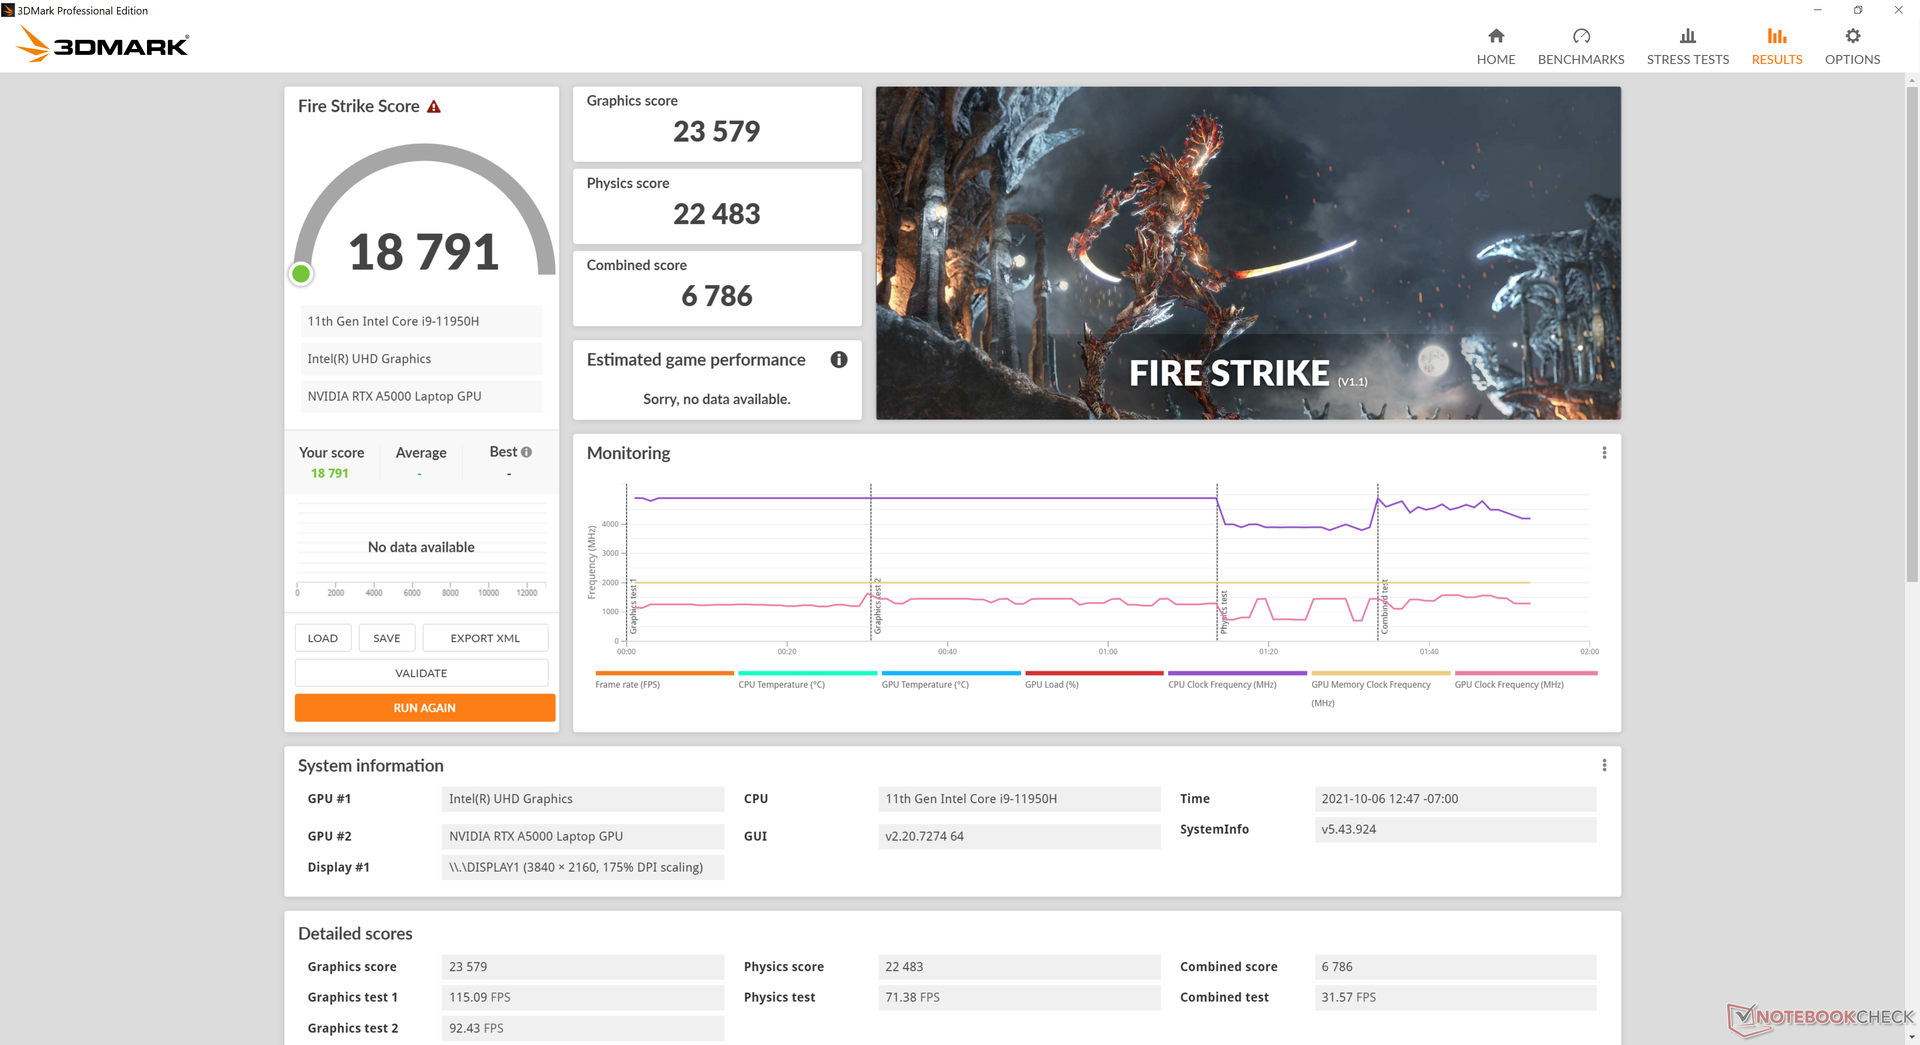
| 3DMark Fire Strike Score | 18791 pontos | |
| 3DMark Time Spy Score | 8348 pontos | |
Ajuda | ||
Witcher 3 FPS Chart
| baixo | média | alto | ultra | QHD | 4K | |
|---|---|---|---|---|---|---|
| GTA V (2015) | 175 | 169 | 131 | 76.1 | 70.4 | 75.5 |
| The Witcher 3 (2015) | 335.1 | 227.4 | 149.5 | 81.7 | 57.5 | |
| Dota 2 Reborn (2015) | 164 | 148 | 140 | 131 | 95 | |
| Final Fantasy XV Benchmark (2018) | 155 | 110 | 81.1 | 62.6 | 35.4 | |
| X-Plane 11.11 (2018) | 108 | 90.8 | 76.5 | 48.6 | ||
| Far Cry 5 (2018) | 137 | 93 | 90 | 85 | 79 | 44 |
| Strange Brigade (2018) | 337 | 195 | 165 | 147 | 108 | 64 |
| Shadow of the Tomb Raider (2018) | 128 | 109 | 106 | 94 | 71 | 38 |
| Far Cry New Dawn (2019) | 105 | 85 | 78 | 71 | 62 | 43 |
| Metro Exodus (2019) | 154 | 94.8 | 74.5 | 59.8 | 46.3 | 28.5 |
| Borderlands 3 (2019) | 159.6 | 121.6 | 85.9 | 67.1 | 46.8 | 25.6 |
| Gears Tactics (2020) | 145.8 | 181.2 | 120.3 | 94.7 | 66.6 | 34.9 |
| Horizon Zero Dawn (2020) | 133 | 109 | 101 | 91 | 73 | 40 |
| Watch Dogs Legion (2020) | 69 | 64 | 60 | 45 | 43 | 26 |
| Dirt 5 (2020) | 178.1 | 115.2 | 91.7 | 74.8 | 59.5 | 39 |
| Assassin´s Creed Valhalla (2020) | 113 | 76 | 64 | 55 | 44 | 29 |
| Immortals Fenyx Rising (2020) | 123 | 90 | 84 | 80 | 59 | 38 |
| Hitman 3 (2021) | 206.6 | 147.3 | 138.1 | 125.8 | 87.1 | 47.1 |
| F1 2021 (2021) | 164 | 136 | 122 | 85 | 59 | 38 |
Emissions
Ruído do sistema
Os dois ventiladores de ~50 mm no Fury 15 G8 tendem a subir em RPM mais cedo do que no Fury 15 G7 quando cargas estressantes são introduzidas. Por exemplo, somos capazes de registrar uma alta de 37,8 dB(A) ao executar a primeira cena de referência de 3DMark 06 em comparação a apenas 31,7 dB(A) no modelo mais antigo. O ruído geral do ventilador permanece mais silencioso do que no ZBook Studio 15 G8, mas muito mais alto do que no mais lento ZBook Firefly 15 G7.
| HP ZBook Fury 15 G8 RTX A5000 Laptop GPU, i9-11950H, Samsung PM981a MZVLB1T0HBLR | HP ZBook Fury 15 G7 Quadro RTX 5000 Max-Q, W-10885M, Samsung PM981a MZVLB1T0HBLR | Dell Precision 5000 5560 RTX A2000 Laptop GPU, i7-11850H, Samsung PM9A1 MZVL22T0HBLB | HP ZBook Studio 15 G8 GeForce RTX 3070 Laptop GPU, i9-11950H, Samsung PM981a MZVLB2T0HALB | Lenovo ThinkPad P15s Gen2-20W6000GGE T500 Laptop GPU, i7-1165G7, WDC PC SN720 SDAQNTW-1T00 | HP ZBook Firefly 15 G7 Quadro P520, i7-10610U, Toshiba XG6 KXG60ZNV1T02 | |
|---|---|---|---|---|---|---|
| Noise | -5% | 8% | -6% | 2% | -3% | |
| desligado / ambiente * (dB) | 24.1 | 26.4 -10% | 23.4 3% | 23.5 2% | 24.3 -1% | 29.3 -22% |
| Idle Minimum * (dB) | 24.1 | 26.4 -10% | 23.6 2% | 25.3 -5% | 25.5 -6% | 29.3 -22% |
| Idle Average * (dB) | 24.1 | 26.4 -10% | 23.6 2% | 25.3 -5% | 25.5 -6% | 29.3 -22% |
| Idle Maximum * (dB) | 24.8 | 26.4 -6% | 23.6 5% | 25.3 -2% | 25.5 -3% | 30 -21% |
| Load Average * (dB) | 37.8 | 31.7 16% | 25.8 32% | 41.2 -9% | 35.65 6% | 32.8 13% |
| Witcher 3 ultra * (dB) | 44.2 | 47 -6% | 40.1 9% | 49.4 -12% | 32.8 26% | |
| Load Maximum * (dB) | 44.2 | 47 -6% | 41.4 6% | 49.4 -12% | 35.65 19% | 32.8 26% |
* ... menor é melhor
Barulho
| Ocioso |
| 24.1 / 24.1 / 24.8 dB |
| Carga |
| 37.8 / 44.2 dB |
 | ||
30 dB silencioso 40 dB(A) audível 50 dB(A) ruidosamente alto |
||
min: | ||
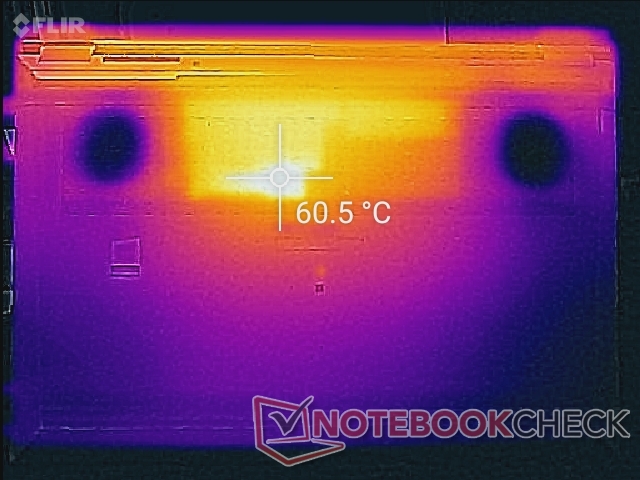
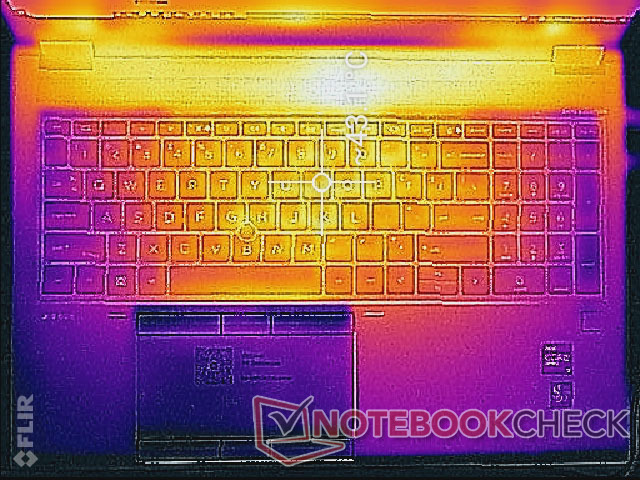
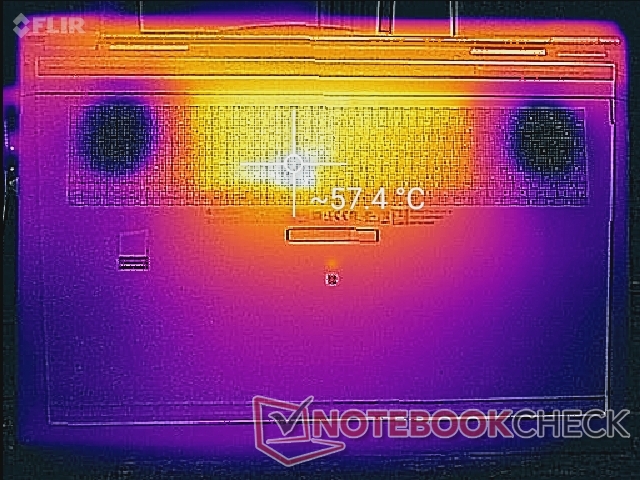
Temperatura - Refrigeração da Câmara de Vapor
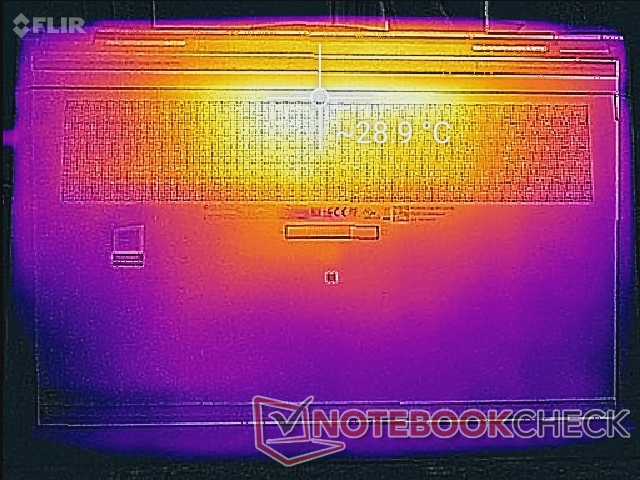
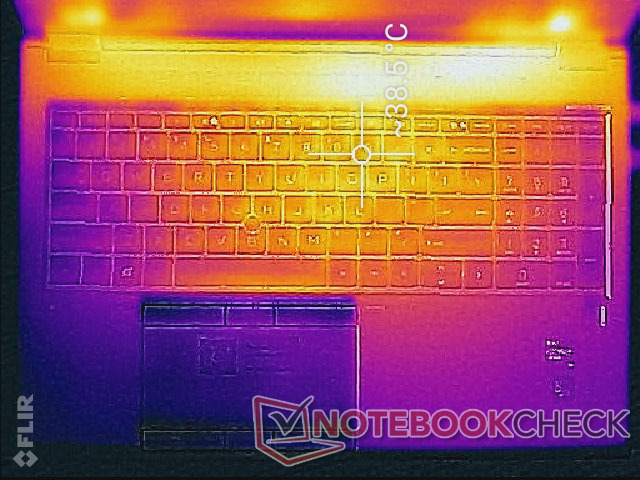
As temperaturas superficiais podem atingir até 43 C e 60 C no topo e no fundo, respectivamente, em comparação com 49 C a 53 C no Precision 7550 quando se correm com cargas exigentes por períodos prolongados. Em outras palavras, o HP é mais frio no topo, às custas de um fundo mais quente, enquanto o Dell é mais frio no fundo, às custas de teclas de teclado mais quentes.
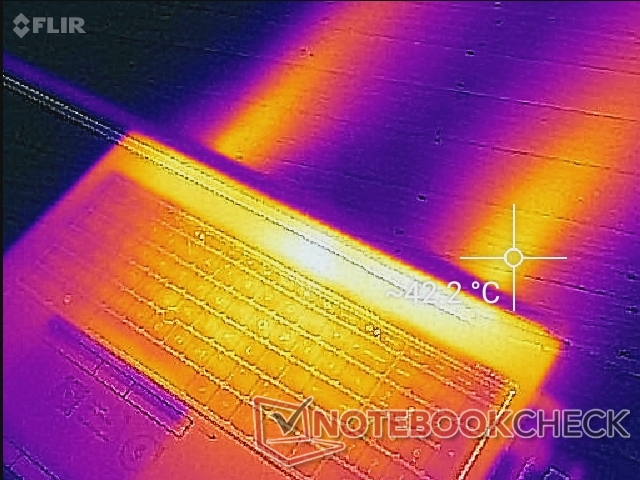
(-) A temperatura máxima no lado superior é 45.6 °C / 114 F, em comparação com a média de 38.2 °C / 101 F , variando de 22.2 a 69.8 °C para a classe Workstation.
(-) A parte inferior aquece até um máximo de 57.6 °C / 136 F, em comparação com a média de 41.1 °C / 106 F
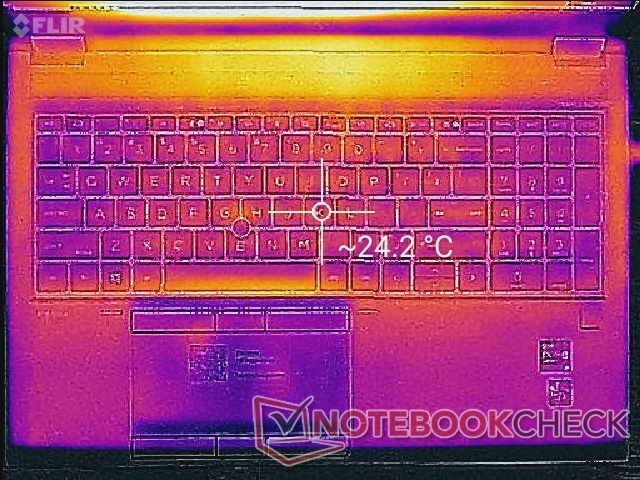
(+) Em uso inativo, a temperatura média para o lado superior é 24.4 °C / 76 F, em comparação com a média do dispositivo de 32 °C / ### class_avg_f### F.
(±) Jogando The Witcher 3, a temperatura média para o lado superior é 34 °C / 93 F, em comparação com a média do dispositivo de 32 °C / ## #class_avg_f### F.
(+) Os apoios para as mãos e o touchpad estão atingindo a temperatura máxima da pele (33 °C / 91.4 F) e, portanto, não estão quentes.
(-) A temperatura média da área do apoio para as mãos de dispositivos semelhantes foi 27.8 °C / 82 F (-5.2 °C / -9.4 F).
Teste de estresse
Quando estressada com Prime95, a CPU aumentaria para 3,6 GHz durante os primeiros segundos até atingir uma temperatura central de 96 C. As taxas de relógio se estabilizariam então na faixa de 3,0 a 3,5 GHz mantendo 96 C. Os resultados são semelhantes ao que observamos tanto na Dell Precision 7550 como na antiga Fury 15 G7 para mostrar que estas estações de trabalho de alto desempenho estão priorizando o desempenho da CPU, mesmo que isso signifique temperaturas centrais muito mais quentes em geral.
Ao rodar Witcher 3, as temperaturas de CPU e GPU se estabilizariam em 94 C e 75 C, respectivamente, em comparação com 85 C e 70 C na Fury 15 G7. Assim, o aumento no desempenho ano após ano implica em ligeiros aumentos de temperatura. Os processadores em nosso Precision 7550 se estabilizariam em temperaturas mais frias por margens relativamente amplas entre 10 a 20 C ao rodar o mesmo jogo.
A potência da placa GPU se estabilizaria em 78 W ao rodar cargas de jogo em comparação com sua meta de 90 W TGP. Somos capazes de atingir um empate de 93 W, embora apenas por um curto período durante o início do teste.
O funcionamento com baterias limitará o desempenho. Um teste 3DMark Fire Strike sobre a energia da bateria retornaria pontuações de Física e Gráficos de 17779 e 6244 pontos, respectivamente, em comparação com 22483 e 23579 pontos quando em rede elétrica.
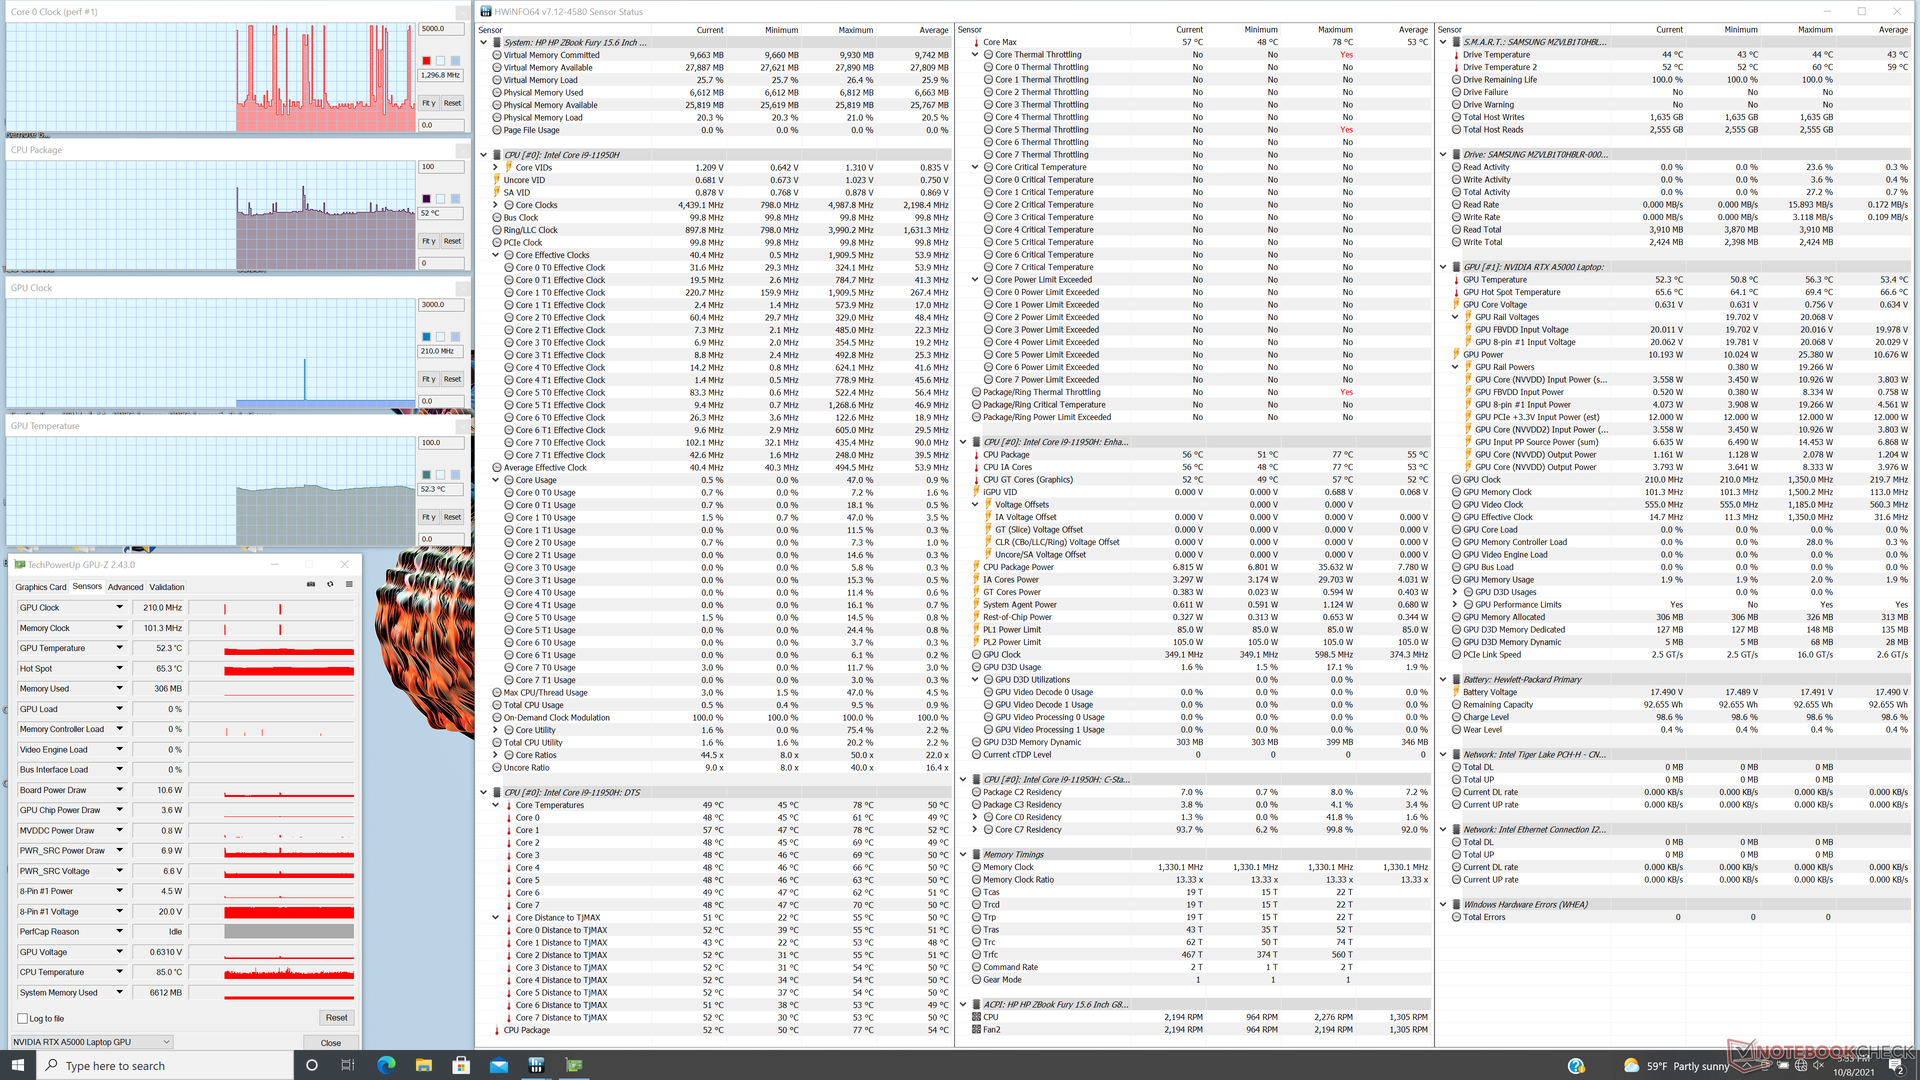
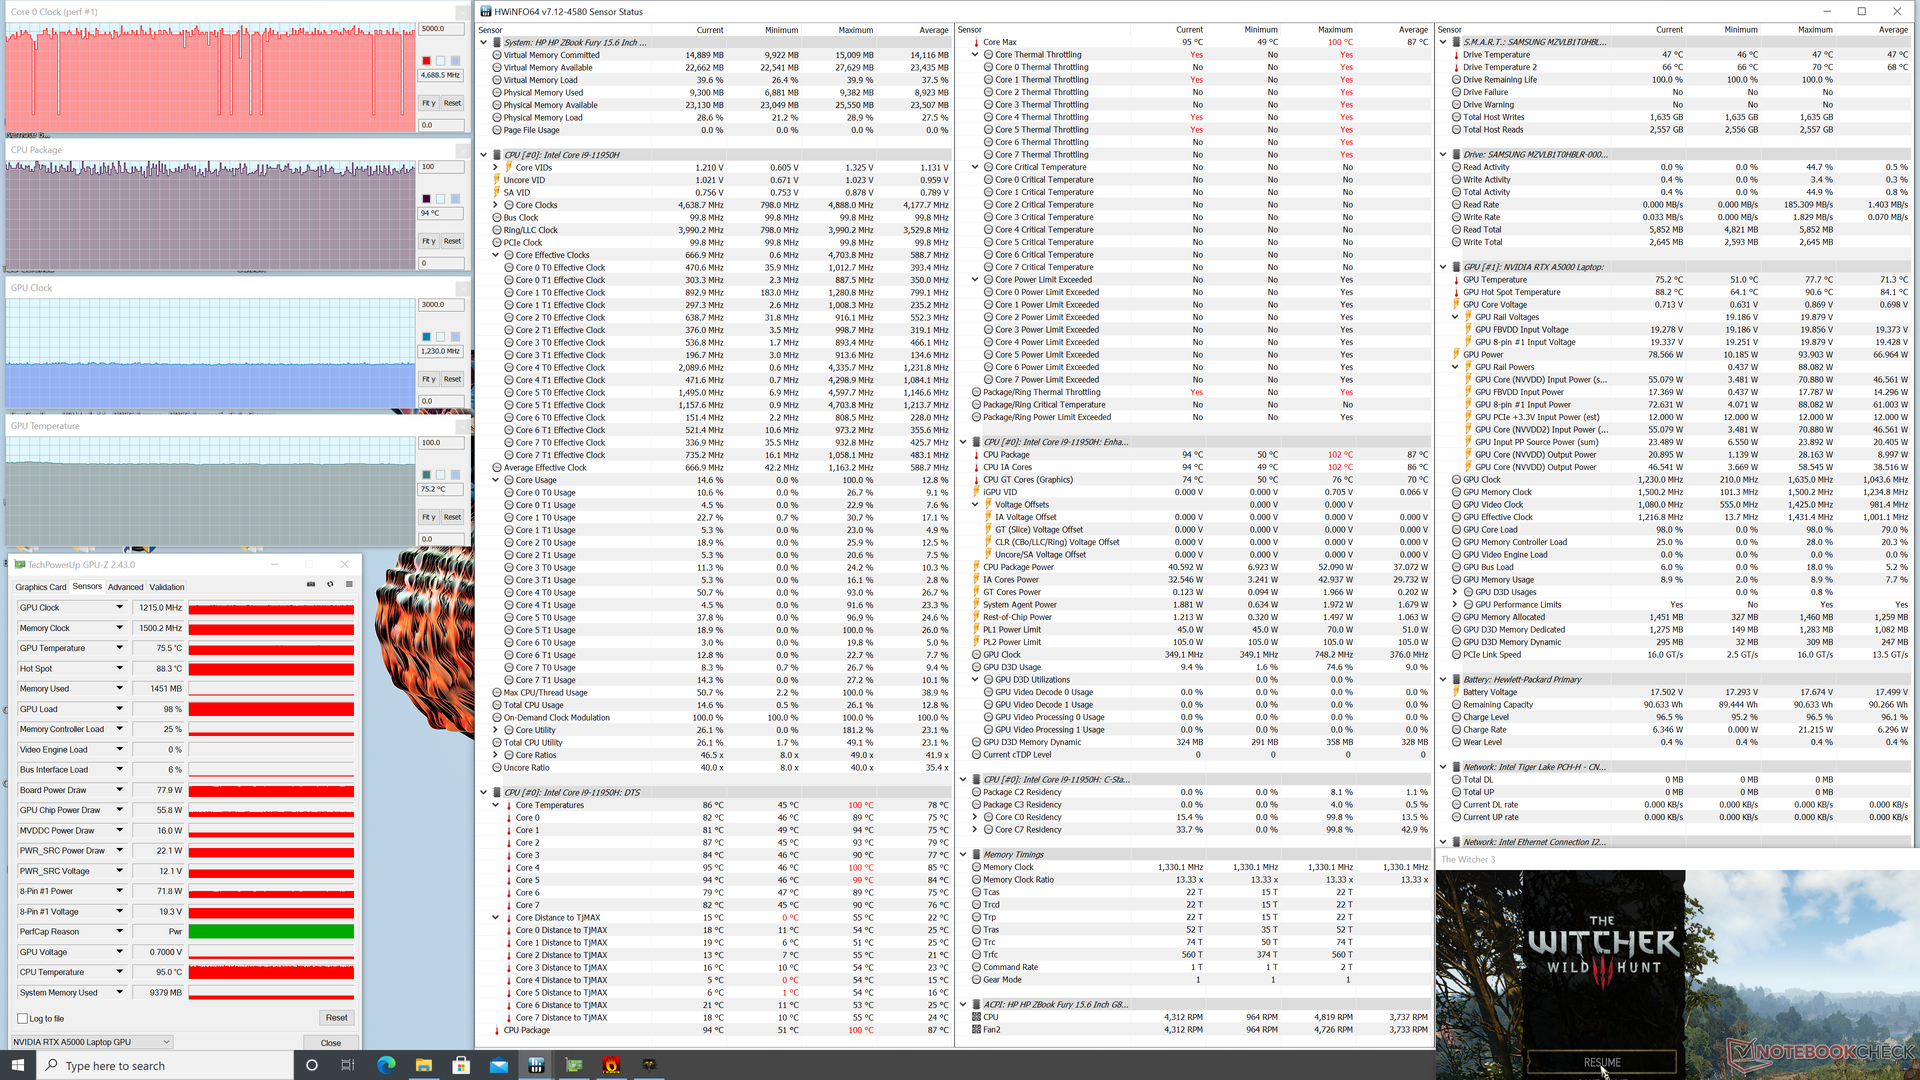
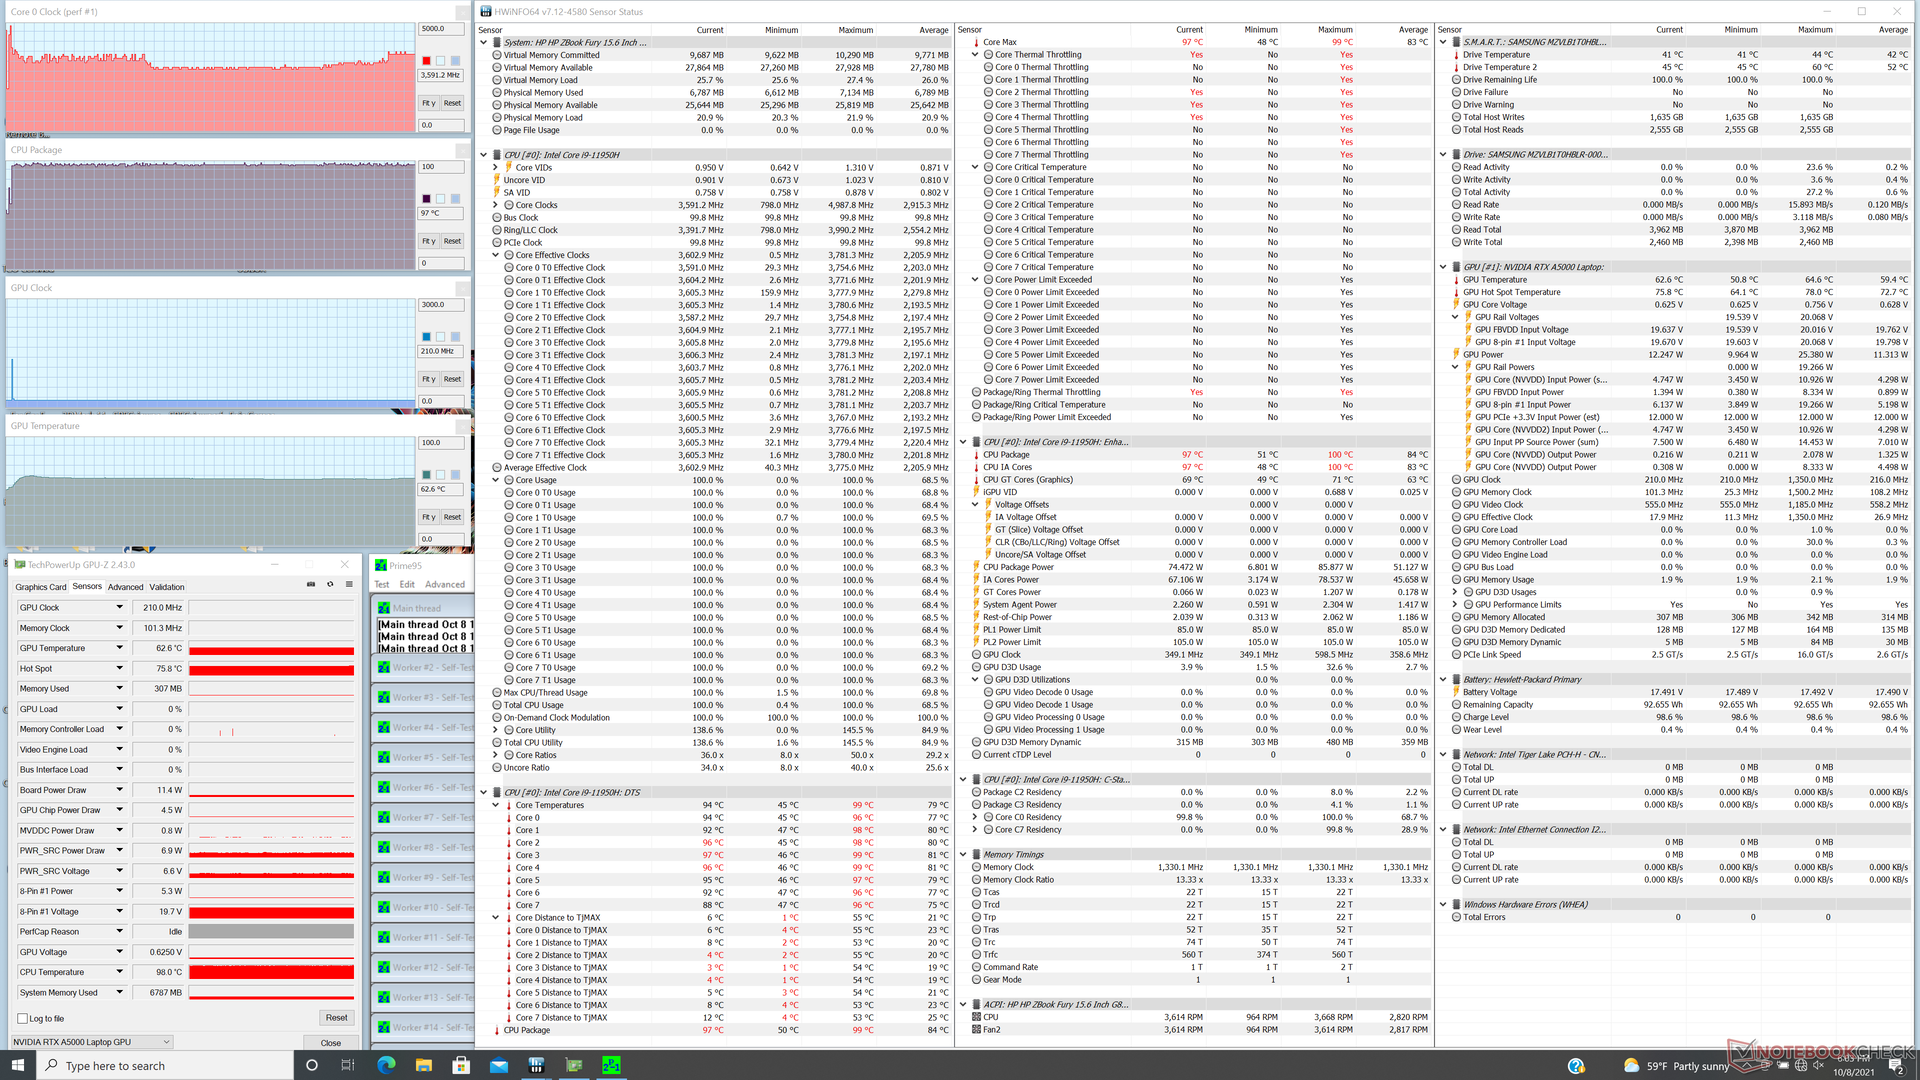
| RelógioCPU (GHz) | RelógioGPU (MHz) | Temperaturamédiada CPU (°C) | Temperaturamédiada GPU (°C) | |
| System Idle | -- | --52 | 52 | |
| Prime95 Stress | 3.0 - 3.5 | -97 | 63 | |
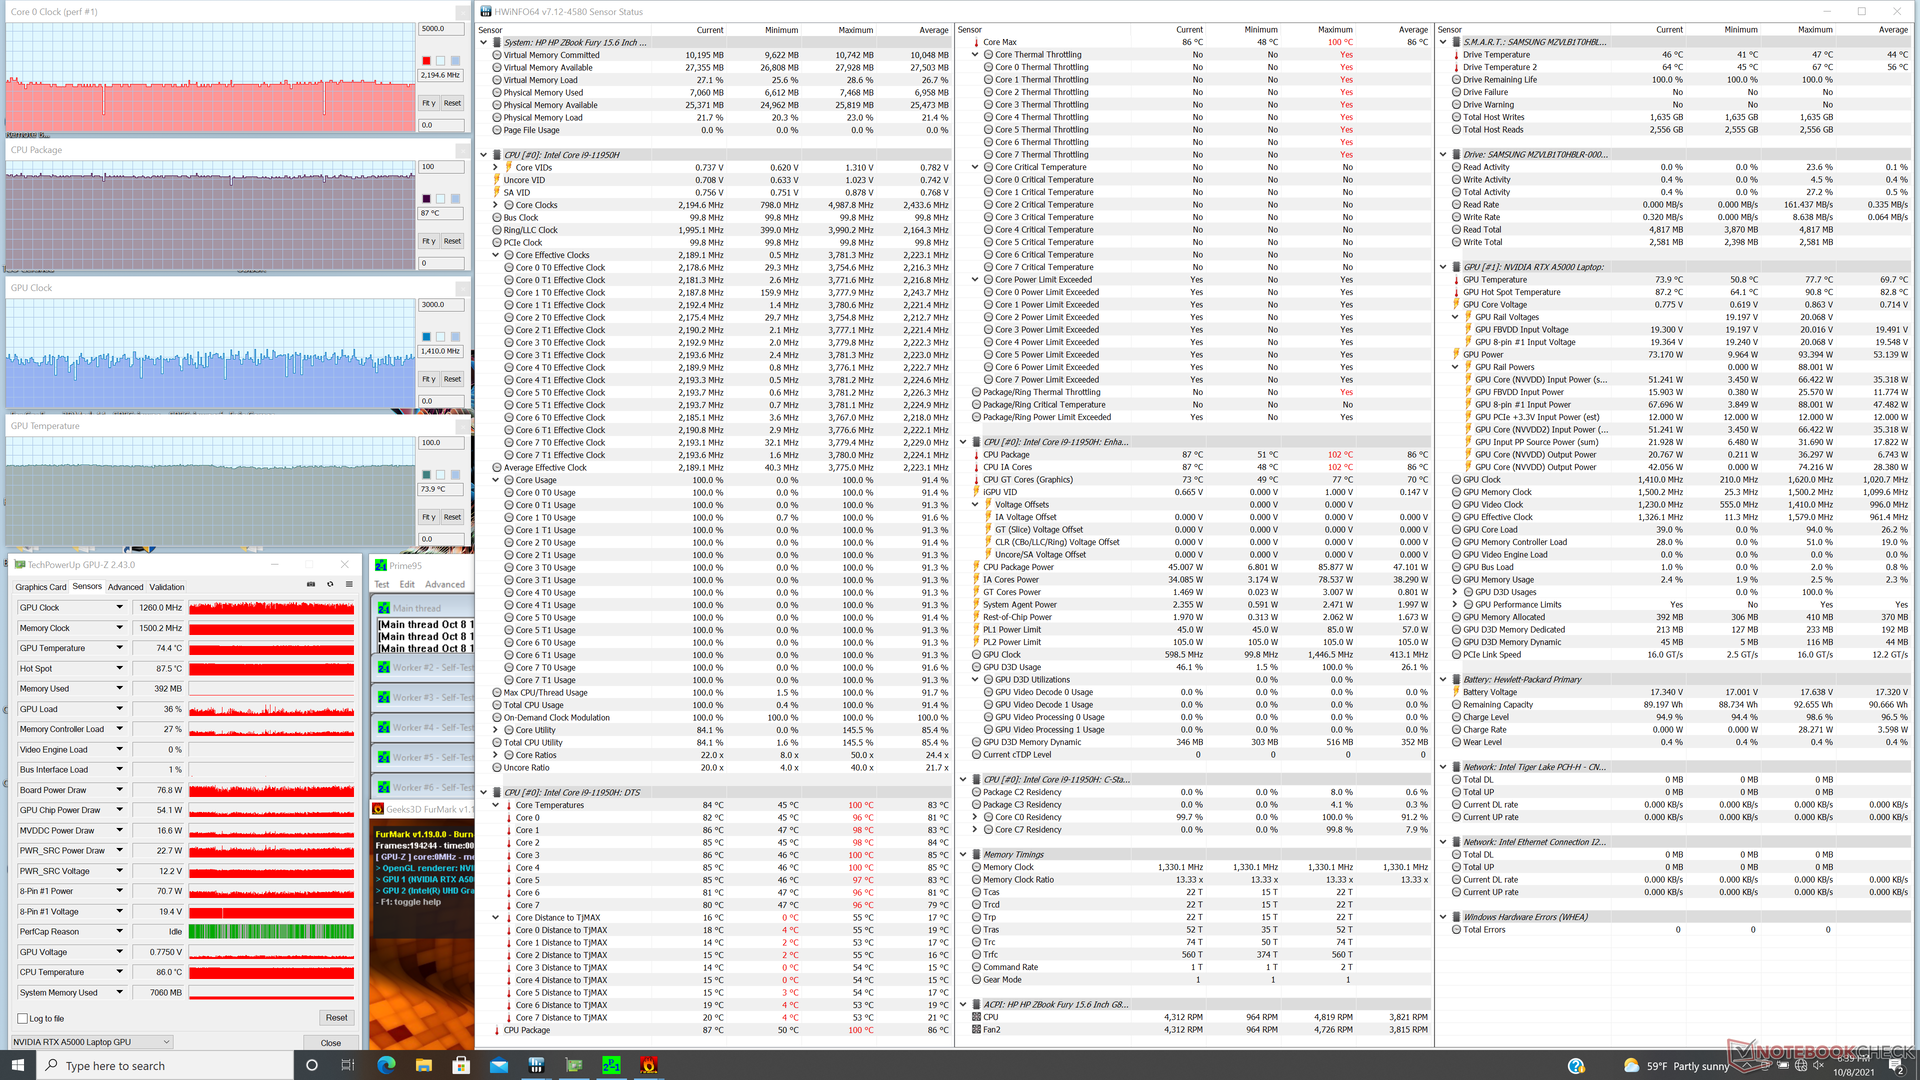
| Prime95 + FurMark Stress | 2.2 | ~1260 | 87 | 74 |
| Witcher 3 Stress | ~4.7 | 1215 | ~94 | 75 |
Oradores

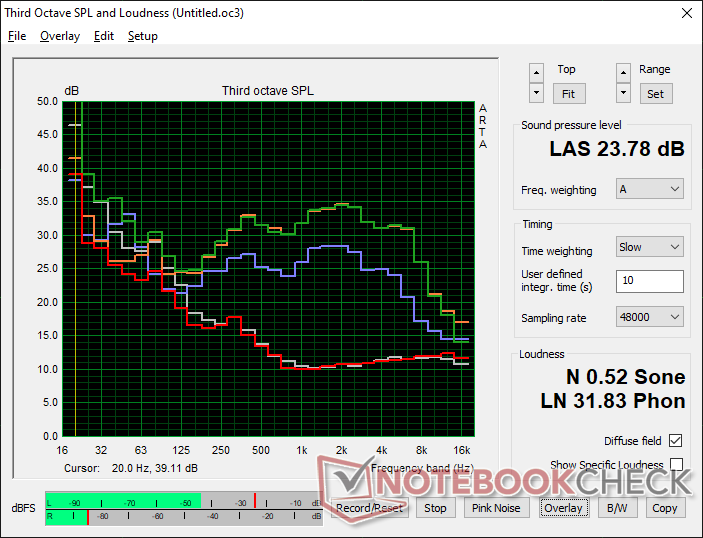
HP ZBook Fury 15 G8 análise de áudio
(±) | o volume do alto-falante é médio, mas bom (###valor### dB)
Graves 100 - 315Hz
(±) | graves reduzidos - em média 10.6% menor que a mediana
(±) | a linearidade dos graves é média (8.8% delta para a frequência anterior)
Médios 400 - 2.000 Hz
(+) | médios equilibrados - apenas 3.9% longe da mediana
(+) | médios são lineares (4.8% delta para frequência anterior)
Altos 2 - 16 kHz
(+) | agudos equilibrados - apenas 2.9% longe da mediana
(+) | os máximos são lineares (5.3% delta da frequência anterior)
Geral 100 - 16.000 Hz
(+) | o som geral é linear (11.9% diferença em relação à mediana)
Comparado com a mesma classe
» 17% de todos os dispositivos testados nesta classe foram melhores, 4% semelhantes, 79% piores
» O melhor teve um delta de 7%, a média foi 17%, o pior foi 35%
Comparado com todos os dispositivos testados
» 9% de todos os dispositivos testados foram melhores, 2% semelhantes, 89% piores
» O melhor teve um delta de 4%, a média foi 23%, o pior foi 134%
Apple MacBook 12 (Early 2016) 1.1 GHz análise de áudio
(+) | os alto-falantes podem tocar relativamente alto (###valor### dB)
Graves 100 - 315Hz
(±) | graves reduzidos - em média 11.3% menor que a mediana
(±) | a linearidade dos graves é média (14.2% delta para a frequência anterior)
Médios 400 - 2.000 Hz
(+) | médios equilibrados - apenas 2.4% longe da mediana
(+) | médios são lineares (5.5% delta para frequência anterior)
Altos 2 - 16 kHz
(+) | agudos equilibrados - apenas 2% longe da mediana
(+) | os máximos são lineares (4.5% delta da frequência anterior)
Geral 100 - 16.000 Hz
(+) | o som geral é linear (10.2% diferença em relação à mediana)
Comparado com a mesma classe
» 7% de todos os dispositivos testados nesta classe foram melhores, 2% semelhantes, 90% piores
» O melhor teve um delta de 5%, a média foi 18%, o pior foi 53%
Comparado com todos os dispositivos testados
» 5% de todos os dispositivos testados foram melhores, 1% semelhantes, 94% piores
» O melhor teve um delta de 4%, a média foi 23%, o pior foi 134%
Energy Management
Consumo de energia - Visor de consumo de energia
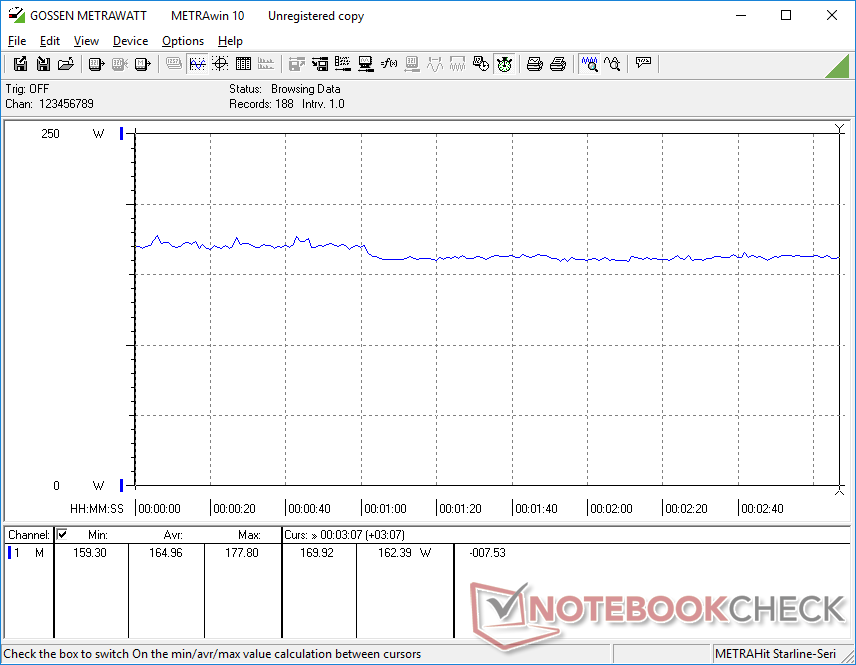
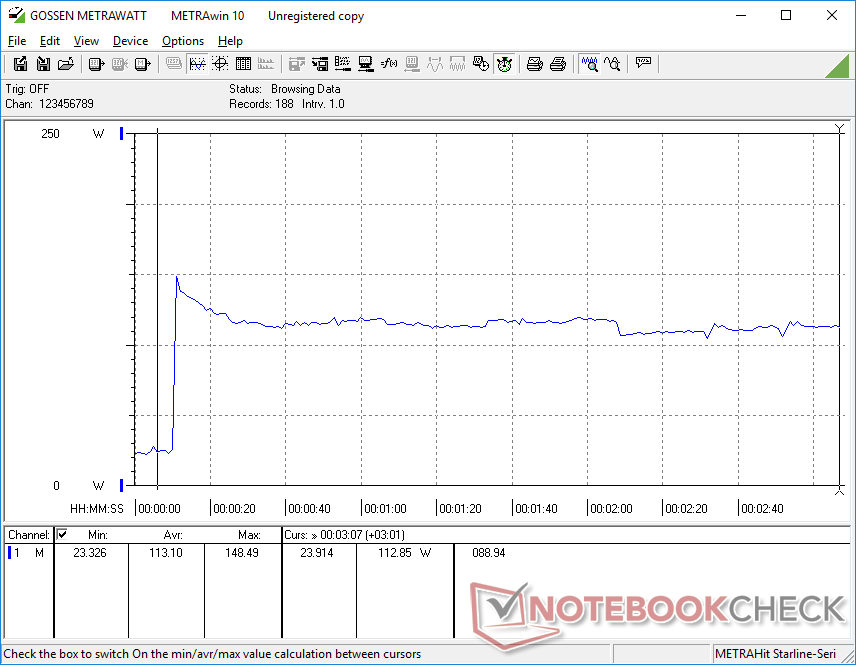
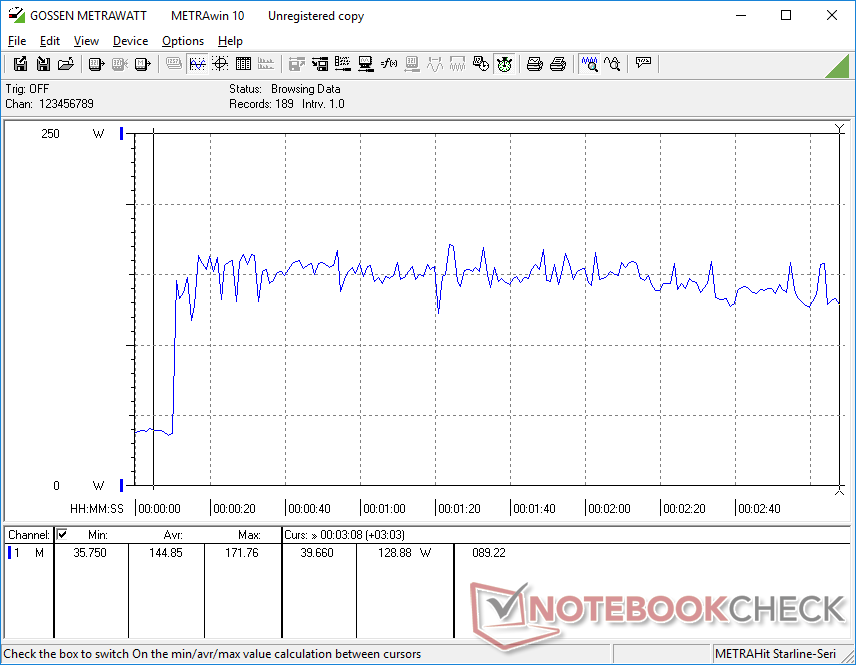
O sistema consome um pouco mais de energia do que seu predecessor imediato Fury 15 G7, particularmente quando sob baixas cargas de processamento. Nossa unidade se instalaria em faixas ligeiramente superiores de 8 W a 20 W em comparação com 4 W a 14 W no modelo mais antigo. Caso contrário, o consumo de energia é muito próximo entre os dois modelos, quando se trabalha com cargas exigentes.
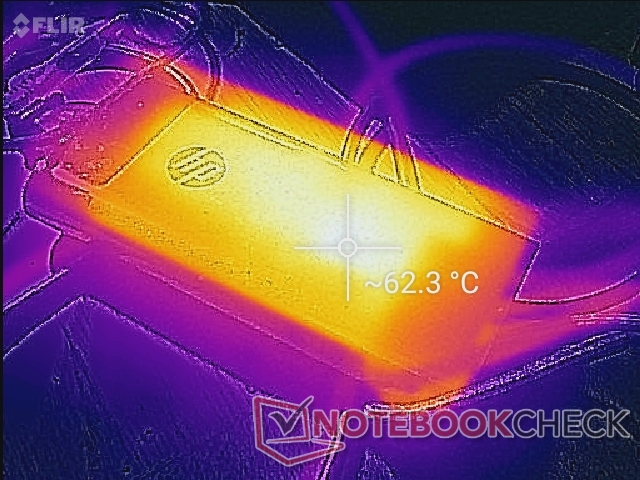
A execução de cargas extremas (Prime95+FurMark) faria com que o consumo de energia chegasse a 172 W a partir do adaptador de média (~15,2 x 7,2 x 2,4 cm) 200 W AC. O sistema continuará a recarregar mesmo com cargas elevadas, embora a um ritmo mais lento
Saltar do ajuste de brilho mínimo para o máximo consumiria cerca de 11 W a mais em comparação com cerca da metade do que na maioria dos Ultrabooks, devido ao painel extra-brilho em nosso HP.
| desligado | |
| Ocioso | |
| Carga |
|
Key:
min: | |
| HP ZBook Fury 15 G8 i9-11950H, RTX A5000 Laptop GPU, Samsung PM981a MZVLB1T0HBLR, IPS, 3840x2160, 15.6" | HP ZBook Fury 15 G7 W-10885M, Quadro RTX 5000 Max-Q, Samsung PM981a MZVLB1T0HBLR, IPS, 3840x2160, 15.6" | Dell Precision 5000 5560 i7-11850H, RTX A2000 Laptop GPU, Samsung PM9A1 MZVL22T0HBLB, IPS, 3840x2400, 15.6" | HP ZBook Studio 15 G8 i9-11950H, GeForce RTX 3070 Laptop GPU, Samsung PM981a MZVLB2T0HALB, OLED, 3840x2160, 15.6" | Lenovo ThinkPad P15s Gen2-20W6000GGE i7-1165G7, T500 Laptop GPU, WDC PC SN720 SDAQNTW-1T00, IPS LED, 3840x2160, 15.6" | HP ZBook Firefly 15 G7 i7-10610U, Quadro P520, Toshiba XG6 KXG60ZNV1T02, IPS LED, 3840x2160, 15.6" | |
|---|---|---|---|---|---|---|
| Power Consumption | 11% | 22% | -10% | 49% | 59% | |
| Idle Minimum * (Watt) | 8.3 | 4.6 45% | 6.2 25% | 11 -33% | 5.8 30% | 3.5 58% |
| Idle Average * (Watt) | 19.9 | 13.6 32% | 13.9 30% | 18.8 6% | 13.3 33% | 6.7 66% |
| Idle Maximum * (Watt) | 21.8 | 21.5 1% | 23.8 -9% | 31.7 -45% | 15.6 28% | 9.6 56% |
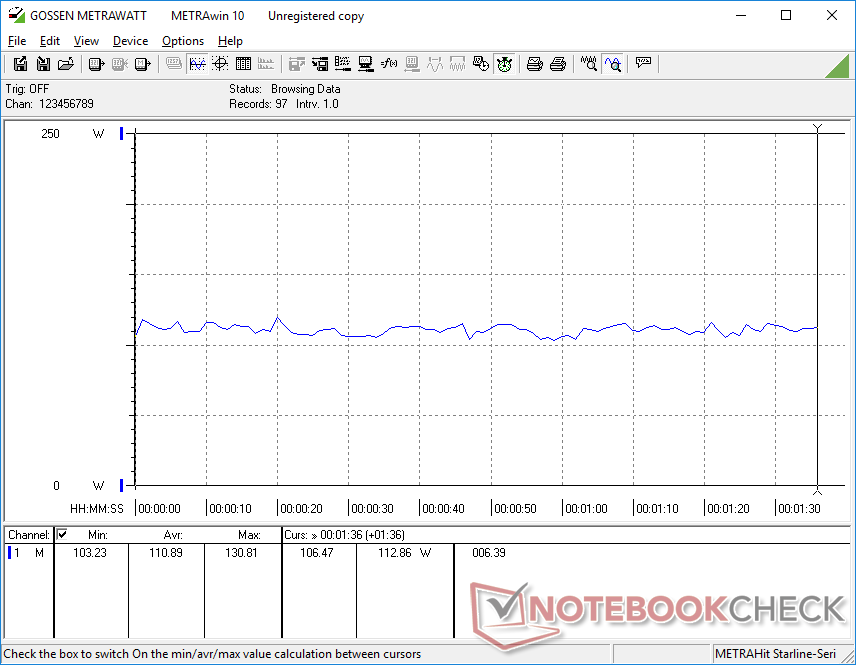
| Load Average * (Watt) | 110.9 | 113.1 -2% | 95.7 14% | 105.2 5% | 43.2 61% | 60 46% |
| Witcher 3 ultra * (Watt) | 165 | 157.5 5% | 87 47% | 148 10% | 37.1 78% | 49.3 70% |
| Load Maximum * (Watt) | 171.8 | 199 -16% | 132.6 23% | 171.8 -0% | 67.3 61% | 68.6 60% |
* ... menor é melhor
Power Consumption Witcher 3 / Stresstest
Vida útil da bateria
Os tempos de execução da WLAN são duas horas mais curtos no Fury 15 G8 quando comparado ao Fury 15 G7, mesmo quando ajustado para o mesmo perfil balanceado, brilho de exibição e ajustes gráficos integrados. Suspeitamos que a maior taxa de atualização nativa ou a atividade de fundo automática potencial pode ter sido parcialmente responsável pela duração visivelmente mais curta da bateria.
O carregamento da capacidade vazia para a capacidade total leva cerca de 90 minutos. A maioria dos carregadores USB-C funcionará no sistema também, desde que a saída de energia seja alta o suficiente.
| HP ZBook Fury 15 G8 i9-11950H, RTX A5000 Laptop GPU, 94 Wh | HP ZBook Fury 15 G7 W-10885M, Quadro RTX 5000 Max-Q, 94 Wh | Dell Precision 5000 5560 i7-11850H, RTX A2000 Laptop GPU, 86 Wh | HP ZBook Studio 15 G8 i9-11950H, GeForce RTX 3070 Laptop GPU, 83 Wh | Lenovo ThinkPad P15s Gen2-20W6000GGE i7-1165G7, T500 Laptop GPU, 57 Wh | HP ZBook Firefly 15 G7 i7-10610U, Quadro P520, 53 Wh | |
|---|---|---|---|---|---|---|
| Duração da bateria | 39% | 2% | 0% | 24% | 47% | |
| WiFi v1.3 (h) | 6.2 | 8.6 39% | 6.3 2% | 6.2 0% | 7.7 24% | 9.1 47% |
| Reader / Idle (h) | 13.2 | 12 | 12.9 | |||
| Load (h) | 1.3 | 1.8 | 1.8 | 1.9 | 2 |
Pro
Contra
Veredicto - Fury-ous Performance
O ZBook Fury 15 G8 aperta mais o desempenho do mesmo chassi Fury 15 G7 com o qual já estamos familiarizados. Os usuários verão ganhos marginais a moderados tanto da CPU de última geração quanto da GPU, mantendo o mesmo adaptador AC e as mesmas características físicas. Seria irrealista esperar um redesenho completo de cima para baixo do Fury 15 G8 quando o salto do Fury 15 G6 para o Fury 15 G7 já era tão significativo para a série. Os usuários de energia podem querer considerar o Fury 15 G8 se os ganhos de desempenho forem relevantes para suas cargas de trabalho. Caso contrário, o Fury 15 G7 pode oferecer essencialmente a mesma experiência por menos.
A nova opção de painel de 120 Hz 4K merece elogios talvez até mais do que as atualizações do processador, uma vez que o movimento mais suave e a redução de fantasmas são muito mais perceptíveis. Este é definitivamente um painel que gostaríamos de ver em mais laptops fora da série ZBook.
A série Fury 15 em geral continua sendo uma excelente alternativa para estações de trabalho como a MSI WS66, Razer Blade Studio, ZBook Fireflyou Lenovo ThinkPad P1 que sacrificam características e opções apenas para o aspecto mais fino e elegante.
Preço e disponibilidade
O ZBook Fury 15 G8 não está amplamente disponível através de varejistas terceirizados a partir desta redação. Pelo menos um SKU pode ser encontrado em Walmartmas os usuários devem adquirir diretamente da HP ao invés disso, para opções significativamente mais configuráveis.
HP ZBook Fury 15 G8
- 10/13/2021 v7 (old)
Allen Ngo
Price comparison

