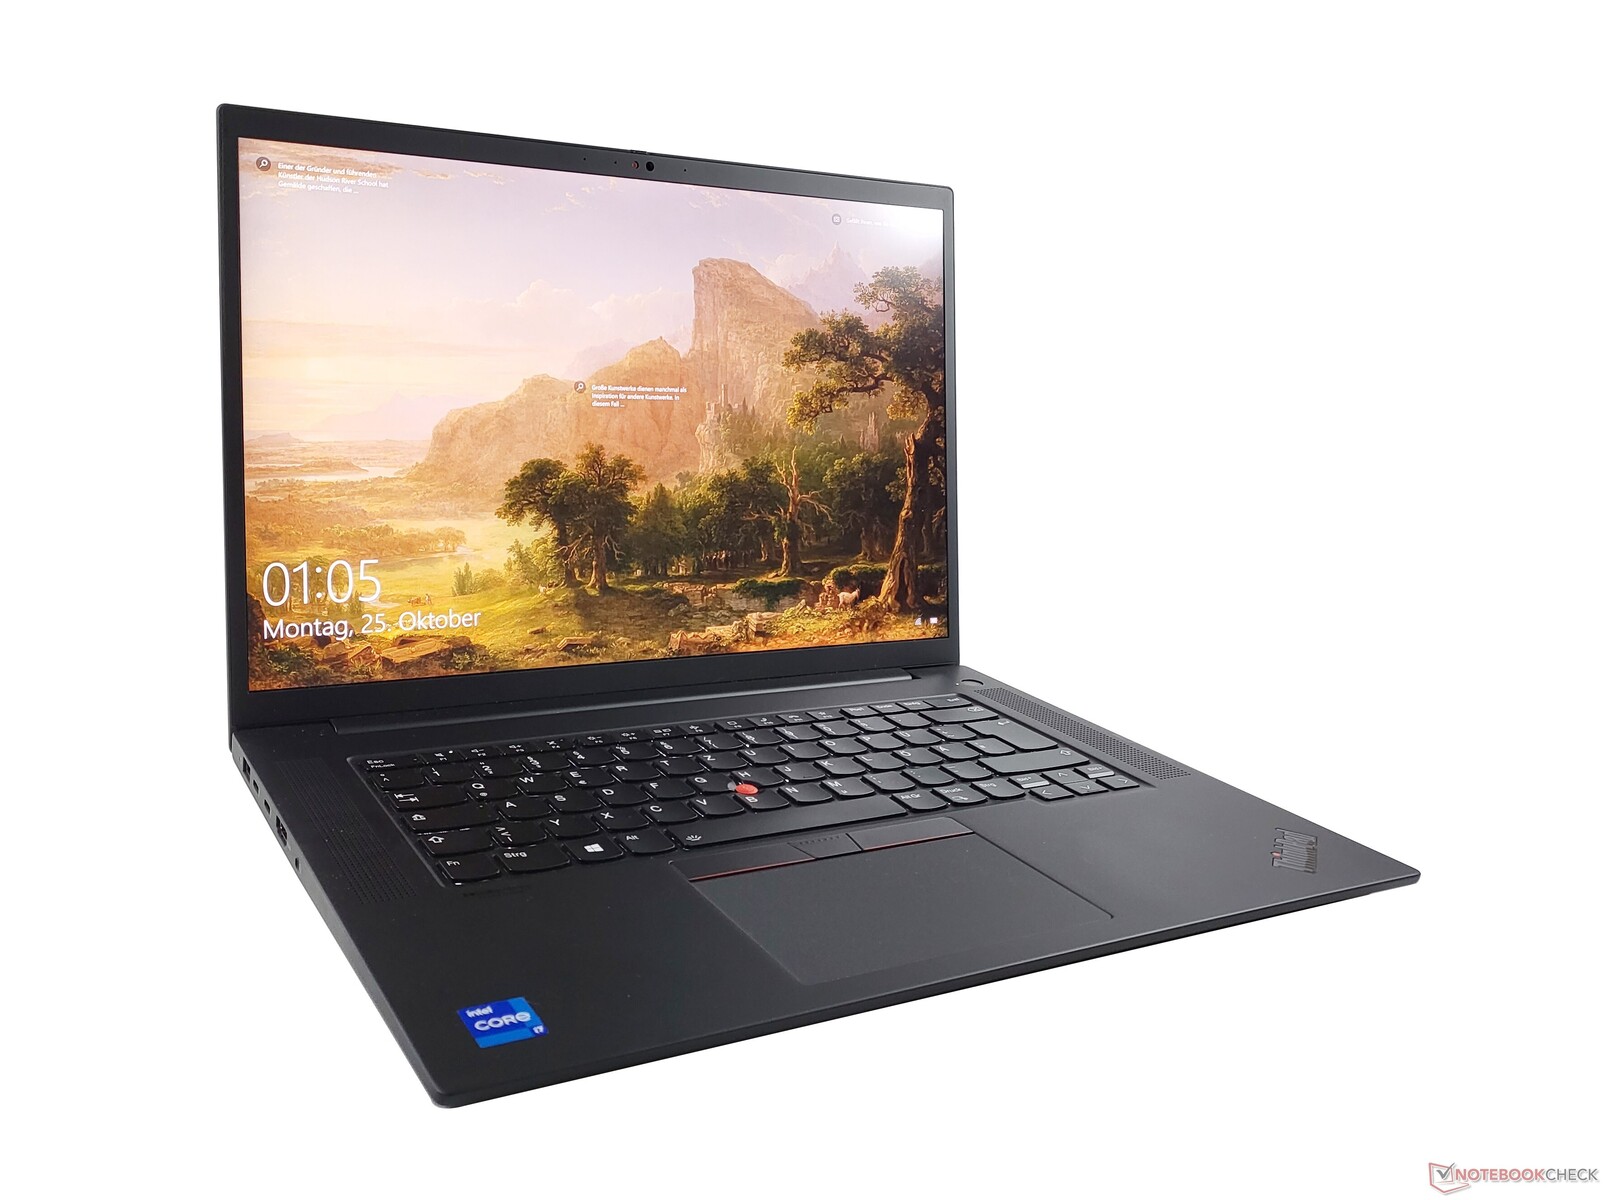
Revisão do laptop Lenovo ThinkPad P1 G4: Sucesso com Vapor-Chamber & GeForce RTX 3070
Quando a Lenovo lançou o PensePad P1 em 2018, a distribuição de papéis na linha de estações de trabalho era clara: o novo modelo premium deveria pegar compradores que precisavam de uma estação de trabalho móvel particularmente fina e leve e poderia sacrificar algum desempenho por ela. O modelo clássico de estação de trabalho Lenovo ThinkPad P52 por outro lado, oferecia mais desempenho com menos mobilidade.
O novo Lenovo ThinkPad P1 G4 ainda tem sua vantagem de mobilidade em comparação com o PensePad P15 G2a atual estação de trabalho ThinkPad com gordura total. No entanto, os clientes não precisam necessariamente sacrificar mais o desempenho - pelo menos no papel. A Lenovo atualizou significativamente o ThinkPad P1 e equipou nosso modelo de teste com um Nvidia GeForce RTX 3070 e resolução 4K UHD+ que corresponde a uma das mais fortes variantes de configuração. Como testamos recentemente o ThinkPad P1 2021 em uma configuração inferior, nos referimos à revisão doThinkPad P1 Gen 4 com Nvidia T1200 para detalhes sobre a configuração, dispositivos de entrada e design
Possible competitors in comparison
Avaliação | Data | Modelo | Peso | Altura | Size | Resolução | Preço |
|---|---|---|---|---|---|---|---|
| 89.8 % v7 (old) | 11/2021 | Lenovo ThinkPad P1 G4-20Y4S0KS00 i7-11850H, GeForce RTX 3070 Laptop GPU | 2 kg | 17.7 mm | 16.00" | 3840x2400 | |
| 89.4 % v7 (old) | 10/2021 | Lenovo ThinkPad P1 G4-20Y30017GE i7-11800H, T1200 Laptop GPU | 1.8 kg | 17.7 mm | 16.00" | 2560x1600 | |
| 88.3 % v7 (old) | 10/2021 | Dell Precision 5000 5560 i7-11850H, RTX A2000 Laptop GPU | 2 kg | 18 mm | 15.60" | 3840x2400 | |
| 89.7 % v7 (old) | 12/2019 | Apple MacBook Pro 16 2019 i9 5500M i9-9880H, Radeon Pro 5500M | 2 kg | 16.2 mm | 16.00" | 3072x1920 | |
| 87.8 % v7 (old) | 08/2021 | HP ZBook Studio 15 G8 i9-11950H, GeForce RTX 3070 Laptop GPU | 1.9 kg | 18 mm | 15.60" | 3840x2160 | |
| 90.1 % v7 (old) | 01/2021 | Lenovo ThinkPad X1 Extreme Gen3-20TLS0UV00 i7-10750H, GeForce GTX 1650 Ti Max-Q | 1.7 kg | 18.7 mm | 15.60" | 1920x1080 |
| SD Card Reader | |
| average JPG Copy Test (av. of 3 runs) | |
| Lenovo ThinkPad P1 G4-20Y30017GE (AV PRO V60) | |
| Dell Precision 5000 5560 (AV Pro V60) | |
| Média da turma Workstation (49.6 - 681, n=14, últimos 2 anos) | |
| Lenovo ThinkPad X1 Extreme Gen3-20TLS0UV00 (Toshiba Exceria Pro SDXC 64 GB UHS-II) | |
| HP ZBook Studio 15 G8 (AV Pro V60) | |
| maximum AS SSD Seq Read Test (1GB) | |
| Média da turma Workstation (87.6 - 1455, n=14, últimos 2 anos) | |
| Lenovo ThinkPad X1 Extreme Gen3-20TLS0UV00 (Toshiba Exceria Pro SDXC 64 GB UHS-II) | |
| Dell Precision 5000 5560 (AV Pro V60) | |
| Lenovo ThinkPad P1 G4-20Y30017GE (AV PRO V60) | |
| HP ZBook Studio 15 G8 (AV Pro V60) | |


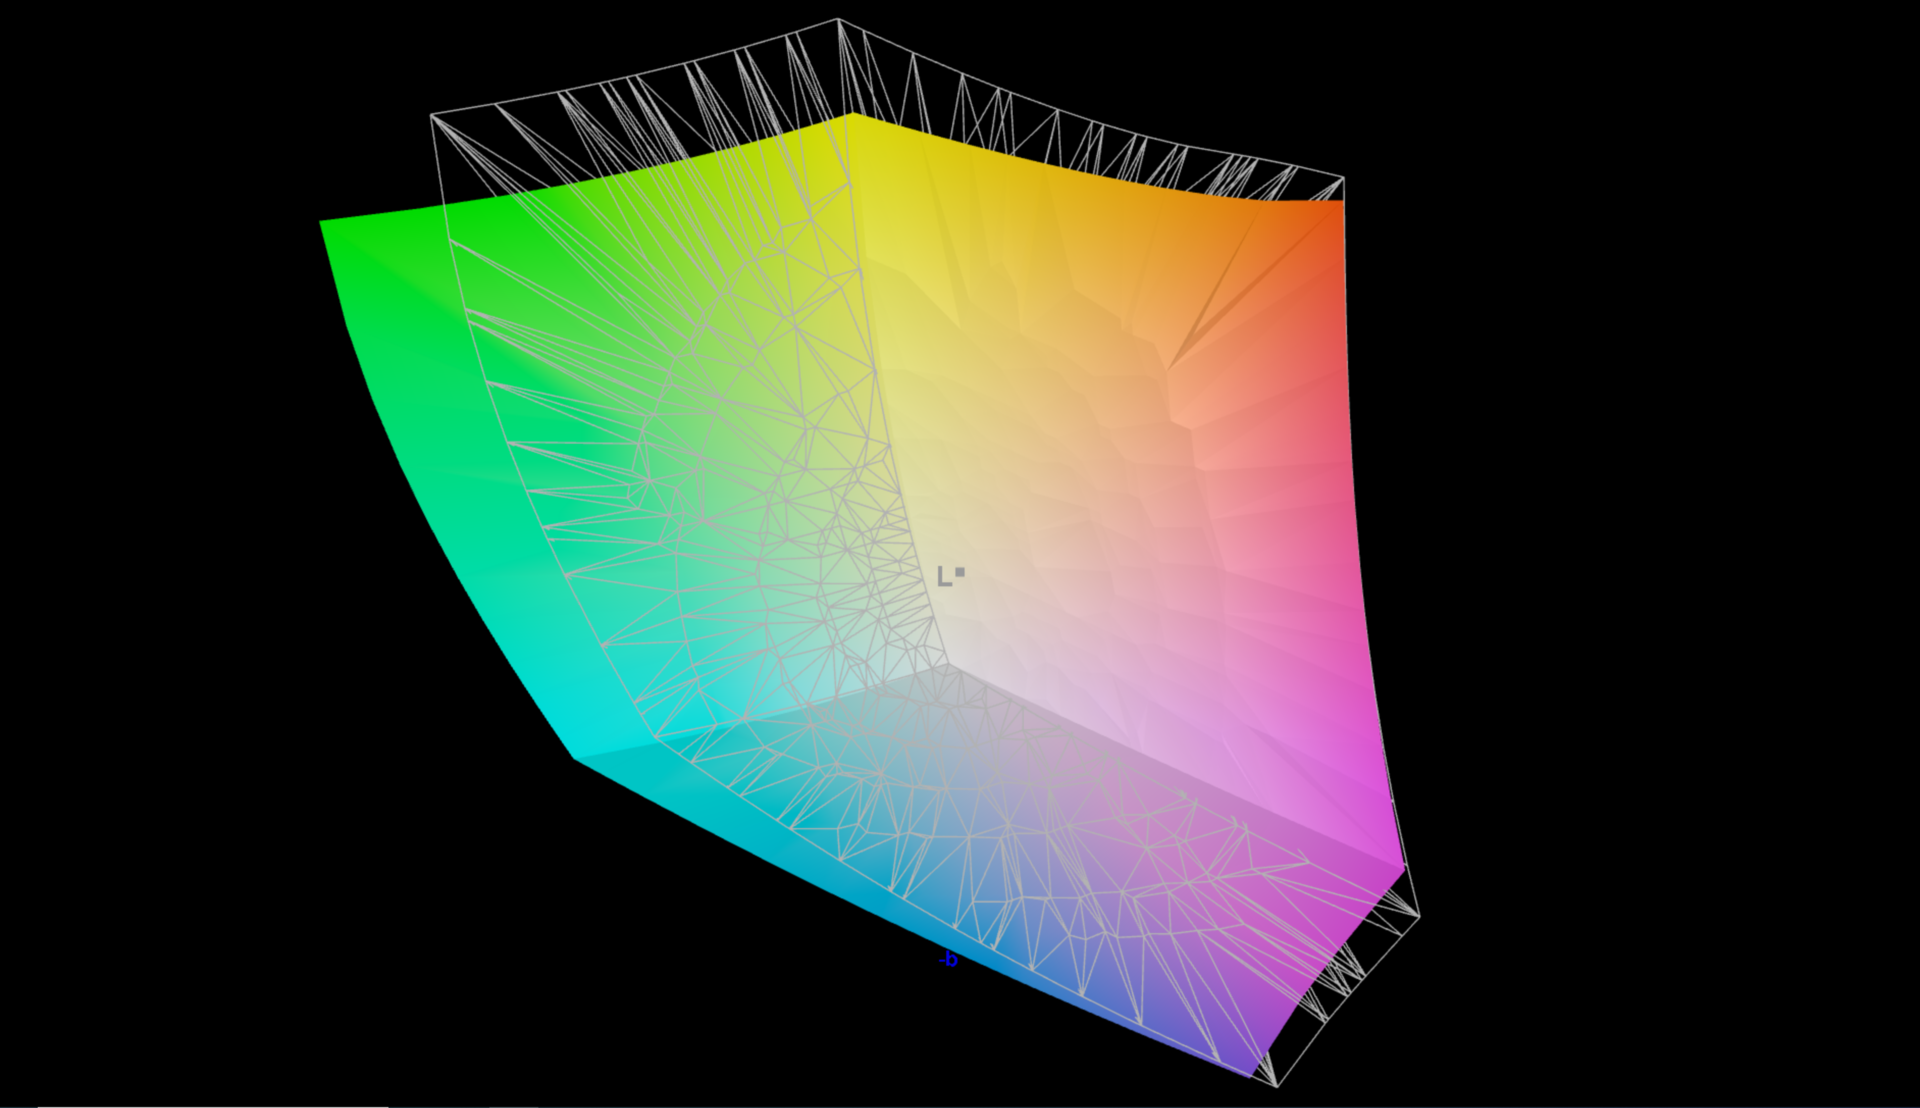
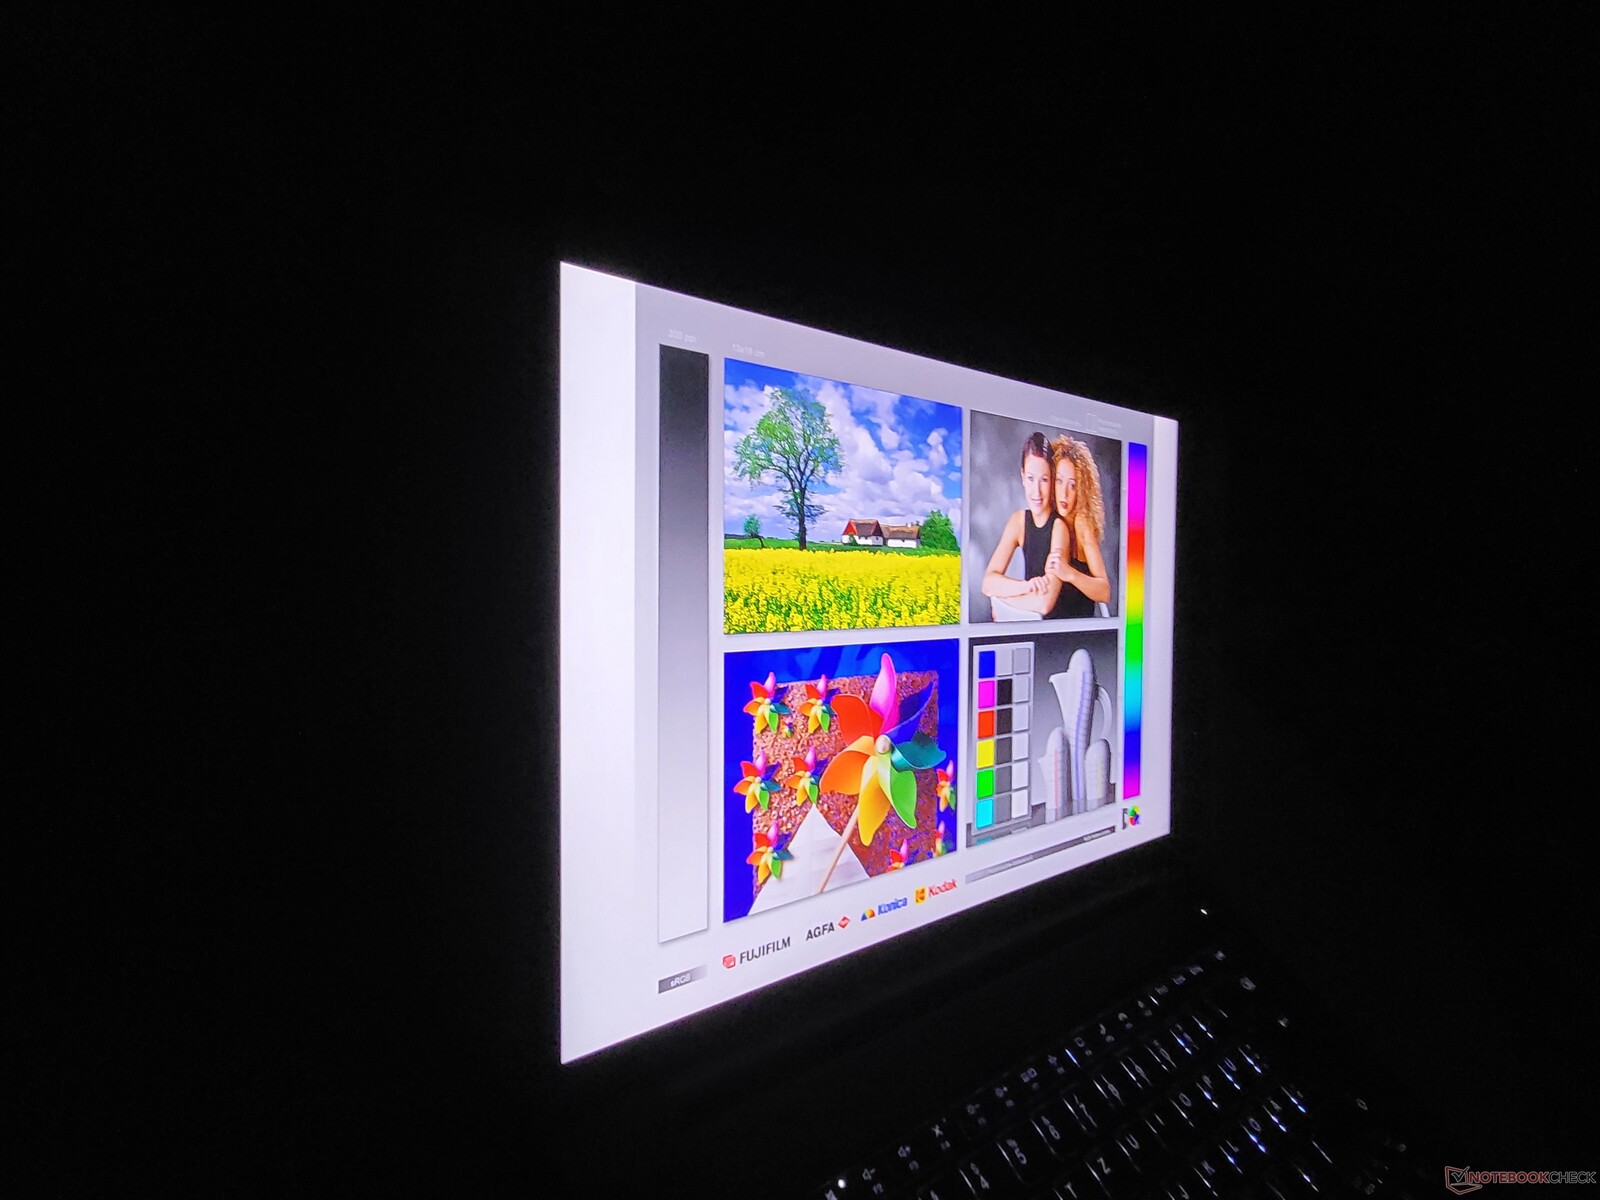
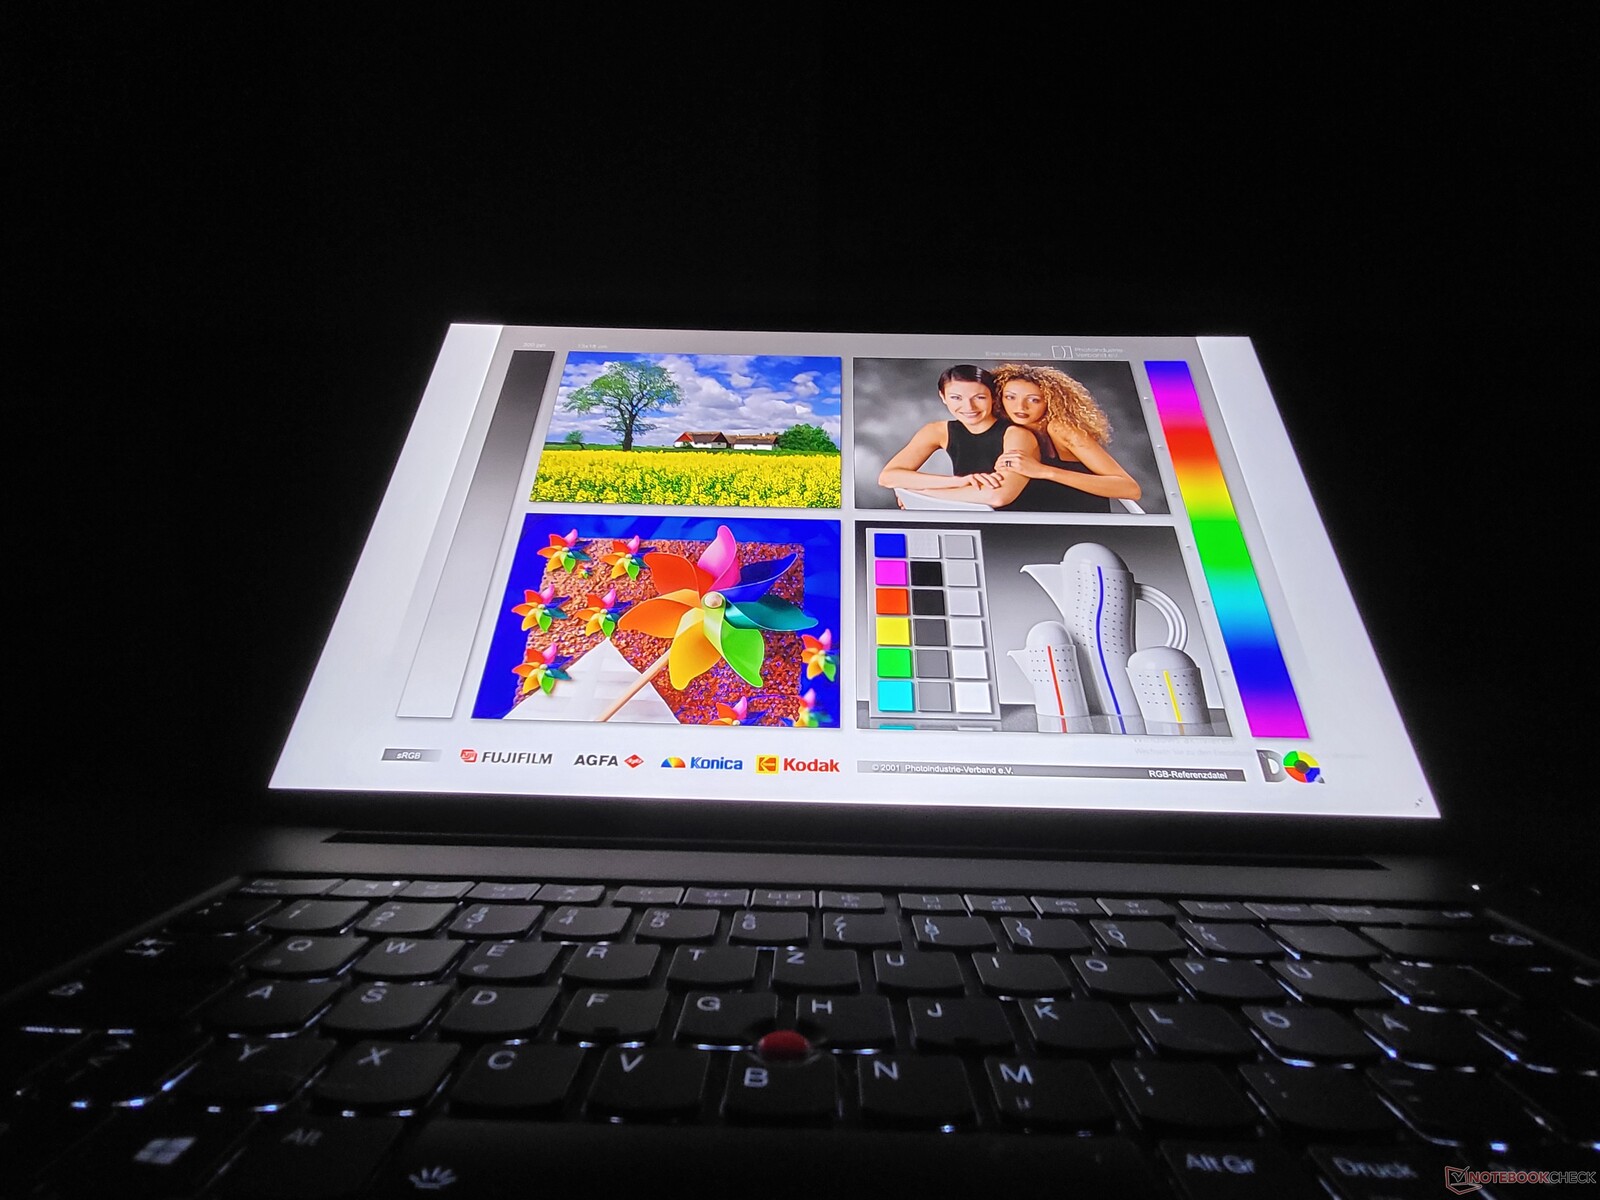
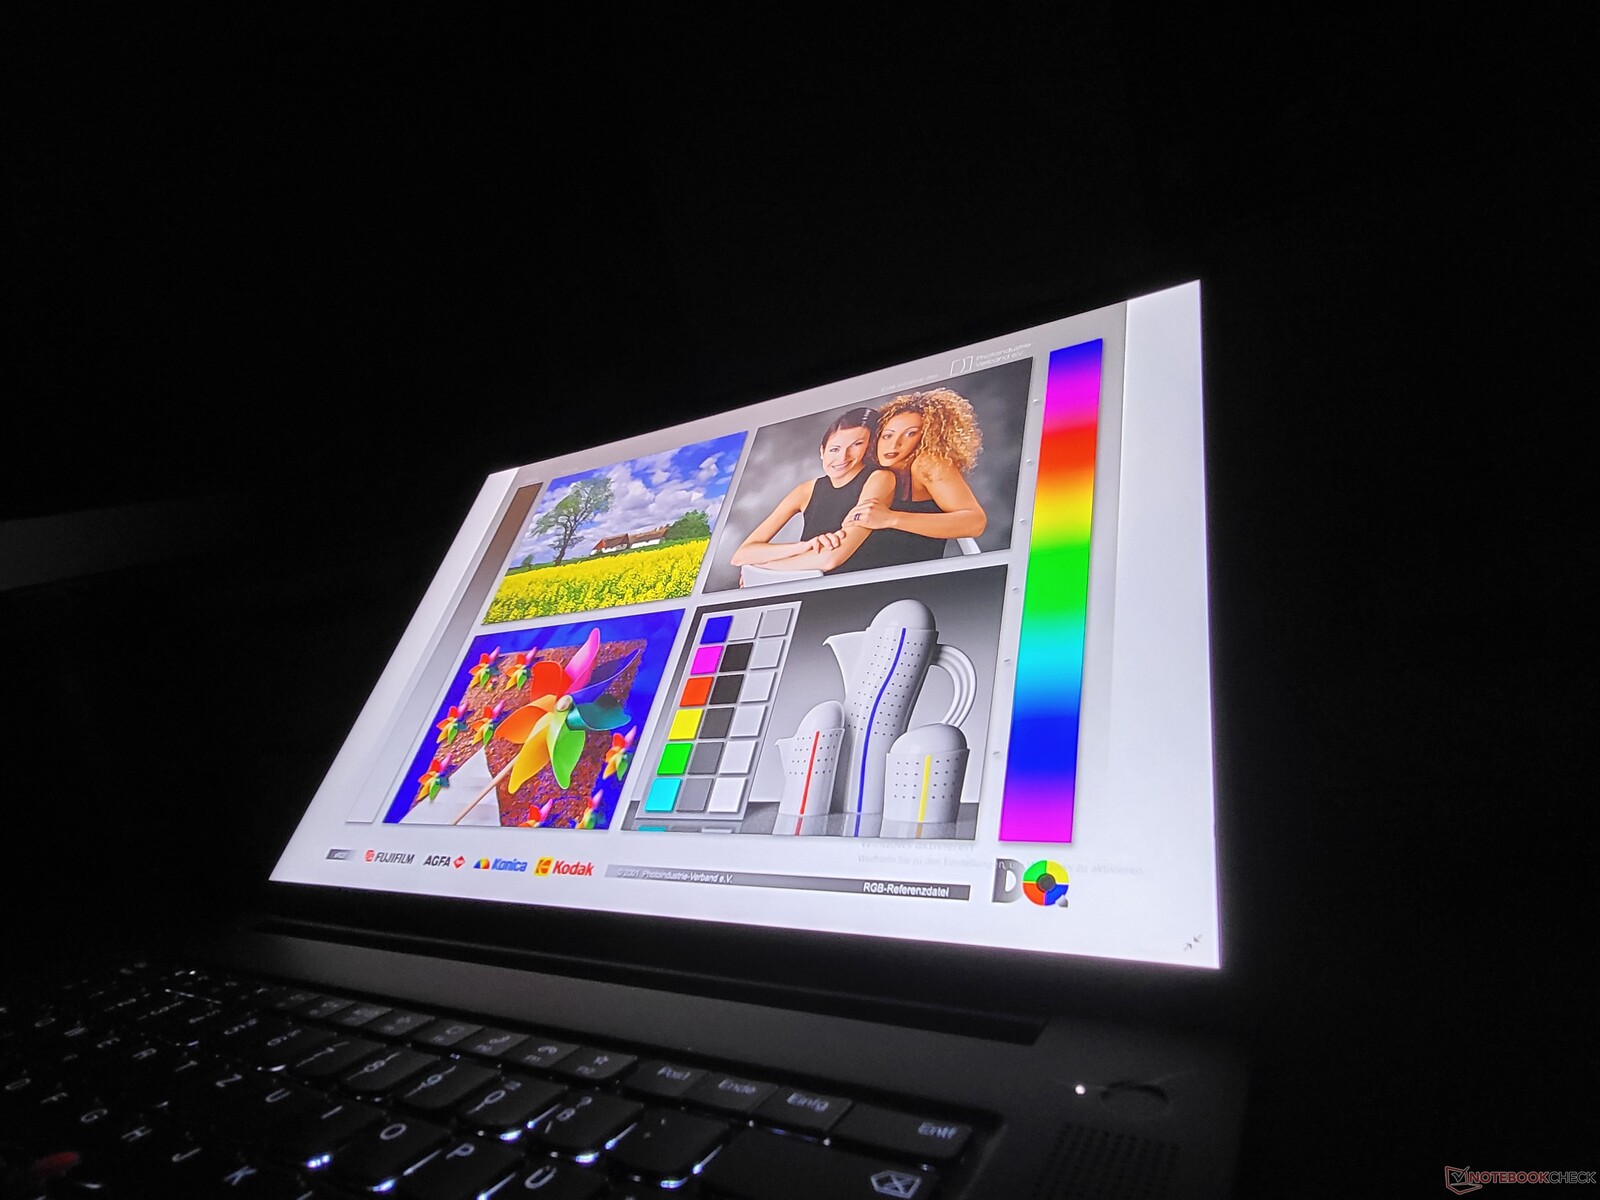
A tela Matte 4K UHD+ do ThinkPad P1 G4 da Lenovo é excelente

O Lenovo ThinkPad P1 Gen 4 está disponível com três telas diferentes de 16 polegadas no formato 16:10. A opção básica, um LCD WQXGA (2.560 x 1.600),já testamos. Nossa unidade de revisão inclui a tela mate 4K UHD+/WQUXGA sem toque - a terceira opção é a mesma tela, em brilho, com toque e digitalizador Wacom.
O valor de brilho de 600 cd/m² declarado pela Lenovo é excedido pelo painel LG com uma média de 610 cd/m². No campo de teste dos laptops premium no formato de 15 a 16 polegadas, a tela do ThinkPad P1 G4 da Lenovo é claramente a mais brilhante.
Os tempos de resposta não são particularmente bons - a opção WQXGA é melhor a este respeito. A diferença é particularmente gritante em comparação com a tela OLED do HP ZBook Studio 15 G8A variante OLED do ThinkPad P1 G3 infelizmente não está mais disponível no ThinkPad P1 2021.
| |||||||||||||||||||||||||
iluminação: 90 %
iluminação com acumulador: 629 cd/m²
Contraste: 1537:1 (Preto: 0.41 cd/m²)
ΔE ColorChecker Calman: 2.2 | ∀{0.5-29.43 Ø4.71}
calibrated: 1
ΔE Greyscale Calman: 2.7 | ∀{0.09-98 Ø4.96}
98.9% AdobeRGB 1998 (Argyll 3D)
99.4% sRGB (Argyll 3D)
85.7% Display P3 (Argyll 3D)
Gamma: 2.26
CCT: 6886 K
| Lenovo ThinkPad P1 G4-20Y4S0KS00 LP160UQ1-SPB1, IPS LED, 3840x2400, 16" | Lenovo ThinkPad P1 G4-20Y30017GE B160QAN02.M, IPS, 2560x1600, 16" | Dell Precision 5000 5560 Sharp LQ156R1, IPS, 3840x2400, 15.6" | Apple MacBook Pro 16 2019 i9 5500M APPA044, IPS, 3072x1920, 16" | HP ZBook Studio 15 G8 SDC4145, OLED, 3840x2160, 15.6" | Lenovo ThinkPad X1 Extreme Gen3-20TLS0UV00 N156HCE-GN1, IPS, 1920x1080, 15.6" | |
|---|---|---|---|---|---|---|
| Display | -10% | 4% | 5% | -25% | ||
| Display P3 Coverage (%) | 85.7 | 77.3 -10% | 94.9 11% | 99.9 17% | 61 -29% | |
| sRGB Coverage (%) | 99.4 | 99.9 1% | 100 1% | 100 1% | 89.9 -10% | |
| AdobeRGB 1998 Coverage (%) | 98.9 | 78.1 -21% | 100 1% | 95.3 -4% | 62.2 -37% | |
| Response Times | 21% | 9% | -4% | 94% | 34% | |
| Response Time Grey 50% / Grey 80% * (ms) | 55.2 ? | 40.8 ? 26% | 47.2 ? 14% | 52.4 ? 5% | 2.4 ? 96% | 33.6 ? 39% |
| Response Time Black / White * (ms) | 31.2 ? | 26.4 ? 15% | 30.4 ? 3% | 34.9 ? -12% | 2.4 ? 92% | 22.4 ? 28% |
| PWM Frequency (Hz) | 131700 | 240.4 ? | 26040 ? | |||
| Screen | -17% | -28% | -1% | -67% | -6% | |
| Brightness middle (cd/m²) | 630 | 420 -33% | 501.5 -20% | 519 -18% | 379.6 -40% | 518 -18% |
| Brightness (cd/m²) | 622 | 401 -36% | 467 -25% | 477 -23% | 380 -39% | 513 -18% |
| Brightness Distribution (%) | 90 | 90 0% | 83 -8% | 86 -4% | 95 6% | 88 -2% |
| Black Level * (cd/m²) | 0.41 | 0.3 27% | 0.44 -7% | 0.39 5% | 0.38 7% | |
| Contrast (:1) | 1537 | 1400 -9% | 1140 -26% | 1331 -13% | 1363 -11% | |
| Colorchecker dE 2000 * | 2.2 | 2.5 -14% | 4.73 -115% | 2.28 -4% | 5.15 -134% | 2.1 5% |
| Colorchecker dE 2000 max. * | 5 | 4.9 2% | 8.45 -69% | 6.54 -31% | 7.79 -56% | 4.5 10% |
| Colorchecker dE 2000 calibrated * | 1 | 1.6 -60% | 0.51 49% | 0.86 14% | 3.1 -210% | 1.3 -30% |
| Greyscale dE 2000 * | 2.7 | 3.4 -26% | 3.6 -33% | 0.9 67% | 2.6 4% | 2.7 -0% |
| Gamma | 2.26 97% | 2.24 98% | 2.08 106% | 2145 0% | 1.99 111% | 2.35 94% |
| CCT | 6886 94% | 6479 100% | 6447 101% | 6572 99% | 6166 105% | 7042 92% |
| Color Space (Percent of AdobeRGB 1998) (%) | 78 | 57.7 | ||||
| Color Space (Percent of sRGB) (%) | 90.4 | |||||
| Média Total (Programa/Configurações) | -2% /
-10% | -5% /
-16% | -3% /
-1% | 11% /
-22% | 1% /
-5% |
* ... menor é melhor
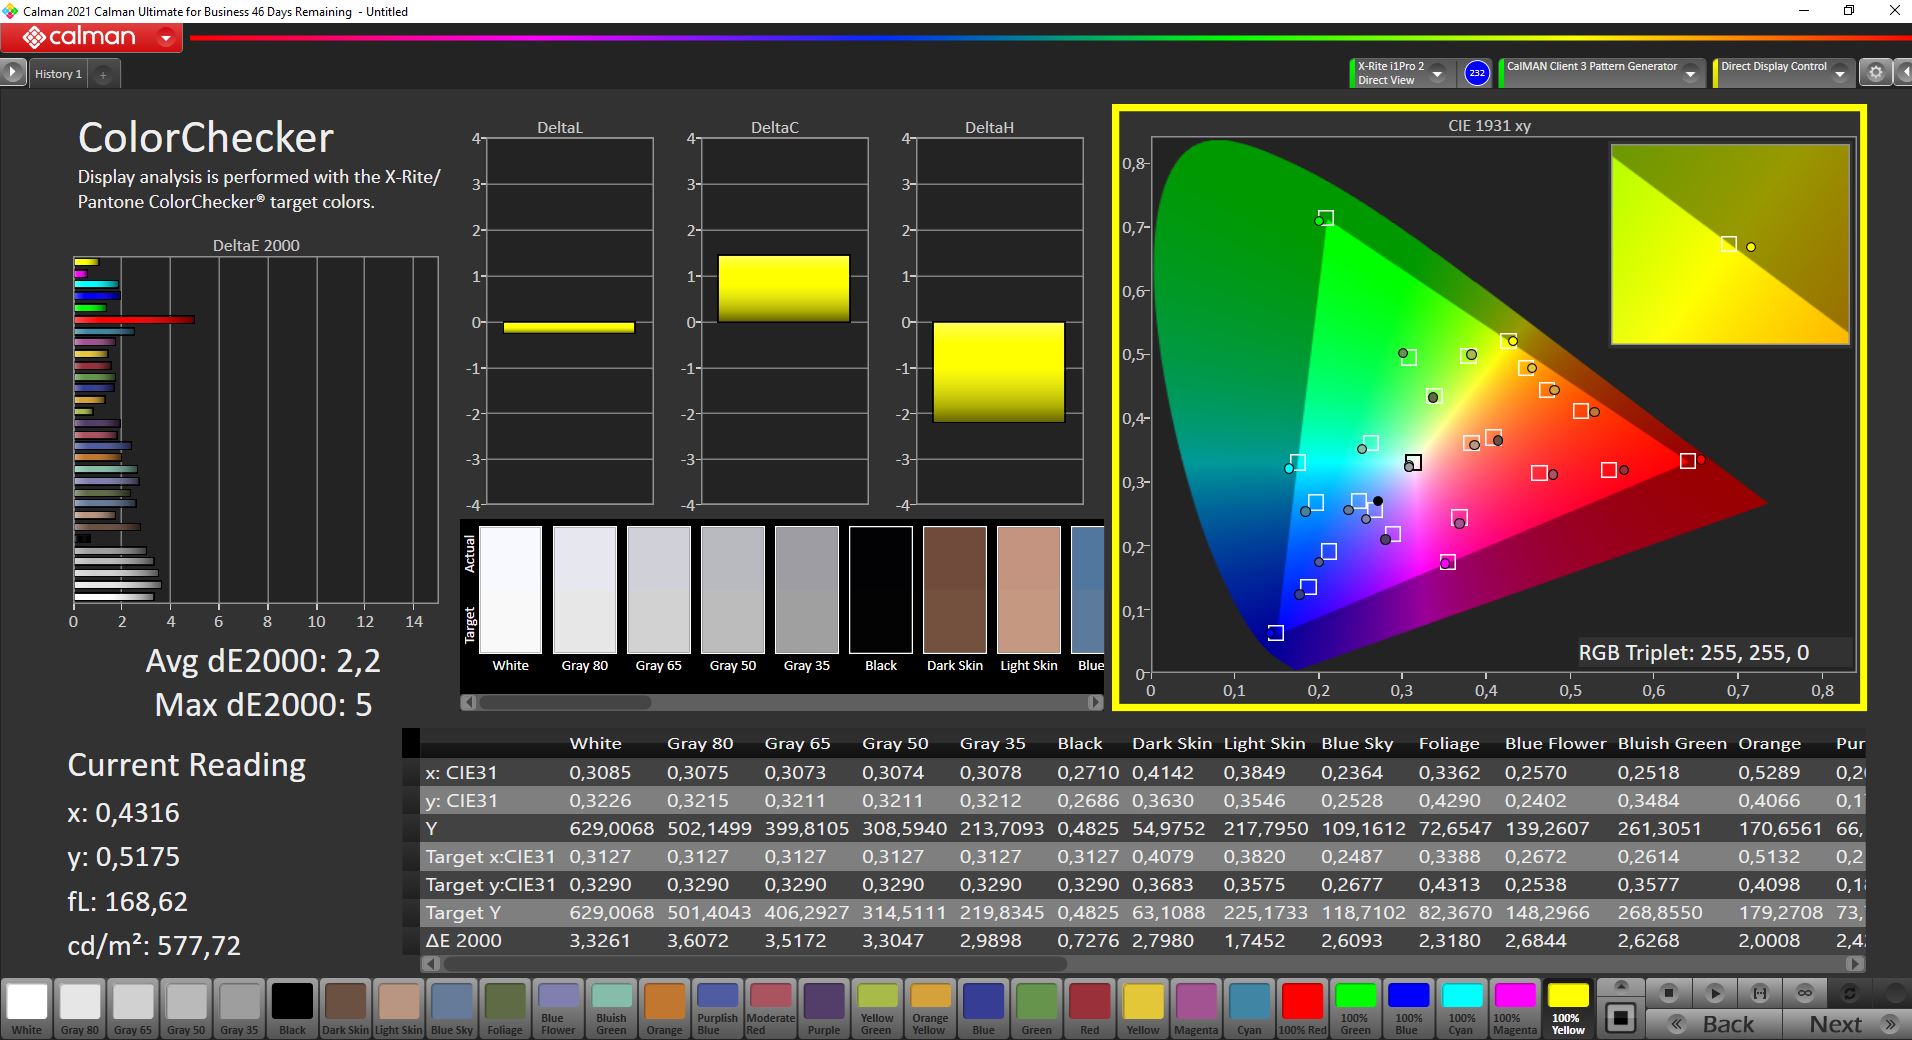
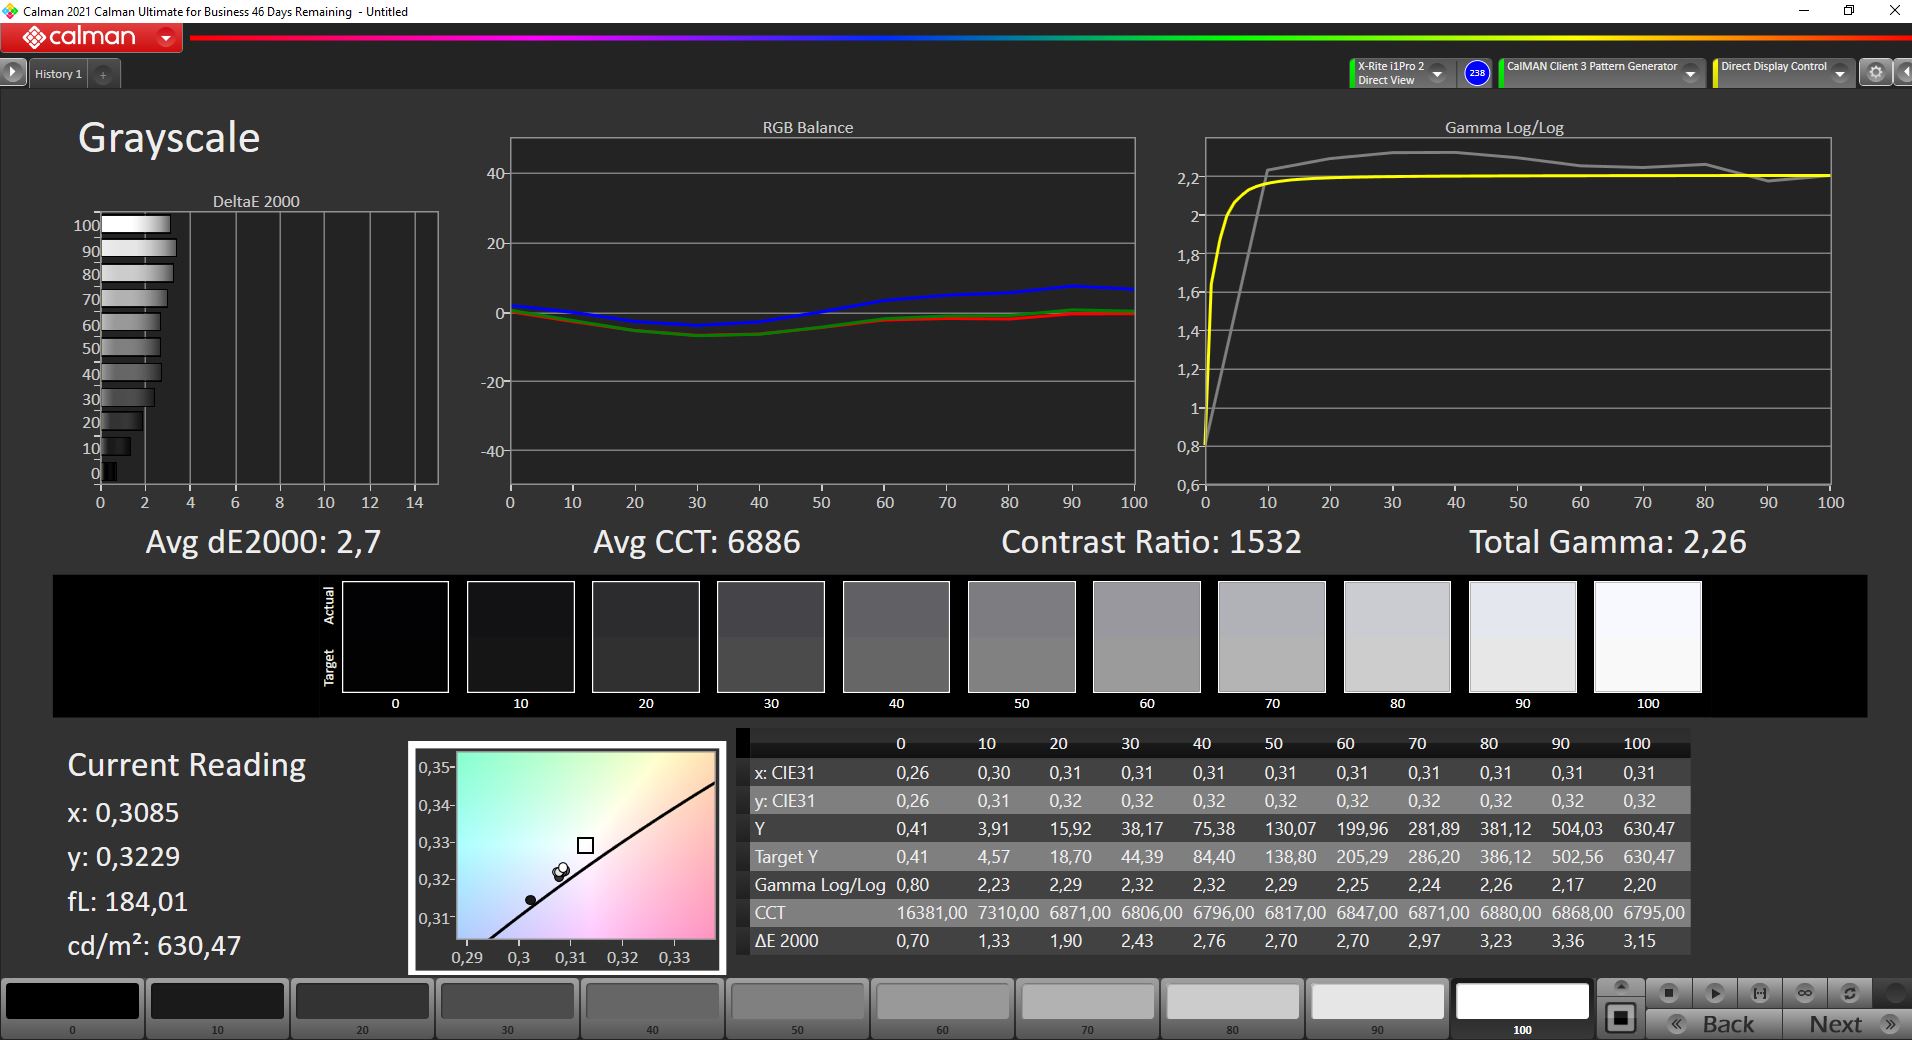

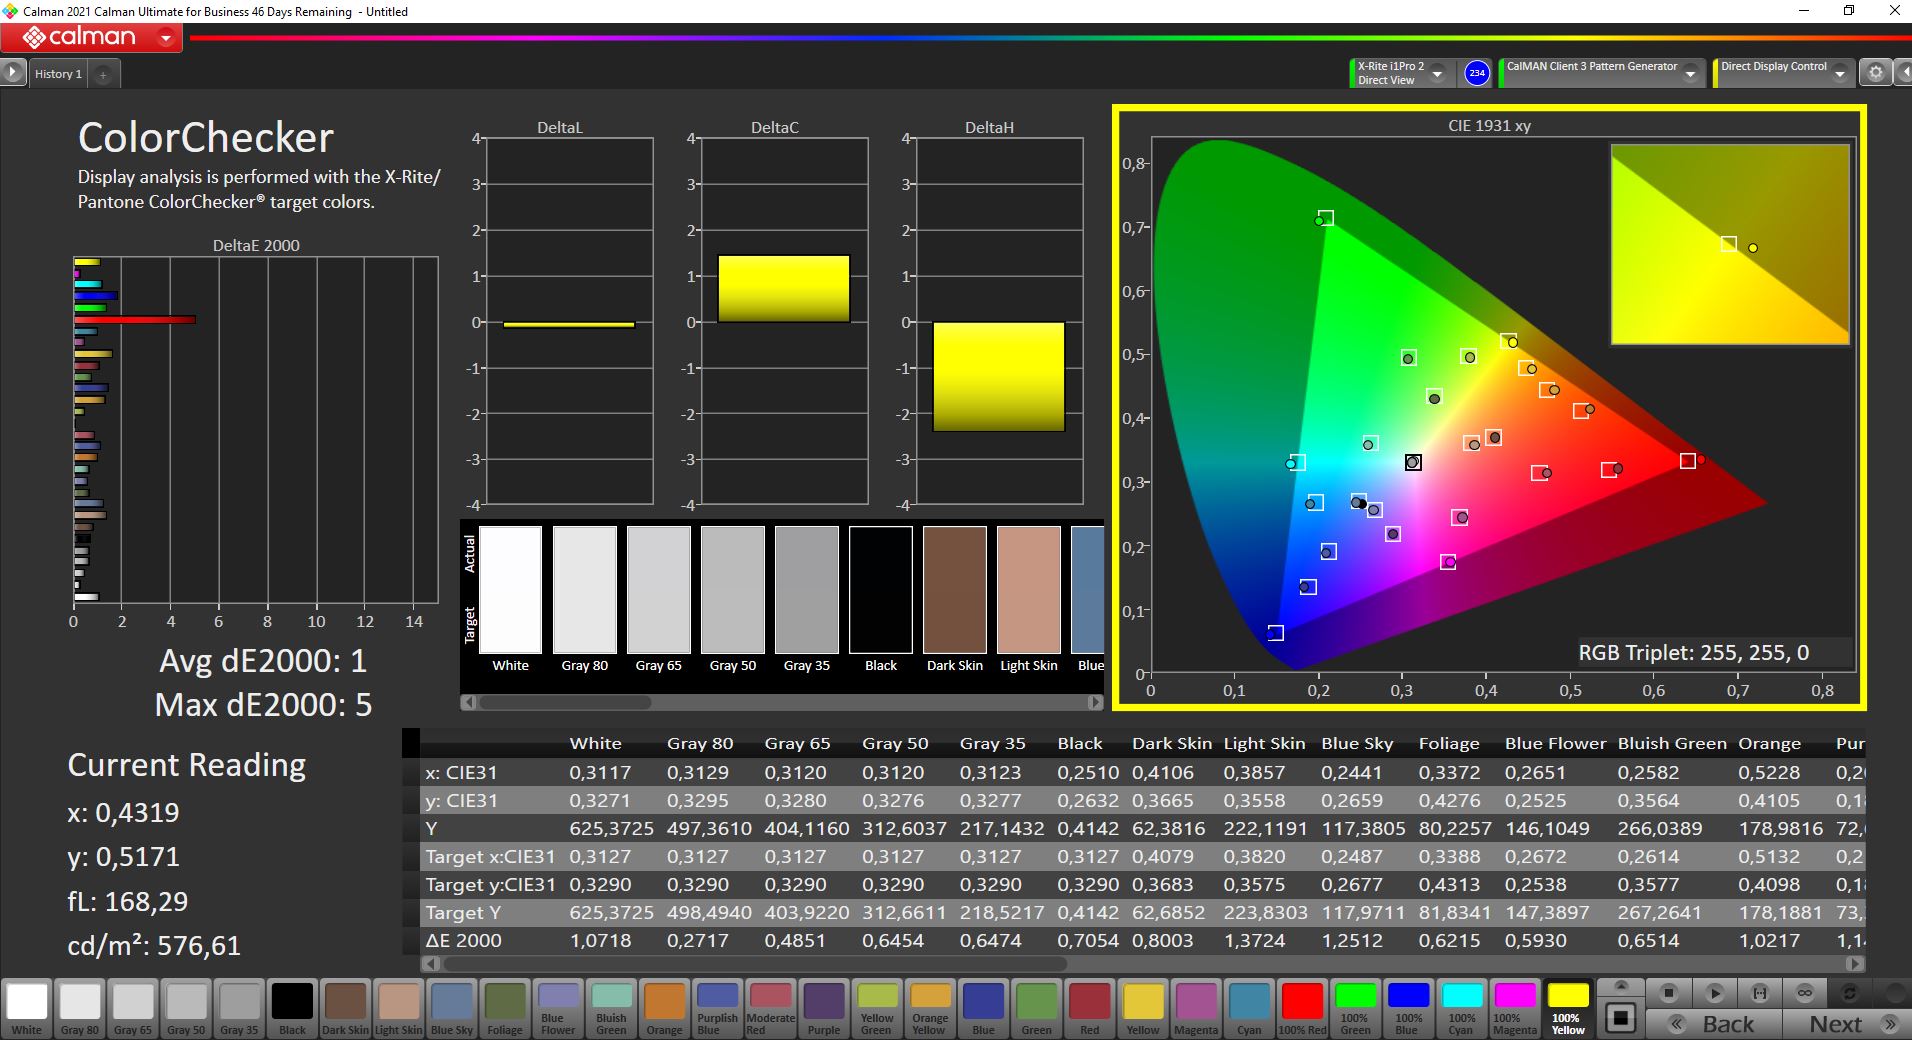
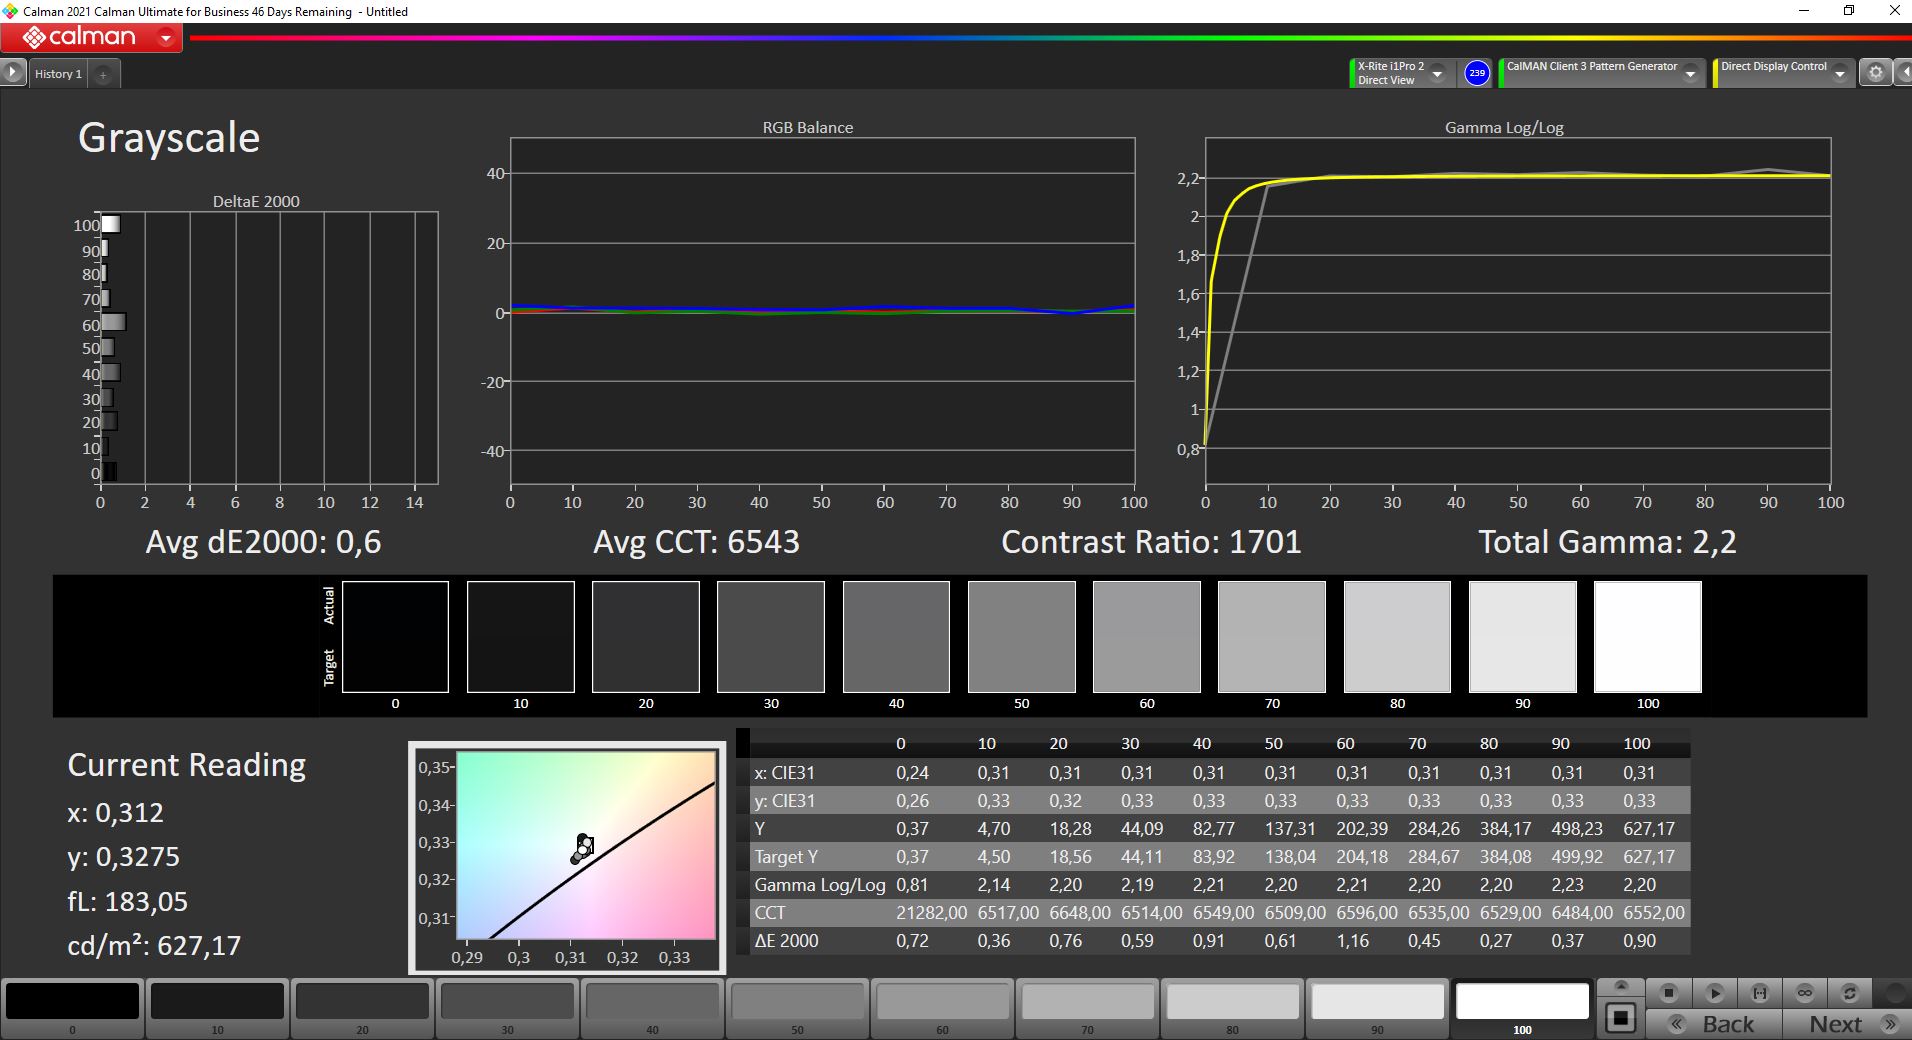
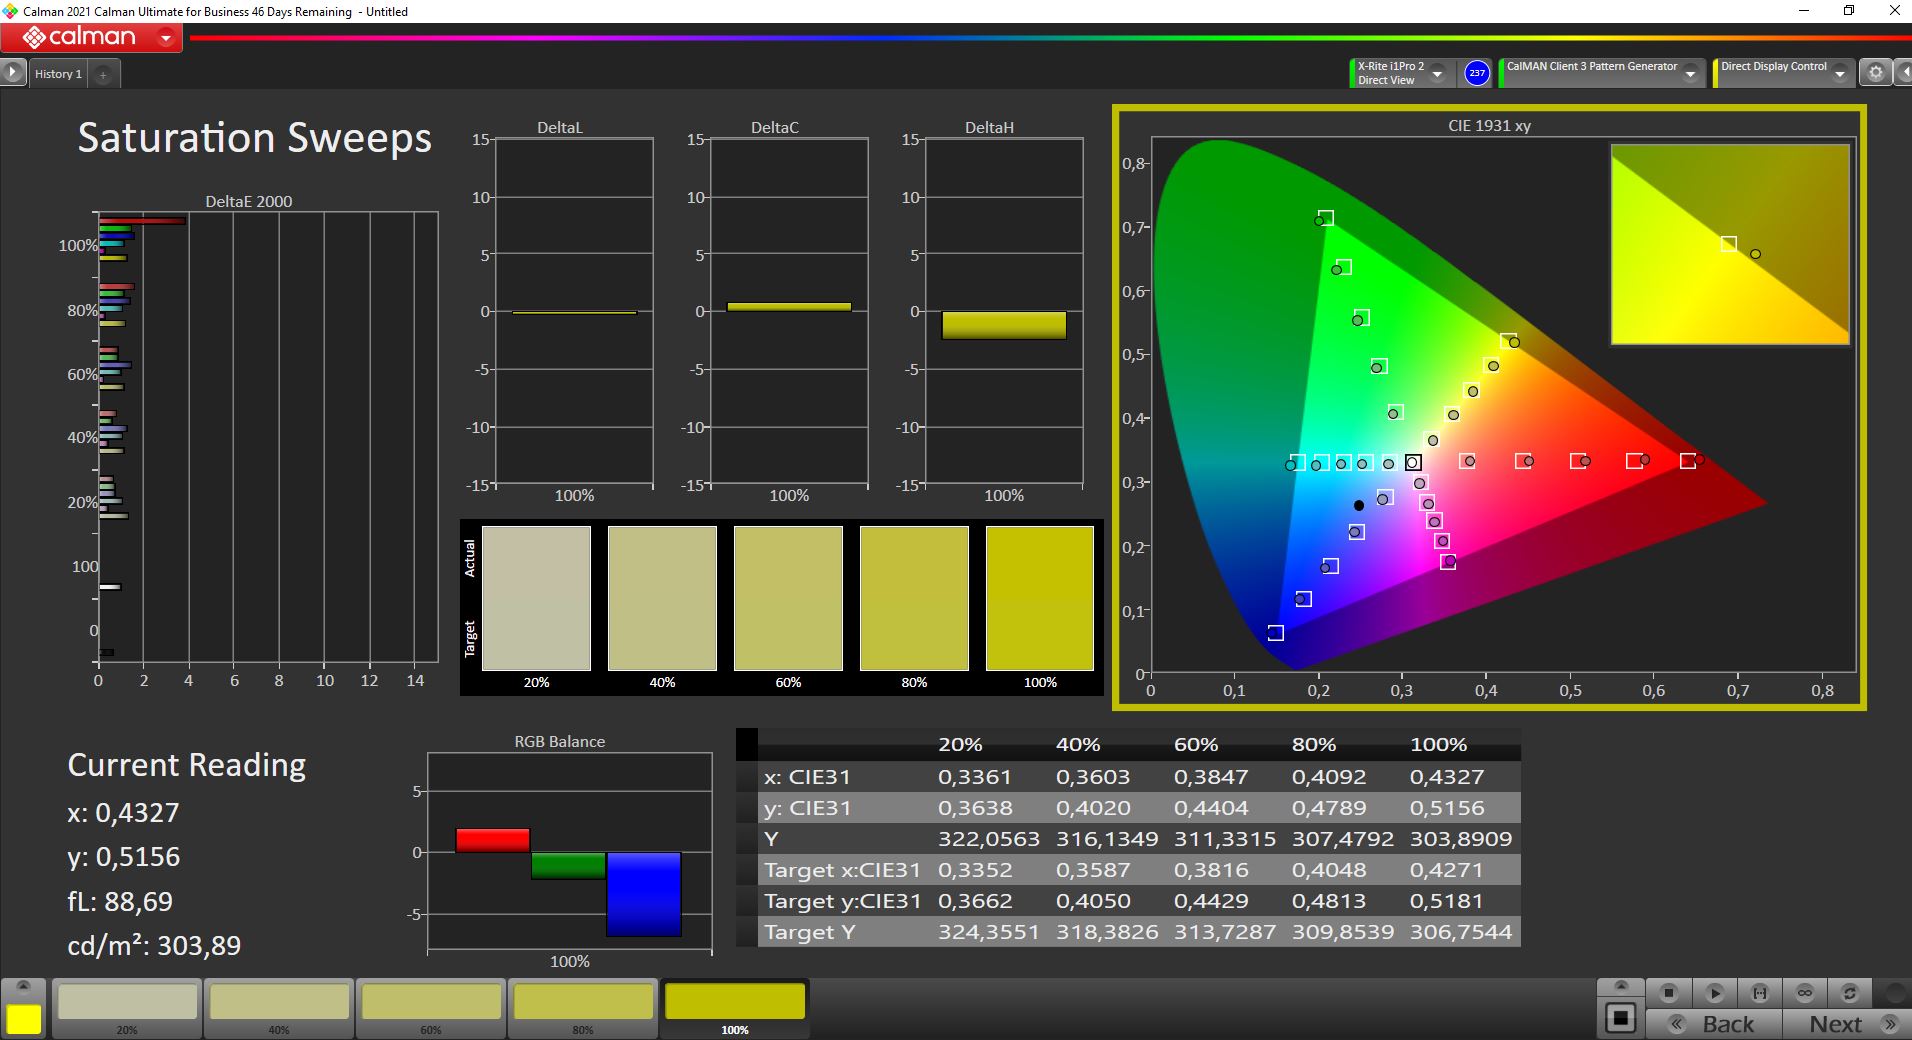
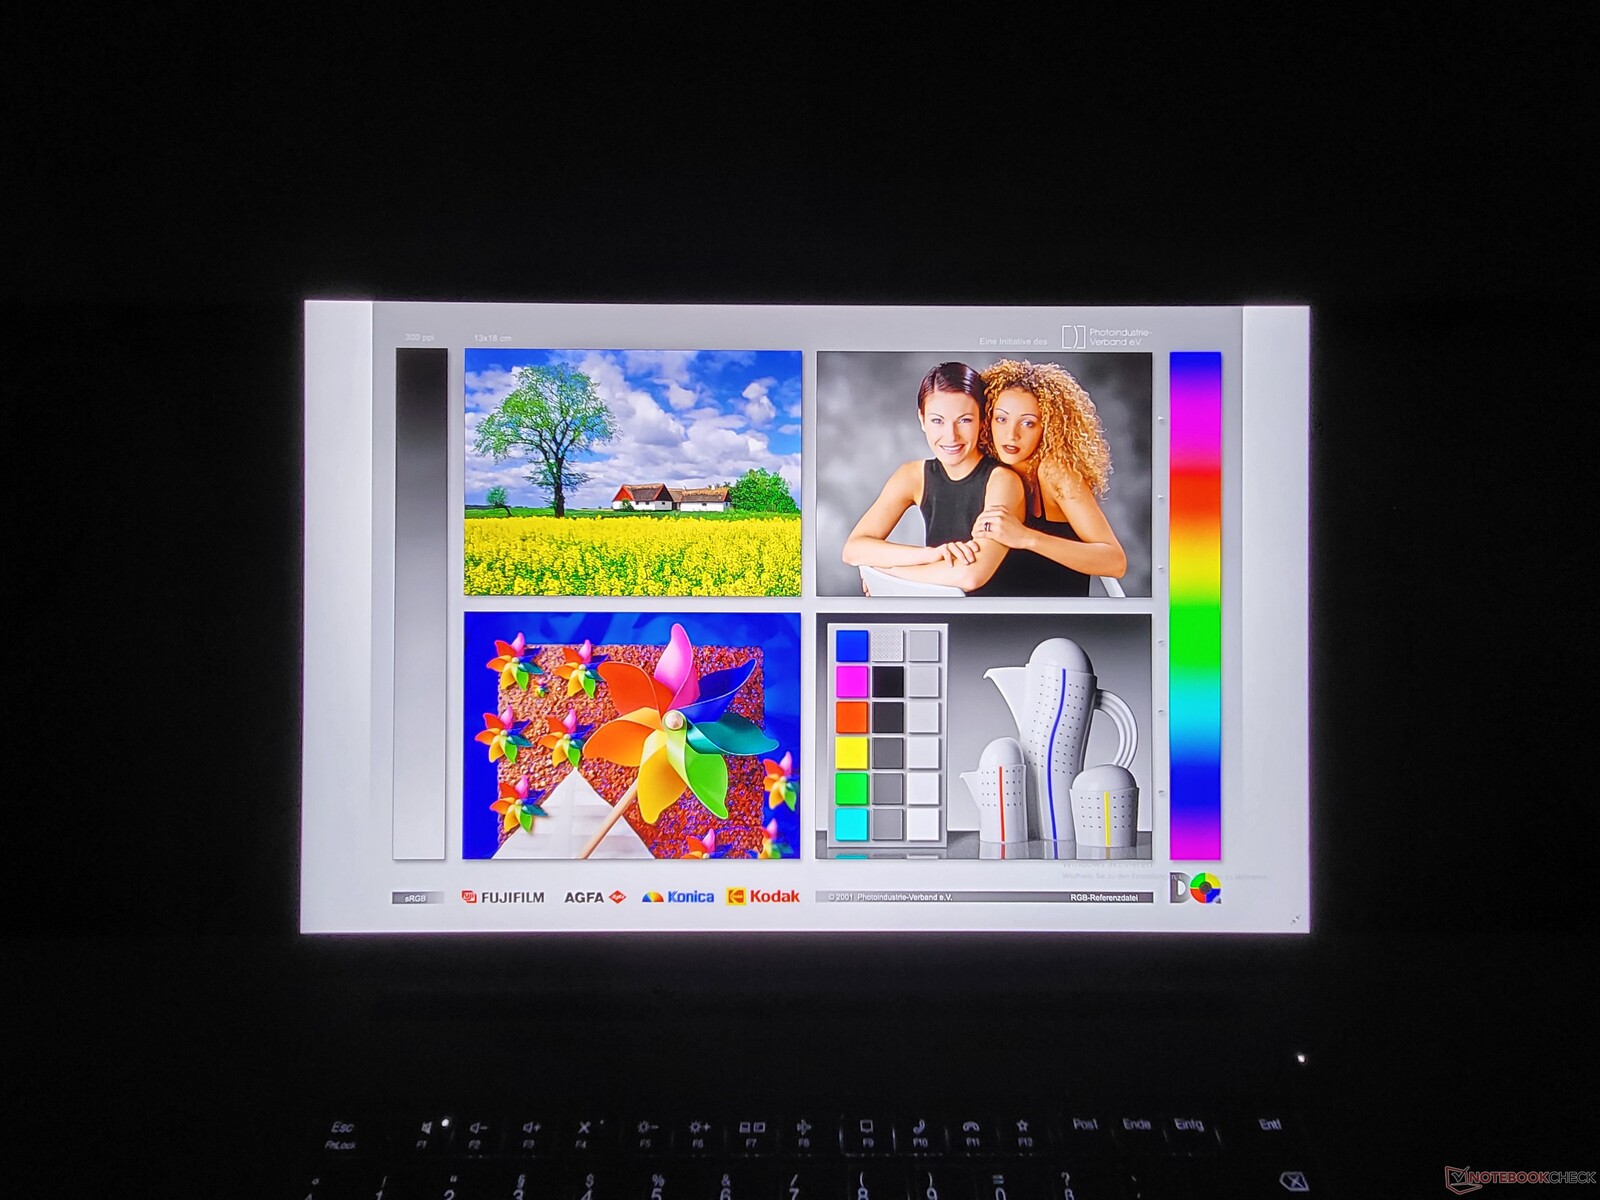
A Lenovo anuncia a tela WQUXGA instalada aqui com uma calibração de fábrica. Na verdade, medimos valores muito bons à saída da fábrica com Calman e o X-Rite i1Pro 2. Um valor DeltaE de 2,2 para os valores de cor significa que os desvios são menores. No entanto, ainda havia espaço para melhorias. Após a calibração com o X-Rite i1Profiler, o DeltaE caiu para 1,0. Como sempre, nós fornecemos o perfil de cor correspondente para download gratuito.
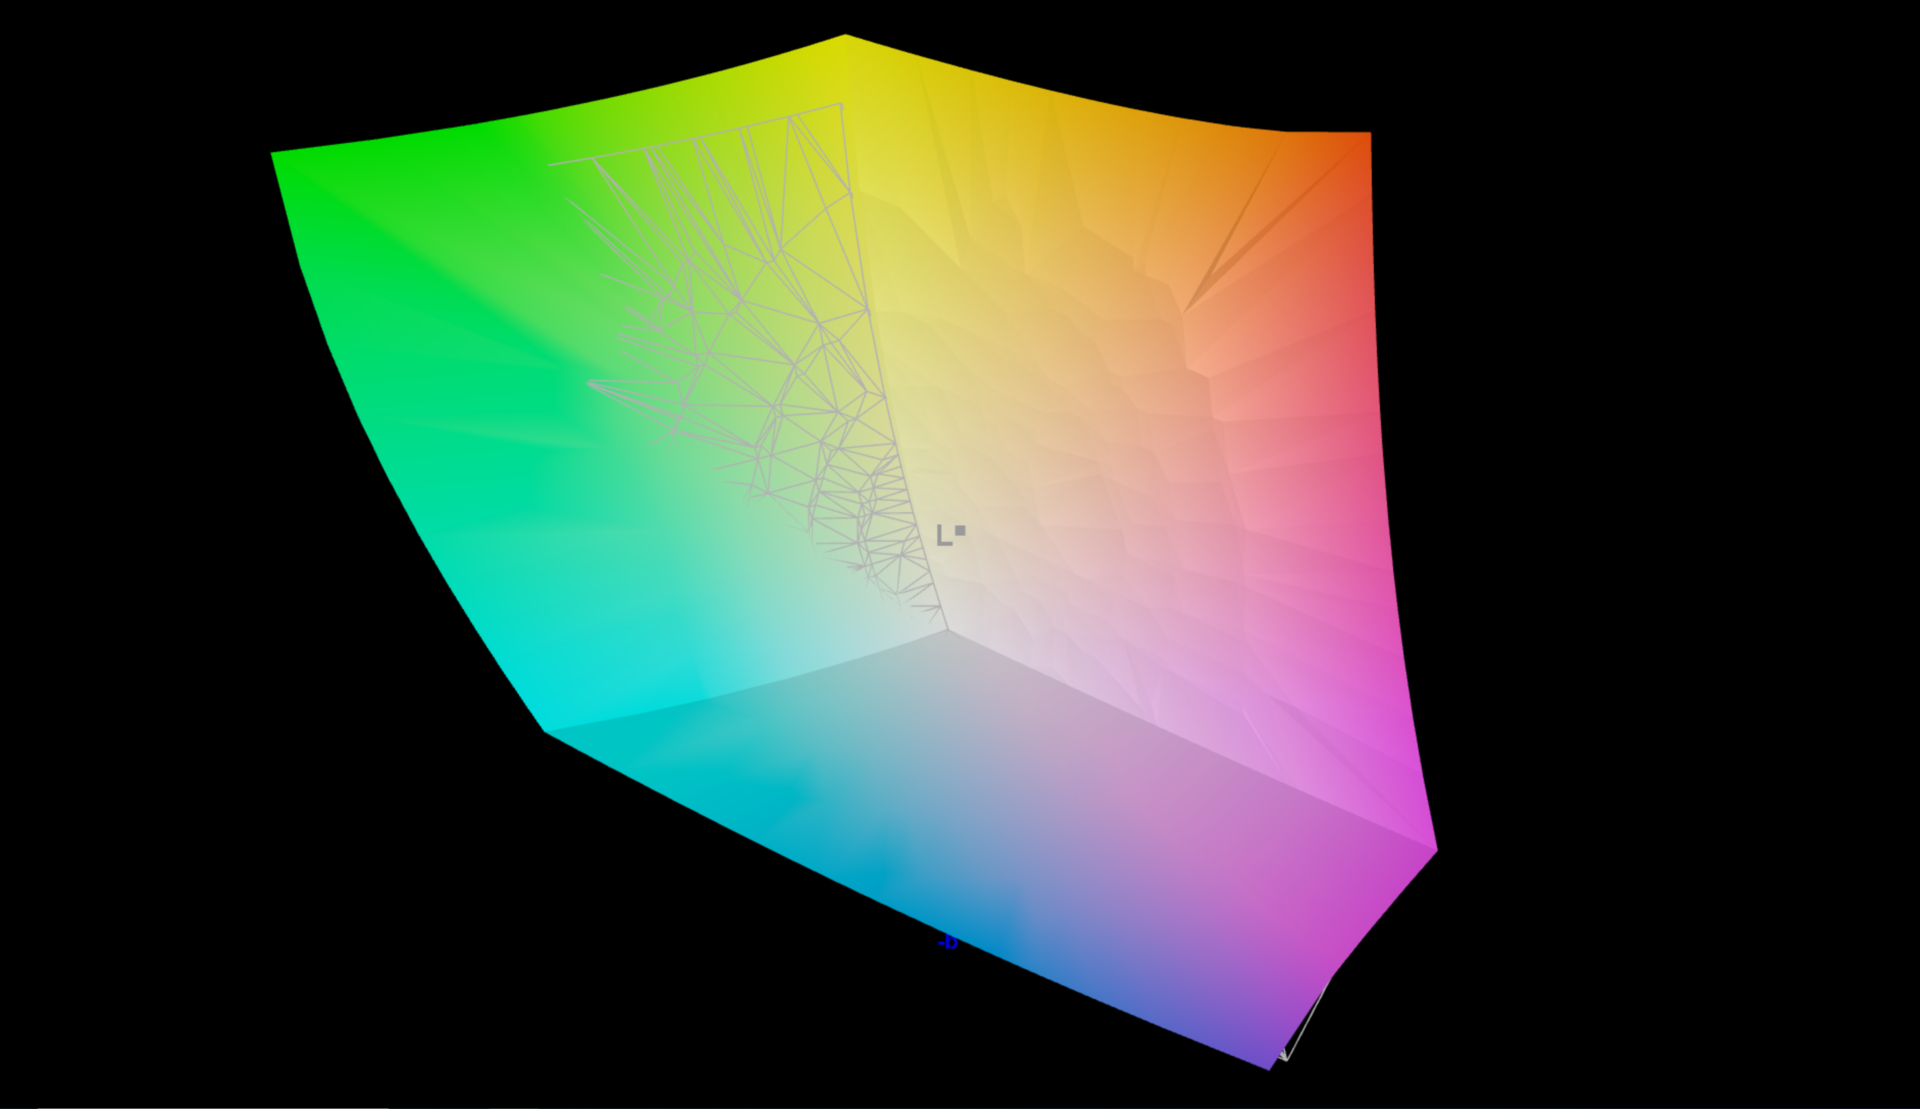
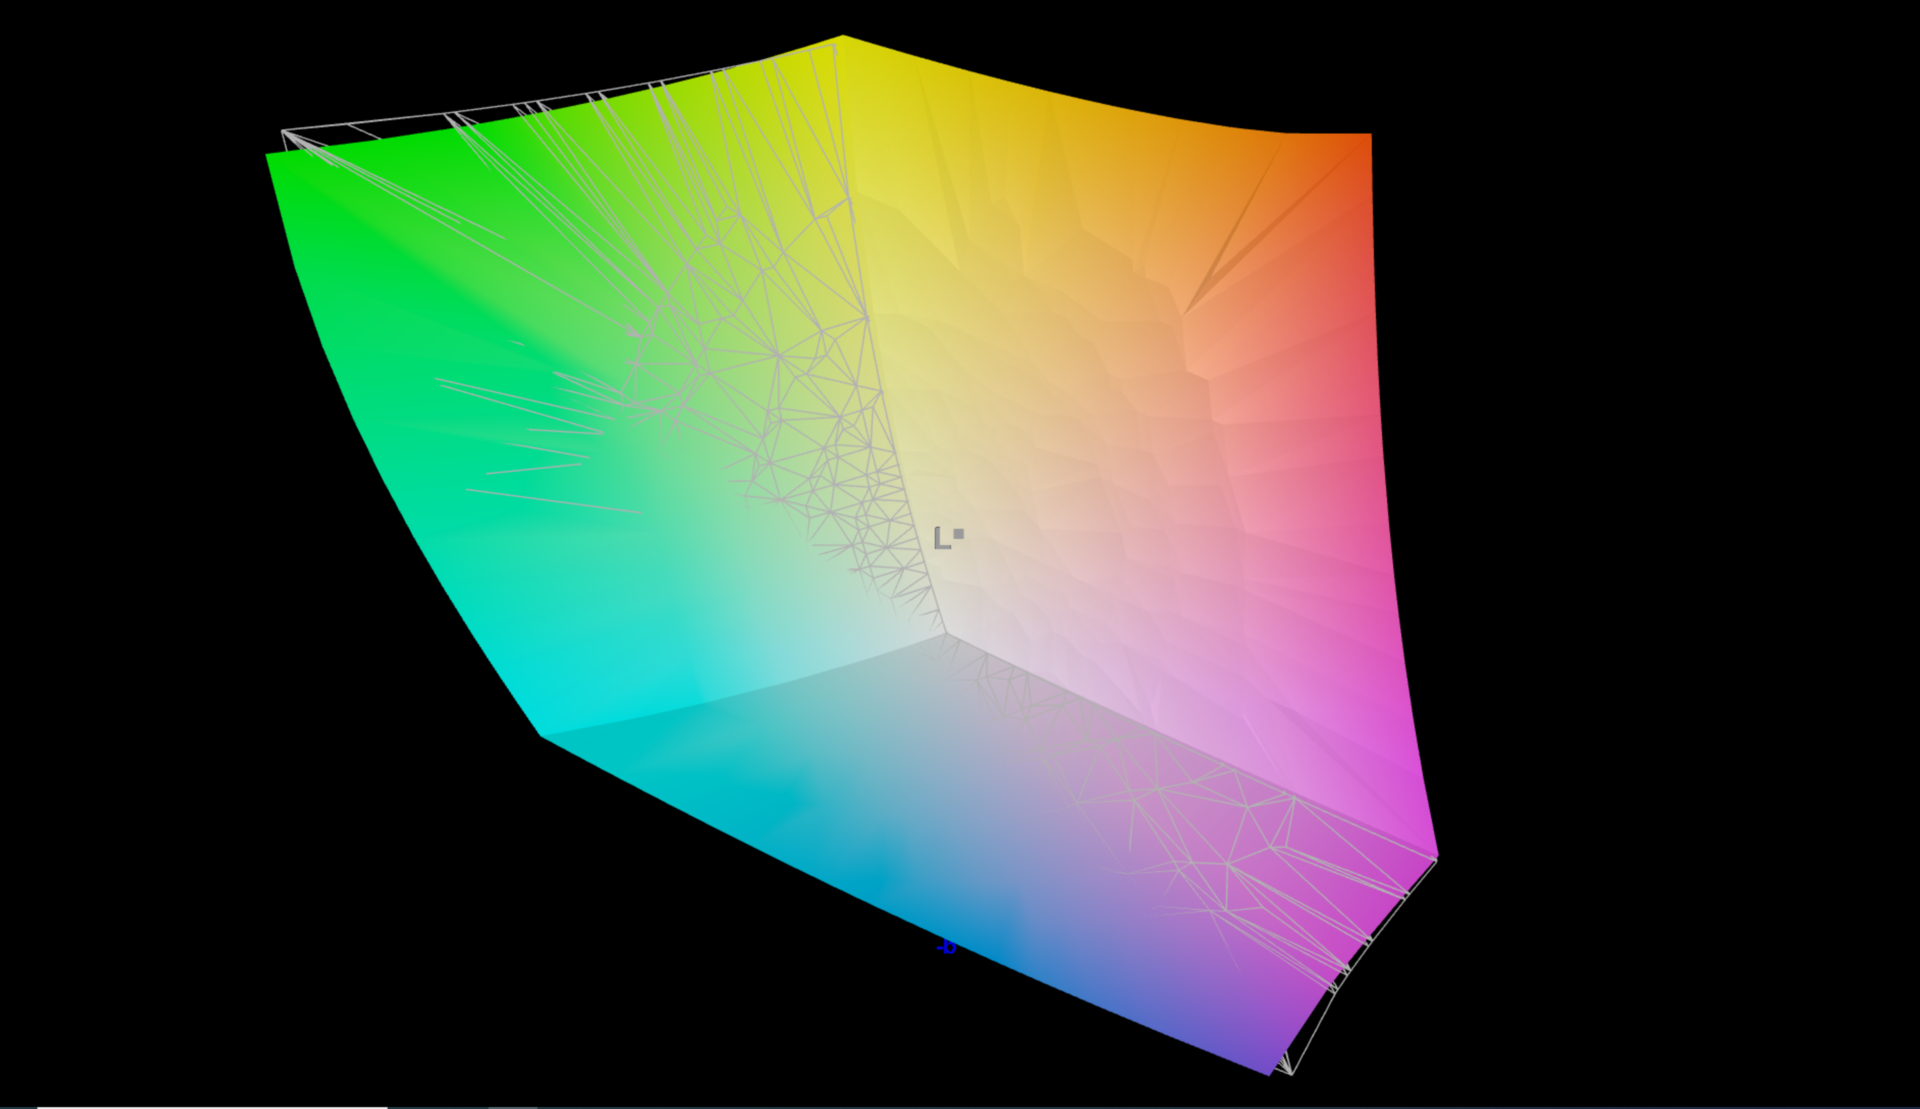
O valor de preto de 0,41 cd/m² não é particularmente notável para uma tela IPS LED, mas o alto brilho ainda garante um bom contraste de 1537:1. Juntamente com a alta cobertura do espaço de cores de 98,9% do amplo espaço de cores AdobeRGB (a Lenovo anuncia 100% AdobeRGB), a qualidade de imagem do Lenovo ThinkPad P1 Gen 4 é excelente, e o painel de 8 bits é bem adequado para a edição de imagens
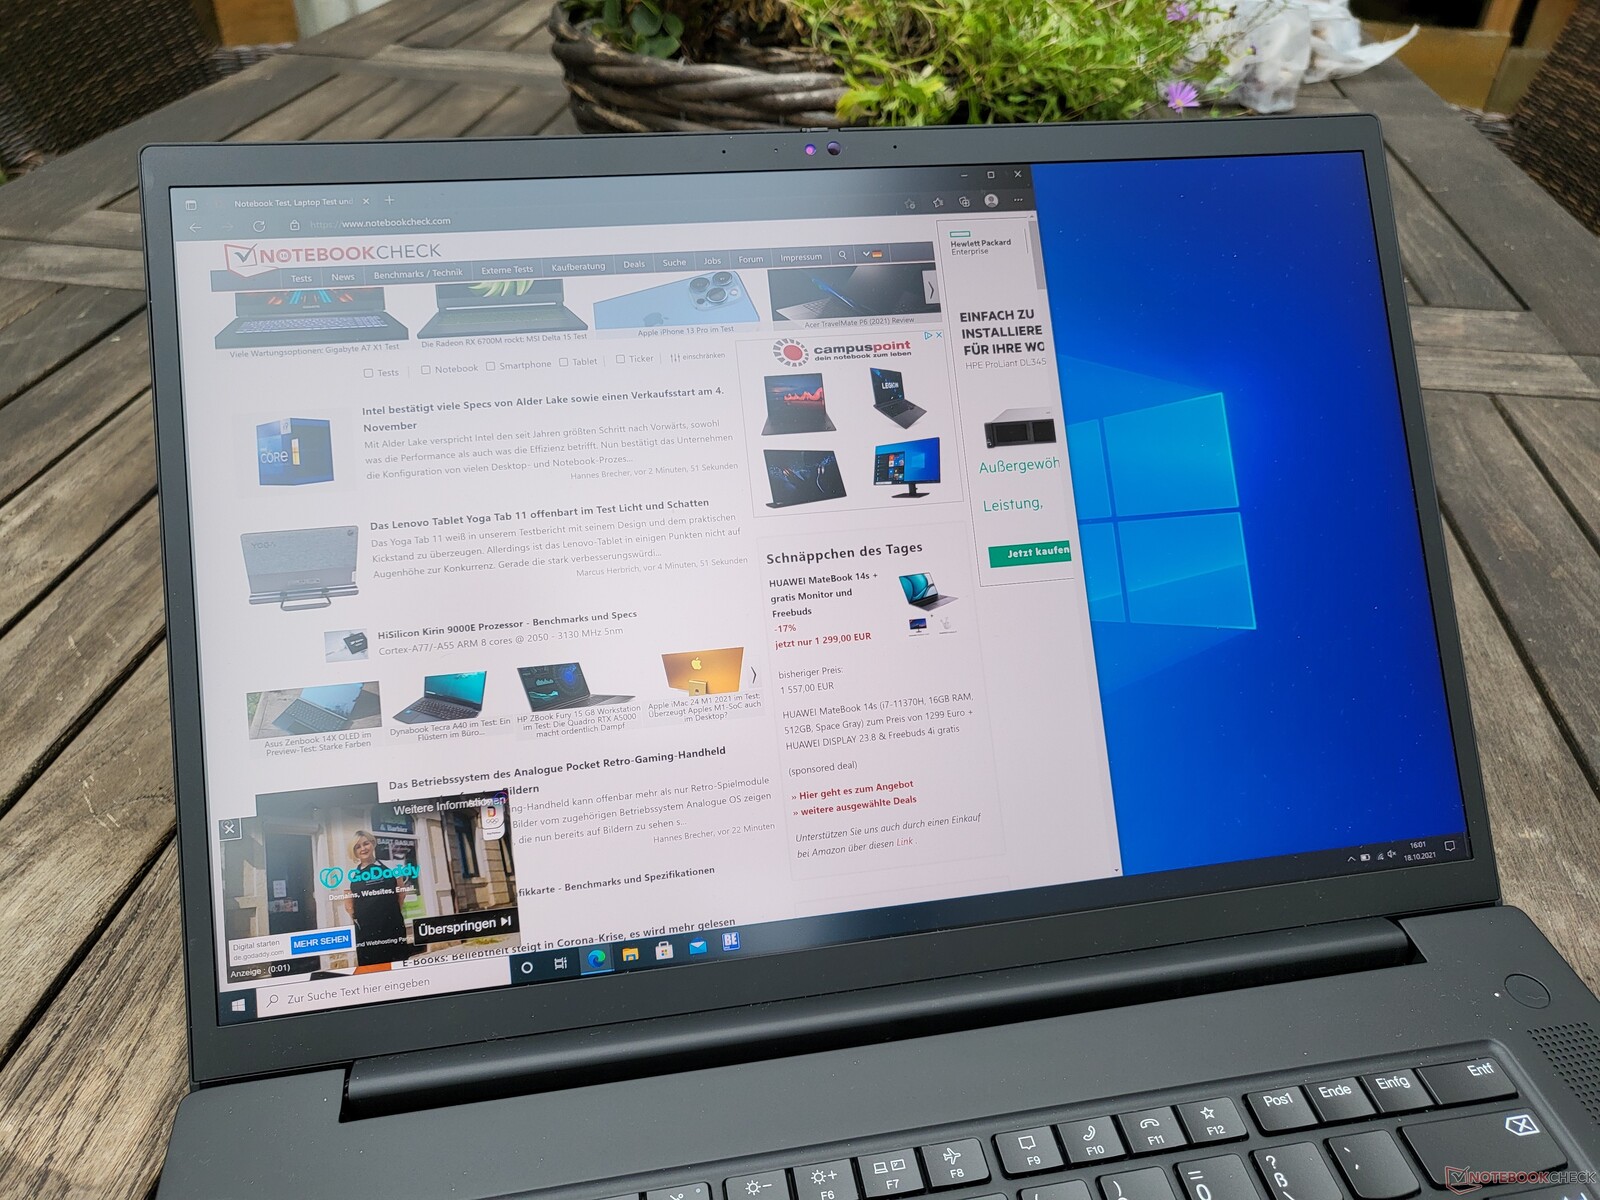
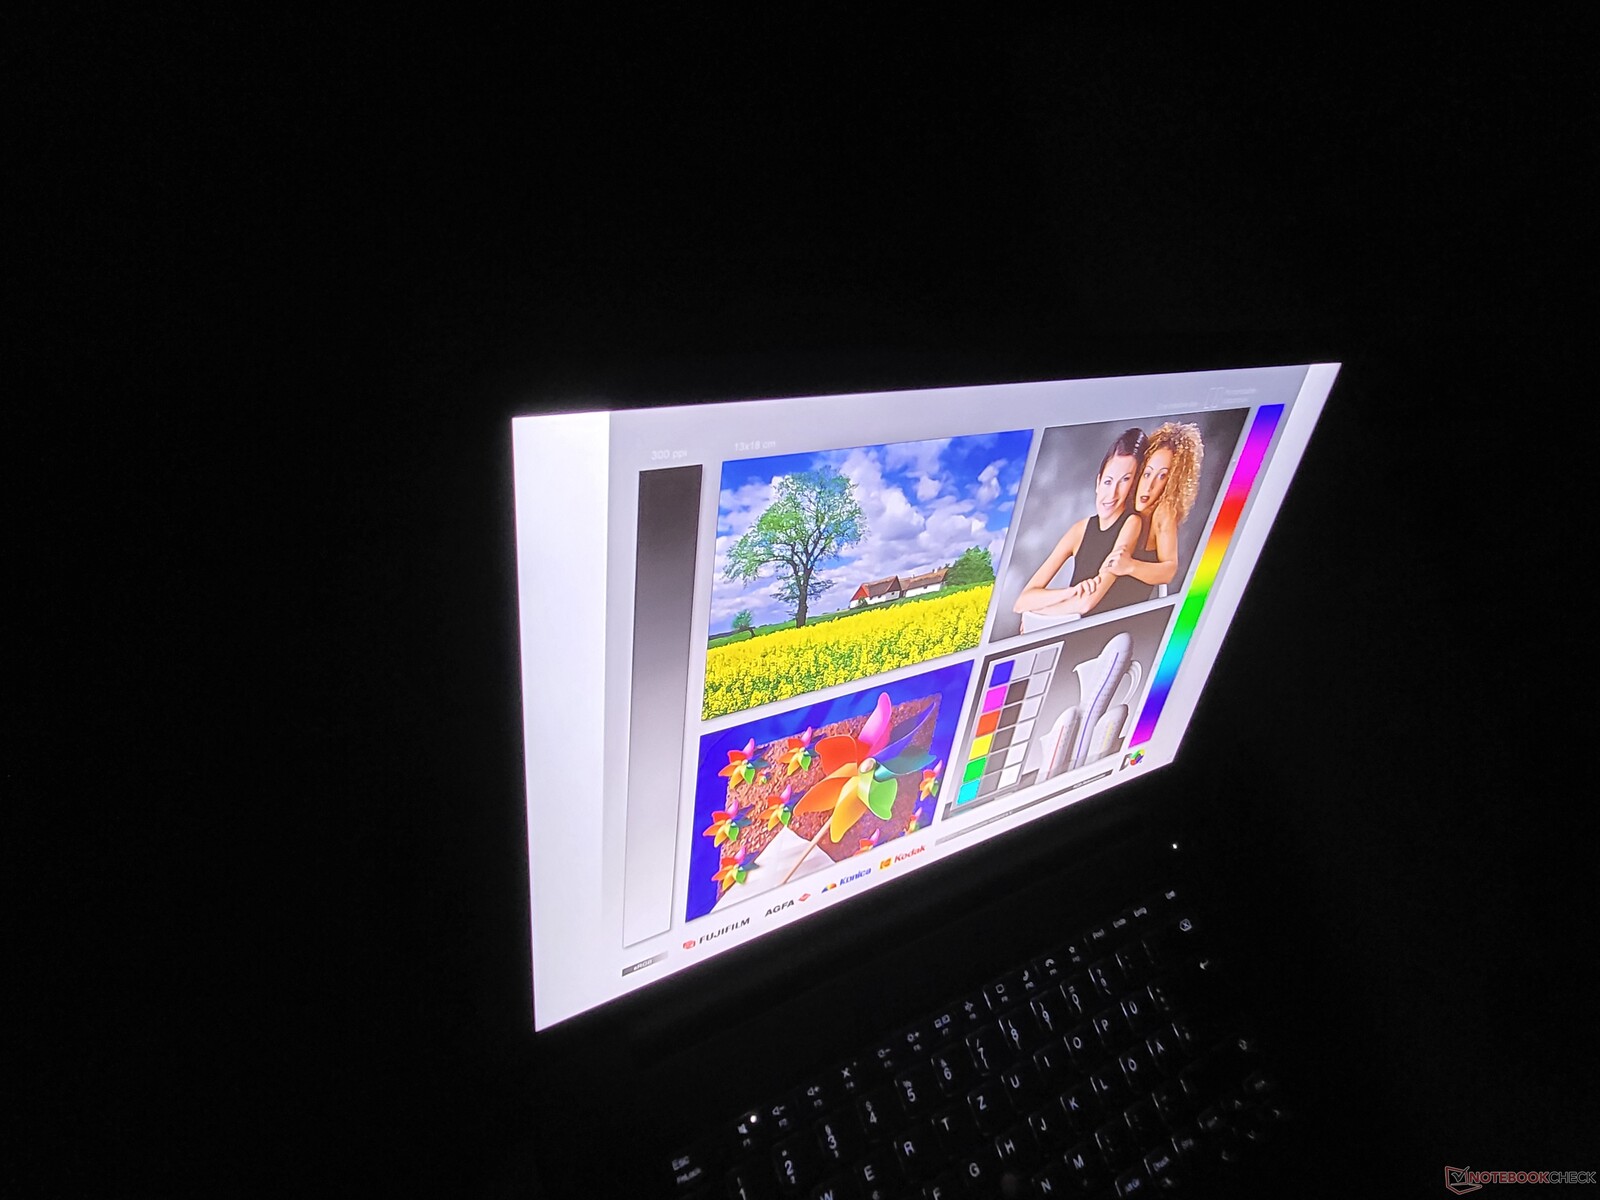
O Lenovo ThinkPad P1 2021 domina facilmente o uso ao ar livre. A superfície fosca ajuda a brilhante tela UHD+ de 4K a brilhar mais facilmente do que a luz do dia em dias nublados. Entretanto, a luz direta do sol ainda pode ser um desafio mesmo a 600 cd/m²
Exibir tempos de resposta
| ↔ Tempo de resposta preto para branco | ||
|---|---|---|
| 31.2 ms ... ascensão ↗ e queda ↘ combinadas | ↗ 16.4 ms ascensão | 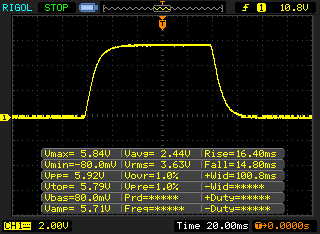 |
| ↘ 14.8 ms queda | ||
| A tela mostra taxas de resposta lentas em nossos testes e será insatisfatória para os jogadores. Em comparação, todos os dispositivos testados variam de 0.1 (mínimo) a 240 (máximo) ms. » 84 % de todos os dispositivos são melhores. Isso significa que o tempo de resposta medido é pior que a média de todos os dispositivos testados (19.8 ms). | ||
| ↔ Tempo de resposta 50% cinza a 80% cinza | ||
| 55.2 ms ... ascensão ↗ e queda ↘ combinadas | ↗ 26.8 ms ascensão | 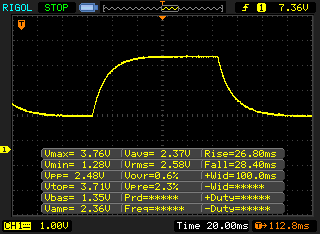 |
| ↘ 28.4 ms queda | ||
| A tela mostra taxas de resposta lentas em nossos testes e será insatisfatória para os jogadores. Em comparação, todos os dispositivos testados variam de 0.165 (mínimo) a 636 (máximo) ms. » 92 % de todos os dispositivos são melhores. Isso significa que o tempo de resposta medido é pior que a média de todos os dispositivos testados (31 ms). | ||
Cintilação da tela / PWM (modulação por largura de pulso)
| Tela tremeluzindo / PWM não detectado |  | ||
[pwm_comparison] Em comparação: 52 % de todos os dispositivos testados não usam PWM para escurecer a tela. Se PWM foi detectado, uma média de 7757 (mínimo: 5 - máximo: 343500) Hz foi medida. | |||
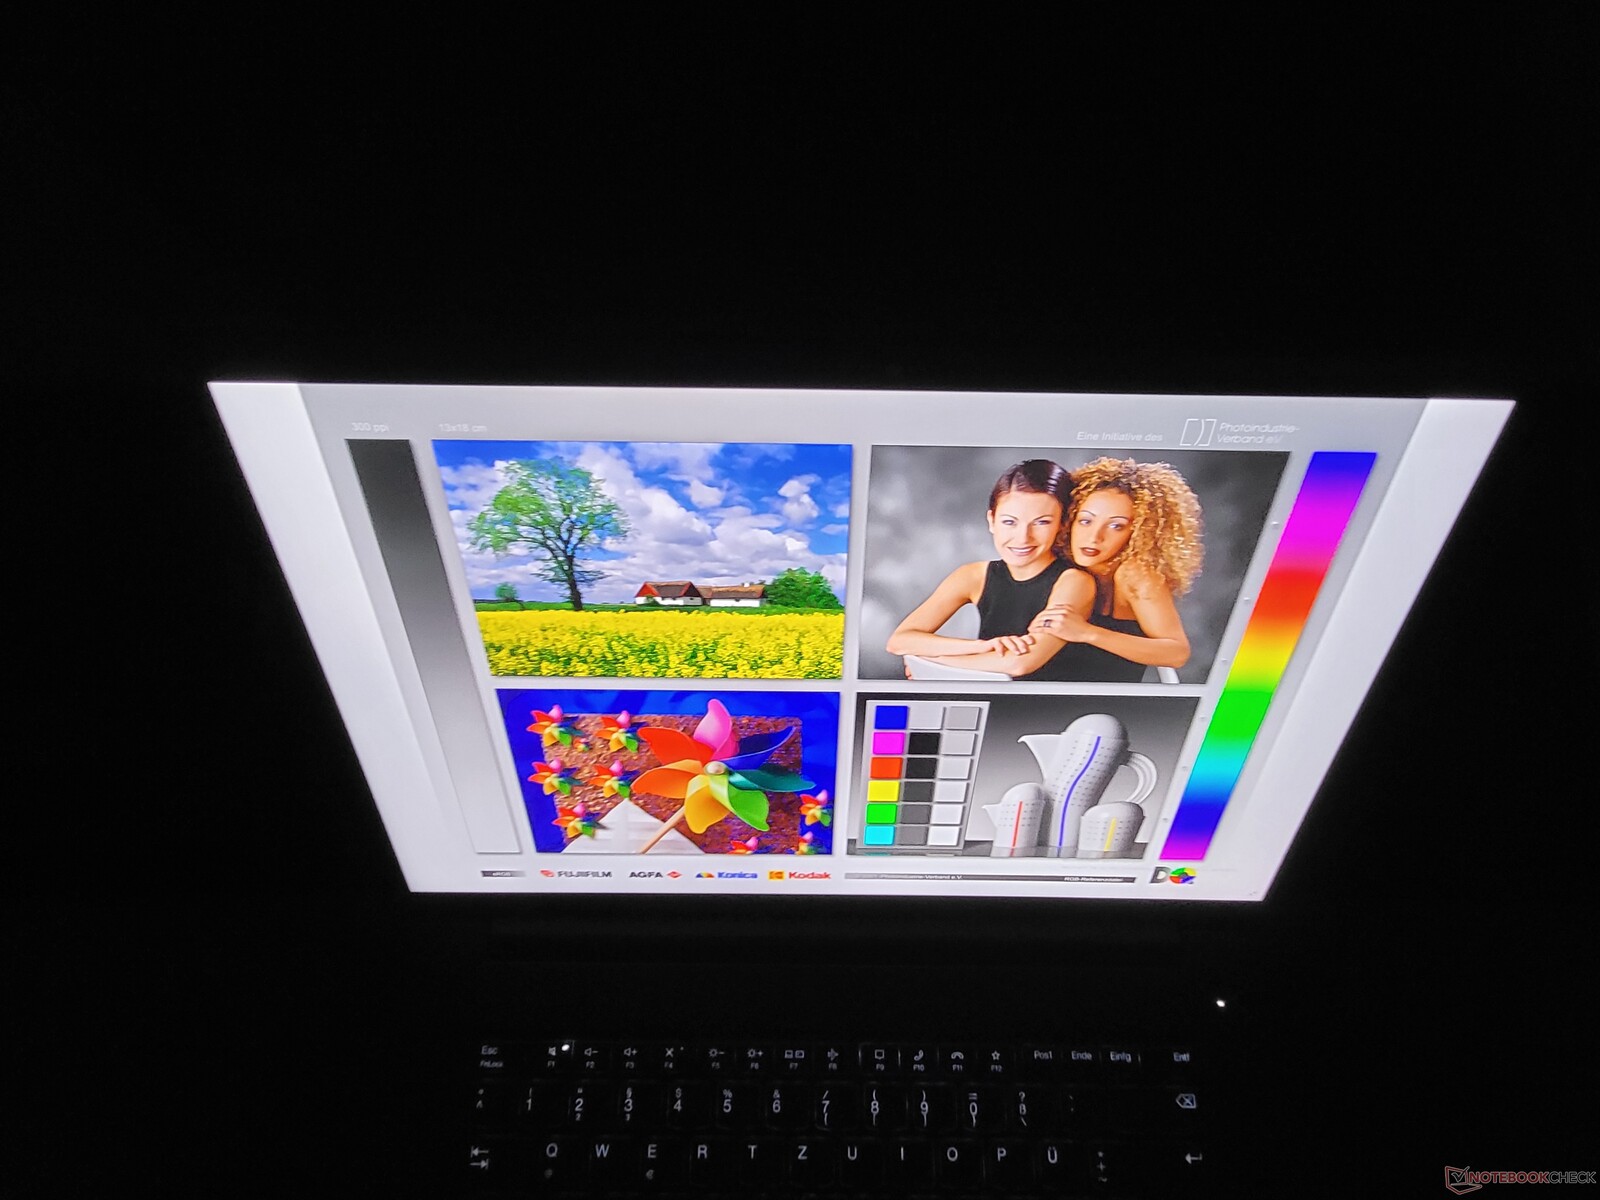
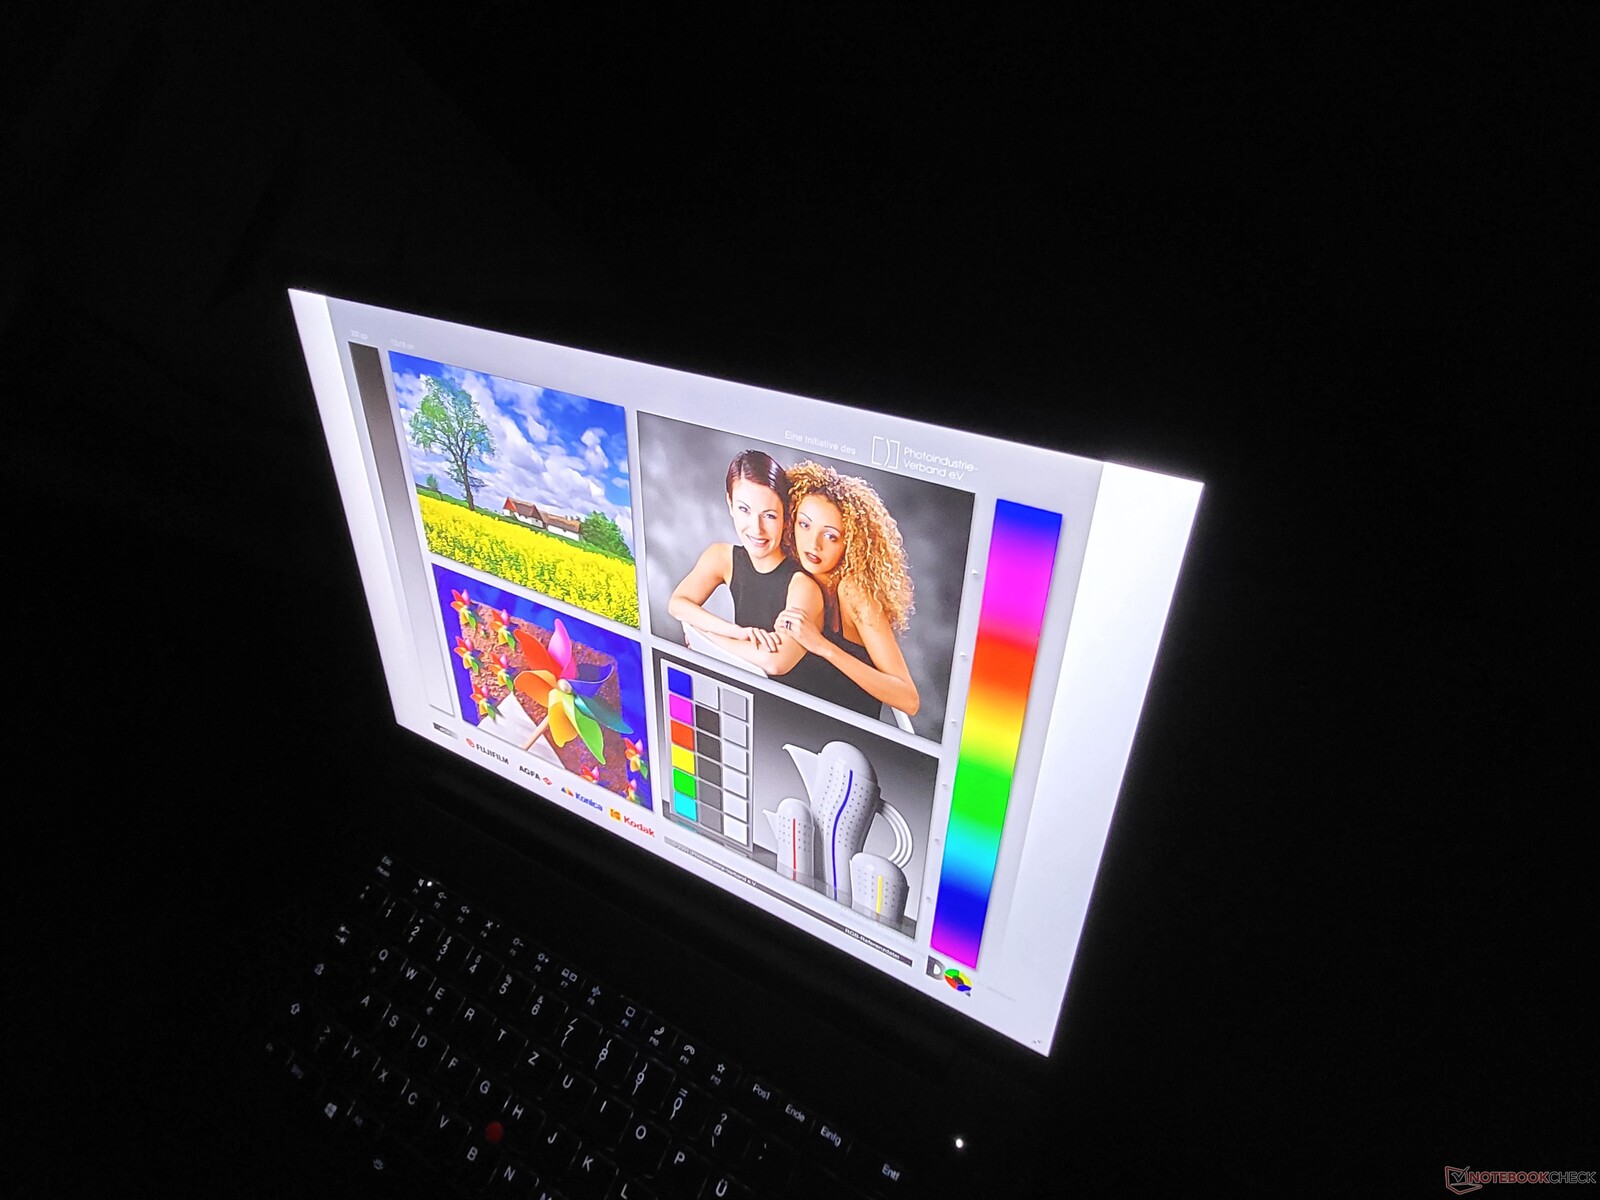
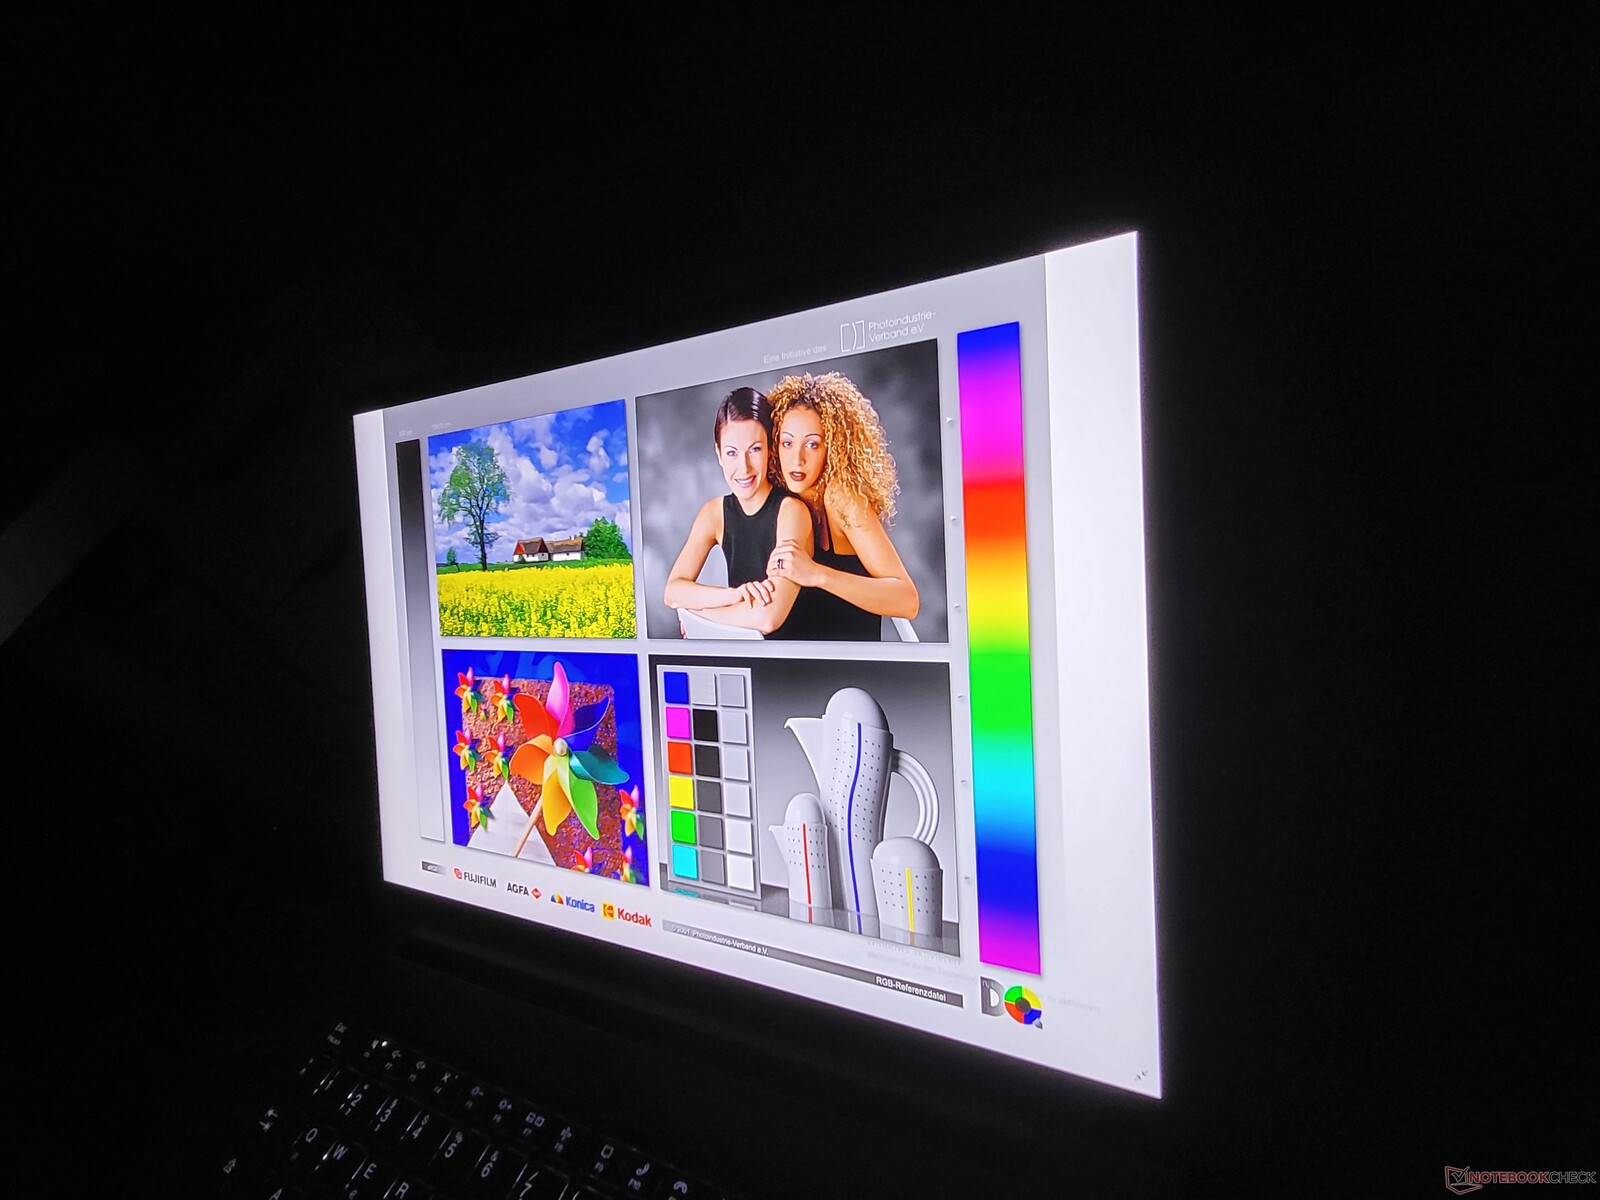
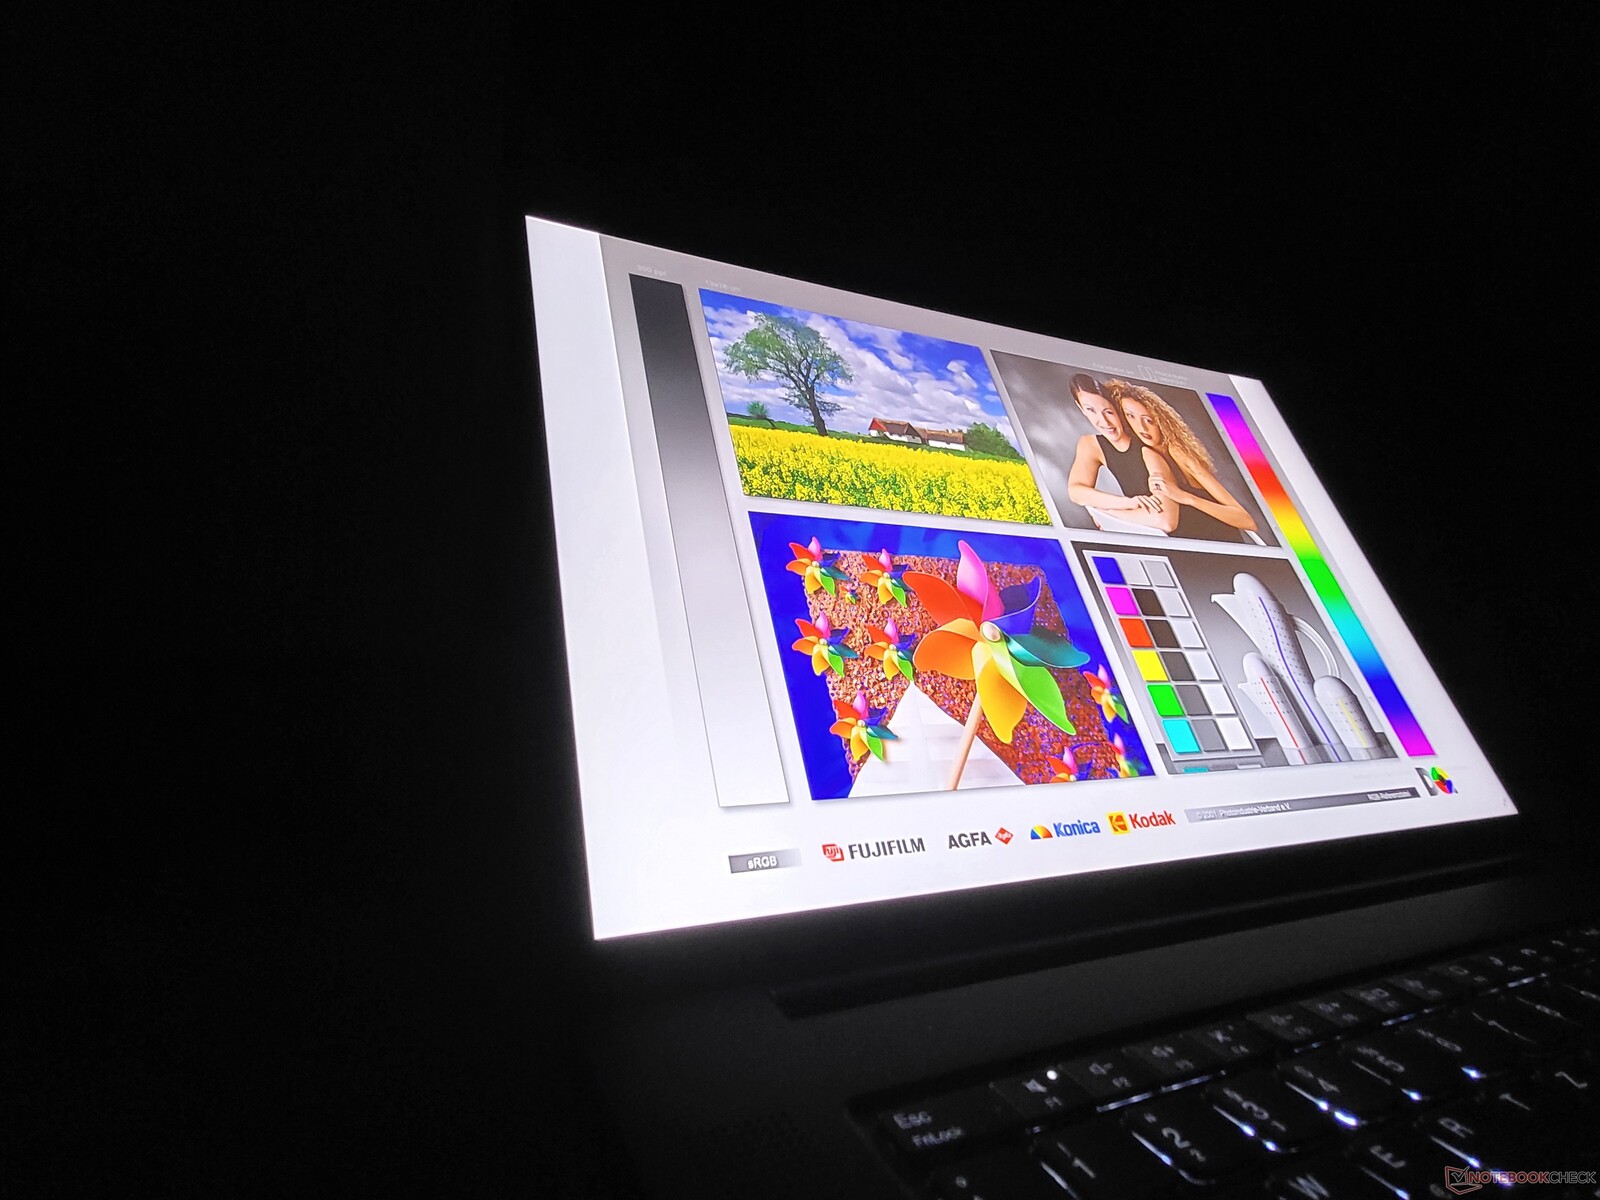
A qualidade da tecnologia IPS se reflete em sua excelente estabilidade do ângulo de visão, que também é sem falhas no ThinkPad P1 2021 da Lenovo.
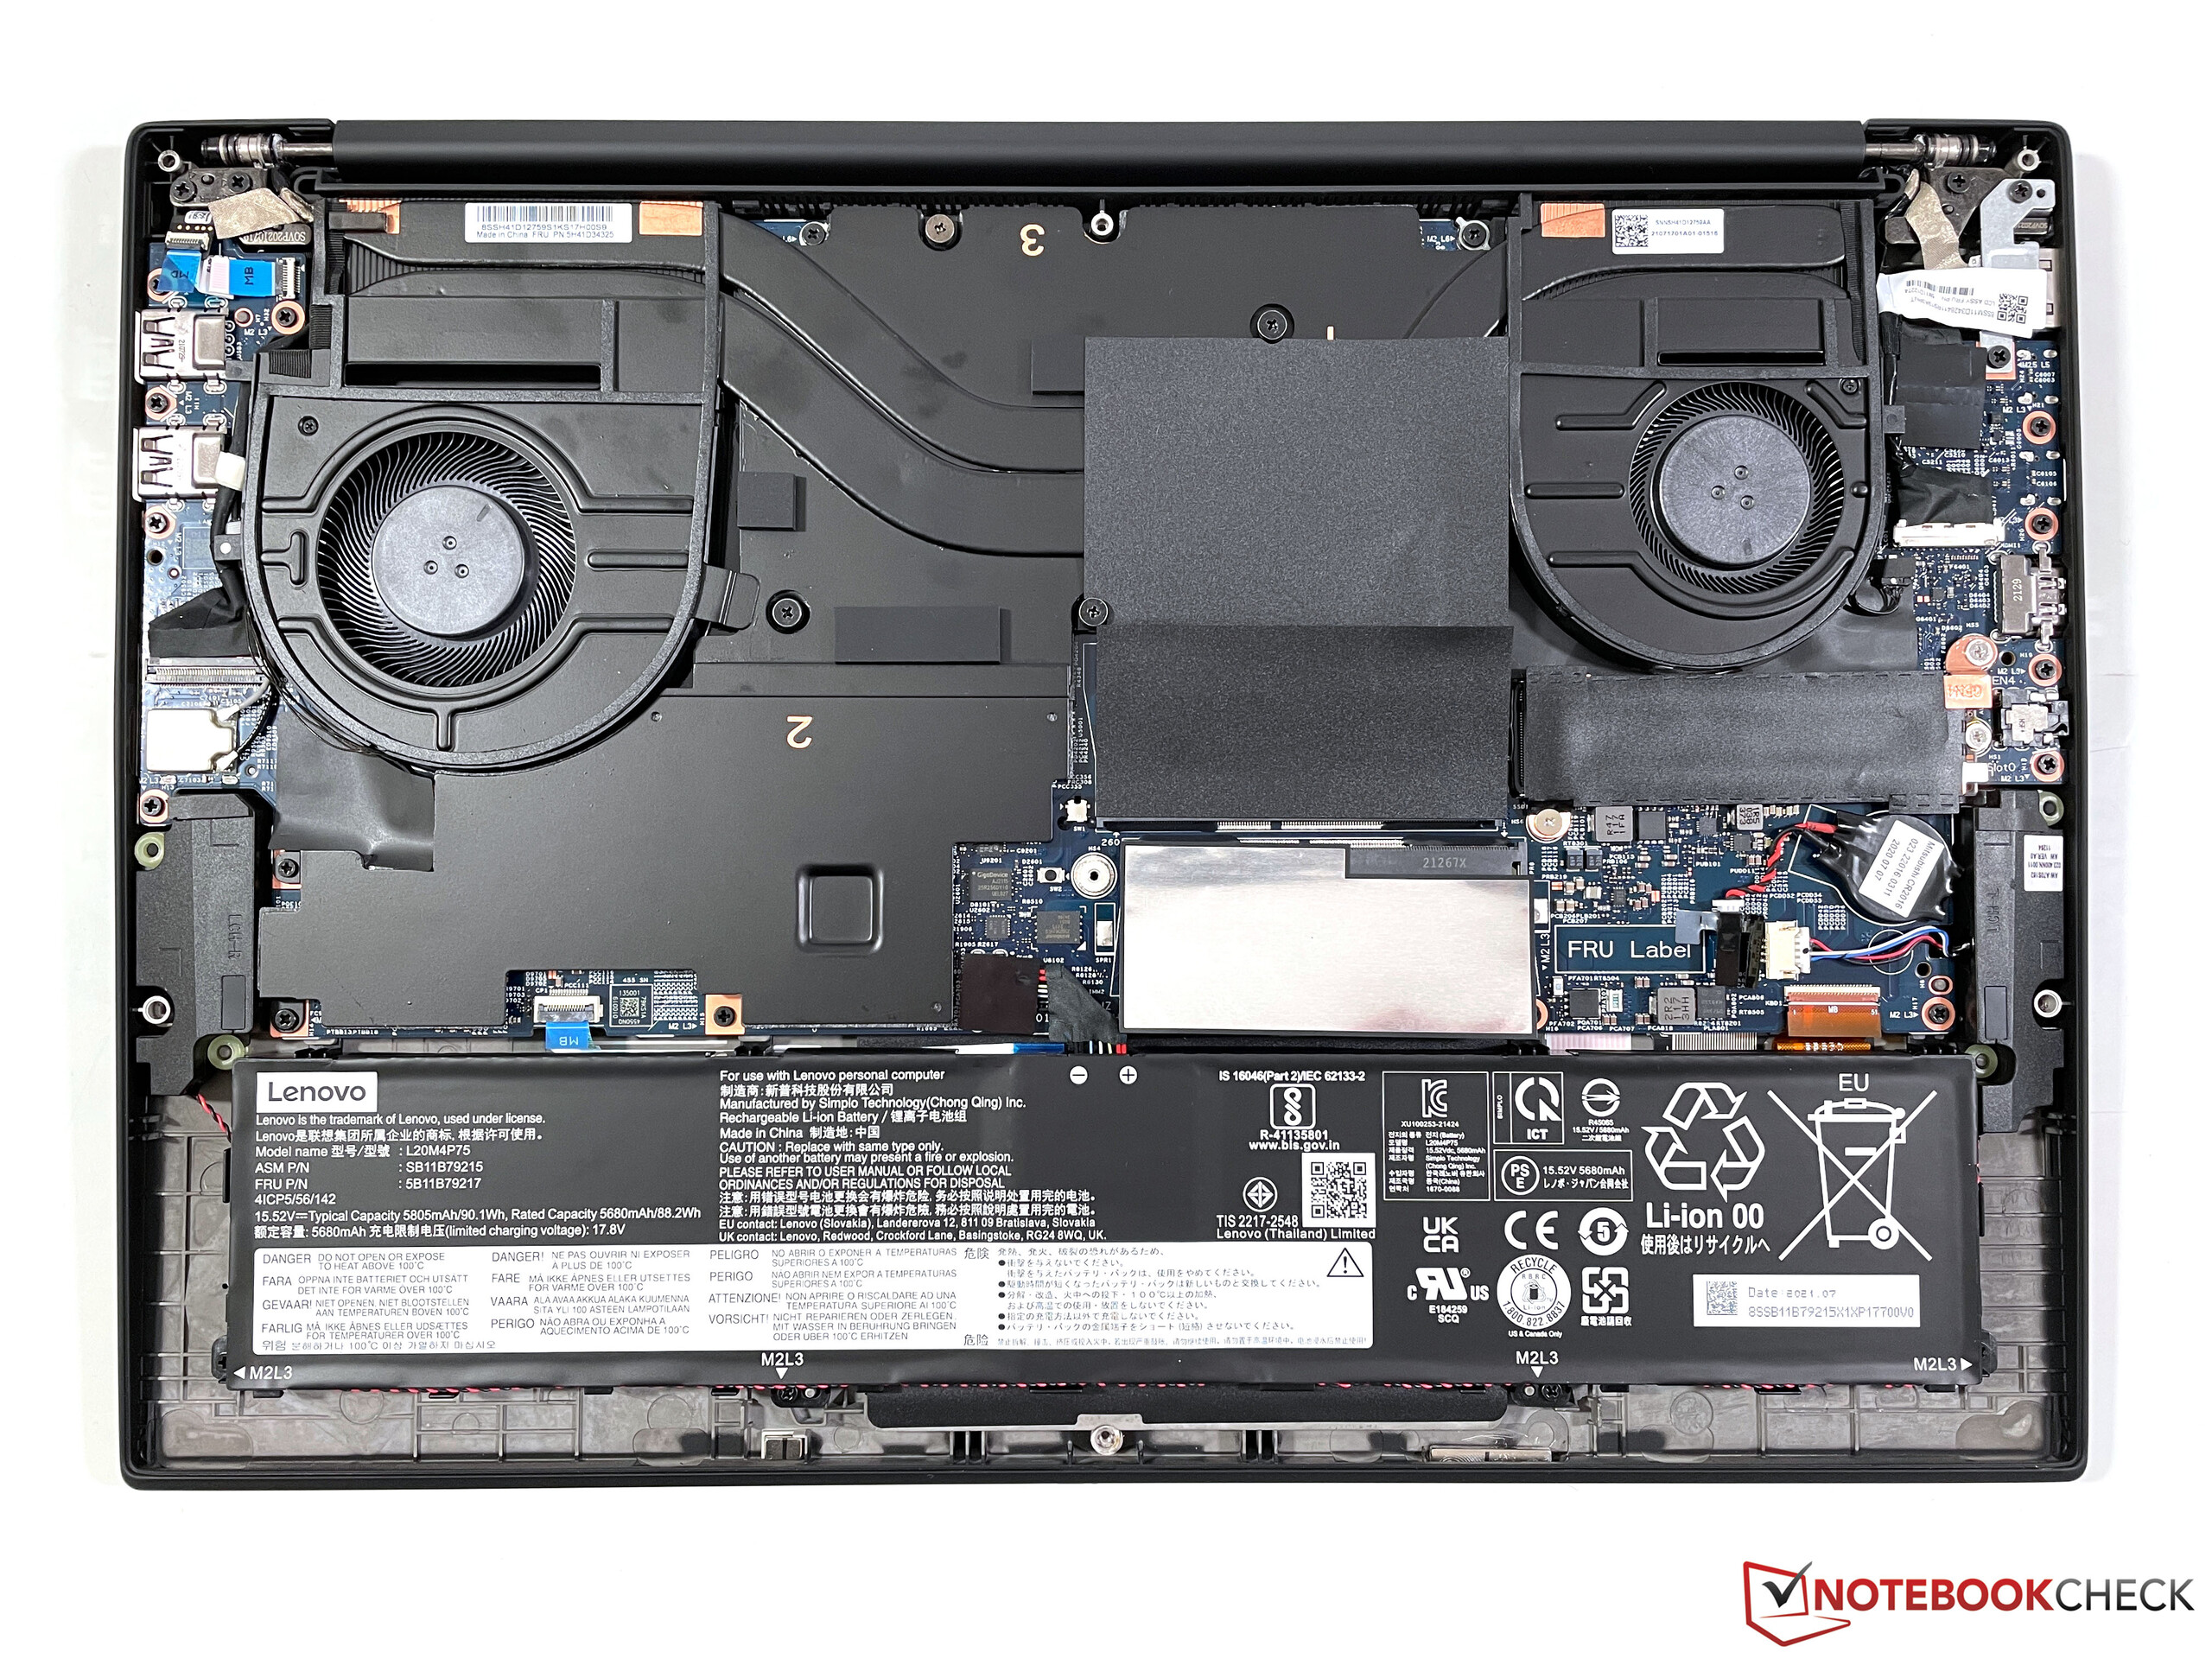
Desempenho da estação de trabalho Lenovo significativamente melhor com VaporChamber
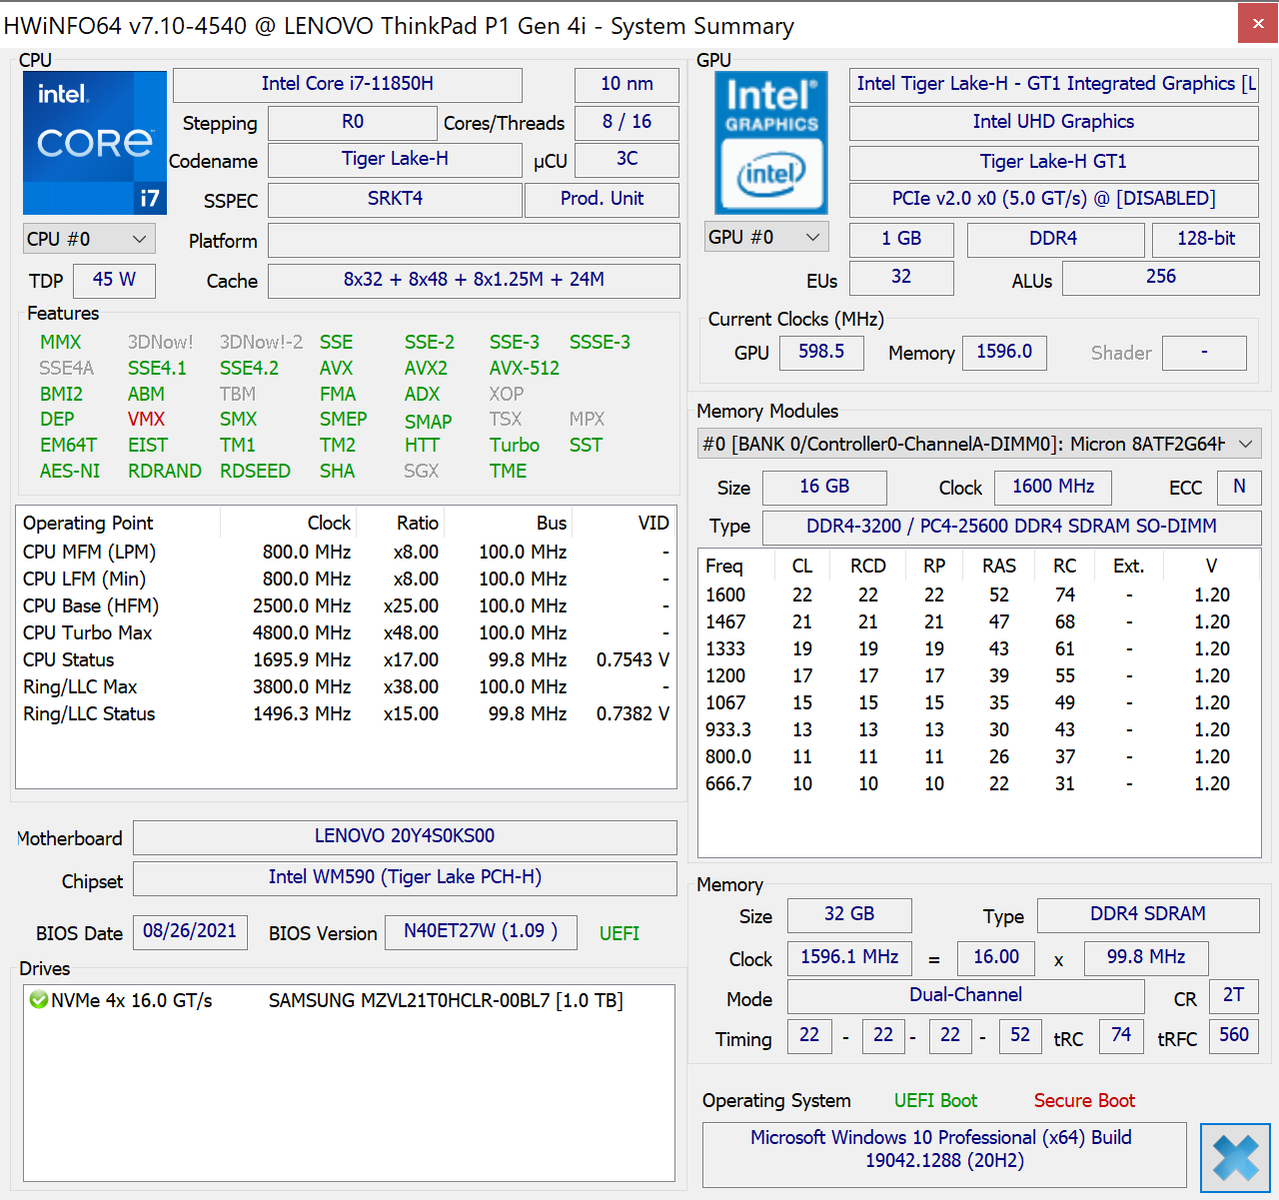
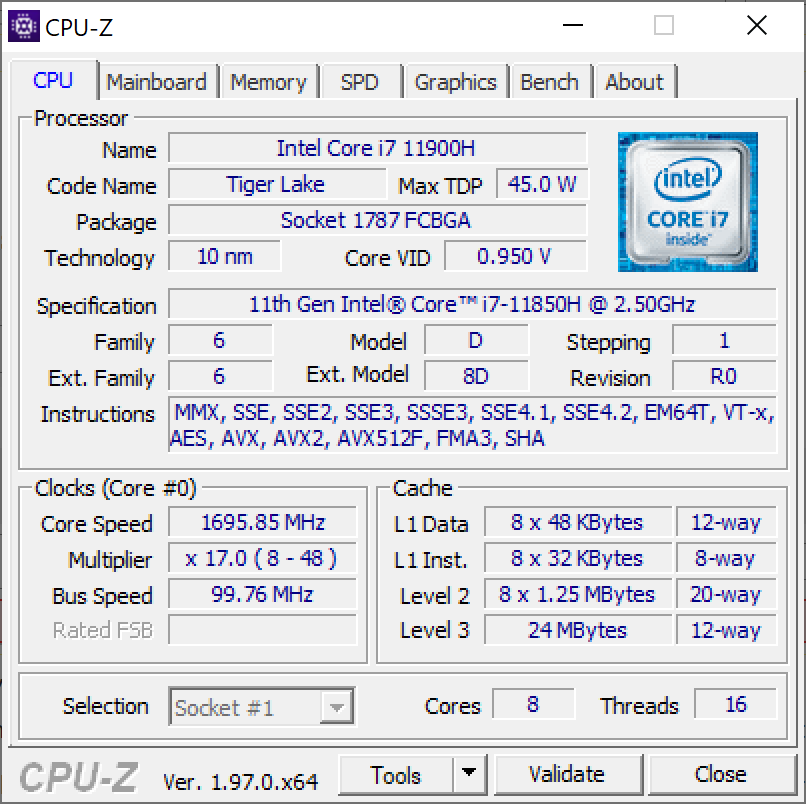
A Lenovo conta com os mais recentes e poderosos componentes que a Intel e a Nvidia oferecem atualmente. No caso da Intel, isto significa processadores da série Tiger-Lake H. As três CPUs Core (i7-11800H, i7-11850H, i9-11950H) têm oito núcleos, o também ofereceu Xeon W-11855M é um núcleo de seis.
A seleção de chips gráficos disponíveis é muito maior. Como uma opção básica absoluta, o P1 G4 está disponível sem uma GPU dedicada, ou seja, somente com os gráficos Intel integrados. Existem sete chips gráficos dedicados;Nvidia T1200, RTX A2000, RTX A3000, RTX A4000, RTX 5000 e, pela primeira vez no P1 GeForce RTX 3070 e RTX 3080.
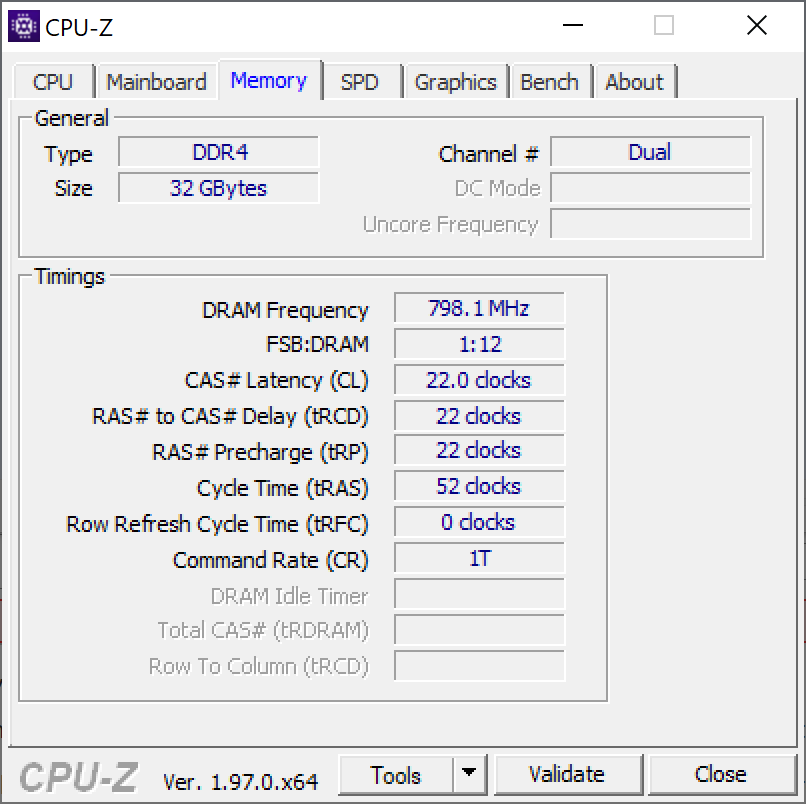
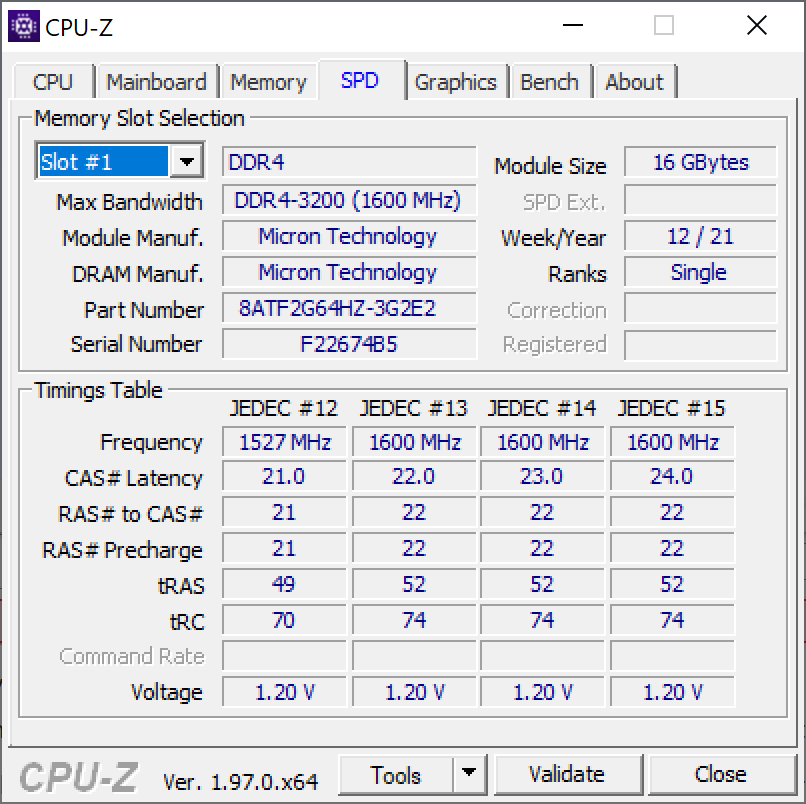
Em qualquer caso, o Lenovo ThinkPad P1 Gen 4 tem dois slots SO-DIMM para um máximo de 64 GB de memória. Isto também pode ser RAM ECC quando o portátil ThinkPad é configurado com Xeon. Dependendo da variante do modelo, o laptop Lenovo possui uma ou duas portas M.2 2280 - as variantes do modelo com GPU Intel, T1200 ou RTX A2000 possuem duas, todas as outras possuem apenas um slot de armazenamento em massa
Processador
O Intel Core i7-11850H é um processador atual da série "Tiger-Lake" com oito núcleos e 16 roscas. Nominalmente, o TDP desta CPU é de 45 watts; no entanto, este consumo não é suficiente para atingir a taxa máxima de 4,8 GHz em todos os núcleos. Com nosso Lista de CPU o processador Intel pode ser comparado com outras CPUs.
Na verdade, o i7-11850H é praticamente tão rápido quanto o i7-11800H, a diferença se deve principalmente ao suporte vPro do 11850H - mas no ThinkPad P1 G4, a diferença entre os dois é grande. A razão não é o processador, mas o sistema de resfriamento: O modelo com GeForce RTX 3070 testado aqui contém o resfriamento por câmara de vapor. Portanto, o processador pode consumir permanentemente cerca de 60 watts sob carga pura de CPU aqui, enquanto que a CPU dos menos equipados ThinkPad P1 Gen 4 com Nvidia T1200 foi limitado a cerca de 40 watts. No teste Cinebench R23 multi-core, o Vapor-Chamber P1 é 27% mais rápido do que o modelo mais barato, está aproximadamente no mesmo nível do HP ZBook Studio 15 G8.
Não pudemos determinar uma limitação de desempenho da CPU no modo de bateria
Cinebench R15 Multi Endurance test
Cinebench R23: Multi Core | Single Core
Cinebench R20: CPU (Multi Core) | CPU (Single Core)
Cinebench R15: CPU Multi 64Bit | CPU Single 64Bit
Blender: v2.79 BMW27 CPU
7-Zip 18.03: 7z b 4 | 7z b 4 -mmt1
Geekbench 5.5: Multi-Core | Single-Core
HWBOT x265 Benchmark v2.2: 4k Preset
LibreOffice : 20 Documents To PDF
R Benchmark 2.5: Overall mean
| CPU Performance rating | |
| Média da turma Workstation | |
| Lenovo ThinkPad P1 G4-20Y4S0KS00 | |
| HP ZBook Studio 15 G8 | |
| Média Intel Core i7-11850H | |
| Huawei MateBook 16 R7 5800H | |
| Apple MacBook Pro 13 Late 2020 M1 Entry (8 / 256 GB) -6! | |
| Dell Precision 5000 5560 -2! | |
| Lenovo ThinkPad P1 G4-20Y30017GE | |
| Apple MacBook Pro 16 2019 i9 5500M | |
| Lenovo ThinkPad X1 Extreme Gen3-20TLS0UV00 | |
| Cinebench R23 / Single Core | |
| Média da turma Workstation (1712 - 2228, n=23, últimos 2 anos) | |
| HP ZBook Studio 15 G8 | |
| Lenovo ThinkPad P1 G4-20Y4S0KS00 | |
| Média Intel Core i7-11850H (1513 - 1552, n=2) | |
| Apple MacBook Pro 13 Late 2020 M1 Entry (8 / 256 GB) | |
| Dell Precision 5000 5560 | |
| Lenovo ThinkPad P1 G4-20Y30017GE | |
| Huawei MateBook 16 R7 5800H | |
| Lenovo ThinkPad X1 Extreme Gen3-20TLS0UV00 | |
| Apple MacBook Pro 16 2019 i9 5500M | |
| Cinebench R20 / CPU (Multi Core) | |
| Média da turma Workstation (5760 - 15043, n=23, últimos 2 anos) | |
| Lenovo ThinkPad P1 G4-20Y4S0KS00 | |
| HP ZBook Studio 15 G8 | |
| Média Intel Core i7-11850H (3826 - 4663, n=2) | |
| Huawei MateBook 16 R7 5800H | |
| Dell Precision 5000 5560 | |
| Lenovo ThinkPad P1 G4-20Y30017GE | |
| Apple MacBook Pro 16 2019 i9 5500M | |
| Apple MacBook Pro 16 2019 i9 5500M | |
| Lenovo ThinkPad X1 Extreme Gen3-20TLS0UV00 | |
| Apple MacBook Pro 13 Late 2020 M1 Entry (8 / 256 GB) | |
| Cinebench R20 / CPU (Single Core) | |
| Média da turma Workstation (671 - 857, n=23, últimos 2 anos) | |
| HP ZBook Studio 15 G8 | |
| Lenovo ThinkPad P1 G4-20Y4S0KS00 | |
| Média Intel Core i7-11850H (583 - 607, n=2) | |
| Dell Precision 5000 5560 | |
| Lenovo ThinkPad P1 G4-20Y30017GE | |
| Huawei MateBook 16 R7 5800H | |
| Lenovo ThinkPad X1 Extreme Gen3-20TLS0UV00 | |
| Apple MacBook Pro 16 2019 i9 5500M | |
| Apple MacBook Pro 16 2019 i9 5500M | |
| Apple MacBook Pro 13 Late 2020 M1 Entry (8 / 256 GB) | |
| Cinebench R15 / CPU Multi 64Bit | |
| Média da turma Workstation (2489 - 5810, n=23, últimos 2 anos) | |
| Huawei MateBook 16 R7 5800H | |
| Lenovo ThinkPad P1 G4-20Y4S0KS00 | |
| HP ZBook Studio 15 G8 | |
| Média Intel Core i7-11850H (1547 - 1988, n=2) | |
| Lenovo ThinkPad P1 G4-20Y30017GE | |
| Dell Precision 5000 5560 | |
| Apple MacBook Pro 16 2019 i9 5500M | |
| Apple MacBook Pro 16 2019 i9 5500M | |
| Lenovo ThinkPad X1 Extreme Gen3-20TLS0UV00 | |
| Apple MacBook Pro 13 Late 2020 M1 Entry (8 / 256 GB) | |
| Cinebench R15 / CPU Single 64Bit | |
| Média da turma Workstation (191.4 - 328, n=23, últimos 2 anos) | |
| HP ZBook Studio 15 G8 | |
| Lenovo ThinkPad P1 G4-20Y4S0KS00 | |
| Média Intel Core i7-11850H (232 - 233, n=2) | |
| Huawei MateBook 16 R7 5800H | |
| Dell Precision 5000 5560 | |
| Lenovo ThinkPad P1 G4-20Y30017GE | |
| Apple MacBook Pro 13 Late 2020 M1 Entry (8 / 256 GB) | |
| Lenovo ThinkPad X1 Extreme Gen3-20TLS0UV00 | |
| Apple MacBook Pro 16 2019 i9 5500M | |
| Apple MacBook Pro 16 2019 i9 5500M | |
| Blender / v2.79 BMW27 CPU | |
| Lenovo ThinkPad X1 Extreme Gen3-20TLS0UV00 | |
| Apple MacBook Pro 16 2019 i9 5500M | |
| Lenovo ThinkPad P1 G4-20Y30017GE | |
| Dell Precision 5000 5560 | |
| Média Intel Core i7-11850H (257 - 313, n=2) | |
| Lenovo ThinkPad P1 G4-20Y4S0KS00 | |
| HP ZBook Studio 15 G8 | |
| Huawei MateBook 16 R7 5800H | |
| Média da turma Workstation (91 - 222, n=23, últimos 2 anos) | |
| 7-Zip 18.03 / 7z b 4 | |
| Média da turma Workstation (60489 - 116969, n=23, últimos 2 anos) | |
| Huawei MateBook 16 R7 5800H | |
| Lenovo ThinkPad P1 G4-20Y4S0KS00 | |
| HP ZBook Studio 15 G8 | |
| Média Intel Core i7-11850H (44890 - 50552, n=2) | |
| Dell Precision 5000 5560 | |
| Apple MacBook Pro 16 2019 i9 5500M | |
| Lenovo ThinkPad P1 G4-20Y30017GE | |
| Lenovo ThinkPad X1 Extreme Gen3-20TLS0UV00 | |
| 7-Zip 18.03 / 7z b 4 -mmt1 | |
| Média da turma Workstation (5126 - 6960, n=23, últimos 2 anos) | |
| HP ZBook Studio 15 G8 | |
| Lenovo ThinkPad P1 G4-20Y4S0KS00 | |
| Média Intel Core i7-11850H (5727 - 5762, n=2) | |
| Dell Precision 5000 5560 | |
| Huawei MateBook 16 R7 5800H | |
| Lenovo ThinkPad P1 G4-20Y30017GE | |
| Lenovo ThinkPad X1 Extreme Gen3-20TLS0UV00 | |
| Apple MacBook Pro 16 2019 i9 5500M | |
| Geekbench 5.5 / Multi-Core | |
| Média da turma Workstation (11542 - 25554, n=23, últimos 2 anos) | |
| Lenovo ThinkPad P1 G4-20Y4S0KS00 | |
| Média Intel Core i7-11850H (9049 - 9451, n=2) | |
| Huawei MateBook 16 R7 5800H | |
| Apple MacBook Pro 13 Late 2020 M1 Entry (8 / 256 GB) | |
| HP ZBook Studio 15 G8 | |
| Apple MacBook Pro 16 2019 i9 5500M | |
| Lenovo ThinkPad P1 G4-20Y30017GE | |
| Lenovo ThinkPad X1 Extreme Gen3-20TLS0UV00 | |
| Geekbench 5.5 / Single-Core | |
| Média da turma Workstation (1783 - 2183, n=23, últimos 2 anos) | |
| Apple MacBook Pro 13 Late 2020 M1 Entry (8 / 256 GB) | |
| HP ZBook Studio 15 G8 | |
| Média Intel Core i7-11850H (1659 - 1686, n=2) | |
| Lenovo ThinkPad P1 G4-20Y4S0KS00 | |
| Lenovo ThinkPad P1 G4-20Y30017GE | |
| Huawei MateBook 16 R7 5800H | |
| Lenovo ThinkPad X1 Extreme Gen3-20TLS0UV00 | |
| Apple MacBook Pro 16 2019 i9 5500M | |
| HWBOT x265 Benchmark v2.2 / 4k Preset | |
| Média da turma Workstation (17.8 - 40.5, n=23, últimos 2 anos) | |
| HP ZBook Studio 15 G8 | |
| Huawei MateBook 16 R7 5800H | |
| Lenovo ThinkPad P1 G4-20Y4S0KS00 | |
| Média Intel Core i7-11850H (12.6 - 14.4, n=2) | |
| Dell Precision 5000 5560 | |
| Lenovo ThinkPad P1 G4-20Y30017GE | |
| Apple MacBook Pro 16 2019 i9 5500M | |
| Lenovo ThinkPad X1 Extreme Gen3-20TLS0UV00 | |
| LibreOffice / 20 Documents To PDF | |
| Apple MacBook Pro 16 2019 i9 5500M | |
| Apple MacBook Pro 16 2019 i9 5500M | |
| Huawei MateBook 16 R7 5800H | |
| Lenovo ThinkPad X1 Extreme Gen3-20TLS0UV00 | |
| Lenovo ThinkPad P1 G4-20Y30017GE | |
| HP ZBook Studio 15 G8 | |
| Dell Precision 5000 5560 | |
| Média da turma Workstation (37.1 - 74.7, n=23, últimos 2 anos) | |
| Média Intel Core i7-11850H (45.8 - 48, n=2) | |
| Lenovo ThinkPad P1 G4-20Y4S0KS00 | |
| R Benchmark 2.5 / Overall mean | |
| Apple MacBook Pro 16 2019 i9 5500M | |
| Apple MacBook Pro 16 2019 i9 5500M | |
| Lenovo ThinkPad X1 Extreme Gen3-20TLS0UV00 | |
| Lenovo ThinkPad P1 G4-20Y30017GE | |
| HP ZBook Studio 15 G8 | |
| Dell Precision 5000 5560 | |
| Média Intel Core i7-11850H (0.541 - 0.543, n=2) | |
| Lenovo ThinkPad P1 G4-20Y4S0KS00 | |
| Huawei MateBook 16 R7 5800H | |
| Média da turma Workstation (0.3825 - 0.603, n=23, últimos 2 anos) | |
* ... menor é melhor
Desempenho do sistema
O Lenovo ThinkPad P1 G4 é muito rápido no uso diário. No PCMark10, está em geral na posição superior no campo de comparação, o que também fala pelo muito bom desempenho do sistema.
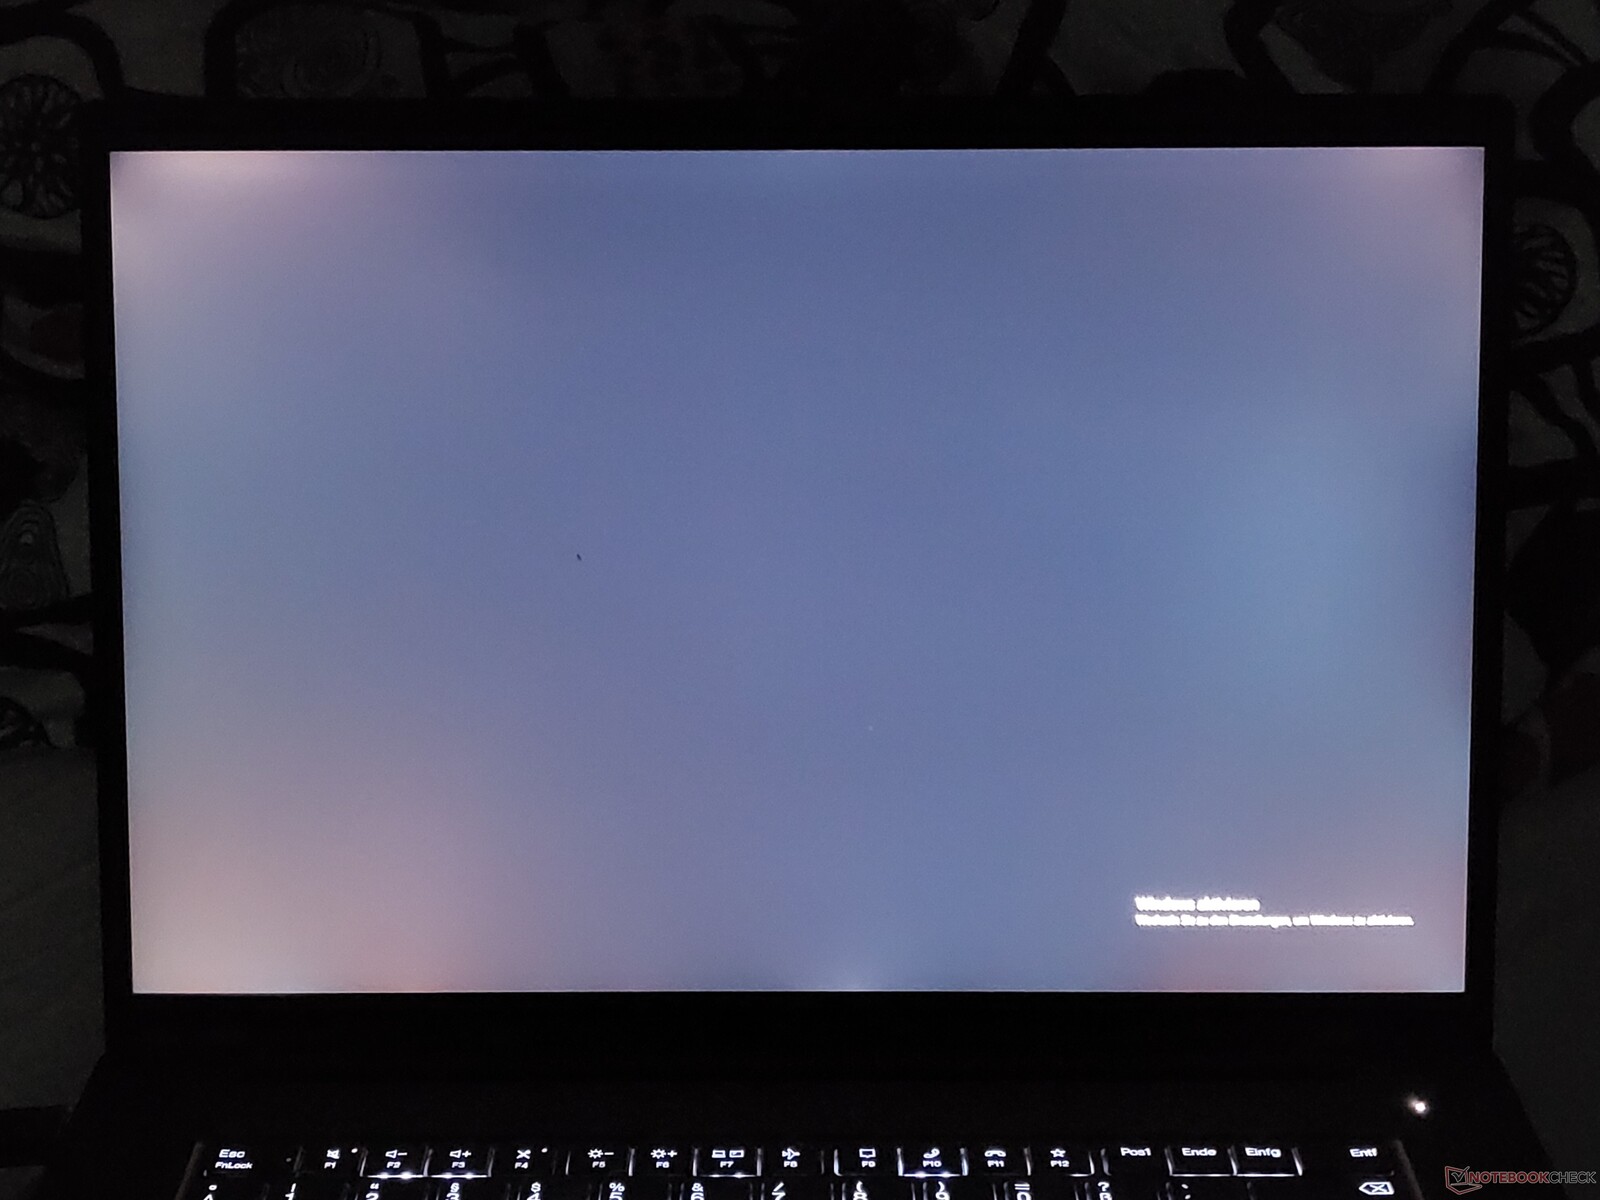
Por melhor que seja o desempenho: Tivemos que reiniciar o laptop ThinkPad com muita freqüência. O motivo foram erros gráficos que às vezes ocorriam após a espera; a imagem inteira foi então coberta com listras pretas e brancas. Como este erro não ocorreu no primeiro modelo de teste, assumimos que se trata de um problema singular deste dispositivo de teste
| PCMark 10 / Score | |
| Média da turma Workstation (6563 - 10409, n=19, últimos 2 anos) | |
| Lenovo ThinkPad P1 G4-20Y4S0KS00 | |
| Média Intel Core i7-11850H, NVIDIA GeForce RTX 3070 Laptop GPU (n=1) | |
| HP ZBook Studio 15 G8 | |
| Dell Precision 5000 5560 | |
| Lenovo ThinkPad P1 G4-20Y30017GE | |
| Apple MacBook Pro 16 2019 i9 5500M | |
| Lenovo ThinkPad X1 Extreme Gen3-20TLS0UV00 | |
| PCMark 10 / Essentials | |
| Lenovo ThinkPad P1 G4-20Y4S0KS00 | |
| Média Intel Core i7-11850H, NVIDIA GeForce RTX 3070 Laptop GPU (n=1) | |
| Dell Precision 5000 5560 | |
| Média da turma Workstation (9622 - 11157, n=19, últimos 2 anos) | |
| HP ZBook Studio 15 G8 | |
| Lenovo ThinkPad P1 G4-20Y30017GE | |
| Lenovo ThinkPad X1 Extreme Gen3-20TLS0UV00 | |
| PCMark 10 / Productivity | |
| Média da turma Workstation (8789 - 20616, n=19, últimos 2 anos) | |
| Dell Precision 5000 5560 | |
| Lenovo ThinkPad P1 G4-20Y4S0KS00 | |
| Média Intel Core i7-11850H, NVIDIA GeForce RTX 3070 Laptop GPU (n=1) | |
| HP ZBook Studio 15 G8 | |
| Lenovo ThinkPad P1 G4-20Y30017GE | |
| Lenovo ThinkPad X1 Extreme Gen3-20TLS0UV00 | |
| PCMark 10 / Digital Content Creation | |
| Média da turma Workstation (8108 - 15631, n=19, últimos 2 anos) | |
| Lenovo ThinkPad P1 G4-20Y4S0KS00 | |
| Média Intel Core i7-11850H, NVIDIA GeForce RTX 3070 Laptop GPU (n=1) | |
| HP ZBook Studio 15 G8 | |
| Dell Precision 5000 5560 | |
| Lenovo ThinkPad P1 G4-20Y30017GE | |
| Lenovo ThinkPad X1 Extreme Gen3-20TLS0UV00 | |
| PCMark 10 Score | 7156 pontos | |
Ajuda | ||
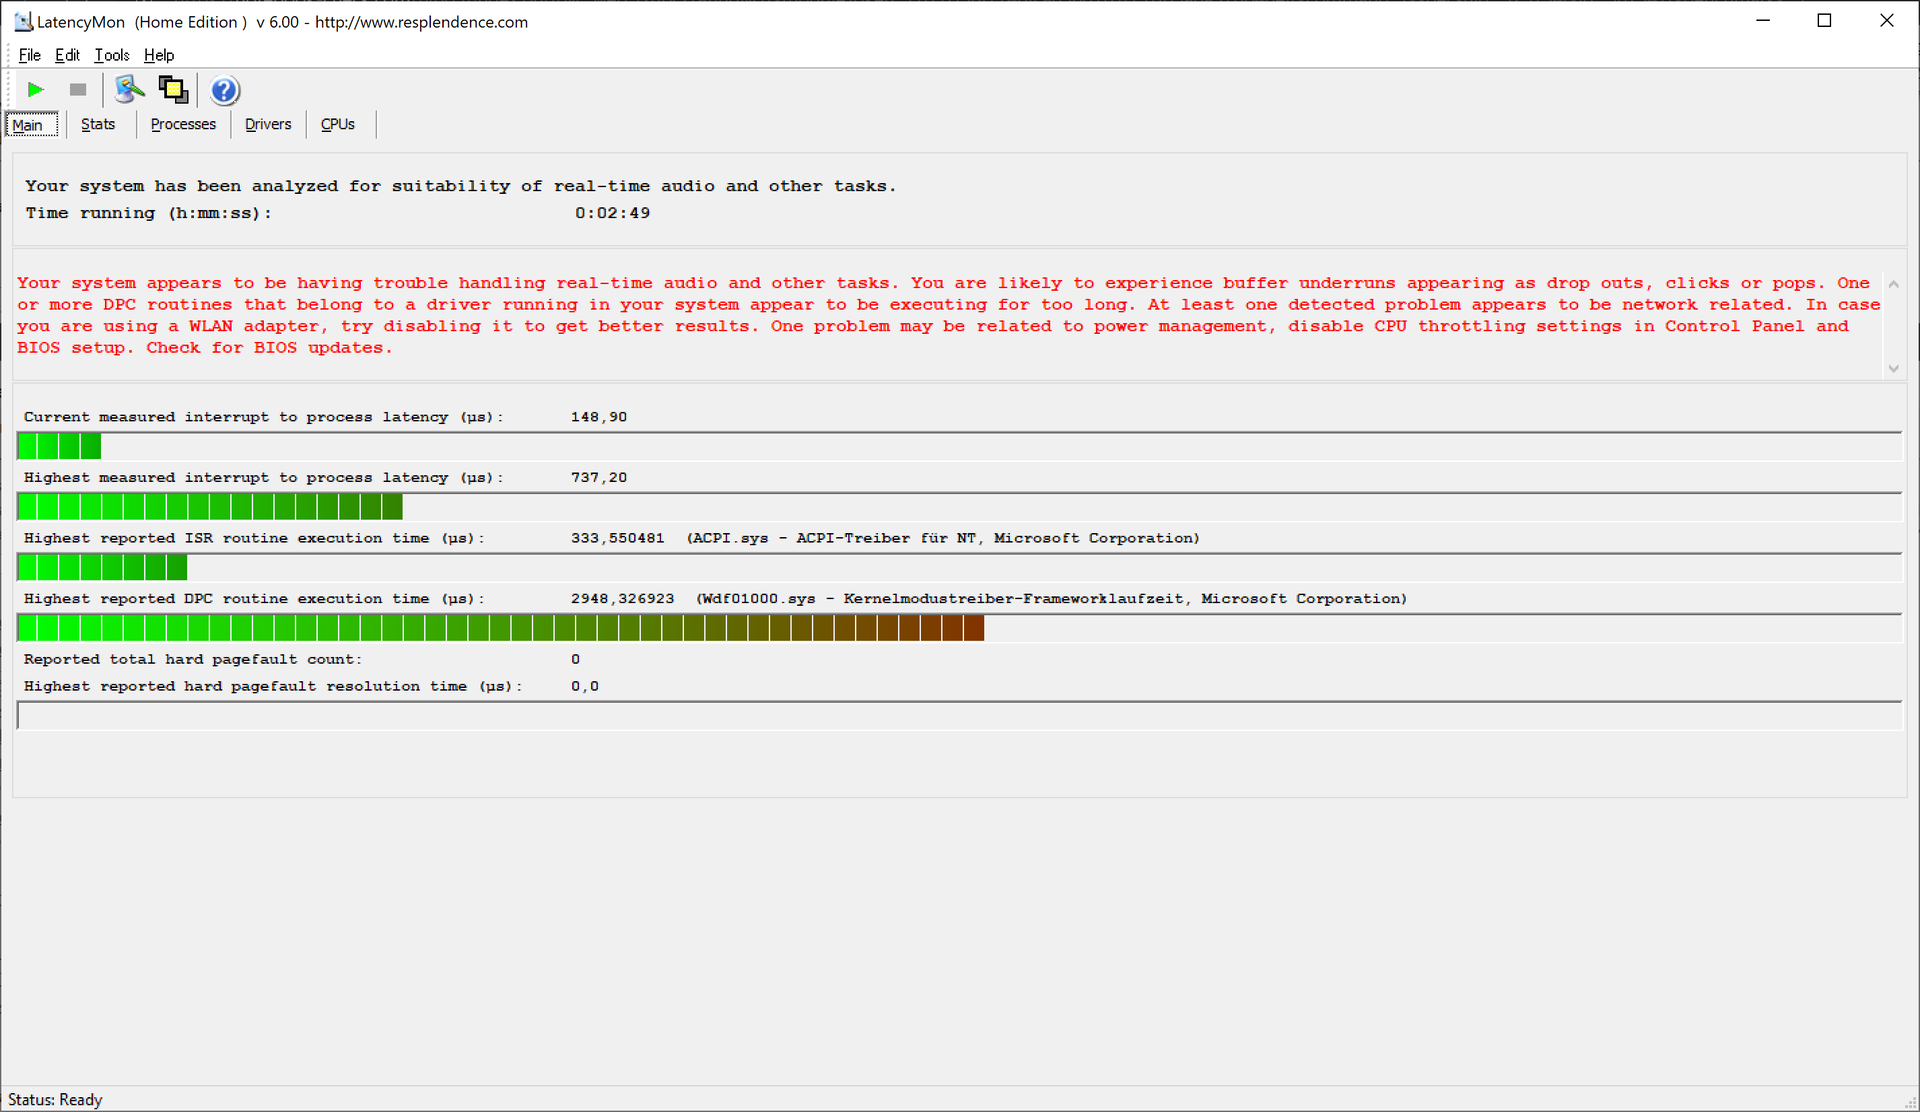
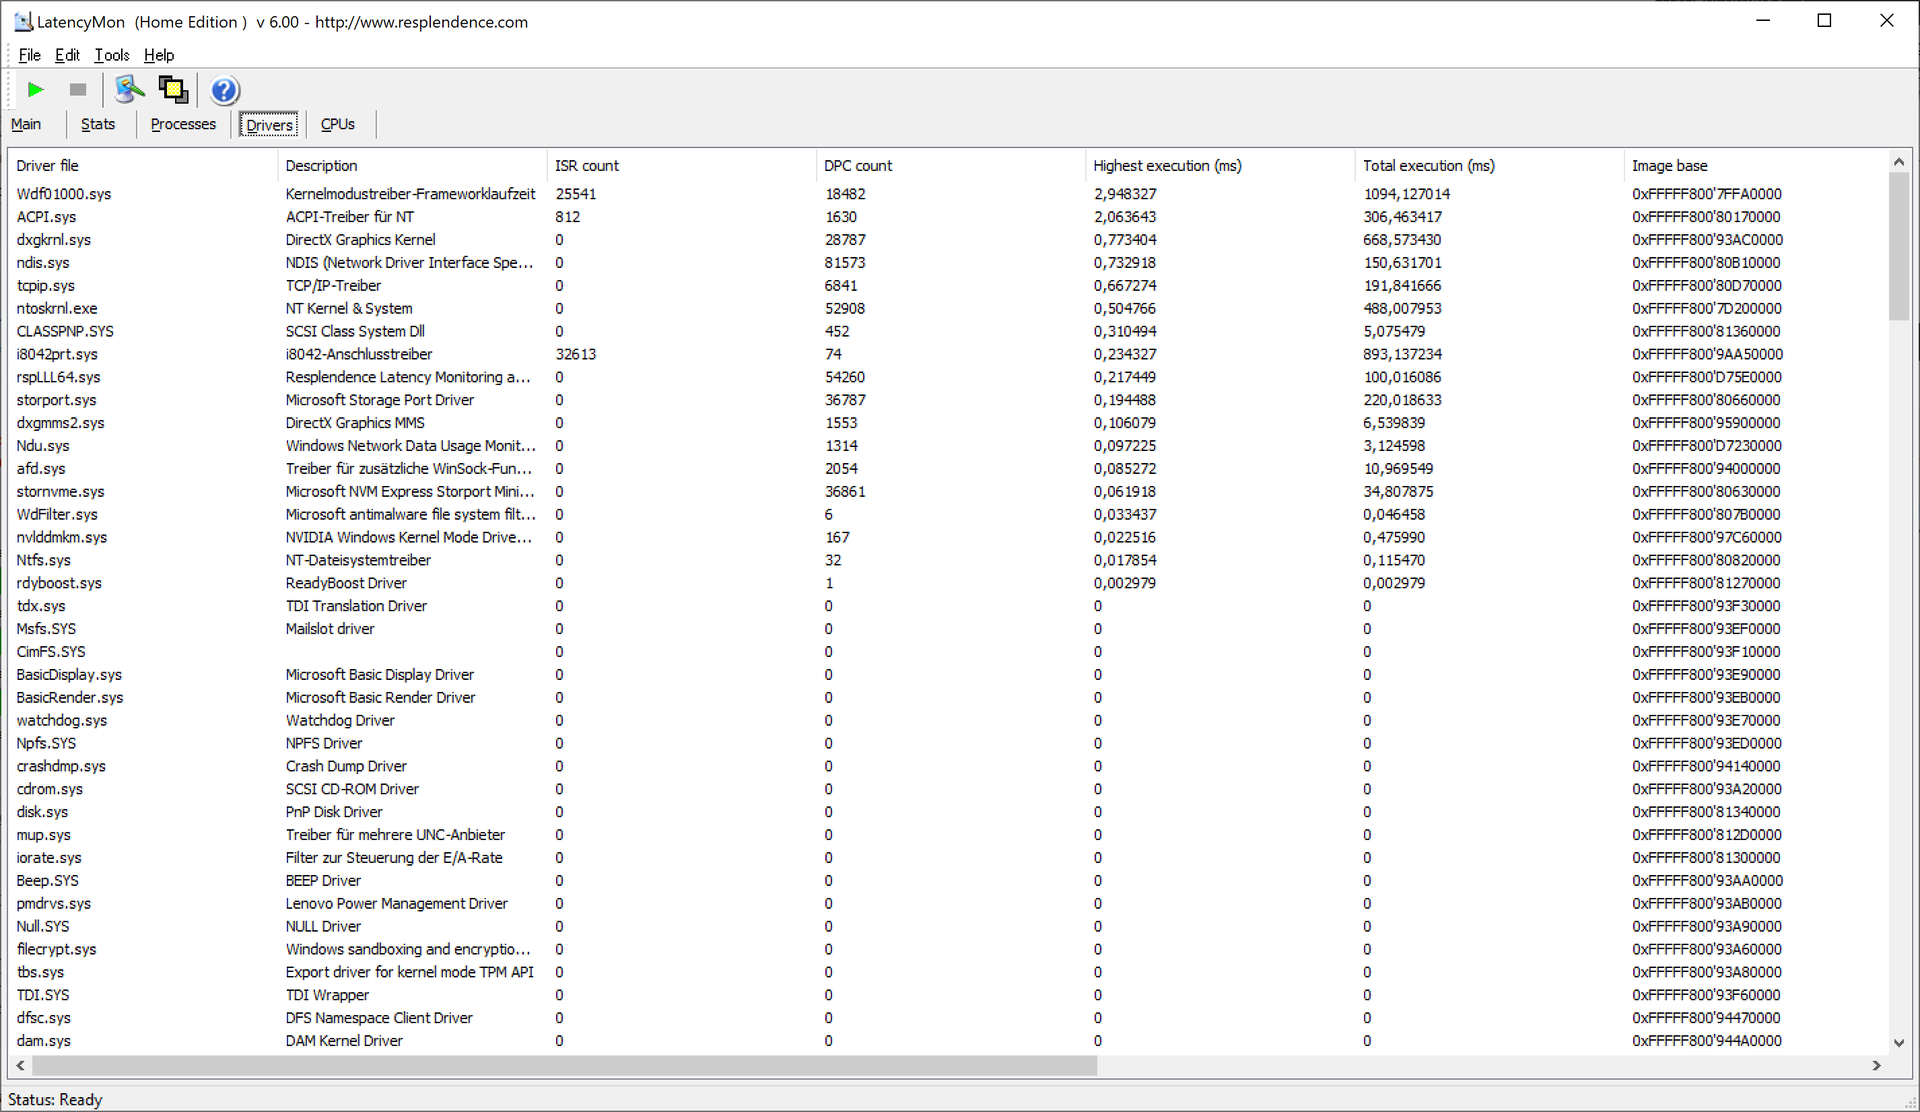
Latências DPC
Trabalhar com arquivos de áudio e vídeo é um dos usos possíveis de um laptop como o ThinkPad P1 Gen 4. Aqui, as latências do DPC podem causar problemas porque as altas taxas também levaram a desistências em nosso teste de vídeo no YouTube
| DPC Latencies / LatencyMon - interrupt to process latency (max), Web, Youtube, Prime95 | |
| Lenovo ThinkPad P1 G4-20Y30017GE | |
| HP ZBook Studio 15 G8 | |
| Dell Precision 5000 5560 | |
| Lenovo ThinkPad P1 G4-20Y4S0KS00 | |
| Lenovo ThinkPad X1 Extreme Gen3-20TLS0UV00 | |
* ... menor é melhor
Armazenamento em massa
Nesta configuração, o Lenovo ThinkPad P1 G4 tem apenas um slot M.2-2280. Pelo menos este está muito bem equipado com um Samsung PM9A1 de 1 TB. Este SSD NMVe PCIe 4.0 tem um desempenho extremamente bom em nossos benchmarks
* ... menor é melhor

Continuous load read: DiskSpd Read Loop, Queue Depth 8
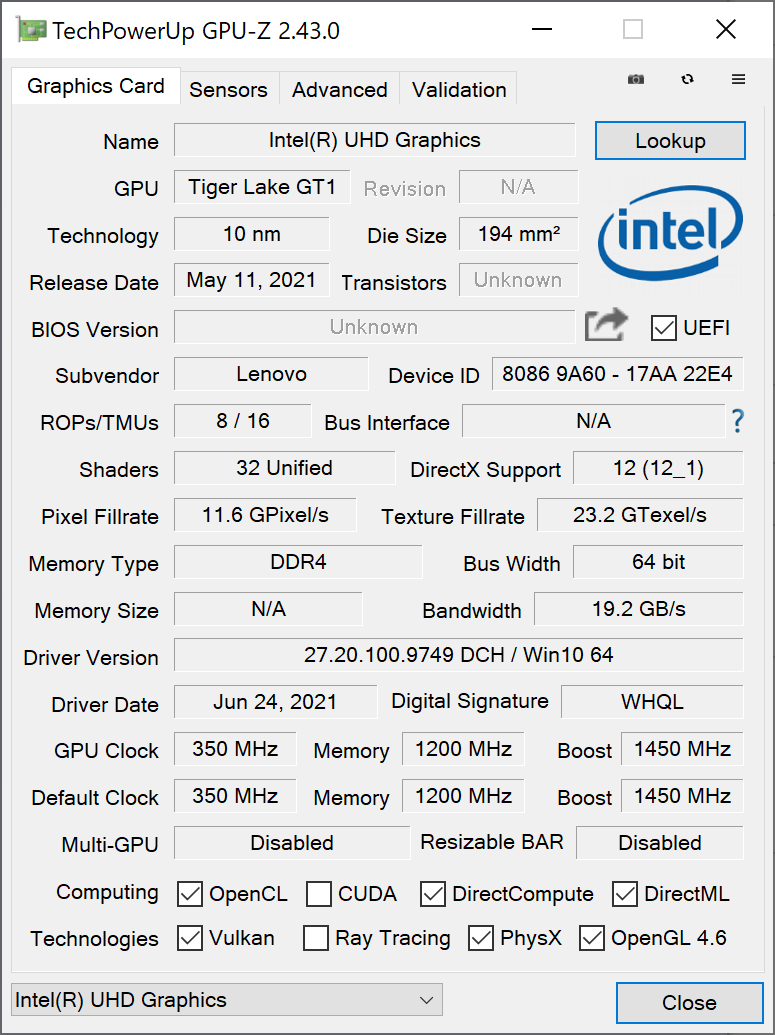
Desempenho da GPU
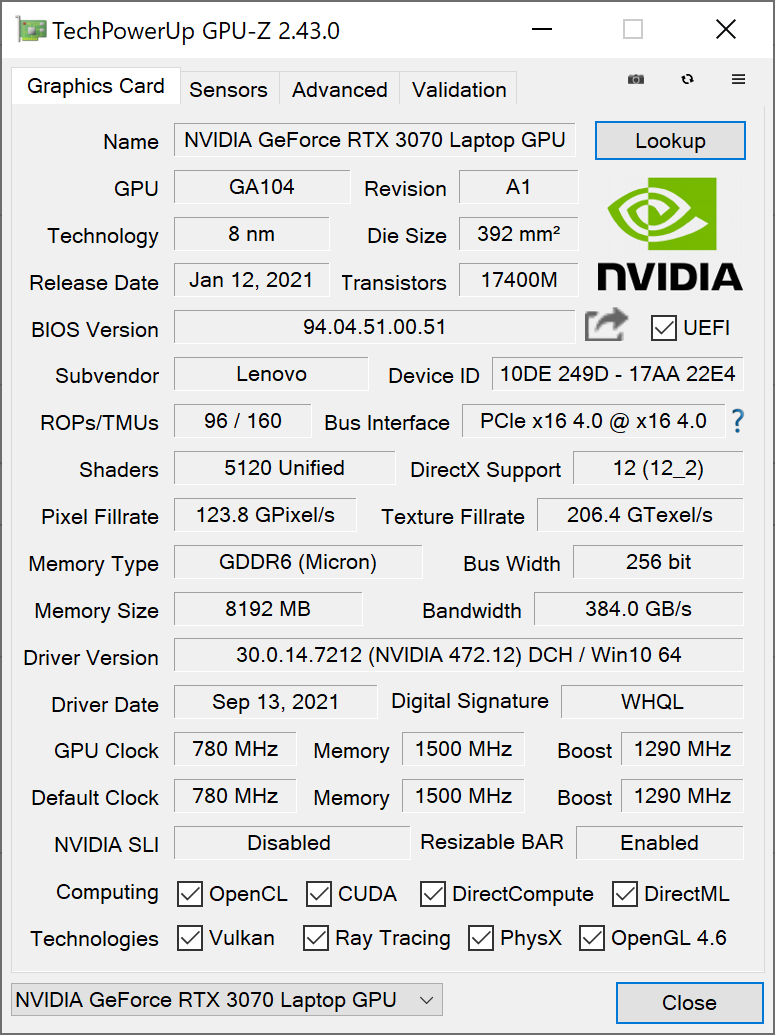
O Nvidia GeForce RTX 3070 é uma das GPUs móveis mais poderosas da atual geração "Ampere" da Nvidia. No caso do ThinkPad P1 G4 da Lenovo, no entanto, as 5120 unidades shader estão longe de seu desempenho máximo porque a Lenovo configura a GPU para um TGP de 80 watts - no passado, esta variante teria sido chamada de "Max-Q".
Assim, não é de se admirar que o RTX 3070 seja em média 10% mais rápido em todos os laptops do que aqui no Lenovo ThinkPad P1 2021. No entanto, a diferença para o ThinkPad X1 Extreme G3 com GeForce GTX 1650 Ti Max-Q é enorme (+148%), mesmo comparado com a variante Nvidia T1200 do P1, o GeForce RTX 3070 é mais do dobro da velocidade nos 3DMark benchmarks (+118%). Neste caso, o GeForce certamente vale a pena. A conclusão para o conjunto de benchmarks profissionais SPECviewperf é mais mista: aqui, o GeForce-P1 atinge em parte bons, mas também em parte maus resultados. Um ThinkPad P1 com uma GPU Nvidia certificada pelo ISV deve ser escolhido para CAD.
O desempenho da GPU é claramente limitado no modo de bateria. O resultado do 3DMark 11 é cerca de 56% menor sem uma fonte de alimentação (13.508 pontos na pontuação da GPU 3DMark 11)
| 3DMark Performance rating - Percent | |
| Média da turma Workstation -1! | |
| Média NVIDIA GeForce RTX 3070 Laptop GPU | |
| Lenovo ThinkPad P1 G4-20Y4S0KS00 | |
| HP ZBook Studio 15 G8 -16! | |
| Dell Precision 5000 5560 | |
| Lenovo ThinkPad P1 G4-20Y30017GE -8! | |
| Apple MacBook Pro 16 2019 i9 5500M -16! | |
| Lenovo ThinkPad X1 Extreme Gen3-20TLS0UV00 -25! | |
| 3DMark 11 Performance | 24753 pontos | |
| 3DMark Fire Strike Score | 17860 pontos | |
| 3DMark Time Spy Score | 8430 pontos | |
Ajuda | ||
Desempenho do jogo
O Lenovo ThinkPad P1 G4 não é explicitamente um laptop para jogos. Ao mesmo tempo, o Nvidia GeForce 3070 permite que o laptop Lenovo seja usado para jogos. Mesmo para jogos em 4K, a GPU pode ser suficientemente rápida, dependendo do título. Em nosso Witcher 3 o ThinkPad P1 2021 também pode chamar seu desempenho de forma consistente - com pequenas flutuações
| The Witcher 3 - 1920x1080 Ultra Graphics & Postprocessing (HBAO+) | |
| Média NVIDIA GeForce RTX 3070 Laptop GPU (34.9 - 109, n=52) | |
| Média da turma Workstation (n=1últimos 2 anos) | |
| Lenovo ThinkPad P1 G4-20Y4S0KS00 | |
| HP ZBook Studio 15 G8 | |
| Dell Precision 5000 5560 | |
| Apple MacBook Pro 16 2019 i9 5500M | |
| Lenovo ThinkPad P1 G4-20Y30017GE | |
| Lenovo ThinkPad X1 Extreme Gen3-20TLS0UV00 | |
Witcher 3 FPS-Diagram
| baixo | média | alto | ultra | QHD | 4K | |
|---|---|---|---|---|---|---|
| GTA V (2015) | 185 | 179 | 164 | 88.1 | 74.5 | 74.3 |
| The Witcher 3 (2015) | 345 | 243 | 158 | 86.8 | 56.5 | |
| Dota 2 Reborn (2015) | 171 | 148 | 124 | 106 | 109 | |
| X-Plane 11.11 (2018) | 105 | 102 | 76.8 | 52.4 | ||
| Strange Brigade (2018) | 408 | 206 | 171 | 151 | 113 | 61.1 |
Emissões: Componentes fortes tornam o ThinkPad P1 G4 quente
Ruído do ventilador
A Lenovo tradicionalmente exerce contenção quando se trata do volume do ventilador do ThinkPads. Entretanto, isto não se aplica ao modelo de estação de trabalho ThinkPad P1. Os dois ventiladores funcionam a um máximo de 47,4 dB(a), o que é claramente audível. Pelo menos este nem sempre é o caso, há também um nível inferior a 38,6 dB(a) e o resfriamento ativo muitas vezes permanece desativado em modo inativo.
Infelizmente, a lamentação da bobina ainda é um problema muito freqüente, mas o Lenovo ThinkPad P1 Gen 4 não é afetado por isto
| Lenovo ThinkPad P1 G4-20Y4S0KS00 GeForce RTX 3070 Laptop GPU, i7-11850H, Samsung PM9A1 MZVL21T0HCLR | Lenovo ThinkPad P1 G4-20Y30017GE T1200 Laptop GPU, i7-11800H, Samsung PM9A1 MZVL2512HCJQ | Dell Precision 5000 5560 RTX A2000 Laptop GPU, i7-11850H, Samsung PM9A1 MZVL22T0HBLB | Apple MacBook Pro 16 2019 i9 5500M Radeon Pro 5500M, i9-9880H, Apple SSD AP1024 7171 | HP ZBook Studio 15 G8 GeForce RTX 3070 Laptop GPU, i9-11950H, Samsung PM981a MZVLB2T0HALB | Lenovo ThinkPad X1 Extreme Gen3-20TLS0UV00 GeForce GTX 1650 Ti Max-Q, i7-10750H, Toshiba XG6 KXG6AZNV1T02 | |
|---|---|---|---|---|---|---|
| Noise | -3% | 12% | -12% | -2% | -9% | |
| desligado / ambiente * (dB) | 23.8 | 24.3 -2% | 23.4 2% | 29.8 -25% | 23.5 1% | 29.5 -24% |
| Idle Minimum * (dB) | 23.8 | 24.3 -2% | 23.6 1% | 29.9 -26% | 25.3 -6% | 29.5 -24% |
| Idle Average * (dB) | 23.8 | 24.3 -2% | 23.6 1% | 29.9 -26% | 25.3 -6% | 29.5 -24% |
| Idle Maximum * (dB) | 28.3 | 26.6 6% | 23.6 17% | 29.9 -6% | 25.3 11% | 29.9 -6% |
| Load Average * (dB) | 38.6 | 46.8 -21% | 25.8 33% | 43 -11% | 41.2 -7% | 44.2 -15% |
| Witcher 3 ultra * (dB) | 47.4 | 46.8 1% | 40.1 15% | 45.4 4% | 49.4 -4% | 36.1 24% |
| Load Maximum * (dB) | 47.4 | 46.8 1% | 41.4 13% | 46.1 3% | 49.4 -4% | 44.2 7% |
* ... menor é melhor
Barulho
| Ocioso |
| 23.8 / 23.8 / 28.3 dB |
| Carga |
| 38.6 / 47.4 dB |
 | ||
30 dB silencioso 40 dB(A) audível 50 dB(A) ruidosamente alto |
||
min: | ||
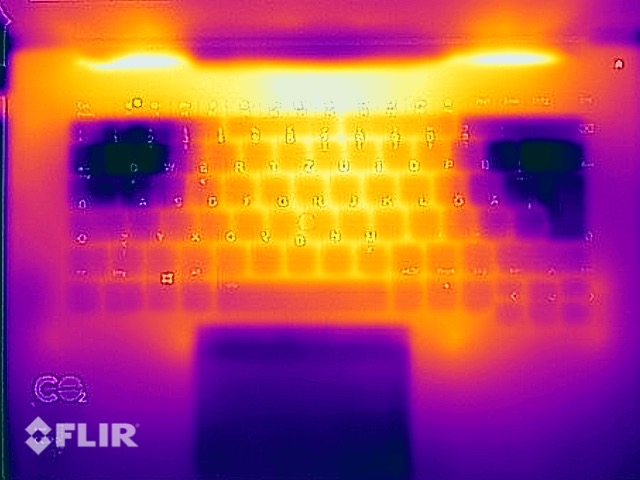
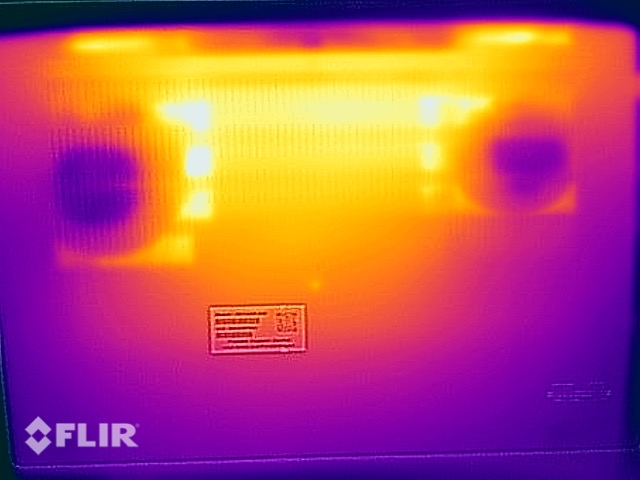
Temperatura
A Lenovo projetou o ThinkPad P1 Gen 4 no limite térmico. Como esperado, o notebook Lenovo permanece frio em modo inativo, mas o aquecimento sob carga mostra claramente: Os limites do que é possível com as atuais CPUs Intel e GPUs Nvidia estão esgotados. Com 53,8 graus Celsius (~129 graus Fahrenheit) na parte inferior, não é tanto a temperatura máxima como o aquecimento uniforme da caixa que mostra isto. Mesmo o apoio de palma aquece visivelmente até 40 graus Celsius (104graus Fahrenheit), e as temperaturas são apenas ligeiramente mais baixas no Witcher 3 teste
(-) A temperatura máxima no lado superior é 51 °C / 124 F, em comparação com a média de 38.2 °C / 101 F , variando de 22.2 a 69.8 °C para a classe Workstation.
(-) A parte inferior aquece até um máximo de 53.5 °C / 128 F, em comparação com a média de 41.1 °C / 106 F
(+) Em uso inativo, a temperatura média para o lado superior é 26.7 °C / 80 F, em comparação com a média do dispositivo de 32 °C / ### class_avg_f### F.
(-) Jogando The Witcher 3, a temperatura média para o lado superior é 43 °C / 109 F, em comparação com a média do dispositivo de 32 °C / ## #class_avg_f### F.
(-) Os apoios para as mãos e o touchpad podem ficar muito quentes ao toque, com um máximo de 40 °C / 104 F.
(-) A temperatura média da área do apoio para as mãos de dispositivos semelhantes foi 27.8 °C / 82 F (-12.2 °C / -22 F).
Teste de estresse
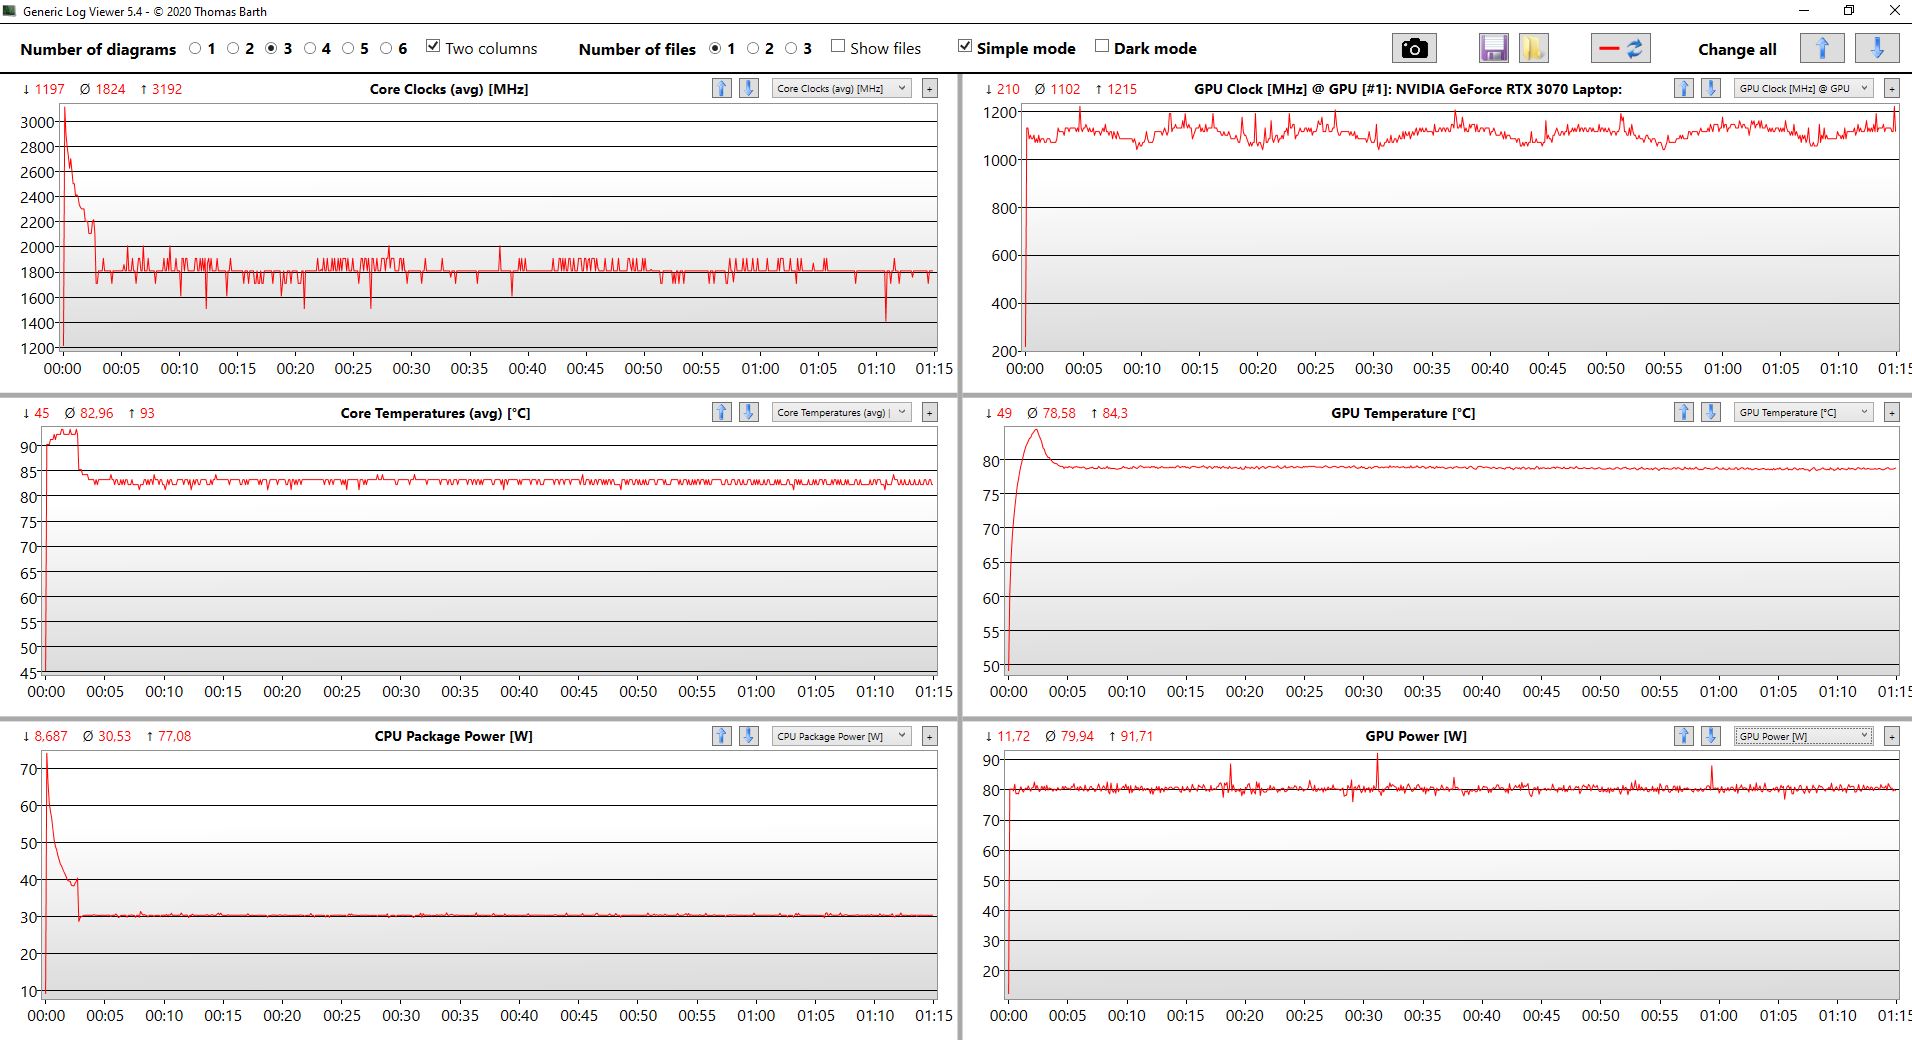
Com as medições de temperatura, já estava claro que a Lenovo não pode executar seu ThinkPad com desempenho desenfreado no teste de estresse. Na verdade, o processador é rapidamente limitado a 30 watts quando a GPU e a CPU estão completamente carregadas ao mesmo tempo, enquanto o desempenho da GPU permanece estável em 80 watts.
O estrangulamento claro no teste de estresse do cenário extremo não deve ser refletido no uso diário, porém, porque o 3DMark 11 após o teste de estresse produziu um resultado normal.
Orador
Uma análise da qualidade do orador pode ser encontrada na revisão do modelo de QHD do Lenovo ThinkPad P1 Gen 4.
Lenovo ThinkPad P1 G4-20Y30017GE análise de áudio
(+) | os alto-falantes podem tocar relativamente alto (###valor### dB)
Graves 100 - 315Hz
(±) | graves reduzidos - em média 12.2% menor que a mediana
(±) | a linearidade dos graves é média (9.8% delta para a frequência anterior)
Médios 400 - 2.000 Hz
(+) | médios equilibrados - apenas 3.4% longe da mediana
(+) | médios são lineares (3.4% delta para frequência anterior)
Altos 2 - 16 kHz
(+) | agudos equilibrados - apenas 2.9% longe da mediana
(+) | os máximos são lineares (5% delta da frequência anterior)
Geral 100 - 16.000 Hz
(+) | o som geral é linear (11.8% diferença em relação à mediana)
Comparado com a mesma classe
» 16% de todos os dispositivos testados nesta classe foram melhores, 3% semelhantes, 81% piores
» O melhor teve um delta de 7%, a média foi 17%, o pior foi 35%
Comparado com todos os dispositivos testados
» 9% de todos os dispositivos testados foram melhores, 3% semelhantes, 89% piores
» O melhor teve um delta de 4%, a média foi 23%, o pior foi 134%
Apple MacBook Pro 16 2019 i9 5500M análise de áudio
(+) | os alto-falantes podem tocar relativamente alto (###valor### dB)
Graves 100 - 315Hz
(+) | bons graves - apenas 2.3% longe da mediana
(+) | o baixo é linear (5% delta para a frequência anterior)
Médios 400 - 2.000 Hz
(+) | médios equilibrados - apenas 2.7% longe da mediana
(+) | médios são lineares (3.4% delta para frequência anterior)
Altos 2 - 16 kHz
(+) | agudos equilibrados - apenas 2.1% longe da mediana
(+) | os máximos são lineares (2.6% delta da frequência anterior)
Geral 100 - 16.000 Hz
(+) | o som geral é linear (6.9% diferença em relação à mediana)
Comparado com a mesma classe
» 5% de todos os dispositivos testados nesta classe foram melhores, 1% semelhantes, 94% piores
» O melhor teve um delta de 5%, a média foi 17%, o pior foi 45%
Comparado com todos os dispositivos testados
» 1% de todos os dispositivos testados foram melhores, 0% semelhantes, 99% piores
» O melhor teve um delta de 4%, a média foi 23%, o pior foi 134%
Consumo de energia: O LCD WQUXGA consome a bateria do laptop Lenovo
Curiosamente, o consumo mínimo desta versão do ThinkPad P1 Gen 4 dificilmente é maior do que o já testado com um LCD QHD. A diferença é acentuada na mediana de ociosidade com o brilho maximizado do LCD: O consumo de 20,2 watts é extremamente alto aqui. Nenhum dos outros postos de trabalho ou laptops multimídia tem um consumo comparável a esta taxa.
Esta variante do ThinkPad P1 2021 da Lenovo é enviada com uma fonte de alimentação de 230 watts. Isto não seria sequer necessário; uma fonte de alimentação de 170 watts também seria suficiente para o consumo máximo
| desligado | |
| Ocioso | |
| Carga |
|
Key:
min: | |
| Lenovo ThinkPad P1 G4-20Y4S0KS00 i7-11850H, GeForce RTX 3070 Laptop GPU, Samsung PM9A1 MZVL21T0HCLR, IPS LED, 3840x2400, 16" | Lenovo ThinkPad P1 G4-20Y30017GE i7-11800H, T1200 Laptop GPU, Samsung PM9A1 MZVL2512HCJQ, IPS, 2560x1600, 16" | Dell Precision 5000 5560 i7-11850H, RTX A2000 Laptop GPU, Samsung PM9A1 MZVL22T0HBLB, IPS, 3840x2400, 15.6" | Apple MacBook Pro 16 2019 i9 5500M i9-9880H, Radeon Pro 5500M, Apple SSD AP1024 7171, IPS, 3072x1920, 16" | HP ZBook Studio 15 G8 i9-11950H, GeForce RTX 3070 Laptop GPU, Samsung PM981a MZVLB2T0HALB, OLED, 3840x2160, 15.6" | Lenovo ThinkPad X1 Extreme Gen3-20TLS0UV00 i7-10750H, GeForce GTX 1650 Ti Max-Q, Toshiba XG6 KXG6AZNV1T02, IPS, 1920x1080, 15.6" | Média NVIDIA GeForce RTX 3070 Laptop GPU | Média da turma Workstation | |
|---|---|---|---|---|---|---|---|---|
| Power Consumption | 23% | 17% | 31% | -16% | 32% | -36% | 5% | |
| Idle Minimum * (Watt) | 8.1 | 7.7 5% | 6.2 23% | 3.7 54% | 11 -36% | 5 38% | 15.6 ? -93% | 9.11 ? -12% |
| Idle Average * (Watt) | 20.2 | 11.8 42% | 13.9 31% | 12.1 40% | 18.8 7% | 9 55% | 20.1 ? -0% | 13.8 ? 32% |
| Idle Maximum * (Watt) | 21.9 | 12.4 43% | 23.8 -9% | 17 22% | 31.7 -45% | 12.2 44% | 29.4 ? -34% | 17.9 ? 18% |
| Load Average * (Watt) | 88.2 | 94.6 -7% | 95.7 -9% | 91.5 -4% | 105.2 -19% | 94.4 -7% | 110.8 ? -26% | 96 ? -9% |
| Witcher 3 ultra * (Watt) | 149 | 99.6 33% | 87 42% | 103 31% | 148 1% | 89 40% | ||
| Load Maximum * (Watt) | 170.6 | 134 21% | 132.6 22% | 102.3 40% | 171.8 -1% | 133.9 22% | 214 ? -25% | 180.3 ? -6% |
* ... menor é melhor
Energy consumption Witcher 3 / Stress test
Duração da bateria
A bateria maior, comparada à geração anterior, com capacidade de 90 horas watt, é esvaziada muito rapidamente pelo consumo da tela de 4K. O Lenovo ThinkPad P1 G4 dura cerca de sete horas no teste Wi-Fi quando a tela é ajustada para 150 cd/m². No brilho máximo, a duração da bateria diminui para quatro horas. O modelo com um monitor QHD é claramente mais adequado para uso móvel - afinal, o ThinkPad 4K consegue vencer os rivais diretos da estação de trabalho Dell Precision 5560 e HP ZBook Studio 15 G8
| Lenovo ThinkPad P1 G4-20Y4S0KS00 i7-11850H, GeForce RTX 3070 Laptop GPU, 90 Wh | Lenovo ThinkPad P1 G4-20Y30017GE i7-11800H, T1200 Laptop GPU, 90 Wh | Dell Precision 5000 5560 i7-11850H, RTX A2000 Laptop GPU, 86 Wh | Apple MacBook Pro 16 2019 i9 5500M i9-9880H, Radeon Pro 5500M, 99.8 Wh | HP ZBook Studio 15 G8 i9-11950H, GeForce RTX 3070 Laptop GPU, 83 Wh | Lenovo ThinkPad X1 Extreme Gen3-20TLS0UV00 i7-10750H, GeForce GTX 1650 Ti Max-Q, 80 Wh | Média da turma Workstation | |
|---|---|---|---|---|---|---|---|
| Duração da bateria | 26% | 20% | 30% | 20% | 51% | 27% | |
| H.264 (h) | 7.2 | 9 25% | 9.7 35% | 12.2 69% | 10.1 ? 40% | ||
| WiFi v1.3 (h) | 7 | 9 29% | 6.3 -10% | 12 71% | 6.2 -11% | 11.6 66% | 8.55 ? 22% |
| Load (h) | 1.2 | 1.5 25% | 1.8 50% | 1 -17% | 1.8 50% | 1.4 17% | 1.441 ? 20% |
| Witcher 3 ultra (h) | 0.9 |
Pro
Contra
Veredicto: ThinkPad P1 Gen 4 melhor com sistema de resfriamento mais forte

Uma vez com Vapor-Chamber, uma vez sem (ThinkPad P1 com T1200 aqui em revisão): O Lenovo ThinkPad P1 G4 passou por nosso curso de teste duas vezes. Rapidamente se torna claro qual das duas versões é melhor: a que tem Vapor-Chamber.
Hoje em dia, a boa refrigeração é provavelmente a característica mais importante de todas para laptops com processadores Intel série H. O modelo com Vapor-Chamber testado aqui dá à CPU um consumo significativamente maior do que seu modelo irmão com resfriamento convencional. A diferença de desempenho é significativa, e é por isso que a conclusão tem que ser baseada apenas nesta diferença: Se Lenovo ThinkPad P1 Gen 4, então com Vapor-Chamber - mesmo que as opções de um segundo M.2-2280 SSD ou um modem WWAN sejam perdidas. Somente as variantes com GeForce RTX 3070, RTX 3080, bem como Nvidia RTX A3000, A4000 e A5000 incluem o melhor sistema de resfriamento.
Nossa conclusão é menos clara em relação ao segundo maior diferenciador do dispositivo testado: O LCD WQUXGA oferece o que promete em termos de qualidade; ele é um dos melhores displays LC de todos os laptops atuais - mas às custas da vida útil da bateria. Dependendo das prioridades do usuário, o display QHD pode ser a melhor escolha se for desejada uma operação prolongada sem uma fonte de alimentação conectada.
Vapor-Chamber, sim, por favor: O sistema de resfriamento deste Lenovo ThinkPad P1 G4 é muito melhor do que o da variante de tubo de calor.
Em geral, o Lenovo ThinkPad P1 G4 ganha claramente nossa recomendação como um laptop de 16 polegadas de topo de linha. O preço é correspondentemente íngreme, e se o comprador estiver disposto a gastar tanto dinheiro, deve ser definitivamente o modelo Vapor-Chamber.
Os rivais diretos da estação de trabalho são, acima de tudo, os Dell Precision 5560 e o HP ZBook Studio 15 G8 onde ambos têm fraquezas - o mais compacto Precision tem menos portas e oferece menos desempenho, enquanto 16:9 e RAM soldada não falam necessariamente pelo ZBook. Fora da esfera Windows, o Apple MacBook Pro 16 deve ser mencionado, pelo que uma comparação com o novo modelo com M1 Max será de particular interesse aqui.
Preço e disponibilidade
O ThinkPad P1 2021 testado da Lenovo custa 2.850 Euros (~$3.266)em Campuspoint. É um modelo especial que está disponível exclusivamente no Programa Campus da Lenovo para estudantes, estagiários e outras pessoas elegíveis. A mesma configuração custa 3.982 Euros (~$4.564) na Loja da Lenovo
Lenovo ThinkPad P1 G4-20Y4S0KS00
- 10/25/2021 v7 (old)
Benjamin Herzig
Price comparison
