Acer Predator Orion 3000 PC desktop com Core i7-12700F e RTX 3070 em revisão
")
A série Predator da Acer existe há muitos anos e é dirigida principalmente aos jogadores. Há vários modelos com esta designação, tanto para laptops como para PCs desktop. Com o atual Predator Orion 3000, o fabricante não apenas atualiza o produto, mas também usa um novo case em comparação com a geração mais antiga.
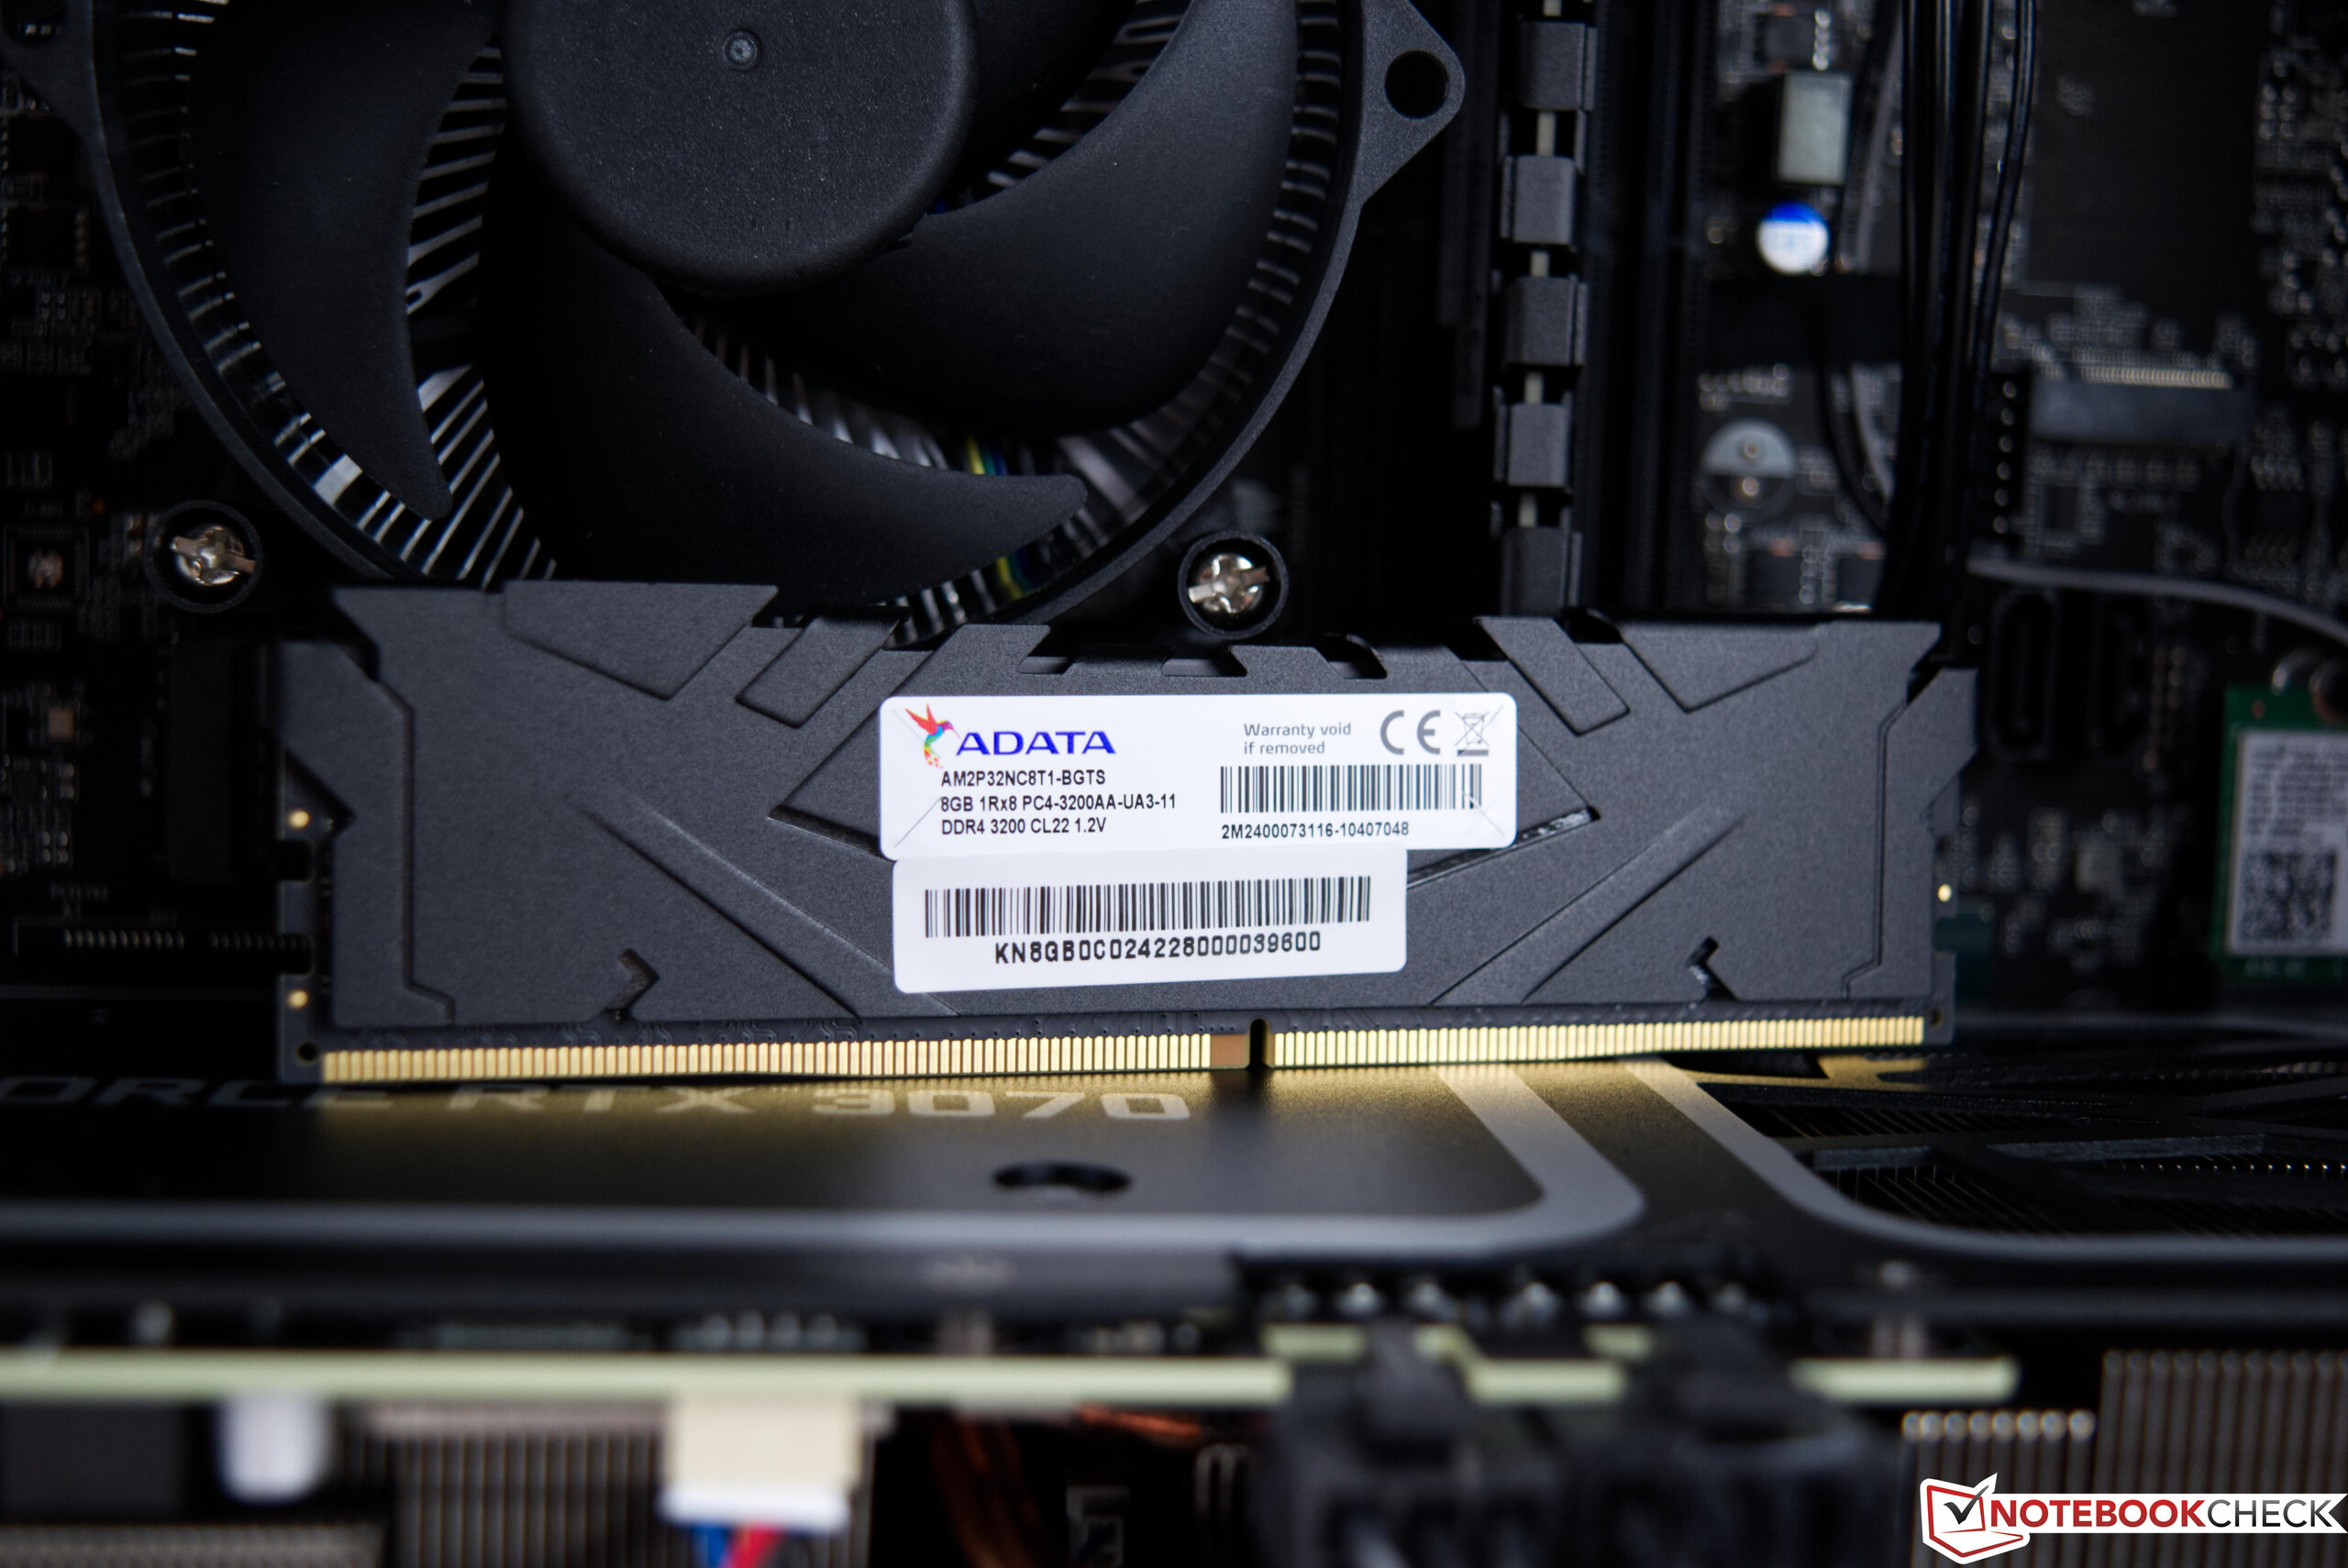
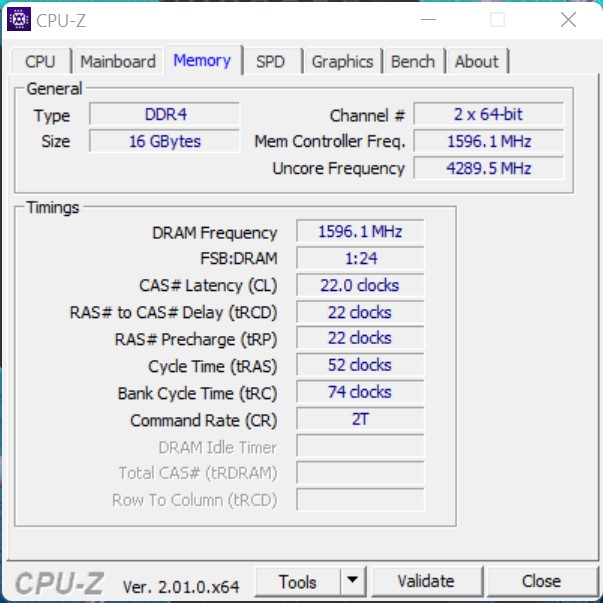
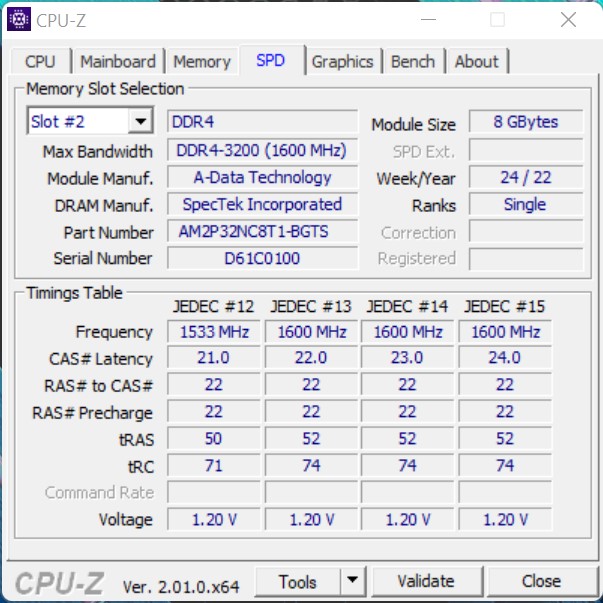
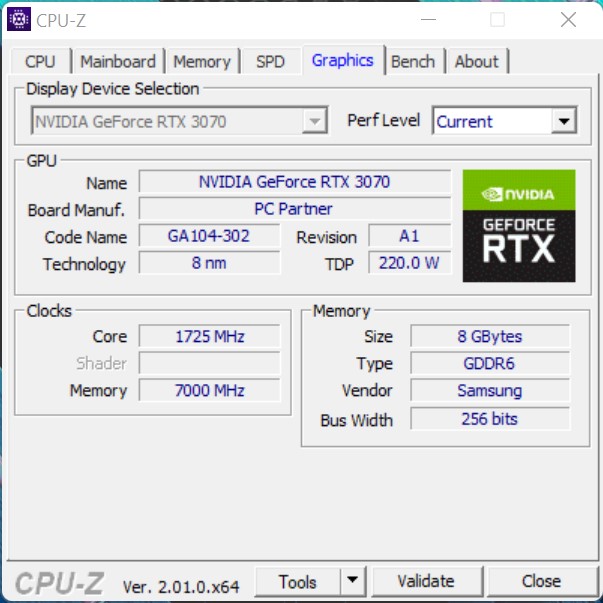
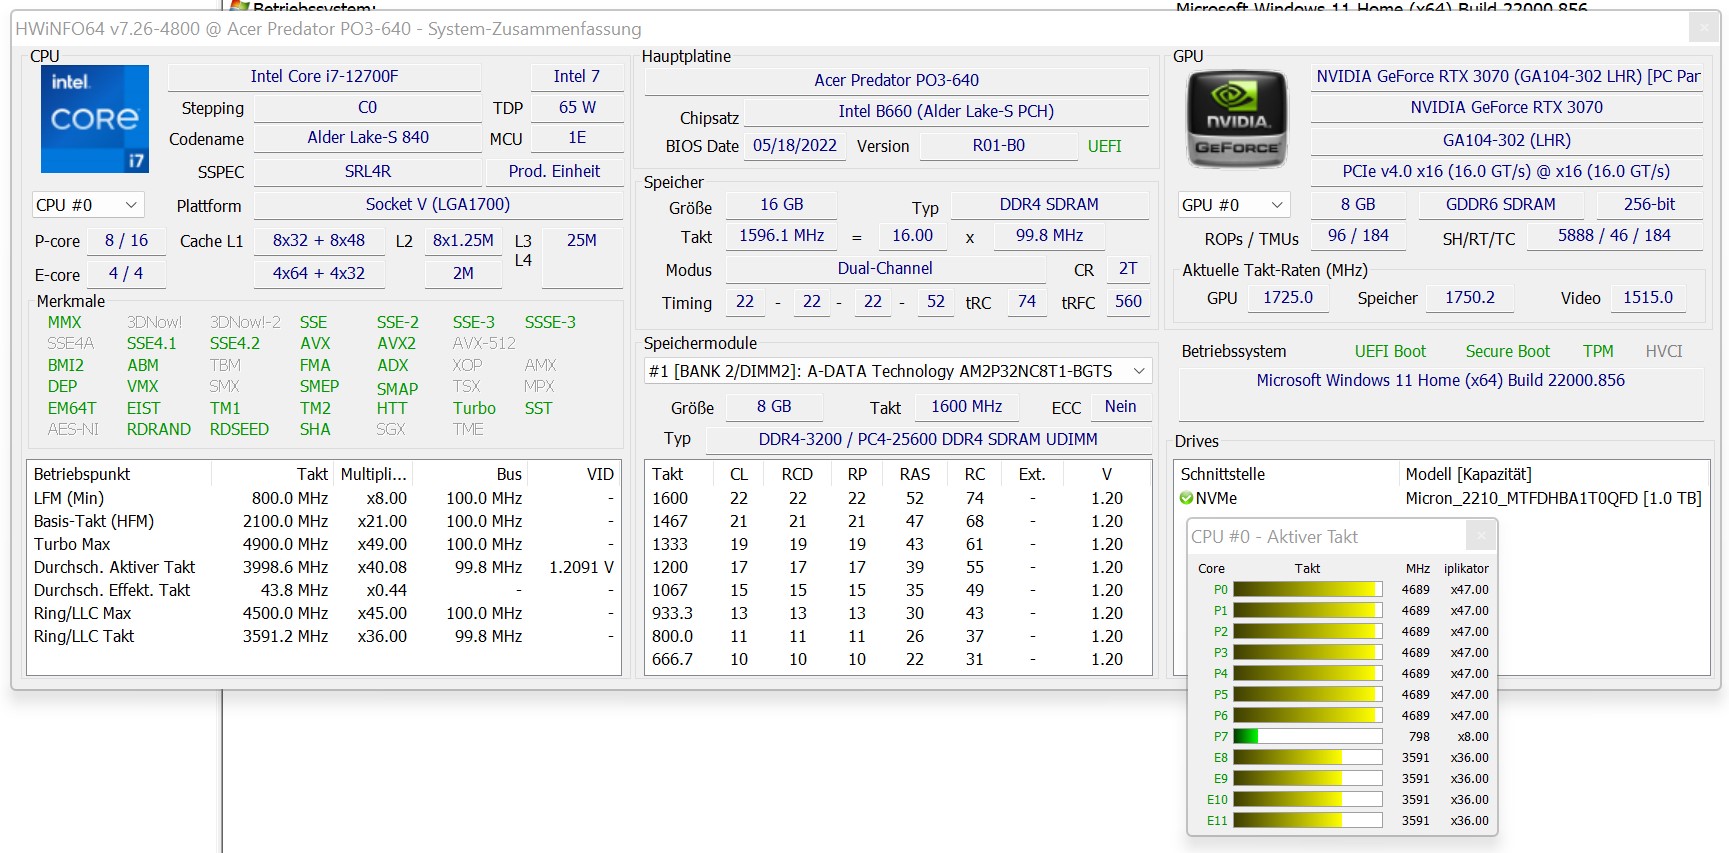
Um Intel Core i7-12700 ou um Intel Core i7-12700F é sempre usado como base (Intel Core i7-12700F em nossa amostra). Entretanto, existem diferentes modelos em termos de configuração da GPU, embora aGeForce RTX 3070é o modelo top desta série. Quando se trata de memória de trabalho, a DDR4 RAM é sempre utilizada. No entanto, você pode escolher entre 16 GB ou 32 GB, dependendo de seu orçamento. O mesmo se aplica ao armazenamento, que é o mínimo em nosso sistema com 1 TB que a Acer oferece no atual Predator Orion 3000.
Possible competitors in comparison
Avaliação | Data | Modelo | Peso | Altura | Preço |
|---|---|---|---|---|---|
v7 (old) | 09/2022 | Acer Predator Orion 3000 PO3-640 i7-12700F, GeForce RTX 3070 | 7.4 kg | 377 mm | |
v (old) | 12/2021 | Intel Beast Canyon NUC i9-11900KB, GeForce RTX 3060 | 189 mm | ||
v (old) | 06/2021 | Zotac Magnus One (ECM73070C) i7-10700, GeForce RTX 3070 | |||
v (old) | 05/2022 | Zotac ZBOX Magnus EN173070C i7-11800H, GeForce RTX 3070 Laptop GPU | 1.8 kg | 62.2 mm | |
v (old) | 04/2022 | Intel Dragon Canyon NUC - RTX 3060 i9-12900, GeForce RTX 3060 | 189 mm | ||
v (old) | 06/2020 | Zotac MEK Mini (RTX 2070 Super) i7-9700, GeForce RTX 2070 Super (Desktop) |
Acer Predator Orion 3000 PO3-640 em detalhes
Caso
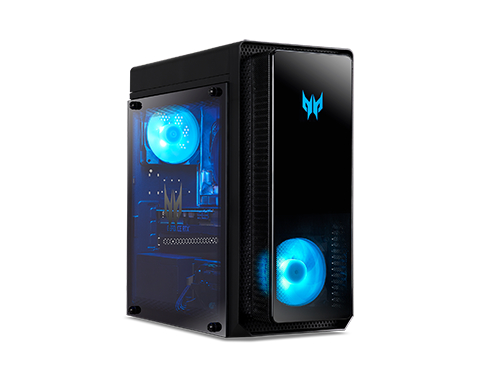
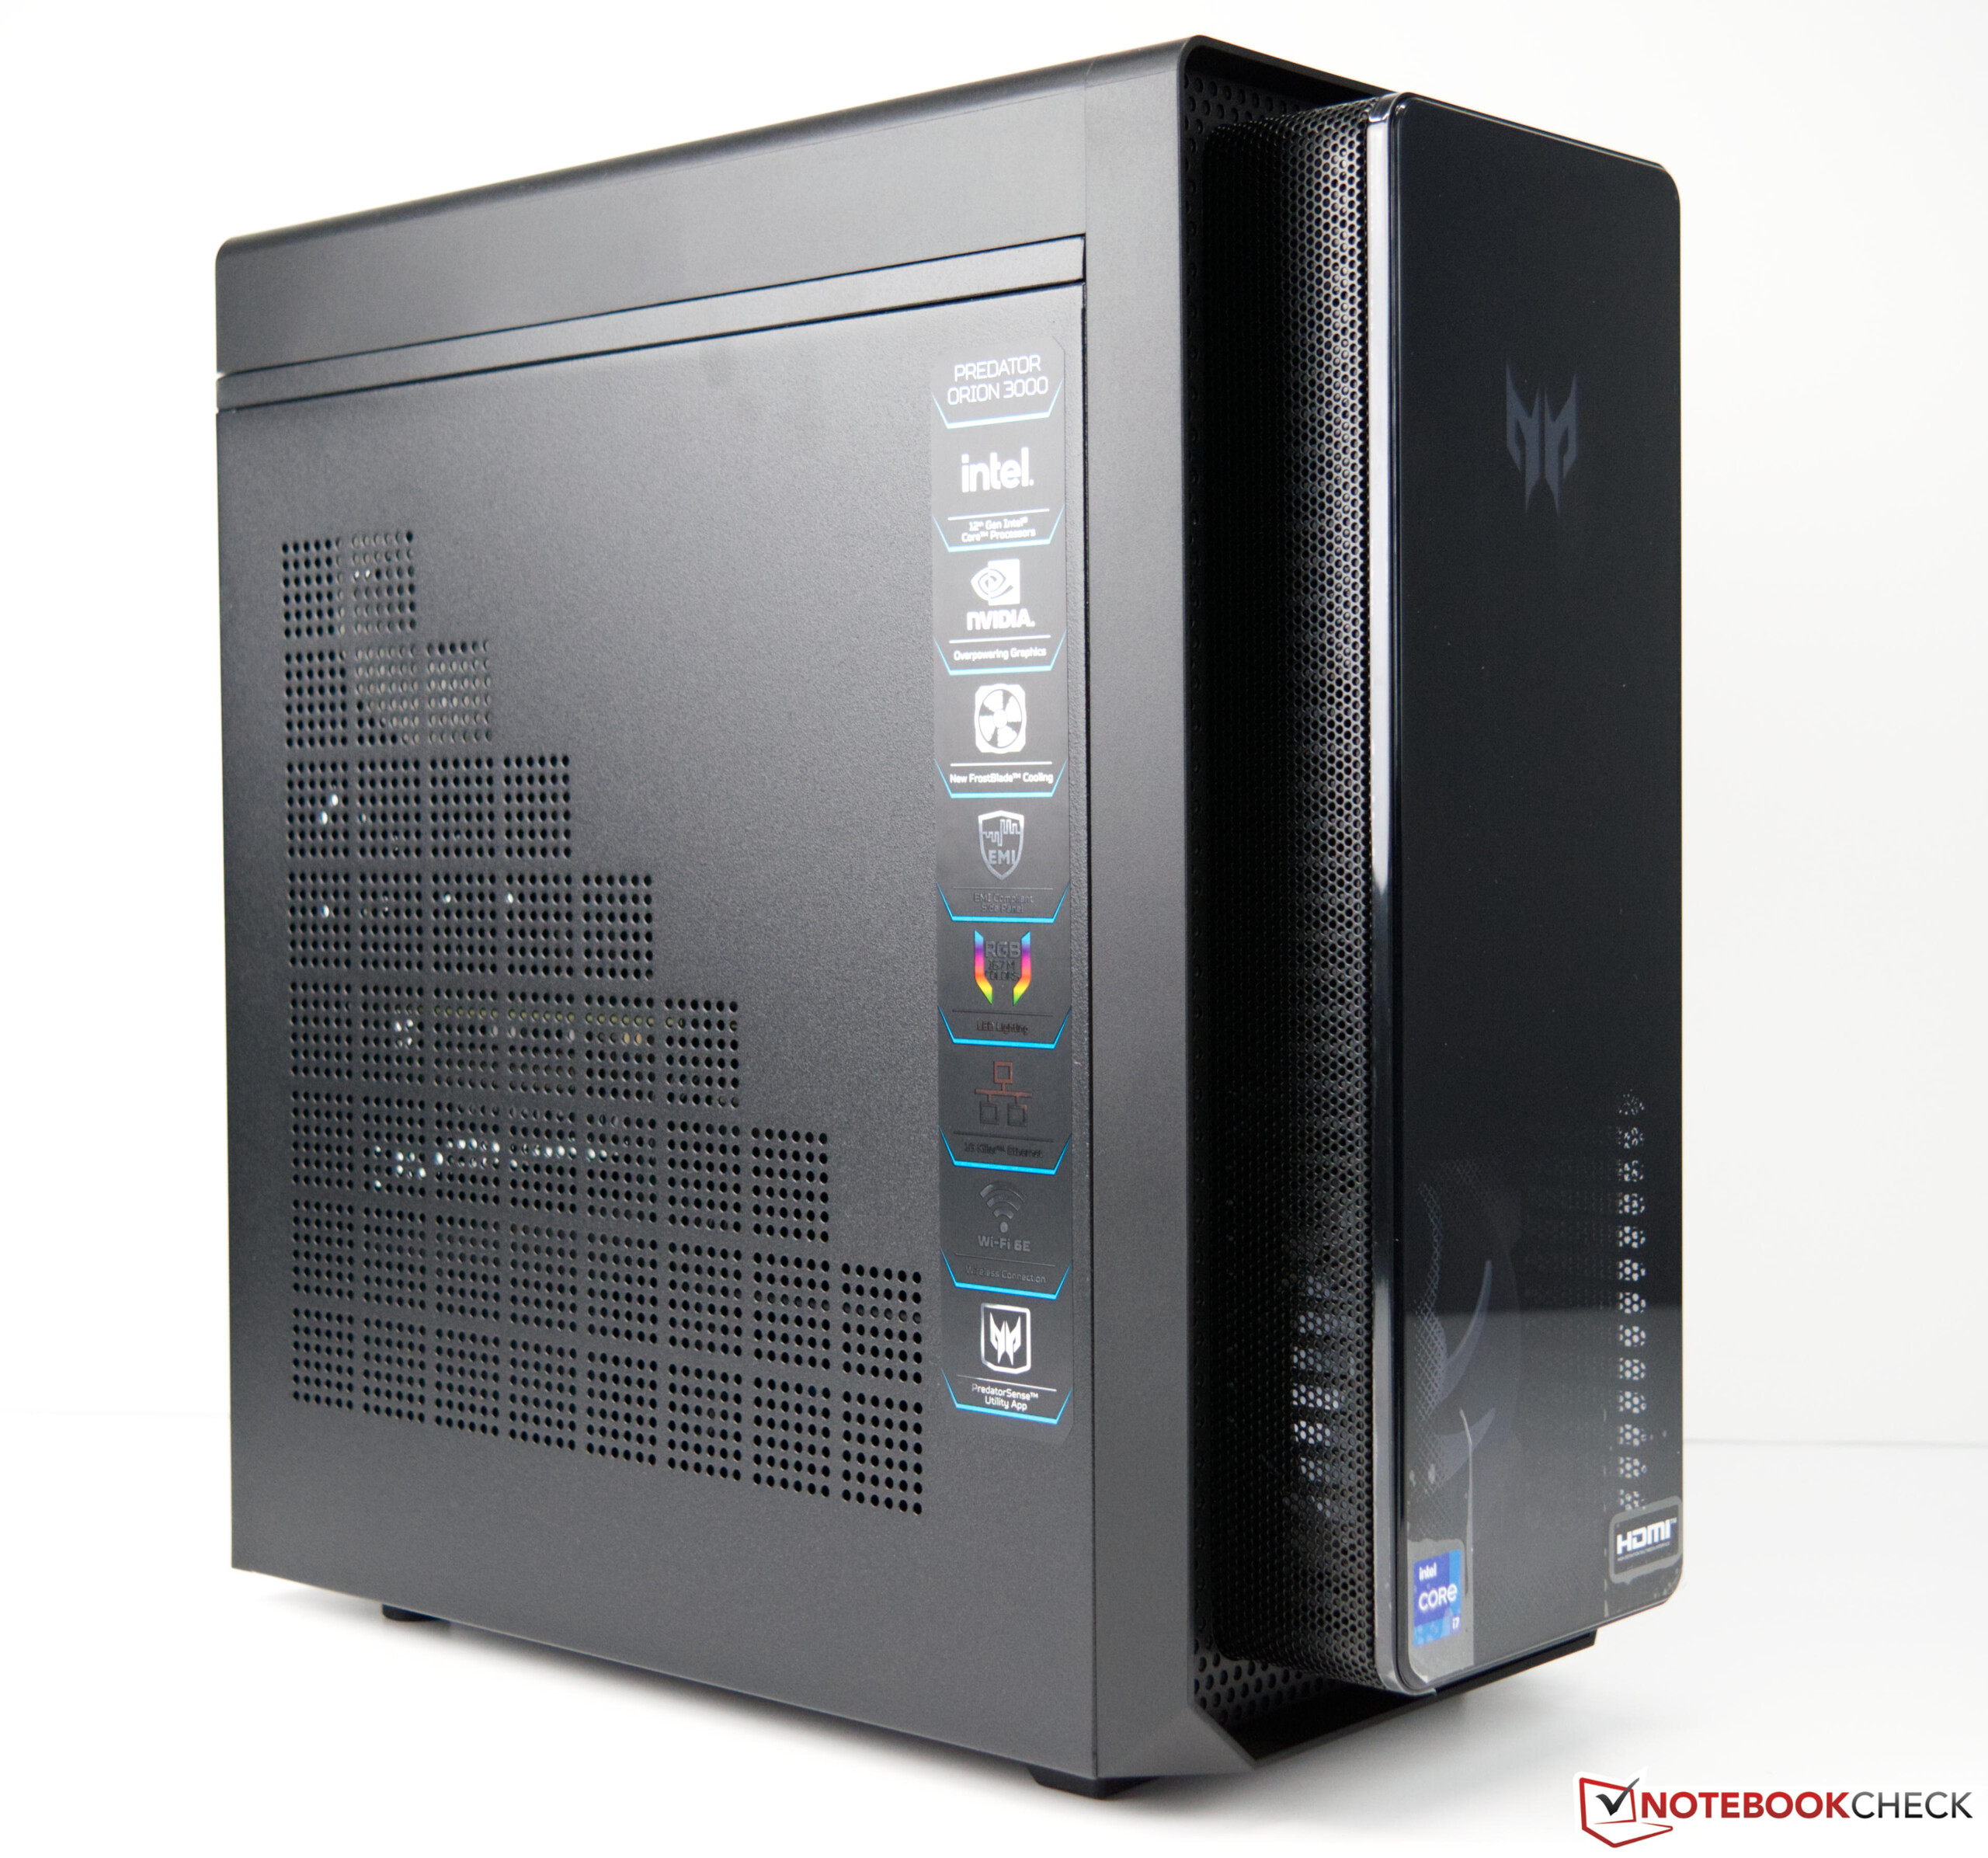
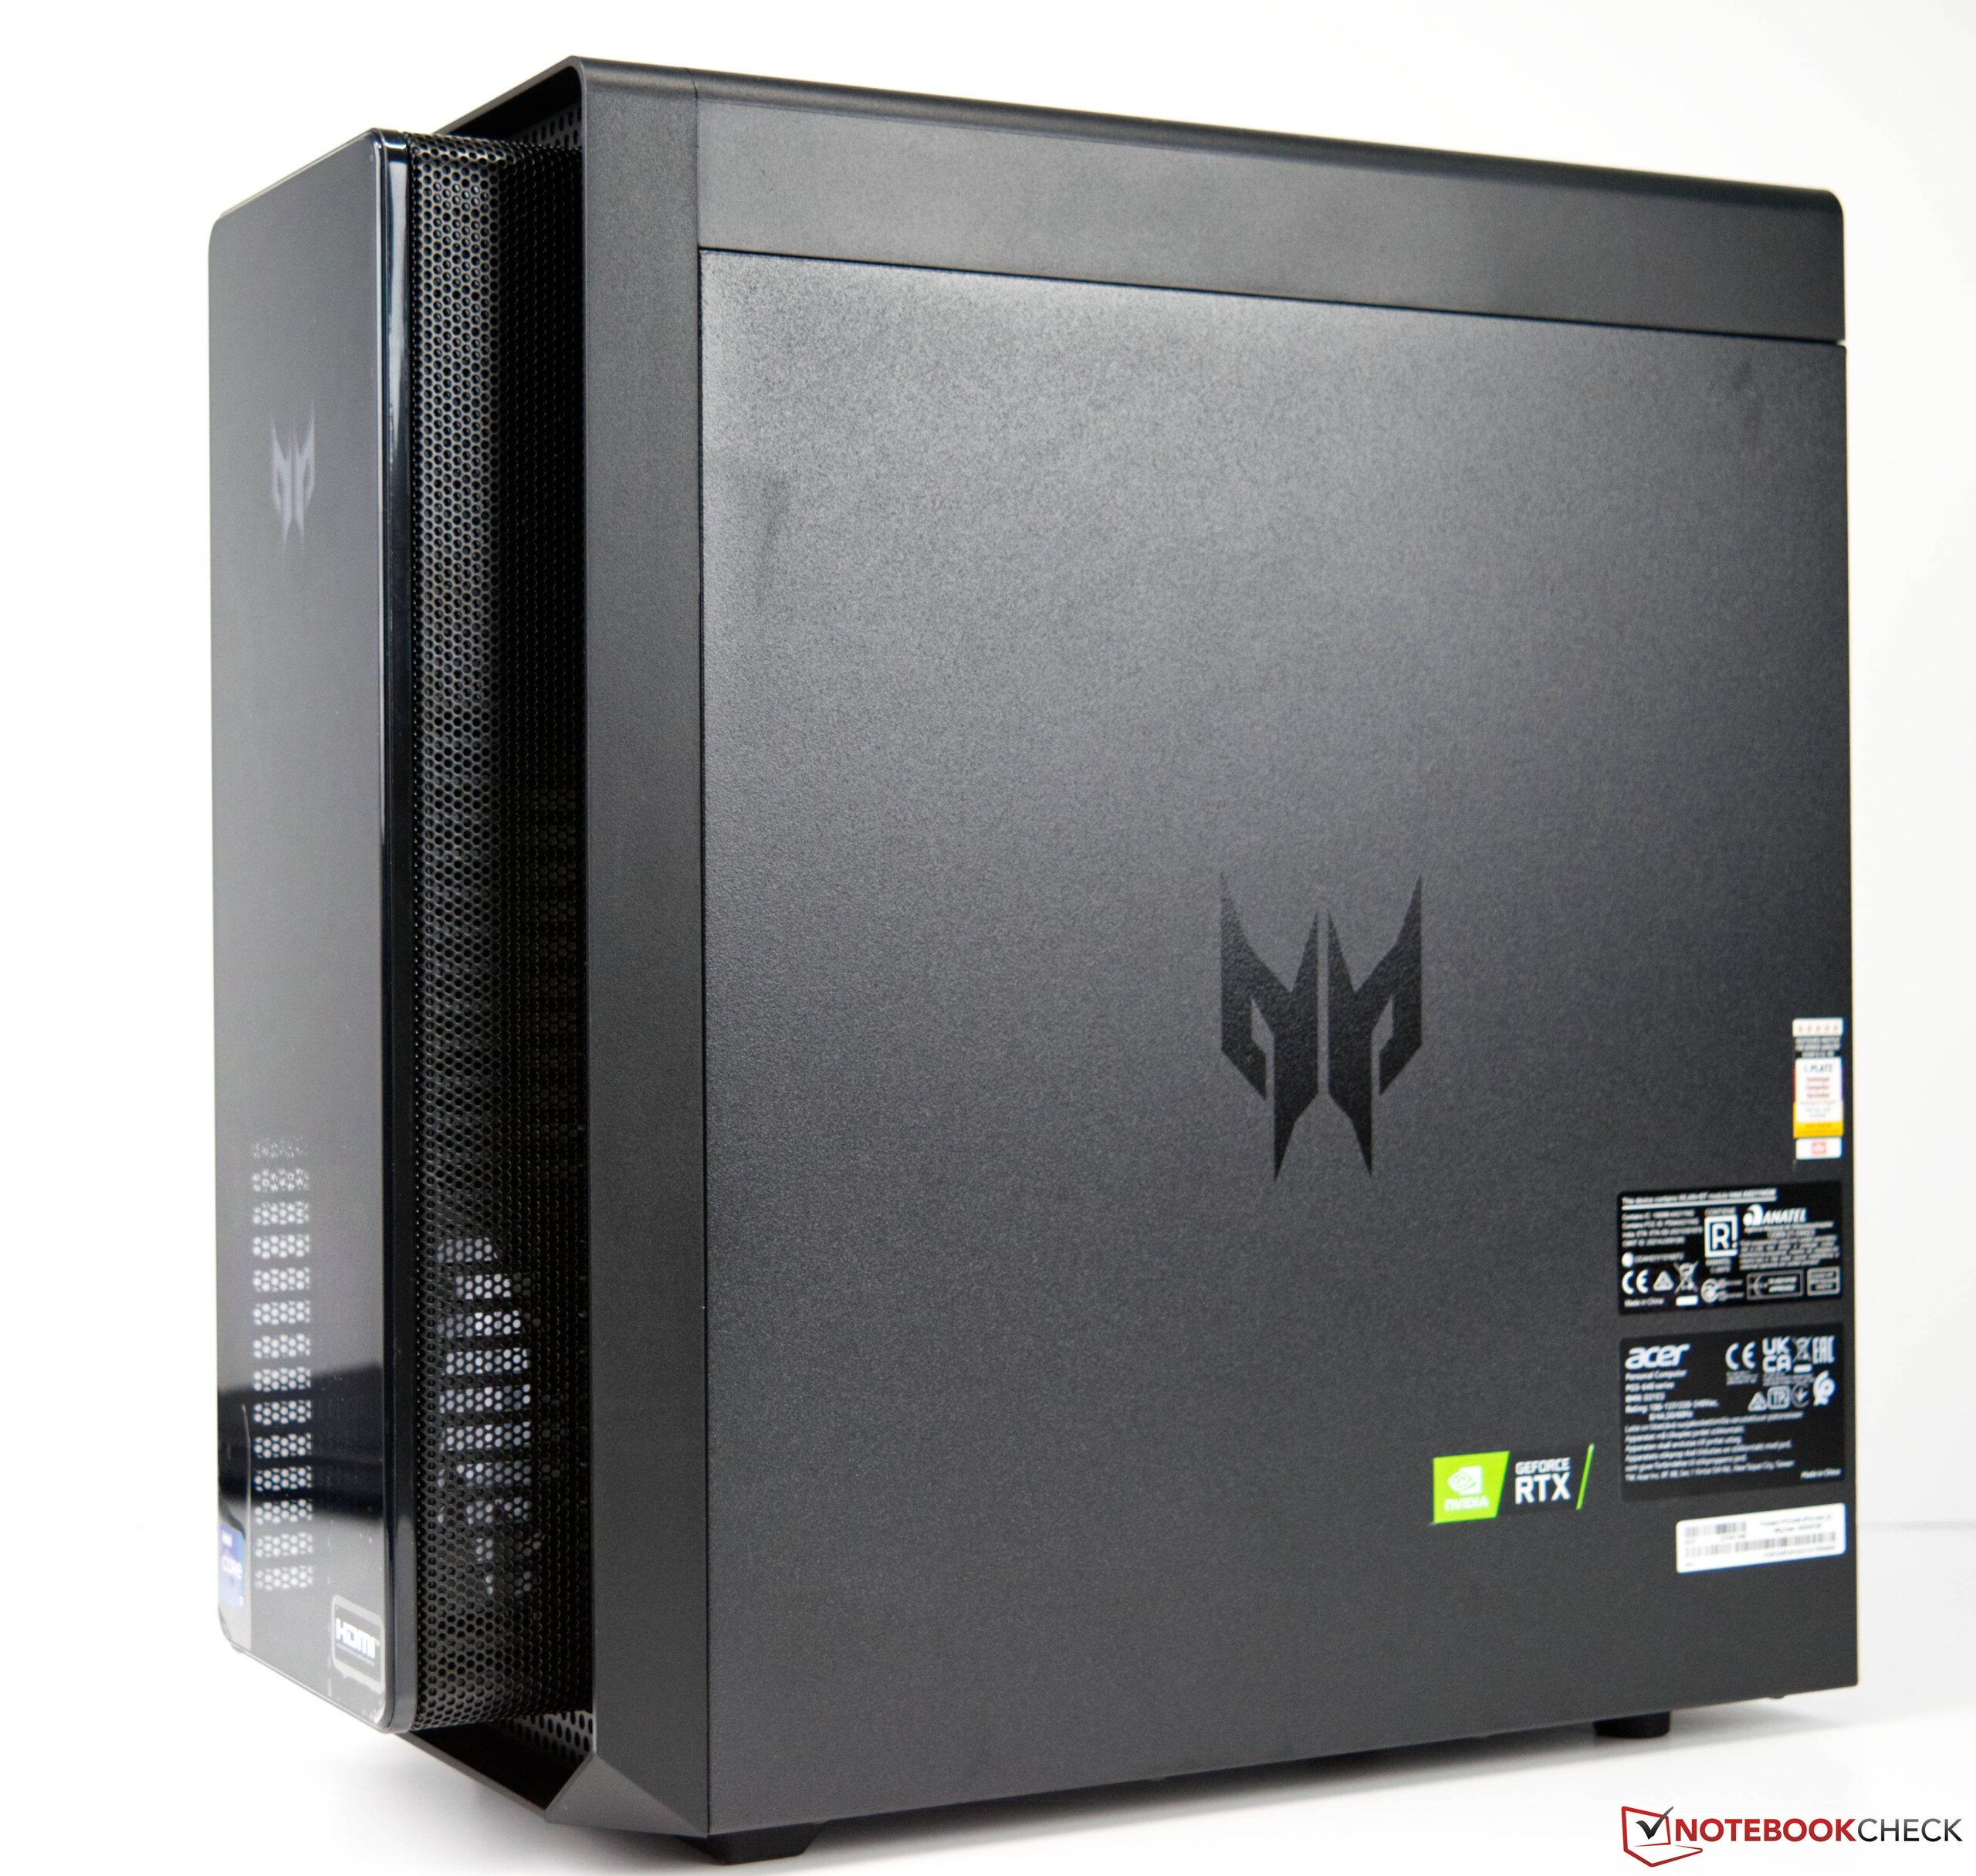
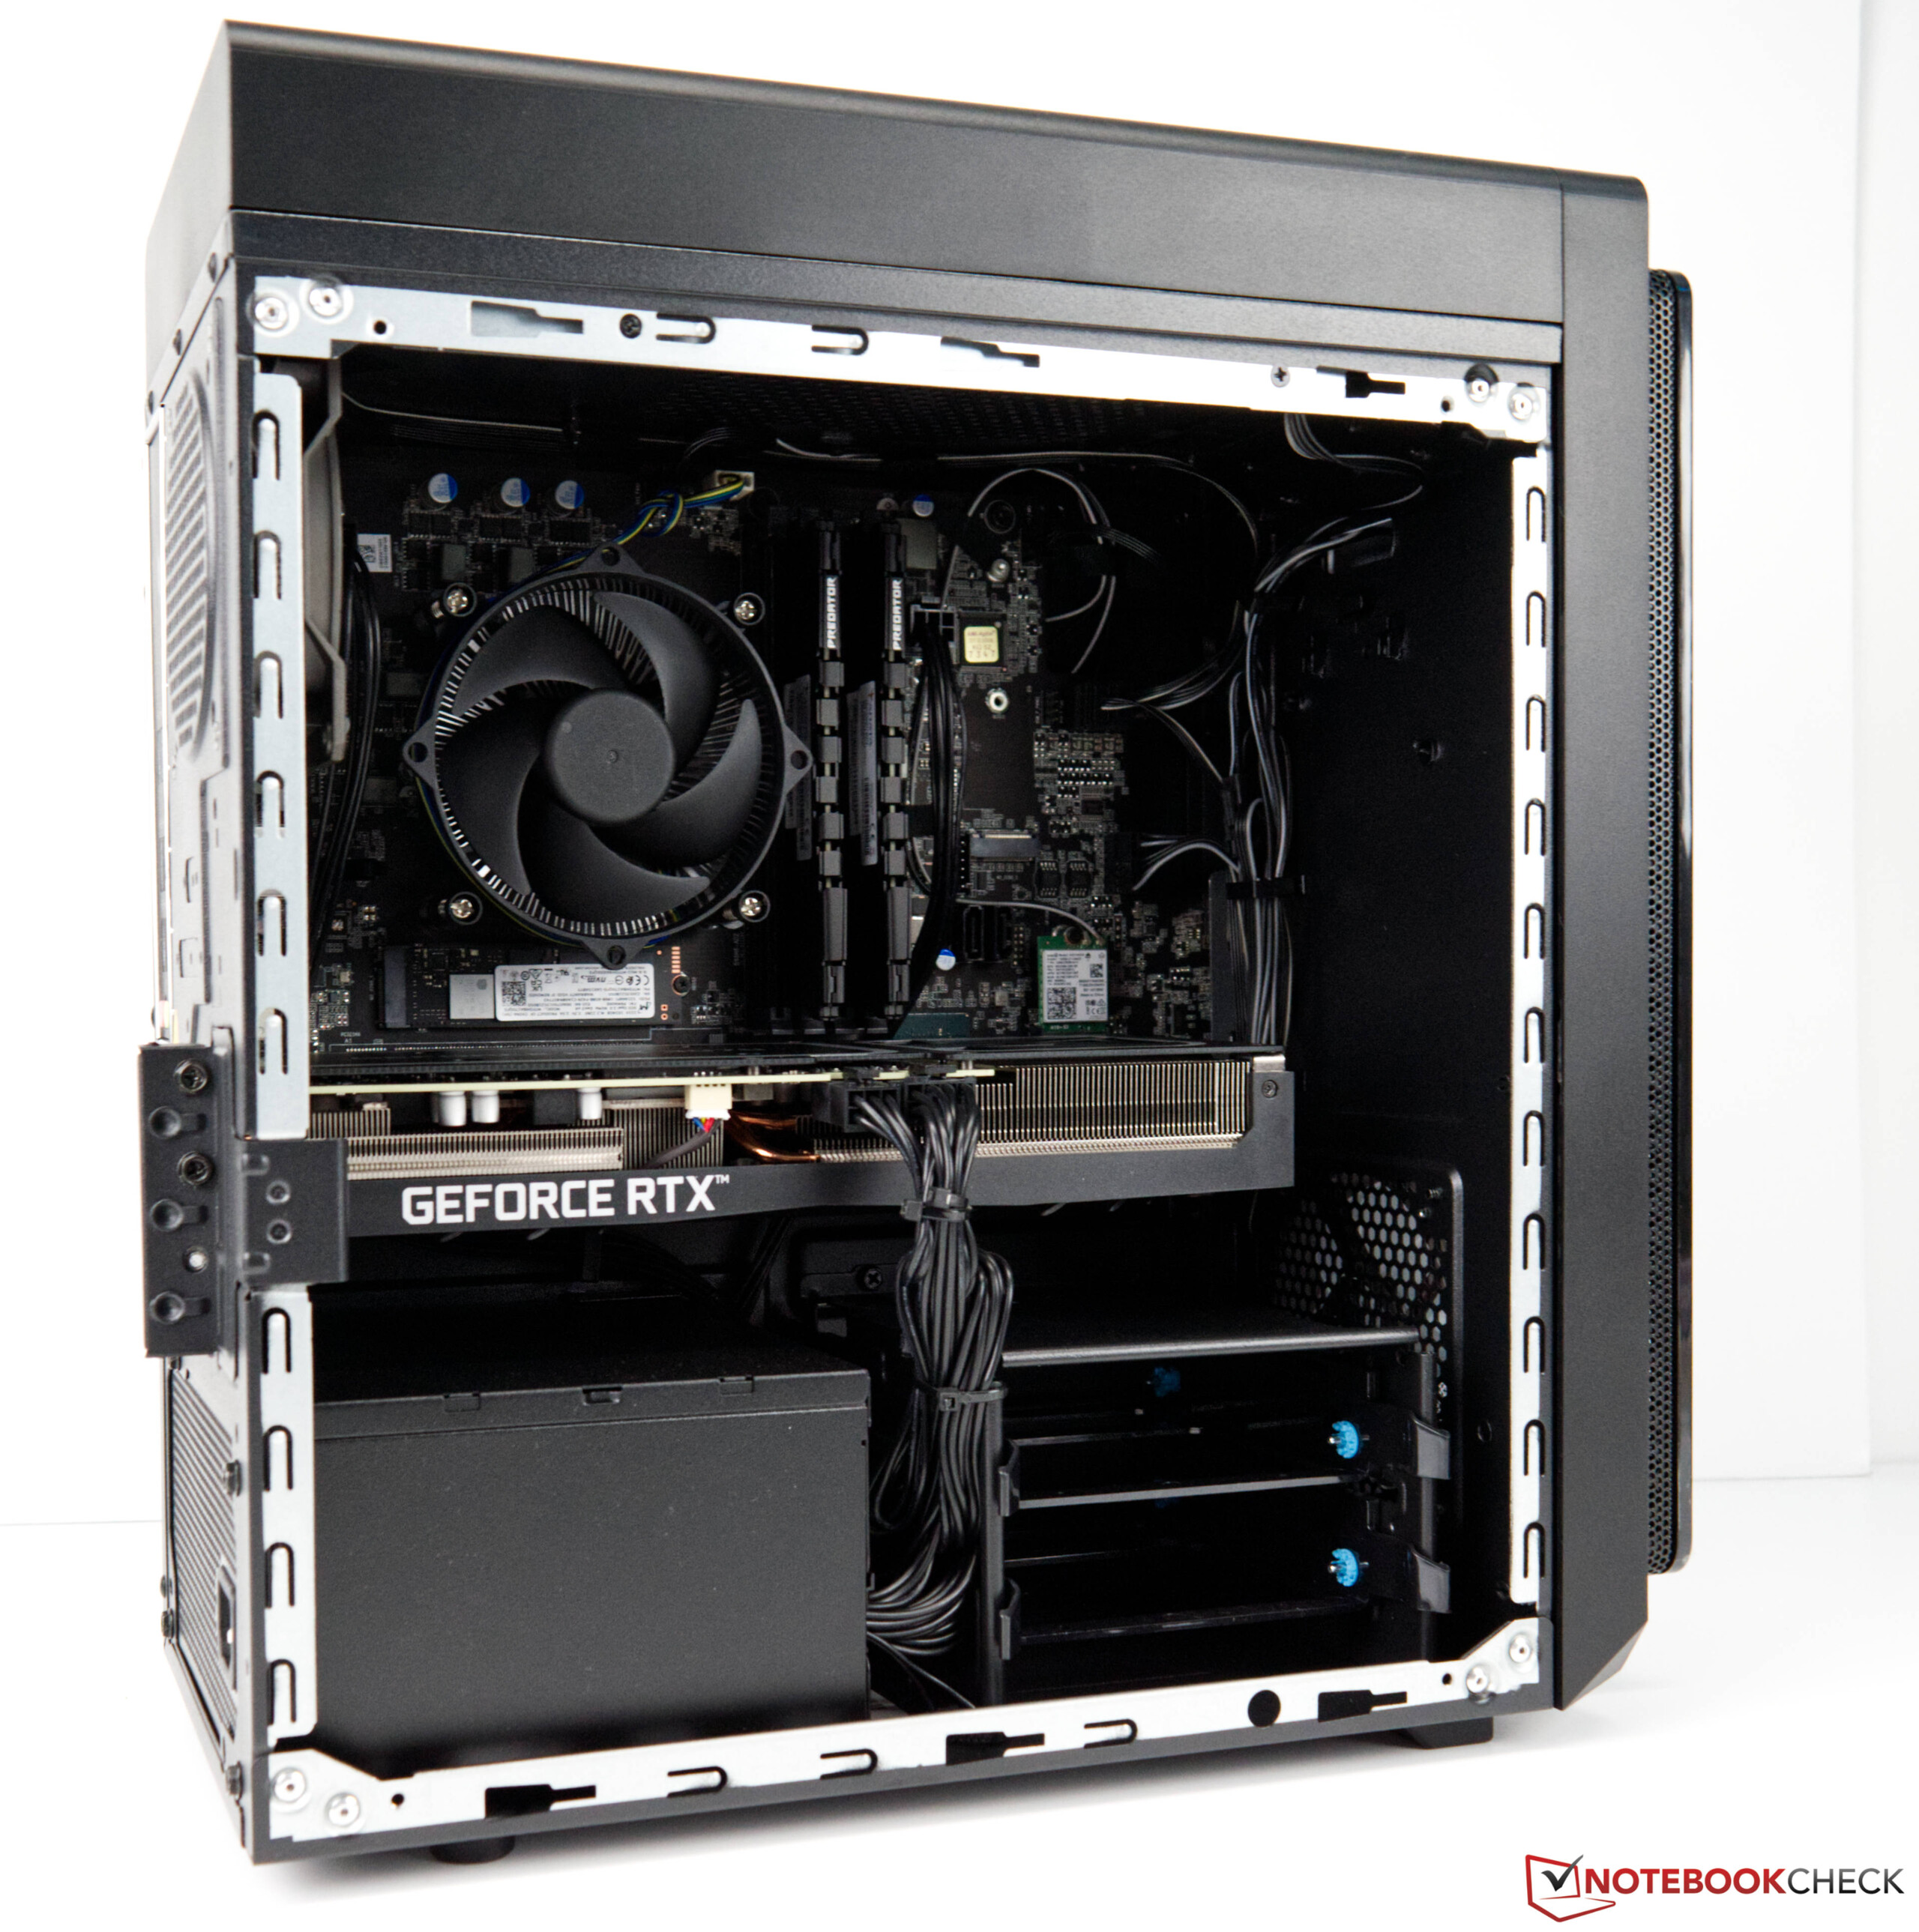
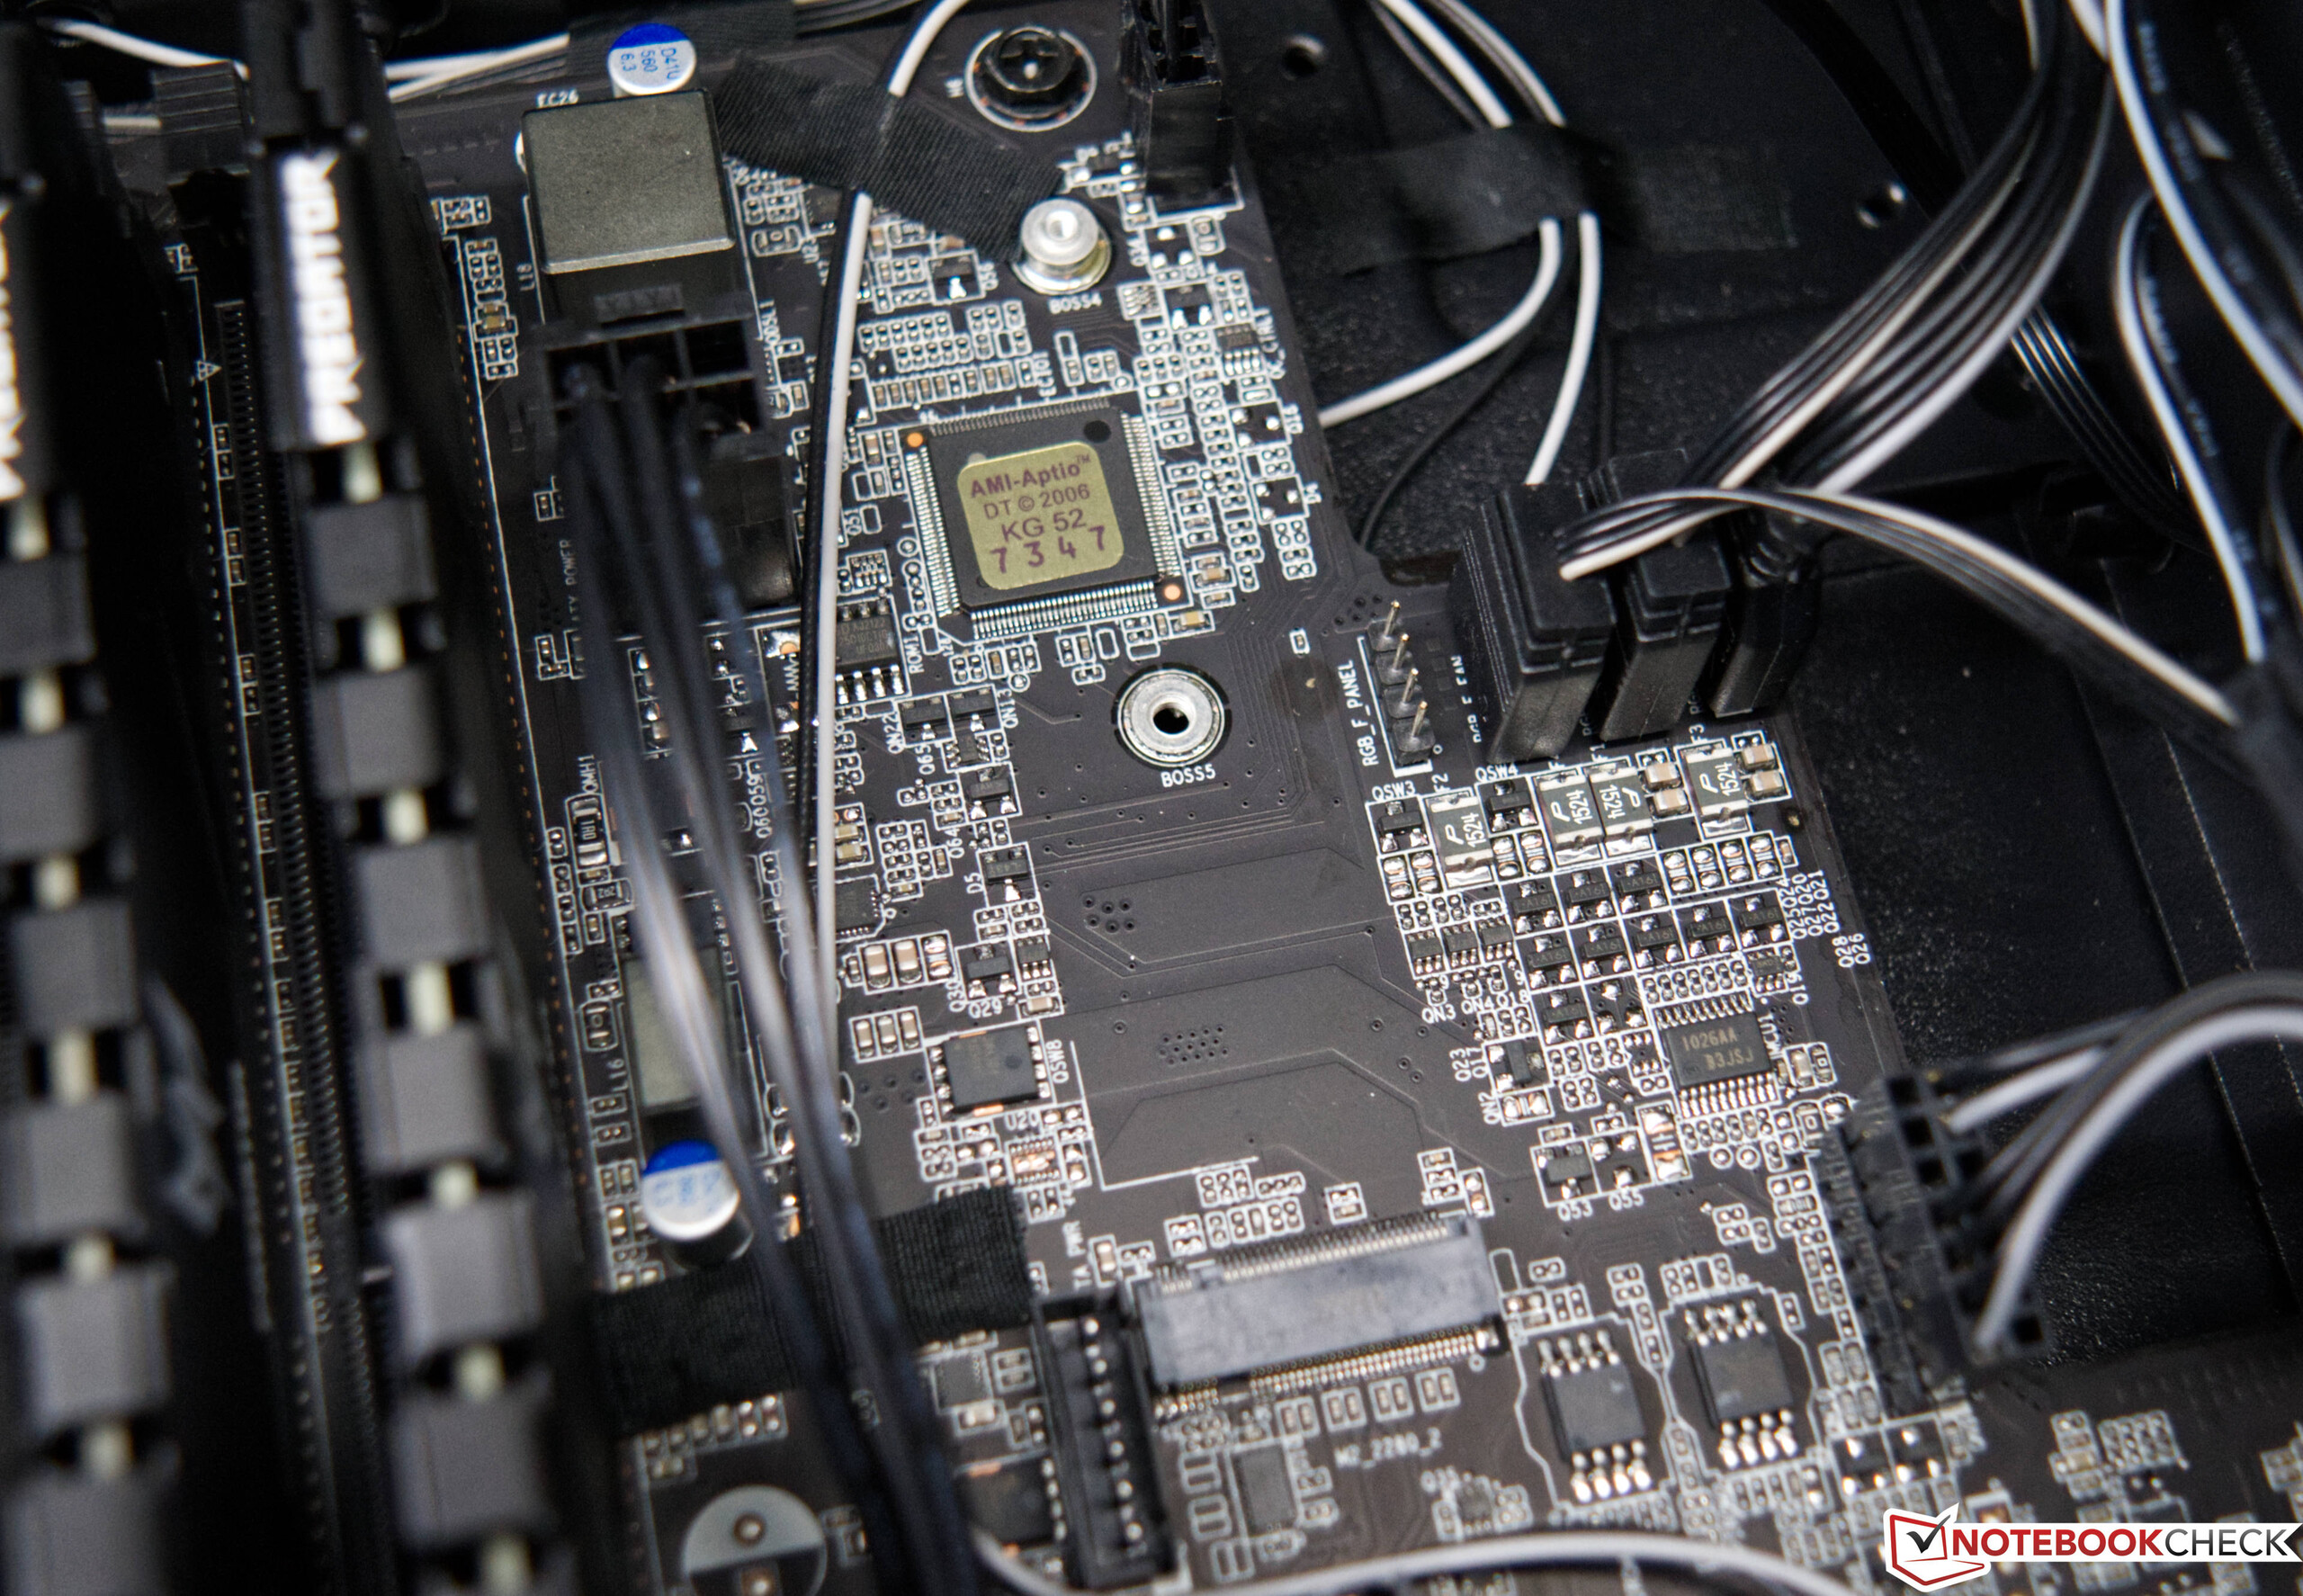
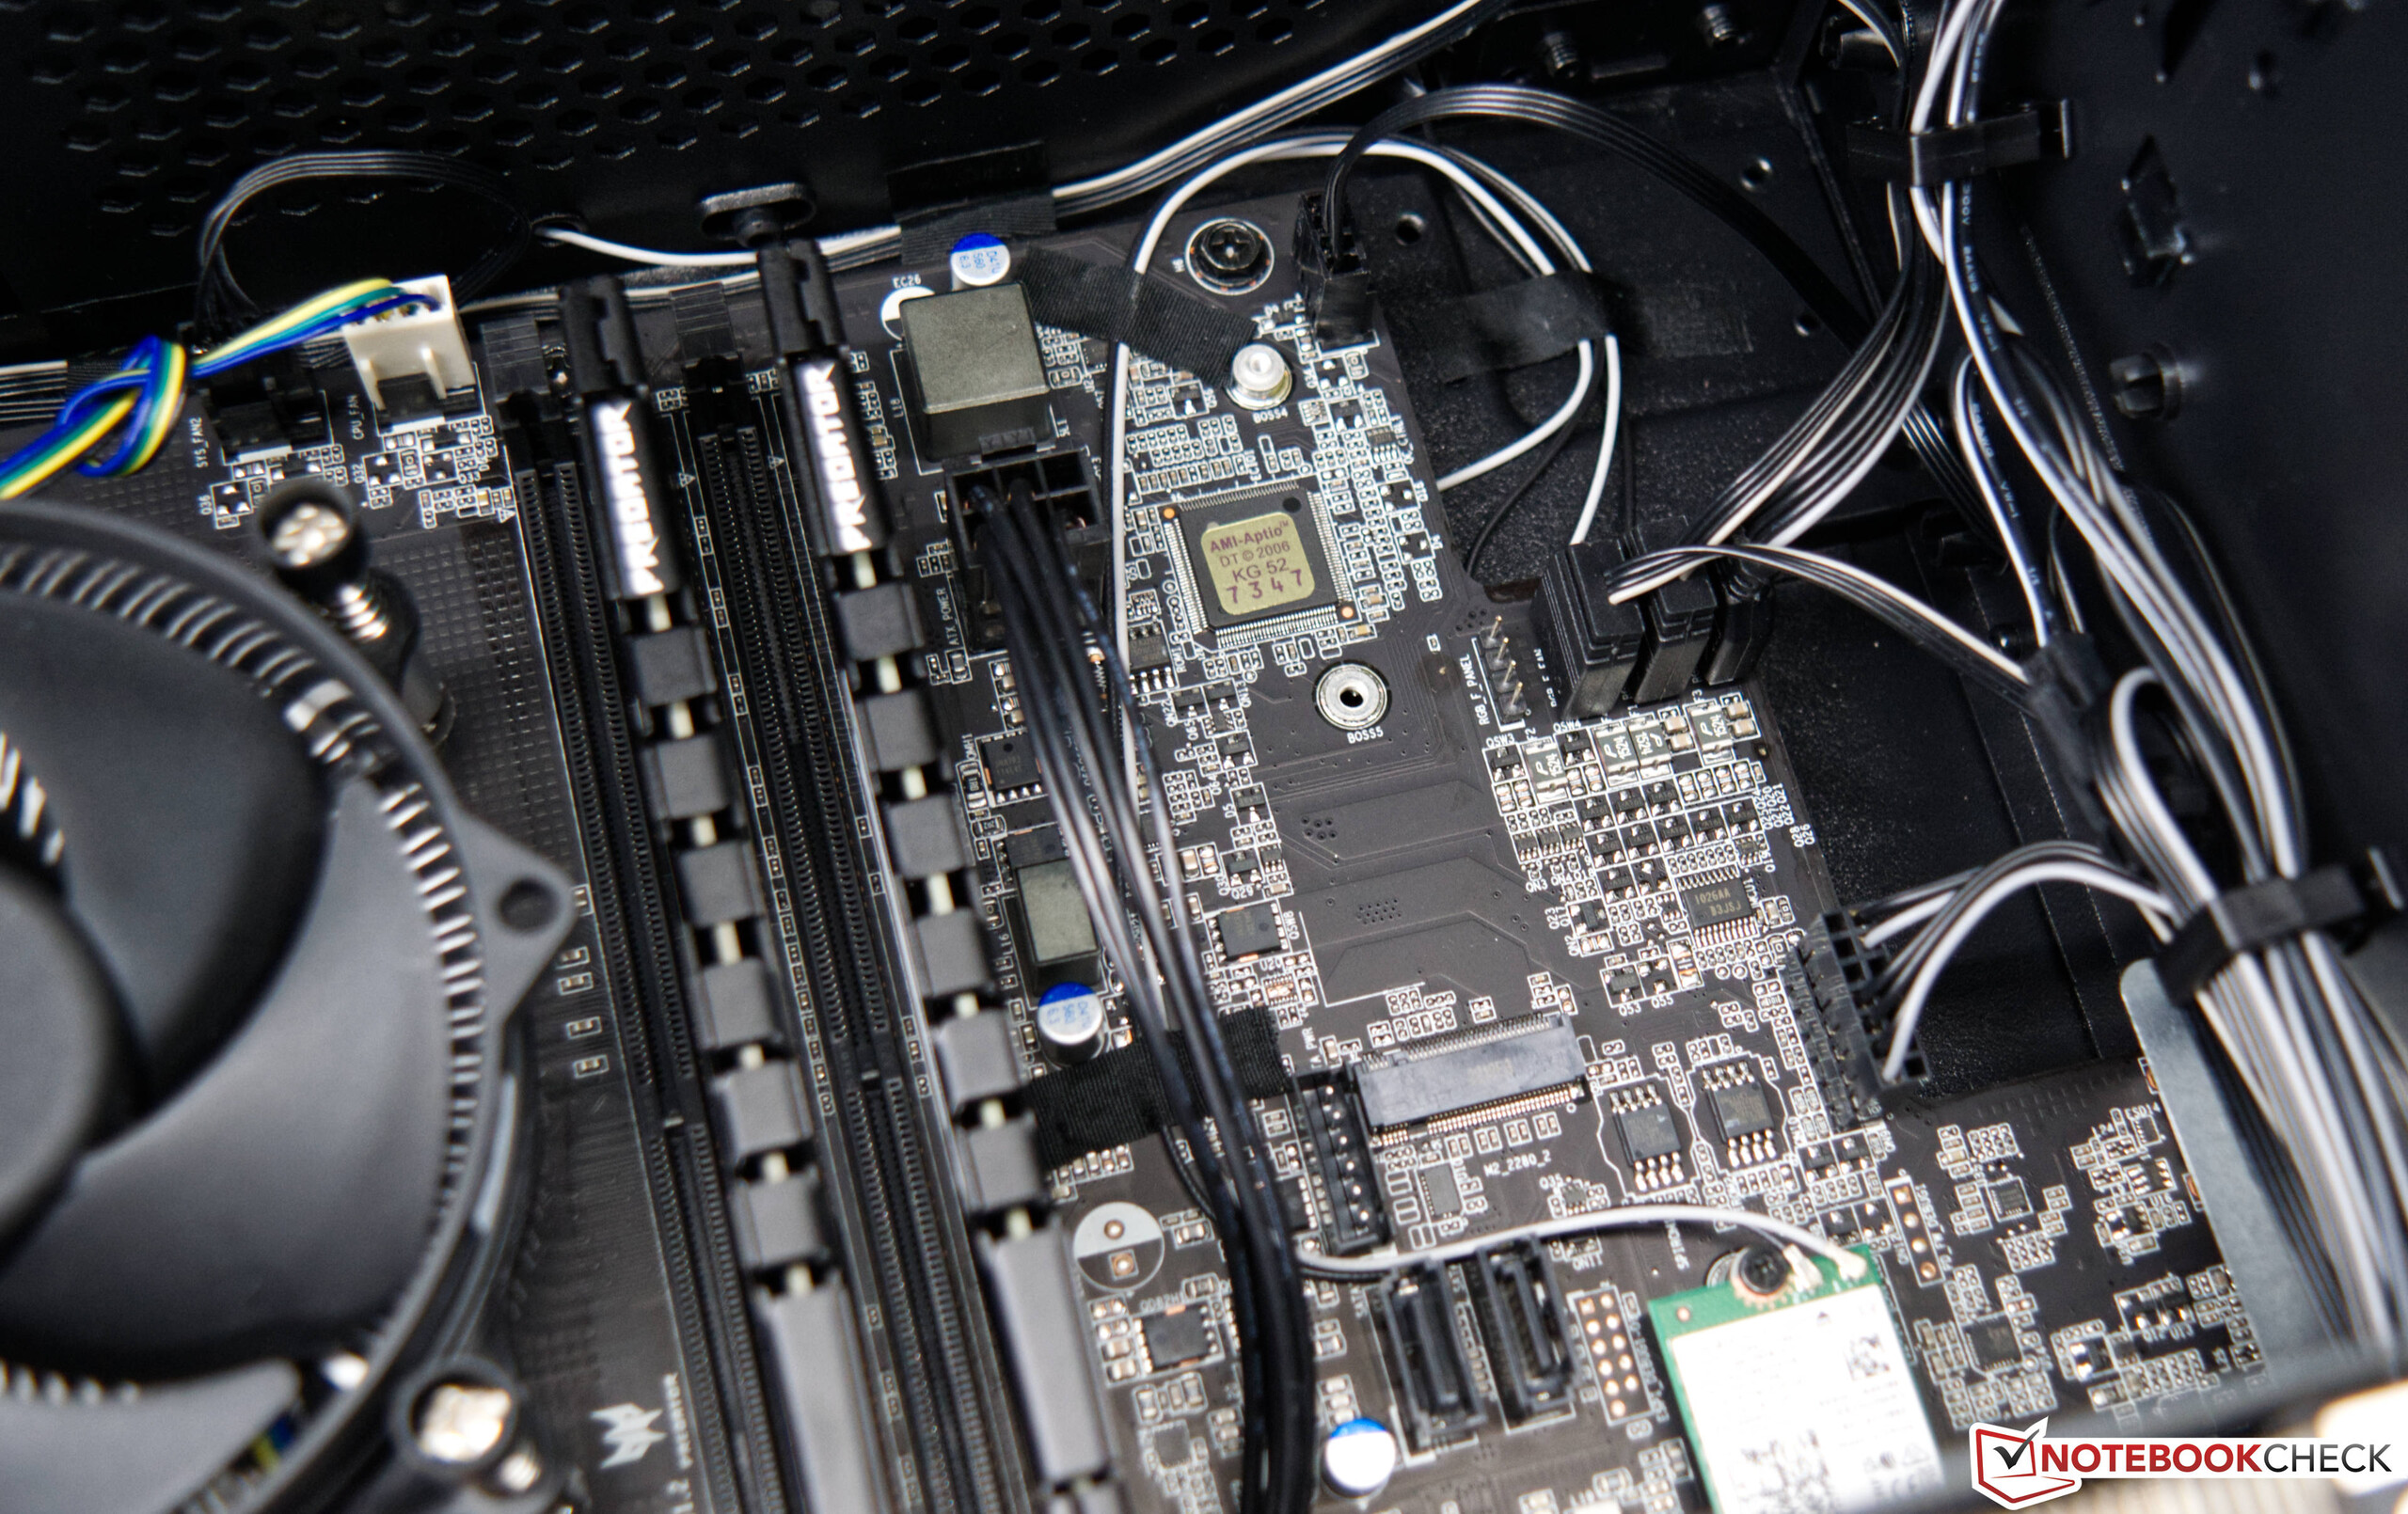
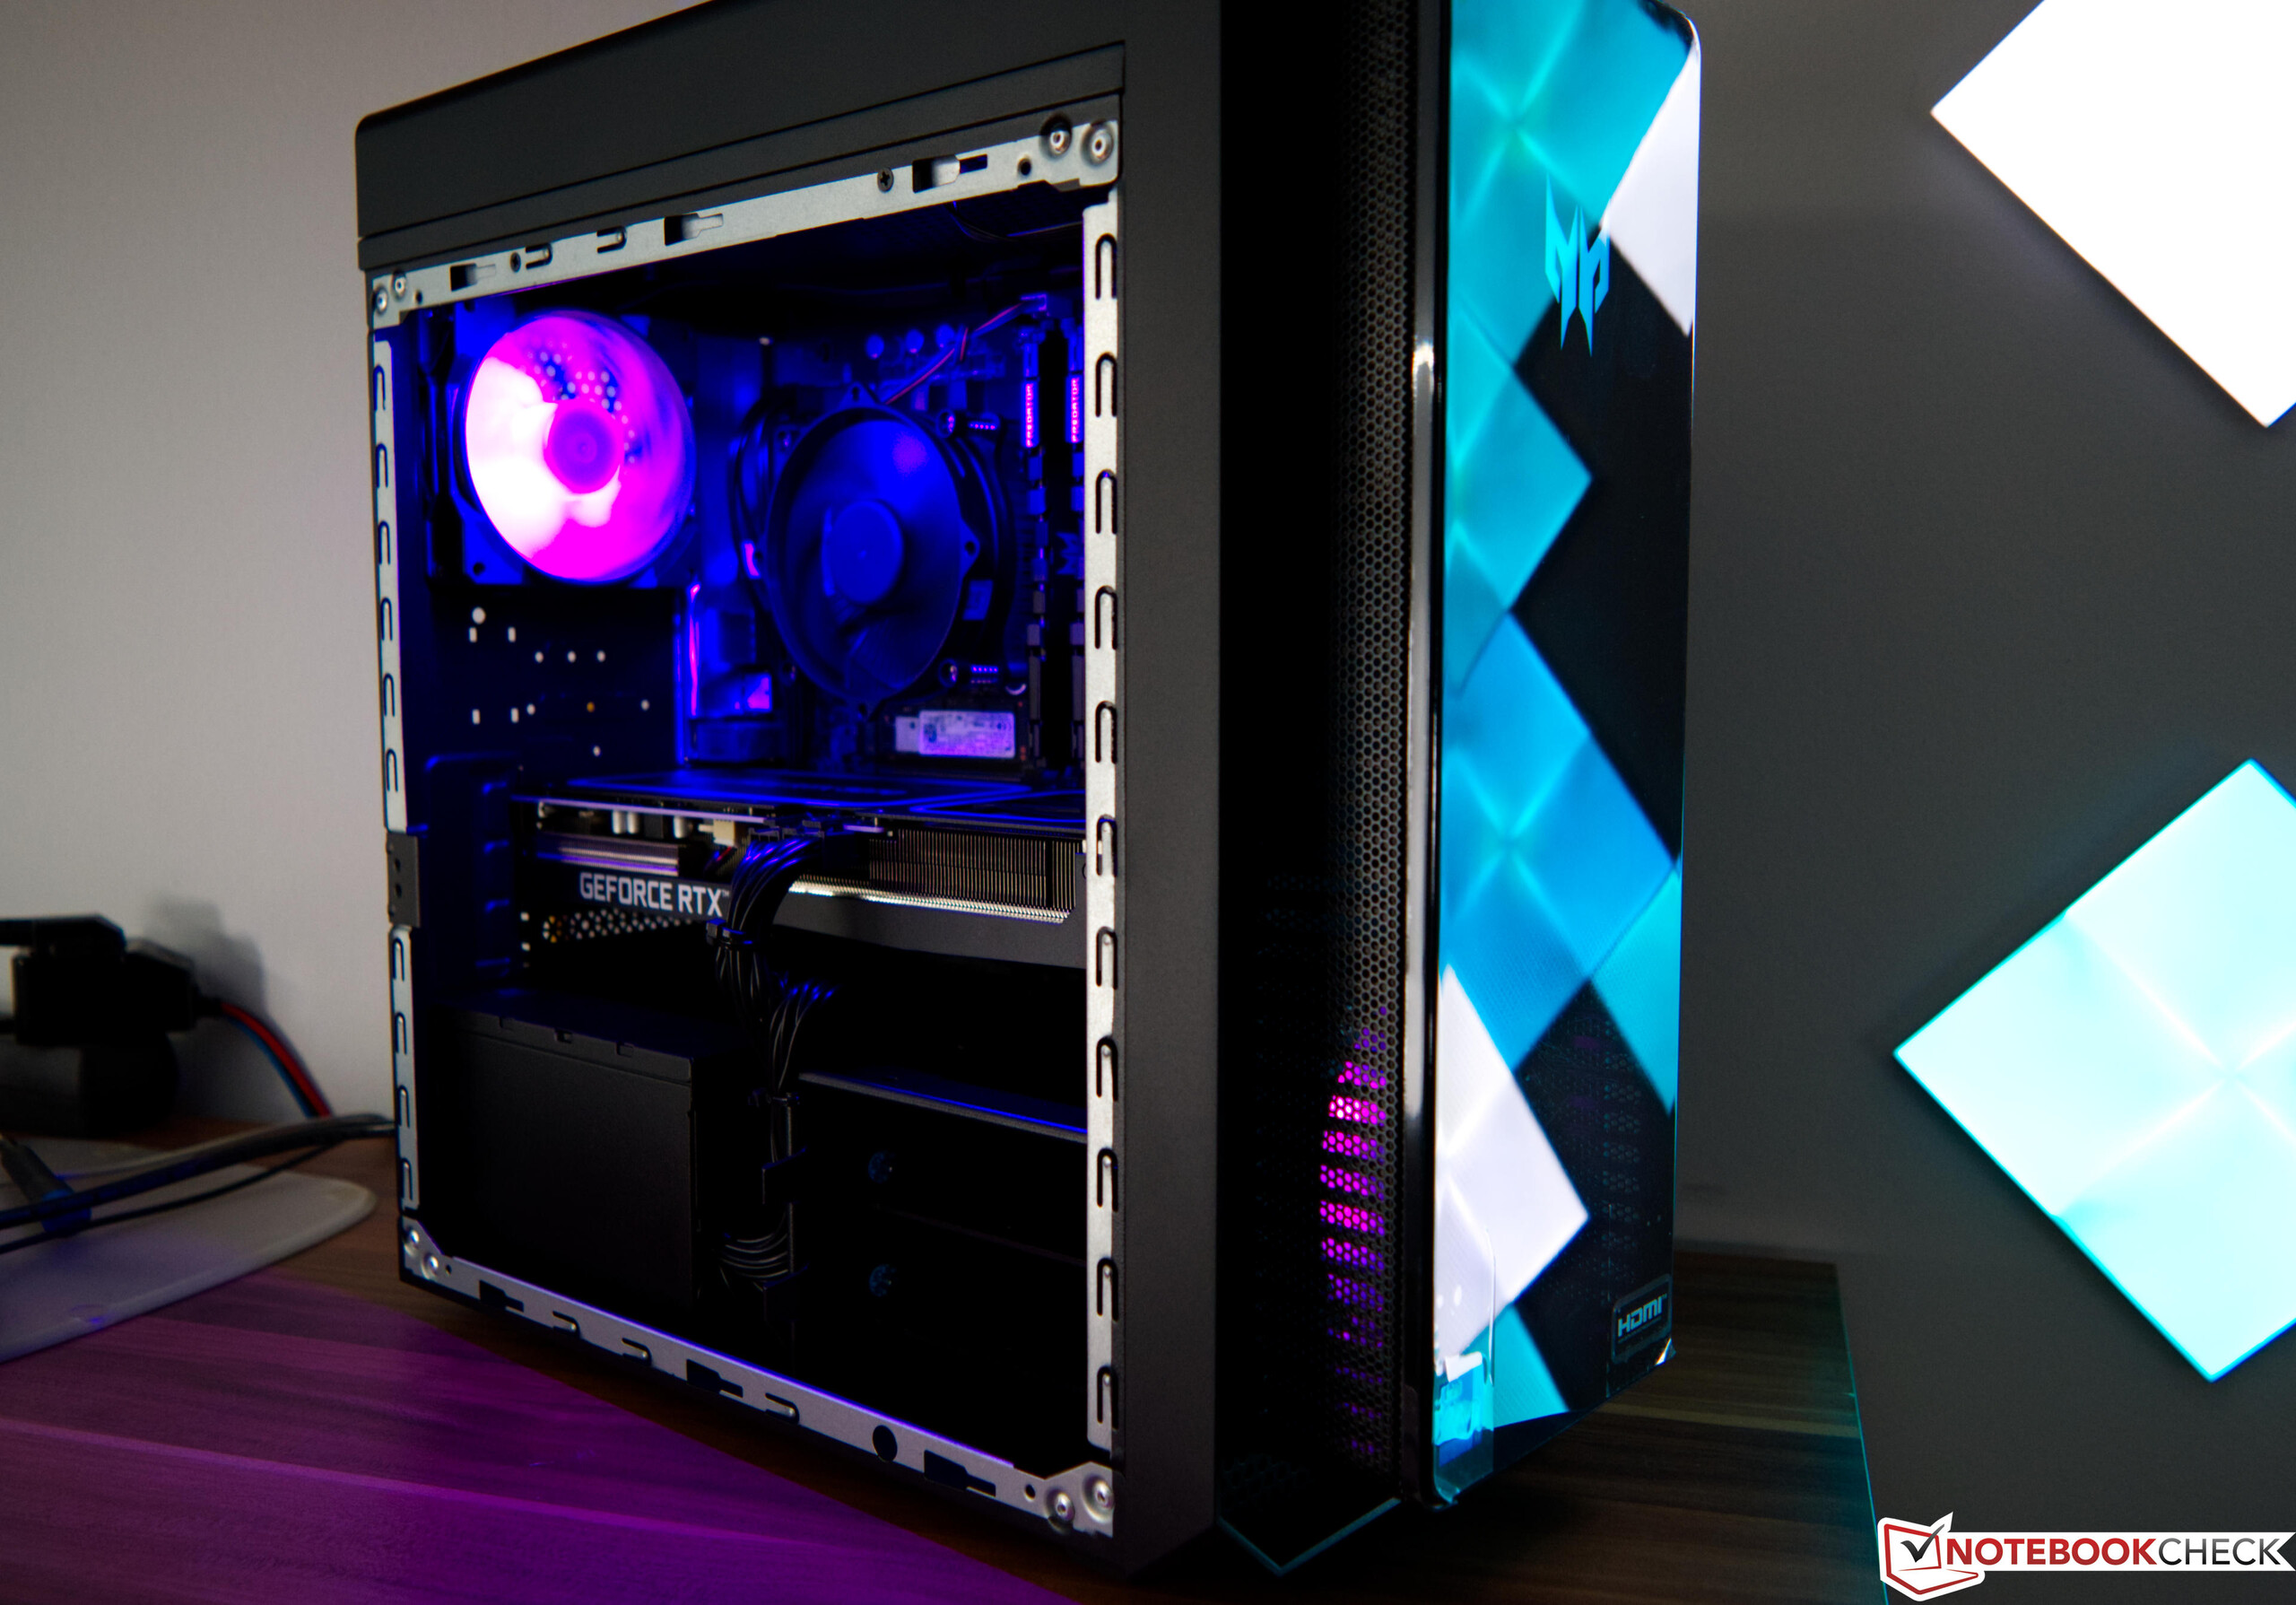
O caso do Acer Predator Orion 3000 PO3-640 parece um caso ATX padrão à primeira vista. Entretanto, o fabricante se desvia do padrão aqui porque os conectores frontais estão localizados diretamente na placa-mãe e não são conectados à placa-mãe por cabo. Com tais construções, a substituição da placa-mãe é quase impossível. No entanto, outros fabricantes seguem caminhos semelhantes e instalam placas-mãe proprietárias em caixas proprietárias. A caixa é bem fabricada, embora o visual seja realmente uma questão de gosto. O escopo da entrega também inclui um painel lateral com uma janela de visualização para melhor mostrar os componentes instalados. Entretanto, devido ao já muito limitado fluxo de ar, nos abstivemos de usar o painel lateral opticamente chique durante o teste. Pelo menos a tampa metálica oferece alguns furos para sugar o ar fresco.
Equipamento
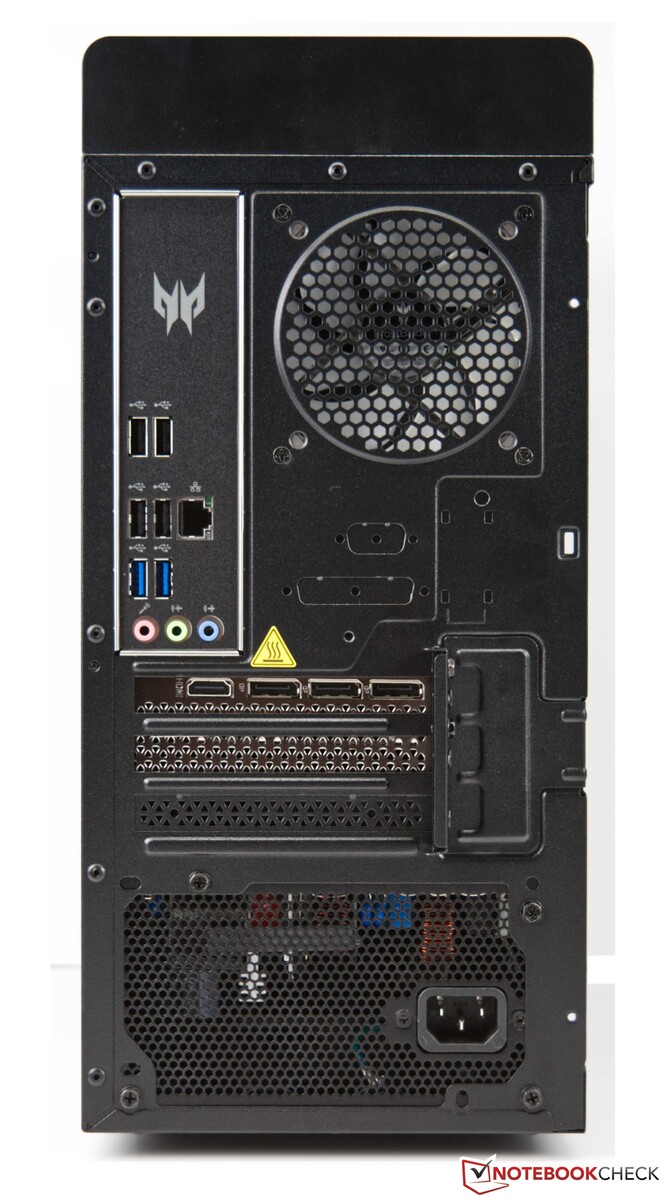
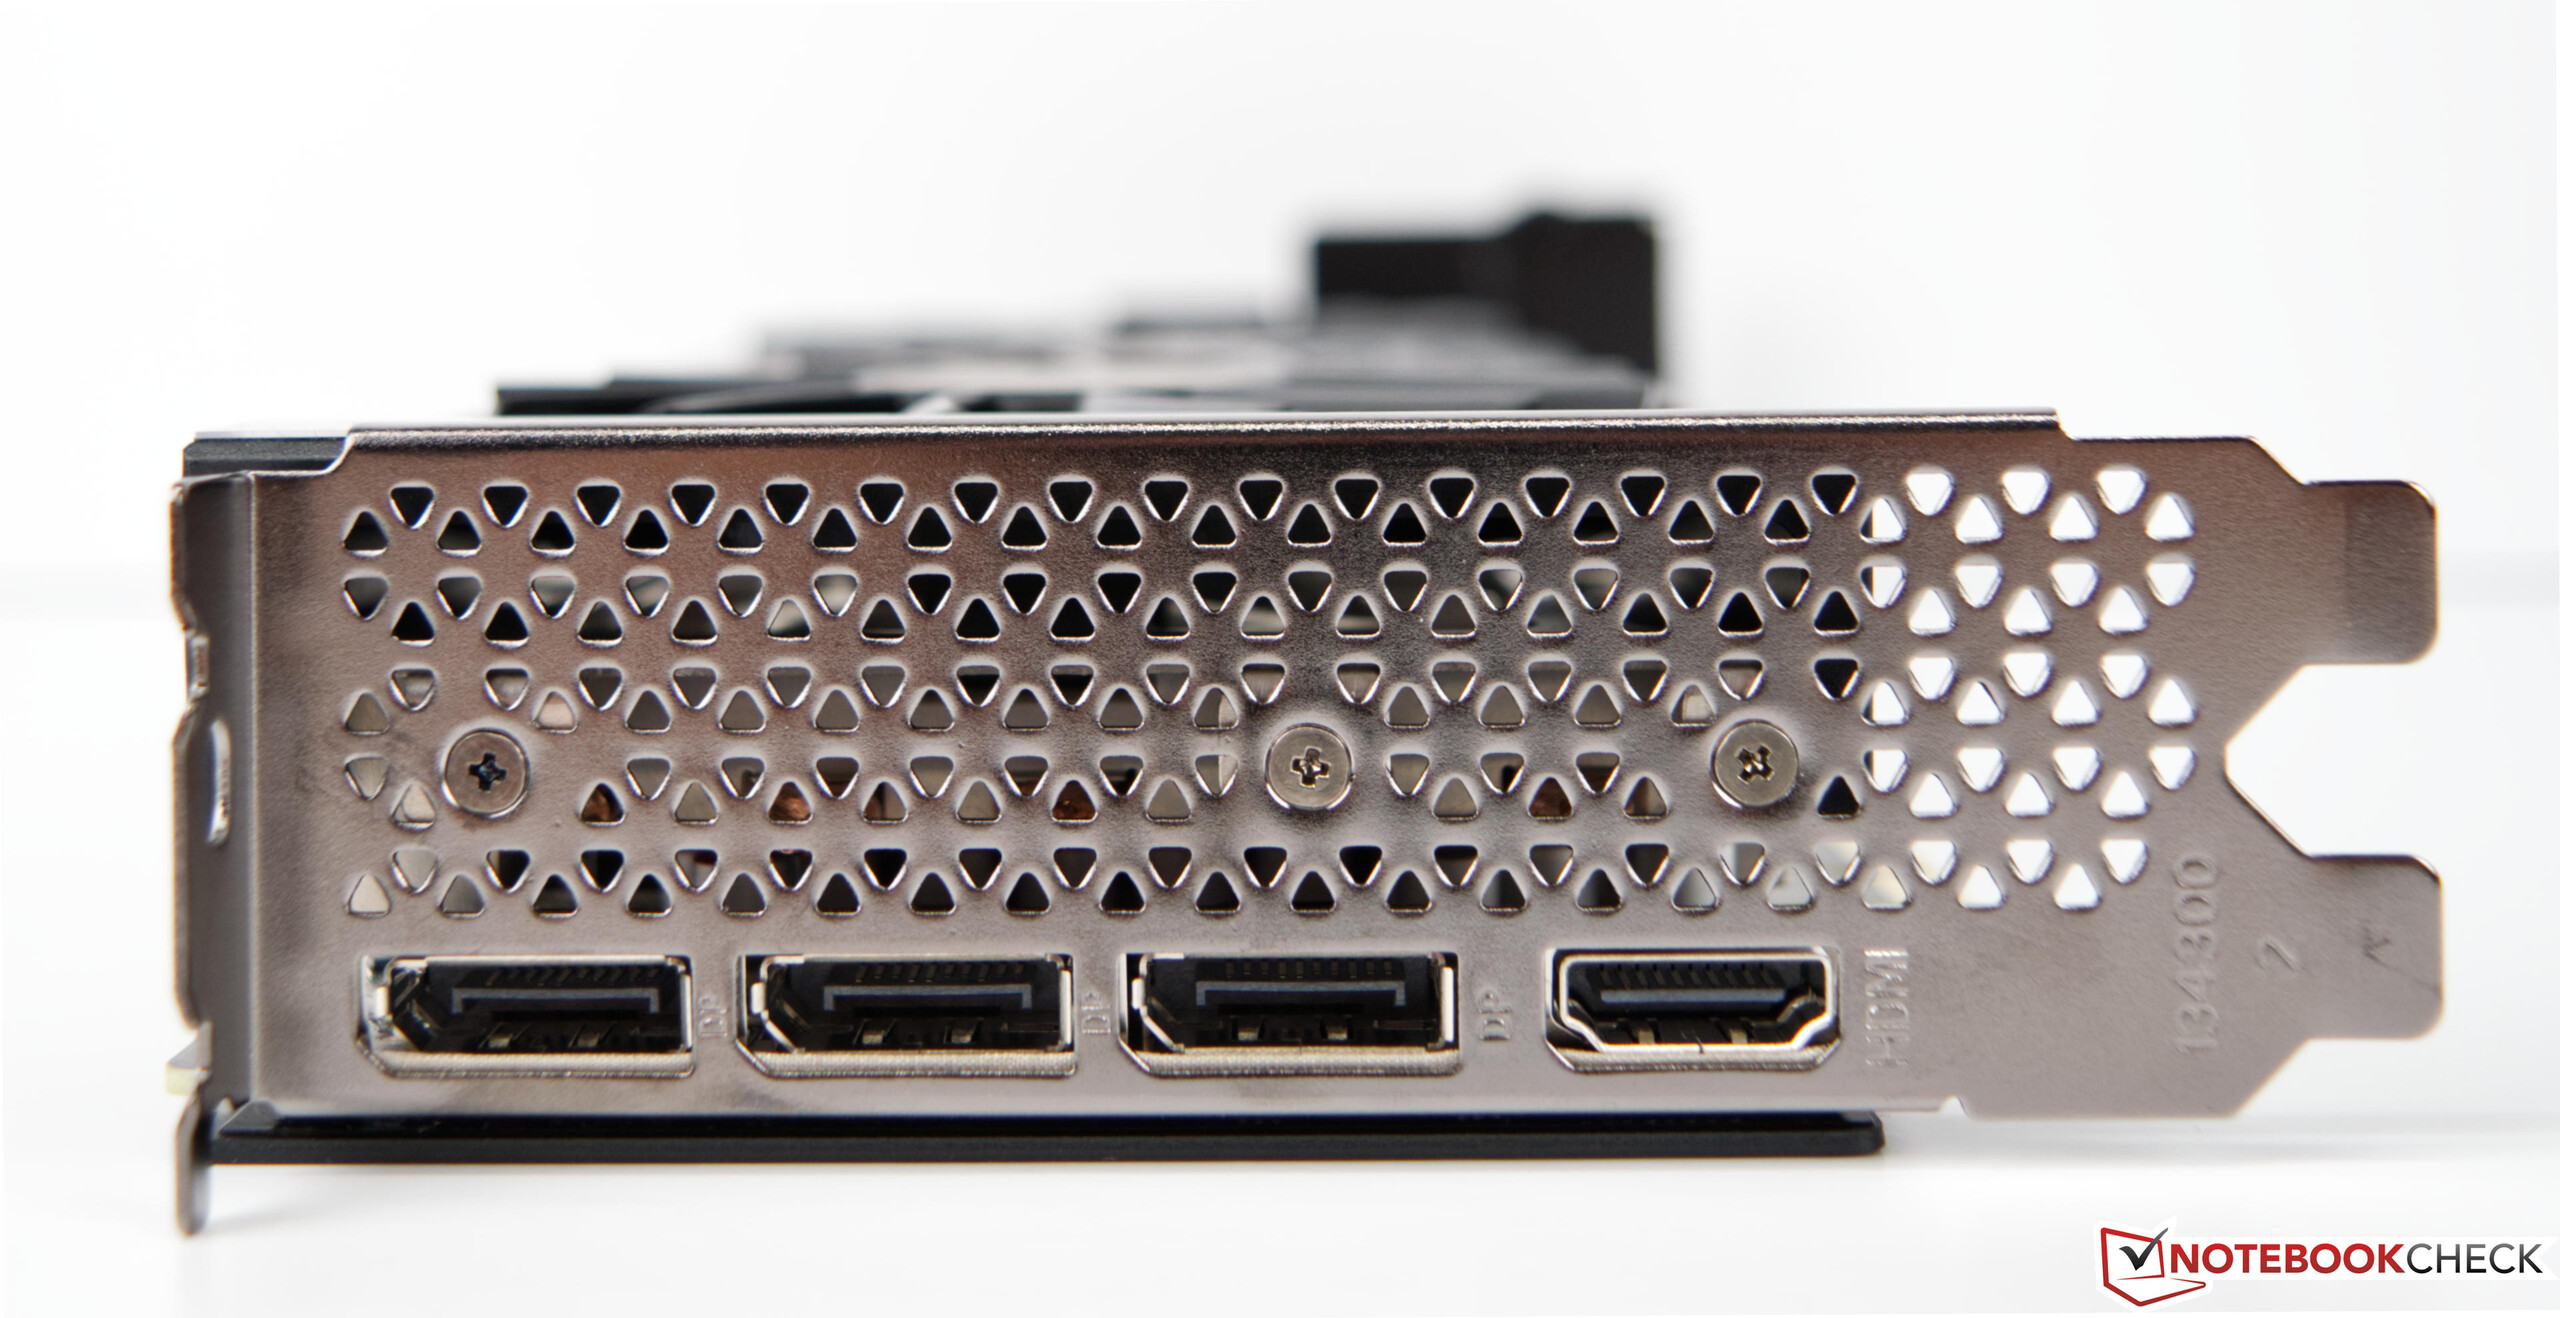
Não há muito o que criticar na seleção da interface. Há um total de 8 portas USB, que estão divididas em 7 TypeA e 1x Type-C. A GPU oferece 3x DisplayPort e HDMI como padrão. No entanto, existe apenas uma LAN Gigabit como interface de rede. Teríamos desejado uma porta LAN 2,5G ou 5G mais rápida aqui. Você também tem que fazer sem um leitor de cartões SD. A distribuição das portas é típica para uma classe de dispositivos. Assim, não é surpreendente que a maioria das interfaces sejam encontradas na parte de trás. No entanto, as portas USB na frente são um pouco difíceis de alcançar devido à construção da caixa.
Comunicação
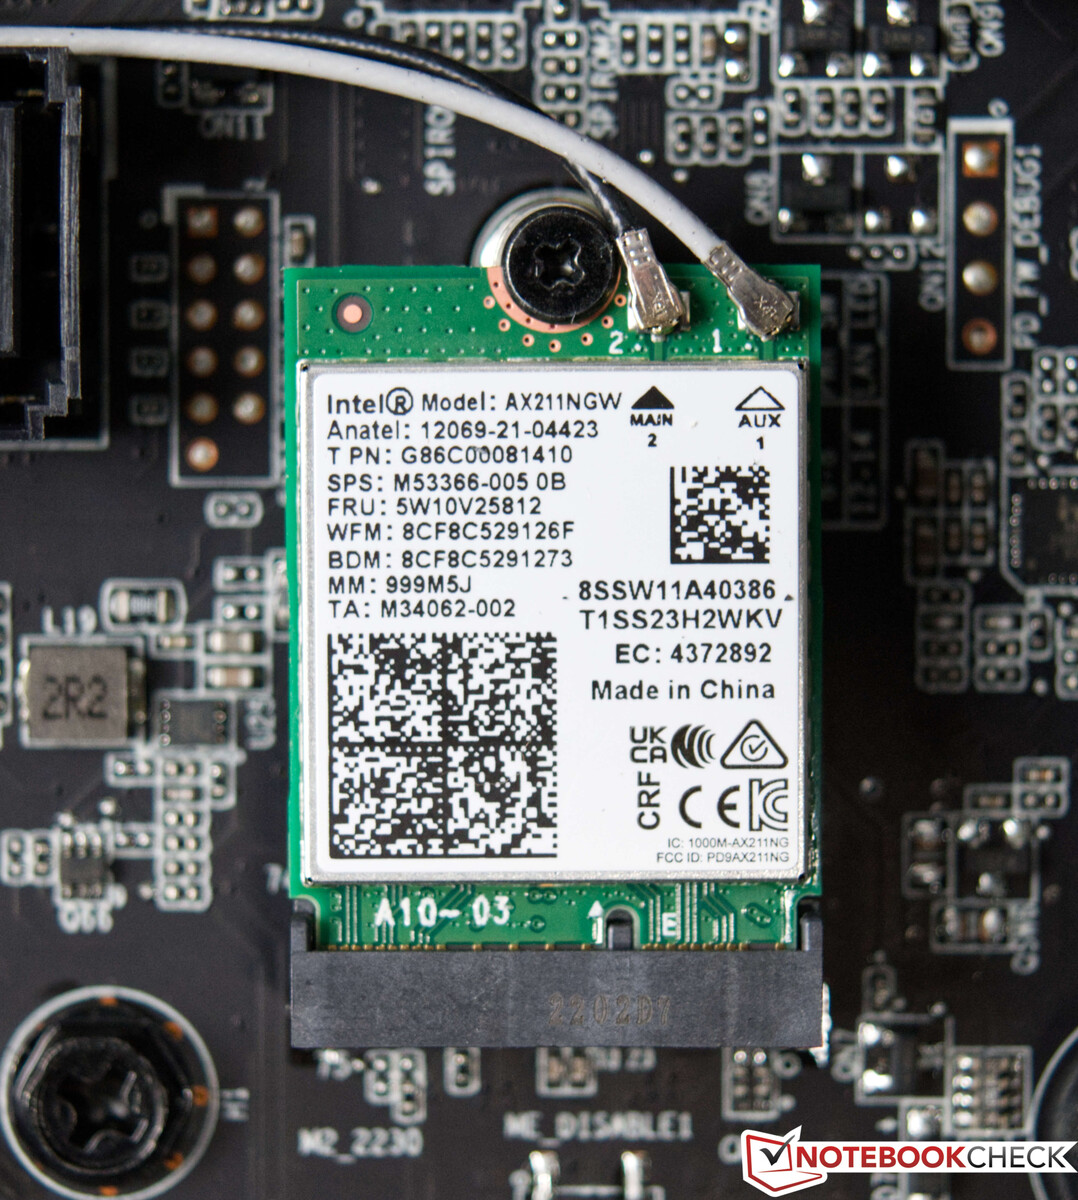
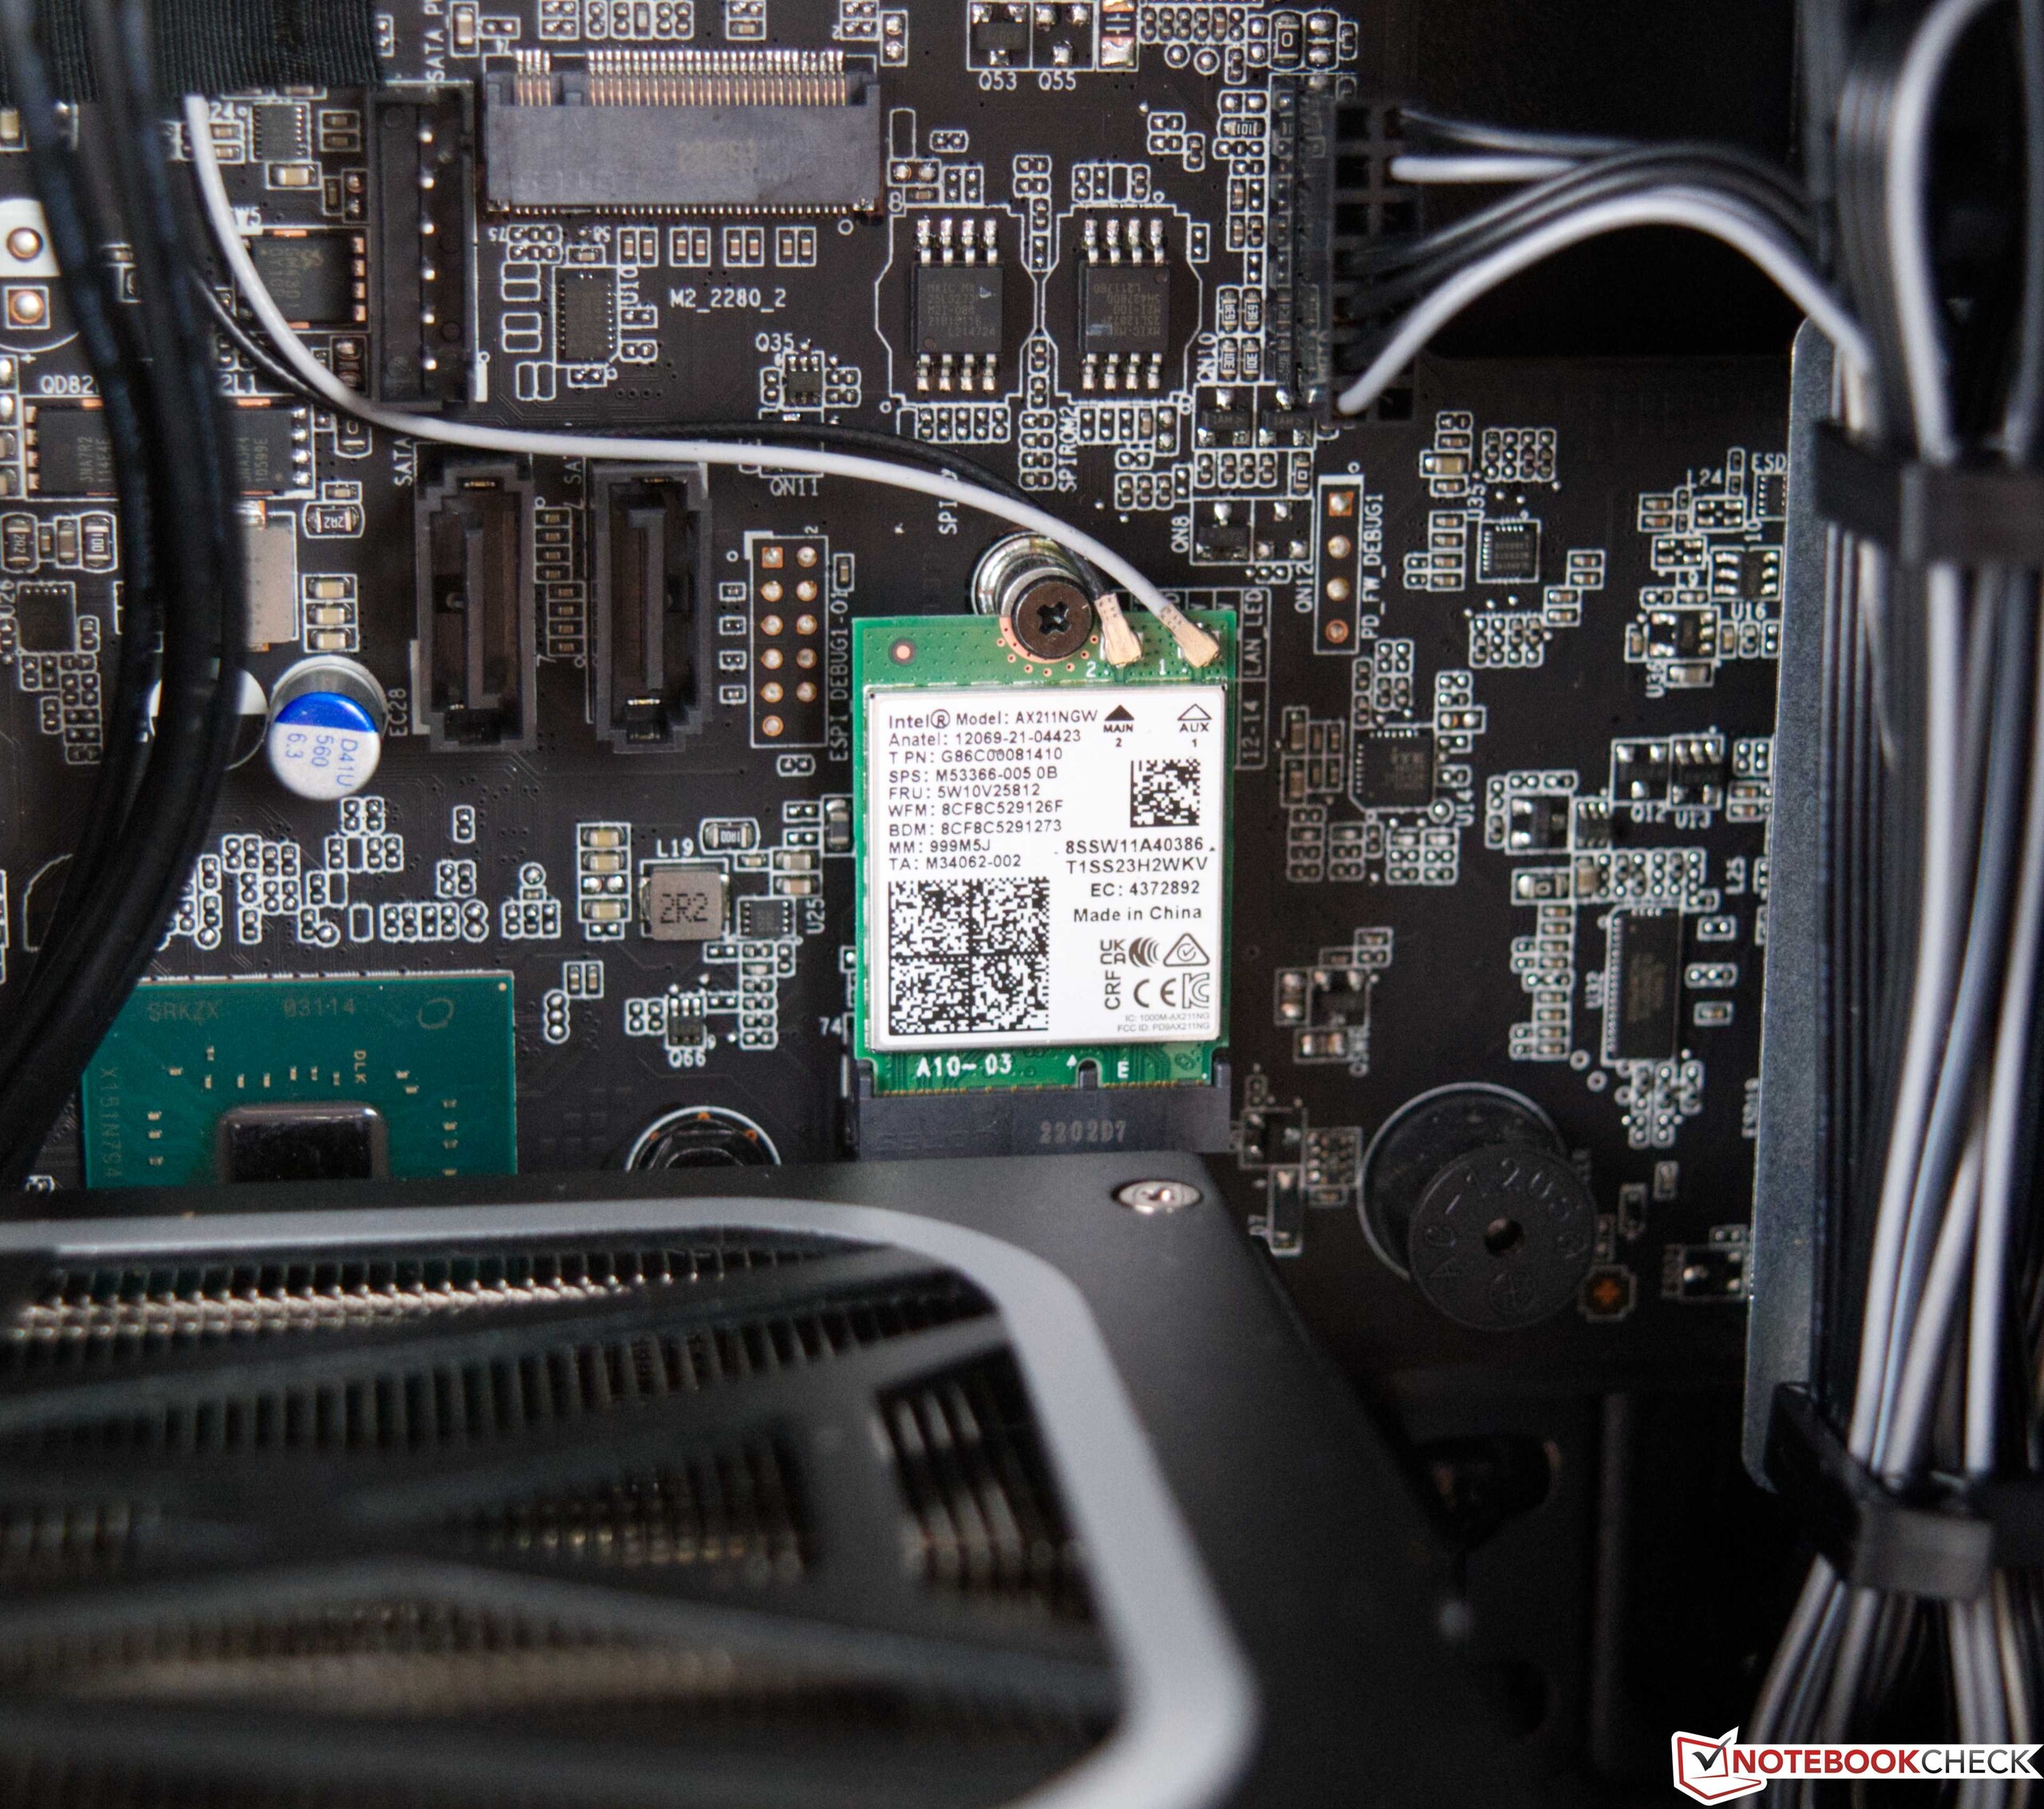
A Acer também equipa o Predator com um módulo Intel Wi-Fi 6E AX211. Ele está localizado como um cartão M.2 plug-in diretamente na placa-mãe e oferece taxas de transferência relativamente boas. No entanto, o desempenho do Intel Wi-Fi 6E AX211 na recepção de dados não consegue acompanhar as boas taxas de transmissão. Os dispositivos de comparação oferecem, em parte, melhores taxas aqui. Entretanto, o teste diário mostrou que você também pode gerenciar bem com o módulo WLAN instalado. Não tivemos nenhum problema usando a conexão sem fio. Como alternativa, o usuário pode usar uma porta RJ45 que depende de um chip E2600 killer. Infelizmente, isto oferece apenas um máximo de 1 GBit/s.
Acessórios
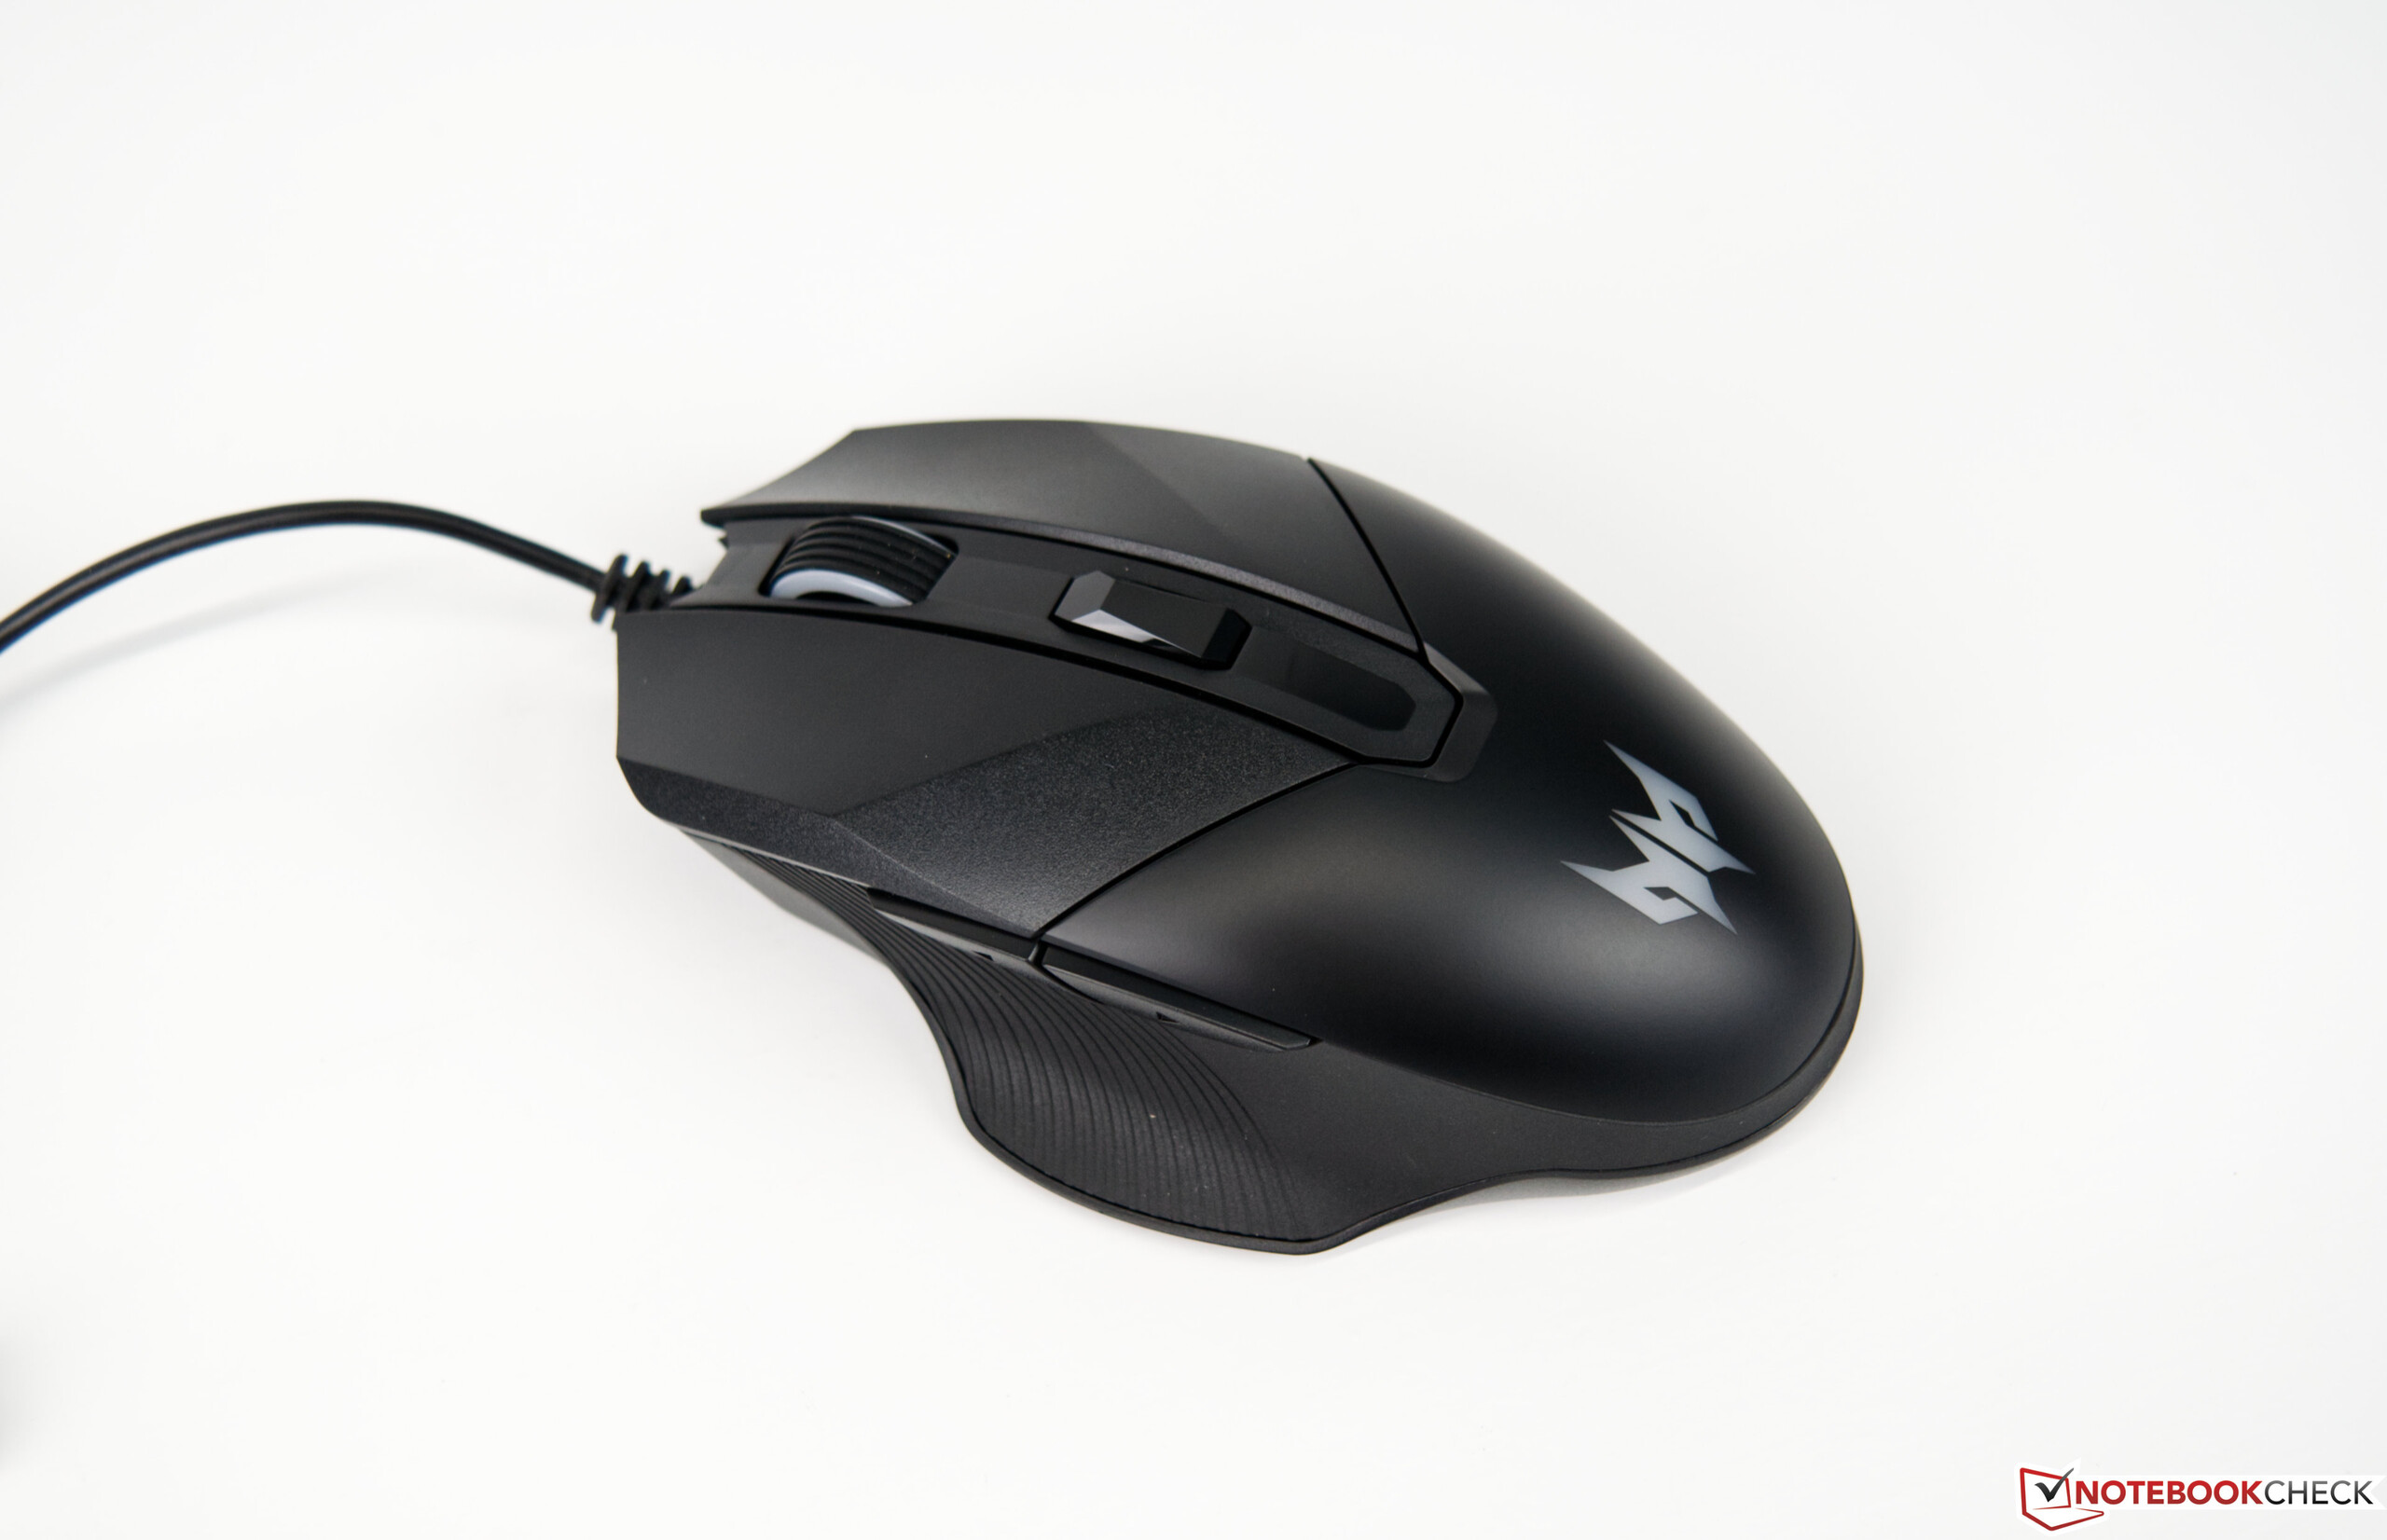
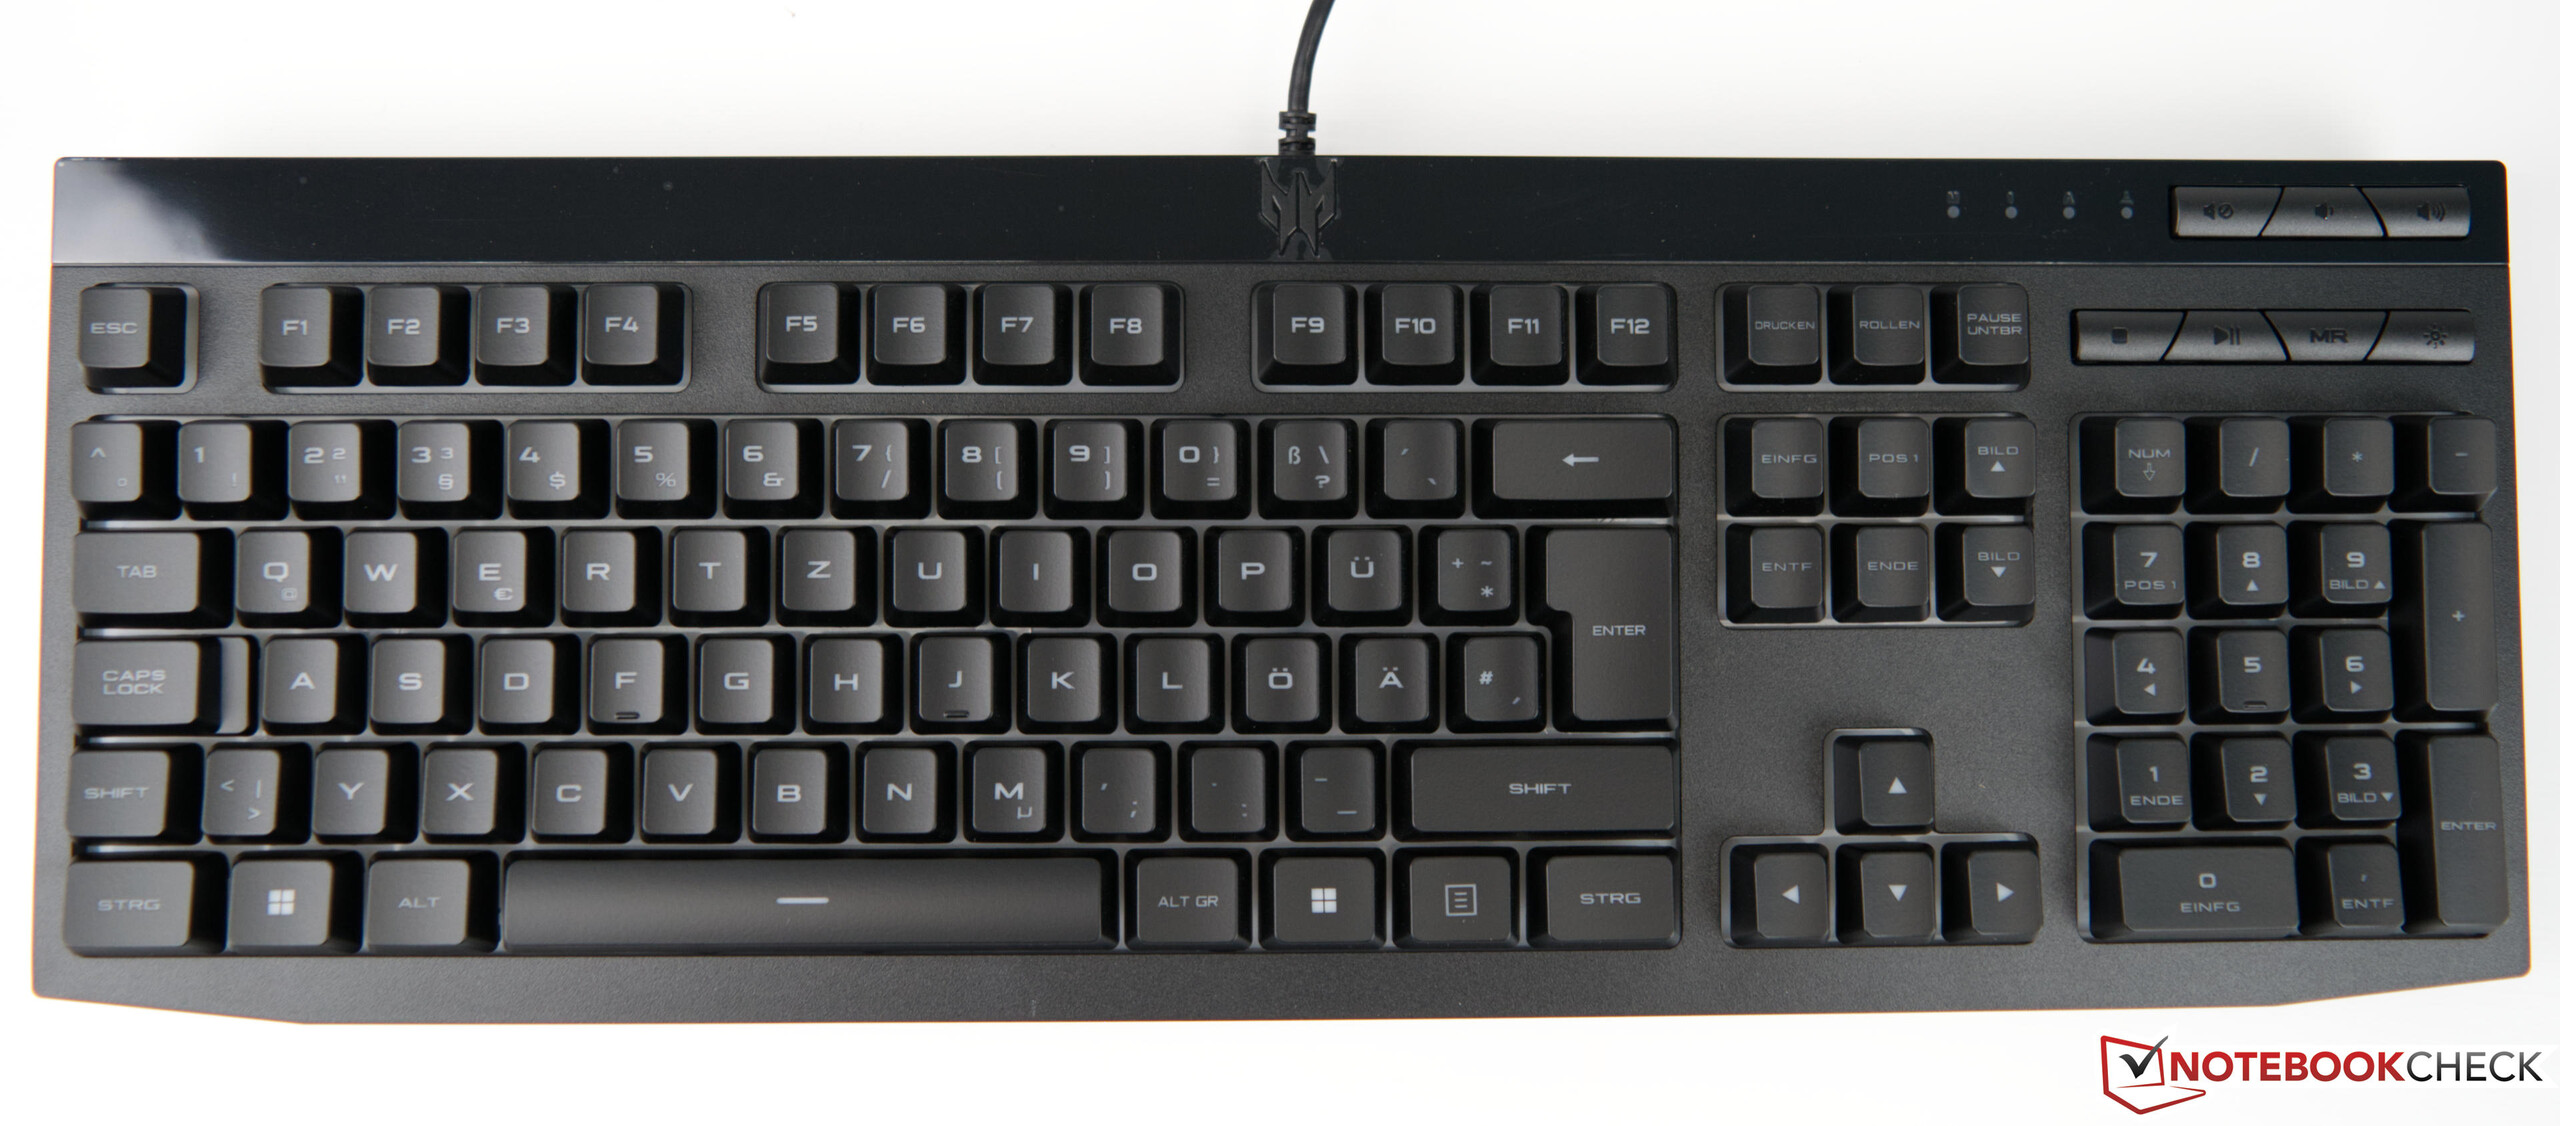
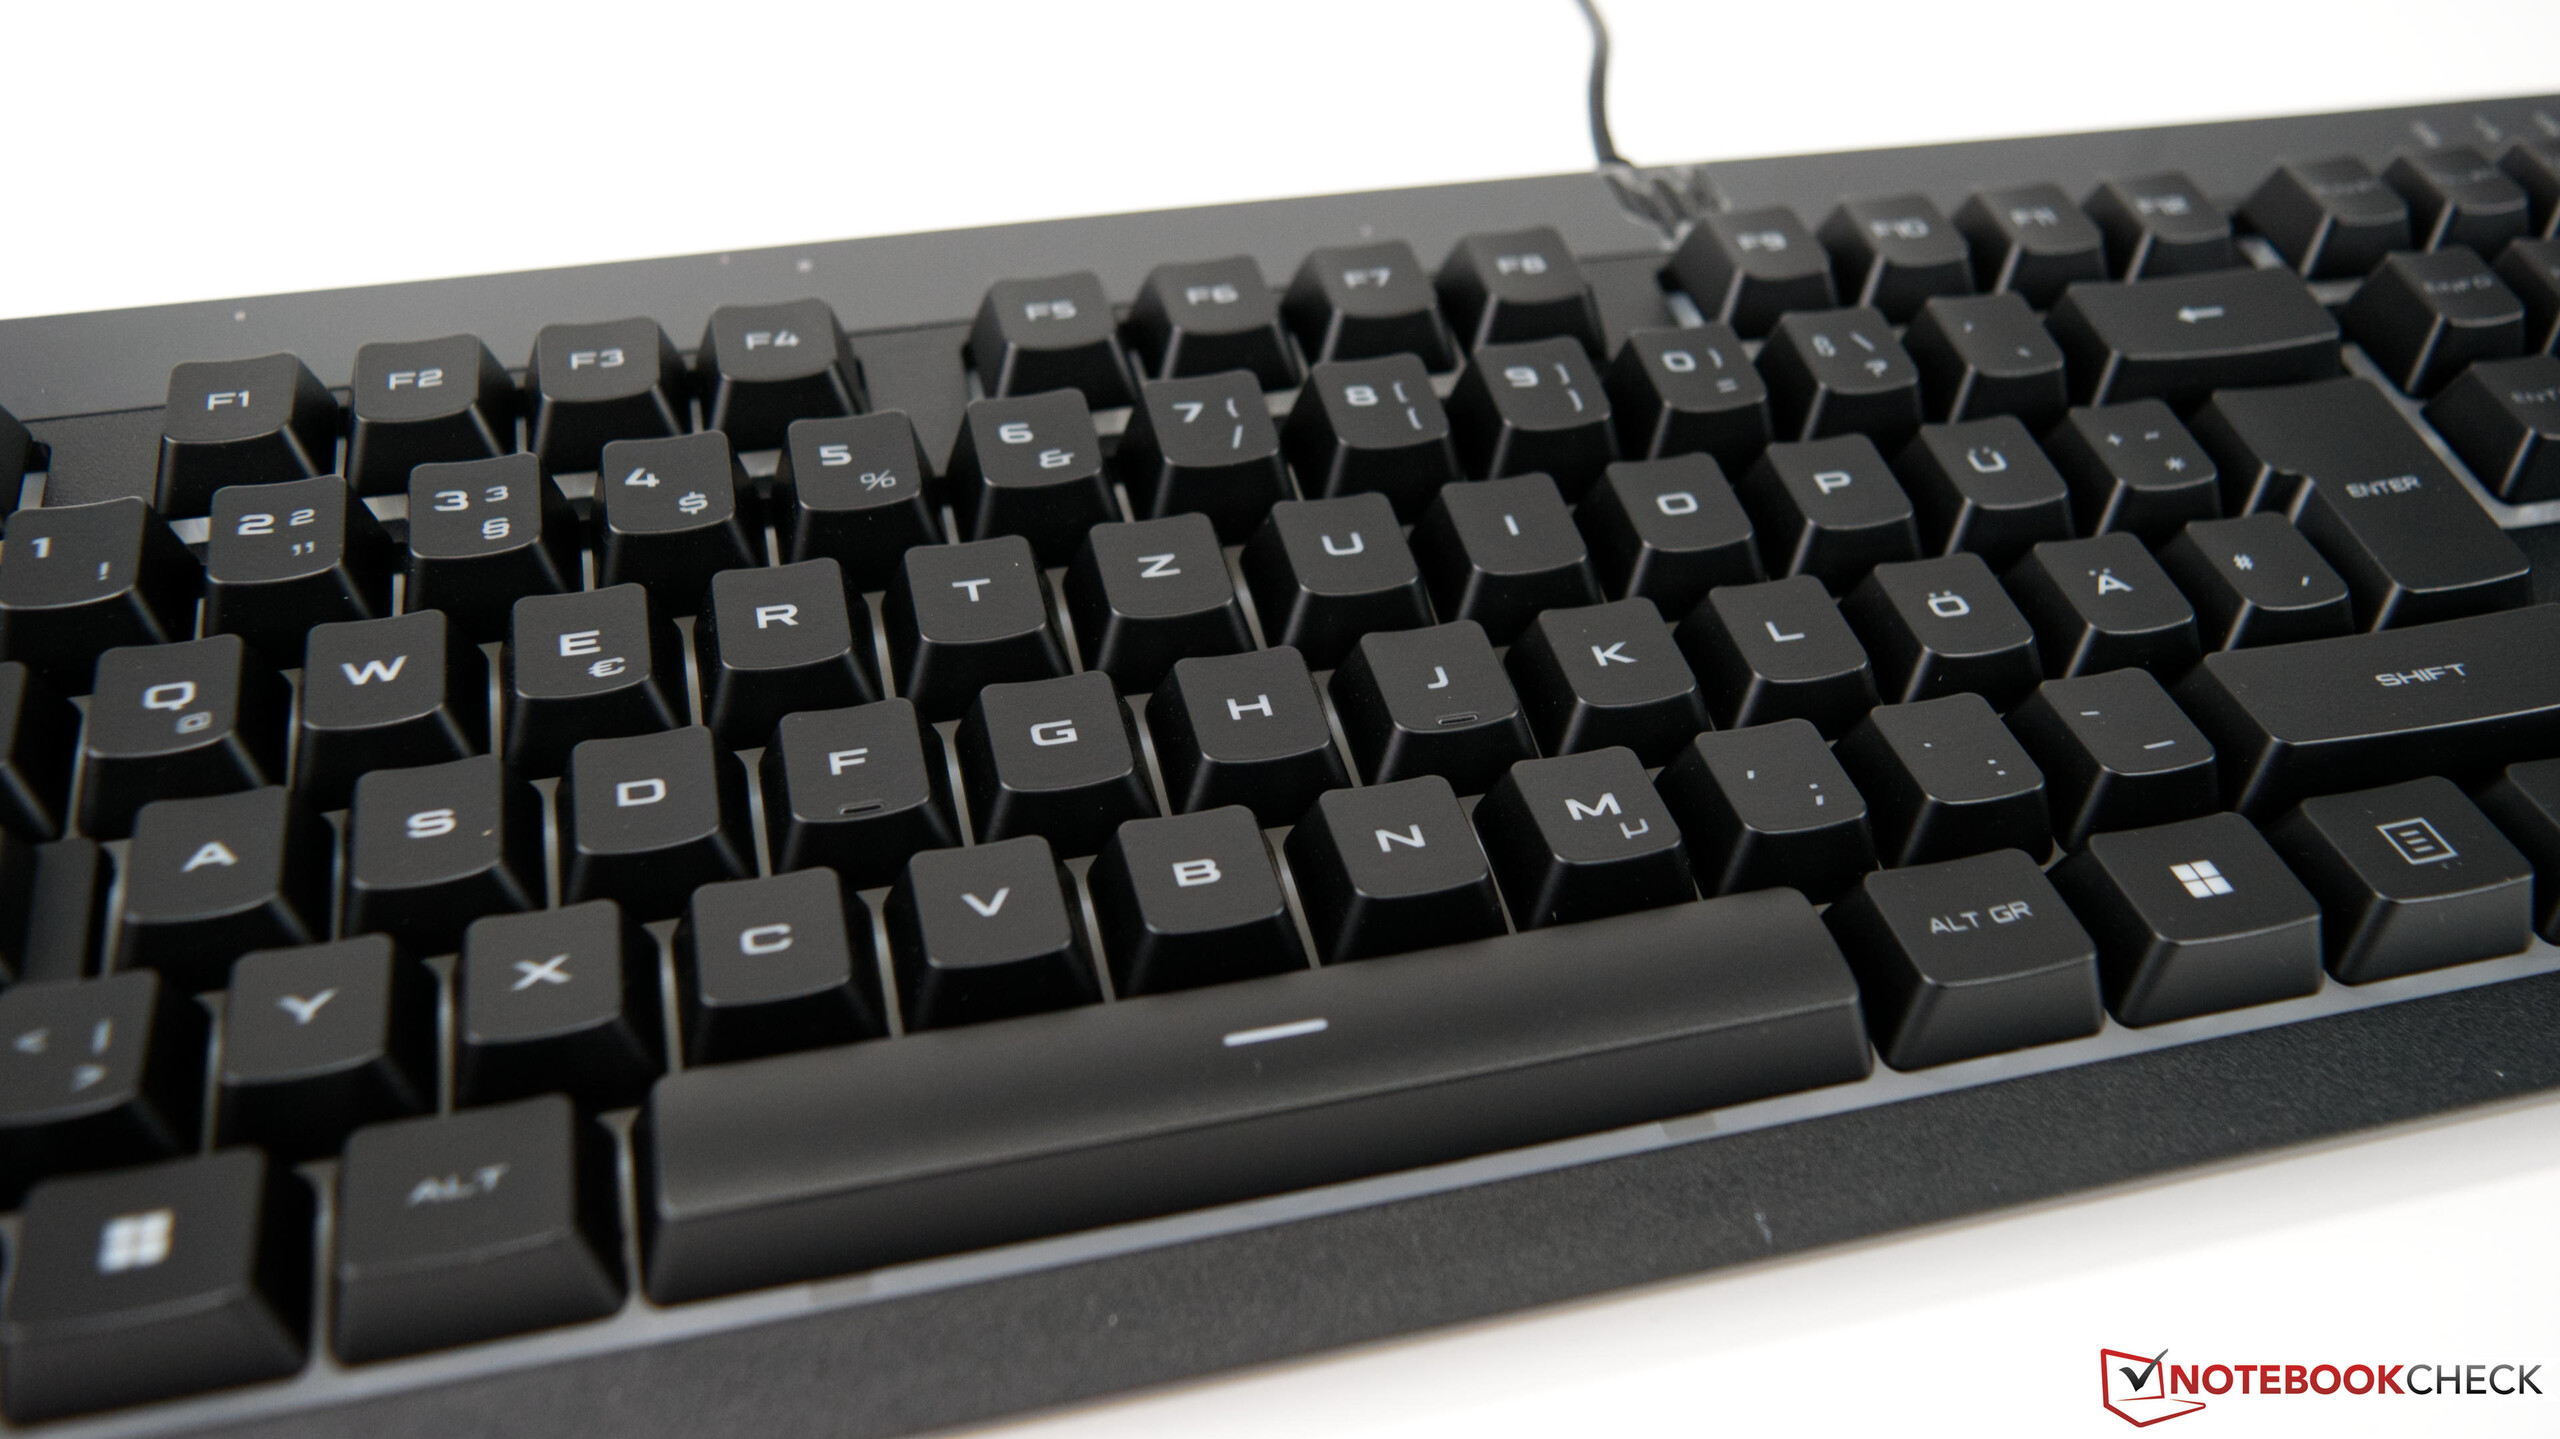
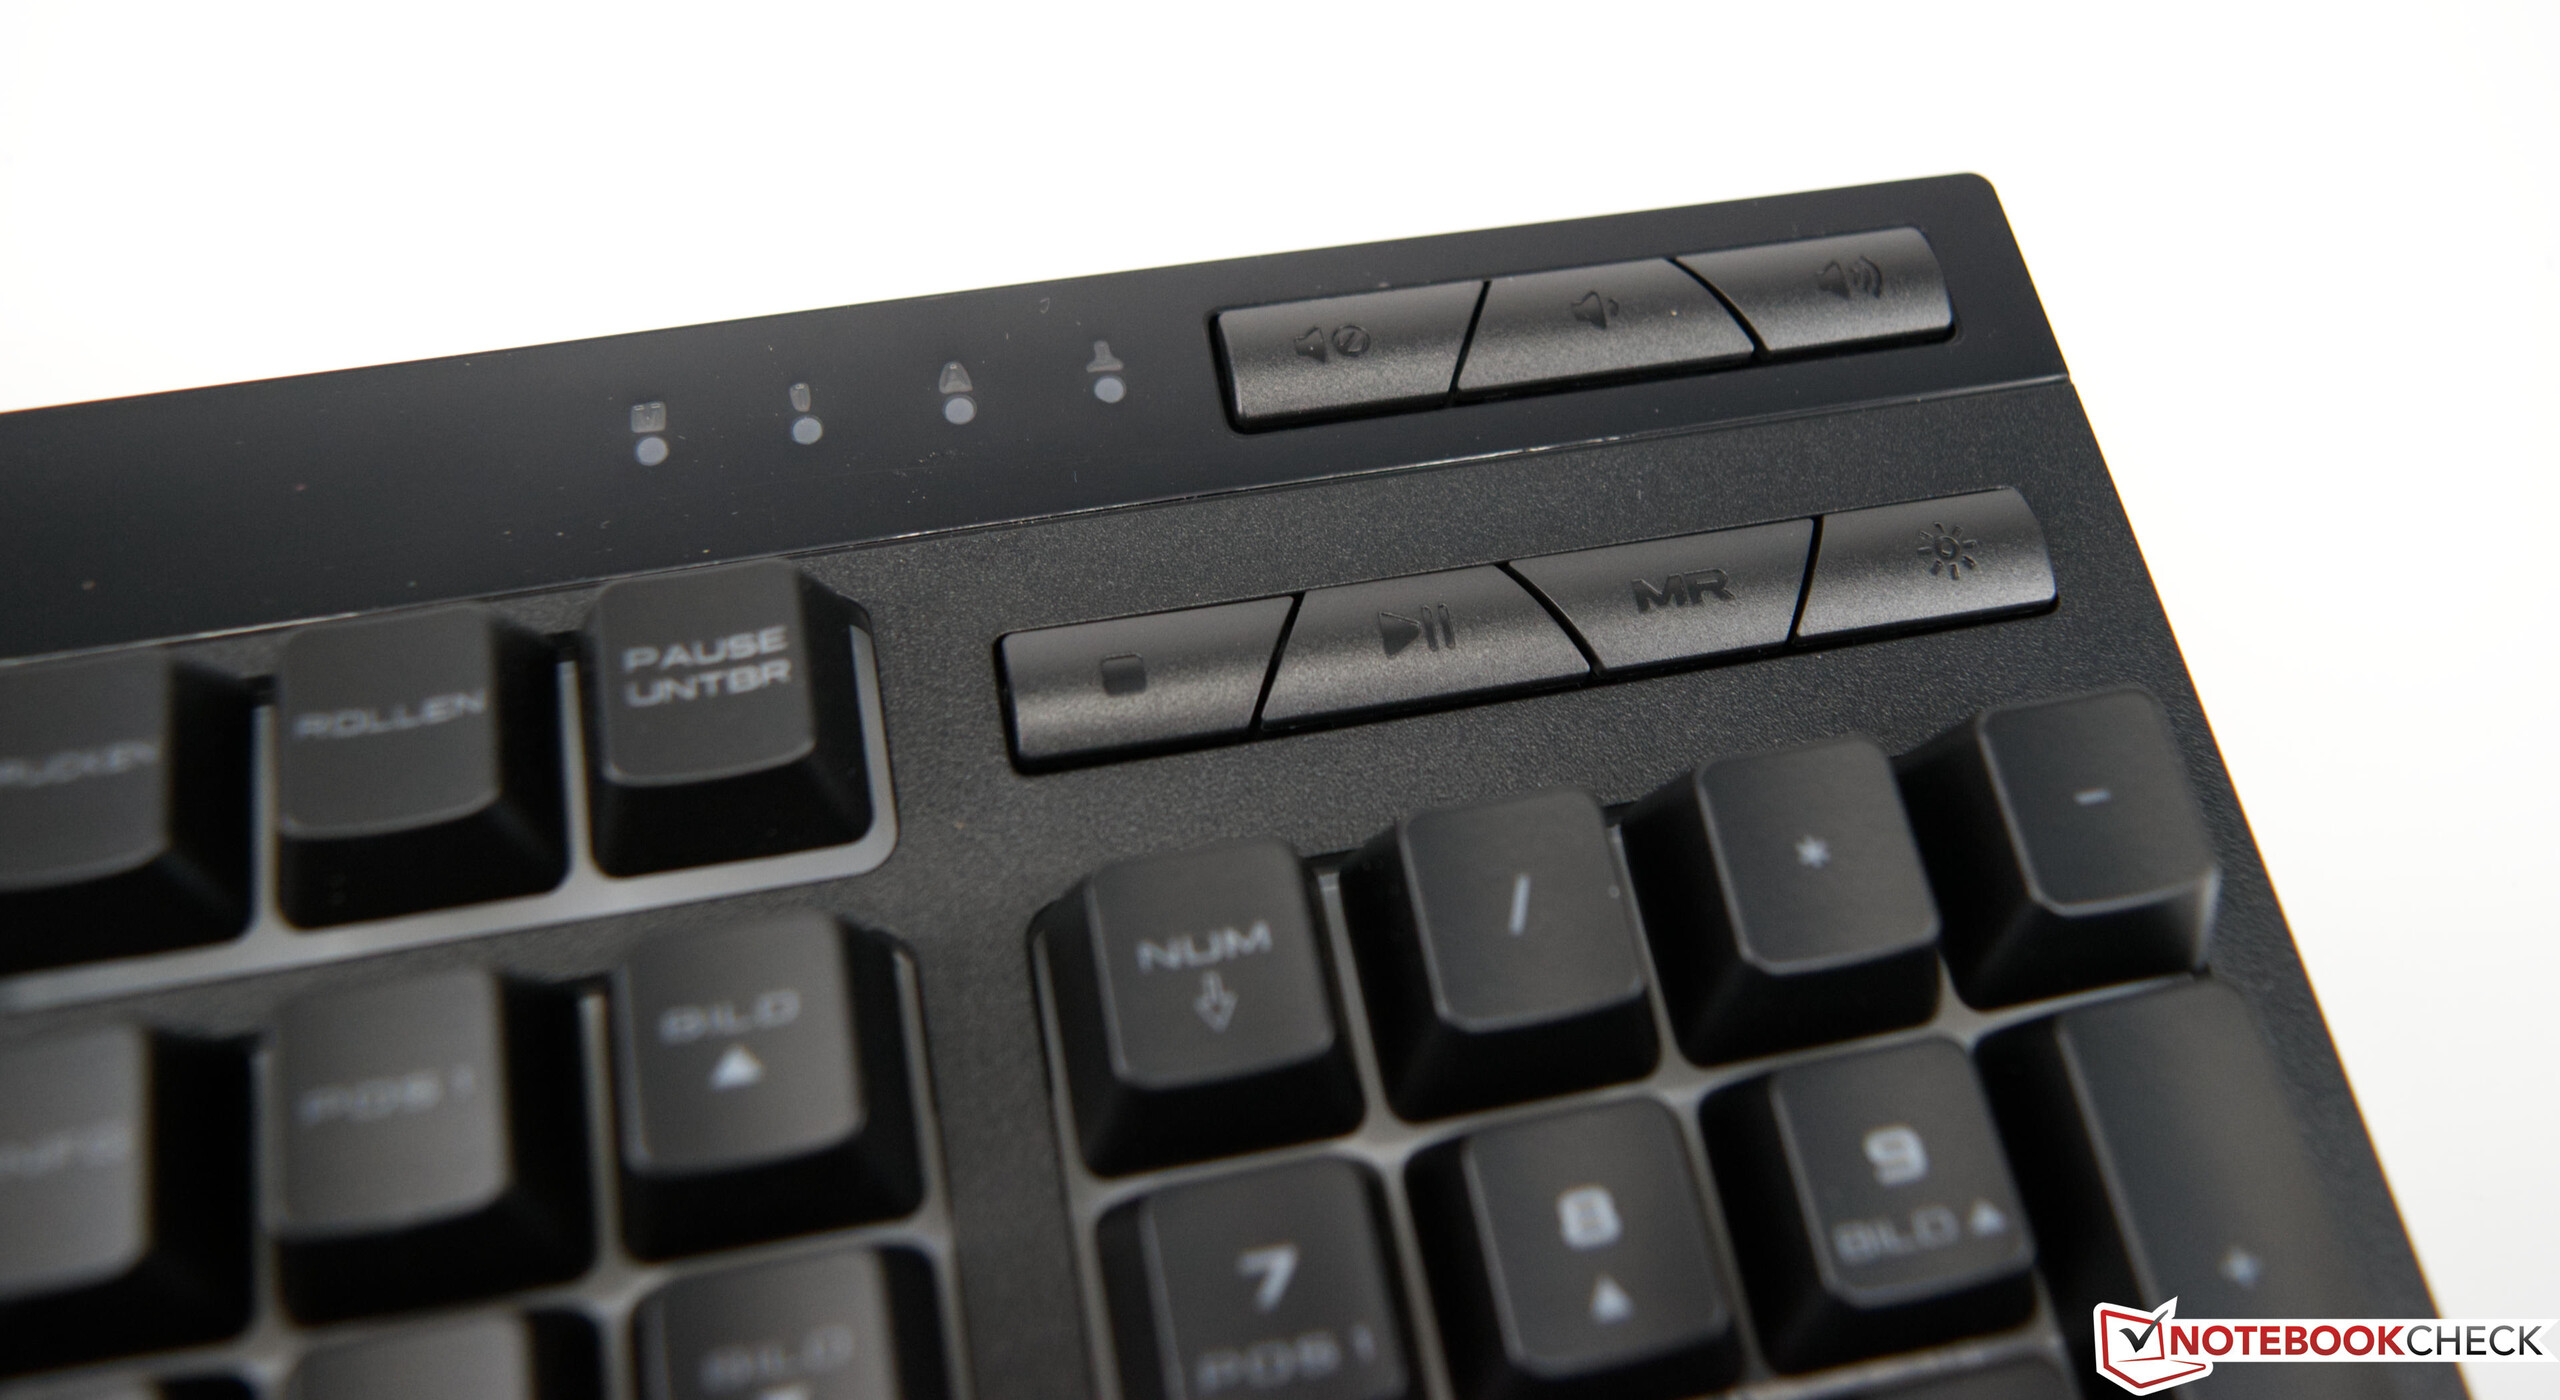
Se você comprar um Acer Predator Orion 3000, você também receberá um teclado e um mouse para jogos, que também vem no estilo Predator. Assim, você está bem preparado para o início e o hardware proporciona uma impressão geral coerente. A torre também pode ser atualizada com o painel lateral opcional, incluindo uma janela de visualização. Isto mostra a iluminação RGB embutida para uma melhor vantagem.
Manutenção
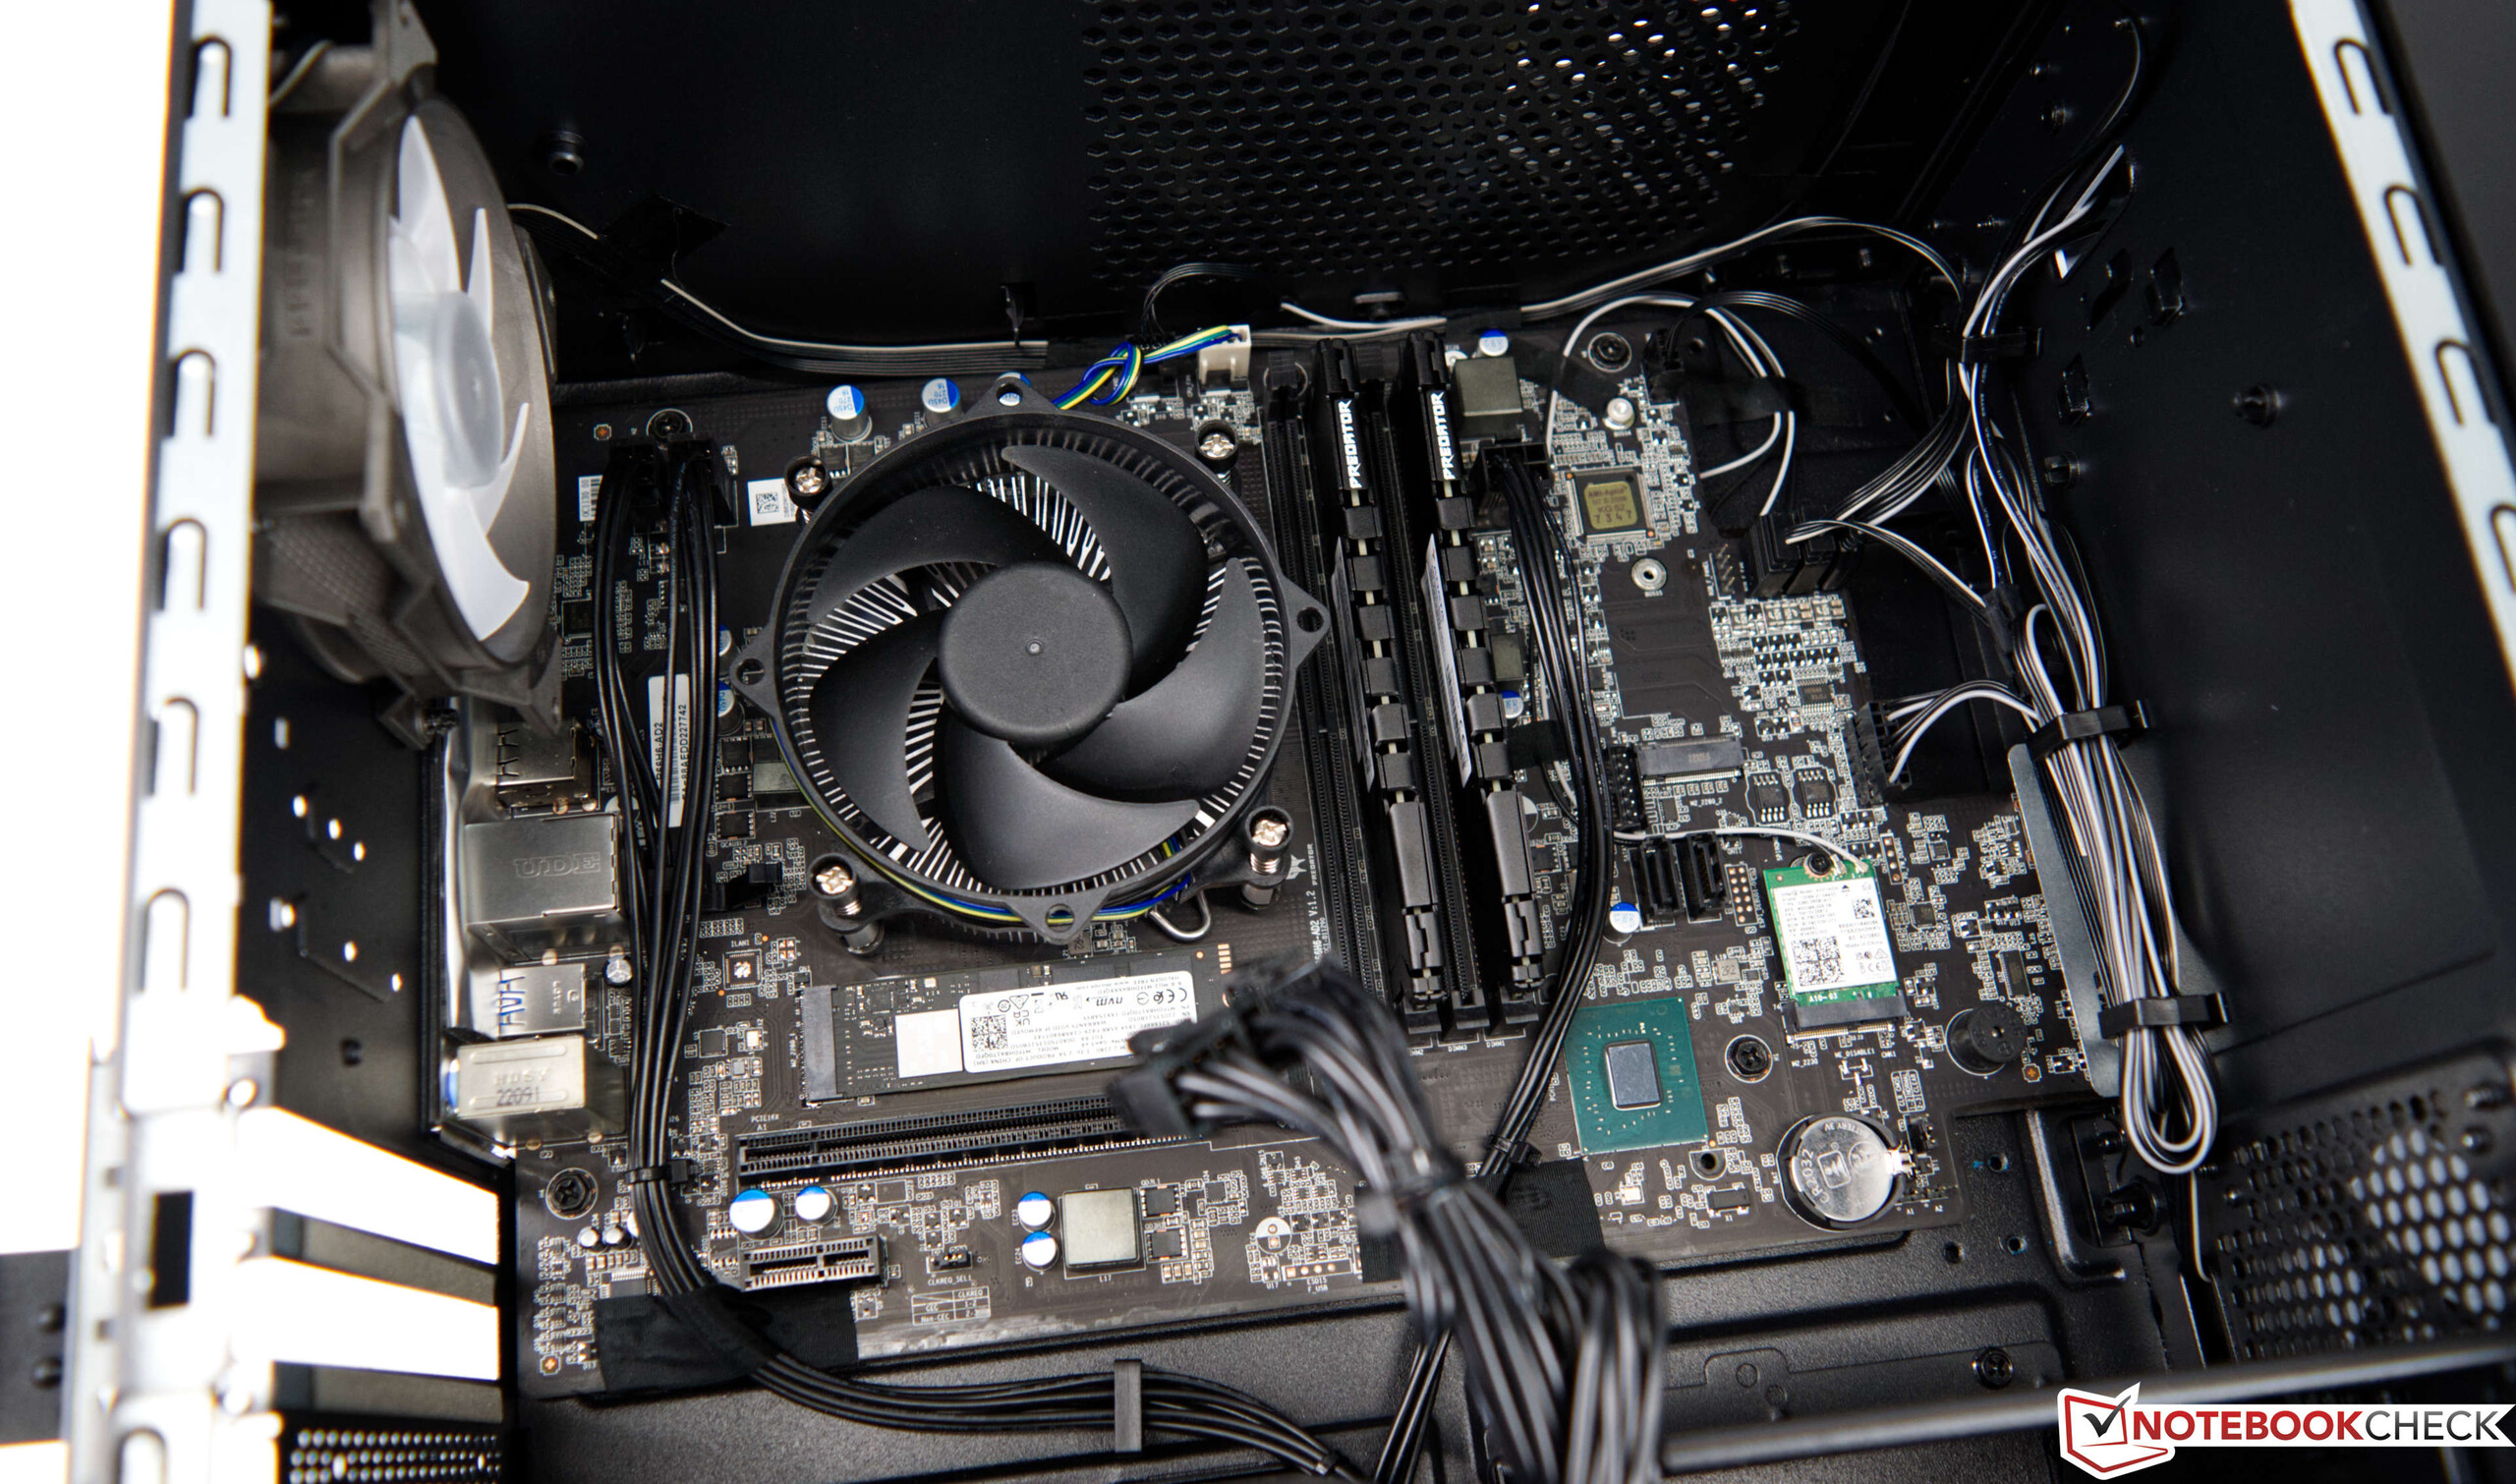
A manutenção não é um grande problema para o Acer Predator Orion 3000. O painel lateral é fixado com dois parafusos e pode ser removido facilmente. Os componentes internos são de fácil acesso. Por exemplo, o armazenamento em massa pode ser expandido com um segundo módulo M.2. Alternativamente, até dois discos rígidos convencionais de 3,5 polegadas podem ser acomodados.
Desempenho - Núcleo i7-12700F Braked-in
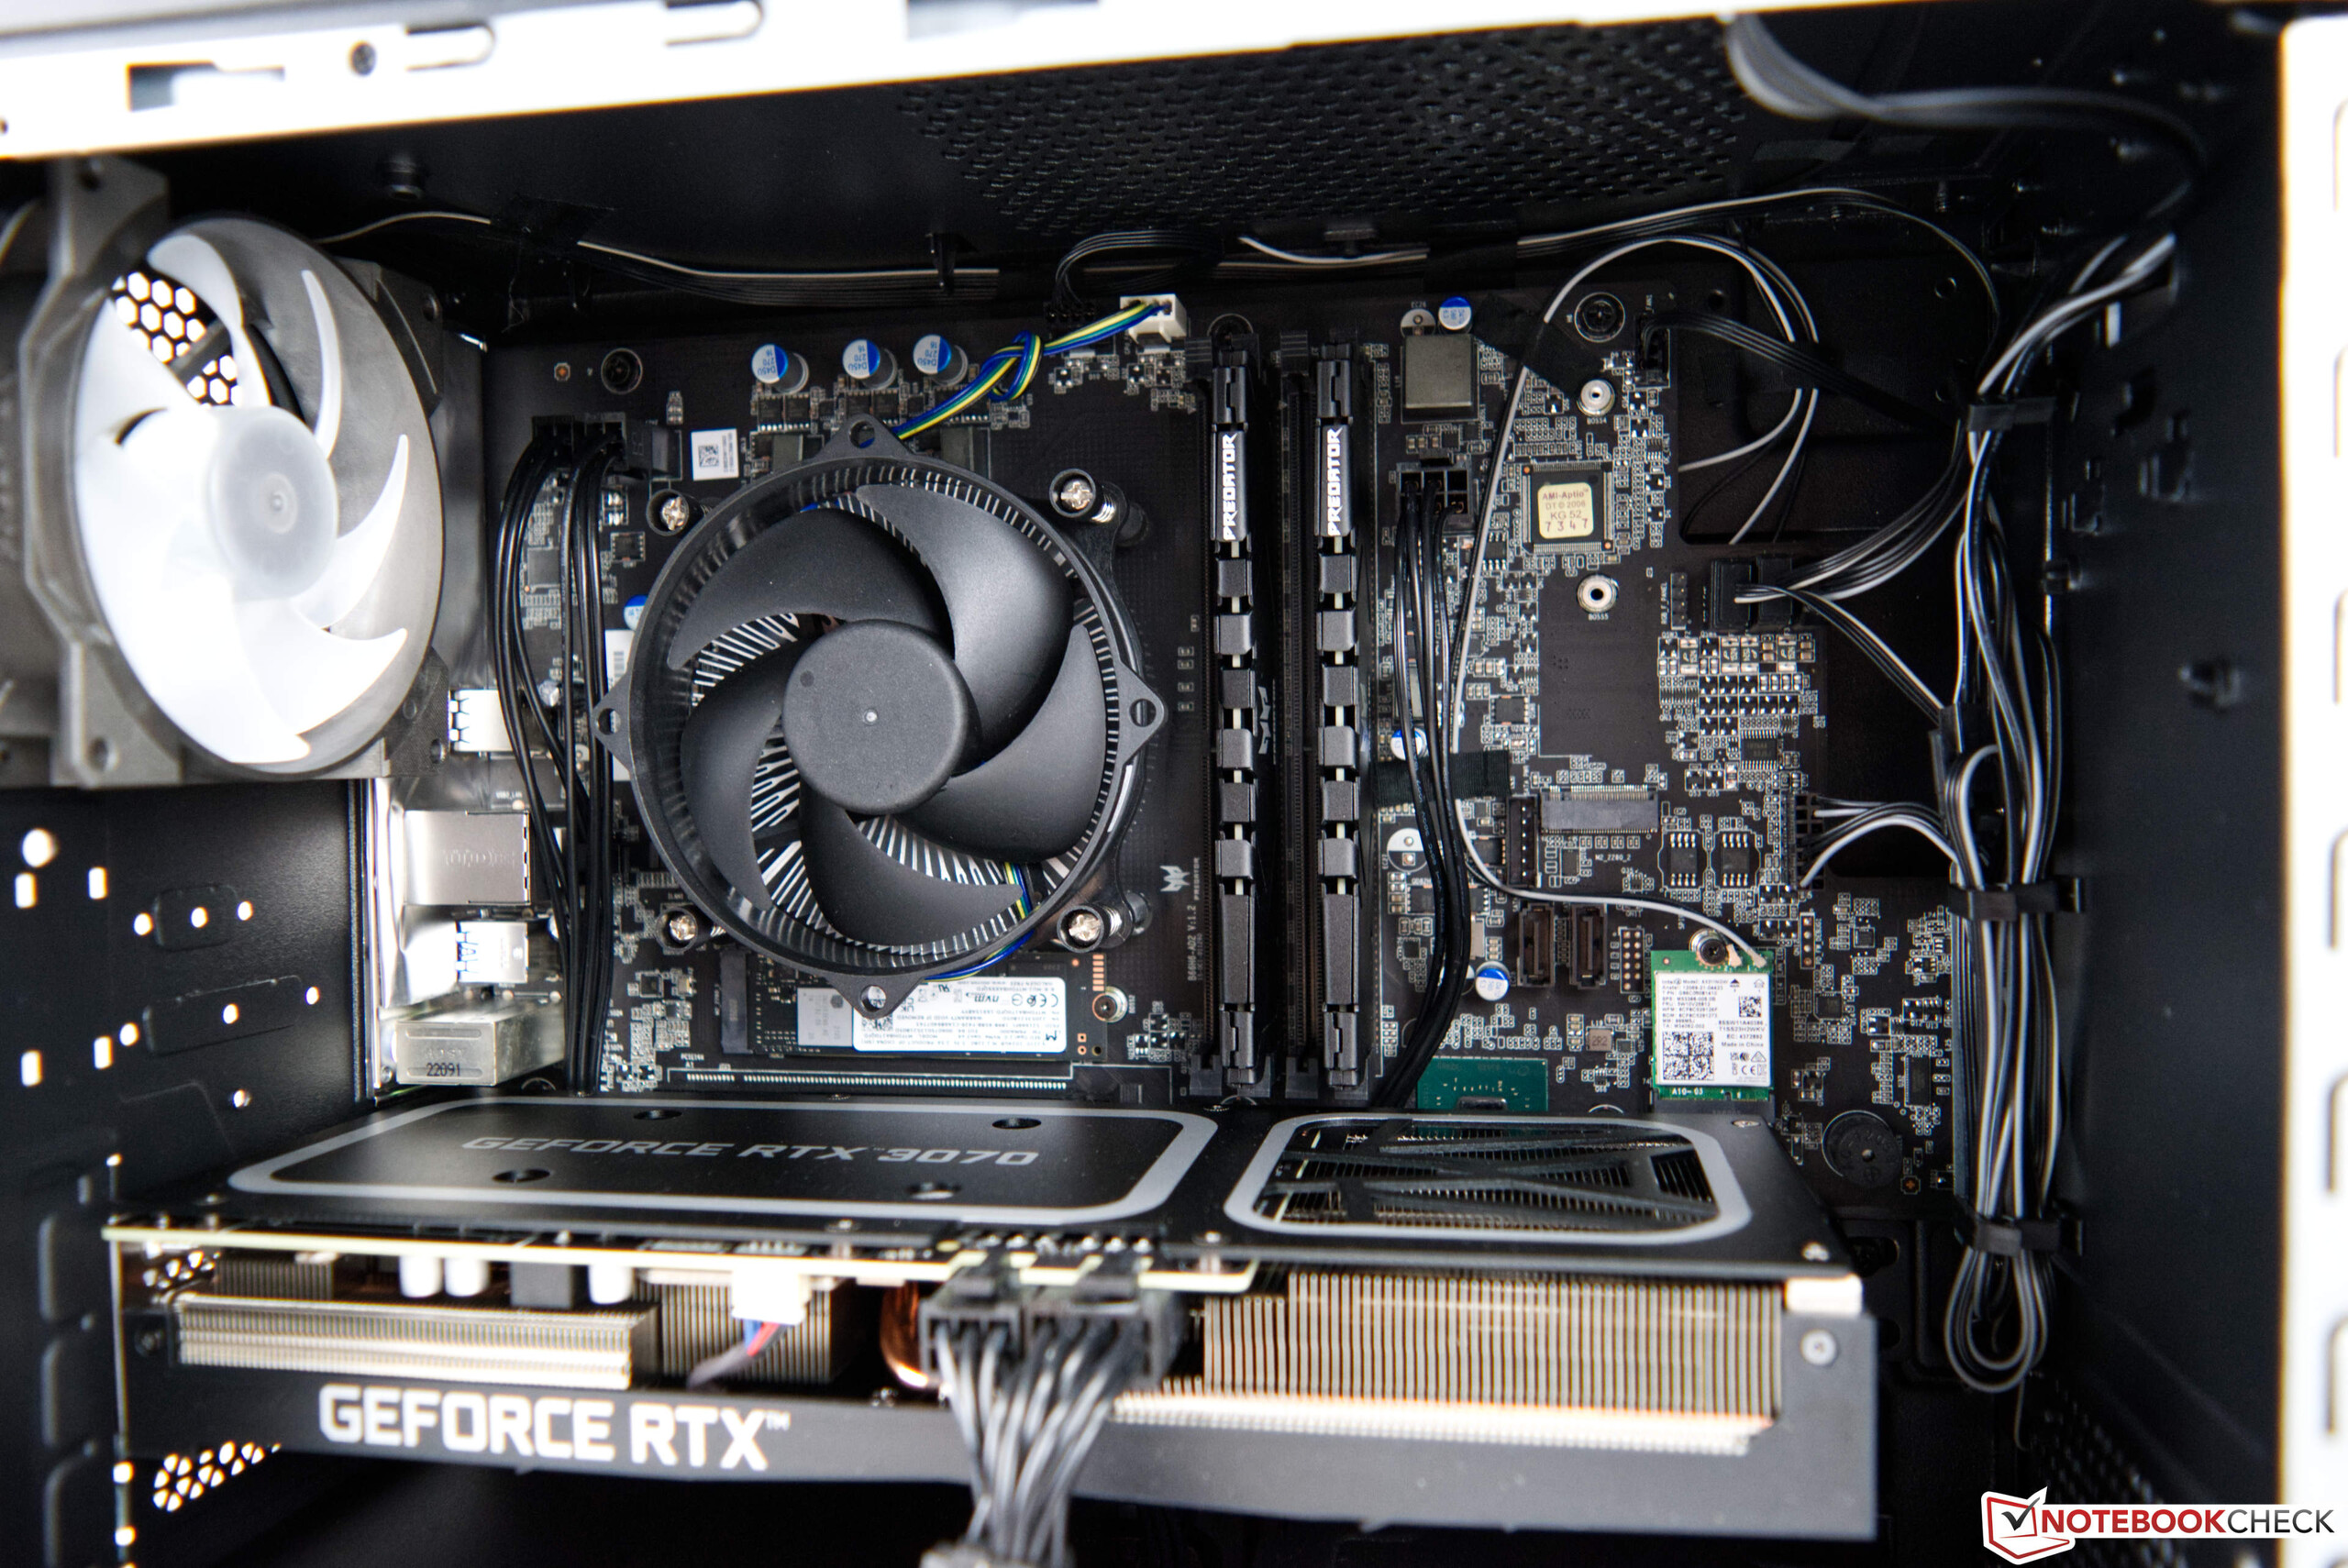
A versão atual do Predator Orion 3000 da Acer está sempre equipada com uma CPU frugal de 65 watts. Assim, o modelo mais forte é equipado com o Intel Core i7-12700F. Isto oferece muito bom desempenho e pode sempre proporcionar a melhor velocidade para a respectiva aplicação, graças à arquitetura híbrida com núcleos E e P. Em uma configuração mais barata, você também pode obter o Predator Orion 3000 com um Intel Core i5-12400. Isto também oferece um bom desempenho em jogos, mas tem que ser feito sem os E-cores. Como uma placa gráfica, você recebe pelo menos um GeForce RTX 3060que é projetado para jogos de 1080p. Mais desempenho está disponível com o GeForce RTX 3070que também permite jogos de 1440p.
Condições de teste
Realizamos todos os testes com o perfil energético de desempenho máximo
. Também não utilizamos o painel lateral transparente no caso. As velocidades do ventilador também podem ser configuradas através da ferramenta Predator Sense
. Mantivemos a configuração automática para alcançar um bom compromisso entre ruído e desempenho.
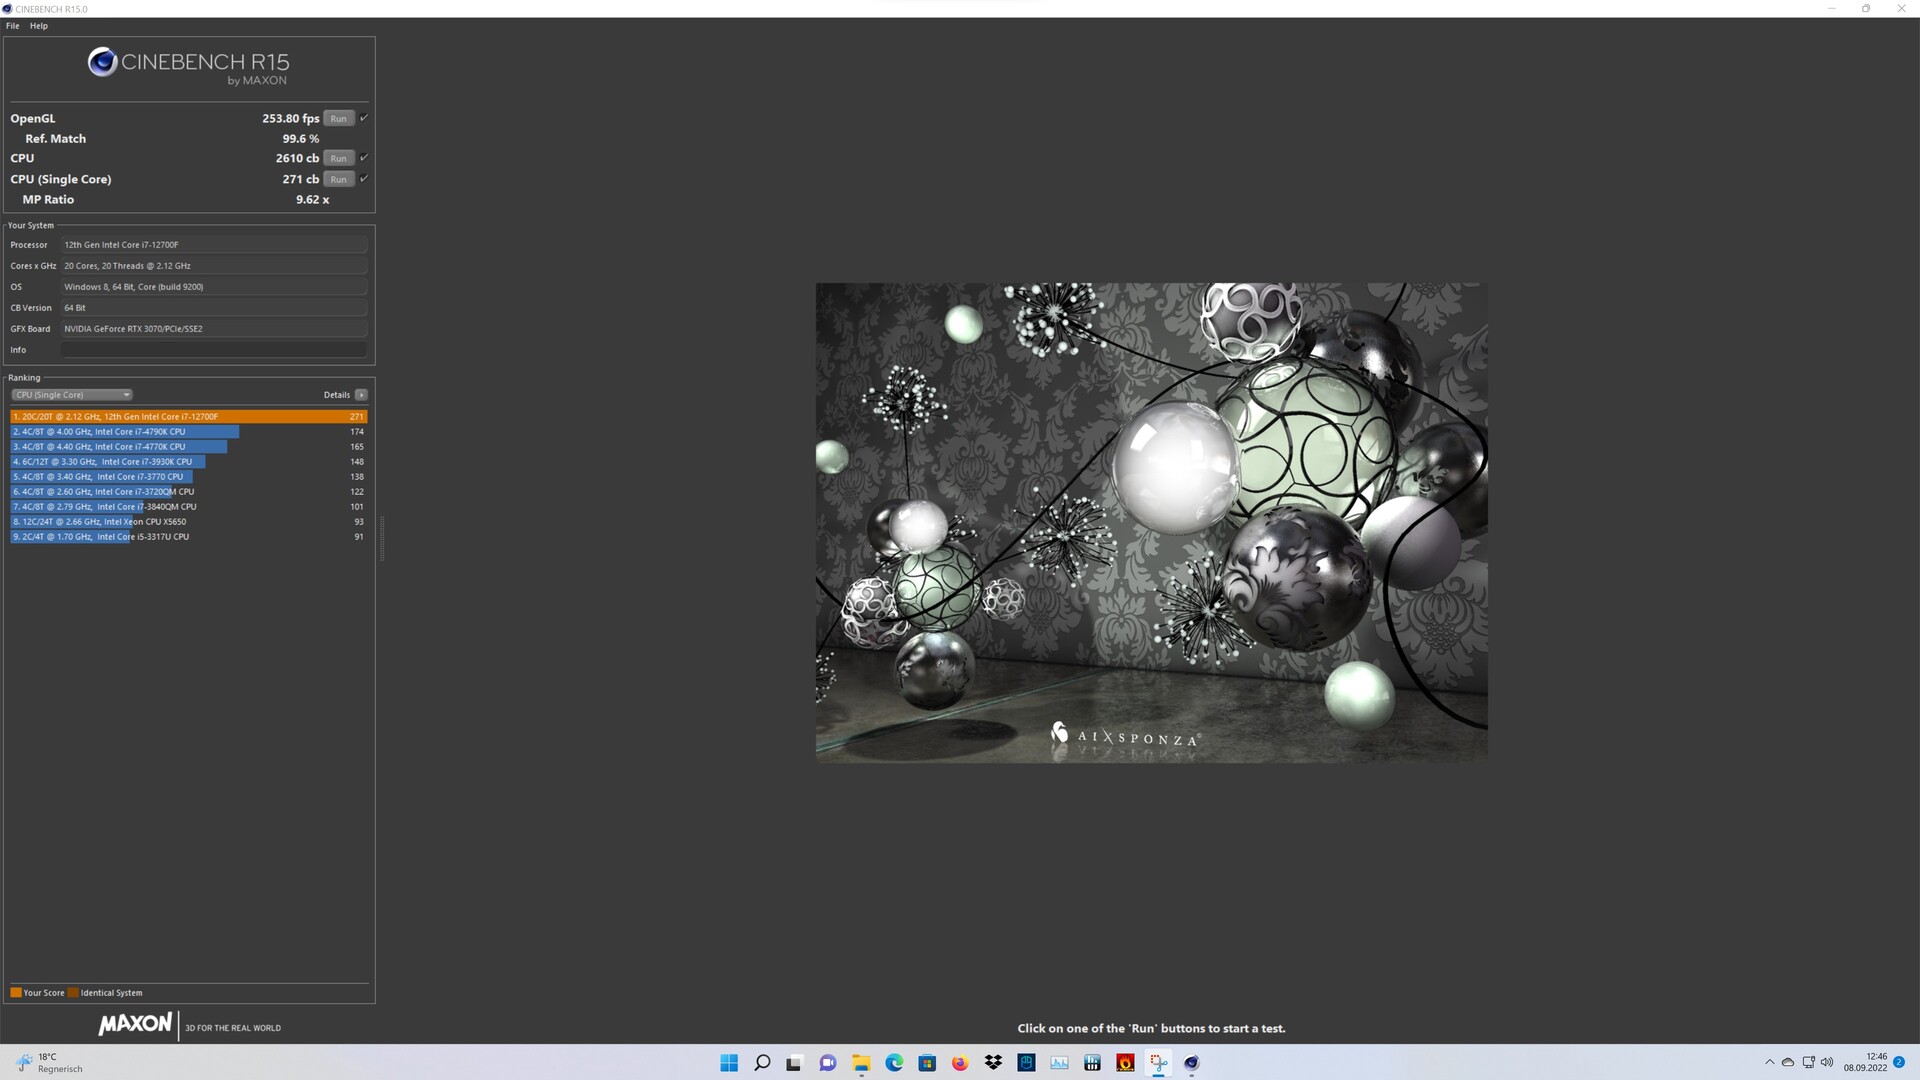
Processador
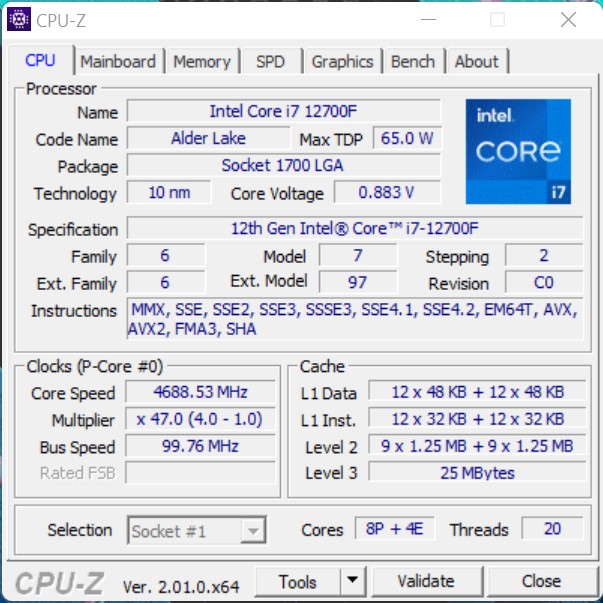
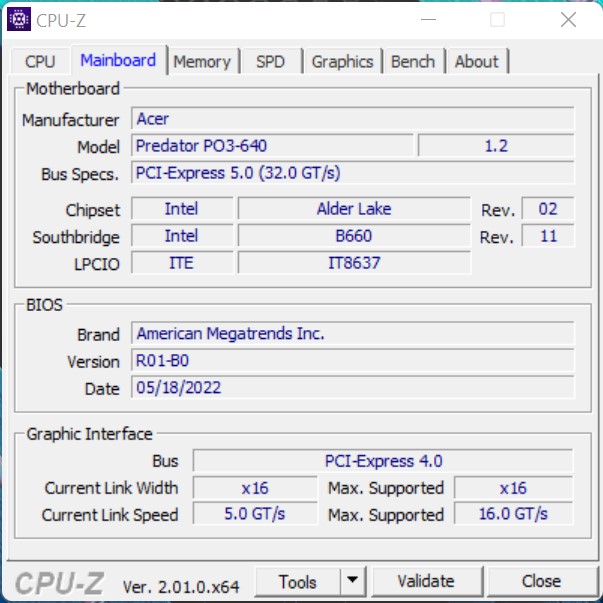
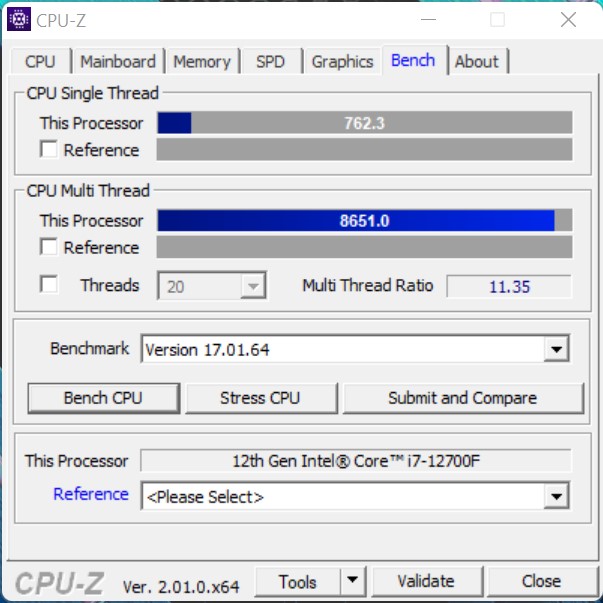
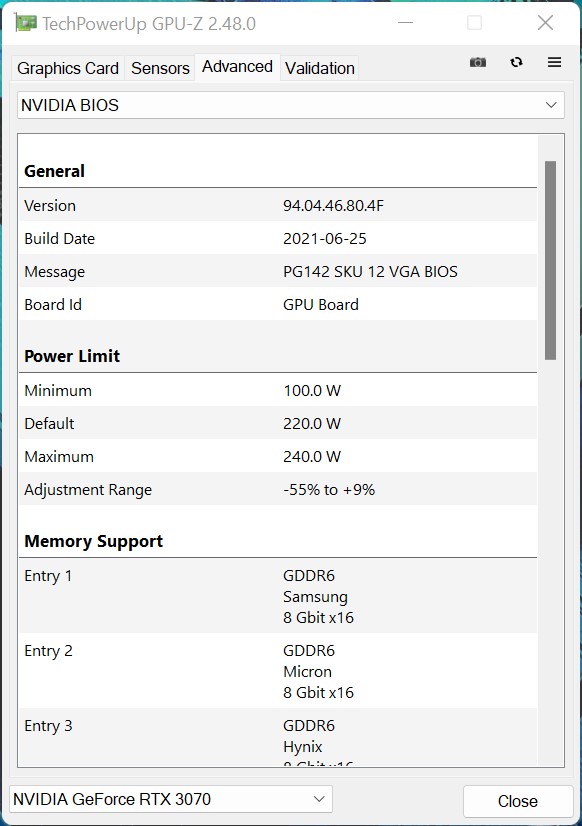
Com o Intel Core i7-12700Fo Predator Orion 3000 nesta revisão está equipado com o modelo mais rápido que a Acer oferece para este PC. O SoC de 65 watts oferece 8 P-cores e 4 E-cores, que juntos podem processar até 20 roscas simultaneamente. Entretanto, a Acer restringe um pouco o Intel Core i7-12700F quando se trata de potência máxima, já que o PL2 é normalmente de 180 watts para este modelo. A Acer, por outro lado, limita o consumo máximo de energia aqui a 126 watts por um máximo de 28 segundos. Em comparação com os outros dispositivos de comparação, o Acer Predator Orion 3000 ainda pode alcançar um bom resultado. No entanto, o fabricante oferece um desempenho para um melhor resultado geral.
Para mais comparações e benchmarks, nos referimos ao nossoGráfico de comparação de CPU.
* ... menor é melhor
AIDA64: FP32 Ray-Trace | FPU Julia | CPU SHA3 | CPU Queen | FPU SinJulia | FPU Mandel | CPU AES | CPU ZLib | FP64 Ray-Trace | CPU PhotoWorxx
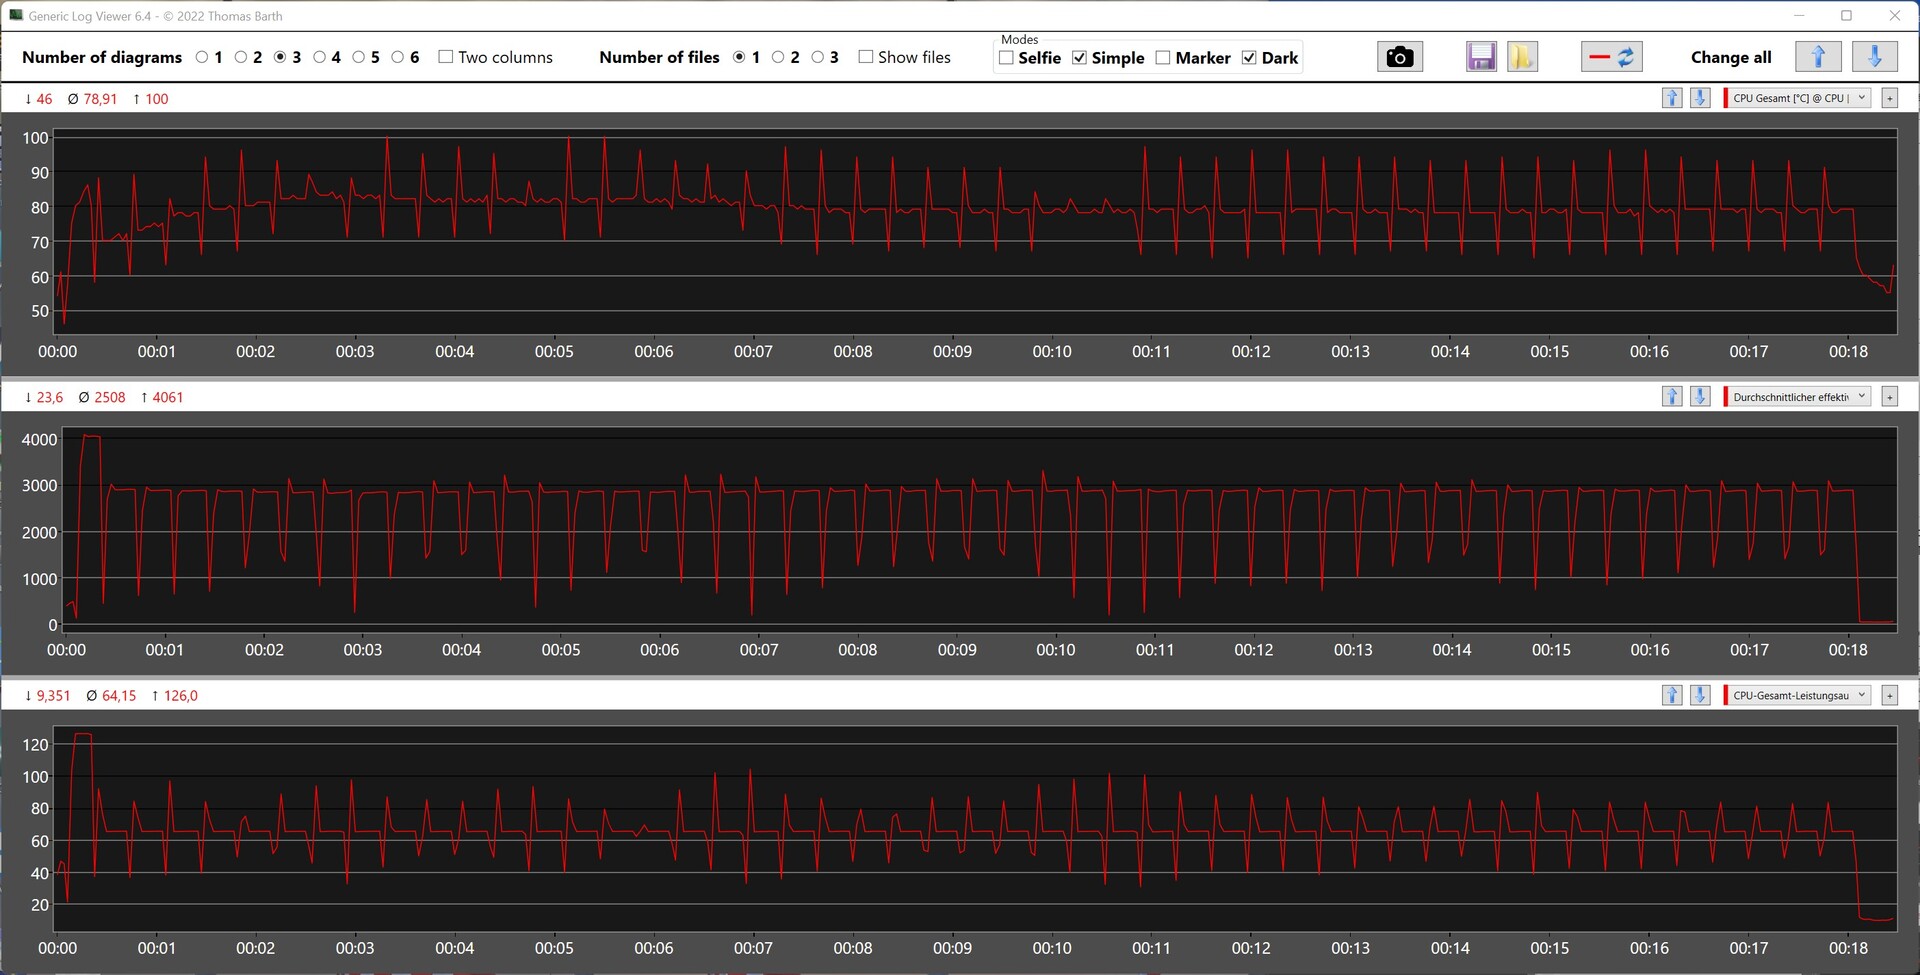
Acer Predator Orion 3000 na Cinebench R15 multi-loop
Temos uma boa primeira visão em termos de eficiência em conjunto com o resfriamento embutido durante o loop contínuo Cinebench R15. Após a primeira corrida, o desempenho cai drasticamente porque o PL2 aumentado só pode ser mantido por mais tempo durante a primeira corrida do que durante as demais. As métricas de CPU registradas durante o teste mostram isso muito bem.
Desempenho do sistema
O fato de que os benchmarks de desempenho do sistema não chamam o desempenho total de forma permanente se adequa claramente ao Acer Predator Orion 3000. Os resultados são bons e apenas alguns pontos percentuais piores do que os do Intel Dragon Canyon NUC com Intel Core i9-12900. A memória de trabalho funciona bastante bem em comparação com os dispositivos de comparação aqui no teste, embora um pouco mais de desempenho pudesse ser alcançado com RAM mais rápida e latências mais baixas.
| AIDA64 / Memory Copy | |
| Média da turma Desktop (54743 - 98416, n=21, últimos 2 anos) | |
| Acer Predator Orion 3000 PO3-640 | |
| Média Intel Core i7-12700F (n=1) | |
| Intel Beast Canyon NUC | |
| Intel Dragon Canyon NUC - RTX 3060 | |
| Zotac ZBOX Magnus EN173070C | |
| Zotac MEK Mini (RTX 2070 Super) | |
| AIDA64 / Memory Read | |
| Média da turma Desktop (58375 - 110448, n=21, últimos 2 anos) | |
| Zotac ZBOX Magnus EN173070C | |
| Acer Predator Orion 3000 PO3-640 | |
| Média Intel Core i7-12700F (n=1) | |
| Intel Beast Canyon NUC | |
| Intel Dragon Canyon NUC - RTX 3060 | |
| Zotac MEK Mini (RTX 2070 Super) | |
| AIDA64 / Memory Write | |
| Média da turma Desktop (60635 - 93889, n=21, últimos 2 anos) | |
| Zotac ZBOX Magnus EN173070C | |
| Intel Beast Canyon NUC | |
| Intel Dragon Canyon NUC - RTX 3060 | |
| Acer Predator Orion 3000 PO3-640 | |
| Média Intel Core i7-12700F (n=1) | |
| Zotac MEK Mini (RTX 2070 Super) | |
| AIDA64 / Memory Latency | |
| Média da turma Desktop (68.5 - 168, n=21, últimos 2 anos) | |
| Intel Beast Canyon NUC | |
| Intel Dragon Canyon NUC - RTX 3060 | |
| Zotac ZBOX Magnus EN173070C | |
| Acer Predator Orion 3000 PO3-640 | |
| Média Intel Core i7-12700F (n=1) | |
| Zotac MEK Mini (RTX 2070 Super) | |
* ... menor é melhor
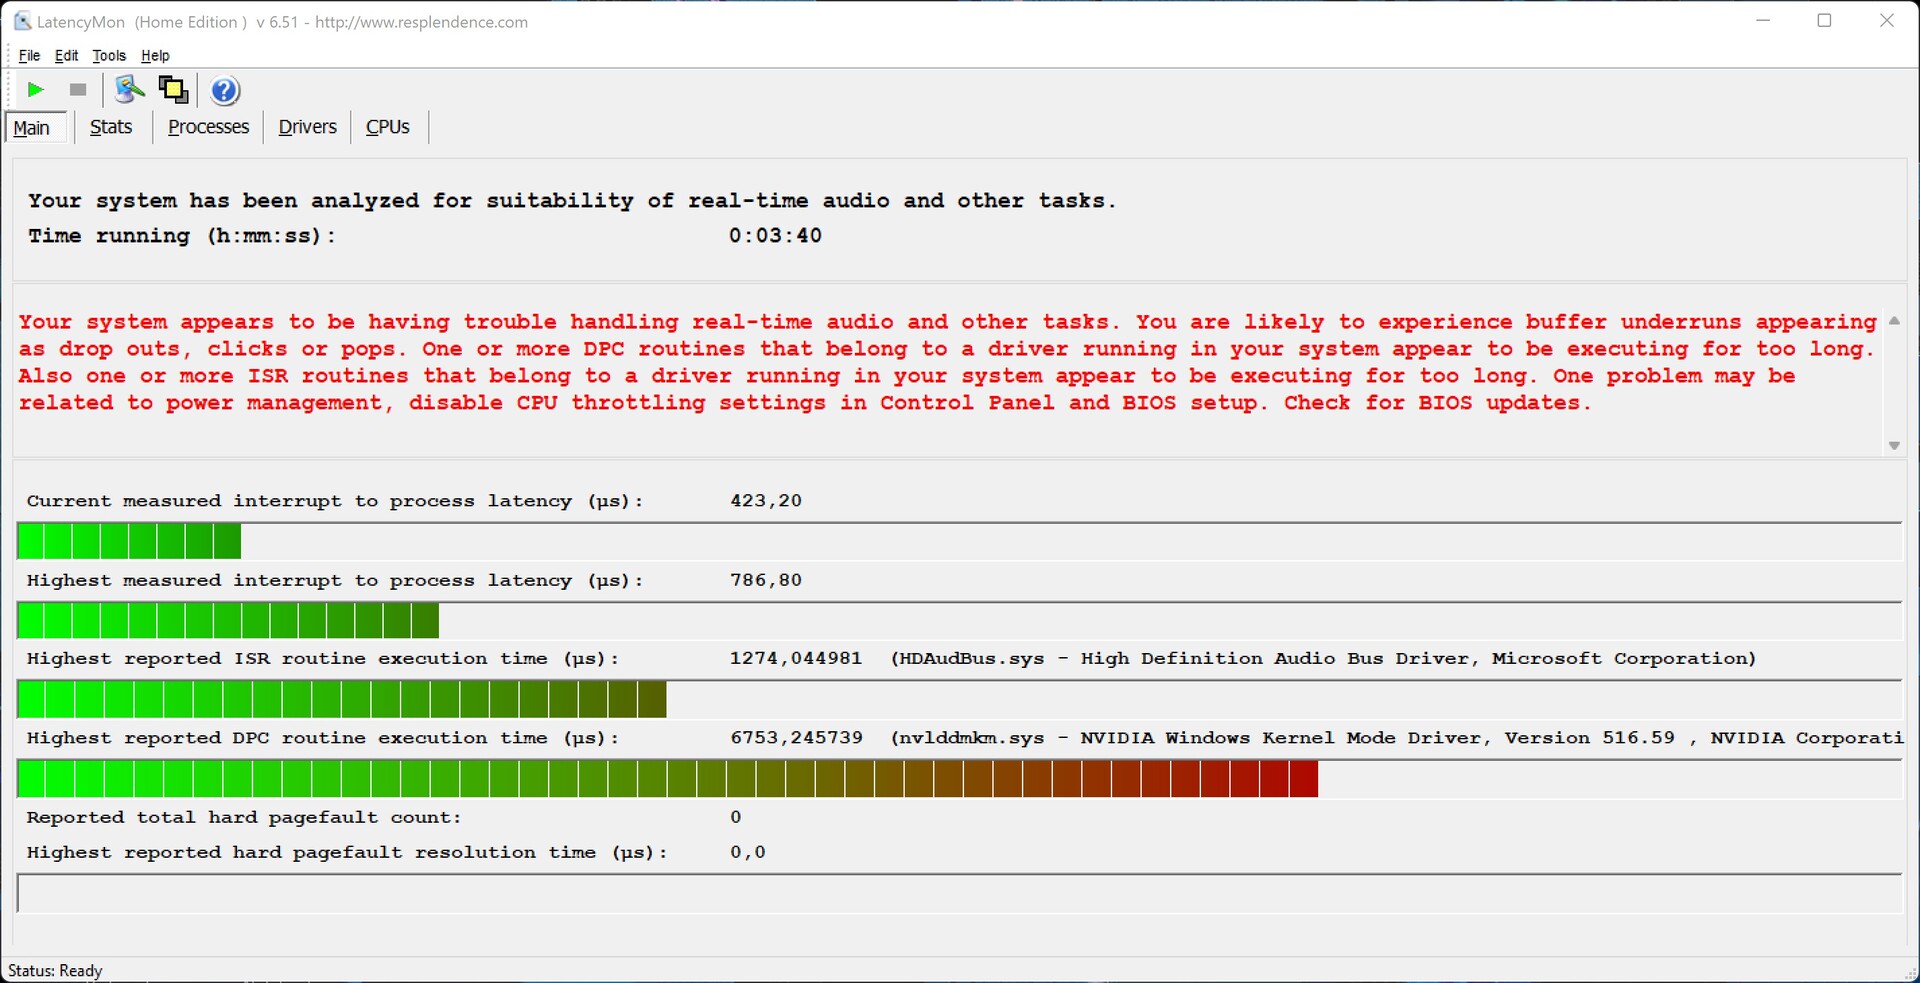
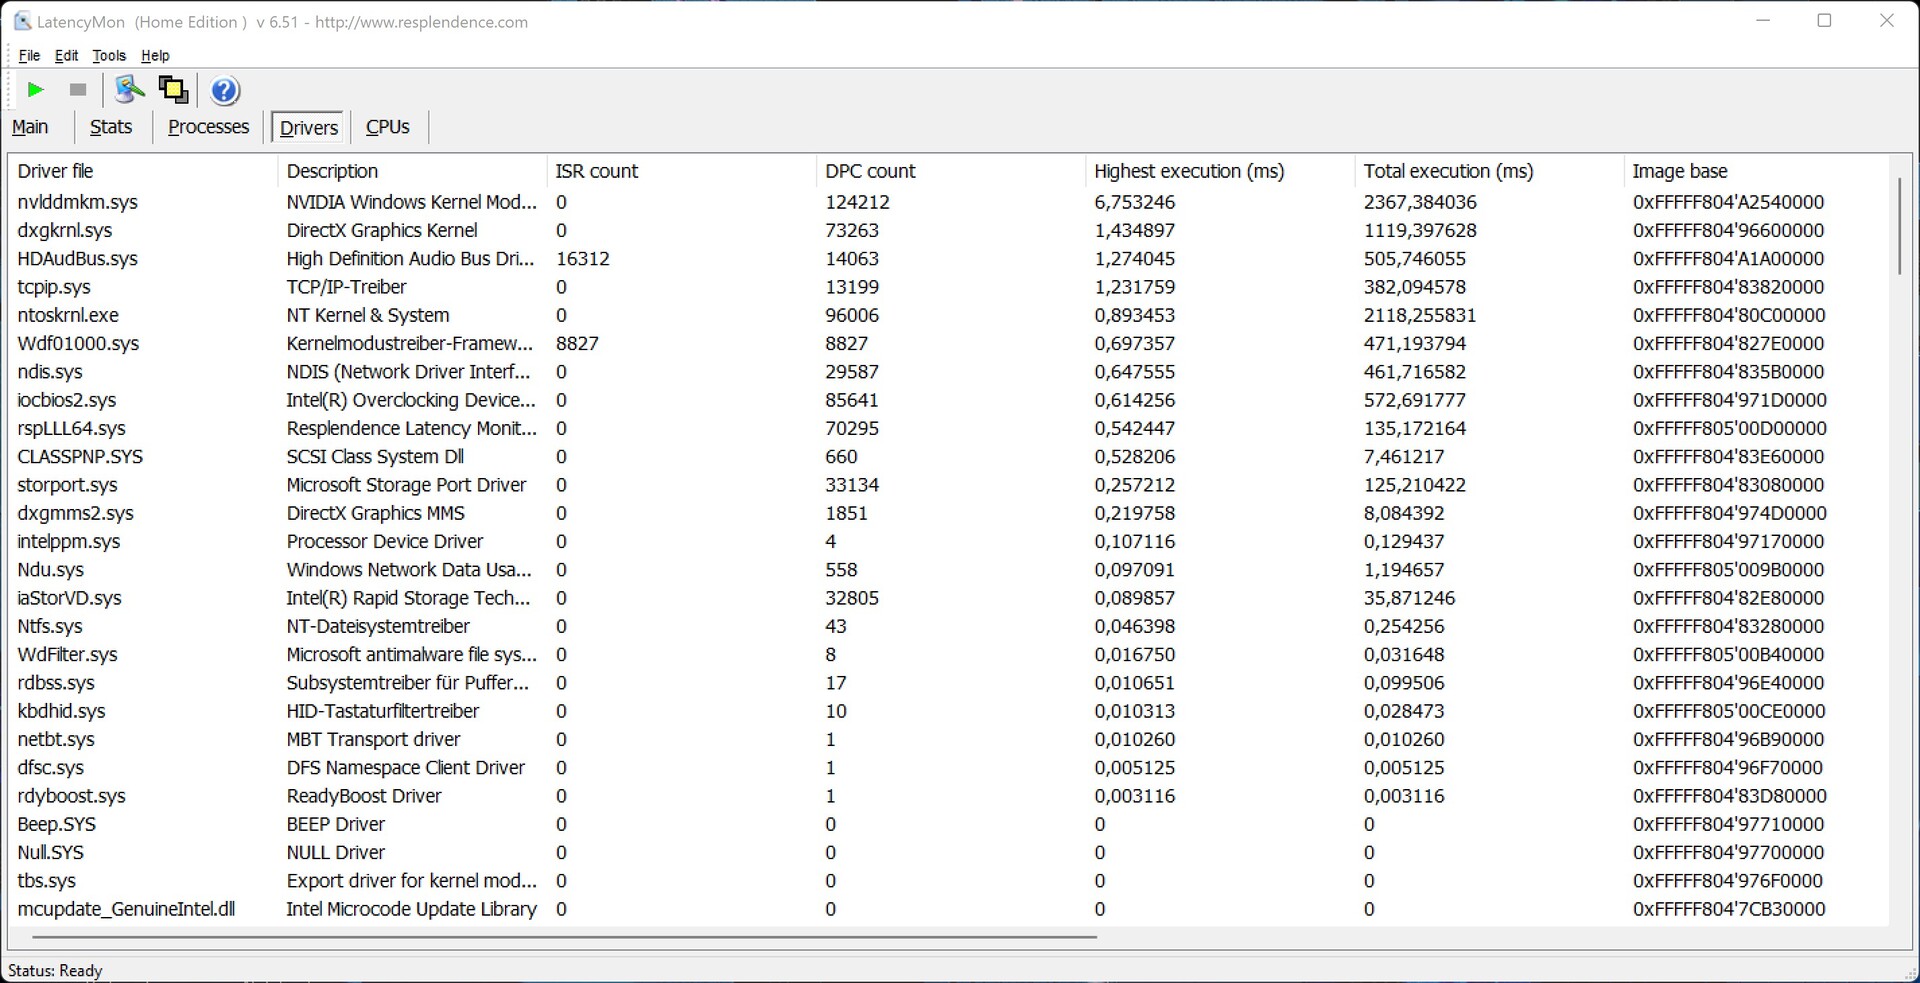
Latências DPC
LatencyMon já relata problemas de latência ao abrir várias abas em Edge. Os drivers ainda não parecem estar otimizados aqui.
| DPC Latencies / LatencyMon - interrupt to process latency (max), Web, Youtube, Prime95 | |
| Acer Predator Orion 3000 PO3-640, Intel Core i7-12700F | |
| Minisforum EliteMini B550, AMD Ryzen 7 5700G | |
| Asus ExpertCenter D9 SFF, Intel Core i7-11700 | |
| Zotac ZBOX Magnus EN173070C, Intel Core i7-11800H | |
| Minisforum EliteMini HX90, AMD Ryzen 9 5900HX | |
* ... menor é melhor
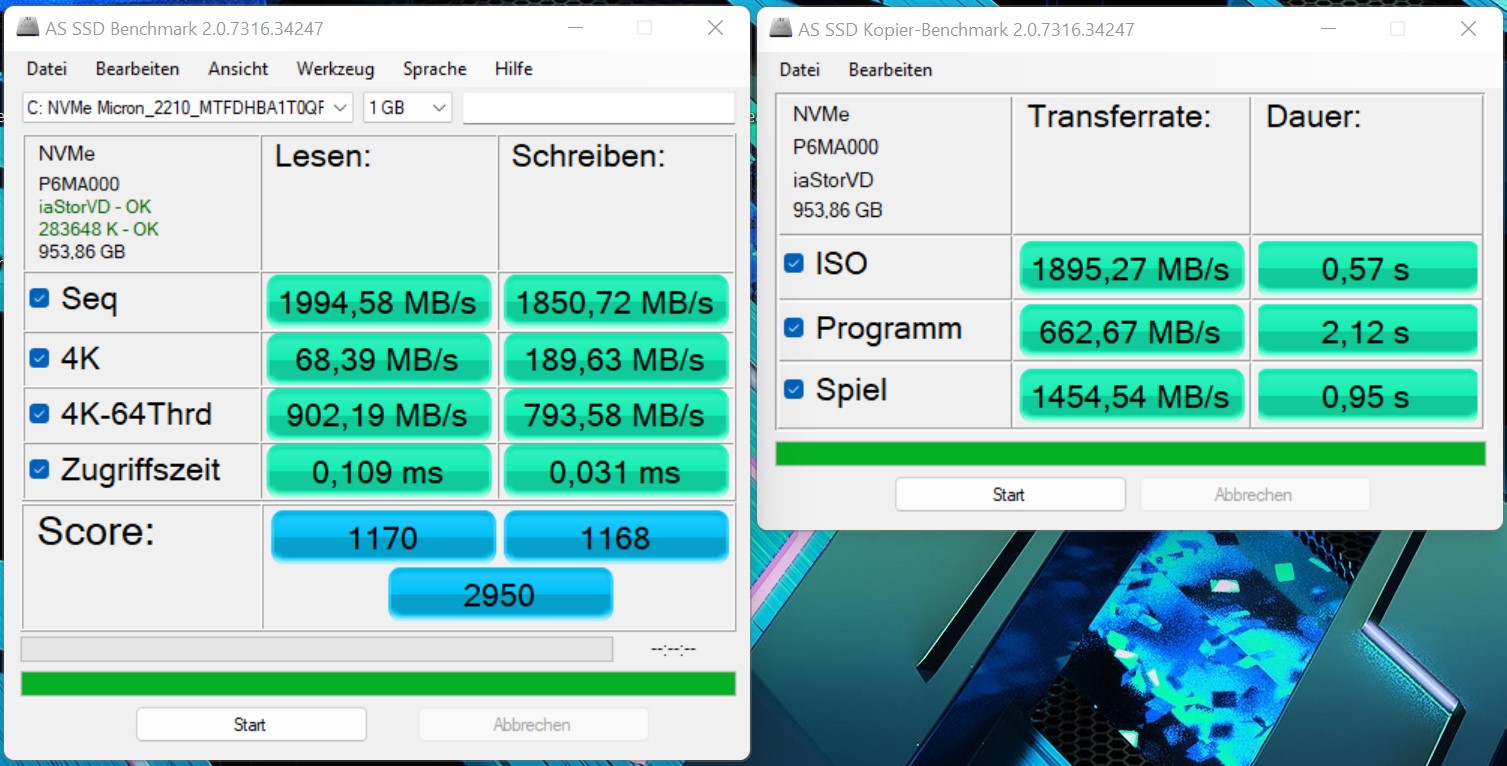
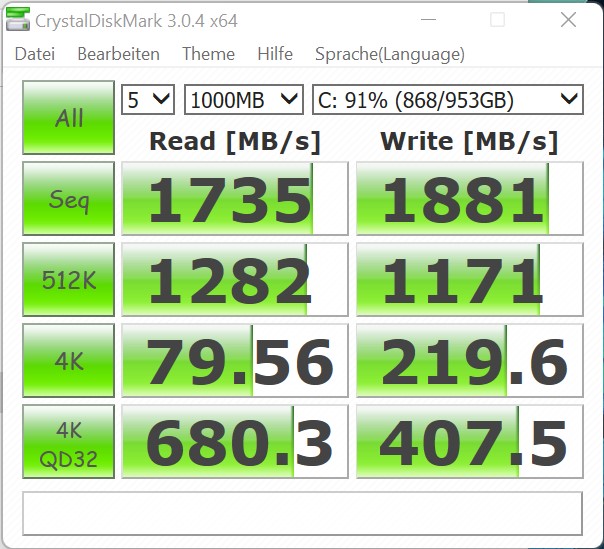
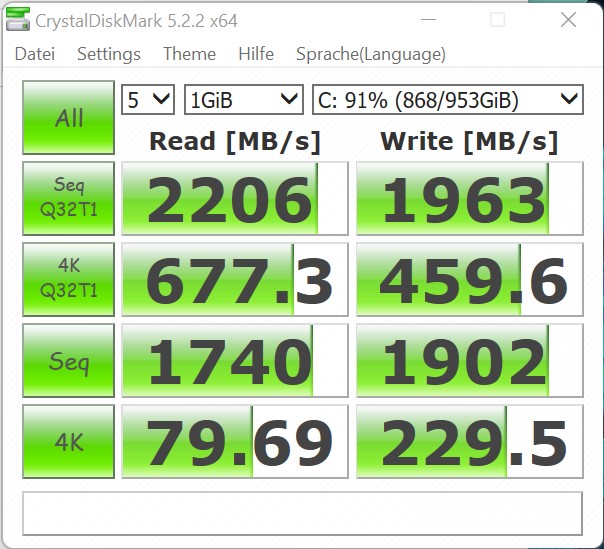
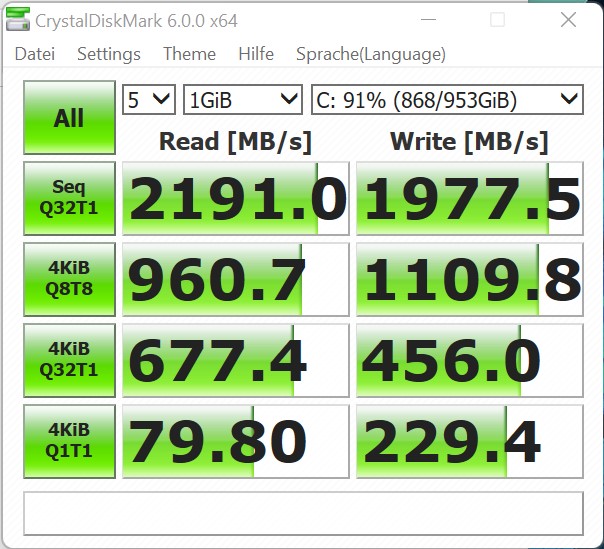
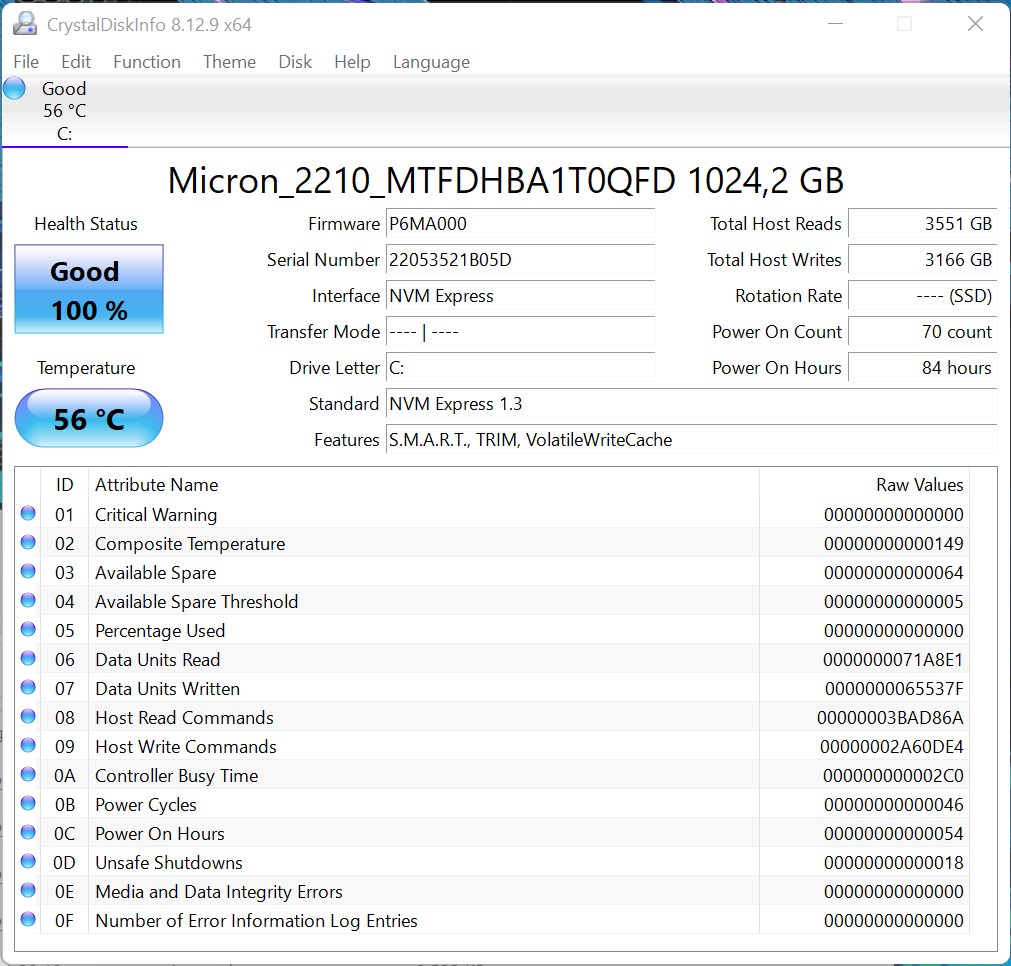
Armazenamento em massa
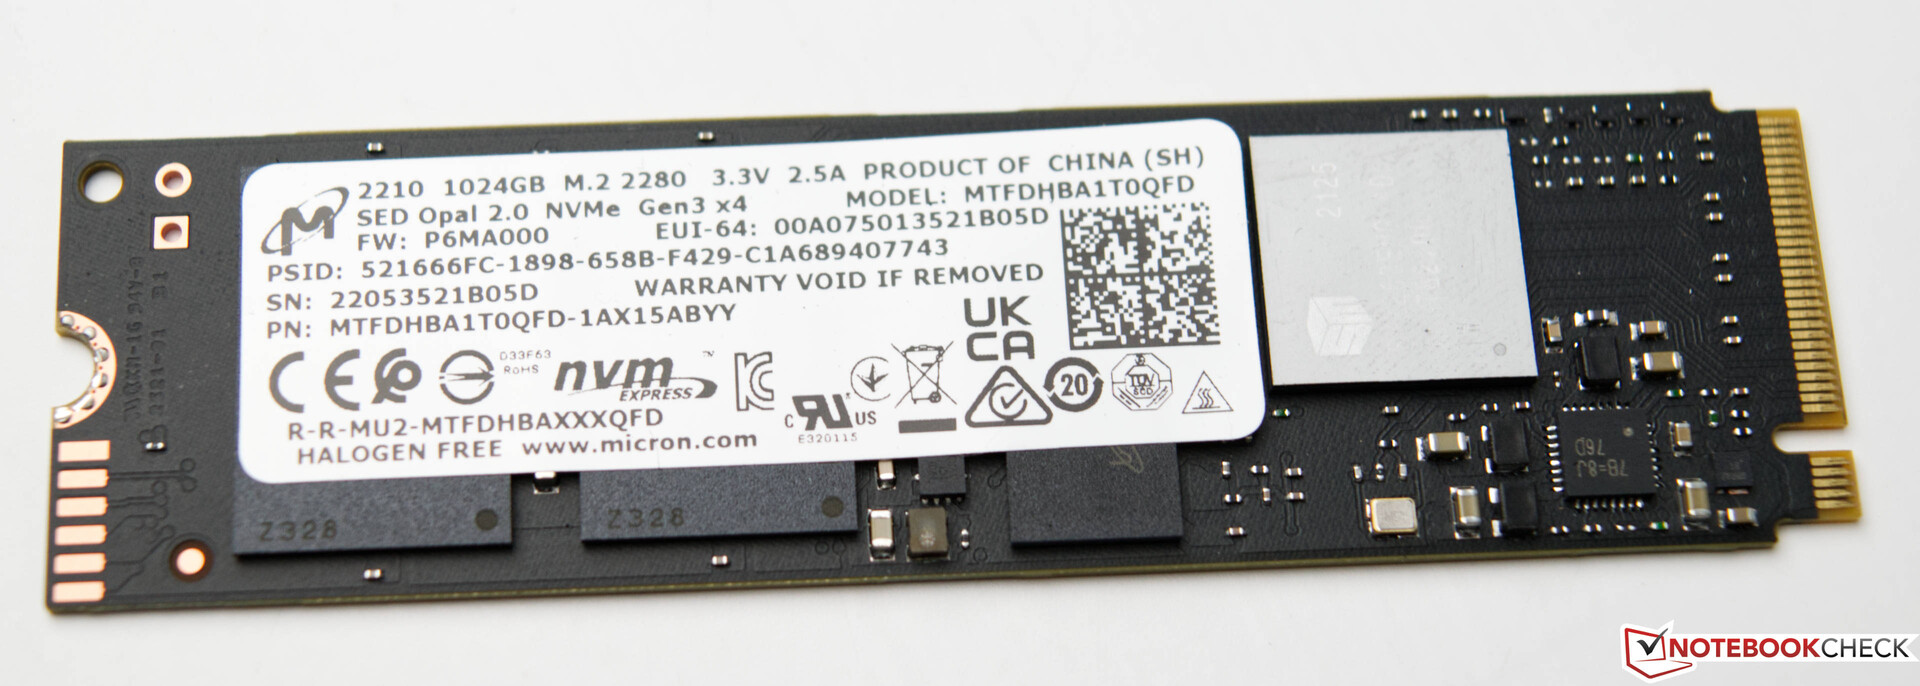
Nossa amostra de teste é equipada com um SSD de 1 TB da Micron. O módulo M.2 oferece boas taxas de transferência, embora os valores máximos não consigam acompanhar os dispositivos de comparação. No entanto, isto dificilmente é notado no uso diário. A taxa de leitura de 4K, por exemplo, tem um impacto muito maior, o que se revela muito bem no Acer Predator Orion 3000. A capacidade de armazenamento de 1 TB é suficiente e não deveria ser menor para um dispositivo de jogo, em nossa opinião. O armazenamento em massa do Acer Predator Orion 3000 pode ser expandido com relativa facilidade. Um segundo módulo M.2 pode ser instalado na placa-mãe. Além disso, também há espaço para dois discos rígidos de 3,5 polegadas na caixa. Todos os cabos de conexão necessários estão incluídos com o dispositivo
Para mais comparações e referências, por favor, consulte nossoTabela comparativa.

* ... menor é melhor
Acelerador de disco: DiskSpd Loop de Leitura, Fila de Profundidade 8
Placa gráfica
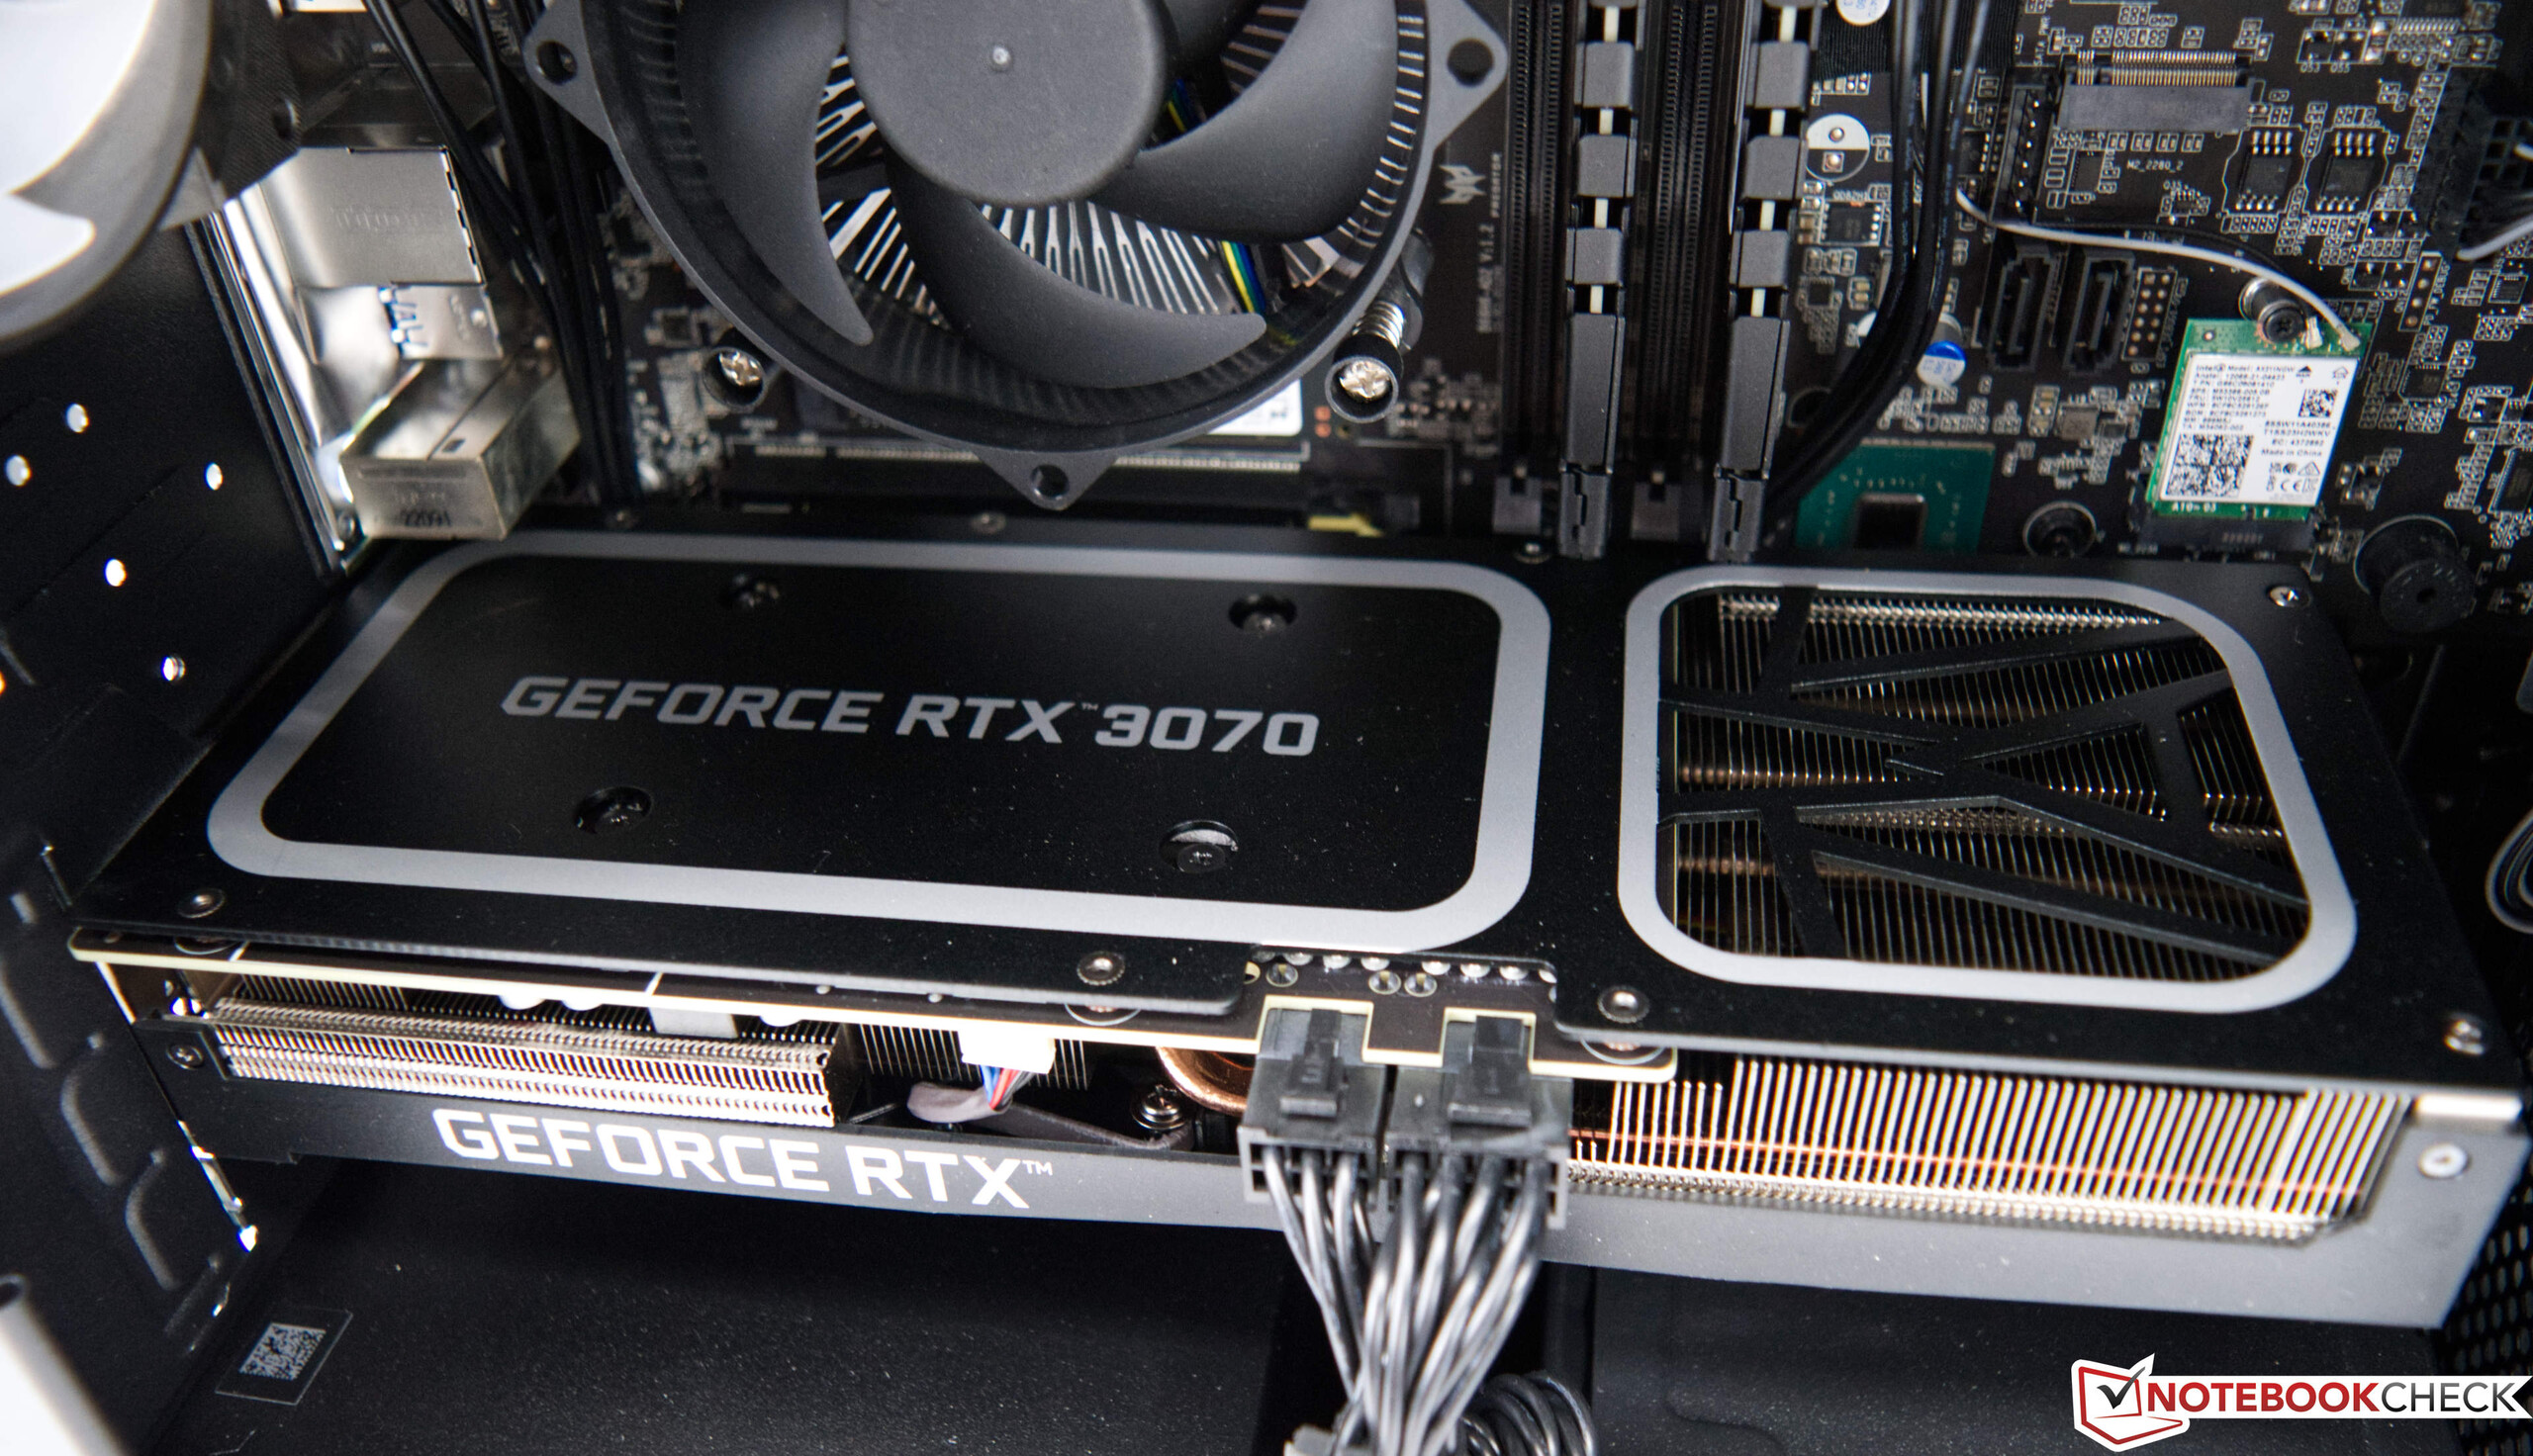
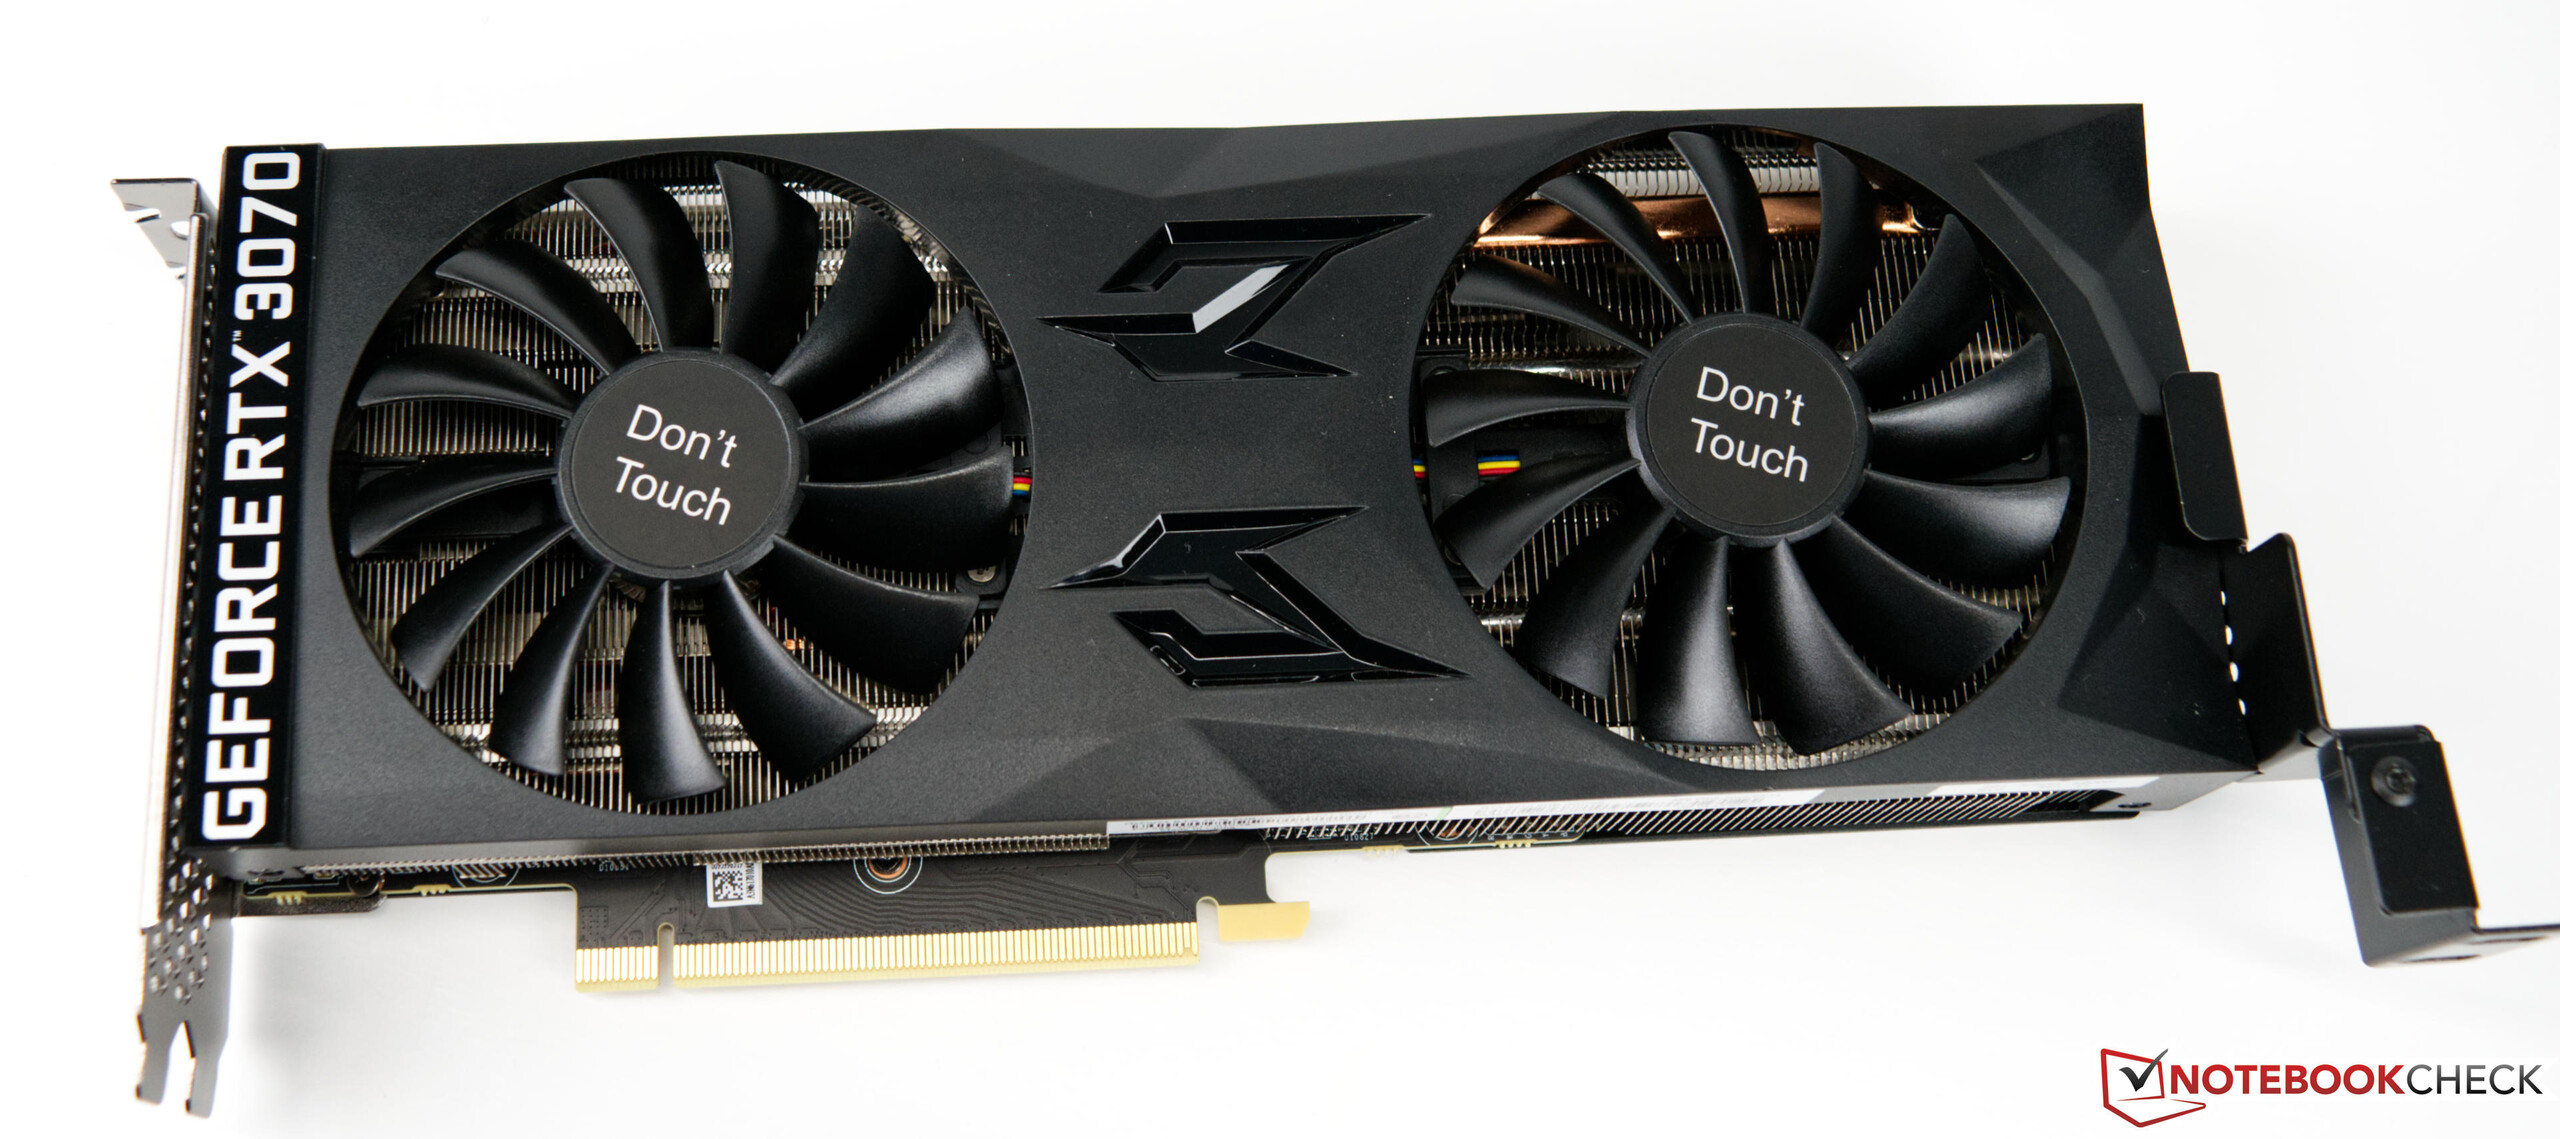
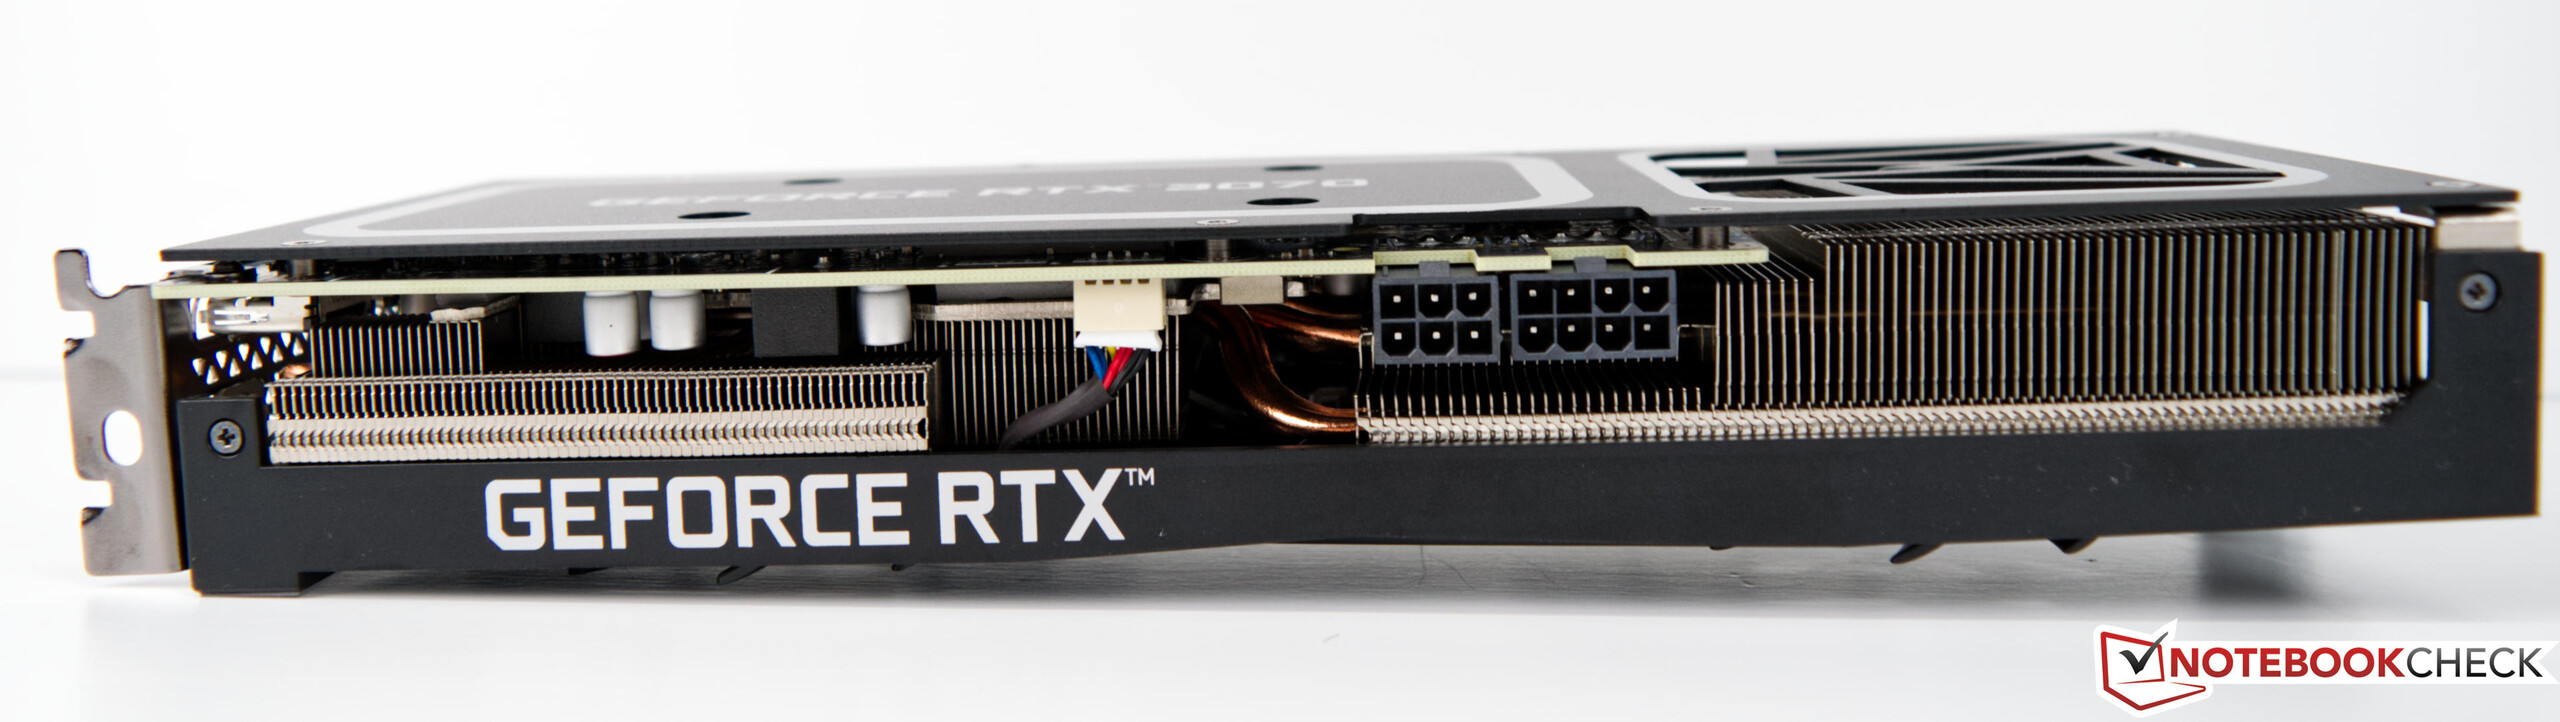
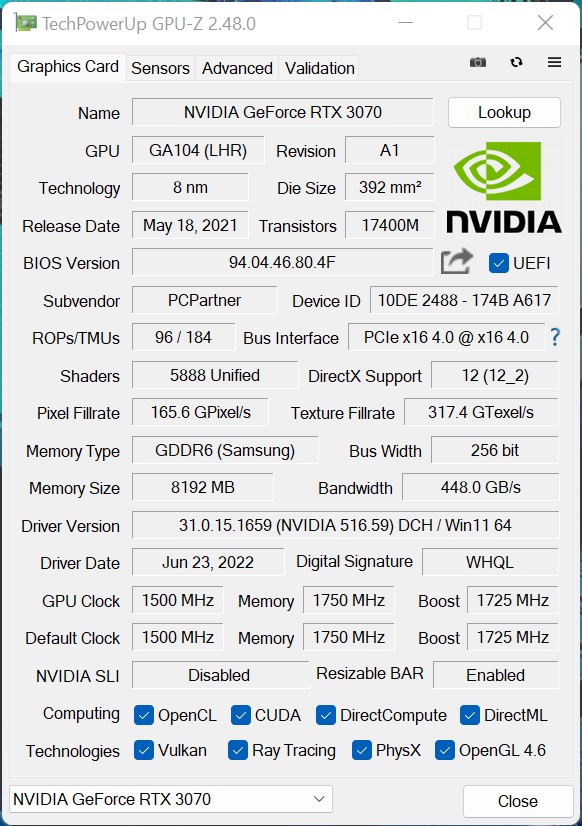
Com o Nvidia GeForce RTX 3070temos o Acer Predator Orion 3000 na configuração mais forte do teste. Considerando o desempenho da CPU um pouco estrangulado, o desempenho 3D nos testes sintéticos se revela muito bom. O modelo desconhecido do GeForce RTX 3070 funciona exatamente de acordo com as especificações dadas pela Nvidia. Isso significa um relógio GPU de 1.500 MHz, que é especificado com 1.750 MHz em Boost. Quanto à VRAM, o RTX 3070 normalmente tem 8 GB de GDDR6 e o consumo total de energia do modelo instalado é de 220 watts. Em comparação com a Zotac Magnus One o Acer Predator Orion 3000 pode prevalecer devido à melhor CPU.
Mais referências da Nvidia GeForce RTX 3070 podem ser encontradasaqui
| Performance rating - Percent | |
| Acer Predator Orion 3000 PO3-640 | |
| Zotac Magnus One (ECM73070C) | |
| Zotac ZBOX Magnus EN173070C | |
| Intel Dragon Canyon NUC - RTX 3060 | |
| Intel Beast Canyon NUC | |
| Unigine Valley 1.0 | |
| 1920x1080 Extreme HD DirectX AA:x8 | |
| Acer Predator Orion 3000 PO3-640 | |
| Zotac Magnus One (ECM73070C) | |
| Zotac ZBOX Magnus EN173070C | |
| Intel Dragon Canyon NUC - RTX 3060 | |
| Intel Beast Canyon NUC | |
| 1920x1080 Extreme HD Preset OpenGL AA:x8 | |
| Acer Predator Orion 3000 PO3-640 | |
| Zotac Magnus One (ECM73070C) | |
| Zotac ZBOX Magnus EN173070C | |
| Intel Dragon Canyon NUC - RTX 3060 | |
| Intel Beast Canyon NUC | |
| 3DMark 05 Standard | 58568 pontos | |
| 3DMark 06 Standard Score | 59134 pontos | |
| 3DMark Vantage P Result | 91011 pontos | |
| 3DMark 11 Performance | 36421 pontos | |
| 3DMark Ice Storm Standard Score | 237580 pontos | |
| 3DMark Cloud Gate Standard Score | 59231 pontos | |
| 3DMark Fire Strike Score | 25739 pontos | |
| 3DMark Fire Strike Extreme Score | 15841 pontos | |
| 3DMark Time Spy Score | 12665 pontos | |
Ajuda | ||
Desempenho do jogo
O Acer Predator Orion 3000 se beneficia muito bem com o processador Alder Lake nos testes de jogo. Isto oferece um desempenho muito alto por relógio (IPC, Instructions per Cycle), o que leva a um impulso decente quando se joga. O Predator Orion 3000 pode implementar isto muito bem, apesar das limitações do TDP, já que os jogos nem sempre requerem potência total da CPU. Juntamente com oNvidia GeForce RTX 3070mesmo os jogos mais recentes podem ser jogados sem problemas. Você deve se limitar a 1440p como resolução máxima, embora o GeForce RTX 3070 também possa dominar muitos jogos a 2160p. Para uma visão geral do desempenho de todos os jogos testados em comparação com outros modelos, nos referimos ao nosso Lista de jogos GPU.
| GTA V | |
| 1920x1080 Highest AA:4xMSAA + FX AF:16x | |
| KFA2 GeForce RTX 3080 SG | |
| Acer Predator Orion 3000 PO3-640 | |
| Média NVIDIA GeForce RTX 3070 (91.1 - 122.4, n=5) | |
| Zotac ZBOX Magnus EN173070C | |
| Intel Beast Canyon NUC | |
| Intel Dragon Canyon NUC - RTX 3060 | |
| Zotac Magnus One (ECM73070C) | |
| 1920x1080 High/On (Advanced Graphics Off) AA:2xMSAA + FX AF:8x | |
| KFA2 GeForce RTX 3080 SG | |
| Acer Predator Orion 3000 PO3-640 | |
| Intel Beast Canyon NUC | |
| Intel Dragon Canyon NUC - RTX 3060 | |
| Média NVIDIA GeForce RTX 3070 (157 - 177.7, n=5) | |
| Zotac ZBOX Magnus EN173070C | |
| Zotac Magnus One (ECM73070C) | |
| The Witcher 3 | |
| 1920x1080 High Graphics & Postprocessing (Nvidia HairWorks Off) | |
| KFA2 GeForce RTX 3080 SG | |
| Acer Predator Orion 3000 PO3-640 | |
| Zotac Magnus One (ECM73070C) | |
| Média NVIDIA GeForce RTX 3070 (100 - 264, n=8) | |
| Zotac ZBOX Magnus EN173070C | |
| Intel Dragon Canyon NUC - RTX 3060 | |
| Zotac MEK Mini (RTX 2070 Super) | |
| 1920x1080 Ultra Graphics & Postprocessing (HBAO+) | |
| KFA2 GeForce RTX 3080 SG | |
| Acer Predator Orion 3000 PO3-640 | |
| Zotac Magnus One (ECM73070C) | |
| Média NVIDIA GeForce RTX 3070 (52.8 - 132.2, n=7) | |
| Zotac ZBOX Magnus EN173070C | |
| Zotac MEK Mini (RTX 2070 Super) | |
| Intel Dragon Canyon NUC - RTX 3060 | |
| F1 2020 | |
| 2560x1440 Ultra High Preset AA:T AF:16x | |
| KFA2 GeForce RTX 3080 SG | |
| Acer Predator Orion 3000 PO3-640 | |
| Média NVIDIA GeForce RTX 3070 (143 - 162.2, n=3) | |
| Zotac ZBOX Magnus EN173070C | |
| Intel Beast Canyon NUC | |
| Intel Dragon Canyon NUC - RTX 3060 | |
| 1920x1080 Ultra High Preset AA:T AF:16x | |
| KFA2 GeForce RTX 3080 SG | |
| Acer Predator Orion 3000 PO3-640 | |
| Média NVIDIA GeForce RTX 3070 (179 - 215, n=3) | |
| Zotac ZBOX Magnus EN173070C | |
| Intel Beast Canyon NUC | |
| Intel Dragon Canyon NUC - RTX 3060 | |
| baixo | média | alto | ultra | QHD | 4K | |
|---|---|---|---|---|---|---|
| GTA V (2015) | 184.7 | 181.6 | 177.7 | 122.4 | 113.1 | 125.9 |
| The Witcher 3 (2015) | 507 | 408 | 264 | 132.2 | 93.9 | |
| Dota 2 Reborn (2015) | 146.5 | 133.9 | 129.3 | 121.4 | 122.7 | |
| Rise of the Tomb Raider (2016) | 376 | 266 | 182.9 | 153.7 | 76.7 | |
| Final Fantasy XV Benchmark (2018) | 195.8 | 172.3 | 129.7 | 99.3 | 58.2 | |
| X-Plane 11.11 (2018) | 150.6 | 137.4 | 111.3 | 98.4 | ||
| Far Cry 5 (2018) | 179 | 159 | 151 | 141 | 125 | 72 |
| Strange Brigade (2018) | 466 | 328 | 268 | 233 | 173.2 | 98.7 |
| Shadow of the Tomb Raider (2018) | 194.8 | 173.8 | 166.8 | 157.1 | 114.8 | 62.6 |
| Far Cry New Dawn (2019) | 162 | 140 | 135 | 121 | 113 | 74 |
| Metro Exodus (2019) | 224 | 156.8 | 121.9 | 97.7 | 78.3 | 49.7 |
| Anno 1800 (2019) | 167.5 | 164.1 | 130.8 | 74.7 | 69.3 | 41.8 |
| Control (2019) | 240 | 167.7 | 124.9 | 81.3 | 40.6 | |
| Borderlands 3 (2019) | 171.5 | 144.7 | 127.9 | 108.9 | 82.9 | 46.3 |
| F1 2020 (2020) | 351 | 302 | 288 | 215 | 162.2 | 92.7 |
| Watch Dogs Legion (2020) | 125 | 123 | 109 | 89 | 67 | 37 |
| Dirt 5 (2020) | 248.1 | 191.8 | 157 | 122.1 | 99 | 65.3 |
| F1 2021 (2021) | 407 | 361 | 304 | 158 | 118 | 67.3 |
| New World (2021) | 166.9 | 139.5 | 128.3 | 117.5 | 95 | 48.9 |
| Far Cry 6 (2021) | 154.9 | 138.3 | 121.1 | 114.2 | 95.9 | 26.4 |
| Forza Horizon 5 (2021) | 247 | 171 | 160 | 115 | 100 | 73 |
| God of War (2022) | 142.3 | 140.5 | 117.8 | 83.5 | 69.3 | 49.8 |
| GRID Legends (2022) | 249 | 224 | 198 | 151 | 127 | 84 |
| Cyberpunk 2077 1.6 (2022) | 146.7 | 145.1 | 136 | 90.3 | 60.6 | 29 |
| Tiny Tina's Wonderlands (2022) | 248 | 204 | 145.8 | 113.9 | 80.7 | 44.4 |
| F1 22 (2022) | 258 | 249 | 228 | 81 | 52 | 25 |
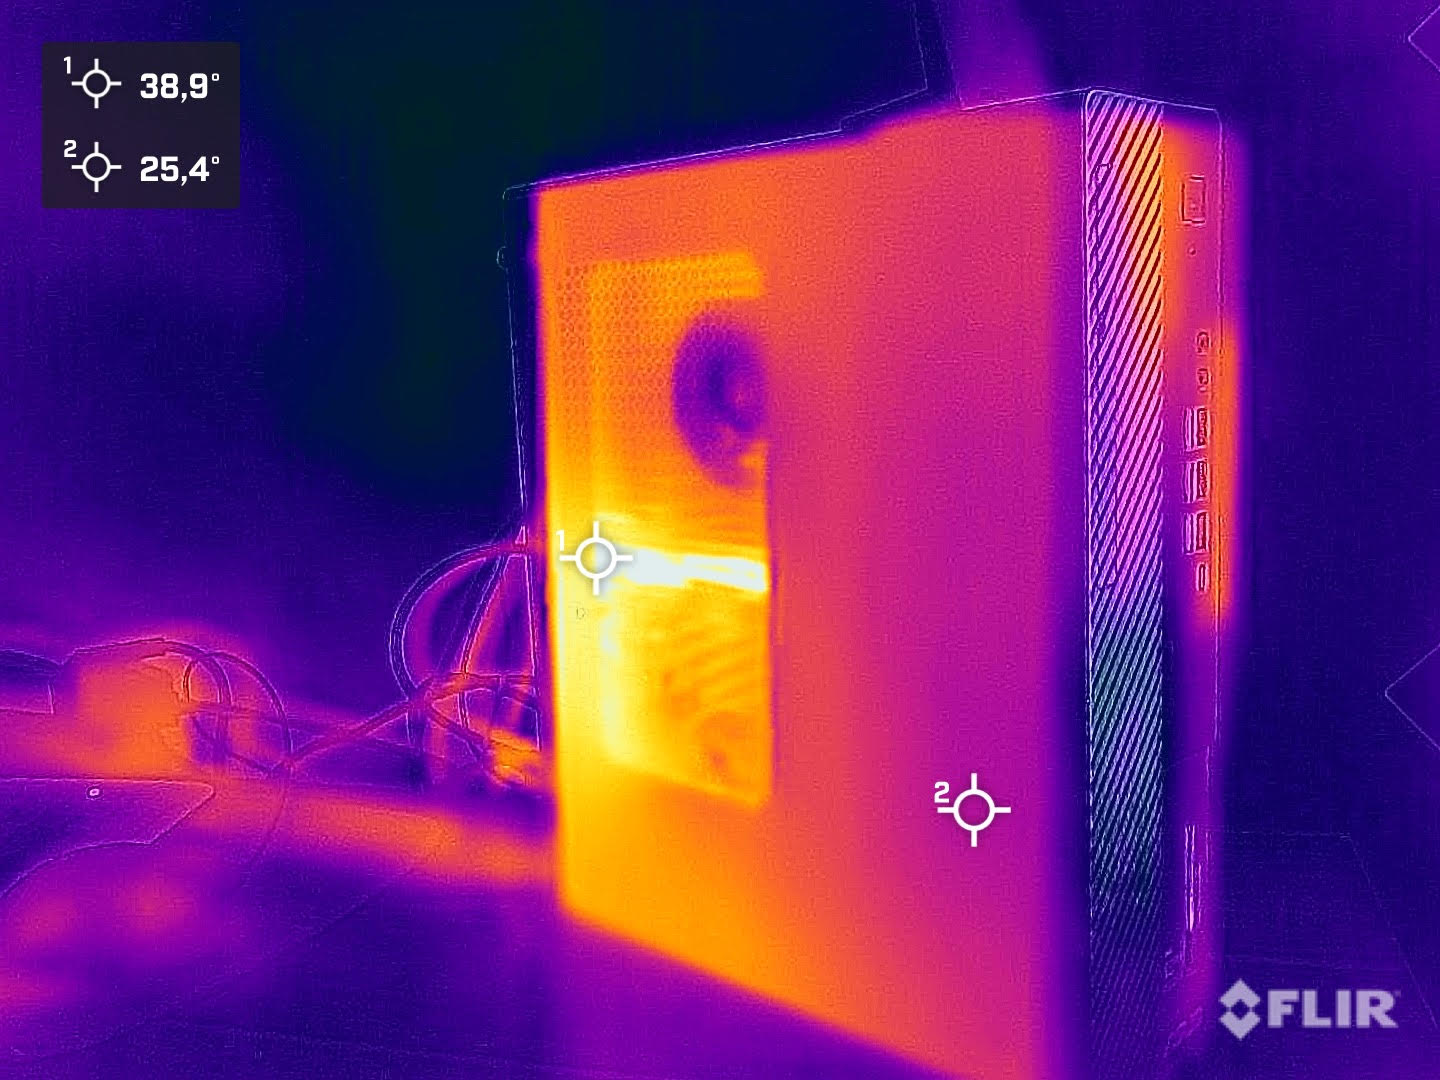
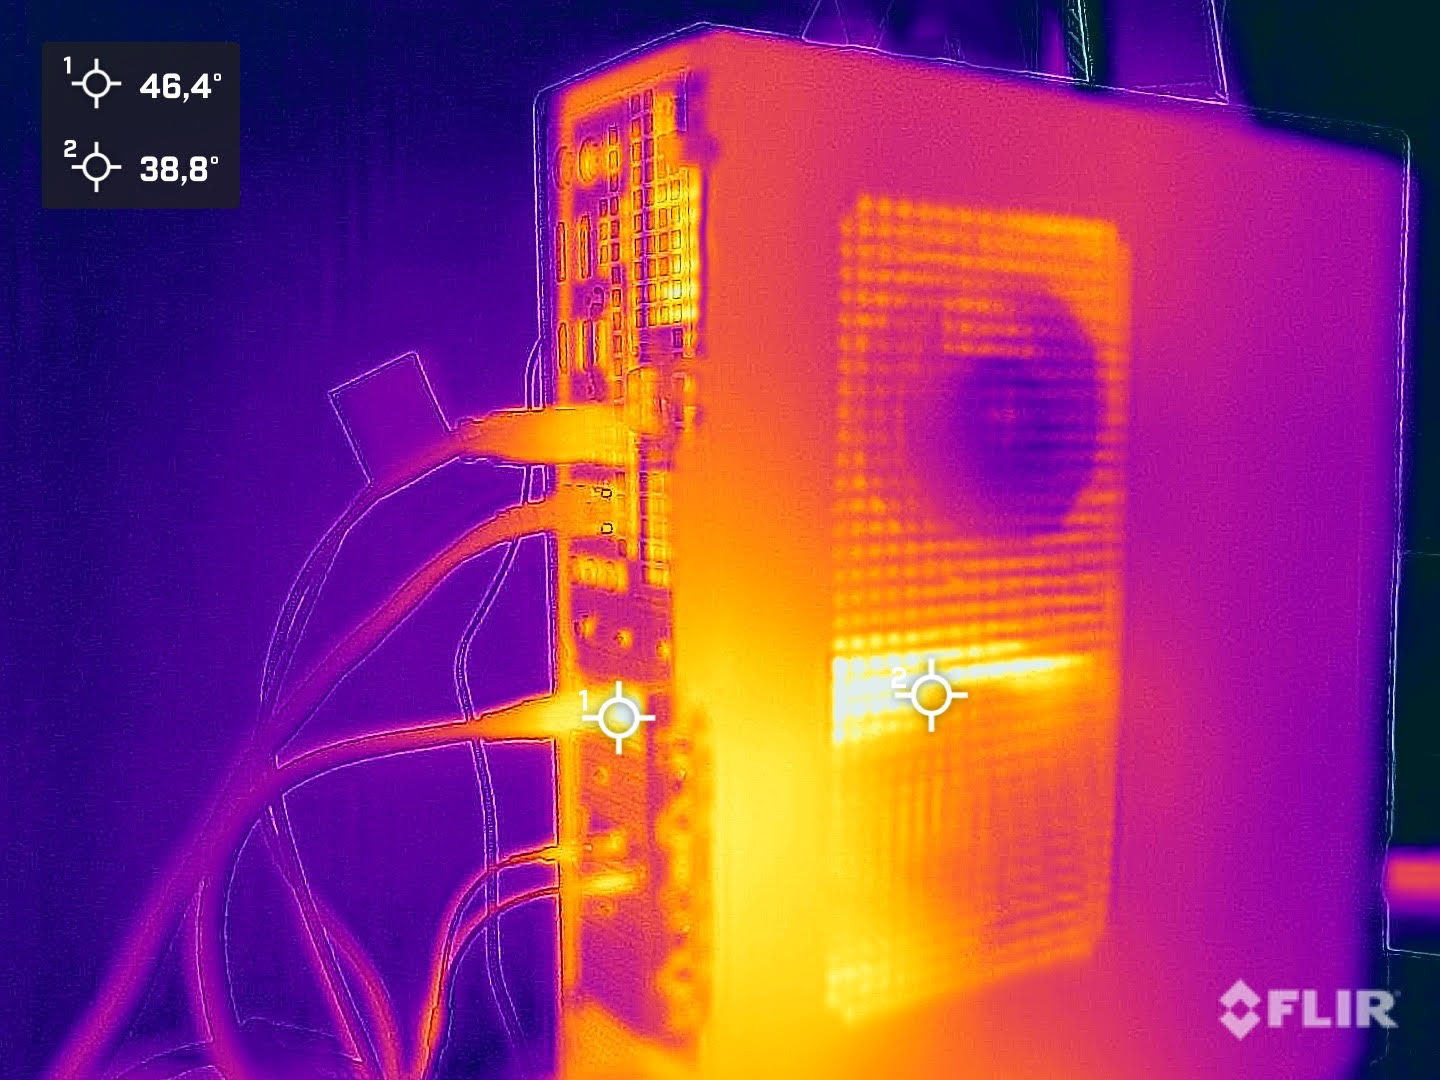
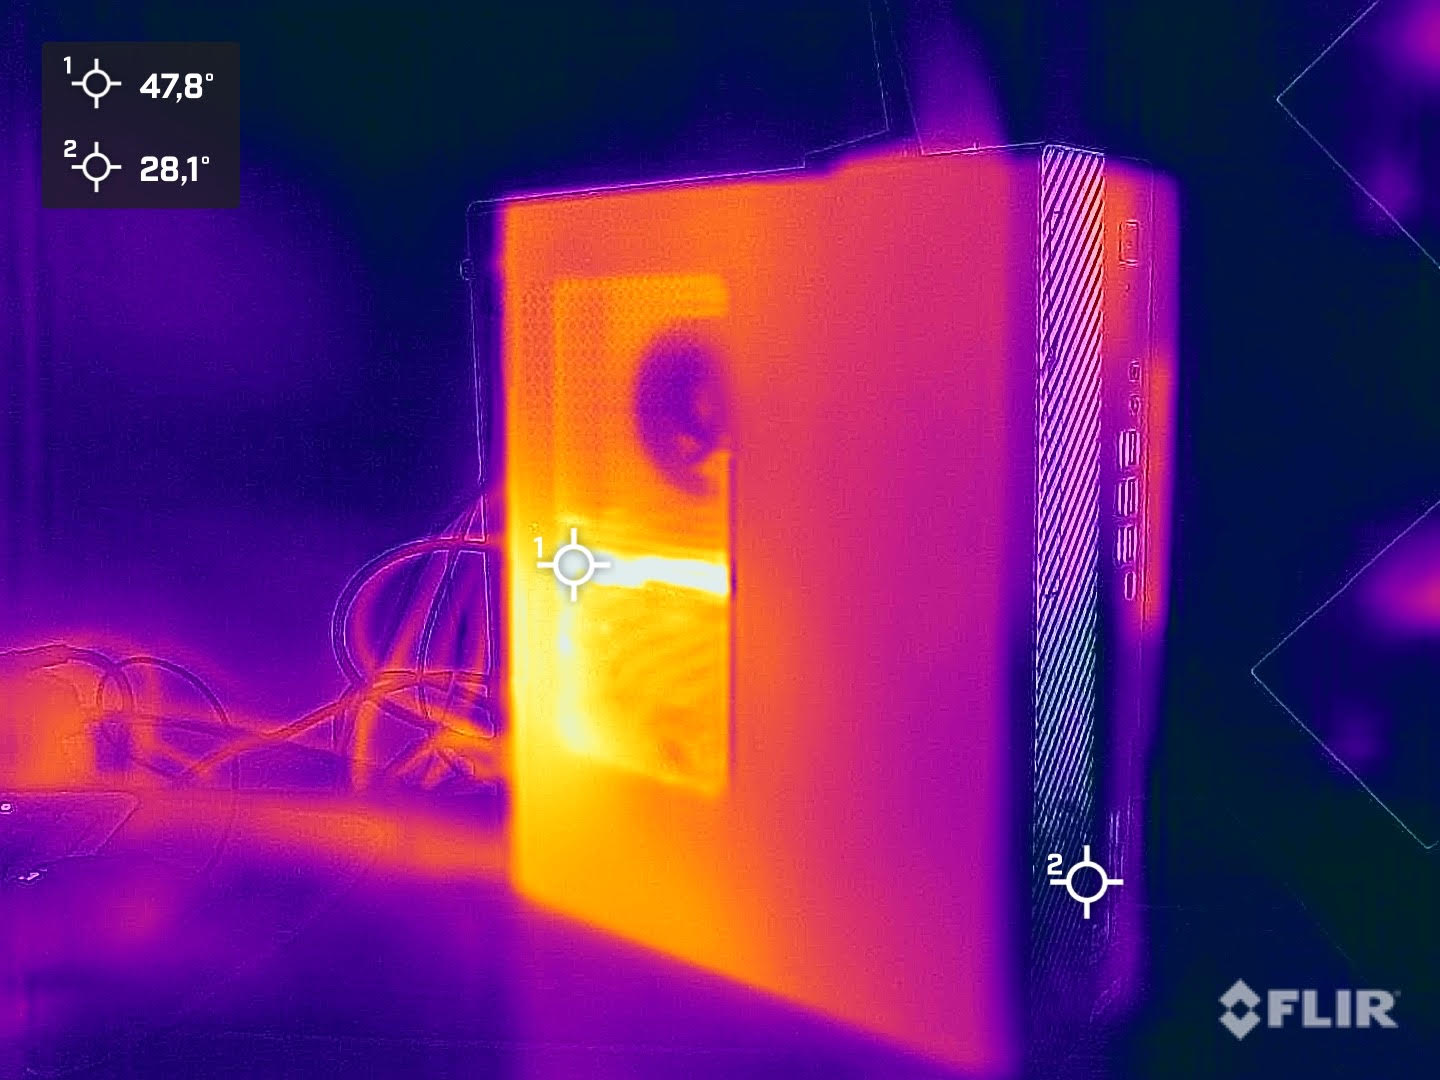
Emissões - Sistema de resfriamento fraco
Emissões sonoras
O sistema de resfriamento do Acer Predator Orion 3000 consiste de um ventilador na frente, que aspira o ar fresco, e um ventilador na parte traseira, que supostamente transporta o ar quente para fora da caixa. Em teoria, isto parece bastante bom, mas na prática, acontece que isto não é o ideal. Não é por nada que a Acer limita o consumo máximo de energia do processador no Predator Orion 3000. No entanto, o PC não se destaca negativamente no teste com apenas 31,6 dB(A) em modo inativo, apesar do refrigerador de CPU muito pequeno. O sistema também é relativamente silencioso sob carga e atinge cerca de 38 dB(A) no teste de estresse. Entretanto, se deixarmos os ventiladores funcionar em velocidade máxima (via modo de jogo Predator Sense), nosso dispositivo de medição mostra 54 dB(A).
Barulho
| Ocioso |
| 31.5 / 31.6 / 31.6 dB |
| Carga |
| 32.7 / 38.1 dB |
 | ||
30 dB silencioso 40 dB(A) audível 50 dB(A) ruidosamente alto |
||
min: | ||
| Acer Predator Orion 3000 PO3-640 i7-12700F, GeForce RTX 3070 | Zotac Magnus One (ECM73070C) i7-10700, GeForce RTX 3070 | Zotac ZBOX Magnus EN173070C i7-11800H, GeForce RTX 3070 Laptop GPU | Intel Dragon Canyon NUC - RTX 3060 i9-12900, GeForce RTX 3060 | |
|---|---|---|---|---|
| Noise | -18% | -10% | -2% | |
| desligado / ambiente * (dB) | 29.8 | 30 -1% | 30.7 -3% | 30.2 -1% |
| Idle Minimum * (dB) | 31.5 | 33.58 -7% | 32.7 -4% | 30.2 4% |
| Idle Average * (dB) | 31.6 | 32.8 -4% | 30.4 4% | |
| Idle Maximum * (dB) | 31.6 | 32.8 -4% | 30.8 3% | |
| Load Average * (dB) | 32.7 | 44.25 -35% | 41.7 -28% | |
| Load Maximum * (dB) | 38.1 | 48.72 -28% | 45.4 -19% | 45.1 -18% |
* ... menor é melhor
Temperatura
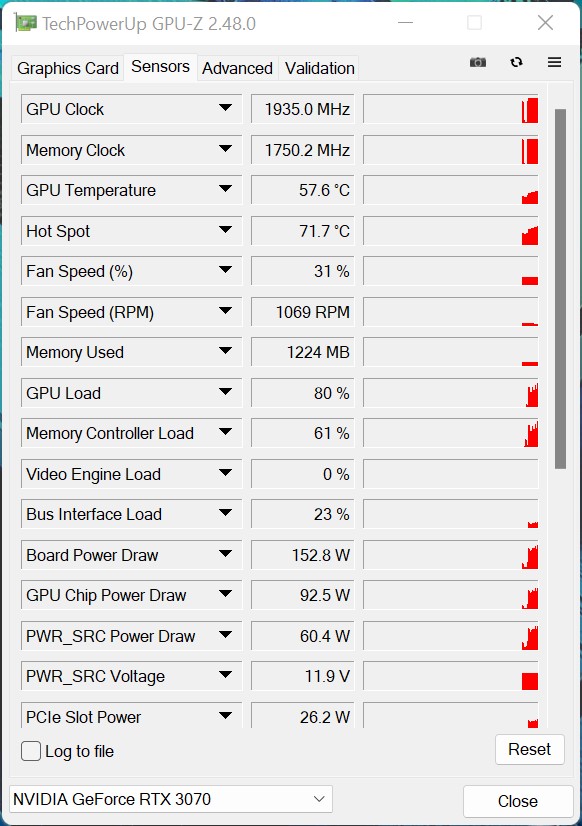
O caso do Acer Predator Orion 3000 aquece um pouco sob carga, mas isto não é problemático. O ventilador único na parte de trás, por outro lado, tira ar muito quente da caixa. Uma dissipação de calor adicional em direção ao topo seria ainda mais eficaz aqui. Observamos o valor mais alto do processador de 98 °C sob carga. Isto mostra que a Acer já está no limite com o resfriamento instalado, mesmo que o Intel Core i7-12700F ainda teria reservas. No entanto, o Predador Orion 3000 ainda poderia proporcionar um bom desempenho no teste. A temperatura máxima da GPU é consideravelmente mais baixa a 70,5 °C
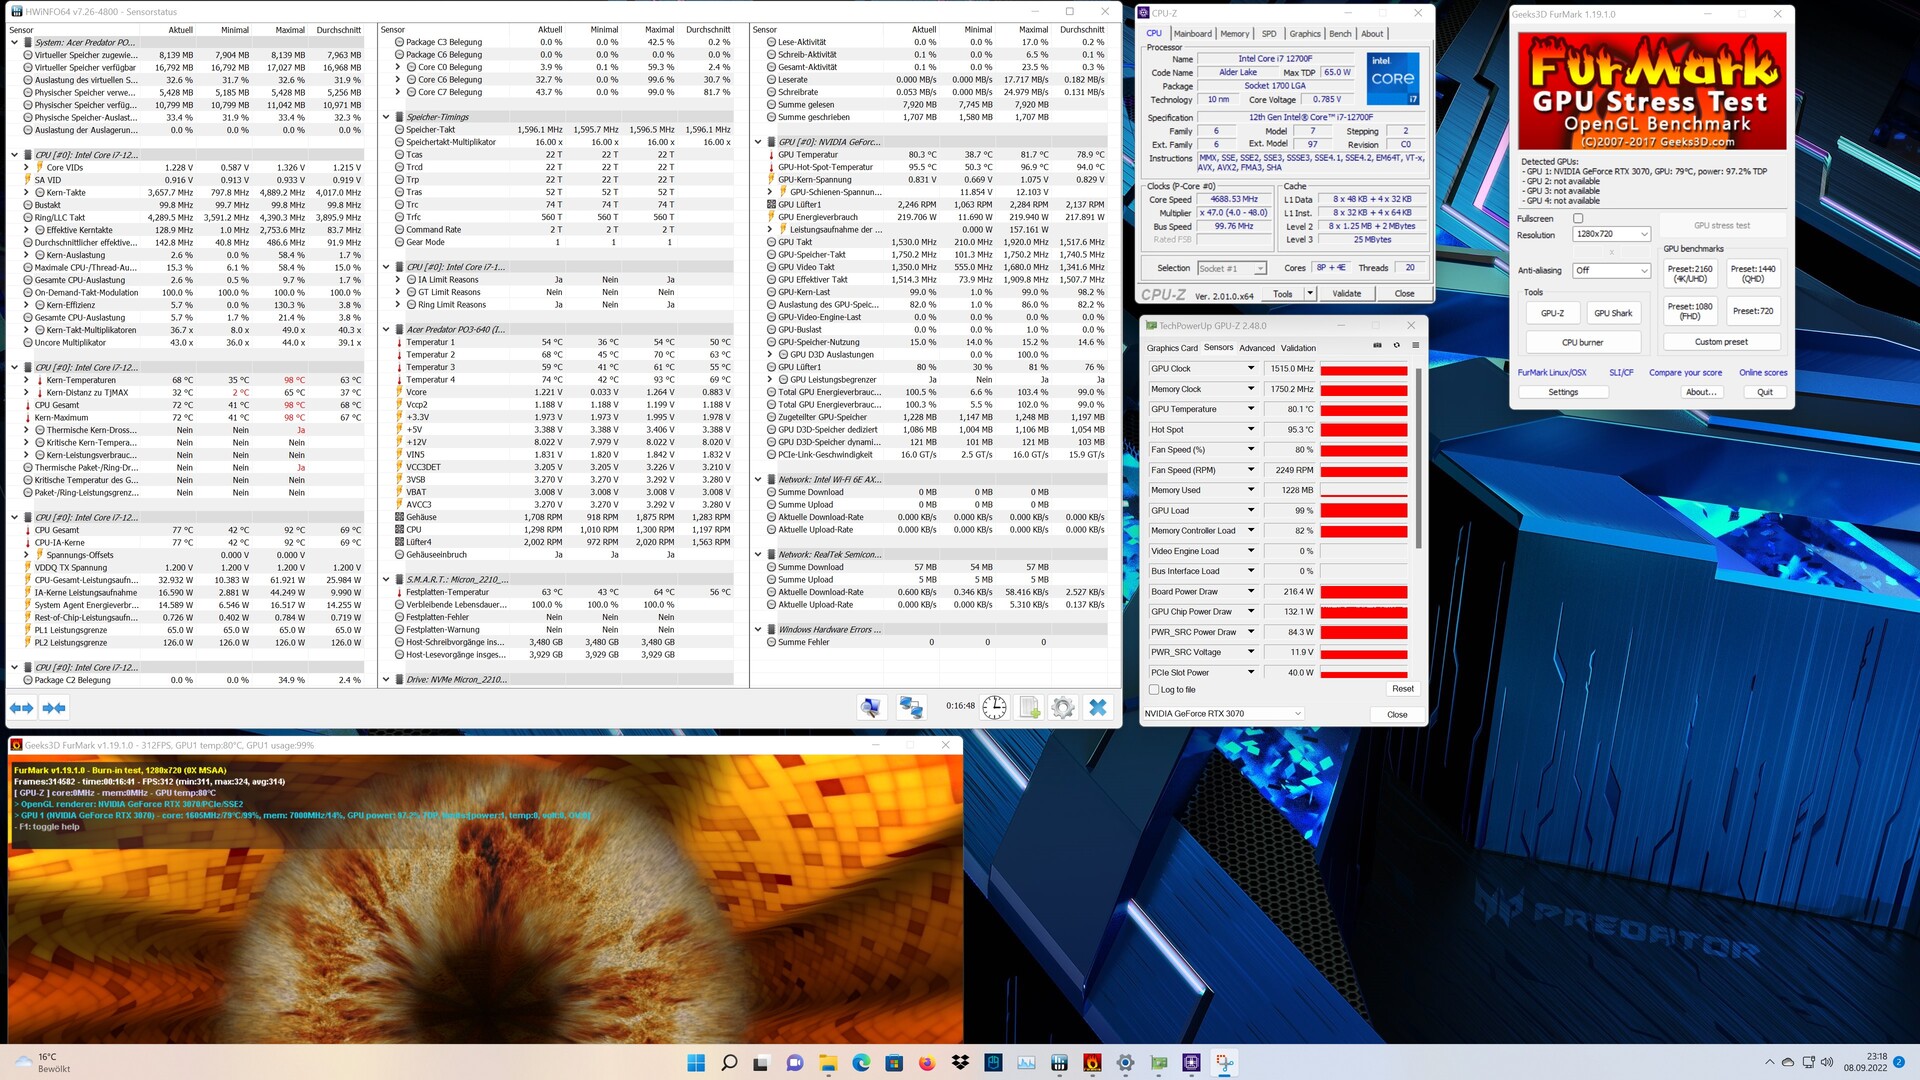
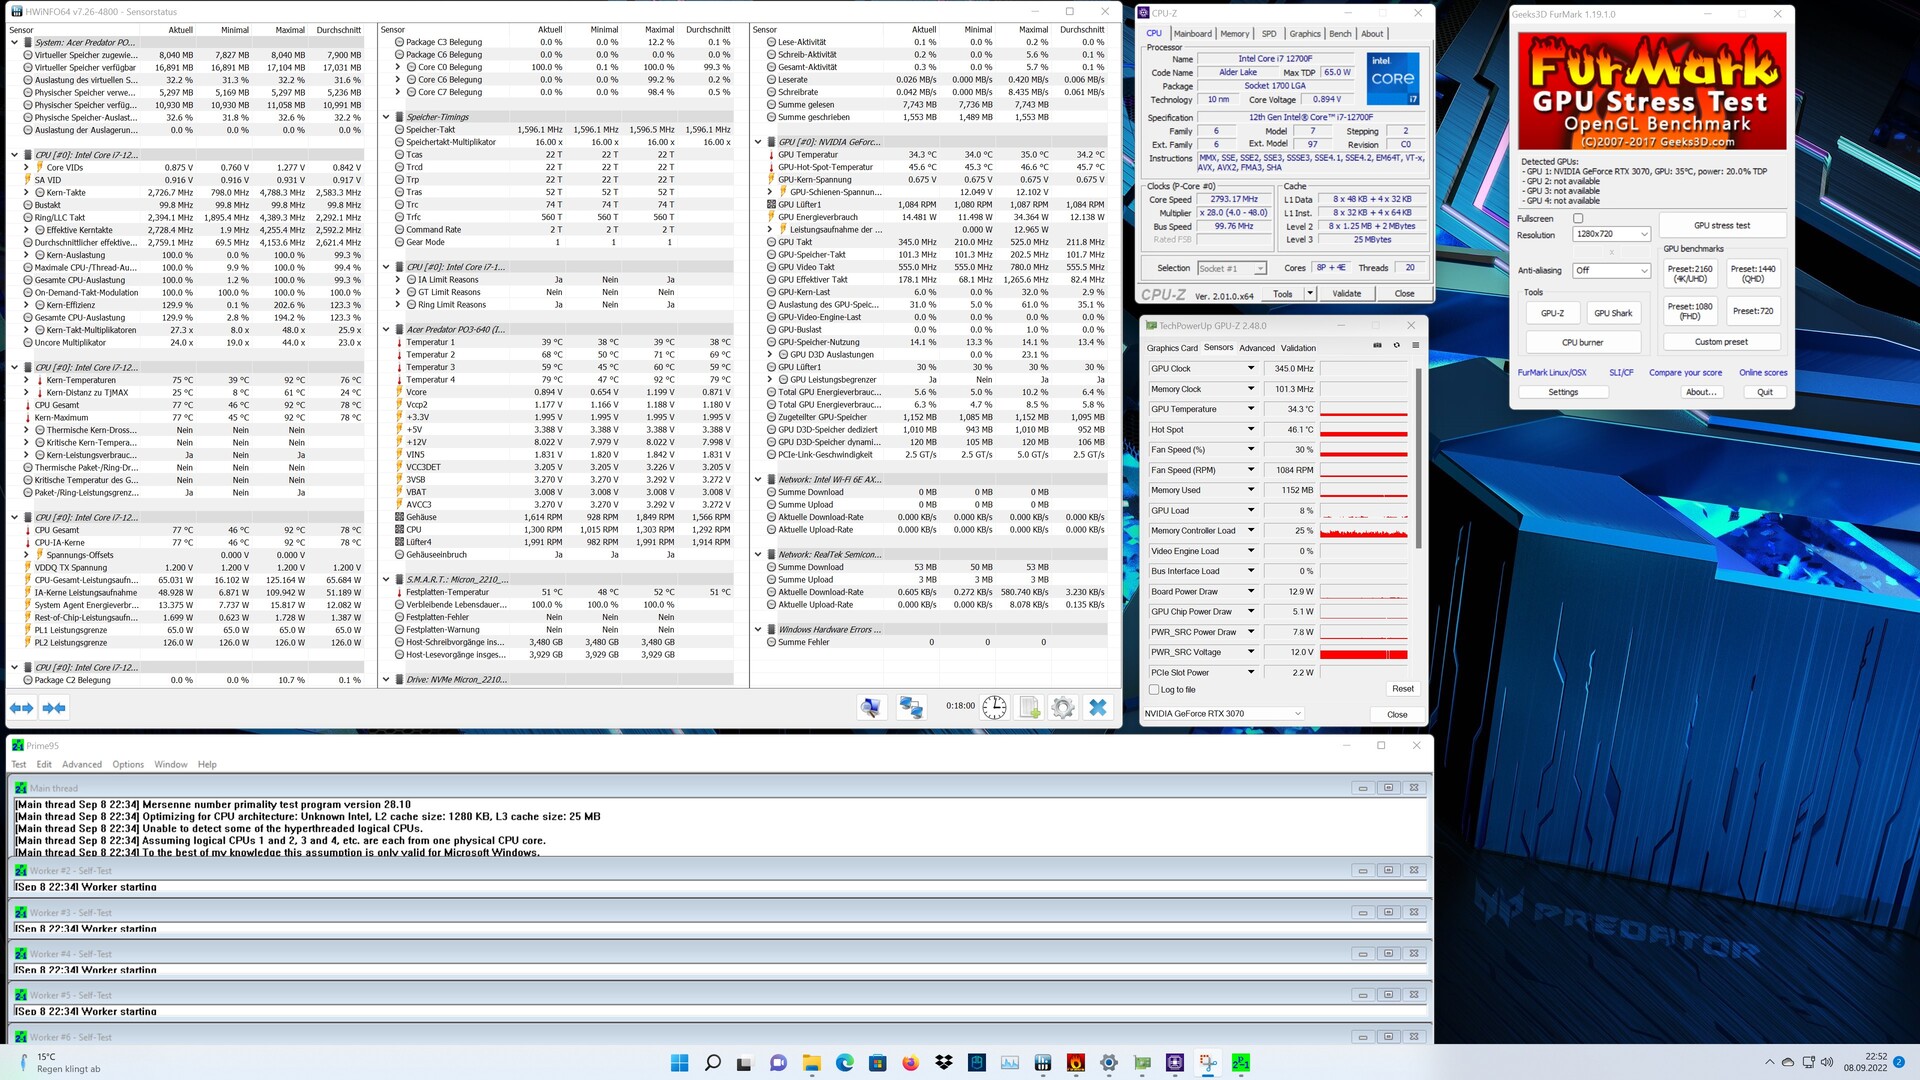
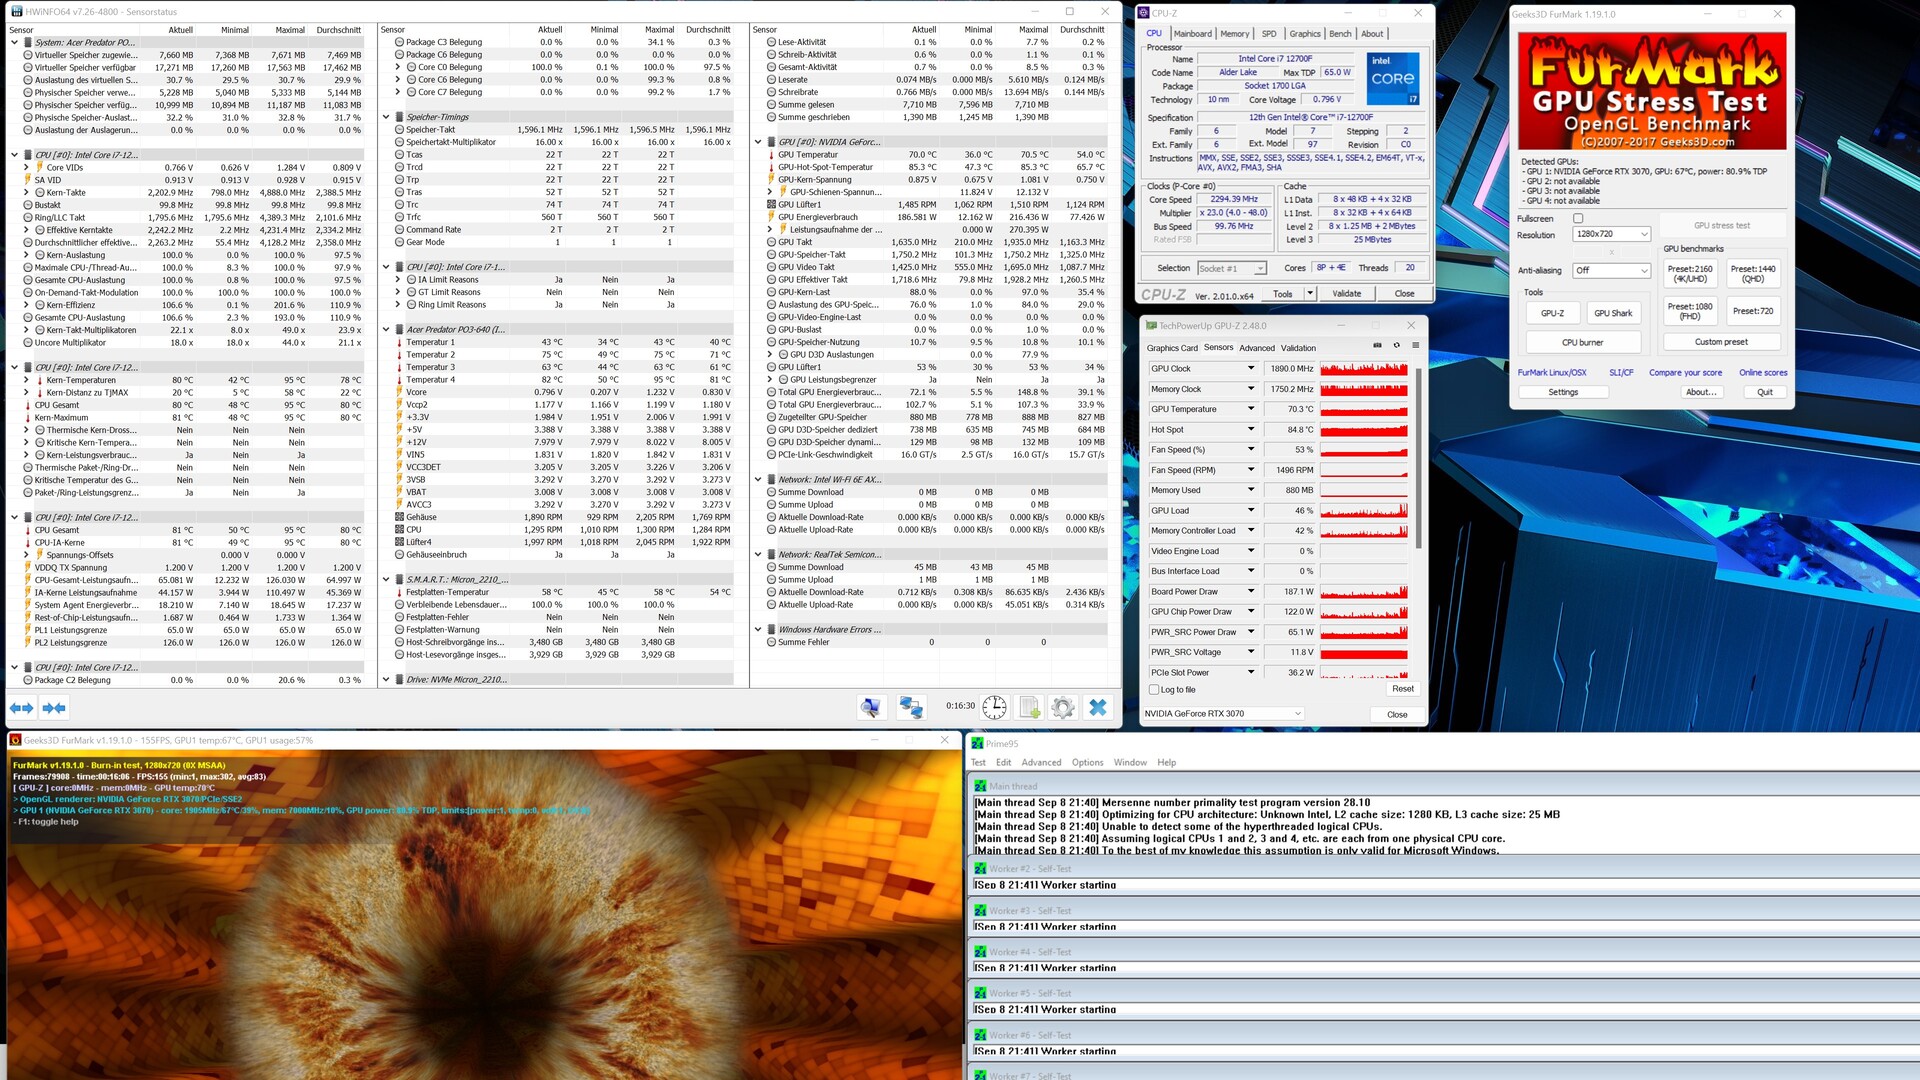
Consumo de energia
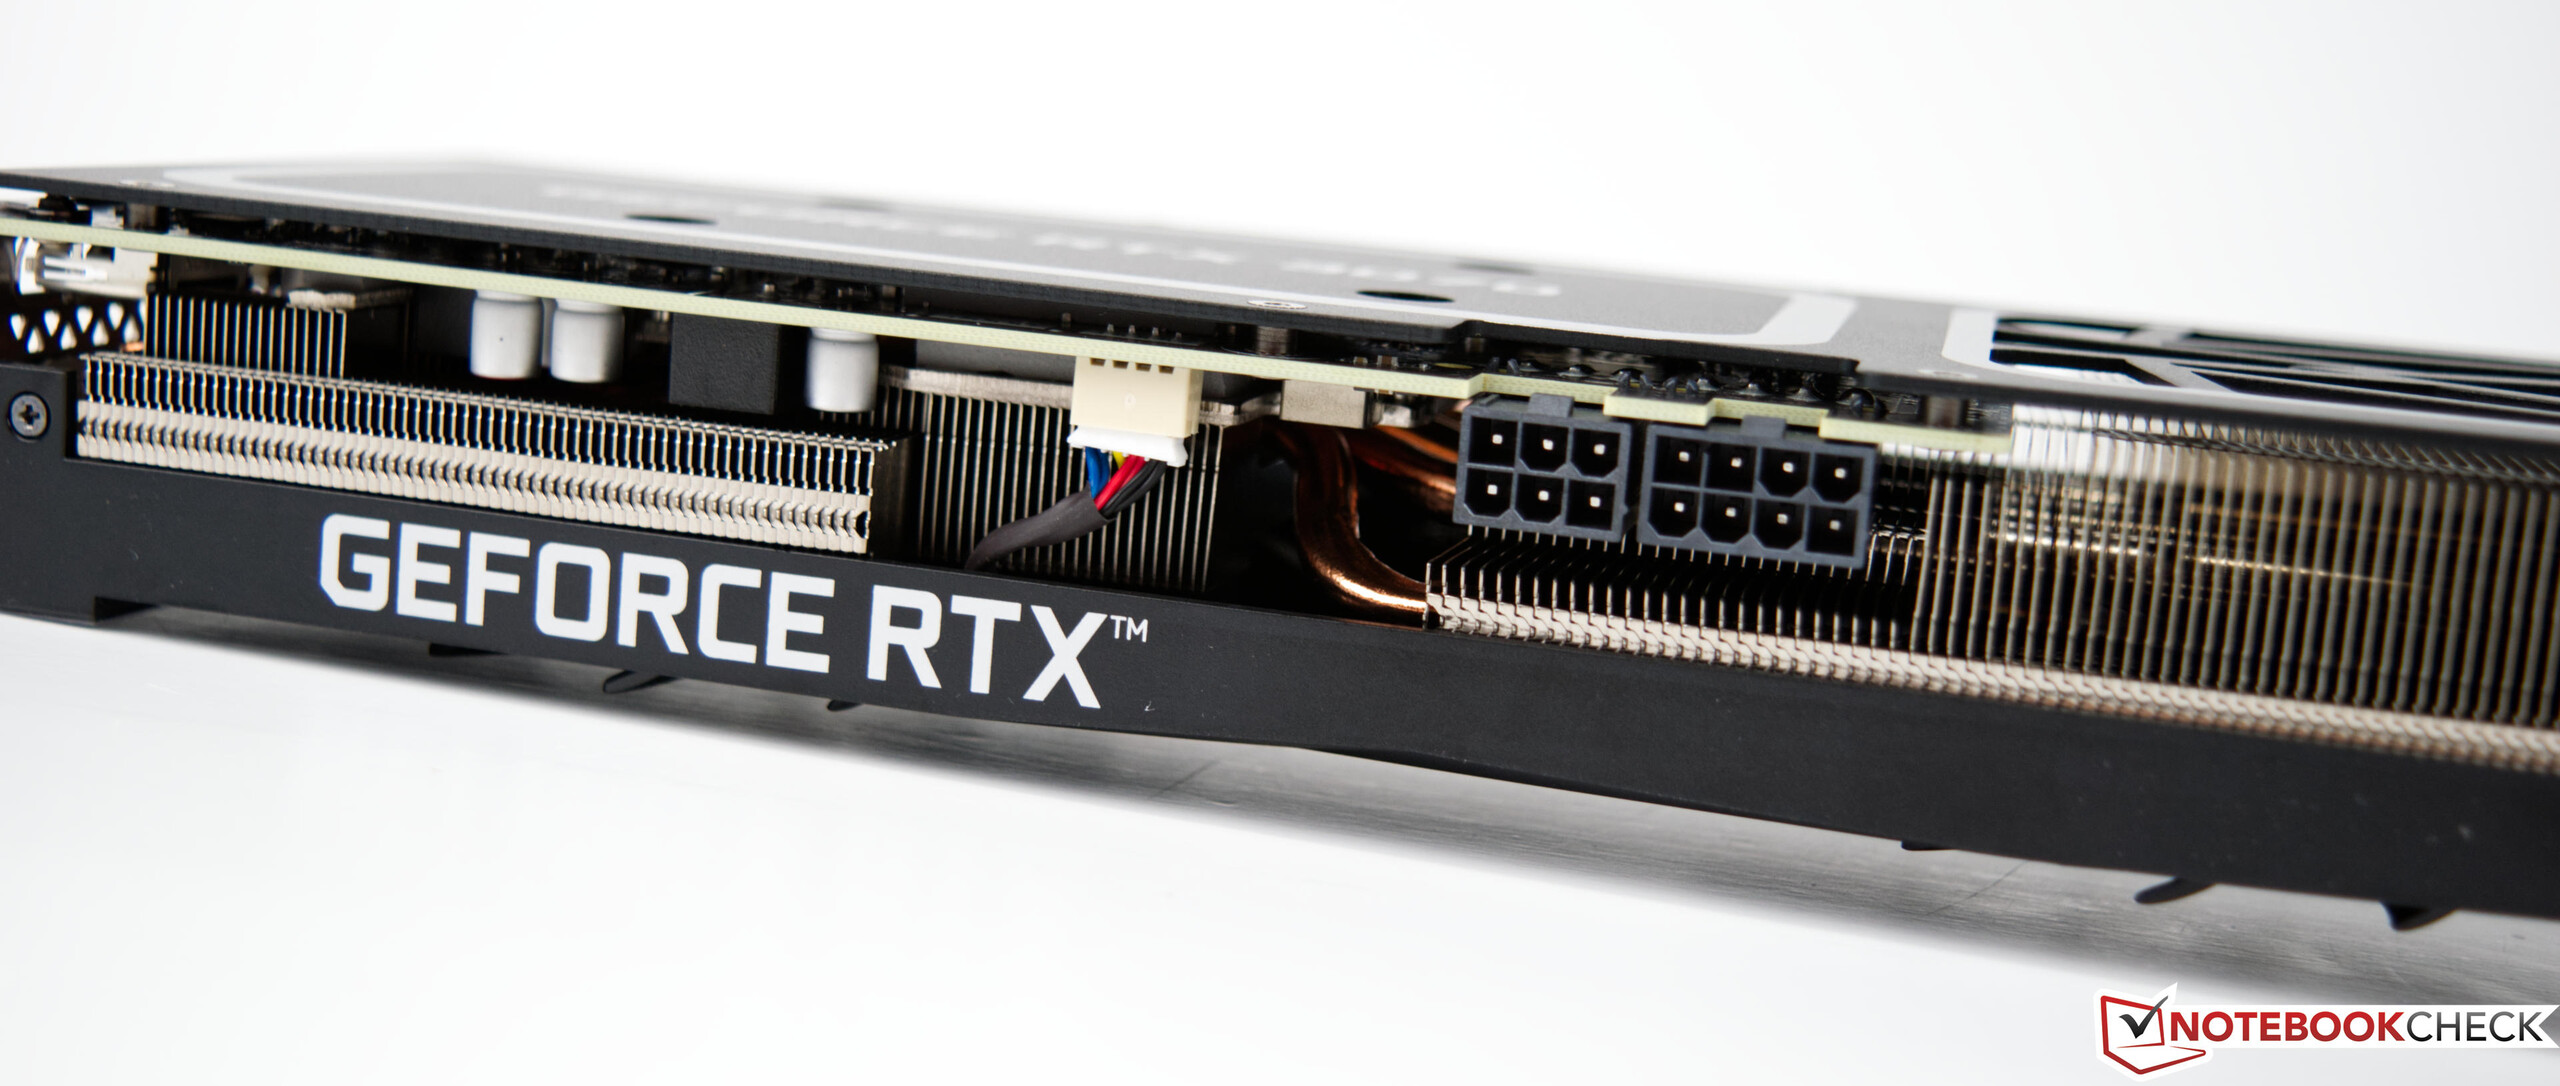
O Acer Predator Orion 3000 é surpreendentemente frugal quando ocioso e sob baixa carga. Nosso medidor mostra apenas pouco menos de 30 watts. É de até 361 watts por um curto período de tempo no teste de estresse, embora apenas 186 watts estejam disponíveis em média. Isto é devido ao PL2, que só é permitido por um máximo de 28 segundos. O consumo de energia do sistema é em média de 338 watts durante os jogos. Documentámos picos de curto prazo de até 364 watts. Uma fonte de alimentação ATX de 500 watts é instalada, o que pode atender às necessidades de hardware.
| desligado | |
| Ocioso | |
| Carga |
|
Key:
min: | |
| Acer Predator Orion 3000 PO3-640 i7-12700F, GeForce RTX 3070 | Zotac ZBOX Magnus EN173070C i7-11800H, GeForce RTX 3070 Laptop GPU | Média NVIDIA GeForce RTX 3070 | Média da turma Desktop | |
|---|---|---|---|---|
| Power Consumption | -27% | -93% | -4% | |
| Idle Minimum * (Watt) | 24.6 | 31.3 -27% | 56 ? -128% | 17.9 ? 27% |
| Idle Average * (Watt) | 24.6 | 35.1 -43% | 58.5 ? -138% | 37.2 ? -51% |
| Idle Maximum * (Watt) | 29.6 | 41.6 -41% | 70.5 ? -138% | 41.3 ? -40% |
| Load Average * (Watt) | 124.6 | 214 -72% | 122.1 ? 2% | 96.7 ? 22% |
| Witcher 3 ultra * (Watt) | 338.1 | 193.5 43% | ||
| Load Maximum * (Watt) | 186.1 | 231 -24% | 305 ? -64% | 141.6 ? 24% |
* ... menor é melhor
Power Consumption with external Monitor
Pro
Contra
Conclusão - PC de jogo rápido com resfriamento fraco

O Acer Predator Orion 3000 é um PC de jogos compacto e é baseado na geração atual de CPU da Intel. O Intel Core i7-12700F oferece muito bom desempenho e é rápido o suficiente para atender às exigências dos jogos atuais, apesar da limitação do PL2. Mais poderia ter sido alcançado aqui com melhor resfriamento. Com o Nvidia GeForce RTX 3070, você obtém um modelo convencional que corresponde às especificações da Nvidia. No entanto, o modelo tem bom desempenho e atinge taxas de quadros suaves com resolução de 1440p nos jogos atuais. O resto da configuração é bastante padrão com um SSD de 1 TB e 16 GB de RAM DDR4. O uso de uma RAM DDR5 mais rápida teria sido à prova de futuro aqui.
Para melhorar a aparência do Acer Predator Orion 3000, o painel do lado esquerdo pode ser substituído por um painel lateral com uma janela de visualização. Isto é parte do escopo da entrega. Há também um teclado e um mouse, que captam o visual do Acer Predator e assim fornecem uma imagem geral coerente
Graças ao Intel Core i7-12700F e ao Nvidia GeForce RTX 3070, o Acer Predator Orion 3000 oferece uma boa base como um PC de jogo. Infelizmente, o sistema de resfriamento tem que aceitar alguns compromissos.
O maior ponto de crítica é o resfriamento muito pequeno do processador. Entretanto, é surpreendente que o Acer Predator Orion 3000 não seja insuportavelmente barulhento. O fabricante provavelmente fez sem velocidades mais altas no modo automático, às custas de temperaturas mais altas. Uma curva de ventilador auto-ajustada pode proporcionar temperaturas ligeiramente melhores sob carga. No entanto, as baixas emissões de ruído sob carga também são coisa do passado.
Preços e disponibilidade
O Acer Predator Orion 3000 está disponível diretamente em Acer e custa 2.200 euros em nossa configuração de teste. Atualmente, você também pode obter o dispositivo em Computer Universe por apenas 1.900 euros.
Acer Predator Orion 3000 PO3-640
- 09/13/2022 v7 (old)
Sebastian Bade
Price comparison
