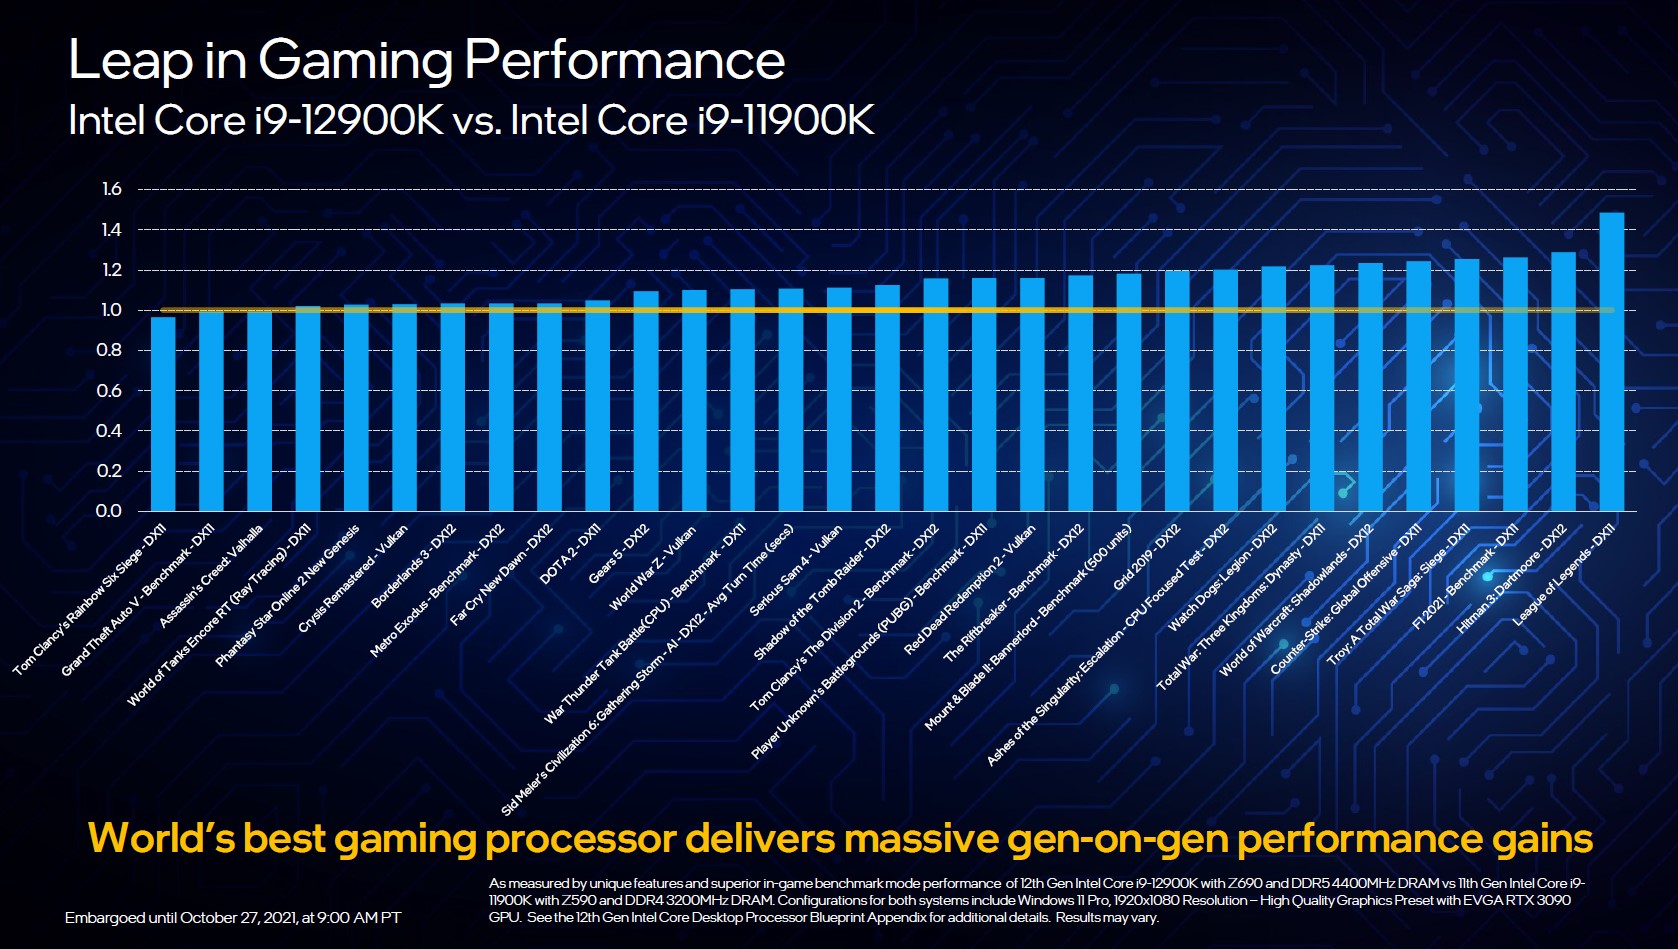
Revisão do Intel Alder Lake-S: A Intel tem novamente a CPU de jogos mais rápida?
A Intel tem muitos planos comLake-S de Amieiro. Durante anos, a Intel foi o padrão de referência para a CPU de jogos mais rápida, até que a AMD acelerou as coisas com seus Ryzen 5000 e levou a coroa. Para o usuário final, este jogo de gato e rato tem muitas vantagens, já que ajuda a obter melhorias mais rápidas para as massas.
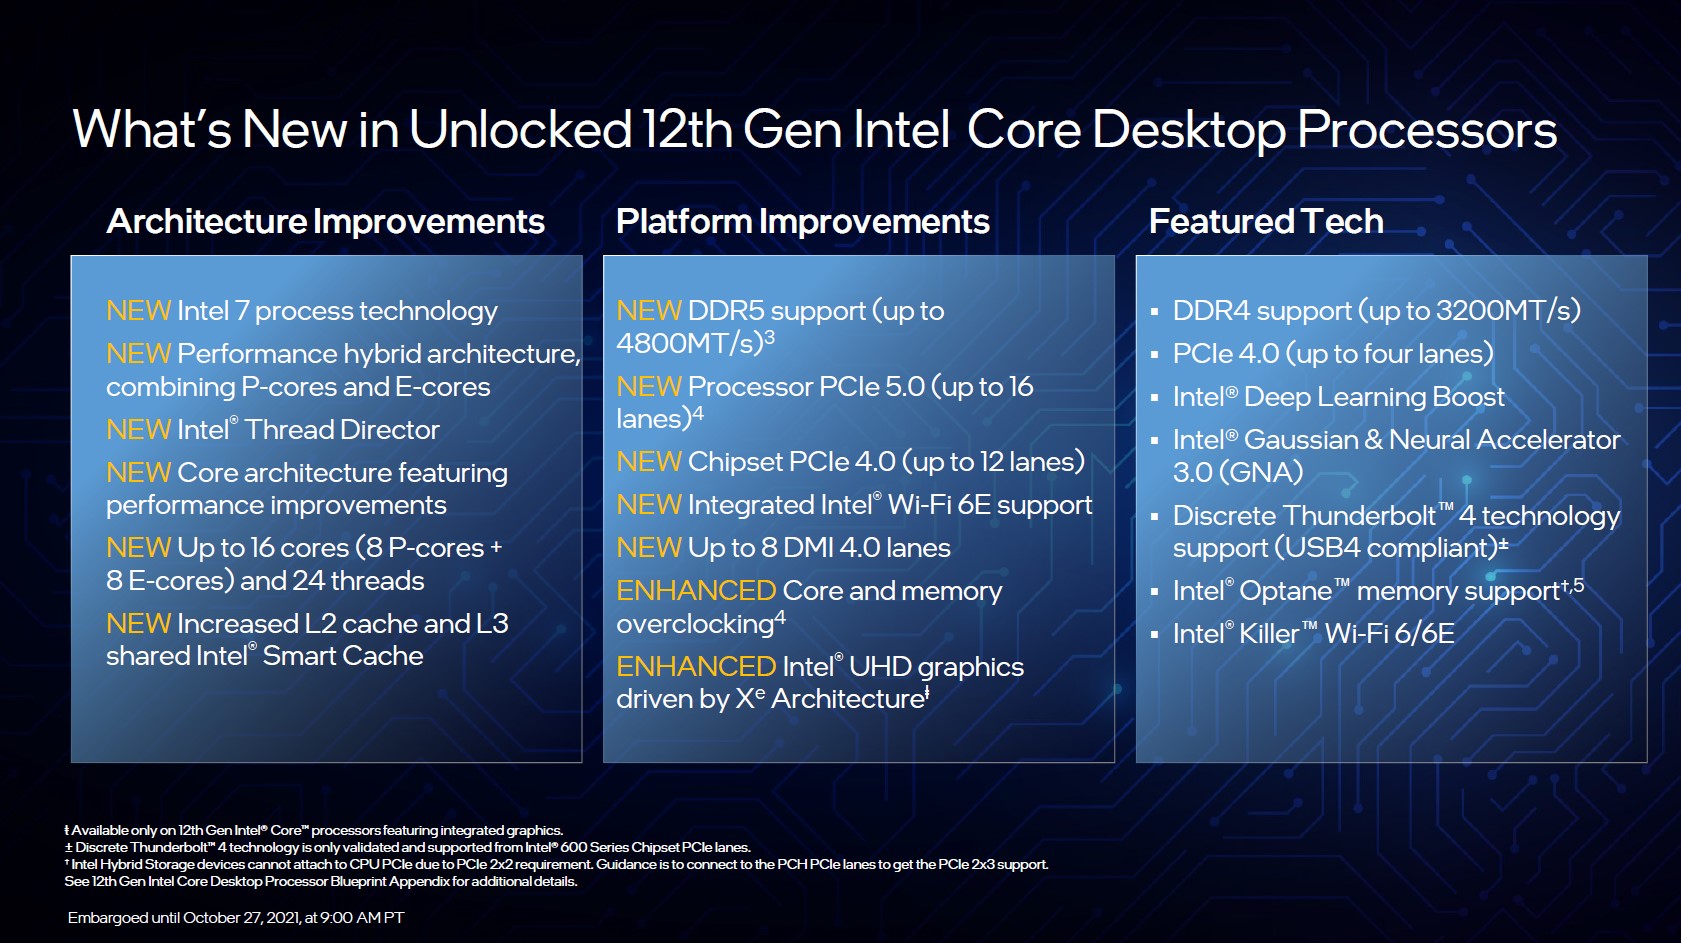
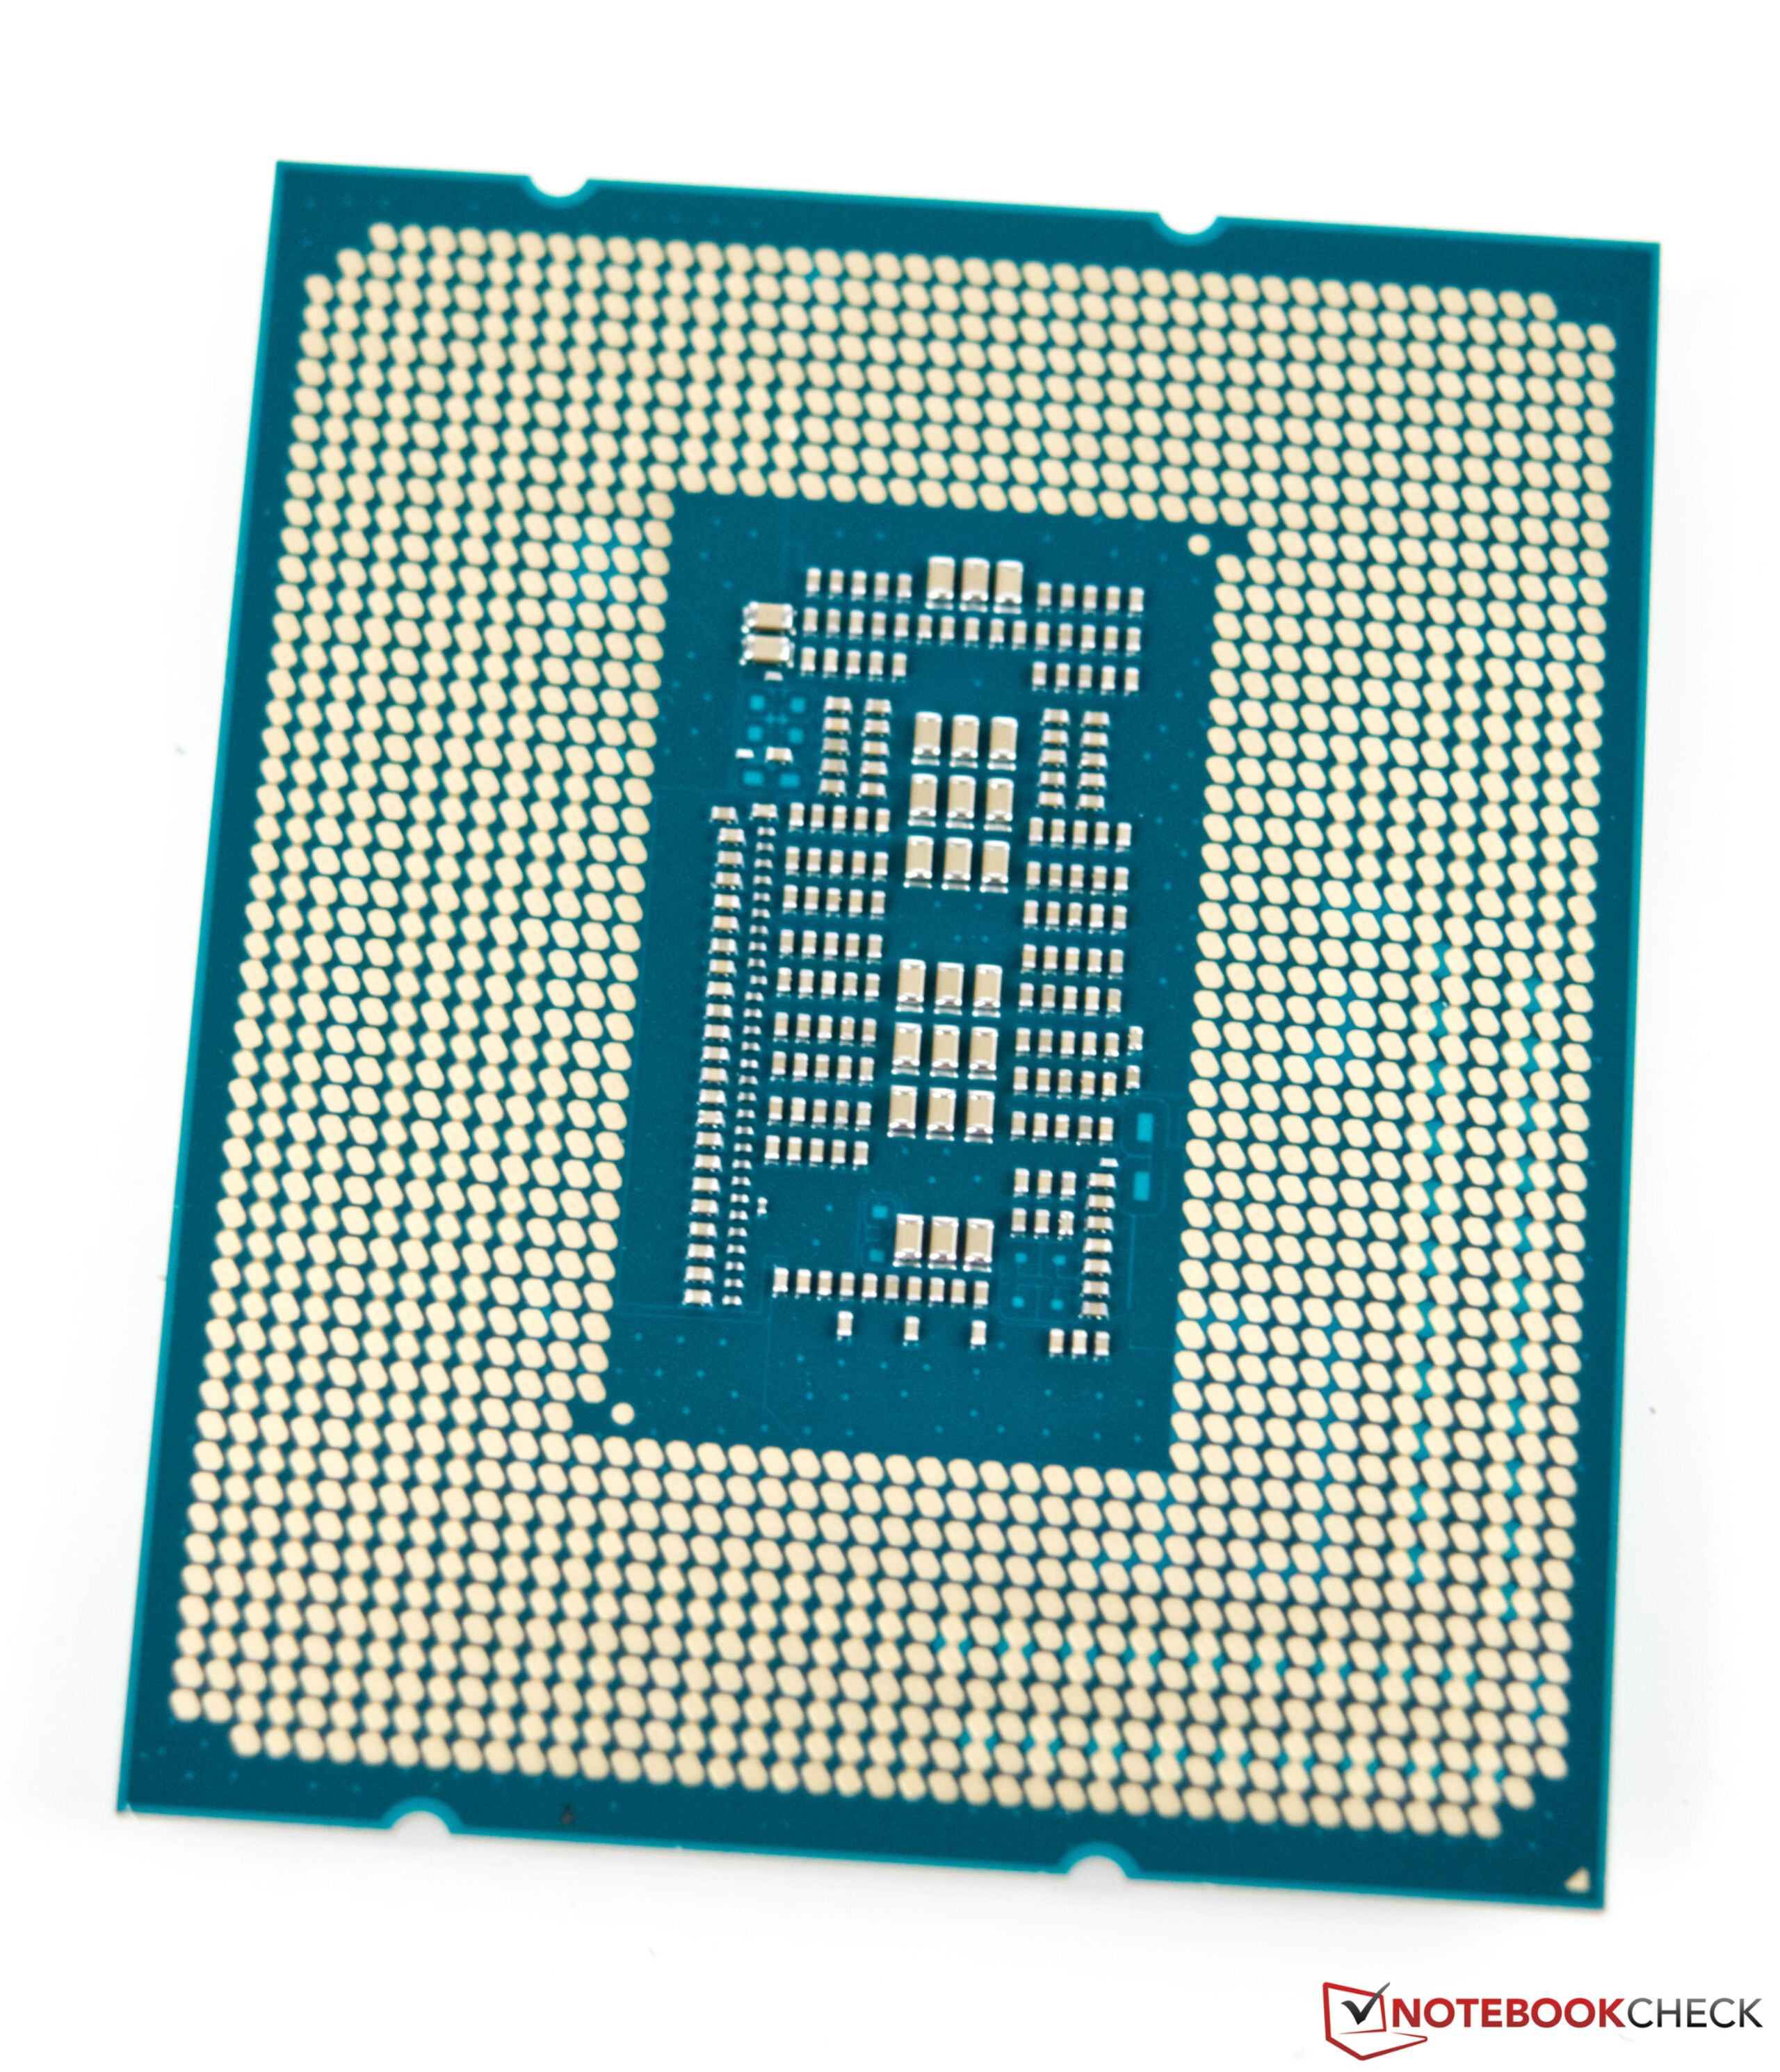
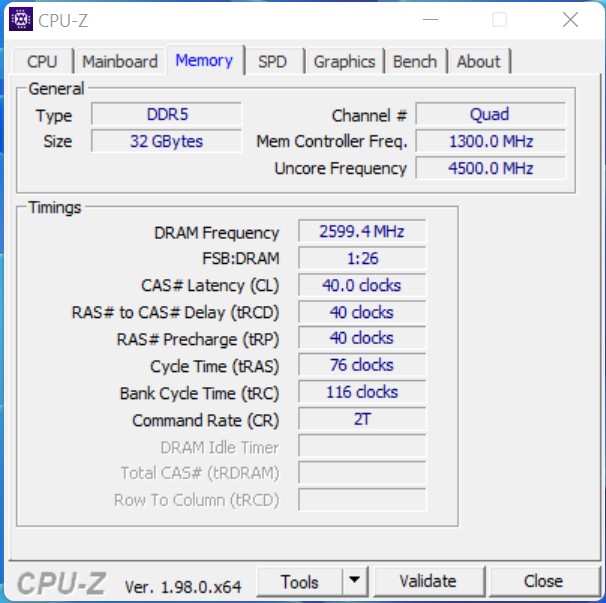
Com os mais novos processadores para o segmento de desktop e a 12ª geração da série Core, a Intel introduz novamente uma mudança na plataforma. Depois de Comet Lake-S e Rocket Lack-S, o LGA1200 já é história, e o maior soquete LGA 1700 assume o comando. As melhorias mais conhecidas são o suporte a DDR5 e PCIe 5.0. Entretanto, neste ponto ainda não há produtos disponíveis que possam utilizar toda esta largura de banda. Isto torna o investimento na plataforma um investimento que só pode ser usado no futuro. As coisas parecem um pouco melhores na memória de trabalho. Aqueles que querem aderir à mais nova tendência e obter o melhor desempenho não contornarão a nova memória de trabalho DDR5. Mas os processadores Intel Alder Lake-S também suportam a RAM DDR4. Você pode encontrar as placas correspondentes para venda também com o novo chipset high-end Z690.
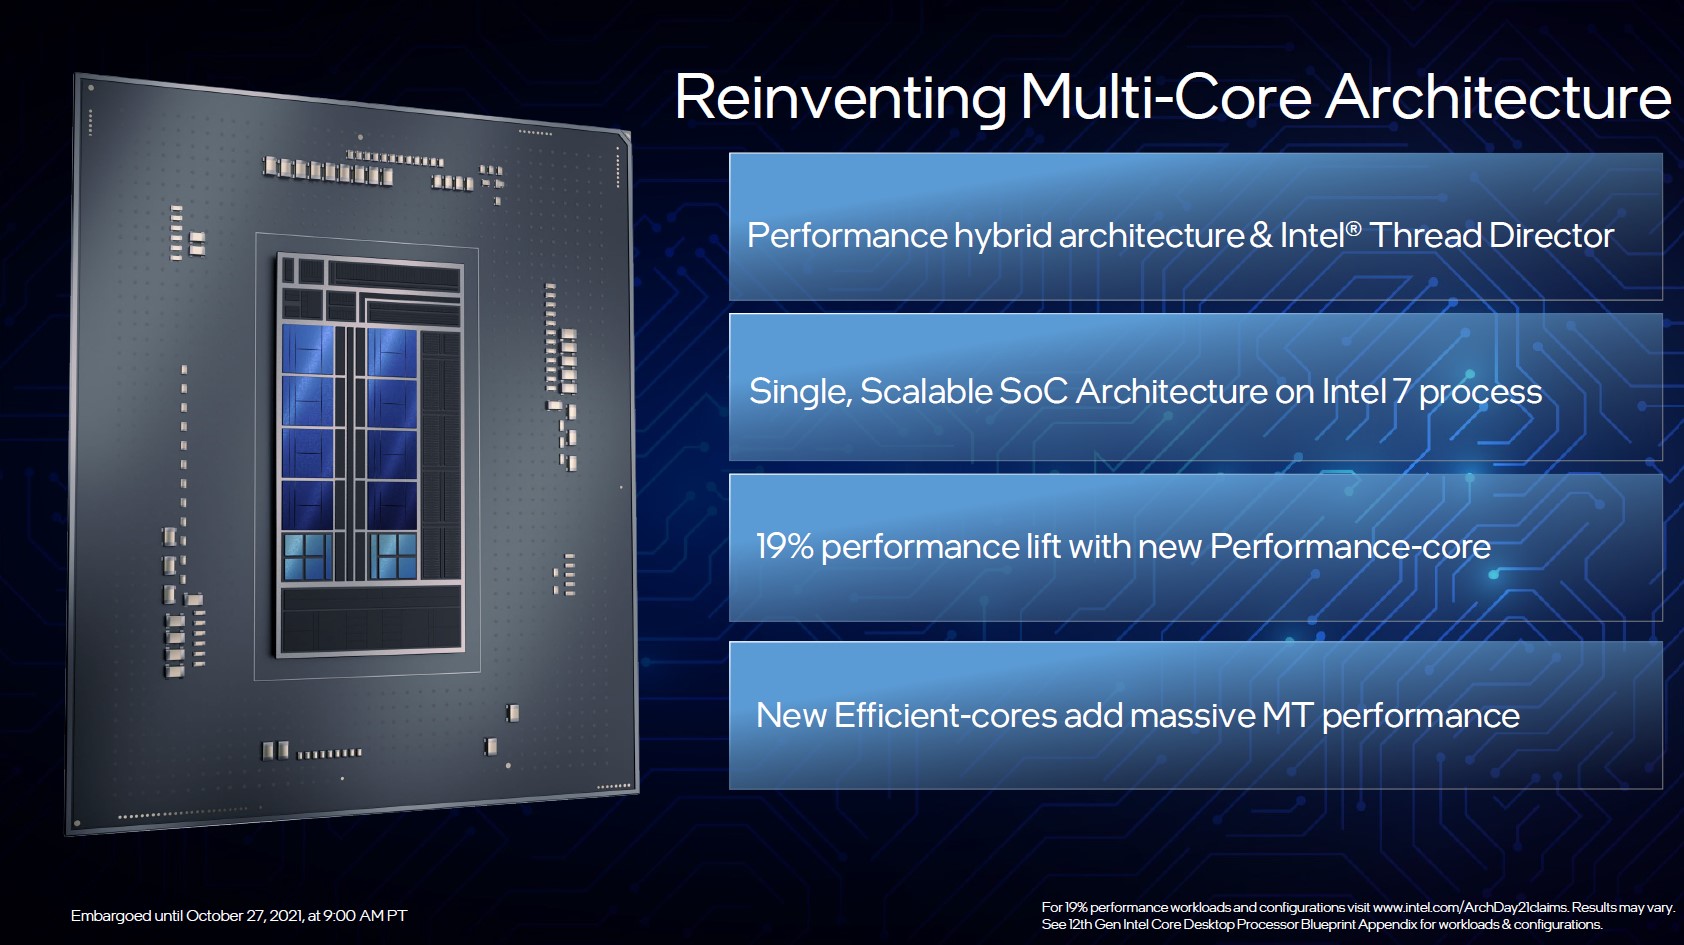
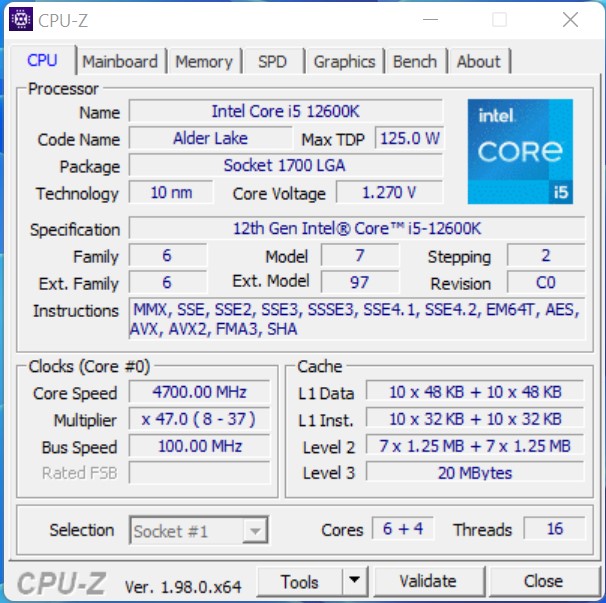
Com o Alder Lake-S, a Intel dá um grande passo à frente que não é apenas uma pequena atualização do Rocket Lake-S. O novo projeto é dividido em núcleos de desempenho, os chamados núcleos P, e núcleos de eficiência energética, os núcleos E. Isto permite que o modelo topo de linha manuseie 24 fios, resultantes de 8 núcleos P, incluindo hyperthreading (HT) e 8 núcleos E sem HT. No menor Intel Core i5-12600K, que também estamos examinando nesta revisão, são 6 P-cores e 4 E-cores, resultando em 16 roscas. Os novos E-cores devem tirar alguma carga dos P-cores, liberando-os para oferecer desempenho computacional suficiente para aplicações exigentes enquanto os E-cores lidam com os processos de fundo. Mas os E-cores não são de forma alguma unidades de computação lentas, e seu desempenho está no nível do Skylake. O gerenciamento ideal dos núcleos é feito pelo diretor de thread da Intel. O Windows 11 como sistema operacional é um requisito para uma utilização otimizada.
Reunimos os representantes mais importantes da nova família Alder Lake-S para você na lista abaixo
Os processadores Core da série Alder Lake-S em um relance
| Modelo | Cores / Roscas |
Corpo P-Core de Velocidade do Relógio / Turbo | Turbo 3.0 | Corpo E-Core de Velocidade do Relógio / Turbo | Cache L2 + L3 | Gráficos | PBP | MTB | Preço (SRP) |
| Core i9-12900K | 16(8P + 8E) /24 | 3,2 GHz / 5,1 GHz | 5,2 GHz | 2,4 GHz / 3,9 GHz | 14+ 30 MB | UHD770 | 125Watt | 241Watt | $ 589 |
| Core i9-12900KF | 16 (8P + 8E) /24 | 3,2 GHz / 5,1 GHz | 5,2 GHz | 2,4 GHz / 3,9 GHz | 14 + 30 MB | - | 125 Watt | 241 Watt | $ 564 |
| Core i7-12700K | 12 (8P + 4E) /20 | 3,6 GHz / 4,9 GHz | 5,0 GHz | 2,7 GHz / 3,8 GHz | 12 + 25 MB | UHD 770 | 125 Watt | 190 Watt | $ 409 |
| Core i7-12700KF | 12 (8P + 4E) /20 | 3,6 GHz / 4,9 GHz | 5,0 GHz | 2,7 GHz / 3,8 GHz | 12 + 25 MB | - | 125 Watt | 190 Watt | $ 384 |
| Core i5-12600K | 10(6P + 4E) /16 | 3,7 GHz / 4,9 GHz | - | 2,8 GHz / 3,6 GHz | 9,5 + 20 MB | UHD770 | 125Watt | 150Watt | $ 289 |
| Core i5-12600KF | 10 (6P + 4E) /16 | 3,7 GHz / 4,9 GHz | - | 2,8 GHz / 3,6 GHz | 9,5 + 20 MB | - | 125 Watt | 150 Watt | $ 264 |
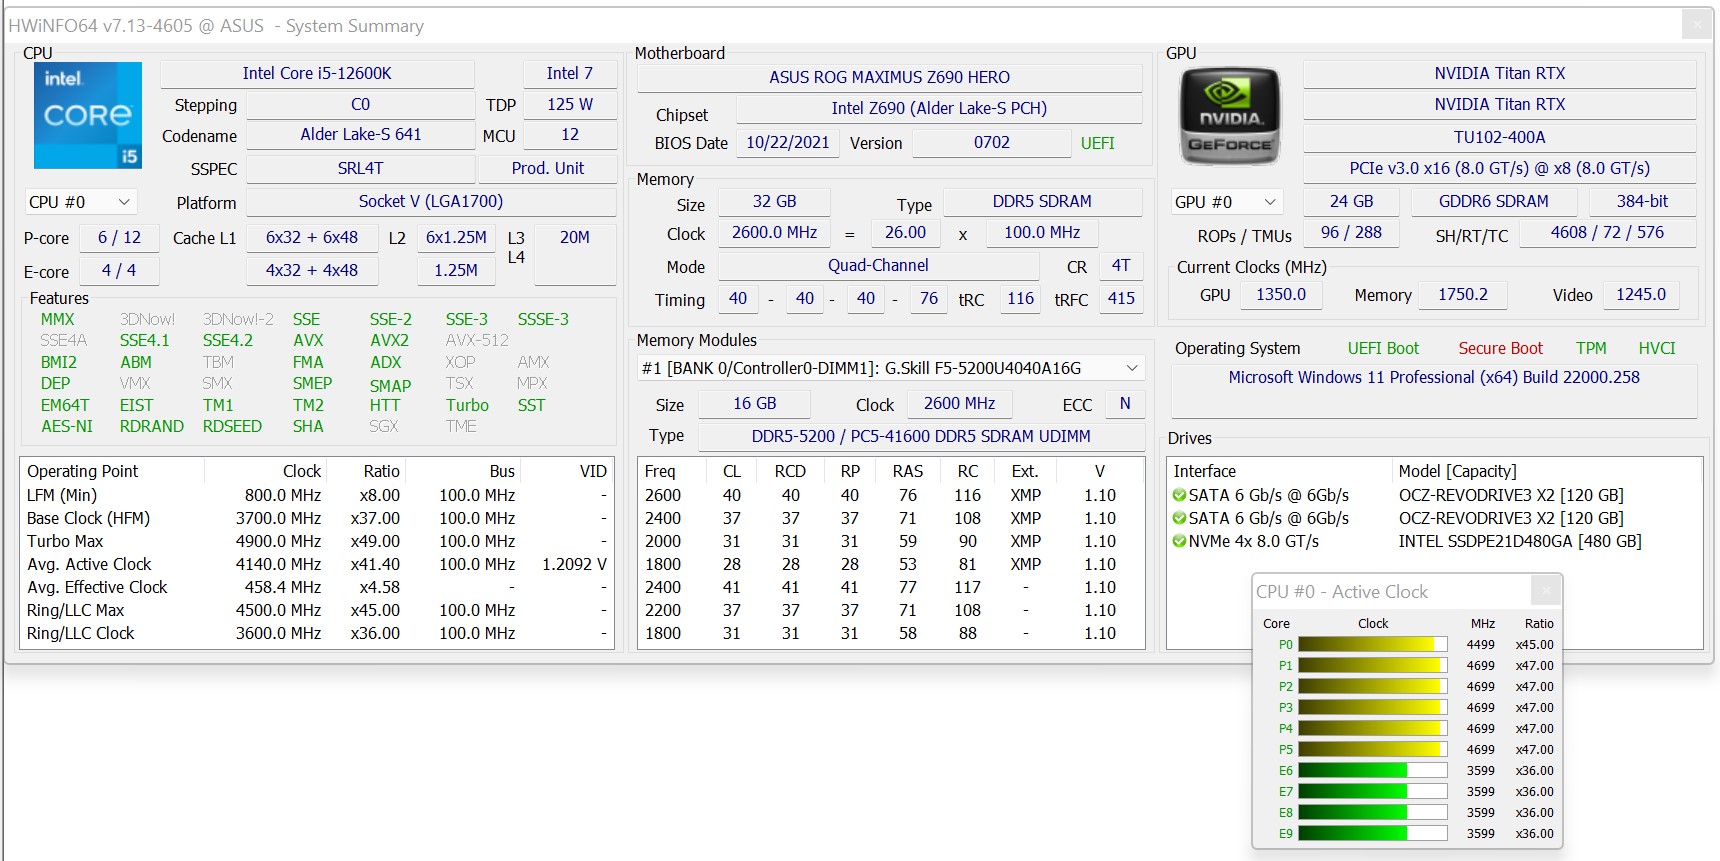
Detalhes de nosso sistema de teste
Utilizamos o seguinte sistema para nossos benchmarks e testes abaixo:
- Raijintek Pean Benchtable
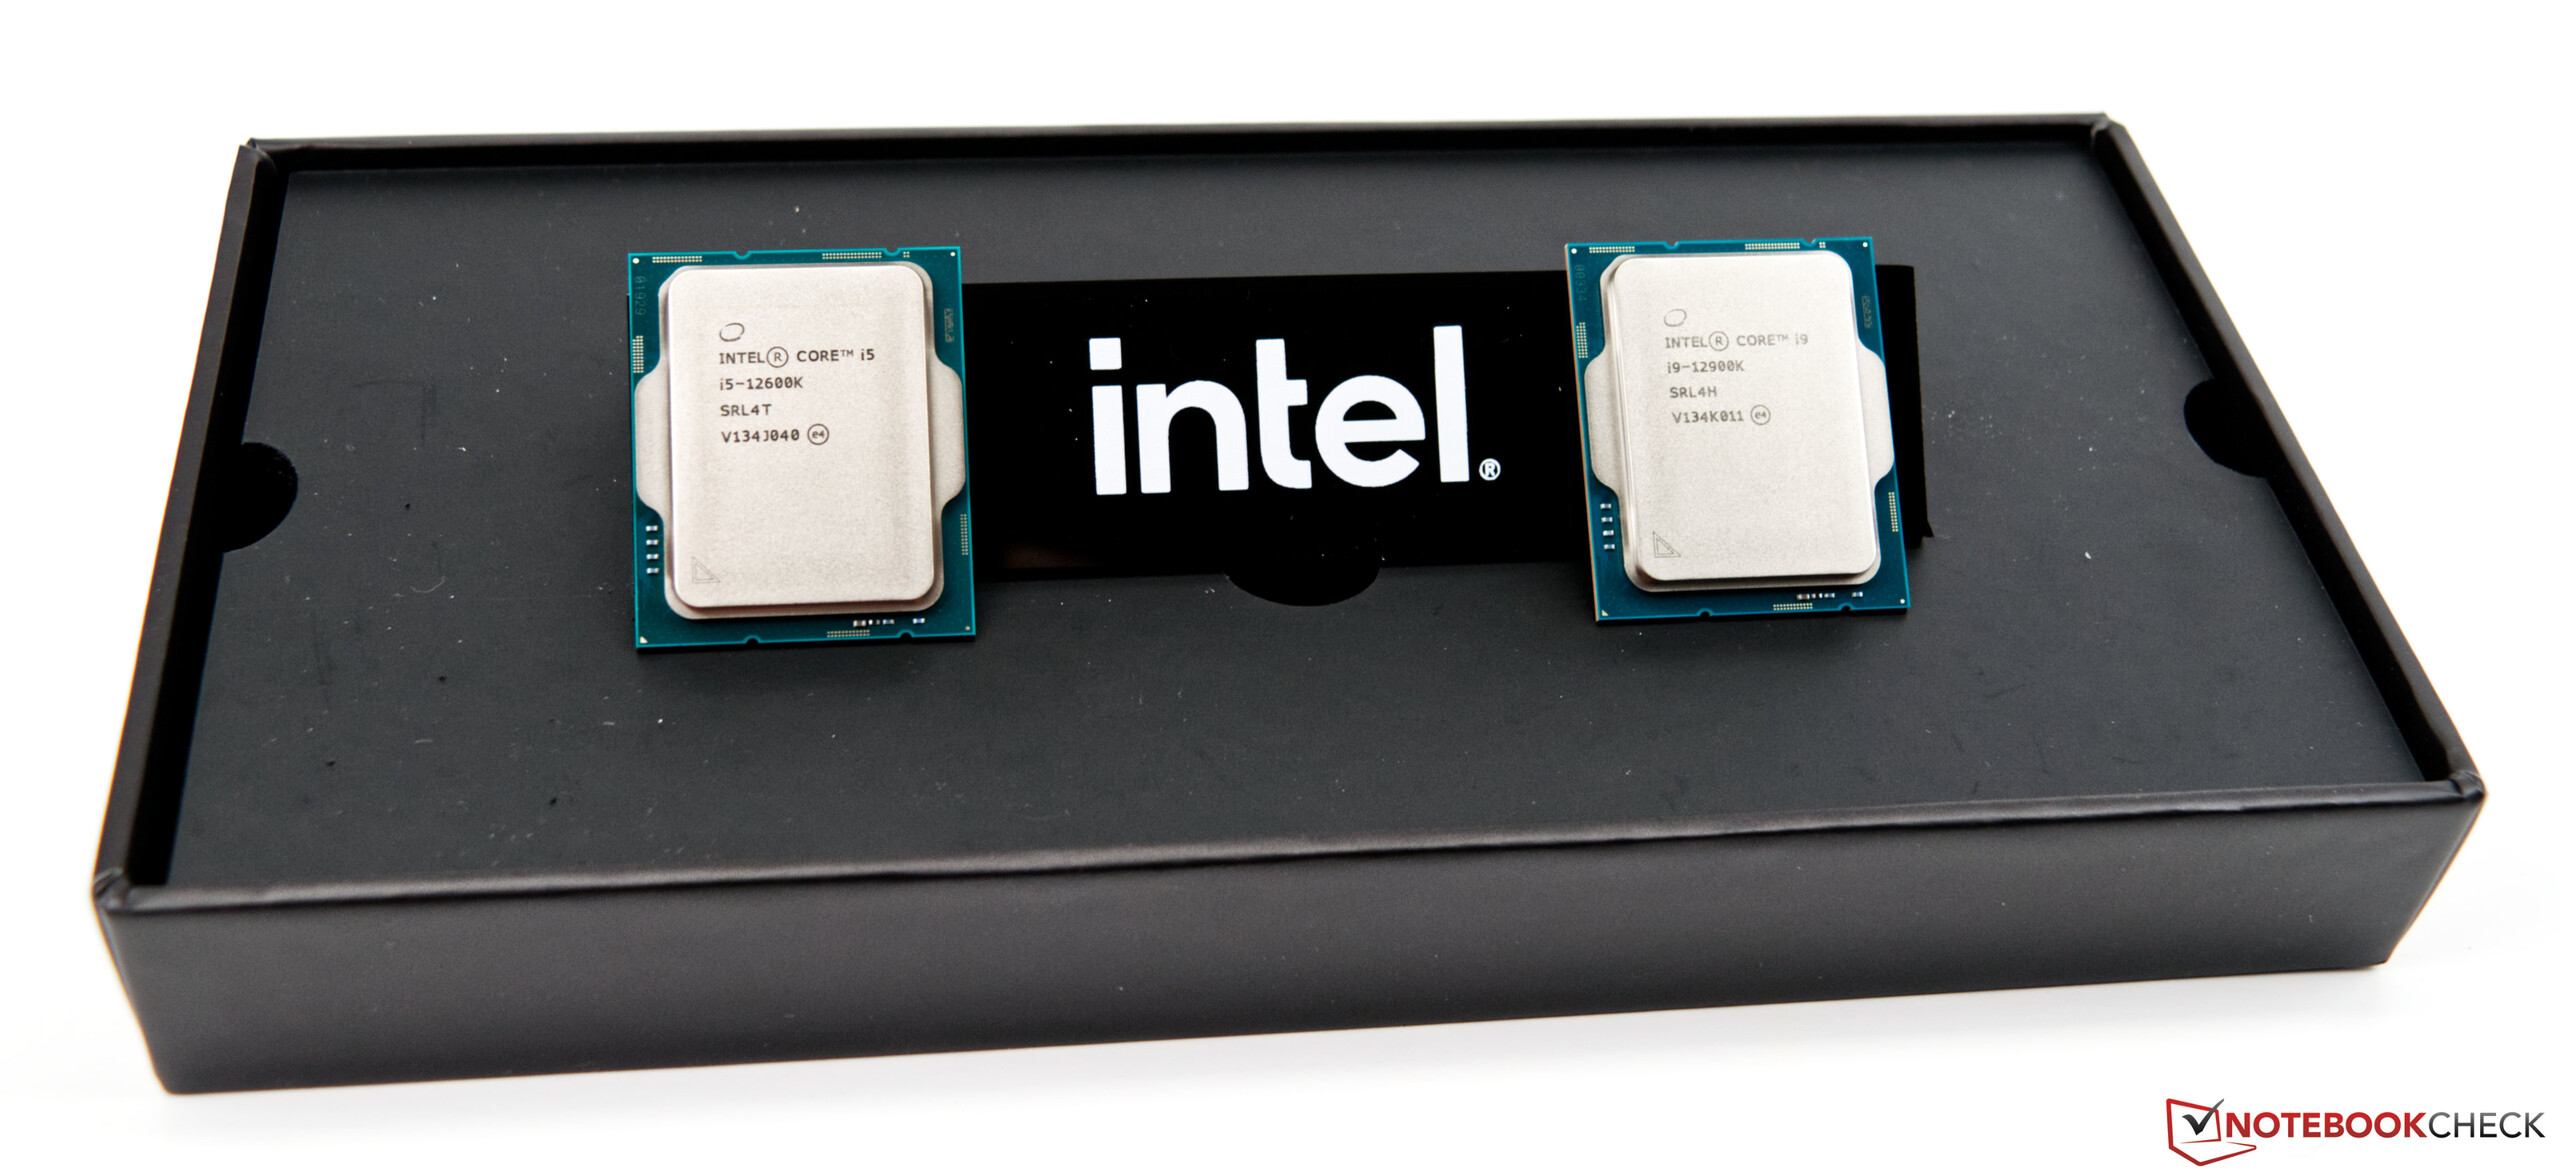
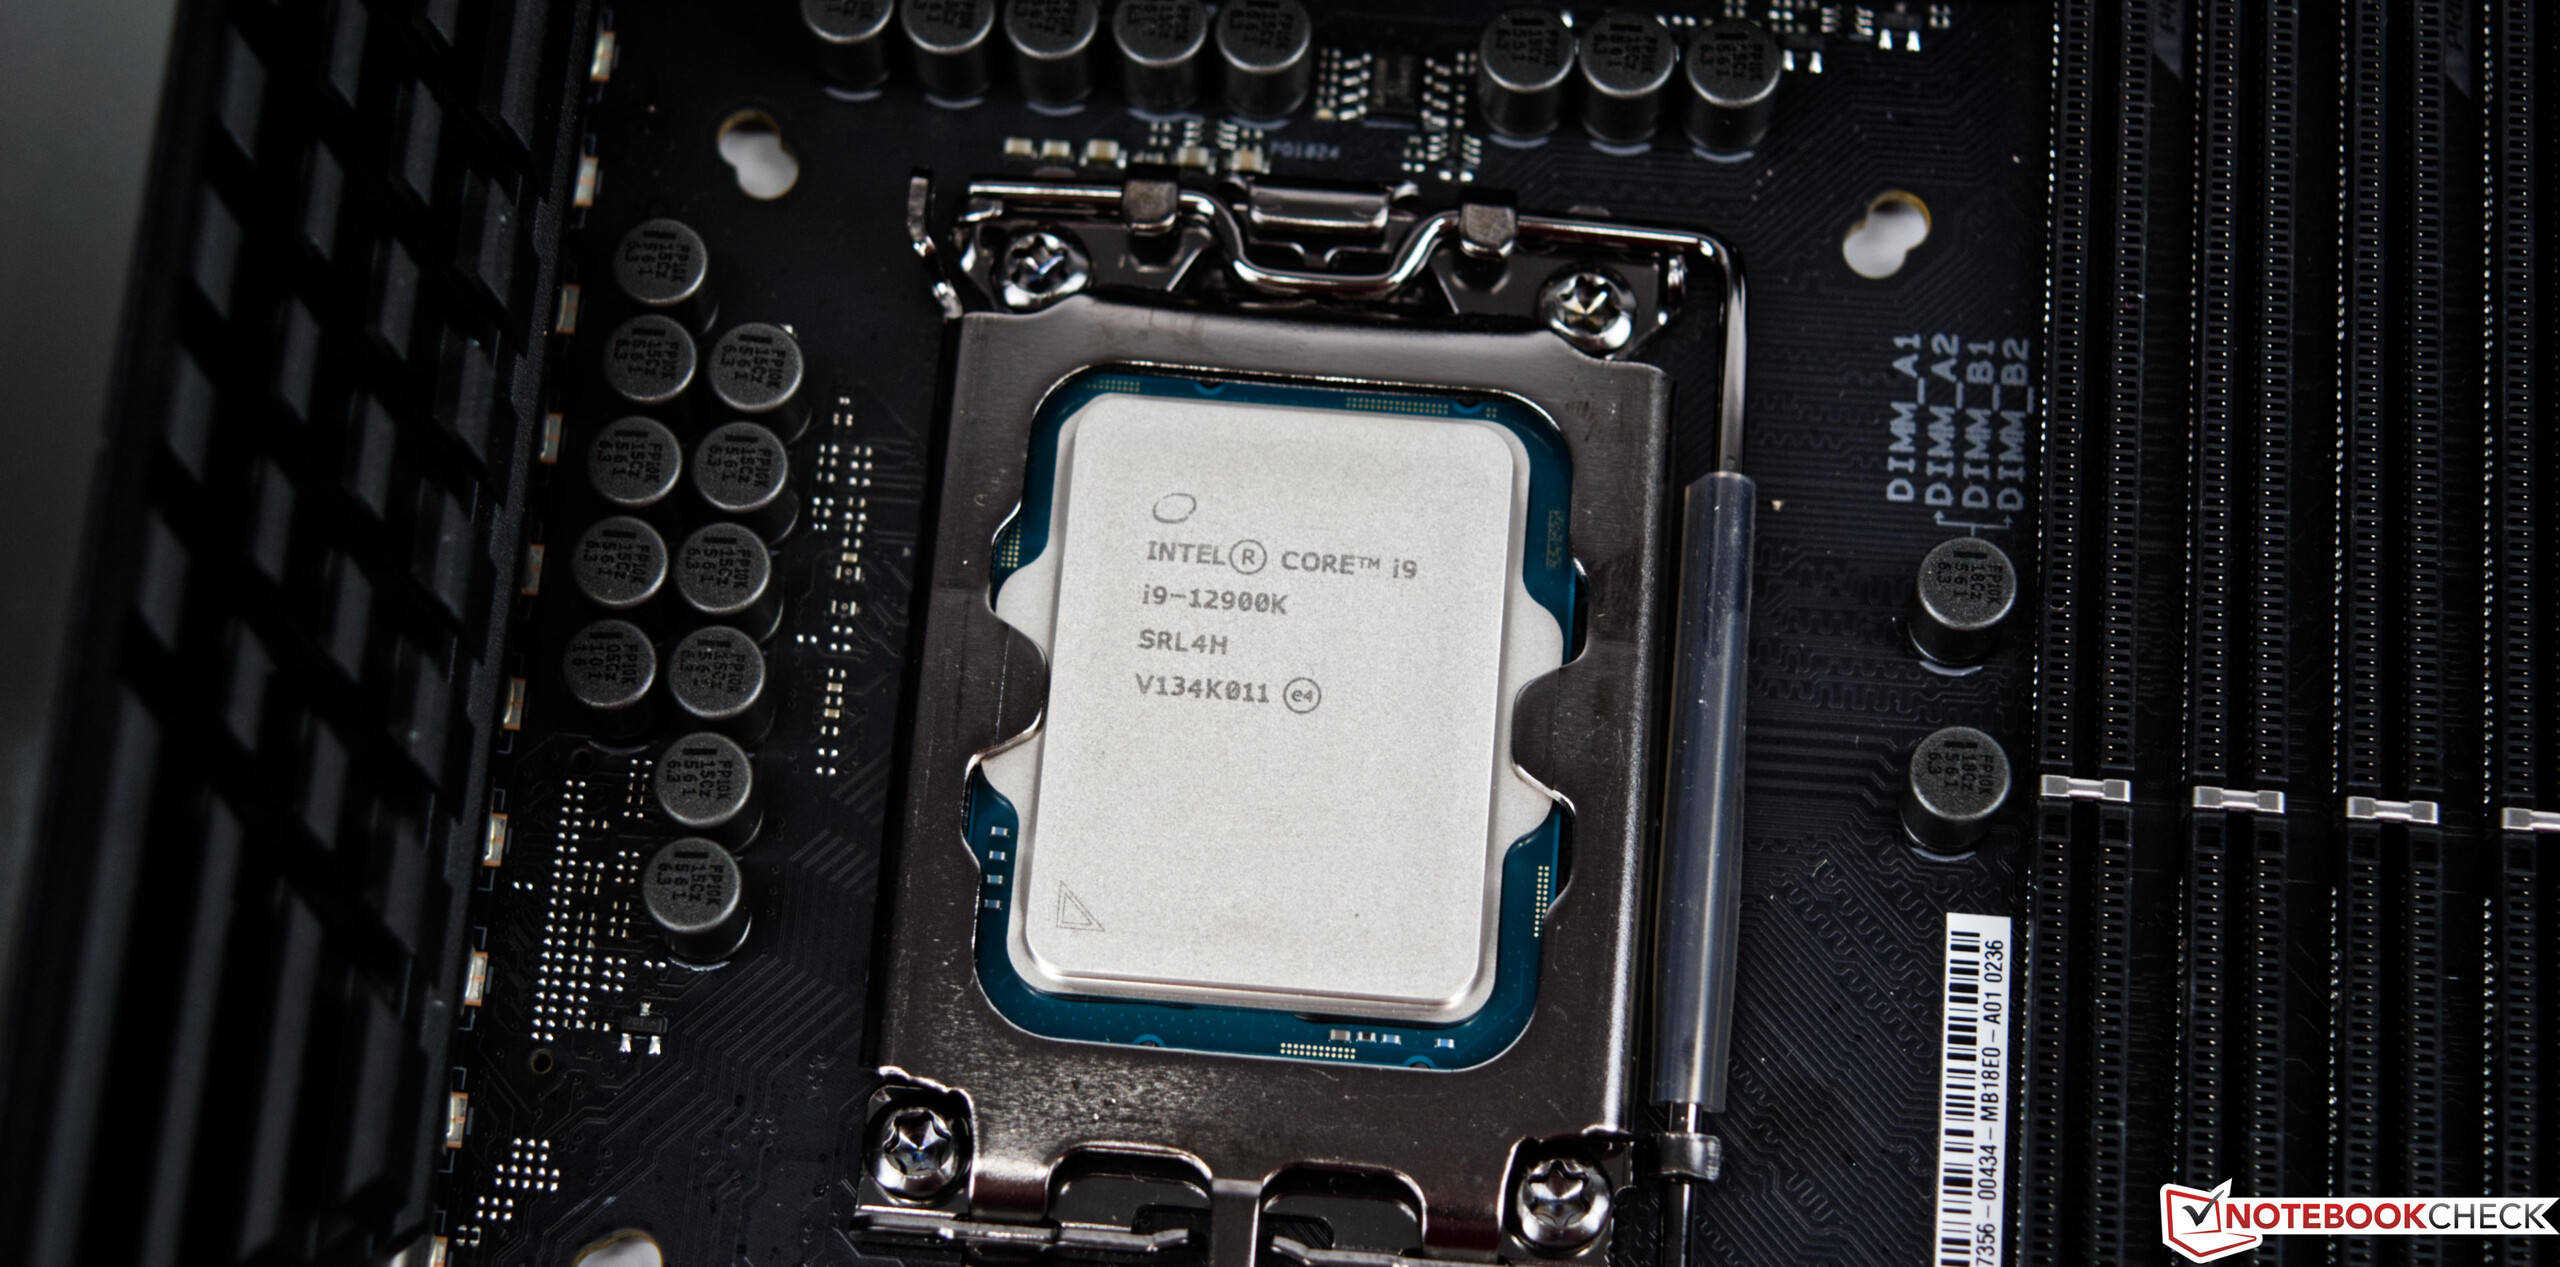
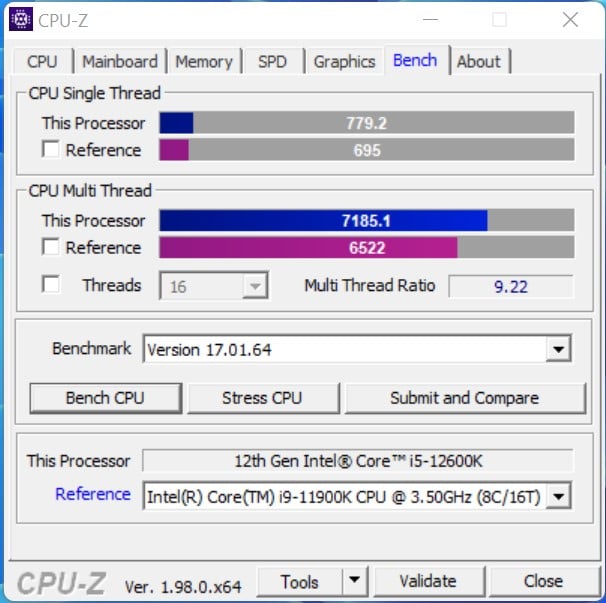
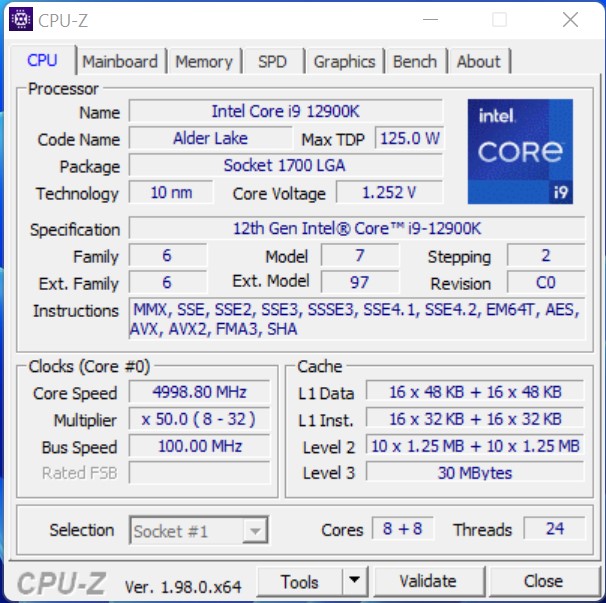
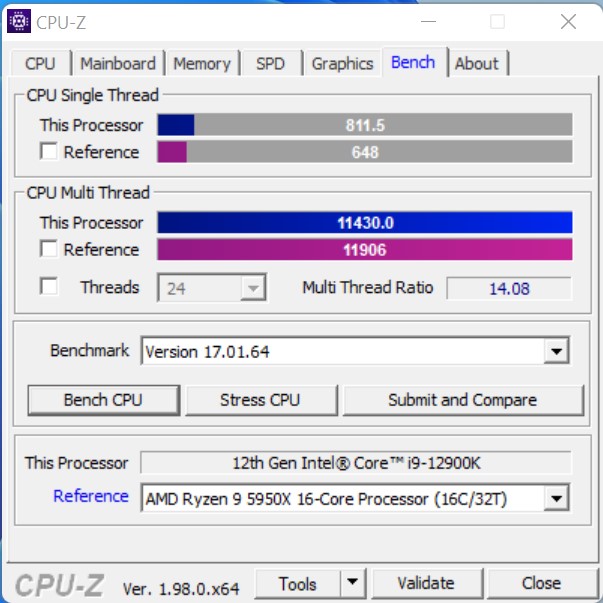
- Intel Core i9-12900K, Intel Core i5-12600K
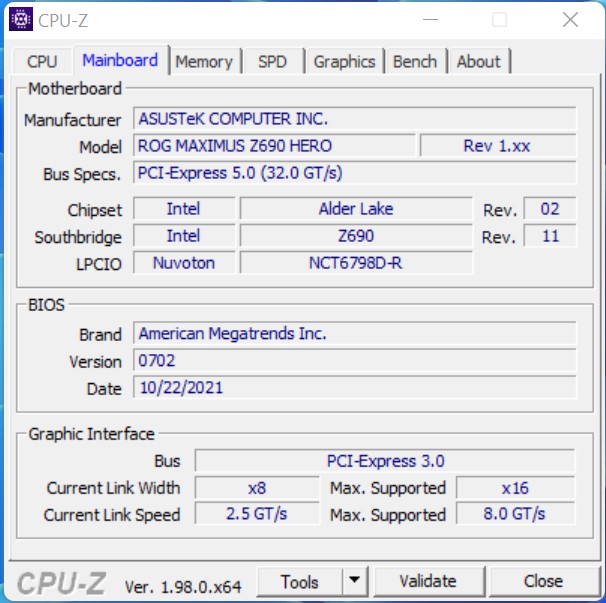
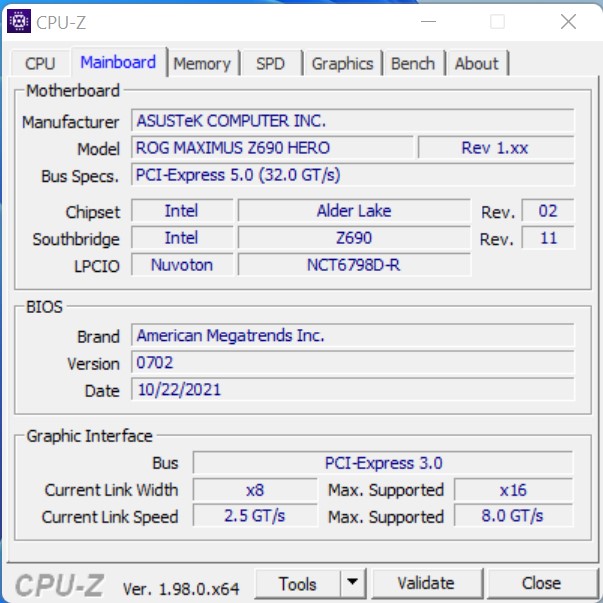
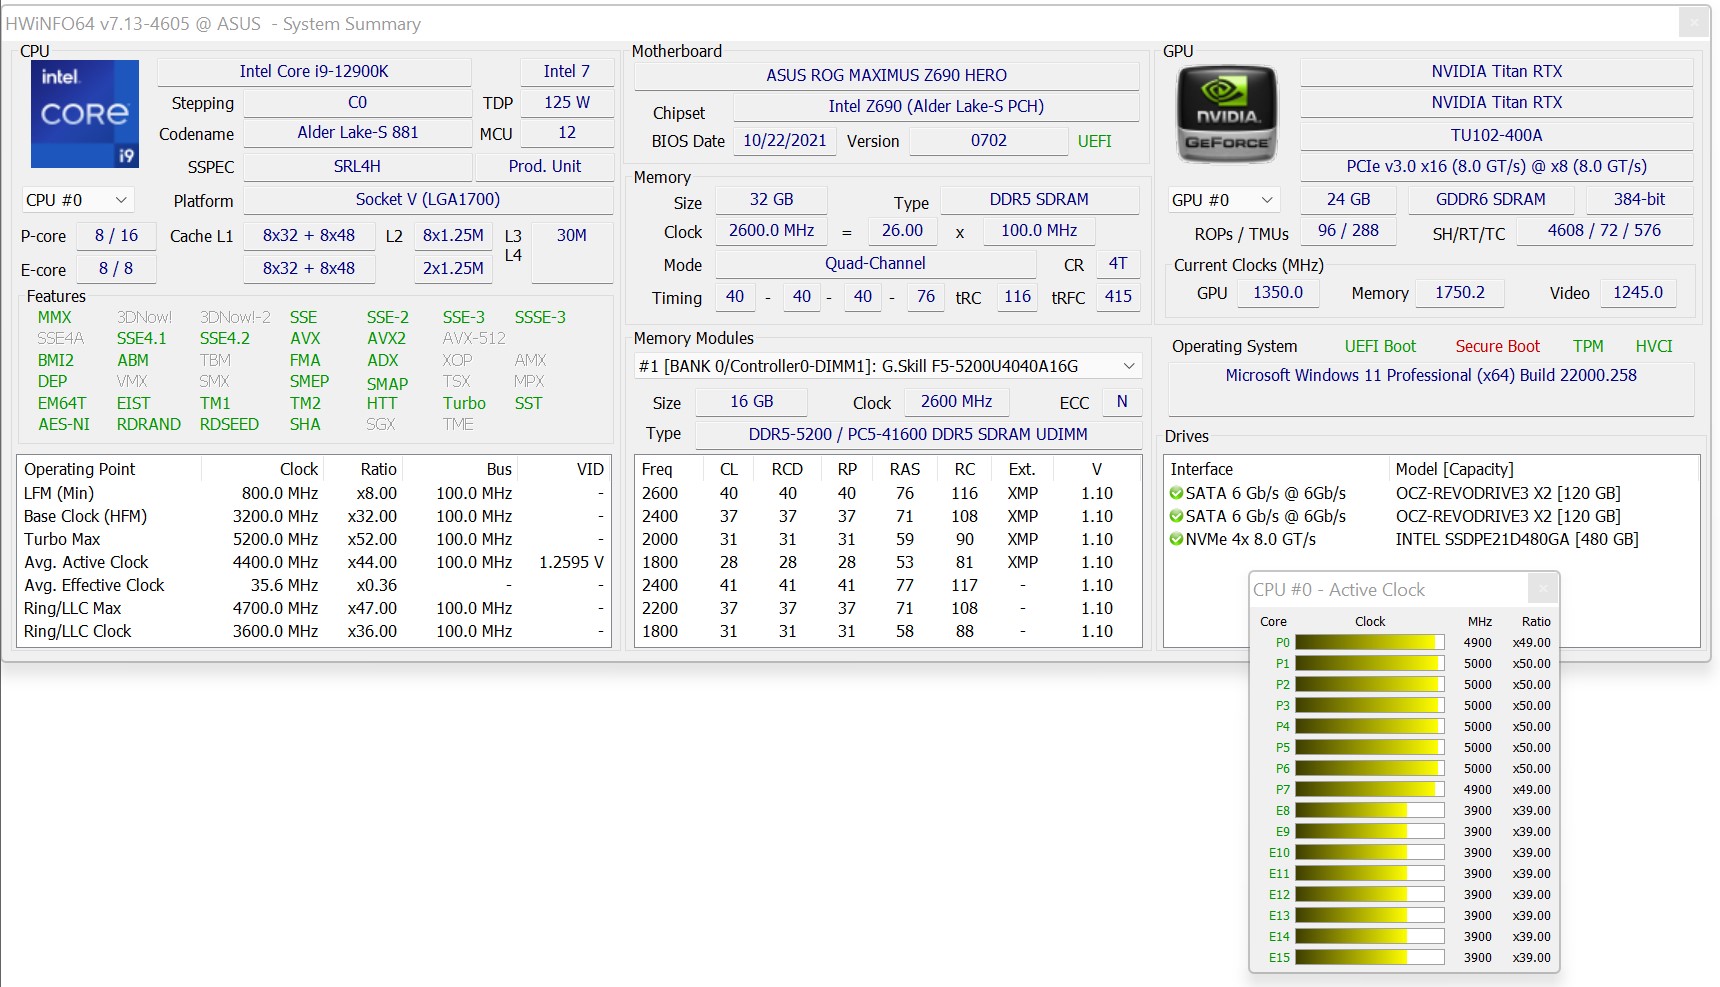
- Asus ROG Maximus Z690 Hero
- Alphacool Eisbear Aurora 280 AiO
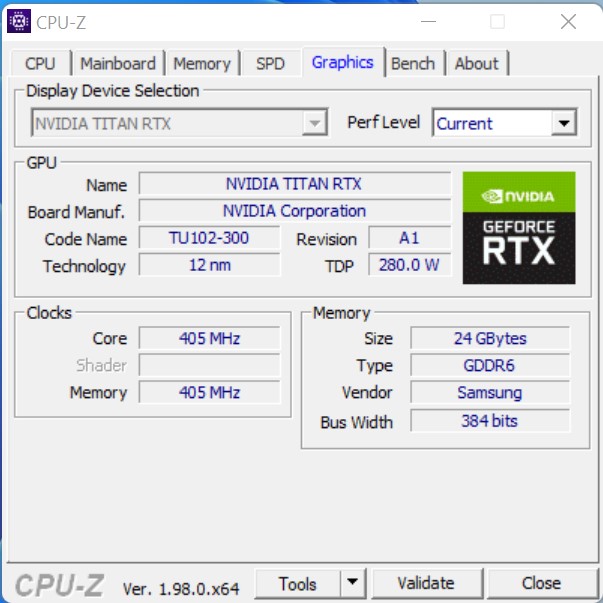
- Nvidia Titan RTX
- Fonte de alimentação Corsair HX 1200X
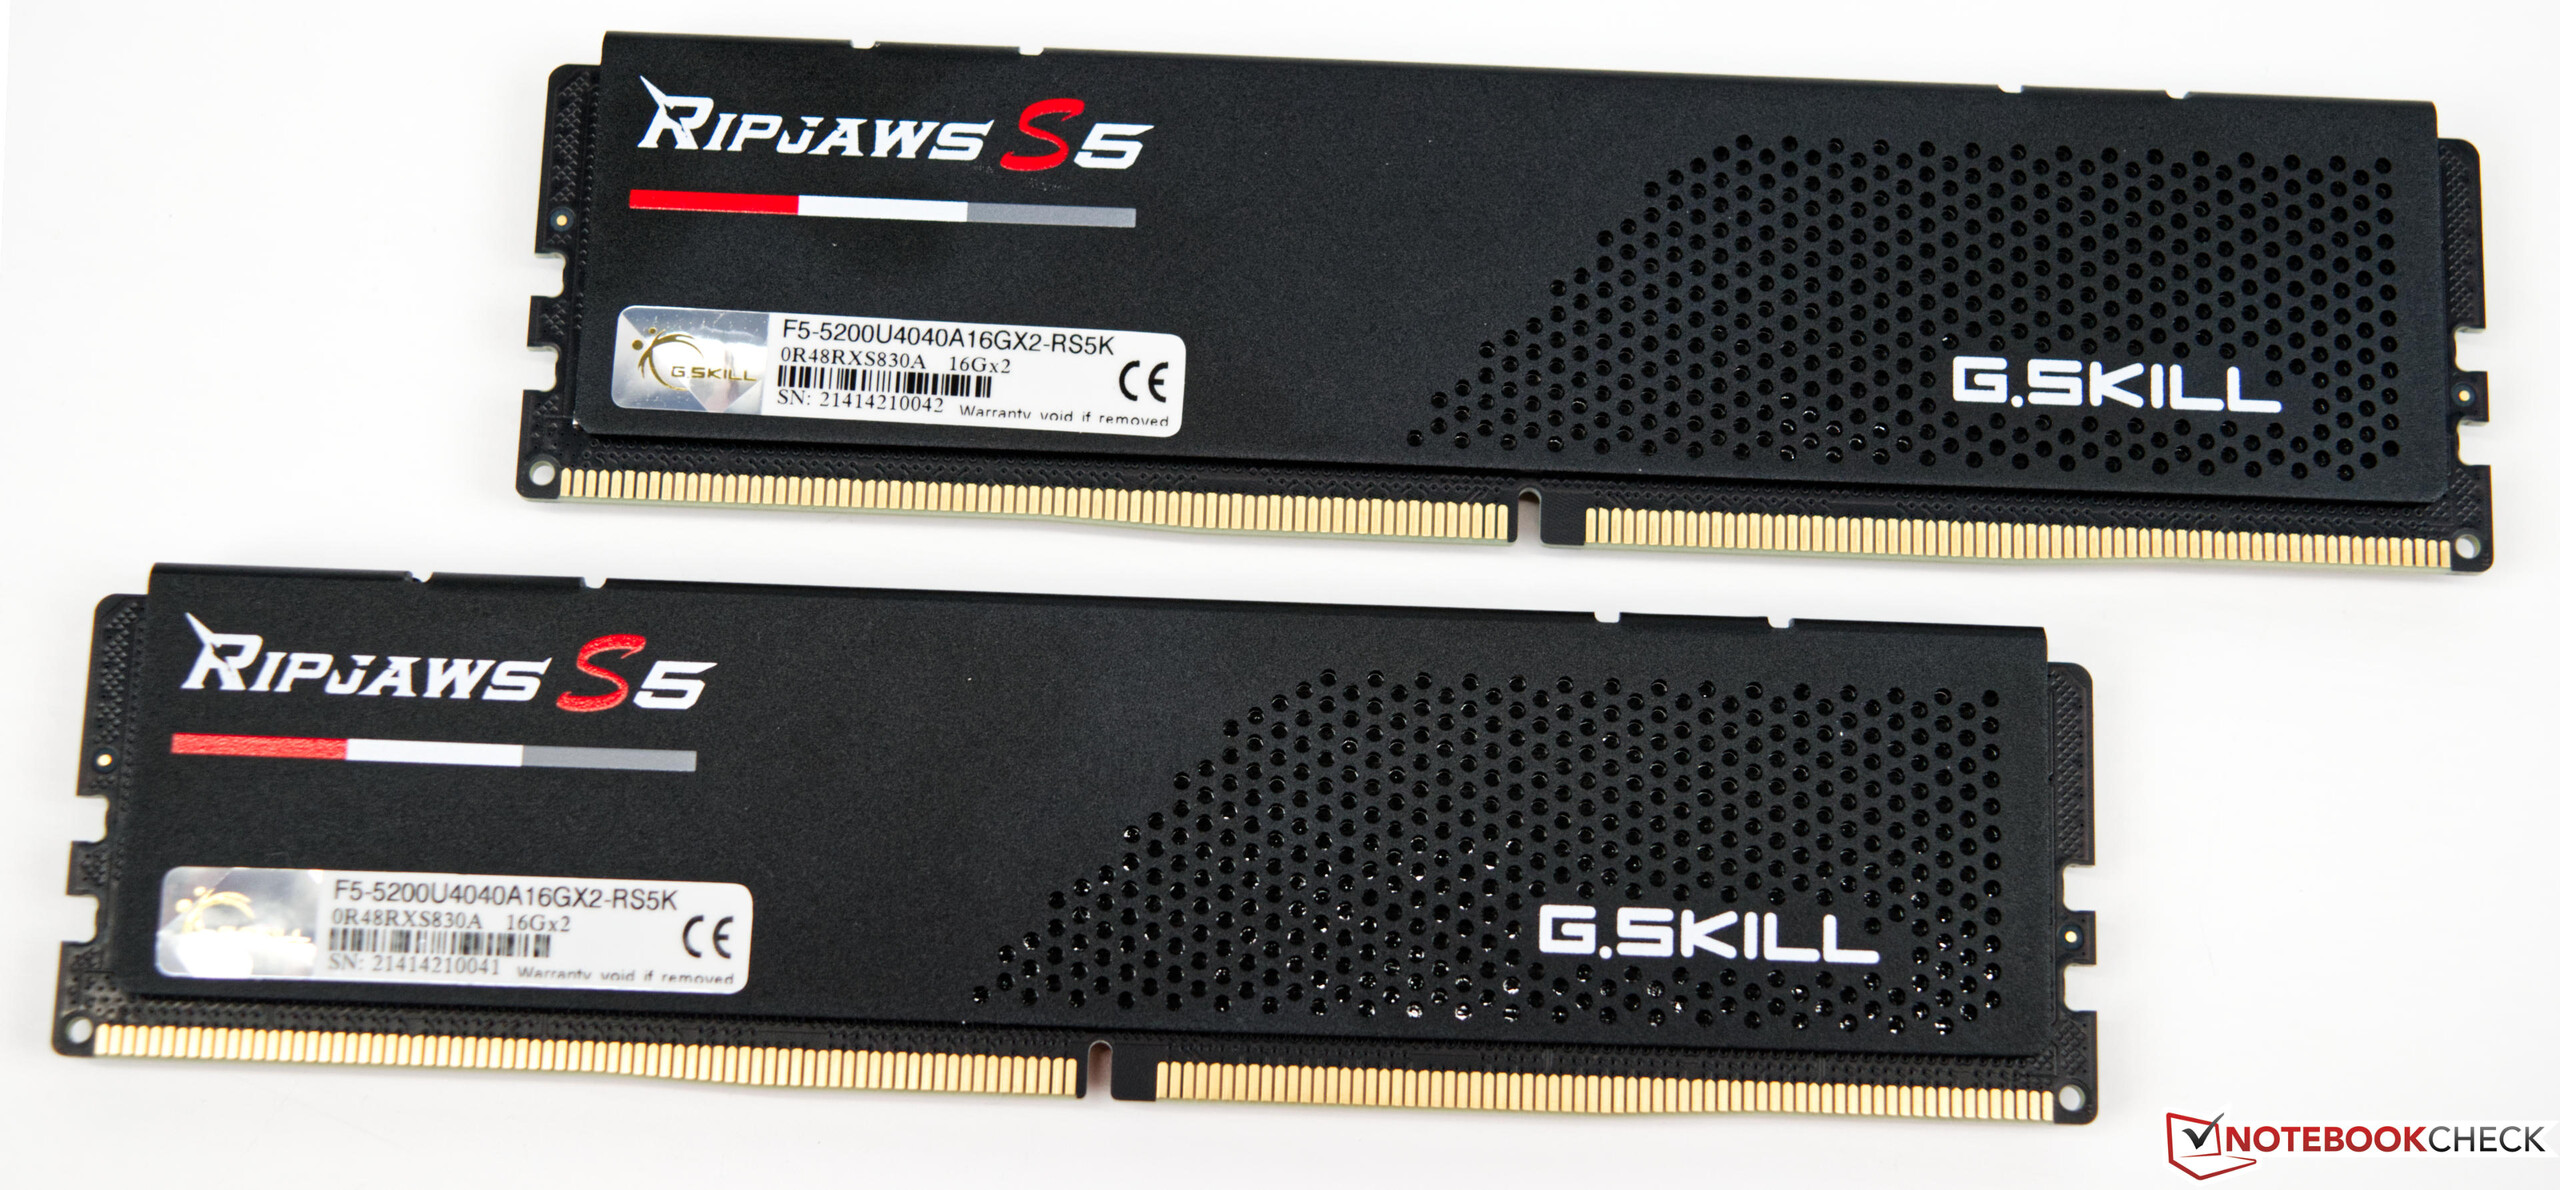
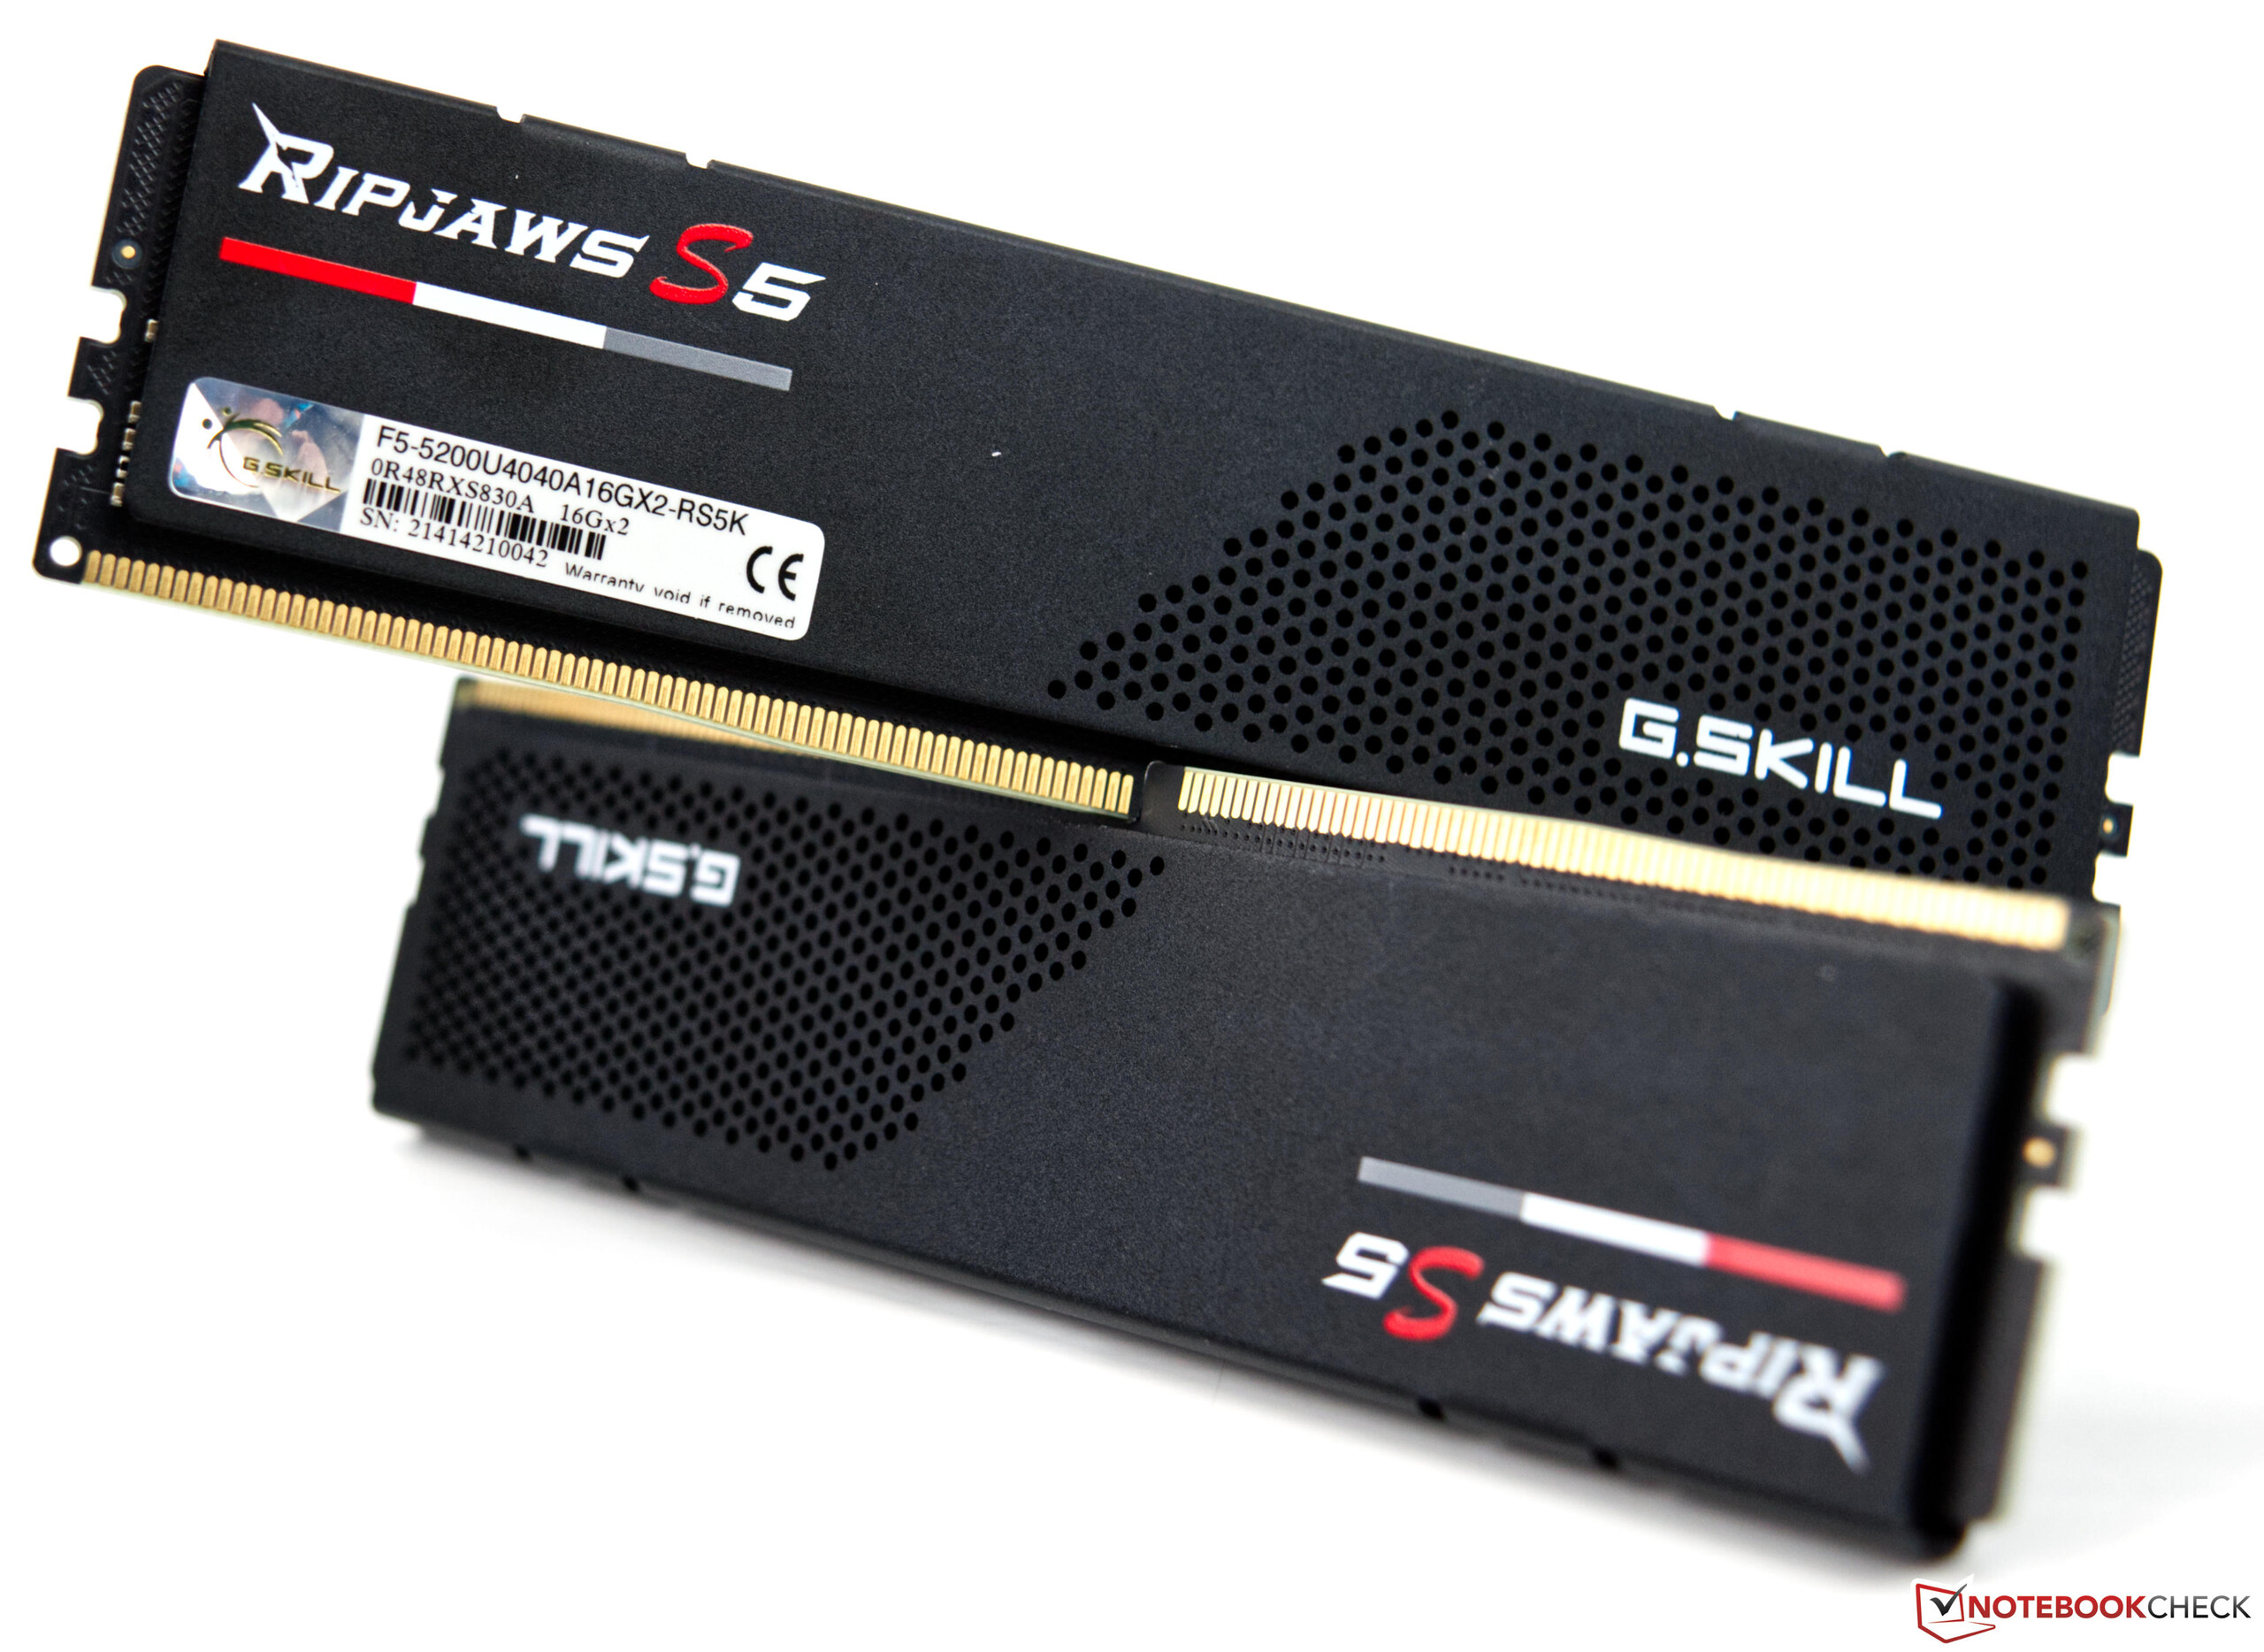
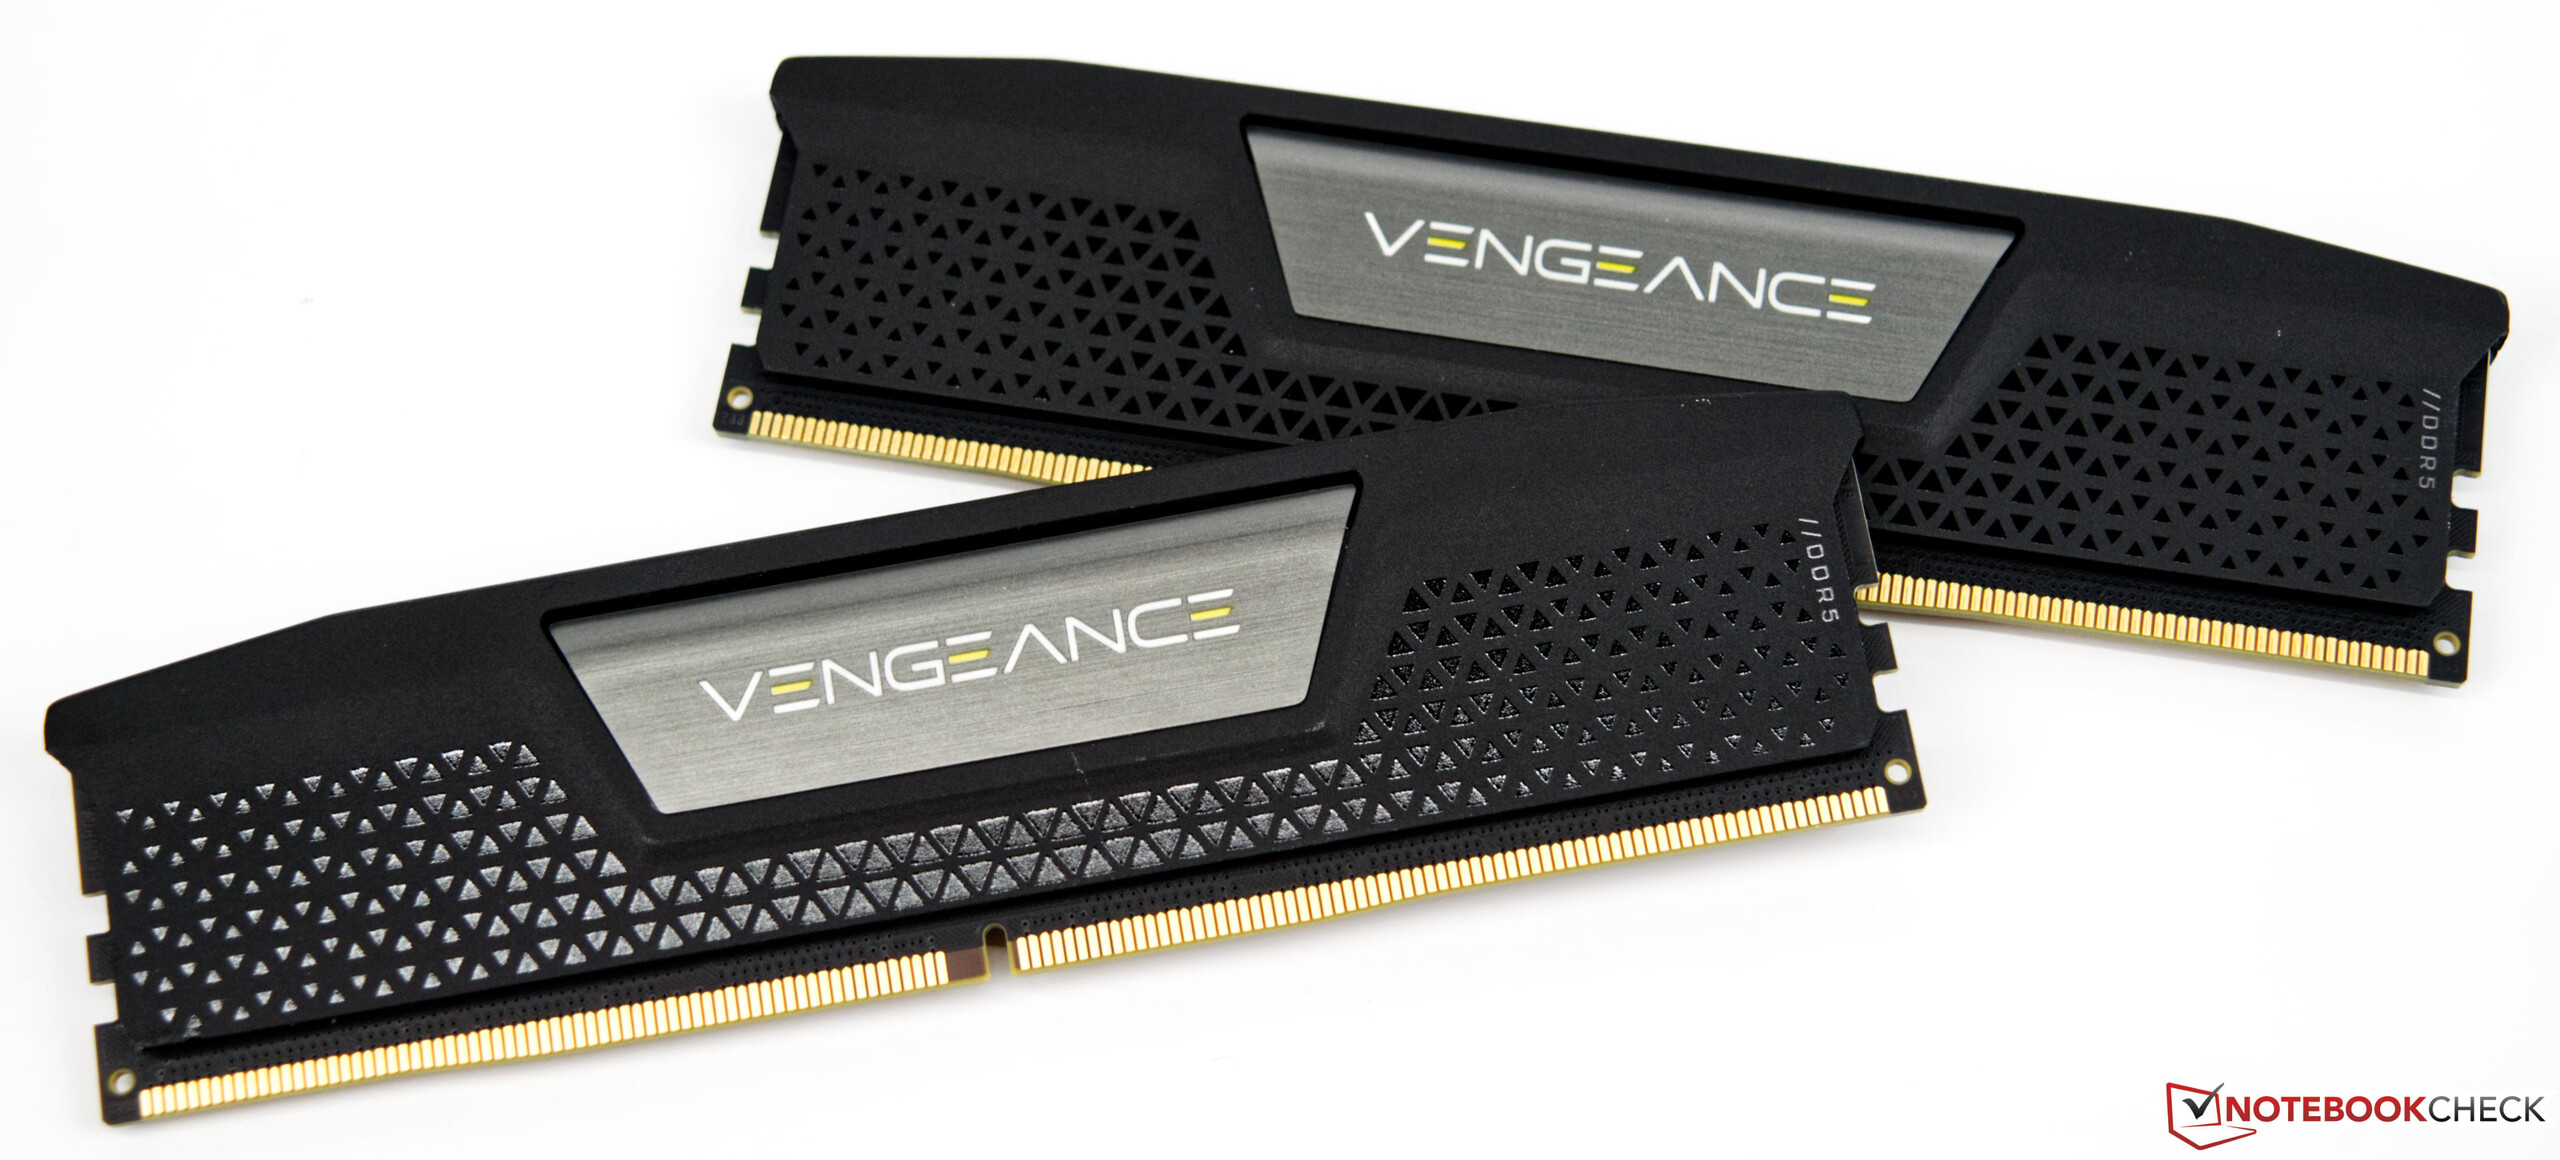
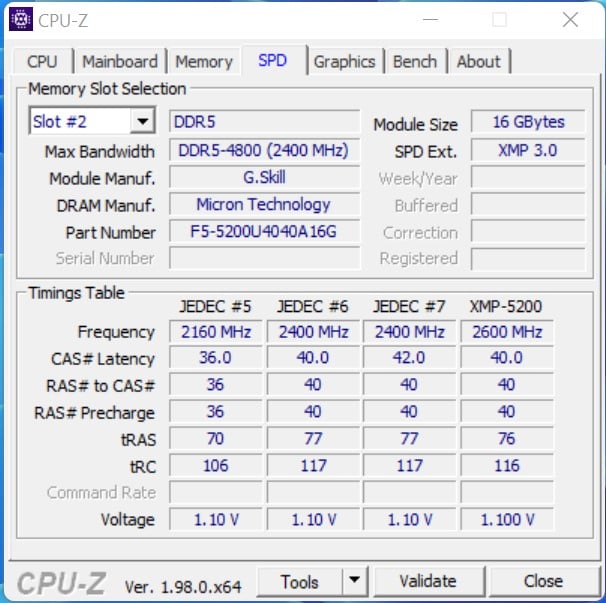
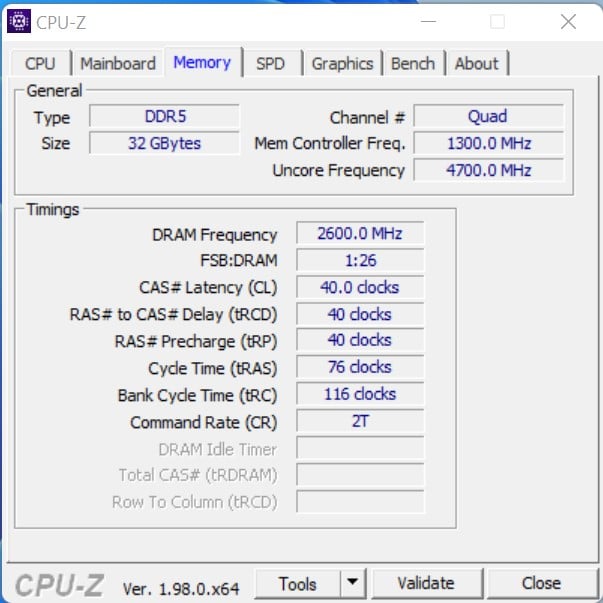
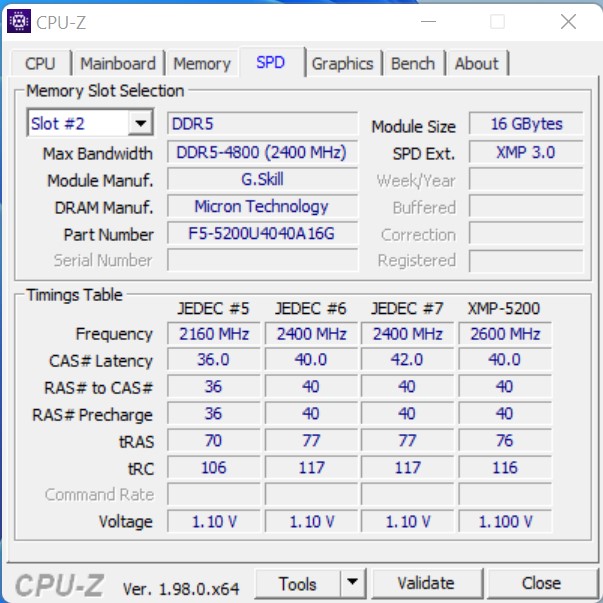
- G.Skill Ripjaws S5 (2x 16GB - DDR5-5200) / Corsair Vengeance (2x 16GB - DDR5-5200)
- Intel Optane 905p (sistema de 480 GB + benchmarks)
- OCZ Revodrive (480 GB para jogos)
- Microsoft Windows 11 Professional 64-Bit (versão 21H2)
Os dois processadores vêm diretamente da Intel. G.Skill e também Corsair nos forneceu a novíssima memória de trabalho DDR5 e a nova placa principal Z690vem diretamente da Asus. A Caseking nos apóia com o Raijintek Pean Showcase, e como refrigeração usamos o Alphacool Eisbear Aurora 280 AiOque nos foi colocado à disposição pela Alphacool.
Nota importante
Todos os benchmarks foram executados em um sistema Windows 11 recentemente instalado. A versão mais atual do Bios foi-nos fornecida pela Asus. O importante saber é que com as configurações padrão PL1 e PL2 são iguais, o que significa que a CPU pode sempre assumir o máximo desempenho sem nenhuma limitação. Usamos as configurações padrão para esta revisão.

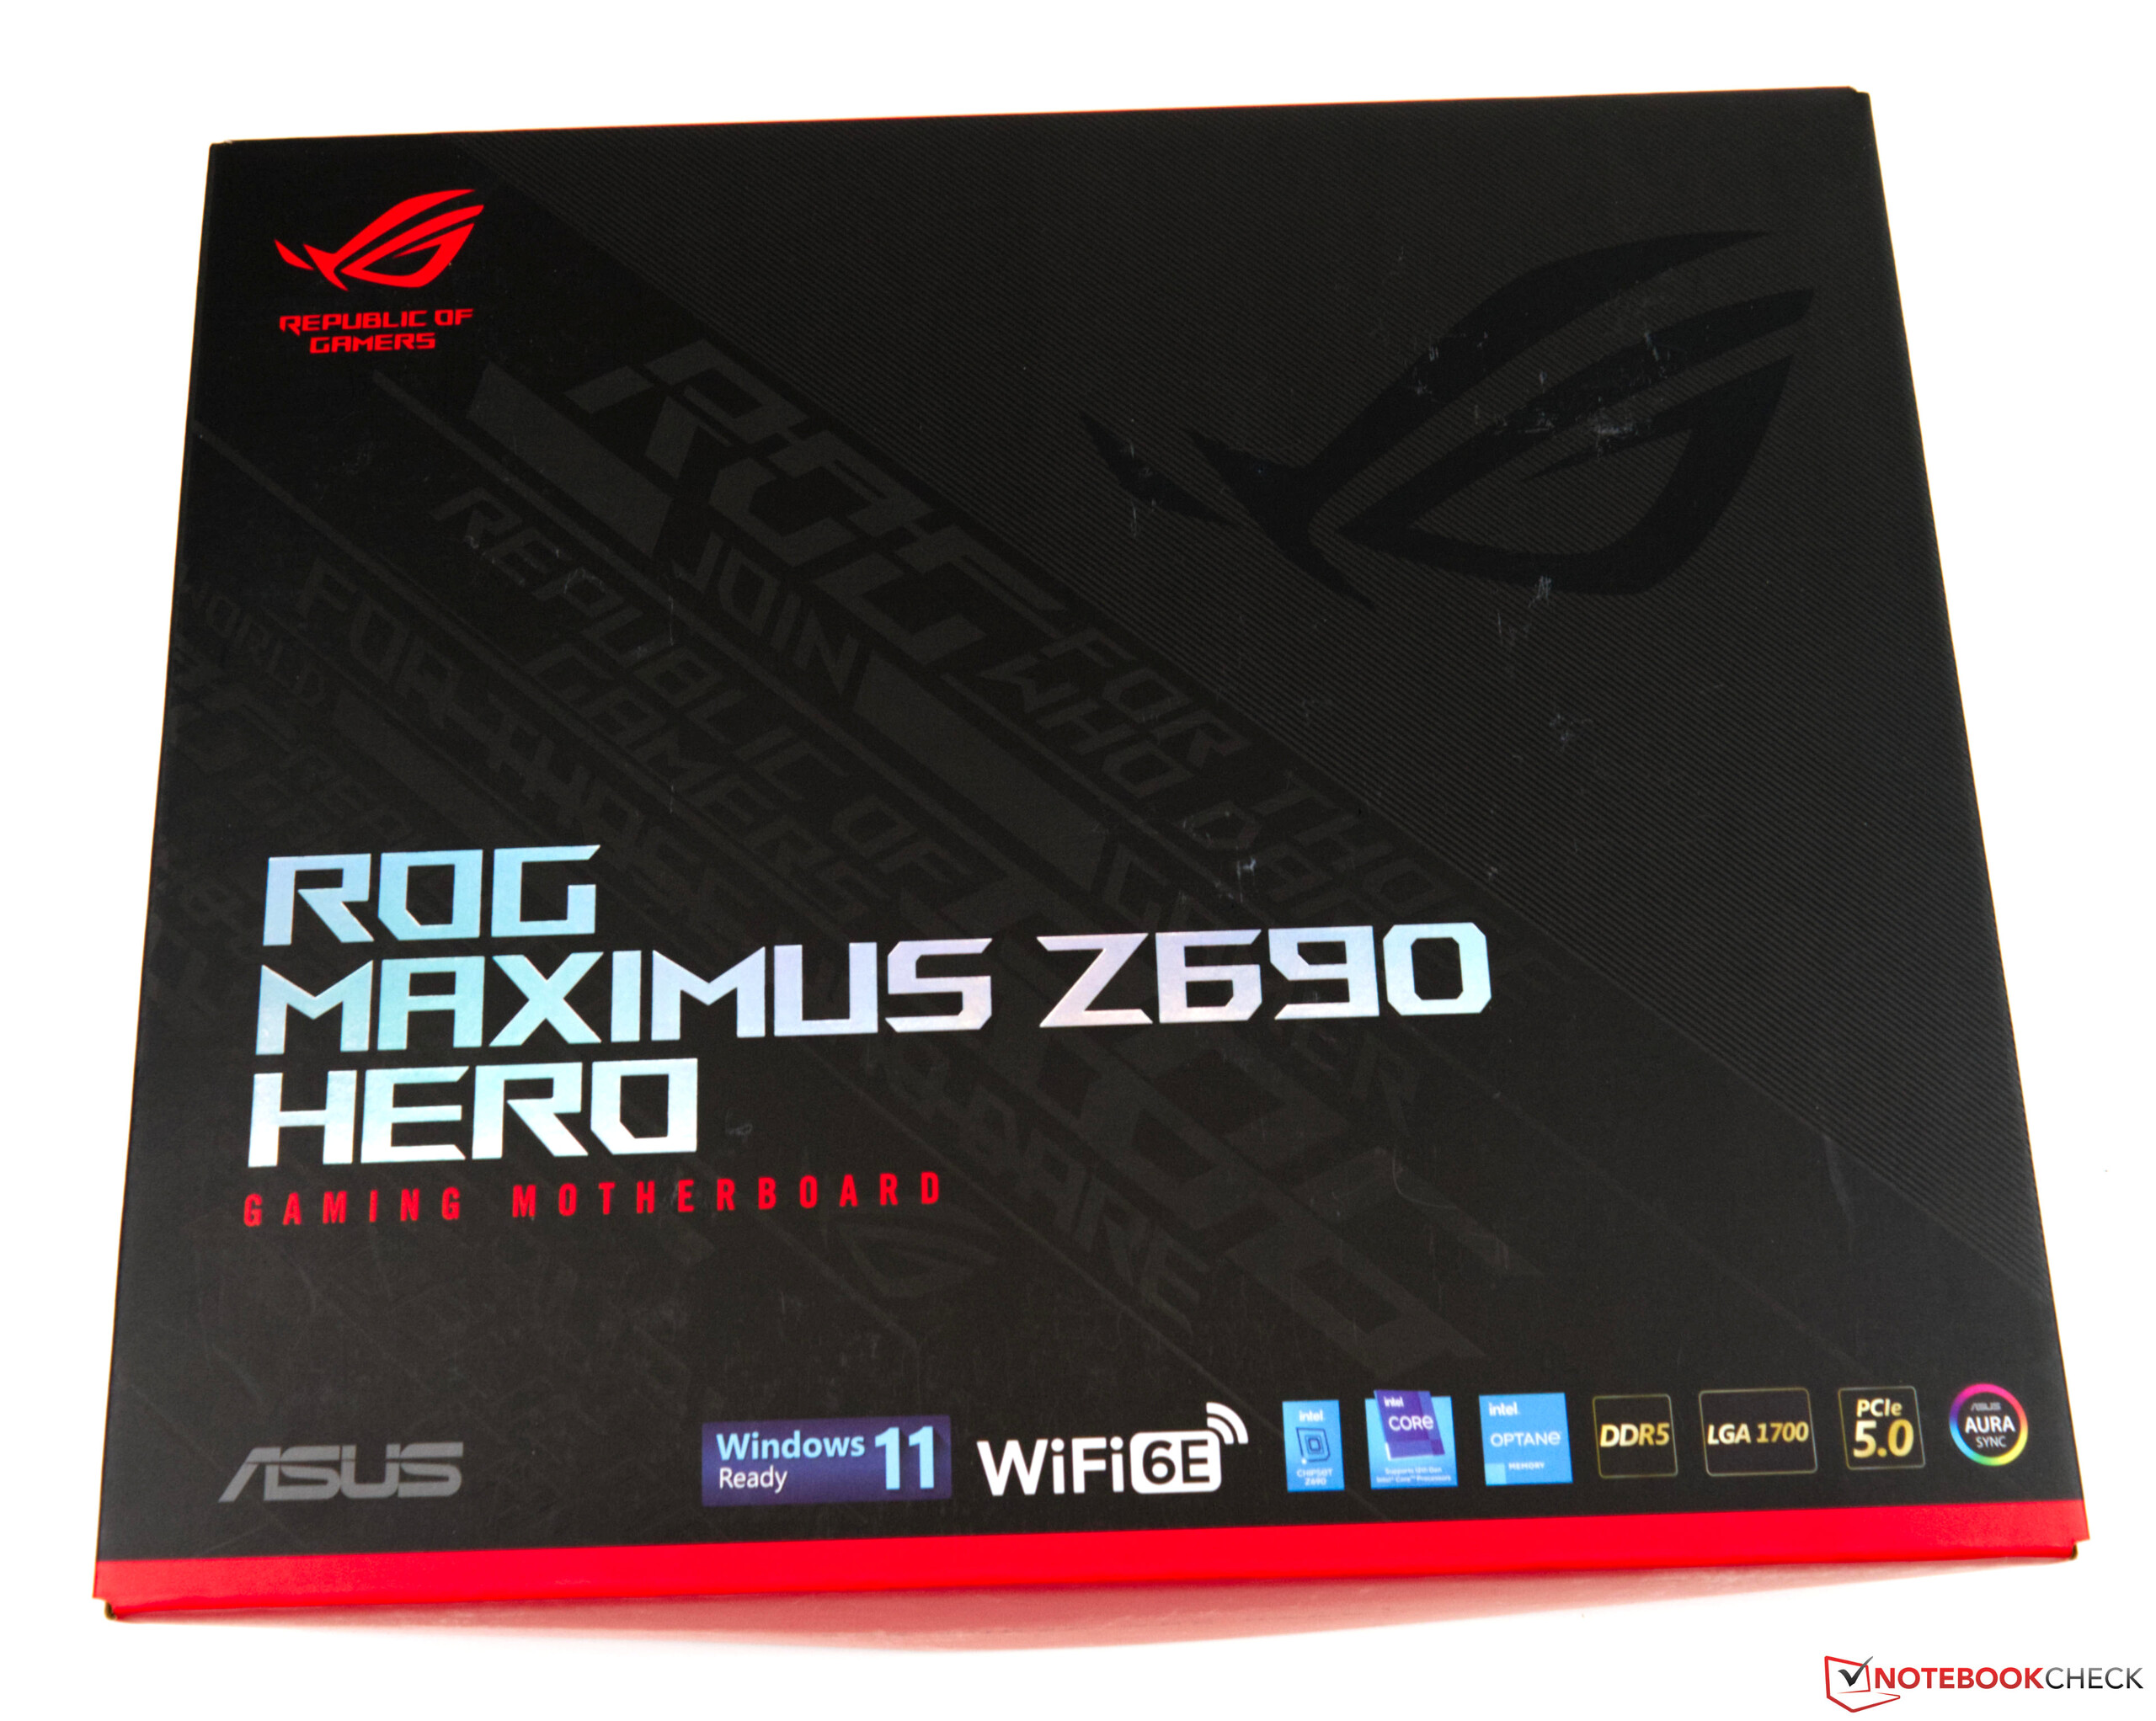
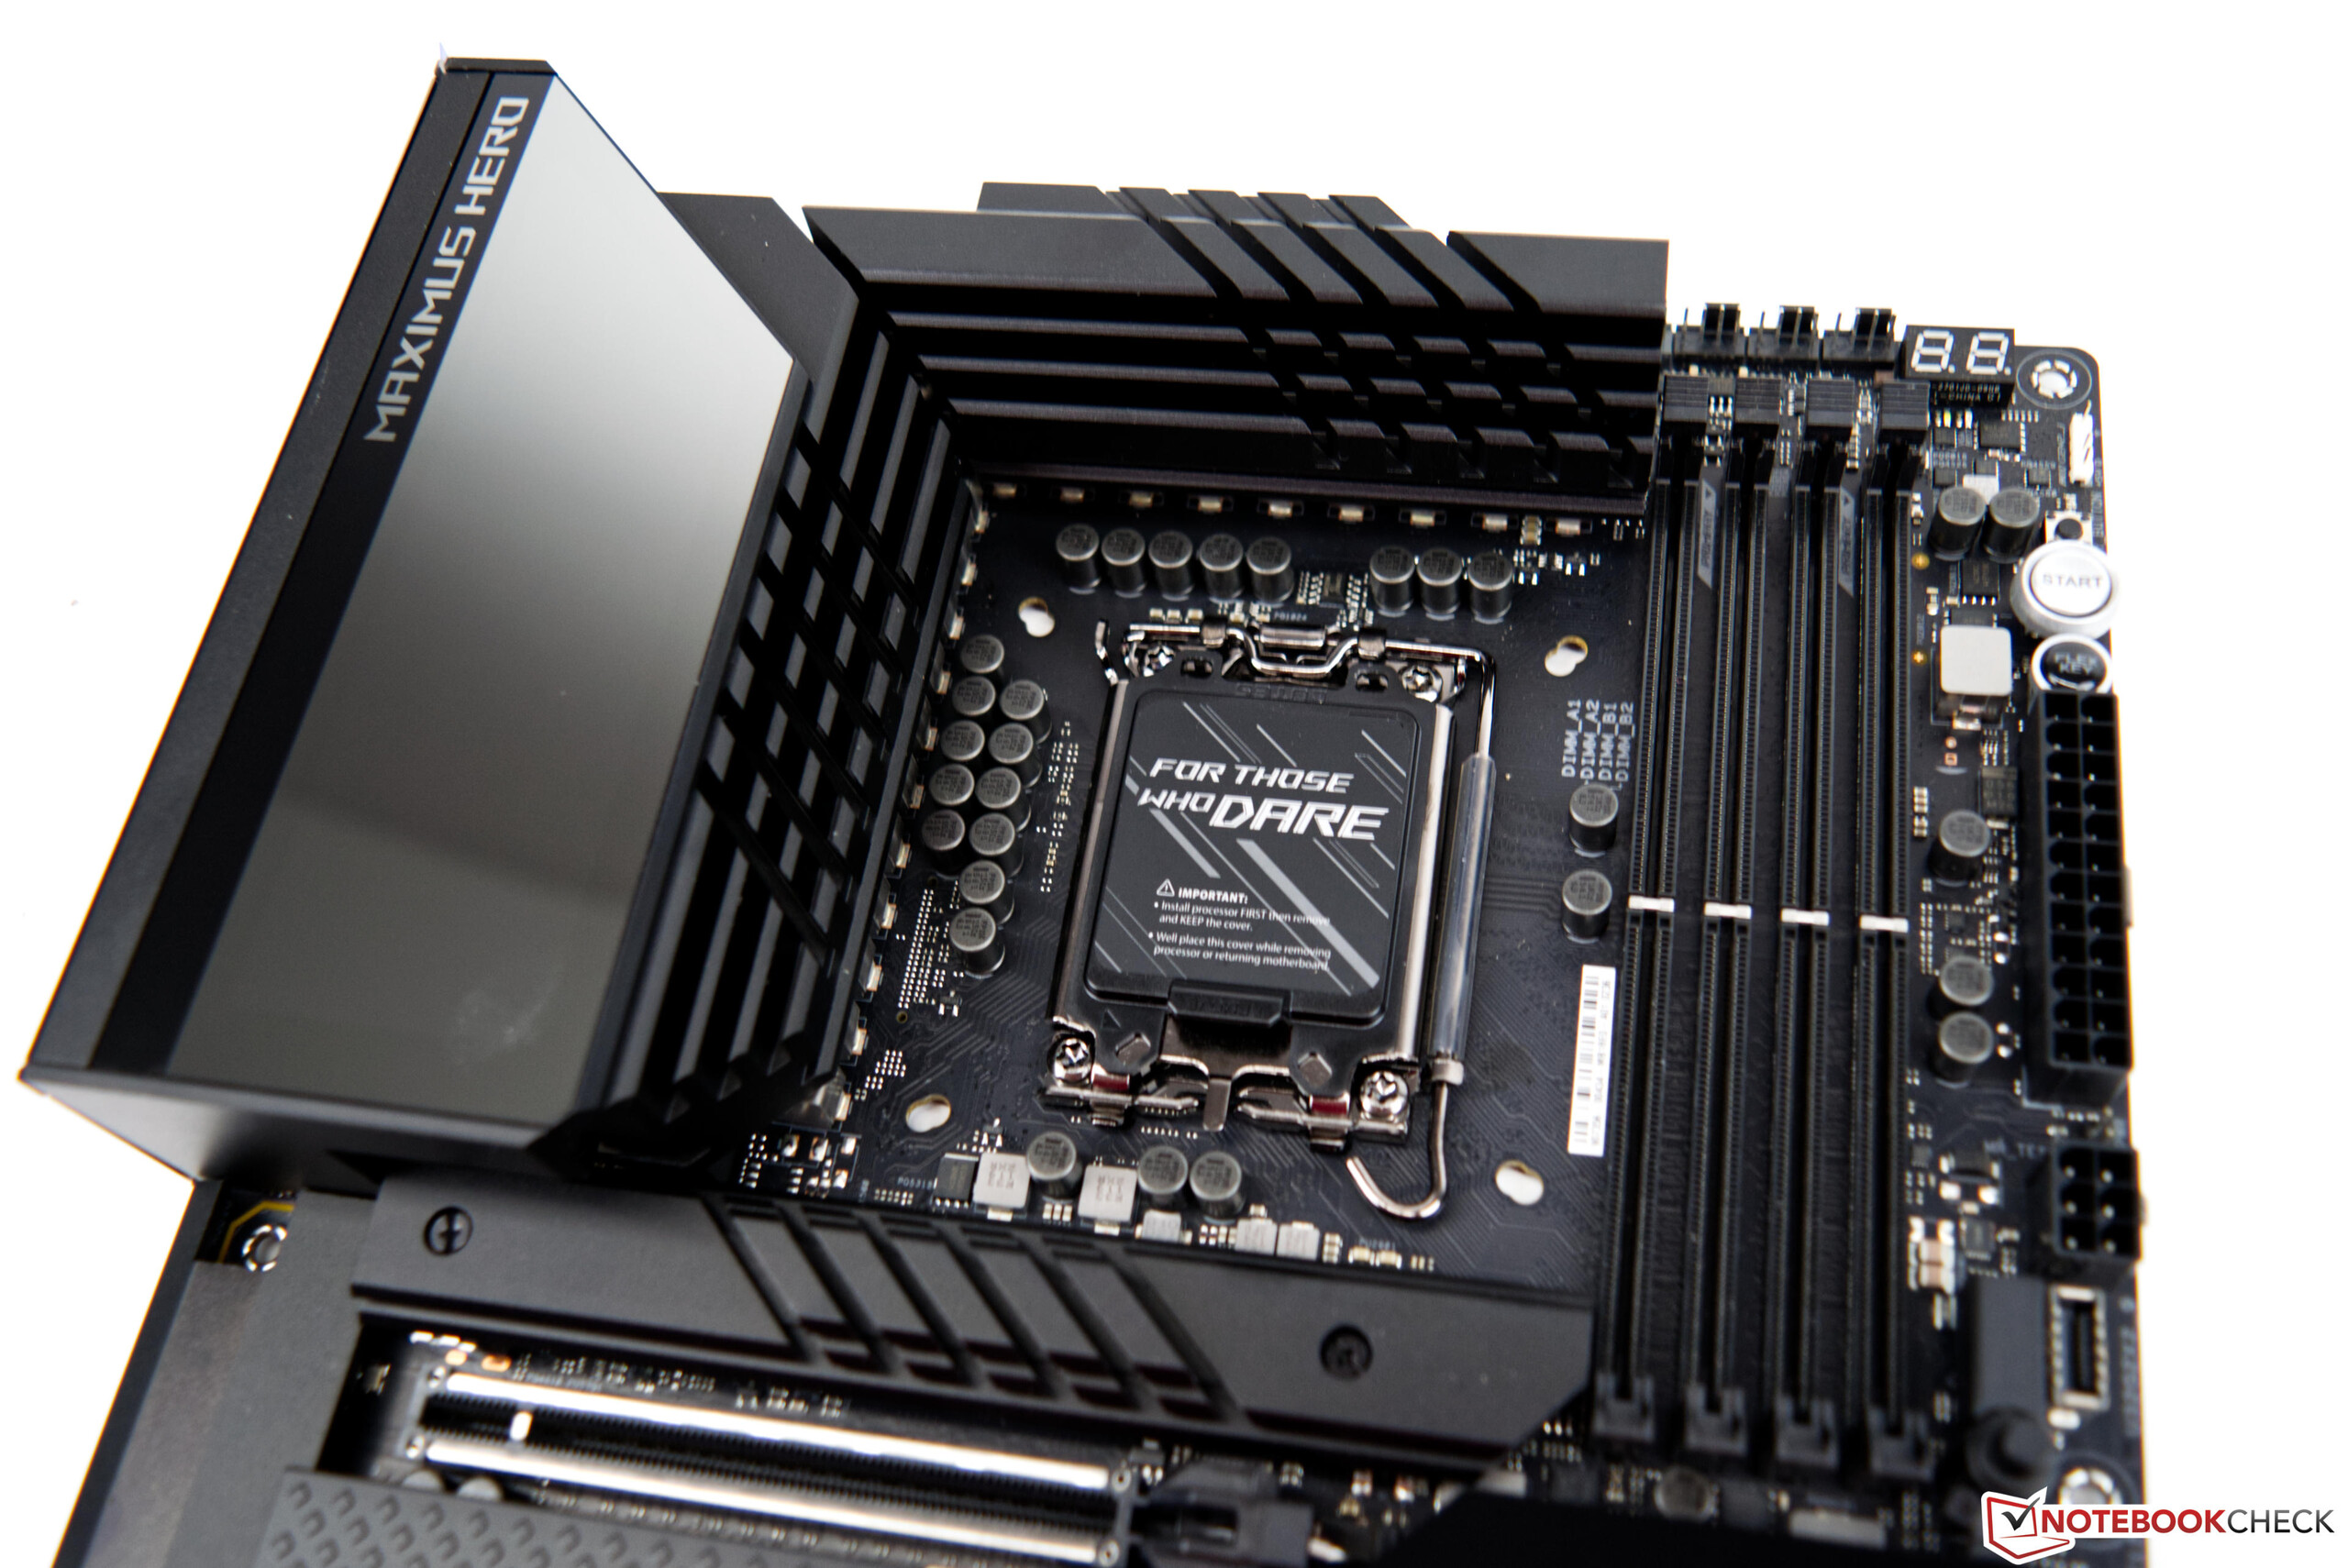
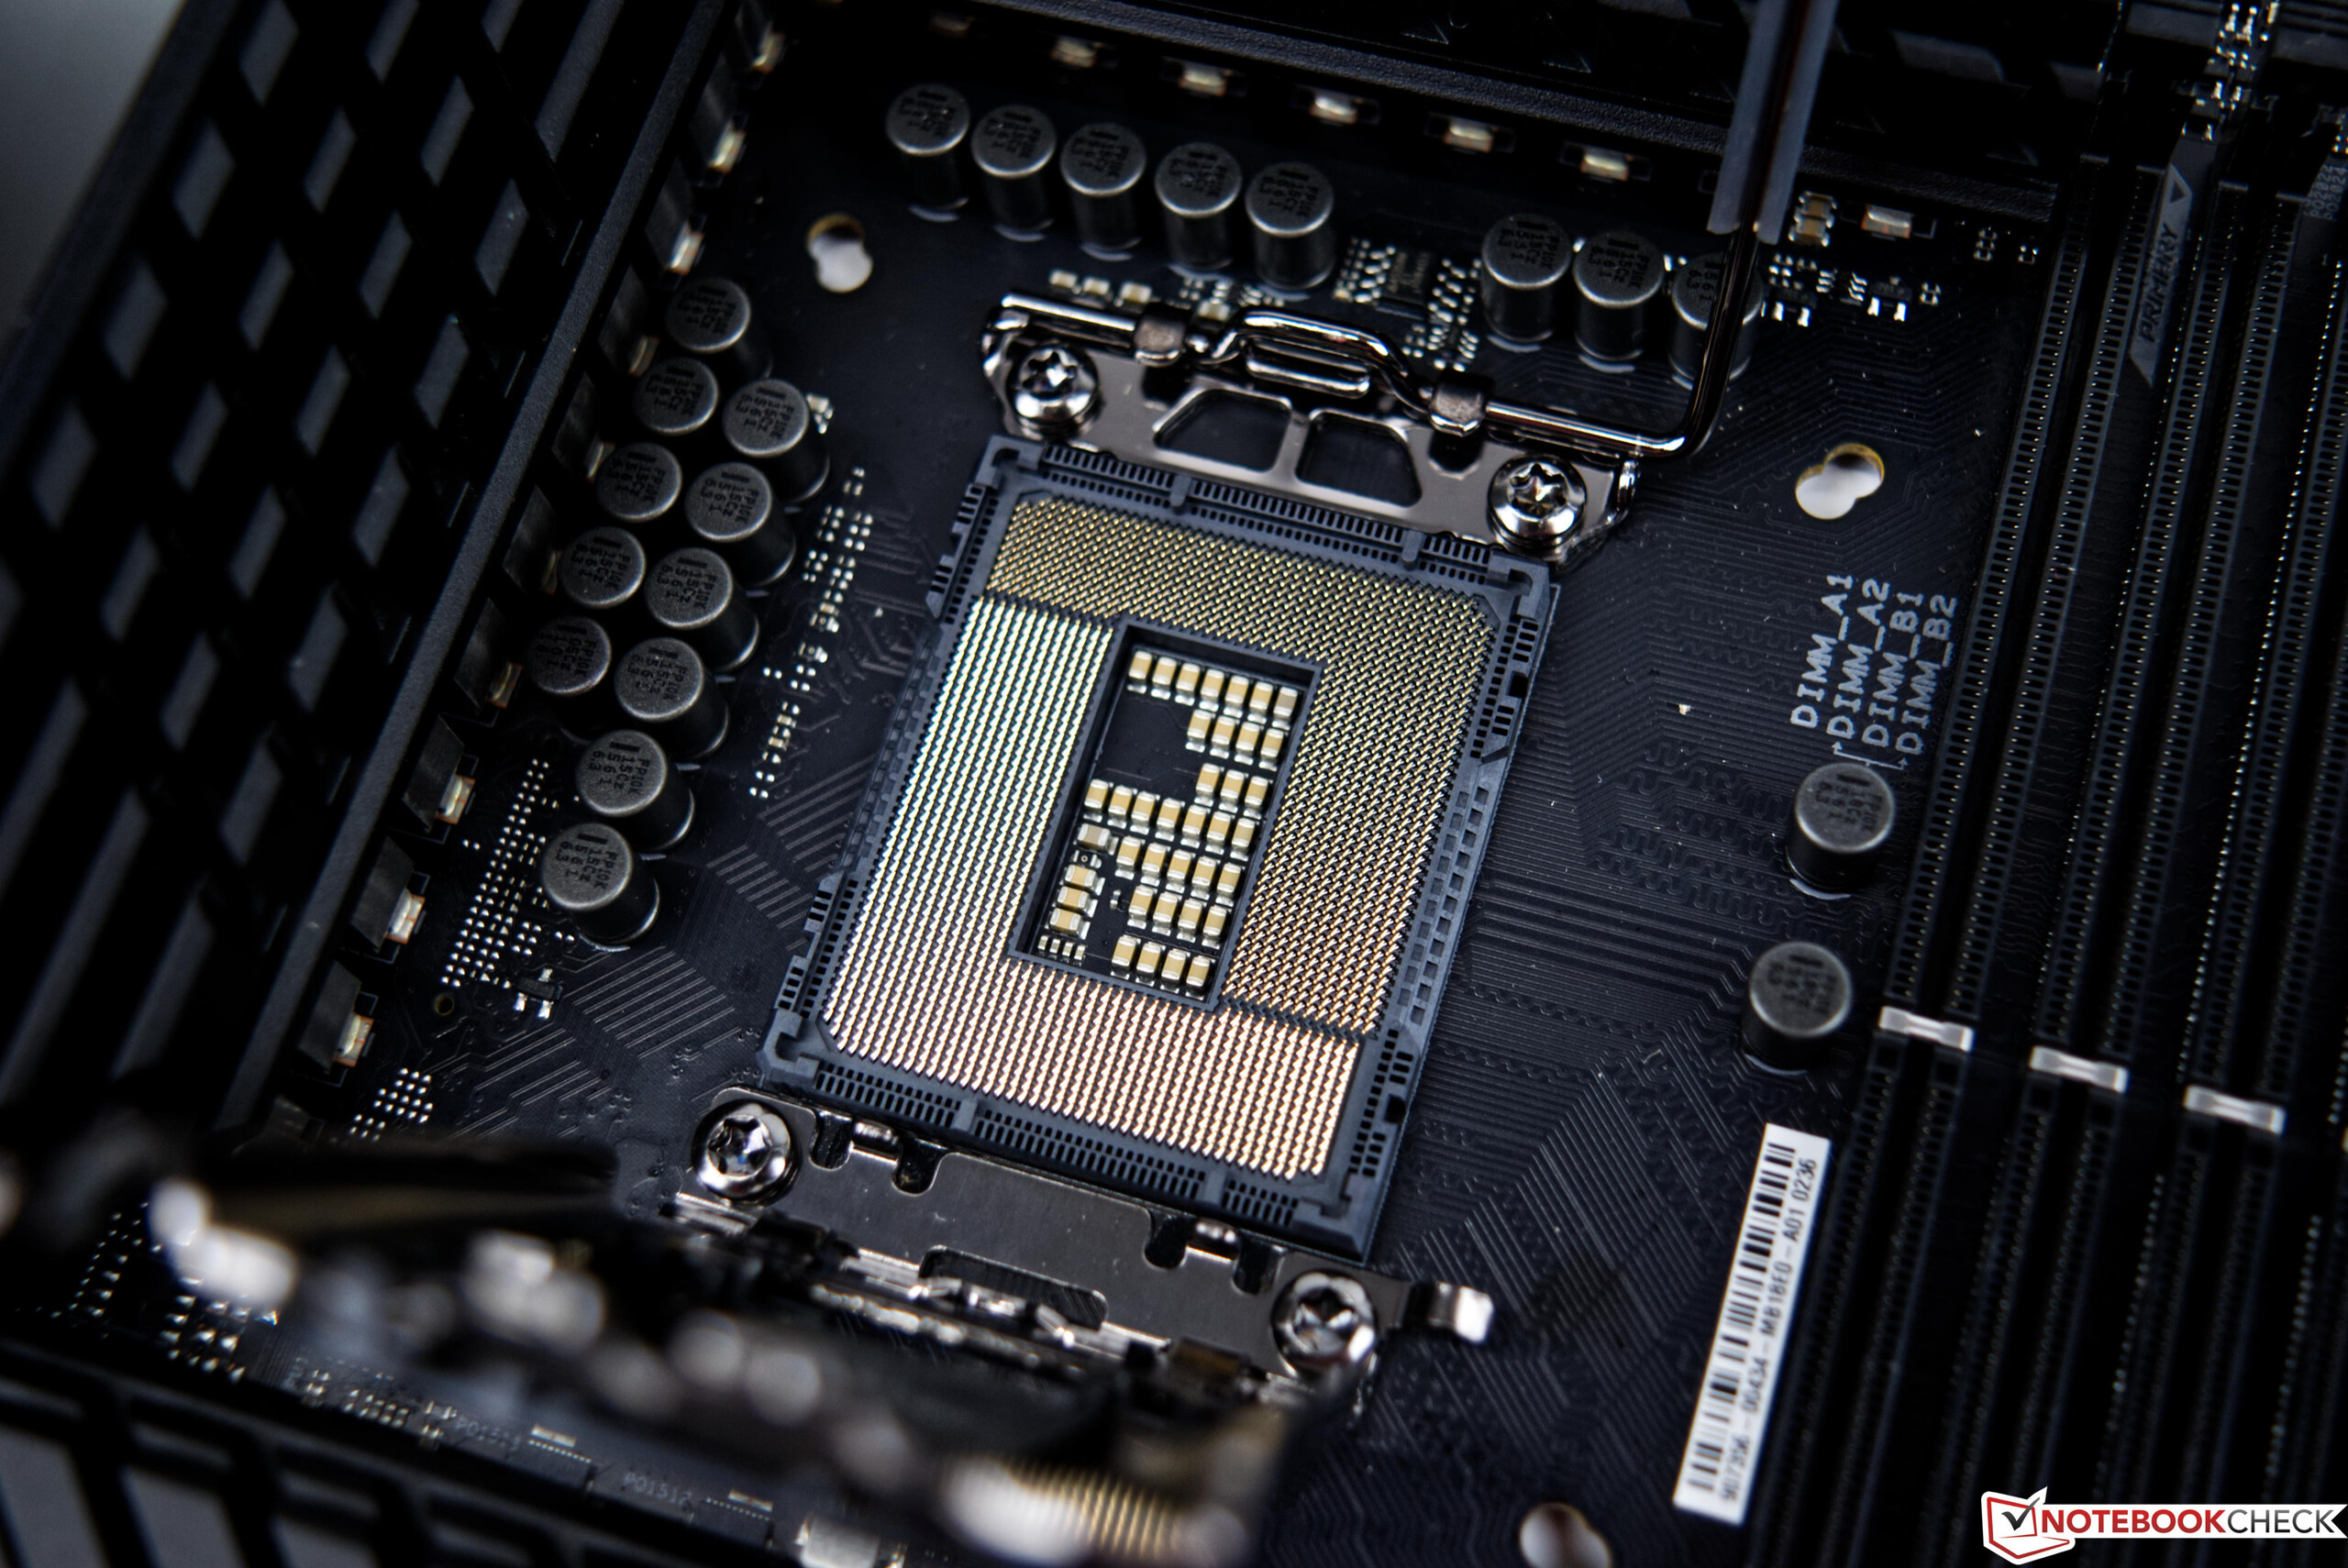
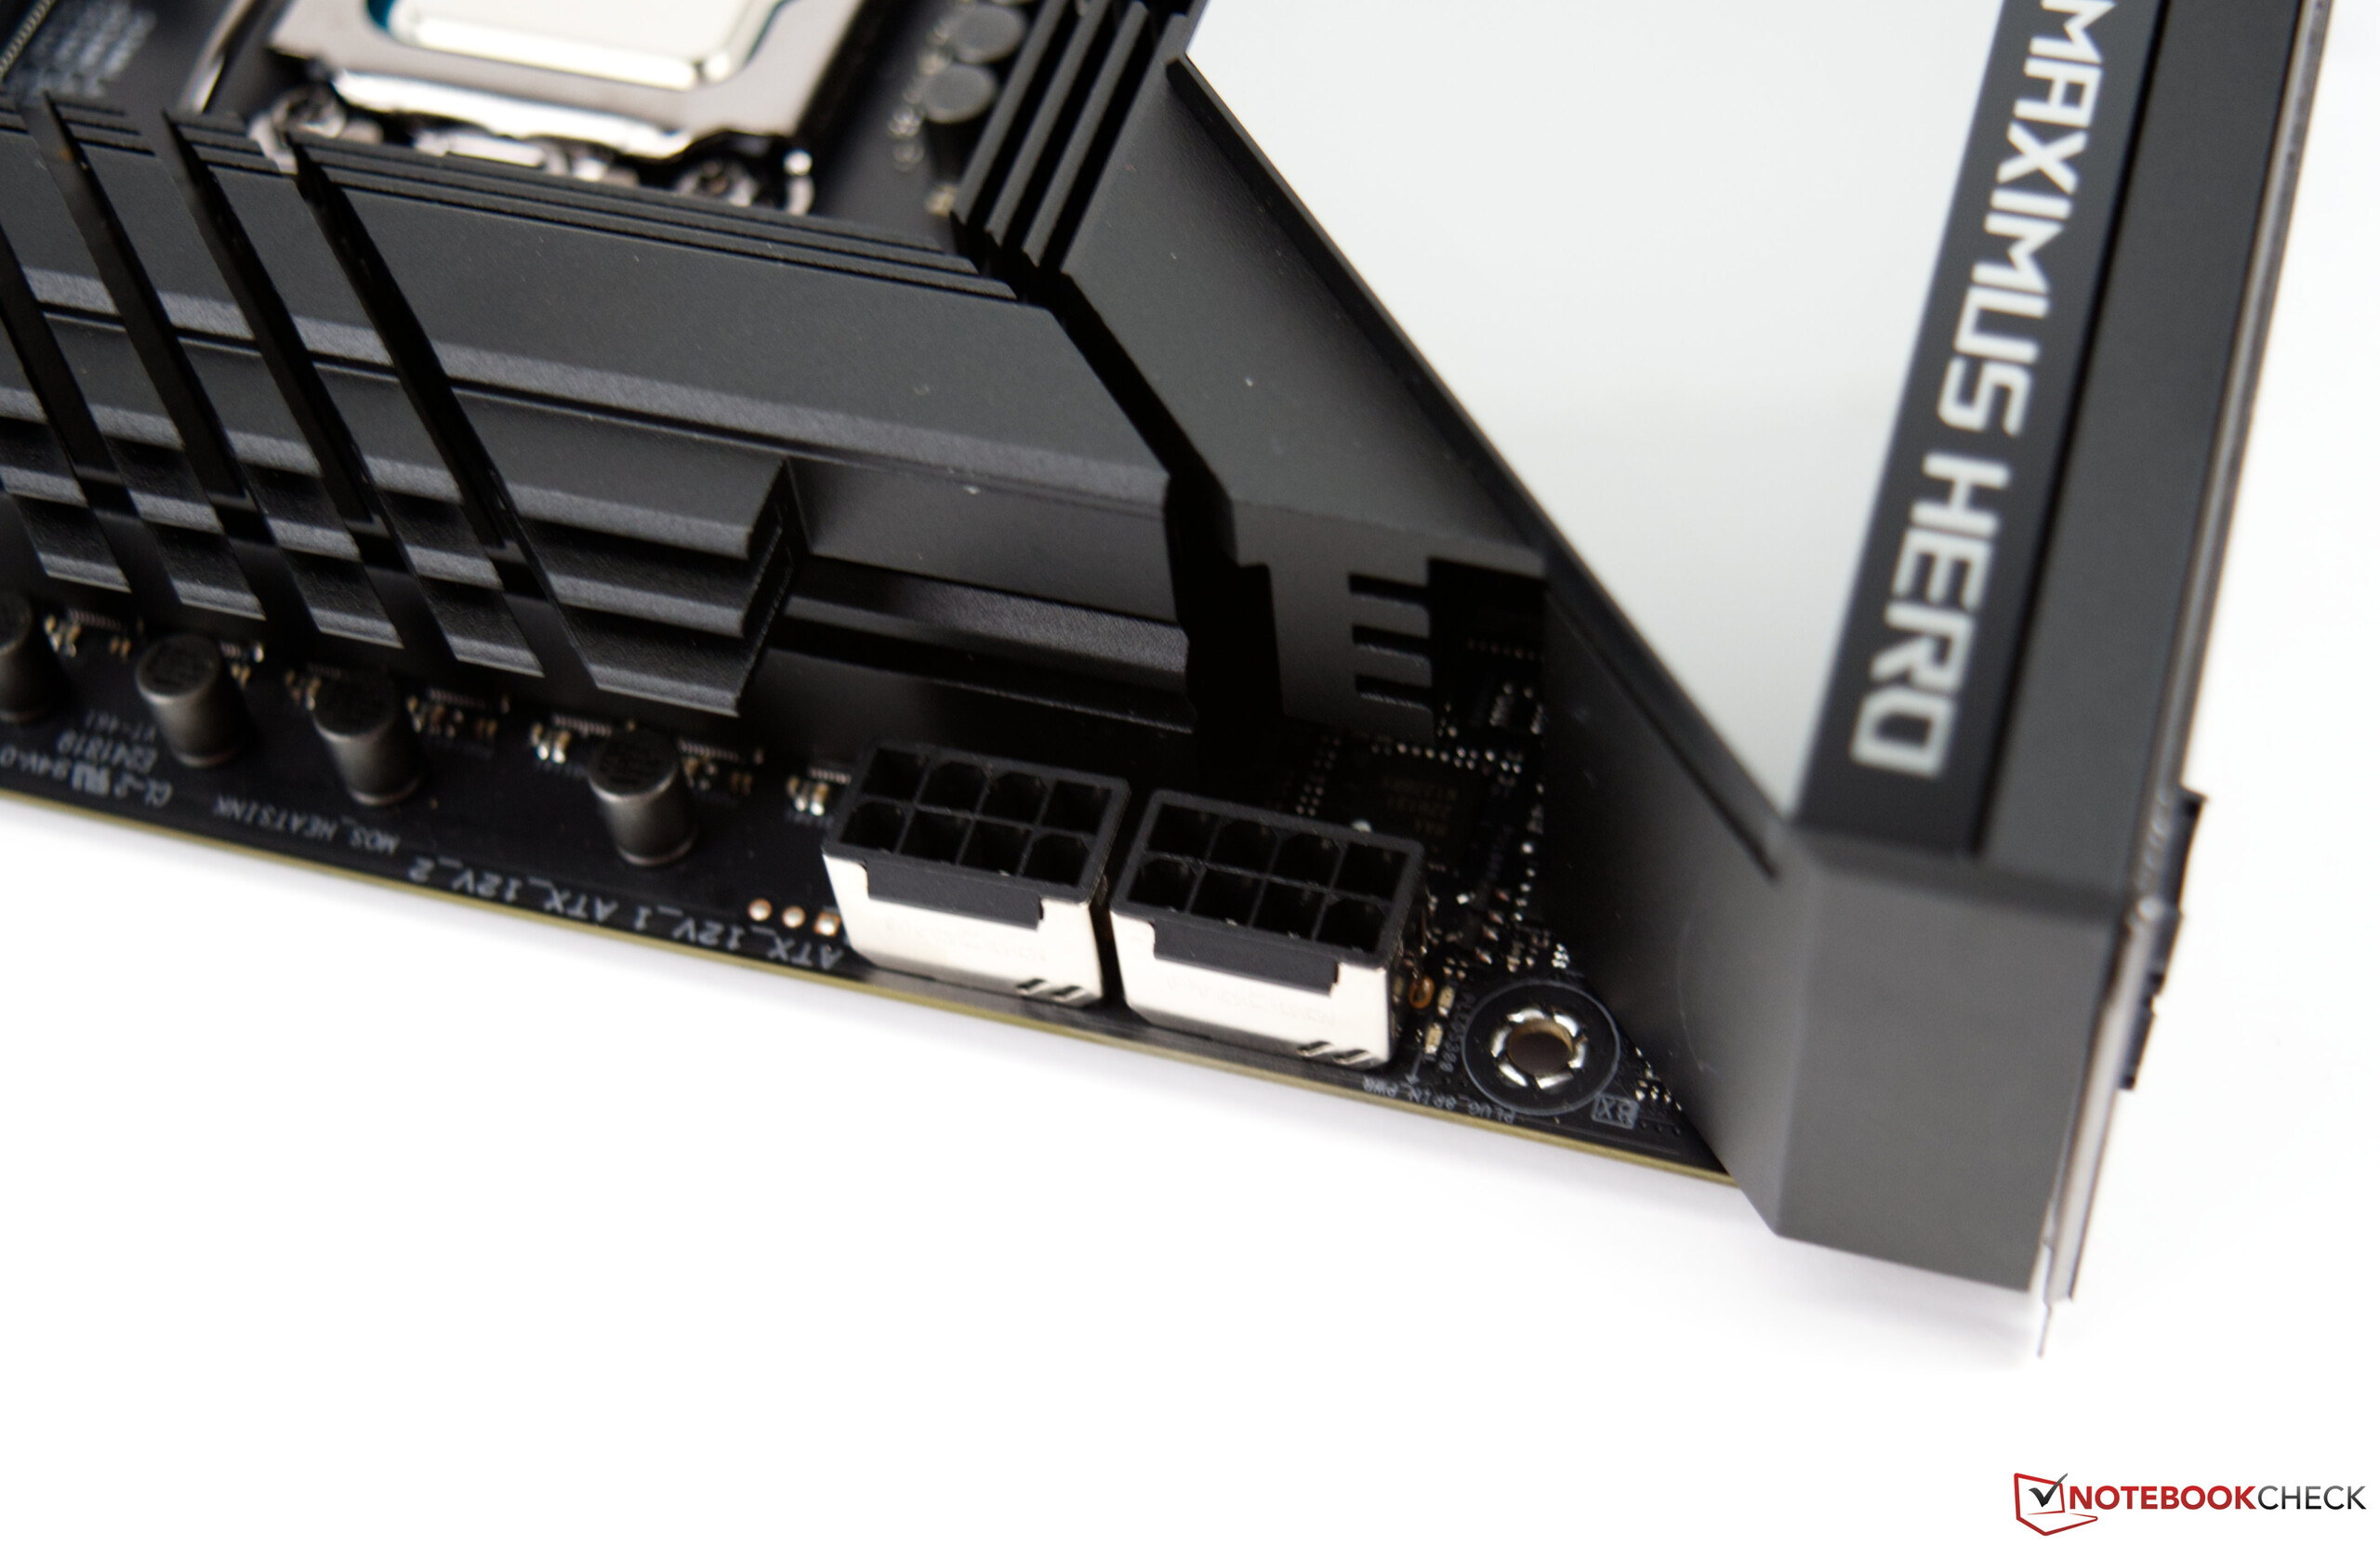
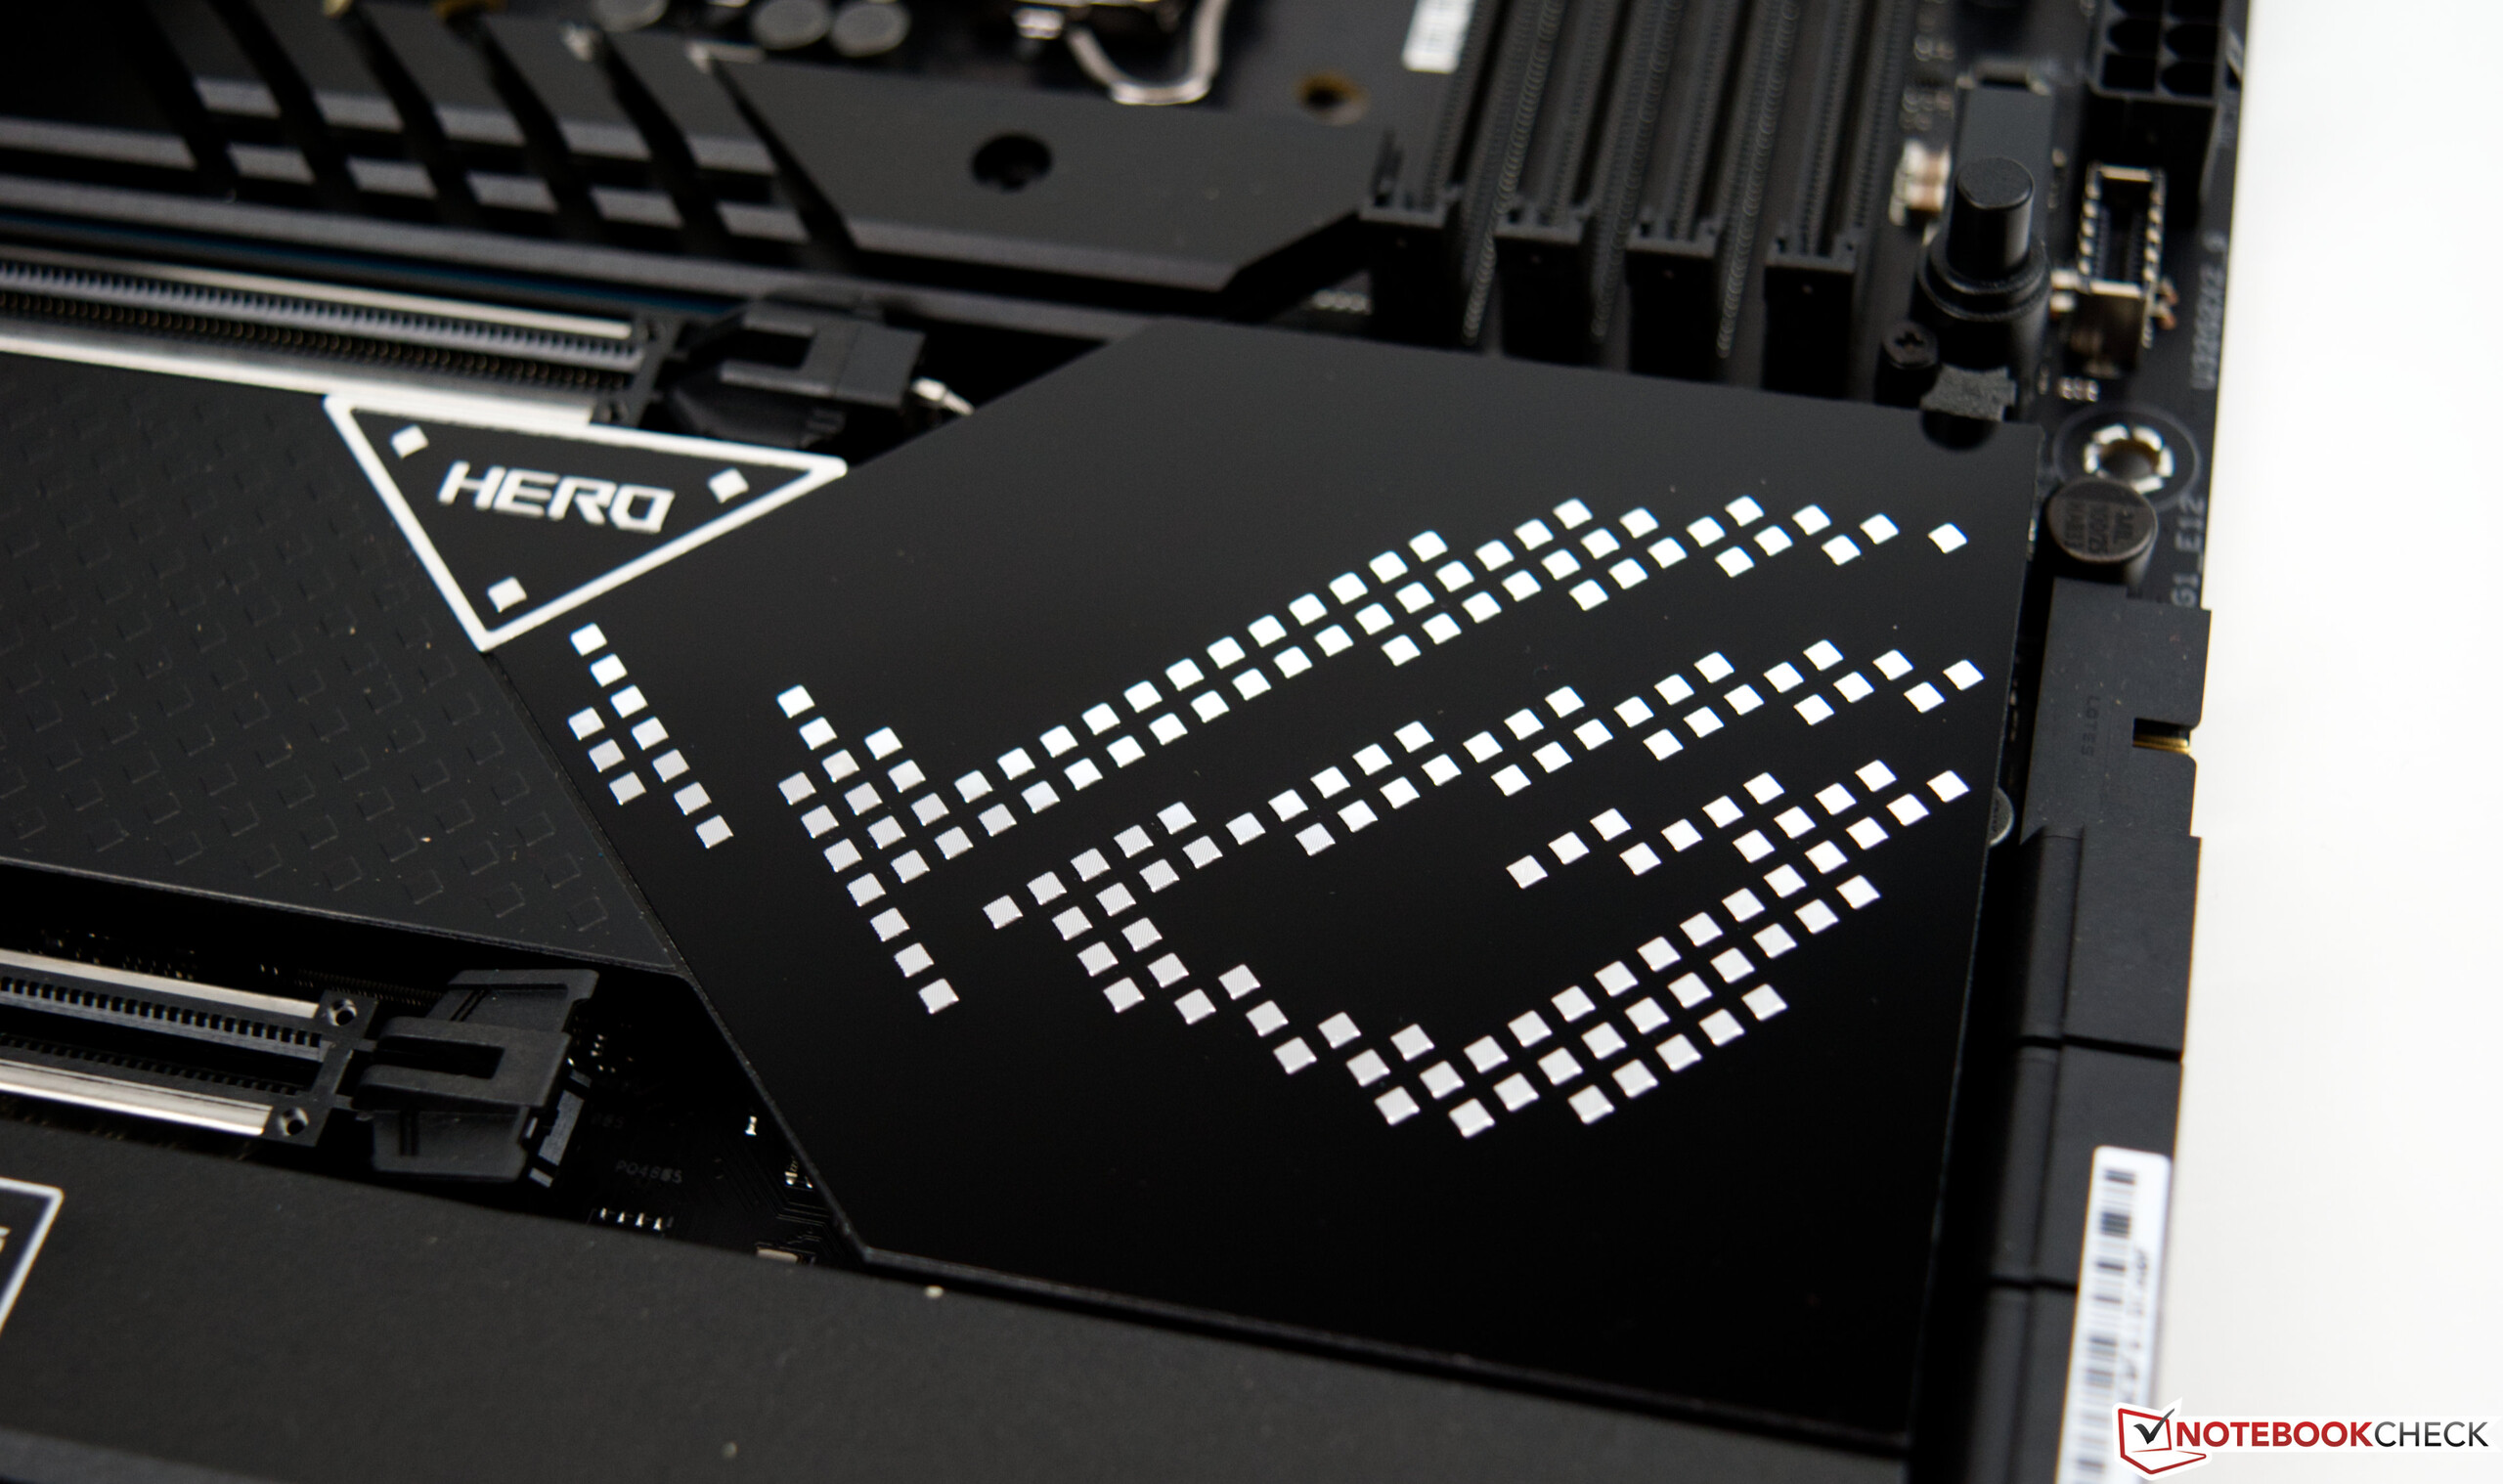
O Herói Asus ROG Maximus Z690 em detalhe
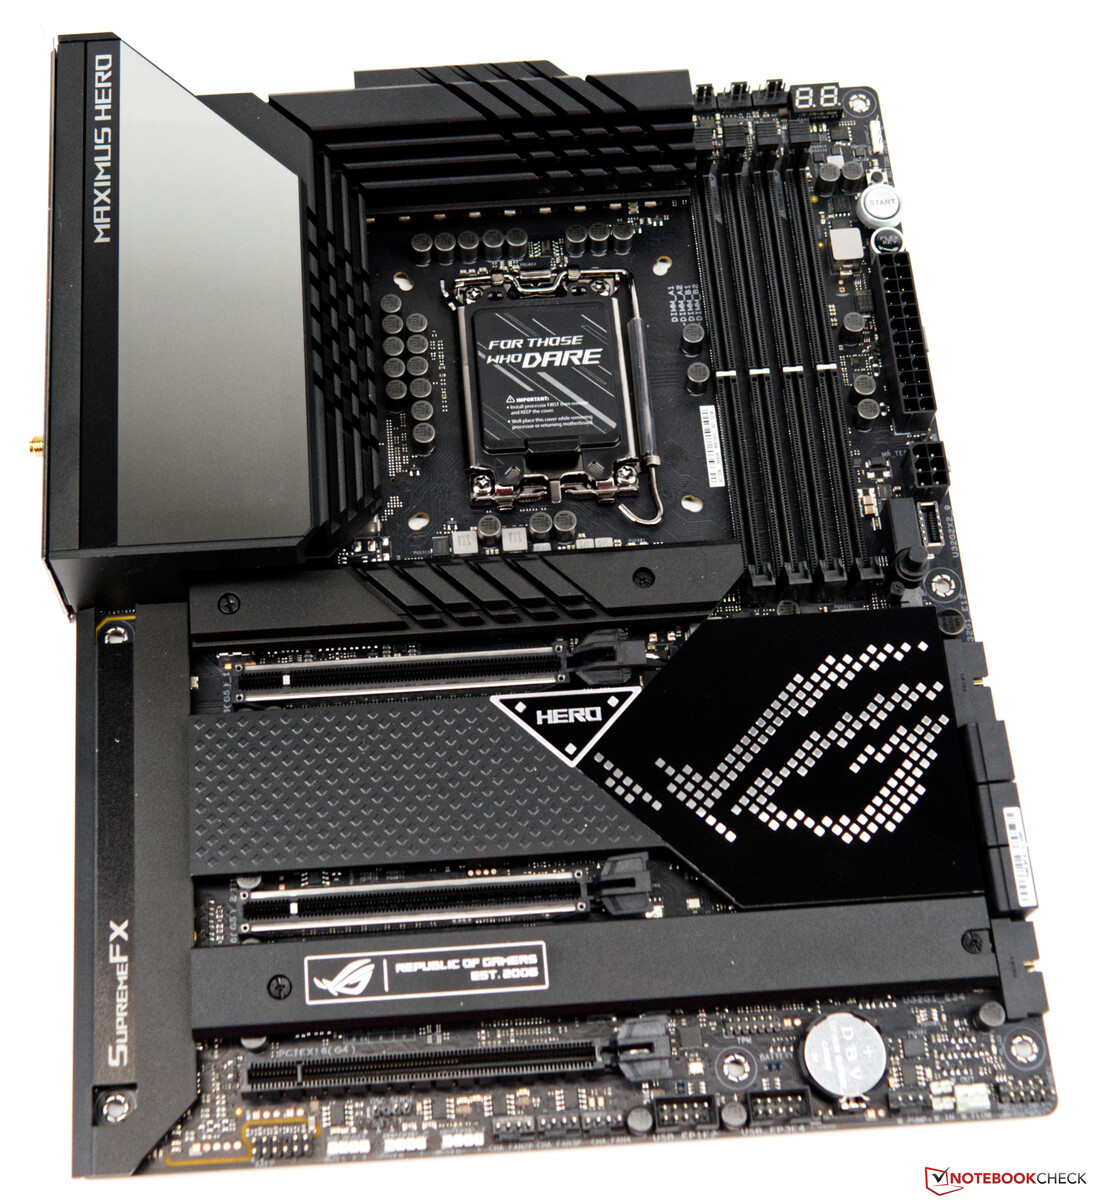
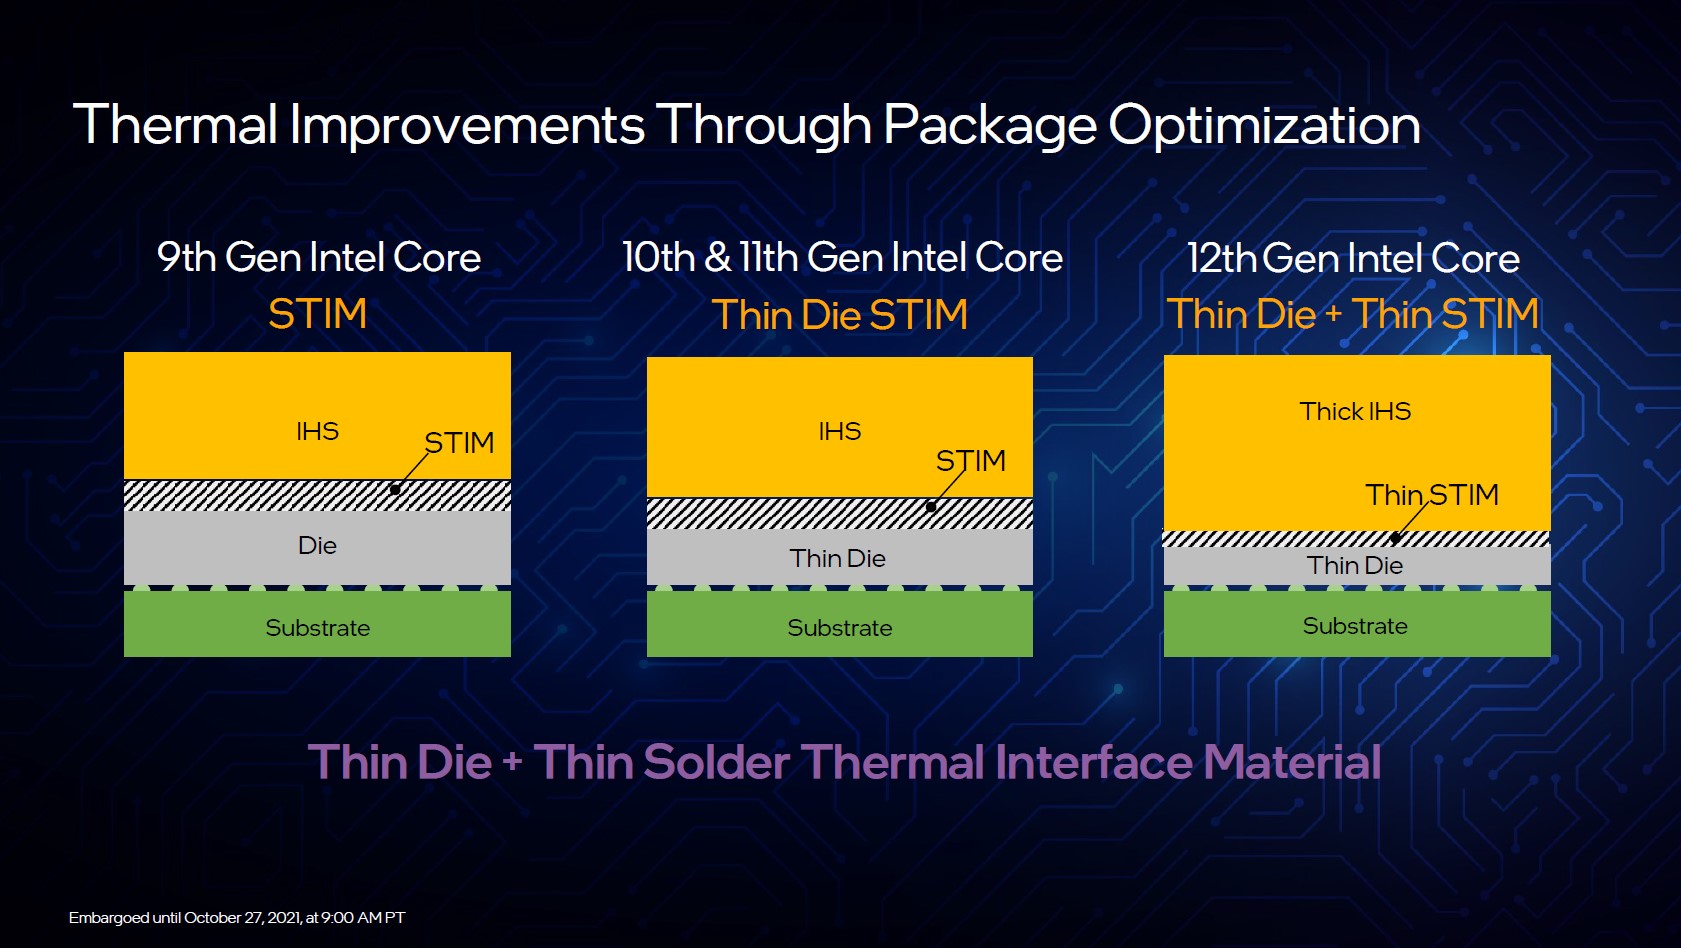
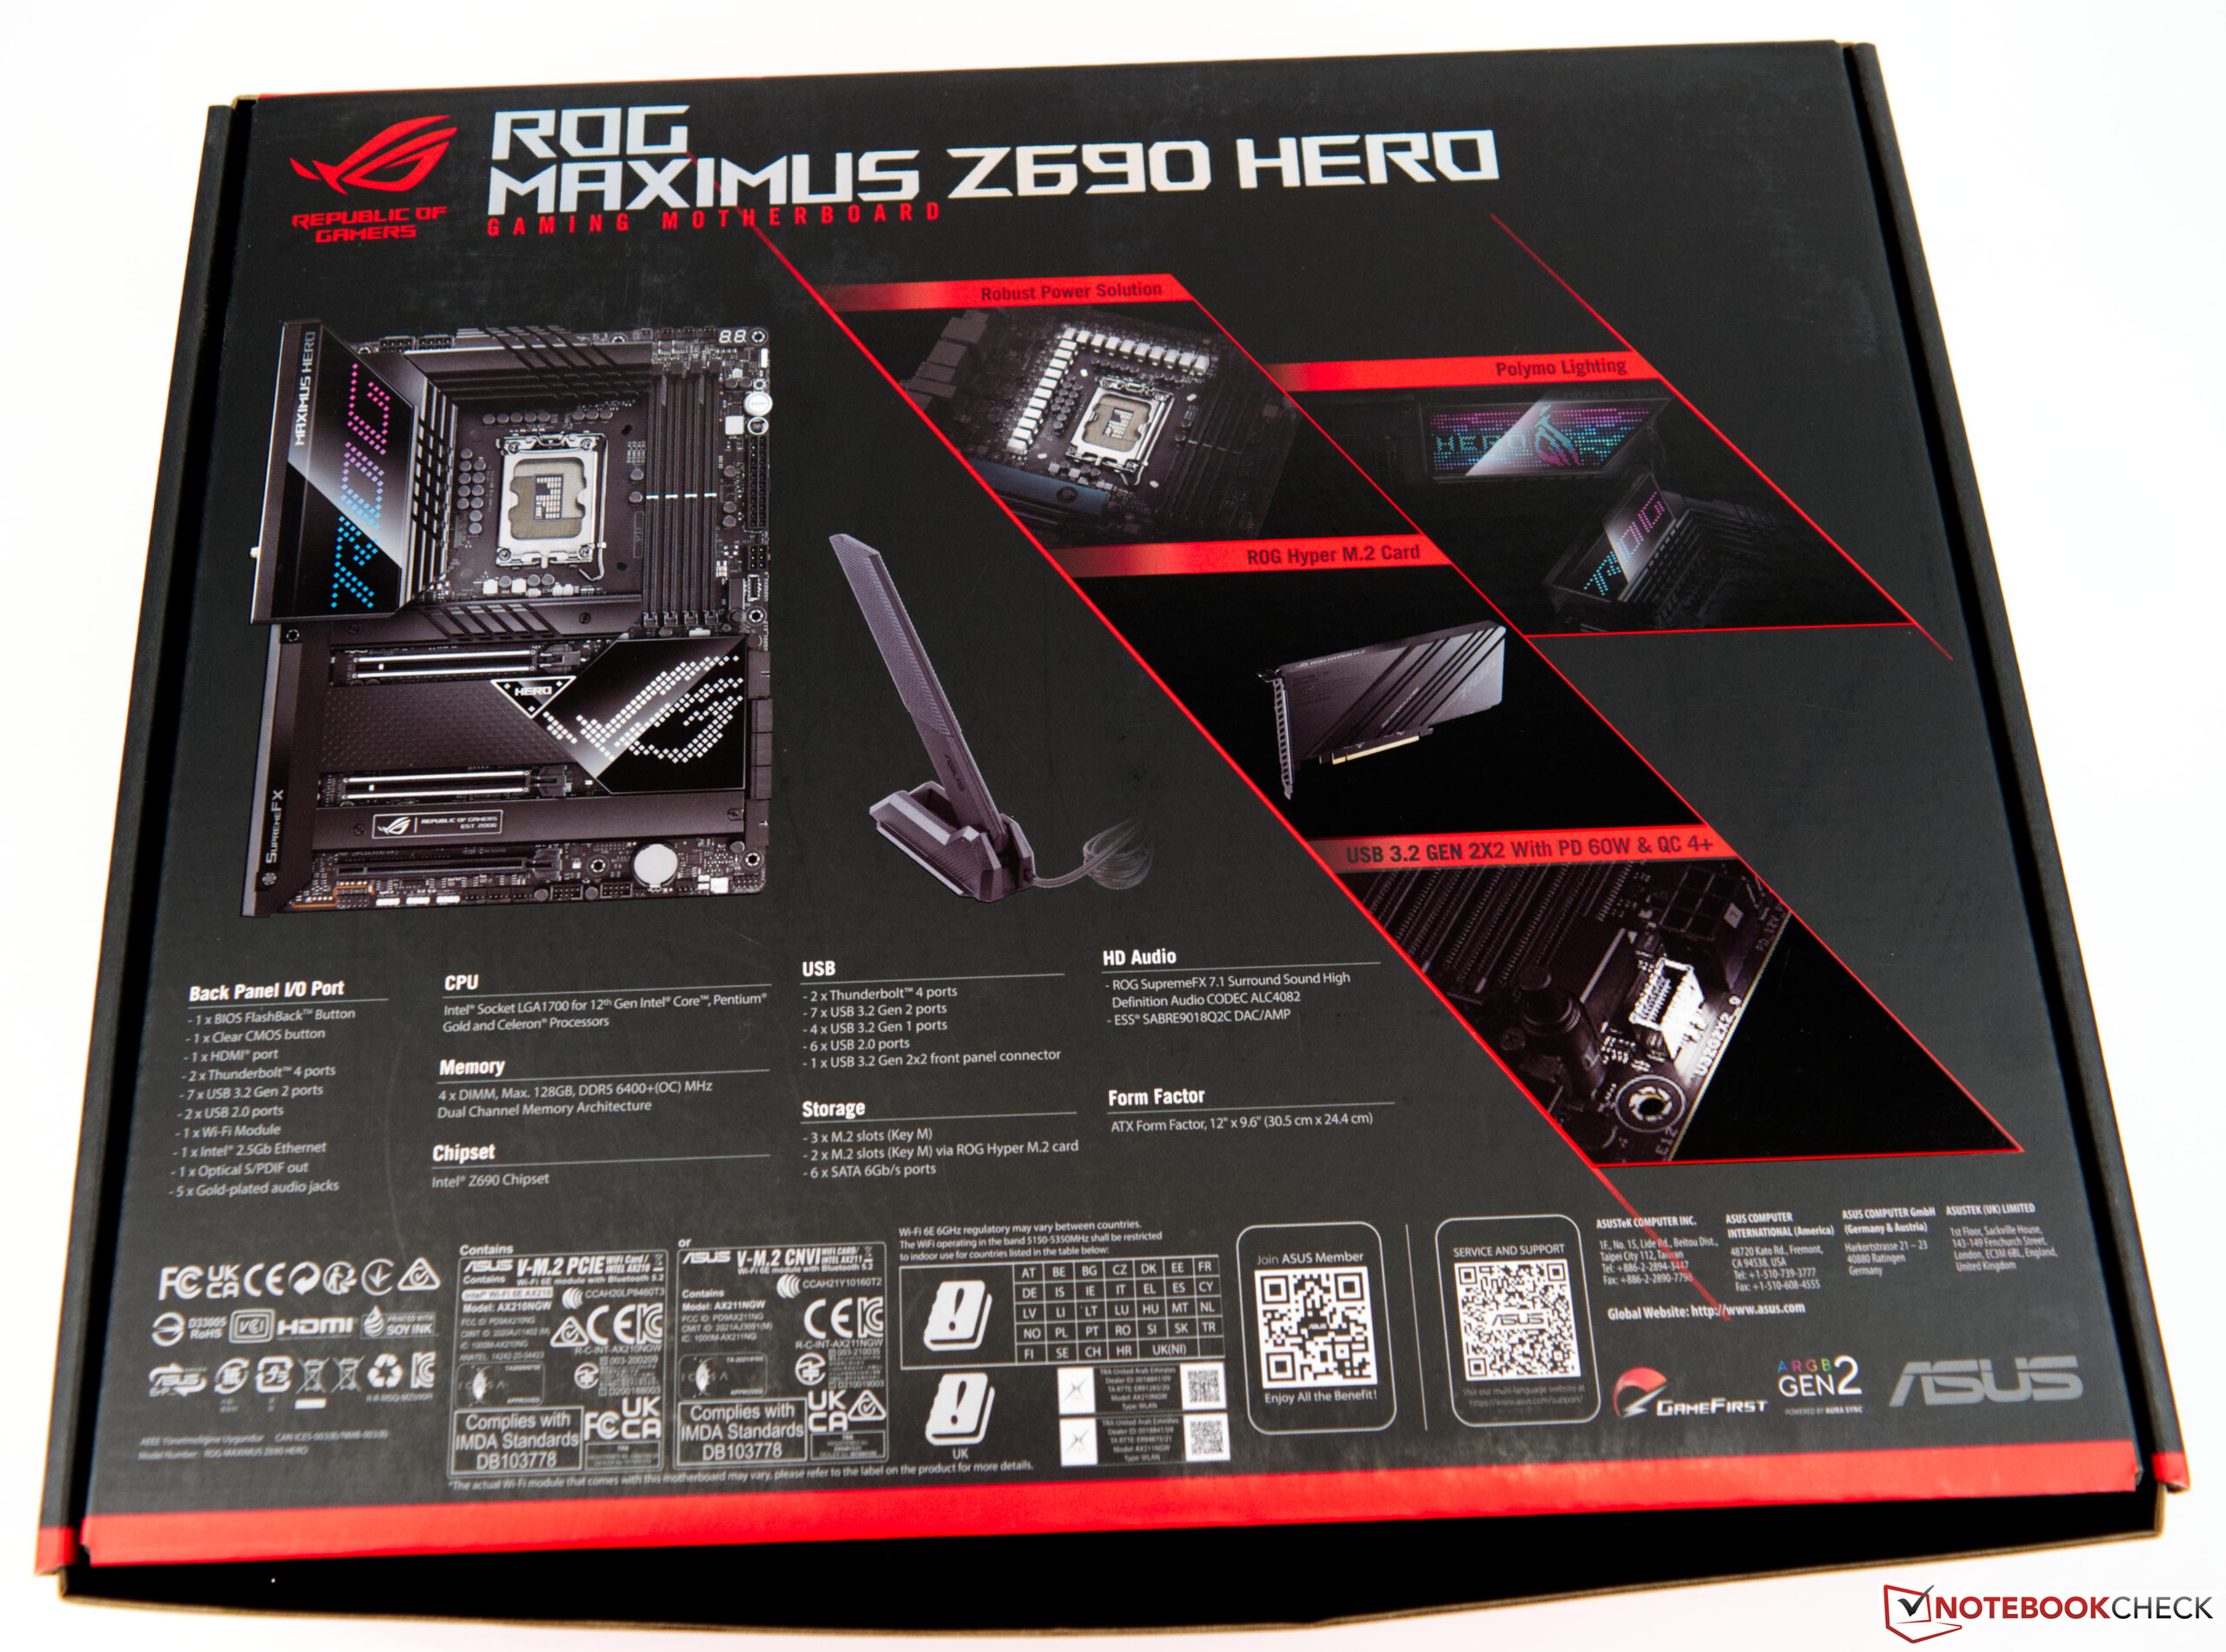
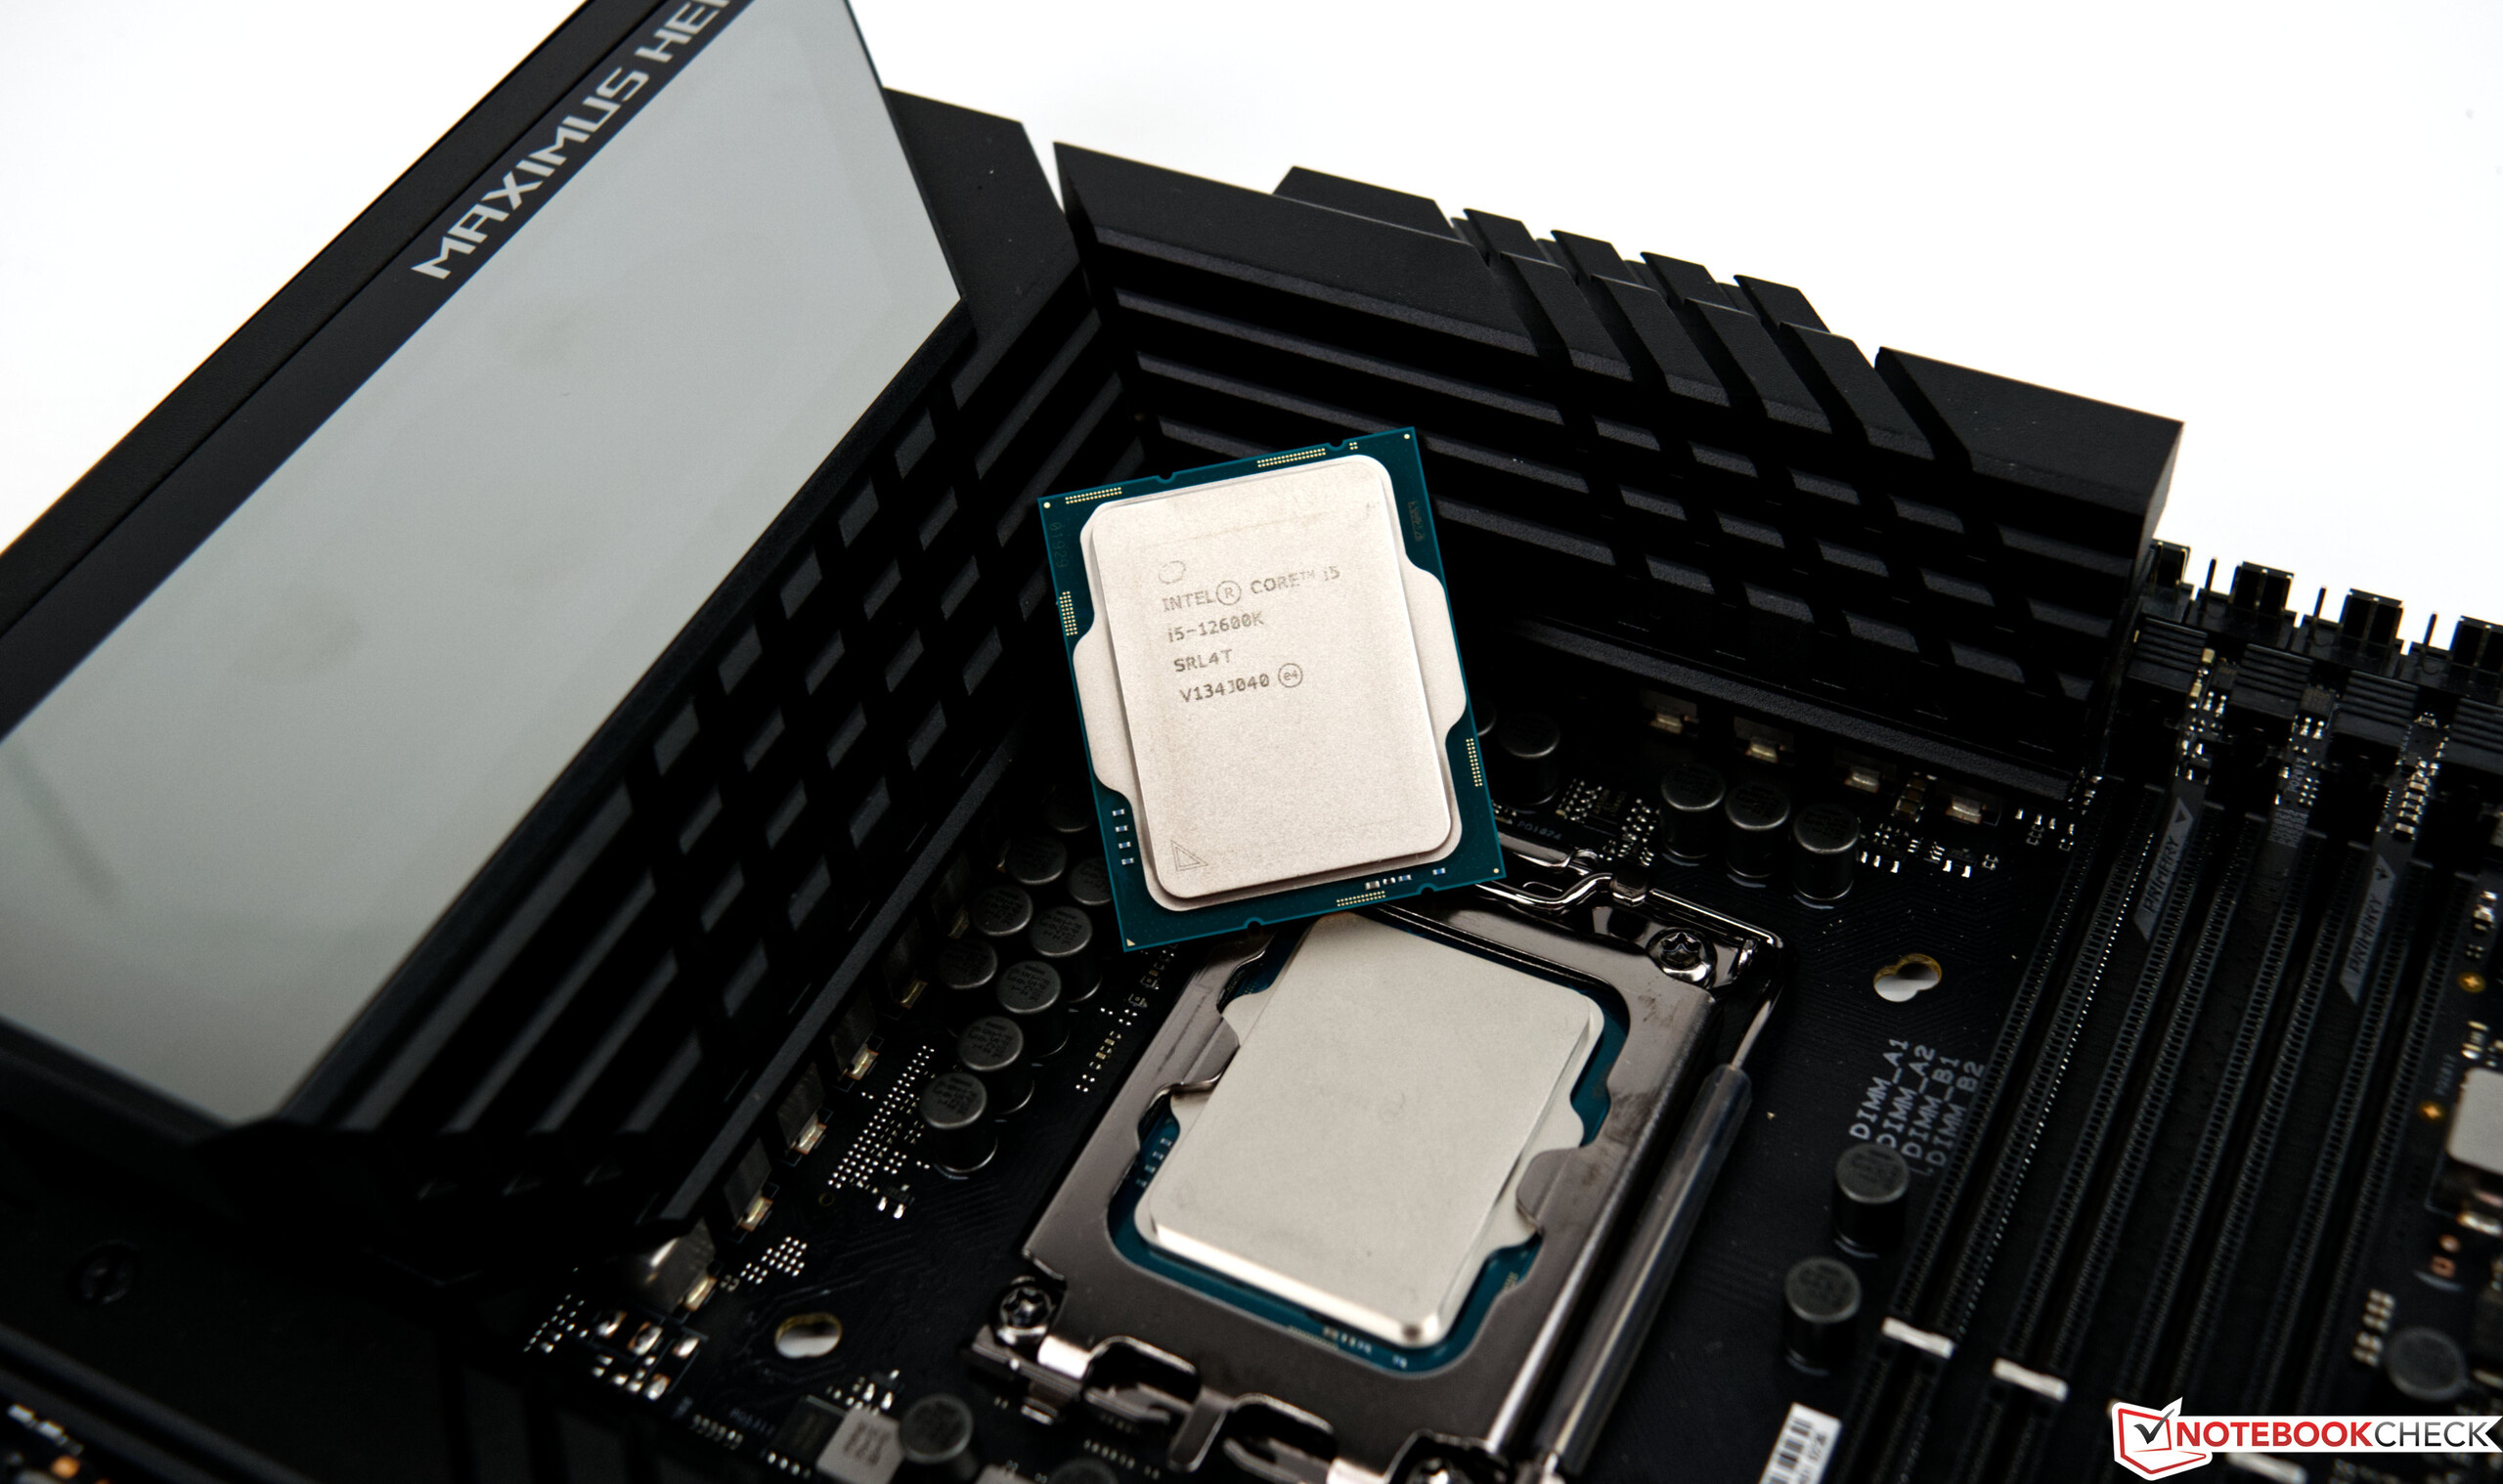
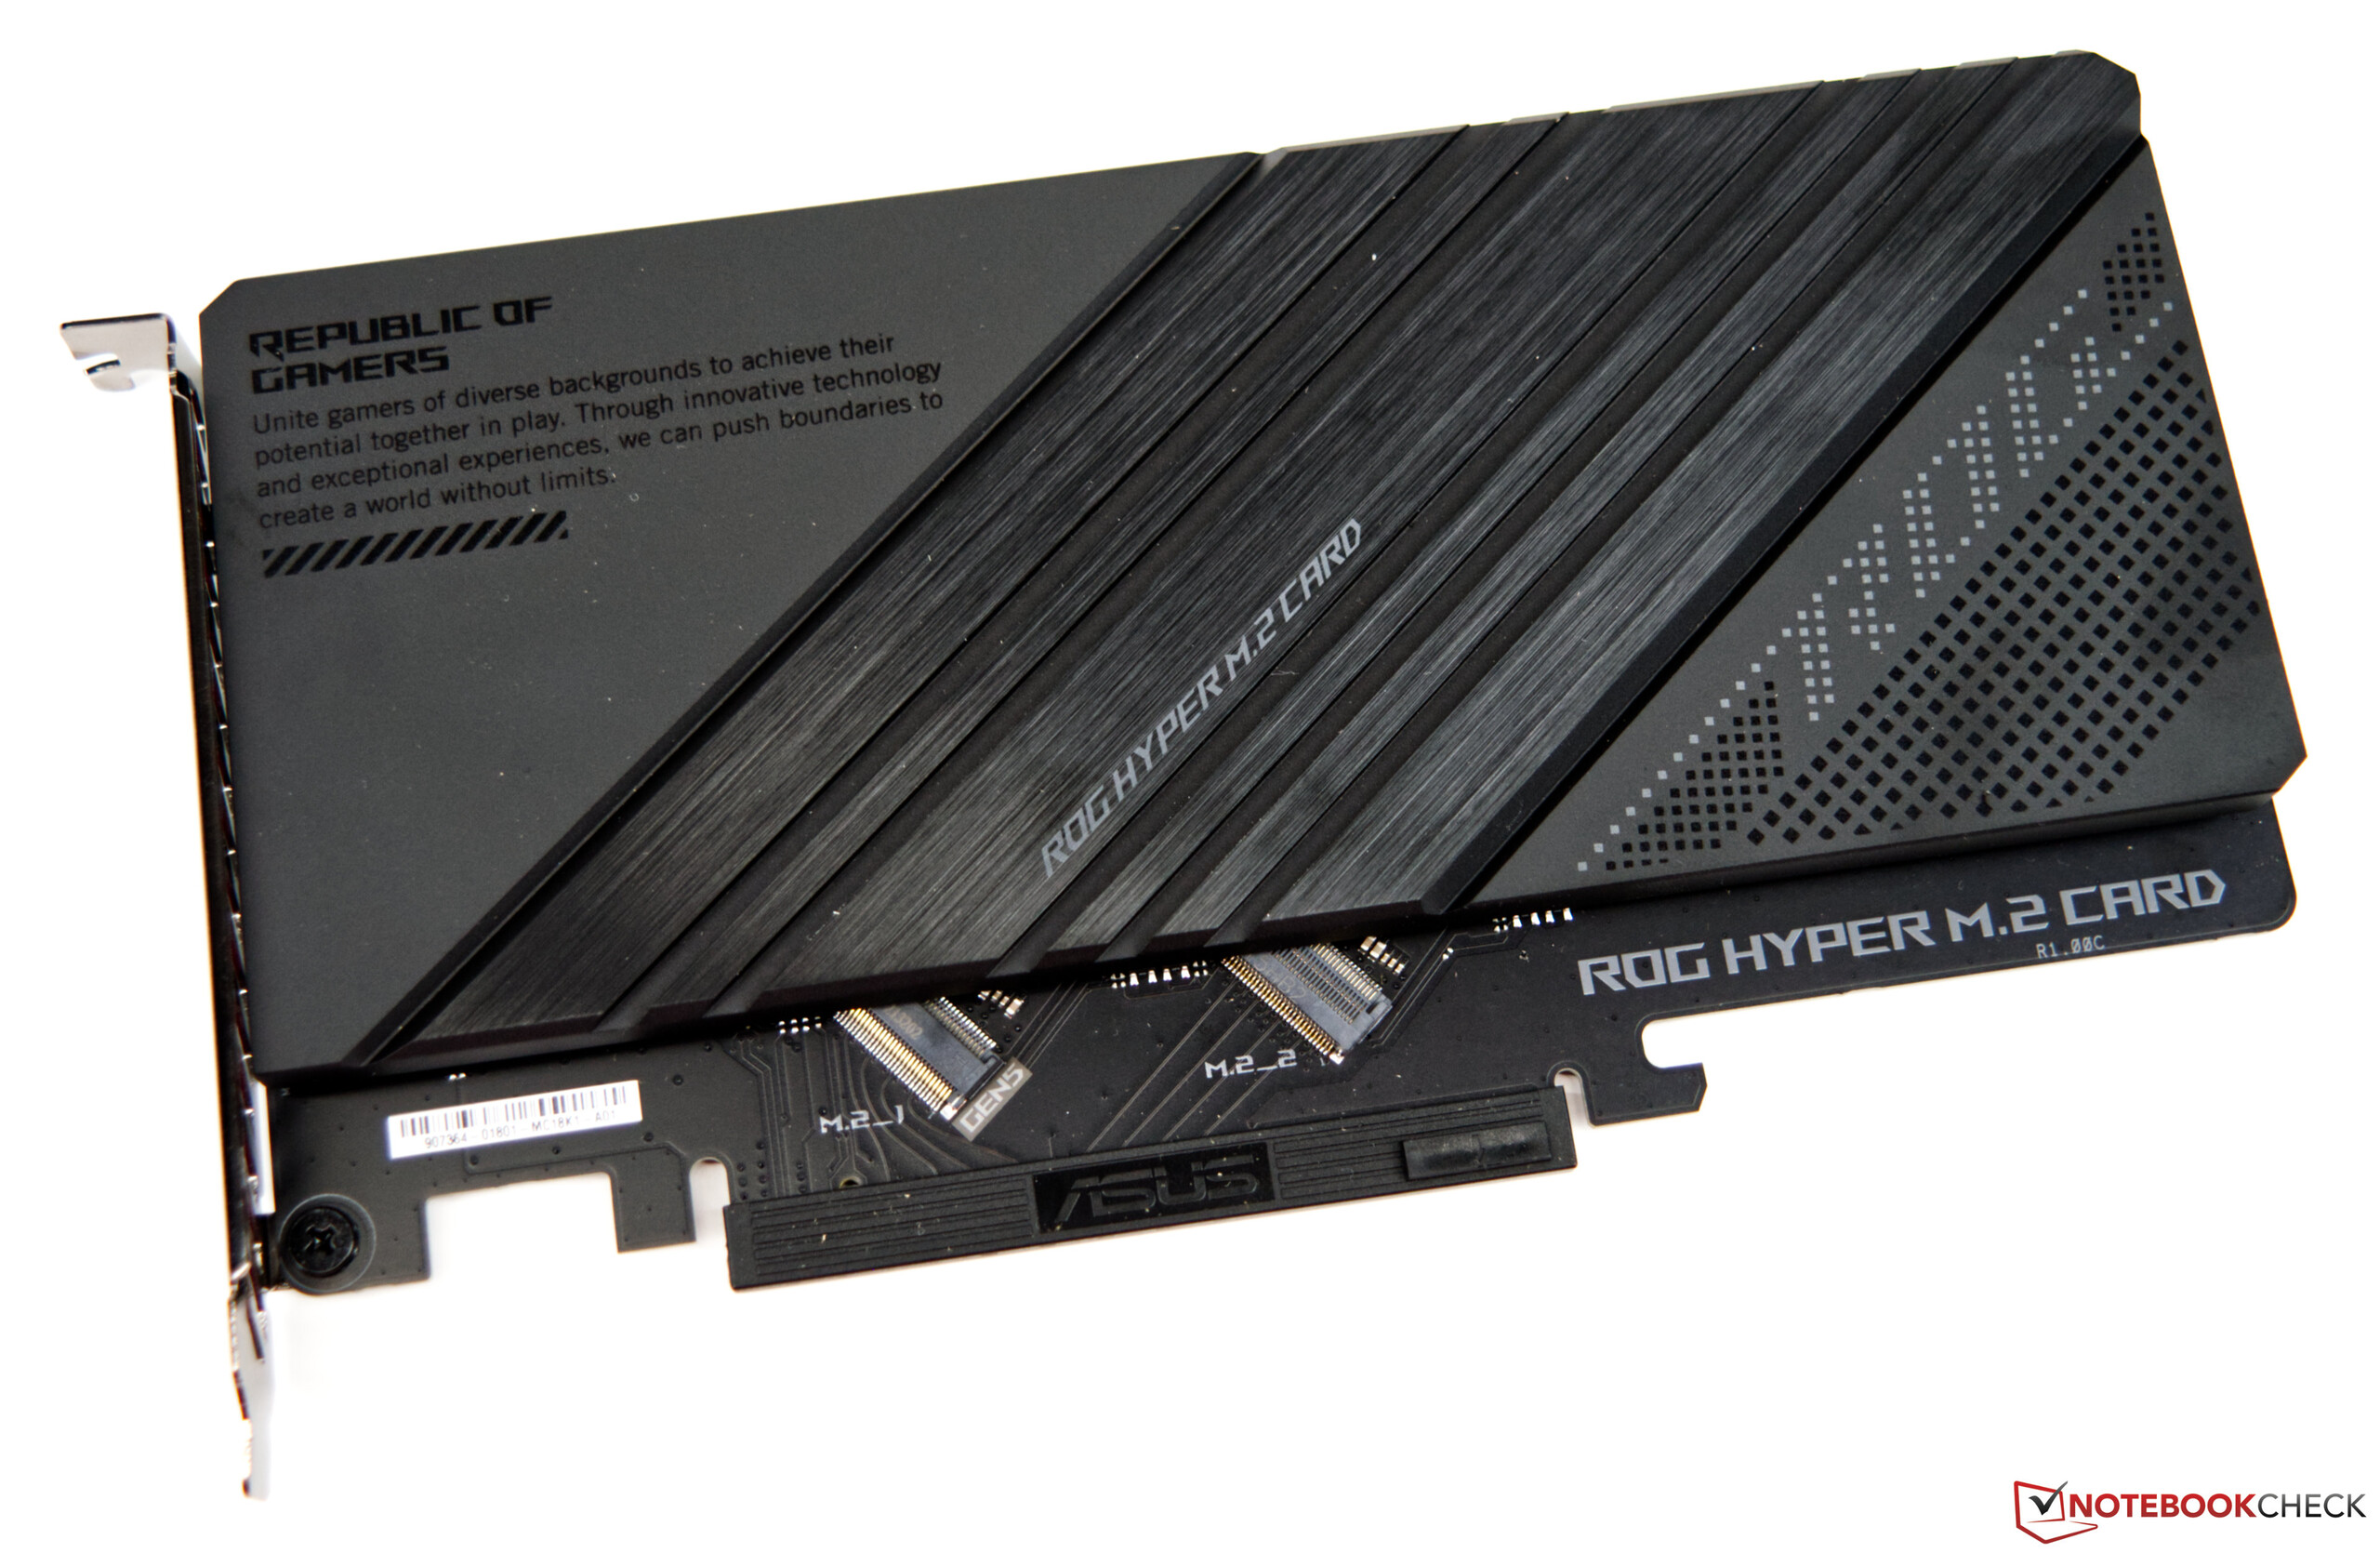
Asus nos forneceu a tempo com o Herói ROG Maximus Z690Agradecemos à Asus Alemanha por este empréstimo. O Asus ROG Maximus Z690 Hero parece muito maciço, o que pode ser rastreado até o grande sistema de refrigeração. No total, você pode instalar até cinco SSDs M.2 na placa principal, mas depois você tem que instalar dois dos cinco SSDs em um cartão Hyper M.2 separado. Isto poderá usar toda a largura de banda do suporte Gen 5 e está incluído como um acessório na caixa. O novo soquete LGA 1700 se destaca com o design ligeiramente alongado. Muitos sistemas de resfriamento LGA 1200 também são compatíveis com o novo soquete LGA 1700, mas você deve certificar-se de perguntar diretamente ao fabricante. Algumas vezes são oferecidos outros suportes de montagem para o LGA 1700 a fim de garantir uma pressão de contato ideal na CPU.
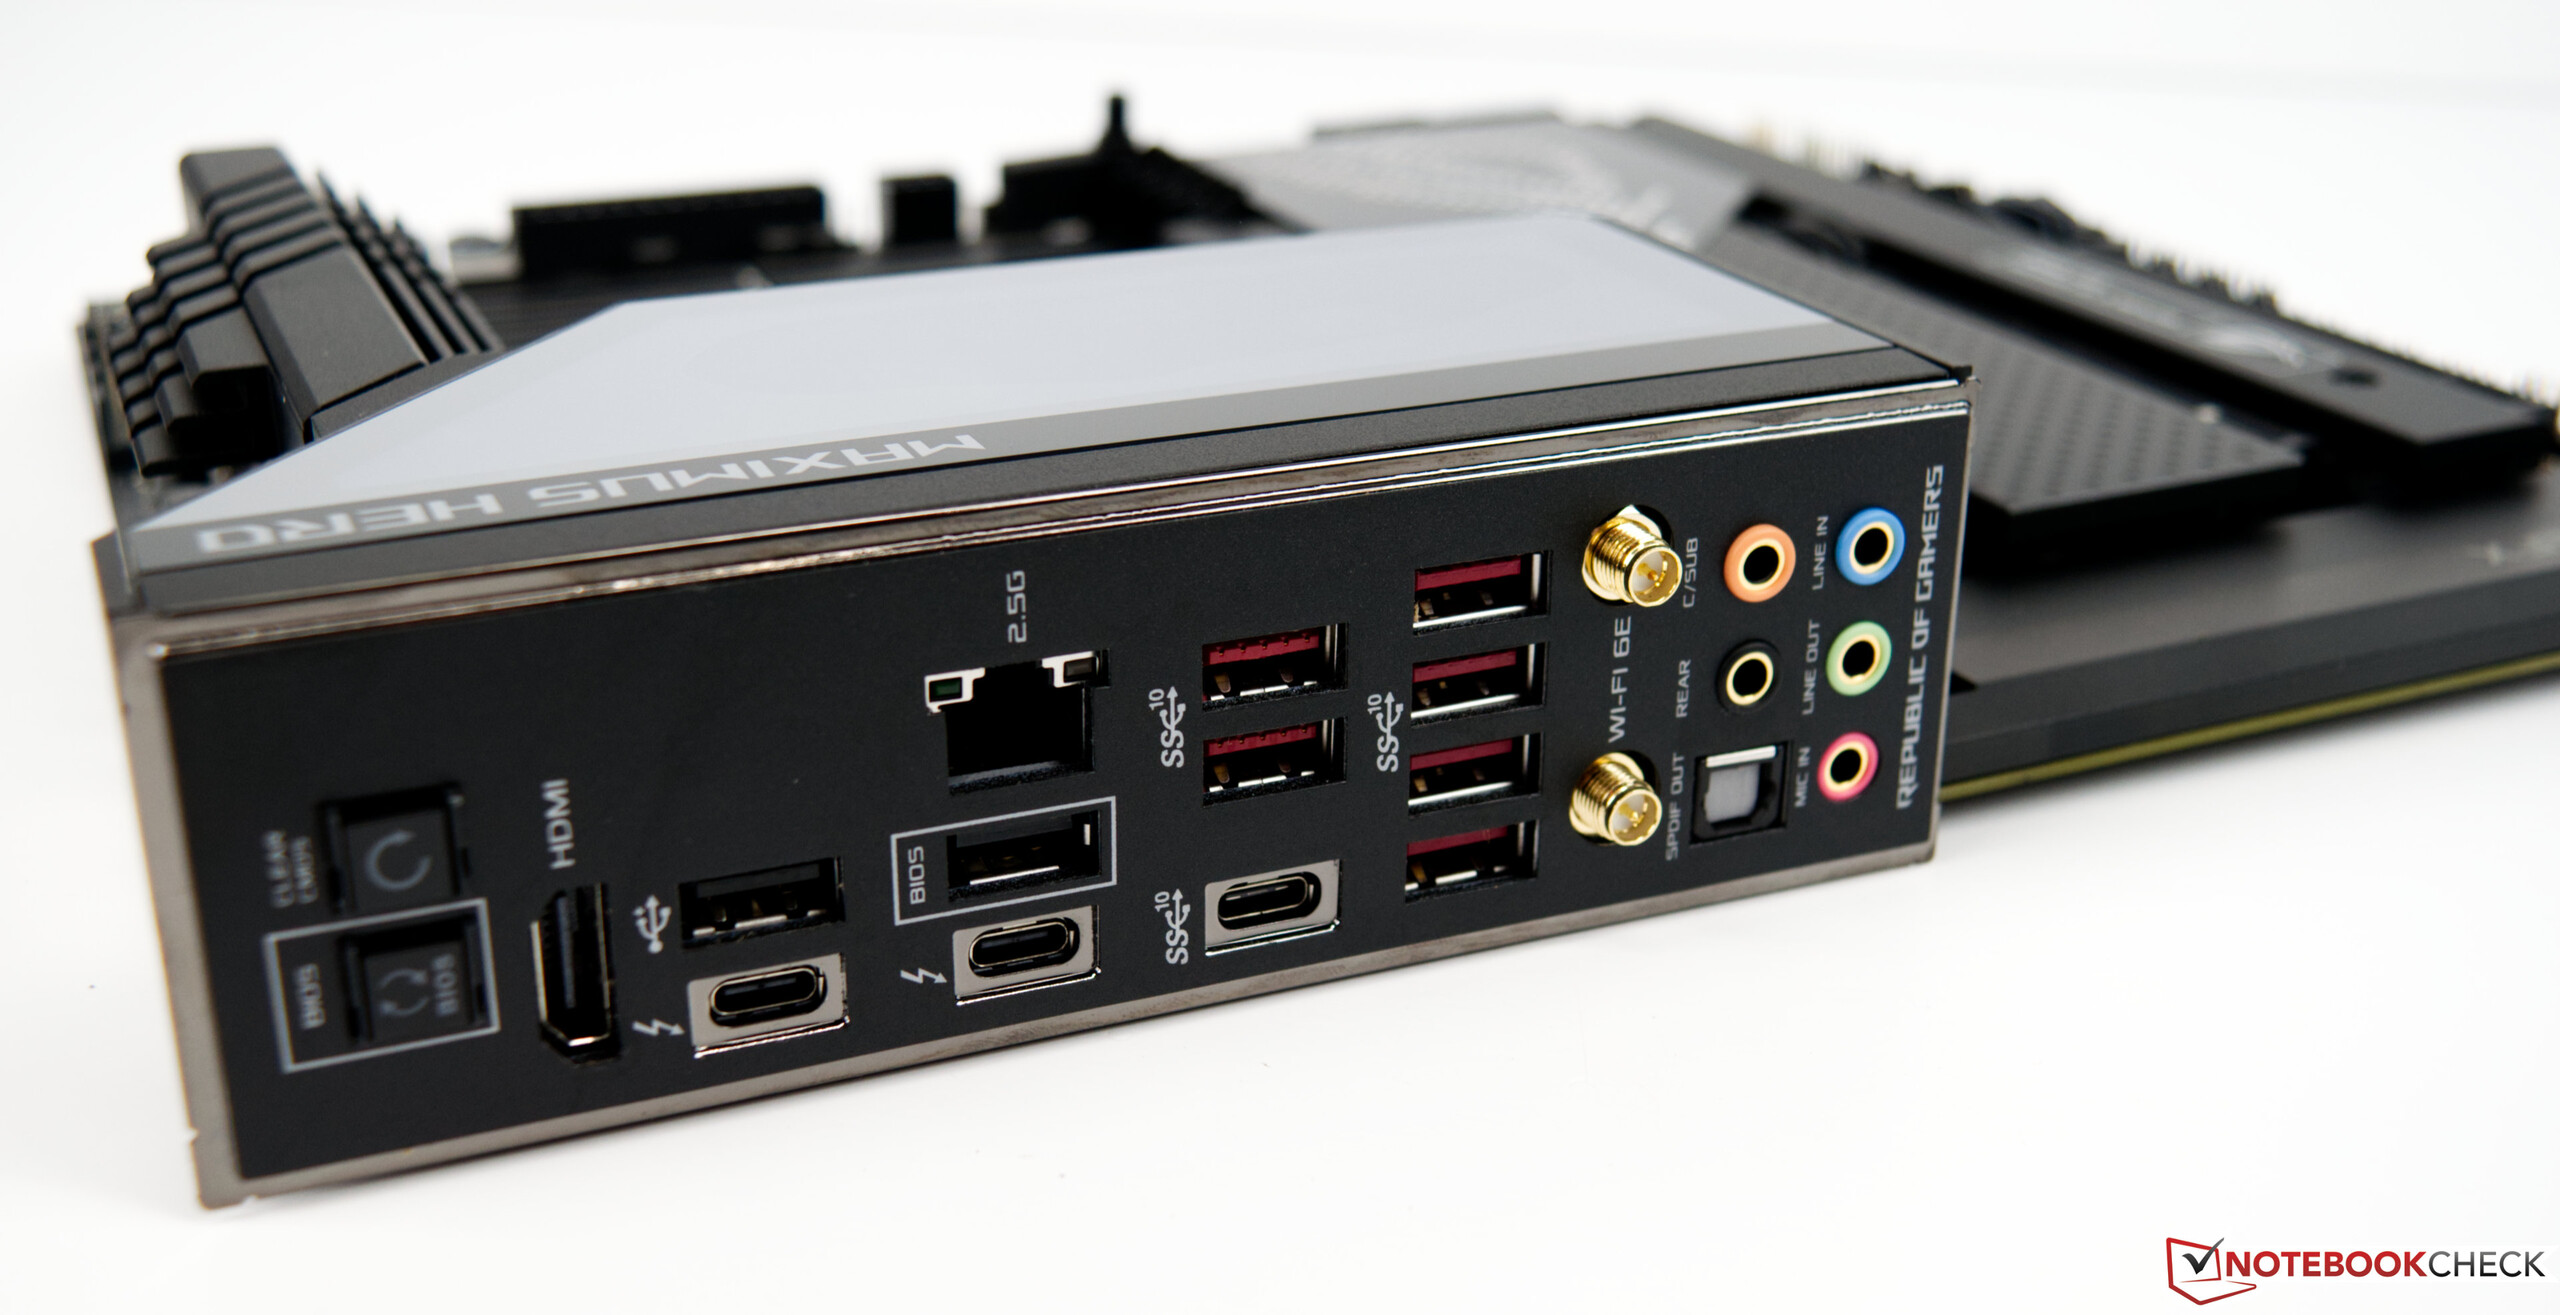
Você pode instalar até 128 GB da nova memória de trabalho DDR5. WiFi, 2,5 Gbit LAN, e um total de 20 portas USB garantem que você tenha conectividade suficiente.
Dois conectores de alimentação de 8 pinos não muito longe da tomada fornecem energia à CPU. Os transformadores de tensão são cobertos por um bloco de resfriamento muito maciço, incluindo um tubo de calor. Além disso, há um atraente painel de iluminação Polymo acima do I/O Shield, que é bastante atraente.
Benchmarks de Processador
A Intel é capaz de manter a promessa de um aumento significativo de desempenho emcomparação com os processadores Rocket Lake-S. Na classificação de desempenho, que reflete a diferença de desempenho entre todos os benchmarks listados, o Intel Core i9-12900K é capaz de colocar claramente no topo. Em comparação com oAMD Ryzen 9 5900Xque também oferece 24 linhas no total, o novo navio bandeira da Intel está à frente em 13 pontos percentuais. Se tomarmos oIntel Core i9-11900K como referência, o Core i9-12900K funciona 23% mais rápido. Embora as diferenças variem ligeiramente nos pontos de referência separados, isto se deve à arquitetura da CPU correspondente.
Vemos uma imagem semelhante com o menor Intel Core i5-12600K. Se utilizarmos o AMD Ryzen 7 5800X como concorrente, uma vez que tem as mesmas quantidades de fios, ambos os concorrentes têm um desempenho a nível dos olhos nos resultados de referência acumulados. Por outro lado, o processador Zen3 tem dificuldade em competir com o poderoso desempenho single-core da Intel. Mas ainda não se deve eliminar a AMD, já que as CPUs Zen3 já estão no mercado há um ano e, segundo alguns rumores, o sucessor já está nos blocos iniciais. Quando isso estiver disponível, os moldes serão lançados de novo e o Rocket Lake-S tem que se provar novamente.
Devido à discussão PL1 = PL2, pegamos o Cinebench R23 e fizemos outra corrida com um valor de PL1 limitado a 125 watts. Não houve mudanças no resultado que valha a pena mencionar. As diferenças foram mínimas e podem ser consideradas como estando dentro das tolerâncias de medição.
Ficou claro que a Intel daria um salto significativo com o novo design dos núcleos P e E. Com isto, a Intel também conseguiu fechar a lacuna para os processadores de 12 e 16 núcleos da AMD, o que não foi possível com o Core i9-11900K.
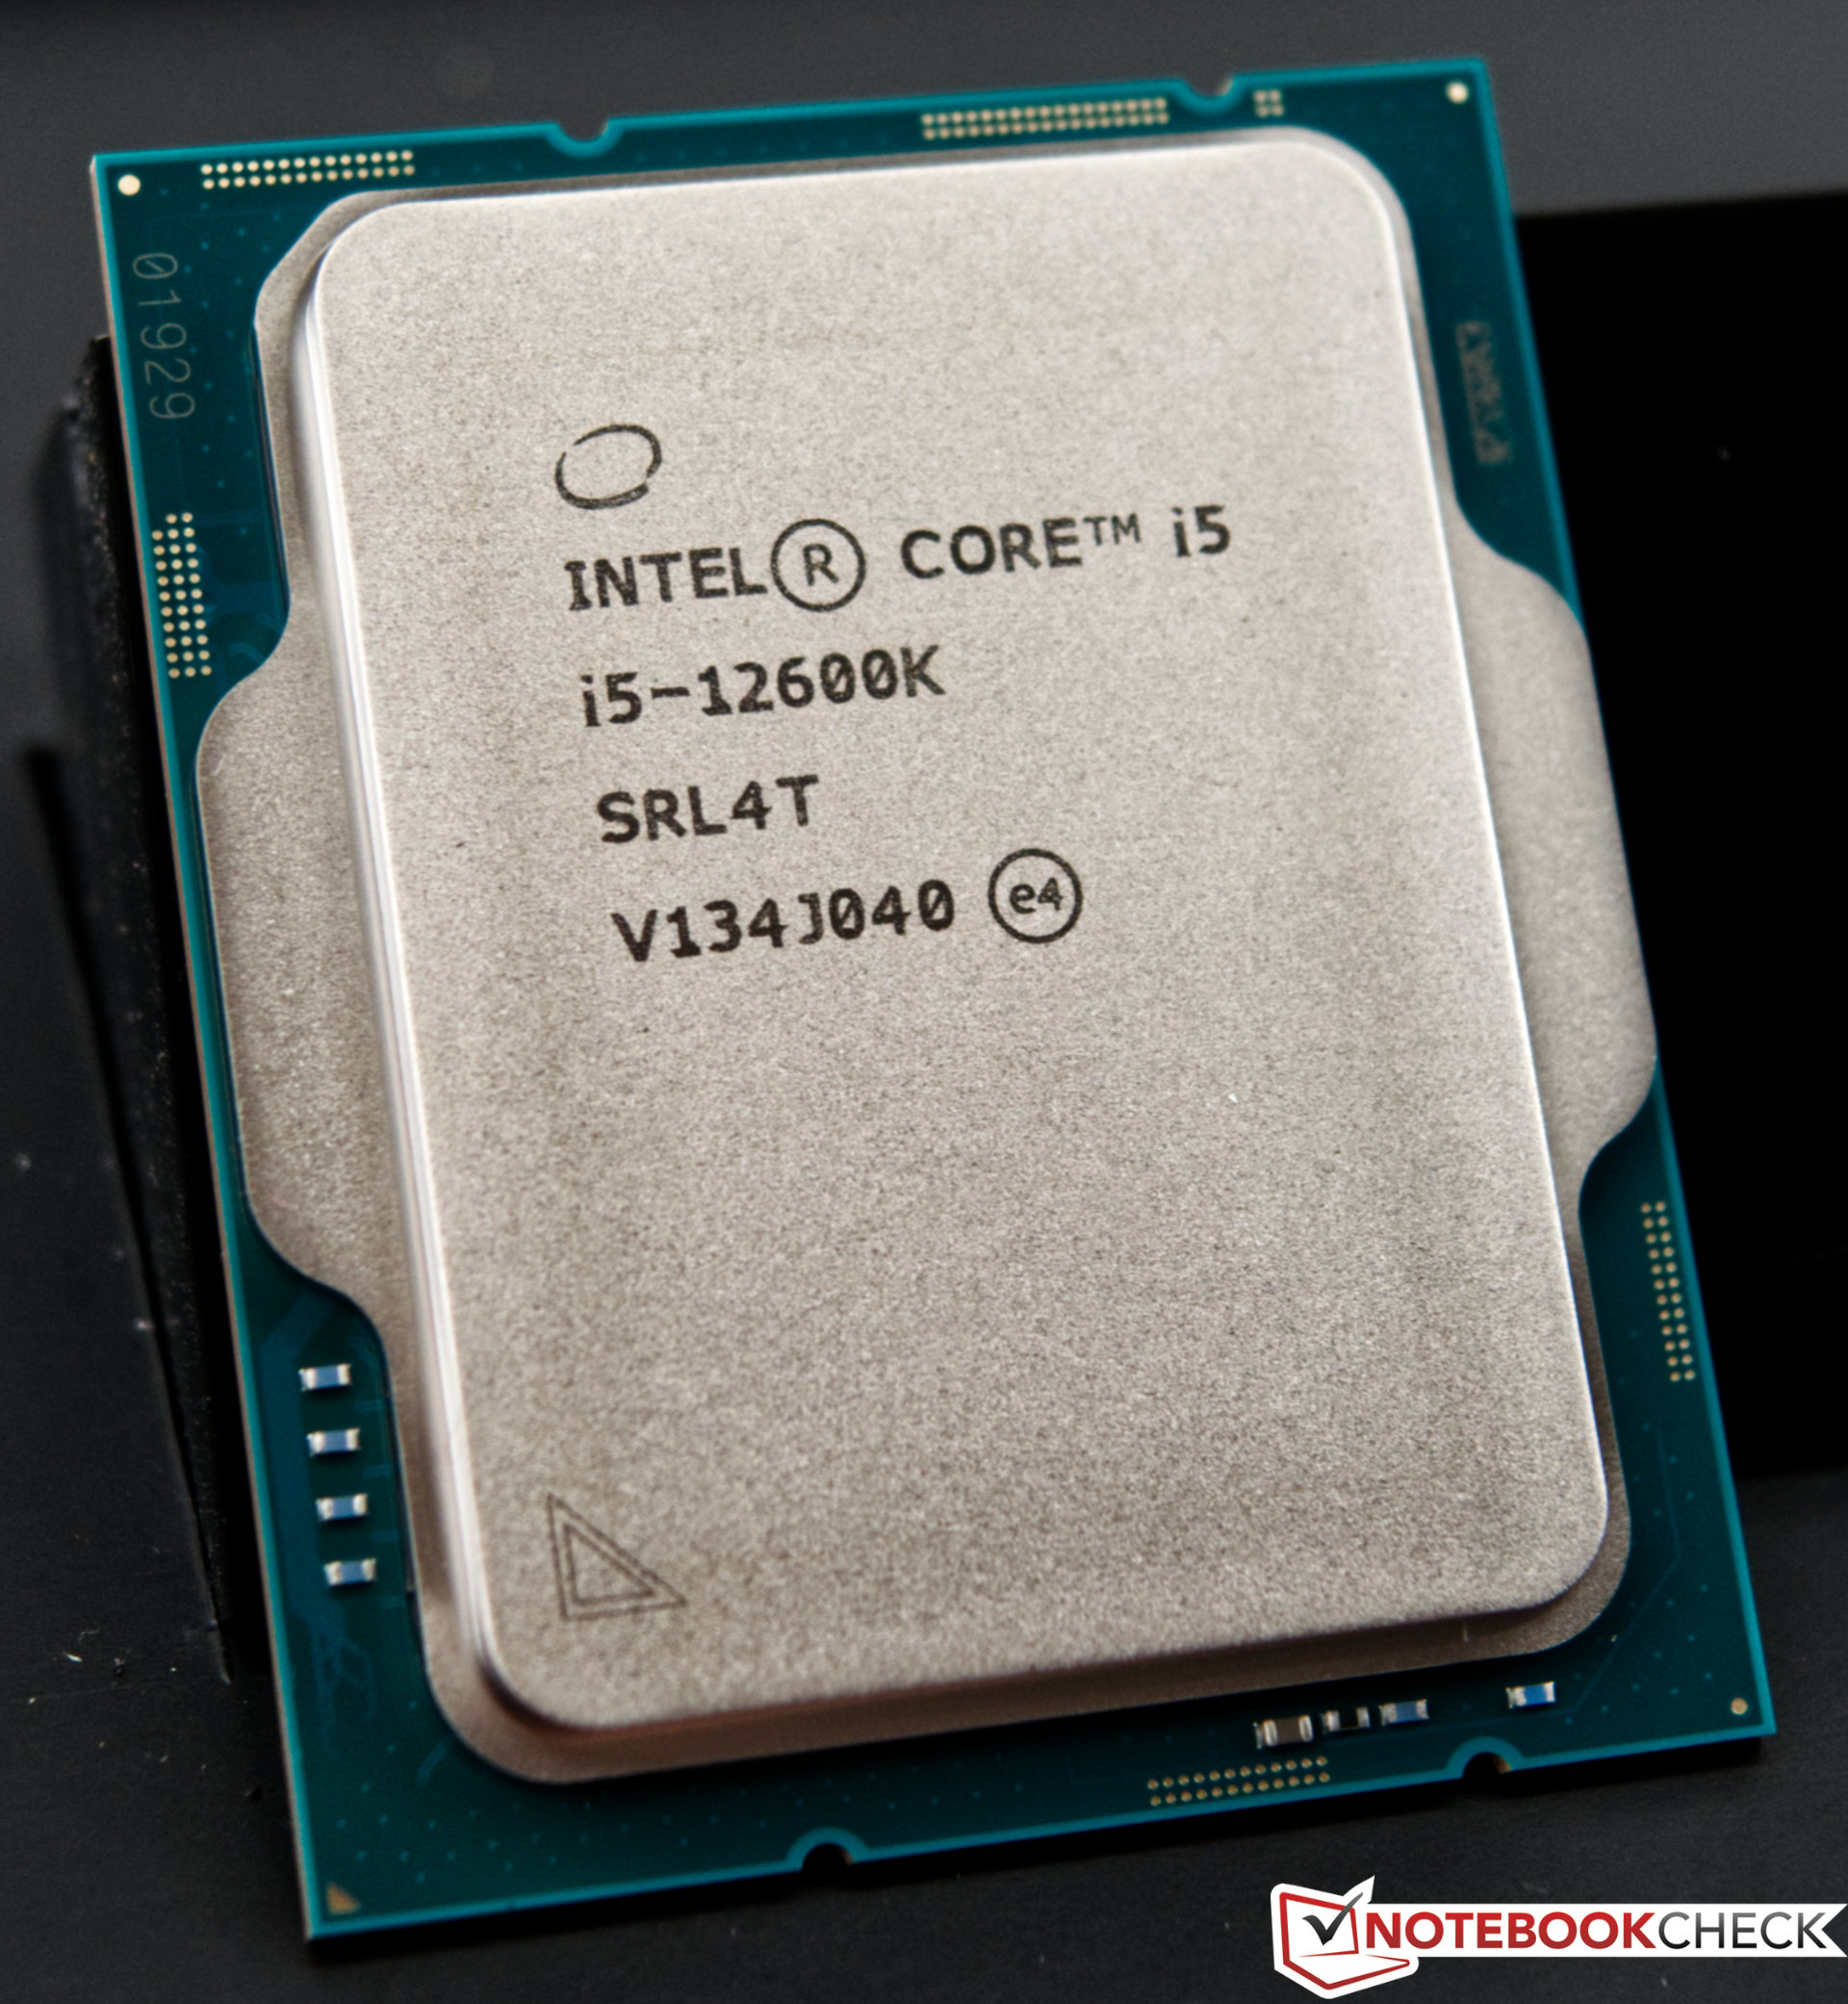
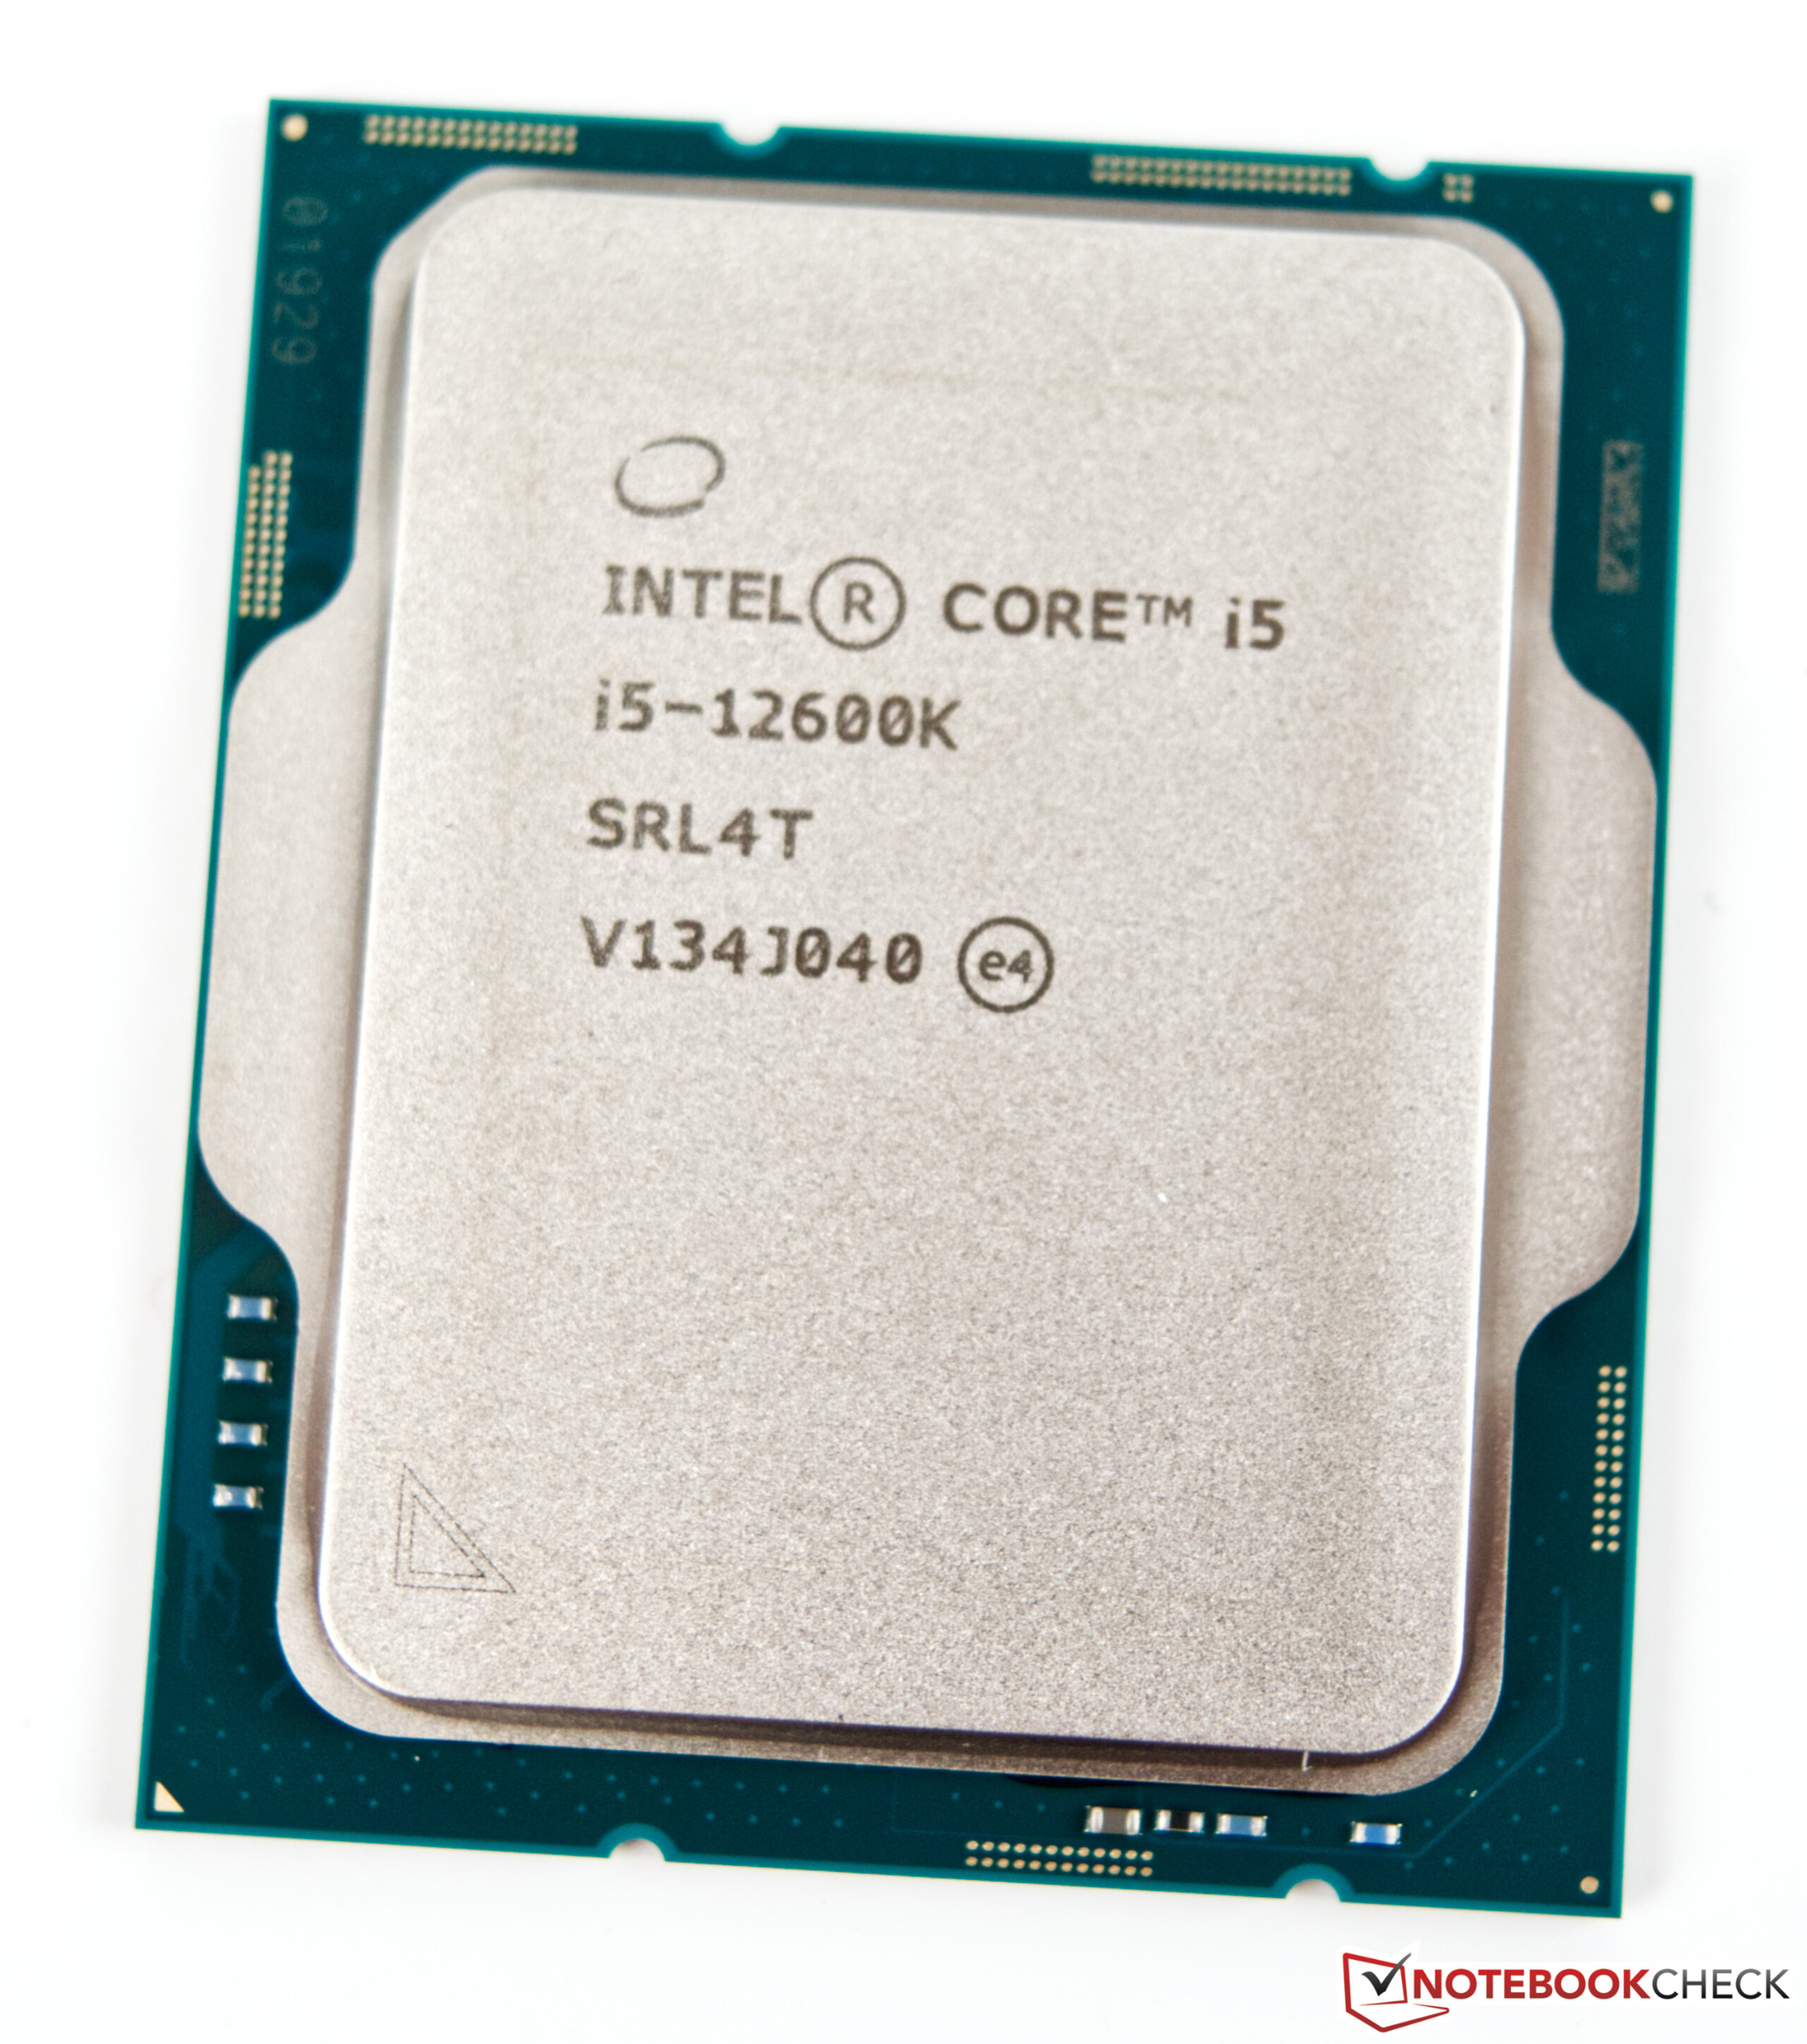
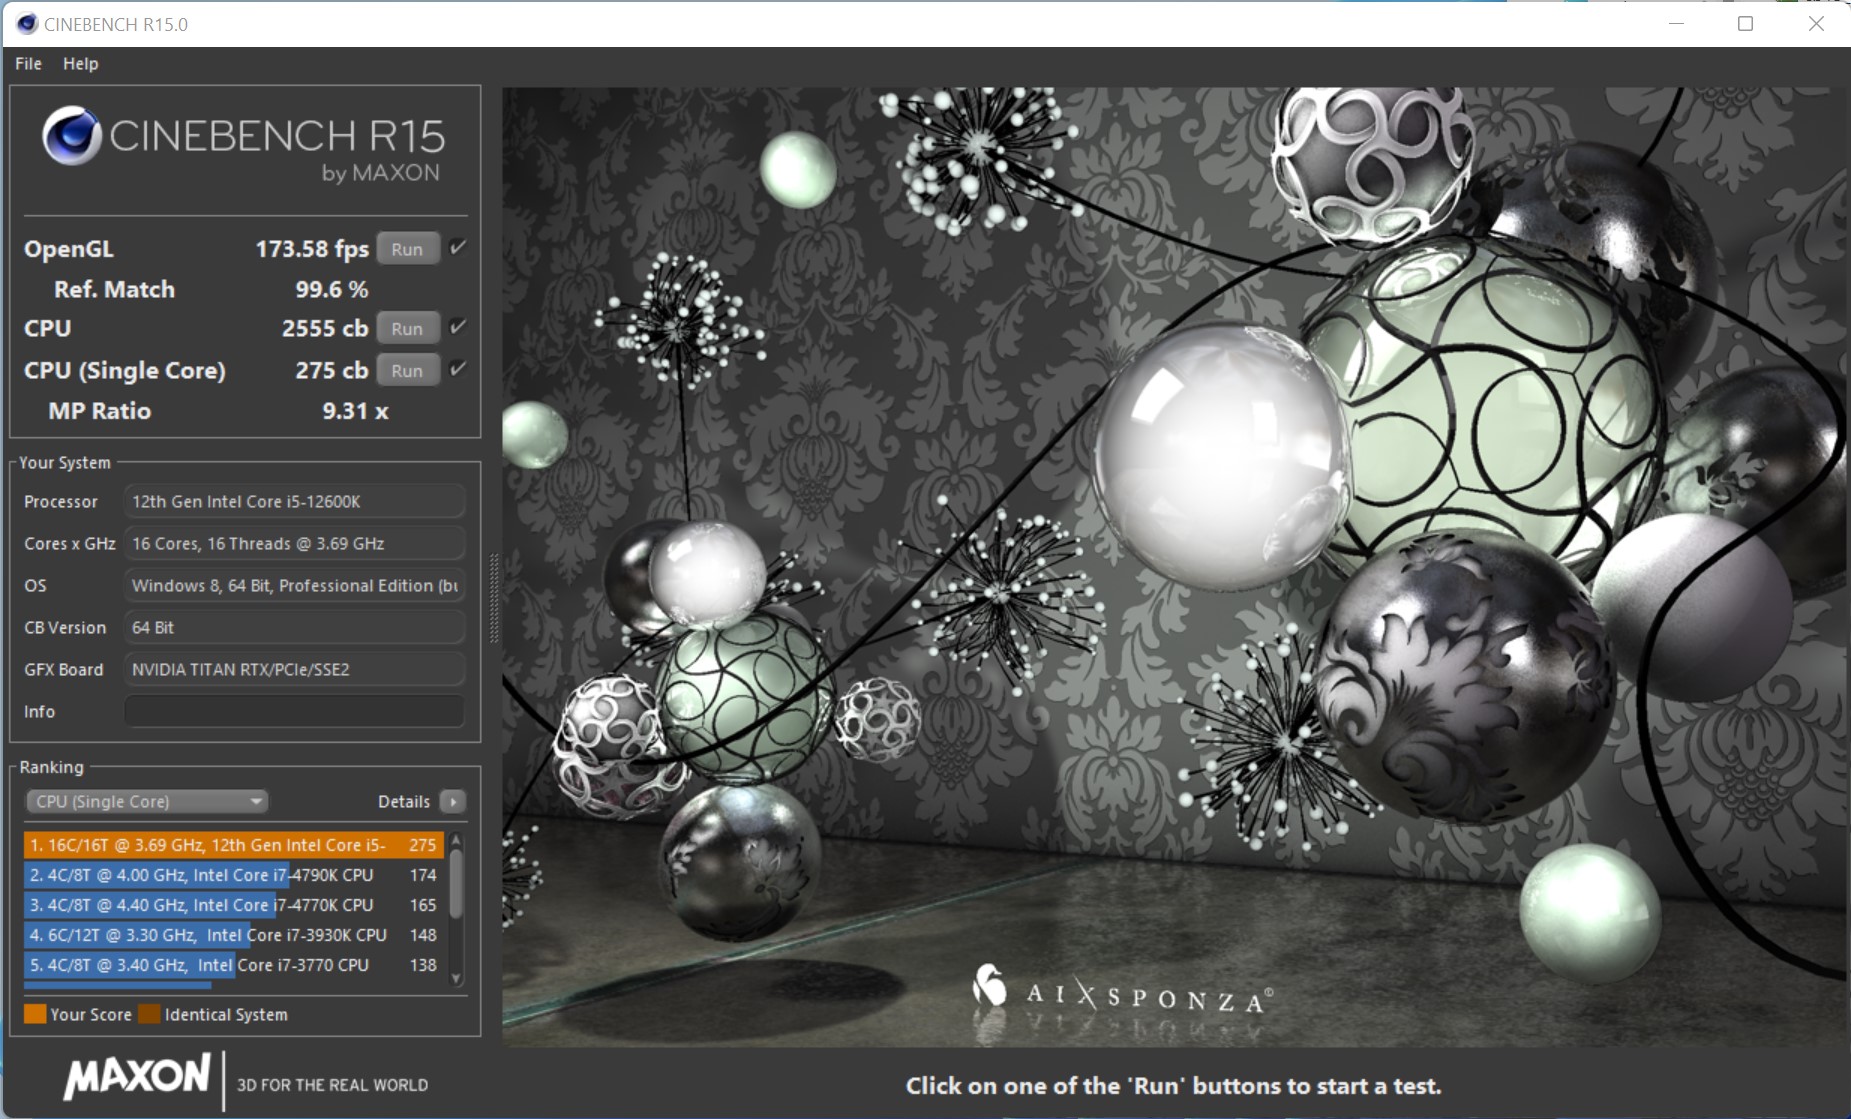
Intel Core i5-12600K

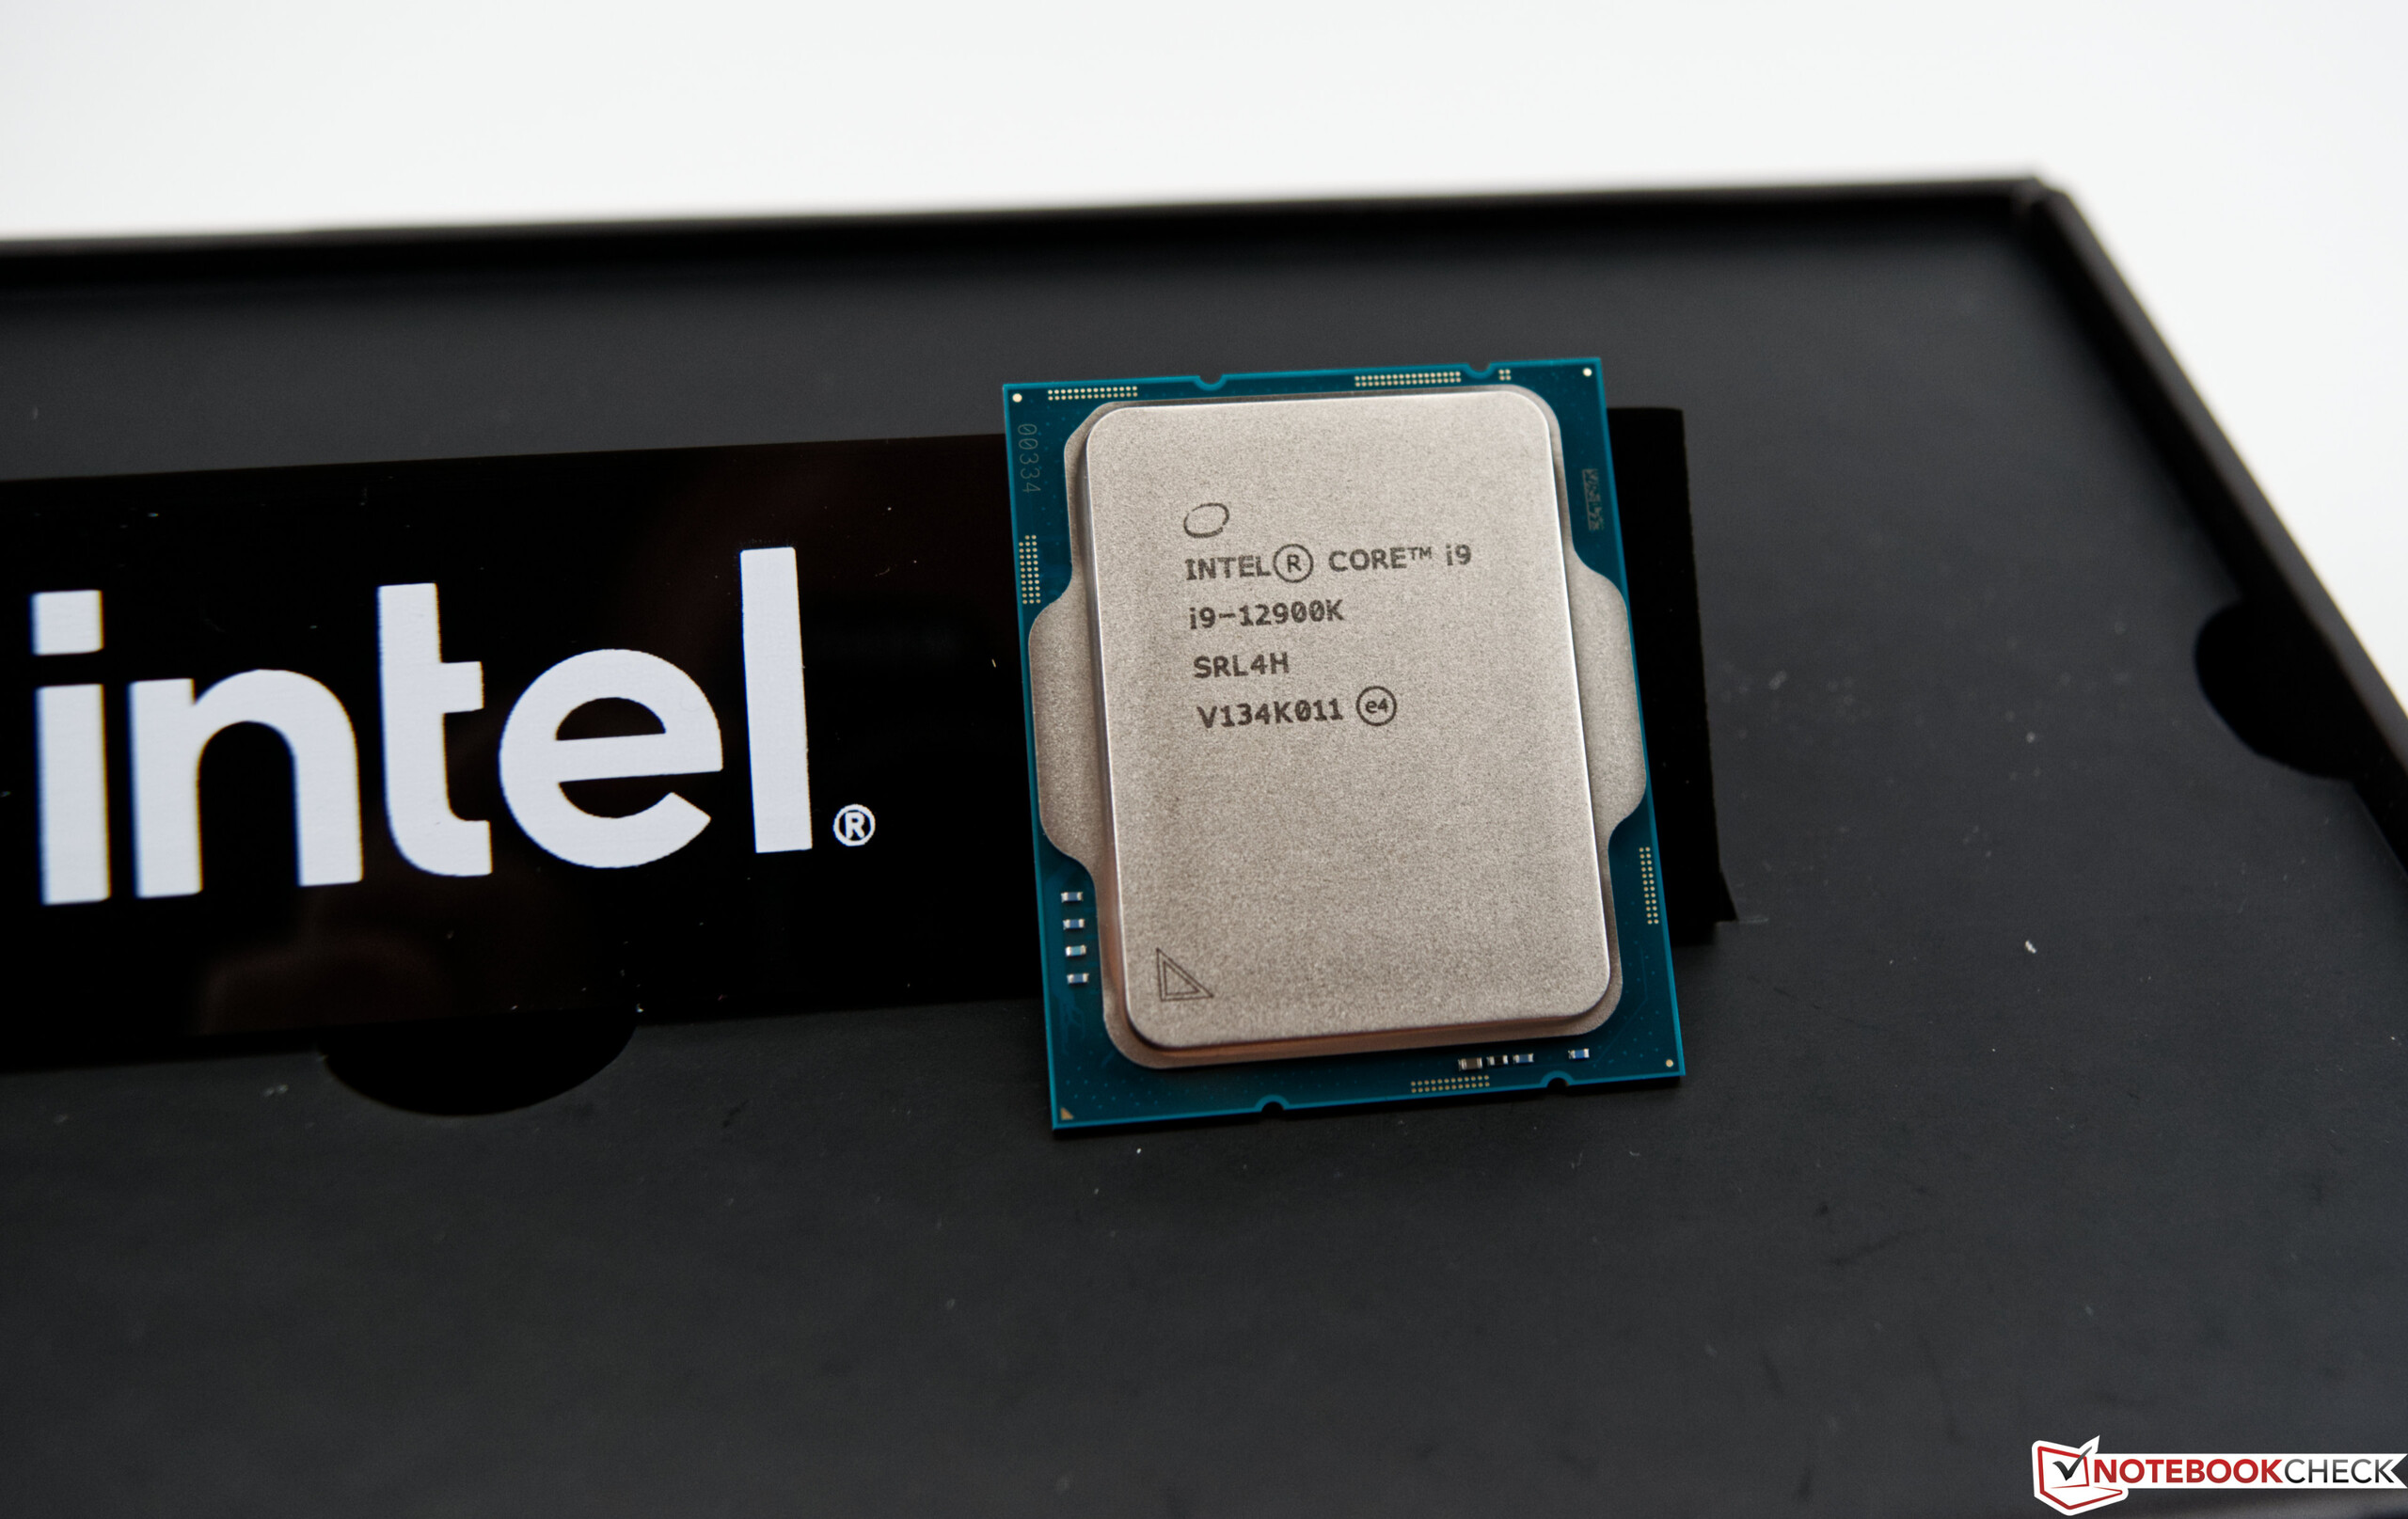
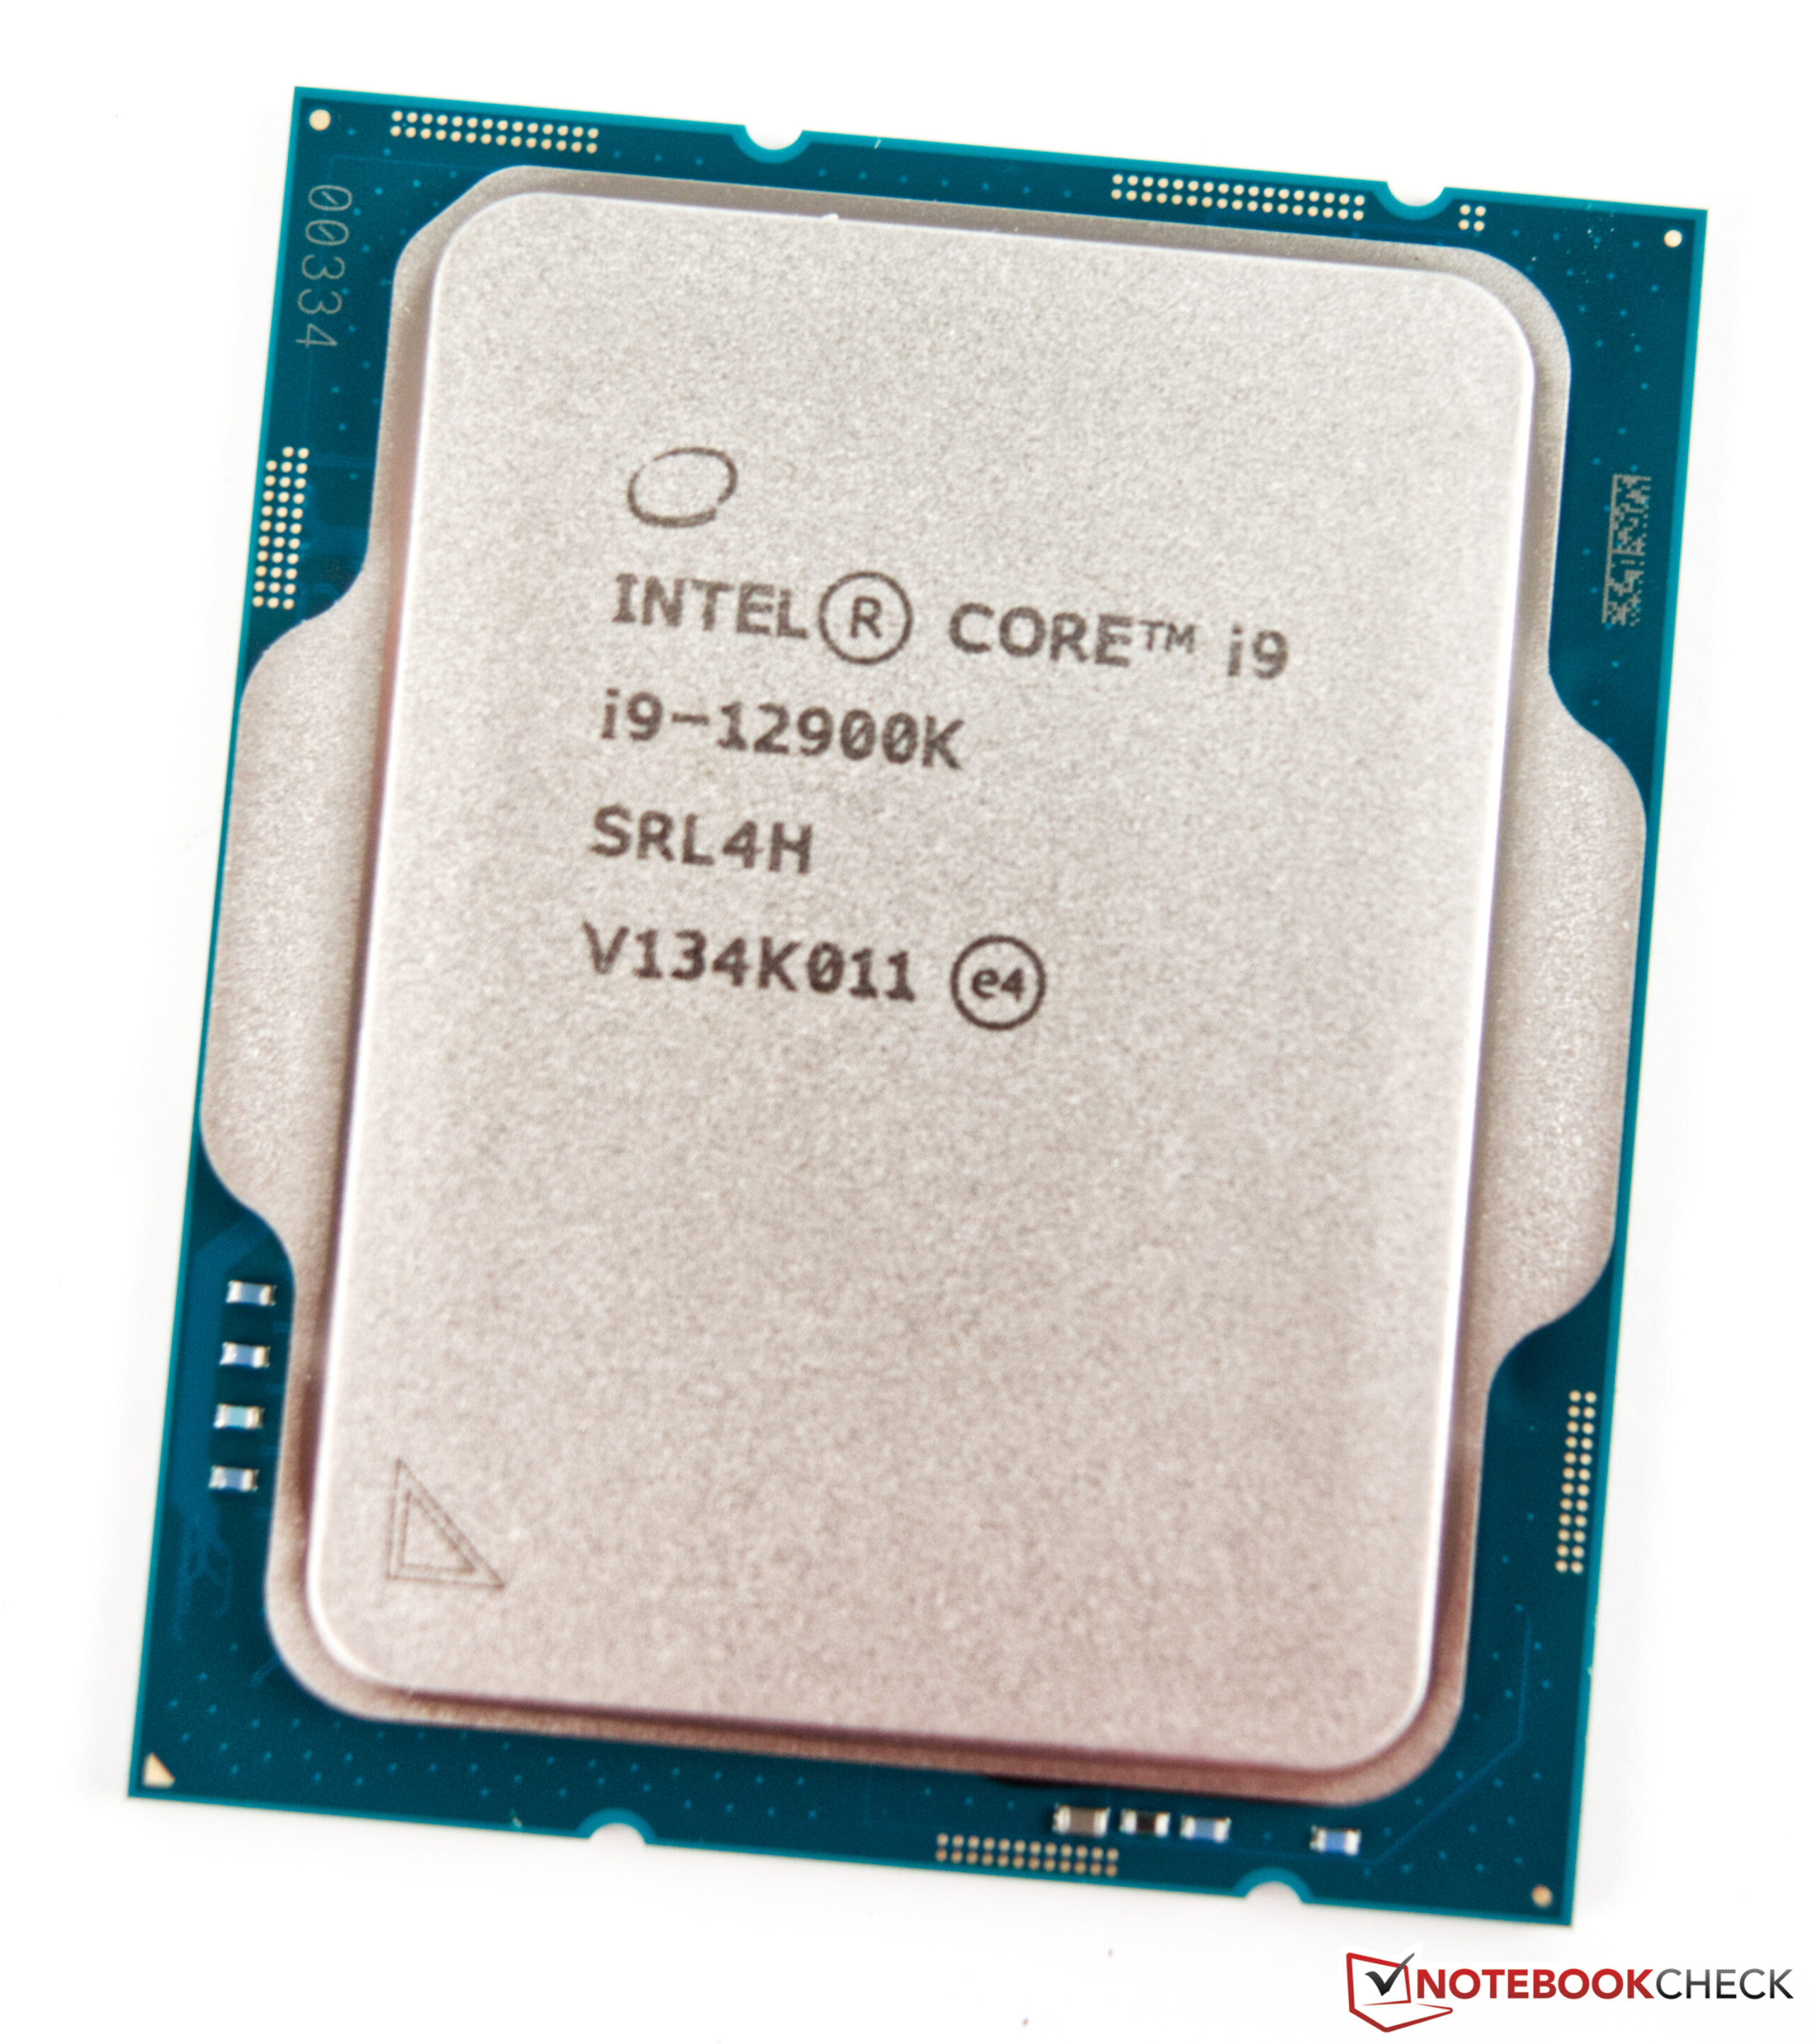
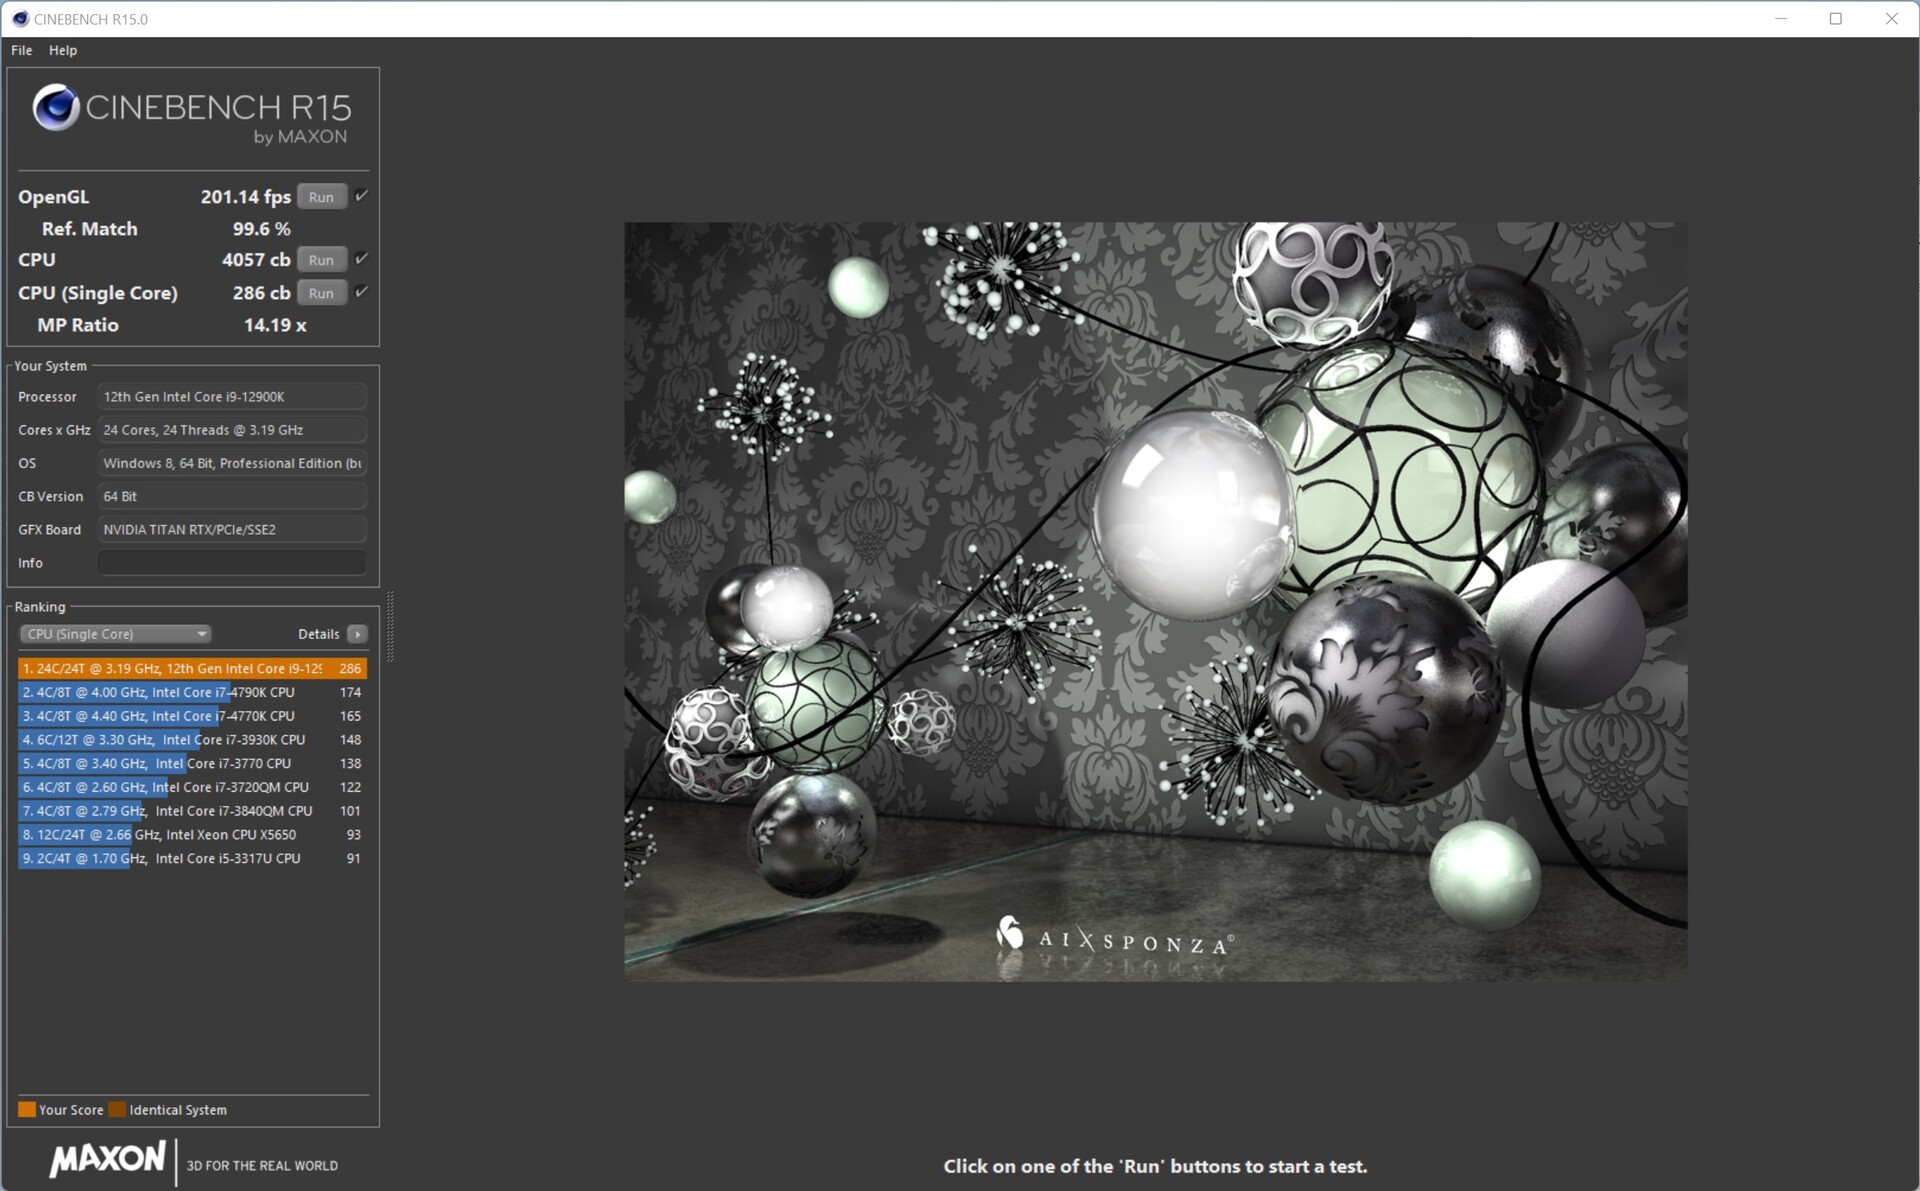
Intel Core i9-12900K
| Performance rating - Percent | |
| Intel Core i9-12900K | |
| AMD Ryzen 9 5950X | |
| Intel Core i5-12600K | |
| AMD Ryzen 9 5900X -2! | |
| AMD Ryzen 7 5800X | |
| Intel Core i9-11900K | |
| Intel Core i9-10900K | |
| AMD Ryzen 5 5600X | |
| Intel Core i5-11600K | |
| Intel Core i5-10600K | |
| Cinebench R15 | |
| CPU Single 64Bit | |
| Intel Core i9-12900K | |
| Intel Core i5-12600K | |
| AMD Ryzen 9 5950X | |
| AMD Ryzen 9 5900X | |
| AMD Ryzen 7 5800X | |
| Intel Core i9-11900K | |
| AMD Ryzen 5 5600X | |
| Intel Core i5-11600K | |
| Intel Core i9-10900K | |
| Intel Core i5-10600K | |
| CPU Multi 64Bit | |
| AMD Ryzen 9 5950X | |
| Intel Core i9-12900K | |
| AMD Ryzen 9 5900X | |
| Intel Core i9-10900K | |
| AMD Ryzen 7 5800X | |
| Intel Core i5-12600K | |
| Intel Core i9-11900K | |
| AMD Ryzen 5 5600X | |
| Intel Core i5-11600K | |
| Intel Core i5-10600K | |
| Cinebench R20 | |
| CPU (Single Core) | |
| Intel Core i9-12900K | |
| Intel Core i5-12600K | |
| Intel Core i9-11900K | |
| AMD Ryzen 9 5950X | |
| AMD Ryzen 9 5900X | |
| AMD Ryzen 7 5800X | |
| AMD Ryzen 5 5600X | |
| Intel Core i5-11600K | |
| Intel Core i9-10900K | |
| Intel Core i5-10600K | |
| CPU (Multi Core) | |
| AMD Ryzen 9 5950X | |
| Intel Core i9-12900K | |
| AMD Ryzen 9 5900X | |
| Intel Core i5-12600K | |
| Intel Core i9-10900K | |
| AMD Ryzen 7 5800X | |
| Intel Core i9-11900K | |
| AMD Ryzen 5 5600X | |
| Intel Core i5-11600K | |
| Intel Core i5-10600K | |
| Cinebench R23 | |
| Single Core | |
| Intel Core i9-12900K | |
| Intel Core i5-12600K | |
| Intel Core i9-11900K | |
| AMD Ryzen 9 5950X | |
| AMD Ryzen 9 5900X | |
| Intel Core i5-11600K | |
| AMD Ryzen 7 5800X | |
| AMD Ryzen 5 5600X | |
| Intel Core i5-10600K | |
| Intel Core i9-10900K | |
| Multi Core | |
| AMD Ryzen 9 5950X | |
| Intel Core i9-12900K | |
| AMD Ryzen 9 5900X | |
| Intel Core i5-12600K | |
| Intel Core i9-10900K | |
| Intel Core i9-11900K | |
| AMD Ryzen 7 5800X | |
| AMD Ryzen 5 5600X | |
| Intel Core i5-11600K | |
| Intel Core i5-10600K | |
| Cinebench R11.5 | |
| CPU Single 64Bit | |
| Intel Core i9-12900K | |
| Intel Core i5-12600K | |
| AMD Ryzen 9 5900X | |
| AMD Ryzen 9 5950X | |
| Intel Core i9-11900K | |
| AMD Ryzen 7 5800X | |
| AMD Ryzen 5 5600X | |
| Intel Core i5-11600K | |
| Intel Core i9-10900K | |
| Intel Core i5-10600K | |
| CPU Multi 64Bit | |
| AMD Ryzen 9 5950X | |
| Intel Core i9-12900K | |
| AMD Ryzen 9 5900X | |
| Intel Core i5-12600K | |
| AMD Ryzen 7 5800X | |
| Intel Core i9-10900K | |
| Intel Core i9-11900K | |
| AMD Ryzen 5 5600X | |
| Intel Core i5-11600K | |
| Intel Core i5-10600K | |
| Cinebench R10 | |
| Rendering Single CPUs 64Bit | |
| Intel Core i9-12900K | |
| Intel Core i5-12600K | |
| Intel Core i9-11900K | |
| AMD Ryzen 9 5950X | |
| AMD Ryzen 7 5800X | |
| Intel Core i5-11600K | |
| AMD Ryzen 9 5900X | |
| AMD Ryzen 5 5600X | |
| Intel Core i9-10900K | |
| Intel Core i5-10600K | |
| Rendering Multiple CPUs 64Bit | |
| Intel Core i9-12900K | |
| AMD Ryzen 9 5950X | |
| AMD Ryzen 9 5900X | |
| Intel Core i5-12600K | |
| AMD Ryzen 7 5800X | |
| Intel Core i9-11900K | |
| Intel Core i9-10900K | |
| AMD Ryzen 5 5600X | |
| Intel Core i5-11600K | |
| Intel Core i5-10600K | |
| Blender - v2.79 BMW27 CPU | |
| Intel Core i5-10600K | |
| Intel Core i5-11600K | |
| AMD Ryzen 5 5600X | |
| AMD Ryzen 7 5800X | |
| Intel Core i9-11900K | |
| Intel Core i5-12600K | |
| Intel Core i9-10900K | |
| AMD Ryzen 9 5900X | |
| Intel Core i9-12900K | |
| AMD Ryzen 9 5950X | |
| wPrime 2.10 | |
| 32m | |
| Intel Core i9-12900K | |
| Intel Core i5-11600K | |
| Intel Core i5-12600K | |
| Intel Core i5-10600K | |
| Intel Core i9-11900K | |
| AMD Ryzen 5 5600X | |
| Intel Core i9-10900K | |
| AMD Ryzen 7 5800X | |
| AMD Ryzen 9 5950X | |
| 1024m | |
| Intel Core i5-12600K | |
| Intel Core i9-12900K | |
| AMD Ryzen 5 5600X | |
| Intel Core i5-10600K | |
| Intel Core i5-11600K | |
| AMD Ryzen 7 5800X | |
| Intel Core i9-11900K | |
| Intel Core i9-10900K | |
| AMD Ryzen 9 5950X | |
| X264 HD Benchmark 4.0 | |
| Pass 1 | |
| Intel Core i9-12900K | |
| AMD Ryzen 7 5800X | |
| AMD Ryzen 9 5950X | |
| AMD Ryzen 9 5900X | |
| Intel Core i5-12600K | |
| AMD Ryzen 5 5600X | |
| Intel Core i9-11900K | |
| Intel Core i5-11600K | |
| Intel Core i9-10900K | |
| Intel Core i5-10600K | |
| Pass 2 | |
| AMD Ryzen 9 5950X | |
| Intel Core i9-12900K | |
| AMD Ryzen 9 5900X | |
| AMD Ryzen 7 5800X | |
| Intel Core i9-10900K | |
| Intel Core i5-12600K | |
| Intel Core i9-11900K | |
| AMD Ryzen 5 5600X | |
| Intel Core i5-11600K | |
| Intel Core i5-10600K | |
| WinRAR - Result | |
| AMD Ryzen 7 5800X | |
| AMD Ryzen 9 5900X | |
| AMD Ryzen 5 5600X | |
| AMD Ryzen 9 5950X | |
| Intel Core i9-12900K | |
| Intel Core i9-10900K | |
| Intel Core i9-11900K | |
| Intel Core i5-11600K | |
| Intel Core i5-10600K | |
| Intel Core i5-12600K | |
| TrueCrypt | |
| AES Mean 100MB | |
| AMD Ryzen 9 5950X | |
| AMD Ryzen 9 5900X | |
| Intel Core i9-12900K | |
| AMD Ryzen 7 5800X | |
| Intel Core i9-10900K | |
| Intel Core i9-11900K | |
| Intel Core i5-12600K | |
| AMD Ryzen 5 5600X | |
| Intel Core i5-11600K | |
| Intel Core i5-10600K | |
| Twofish Mean 100MB | |
| AMD Ryzen 9 5950X | |
| Intel Core i9-12900K | |
| AMD Ryzen 9 5900X | |
| Intel Core i9-10900K | |
| Intel Core i5-12600K | |
| AMD Ryzen 7 5800X | |
| Intel Core i9-11900K | |
| AMD Ryzen 5 5600X | |
| Intel Core i5-11600K | |
| Intel Core i5-10600K | |
| Serpent Mean 100MB | |
| AMD Ryzen 9 5950X | |
| Intel Core i9-12900K | |
| AMD Ryzen 9 5900X | |
| Intel Core i9-10900K | |
| AMD Ryzen 7 5800X | |
| Intel Core i5-12600K | |
| Intel Core i9-11900K | |
| AMD Ryzen 5 5600X | |
| Intel Core i5-11600K | |
| Intel Core i5-10600K | |
| Geekbench 5.5 | |
| Multi-Core | |
| Intel Core i9-12900K | |
| AMD Ryzen 9 5950X | |
| AMD Ryzen 9 5900X | |
| Intel Core i5-12600K | |
| Intel Core i9-10900K | |
| AMD Ryzen 7 5800X | |
| Intel Core i9-11900K | |
| AMD Ryzen 5 5600X | |
| Intel Core i5-11600K | |
| Intel Core i5-10600K | |
| Single-Core | |
| Intel Core i9-12900K | |
| Intel Core i5-12600K | |
| Intel Core i9-11900K | |
| Intel Core i5-11600K | |
| AMD Ryzen 9 5950X | |
| AMD Ryzen 9 5900X | |
| AMD Ryzen 7 5800X | |
| AMD Ryzen 5 5600X | |
| Intel Core i9-10900K | |
| Intel Core i5-10600K | |
| Geekbench 5.0 | |
| 5.0 Multi-Core | |
| Intel Core i9-12900K | |
| AMD Ryzen 9 5950X | |
| AMD Ryzen 9 5900X | |
| Intel Core i5-12600K | |
| Intel Core i9-10900K | |
| AMD Ryzen 7 5800X | |
| Intel Core i9-11900K | |
| AMD Ryzen 5 5600X | |
| Intel Core i5-11600K | |
| Intel Core i5-10600K | |
| 5.0 Single-Core | |
| Intel Core i9-12900K | |
| Intel Core i9-11900K | |
| Intel Core i5-12600K | |
| Intel Core i5-11600K | |
| AMD Ryzen 9 5950X | |
| AMD Ryzen 7 5800X | |
| AMD Ryzen 9 5900X | |
| AMD Ryzen 5 5600X | |
| Intel Core i9-10900K | |
| Intel Core i5-10600K | |
| Geekbench 4.4 | |
| 64 Bit Single-Core Score | |
| Intel Core i9-12900K | |
| Intel Core i5-12600K | |
| Intel Core i9-11900K | |
| Intel Core i5-11600K | |
| AMD Ryzen 7 5800X | |
| AMD Ryzen 9 5900X | |
| AMD Ryzen 9 5950X | |
| AMD Ryzen 5 5600X | |
| Intel Core i9-10900K | |
| Intel Core i5-10600K | |
| 64 Bit Multi-Core Score | |
| Intel Core i9-12900K | |
| AMD Ryzen 9 5950X | |
| AMD Ryzen 9 5900X | |
| Intel Core i5-12600K | |
| AMD Ryzen 7 5800X | |
| Intel Core i9-10900K | |
| Intel Core i9-11900K | |
| AMD Ryzen 5 5600X | |
| Intel Core i5-11600K | |
| Intel Core i5-10600K | |
| 3DMark 11 - 1280x720 Performance Physics | |
| Intel Core i9-12900K | |
| AMD Ryzen 9 5950X | |
| Intel Core i5-12600K | |
| AMD Ryzen 9 5900X | |
| AMD Ryzen 7 5800X | |
| Intel Core i9-10900K | |
| Intel Core i9-11900K | |
| AMD Ryzen 5 5600X | |
| Intel Core i5-11600K | |
| Intel Core i5-10600K | |
| 7-Zip 18.03 | |
| 7z b 4 | |
| AMD Ryzen 9 5950X | |
| Intel Core i9-12900K | |
| AMD Ryzen 9 5900X | |
| AMD Ryzen 7 5800X | |
| Intel Core i9-10900K | |
| Intel Core i5-12600K | |
| Intel Core i9-11900K | |
| AMD Ryzen 5 5600X | |
| Intel Core i5-11600K | |
| Intel Core i5-10600K | |
| 7z b 4 -mmt1 | |
| AMD Ryzen 9 5950X | |
| AMD Ryzen 7 5800X | |
| AMD Ryzen 9 5900X | |
| Intel Core i9-11900K | |
| AMD Ryzen 5 5600X | |
| Intel Core i9-12900K | |
| Intel Core i5-11600K | |
| Intel Core i9-10900K | |
| Intel Core i5-12600K | |
| Intel Core i5-10600K | |
| HWBOT x265 Benchmark v2.2 - 4k Preset | |
| AMD Ryzen 9 5950X | |
| Intel Core i5-12600K | |
| Intel Core i9-12900K | |
| AMD Ryzen 9 5900X | |
| Intel Core i9-10900K | |
| AMD Ryzen 7 5800X | |
| Intel Core i9-11900K | |
| AMD Ryzen 5 5600X | |
| Intel Core i5-11600K | |
| Intel Core i5-10600K | |
| R Benchmark 2.5 - Overall mean | |
| Intel Core i5-10600K | |
| Intel Core i9-10900K | |
| Intel Core i5-11600K | |
| AMD Ryzen 5 5600X | |
| Intel Core i9-11900K | |
| AMD Ryzen 9 5950X | |
| AMD Ryzen 9 5900X | |
| AMD Ryzen 7 5800X | |
| Intel Core i5-12600K | |
| Intel Core i9-12900K | |
| LibreOffice - 20 Documents To PDF | |
| Intel Core i9-10900K | |
| Intel Core i9-11900K | |
| Intel Core i5-12600K | |
| AMD Ryzen 9 5900X | |
| Intel Core i5-10600K | |
| AMD Ryzen 9 5950X | |
| AMD Ryzen 5 5600X | |
| AMD Ryzen 7 5800X | |
| Intel Core i9-12900K | |
| Intel Core i5-11600K | |
| WebXPRT 3 - Overall | |
| Intel Core i9-12900K | |
| AMD Ryzen 7 5800X | |
| Intel Core i5-12600K | |
| AMD Ryzen 9 5950X | |
| AMD Ryzen 5 5600X | |
| AMD Ryzen 9 5900X | |
| Intel Core i5-11600K | |
| Intel Core i9-10900K | |
| Intel Core i5-10600K | |
| Intel Core i9-11900K | |
| Mozilla Kraken 1.1 - Total | |
| Intel Core i5-10600K | |
| Intel Core i9-10900K | |
| Intel Core i5-11600K | |
| AMD Ryzen 5 5600X | |
| AMD Ryzen 9 5900X | |
| AMD Ryzen 7 5800X | |
| AMD Ryzen 9 5950X | |
| Intel Core i9-11900K | |
| Intel Core i5-12600K | |
| Intel Core i9-12900K | |
| 3DMark | |
| 3840x2160 Fire Strike Ultra Physics | |
| Intel Core i9-12900K | |
| AMD Ryzen 9 5950X | |
| AMD Ryzen 9 5900X | |
| AMD Ryzen 7 5800X | |
| Intel Core i5-12600K | |
| Intel Core i9-10900K | |
| Intel Core i9-11900K | |
| AMD Ryzen 5 5600X | |
| Intel Core i5-11600K | |
| Intel Core i5-10600K | |
| 1920x1080 Fire Strike Physics | |
| AMD Ryzen 9 5950X | |
| Intel Core i9-12900K | |
| AMD Ryzen 9 5900X | |
| AMD Ryzen 7 5800X | |
| Intel Core i9-10900K | |
| Intel Core i5-12600K | |
| Intel Core i9-11900K | |
| AMD Ryzen 5 5600X | |
| Intel Core i5-11600K | |
| Intel Core i5-10600K | |
| 2560x1440 Time Spy CPU | |
| Intel Core i9-12900K | |
| Intel Core i9-10900K | |
| Intel Core i5-12600K | |
| AMD Ryzen 9 5950X | |
| Intel Core i9-11900K | |
| AMD Ryzen 9 5900X | |
| AMD Ryzen 7 5800X | |
| Intel Core i5-11600K | |
| AMD Ryzen 5 5600X | |
| Intel Core i5-10600K | |
* ... menor é melhor
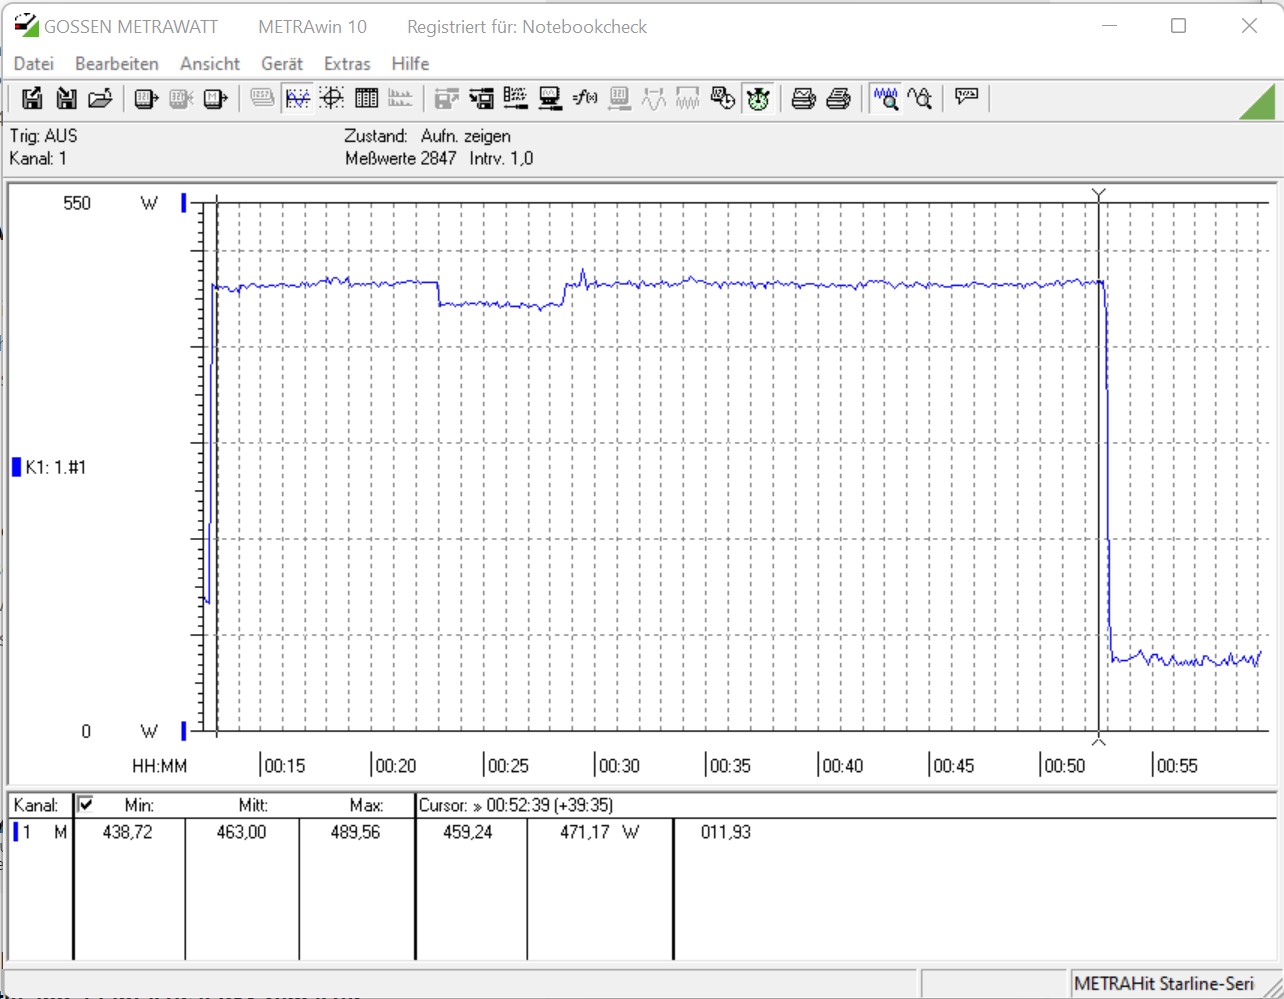
Alder Lake-S vs. Cinebench R15 Multi Loop
Ambas as nossas unidades de teste mostram um desempenho muito estável no teste de carga. Em comparação com oIntel Core i9-11900KO Intel Core i9-12900K é capaz de se mover para o primeiro lugar continuamente e sem qualquer queda de desempenho a uma média de 3987 pontos. O Intel Core i5-12600K também é capaz de se posicionar de forma estável à frente do Intel Core i5-11600Kpredecessor do foguetãoi5-11600Kcom uma vantagem significativa. A maior quantidade de núcleos de computação nativa garante esta diferença de desempenho em geral
Benchmarks Sintéticos e Desempenho de Aplicação
Nos benchmarks sintéticos, os novos processadores Alder Lake-S estão à frente. Além de poucas exceções em que a AMD deve oferecer a melhor plataforma, o Intel Core i9-12900K é capaz de alcançar uma vantagem sólida. Não é surpreendente então que as duas CPUs Alder Lake-S compartilhem os dois primeiros lugares nos dois resultados cumulativos dos benchmarks. Entretanto, ainda ficamos um pouco surpresos, já que não esperávamos o segundo lugar para o Intel Core i5-12600K no ranking geral.
| Performance rating - Percent | |
| Intel Core i9-12900K | |
| Intel Core i5-12600K | |
| AMD Ryzen 7 5800X | |
| AMD Ryzen 9 5950X | |
| AMD Ryzen 5 5600X | |
| AMD Ryzen 9 5900X | |
| Intel Core i9-11900K | |
| Intel Core i9-10900K | |
| Intel Core i5-11600K | |
| Intel Core i7-10700K | |
| Intel Core i5-10600K | |
| 3DMark | |
| 1920x1080 Fire Strike Physics | |
| AMD Ryzen 9 5950X | |
| Intel Core i9-12900K | |
| AMD Ryzen 9 5900X | |
| AMD Ryzen 7 5800X | |
| Intel Core i9-10900K | |
| Intel Core i5-12600K | |
| Intel Core i9-11900K | |
| AMD Ryzen 5 5600X | |
| Intel Core i7-10700K | |
| Intel Core i5-11600K | |
| Intel Core i5-10600K | |
| 1920x1080 Fire Strike Graphics | |
| Intel Core i5-12600K | |
| Intel Core i9-12900K | |
| Intel Core i7-10700K | |
| Intel Core i5-11600K | |
| AMD Ryzen 7 5800X | |
| Intel Core i9-10900K | |
| Intel Core i9-11900K | |
| AMD Ryzen 9 5950X | |
| AMD Ryzen 5 5600X | |
| Intel Core i5-10600K | |
| AMD Ryzen 9 5900X | |
| Fire Strike Extreme Graphics | |
| Intel Core i5-12600K | |
| Intel Core i9-12900K | |
| Intel Core i5-11600K | |
| AMD Ryzen 5 5600X | |
| Intel Core i7-10700K | |
| Intel Core i9-11900K | |
| AMD Ryzen 9 5950X | |
| AMD Ryzen 7 5800X | |
| Intel Core i9-10900K | |
| AMD Ryzen 9 5900X | |
| Intel Core i5-10600K | |
| 3840x2160 Fire Strike Ultra Graphics | |
| Intel Core i5-12600K | |
| Intel Core i9-12900K | |
| Intel Core i5-11600K | |
| Intel Core i9-11900K | |
| AMD Ryzen 7 5800X | |
| AMD Ryzen 5 5600X | |
| Intel Core i7-10700K | |
| AMD Ryzen 9 5950X | |
| Intel Core i9-10900K | |
| AMD Ryzen 9 5900X | |
| Intel Core i5-10600K | |
| 3DMark 11 | |
| 1280x720 Performance GPU | |
| Intel Core i7-10700K | |
| Intel Core i5-12600K | |
| Intel Core i9-10900K | |
| AMD Ryzen 9 5950X | |
| AMD Ryzen 7 5800X | |
| Intel Core i9-12900K | |
| AMD Ryzen 5 5600X | |
| Intel Core i9-11900K | |
| Intel Core i5-10600K | |
| Intel Core i5-11600K | |
| AMD Ryzen 9 5900X | |
| 1280x720 Performance Physics | |
| Intel Core i9-12900K | |
| AMD Ryzen 9 5950X | |
| Intel Core i5-12600K | |
| AMD Ryzen 9 5900X | |
| AMD Ryzen 7 5800X | |
| Intel Core i9-10900K | |
| Intel Core i9-11900K | |
| AMD Ryzen 5 5600X | |
| Intel Core i7-10700K | |
| Intel Core i5-11600K | |
| Intel Core i5-10600K | |
| PCMark 10 - Score | |
| AMD Ryzen 9 5950X | |
| Intel Core i9-12900K | |
| AMD Ryzen 9 5900X | |
| AMD Ryzen 5 5600X | |
| Intel Core i5-12600K | |
| AMD Ryzen 7 5800X | |
| Intel Core i9-11900K | |
| Intel Core i5-11600K | |
| Intel Core i9-10900K | |
| Intel Core i7-10700K | |
| Intel Core i5-10600K | |
Benchmarks de jogos
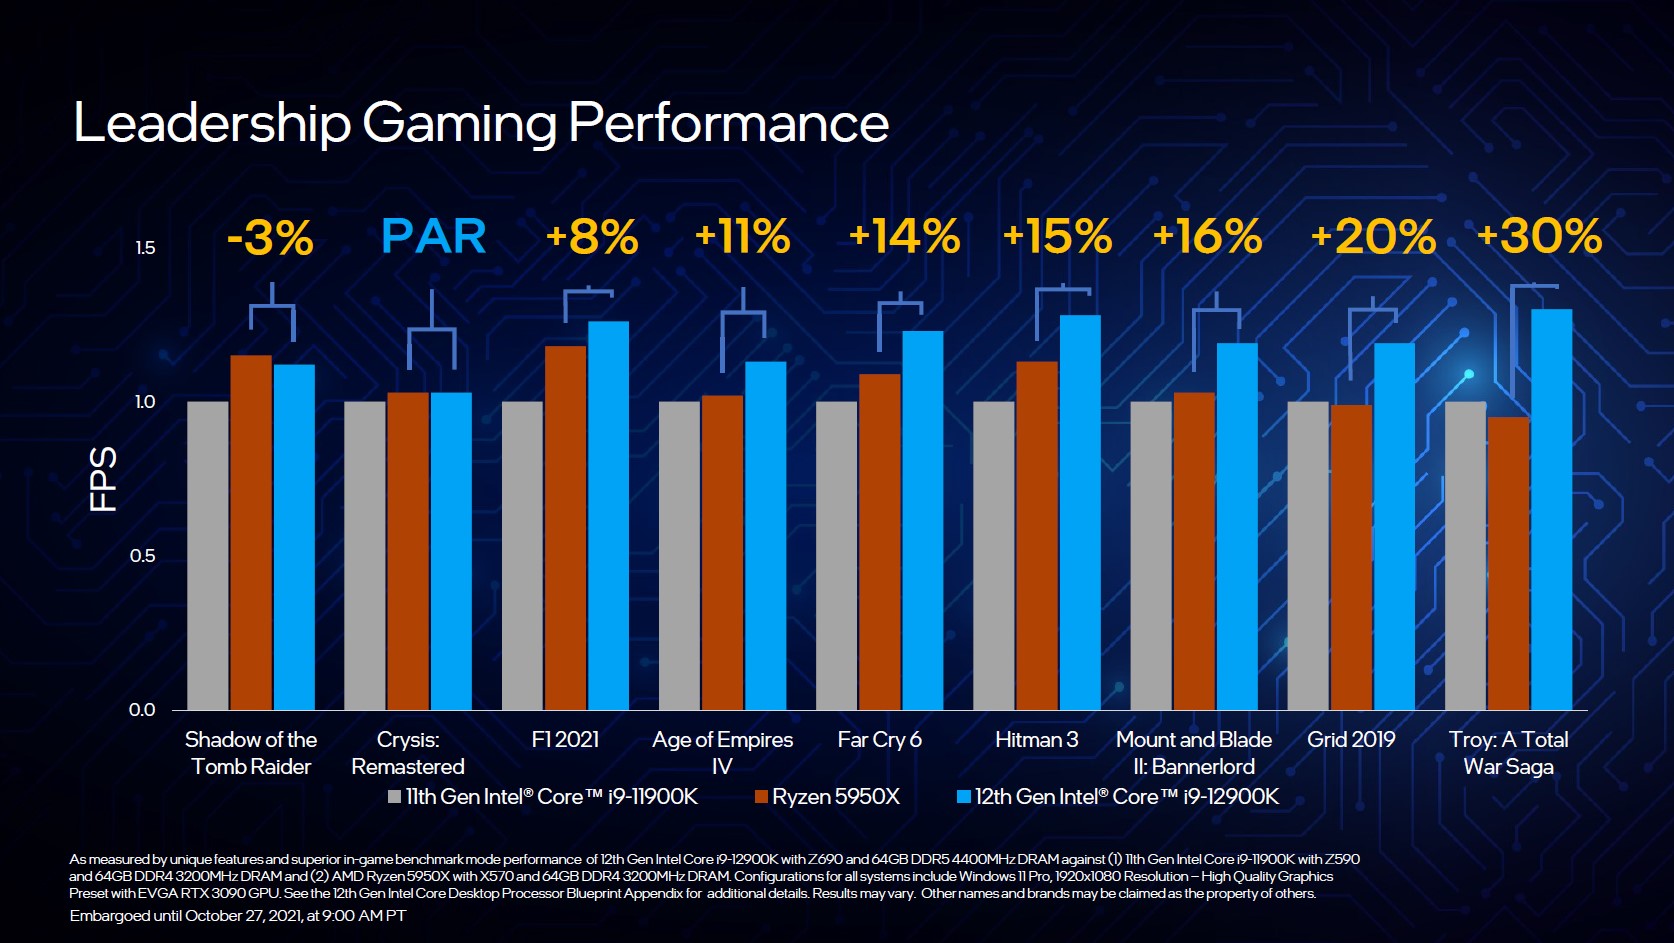
Agora estamos chegando aos pontos de referência mais interessantes e à disciplina onde os novos processadores Intel Alder Lake-S podem realmente mostrar suas capacidades. Em comparação com o Rocket Lake-S, os novos processadores são capazes de aumentar significativamente seu desempenho, como você pode ver nos benchmarks de jogos. Na comparação cumulativa dos nove jogos, o Intel Core i9-12900K é capaz de apenas avançar à frente do AMD Ryzen 9 5900X. Você também tem que saber aqui que existem alguns jogos que se harmonizam melhor com processadores Intel e outros que oferecem o melhor desempenho com processadores AMD. Na competição interna dos dois processadores Alder Lake-S, o Intel Core i5-12600K perde em 8 pontos percentuais contra o carro-chefe, acabando logo à frente do Intel Core i5-11600Kcom isto.
No entanto, ambos os processadores oferecem um desempenho muito bom nos jogos. Devido às muitas mudanças na plataforma e no sistema operacional, também podemos esperar mais algumas melhorias de desempenho na forma de atualizações no futuro. Mas não há garantia disso. O desempenho no limite da CPU pura é muito alto e, dependendo do jogo, também está significativamente à frente dos concorrentes. Entretanto, ainda temos que observar que embora a Intel tenha a CPU de jogo mais rápida em seu portfólio aqui, a distância em relação ao processador Zen3 não pode ser chamada de excelente. Além disso, todos os concorrentes se aproximam com uma resolução crescente, de modo que a CPU só joga o segundo violino atrás da GPU como fator determinante para o aumento do FPS. Aqueles que também transmitem conteúdo além dos jogos reais lucrarão com a maior quantidade de fios, o que também tornará os novos modelos muito interessantes para os criadores de conteúdo.
| Performance rating - Percent | |
| Intel Core i9-12900K | |
| AMD Ryzen 9 5900X -2! | |
| AMD Ryzen 7 5800X -2! | |
| AMD Ryzen 9 5950X -2! | |
| AMD Ryzen 5 5600X -2! | |
| Intel Core i9-11900K | |
| Intel Core i5-12600K | |
| Intel Core i5-11600K | |
| Intel Core i9-10900K | |
| Intel Core i7-10700K -4! | |
| Intel Core i5-10600K | |
| Borderlands 3 | |
| 1280x720 Very Low Overall Quality (DX11) | |
| AMD Ryzen 9 5900X | |
| AMD Ryzen 7 5800X | |
| AMD Ryzen 9 5950X | |
| AMD Ryzen 5 5600X | |
| Intel Core i9-12900K | |
| Intel Core i9-11900K | |
| Intel Core i9-10900K | |
| Intel Core i5-11600K | |
| Intel Core i7-10700K | |
| Intel Core i5-12600K | |
| Intel Core i5-10600K | |
| 1920x1080 Badass Overall Quality (DX11) | |
| Intel Core i9-12900K | |
| Intel Core i5-12600K | |
| AMD Ryzen 9 5900X | |
| Intel Core i9-11900K | |
| Intel Core i9-10900K | |
| Intel Core i7-10700K | |
| AMD Ryzen 9 5950X | |
| Intel Core i5-11600K | |
| AMD Ryzen 7 5800X | |
| AMD Ryzen 5 5600X | |
| Intel Core i5-10600K | |
| Far Cry New Dawn | |
| 1280x720 Low Preset | |
| Intel Core i9-12900K | |
| Intel Core i9-11900K | |
| AMD Ryzen 9 5900X | |
| Intel Core i5-12600K | |
| Intel Core i5-11600K | |
| AMD Ryzen 7 5800X | |
| AMD Ryzen 9 5950X | |
| Intel Core i7-10700K | |
| AMD Ryzen 5 5600X | |
| Intel Core i9-10900K | |
| Intel Core i5-10600K | |
| 1920x1080 Ultra Preset | |
| Intel Core i9-12900K | |
| Intel Core i9-11900K | |
| AMD Ryzen 9 5900X | |
| Intel Core i5-11600K | |
| Intel Core i7-10700K | |
| Intel Core i5-12600K | |
| AMD Ryzen 7 5800X | |
| AMD Ryzen 9 5950X | |
| AMD Ryzen 5 5600X | |
| Intel Core i5-10600K | |
| Intel Core i9-10900K | |
| Forza Horizon 4 | |
| 1280x720 Very Low Preset | |
| Intel Core i9-12900K | |
| Intel Core i5-12600K | |
| Intel Core i9-11900K | |
| Intel Core i9-10900K | |
| Intel Core i5-11600K | |
| Intel Core i5-10600K | |
| 1920x1080 Ultra Preset AA:2xMS | |
| Intel Core i9-10900K | |
| Intel Core i9-11900K | |
| Intel Core i5-11600K | |
| Intel Core i5-10600K | |
| Intel Core i9-12900K | |
| Intel Core i5-12600K | |
| Far Cry 5 | |
| 1280x720 Low Preset AA:T | |
| Intel Core i9-12900K | |
| AMD Ryzen 9 5900X | |
| Intel Core i9-11900K | |
| AMD Ryzen 7 5800X | |
| AMD Ryzen 9 5950X | |
| AMD Ryzen 5 5600X | |
| Intel Core i5-12600K | |
| Intel Core i5-11600K | |
| Intel Core i9-10900K | |
| Intel Core i7-10700K | |
| Intel Core i5-10600K | |
| 1920x1080 Ultra Preset AA:T | |
| Intel Core i9-12900K | |
| Intel Core i9-11900K | |
| AMD Ryzen 9 5900X | |
| AMD Ryzen 7 5800X | |
| Intel Core i5-11600K | |
| AMD Ryzen 9 5950X | |
| Intel Core i5-12600K | |
| AMD Ryzen 5 5600X | |
| Intel Core i7-10700K | |
| Intel Core i9-10900K | |
| Intel Core i5-10600K | |
| X-Plane 11.11 | |
| 1280x720 low (fps_test=1) | |
| Intel Core i9-12900K | |
| AMD Ryzen 7 5800X | |
| AMD Ryzen 9 5900X | |
| AMD Ryzen 5 5600X | |
| Intel Core i5-12600K | |
| Intel Core i9-11900K | |
| AMD Ryzen 9 5950X | |
| Intel Core i5-11600K | |
| Intel Core i9-10900K | |
| Intel Core i7-10700K | |
| Intel Core i5-10600K | |
| 1920x1080 high (fps_test=3) | |
| Intel Core i9-12900K | |
| AMD Ryzen 9 5900X | |
| AMD Ryzen 7 5800X | |
| Intel Core i9-11900K | |
| AMD Ryzen 5 5600X | |
| Intel Core i5-12600K | |
| AMD Ryzen 9 5950X | |
| Intel Core i5-11600K | |
| Intel Core i9-10900K | |
| Intel Core i7-10700K | |
| Intel Core i5-10600K | |
| Final Fantasy XV Benchmark | |
| 1280x720 Lite Quality | |
| Intel Core i9-12900K | |
| AMD Ryzen 9 5900X | |
| AMD Ryzen 7 5800X | |
| AMD Ryzen 9 5950X | |
| AMD Ryzen 5 5600X | |
| Intel Core i9-10900K | |
| Intel Core i9-11900K | |
| Intel Core i5-12600K | |
| Intel Core i5-11600K | |
| Intel Core i5-10600K | |
| Intel Core i7-10700K | |
| 1920x1080 High Quality | |
| Intel Core i9-12900K | |
| Intel Core i9-11900K | |
| Intel Core i9-10900K | |
| AMD Ryzen 9 5950X | |
| Intel Core i5-11600K | |
| Intel Core i5-12600K | |
| Intel Core i5-10600K | |
| AMD Ryzen 7 5800X | |
| AMD Ryzen 9 5900X | |
| AMD Ryzen 5 5600X | |
| Intel Core i7-10700K | |
| Dota 2 Reborn | |
| 1280x720 min (0/3) fastest | |
| AMD Ryzen 7 5800X | |
| AMD Ryzen 9 5900X | |
| AMD Ryzen 5 5600X | |
| AMD Ryzen 9 5950X | |
| Intel Core i9-12900K | |
| Intel Core i9-10900K | |
| Intel Core i9-11900K | |
| Intel Core i7-10700K | |
| Intel Core i5-11600K | |
| Intel Core i5-12600K | |
| Intel Core i5-10600K | |
| 1920x1080 ultra (3/3) best looking | |
| Intel Core i9-12900K | |
| AMD Ryzen 7 5800X | |
| AMD Ryzen 9 5900X | |
| AMD Ryzen 5 5600X | |
| AMD Ryzen 9 5950X | |
| Intel Core i5-12600K | |
| Intel Core i9-10900K | |
| Intel Core i9-11900K | |
| Intel Core i5-11600K | |
| Intel Core i7-10700K | |
| Intel Core i5-10600K | |
| The Witcher 3 | |
| 1024x768 Low Graphics & Postprocessing | |
| AMD Ryzen 9 5900X | |
| AMD Ryzen 7 5800X | |
| AMD Ryzen 9 5950X | |
| Intel Core i9-12900K | |
| AMD Ryzen 5 5600X | |
| Intel Core i9-10900K | |
| Intel Core i9-11900K | |
| Intel Core i5-12600K | |
| Intel Core i7-10700K | |
| Intel Core i5-11600K | |
| Intel Core i5-10600K | |
| 1920x1080 Ultra Graphics & Postprocessing (HBAO+) | |
| Intel Core i5-11600K | |
| Intel Core i5-12600K | |
| Intel Core i7-10700K | |
| AMD Ryzen 9 5900X | |
| AMD Ryzen 9 5950X | |
| Intel Core i5-10600K | |
| Intel Core i9-11900K | |
| Intel Core i9-10900K | |
| AMD Ryzen 7 5800X | |
| AMD Ryzen 5 5600X | |
| Intel Core i9-12900K | |
| Shadow of the Tomb Raider | |
| 1280x720 Lowest Preset | |
| AMD Ryzen 7 5800X | |
| AMD Ryzen 9 5950X | |
| AMD Ryzen 9 5900X | |
| Intel Core i9-12900K | |
| AMD Ryzen 5 5600X | |
| Intel Core i9-10900K | |
| Intel Core i9-11900K | |
| Intel Core i5-12600K | |
| Intel Core i5-11600K | |
| Intel Core i5-10600K | |
| 1920x1080 Highest Preset AA:T | |
| AMD Ryzen 7 5800X | |
| Intel Core i9-12900K | |
| Intel Core i9-11900K | |
| AMD Ryzen 9 5950X | |
| AMD Ryzen 9 5900X | |
| Intel Core i9-10900K | |
| AMD Ryzen 5 5600X | |
| Intel Core i5-12600K | |
| Intel Core i5-11600K | |
| Intel Core i5-10600K | |
Intel Core i9-12900K + Nvidia Titan RTX
| baixo | média | alto | ultra | QHD | 4K | |
|---|---|---|---|---|---|---|
| GTA V (2015) | 187 | 187 | 185 | 135 | 123 | 138 |
| The Witcher 3 (2015) | 589 | 422 | 271 | 139 | 103 | |
| Dota 2 Reborn (2015) | 203.5 | 208.7 | 201.7 | 189.7 | 178.9 | |
| Final Fantasy XV Benchmark (2018) | 227 | 195 | 144 | 108 | 64.1 | |
| X-Plane 11.11 (2018) | 200 | 176 | 137 | 117 | ||
| Far Cry 5 (2018) | 220 | 191 | 178 | 167 | 145 | 83 |
| Strange Brigade (2018) | 593 | 371 | 308 | 266 | 197 | 115 |
| Shadow of the Tomb Raider (2018) | 221 | 192 | 183 | 169 | 124 | 69.3 |
| Forza Horizon 4 (2018) | 293 | 227 | 216 | 178 | 153 | 111 |
| Far Cry New Dawn (2019) | 188 | 162 | 154 | 140 | 129 | 84 |
| Borderlands 3 (2019) | 202 | 172 | 147 | 124 | 89.9 | 49.2 |
| F1 2020 (2020) | 432 | 343 | 303 | 213 | 167 | 101 |
| F1 2021 (2021) | 491 | 383 | 307 | 160 | 121 | 71.9 |
| Far Cry 6 (2021) | 185 | 157 | 142 | 134 | 109 | 64 |
Intel Core i5-12600K + Nvidia Titan RTX
| baixo | média | alto | ultra | QHD | 4K | |
|---|---|---|---|---|---|---|
| GTA V (2015) | 186 | 185 | 181 | 124 | 115 | 136 |
| The Witcher 3 (2015) | 500 | 406 | 277 | 144 | 107 | |
| Dota 2 Reborn (2015) | 183.7 | 188 | 181.1 | 174.9 | 165.8 | |
| Final Fantasy XV Benchmark (2018) | 218 | 192 | 141 | 107 | 63.6 | |
| X-Plane 11.11 (2018) | 172 | 153 | 119 | 104 | ||
| Far Cry 5 (2018) | 200 | 174 | 165 | 154 | 140 | 81 |
| Strange Brigade (2018) | 489 | 352 | 301 | 262 | 196 | 114 |
| Shadow of the Tomb Raider (2018) | 195 | 176 | 172 | 163 | 124 | 70.1 |
| Forza Horizon 4 (2018) | 263 | 218 | 212 | 178 | 154 | 112 |
| Far Cry New Dawn (2019) | 171 | 147 | 141 | 126 | 121 | 84 |
| Metro Exodus (2019) | 227 | 174 | 135 | 108 | 87.7 | 56.6 |
| Borderlands 3 (2019) | 175 | 155 | 138 | 119 | 90.4 | 49.8 |
| F1 2020 (2020) | 340 | 291 | 288 | 216 | 168 | 103 |
| F1 2021 (2021) | 407 | 367 | 302 | 160 | 122 | 72.6 |
| Far Cry 6 (2021) | 164 | 136 | 129 | 124 | 105 | 64 |
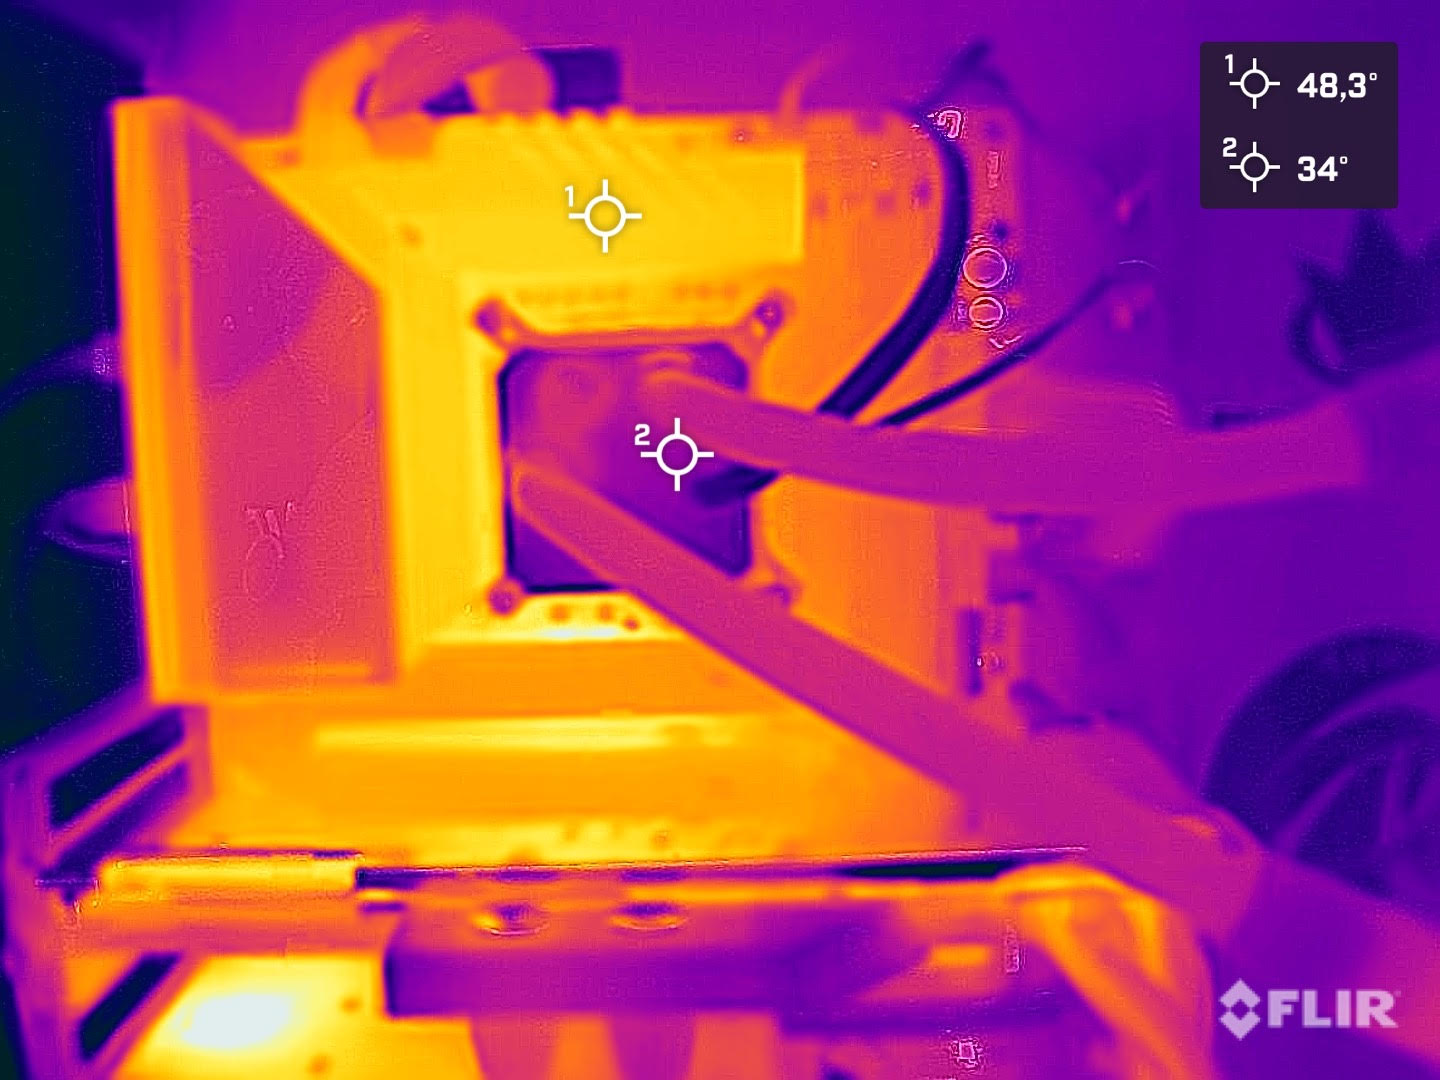
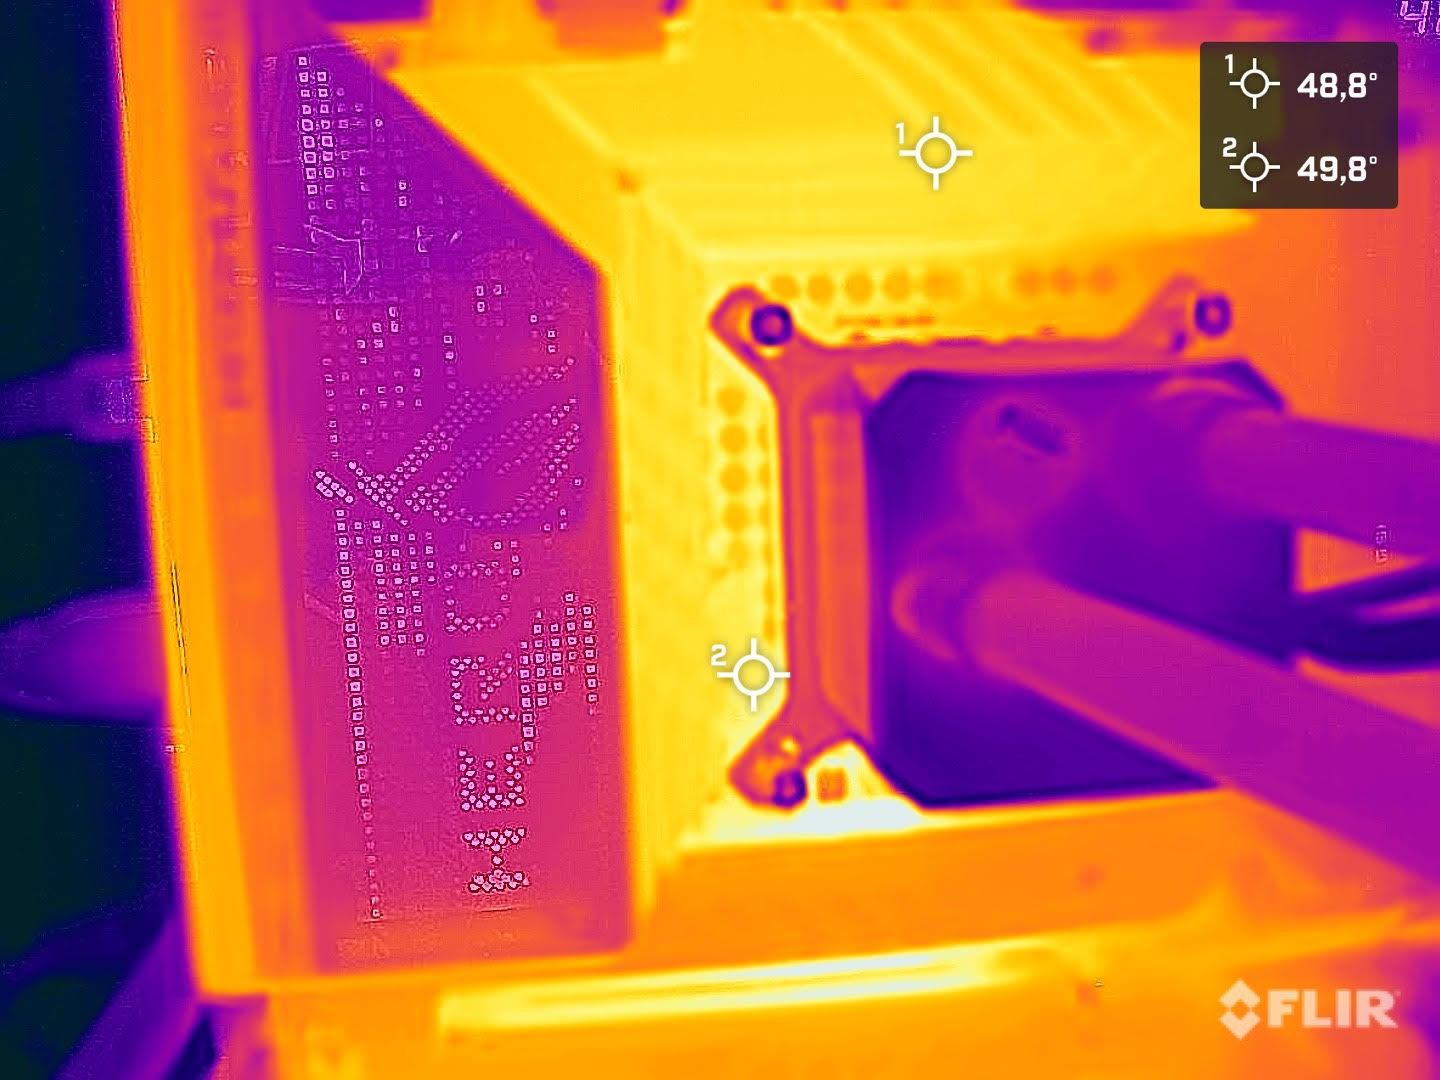
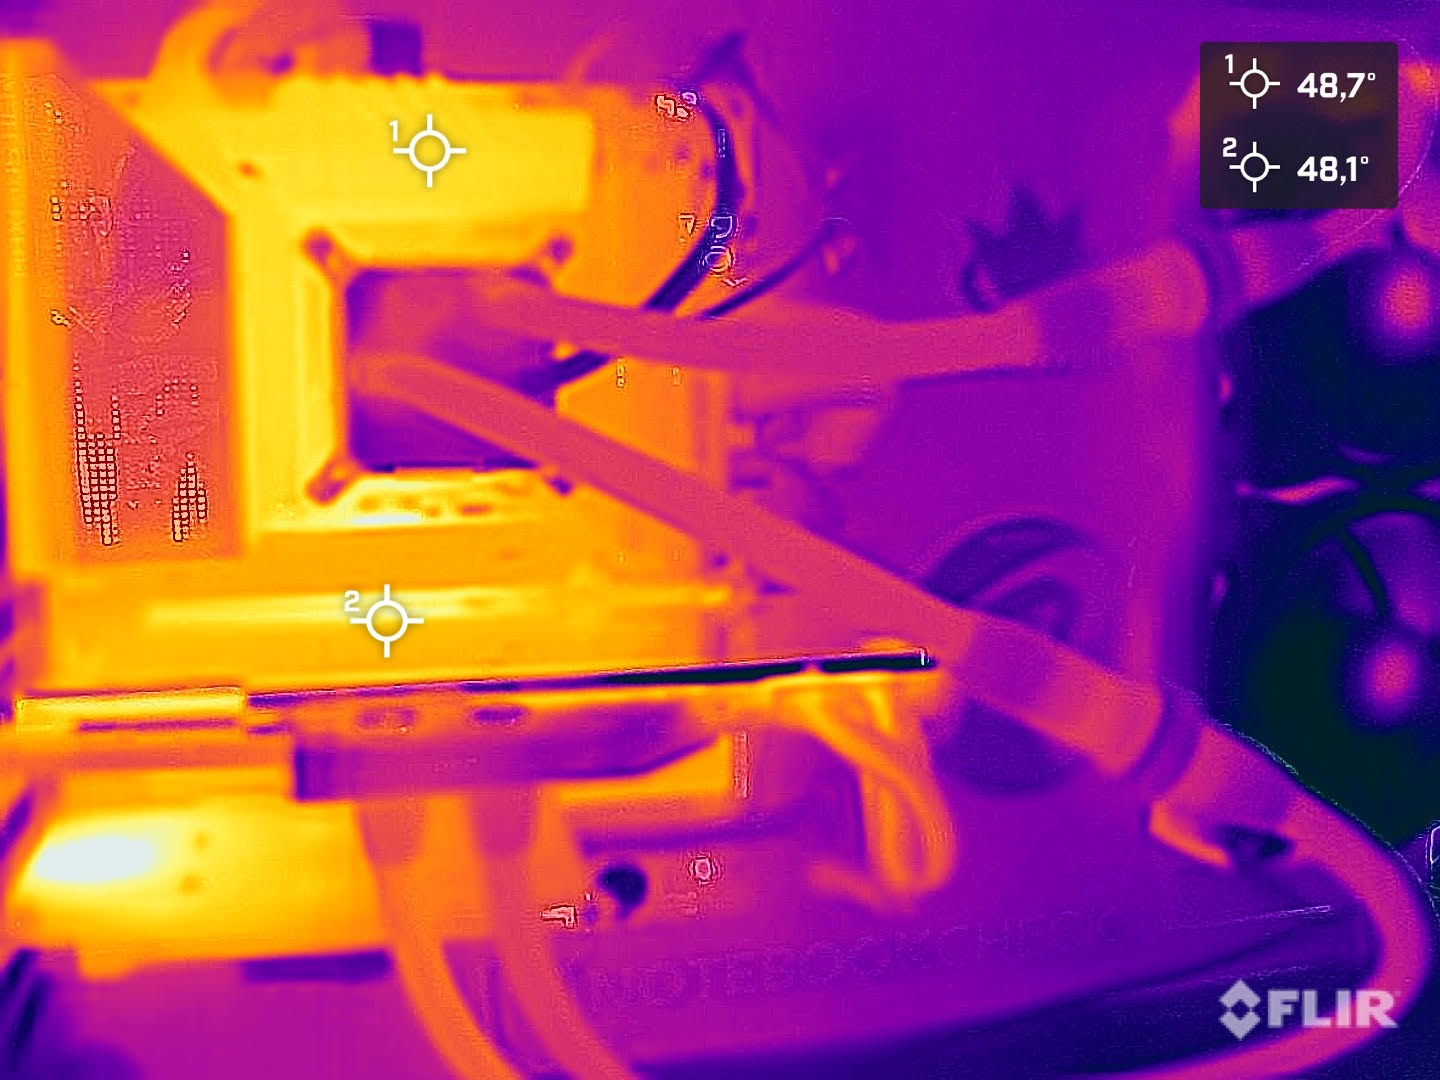
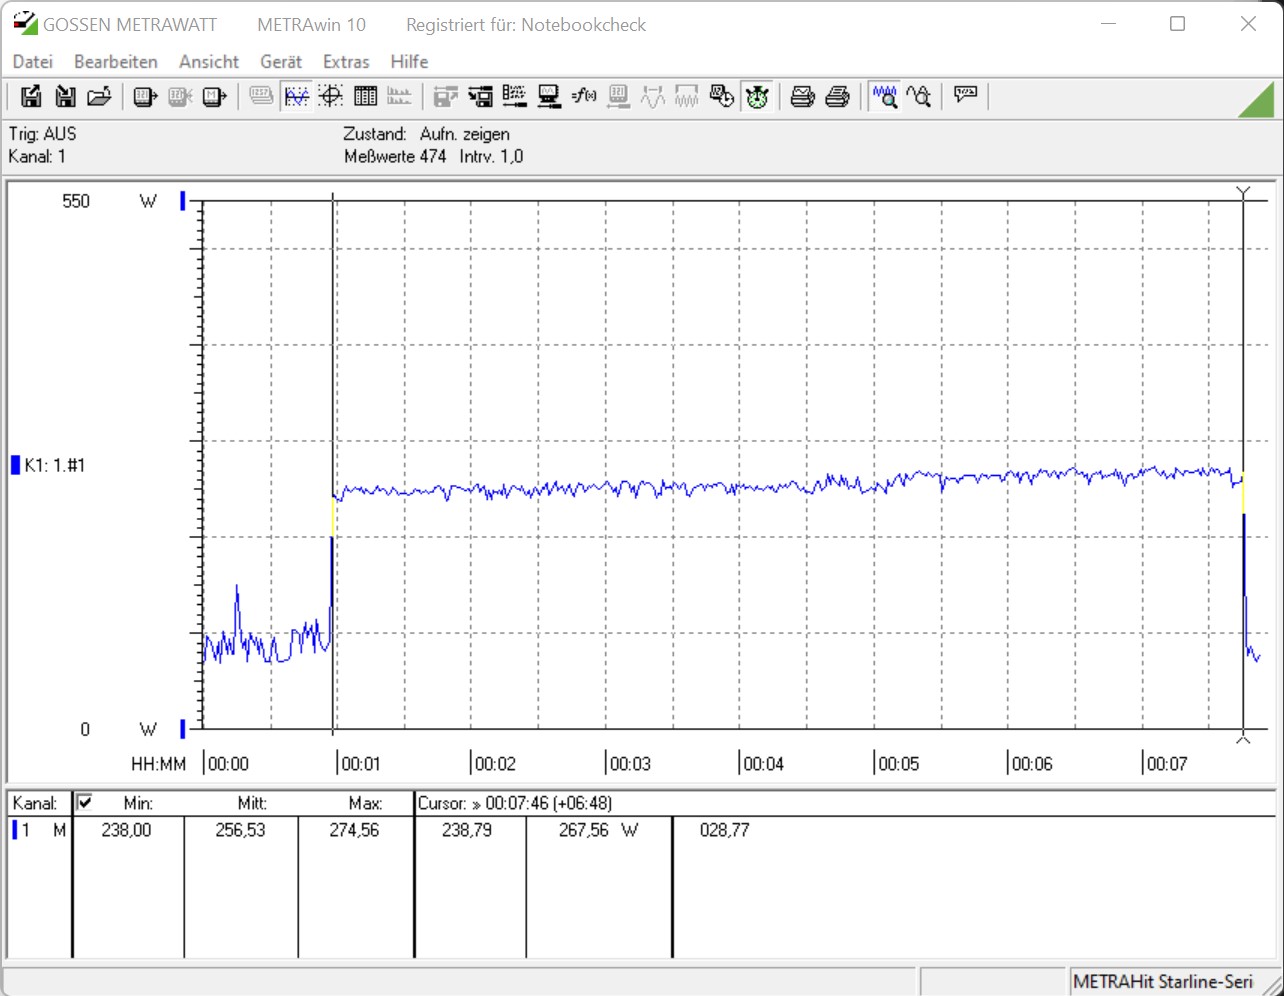
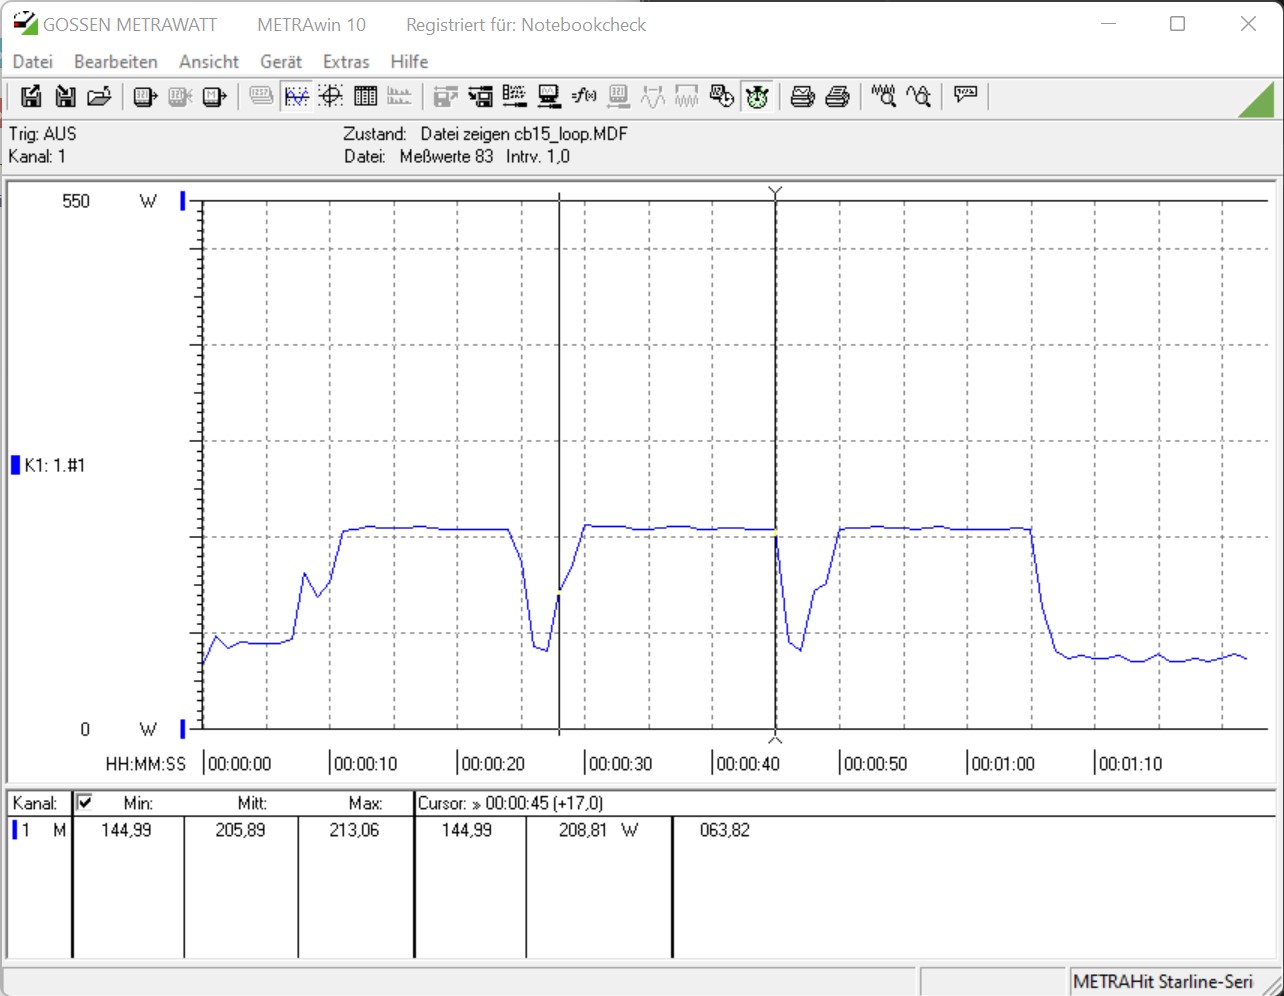
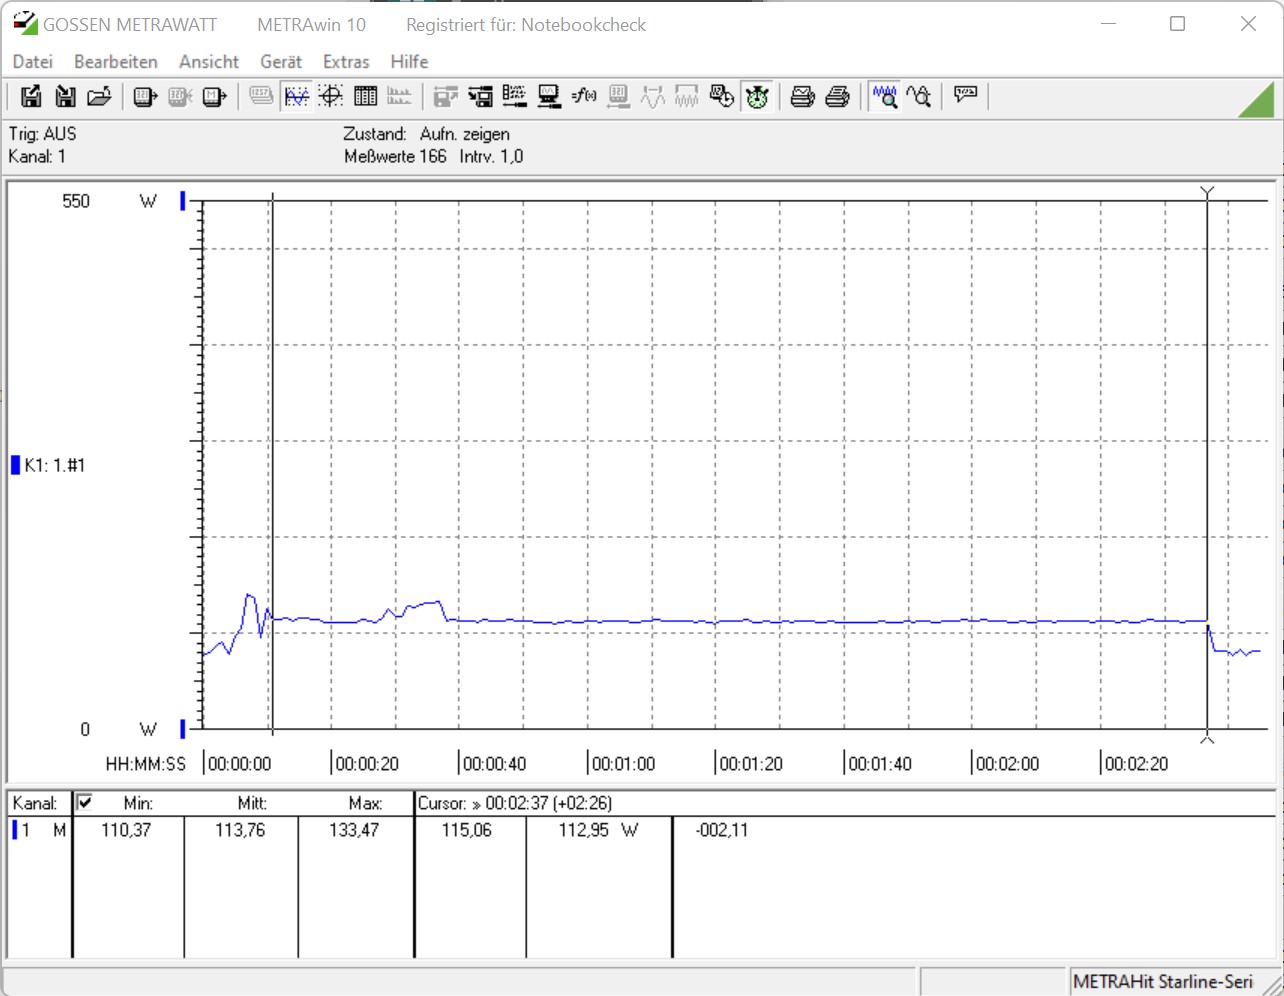
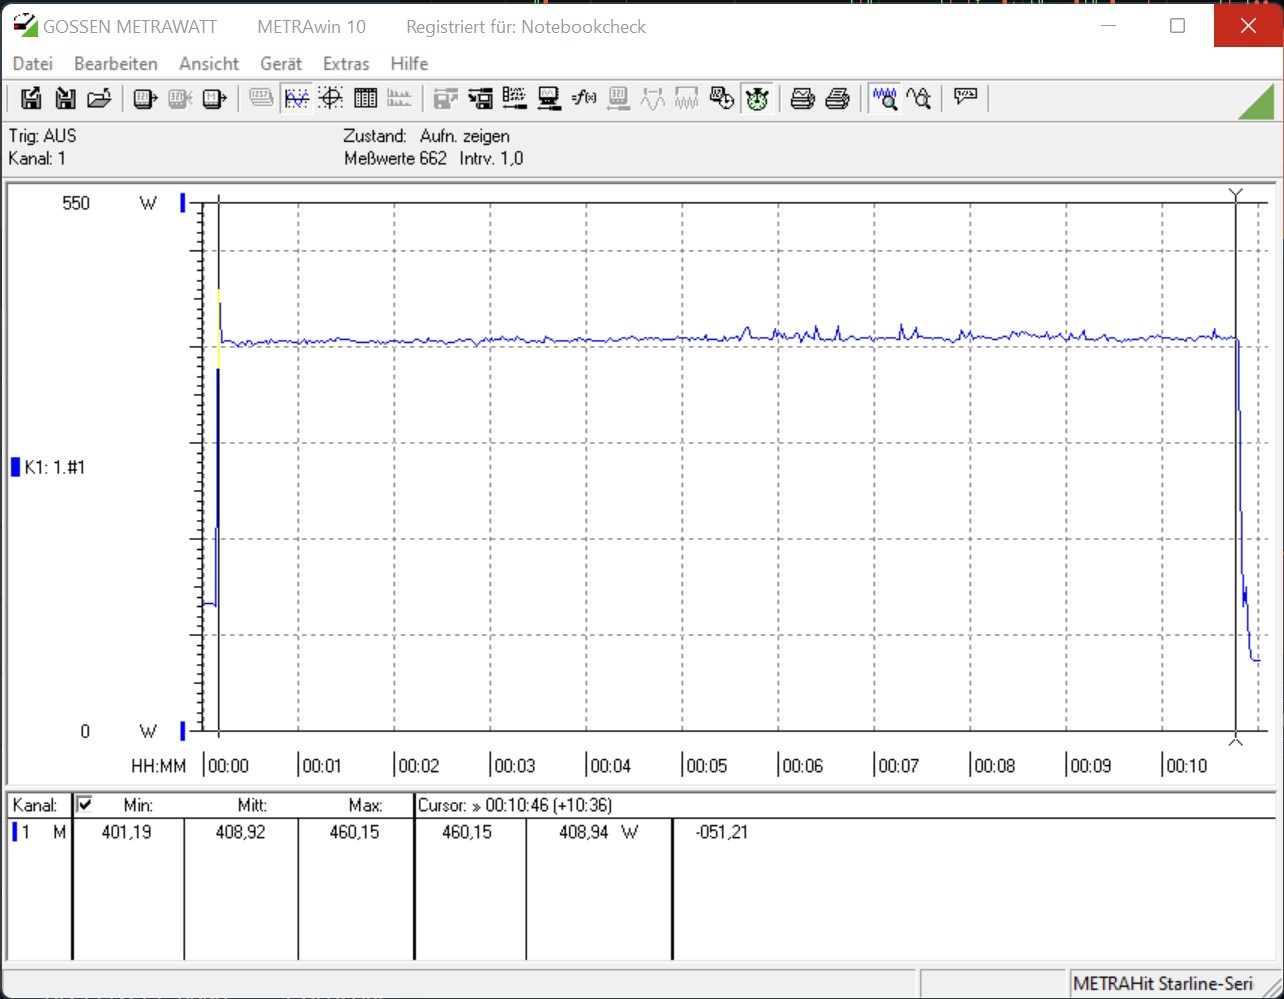
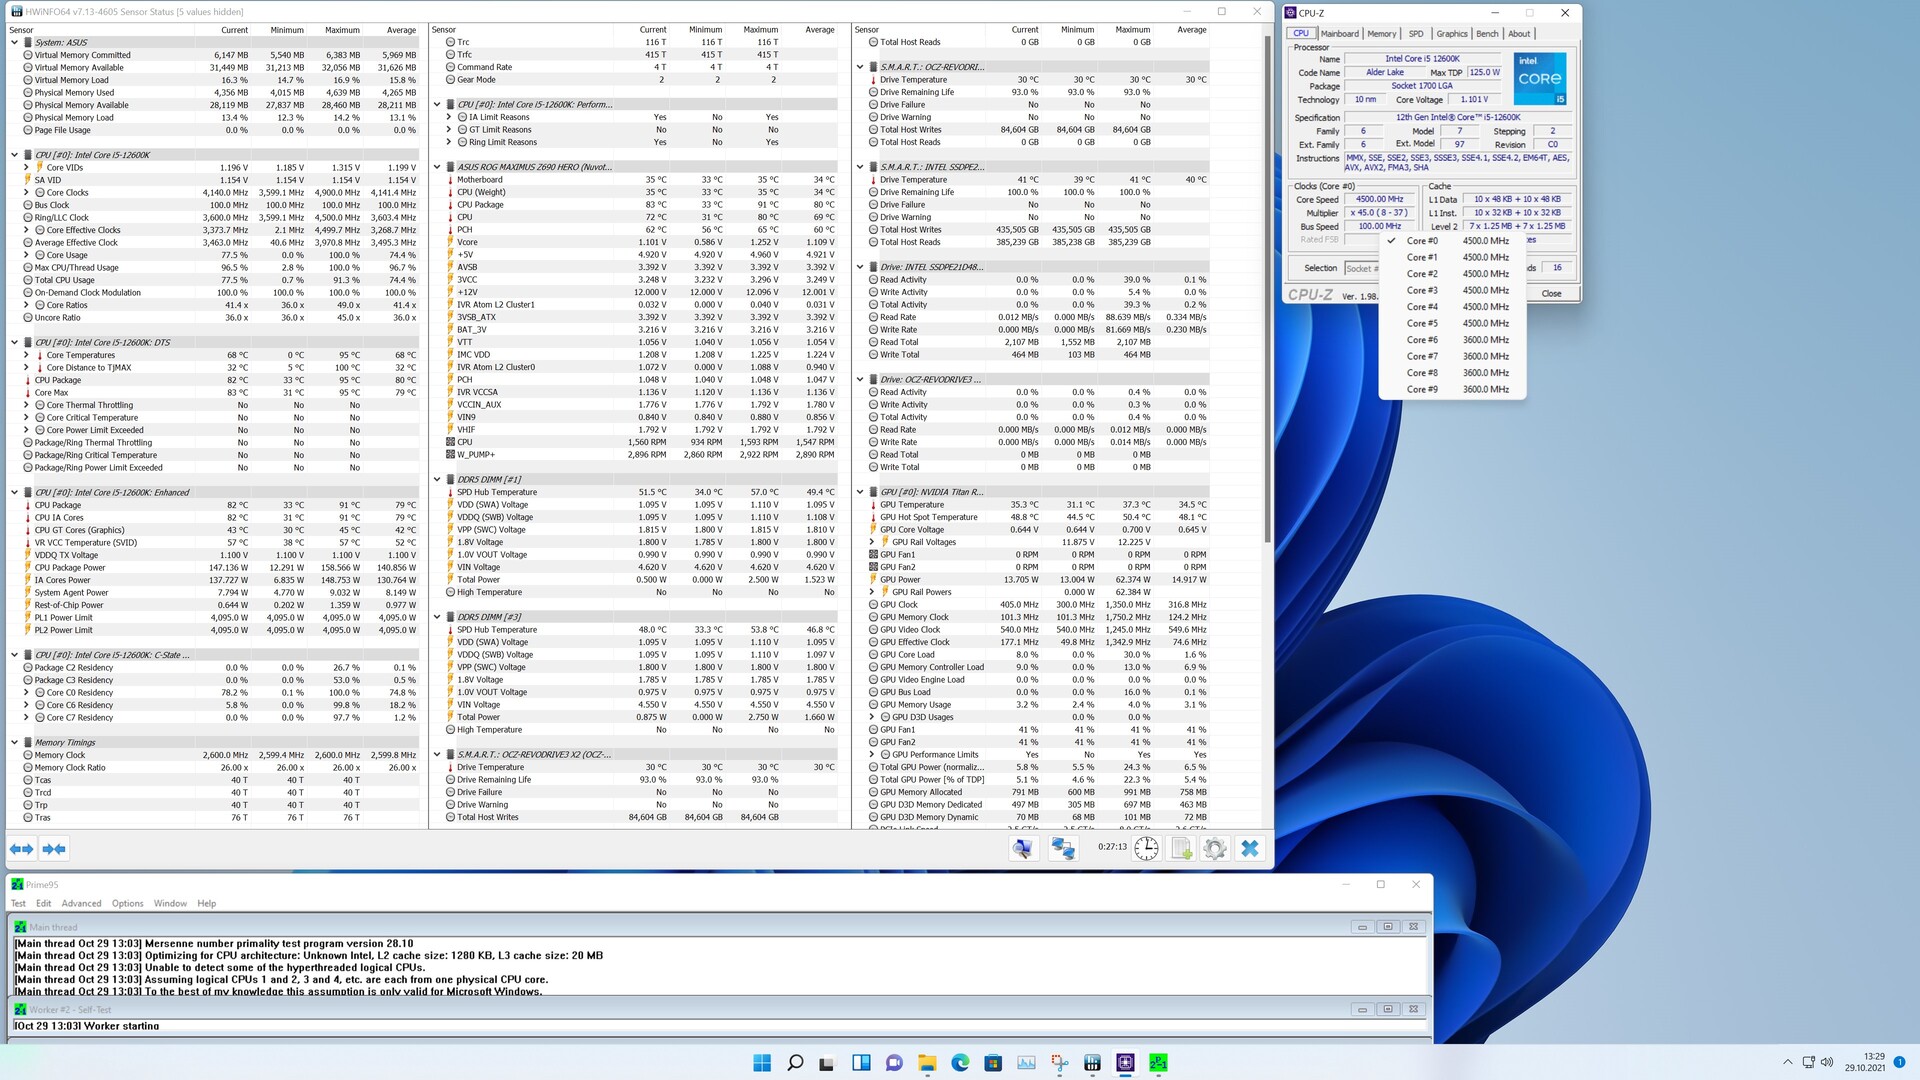
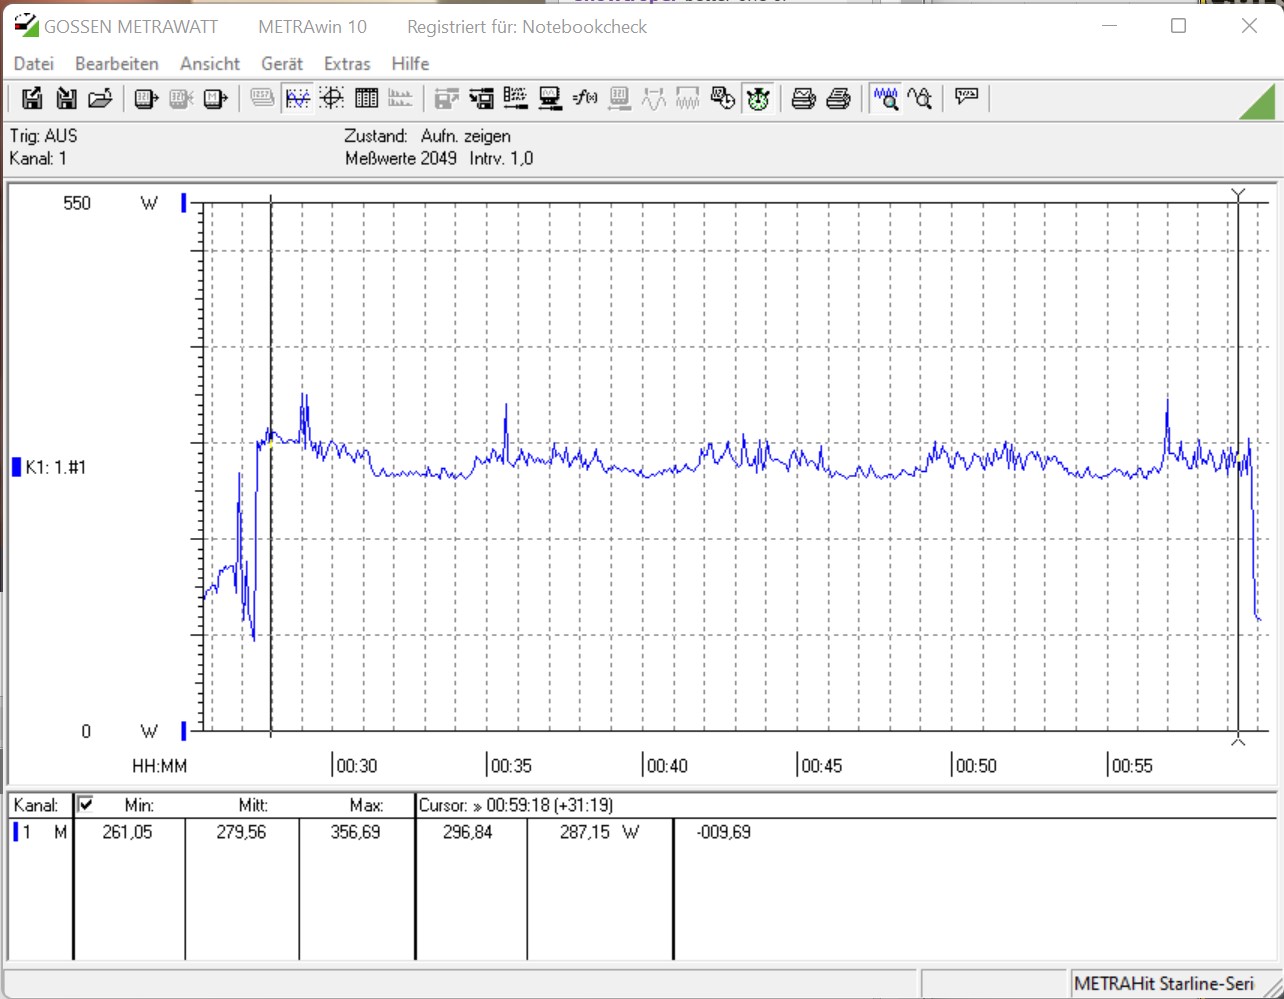
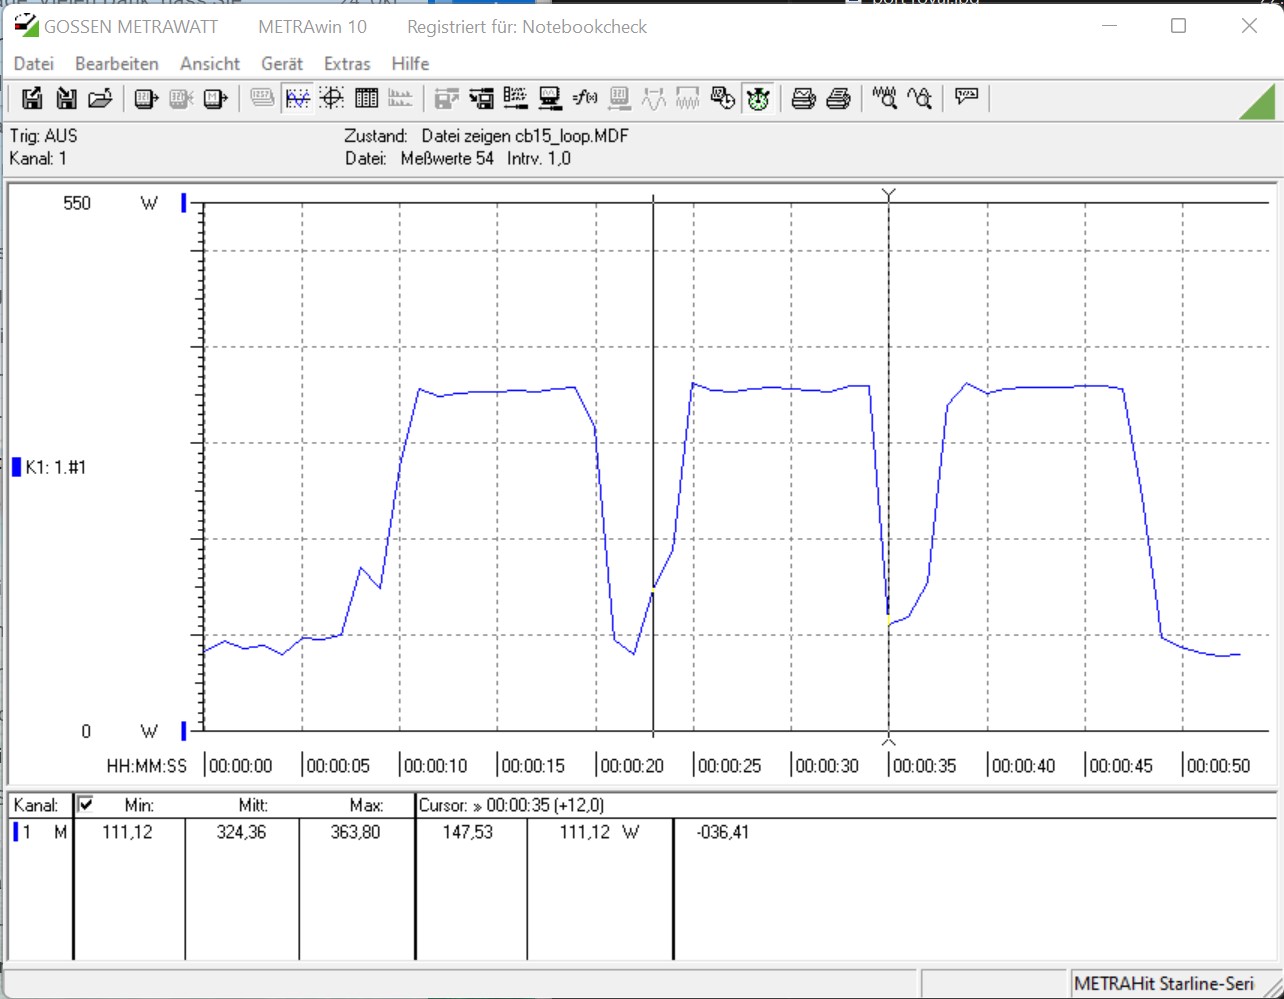
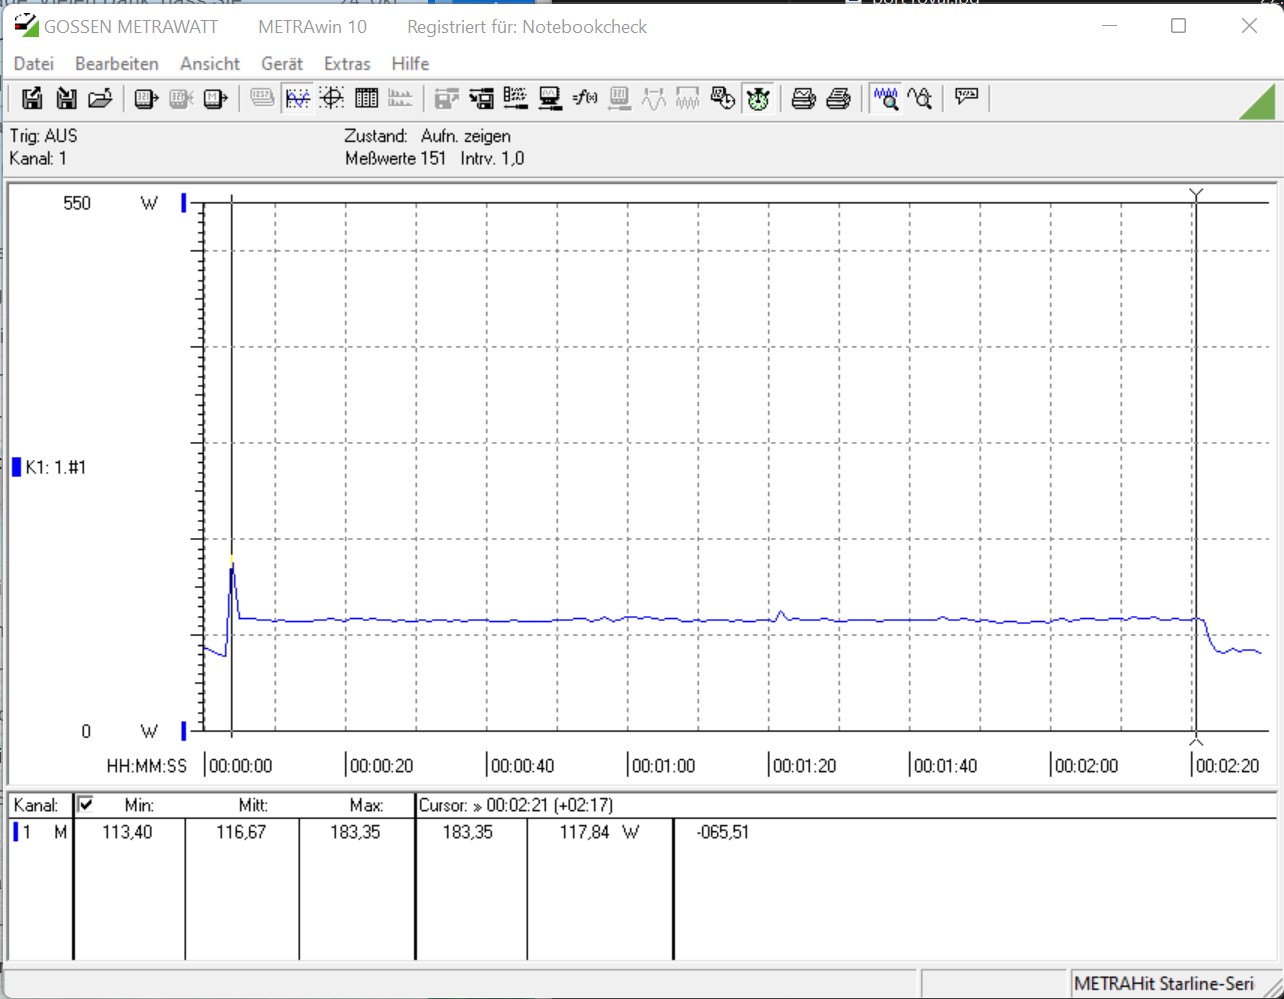
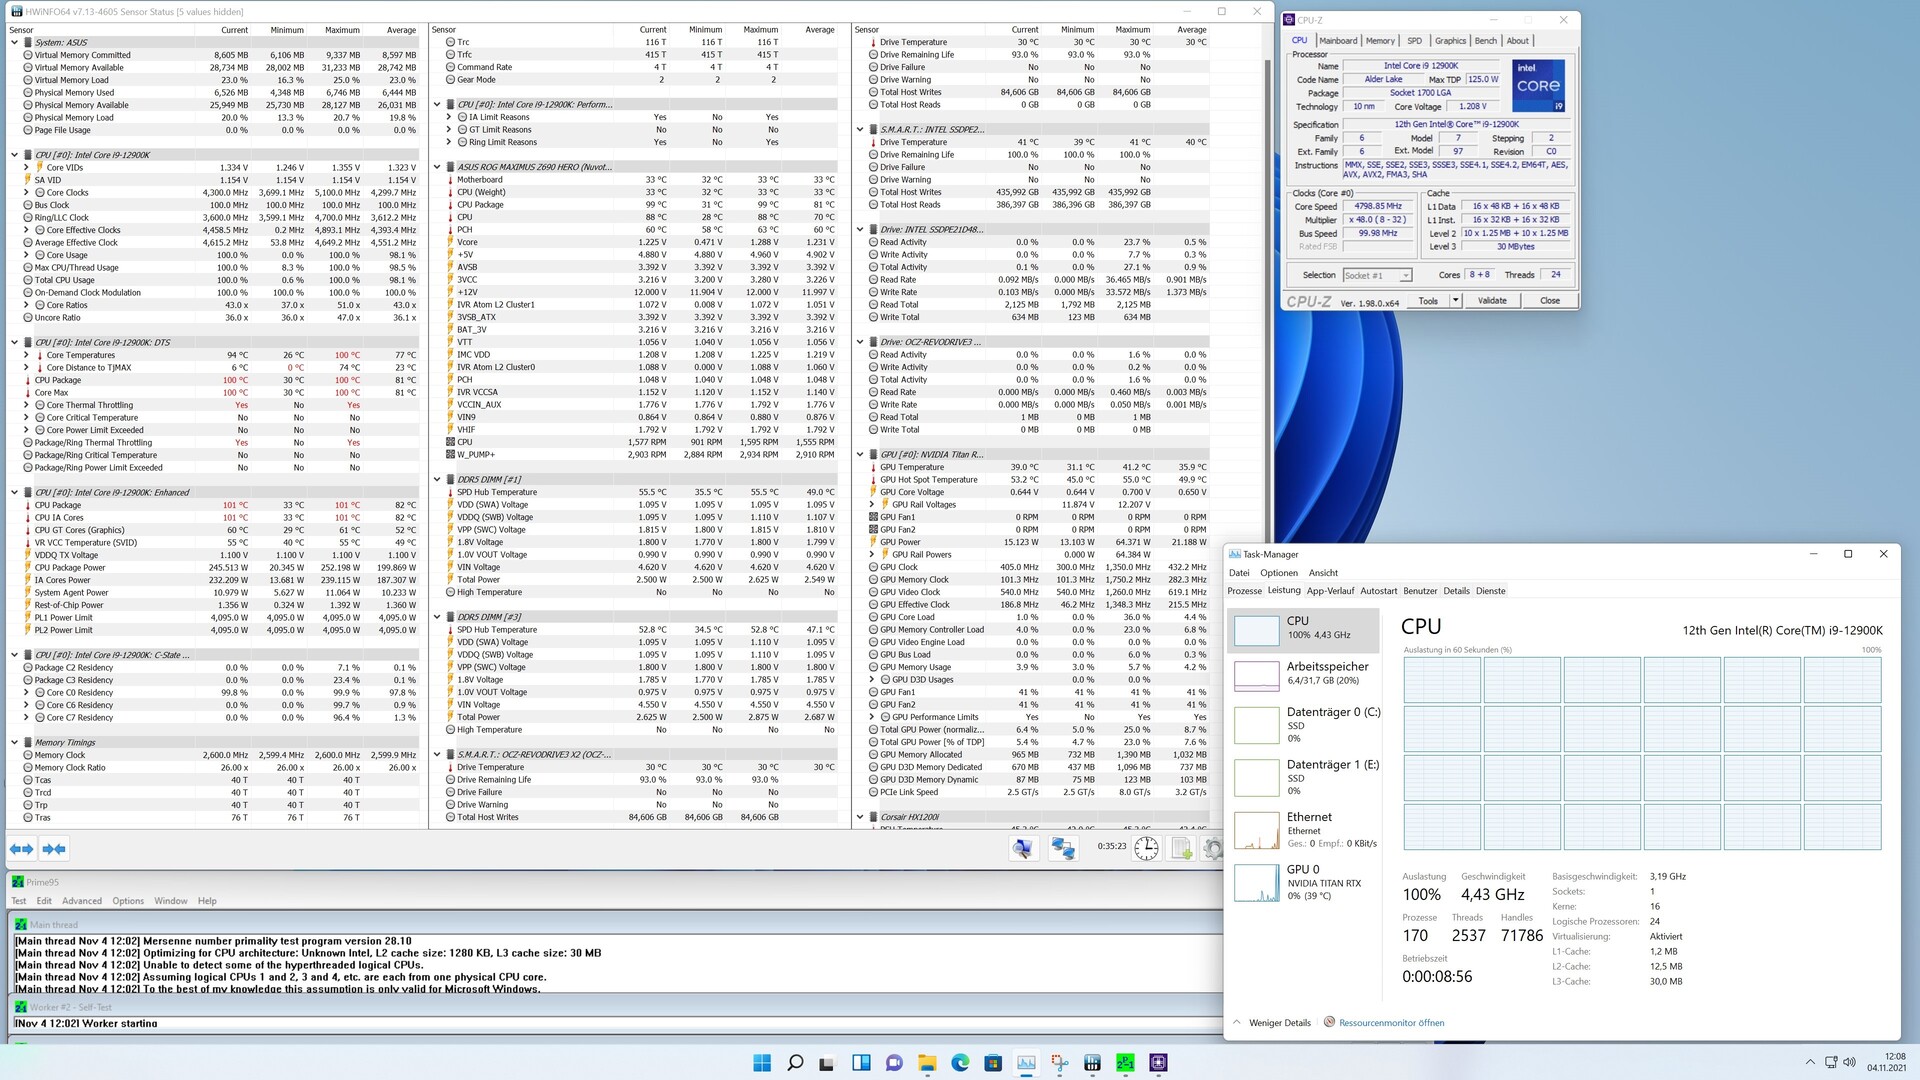
Consumo de energia e Temperaturas
De acordo com as especificações técnicas, os processadores oferecem um TDP de 125 watts. Isto se refere ao valor PL1. O valor PL2 especifica a quantidade de watts disponíveis para o processador sob carga total, se todos os requisitos forem cumpridos. Com um máximo de 241 watts, o Intel Core i9-12900K é um pouco mais eficiente do que o Intel Core i9-11900K. Em nosso teste, o carro-chefe do Alder Lake-S foi de fato apenas mais eficientedo que o predecessor no teste de estresse Prime95. Entretanto, nossas medições ainda mostraram um pouco menos de 280 watts para todo o sistema. No teste Cinebench R15 Multi, nosso sistema de teste consumiu quase 25% a mais de potência. Este é um aumento que não pode ser simplesmente descartado. No Intel Core i5-12600K, o valor PL2 é limitado a 150 watts, o que também é refletido em nossos resultados de medição. Em comparação com o Intel Core i5-11600KNo entanto, a imagem muda no teste de estresse, e o Core i5-12600K retira 13% mais energia da tomada. Os valores medidos durante os jogos são obviamente aumentados pelo Nvidia Titan RTX. Entretanto, também podemos ver aqui que a plataforma Alder Lake-S não convida à economia de energia.
Nossas temperaturas medidas mostraram que o Intel Core i9-12900K já atingiu 100 °C (212 °F ) vários minutos depois de iniciar o benchmark Prime95. Continuando o teste de estresse, a CPU teve então que ser estrangulada para não prejudicá-la. Esta é a desvantagem do ajuste PL1 = PL2 na Bios. Entretanto, não notamos nenhuma estrangulamento sob carga no laço Multi Cinebench R15. A fim de excluir uma má instalação do sistema de resfriamento, também o removemos e depois o reinstalamos em um ponto, mas o resultado depois foi o mesmo. Também contatamos a Alphacool para garantir que não houvesse incompatibilidade do refrigerador que utilizamos. Segundo o fabricante, o Alphacool Eisbear Aurora 280 AiO que utilizamos é compatível com o soquete LGA 1700. O Intel Core i5-12600K era ligeiramente mais fácil de resfriar sob carga, mas ainda observamos uma temperatura máxima de 95 °C (203°F).
Portanto, aqueles que querem usar um Intel Core i9-12900K também devem obter um sistema de resfriamento muito potente para obter o máximo do processador.
| Power Consumption | |
| 1920x1080 The Witcher 3 ultra (external Monitor) | |
| Intel Core i9-12900K (Idle: 70.5 W) | |
| AMD Ryzen 9 5950X (Idle: 78 W) | |
| AMD Ryzen 9 5900X (Idle: 78.1 W) | |
| Intel Core i5-11600K (Idle: 69.49 W) | |
| AMD Ryzen 7 5800X (Idle: 77.5 W) | |
| AMD Ryzen 5 5600X (Idle: 79.23 W) | |
| Intel Core i5-12600K (Idle: 70.45 W) | |
| Intel Core i7-10700K (Idle: 67.7 W) | |
| Intel Core i9-10900K (Idle: 52.3 W) | |
| Intel Core i9-11900K (Idle: 57.3 W) | |
| Intel Core i5-10600K (Idle: 52.2 W) | |
| Prime95 V2810 Stress (external Monitor) | |
| Intel Core i9-11900K (Idle: 57.3 W) | |
| Intel Core i9-12900K (Idle: 70.5 W) | |
| Intel Core i9-10900K (Idle: 52.3 W) | |
| Intel Core i5-12600K (Idle: 70.45 W) | |
| AMD Ryzen 9 5950X (Idle: 78 W) | |
| AMD Ryzen 7 5800X (Idle: 77.5 W) | |
| AMD Ryzen 9 5900X (Idle: 78.1 W) | |
| Intel Core i5-11600K (Idle: 69.49 W) | |
| Intel Core i7-10700K (Idle: 67.7 W) | |
| Intel Core i5-10600K (Idle: 52.2 W) | |
| AMD Ryzen 5 5600X (Idle: 79.23 W) | |
| Cinebench R15 Multi (external Monitor) | |
| Intel Core i9-12900K (Idle: 70.5 W) | |
| Intel Core i9-10900K (Idle: 52.3 W) | |
| Intel Core i9-11900K (Idle: 57.3 W) | |
| AMD Ryzen 9 5900X (Idle: 78.1 W) | |
| AMD Ryzen 9 5950X (Idle: 78 W) | |
| AMD Ryzen 7 5800X (Idle: 77.5 W) | |
| Intel Core i5-11600K (Idle: 69.49 W) | |
| Intel Core i7-10700K (Idle: 67.7 W) | |
| Intel Core i5-12600K (Idle: 70.45 W) | |
| Intel Core i5-10600K (Idle: 52.2 W) | |
| AMD Ryzen 5 5600X (Idle: 79.23 W) | |
| Temperatures - CPU Temperature Prime95 | |
| Intel Core i9-11900K | |
| AMD Ryzen 7 5800X | |
| Intel Core i9-10900K | |
| Intel Core i5-11600K | |
| AMD Ryzen 9 5900X | |
| Intel Core i5-10600K | |
| AMD Ryzen 9 5950X | |
* ... menor é melhor
Pro
Contra
Veredicto - De volta ao topo com um total de 24 Roscas

Com o Alder Lake-S, a Intel realmente consegue ter a CPU de jogos mais rápida, pelo menos por enquanto. Mas isto não é tudo. O Alder Lake-S não é apenas um processador de última geração com sopa, como já vimos muitas vezes antes. Este não é o caso aqui, já que a nova arquitetura inclui muitas melhorias. Muitos deles já conhecemos da área móvel, já que os smartphones e os tablets já contêm processadores com desempenho e núcleos de eficiência energética há anos. A Intel também faz uso deste projeto em sua atual linha de desktops, aumentando dramaticamente o desempenho multi-core. Desta forma, o Intel Core i9-12900K capaz de operar em um total de 24 fios em paralelo. Além disso, o IPC também foi melhorado significativamente, o que beneficia enormemente os jogos
A base subjacente também mudou completamente e uma simples atualização do Rocket Lake-S é impossível sem a substituição da placa principal. Você definitivamente tem que incluir isto em seu cálculo de custos. Aproximadamente os custos, o preço de compra recomendado é de $589 e está atualmente disponível a partir de 659 Euros (~$762) em alguns lugares. Dependendo da disponibilidade, pode haver alguns aumentos de preço aqui, como nas placas gráficas. O Intel Core i5-12600K ligeiramente mais fraco, mas ainda muito rápido, começa a um preço recomendado de US$289 de acordo com a Intel. De acordo com nossa pesquisa inicial, o modelo já está disponível a partir de 319 Euros (~$369) em alguns lugares. Este é um preço atraente que nem mesmo a AMD atualmente não pode bater. O preço correspondente AMD Ryzen 7 5800Xcusta 379 euros (~$438) neste momento. As coisas parecem um pouco diferentes aqui com o modelo top, onde o AMD Ryzen 9 5900Xé significativamente mais acessível a 519 euros (~$600).
O Intel Core i9-12900K é uma CPU de jogos muito boa, com algumas reservas para o futuro. Com a CPU de jogos mais rápida do mercado, a Intel pode se dar um tapinha nas costas por enquanto.
Entretanto, para tornar o Intel Core i9-12900K mais competitivo, o preço deve cair, já que, como já mencionamos, você definitivamente também tem que investir em uma nova placa principal e, em algumas circunstâncias, também em nova memória de trabalho, se tiver que ser DDR5. Mas gostamos do fato de que você também tem a opção de continuar usando o DDR4. Os fabricantes de placas principais oferecem alguns modelos específicos com DDR4 RAM para isto. No entanto, se estes também suportarão o Raptor Lake-S infelizmente ainda não é conhecido atualmente.
Ficamos um pouco desapontados com o consumo de energia. É claro que o desempenho foi drasticamente melhorado e o correspondente consumo de energia ligeiramente maior permanece dentro dos limites. Mas teria sido ótimo, se este aumento de desempenho pudesse ser combinado com um consumo de energia visivelmente menor. Isto também ajudaria a lidar melhor com as questões de resfriamento.
Aqueles que já querem pegá-lo agora podem obter o Intel Core i5-12600K no siteAmazon por ~$323 e o Intel Core i9-12900K também de Amazon por ~$1400. Enquanto Newegg lista por $649, atualmente é vendido lá fora.

