Revisão da Zotac ZBOX Magnus: GeForce RTX 3070 Mobile e Tiger Lake SoC em um estojo de 2,65 litros
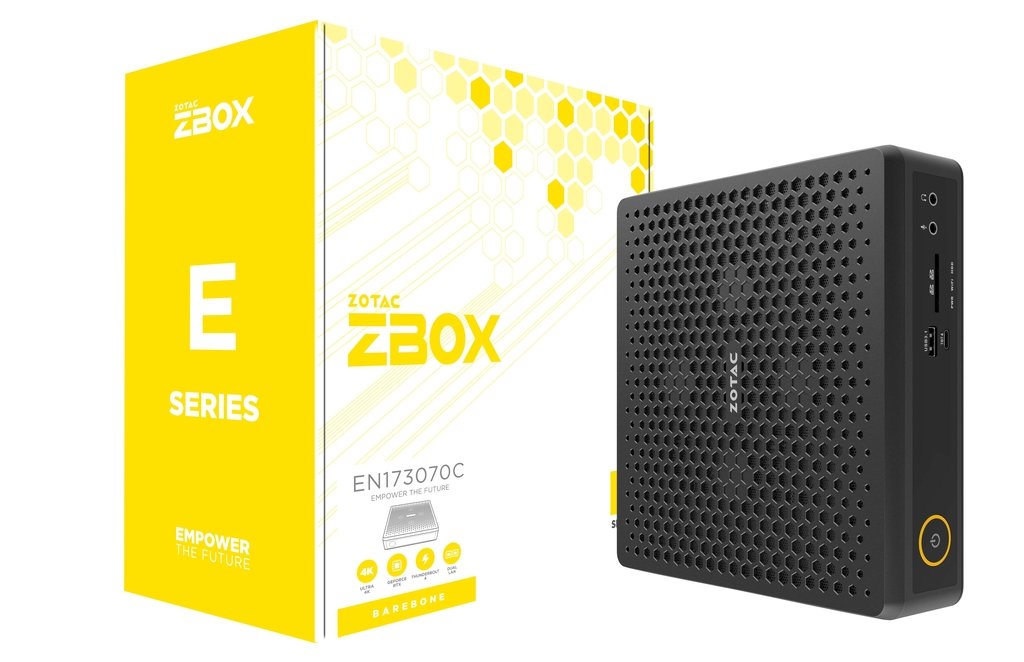
Sob a etiqueta Zotac ZBOX, o fabricante oferece uma série de PCs compactos destinados a vários cenários individuais de uso. Em combinação com a adição da etiqueta Magnus, a direção é a de um PC de jogos, o que também se reflete nos componentes embutidos. A versão atual da etiqueta Magnus EN173070C contém um Intel Core i7-11800Hque, supostamente, garante uma operação rápida de jogo em combinação com o Nvidia GeForce RTX 3070 Laptopgráficos. Esta combinação não é nova para nós como uma plataforma de revisão de laptop, e já podemos dar uma estimativa aproximada sobre o desempenho a esperar
Na configuração de nosso equipamento, a Magnus EN173070C custa quase 1650 euros (~$1743). Entretanto, como este é sempre um sistema de barebone, também é necessário calcular para o SSD, a RAM e a licença do Windows. Dependendo dos componentes que você escolher, a conta total pode facilmente ultrapassar os 2000 Euros (~$2113). Aqueles para os quais o desempenho do Nvidia GeForce RTX 3070 Laptopa GPU não é suficiente também pode obter a versão EN173080C do Magnus, que contém uma GPU mais rápida com o Nvidia GeForce RTX 3080 Laptopgráficos. A CPU permanece a mesma com o Intel Core i7-11800H. Você também pode obter a Magnus EN153060C, que oferece um pouco menos de desempenho e inclui oIntel Core i5-11400HcPU e Nvidia GeForce RTX 3060 LaptopgPU.
Zotac ZBOX Magnus EN173070C em detalhe
Caso
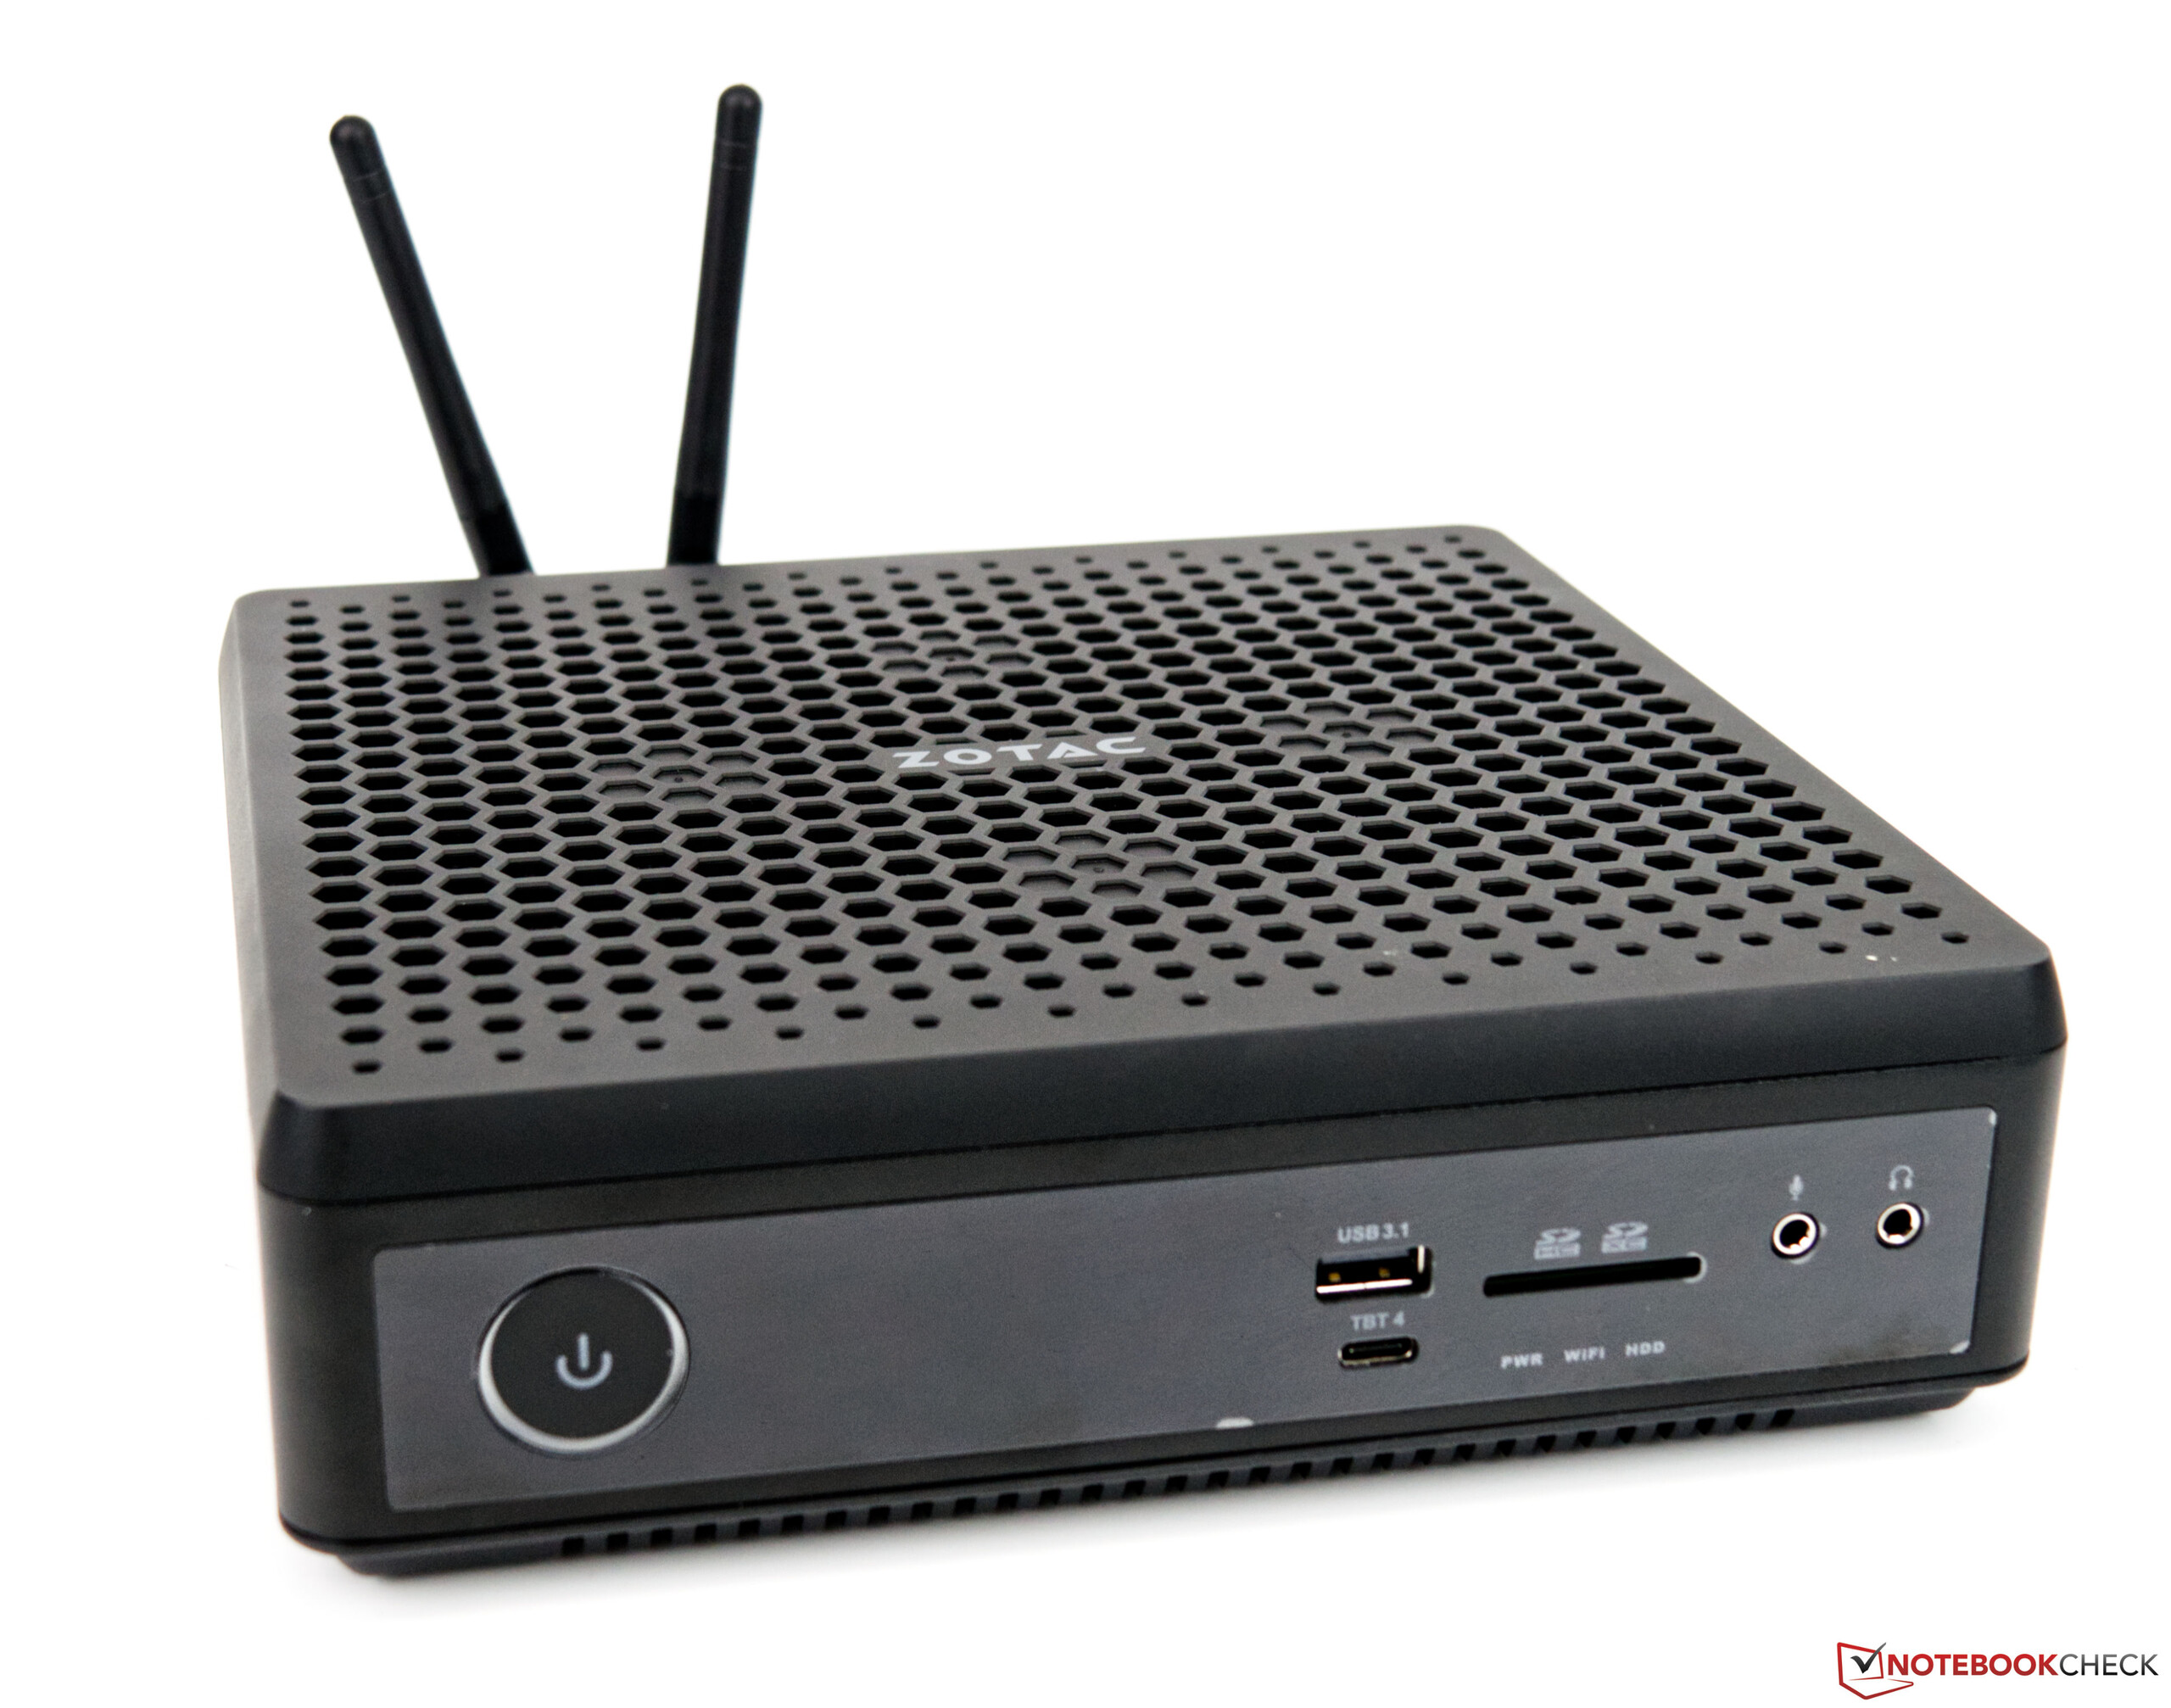
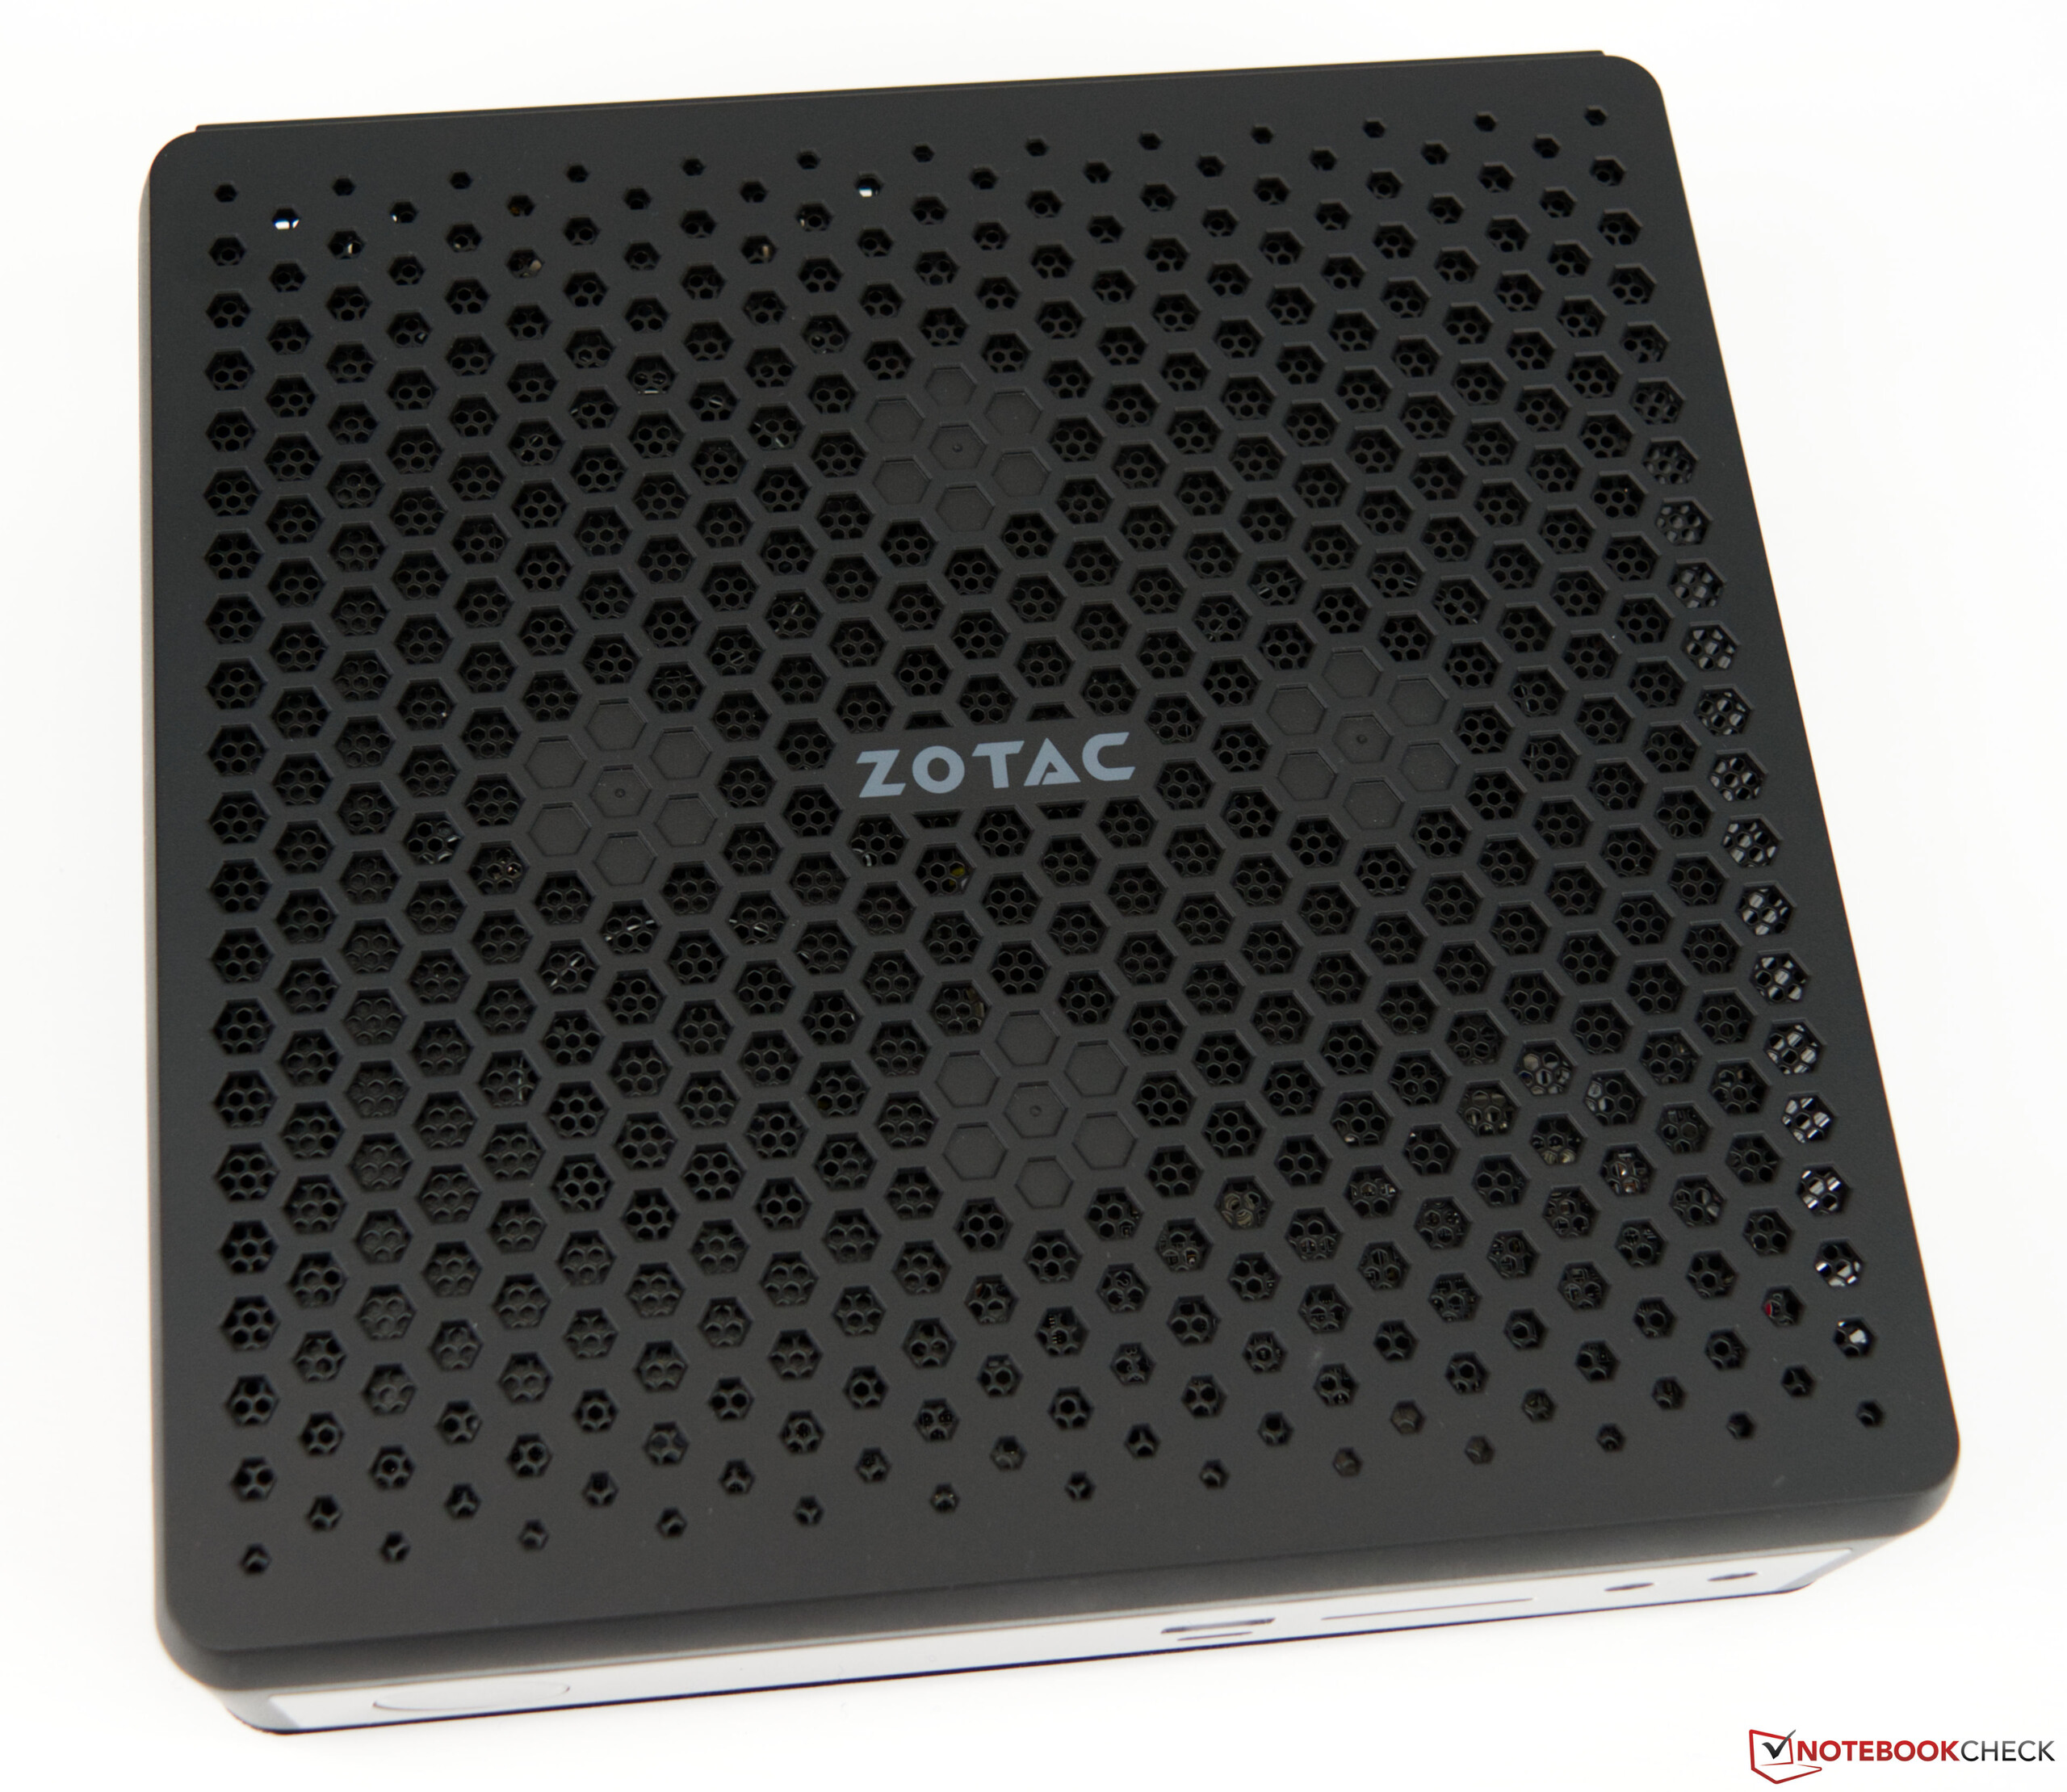
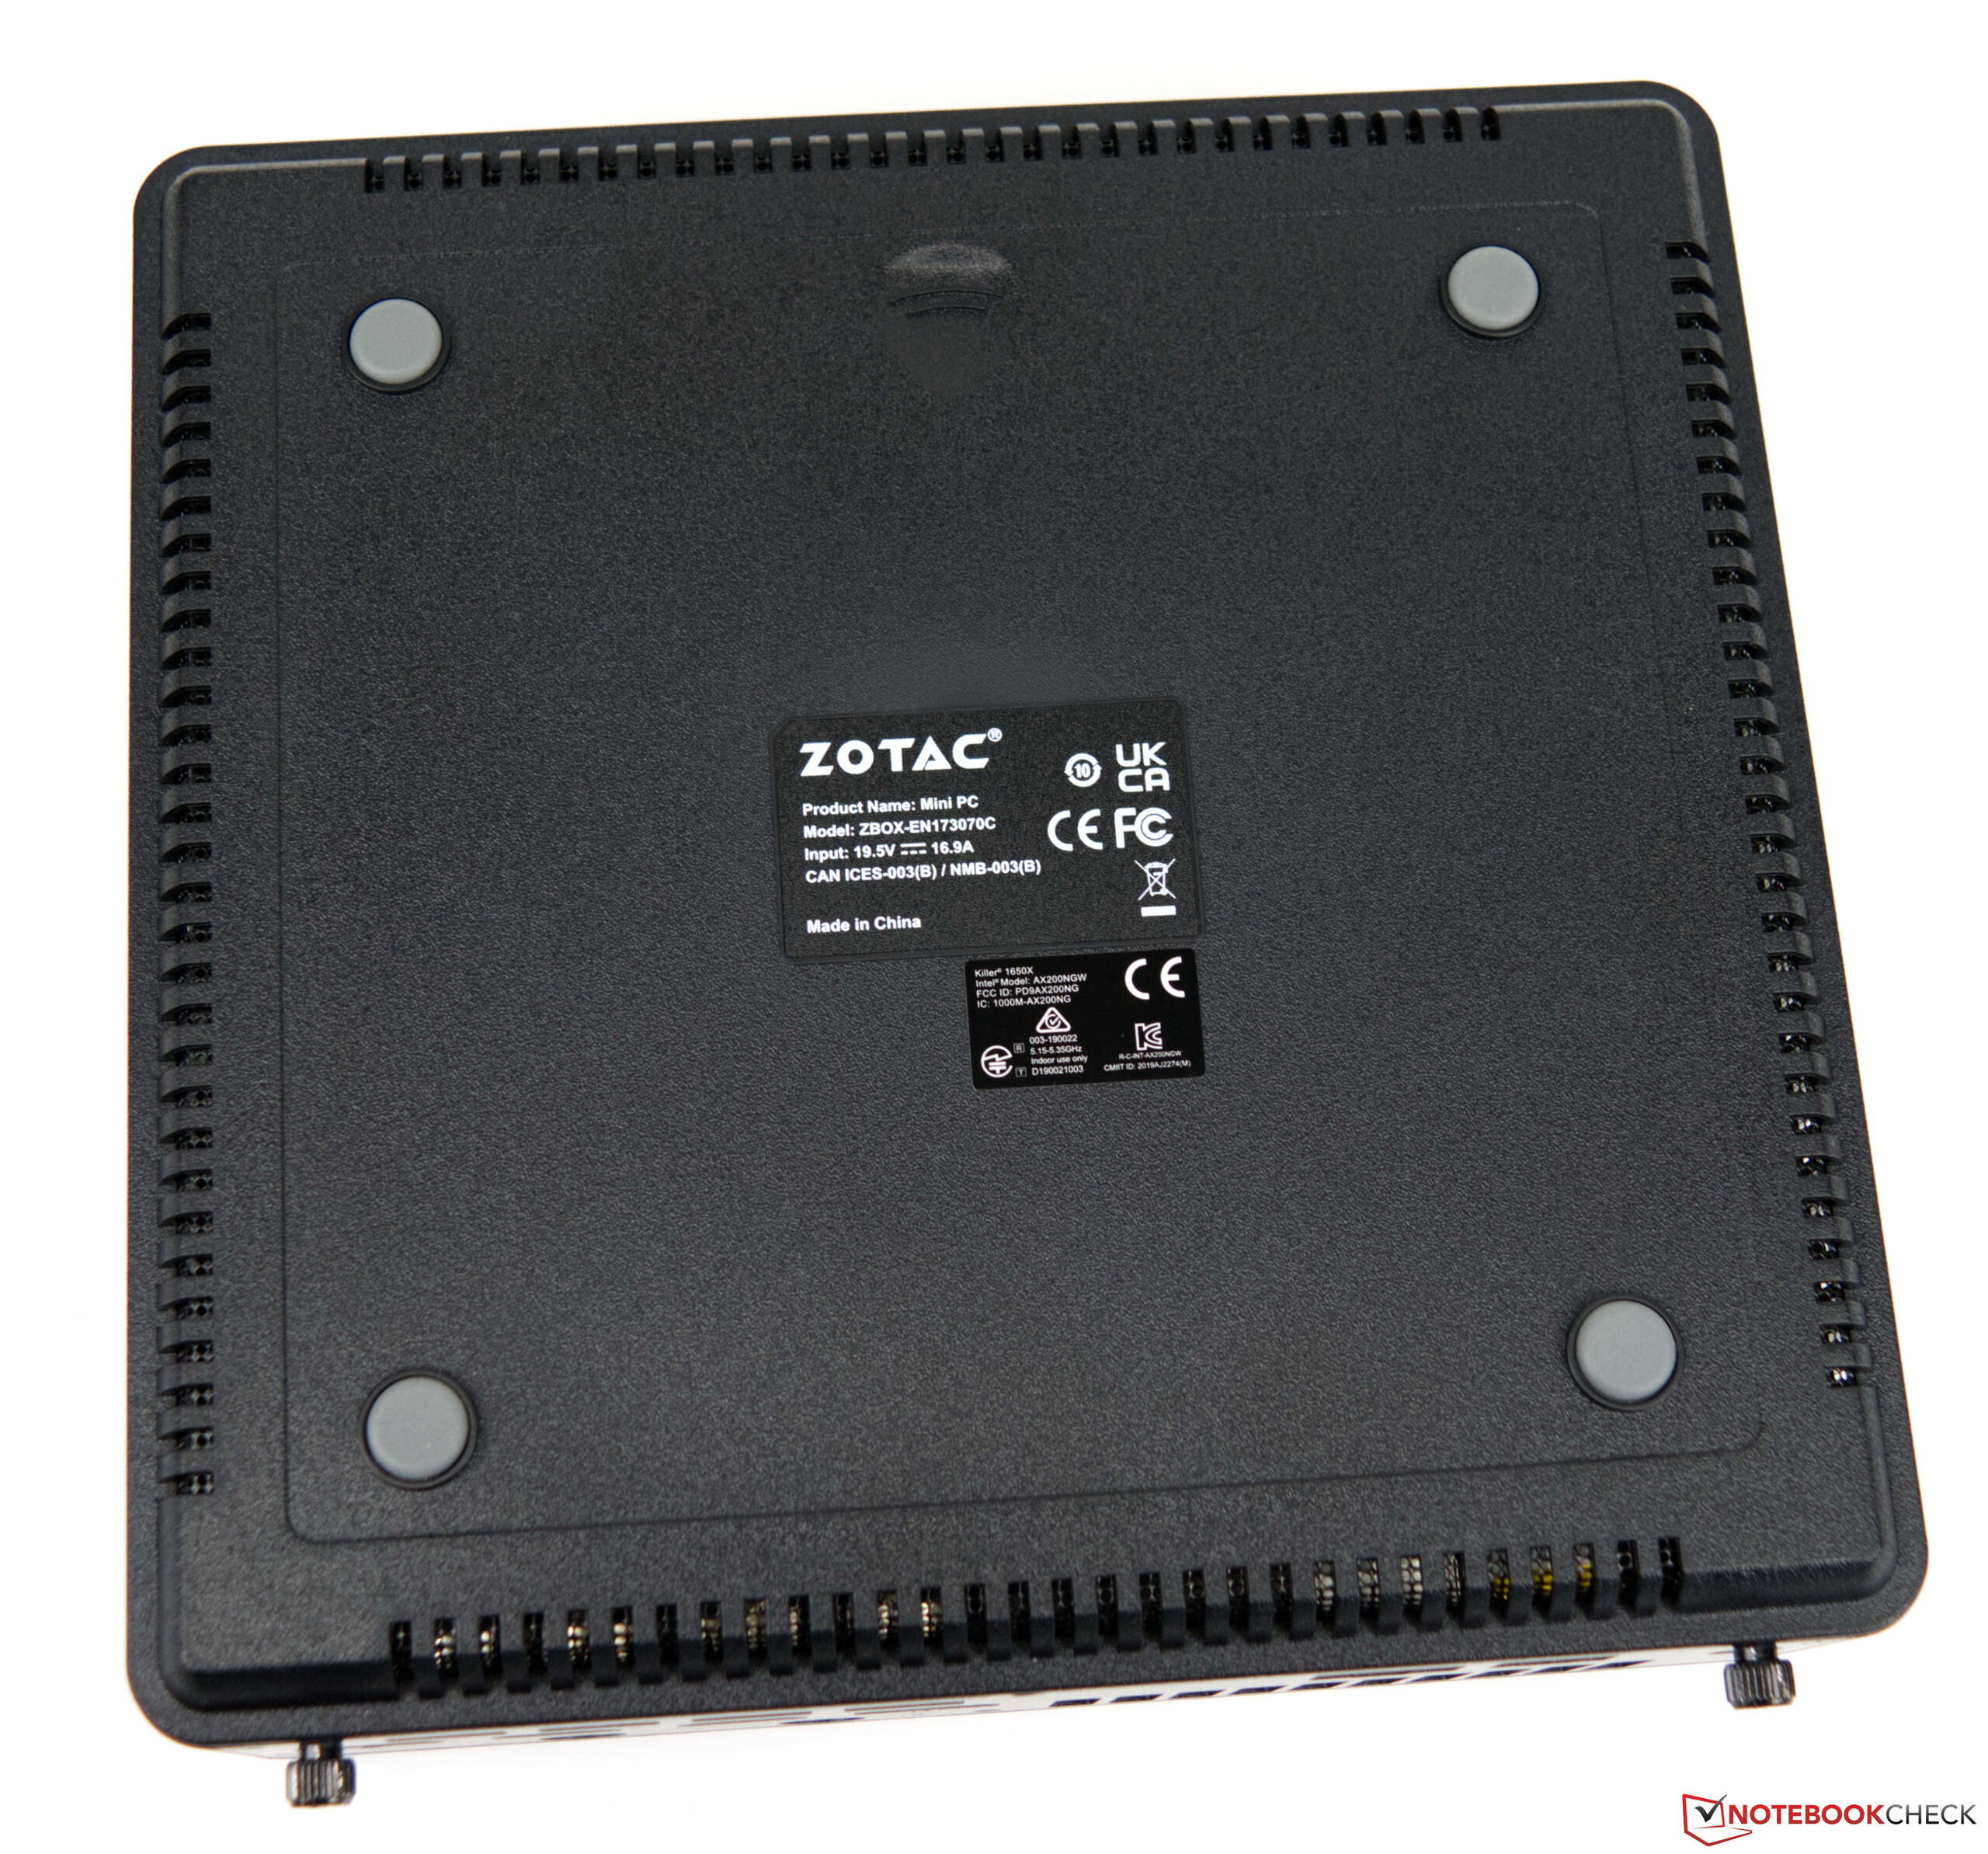
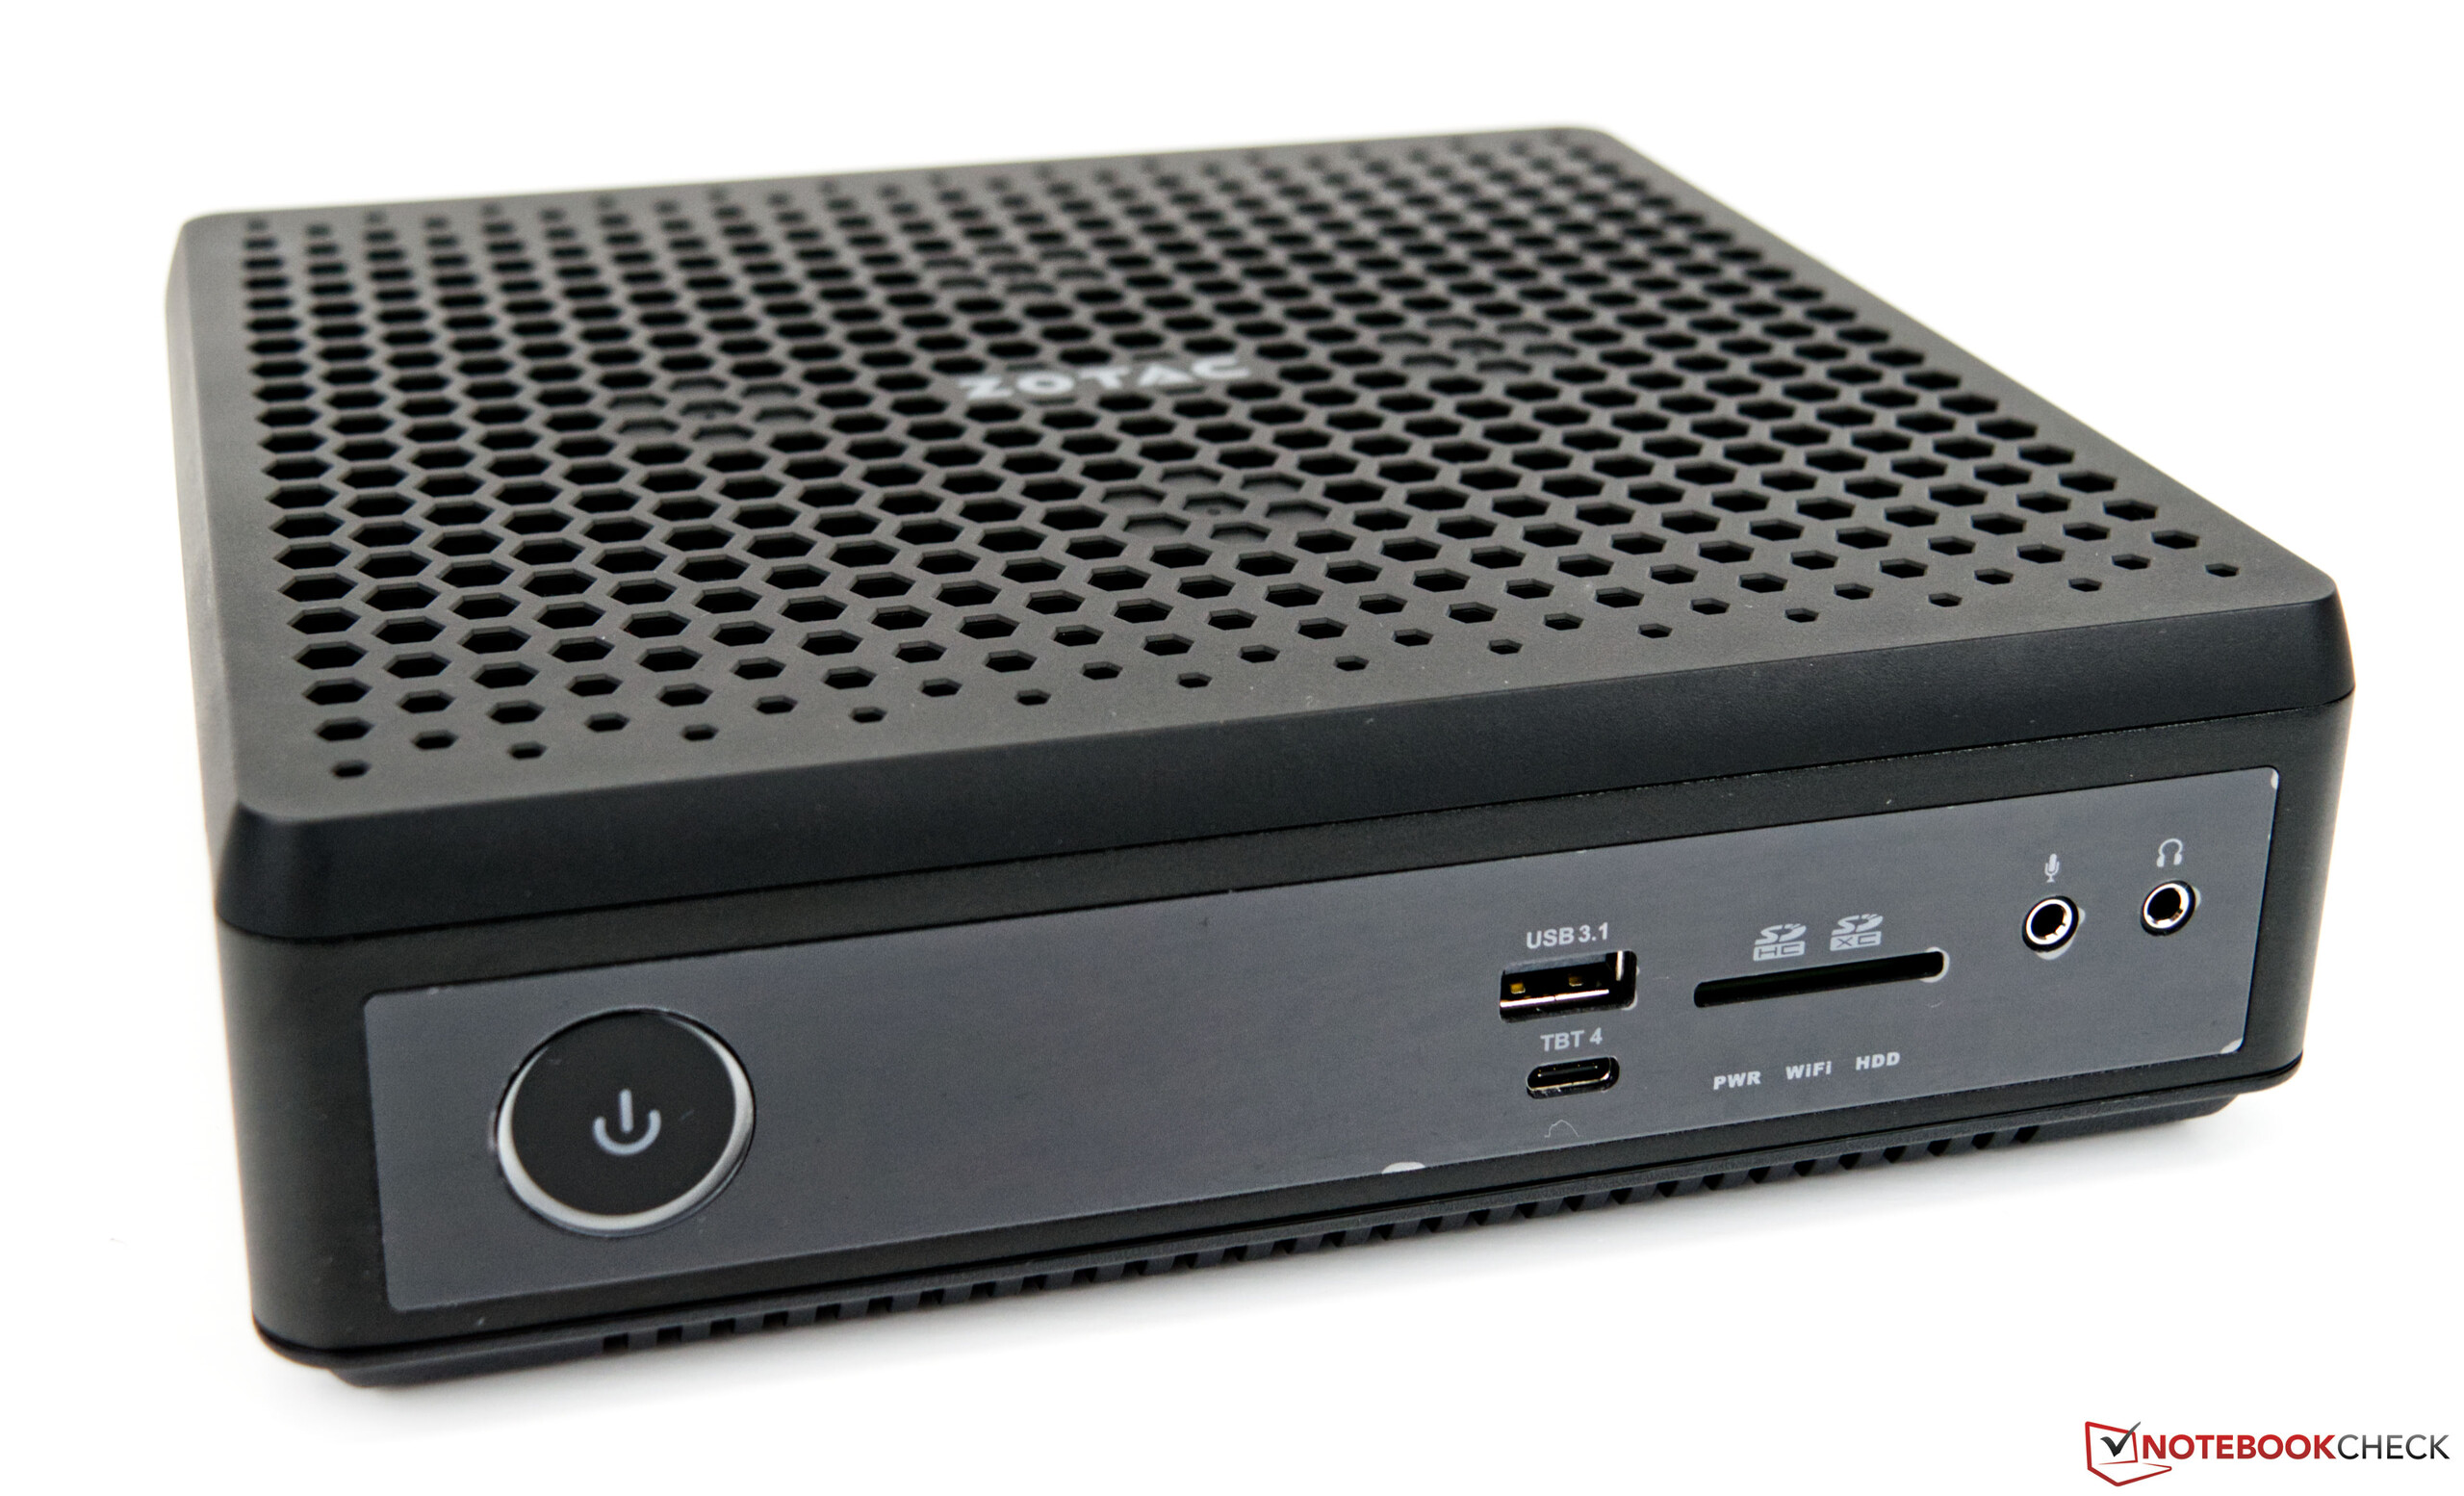
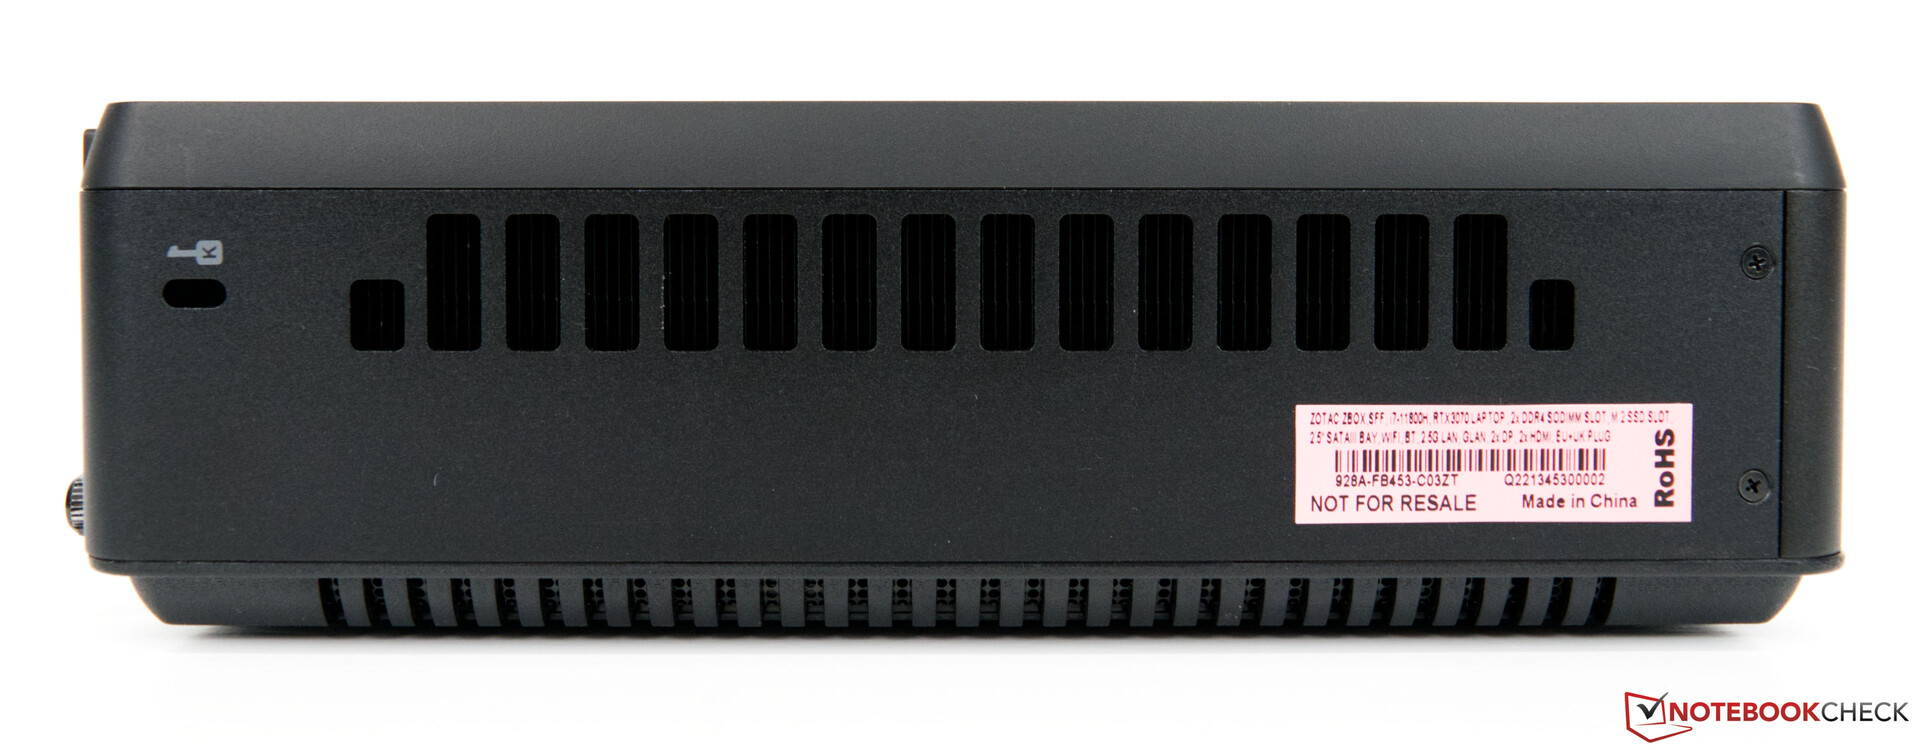
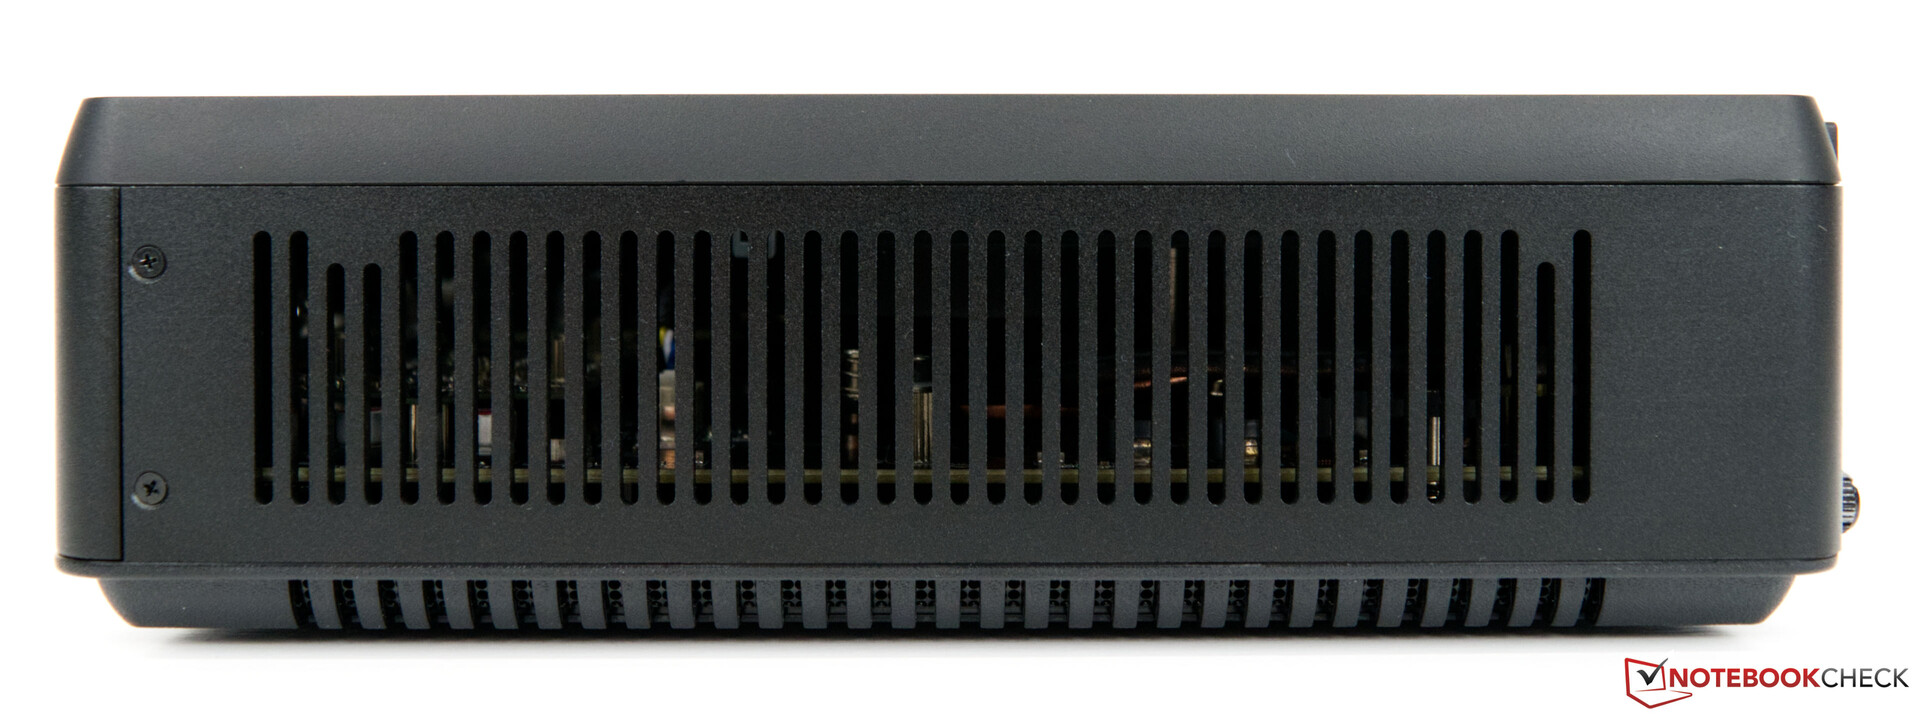
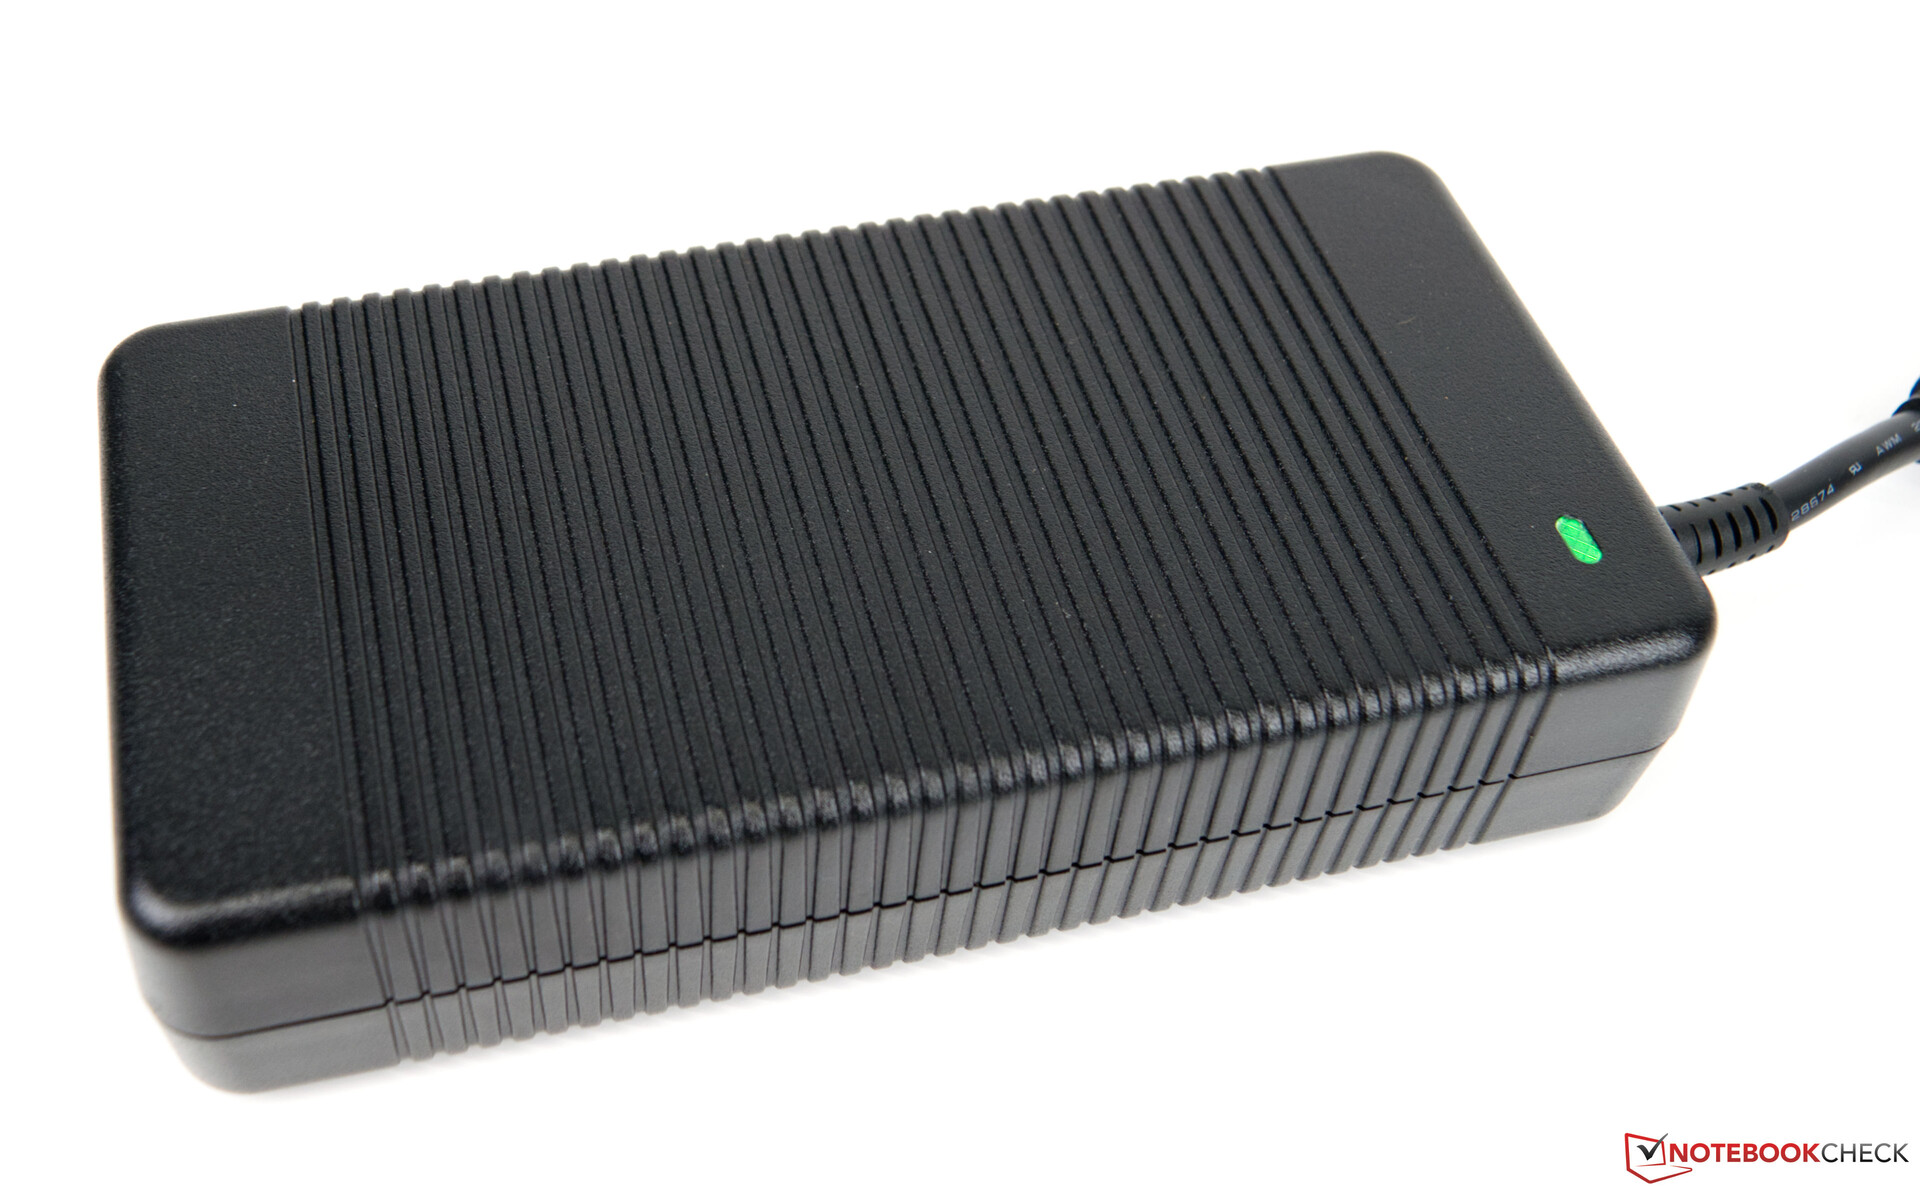
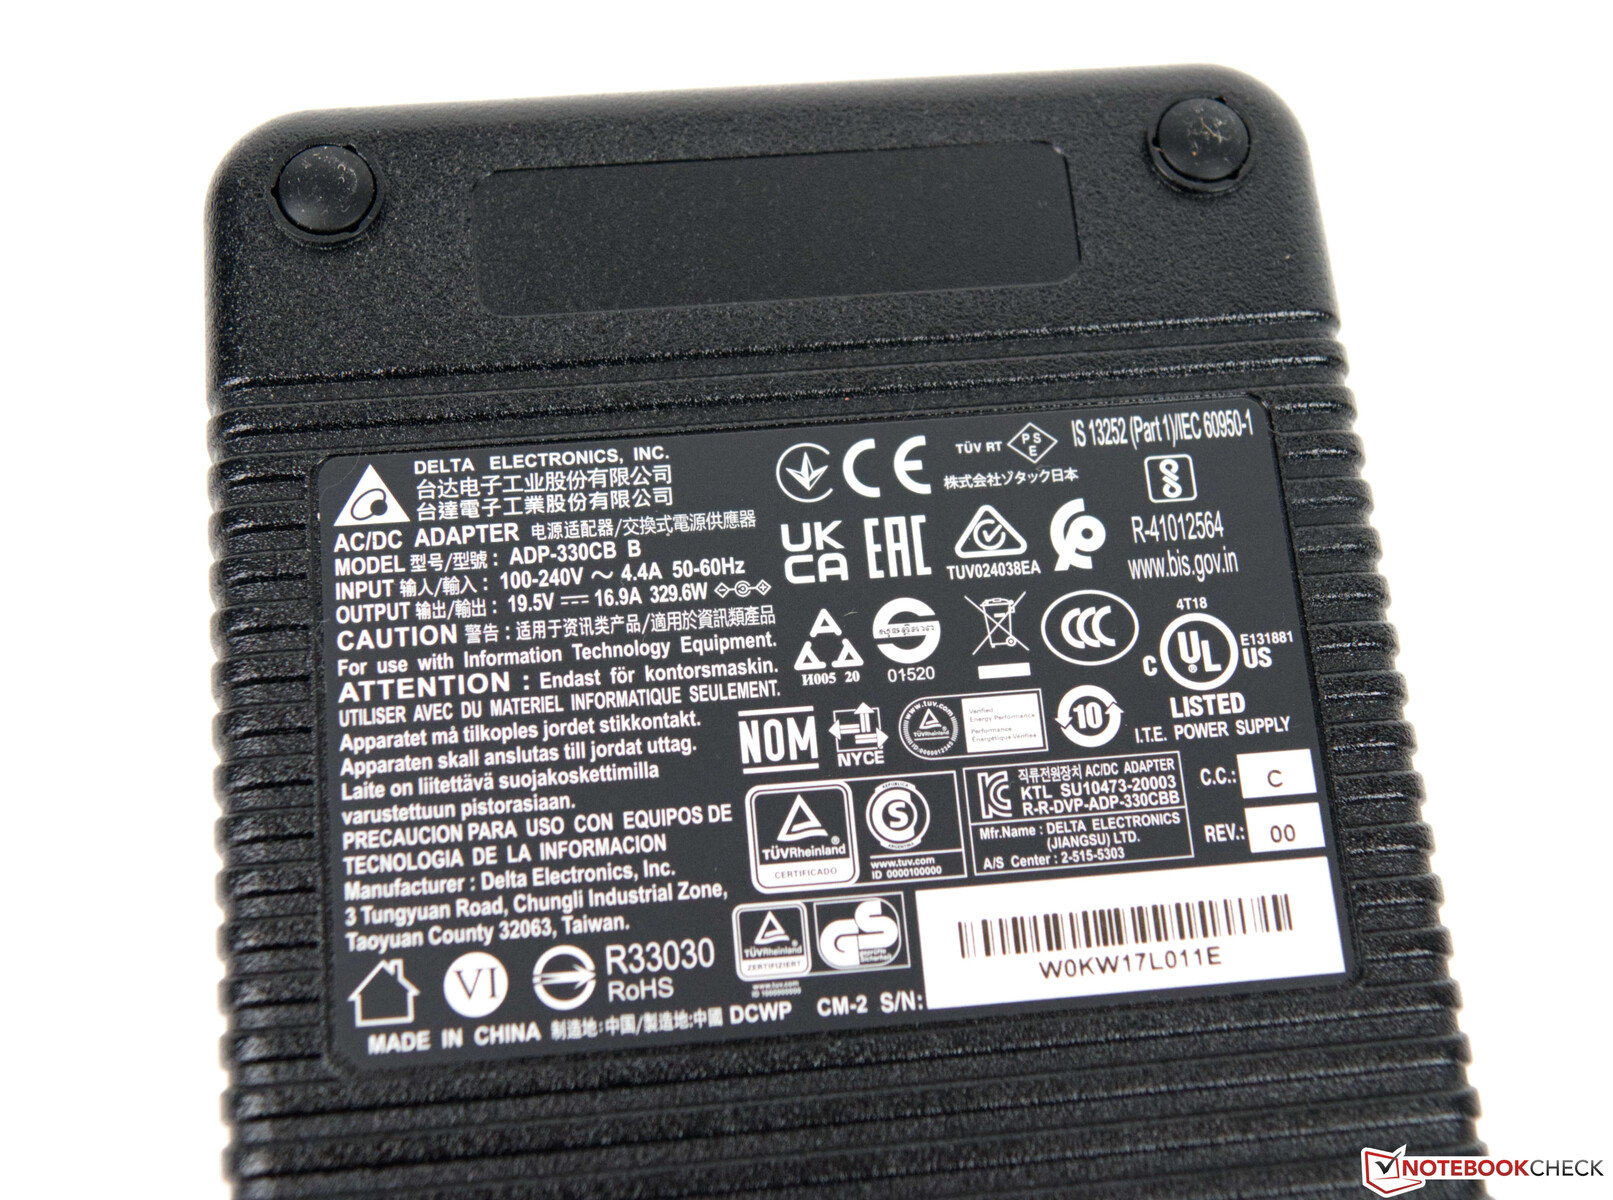
Visualmente, a Zotac ZBOX Magnus EN173070C pode ser claramente distinguida. A Zotac ZBOX Magnus EN72080V já estava baseada na caixa compacta, que só mudou minimamente na frente. As coisas também podem ser feitas completamente sem RGB, como a Zotac mostra aqui. Aqueles que gostam de um design simples e compacto ficarão satisfeitos. O case é feito de plástico e deixou uma boa impressão táctil em nossas mentes. Juntamente com a RAM e os dois SSDs M.2, o sistema pesa um pouco menos de 1,8 quilos (~4 lb). Acrescentada é a fonte de alimentação de 330 watts, que pesa 1,3 quilos (~2,9 lb). Em termos de tamanho, a fonte de energia é cerca da metade do tamanho da própria Magnus EN173070C, que não precisa de muito espaço a uma pegada de 21 x 20,3 cm (~8,3 x 8 pol.). Com uma altura de apenas 6,22 cm (~2,45 pol.), o dispositivo também é relativamente estreito.
Equipamento de conexão
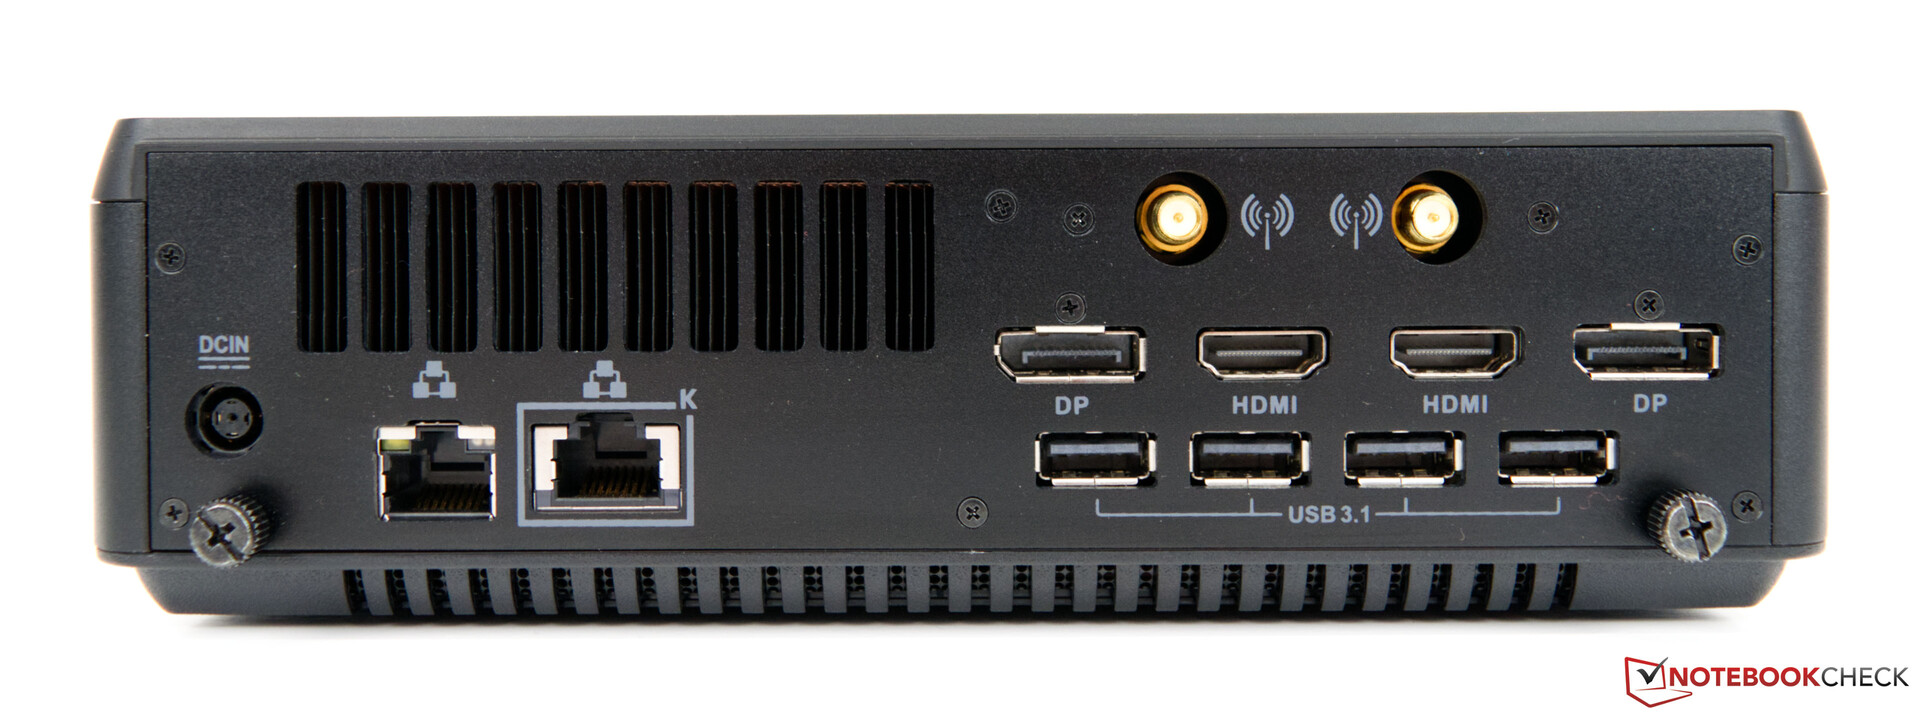
A Zotac ZBOX Magnus EN173070C oferece uma grande variedade de conexões externas, mas isto também deve ser esperado de um PC desktop. Há um total de cinco portas USB Tipo A e uma única conexão Tipo C, que suporta Thunderbolt 4. No entanto, esta última tem uma limitação na medida em que se destina apenas a dados. Além disso, é possível executar até quatro monitores externos simultaneamente. Para conectá-los, há duas portas DisplayPort e duas portas HDMI. Além disso, os usuários também não têm que viver sem um leitor de cartões SD.
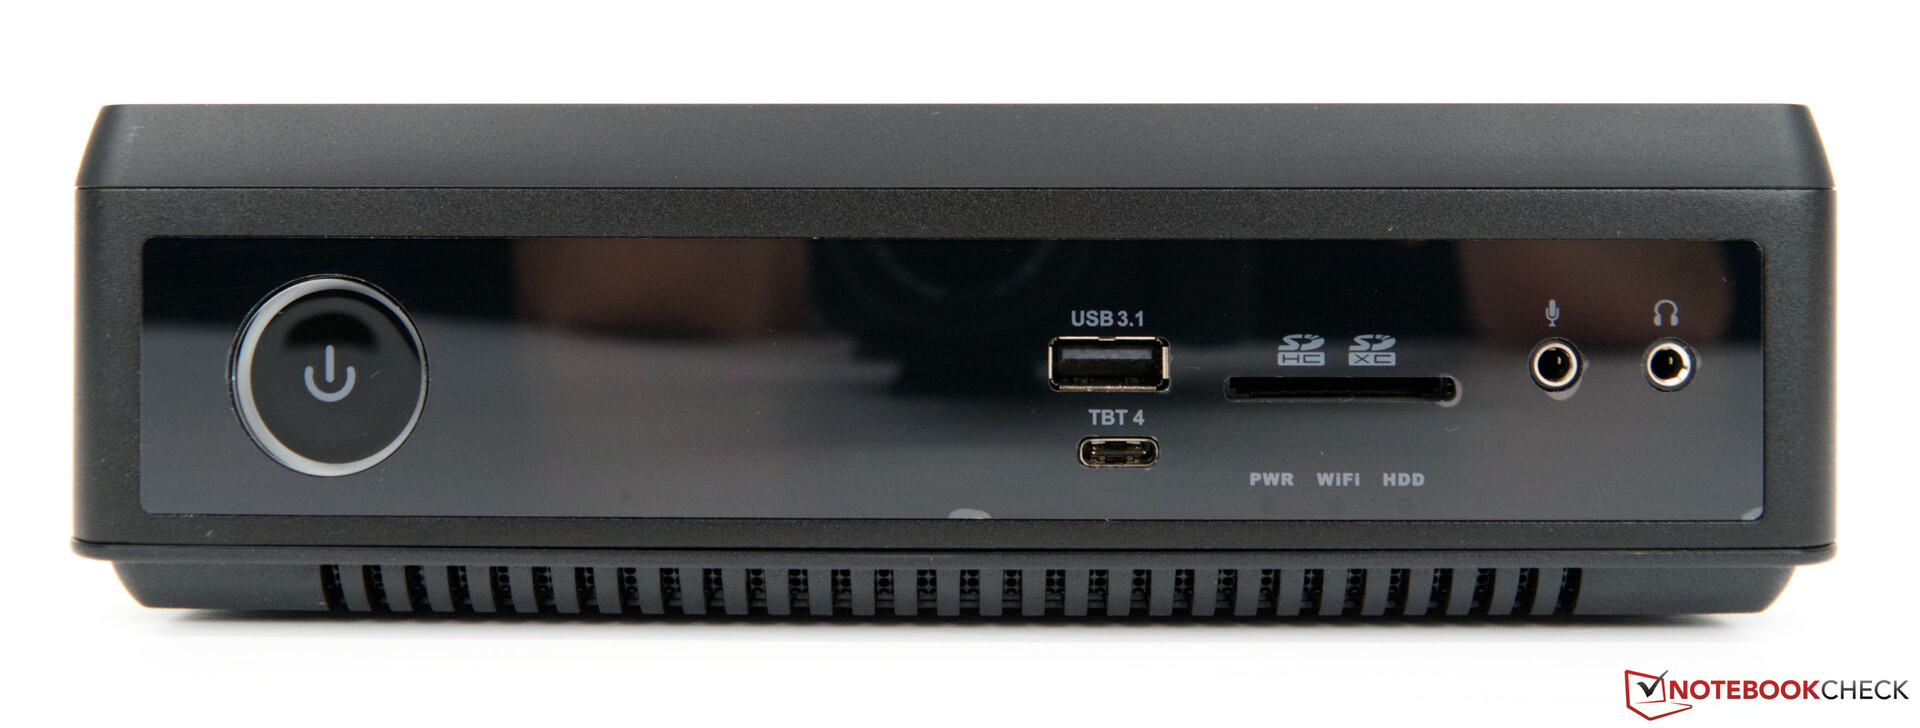
Leitor de cartões SD
O leitor de cartões SD dentro oferece velocidades USB-3 e é incapaz de usar o desempenho total de nosso cartão de teste (AV Pro SD microSD 128 GB V60). Em contraste, o Intel Dragon Canyon NUCmostra o que é possível com o apoio do UHS II.
| SD Card Reader | |
| average JPG Copy Test (av. of 3 runs) | |
| Intel Dragon Canyon NUC | |
| Zotac ZBOX Magnus EN173070C (AV Pro SD microSD 128 GB V60) | |
| maximum AS SSD Seq Read Test (1GB) | |
| Intel Dragon Canyon NUC | |
| Zotac ZBOX Magnus EN173070C (AV Pro SD microSD 128 GB V60) | |
Comunicação
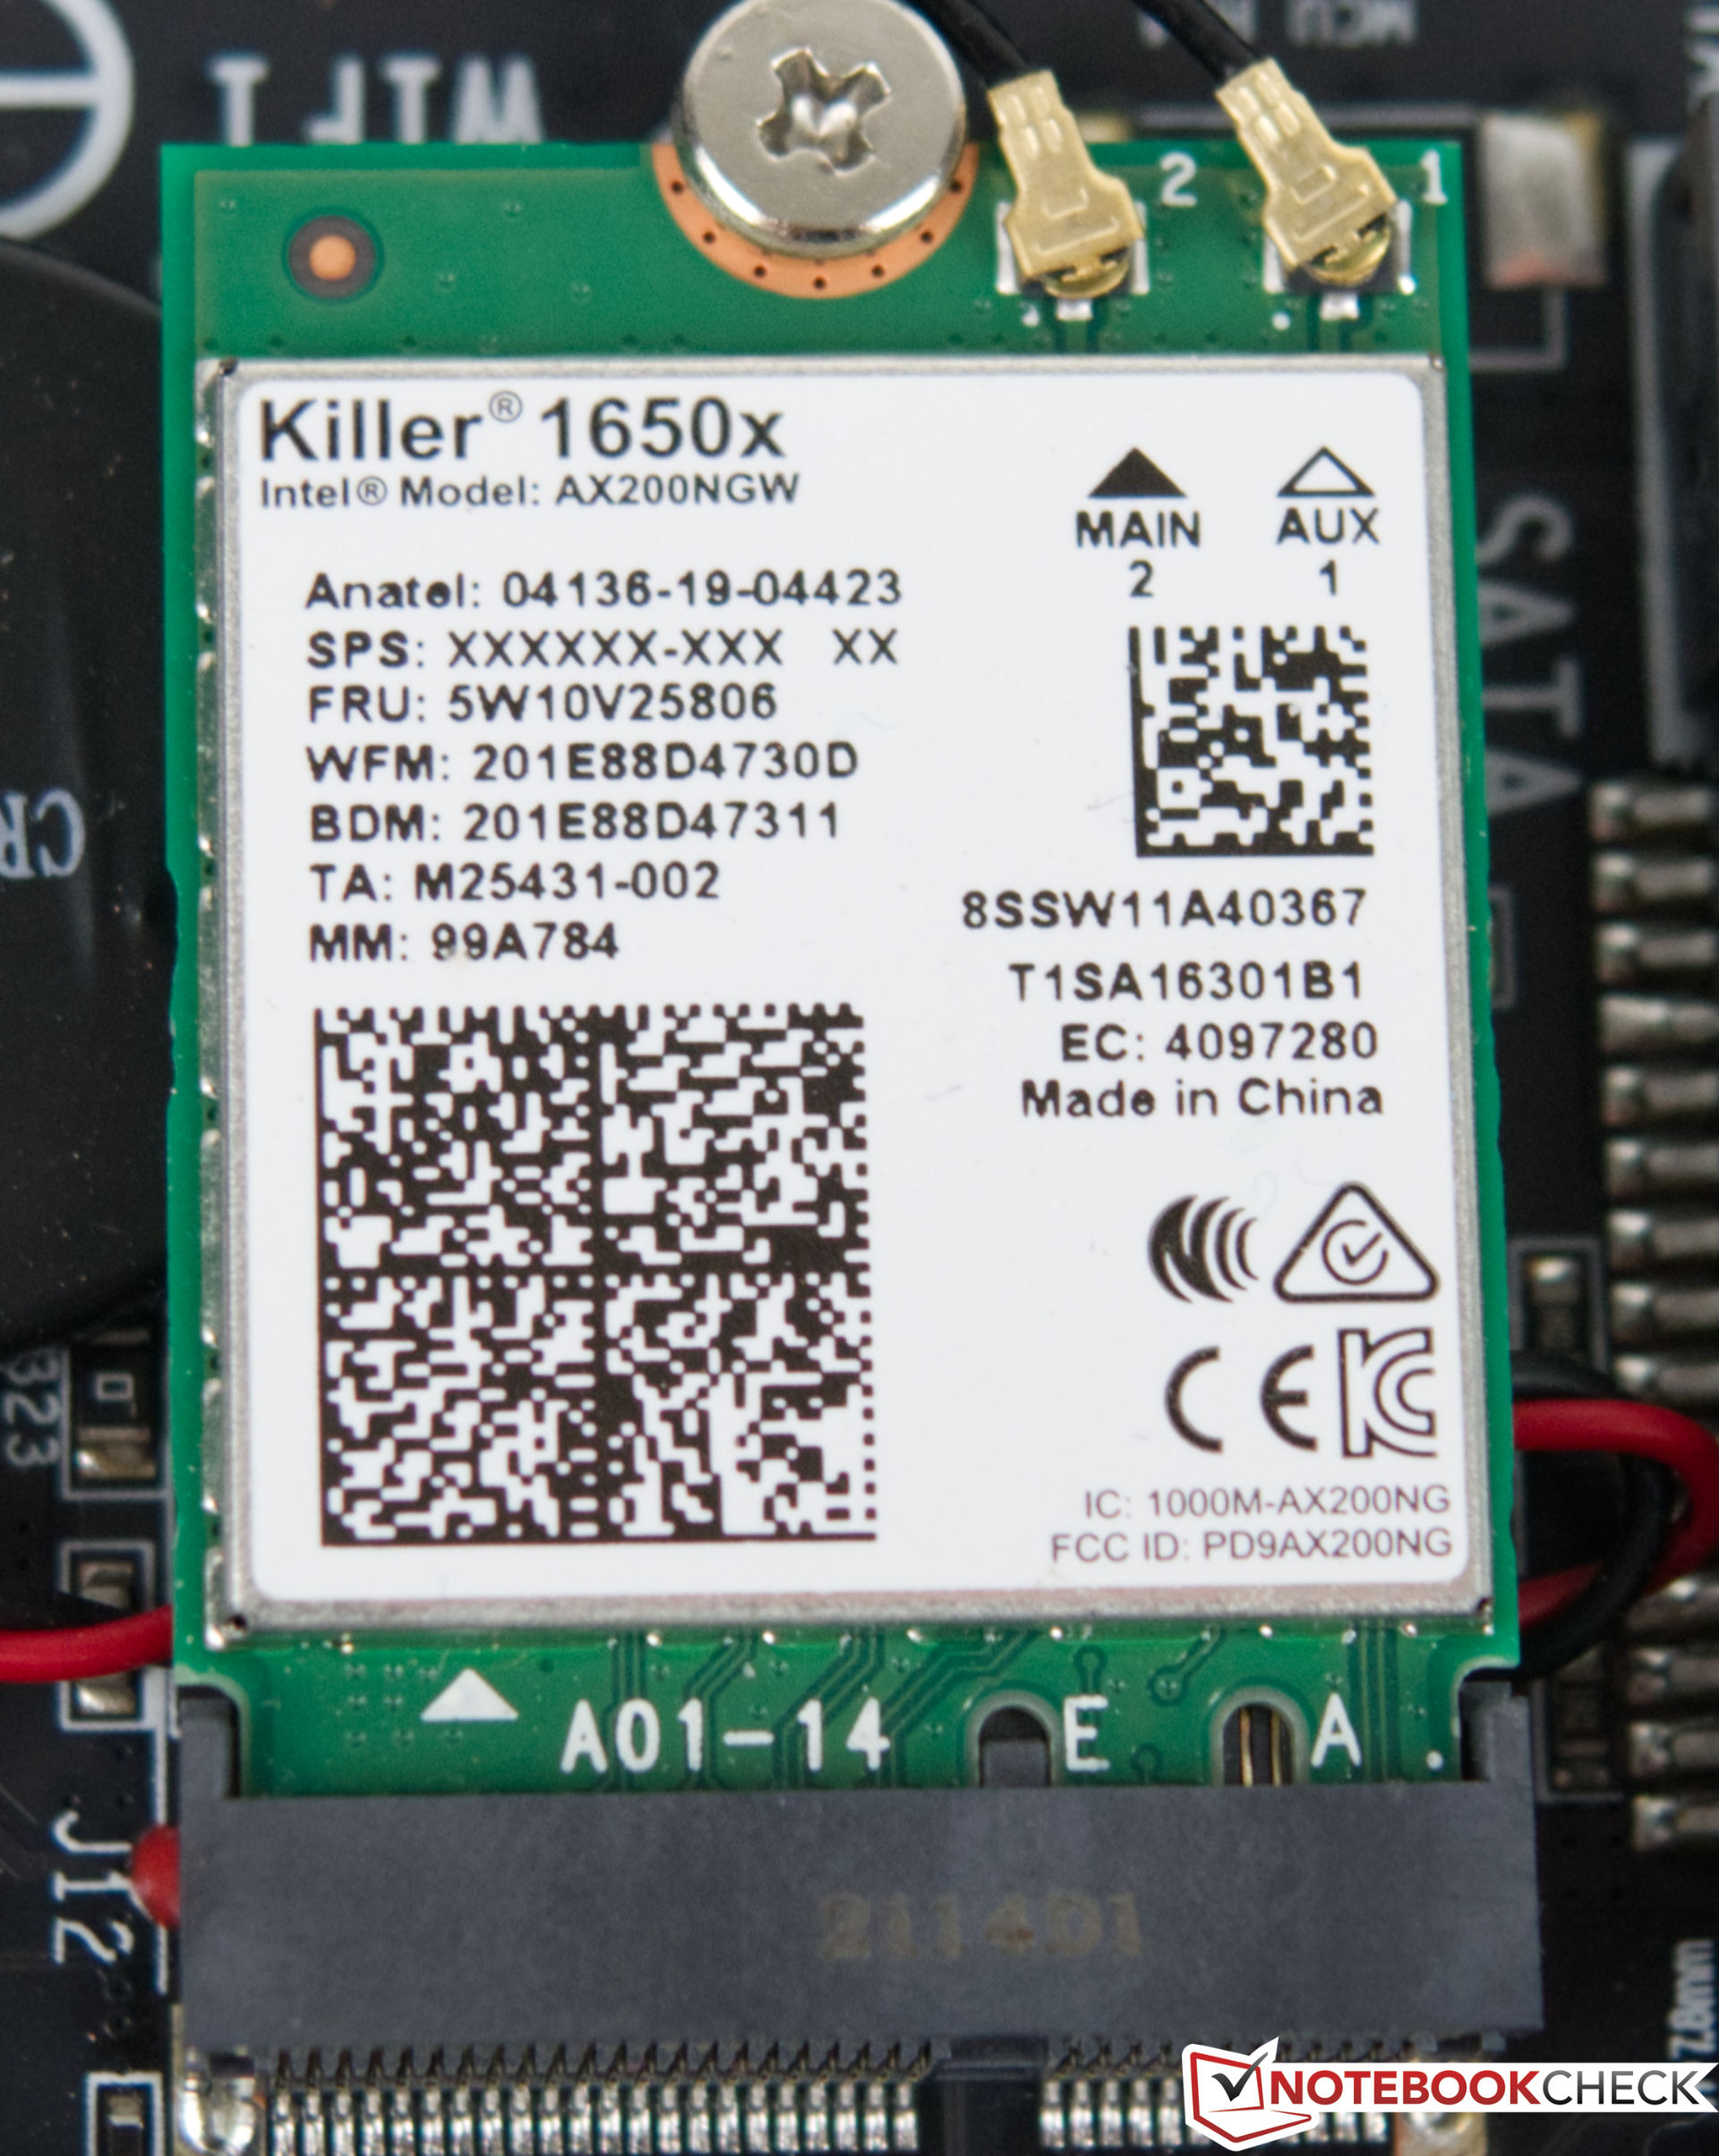
Zotac usa um módulo WLAN da Killer no Magnus EN173070C. O AX1650x oferece Wi-Fi 6 e faz um trabalho muito bom em nosso teste. O desempenho permanece estável mesmo durante um período de tempo mais longo e não há variações significativas. No entanto, na comparação direta, o Intel Dragon Canyon NUCcom o Intel Wi-Fi 6E AX211 é capaz de fornecer melhores valores. Realizamos o teste em condições ótimas utilizando o roteador para jogos Asus GT-AXE1000WiFi-6E WLAN.
Desempenho
Processador
A Zotac ZBOX Magnus EN173070C utiliza umIntel Core i7-11800HcPU. Este processador é realmente destinado a laptops e oferece 8 núcleos e 16 fios a uma velocidade máxima de clock de até 4,6 GHz. O SoC, que pertence à série Tiger Lake, faz um bom trabalho no sistema compacto. Zotac define o valor PL1 a 55 watts, e o sistema é capaz de consumir até 69 watts por um curto período de tempo. Embora o desempenho não se reflita realmente nos resultados, o SoC de nossa unidade de teste funciona ao nível de um Intel Core i9-10900Kdurante a carga do núcleo único, e às vezes é até capaz de ultrapassá-lo. Por outro lado, o Intel Core i7-11800H é ultrapassado peloAMD Ryzen 9 5900HXem muitos testes. Esperamos apenas um notável salto de desempenho com os SoCs do Alder Lake P da Intel. Talvez a Zotac já esteja planejando uma pequena atualização no futuro próximo, o que deverá melhorar o desempenho em todas as áreas.
| Cinebench R15 | |
| CPU Single 64Bit | |
| Intel Core i5-12600K, NVIDIA Titan RTX | |
| AMD Ryzen 7 5800X, NVIDIA Titan RTX | |
| AMD Ryzen 9 5900HX, AMD Radeon RX Vega 8 (Ryzen 4000/5000) | |
| Média Intel Core i7-11800H (201 - 231, n=46) | |
| Intel Core i9-10900K, NVIDIA Titan RTX | |
| Intel Core i7-11800H, NVIDIA GeForce RTX 3070 Laptop GPU | |
| Intel Core i9-9980HK, NVIDIA GeForce RTX 2070 (Desktop) | |
| Intel Core i5-10600K, NVIDIA Titan RTX | |
| Intel Core i7-10700, NVIDIA GeForce RTX 3070 | |
| CPU Multi 64Bit | |
| Intel Core i9-10900K, NVIDIA Titan RTX | |
| AMD Ryzen 7 5800X, NVIDIA Titan RTX | |
| Intel Core i5-12600K, NVIDIA Titan RTX | |
| AMD Ryzen 9 5900HX, AMD Radeon RX Vega 8 (Ryzen 4000/5000) | |
| Média Intel Core i7-11800H (1342 - 2173, n=50) | |
| Intel Core i7-11800H, NVIDIA GeForce RTX 3070 Laptop GPU | |
| Intel Core i9-9980HK, NVIDIA GeForce RTX 2070 (Desktop) | |
| Intel Core i7-10700, NVIDIA GeForce RTX 3070 | |
| Intel Core i5-10600K, NVIDIA Titan RTX | |
| Cinebench R20 | |
| CPU (Single Core) | |
| Intel Core i5-12600K, NVIDIA Titan RTX | |
| AMD Ryzen 7 5800X, NVIDIA Titan RTX | |
| AMD Ryzen 9 5900HX, AMD Radeon RX Vega 8 (Ryzen 4000/5000) | |
| Média Intel Core i7-11800H (520 - 586, n=47) | |
| Intel Core i7-11800H, NVIDIA GeForce RTX 3070 Laptop GPU | |
| Intel Core i9-10900K, NVIDIA Titan RTX | |
| Intel Core i9-9980HK, NVIDIA GeForce RTX 2070 (Desktop) | |
| Intel Core i5-10600K, NVIDIA Titan RTX | |
| CPU (Multi Core) | |
| Intel Core i5-12600K, NVIDIA Titan RTX | |
| Intel Core i9-10900K, NVIDIA Titan RTX | |
| AMD Ryzen 7 5800X, NVIDIA Titan RTX | |
| AMD Ryzen 9 5900HX, AMD Radeon RX Vega 8 (Ryzen 4000/5000) | |
| Média Intel Core i7-11800H (2498 - 5408, n=50) | |
| Intel Core i7-11800H, NVIDIA GeForce RTX 3070 Laptop GPU | |
| Intel Core i5-10600K, NVIDIA Titan RTX | |
| Intel Core i9-9980HK, NVIDIA GeForce RTX 2070 (Desktop) | |
| Cinebench R11.5 | |
| CPU Single 64Bit | |
| Intel Core i5-12600K, NVIDIA Titan RTX | |
| AMD Ryzen 7 5800X, NVIDIA Titan RTX | |
| AMD Ryzen 9 5900HX, AMD Radeon RX Vega 8 (Ryzen 4000/5000) | |
| Intel Core i7-11800H, NVIDIA GeForce RTX 3070 Laptop GPU | |
| Média Intel Core i7-11800H (2.45 - 2.62, n=4) | |
| Intel Core i9-10900K, NVIDIA Titan RTX | |
| Intel Core i9-9980HK, NVIDIA GeForce RTX 2070 (Desktop) | |
| Intel Core i7-10700, NVIDIA GeForce RTX 3070 | |
| Intel Core i5-10600K, NVIDIA Titan RTX | |
| CPU Multi 64Bit | |
| Intel Core i5-12600K, NVIDIA Titan RTX | |
| AMD Ryzen 7 5800X, NVIDIA Titan RTX | |
| Intel Core i9-10900K, NVIDIA Titan RTX | |
| AMD Ryzen 9 5900HX, AMD Radeon RX Vega 8 (Ryzen 4000/5000) | |
| Intel Core i7-11800H, NVIDIA GeForce RTX 3070 Laptop GPU | |
| Média Intel Core i7-11800H (16 - 21.9, n=4) | |
| Intel Core i9-9980HK, NVIDIA GeForce RTX 2070 (Desktop) | |
| Intel Core i7-10700, NVIDIA GeForce RTX 3070 | |
| Intel Core i5-10600K, NVIDIA Titan RTX | |
| Cinebench R10 | |
| Rendering Single CPUs 64Bit | |
| Intel Core i5-12600K, NVIDIA Titan RTX | |
| AMD Ryzen 7 5800X, NVIDIA Titan RTX | |
| AMD Ryzen 9 5900HX, AMD Radeon RX Vega 8 (Ryzen 4000/5000) | |
| Intel Core i7-11800H, NVIDIA GeForce RTX 3070 Laptop GPU | |
| Média Intel Core i7-11800H (10903 - 11957, n=4) | |
| Intel Core i9-10900K, NVIDIA Titan RTX | |
| Intel Core i9-9980HK, NVIDIA GeForce RTX 2070 (Desktop) | |
| Intel Core i7-10700, NVIDIA GeForce RTX 3070 | |
| Intel Core i5-10600K, NVIDIA Titan RTX | |
| Rendering Multiple CPUs 64Bit | |
| Intel Core i5-12600K, NVIDIA Titan RTX | |
| AMD Ryzen 7 5800X, NVIDIA Titan RTX | |
| Intel Core i9-10900K, NVIDIA Titan RTX | |
| AMD Ryzen 9 5900HX, AMD Radeon RX Vega 8 (Ryzen 4000/5000) | |
| Intel Core i7-11800H, NVIDIA GeForce RTX 3070 Laptop GPU | |
| Média Intel Core i7-11800H (49232 - 67486, n=4) | |
| Intel Core i9-9980HK, NVIDIA GeForce RTX 2070 (Desktop) | |
| Intel Core i7-10700, NVIDIA GeForce RTX 3070 | |
| Intel Core i5-10600K, NVIDIA Titan RTX | |
| Blender - v2.79 BMW27 CPU | |
| Intel Core i9-9980HK, NVIDIA GeForce RTX 2070 (Desktop) | |
| Intel Core i7-10700, NVIDIA GeForce RTX 3070 | |
| Intel Core i5-10600K, NVIDIA Titan RTX | |
| Intel Core i7-11800H, NVIDIA GeForce RTX 3070 Laptop GPU | |
| Média Intel Core i7-11800H (217 - 454, n=46) | |
| AMD Ryzen 9 5900HX, AMD Radeon RX Vega 8 (Ryzen 4000/5000) | |
| AMD Ryzen 7 5800X, NVIDIA Titan RTX | |
| Intel Core i5-12600K, NVIDIA Titan RTX | |
| Intel Core i9-10900K, NVIDIA Titan RTX | |
| wPrime 2.10 | |
| 32m | |
| Intel Core i5-12600K, NVIDIA Titan RTX | |
| Intel Core i5-10600K, NVIDIA Titan RTX | |
| Intel Core i7-11800H, NVIDIA GeForce RTX 3070 Laptop GPU | |
| Média Intel Core i7-11800H (3.41 - 4.19, n=3) | |
| Intel Core i9-9980HK, NVIDIA GeForce RTX 2070 (Desktop) | |
| Intel Core i9-10900K, NVIDIA Titan RTX | |
| AMD Ryzen 9 5900HX, AMD Radeon RX Vega 8 (Ryzen 4000/5000) | |
| Intel Core i7-10700, NVIDIA GeForce RTX 3070 | |
| AMD Ryzen 7 5800X, NVIDIA Titan RTX | |
| 1024m | |
| Intel Core i5-12600K, NVIDIA Titan RTX | |
| Intel Core i7-11800H, NVIDIA GeForce RTX 3070 Laptop GPU | |
| Intel Core i9-9980HK, NVIDIA GeForce RTX 2070 (Desktop) | |
| Intel Core i7-10700, NVIDIA GeForce RTX 3070 | |
| Média Intel Core i7-11800H (98.3 - 121.1, n=3) | |
| Intel Core i5-10600K, NVIDIA Titan RTX | |
| AMD Ryzen 9 5900HX, AMD Radeon RX Vega 8 (Ryzen 4000/5000) | |
| AMD Ryzen 7 5800X, NVIDIA Titan RTX | |
| Intel Core i9-10900K, NVIDIA Titan RTX | |
| X264 HD Benchmark 4.0 | |
| Pass 1 | |
| AMD Ryzen 7 5800X, NVIDIA Titan RTX | |
| Intel Core i5-12600K, NVIDIA Titan RTX | |
| Intel Core i9-10900K, NVIDIA Titan RTX | |
| AMD Ryzen 9 5900HX, AMD Radeon RX Vega 8 (Ryzen 4000/5000) | |
| Intel Core i5-10600K, NVIDIA Titan RTX | |
| Média Intel Core i7-11800H (242 - 258, n=3) | |
| Intel Core i7-11800H, NVIDIA GeForce RTX 3070 Laptop GPU | |
| Intel Core i9-9980HK, NVIDIA GeForce RTX 2070 (Desktop) | |
| Intel Core i7-10700, NVIDIA GeForce RTX 3070 | |
| Pass 2 | |
| AMD Ryzen 7 5800X, NVIDIA Titan RTX | |
| Intel Core i9-10900K, NVIDIA Titan RTX | |
| Intel Core i5-12600K, NVIDIA Titan RTX | |
| AMD Ryzen 9 5900HX, AMD Radeon RX Vega 8 (Ryzen 4000/5000) | |
| Média Intel Core i7-11800H (86.3 - 109.3, n=3) | |
| Intel Core i7-11800H, NVIDIA GeForce RTX 3070 Laptop GPU | |
| Intel Core i9-9980HK, NVIDIA GeForce RTX 2070 (Desktop) | |
| Intel Core i5-10600K, NVIDIA Titan RTX | |
| Intel Core i7-10700, NVIDIA GeForce RTX 3070 | |
| WinRAR - Result | |
| AMD Ryzen 7 5800X, NVIDIA Titan RTX | |
| Intel Core i9-10900K, NVIDIA Titan RTX | |
| Média Intel Core i7-11800H (7925 - 8569, n=3) | |
| Intel Core i7-11800H, NVIDIA GeForce RTX 3070 Laptop GPU | |
| Intel Core i9-9980HK, NVIDIA GeForce RTX 2070 (Desktop) | |
| Intel Core i7-10700, NVIDIA GeForce RTX 3070 | |
| Intel Core i5-10600K, NVIDIA Titan RTX | |
| Intel Core i5-12600K, NVIDIA Titan RTX | |
| AMD Ryzen 9 5900HX, AMD Radeon RX Vega 8 (Ryzen 4000/5000) | |
| Geekbench 5.5 | |
| Multi-Core | |
| Intel Core i5-12600K, NVIDIA Titan RTX | |
| Intel Core i9-10900K, NVIDIA Titan RTX | |
| AMD Ryzen 7 5800X, NVIDIA Titan RTX | |
| Média Intel Core i7-11800H (4655 - 9851, n=40) | |
| Intel Core i7-11800H, NVIDIA GeForce RTX 3070 Laptop GPU | |
| Intel Core i7-10700, NVIDIA GeForce RTX 3070 | |
| AMD Ryzen 9 5900HX, AMD Radeon RX Vega 8 (Ryzen 4000/5000) | |
| Intel Core i9-9980HK, NVIDIA GeForce RTX 2070 (Desktop) | |
| Intel Core i5-10600K, NVIDIA Titan RTX | |
| Single-Core | |
| Intel Core i5-12600K, NVIDIA Titan RTX | |
| AMD Ryzen 7 5800X, NVIDIA Titan RTX | |
| Intel Core i7-11800H, NVIDIA GeForce RTX 3070 Laptop GPU | |
| Média Intel Core i7-11800H (1429 - 1625, n=40) | |
| AMD Ryzen 9 5900HX, AMD Radeon RX Vega 8 (Ryzen 4000/5000) | |
| Intel Core i9-10900K, NVIDIA Titan RTX | |
| Intel Core i9-9980HK, NVIDIA GeForce RTX 2070 (Desktop) | |
| Intel Core i7-10700, NVIDIA GeForce RTX 3070 | |
| Intel Core i5-10600K, NVIDIA Titan RTX | |
| Geekbench 5.0 | |
| 5.0 Multi-Core | |
| Intel Core i5-12600K, NVIDIA Titan RTX | |
| Intel Core i9-10900K, NVIDIA Titan RTX | |
| AMD Ryzen 7 5800X, NVIDIA Titan RTX | |
| Intel Core i7-10700, NVIDIA GeForce RTX 3070 | |
| Intel Core i7-11800H, NVIDIA GeForce RTX 3070 Laptop GPU | |
| AMD Ryzen 9 5900HX, AMD Radeon RX Vega 8 (Ryzen 4000/5000) | |
| Média Intel Core i7-11800H (6340 - 9103, n=8) | |
| Intel Core i9-9980HK, NVIDIA GeForce RTX 2070 (Desktop) | |
| Intel Core i5-10600K, NVIDIA Titan RTX | |
| 5.0 Single-Core | |
| Intel Core i5-12600K, NVIDIA Titan RTX | |
| AMD Ryzen 7 5800X, NVIDIA Titan RTX | |
| Intel Core i7-11800H, NVIDIA GeForce RTX 3070 Laptop GPU | |
| Média Intel Core i7-11800H (1436 - 1571, n=8) | |
| AMD Ryzen 9 5900HX, AMD Radeon RX Vega 8 (Ryzen 4000/5000) | |
| Intel Core i9-10900K, NVIDIA Titan RTX | |
| Intel Core i9-9980HK, NVIDIA GeForce RTX 2070 (Desktop) | |
| Intel Core i7-10700, NVIDIA GeForce RTX 3070 | |
| Intel Core i5-10600K, NVIDIA Titan RTX | |
| Geekbench 4.4 | |
| 64 Bit Single-Core Score | |
| Intel Core i5-12600K, NVIDIA Titan RTX | |
| AMD Ryzen 7 5800X, NVIDIA Titan RTX | |
| Intel Core i7-11800H, NVIDIA GeForce RTX 3070 Laptop GPU | |
| Média Intel Core i7-11800H (6104 - 6747, n=7) | |
| AMD Ryzen 9 5900HX, AMD Radeon RX Vega 8 (Ryzen 4000/5000) | |
| Intel Core i9-10900K, NVIDIA Titan RTX | |
| Intel Core i9-9980HK, NVIDIA GeForce RTX 2070 (Desktop) | |
| Intel Core i5-10600K, NVIDIA Titan RTX | |
| Intel Core i7-10700, NVIDIA GeForce RTX 3070 | |
| 64 Bit Multi-Core Score | |
| Intel Core i5-12600K, NVIDIA Titan RTX | |
| AMD Ryzen 7 5800X, NVIDIA Titan RTX | |
| Intel Core i9-10900K, NVIDIA Titan RTX | |
| Média Intel Core i7-11800H (27454 - 36706, n=7) | |
| Intel Core i7-11800H, NVIDIA GeForce RTX 3070 Laptop GPU | |
| AMD Ryzen 9 5900HX, AMD Radeon RX Vega 8 (Ryzen 4000/5000) | |
| Intel Core i7-10700, NVIDIA GeForce RTX 3070 | |
| Intel Core i9-9980HK, NVIDIA GeForce RTX 2070 (Desktop) | |
| Intel Core i5-10600K, NVIDIA Titan RTX | |
| 3DMark 11 - 1280x720 Performance Physics | |
| Intel Core i5-12600K, NVIDIA Titan RTX | |
| AMD Ryzen 7 5800X, NVIDIA Titan RTX | |
| Intel Core i9-10900K, NVIDIA Titan RTX | |
| Intel Core i9-9980HK, NVIDIA GeForce RTX 2070 (Desktop) | |
| Média Intel Core i7-11800H (10590 - 19167, n=46) | |
| Intel Core i5-10600K, NVIDIA Titan RTX | |
| Intel Core i7-11800H, NVIDIA GeForce RTX 3070 Laptop GPU | |
| Intel Core i7-10700, NVIDIA GeForce RTX 3070 | |
| AMD Ryzen 9 5900HX, AMD Radeon RX Vega 8 (Ryzen 4000/5000) | |
| 7-Zip 18.03 | |
| 7z b 4 | |
| AMD Ryzen 7 5800X, NVIDIA Titan RTX | |
| Intel Core i9-10900K, NVIDIA Titan RTX | |
| Intel Core i5-12600K, NVIDIA Titan RTX | |
| AMD Ryzen 9 5900HX, AMD Radeon RX Vega 8 (Ryzen 4000/5000) | |
| Média Intel Core i7-11800H (33718 - 56758, n=46) | |
| Intel Core i7-11800H, NVIDIA GeForce RTX 3070 Laptop GPU | |
| Intel Core i9-9980HK, NVIDIA GeForce RTX 2070 (Desktop) | |
| Intel Core i7-10700, NVIDIA GeForce RTX 3070 | |
| Intel Core i5-10600K, NVIDIA Titan RTX | |
| 7z b 4 -mmt1 | |
| AMD Ryzen 7 5800X, NVIDIA Titan RTX | |
| Intel Core i9-10900K, NVIDIA Titan RTX | |
| Intel Core i5-12600K, NVIDIA Titan RTX | |
| AMD Ryzen 9 5900HX, AMD Radeon RX Vega 8 (Ryzen 4000/5000) | |
| Intel Core i9-9980HK, NVIDIA GeForce RTX 2070 (Desktop) | |
| Intel Core i7-11800H, NVIDIA GeForce RTX 3070 Laptop GPU | |
| Média Intel Core i7-11800H (5138 - 5732, n=46) | |
| Intel Core i7-10700, NVIDIA GeForce RTX 3070 | |
| Intel Core i5-10600K, NVIDIA Titan RTX | |
| HWBOT x265 Benchmark v2.2 - 4k Preset | |
| Intel Core i5-12600K, NVIDIA Titan RTX | |
| Intel Core i9-10900K, NVIDIA Titan RTX | |
| AMD Ryzen 7 5800X, NVIDIA Titan RTX | |
| AMD Ryzen 9 5900HX, AMD Radeon RX Vega 8 (Ryzen 4000/5000) | |
| Média Intel Core i7-11800H (7.38 - 17.4, n=46) | |
| Intel Core i7-11800H, NVIDIA GeForce RTX 3070 Laptop GPU | |
| Intel Core i5-10600K, NVIDIA Titan RTX | |
| Intel Core i7-10700, NVIDIA GeForce RTX 3070 | |
| Intel Core i9-9980HK, NVIDIA GeForce RTX 2070 (Desktop) | |
| R Benchmark 2.5 - Overall mean | |
| Intel Core i5-10600K, NVIDIA Titan RTX | |
| Intel Core i7-10700, NVIDIA GeForce RTX 3070 | |
| Média Intel Core i7-11800H (0.548 - 0.615, n=46) | |
| Intel Core i7-11800H, NVIDIA GeForce RTX 3070 Laptop GPU | |
| Intel Core i9-9980HK, NVIDIA GeForce RTX 2070 (Desktop) | |
| Intel Core i9-10900K, NVIDIA Titan RTX | |
| AMD Ryzen 9 5900HX, AMD Radeon RX Vega 8 (Ryzen 4000/5000) | |
| AMD Ryzen 7 5800X, NVIDIA Titan RTX | |
| Intel Core i5-12600K, NVIDIA Titan RTX | |
| LibreOffice - 20 Documents To PDF | |
| Intel Core i9-10900K, NVIDIA Titan RTX | |
| Intel Core i5-12600K, NVIDIA Titan RTX | |
| Intel Core i7-10700, NVIDIA GeForce RTX 3070 | |
| AMD Ryzen 9 5900HX, AMD Radeon RX Vega 8 (Ryzen 4000/5000) | |
| Intel Core i7-11800H, NVIDIA GeForce RTX 3070 Laptop GPU | |
| Média Intel Core i7-11800H (38.6 - 59.9, n=45) | |
| Intel Core i5-10600K, NVIDIA Titan RTX | |
| Intel Core i9-9980HK, NVIDIA GeForce RTX 2070 (Desktop) | |
| AMD Ryzen 7 5800X, NVIDIA Titan RTX | |
| WebXPRT 3 - Overall | |
| AMD Ryzen 7 5800X, NVIDIA Titan RTX | |
| Intel Core i5-12600K, NVIDIA Titan RTX | |
| AMD Ryzen 9 5900HX, AMD Radeon RX Vega 8 (Ryzen 4000/5000) | |
| Intel Core i7-11800H, NVIDIA GeForce RTX 3070 Laptop GPU | |
| Média Intel Core i7-11800H (251 - 280, n=40) | |
| Intel Core i9-10900K, NVIDIA Titan RTX | |
| Intel Core i7-10700, NVIDIA GeForce RTX 3070 | |
| Intel Core i5-10600K, NVIDIA Titan RTX | |
| Intel Core i9-9980HK, NVIDIA GeForce RTX 2070 (Desktop) | |
| Mozilla Kraken 1.1 - Total | |
| Intel Core i5-10600K, NVIDIA Titan RTX | |
| Intel Core i9-9980HK, NVIDIA GeForce RTX 2070 (Desktop) | |
| Intel Core i7-10700, NVIDIA GeForce RTX 3070 | |
| Intel Core i9-10900K, NVIDIA Titan RTX | |
| Média Intel Core i7-11800H (600 - 690, n=45) | |
| Intel Core i7-11800H, NVIDIA GeForce RTX 3070 Laptop GPU | |
| AMD Ryzen 9 5900HX, AMD Radeon RX Vega 8 (Ryzen 4000/5000) | |
| AMD Ryzen 7 5800X, NVIDIA Titan RTX | |
| Intel Core i5-12600K, NVIDIA Titan RTX | |
* ... menor é melhor
AIDA64: FP32 Ray-Trace | FPU Julia | CPU SHA3 | CPU Queen | FPU SinJulia | FPU Mandel | CPU AES | CPU ZLib | FP64 Ray-Trace | CPU PhotoWorxx
| Performance rating | |
| Média da turma Desktop | |
| Minisforum EliteMini HX90 | |
| AMD Ryzen 7 5800X | |
| Zotac ZBOX Magnus EN173070C | |
| Média Intel Core i7-11800H | |
| Intel Core i5-12600K | |
| Intel Ghost Canyon NUC (RTX 2070) -1! | |
| AIDA64 / FP32 Ray-Trace | |
| Média da turma Desktop (12248 - 84577, n=21, últimos 2 anos) | |
| AMD Ryzen 7 5800X | |
| Minisforum EliteMini HX90 | |
| Média Intel Core i7-11800H (8772 - 15961, n=20) | |
| Zotac ZBOX Magnus EN173070C | |
| Intel Ghost Canyon NUC (RTX 2070) | |
| Intel Core i5-12600K | |
| AIDA64 / FPU Julia | |
| Média da turma Desktop (65152 - 246125, n=21, últimos 2 anos) | |
| Minisforum EliteMini HX90 | |
| AMD Ryzen 7 5800X | |
| Média Intel Core i7-11800H (39404 - 65636, n=20) | |
| Zotac ZBOX Magnus EN173070C | |
| Intel Ghost Canyon NUC (RTX 2070) | |
| Intel Core i5-12600K | |
| AIDA64 / CPU SHA3 | |
| Média da turma Desktop (2982 - 10804, n=21, últimos 2 anos) | |
| Média Intel Core i7-11800H (2599 - 4439, n=20) | |
| Zotac ZBOX Magnus EN173070C | |
| Minisforum EliteMini HX90 | |
| Intel Core i5-12600K | |
| Intel Ghost Canyon NUC (RTX 2070) | |
| AMD Ryzen 7 5800X | |
| AIDA64 / CPU Queen | |
| Média da turma Desktop (76512 - 187912, n=18, últimos 2 anos) | |
| AMD Ryzen 7 5800X | |
| Minisforum EliteMini HX90 | |
| Média Intel Core i7-11800H (85233 - 91941, n=20) | |
| Zotac ZBOX Magnus EN173070C | |
| Intel Core i5-12600K | |
| AIDA64 / FPU SinJulia | |
| Média da turma Desktop (6443 - 35251, n=21, últimos 2 anos) | |
| AMD Ryzen 7 5800X | |
| Minisforum EliteMini HX90 | |
| Intel Core i5-12600K | |
| Zotac ZBOX Magnus EN173070C | |
| Intel Ghost Canyon NUC (RTX 2070) | |
| Média Intel Core i7-11800H (6420 - 9792, n=20) | |
| AIDA64 / FPU Mandel | |
| Média da turma Desktop (31697 - 129745, n=21, últimos 2 anos) | |
| Minisforum EliteMini HX90 | |
| AMD Ryzen 7 5800X | |
| Média Intel Core i7-11800H (23365 - 39464, n=20) | |
| Zotac ZBOX Magnus EN173070C | |
| Intel Ghost Canyon NUC (RTX 2070) | |
| Intel Core i5-12600K | |
| AIDA64 / CPU AES | |
| Média da turma Desktop (57777 - 513073, n=21, últimos 2 anos) | |
| Minisforum EliteMini HX90 | |
| Zotac ZBOX Magnus EN173070C | |
| Média Intel Core i7-11800H (74617 - 149388, n=20) | |
| AMD Ryzen 7 5800X | |
| Intel Core i5-12600K | |
| Intel Ghost Canyon NUC (RTX 2070) | |
| AIDA64 / CPU ZLib | |
| Média da turma Desktop (887 - 2674, n=21, últimos 2 anos) | |
| Intel Core i5-12600K | |
| AMD Ryzen 7 5800X | |
| Minisforum EliteMini HX90 | |
| Zotac ZBOX Magnus EN173070C | |
| Intel Ghost Canyon NUC (RTX 2070) | |
| Média Intel Core i7-11800H (461 - 830, n=43) | |
| AIDA64 / FP64 Ray-Trace | |
| Média da turma Desktop (6471 - 44013, n=21, últimos 2 anos) | |
| AMD Ryzen 7 5800X | |
| Minisforum EliteMini HX90 | |
| Média Intel Core i7-11800H (4545 - 8717, n=21) | |
| Zotac ZBOX Magnus EN173070C | |
| Intel Ghost Canyon NUC (RTX 2070) | |
| Intel Core i5-12600K | |
| AIDA64 / CPU PhotoWorxx | |
| Intel Core i5-12600K | |
| Média da turma Desktop (38071 - 63949, n=21, últimos 2 anos) | |
| AMD Ryzen 7 5800X | |
| Zotac ZBOX Magnus EN173070C | |
| Intel Ghost Canyon NUC (RTX 2070) | |
| Média Intel Core i7-11800H (11898 - 26757, n=21) | |
| Minisforum EliteMini HX90 | |
Zotac ZBOX Magnus Durante a Cinebench R15 Multi Loop
A construção compacta requer um sistema de refrigeração bem projetado e eficaz. A Zotac oferece exatamente isso aqui, já que não medimos nenhuma perda forte de desempenho sob carga constante durante a repetida malha de carga Cinebench R15.
Desempenho da aplicação e solução de armazenamento
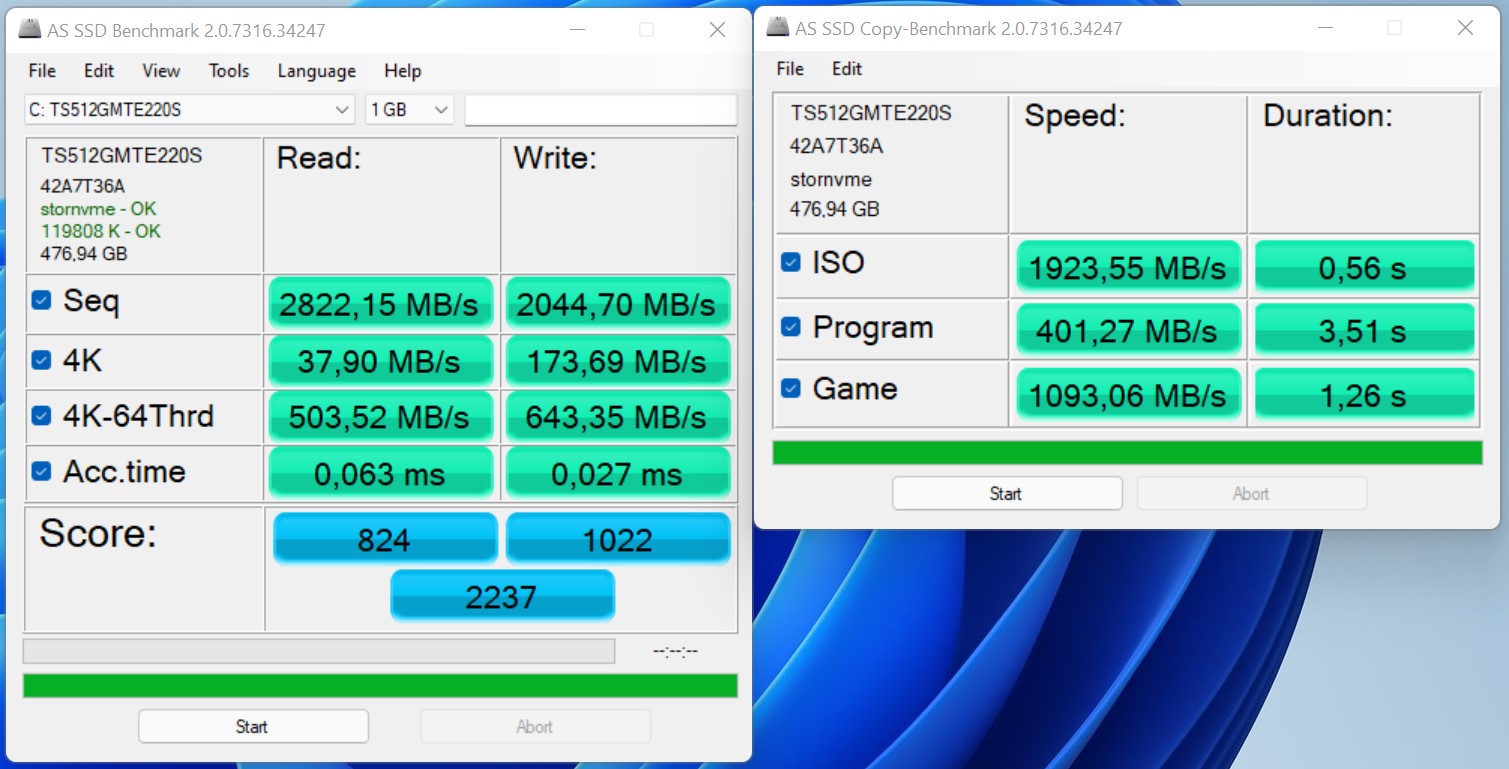
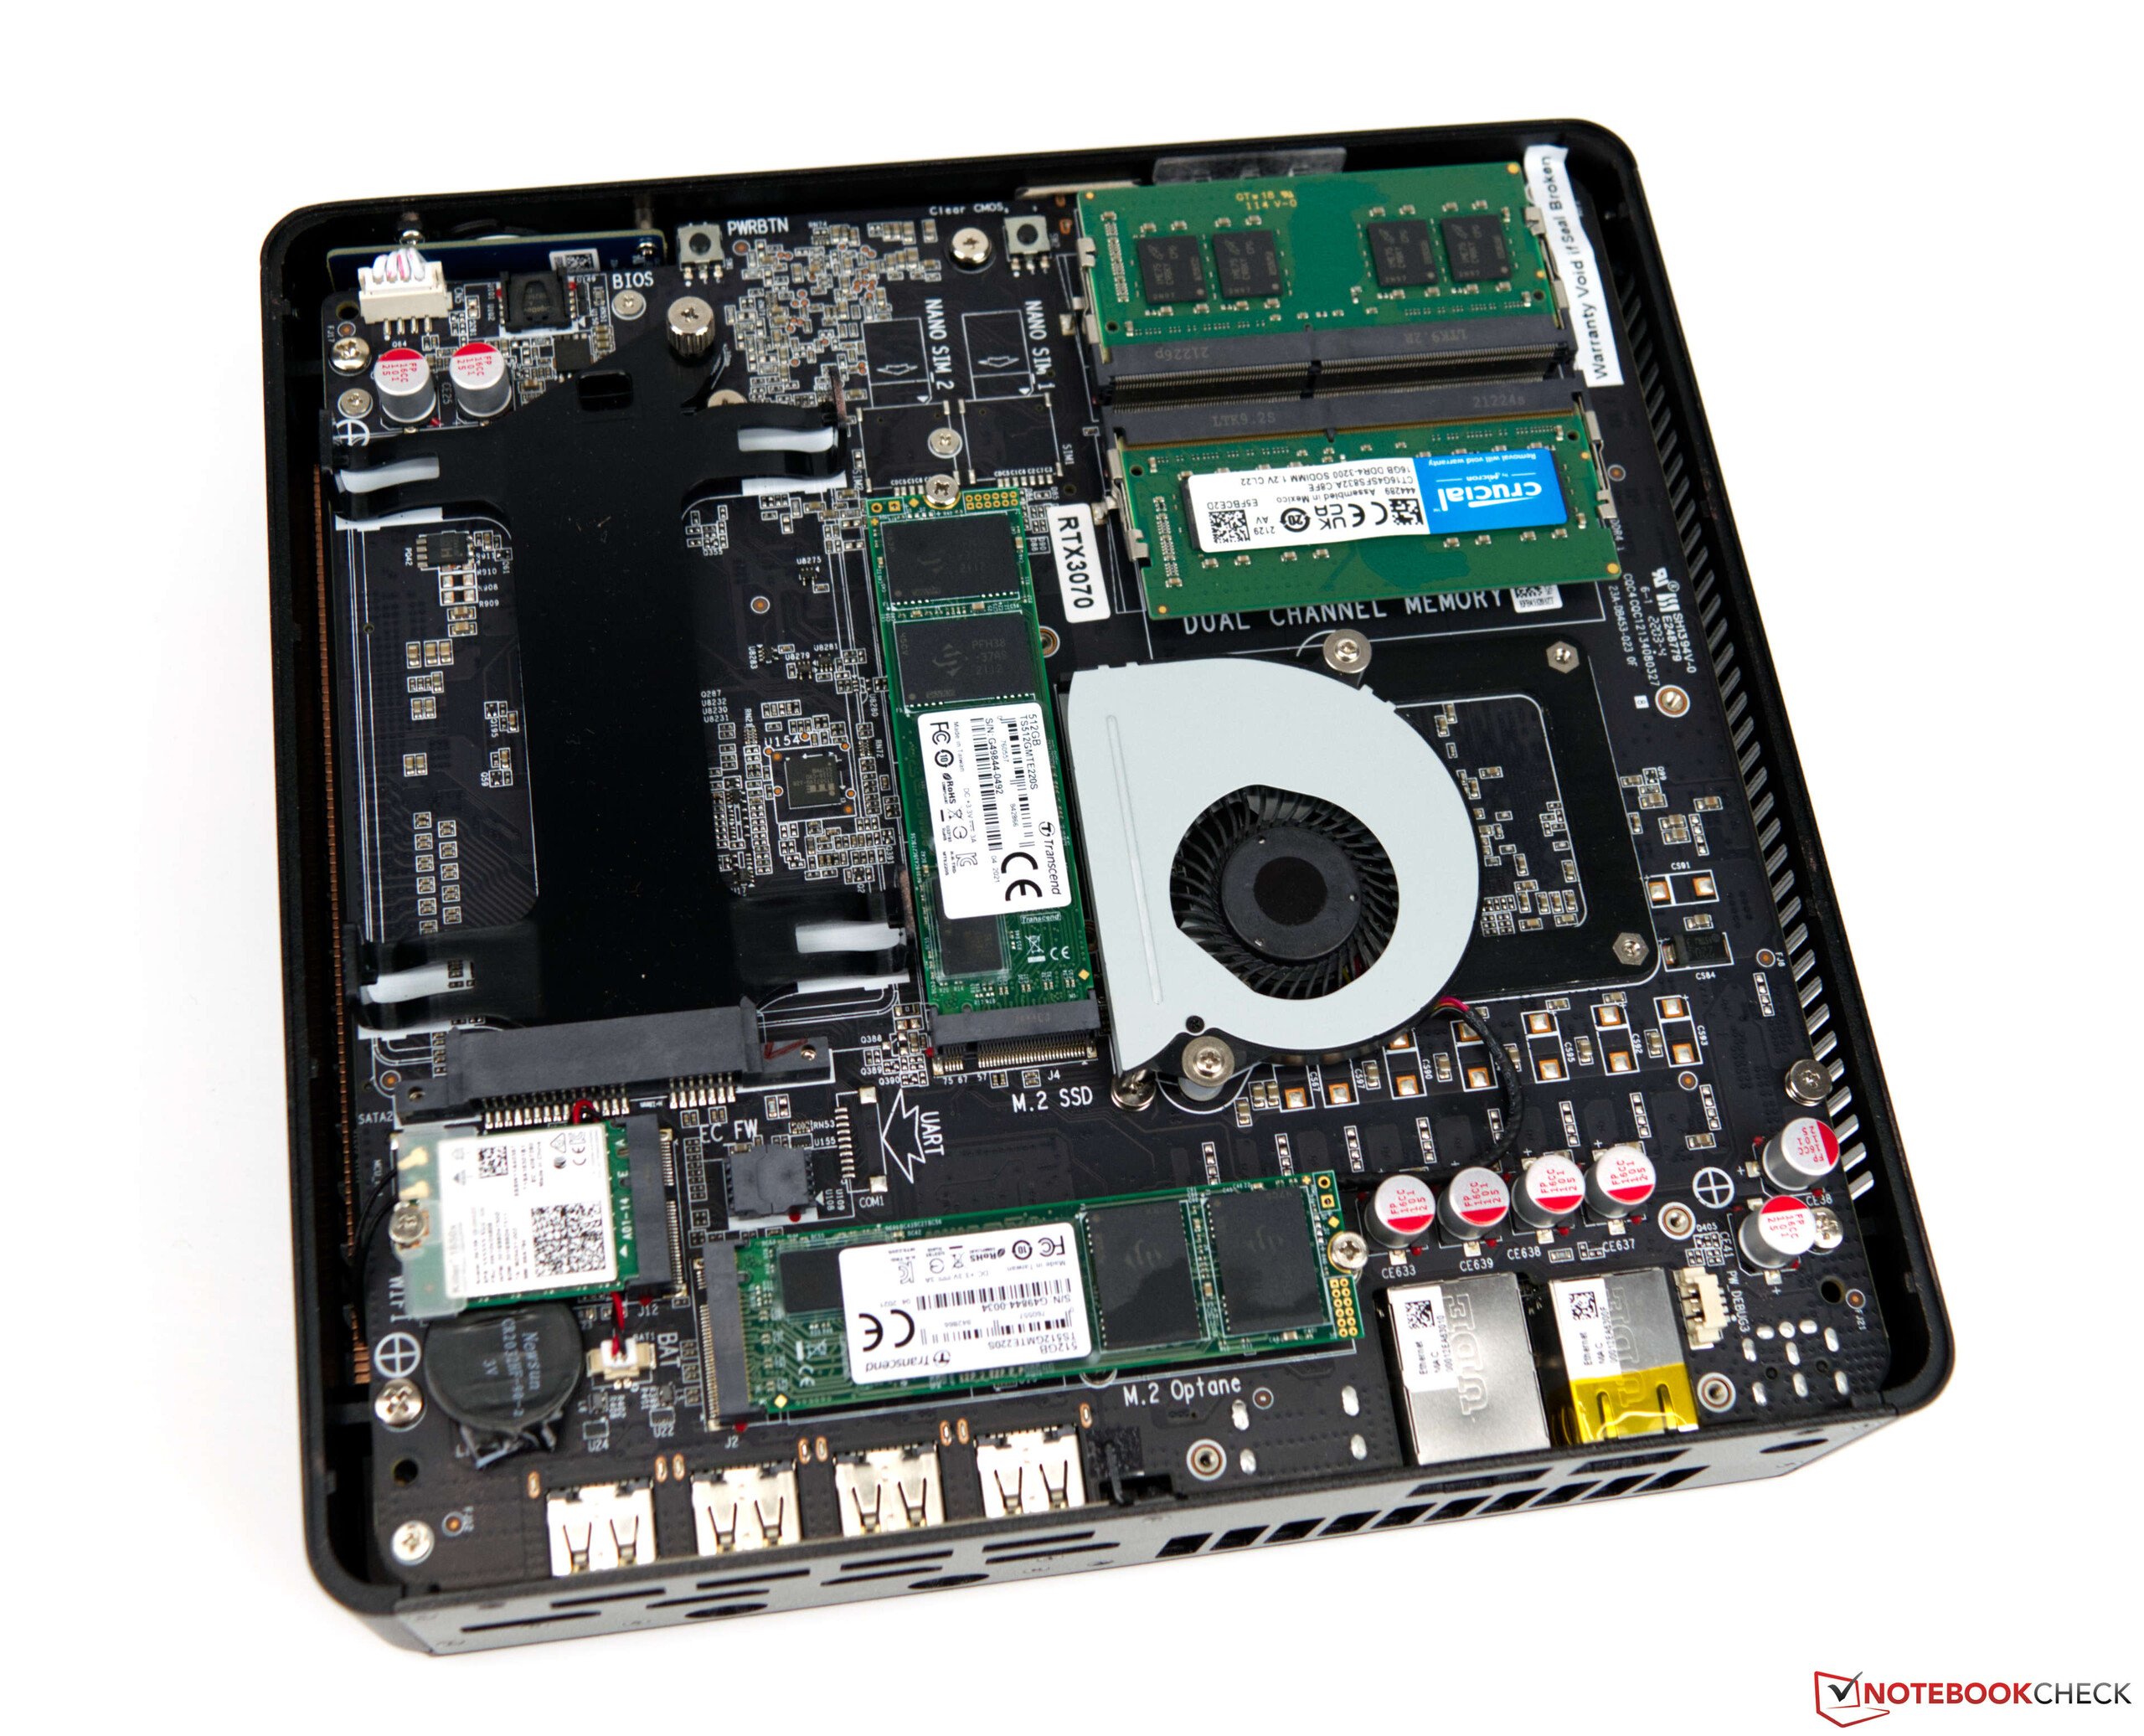
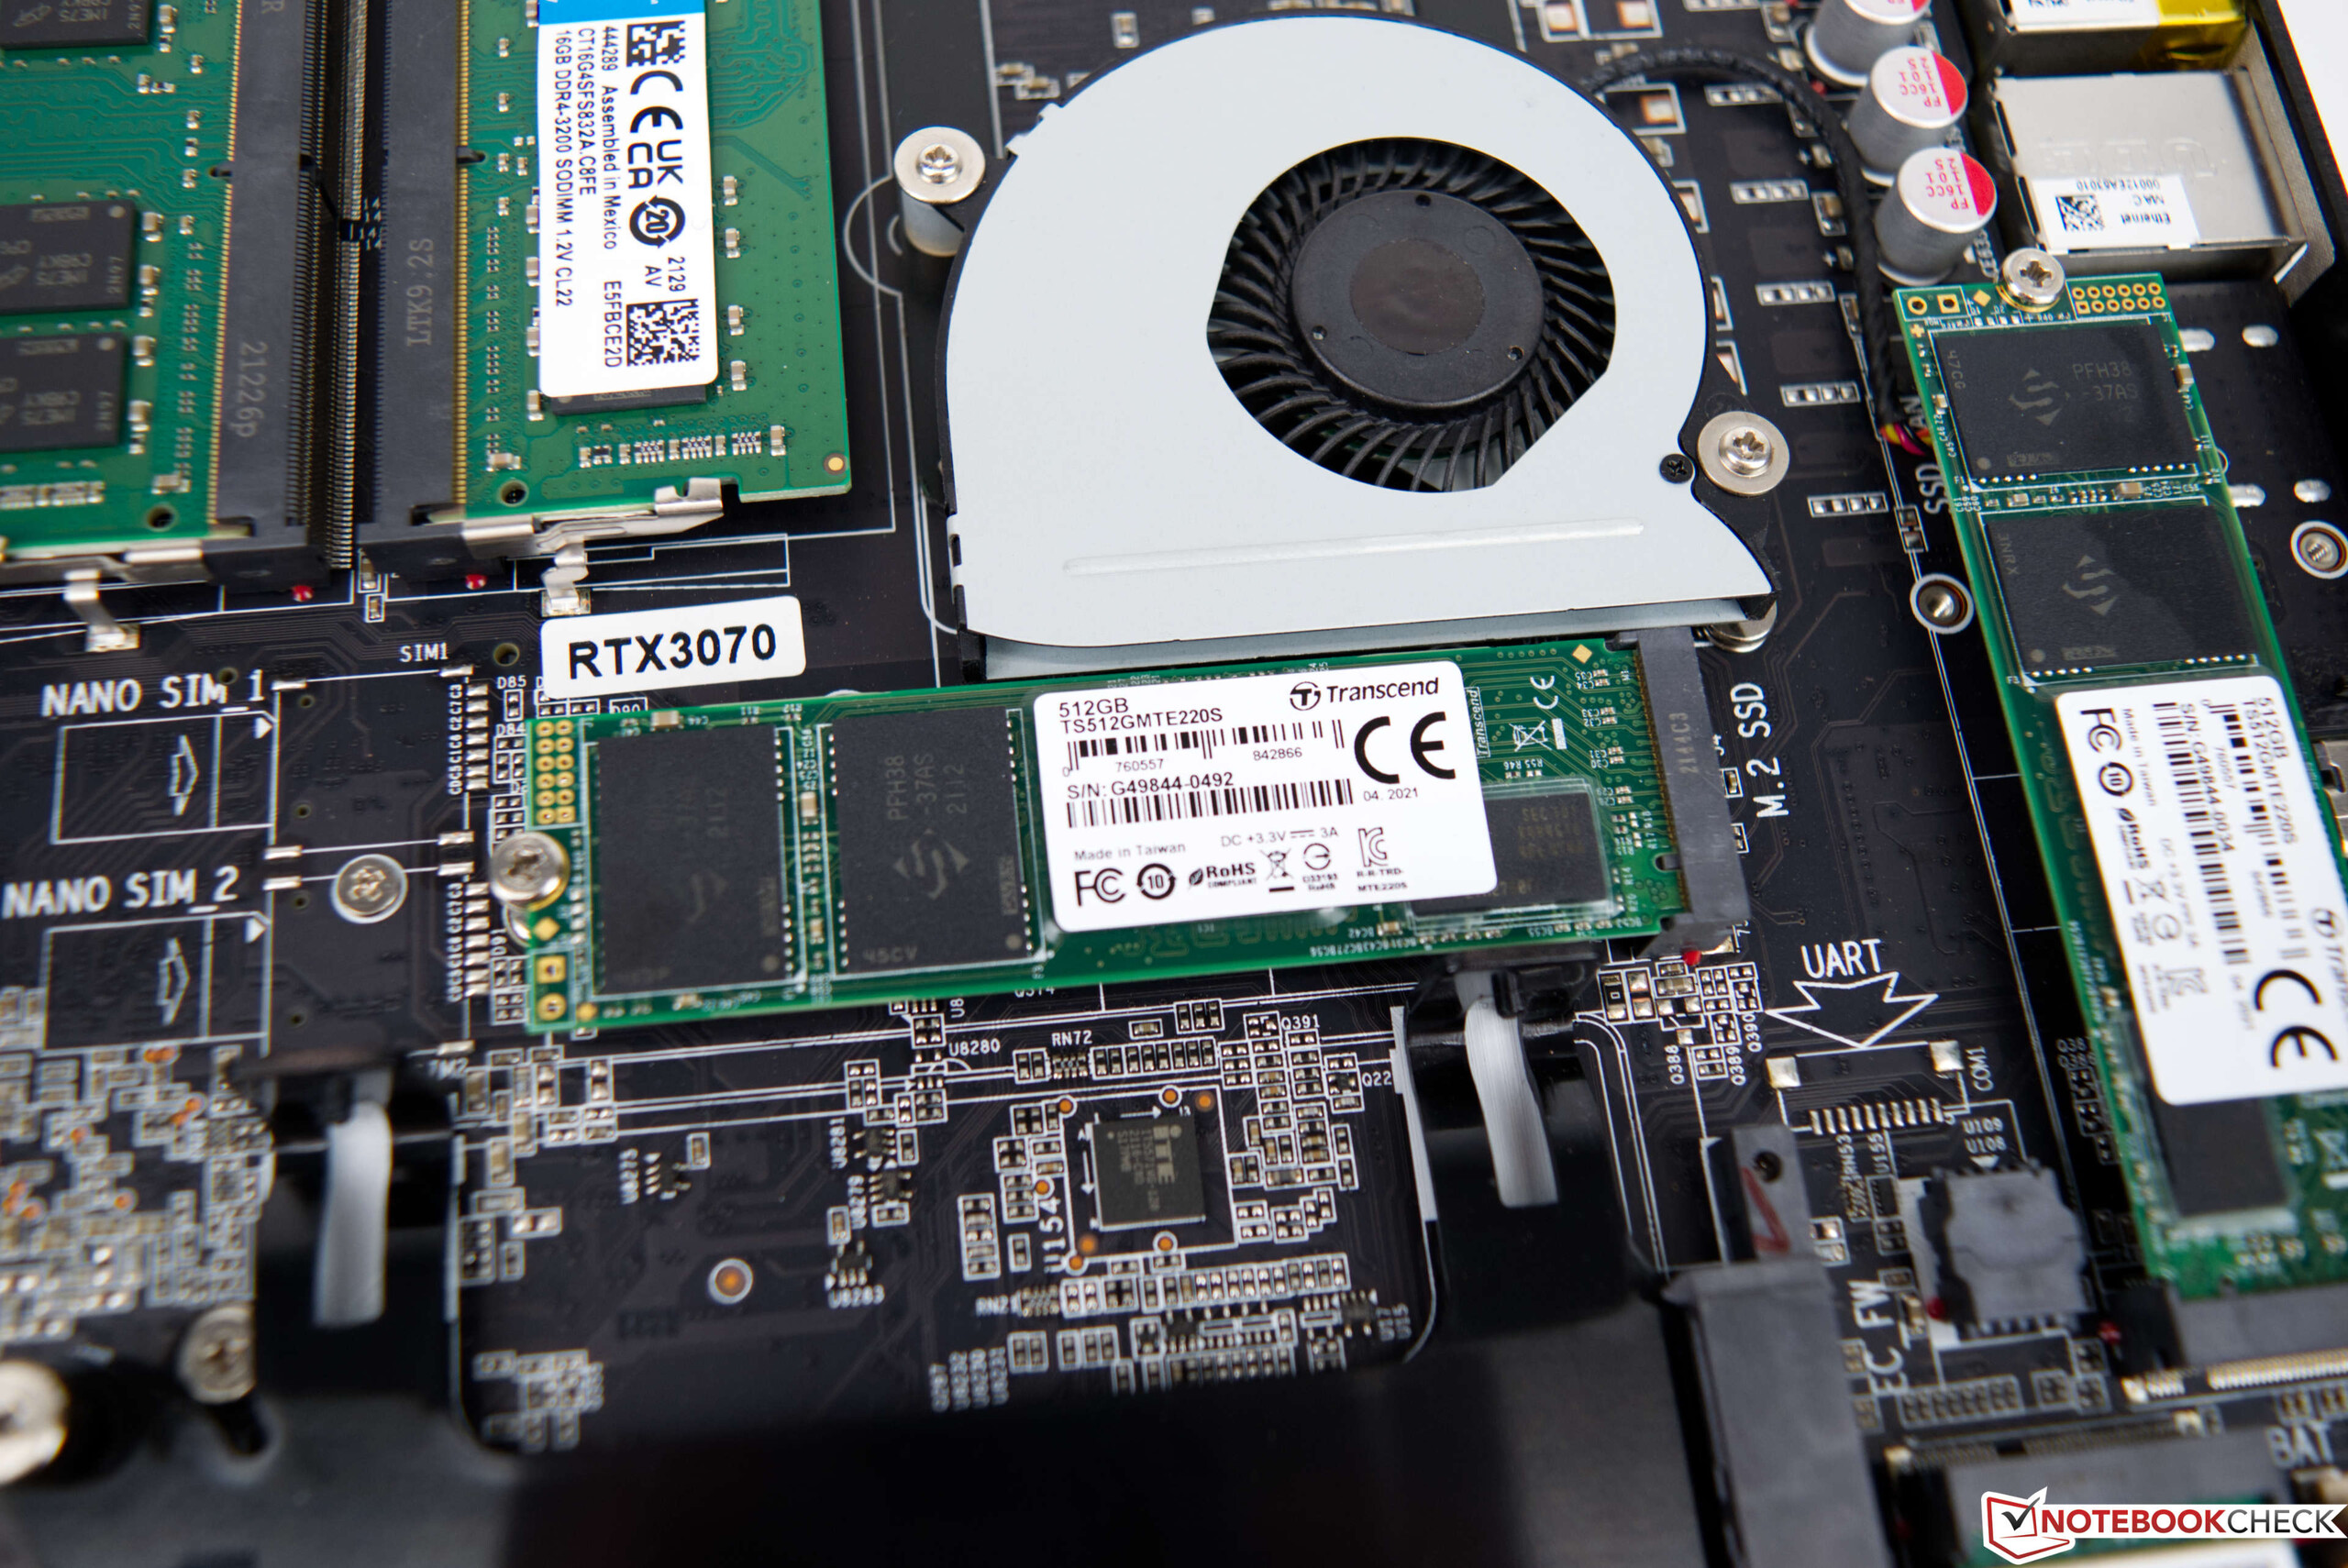
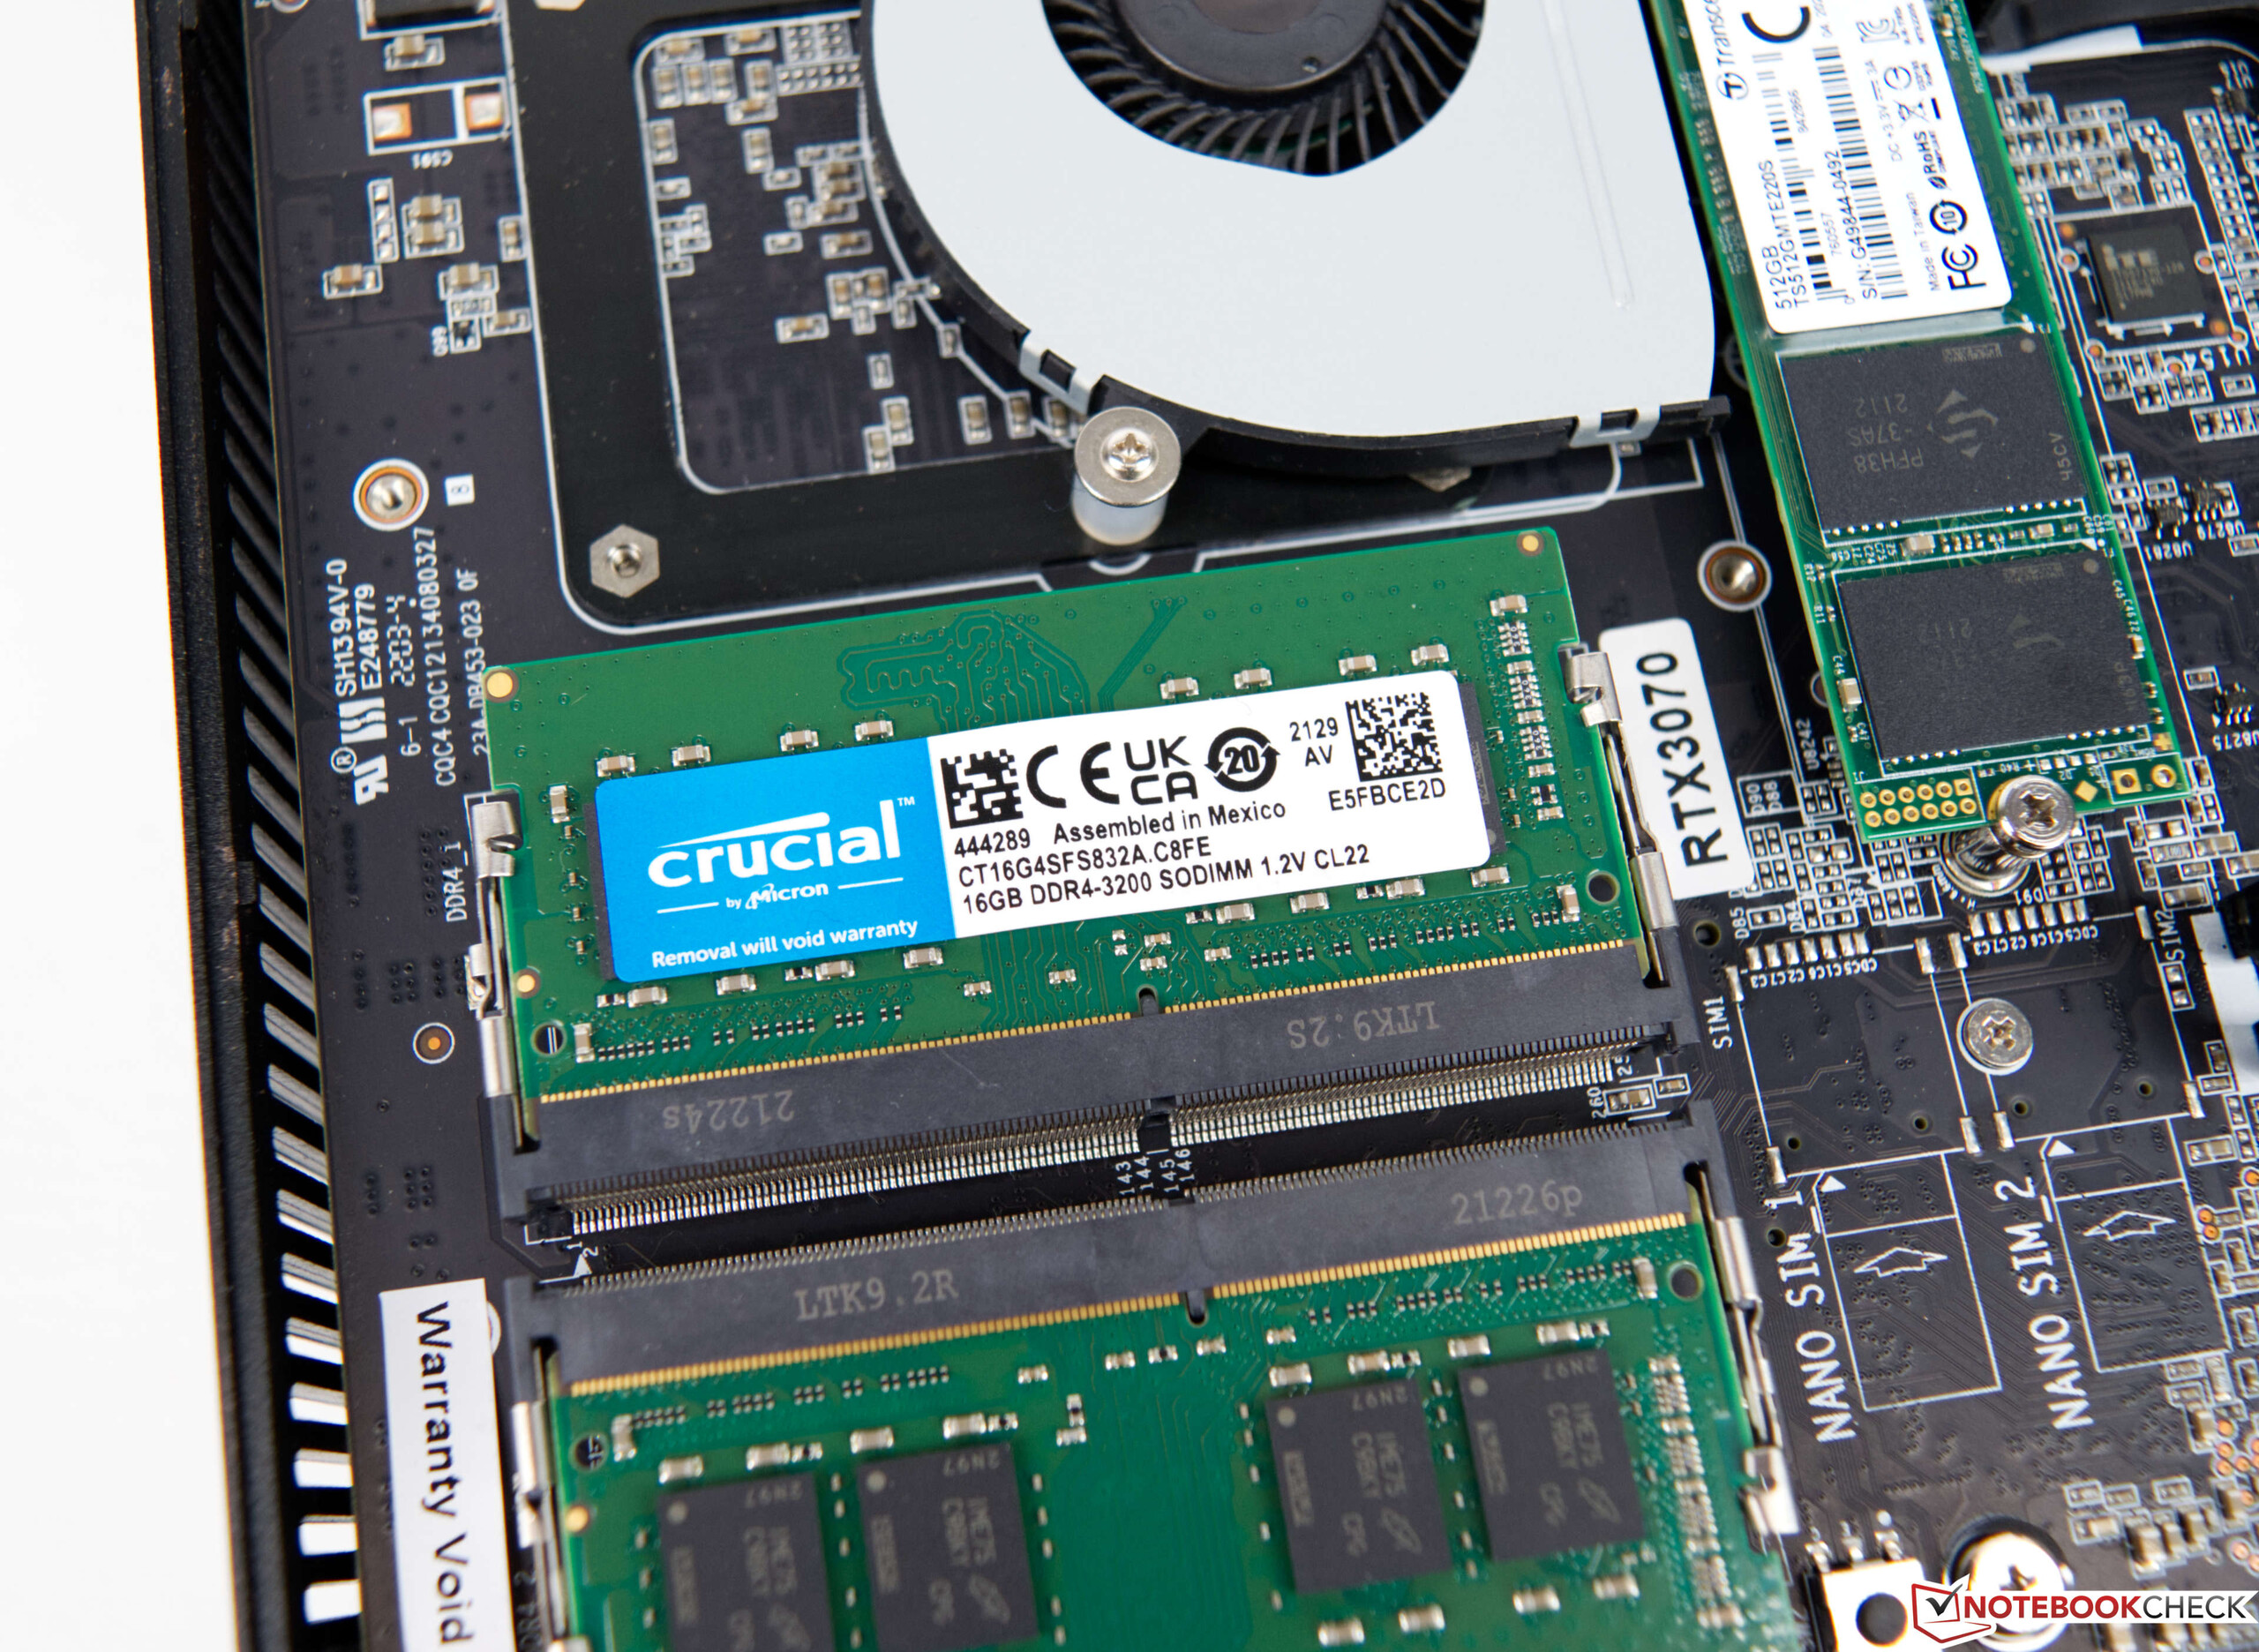
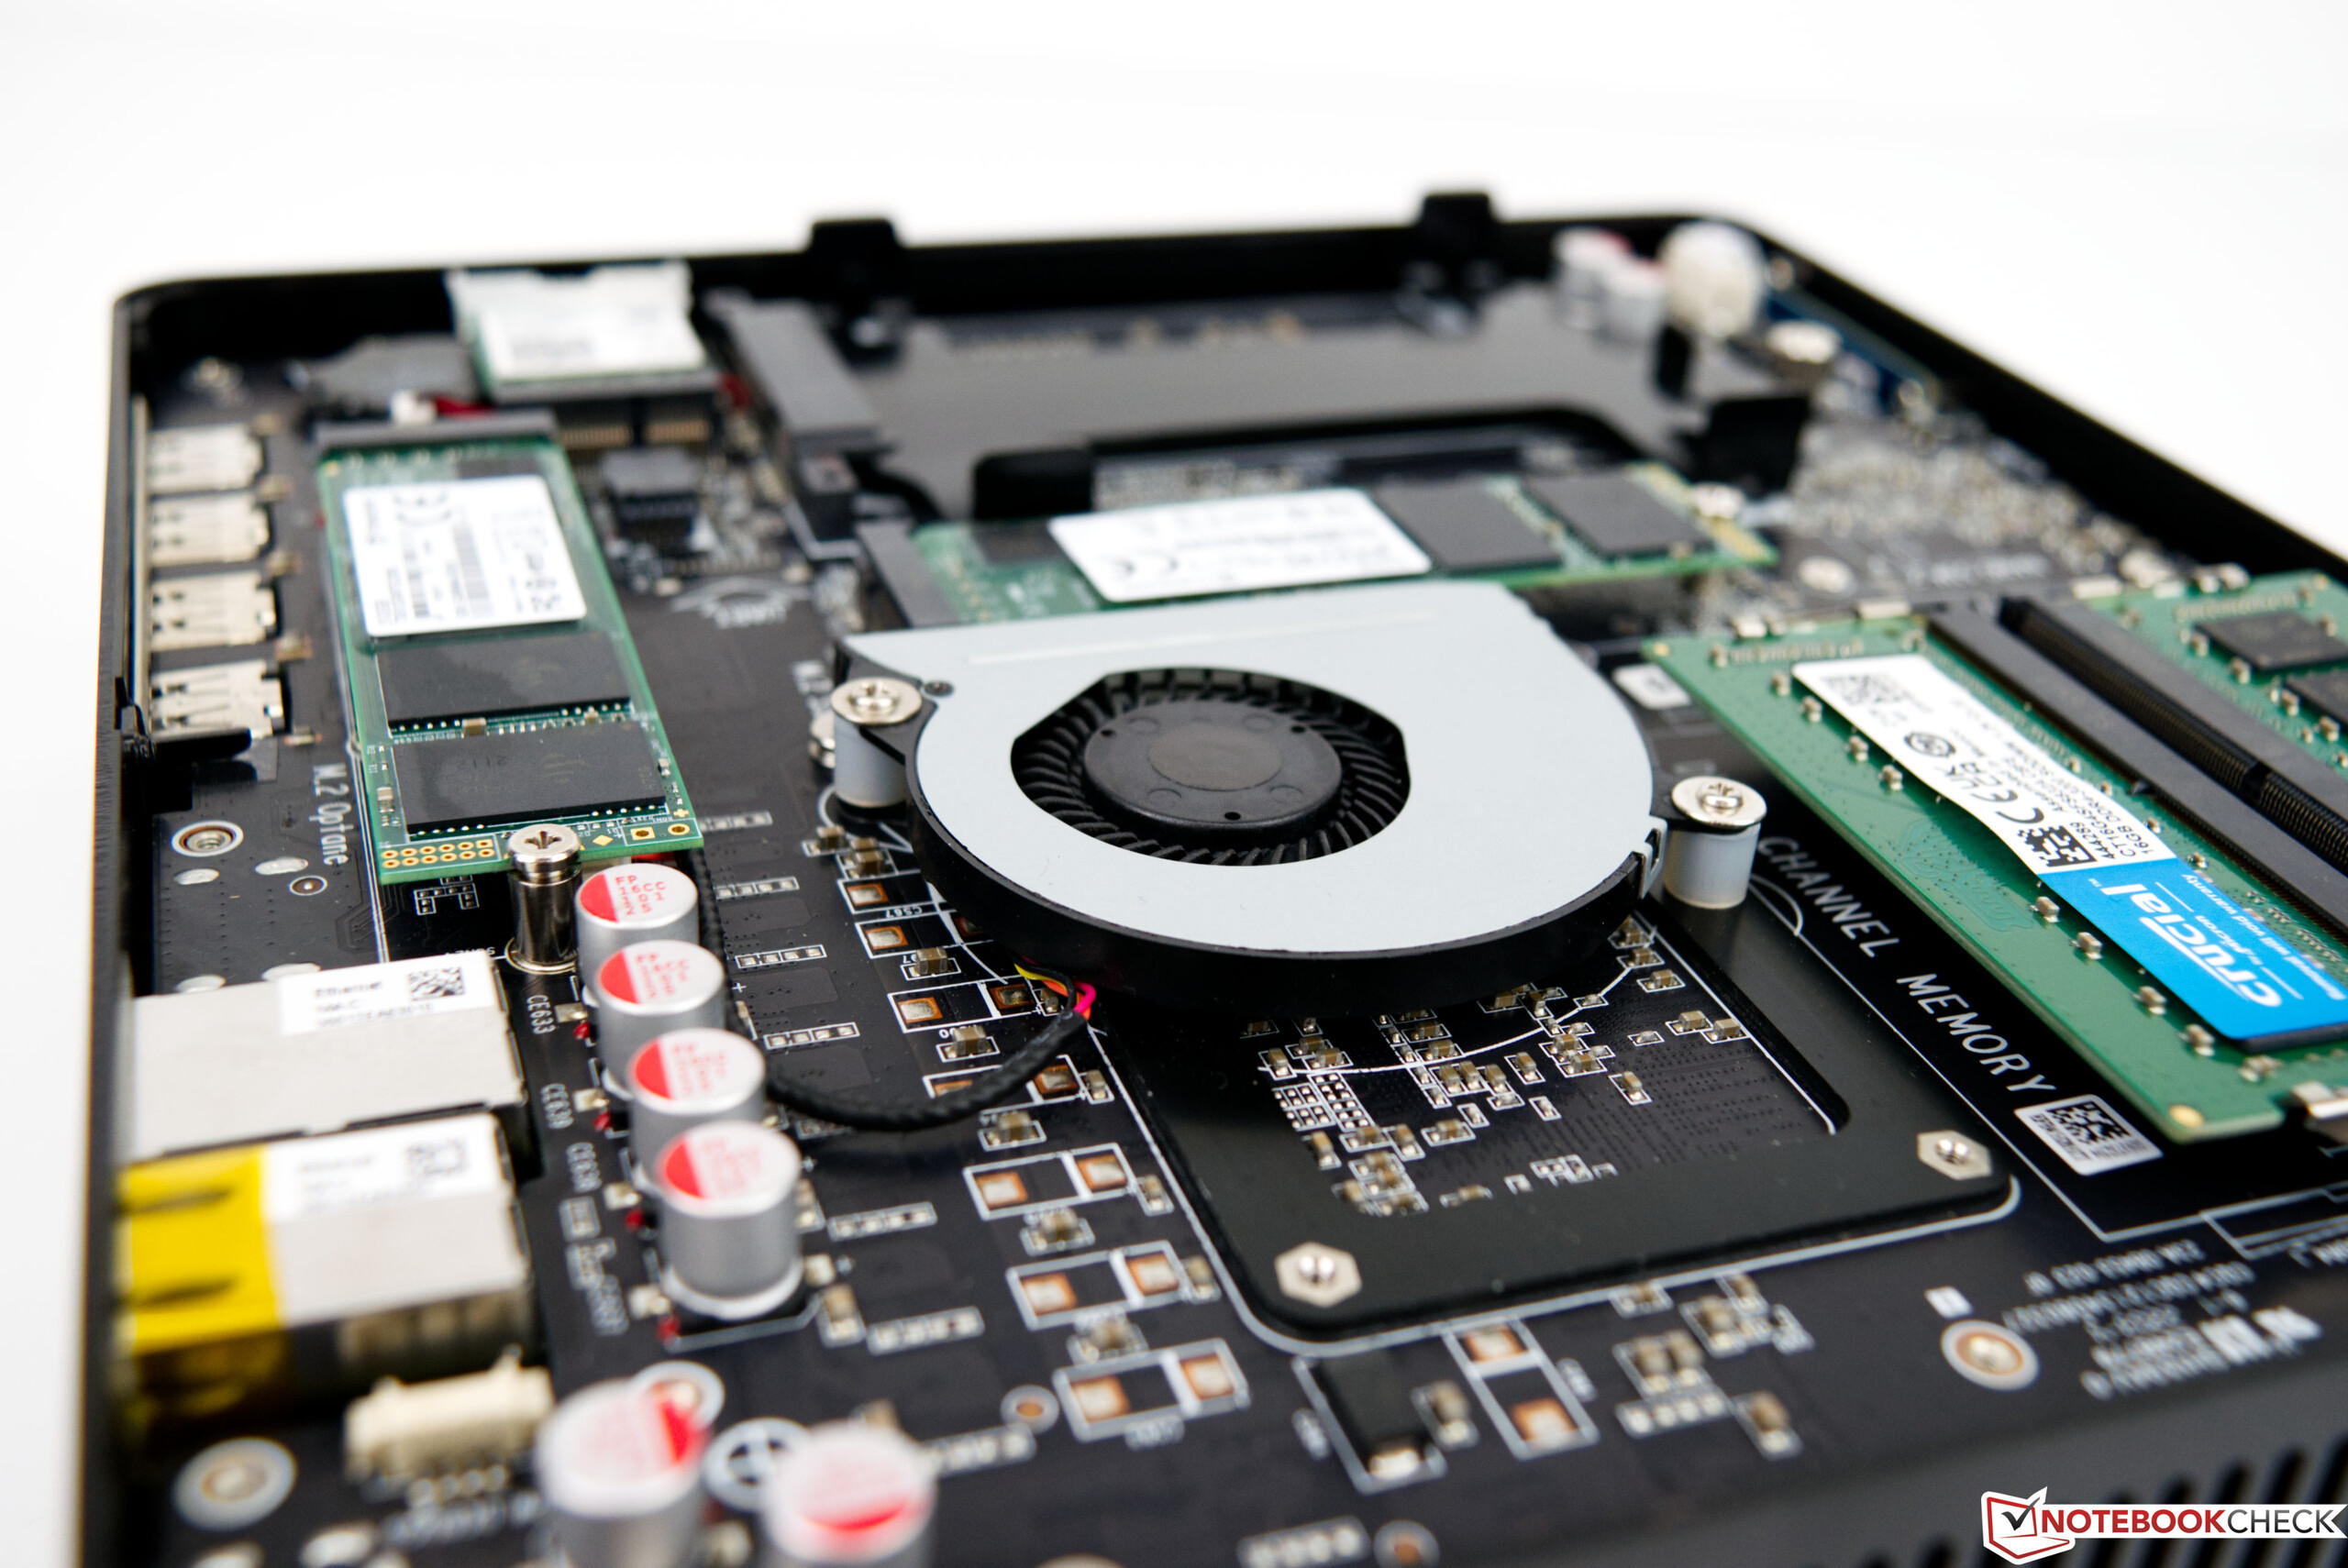
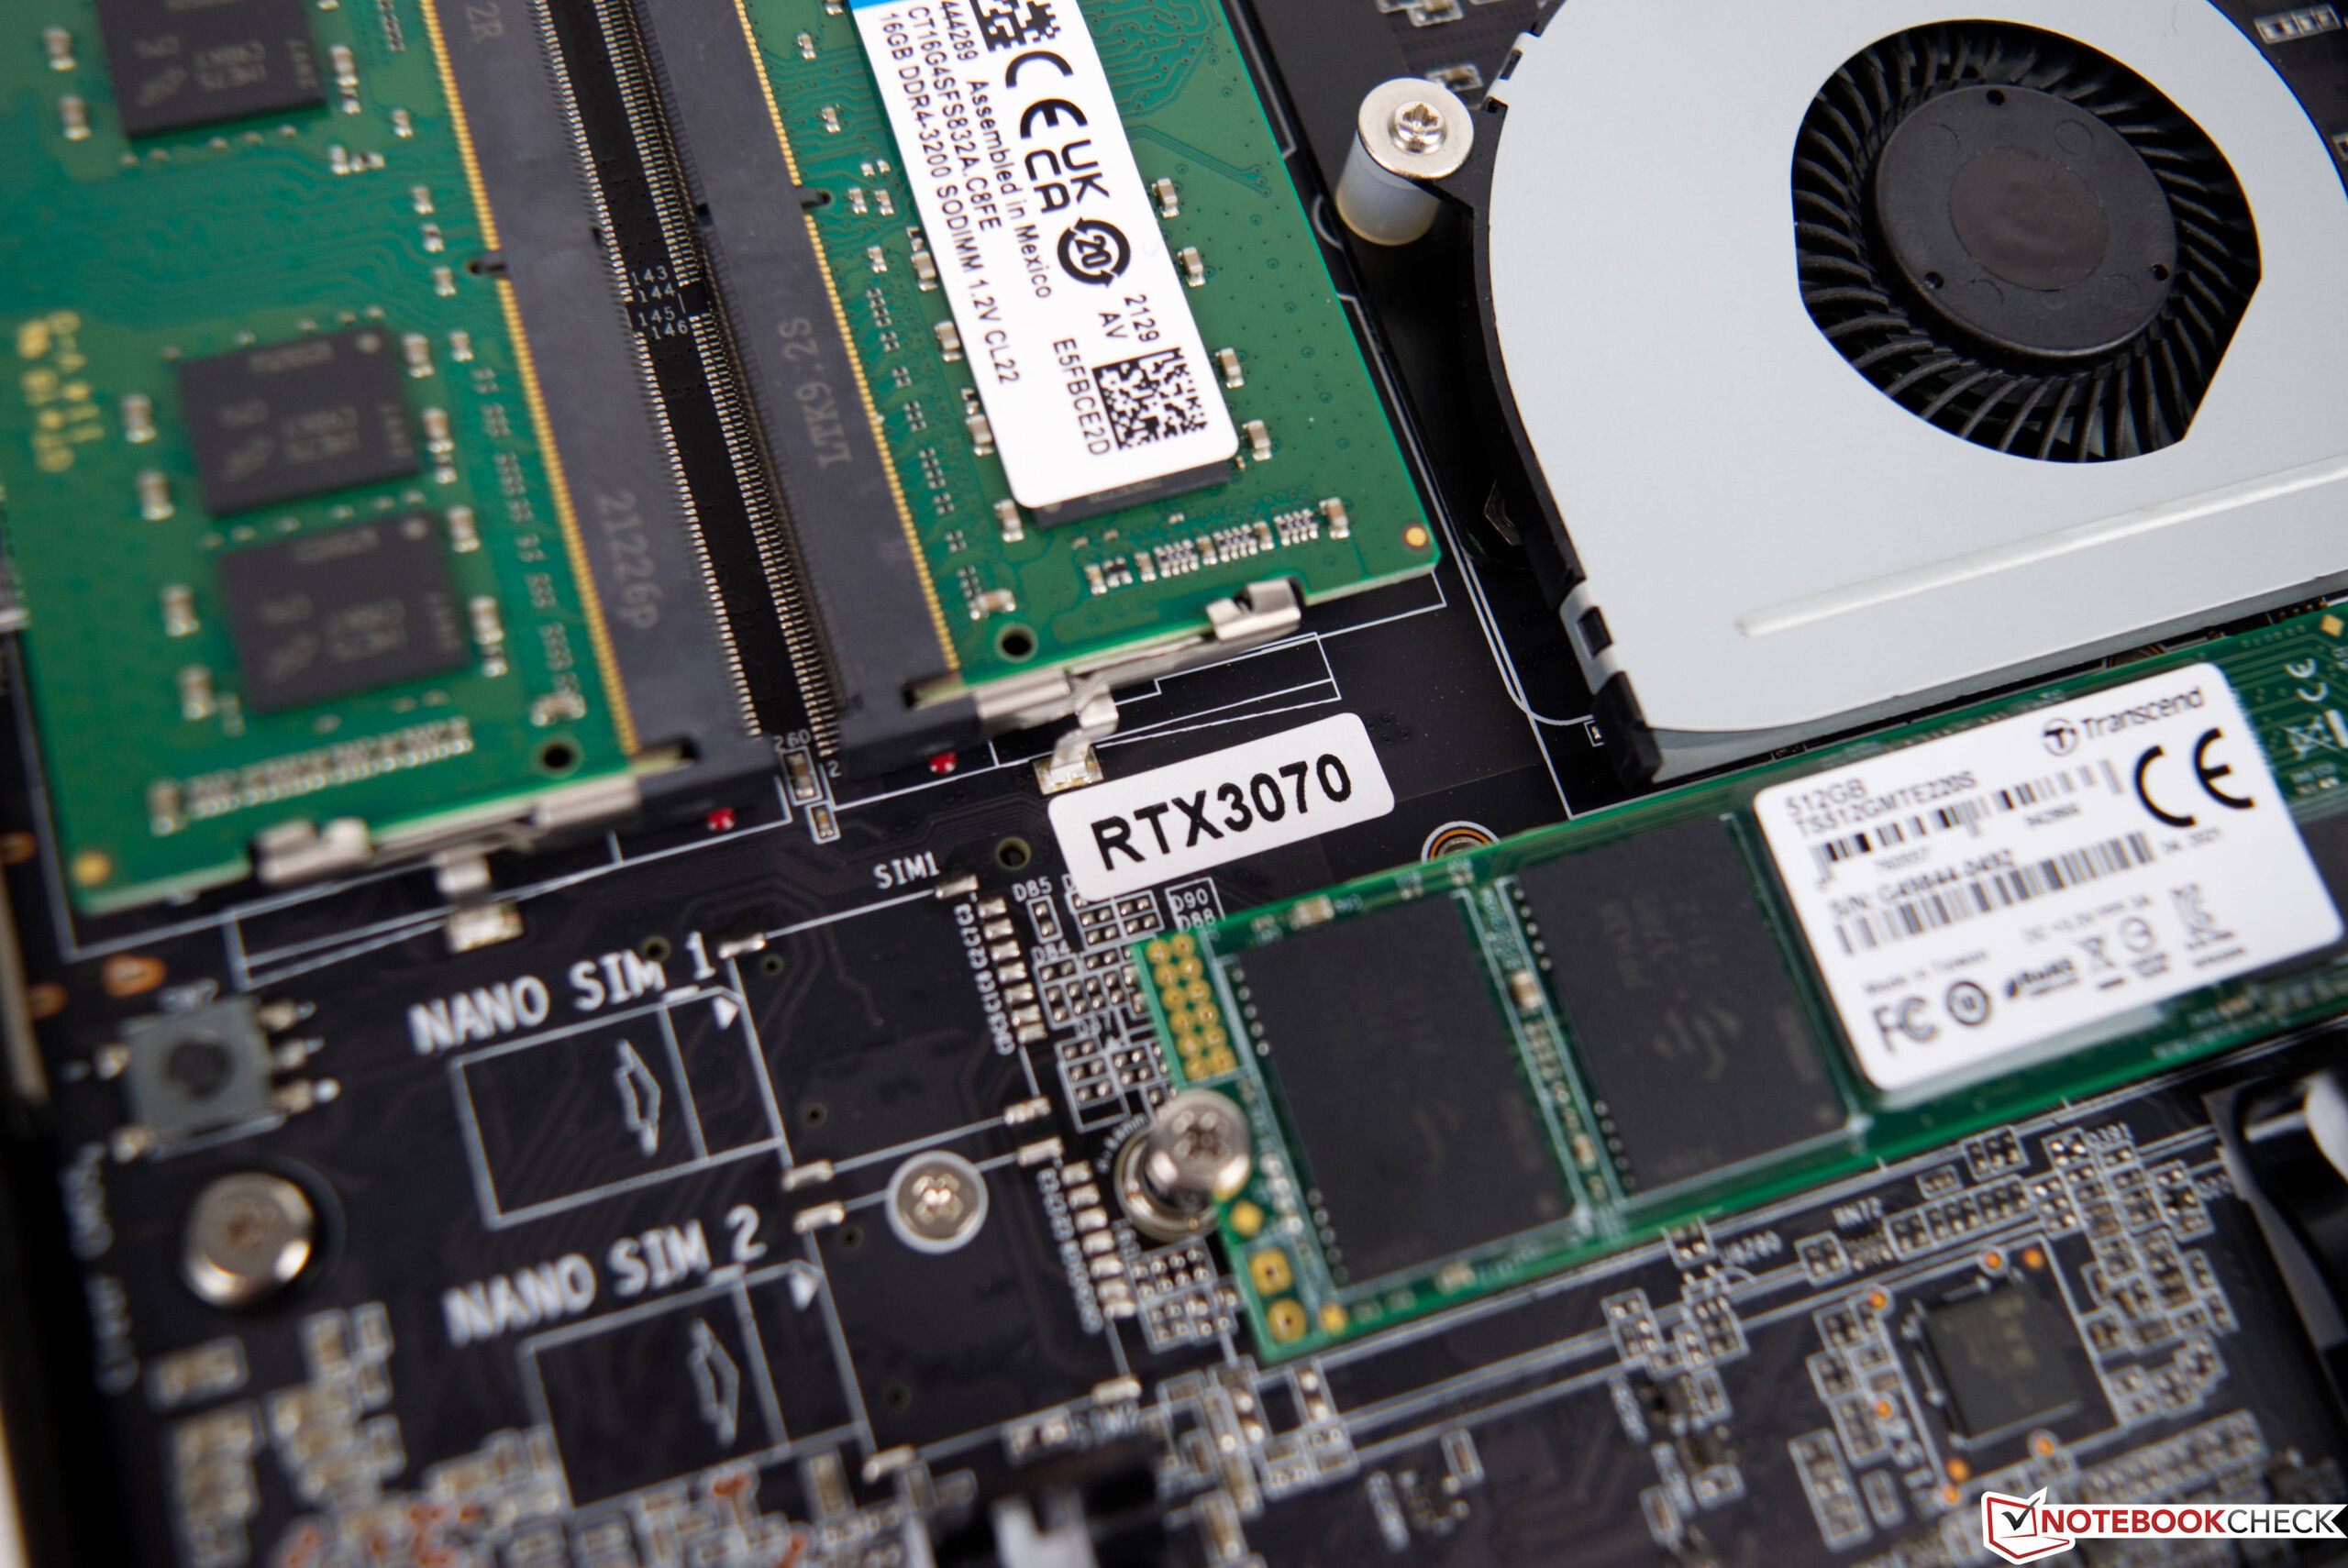
Nos benchmarks de aplicação, vemos um claro aumento de desempenho em comparação com os Zotac ZBOX Magus EN72080V. Juntos, o mais novo SoC e a placa gráfica significativamente mais rápida garantem o bom resultado. No geral, a Zotac ZBOX Magnus EN173070C é até ligeiramente mais rápida que a Intel Dragon Canyon NUC com sua GPU de mesa de tamanho normal e CPU mais atual do Alder Lake. Nos testes de renderização, o GeForce RTX 3070 Mobile é capaz de ganhar os pontos decisivos em comparação com o GeForce RTX 3060. Olhando para ele subjetivamente, as velocidades na operação diária são muito boas. Quer você esteja navegando na Internet, assistindo vídeos ou jogando jogos, a Zotac ZBOX Magnus EN173070C domina todas estas tarefas sem nenhum problema. Para esta revisão, equipamos o mini PC com 32 GB de DDR4-RAM e dois SSDs 512-GB. Os modelos da Transcend oferecem um desempenho sólido. No entanto, ainda é possível apertar alguns pontos percentuais a mais em termos de desempenho, usando SSDs ainda mais rápidos. O estojo pode caber em até três soluções de armazenamento. Além das duas conexões M.2 que não estão limitadas apenas a 80 mm de comprimento, você também pode instalar um drive de 2,5 polegadas.
| PCMark 10 - Score | |
| Intel Dragon Canyon NUC - RTX 3060, Intel Core i9-12900 | |
| Intel Core i9-10900K, Intel Core i9-10900K | |
| Corsair One i160, Intel Core i9-9900K | |
| Intel Beast Canyon NUC, Intel Core i9-11900KB | |
| Zotac ZBOX Magnus EN173070C, Intel Core i7-11800H | |
| Intel Ghost Canyon NUC (RTX 2070), Intel Core i9-9980HK | |
| Minisforum EliteMini HX90, AMD Ryzen 9 5900HX | |
| Zotac Magnus One (ECM73070C), Intel Core i7-10700 | |
| Zotac MEK Mini (RTX 2070 Super), Intel Core i7-9700 | |
| Zotac ZBOX Magnus EN72070V, Intel Core i7-9750H | |
| DPC Latencies / LatencyMon - interrupt to process latency (max), Web, Youtube, Prime95 | |
| Zotac ZBOX Magnus EN173070C, Intel Core i7-11800H | |
| Minisforum EliteMini HX90, AMD Ryzen 9 5900HX | |
| CrossMark | |
| Responsiveness | |
| Intel Beast Canyon NUC, Intel Core i9-11900KB | |
| Intel Dragon Canyon NUC - RTX 3060, Intel Core i9-12900 | |
| Zotac ZBOX Magnus EN173070C, Intel Core i7-11800H | |
| Intel Ghost Canyon NUC (RTX 2070), Intel Core i9-9980HK | |
| Creativity | |
| Intel Beast Canyon NUC, Intel Core i9-11900KB | |
| Intel Dragon Canyon NUC - RTX 3060, Intel Core i9-12900 | |
| Zotac ZBOX Magnus EN173070C, Intel Core i7-11800H | |
| Intel Ghost Canyon NUC (RTX 2070), Intel Core i9-9980HK | |
| Productivity | |
| Intel Beast Canyon NUC, Intel Core i9-11900KB | |
| Intel Dragon Canyon NUC - RTX 3060, Intel Core i9-12900 | |
| Zotac ZBOX Magnus EN173070C, Intel Core i7-11800H | |
| Intel Ghost Canyon NUC (RTX 2070), Intel Core i9-9980HK | |
| Overall | |
| Intel Beast Canyon NUC, Intel Core i9-11900KB | |
| Intel Dragon Canyon NUC - RTX 3060, Intel Core i9-12900 | |
| Zotac ZBOX Magnus EN173070C, Intel Core i7-11800H | |
| Intel Ghost Canyon NUC (RTX 2070), Intel Core i9-9980HK | |
* ... menor é melhor
desempenho em 3D e jogos
Para um PC de jogos, uma placa gráfica rápida é indispensável para atingir taxas de quadros suaves. Em nosso caso, há uma placa gráfica rápida com 8 GB de VRAM com o Nvidia GeForce RTX 3070 Móvel. Ao mesmo tempo, não se pode realmente comparar isto com as versões desktop da mesma nomenclatura. Ao invés disso, a versão móvel do GeForce RTX 3070alcança um desempenho semelhante ao de um Nvidia GeForce RTX 3060. A comparação direta com a Intel Beast Canyon NUC ilustra isso muito bem.
Na classificação TDP, a Zotac vai a toda velocidade, permitindo até 125 watts sob carga. Com isto, o desempenho da placa gráfica dedicada não é artificialmente limitado, como é freqüentemente o caso em laptops compactos. Isto também leva ao bom resultado às vezes comparado ao desempenho médio do adaptador gráfico. Os jogos que testamos podem ser reproduzidos com o máximo de detalhes na resolução FHD e QHD sem nenhum problema. Entretanto, quando a resolução se move para 4K, as coisas podem ficar apertadas às vezes. Mas ainda há muitos jogos que também podem ser reproduzidos suavemente nessa alta resolução
Você pode encontrar comparações e benchmarks adicionais em nosso GTabela de comparação PU.
| Performance rating - Percent | |
| Inno3D GeForce RTX 3060 Twin X2 | |
| Zotac Magnus One (ECM73070C) | |
| Intel Dragon Canyon NUC - RTX 3060 | |
| Média NVIDIA GeForce RTX 3070 Ti Laptop GPU -3! | |
| Zotac ZBOX Magnus EN173070C | |
| Intel Beast Canyon NUC | |
| Média NVIDIA GeForce RTX 3080 Laptop GPU | |
| Média NVIDIA GeForce RTX 3070 Laptop GPU | |
| AMD Radeon RX 6600 | |
| Intel Ghost Canyon NUC (RTX 2070) -2! | |
| Borderlands 3 | |
| 1280x720 Very Low Overall Quality (DX11) | |
| Intel Dragon Canyon NUC - RTX 3060 | |
| Inno3D GeForce RTX 3060 Twin X2 | |
| Média NVIDIA GeForce RTX 3080 Laptop GPU (158.7 - 170.4, n=2) | |
| Intel Beast Canyon NUC | |
| Intel Ghost Canyon NUC (RTX 2070) | |
| Zotac Magnus One (ECM73070C) | |
| Média NVIDIA GeForce RTX 3070 Laptop GPU (135.5 - 141.9, n=2) | |
| Zotac ZBOX Magnus EN173070C | |
| AMD Radeon RX 6600 | |
| 1920x1080 Badass Overall Quality (DX11) | |
| Intel Beast Canyon NUC | |
| Zotac Magnus One (ECM73070C) | |
| Média NVIDIA GeForce RTX 3080 Laptop GPU (76.5 - 91.3, n=4) | |
| Intel Dragon Canyon NUC - RTX 3060 | |
| Zotac ZBOX Magnus EN173070C | |
| Média NVIDIA GeForce RTX 3070 Ti Laptop GPU (n=1) | |
| Média NVIDIA GeForce RTX 3070 Laptop GPU (65.4 - 88.3, n=4) | |
| Inno3D GeForce RTX 3060 Twin X2 | |
| Intel Ghost Canyon NUC (RTX 2070) | |
| AMD Radeon RX 6600 | |
| Far Cry New Dawn | |
| 1280x720 Low Preset | |
| Inno3D GeForce RTX 3060 Twin X2 | |
| Intel Dragon Canyon NUC - RTX 3060 | |
| Intel Beast Canyon NUC | |
| AMD Radeon RX 6600 | |
| Zotac ZBOX Magnus EN173070C | |
| Intel Ghost Canyon NUC (RTX 2070) | |
| Média NVIDIA GeForce RTX 3070 Laptop GPU (112 - 134, n=4) | |
| Zotac Magnus One (ECM73070C) | |
| Média NVIDIA GeForce RTX 3080 Laptop GPU (80 - 143, n=4) | |
| 1920x1080 Ultra Preset | |
| Intel Dragon Canyon NUC - RTX 3060 | |
| Inno3D GeForce RTX 3060 Twin X2 | |
| Intel Beast Canyon NUC | |
| AMD Radeon RX 6600 | |
| Zotac ZBOX Magnus EN173070C | |
| Zotac Magnus One (ECM73070C) | |
| Média NVIDIA GeForce RTX 3080 Laptop GPU (62 - 110, n=6) | |
| Média NVIDIA GeForce RTX 3070 Laptop GPU (70 - 101, n=6) | |
| Intel Ghost Canyon NUC (RTX 2070) | |
| baixo | média | alto | ultra | QHD | 4K | |
|---|---|---|---|---|---|---|
| GTA V (2015) | 182.7 | 177.1 | 167.5 | 104.9 | 94.4 | 100.8 |
| The Witcher 3 (2015) | 435 | 331 | 190.1 | 105.5 | 70.7 | |
| Dota 2 Reborn (2015) | 164.4 | 148.3 | 142.9 | 133.9 | 127.7 | |
| Rise of the Tomb Raider (2016) | 302 | 216 | 141.9 | 116.2 | 55.4 | |
| Final Fantasy XV Benchmark (2018) | 190.1 | 139 | 101 | 75.3 | 43.5 | |
| X-Plane 11.11 (2018) | 136.6 | 121.2 | 95.7 | 82.3 | ||
| Far Cry 5 (2018) | 159 | 136 | 129 | 120 | 101 | 55 |
| Strange Brigade (2018) | 437 | 267 | 216 | 186.7 | 137.3 | 78.1 |
| Shadow of the Tomb Raider (2018) | 169.6 | 146.4 | 142.5 | 133.7 | 95.1 | 50.8 |
| Far Cry New Dawn (2019) | 134 | 116 | 112 | 100 | 91 | 57 |
| Metro Exodus (2019) | 177.1 | 123 | 94 | 74.6 | 58.7 | 36.6 |
| Control (2019) | 240 | 128 | 93.7 | 60.9 | 30.3 | |
| Borderlands 3 (2019) | 135.5 | 117.3 | 101 | 84.6 | 62.2 | 34.2 |
| F1 2020 (2020) | 315 | 267 | 238 | 165.8 | 123.6 | 68.3 |
| Dirt 5 (2020) | 227 | 153 | 123 | 96 | 75 | 49 |
| F1 2021 (2021) | 367 | 309 | 246 | 122.7 | 88.3 | 49.8 |
| Alan Wake Remastered (2021) | 119.2 | 118.2 | 118.2 | 113.1 | ||
| Far Cry 6 (2021) | 127.5 | 109.5 | 99 | 99.8 | 79.2 | 41 |
| Guardians of the Galaxy (2021) | 123 | 124 | 122 | 120 | 102 | 55 |
| Riders Republic (2021) | 174 | 144 | 118 | 107 | 77 | 40 |
| Forza Horizon 5 (2021) | 213 | 141 | 129 | 82 | 70 | 48 |
| Farming Simulator 22 (2021) | 205 | 161.1 | 138.8 | 132.8 | 124.8 | 79.2 |
| God of War (2022) | 122.2 | 109.4 | 88.1 | 61.7 | 50.7 | 33.8 |
| Rainbow Six Extraction (2022) | 241 | 182 | 181 | 149 | 97 | 49 |
| GRID Legends (2022) | 194 | 189 | 158 | 123 | 95 | 62 |
| Cyberpunk 2077 1.6 (2022) | 139 | 116 | 92 | 76 | 47 | 22 |
| Elex 2 (2022) | 98.4 | 95.1 | 87.3 | 79.5 | 61.8 | 34.5 |
Emissões
Emissões sonoras
Quando você compra um laptop para jogos, geralmente você está ciente do aumento do nível de ruído que isso traz. No entanto, as coisas são muitas vezes diferentes para um PC desktop, uma vez que sistemas de resfriamento maiores são capazes de dissipar o calor de forma mais eficaz e silenciosa. Mas como a Zotac usa uma caixa muito compacta aqui, os ventiladores embutidos têm que trabalhar bastante sob carga. Os níveis de ruído sob carga nos lembram de um laptop de jogos médio. A 45 dB(A), o dispositivo é claramente audível. Sob carga baixa, ainda medimos 41 dB(A). Na operação em 2D, os ventiladores se espelham silenciosamente e são quase imperceptíveis.
Barulho
| Ocioso |
| 32.7 / 32.8 / 32.8 dB |
| Carga |
| 41.7 / 45.4 dB |
 | ||
30 dB silencioso 40 dB(A) audível 50 dB(A) ruidosamente alto |
||
min: | ||
| Zotac ZBOX Magnus EN173070C GeForce RTX 3070 Laptop GPU, i7-11800H, Transcend M.2 SSD 2200S TS512GMTE220S | Zotac Magnus One (ECM73070C) GeForce RTX 3070, i7-10700, Phison 512GB PA6620060U | Minisforum EliteMini HX90 Vega 8, R9 5900HX, Kingston OM8PCP3512F-AB | |
|---|---|---|---|
| Noise | -4% | 10% | |
| desligado / ambiente * (dB) | 30.7 | 30 2% | 30.8 -0% |
| Idle Minimum * (dB) | 32.7 | 33.58 -3% | |
| Idle Average * (dB) | 32.8 | 31.6 4% | |
| Idle Maximum * (dB) | 32.8 | ||
| Load Average * (dB) | 41.7 | 44.25 -6% | |
| Load Maximum * (dB) | 45.4 | 48.72 -7% | 33.4 26% |
* ... menor é melhor
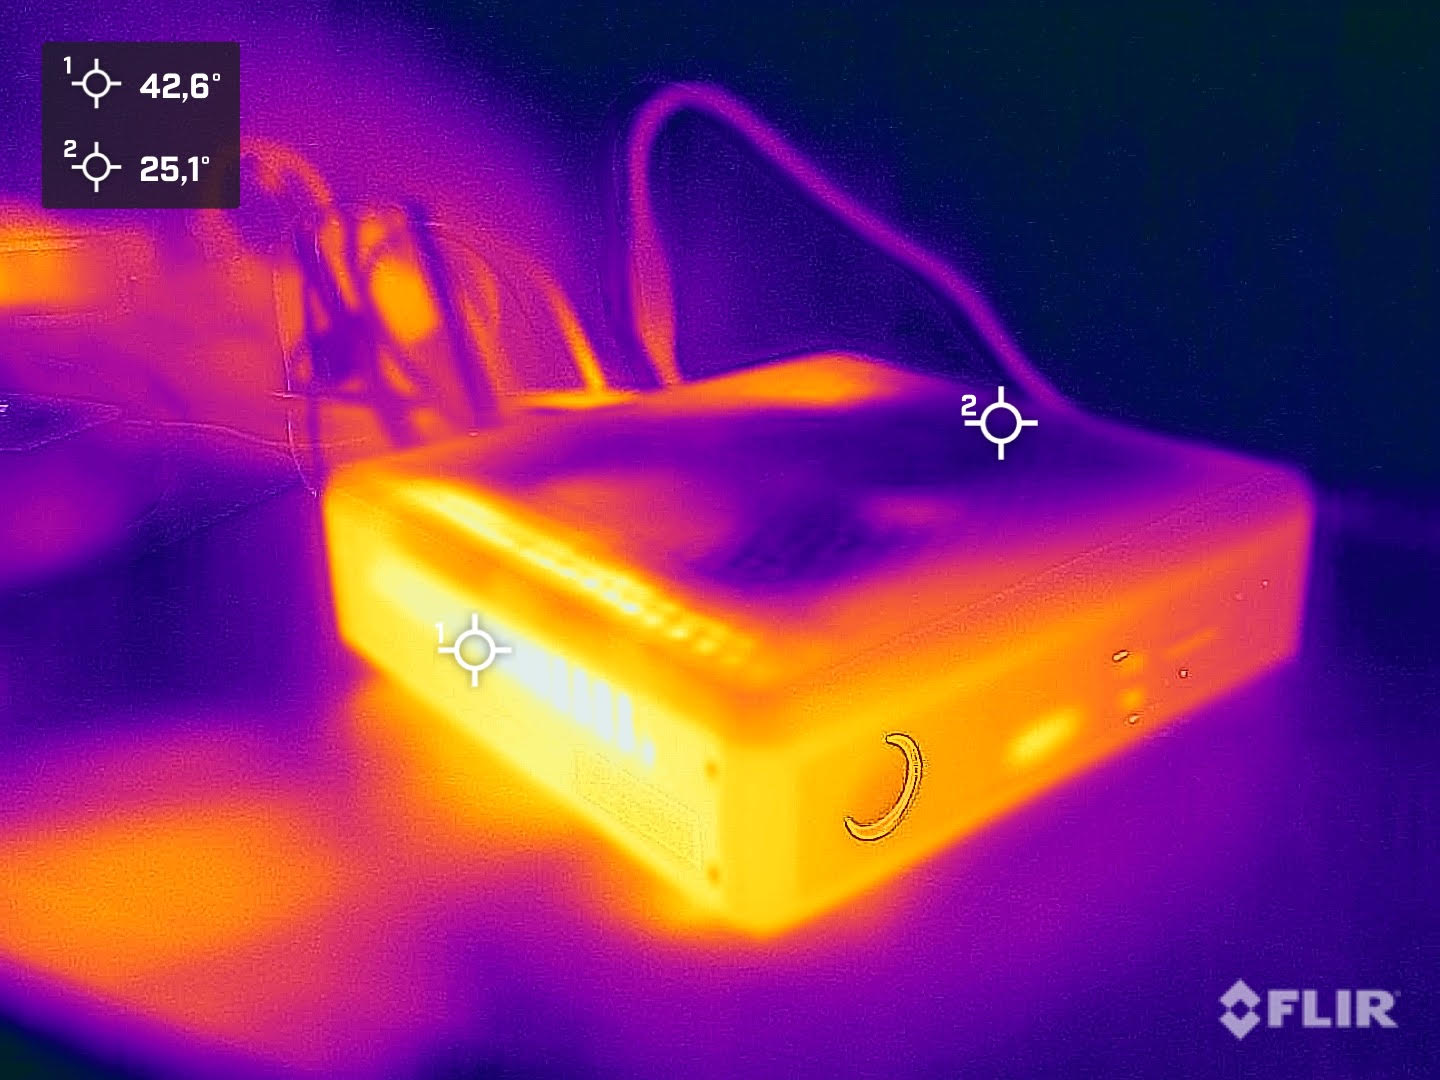
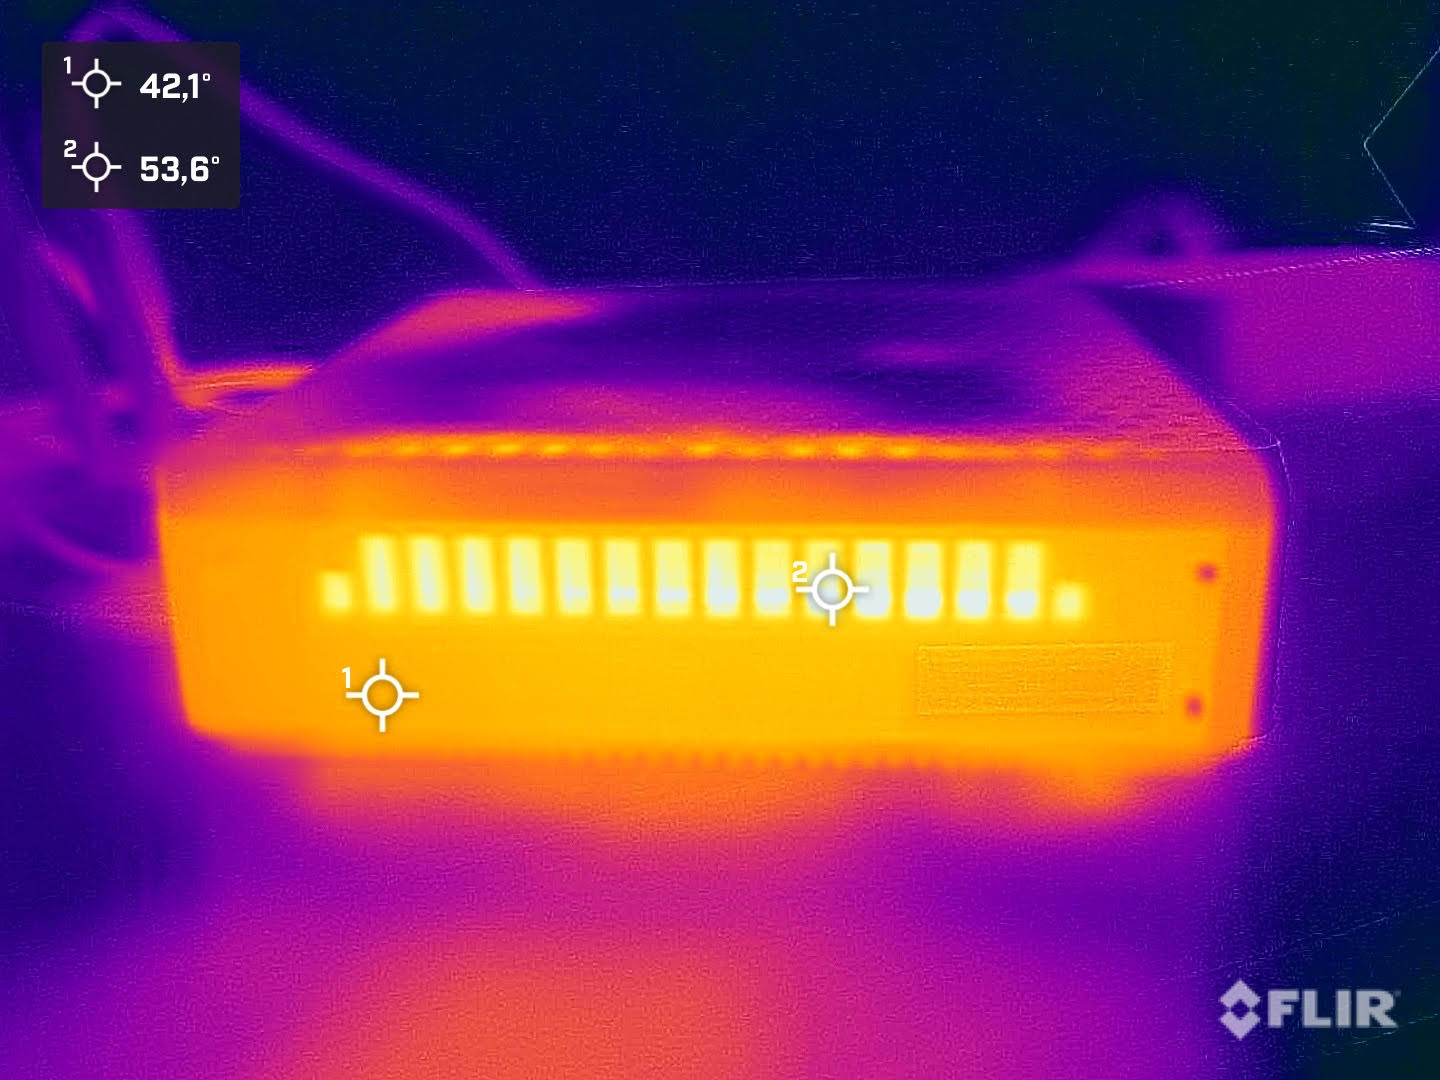
Temperaturas
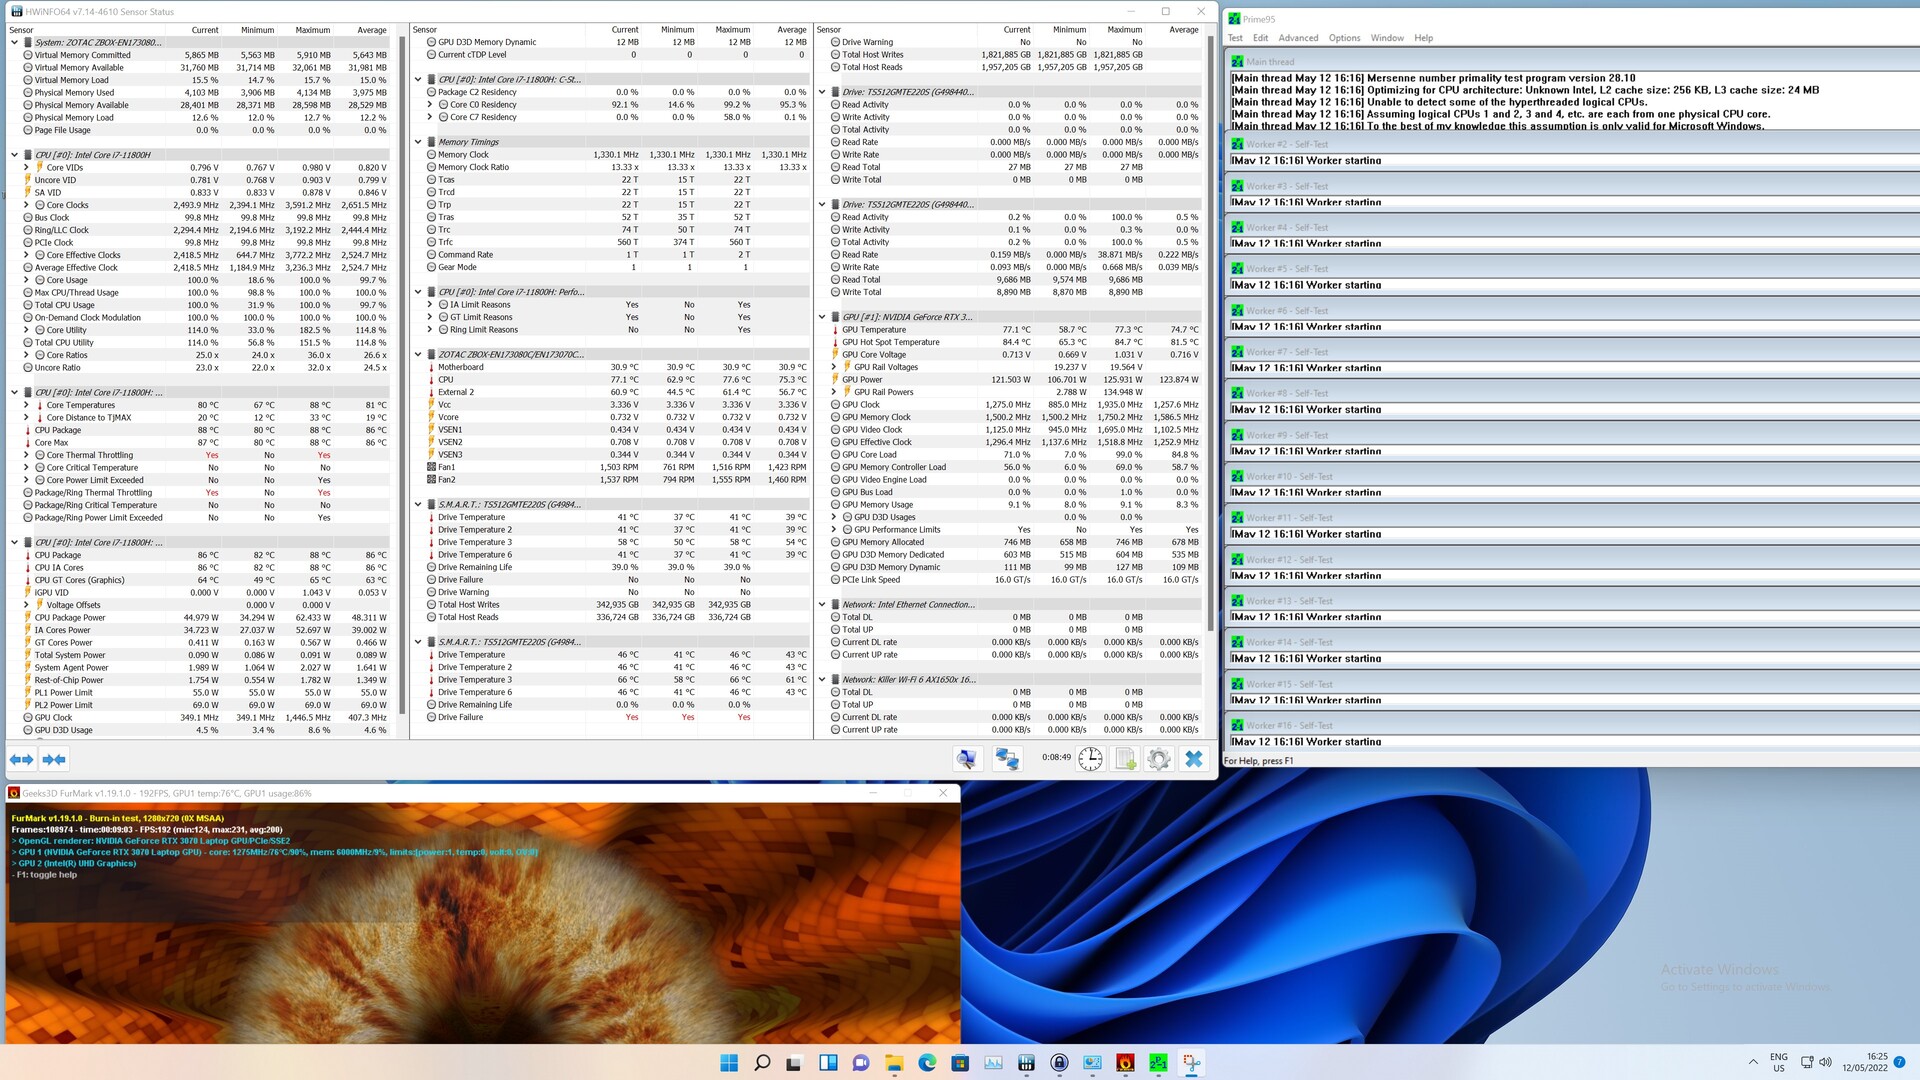
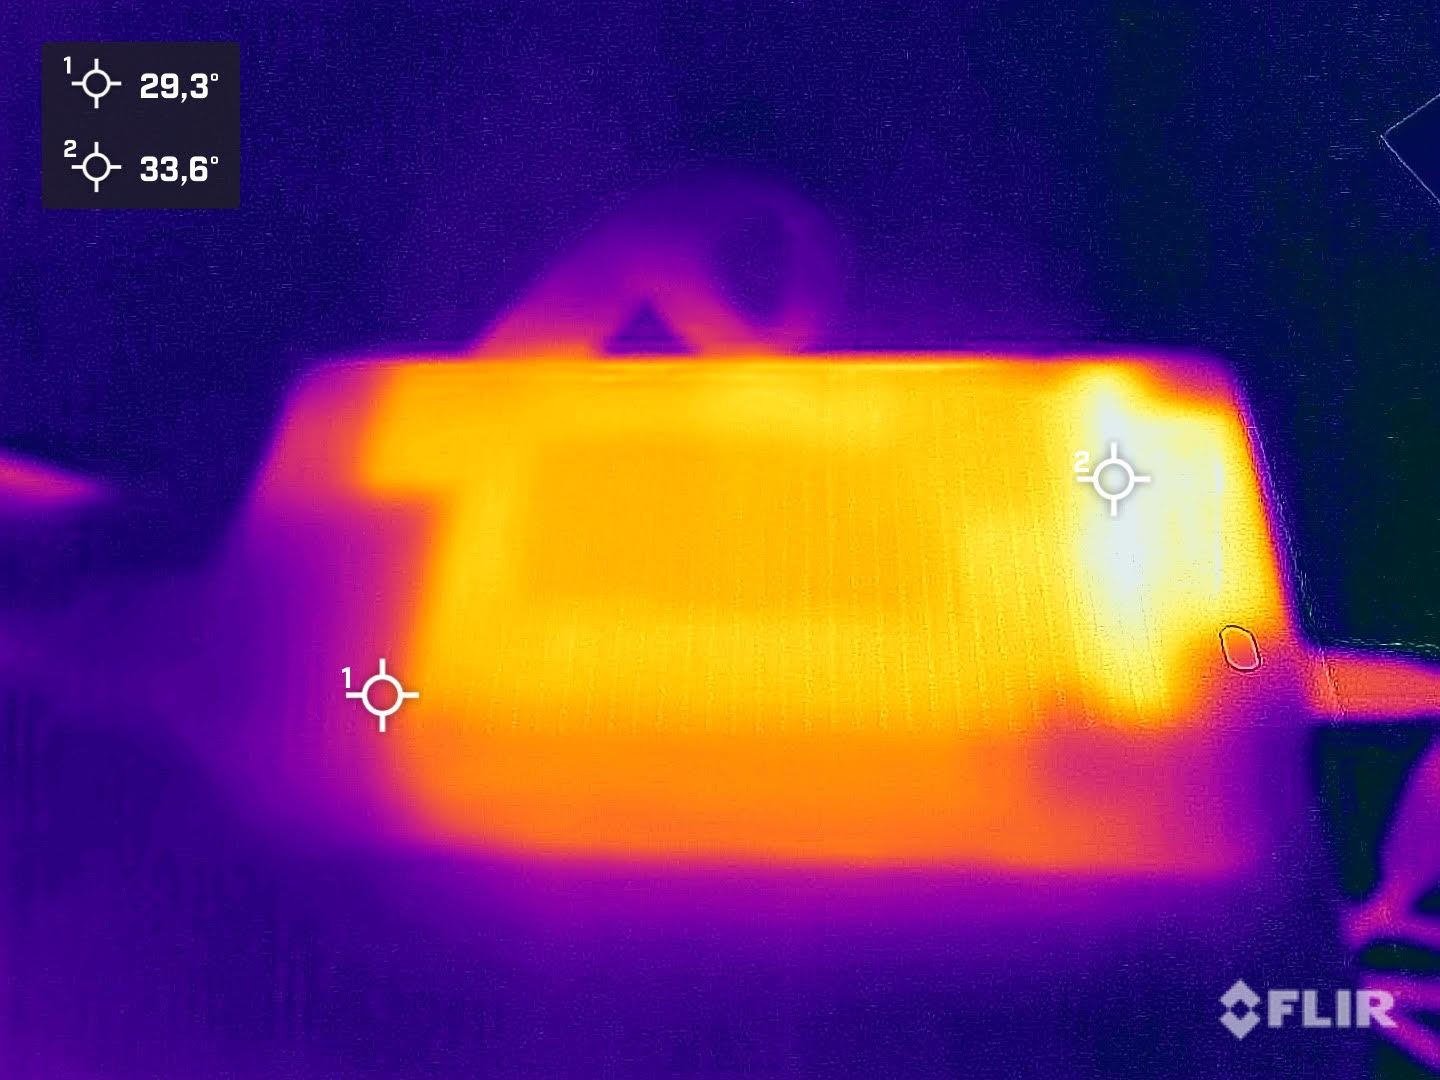
Durante o teste de estresse, colocamos os mais altos níveis de carga no sistema com Prime95 e FurMark. Durante este pior cenário, o Intel Core i7-11800Hatinge uma temperatura máxima de 88 °C (190 °F). Na placa gráfica, medimos um valor ligeiramente inferior a 77 °C (171 °F). A velocidade do relógio da CPU é de 2,6 GHz, que é maior que a velocidade básica do relógio de 2,3 GHz. A carga constante em todos os componentes não tem um efeito negativo, e uma referência 3D logo em seguida produz um resultado idêntico em comparação com a partida a frio.
Consumo de energia
Durante a operação ociosa, o consumo de energia da Zotac ZBOX Magnus EN173070C está entre 31 e 41 watts. Para um sistema de mesa, estes são valores muito bons. Por outro lado, em comparação com laptops equipados de maneira semelhante, esses valores são muito altos. Sob carga, medimos em média 214 watts. Ao mesmo tempo, a fonte de alimentação pesada é capaz de lidar facilmente com o pico de consumo de apenas 231 watts que medimos.
| Ocioso | |
| Carga |
|
Key:
min: | |
Power Consumption With External Monitor
Pro
Contra
Veredicto - Um PC ultracompacto para jogos

Com o ZBOX Magnus EN173070C, a Zotac proporciona uma boa atualização do produto. O rápidoIntel Core i7-11800Hoferece uma velocidade de operação muito boa, e o Nvidia GeForce RTX 3070 Móvelé igualmente capaz de produzir um bom desempenho sem ser asfixiado artificialmente. Os 125 watts completos estão disponíveis aqui, o que significa que mesmo os Nvidia GeForce RTX 3080 Móvel é muitas vezes superada. No entanto, ainda temos que considerar que os níveis de desempenho estão na faixa de umNvidia GeForce RTX 3060 DesktopgPU. Mas considerando a compacidade da única caixa de 2,65 litros, é surpreendente o que a Zotac pode oferecer com suas ZBOXes aqui.
Tudo isso, naturalmente, também tem seu preço. Em comparação com laptops para jogos a preços acessíveis, tais como o Acer Nitro5 AN515o preço está em um nível semelhante. Às vezes é preciso até mesmo pagar mais, já que um SSD e a RAM não estão incluídos no equipamento base. Com 1650 euros (~$1743), a Zotac está pedindo um preço elevado. Por outro lado, você também recebe um PC ultracompacto para jogos que você pode armazenar ou levar com você tão facilmente quanto um laptop.
O desempenho do jogo foi capaz de nos convencer, e a variedade de conexões também é suficiente. Ao mesmo tempo, você também tem que ter em mente que você só pode transferir dados através do Thunderbolt 4, mas não pode usá-lo para executar uma placa gráfica externa. Isto é lamentável em nossa opinião, já que, de outra forma, lhe permitiria aumentar o desempenho 3D sem ter que adquirir um dispositivo completamente novo.
O Zotac ZBOX Magnus EN173070C é um PC de jogo muito rápido baseado em componentes móveis. Entretanto, antes de adquiri-lo, você deve estar familiarizado com as características de um sistema de barebone.
Em termos de nível de ruído, a Zotac ZBOX Magnus EN173070C perde em comparação com os PCs desktop convencionais. Sob carga, os ventiladores têm que se reverter consideravelmente, mas o ruído dos ventiladores ainda é relativamente confortável e não muito agudo. Uma alternativa é oferecida pela Intel com a Dragon Canyon NUCque é outro sistema de barebone, assim como a ZBOX Magnus EN173070C. Embora o dispositivo não seja tão compacto, ele também pode ser equipado com placas gráficas convencionais de mesa. Como de costume, o cliente tem a escolha e precisa decidir quais parâmetros são mais importantes em sua compra.
Preço e Disponibilidade
Enquanto a Zotac ZBOX Magnus EN173070C está listada no site Zotac USe em muitos outros de seus sites específicos de país, parece ser difícil encontrar para compra nos EUA. O modelo mais prevalente nos EUA parece ser oZOTAC Magnus ONE ECM7307LH Mini PC, que usa um estojo diferente e já inclui a RAM, SSD e HDD por $2130 na Amazon.

