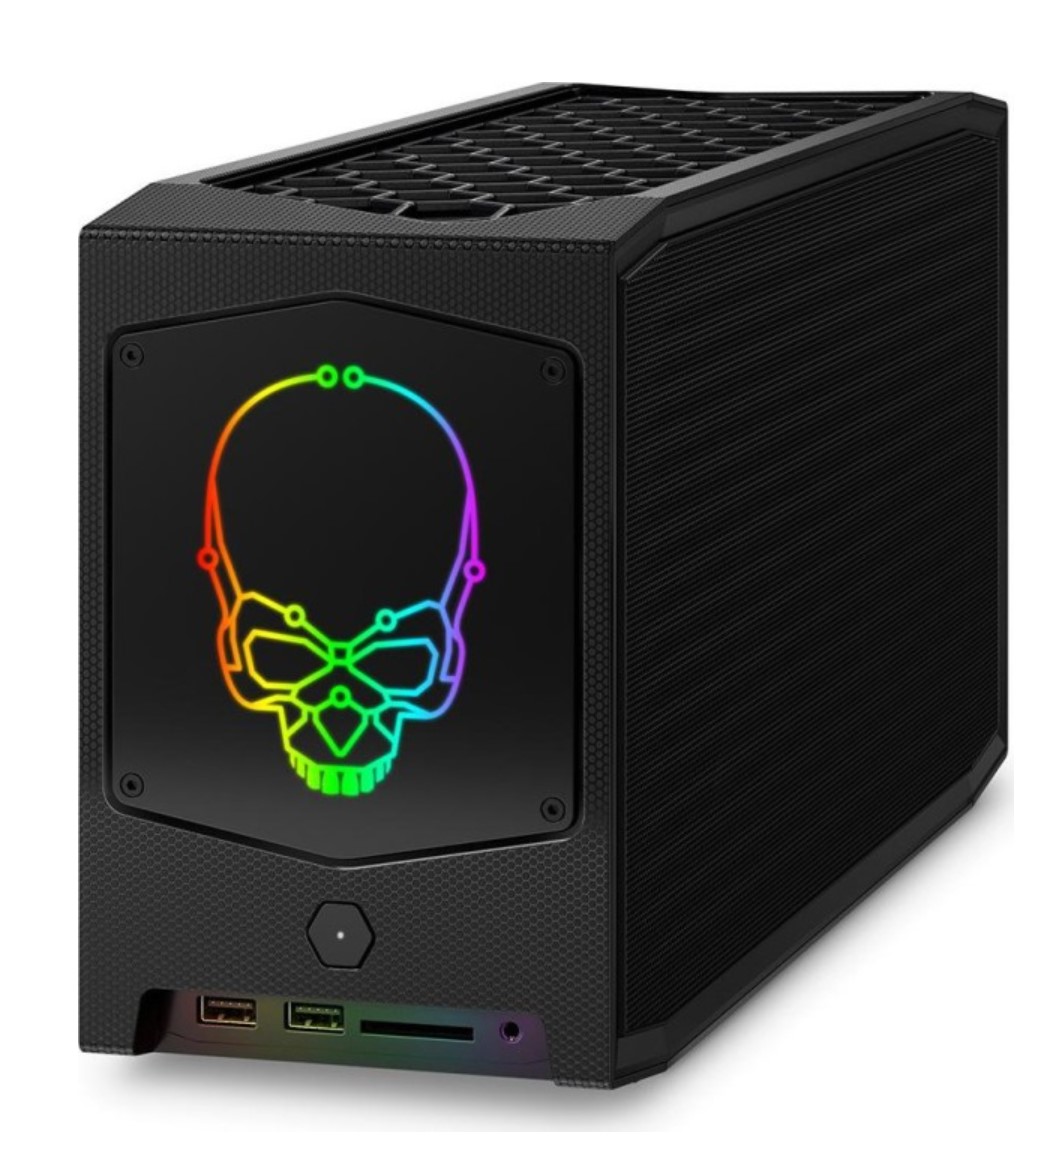
Revisão da Intel NUC 12 Dragon Canyon com Intel Core i9-12900
O Intel NUC Extreme Kit já é conhecido há algum tempo. Com sua construção compacta e bom equipamento, ele se destaca das massas, e o design do computador desktop compacto pode ser facilmente reconhecido,sem dúvida.
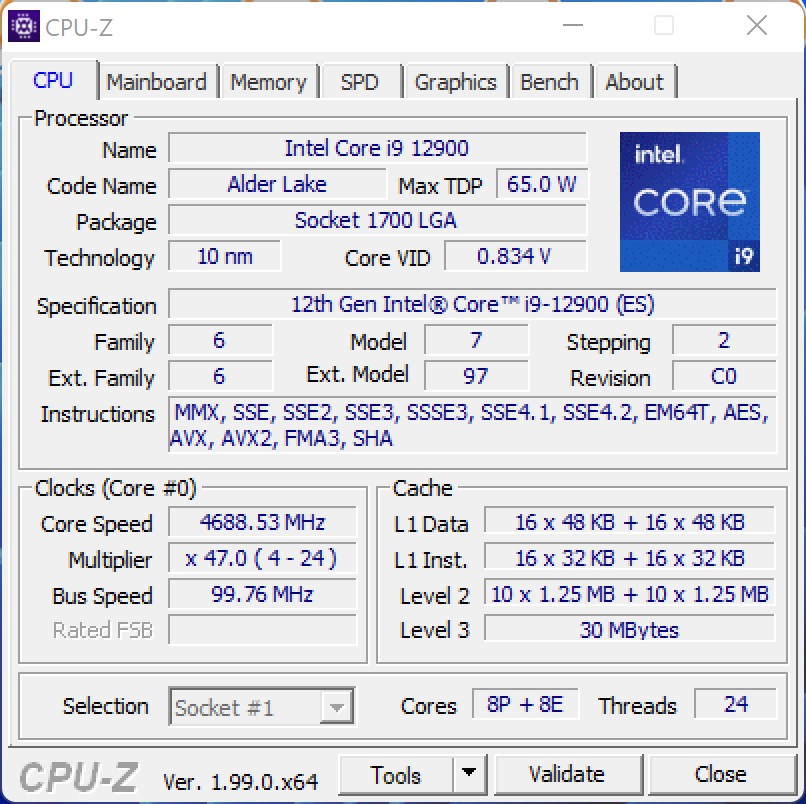
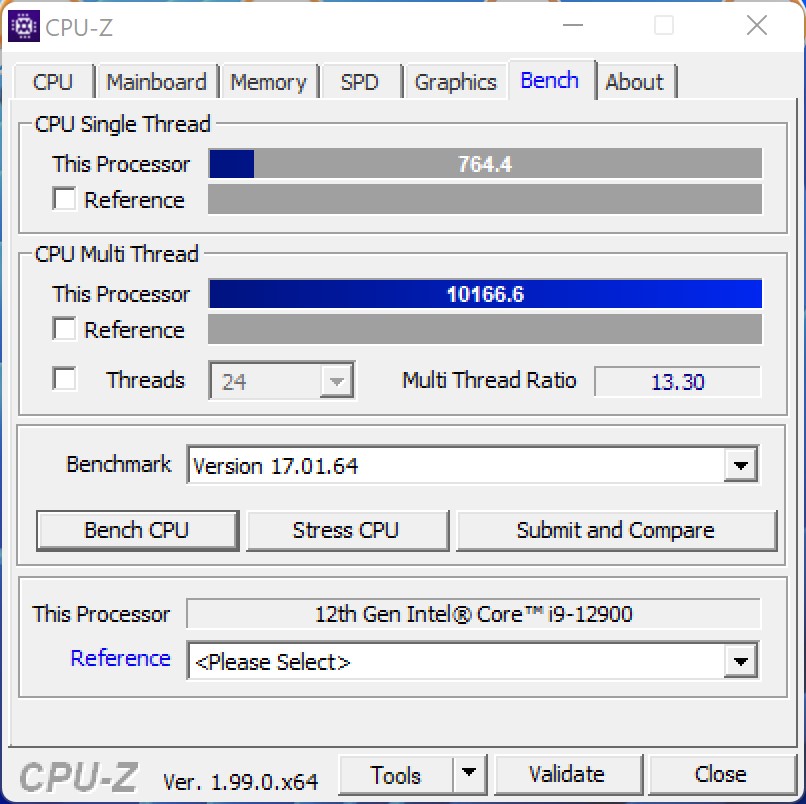
Recentemente, demos uma olhada detalhada no Intel NUC 11 Extreme Kit alias Beast Canyon e já estávamos surpresos com suas poderosas capacidades naquela época. Com o Intel NUC 12 Extreme Kit, vulgo Dragon Canyon, a Intel apresenta agora o sucessor, mostrando que agora há ainda mais potência com a nova CPU. Mas isto também poderia ser esperado devido ao progresso no desenvolvimento do chip, já que Alder Lake tem uma vantagem significativa para a plataforma Tiger Lake mais antiga. Ela ainda usa o Elemento de Cálculo que já conhecemos, que combina todos os componentes importantes de um PC. Pela primeira vez, a Intel toma a direção de usar uma CPU socketed como a conhecemos do segmento de desktop padrão. Aqui, é utilizado o Intel Core i9-12900 da atual série Alder Lake S. Assim como o Intel Core i9-12900K, o processador oferece os núcleos P e E que já conhecemos, que são capazes de operar com até 24 threads simultaneamente. Entretanto, com um TDP ligeiramente inferior, também esperamos um desempenho ligeiramente inferior. Descubra mais detalhes sobre isto no segmento de desempenho mais abaixo.
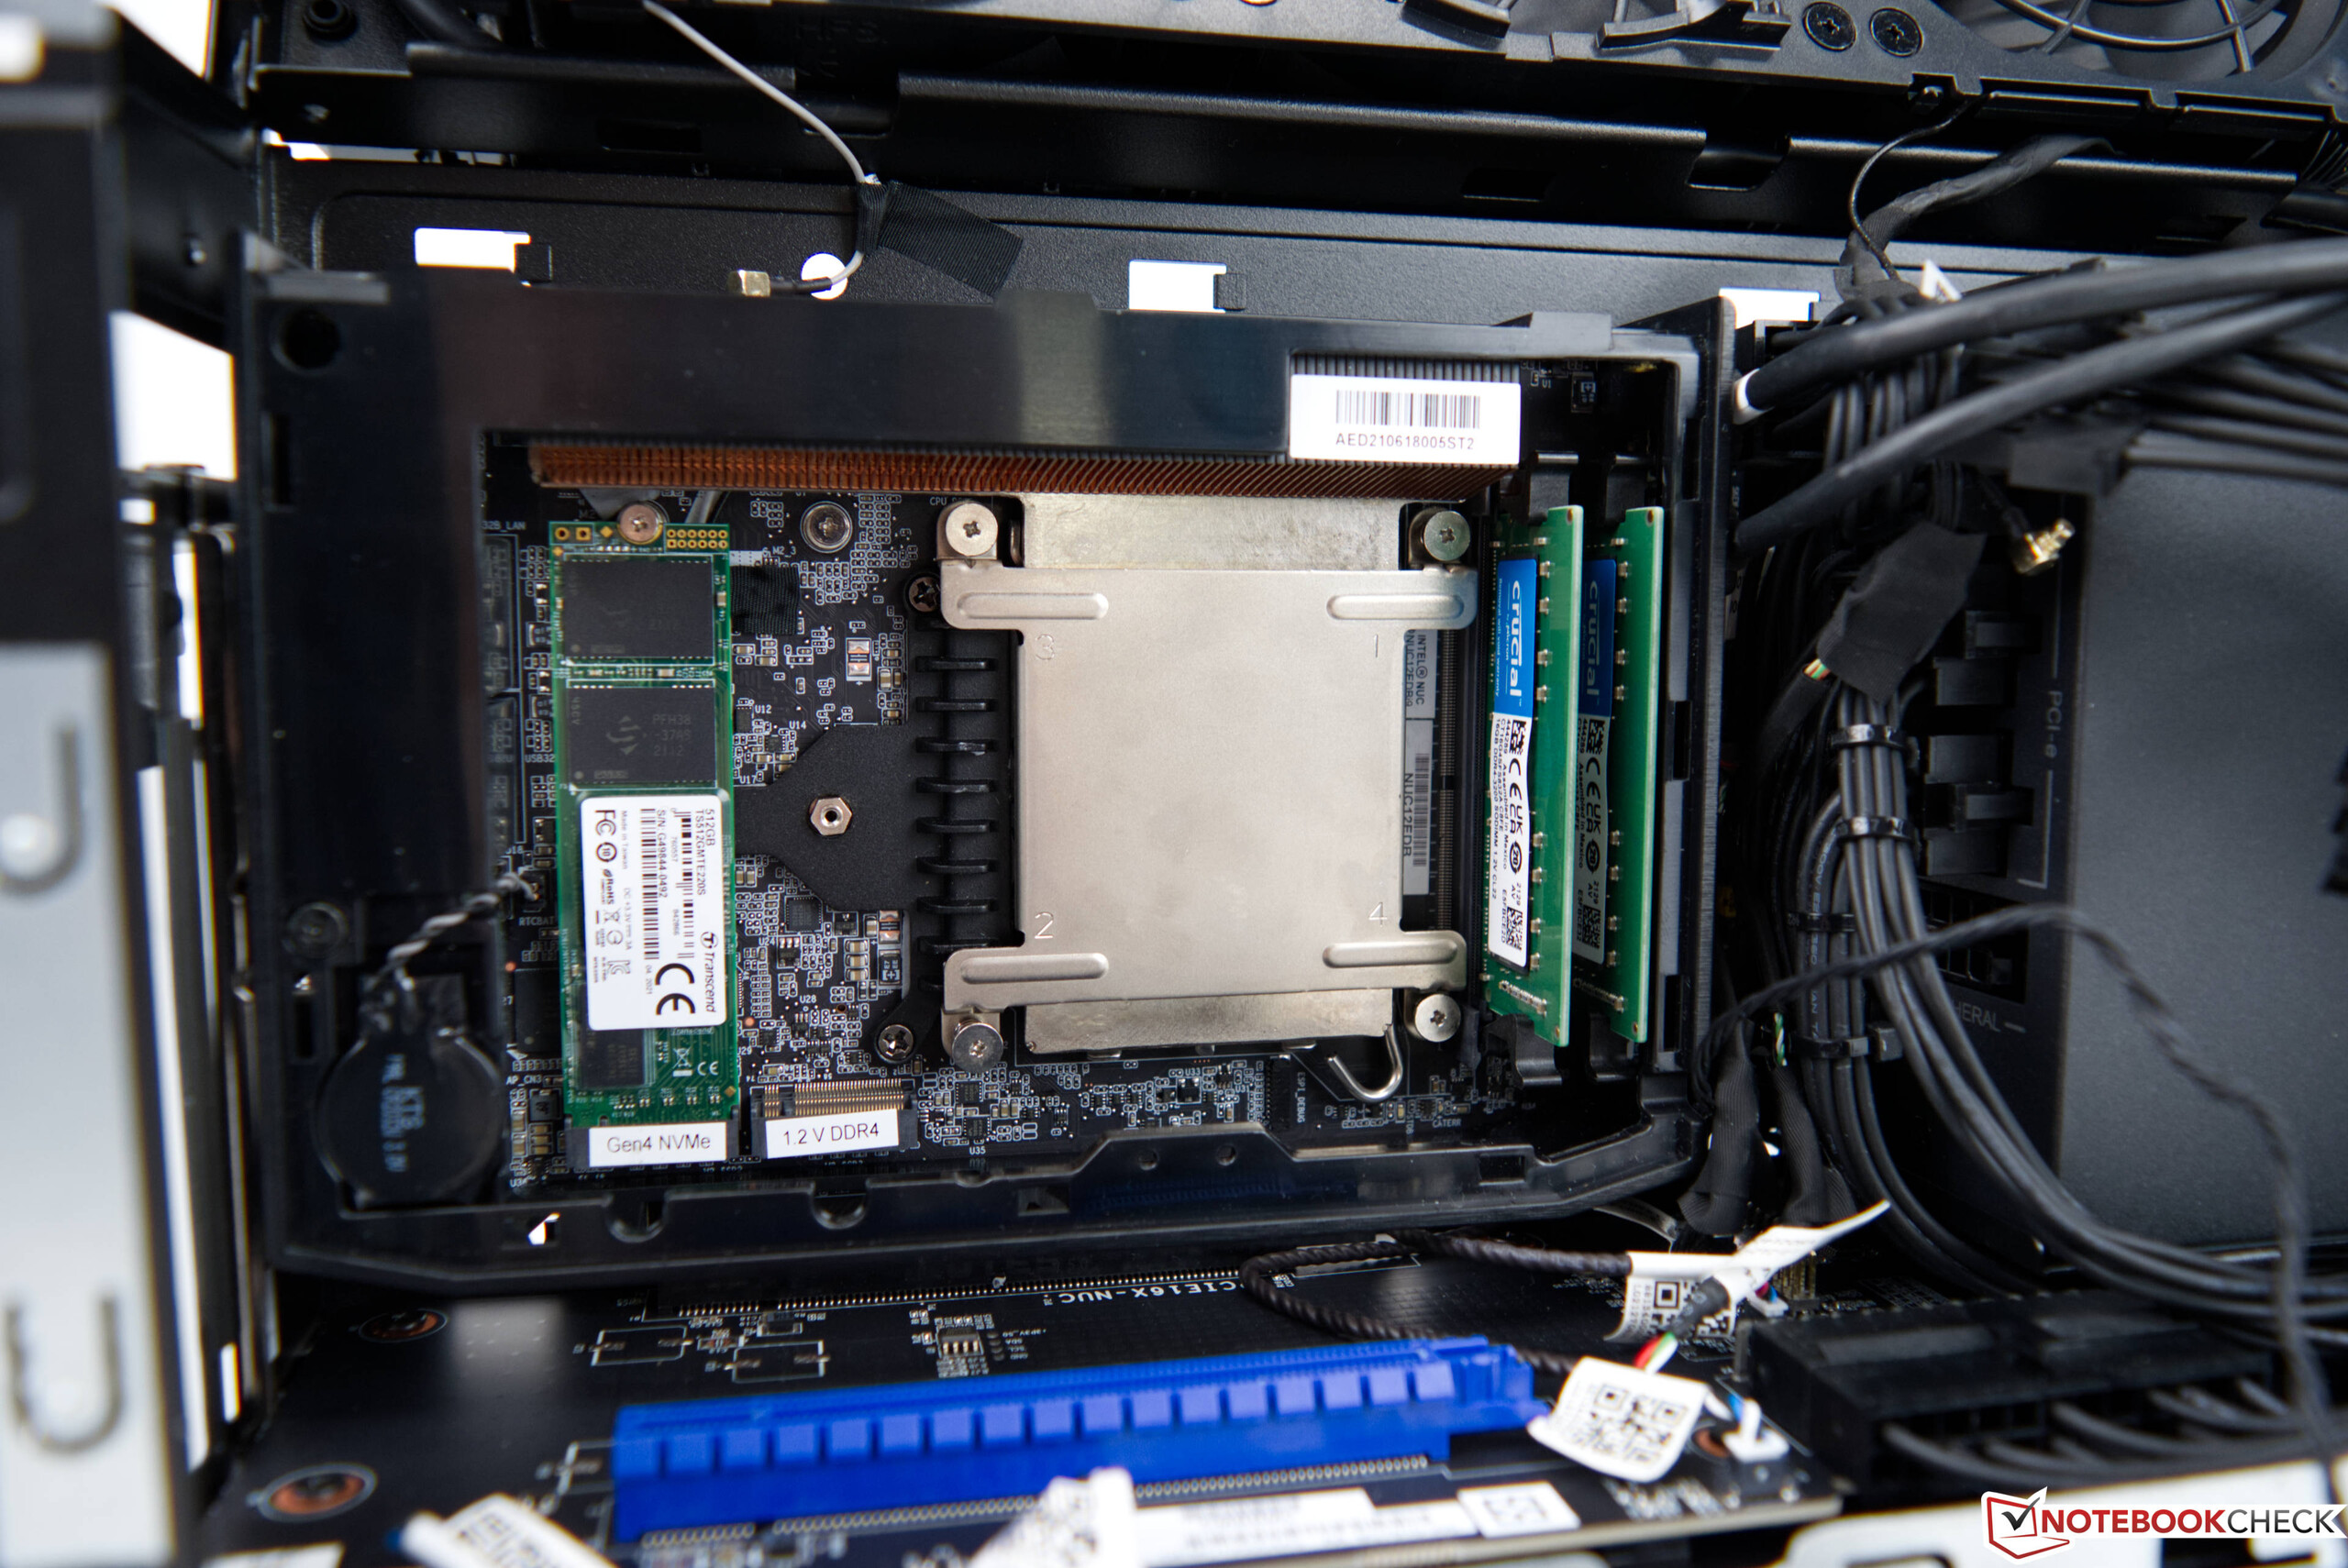
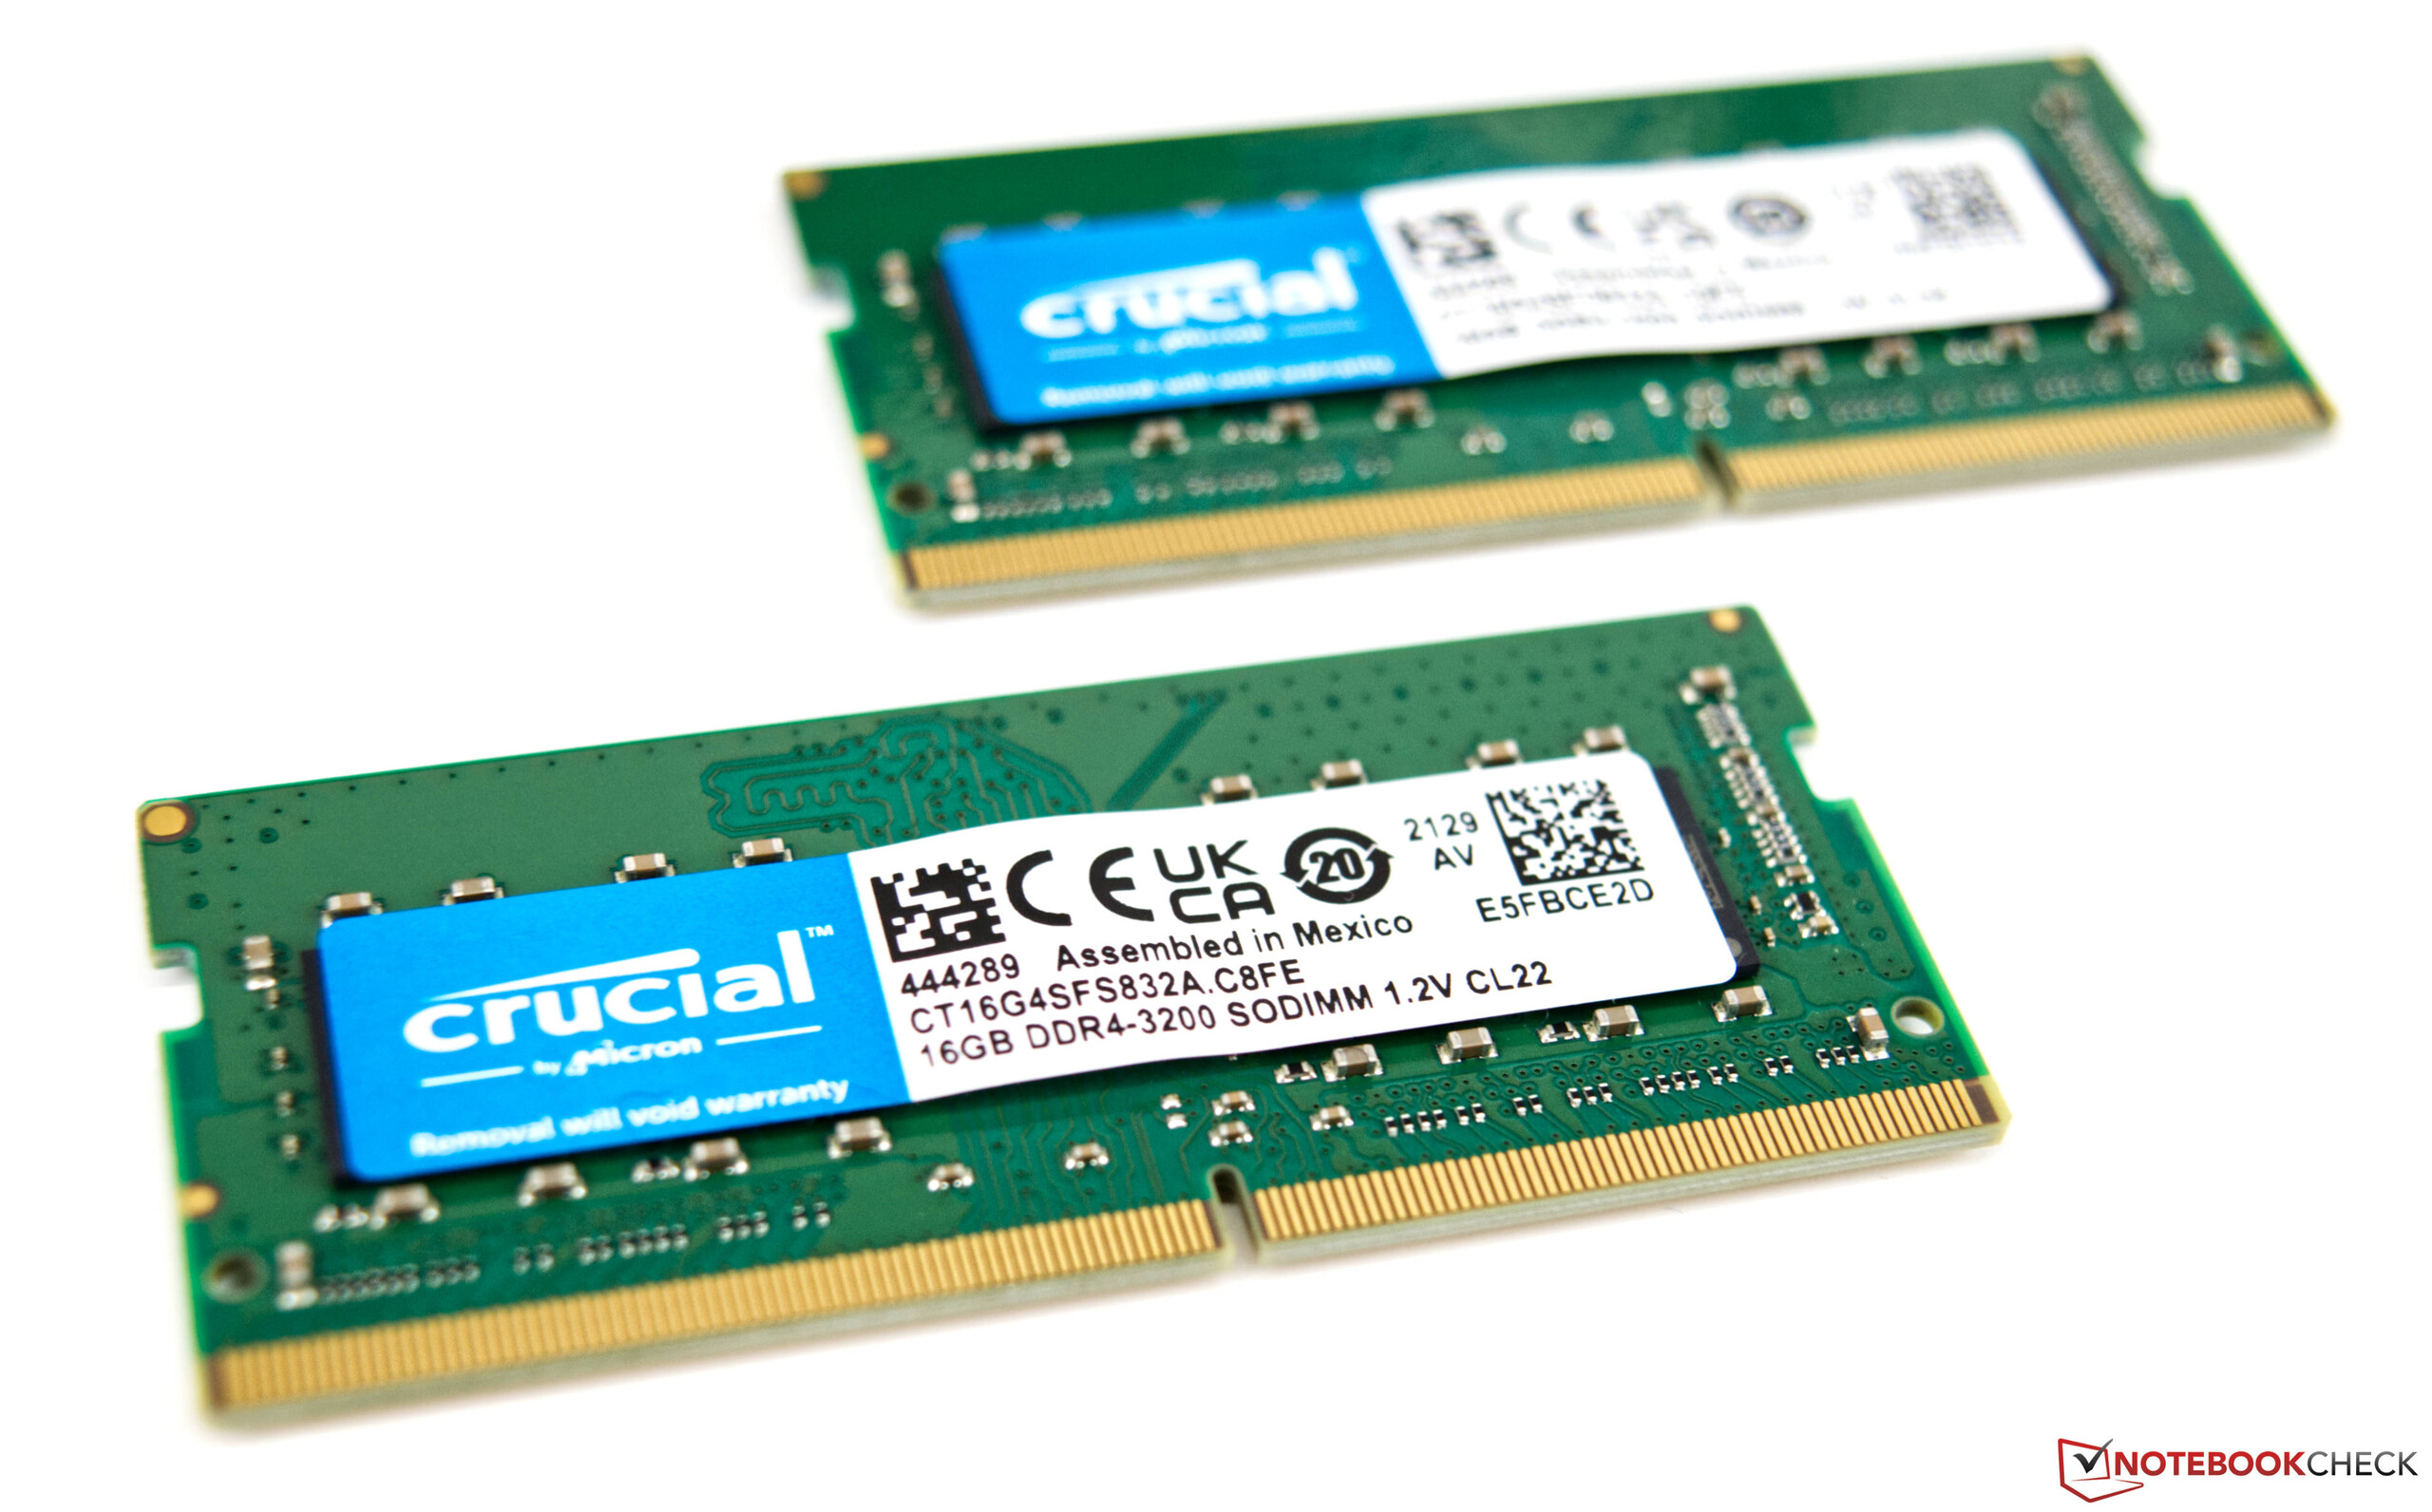
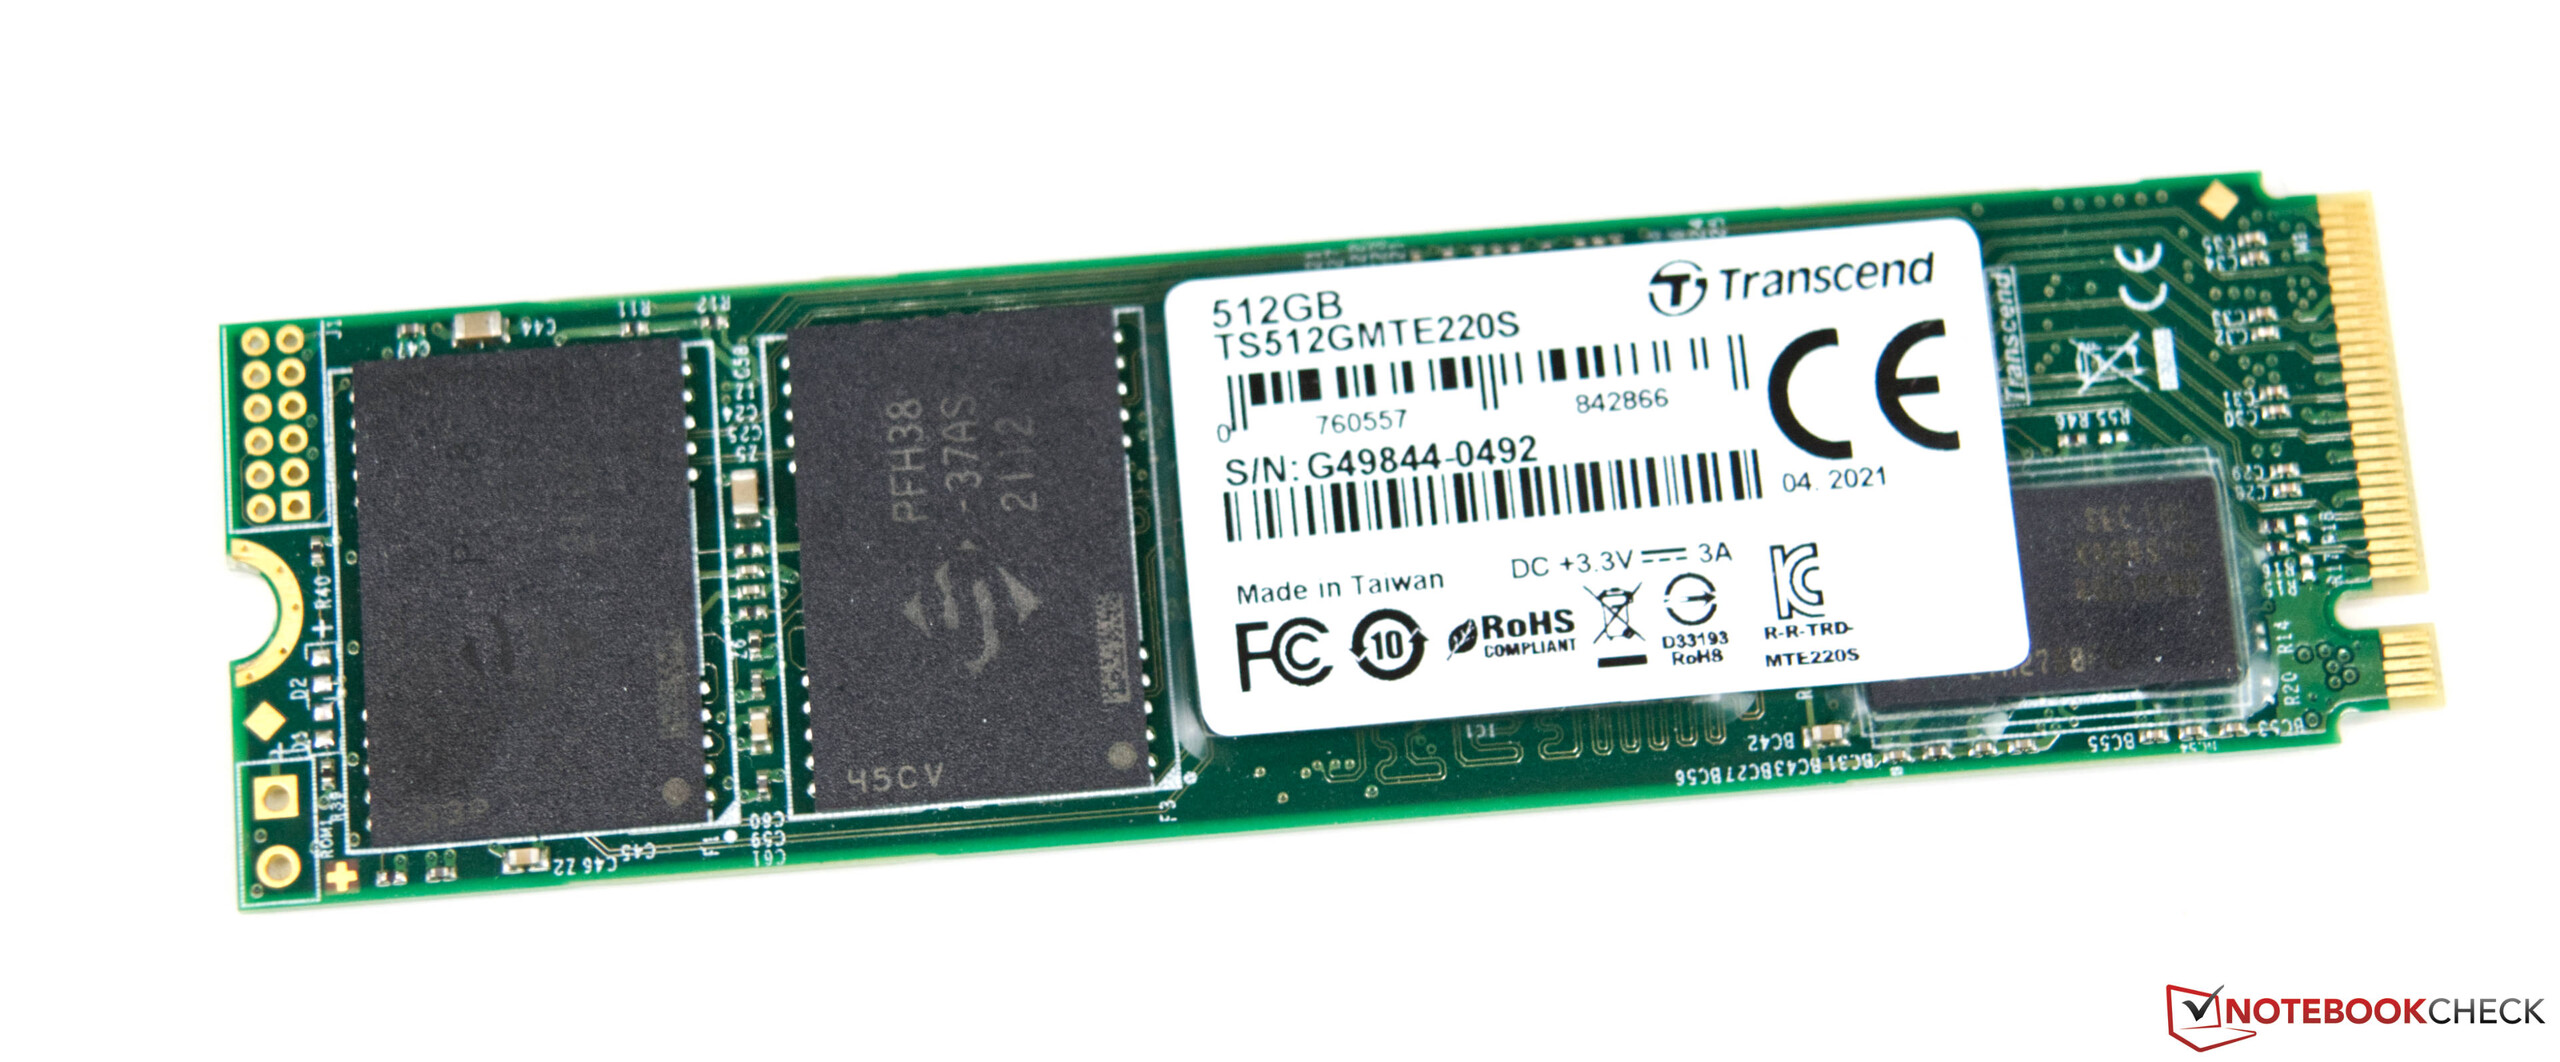
Ao adquirir o Intel NUC 12 Extreme Kit, você tem que considerar que este é um sistema de barebone. O SSD, RAM, e uma placa gráfica dedicada não estão incluídos. Para estes, examinamos nossos próprios suprimentos e equipamos o sistema com um SSD NVME de 512 GB e 32 GB de RAM DDR4. Em termos da placa gráfica dedicada, decidimos propositalmente pelo Nvidia GeForce RTX 3060, a fim de permitir uma comparação justa com o Intel NUC 11 Extreme Kit.
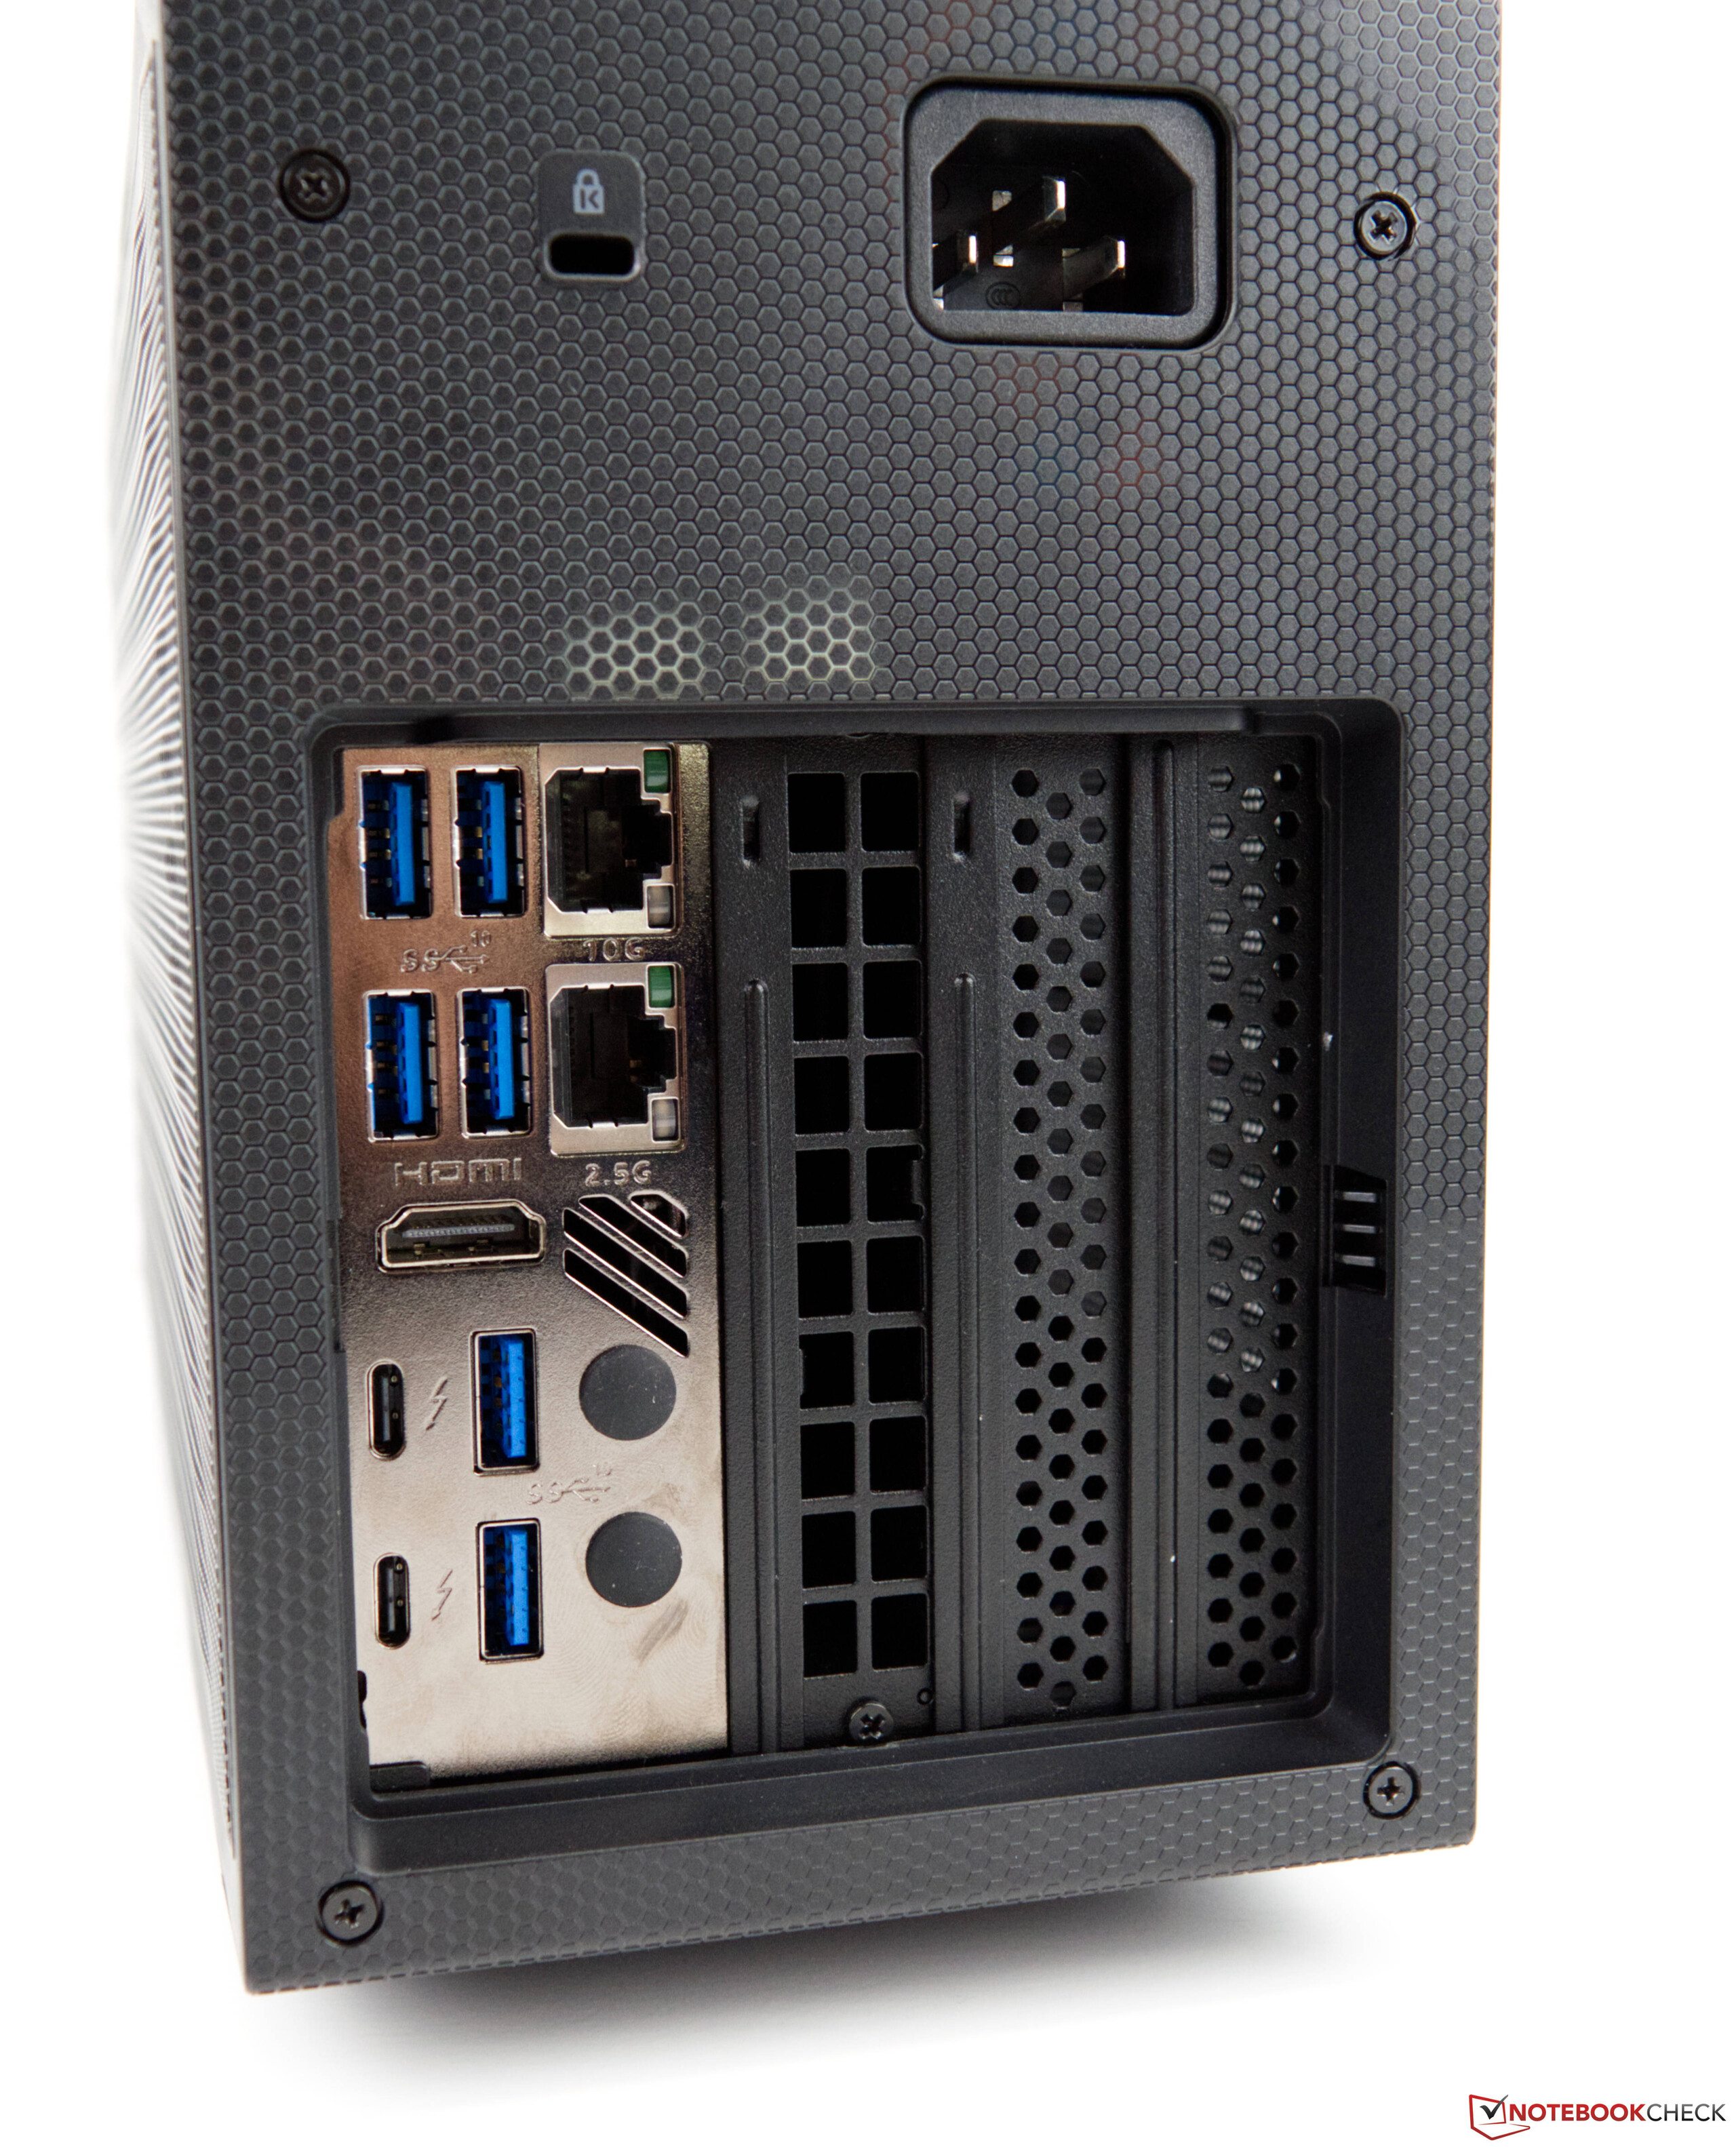
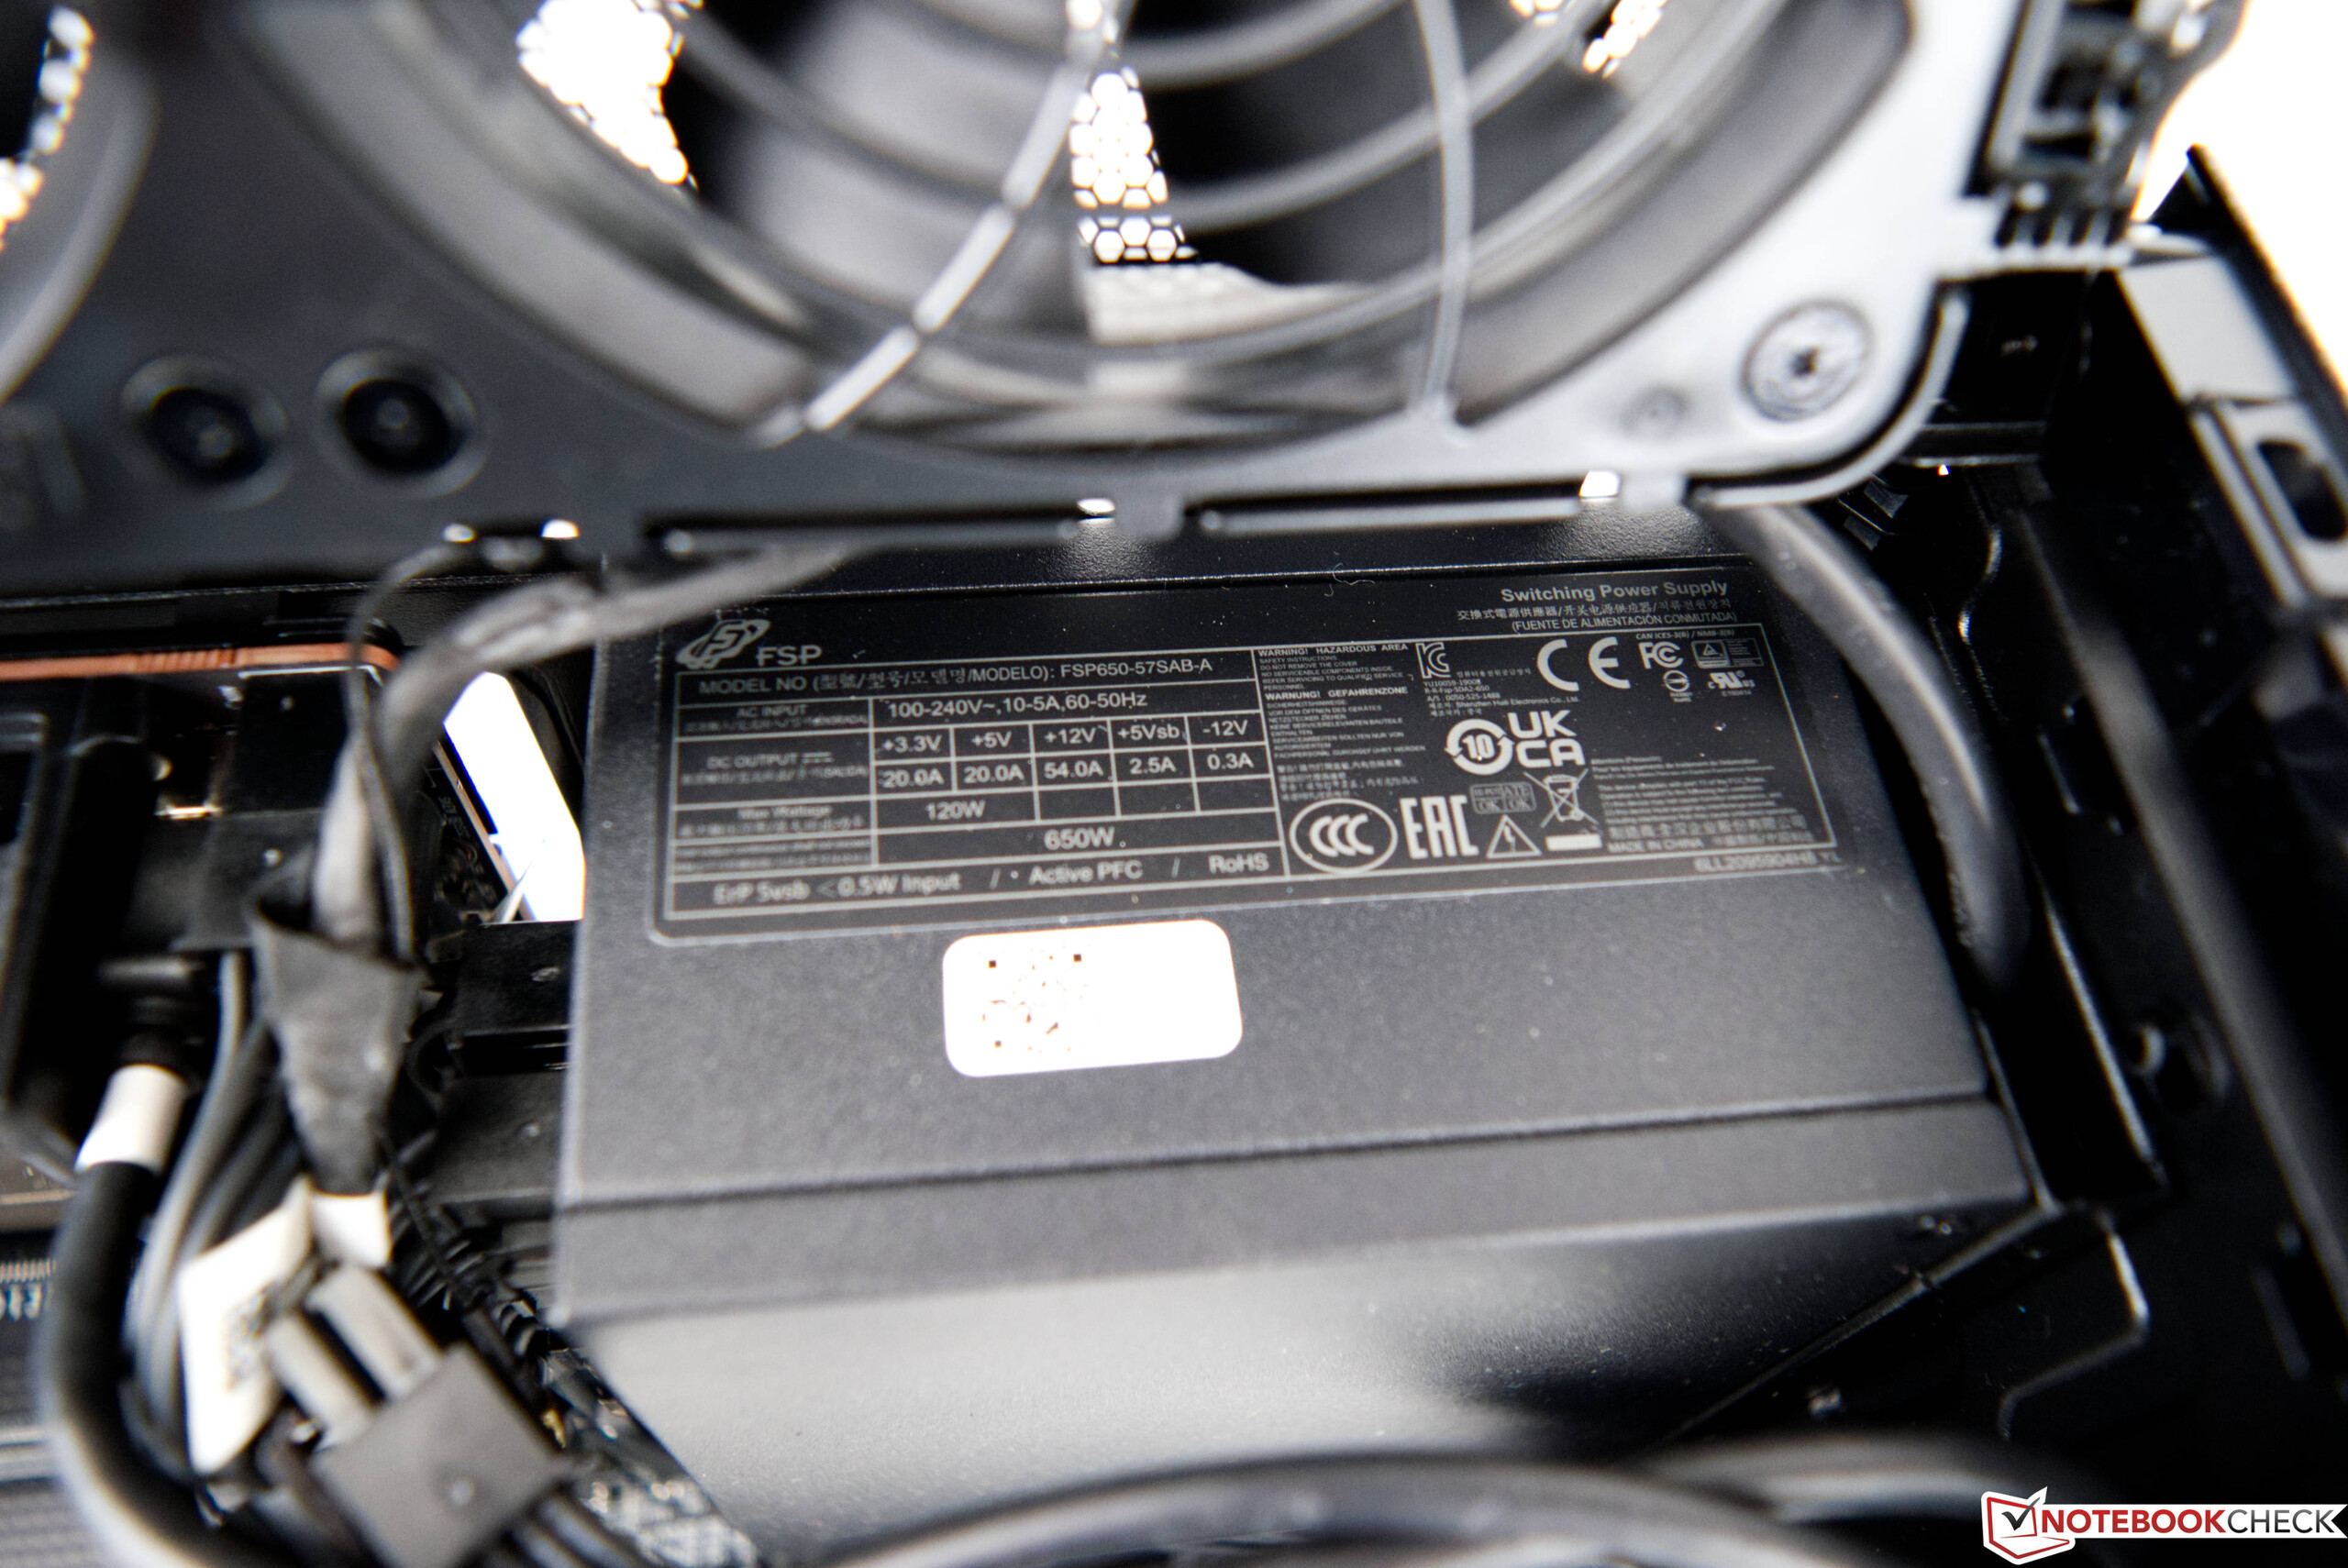
Para uma placa gráfica dedicada, pode-se usar modelos com um comprimento máximo de 30,5 cm (~12 pol.). A fonte de alimentação SFX de 650 watts oferece energia suficiente para operar também os modelos high-end atuais. No entanto, o resfriamento destes aceleradores de pixels não deve ocupar mais do que dois slots. Atualmente, você pode obter o Kit Extremo Intel NUC 12 por 1450 euros (~$1589).
Intel NUC 12 Extreme Compute Element em detalhe
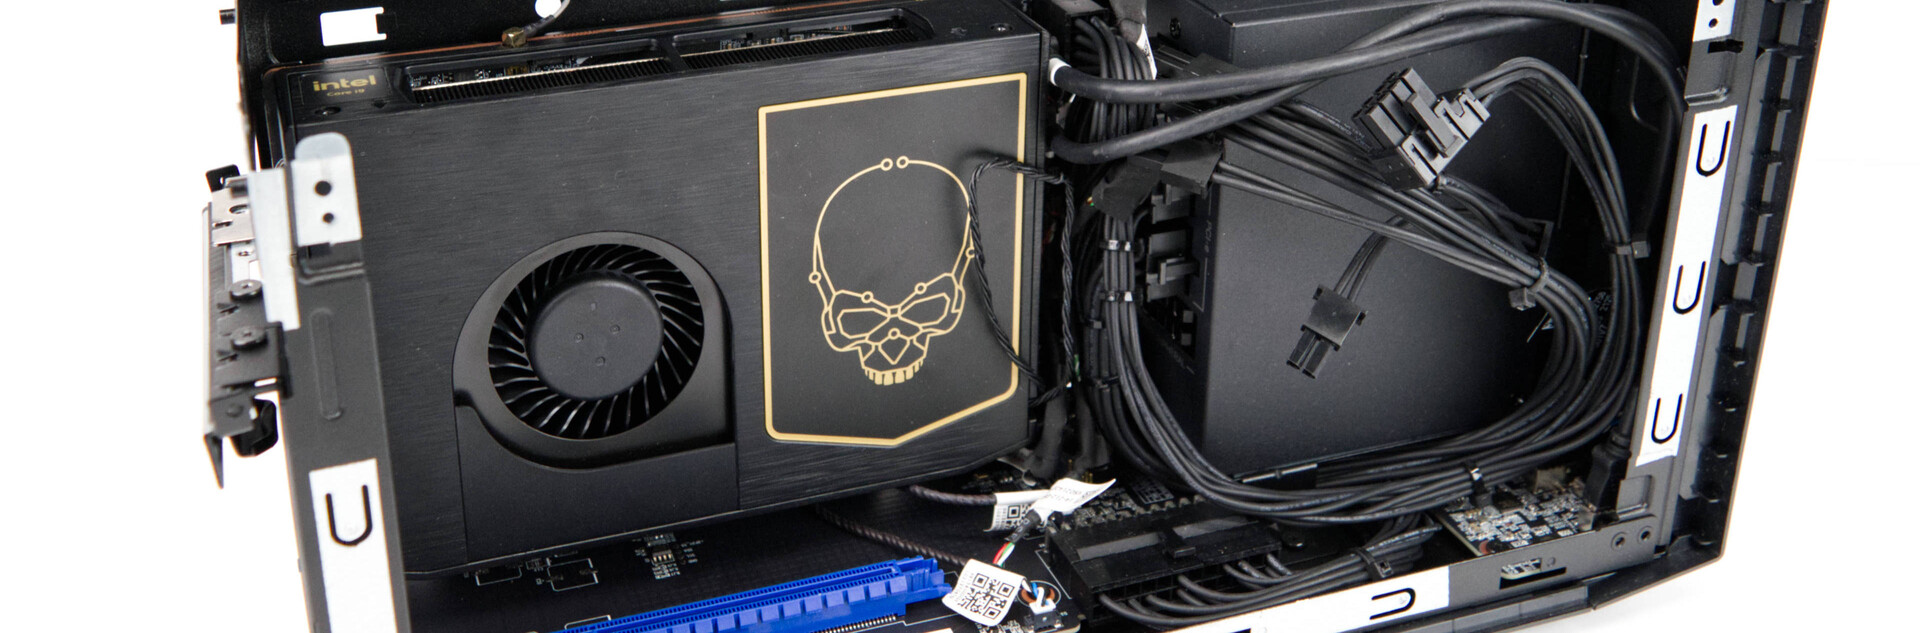
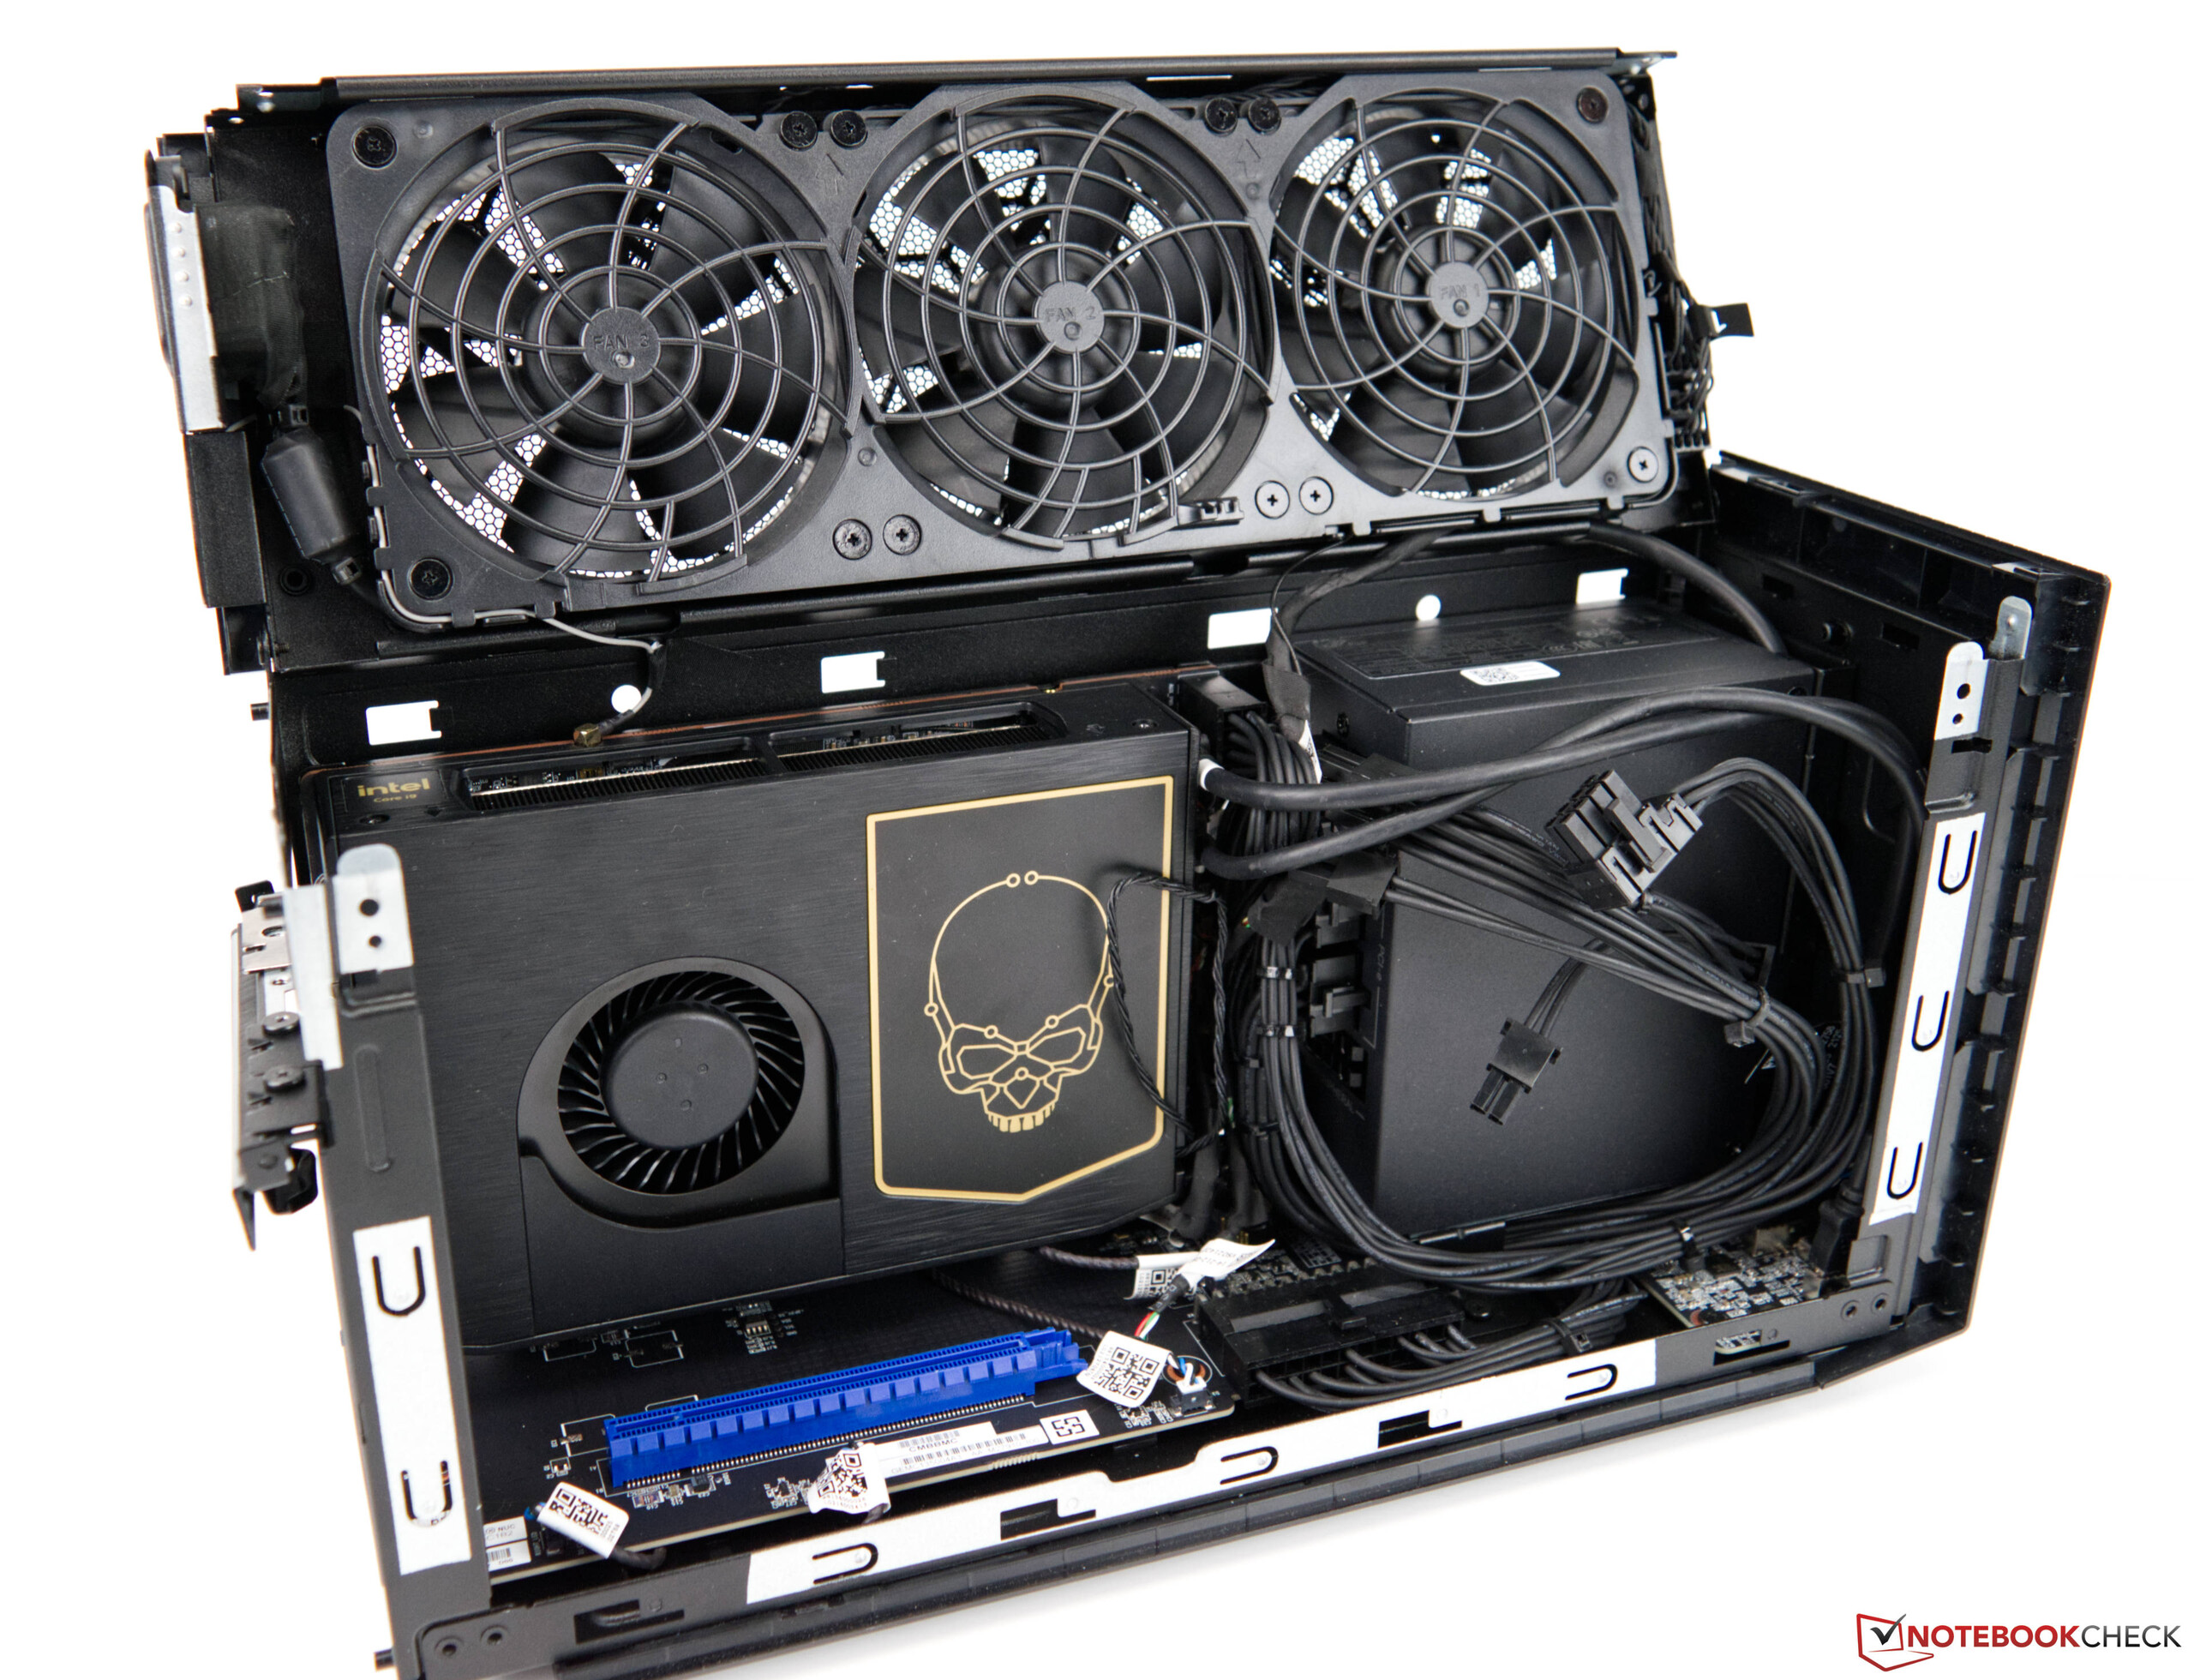
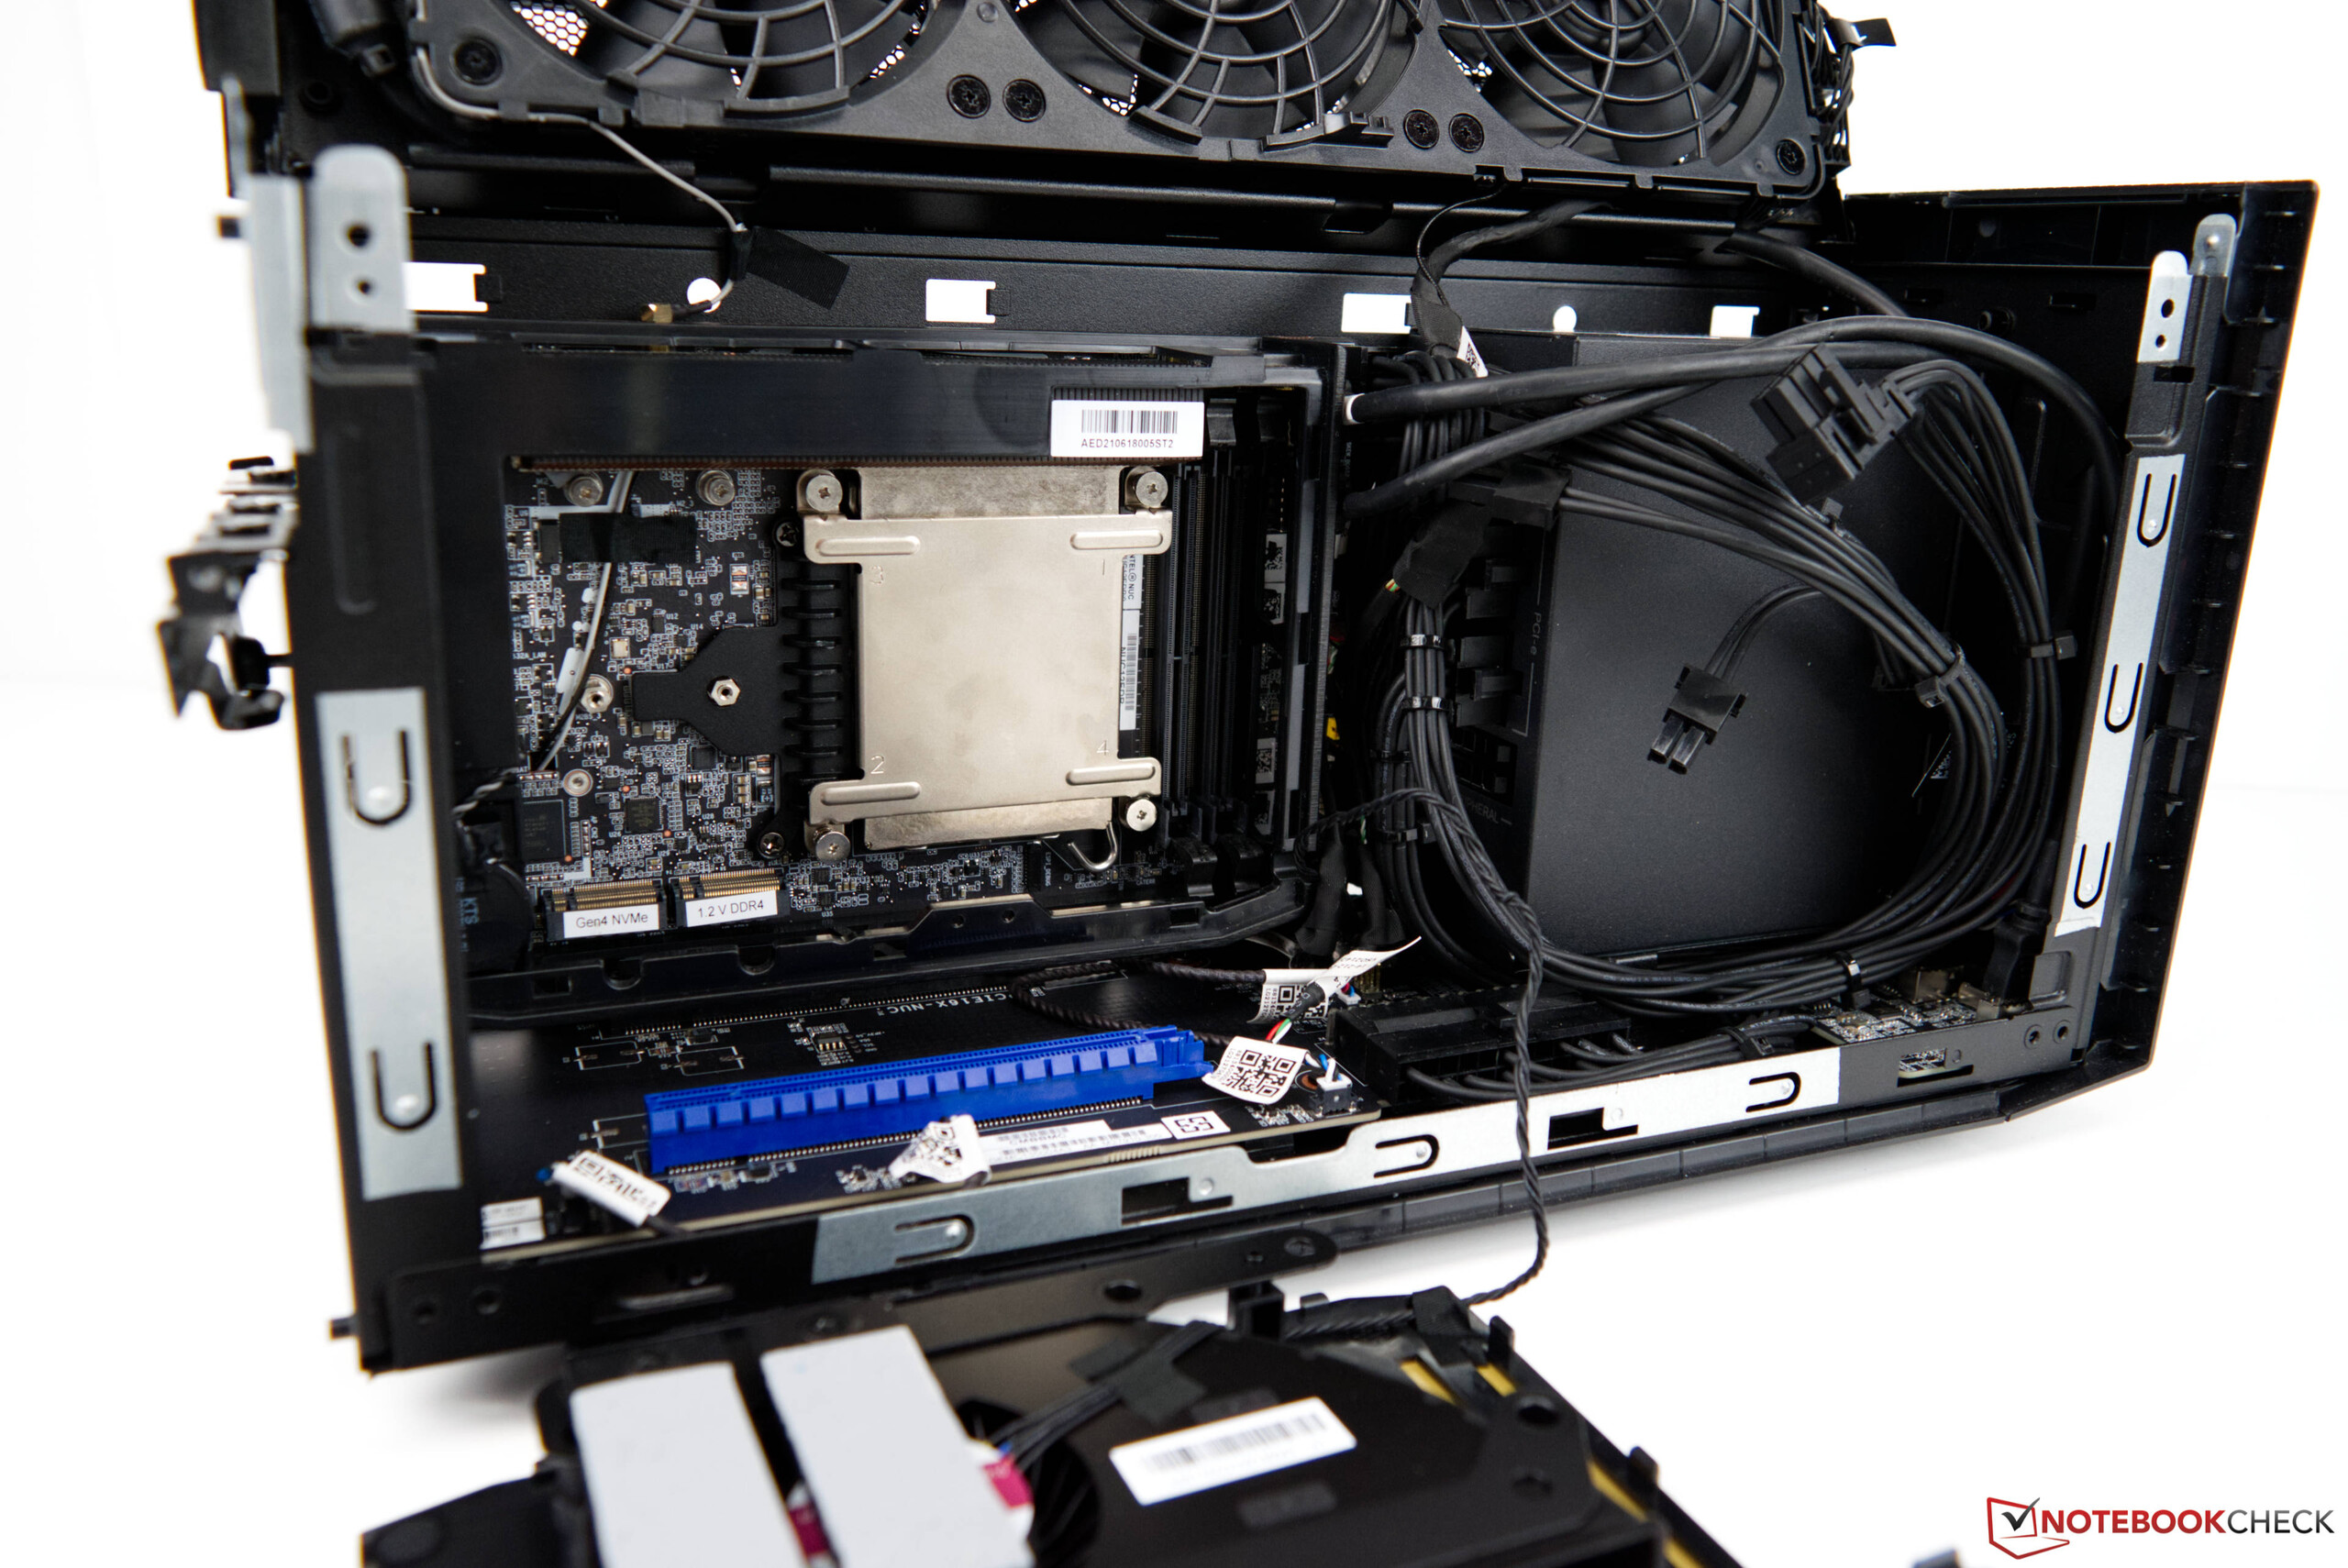
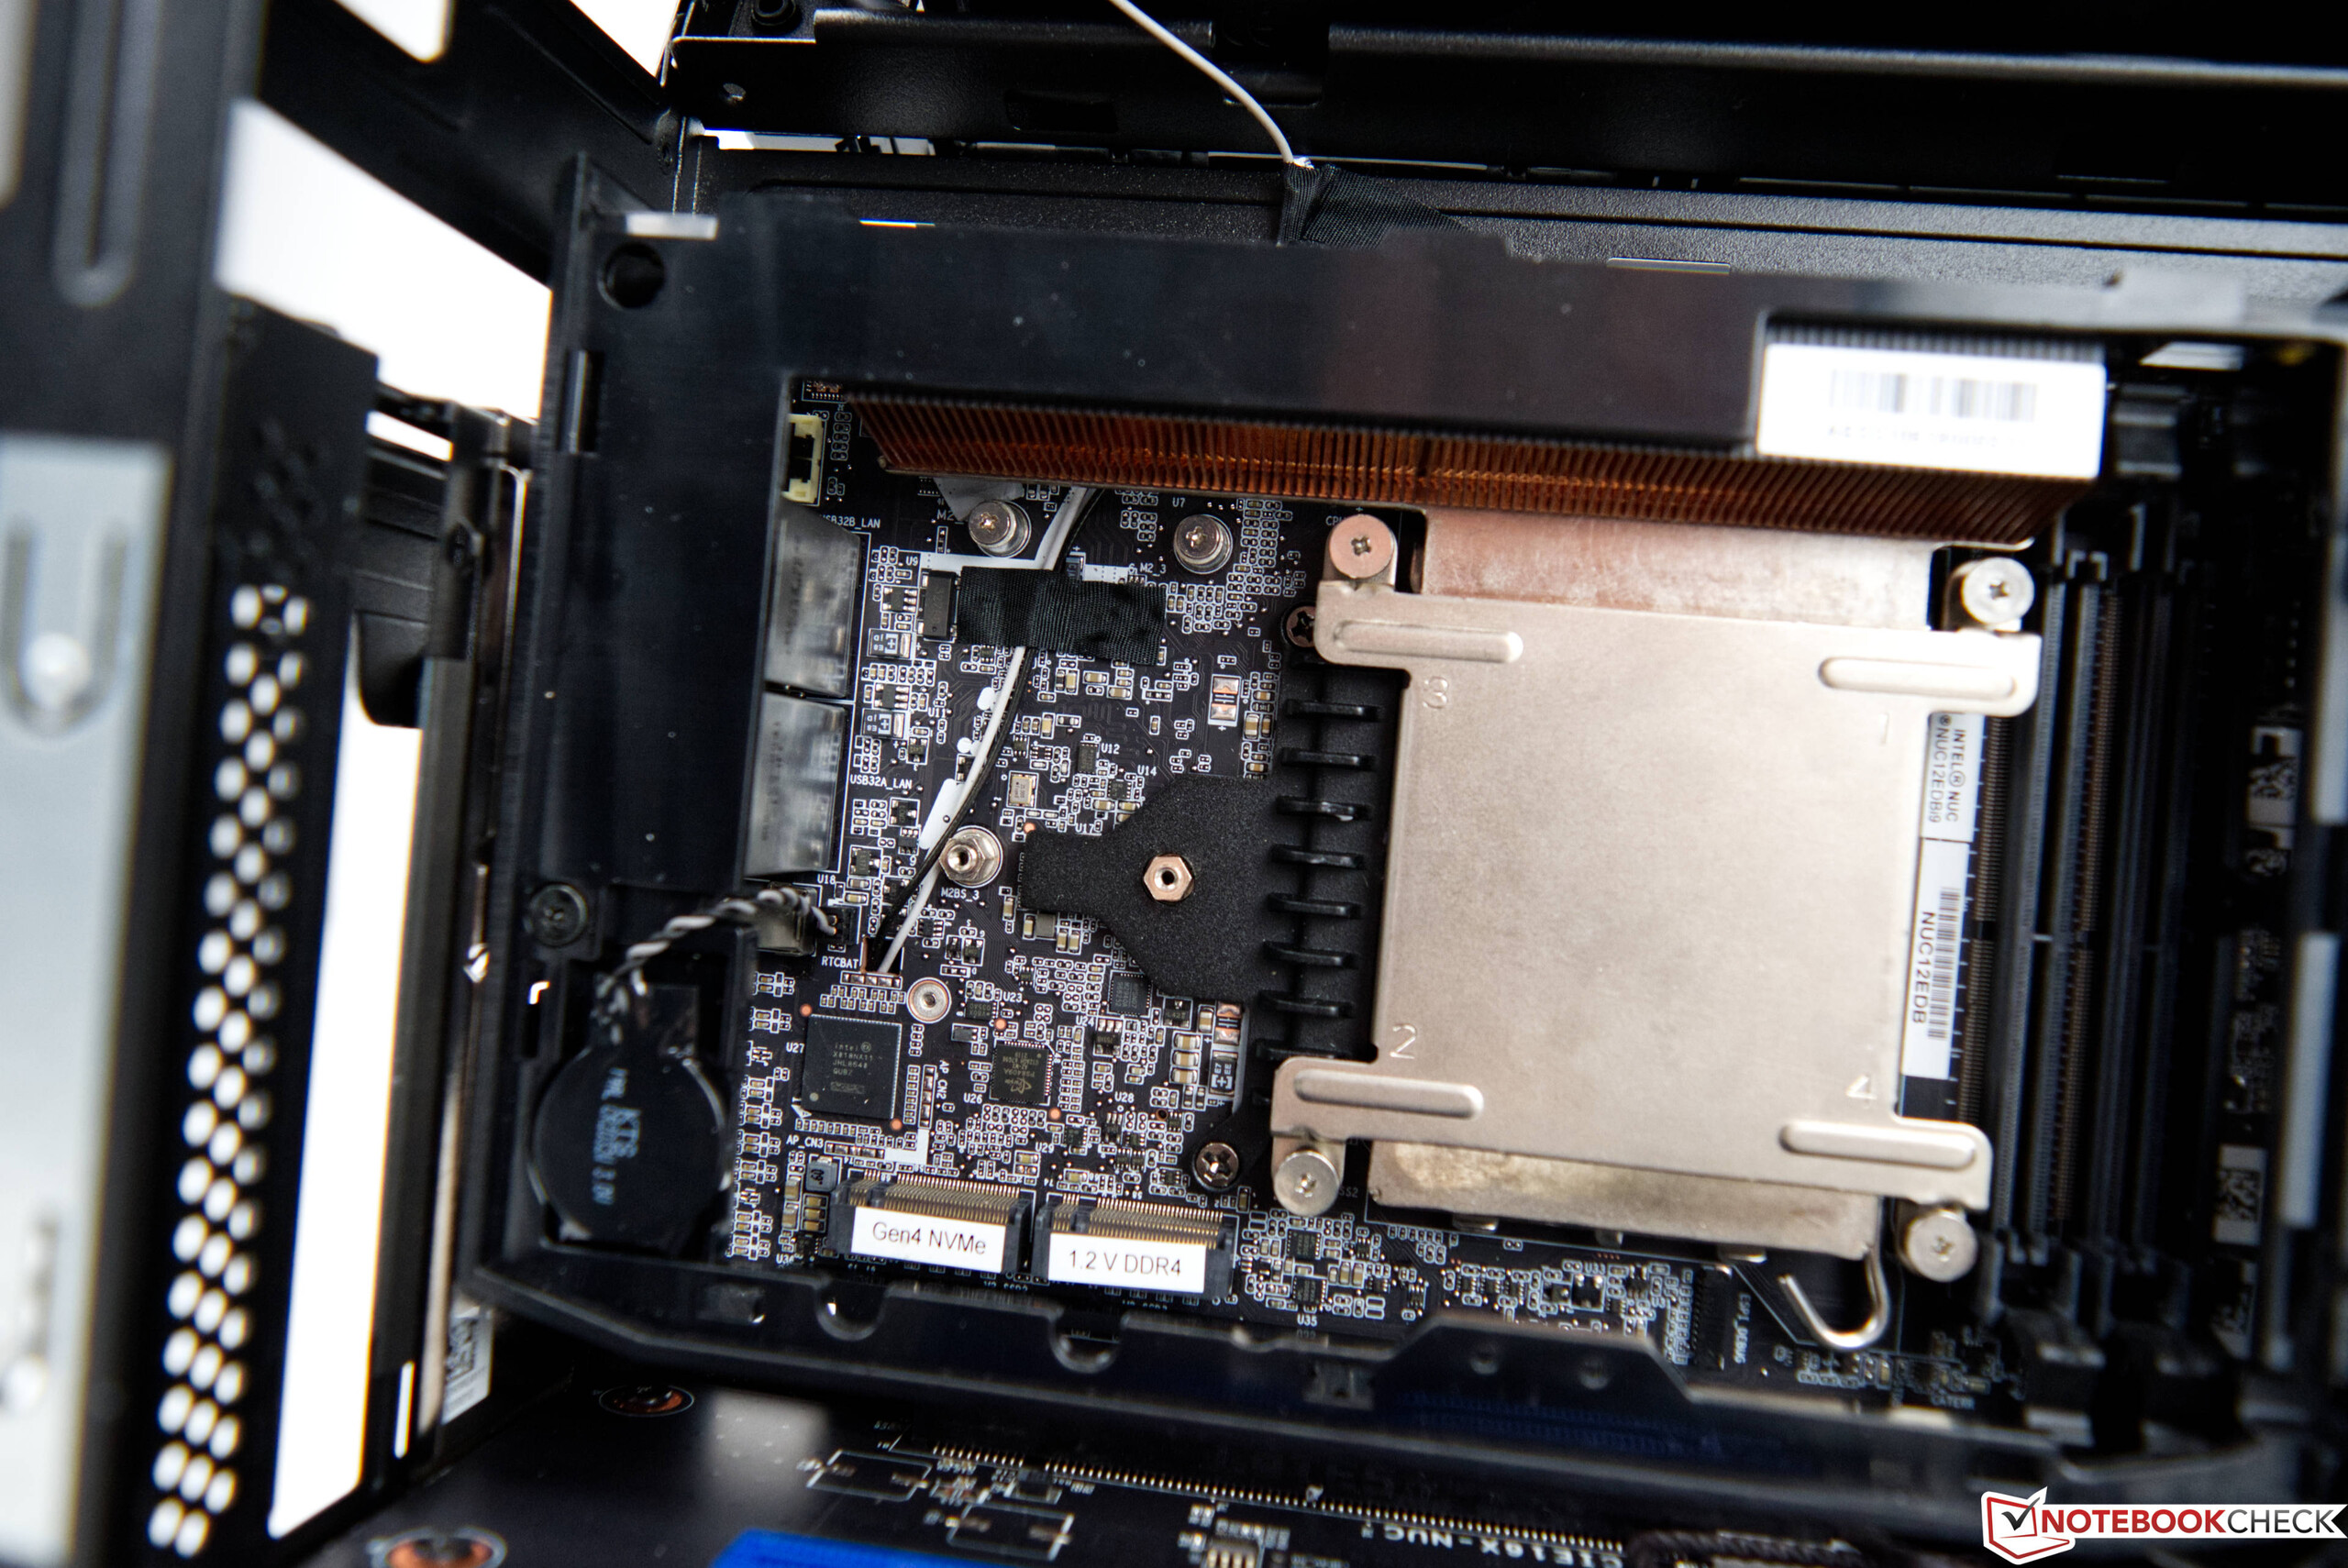
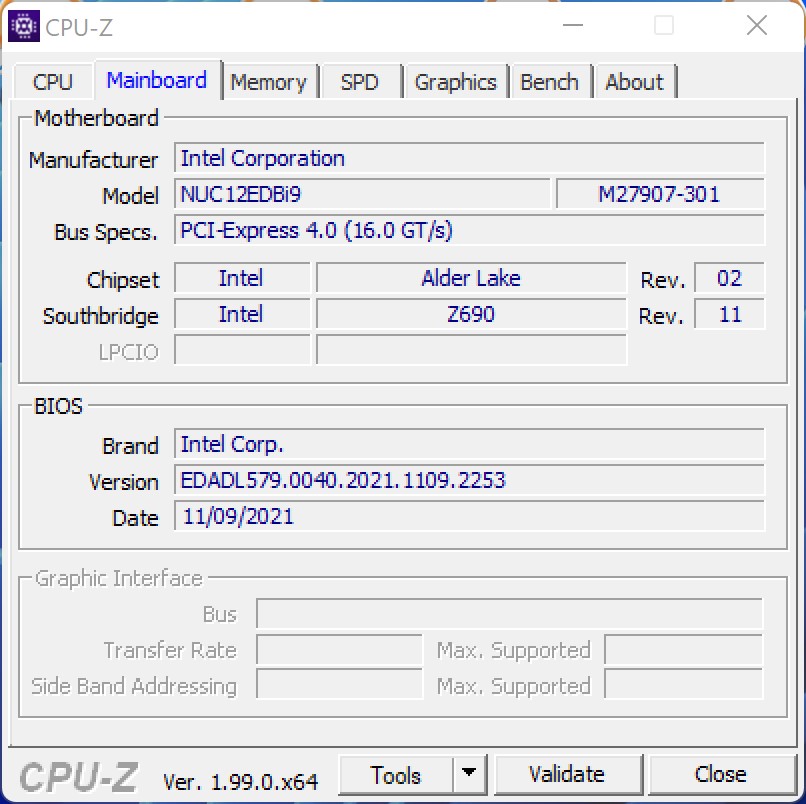
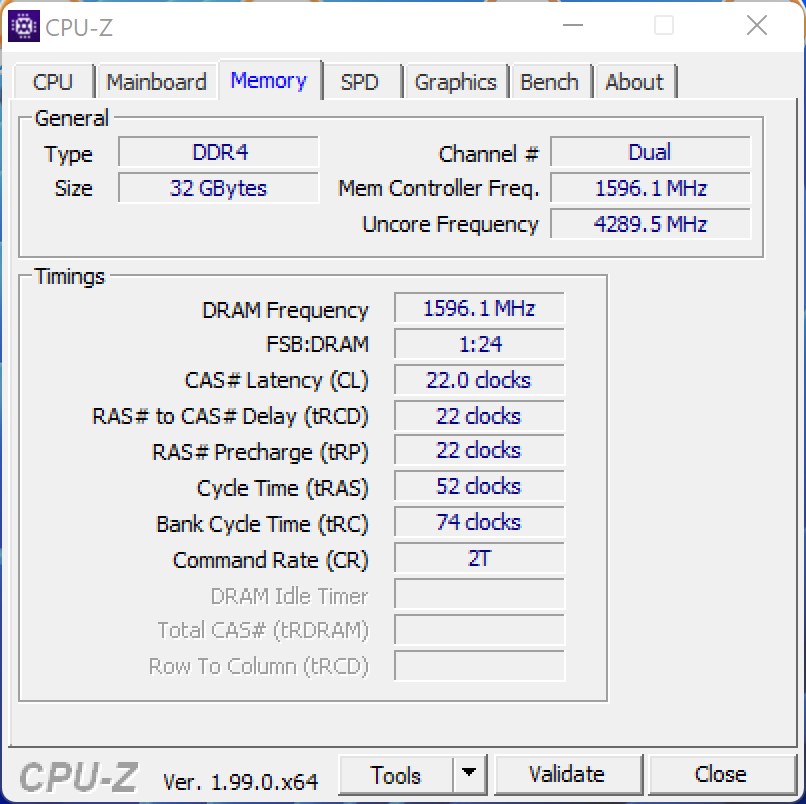
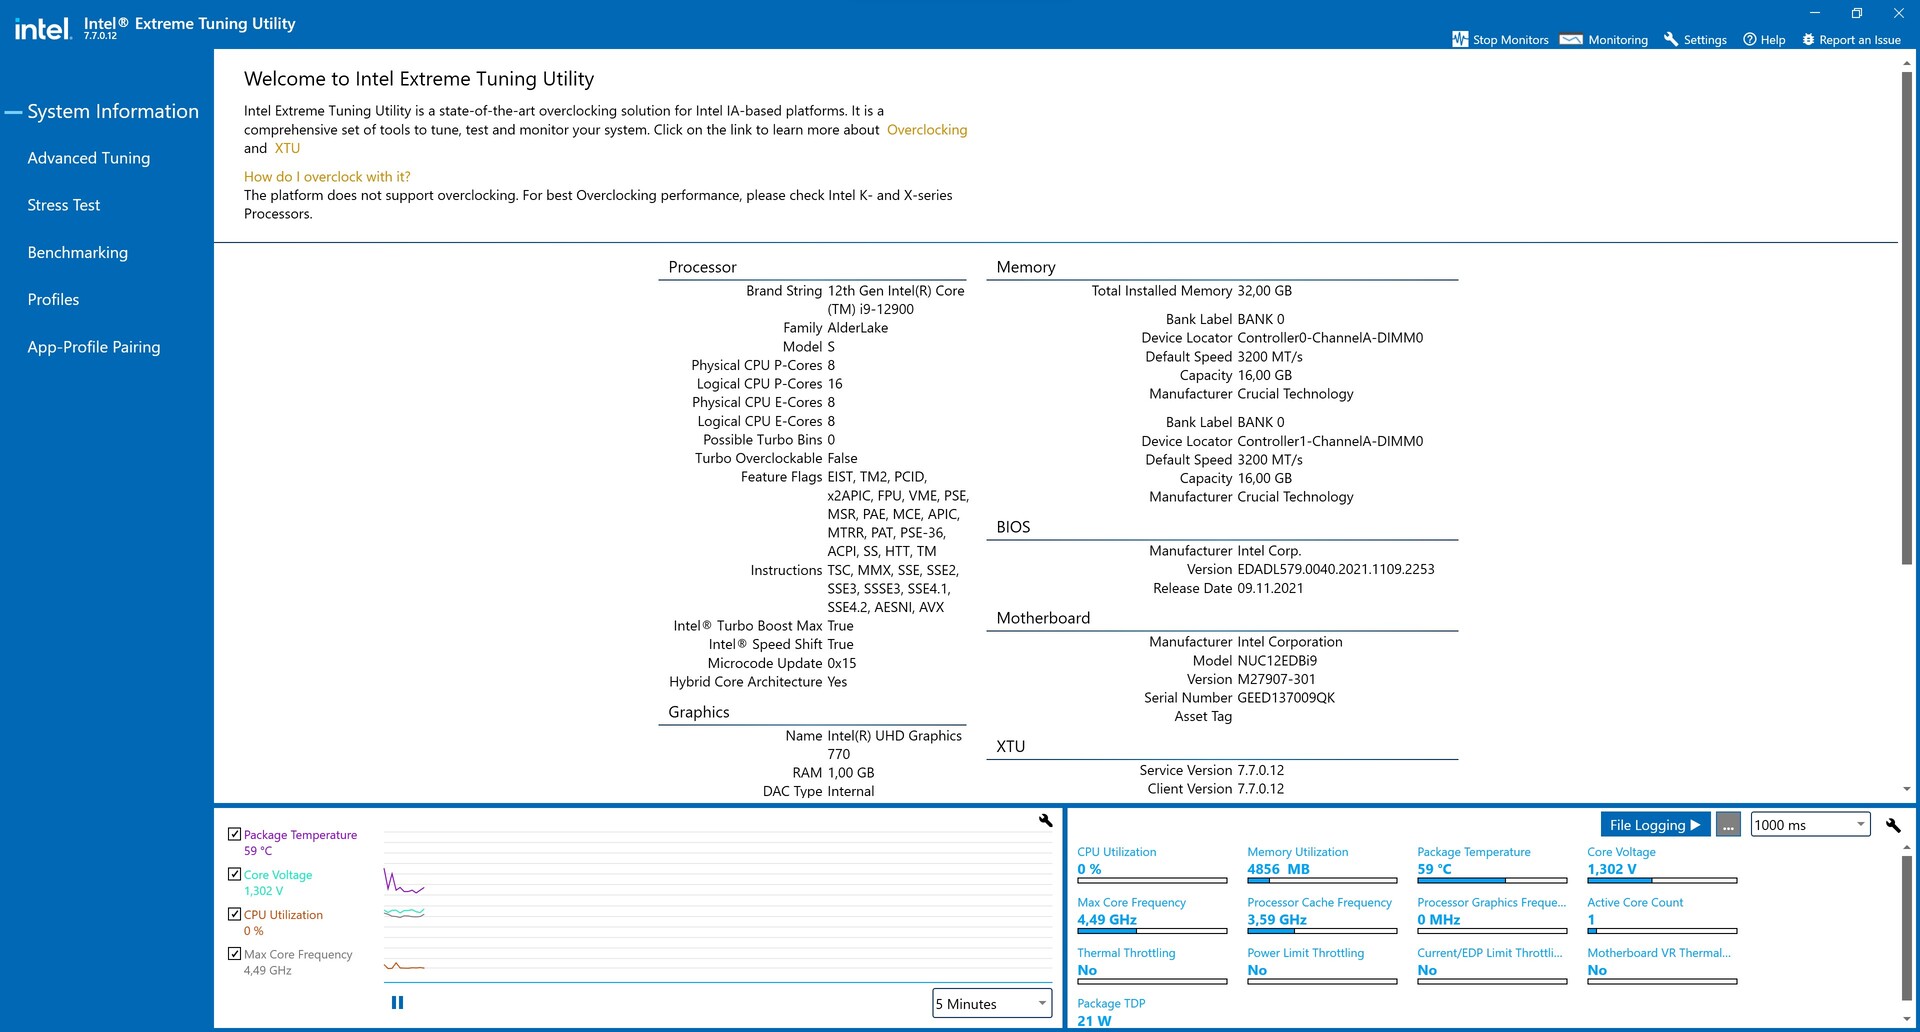
Com o Intel Core i9-12900, oIntel NUC 12 Extreme oferece um SoC de 16 núcleos com 24 fios baseados na série Alder Lake S. Como já mencionamos, o Core i9-12900 utiliza uma mistura de núcleos P e E. Em contraste com a série Kit Extremo Intel NUC 11 antes, agora é usado um processador de mesa de tamanho normal. Todas as conexões externas continuam a ser colocadas no elemento de computação, que está alojado no sistema na forma conhecida de uma placa PCI Express. Na parte de trás estão seis conexões USB 3.1 Gen2 Tipo A e duas conexões USB-C que suportam Thunderbolt 4. Com HDMI ou Thunderbolt, você pode rodar até três monitores ao mesmo tempo. Existem conexões 10G e 2.5G para redes com fio. Além disso, o Intel WiFi 6E AX211 se comunica usando o mais novo padrão. O próprio elemento de computação oferece espaço para dois módulos SO-DIMM RAM de até 64 GB cada, e também há espaço para dois M.2 SSDs.
Desempenho da WLAN
No teste WLAN, o Intel WiFi 6E AX211 é capaz de alcançar taxas de transferência muito boas na faixa de 6 GHz em combinação com nosso roteador de teste ASUS GT-AXE11000. Em nosso teste, medimos uma boa média de 1850 Mbit/s ao enviar ou receber dados.
| Networking | |
| iperf3 transmit AXE11000 6GHz | |
| Intel Dragon Canyon NUC - RTX 3060 | |
| Média da turma (229 - 2373, n=824) | |
| Média Intel Wi-Fi 6E AX211 (385 - 1851, n=226) | |
| Minisforum EliteMini TH50 | |
| iperf3 receive AXE11000 6GHz | |
| Intel Dragon Canyon NUC - RTX 3060 | |
| Média Intel Wi-Fi 6E AX211 (700 - 1857, n=226) | |
| Média da turma (291 - 2361, n=828) | |
| Minisforum EliteMini TH50 | |
| iperf3 receive AX12 | |
| MSI Vector GP66 12UGS | |
| Média Intel Wi-Fi 6E AX211 (1178 - 1623, n=4) | |
| Alienware x14 i7 RTX 3060 | |
| Média da turma (5 - 2374, n=2624) | |
| iperf3 transmit AX12 | |
| MSI Vector GP66 12UGS | |
| Alienware x14 i7 RTX 3060 | |
| Média Intel Wi-Fi 6E AX211 (1003 - 1501, n=4) | |
| Média da turma (5.59 - 2371, n=2621) | |
Referências de processadores
O Intel Core i9-12900 é um modelo de mesa da atual série Alder Lake S. O consumo de energia do PL1 é de 65 watts, que pode ser aumentado até o valor do PL2 de 202 watts.
O Intel Core i9-12900 faz justiça a sua classe no teste, superando o desempenho do Intel Core i9-11900KBem 15%, se observarmos os resultados em todos os pontos de referência (classificação de desempenho). Ao ser comparado aos sistemas desktop padrão, o Intel Core i9-12900 do Intel NUC 12 Extreme Kit também é capaz de se manter atualizado com um AMD Ryzen 7 5800X ou Intel Core i9-11900K. Por outro lado, o Intel Core i7-12700K é capaz de vencer nosso Dragon Canyon NUC, e vemos um primeiro sinal de um desempenho ligeiramente estrangulado devido ao sistema de resfriamento muito pequeno. Entretanto, a desvantagem permanece dentro dos limites, e o Intel Core i7-12700K foi apenas 10% mais rápido no teste
Você pode encontrar comparações e benchmarks adicionais em nosso Gráfico de comparação de CPU.
| Performance rating - Percent | |
| Intel Core i9-12900K, NVIDIA Titan RTX | |
| Intel Core i7-12700K, NVIDIA Titan RTX | |
| Intel Core i9-12900, NVIDIA GeForce RTX 3060 | |
| AMD Ryzen 7 5800X, NVIDIA Titan RTX | |
| AMD Ryzen 9 3950X, NVIDIA Titan RTX | |
| Intel Core i9-11900K, NVIDIA Titan RTX | |
| Intel Core i9-10900K, NVIDIA Titan RTX | |
| Intel Core i9-11900KB, NVIDIA GeForce RTX 3060 | |
| Intel Core i5-11600K, NVIDIA Titan RTX | |
| AMD Ryzen 7 3800XT, NVIDIA Titan RTX | |
| Intel Core i9-9980HK, NVIDIA GeForce RTX 2070 (Desktop) | |
| Intel Core i5-10600K, NVIDIA Titan RTX | |
| Cinebench R15 | |
| CPU Single 64Bit | |
| Intel Core i9-12900K, NVIDIA Titan RTX | |
| Intel Core i7-12700K, NVIDIA Titan RTX | |
| AMD Ryzen 7 5800X, NVIDIA Titan RTX | |
| Intel Core i9-11900K, NVIDIA Titan RTX | |
| Intel Core i9-12900, NVIDIA GeForce RTX 3060 | |
| Intel Core i9-11900KB, NVIDIA GeForce RTX 3060 | |
| Intel Core i5-11600K, NVIDIA Titan RTX | |
| Intel Core i9-10900K, NVIDIA Titan RTX | |
| AMD Ryzen 7 3800XT, NVIDIA Titan RTX | |
| Intel Core i9-9980HK, NVIDIA GeForce RTX 2070 (Desktop) | |
| AMD Ryzen 9 3950X, NVIDIA Titan RTX | |
| Intel Core i5-10600K, NVIDIA Titan RTX | |
| CPU Multi 64Bit | |
| Intel Core i9-12900K, NVIDIA Titan RTX | |
| AMD Ryzen 9 3950X, NVIDIA Titan RTX | |
| Intel Core i7-12700K, NVIDIA Titan RTX | |
| Intel Core i9-12900, NVIDIA GeForce RTX 3060 | |
| Intel Core i9-10900K, NVIDIA Titan RTX | |
| AMD Ryzen 7 5800X, NVIDIA Titan RTX | |
| Intel Core i9-11900K, NVIDIA Titan RTX | |
| AMD Ryzen 7 3800XT, NVIDIA Titan RTX | |
| Intel Core i9-11900KB, NVIDIA GeForce RTX 3060 | |
| Intel Core i5-11600K, NVIDIA Titan RTX | |
| Intel Core i9-9980HK, NVIDIA GeForce RTX 2070 (Desktop) | |
| Intel Core i5-10600K, NVIDIA Titan RTX | |
| Cinebench R20 | |
| CPU (Single Core) | |
| Intel Core i9-12900K, NVIDIA Titan RTX | |
| Intel Core i7-12700K, NVIDIA Titan RTX | |
| Intel Core i9-12900, NVIDIA GeForce RTX 3060 | |
| Intel Core i9-11900K, NVIDIA Titan RTX | |
| Intel Core i9-11900KB, NVIDIA GeForce RTX 3060 | |
| AMD Ryzen 7 5800X, NVIDIA Titan RTX | |
| Intel Core i5-11600K, NVIDIA Titan RTX | |
| AMD Ryzen 7 3800XT, NVIDIA Titan RTX | |
| Intel Core i9-10900K, NVIDIA Titan RTX | |
| AMD Ryzen 9 3950X, NVIDIA Titan RTX | |
| Intel Core i9-9980HK, NVIDIA GeForce RTX 2070 (Desktop) | |
| Intel Core i5-10600K, NVIDIA Titan RTX | |
| CPU (Multi Core) | |
| Intel Core i9-12900K, NVIDIA Titan RTX | |
| AMD Ryzen 9 3950X, NVIDIA Titan RTX | |
| Intel Core i7-12700K, NVIDIA Titan RTX | |
| Intel Core i9-12900, NVIDIA GeForce RTX 3060 | |
| Intel Core i9-10900K, NVIDIA Titan RTX | |
| AMD Ryzen 7 5800X, NVIDIA Titan RTX | |
| Intel Core i9-11900K, NVIDIA Titan RTX | |
| AMD Ryzen 7 3800XT, NVIDIA Titan RTX | |
| Intel Core i9-11900KB, NVIDIA GeForce RTX 3060 | |
| Intel Core i5-11600K, NVIDIA Titan RTX | |
| Intel Core i5-10600K, NVIDIA Titan RTX | |
| Intel Core i9-9980HK, NVIDIA GeForce RTX 2070 (Desktop) | |
| Cinebench R11.5 | |
| CPU Single 64Bit | |
| Intel Core i9-12900K, NVIDIA Titan RTX | |
| Intel Core i7-12700K, NVIDIA Titan RTX | |
| Intel Core i9-12900, NVIDIA GeForce RTX 3060 | |
| Intel Core i9-11900K, NVIDIA Titan RTX | |
| AMD Ryzen 7 5800X, NVIDIA Titan RTX | |
| Intel Core i5-11600K, NVIDIA Titan RTX | |
| Intel Core i9-11900KB, NVIDIA GeForce RTX 3060 | |
| Intel Core i9-10900K, NVIDIA Titan RTX | |
| Intel Core i9-9980HK, NVIDIA GeForce RTX 2070 (Desktop) | |
| AMD Ryzen 9 3950X, NVIDIA Titan RTX | |
| AMD Ryzen 7 3800XT, NVIDIA Titan RTX | |
| Intel Core i5-10600K, NVIDIA Titan RTX | |
| CPU Multi 64Bit | |
| Intel Core i9-12900K, NVIDIA Titan RTX | |
| AMD Ryzen 9 3950X, NVIDIA Titan RTX | |
| Intel Core i9-12900, NVIDIA GeForce RTX 3060 | |
| Intel Core i7-12700K, NVIDIA Titan RTX | |
| AMD Ryzen 7 5800X, NVIDIA Titan RTX | |
| Intel Core i9-10900K, NVIDIA Titan RTX | |
| Intel Core i9-11900K, NVIDIA Titan RTX | |
| AMD Ryzen 7 3800XT, NVIDIA Titan RTX | |
| Intel Core i9-11900KB, NVIDIA GeForce RTX 3060 | |
| Intel Core i5-11600K, NVIDIA Titan RTX | |
| Intel Core i9-9980HK, NVIDIA GeForce RTX 2070 (Desktop) | |
| Intel Core i5-10600K, NVIDIA Titan RTX | |
| Cinebench R10 | |
| Rendering Single CPUs 64Bit | |
| Intel Core i9-12900K, NVIDIA Titan RTX | |
| Intel Core i7-12700K, NVIDIA Titan RTX | |
| Intel Core i9-12900, NVIDIA GeForce RTX 3060 | |
| Intel Core i9-11900K, NVIDIA Titan RTX | |
| AMD Ryzen 7 5800X, NVIDIA Titan RTX | |
| Intel Core i5-11600K, NVIDIA Titan RTX | |
| Intel Core i9-11900KB, NVIDIA GeForce RTX 3060 | |
| Intel Core i9-10900K, NVIDIA Titan RTX | |
| AMD Ryzen 9 3950X, NVIDIA Titan RTX | |
| AMD Ryzen 7 3800XT, NVIDIA Titan RTX | |
| Intel Core i9-9980HK, NVIDIA GeForce RTX 2070 (Desktop) | |
| Intel Core i5-10600K, NVIDIA Titan RTX | |
| Rendering Multiple CPUs 64Bit | |
| Intel Core i9-12900K, NVIDIA Titan RTX | |
| Intel Core i9-12900, NVIDIA GeForce RTX 3060 | |
| Intel Core i7-12700K, NVIDIA Titan RTX | |
| AMD Ryzen 9 3950X, NVIDIA Titan RTX | |
| AMD Ryzen 7 5800X, NVIDIA Titan RTX | |
| Intel Core i9-11900K, NVIDIA Titan RTX | |
| Intel Core i9-10900K, NVIDIA Titan RTX | |
| AMD Ryzen 7 3800XT, NVIDIA Titan RTX | |
| Intel Core i9-11900KB, NVIDIA GeForce RTX 3060 | |
| Intel Core i5-11600K, NVIDIA Titan RTX | |
| Intel Core i9-9980HK, NVIDIA GeForce RTX 2070 (Desktop) | |
| Intel Core i5-10600K, NVIDIA Titan RTX | |
| Blender - v2.79 BMW27 CPU | |
| Intel Core i9-9980HK, NVIDIA GeForce RTX 2070 (Desktop) | |
| Intel Core i5-10600K, NVIDIA Titan RTX | |
| Intel Core i5-11600K, NVIDIA Titan RTX | |
| Intel Core i9-11900KB, NVIDIA GeForce RTX 3060 | |
| Intel Core i9-12900, NVIDIA GeForce RTX 3060 | |
| AMD Ryzen 7 3800XT, NVIDIA Titan RTX | |
| AMD Ryzen 7 5800X, NVIDIA Titan RTX | |
| Intel Core i9-11900K, NVIDIA Titan RTX | |
| Intel Core i9-10900K, NVIDIA Titan RTX | |
| Intel Core i7-12700K, NVIDIA Titan RTX | |
| AMD Ryzen 9 3950X, NVIDIA Titan RTX | |
| Intel Core i9-12900K, NVIDIA Titan RTX | |
| wPrime 2.10 | |
| 32m | |
| Intel Core i9-12900K, NVIDIA Titan RTX | |
| Intel Core i5-11600K, NVIDIA Titan RTX | |
| Intel Core i5-10600K, NVIDIA Titan RTX | |
| AMD Ryzen 9 3950X, NVIDIA Titan RTX | |
| Intel Core i9-11900K, NVIDIA Titan RTX | |
| Intel Core i9-9980HK, NVIDIA GeForce RTX 2070 (Desktop) | |
| AMD Ryzen 7 3800XT, NVIDIA Titan RTX | |
| Intel Core i9-10900K, NVIDIA Titan RTX | |
| Intel Core i9-11900KB, NVIDIA GeForce RTX 3060 | |
| AMD Ryzen 7 5800X, NVIDIA Titan RTX | |
| Intel Core i9-12900, NVIDIA GeForce RTX 3060 | |
| Intel Core i7-12700K, NVIDIA Titan RTX | |
| 1024m | |
| Intel Core i9-12900, NVIDIA GeForce RTX 3060 | |
| Intel Core i9-12900K, NVIDIA Titan RTX | |
| Intel Core i7-12700K, NVIDIA Titan RTX | |
| Intel Core i9-9980HK, NVIDIA GeForce RTX 2070 (Desktop) | |
| Intel Core i5-10600K, NVIDIA Titan RTX | |
| Intel Core i5-11600K, NVIDIA Titan RTX | |
| Intel Core i9-11900KB, NVIDIA GeForce RTX 3060 | |
| AMD Ryzen 7 5800X, NVIDIA Titan RTX | |
| AMD Ryzen 7 3800XT, NVIDIA Titan RTX | |
| Intel Core i9-11900K, NVIDIA Titan RTX | |
| Intel Core i9-10900K, NVIDIA Titan RTX | |
| AMD Ryzen 9 3950X, NVIDIA Titan RTX | |
| X264 HD Benchmark 4.0 | |
| Pass 1 | |
| Intel Core i9-12900K, NVIDIA Titan RTX | |
| Intel Core i7-12700K, NVIDIA Titan RTX | |
| AMD Ryzen 7 5800X, NVIDIA Titan RTX | |
| Intel Core i9-12900, NVIDIA GeForce RTX 3060 | |
| Intel Core i9-11900K, NVIDIA Titan RTX | |
| Intel Core i5-11600K, NVIDIA Titan RTX | |
| Intel Core i9-10900K, NVIDIA Titan RTX | |
| Intel Core i9-11900KB, NVIDIA GeForce RTX 3060 | |
| AMD Ryzen 7 3800XT, NVIDIA Titan RTX | |
| AMD Ryzen 9 3950X, NVIDIA Titan RTX | |
| Intel Core i5-10600K, NVIDIA Titan RTX | |
| Intel Core i9-9980HK, NVIDIA GeForce RTX 2070 (Desktop) | |
| Pass 2 | |
| Intel Core i9-12900K, NVIDIA Titan RTX | |
| Intel Core i7-12700K, NVIDIA Titan RTX | |
| AMD Ryzen 9 3950X, NVIDIA Titan RTX | |
| AMD Ryzen 7 5800X, NVIDIA Titan RTX | |
| Intel Core i9-10900K, NVIDIA Titan RTX | |
| Intel Core i9-12900, NVIDIA GeForce RTX 3060 | |
| Intel Core i9-11900K, NVIDIA Titan RTX | |
| AMD Ryzen 7 3800XT, NVIDIA Titan RTX | |
| Intel Core i9-11900KB, NVIDIA GeForce RTX 3060 | |
| Intel Core i5-11600K, NVIDIA Titan RTX | |
| Intel Core i9-9980HK, NVIDIA GeForce RTX 2070 (Desktop) | |
| Intel Core i5-10600K, NVIDIA Titan RTX | |
| WinRAR - Result | |
| AMD Ryzen 7 5800X, NVIDIA Titan RTX | |
| Intel Core i9-12900K, NVIDIA Titan RTX | |
| Intel Core i9-12900, NVIDIA GeForce RTX 3060 | |
| Intel Core i7-12700K, NVIDIA Titan RTX | |
| Intel Core i9-10900K, NVIDIA Titan RTX | |
| Intel Core i9-11900KB, NVIDIA GeForce RTX 3060 | |
| Intel Core i9-11900K, NVIDIA Titan RTX | |
| Intel Core i5-11600K, NVIDIA Titan RTX | |
| AMD Ryzen 7 3800XT, NVIDIA Titan RTX | |
| AMD Ryzen 9 3950X, NVIDIA Titan RTX | |
| Intel Core i9-9980HK, NVIDIA GeForce RTX 2070 (Desktop) | |
| Intel Core i5-10600K, NVIDIA Titan RTX | |
| TrueCrypt | |
| AES Mean 100MB | |
| Intel Core i9-12900K, NVIDIA Titan RTX | |
| Intel Core i9-12900, NVIDIA GeForce RTX 3060 | |
| Intel Core i7-12700K, NVIDIA Titan RTX | |
| AMD Ryzen 7 5800X, NVIDIA Titan RTX | |
| Intel Core i9-10900K, NVIDIA Titan RTX | |
| Intel Core i9-11900K, NVIDIA Titan RTX | |
| Intel Core i9-11900KB, NVIDIA GeForce RTX 3060 | |
| AMD Ryzen 7 3800XT, NVIDIA Titan RTX | |
| AMD Ryzen 9 3950X, NVIDIA Titan RTX | |
| Intel Core i9-9980HK, NVIDIA GeForce RTX 2070 (Desktop) | |
| Intel Core i5-11600K, NVIDIA Titan RTX | |
| Intel Core i5-10600K, NVIDIA Titan RTX | |
| Twofish Mean 100MB | |
| Intel Core i9-12900K, NVIDIA Titan RTX | |
| AMD Ryzen 9 3950X, NVIDIA Titan RTX | |
| Intel Core i9-12900, NVIDIA GeForce RTX 3060 | |
| Intel Core i7-12700K, NVIDIA Titan RTX | |
| Intel Core i9-10900K, NVIDIA Titan RTX | |
| AMD Ryzen 7 3800XT, NVIDIA Titan RTX | |
| AMD Ryzen 7 5800X, NVIDIA Titan RTX | |
| Intel Core i9-11900K, NVIDIA Titan RTX | |
| Intel Core i9-9980HK, NVIDIA GeForce RTX 2070 (Desktop) | |
| Intel Core i9-11900KB, NVIDIA GeForce RTX 3060 | |
| Intel Core i5-11600K, NVIDIA Titan RTX | |
| Intel Core i5-10600K, NVIDIA Titan RTX | |
| Serpent Mean 100MB | |
| AMD Ryzen 9 3950X, NVIDIA Titan RTX | |
| Intel Core i9-12900K, NVIDIA Titan RTX | |
| Intel Core i9-12900, NVIDIA GeForce RTX 3060 | |
| Intel Core i7-12700K, NVIDIA Titan RTX | |
| Intel Core i9-10900K, NVIDIA Titan RTX | |
| AMD Ryzen 7 5800X, NVIDIA Titan RTX | |
| AMD Ryzen 7 3800XT, NVIDIA Titan RTX | |
| Intel Core i9-11900K, NVIDIA Titan RTX | |
| Intel Core i9-11900KB, NVIDIA GeForce RTX 3060 | |
| Intel Core i9-9980HK, NVIDIA GeForce RTX 2070 (Desktop) | |
| Intel Core i5-11600K, NVIDIA Titan RTX | |
| Intel Core i5-10600K, NVIDIA Titan RTX | |
| Geekbench 5.5 | |
| Multi-Core | |
| Intel Core i9-12900K, NVIDIA Titan RTX | |
| Intel Core i7-12700K, NVIDIA Titan RTX | |
| AMD Ryzen 9 3950X, NVIDIA Titan RTX | |
| Intel Core i9-10900K, NVIDIA Titan RTX | |
| AMD Ryzen 7 5800X, NVIDIA Titan RTX | |
| Intel Core i9-11900K, NVIDIA Titan RTX | |
| AMD Ryzen 7 3800XT, NVIDIA Titan RTX | |
| Intel Core i9-11900KB, NVIDIA GeForce RTX 3060 | |
| Intel Core i9-12900, NVIDIA GeForce RTX 3060 | |
| Intel Core i5-11600K, NVIDIA Titan RTX | |
| Intel Core i9-9980HK, NVIDIA GeForce RTX 2070 (Desktop) | |
| Intel Core i5-10600K, NVIDIA Titan RTX | |
| Single-Core | |
| Intel Core i9-12900K, NVIDIA Titan RTX | |
| Intel Core i7-12700K, NVIDIA Titan RTX | |
| Intel Core i9-11900K, NVIDIA Titan RTX | |
| Intel Core i5-11600K, NVIDIA Titan RTX | |
| AMD Ryzen 7 5800X, NVIDIA Titan RTX | |
| Intel Core i9-11900KB, NVIDIA GeForce RTX 3060 | |
| Intel Core i9-12900, NVIDIA GeForce RTX 3060 | |
| Intel Core i9-10900K, NVIDIA Titan RTX | |
| Intel Core i9-9980HK, NVIDIA GeForce RTX 2070 (Desktop) | |
| AMD Ryzen 7 3800XT, NVIDIA Titan RTX | |
| AMD Ryzen 9 3950X, NVIDIA Titan RTX | |
| Intel Core i5-10600K, NVIDIA Titan RTX | |
| Geekbench 5.0 | |
| 5.0 Multi-Core | |
| Intel Core i9-12900K, NVIDIA Titan RTX | |
| Intel Core i7-12700K, NVIDIA Titan RTX | |
| AMD Ryzen 9 3950X, NVIDIA Titan RTX | |
| Intel Core i9-10900K, NVIDIA Titan RTX | |
| AMD Ryzen 7 5800X, NVIDIA Titan RTX | |
| Intel Core i9-11900K, NVIDIA Titan RTX | |
| AMD Ryzen 7 3800XT, NVIDIA Titan RTX | |
| Intel Core i9-11900KB, NVIDIA GeForce RTX 3060 | |
| Intel Core i9-12900, NVIDIA GeForce RTX 3060 | |
| Intel Core i5-11600K, NVIDIA Titan RTX | |
| Intel Core i9-9980HK, NVIDIA GeForce RTX 2070 (Desktop) | |
| Intel Core i5-10600K, NVIDIA Titan RTX | |
| 5.0 Single-Core | |
| Intel Core i9-12900K, NVIDIA Titan RTX | |
| Intel Core i9-11900K, NVIDIA Titan RTX | |
| Intel Core i7-12700K, NVIDIA Titan RTX | |
| Intel Core i5-11600K, NVIDIA Titan RTX | |
| AMD Ryzen 7 5800X, NVIDIA Titan RTX | |
| Intel Core i9-11900KB, NVIDIA GeForce RTX 3060 | |
| Intel Core i9-12900, NVIDIA GeForce RTX 3060 | |
| Intel Core i9-10900K, NVIDIA Titan RTX | |
| AMD Ryzen 7 3800XT, NVIDIA Titan RTX | |
| Intel Core i9-9980HK, NVIDIA GeForce RTX 2070 (Desktop) | |
| AMD Ryzen 9 3950X, NVIDIA Titan RTX | |
| Intel Core i5-10600K, NVIDIA Titan RTX | |
| Geekbench 4.4 | |
| 64 Bit Single-Core Score | |
| Intel Core i9-12900K, NVIDIA Titan RTX | |
| Intel Core i7-12700K, NVIDIA Titan RTX | |
| Intel Core i9-11900K, NVIDIA Titan RTX | |
| Intel Core i5-11600K, NVIDIA Titan RTX | |
| AMD Ryzen 7 5800X, NVIDIA Titan RTX | |
| Intel Core i9-11900KB, NVIDIA GeForce RTX 3060 | |
| Intel Core i9-12900, NVIDIA GeForce RTX 3060 | |
| Intel Core i9-10900K, NVIDIA Titan RTX | |
| Intel Core i9-9980HK, NVIDIA GeForce RTX 2070 (Desktop) | |
| AMD Ryzen 7 3800XT, NVIDIA Titan RTX | |
| Intel Core i5-10600K, NVIDIA Titan RTX | |
| AMD Ryzen 9 3950X, NVIDIA Titan RTX | |
| 64 Bit Multi-Core Score | |
| Intel Core i9-12900K, NVIDIA Titan RTX | |
| Intel Core i7-12700K, NVIDIA Titan RTX | |
| AMD Ryzen 9 3950X, NVIDIA Titan RTX | |
| AMD Ryzen 7 5800X, NVIDIA Titan RTX | |
| Intel Core i9-10900K, NVIDIA Titan RTX | |
| Intel Core i9-11900K, NVIDIA Titan RTX | |
| Intel Core i9-11900KB, NVIDIA GeForce RTX 3060 | |
| Intel Core i9-12900, NVIDIA GeForce RTX 3060 | |
| AMD Ryzen 7 3800XT, NVIDIA Titan RTX | |
| Intel Core i5-11600K, NVIDIA Titan RTX | |
| Intel Core i9-9980HK, NVIDIA GeForce RTX 2070 (Desktop) | |
| Intel Core i5-10600K, NVIDIA Titan RTX | |
| 3DMark 11 - 1280x720 Performance Physics | |
| Intel Core i9-12900K, NVIDIA Titan RTX | |
| Intel Core i7-12700K, NVIDIA Titan RTX | |
| Intel Core i9-12900, NVIDIA GeForce RTX 3060 | |
| AMD Ryzen 7 5800X, NVIDIA Titan RTX | |
| Intel Core i9-10900K, NVIDIA Titan RTX | |
| Intel Core i9-11900K, NVIDIA Titan RTX | |
| AMD Ryzen 9 3950X, NVIDIA Titan RTX | |
| AMD Ryzen 7 3800XT, NVIDIA Titan RTX | |
| Intel Core i9-11900KB, NVIDIA GeForce RTX 3060 | |
| Intel Core i5-11600K, NVIDIA Titan RTX | |
| Intel Core i9-9980HK, NVIDIA GeForce RTX 2070 (Desktop) | |
| Intel Core i5-10600K, NVIDIA Titan RTX | |
| 7-Zip 18.03 | |
| 7z b 4 | |
| AMD Ryzen 9 3950X, NVIDIA Titan RTX | |
| Intel Core i9-12900K, NVIDIA Titan RTX | |
| Intel Core i7-12700K, NVIDIA Titan RTX | |
| AMD Ryzen 7 5800X, NVIDIA Titan RTX | |
| Intel Core i9-10900K, NVIDIA Titan RTX | |
| Intel Core i9-11900K, NVIDIA Titan RTX | |
| AMD Ryzen 7 3800XT, NVIDIA Titan RTX | |
| Intel Core i9-11900KB, NVIDIA GeForce RTX 3060 | |
| Intel Core i9-12900, NVIDIA GeForce RTX 3060 | |
| Intel Core i5-11600K, NVIDIA Titan RTX | |
| Intel Core i9-9980HK, NVIDIA GeForce RTX 2070 (Desktop) | |
| Intel Core i5-10600K, NVIDIA Titan RTX | |
| 7z b 4 -mmt1 | |
| AMD Ryzen 7 5800X, NVIDIA Titan RTX | |
| Intel Core i9-11900K, NVIDIA Titan RTX | |
| Intel Core i9-12900K, NVIDIA Titan RTX | |
| Intel Core i5-11600K, NVIDIA Titan RTX | |
| Intel Core i7-12700K, NVIDIA Titan RTX | |
| Intel Core i9-11900KB, NVIDIA GeForce RTX 3060 | |
| Intel Core i9-12900, NVIDIA GeForce RTX 3060 | |
| Intel Core i9-10900K, NVIDIA Titan RTX | |
| Intel Core i9-9980HK, NVIDIA GeForce RTX 2070 (Desktop) | |
| AMD Ryzen 7 3800XT, NVIDIA Titan RTX | |
| AMD Ryzen 9 3950X, NVIDIA Titan RTX | |
| Intel Core i5-10600K, NVIDIA Titan RTX | |
| HWBOT x265 Benchmark v2.2 - 4k Preset | |
| Intel Core i9-12900K, NVIDIA Titan RTX | |
| Intel Core i7-12700K, NVIDIA Titan RTX | |
| Intel Core i9-10900K, NVIDIA Titan RTX | |
| AMD Ryzen 7 5800X, NVIDIA Titan RTX | |
| Intel Core i9-11900K, NVIDIA Titan RTX | |
| AMD Ryzen 7 3800XT, NVIDIA Titan RTX | |
| AMD Ryzen 9 3950X, NVIDIA Titan RTX | |
| Intel Core i5-11600K, NVIDIA Titan RTX | |
| Intel Core i9-11900KB, NVIDIA GeForce RTX 3060 | |
| Intel Core i9-12900, NVIDIA GeForce RTX 3060 | |
| Intel Core i5-10600K, NVIDIA Titan RTX | |
| Intel Core i9-9980HK, NVIDIA GeForce RTX 2070 (Desktop) | |
| R Benchmark 2.5 - Overall mean | |
| Intel Core i5-10600K, NVIDIA Titan RTX | |
| Intel Core i9-9980HK, NVIDIA GeForce RTX 2070 (Desktop) | |
| Intel Core i9-11900KB, NVIDIA GeForce RTX 3060 | |
| Intel Core i9-12900, NVIDIA GeForce RTX 3060 | |
| Intel Core i9-10900K, NVIDIA Titan RTX | |
| AMD Ryzen 9 3950X, NVIDIA Titan RTX | |
| AMD Ryzen 7 3800XT, NVIDIA Titan RTX | |
| Intel Core i5-11600K, NVIDIA Titan RTX | |
| Intel Core i9-11900K, NVIDIA Titan RTX | |
| AMD Ryzen 7 5800X, NVIDIA Titan RTX | |
| Intel Core i7-12700K, NVIDIA Titan RTX | |
| Intel Core i9-12900K, NVIDIA Titan RTX | |
| LibreOffice - 20 Documents To PDF | |
| Intel Core i9-10900K, NVIDIA Titan RTX | |
| Intel Core i9-11900K, NVIDIA Titan RTX | |
| AMD Ryzen 9 3950X, NVIDIA Titan RTX | |
| Intel Core i5-10600K, NVIDIA Titan RTX | |
| Intel Core i9-9980HK, NVIDIA GeForce RTX 2070 (Desktop) | |
| Intel Core i9-11900KB, NVIDIA GeForce RTX 3060 | |
| Intel Core i9-12900, NVIDIA GeForce RTX 3060 | |
| AMD Ryzen 7 3800XT, NVIDIA Titan RTX | |
| AMD Ryzen 7 5800X, NVIDIA Titan RTX | |
| Intel Core i9-12900K, NVIDIA Titan RTX | |
| Intel Core i7-12700K, NVIDIA Titan RTX | |
| Intel Core i5-11600K, NVIDIA Titan RTX | |
| WebXPRT 3 - Overall | |
| Intel Core i9-12900K, NVIDIA Titan RTX | |
| Intel Core i7-12700K, NVIDIA Titan RTX | |
| AMD Ryzen 7 5800X, NVIDIA Titan RTX | |
| Intel Core i5-11600K, NVIDIA Titan RTX | |
| Intel Core i9-11900KB, NVIDIA GeForce RTX 3060 | |
| Intel Core i9-12900, NVIDIA GeForce RTX 3060 | |
| Intel Core i9-10900K, NVIDIA Titan RTX | |
| AMD Ryzen 7 3800XT, NVIDIA Titan RTX | |
| AMD Ryzen 9 3950X, NVIDIA Titan RTX | |
| Intel Core i5-10600K, NVIDIA Titan RTX | |
| Intel Core i9-9980HK, NVIDIA GeForce RTX 2070 (Desktop) | |
| Intel Core i9-11900K, NVIDIA Titan RTX | |
| Mozilla Kraken 1.1 - Total | |
| Intel Core i5-10600K, NVIDIA Titan RTX | |
| Intel Core i9-9980HK, NVIDIA GeForce RTX 2070 (Desktop) | |
| Intel Core i9-10900K, NVIDIA Titan RTX | |
| AMD Ryzen 9 3950X, NVIDIA Titan RTX | |
| AMD Ryzen 7 3800XT, NVIDIA Titan RTX | |
| Intel Core i9-11900KB, NVIDIA GeForce RTX 3060 | |
| Intel Core i9-12900, NVIDIA GeForce RTX 3060 | |
| Intel Core i5-11600K, NVIDIA Titan RTX | |
| AMD Ryzen 7 5800X, NVIDIA Titan RTX | |
| Intel Core i9-11900K, NVIDIA Titan RTX | |
| Intel Core i7-12700K, NVIDIA Titan RTX | |
| Intel Core i9-12900K, NVIDIA Titan RTX | |
| 3DMark | |
| 3840x2160 Fire Strike Ultra Physics | |
| Intel Core i9-12900K, NVIDIA Titan RTX | |
| Intel Core i9-12900, NVIDIA GeForce RTX 3060 | |
| Intel Core i7-12700K, NVIDIA Titan RTX | |
| AMD Ryzen 9 3950X, NVIDIA Titan RTX | |
| AMD Ryzen 7 5800X, NVIDIA Titan RTX | |
| Intel Core i9-10900K, NVIDIA Titan RTX | |
| Intel Core i9-11900K, NVIDIA Titan RTX | |
| AMD Ryzen 7 3800XT, NVIDIA Titan RTX | |
| Intel Core i9-11900KB, NVIDIA GeForce RTX 3060 | |
| Intel Core i5-11600K, NVIDIA Titan RTX | |
| Intel Core i9-9980HK, NVIDIA GeForce RTX 2070 (Desktop) | |
| Intel Core i5-10600K, NVIDIA Titan RTX | |
| 1920x1080 Fire Strike Physics | |
| Intel Core i9-12900K, NVIDIA Titan RTX | |
| Intel Core i7-12700K, NVIDIA Titan RTX | |
| Intel Core i9-12900, NVIDIA GeForce RTX 3060 | |
| AMD Ryzen 9 3950X, NVIDIA Titan RTX | |
| AMD Ryzen 7 5800X, NVIDIA Titan RTX | |
| Intel Core i9-10900K, NVIDIA Titan RTX | |
| Intel Core i9-11900K, NVIDIA Titan RTX | |
| AMD Ryzen 7 3800XT, NVIDIA Titan RTX | |
| Intel Core i9-11900KB, NVIDIA GeForce RTX 3060 | |
| Intel Core i5-11600K, NVIDIA Titan RTX | |
| Intel Core i9-9980HK, NVIDIA GeForce RTX 2070 (Desktop) | |
| Intel Core i5-10600K, NVIDIA Titan RTX | |
| 2560x1440 Time Spy CPU | |
| Intel Core i9-12900K, NVIDIA Titan RTX | |
| Intel Core i7-12700K, NVIDIA Titan RTX | |
| Intel Core i9-12900, NVIDIA GeForce RTX 3060 | |
| Intel Core i9-10900K, NVIDIA Titan RTX | |
| Intel Core i9-11900K, NVIDIA Titan RTX | |
| AMD Ryzen 9 3950X, NVIDIA Titan RTX | |
| AMD Ryzen 7 5800X, NVIDIA Titan RTX | |
| AMD Ryzen 7 3800XT, NVIDIA Titan RTX | |
| Intel Core i9-11900KB, NVIDIA GeForce RTX 3060 | |
| Intel Core i5-11600K, NVIDIA Titan RTX | |
| Intel Core i9-9980HK, NVIDIA GeForce RTX 2070 (Desktop) | |
| Intel Core i5-10600K, NVIDIA Titan RTX | |
* ... menor é melhor
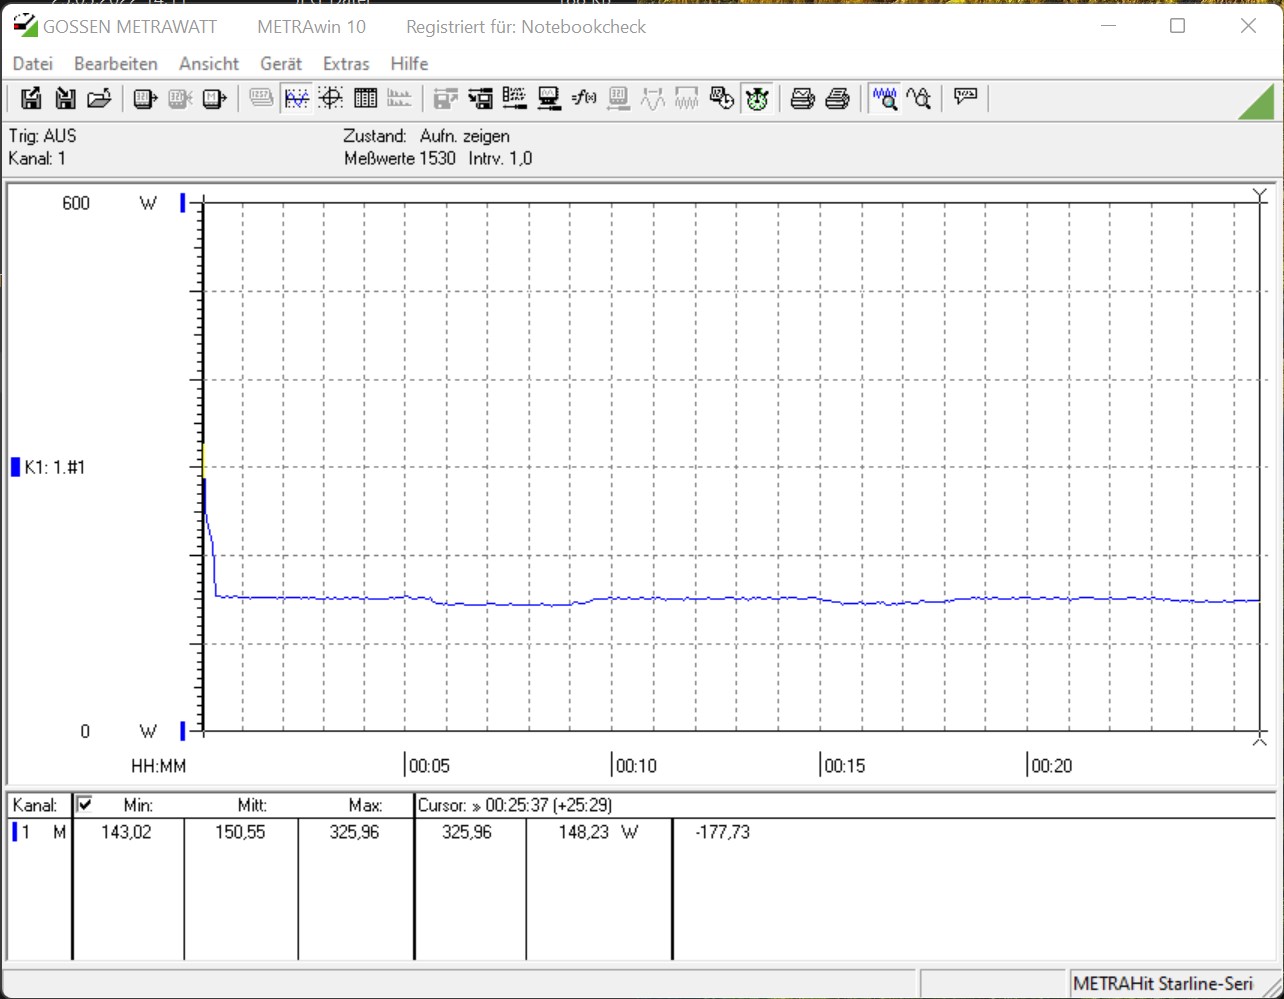
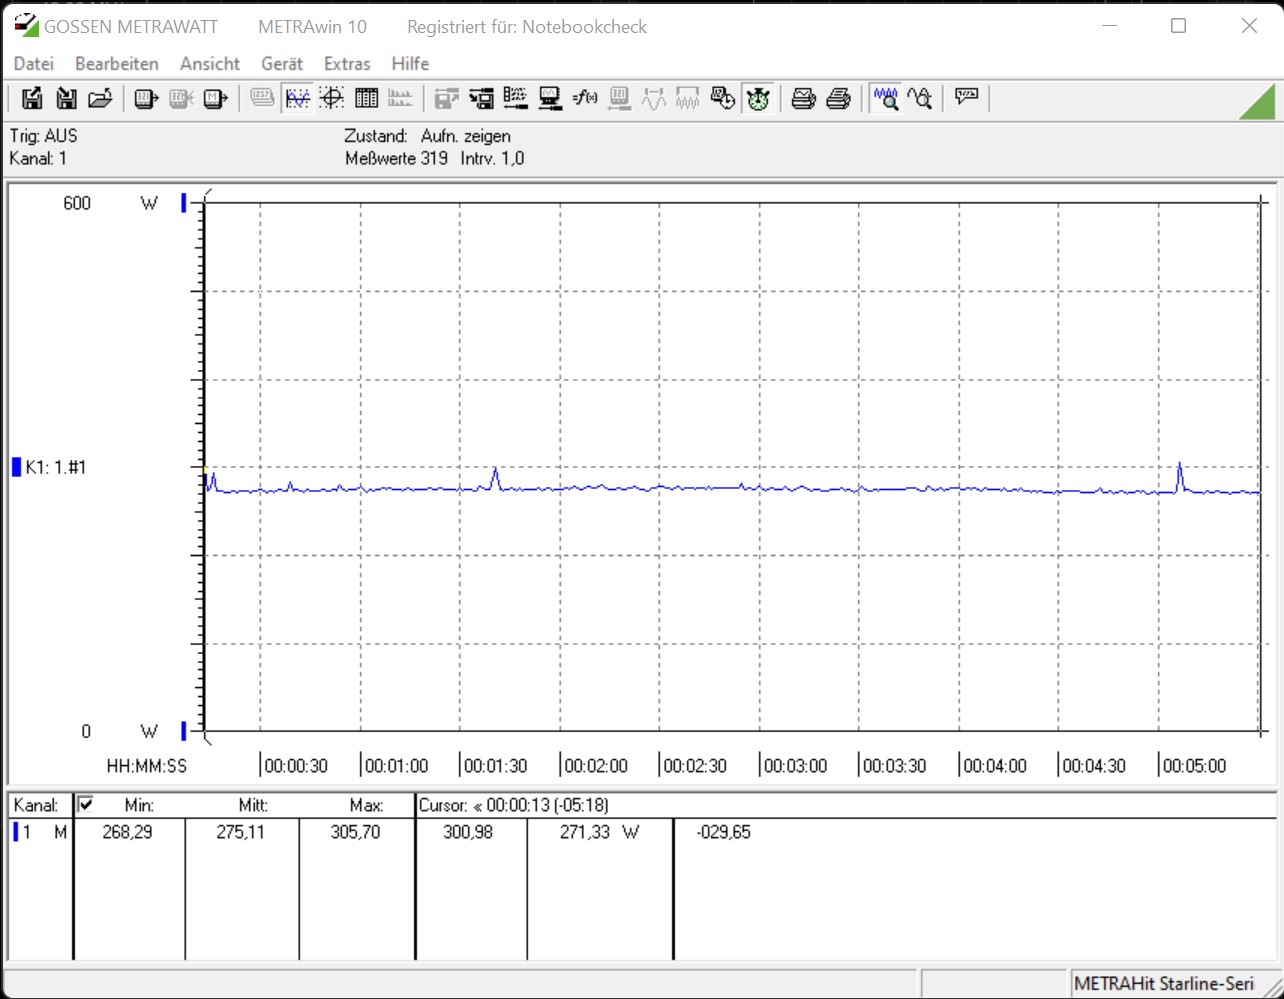
Kit Extremo Intel NUC 12 no Cinebench R15 Multi loop
No teste de carga com o loop Cinebench R15 Mult, vemos uma queda significativa de desempenho após a corrida inicial, antes de continuar nivelando em 2.592 pontos. Entretanto, em comparação com os dois antecessores, ainda há uma clara vantagem de desempenho, mesmo sob carga total.
Desempenho da aplicação
Nos benchmarks de aplicação, a vantagem pura de desempenho em comparação com o modelo antecessor se revela significativamente menor do que o esperado. Entretanto, olhando para isto subjetivamente, tanto o Beast Canyon NUC naquela época quanto o Dragon Canyon NUC agora têm uma velocidade operacional muito alta e deixam uma impressão muito boa na operação diária. Se você instalar um SSD rápido, o sistema estará pronto para uso já após alguns segundos. Não encontramos nenhum tempo de espera longo em nossa configuração de teste. Mas ao compará-lo com os sistemas high-end atuais, eles ainda vão superar o Kit Extremo Intel NUC 12. A GPU que é utilizada tem um grande impacto aqui. Ao mesmo tempo, nossa unidade de teste ainda é 14% mais rápida que um sistema baseado em um AMD Ryzen 9 5900X com a GPU idêntica
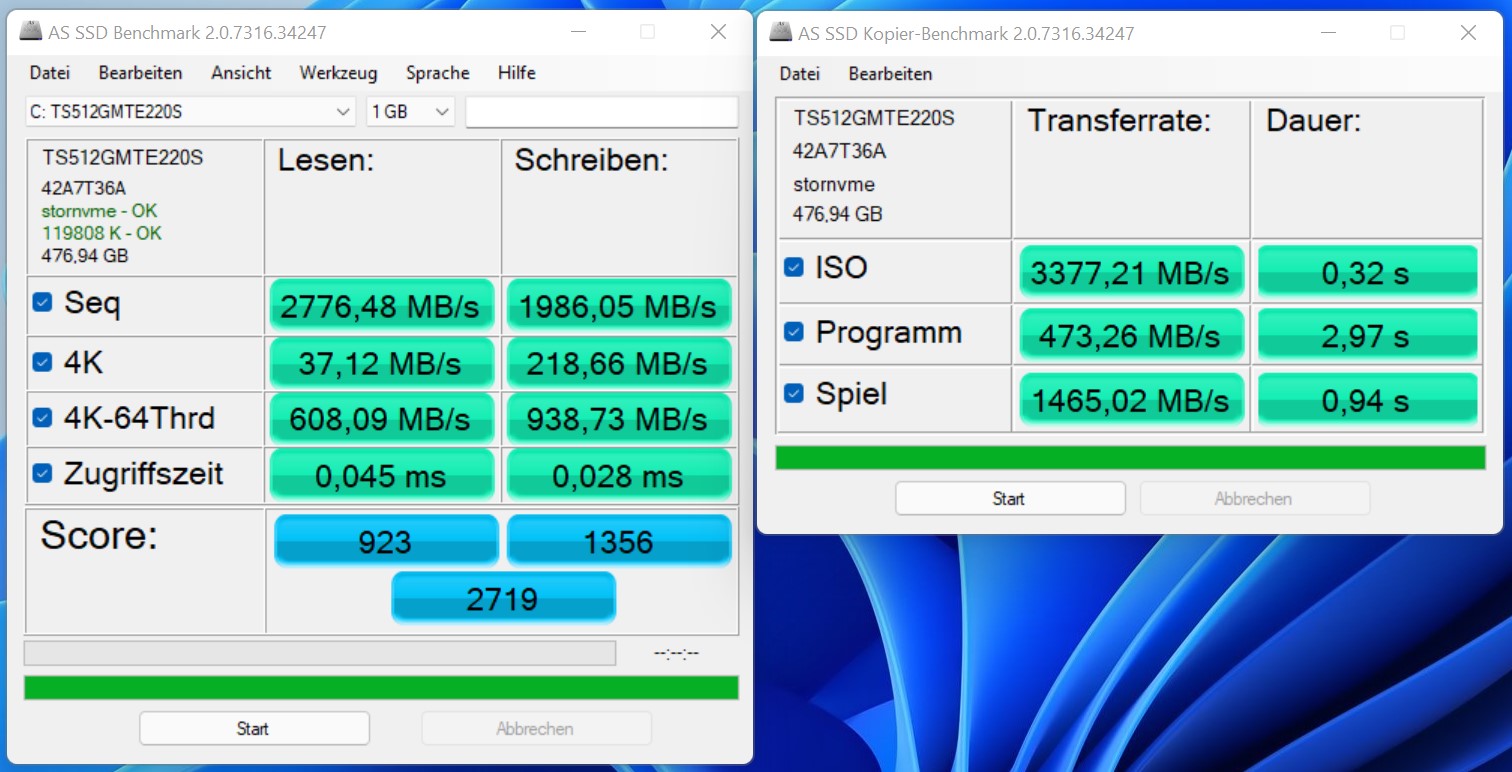
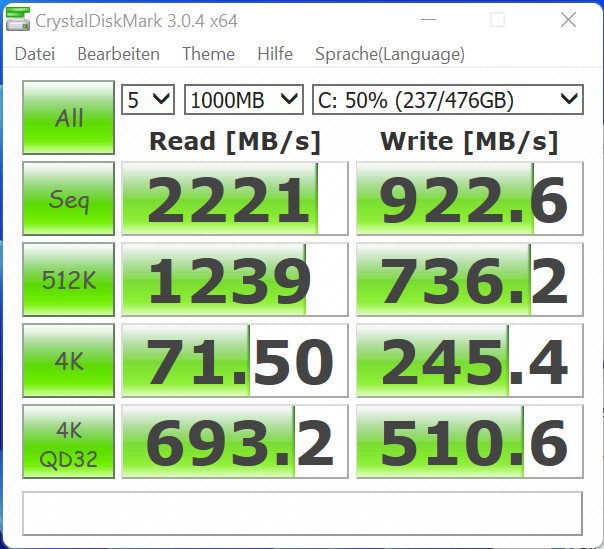
Equipamos o sistema de barebone com um SSD NVMe 512-GB. Em nosso teste, o modelo da Transcend nos proporcionou um desempenho sólido. Você pode inserir um total de dois M.2-2280 SSDs no Elemento de Computação.
| Performance rating - Percent | |
| Intel Core i7-12700K, Intel Core i7-12700K | |
| Intel Core i9-12900K, Intel Core i9-12900K | |
| Intel Core i9-11900K, Intel Core i9-11900K | |
| Intel Core i5-11600K, Intel Core i5-11600K | |
| Intel Core i9-10900K, Intel Core i9-10900K | |
| Intel Core i5-10600K, Intel Core i5-10600K | |
| AMD Ryzen 9 3950X, AMD Ryzen 9 3950X | |
| Corsair One i160, Intel Core i9-9900K | |
| Intel Dragon Canyon NUC - RTX 3060, Intel Core i9-12900 | |
| Intel Beast Canyon NUC, Intel Core i9-11900KB | |
| Intel Ghost Canyon NUC (RTX 2070), Intel Core i9-9980HK | |
| Inno3D GeForce RTX 3060 Twin X2, AMD Ryzen 9 5900X -1! | |
| PCMark 10 - Score | |
| Intel Core i9-12900K, Intel Core i9-12900K | |
| Intel Core i7-12700K, Intel Core i7-12700K | |
| Intel Dragon Canyon NUC - RTX 3060, Intel Core i9-12900 | |
| AMD Ryzen 9 3950X, AMD Ryzen 9 3950X | |
| Intel Core i9-11900K, Intel Core i9-11900K | |
| Intel Core i5-11600K, Intel Core i5-11600K | |
| Intel Core i9-10900K, Intel Core i9-10900K | |
| Corsair One i160, Intel Core i9-9900K | |
| Intel Beast Canyon NUC, Intel Core i9-11900KB | |
| Intel Core i5-10600K, Intel Core i5-10600K | |
| Intel Ghost Canyon NUC (RTX 2070), Intel Core i9-9980HK | |
| SPECviewperf 12 | |
| 1900x1060 Solidworks (sw-03) | |
| Intel Core i9-11900K, Intel Core i9-11900K | |
| Intel Core i9-12900K, Intel Core i9-12900K | |
| Intel Core i9-10900K, Intel Core i9-10900K | |
| Intel Core i5-11600K, Intel Core i5-11600K | |
| Intel Core i7-12700K, Intel Core i7-12700K | |
| Intel Core i5-10600K, Intel Core i5-10600K | |
| AMD Ryzen 9 3950X, AMD Ryzen 9 3950X | |
| Corsair One i160, Intel Core i9-9900K | |
| Intel Dragon Canyon NUC - RTX 3060, Intel Core i9-12900 | |
| Intel Beast Canyon NUC, Intel Core i9-11900KB | |
| Intel Ghost Canyon NUC (RTX 2070), Intel Core i9-9980HK | |
| Inno3D GeForce RTX 3060 Twin X2, AMD Ryzen 9 5900X | |
| 1900x1060 Siemens NX (snx-02) | |
| Intel Core i7-12700K, Intel Core i7-12700K | |
| Intel Core i9-12900K, Intel Core i9-12900K | |
| Intel Core i9-10900K, Intel Core i9-10900K | |
| Intel Core i5-10600K, Intel Core i5-10600K | |
| AMD Ryzen 9 3950X, AMD Ryzen 9 3950X | |
| Intel Core i5-11600K, Intel Core i5-11600K | |
| Intel Core i9-11900K, Intel Core i9-11900K | |
| Corsair One i160, Intel Core i9-9900K | |
| Intel Dragon Canyon NUC - RTX 3060, Intel Core i9-12900 | |
| Intel Ghost Canyon NUC (RTX 2070), Intel Core i9-9980HK | |
| Inno3D GeForce RTX 3060 Twin X2, AMD Ryzen 9 5900X | |
| Intel Beast Canyon NUC, Intel Core i9-11900KB | |
| 1900x1060 Showcase (showcase-01) | |
| Intel Core i9-11900K, Intel Core i9-11900K | |
| Intel Core i5-11600K, Intel Core i5-11600K | |
| Intel Core i9-12900K, Intel Core i9-12900K | |
| Intel Core i7-12700K, Intel Core i7-12700K | |
| Intel Core i5-10600K, Intel Core i5-10600K | |
| Intel Core i9-10900K, Intel Core i9-10900K | |
| AMD Ryzen 9 3950X, AMD Ryzen 9 3950X | |
| Corsair One i160, Intel Core i9-9900K | |
| Intel Ghost Canyon NUC (RTX 2070), Intel Core i9-9980HK | |
| Intel Dragon Canyon NUC - RTX 3060, Intel Core i9-12900 | |
| Inno3D GeForce RTX 3060 Twin X2, AMD Ryzen 9 5900X | |
| Intel Beast Canyon NUC, Intel Core i9-11900KB | |
| 1900x1060 Medical (medical-01) | |
| Intel Core i9-12900K, Intel Core i9-12900K | |
| Intel Core i7-12700K, Intel Core i7-12700K | |
| Intel Core i5-10600K, Intel Core i5-10600K | |
| Intel Core i9-10900K, Intel Core i9-10900K | |
| Intel Core i5-11600K, Intel Core i5-11600K | |
| AMD Ryzen 9 3950X, AMD Ryzen 9 3950X | |
| Intel Core i9-11900K, Intel Core i9-11900K | |
| Corsair One i160, Intel Core i9-9900K | |
| Intel Dragon Canyon NUC - RTX 3060, Intel Core i9-12900 | |
| Intel Beast Canyon NUC, Intel Core i9-11900KB | |
| Intel Ghost Canyon NUC (RTX 2070), Intel Core i9-9980HK | |
| Inno3D GeForce RTX 3060 Twin X2, AMD Ryzen 9 5900X | |
| 1900x1060 Maya (maya-04) | |
| Intel Core i9-12900K, Intel Core i9-12900K | |
| Intel Core i7-12700K, Intel Core i7-12700K | |
| Intel Core i9-11900K, Intel Core i9-11900K | |
| Intel Dragon Canyon NUC - RTX 3060, Intel Core i9-12900 | |
| Intel Beast Canyon NUC, Intel Core i9-11900KB | |
| Corsair One i160, Intel Core i9-9900K | |
| Intel Core i9-10900K, Intel Core i9-10900K | |
| Intel Core i5-11600K, Intel Core i5-11600K | |
| Inno3D GeForce RTX 3060 Twin X2, AMD Ryzen 9 5900X | |
| AMD Ryzen 9 3950X, AMD Ryzen 9 3950X | |
| Intel Ghost Canyon NUC (RTX 2070), Intel Core i9-9980HK | |
| Intel Core i5-10600K, Intel Core i5-10600K | |
| 1900x1060 Energy (energy-01) | |
| Intel Core i9-12900K, Intel Core i9-12900K | |
| Intel Core i7-12700K, Intel Core i7-12700K | |
| Intel Core i5-10600K, Intel Core i5-10600K | |
| Intel Core i9-10900K, Intel Core i9-10900K | |
| Intel Core i5-11600K, Intel Core i5-11600K | |
| Intel Core i9-11900K, Intel Core i9-11900K | |
| AMD Ryzen 9 3950X, AMD Ryzen 9 3950X | |
| Corsair One i160, Intel Core i9-9900K | |
| Intel Ghost Canyon NUC (RTX 2070), Intel Core i9-9980HK | |
| Intel Dragon Canyon NUC - RTX 3060, Intel Core i9-12900 | |
| Intel Beast Canyon NUC, Intel Core i9-11900KB | |
| Inno3D GeForce RTX 3060 Twin X2, AMD Ryzen 9 5900X | |
| 1900x1060 Creo (creo-01) | |
| Intel Core i9-12900K, Intel Core i9-12900K | |
| Intel Core i7-12700K, Intel Core i7-12700K | |
| Intel Core i9-11900K, Intel Core i9-11900K | |
| Intel Core i5-11600K, Intel Core i5-11600K | |
| Intel Core i9-10900K, Intel Core i9-10900K | |
| Intel Core i5-10600K, Intel Core i5-10600K | |
| AMD Ryzen 9 3950X, AMD Ryzen 9 3950X | |
| Corsair One i160, Intel Core i9-9900K | |
| Intel Dragon Canyon NUC - RTX 3060, Intel Core i9-12900 | |
| Inno3D GeForce RTX 3060 Twin X2, AMD Ryzen 9 5900X | |
| Intel Ghost Canyon NUC (RTX 2070), Intel Core i9-9980HK | |
| Intel Beast Canyon NUC, Intel Core i9-11900KB | |
| 1900x1060 Catia (catia-04) | |
| Intel Core i9-12900K, Intel Core i9-12900K | |
| Intel Core i7-12700K, Intel Core i7-12700K | |
| Intel Core i9-11900K, Intel Core i9-11900K | |
| Intel Core i5-11600K, Intel Core i5-11600K | |
| Intel Core i9-10900K, Intel Core i9-10900K | |
| AMD Ryzen 9 3950X, AMD Ryzen 9 3950X | |
| Intel Core i5-10600K, Intel Core i5-10600K | |
| Corsair One i160, Intel Core i9-9900K | |
| Intel Ghost Canyon NUC (RTX 2070), Intel Core i9-9980HK | |
| Intel Dragon Canyon NUC - RTX 3060, Intel Core i9-12900 | |
| Intel Beast Canyon NUC, Intel Core i9-11900KB | |
| Inno3D GeForce RTX 3060 Twin X2, AMD Ryzen 9 5900X | |
| 1900x1060 3ds Max (3dsmax-05) | |
| Intel Core i7-12700K, Intel Core i7-12700K | |
| Intel Core i9-10900K, Intel Core i9-10900K | |
| Intel Core i5-10600K, Intel Core i5-10600K | |
| Intel Core i9-11900K, Intel Core i9-11900K | |
| Intel Core i5-11600K, Intel Core i5-11600K | |
| AMD Ryzen 9 3950X, AMD Ryzen 9 3950X | |
| Corsair One i160, Intel Core i9-9900K | |
| Intel Core i9-12900K, Intel Core i9-12900K | |
| Inno3D GeForce RTX 3060 Twin X2, AMD Ryzen 9 5900X | |
| Intel Dragon Canyon NUC - RTX 3060, Intel Core i9-12900 | |
| Intel Beast Canyon NUC, Intel Core i9-11900KB | |
| Intel Ghost Canyon NUC (RTX 2070), Intel Core i9-9980HK | |
| SPECviewperf 13 | |
| Solidworks (sw-04) | |
| Intel Core i9-12900K, Intel Core i9-12900K | |
| Intel Core i9-11900K, Intel Core i9-11900K | |
| Intel Core i7-12700K, Intel Core i7-12700K | |
| Intel Core i5-11600K, Intel Core i5-11600K | |
| Intel Core i9-10900K, Intel Core i9-10900K | |
| Intel Core i5-10600K, Intel Core i5-10600K | |
| AMD Ryzen 9 3950X, AMD Ryzen 9 3950X | |
| Corsair One i160, Intel Core i9-9900K | |
| Intel Dragon Canyon NUC - RTX 3060, Intel Core i9-12900 | |
| Intel Beast Canyon NUC, Intel Core i9-11900KB | |
| Intel Ghost Canyon NUC (RTX 2070), Intel Core i9-9980HK | |
| Inno3D GeForce RTX 3060 Twin X2, AMD Ryzen 9 5900X | |
| Siemens NX (snx-03) | |
| Intel Core i9-12900K, Intel Core i9-12900K | |
| Intel Core i7-12700K, Intel Core i7-12700K | |
| Intel Core i9-10900K, Intel Core i9-10900K | |
| Intel Core i5-10600K, Intel Core i5-10600K | |
| AMD Ryzen 9 3950X, AMD Ryzen 9 3950X | |
| Intel Core i5-11600K, Intel Core i5-11600K | |
| Intel Core i9-11900K, Intel Core i9-11900K | |
| Corsair One i160, Intel Core i9-9900K | |
| Intel Dragon Canyon NUC - RTX 3060, Intel Core i9-12900 | |
| Intel Ghost Canyon NUC (RTX 2070), Intel Core i9-9980HK | |
| Inno3D GeForce RTX 3060 Twin X2, AMD Ryzen 9 5900X | |
| Intel Beast Canyon NUC, Intel Core i9-11900KB | |
| Showcase (showcase-02) | |
| Intel Core i9-12900K, Intel Core i9-12900K | |
| Intel Core i7-12700K, Intel Core i7-12700K | |
| Intel Core i5-10600K, Intel Core i5-10600K | |
| Intel Core i9-10900K, Intel Core i9-10900K | |
| Intel Core i9-11900K, Intel Core i9-11900K | |
| Intel Core i5-11600K, Intel Core i5-11600K | |
| AMD Ryzen 9 3950X, AMD Ryzen 9 3950X | |
| Corsair One i160, Intel Core i9-9900K | |
| Intel Ghost Canyon NUC (RTX 2070), Intel Core i9-9980HK | |
| Intel Dragon Canyon NUC - RTX 3060, Intel Core i9-12900 | |
| Inno3D GeForce RTX 3060 Twin X2, AMD Ryzen 9 5900X | |
| Intel Beast Canyon NUC, Intel Core i9-11900KB | |
| Medical (medical-02) | |
| Intel Core i7-12700K, Intel Core i7-12700K | |
| Intel Core i9-12900K, Intel Core i9-12900K | |
| AMD Ryzen 9 3950X, AMD Ryzen 9 3950X | |
| Intel Core i9-11900K, Intel Core i9-11900K | |
| Intel Core i5-11600K, Intel Core i5-11600K | |
| Intel Core i5-10600K, Intel Core i5-10600K | |
| Intel Core i9-10900K, Intel Core i9-10900K | |
| Corsair One i160, Intel Core i9-9900K | |
| Intel Ghost Canyon NUC (RTX 2070), Intel Core i9-9980HK | |
| Intel Dragon Canyon NUC - RTX 3060, Intel Core i9-12900 | |
| Inno3D GeForce RTX 3060 Twin X2, AMD Ryzen 9 5900X | |
| Intel Beast Canyon NUC, Intel Core i9-11900KB | |
| Maya (maya-05) | |
| Intel Core i9-12900K, Intel Core i9-12900K | |
| Intel Core i7-12700K, Intel Core i7-12700K | |
| Intel Core i9-11900K, Intel Core i9-11900K | |
| Intel Core i5-11600K, Intel Core i5-11600K | |
| Intel Core i9-10900K, Intel Core i9-10900K | |
| Corsair One i160, Intel Core i9-9900K | |
| AMD Ryzen 9 3950X, AMD Ryzen 9 3950X | |
| Intel Core i5-10600K, Intel Core i5-10600K | |
| Intel Ghost Canyon NUC (RTX 2070), Intel Core i9-9980HK | |
| Intel Dragon Canyon NUC - RTX 3060, Intel Core i9-12900 | |
| Intel Beast Canyon NUC, Intel Core i9-11900KB | |
| Inno3D GeForce RTX 3060 Twin X2, AMD Ryzen 9 5900X | |
| Energy (energy-02) | |
| Intel Core i5-11600K, Intel Core i5-11600K | |
| Intel Core i9-11900K, Intel Core i9-11900K | |
| Intel Core i5-10600K, Intel Core i5-10600K | |
| Intel Core i9-10900K, Intel Core i9-10900K | |
| Intel Core i9-12900K, Intel Core i9-12900K | |
| Intel Core i7-12700K, Intel Core i7-12700K | |
| AMD Ryzen 9 3950X, AMD Ryzen 9 3950X | |
| Corsair One i160, Intel Core i9-9900K | |
| Intel Ghost Canyon NUC (RTX 2070), Intel Core i9-9980HK | |
| Intel Beast Canyon NUC, Intel Core i9-11900KB | |
| Intel Dragon Canyon NUC - RTX 3060, Intel Core i9-12900 | |
| Inno3D GeForce RTX 3060 Twin X2, AMD Ryzen 9 5900X | |
| Creo (creo-02) | |
| Intel Core i9-12900K, Intel Core i9-12900K | |
| Intel Core i7-12700K, Intel Core i7-12700K | |
| Intel Core i9-11900K, Intel Core i9-11900K | |
| Intel Core i5-11600K, Intel Core i5-11600K | |
| Intel Core i9-10900K, Intel Core i9-10900K | |
| Intel Core i5-10600K, Intel Core i5-10600K | |
| AMD Ryzen 9 3950X, AMD Ryzen 9 3950X | |
| Corsair One i160, Intel Core i9-9900K | |
| Intel Dragon Canyon NUC - RTX 3060, Intel Core i9-12900 | |
| Intel Ghost Canyon NUC (RTX 2070), Intel Core i9-9980HK | |
| Inno3D GeForce RTX 3060 Twin X2, AMD Ryzen 9 5900X | |
| Intel Beast Canyon NUC, Intel Core i9-11900KB | |
| Catia (catia-05) | |
| Intel Core i9-12900K, Intel Core i9-12900K | |
| Intel Core i7-12700K, Intel Core i7-12700K | |
| Intel Core i9-11900K, Intel Core i9-11900K | |
| Intel Core i5-11600K, Intel Core i5-11600K | |
| Intel Core i9-10900K, Intel Core i9-10900K | |
| AMD Ryzen 9 3950X, AMD Ryzen 9 3950X | |
| Intel Core i5-10600K, Intel Core i5-10600K | |
| Corsair One i160, Intel Core i9-9900K | |
| Intel Ghost Canyon NUC (RTX 2070), Intel Core i9-9980HK | |
| Inno3D GeForce RTX 3060 Twin X2, AMD Ryzen 9 5900X | |
| Intel Dragon Canyon NUC - RTX 3060, Intel Core i9-12900 | |
| Intel Beast Canyon NUC, Intel Core i9-11900KB | |
| 3ds Max (3dsmax-06) | |
| Intel Core i7-12700K, Intel Core i7-12700K | |
| Intel Core i5-10600K, Intel Core i5-10600K | |
| Intel Core i9-10900K, Intel Core i9-10900K | |
| Intel Core i5-11600K, Intel Core i5-11600K | |
| Intel Core i9-11900K, Intel Core i9-11900K | |
| AMD Ryzen 9 3950X, AMD Ryzen 9 3950X | |
| Corsair One i160, Intel Core i9-9900K | |
| Intel Core i9-12900K, Intel Core i9-12900K | |
| Inno3D GeForce RTX 3060 Twin X2, AMD Ryzen 9 5900X | |
| Intel Dragon Canyon NUC - RTX 3060, Intel Core i9-12900 | |
| Intel Beast Canyon NUC, Intel Core i9-11900KB | |
| Intel Ghost Canyon NUC (RTX 2070), Intel Core i9-9980HK | |
desempenho em 3D e jogos
Como o Intel Core i9-12900 oferece apenas um iGPU simples com o Intel UHD Graphics 770, o desempenho 3D para jogos de vídeo exigentes simplesmente não está lá. Entretanto, é possível instalar uma placa gráfica dedicada no case, o que transformará o NUC em um PC de jogos muito compacto. Porque nós já testamos oBeast Canyon NUCcom um Nvidia GeForce RTX 3060 naquela época, decidimos usar também um modelo do RTX 3060 para o Dragon Canyon NUC. Em combinação com o processador do Alder Lake, o desempenho aumenta em cerca de 4% na operação de jogos. Este resultado não justifica uma atualização, portanto, só deve ser relevante para uma nova compra
A cooperação com o Nvidia GeForce RTX 3060da INNO 3D funciona muito bem. Todos os jogos atuais podem ser desfrutados a taxas de quadros suficientes na resolução de 1440 sem problemas. Às vezes, você pode até mesmo jogar muitos jogos em 2160p. Entretanto, como o aumento da resolução e os níveis mais altos de detalhes dizem mais respeito aos limites da GPU, o desempenho da CPU é apenas secundário, o que explica o baixo aumento de desempenho em comparação com o NUC do Beast Canyon
Você pode encontrar comparações e benchmarks adicionais em nosso GQuadro comparativo de PU.
Aqueles que querem equipar seu Dragon Canyon NUC com uma placa gráfica dedicada devem informar-se previamente sobre as dimensões exatas da GPU. A placa gráfica não pode ter um projeto de resfriamento que ocupa mais de dois slots, e você também deve observar o comprimento máximo de 30,5 cm (12 pol.).
| Performance rating - Percent | |
| Zotac Magnus One (ECM73070C) | |
| Inno3D GeForce RTX 3060 Twin X2 | |
| Intel Dragon Canyon NUC - RTX 3060 | |
| Intel Beast Canyon NUC | |
| Intel Ghost Canyon NUC (RTX 2070) | |
| Borderlands 3 | |
| 1280x720 Very Low Overall Quality (DX11) | |
| Intel Dragon Canyon NUC - RTX 3060 | |
| Inno3D GeForce RTX 3060 Twin X2 | |
| Intel Beast Canyon NUC | |
| Intel Ghost Canyon NUC (RTX 2070) | |
| Zotac Magnus One (ECM73070C) | |
| 1920x1080 Badass Overall Quality (DX11) | |
| Intel Beast Canyon NUC | |
| Zotac Magnus One (ECM73070C) | |
| Intel Dragon Canyon NUC - RTX 3060 | |
| Inno3D GeForce RTX 3060 Twin X2 | |
| Intel Ghost Canyon NUC (RTX 2070) | |
| Metro Exodus | |
| 1280x720 Low Quality AF:4x | |
| Intel Dragon Canyon NUC - RTX 3060 | |
| Inno3D GeForce RTX 3060 Twin X2 | |
| Intel Beast Canyon NUC | |
| Intel Ghost Canyon NUC (RTX 2070) | |
| Zotac Magnus One (ECM73070C) | |
| 1920x1080 Ultra Quality AF:16x | |
| Zotac Magnus One (ECM73070C) | |
| Intel Dragon Canyon NUC - RTX 3060 | |
| Intel Ghost Canyon NUC (RTX 2070) | |
| Intel Beast Canyon NUC | |
| Inno3D GeForce RTX 3060 Twin X2 | |
| Far Cry New Dawn | |
| 1280x720 Low Preset | |
| Inno3D GeForce RTX 3060 Twin X2 | |
| Intel Dragon Canyon NUC - RTX 3060 | |
| Intel Beast Canyon NUC | |
| Intel Ghost Canyon NUC (RTX 2070) | |
| Zotac Magnus One (ECM73070C) | |
| 1920x1080 Ultra Preset | |
| Intel Dragon Canyon NUC - RTX 3060 | |
| Inno3D GeForce RTX 3060 Twin X2 | |
| Intel Beast Canyon NUC | |
| Zotac Magnus One (ECM73070C) | |
| Intel Ghost Canyon NUC (RTX 2070) | |
| Far Cry 5 | |
| 1280x720 Low Preset AA:T | |
| Inno3D GeForce RTX 3060 Twin X2 | |
| Intel Dragon Canyon NUC - RTX 3060 | |
| Intel Beast Canyon NUC | |
| Zotac Magnus One (ECM73070C) | |
| Intel Ghost Canyon NUC (RTX 2070) | |
| 1920x1080 Ultra Preset AA:T | |
| Inno3D GeForce RTX 3060 Twin X2 | |
| Intel Dragon Canyon NUC - RTX 3060 | |
| Intel Beast Canyon NUC | |
| Zotac Magnus One (ECM73070C) | |
| Intel Ghost Canyon NUC (RTX 2070) | |
| X-Plane 11.11 | |
| 1280x720 low (fps_test=1) | |
| Inno3D GeForce RTX 3060 Twin X2 | |
| Intel Beast Canyon NUC | |
| Intel Dragon Canyon NUC - RTX 3060 | |
| Intel Ghost Canyon NUC (RTX 2070) | |
| Zotac Magnus One (ECM73070C) | |
| 1920x1080 high (fps_test=3) | |
| Inno3D GeForce RTX 3060 Twin X2 | |
| Intel Beast Canyon NUC | |
| Intel Dragon Canyon NUC - RTX 3060 | |
| Intel Ghost Canyon NUC (RTX 2070) | |
| Zotac Magnus One (ECM73070C) | |
| Final Fantasy XV Benchmark | |
| 1280x720 Lite Quality | |
| Inno3D GeForce RTX 3060 Twin X2 | |
| Intel Beast Canyon NUC | |
| Intel Dragon Canyon NUC - RTX 3060 | |
| Intel Ghost Canyon NUC (RTX 2070) | |
| Zotac Magnus One (ECM73070C) | |
| 1920x1080 High Quality | |
| Zotac Magnus One (ECM73070C) | |
| Intel Ghost Canyon NUC (RTX 2070) | |
| Inno3D GeForce RTX 3060 Twin X2 | |
| Intel Beast Canyon NUC | |
| Intel Dragon Canyon NUC - RTX 3060 | |
| Dota 2 Reborn | |
| 1280x720 min (0/3) fastest | |
| Inno3D GeForce RTX 3060 Twin X2 | |
| Intel Beast Canyon NUC | |
| Intel Dragon Canyon NUC - RTX 3060 | |
| Zotac Magnus One (ECM73070C) | |
| Intel Ghost Canyon NUC (RTX 2070) | |
| 1920x1080 ultra (3/3) best looking | |
| Inno3D GeForce RTX 3060 Twin X2 | |
| Intel Beast Canyon NUC | |
| Intel Dragon Canyon NUC - RTX 3060 | |
| Intel Ghost Canyon NUC (RTX 2070) | |
| Zotac Magnus One (ECM73070C) | |
| 3DMark | |
| Fire Strike Extreme Graphics | |
| Zotac Magnus One (ECM73070C) | |
| Inno3D GeForce RTX 3060 Twin X2 | |
| Intel Dragon Canyon NUC - RTX 3060 | |
| Intel Beast Canyon NUC | |
| Intel Ghost Canyon NUC (RTX 2070) | |
| 1920x1080 Fire Strike Graphics | |
| Zotac Magnus One (ECM73070C) | |
| Intel Dragon Canyon NUC - RTX 3060 | |
| Inno3D GeForce RTX 3060 Twin X2 | |
| Intel Beast Canyon NUC | |
| Intel Ghost Canyon NUC (RTX 2070) | |
| 2560x1440 Time Spy Graphics | |
| Zotac Magnus One (ECM73070C) | |
| Intel Ghost Canyon NUC (RTX 2070) | |
| Intel Dragon Canyon NUC - RTX 3060 | |
| Inno3D GeForce RTX 3060 Twin X2 | |
| Intel Beast Canyon NUC | |
| 3DMark 11 | |
| 1280x720 Performance GPU | |
| Zotac Magnus One (ECM73070C) | |
| Intel Dragon Canyon NUC - RTX 3060 | |
| Intel Beast Canyon NUC | |
| Intel Ghost Canyon NUC (RTX 2070) | |
| Inno3D GeForce RTX 3060 Twin X2 | |
| 1280x720 Performance | |
| Zotac Magnus One (ECM73070C) | |
| Intel Dragon Canyon NUC - RTX 3060 | |
| Inno3D GeForce RTX 3060 Twin X2 | |
| Intel Beast Canyon NUC | |
| Intel Ghost Canyon NUC (RTX 2070) | |
Intel NUC 12 Dragon Canyon + Nvidia GeForce RTX 3060
| baixo | média | alto | ultra | QHD | 4K | |
|---|---|---|---|---|---|---|
| GTA V (2015) | 186 | 181 | 177 | 104 | 81.4 | 82.3 |
| The Witcher 3 (2015) | 462 | 305 | 178 | 91.3 | 62.5 | |
| Dota 2 Reborn (2015) | 178.3 | 161.7 | 155.6 | 147.1 | 116.1 | |
| Final Fantasy XV Benchmark (2018) | 196 | 123 | 88.6 | 64.8 | 38 | |
| X-Plane 11.11 (2018) | 151 | 133 | 105 | 88.5 | ||
| Far Cry 5 (2018) | 193 | 153 | 139 | 132 | 94 | 48 |
| Strange Brigade (2018) | 491 | 230 | 180 | 154 | 116 | 66.8 |
| Far Cry New Dawn (2019) | 161 | 132 | 126 | 113 | 92 | 51 |
| Metro Exodus (2019) | 207 | 113 | 83.7 | 65.3 | 51.7 | 32.2 |
| Borderlands 3 (2019) | 185 | 148 | 104 | 84.7 | 60.3 | 33.3 |
| F1 2020 (2020) | 355 | 259 | 208 | 142 | 106 | 60.2 |
| F1 2021 (2021) | 419 | 261 | 206 | 96.9 | 72 | 40.9 |
| Far Cry 6 (2021) | 167 | 129 | 110 | 96 | 70.5 | 39.3 |
Consumo de energia, desenvolvimento de calor e ruído da Intel NUC 12 Dragon Canyon
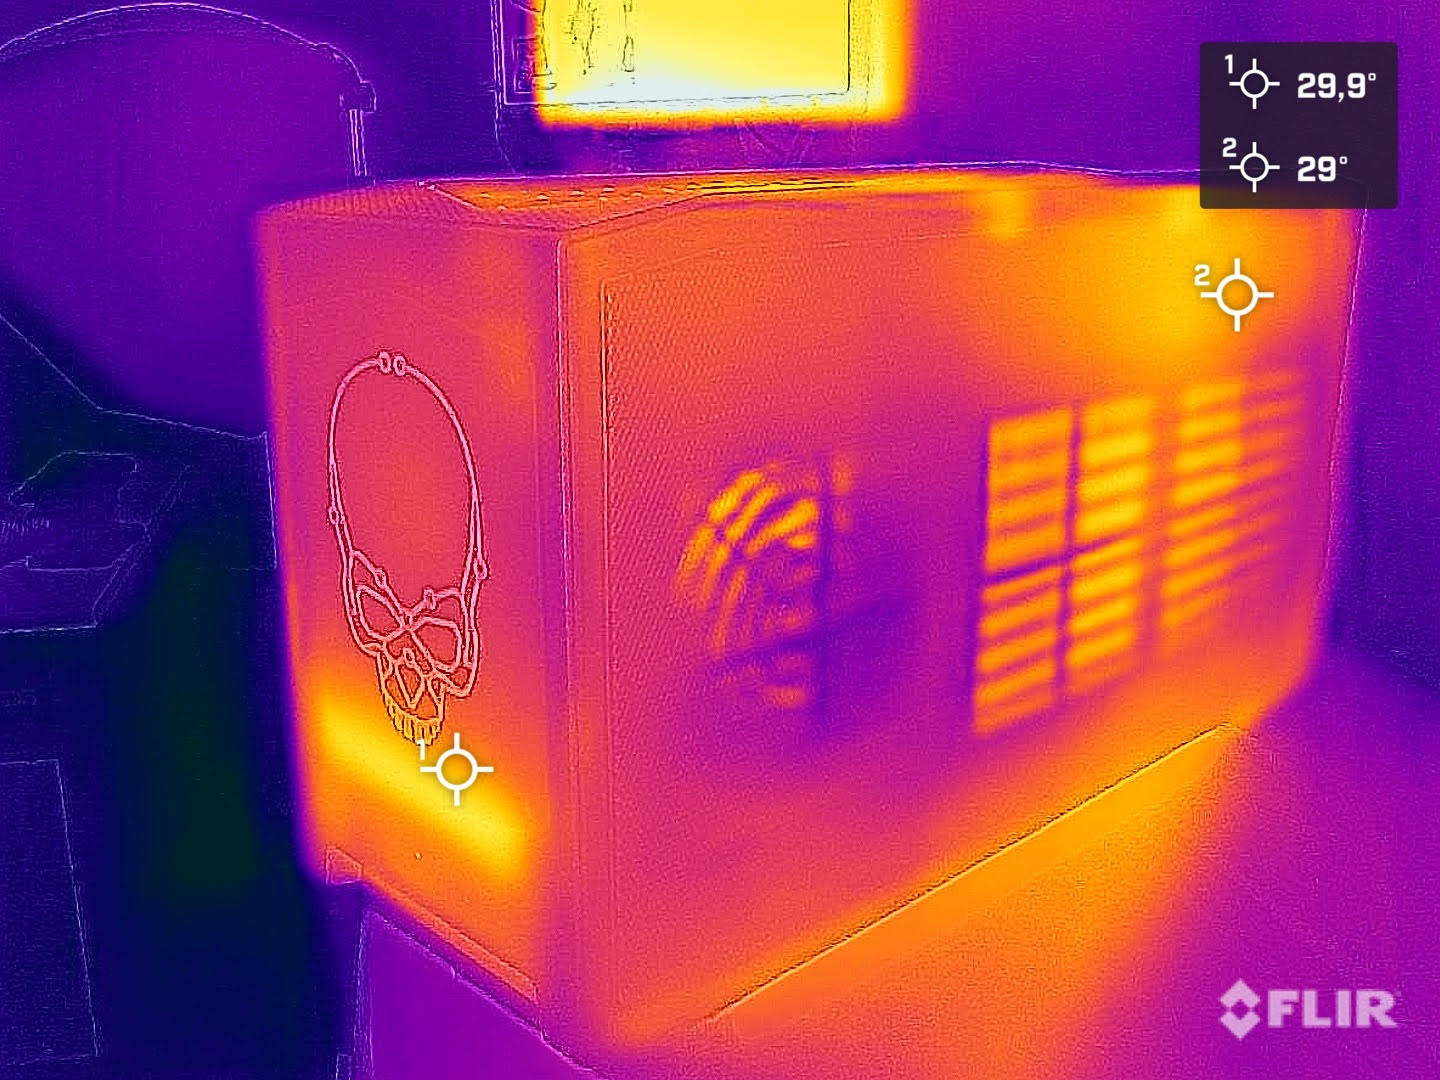
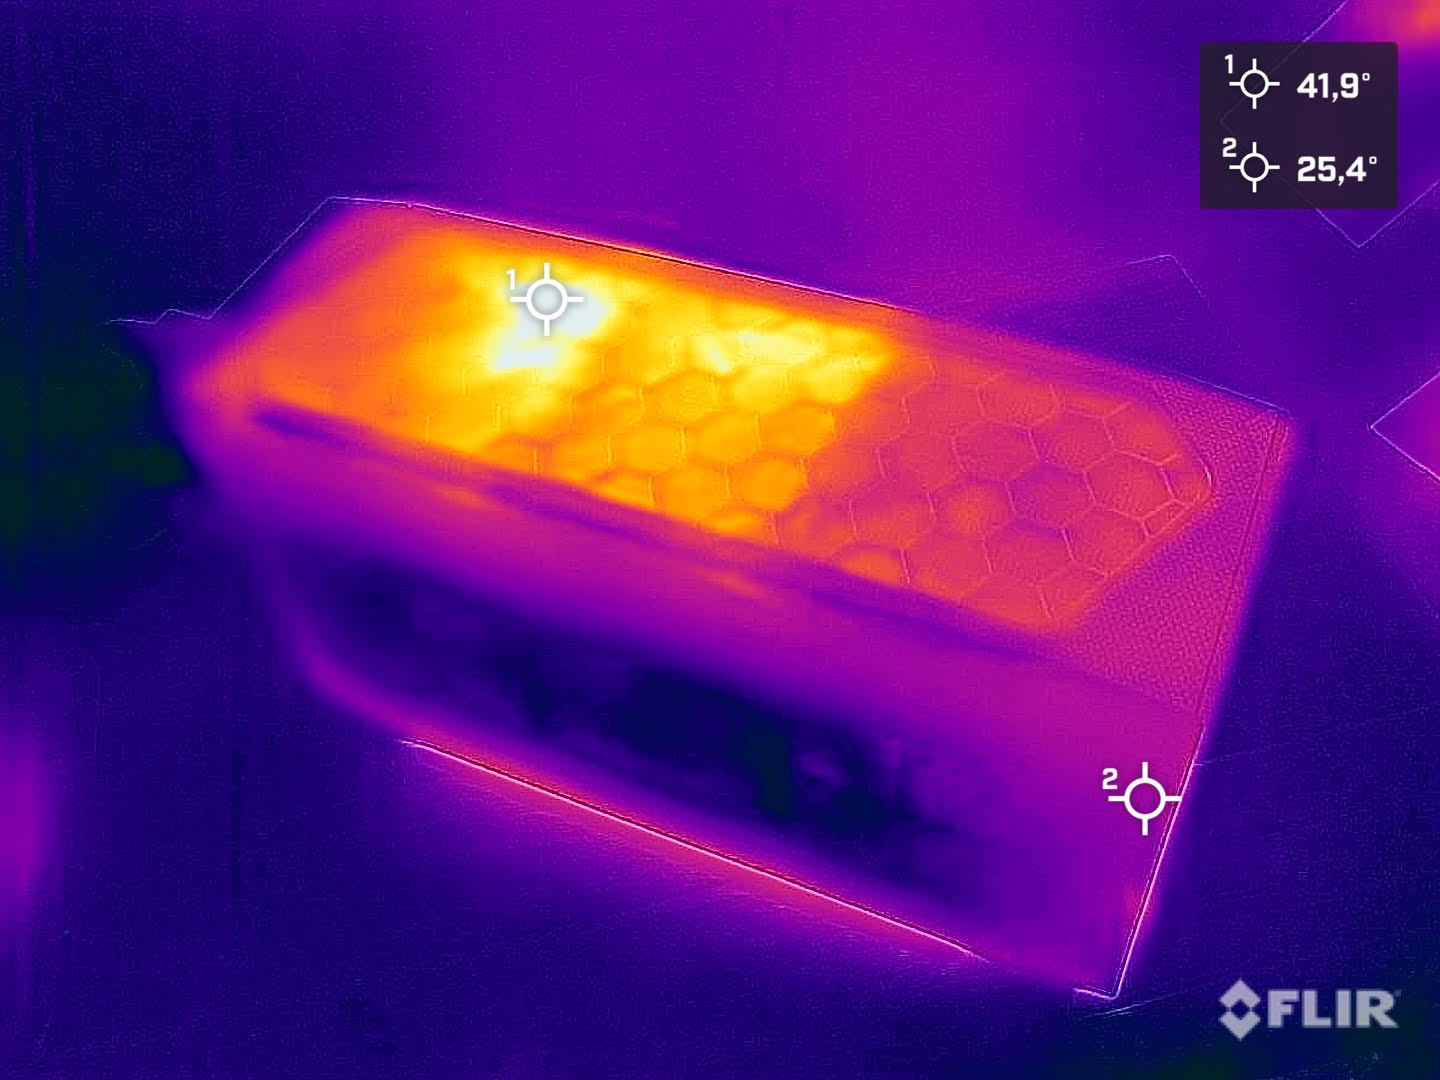
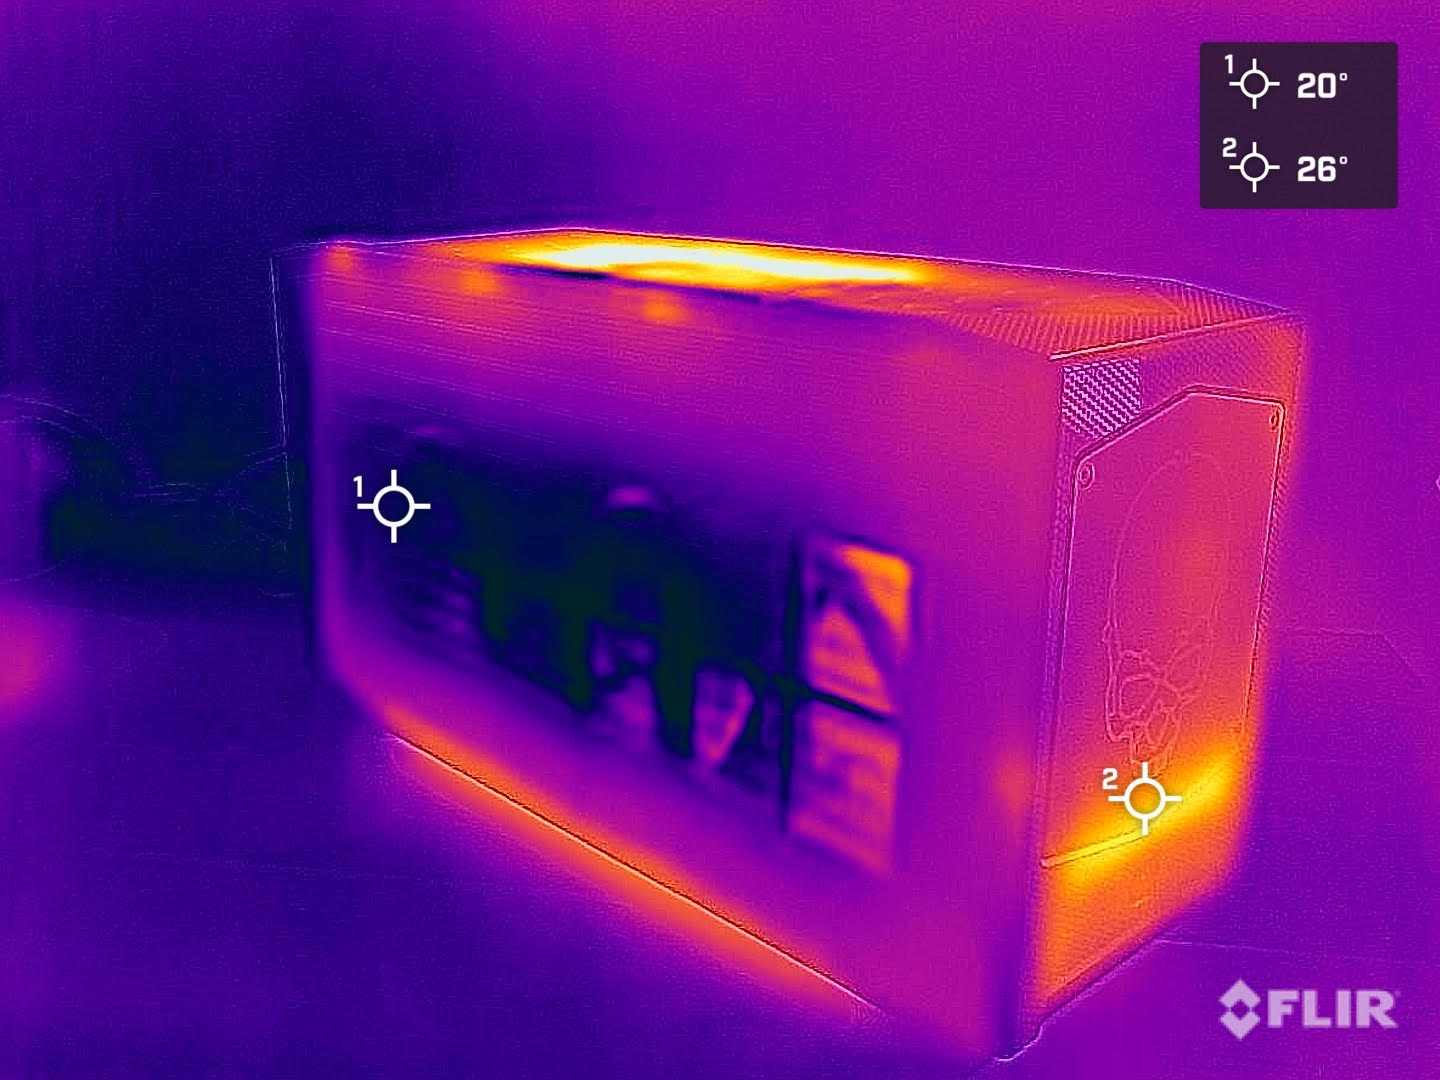
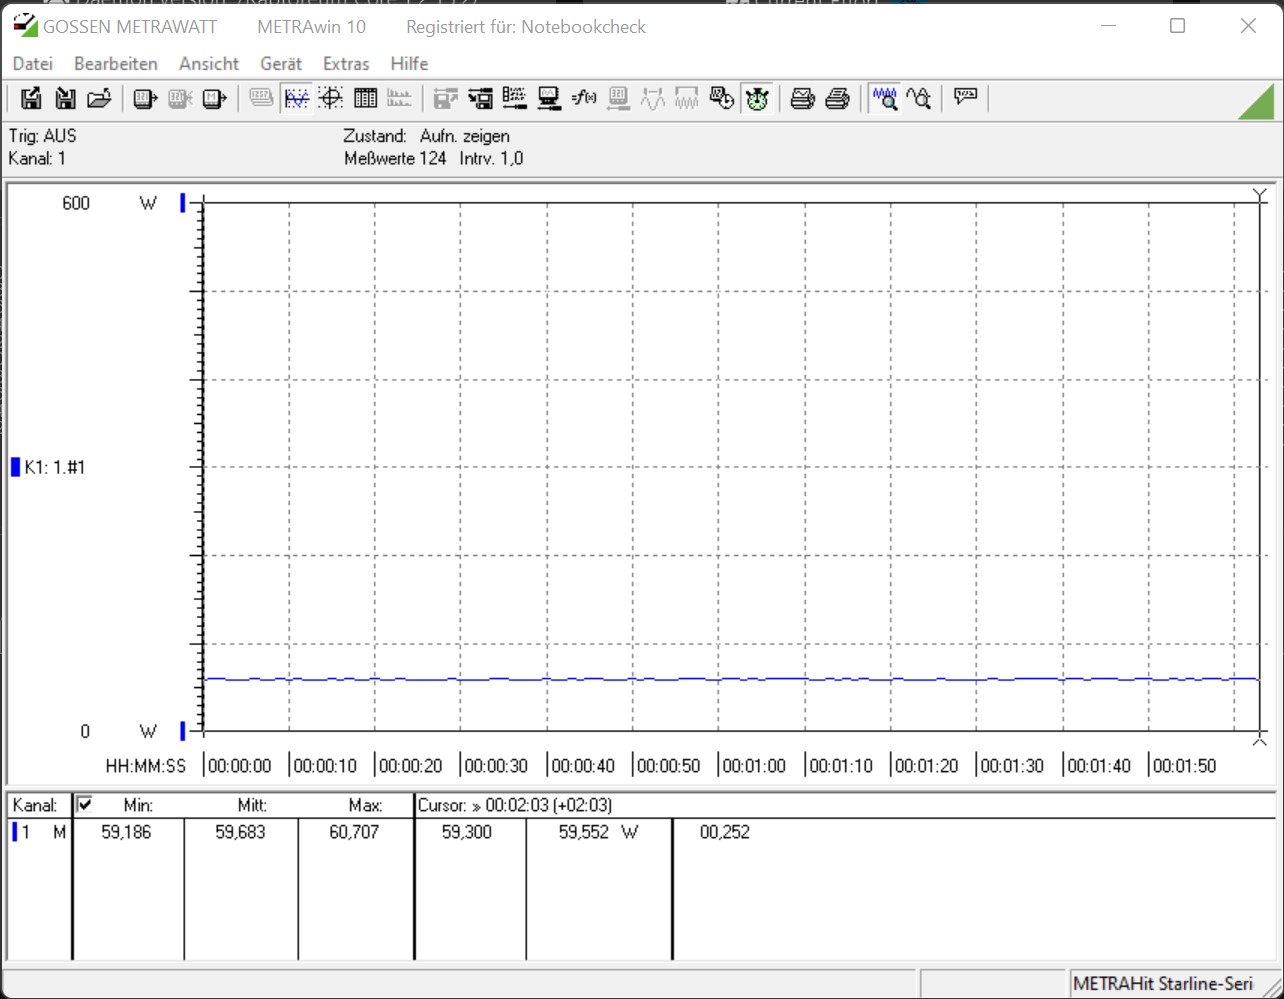
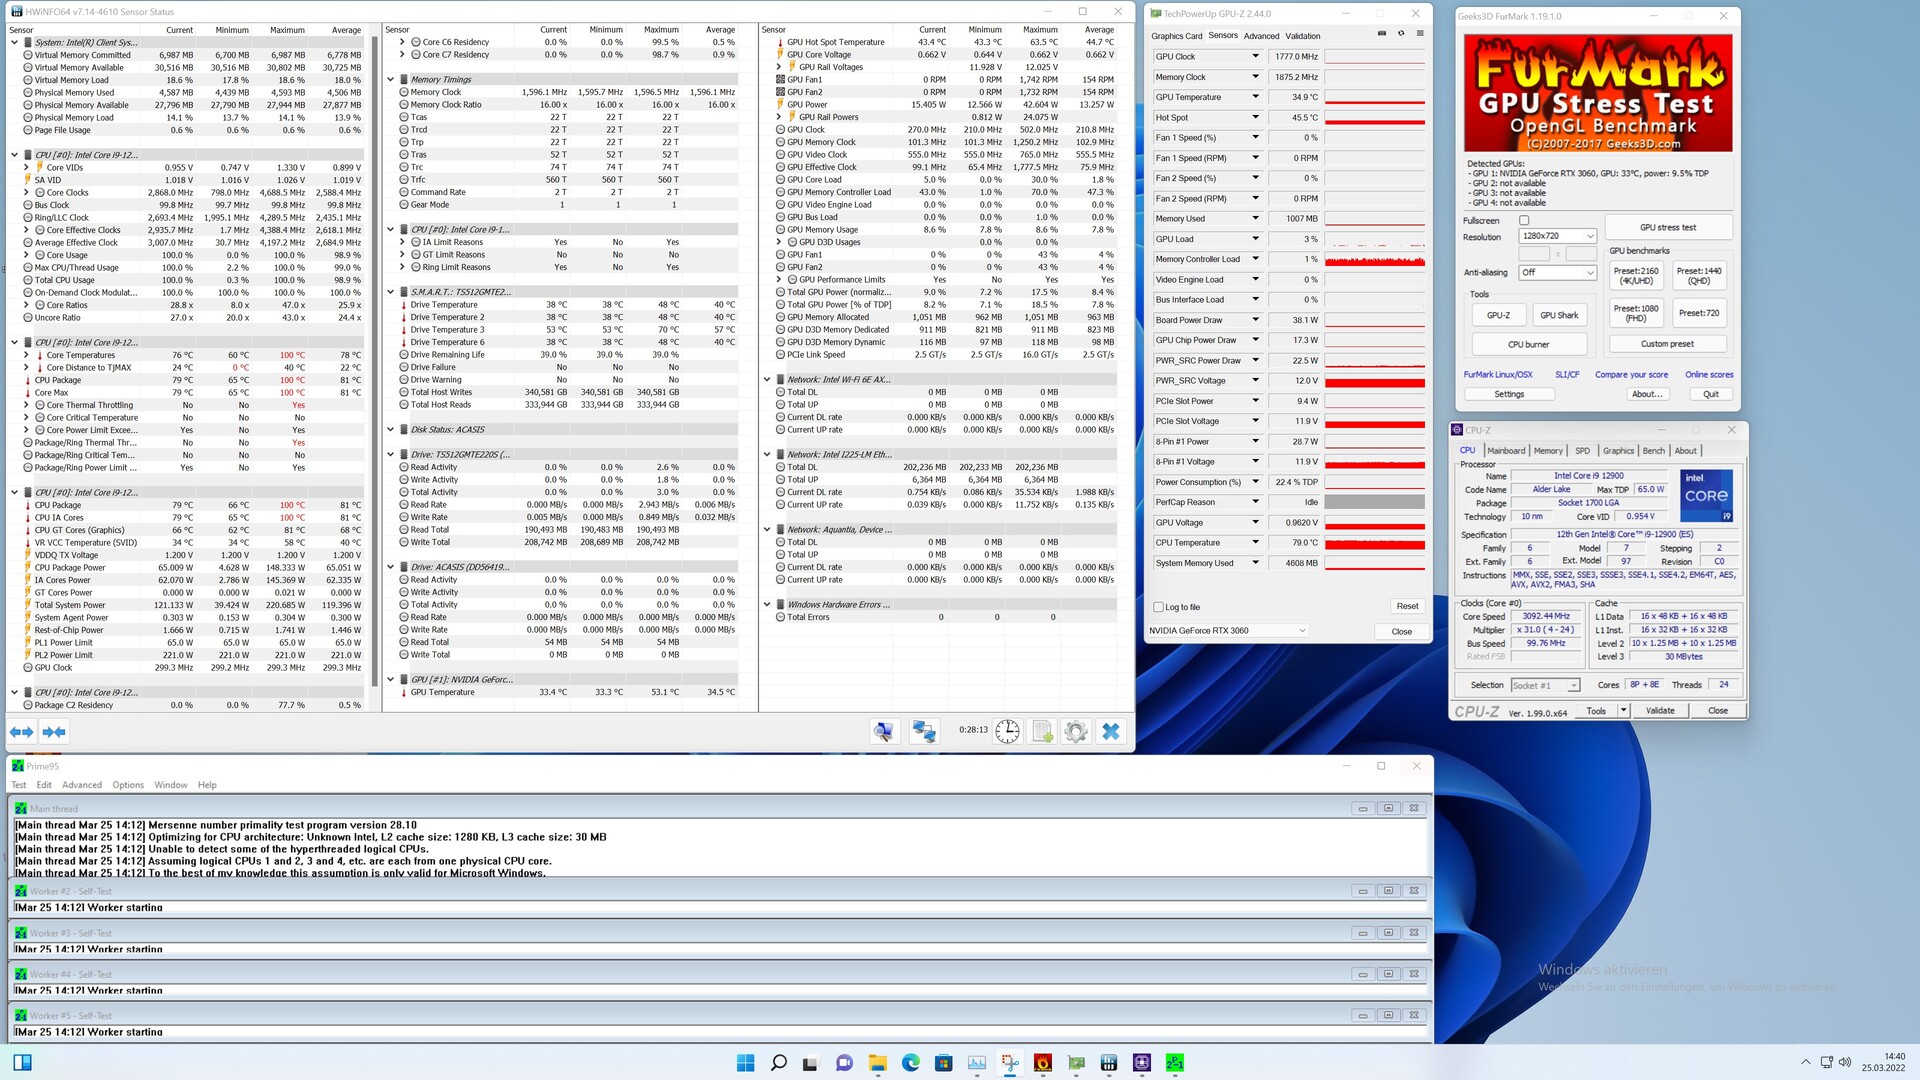
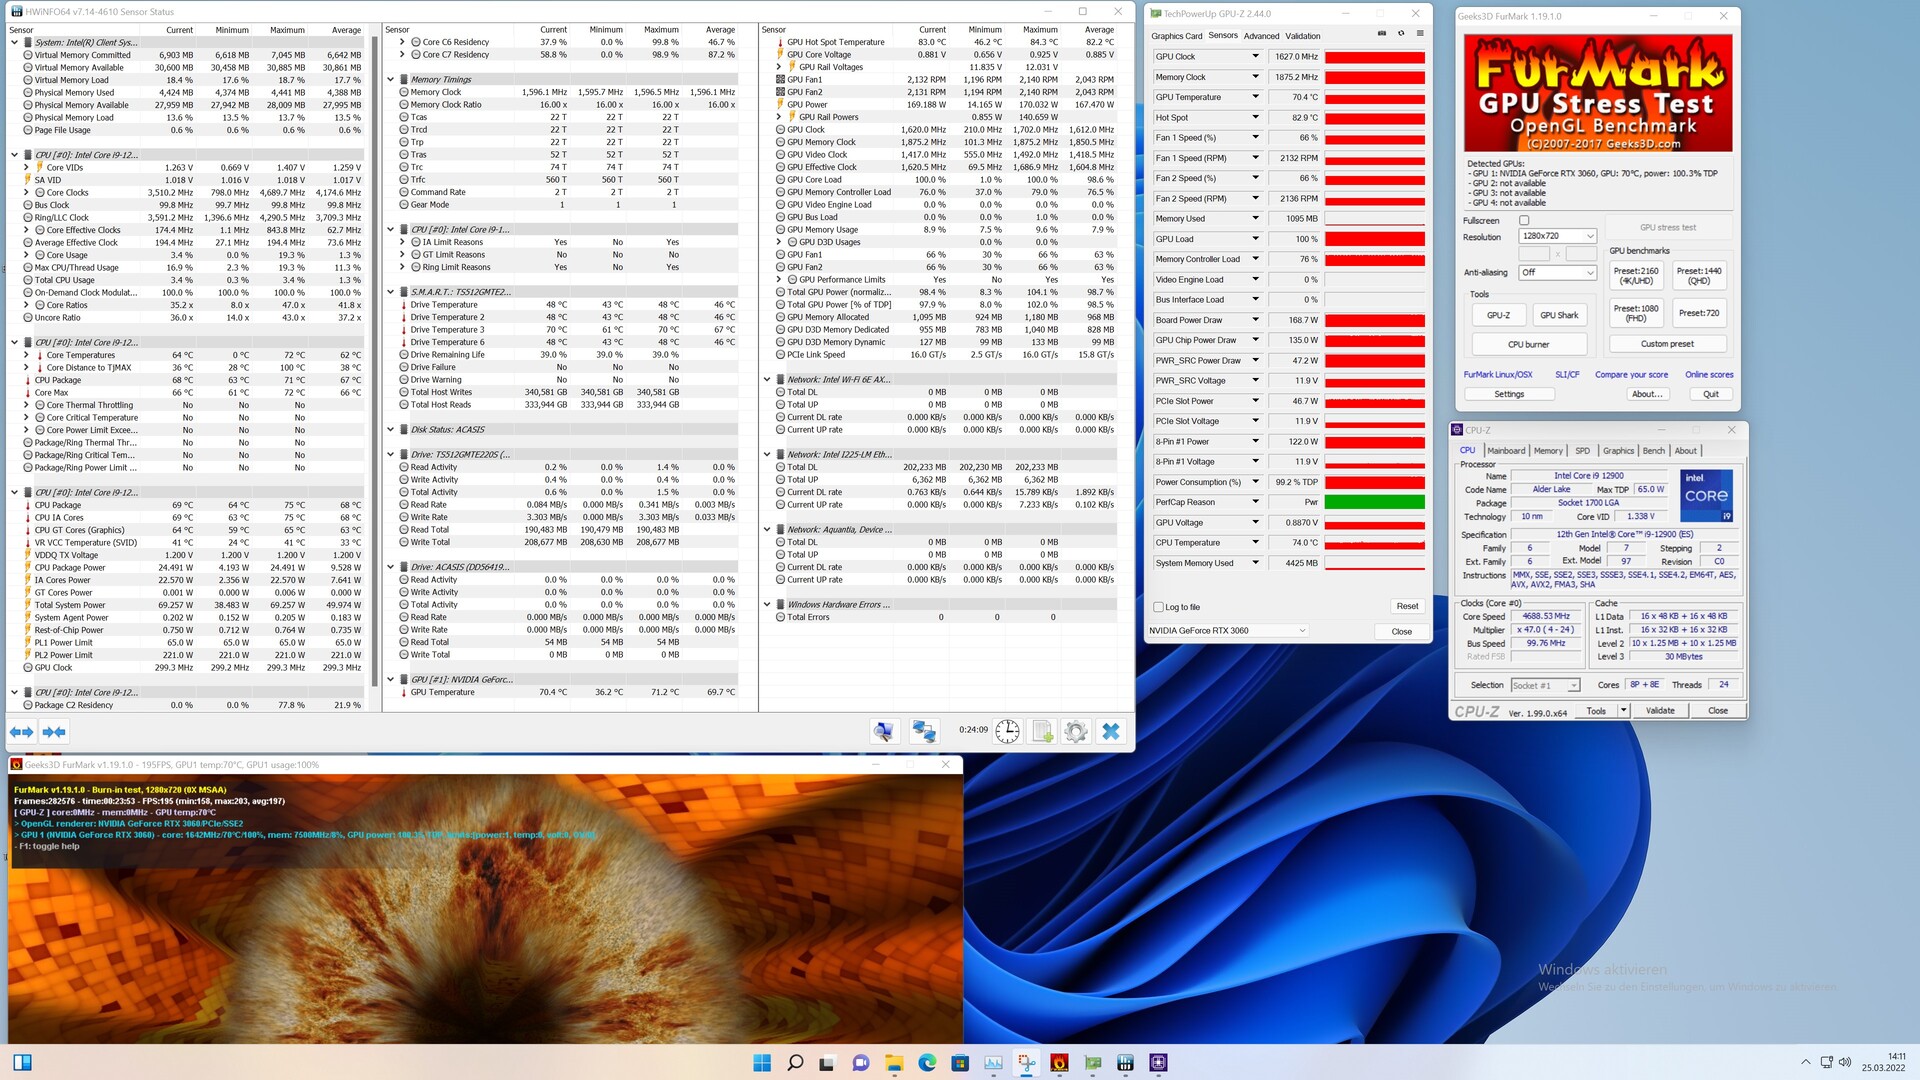
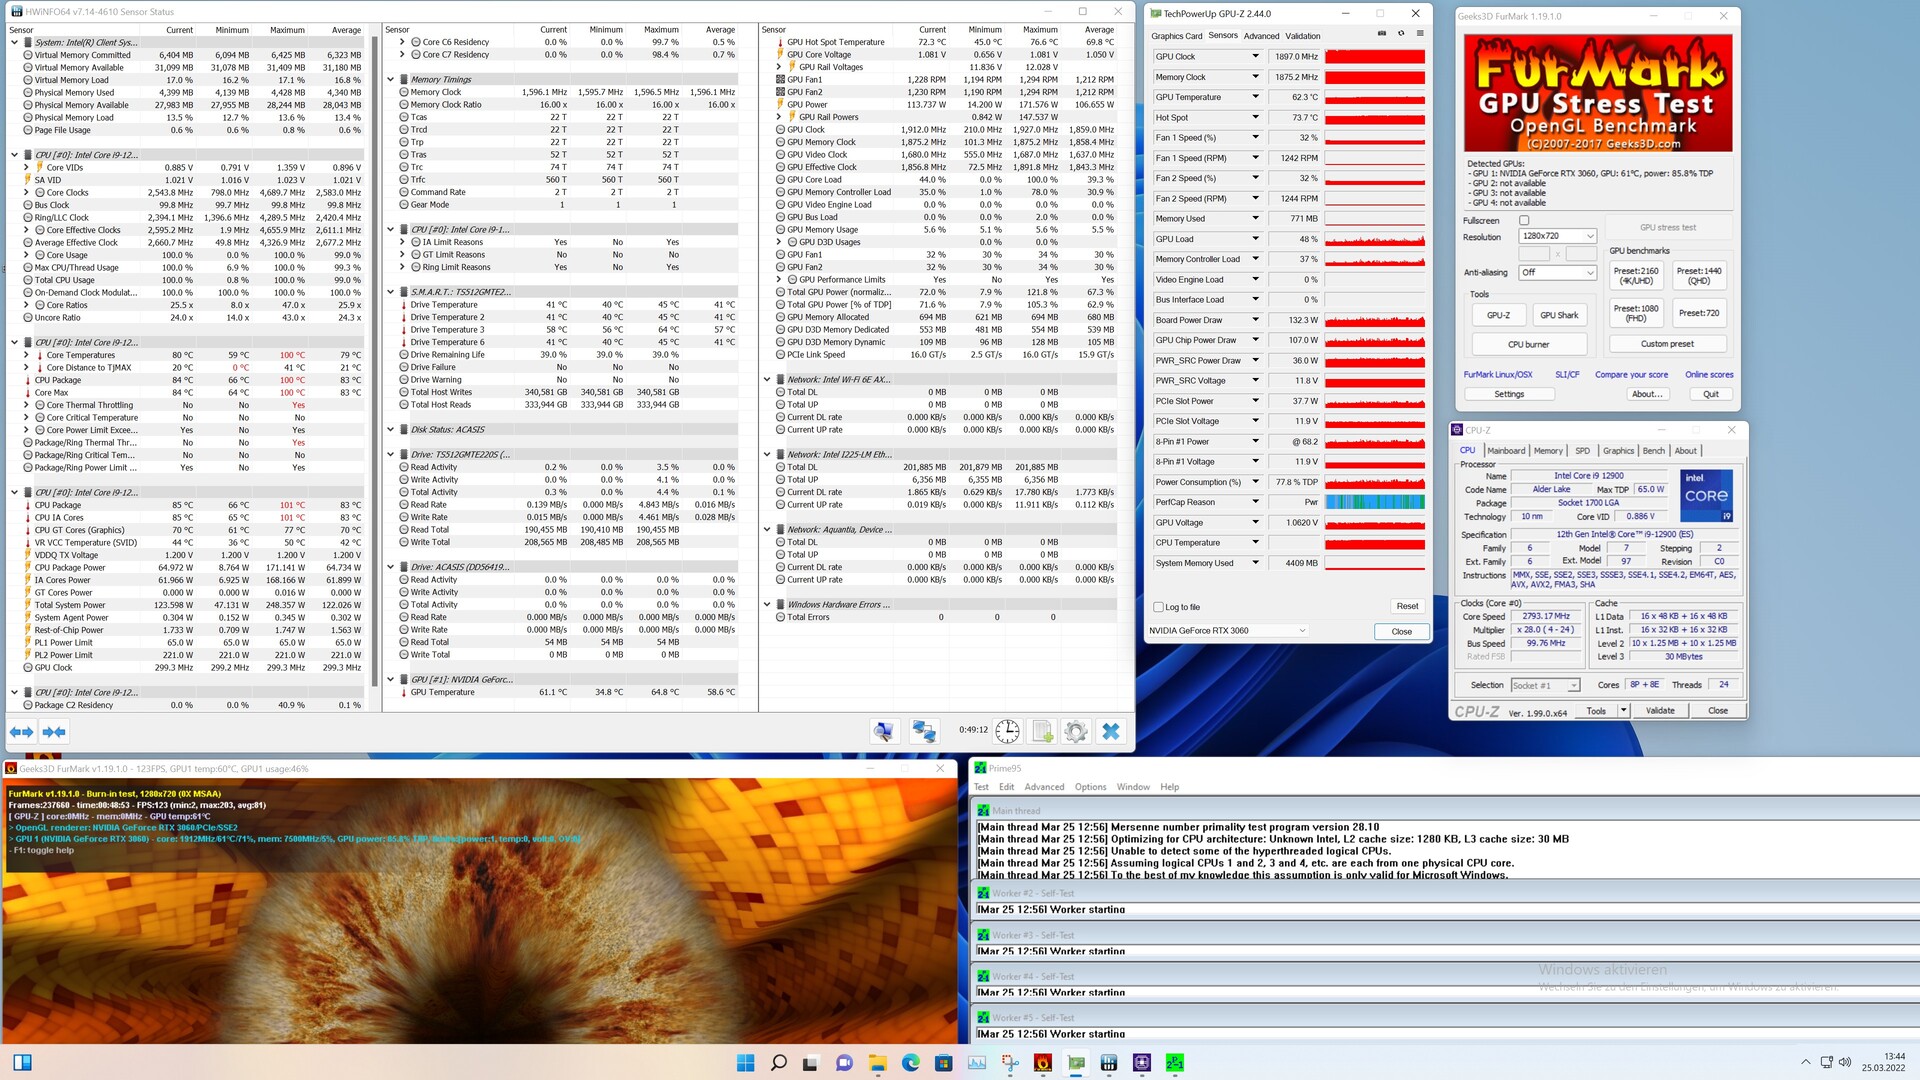
No Kit Extremo Intel NUC 12, o Intel Core i9-12900 traz um consumo de energia significativamente maior em comparação com o Kit Extremo Intel NUC 11. Devido ao maior TDP do Intel Core i9-12900 em comparação com o Intel Core i9-11900KB isto já era esperado. Em comparação com os dois outros sistemas de Alder Lake que também listamos aqui, o consumo de energia da Intel Dragon Canyon NUC acaba sendo significativamente mais baixo, no entanto. A razão para isto pode ser encontrada facilmente, já que a unidade de resfriamento relativamente pequena atinge rapidamente seus limites com o Intel Core i9-12900 sob carga, de modo que o desempenho do processador tem que ser estrangulado. Sob carga, o limite de temperatura de 100 °C (212°F) é quase sempre atingido rapidamente. No teste de estresse com Prime95, o limite de temperatura já é atingido após alguns segundos. Entretanto, o Intel Core i9-12900 ainda funciona a quase 2,6 GHz em média, o que ainda é ligeiramente mais que a velocidade básica do relógio (2,4 GHz). Devemos também mencionar que o limite de temperatura só é atingido muito brevemente. Em todo o teste, a temperatura média se situa em 78 °C (172°F), o que é um valor razoável em geral. Também vemos uma imagem semelhante durante a carga simultânea da CPU e GPU
A construção compacta traz uma grande desvantagem. A Intel Beast Canyon NUC já podia ser ouvida claramente sob carga. A Intel faz um trabalho um pouco melhor com o Dragon Canyon NUC, embora isso também seja claramente audível a 45,1 dB(A) sob carga total. Mas durante a operação ociosa ou sob carga baixa, o sistema permanece silencioso na maior parte do tempo. Só ouvimos a rotação dos ventiladores de vez em quando, mas devido a sua baixa freqüência o ruído dos ventiladores é relativamente confortável.
Barulho
| Ocioso |
| 30.2 / 30.4 / 30.8 dB |
| Carga |
| / 45.1 dB |
 | ||
30 dB silencioso 40 dB(A) audível 50 dB(A) ruidosamente alto |
||
min: | ||
| Power Consumption | |
| 1920x1080 The Witcher 3 ultra (external Monitor) | |
| Intel Core i9-12900K (Idle: 70.5 W) | |
| AMD Ryzen 9 3950X (Idle: 95 W) | |
| Intel Core i7-12700K (Idle: 81 W) | |
| Intel Core i9-10900K (Idle: 52.3 W) | |
| Intel Core i5-10600K (Idle: 52.2 W) | |
| Corsair One i160 (Idle: 51.5 W) | |
| Intel Dragon Canyon NUC - RTX 3060 | |
| Intel Ghost Canyon NUC (RTX 2070) (Idle: 33.1 W) | |
| Intel Beast Canyon NUC (Idle: 32 W) | |
| Prime95 V2810 Stress (external Monitor) | |
| Intel Core i7-12700K (Idle: 81 W) | |
| Intel Core i9-12900K (Idle: 70.5 W) | |
| Intel Core i9-10900K (Idle: 52.3 W) | |
| Intel Core i5-10600K (Idle: 52.2 W) | |
| AMD Ryzen 9 3950X (Idle: 95 W) | |
| Intel Dragon Canyon NUC - RTX 3060 | |
| Intel Beast Canyon NUC (Idle: 34 W) | |
| Intel Ghost Canyon NUC (RTX 2070) (Idle: 33.1 W) | |
| Cinebench R15 Multi (external Monitor) | |
| Intel Core i9-12900K (Idle: 70.5 W) | |
| Intel Core i7-12700K (Idle: 81 W) | |
| Intel Core i9-10900K (Idle: 52.3 W) | |
| AMD Ryzen 9 3950X (Idle: 95 W) | |
| Intel Dragon Canyon NUC - RTX 3060 | |
| Intel Core i5-10600K (Idle: 52.2 W) | |
| Intel Beast Canyon NUC (Idle: 32 W) | |
| Temperatures - CPU Temperature Prime95 | |
| Intel Dragon Canyon NUC - RTX 3060 | |
| Intel Core i9-10900K | |
| AMD Ryzen 9 3950X | |
| Intel Core i5-10600K | |
* ... menor é melhor
Pro
Contra
Veredicto - Um cavalo de batalha compacto
O Intel NUC 12 Dragon Canyon é uma pequena atualização do Intel NUC 11 Extreme Kit, também conhecido como Beast Canyon. Com a nova CPU Alder Lake, a Intel realiza alguma manutenção do produto, aposentando o antigo processador Tiger Lake. Além disso, há pela primeira vez uma CPU socketed no Elemento de Computação, permitindo o uso de diferentes processadores. Em termos de desempenho puro, o que o Intel Core i9-12900 é capaz de fornecer é ligeiramente melhor do que o Intel Core i9-11900KB. Ao mesmo tempo, a construção compacta oferece apenas um espaço limitado para o resfriamento adequado. Sob carga, que atinge seus limites muito rapidamente com um Intel Core i9-12900 não acionado, fazendo com que ele atinja repetidamente o limite de temperatura.
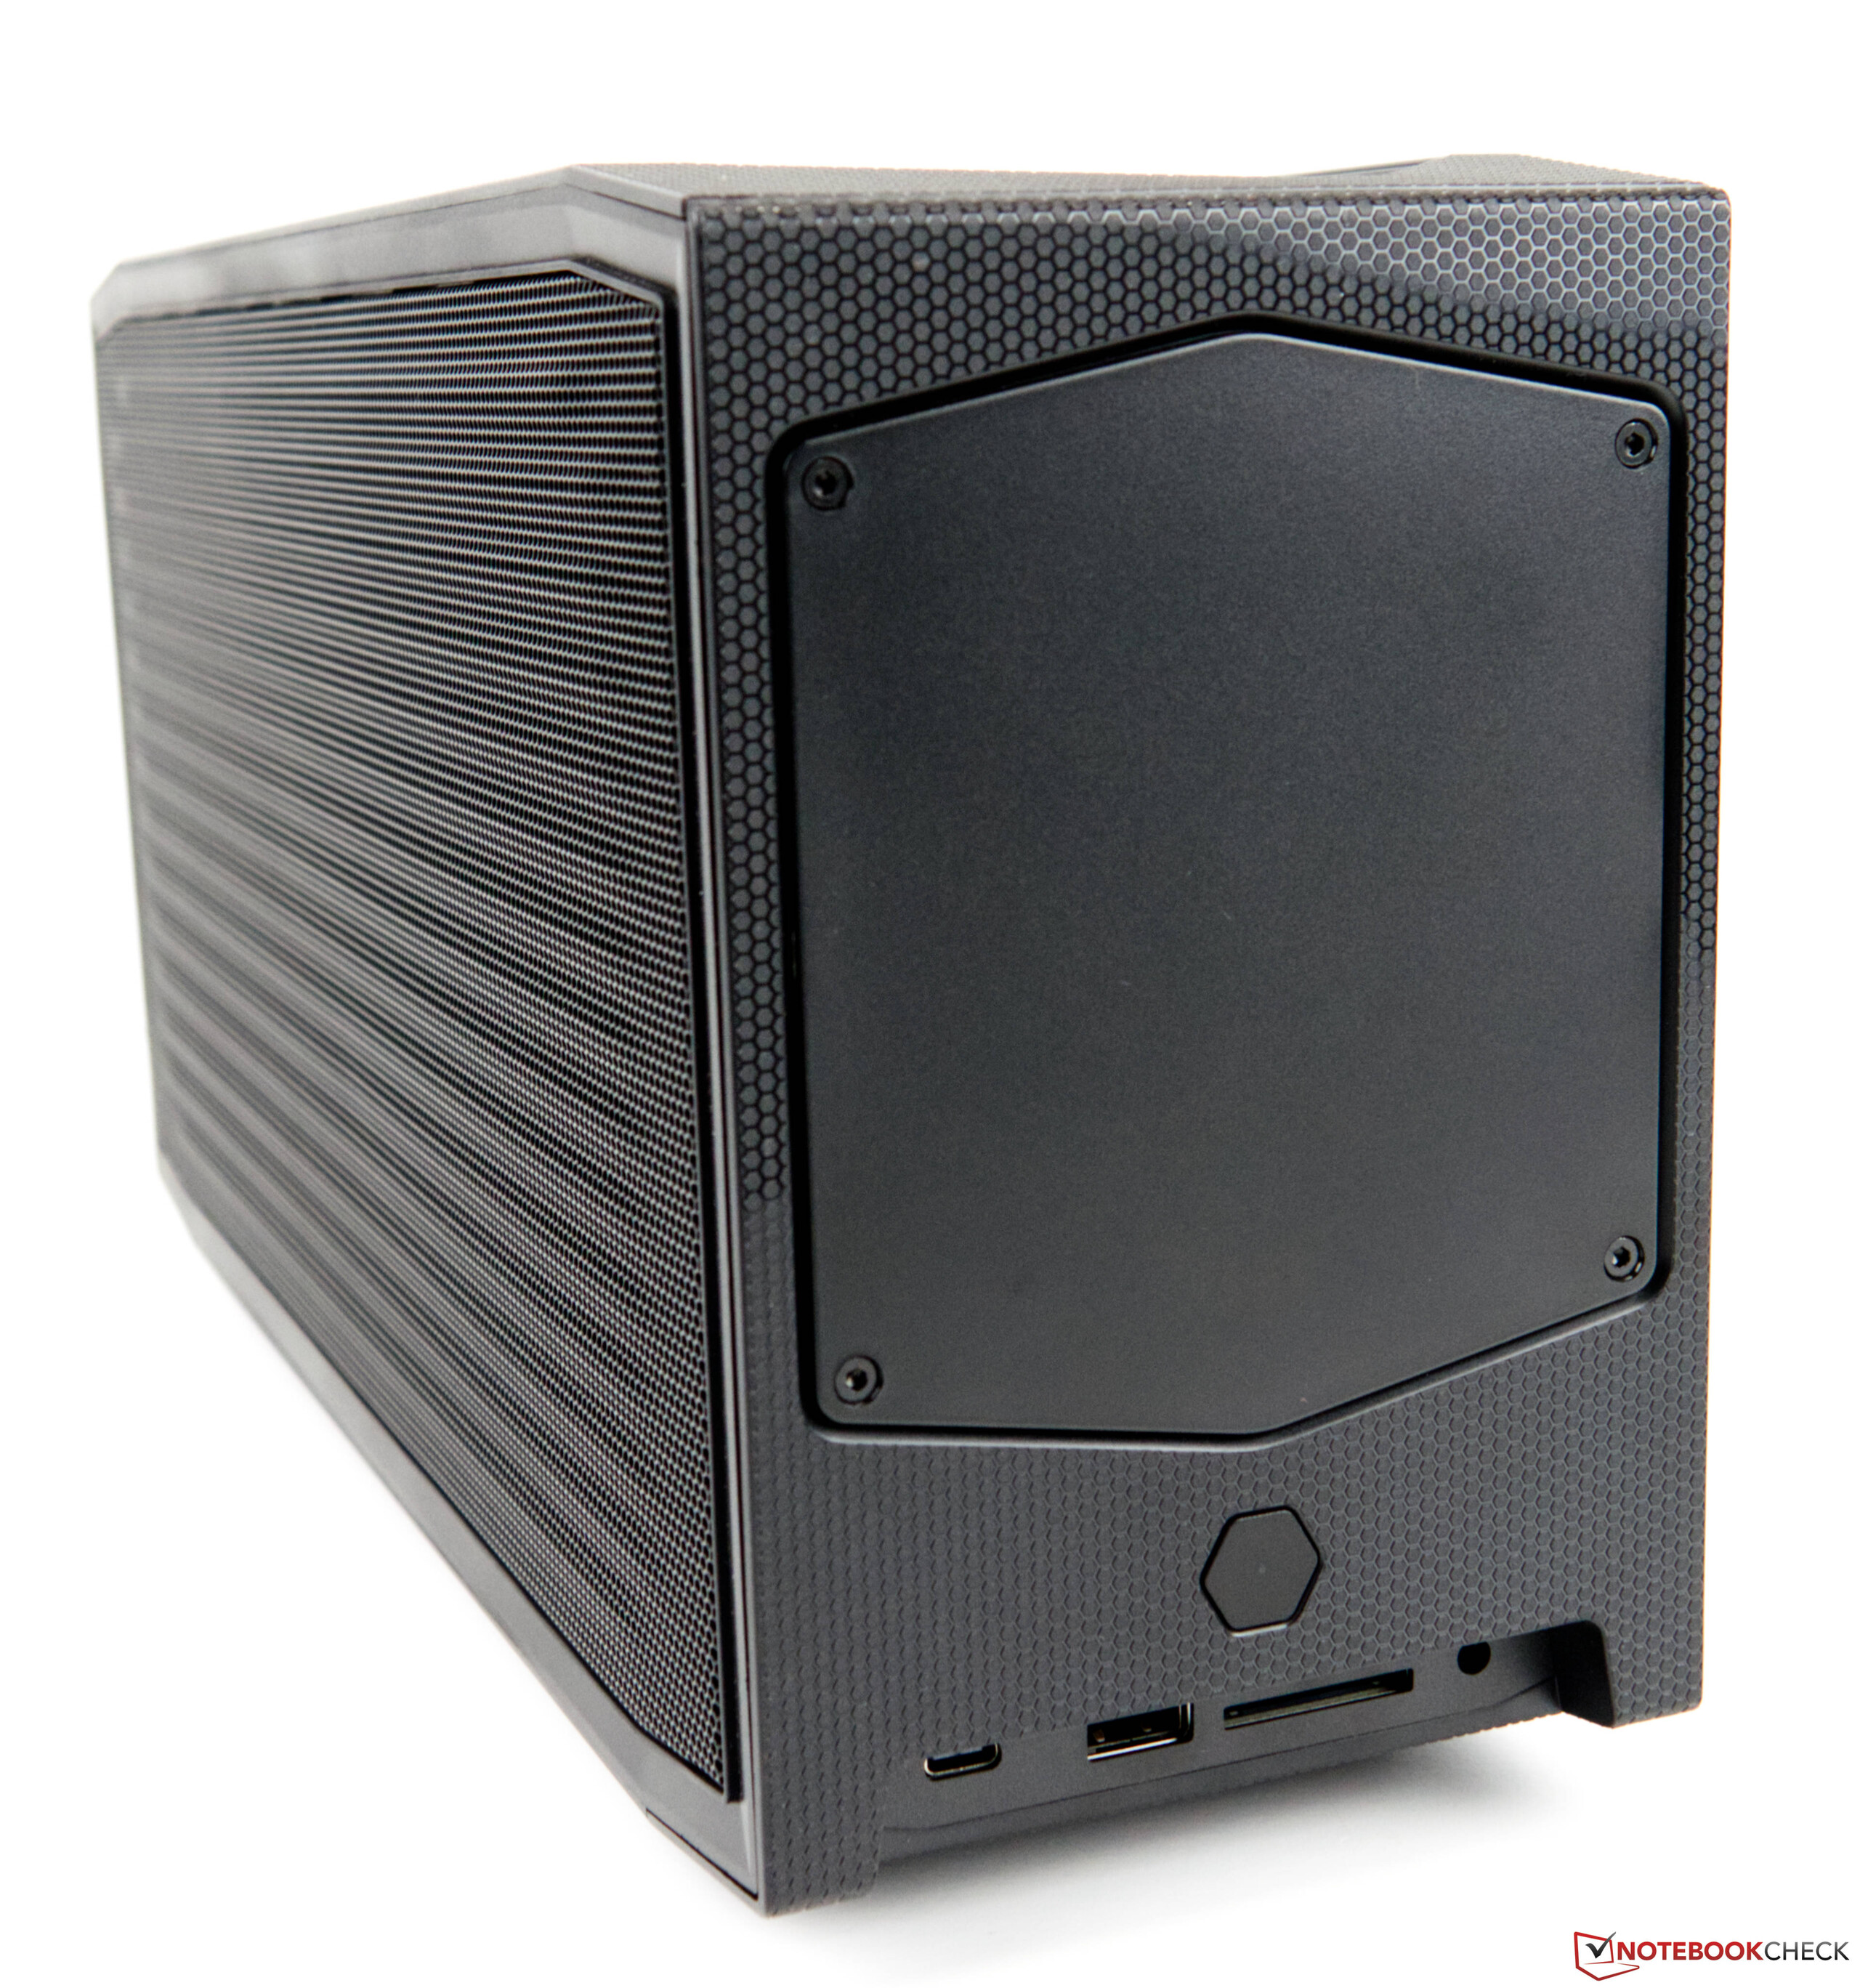
Neste ponto, o preço de compra do sistema de barebone é de 1450 euros (~$1585). Se você incluir o resto dos componentes como RAM, SSD e GPU, o Intel NUC 12 Dragon Canyon não é muito mais caro do que outros sistemas completos. Isto coloca o ônus da escolha para o cliente. Se você gosta do design do Intel NUC 12 Dragon Canyon, você pode escolhê-lo sem nenhum aviso, a variedade de conexões faz dele uma prova de futuro e seu número também é suficiente. Há até mesmo um leitor de cartões SD rápido que suporta o padrão UHS-II.
Com o Intel NUC 12 Extreme Kit, também conhecido como Dragon Canyon, a Intel eleva novamente a fasquia para seus dispositivoscompactosem termos de desempenho
.
Finalmente, ainda precisamos responder à pergunta que fizemos no início. A julgar puramente pelo seu aspecto, preferimos considerar o Intel NUC 12 Dragon Canyon como estando no segmento de jogos. Devido ao desempenho do processador Alder Lake e do iGPU, o sistema também é adequado como um PC de escritório de alto nível. Ao mesmo tempo, você também tem a opção de inserir uma placa gráfica profissional, o que transforma o sistema em uma estação de trabalho completa. Você pode então também usar facilmente o pequeno Intel NUC Dragon Canyon para algum processamento de imagem e vídeo
A alternativa para o Intel NUC 12 Extreme Kit Dragon Canyon seria construir um sistema você mesmo, o que provavelmente custaria aproximadamente o mesmo. Com o Zotac Magnus One há também uma boa alternativa se você quiser um PC de jogo muito compacto.

