Análise da Gigabyte GeForce RTX 4080 Super Gaming OC 16G: Troca de lugar com a RX 7900 XTX por US$ 200 a menos do que a RTX 4080 não-Super

Até o momento, analisamos várias novas GPUs da série RTX 40 Super, incluindo a RTX 4070 Super Founders Edition, Gigabyte RTX 4070 Super Gaming OCe a Asus TUF Gaming RTX 4070 Ti Super.
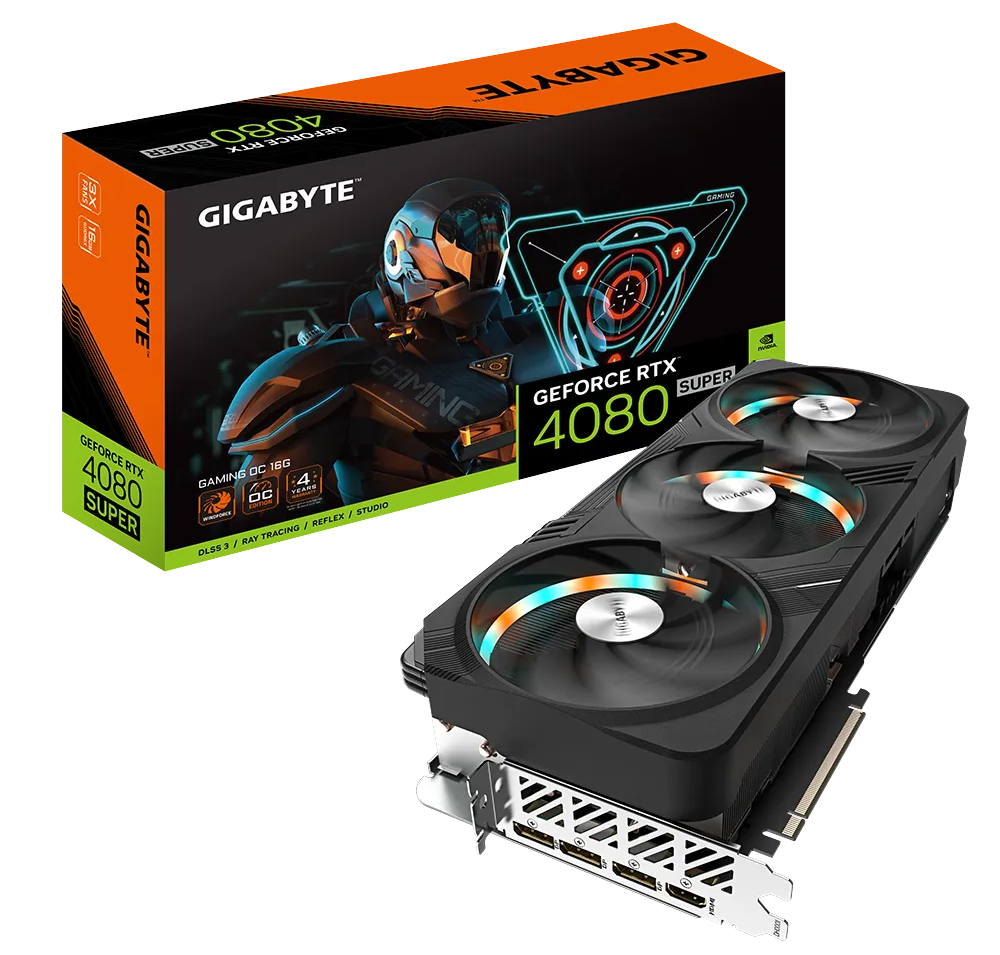
Agora, temos conosco o Gigabyte GeForce RTX 4080 Super Gaming OC 16G - uma atualização no meio do ciclo de vida que substitui totalmente o RTX 4080 anterior.
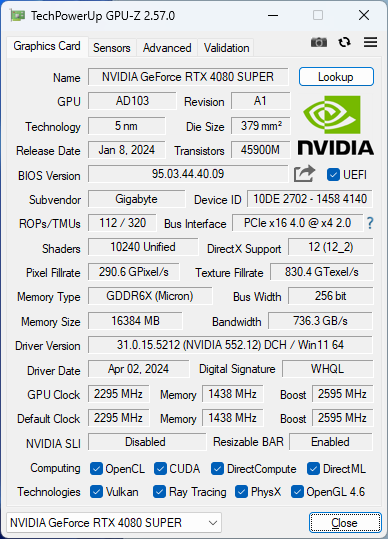
Enquanto a RTX 4080 original apresentava 9.728 núcleos CUDA, a nova RTX 4080 Super maximiza totalmente a matriz AD103, com todos os 10.240 núcleos CUDA funcionando em sua capacidade total. Isso representa um aumento de apenas 5% na contagem de shaders, o que não é muito impressionante, ao contrário do RTX 4070 Super (+21%) e do RTX 4070 Super Ti (+10%). A VRAM permanece a mesma, com 16 GB GDDR6X, mas a largura de banda geral aumenta ligeiramente para 736,3 GB/s em comparação com os 716,8 GB/s do RTX 4080 não Super.
A RTX 4080 Super é vendida a US$ 1.000 MSRP em comparação com o preço pedido de US$ 200 mais alto da original. A versão da Gigabyte para a RTX 4080 Super acrescenta algumas vantagens extras por um prêmio nominal de US$ 50, a US$ 1.050 MSRP.
Na Índia, essa GPU pode ser adquirida na faixa de ₹1.20.000 a ₹1.28.000, dependendo do varejista, e vem com uma garantia padrão de três anos, prorrogável por mais um ano.
Nesta análise, vamos dar uma olhada na Gigabyte RTX 4080 Super Gaming OC e ver se os supostos ganhos de desempenho e o preço são razoáveis, especialmente com o lançamento da Blackwell previsto para o final deste ano.
Comparação da Gigabyte GeForce RTX 4080 Super Gaming OC 16G com outras GPUs da Nvidia
| Especificação | RTX 4090 FE | Gigabyte RTX 4080 Super Gaming OC | RTX 4080 FE | Asus TUF RTX 4070 Ti Super | RTX 4070 Super FE | ZotacRTX 4070 AMP Airo | KFA2RTX 4060 Ti EX | RTX 3090 Ti FE | RTX 3090 FE | RTX 3080 Ti FE | RTX 3070 FE | Titan RTX |
|---|---|---|---|---|---|---|---|---|---|---|---|---|
| Chip | AD102 | AD103 | AD103 | AD103 | AD104 | AD104 | AD106 | GA102 | GA102 | GA102 | GA104 | TU102 |
| Processo FinFET | 4N personalizado | 4N personalizado | 4N personalizado | 4N personalizado | 4N personalizado | 4N personalizado | 4N personalizado | 8 nm | 8 nm | 8 nm | 8 nm | 12 nm |
| Núcleos CUDA | 16.384 | 10.240 | 9.728 | 8.448 | 7.168 | 5.888 | 4.352 | 10.752 | 10.496 | 10.240 | 5.888 | 4.608 |
| Unidades de textura | 512 | 320 | 304 | 264 | 224 | 184 | 136 | 336 | 328 | 320 | 184 | 288 |
| Núcleos de tensor | 512 4ª geração | 320 4ª geração | 304 4ª geração | 264 4ª geração | 224 4ª geração | 184 4ª geração | 136 4ª geração | 336 3ª geração | 328 3ª geração | 320 3ª geração | 184 3ª geração | 576 2ª geração |
| RT Cores | 128 3ª Geração | 80 3ª Geração | 76 3ª Geração | 66 3ª Geração | 56 3ª Geração | 46 3ª Geração | 34 3ª Geração | 84 2ª Geração | 82 2ª Geração | 80 2ª Geração | 46 2ª Geração | 72 |
| Relógio base da GPU | 2.235 MHz | 2.295 MHz | 2.205 MHz | 2.340 MHz | 1.980 MHz | 1.920 MHz | 2.310 MHz | 1.560 MHz | 1.395 MHz | 1.365 MHz | 1.500 MHz | 1.350 MHz |
| Relógio de aumento da GPU | 2.520 MHz | 2.595 MHz | 2.505 MHz | 2.610 MHz | 2.475 MHz | 2.535 MHz | 2.535 MHz | 1.860 MHz | 1.695 MHz | 1.665 MHz | 1.750 MHz | 1.770 MHz |
| Barramento de memória | 384-bit | 256-bit | 256-bit | 256-bit | 192-bit | 192-bit | 128-bit | 384-bit | 384-bit | 384-bit | 256-bit | 384-bit |
| Largura de banda da memória | 1.008 GB/s | 736,3 GB/s | 716,8 GB/s | 672 GB/s | 504 GB/s | 504 GB/s | 288 GB/s | 1.008 GB/s | 936 GB/s | 912 GB/s | 448 GB/s | 672 GB/s |
| Memória de vídeo | 24 GB GDDR6X | 16 GB GDDR6X | 16 GB GDDR6X | 16 GB GDDR6X | 12 GB GDDR6X | 12 GB GDDR6X | 8 GB GDDR6 | 24 GB GDDR6X | 24 GB GDDR6X | 12 GB GDDR6X | 8 GB GDDR6 | 24 GB GDDR6 |
| Consumo de energia | 450 W | 320 W | 320 W | 285 W | 220 W | 215 W | 160 W | 450 W | 350 W | 350 W | 220 W | 280 W |
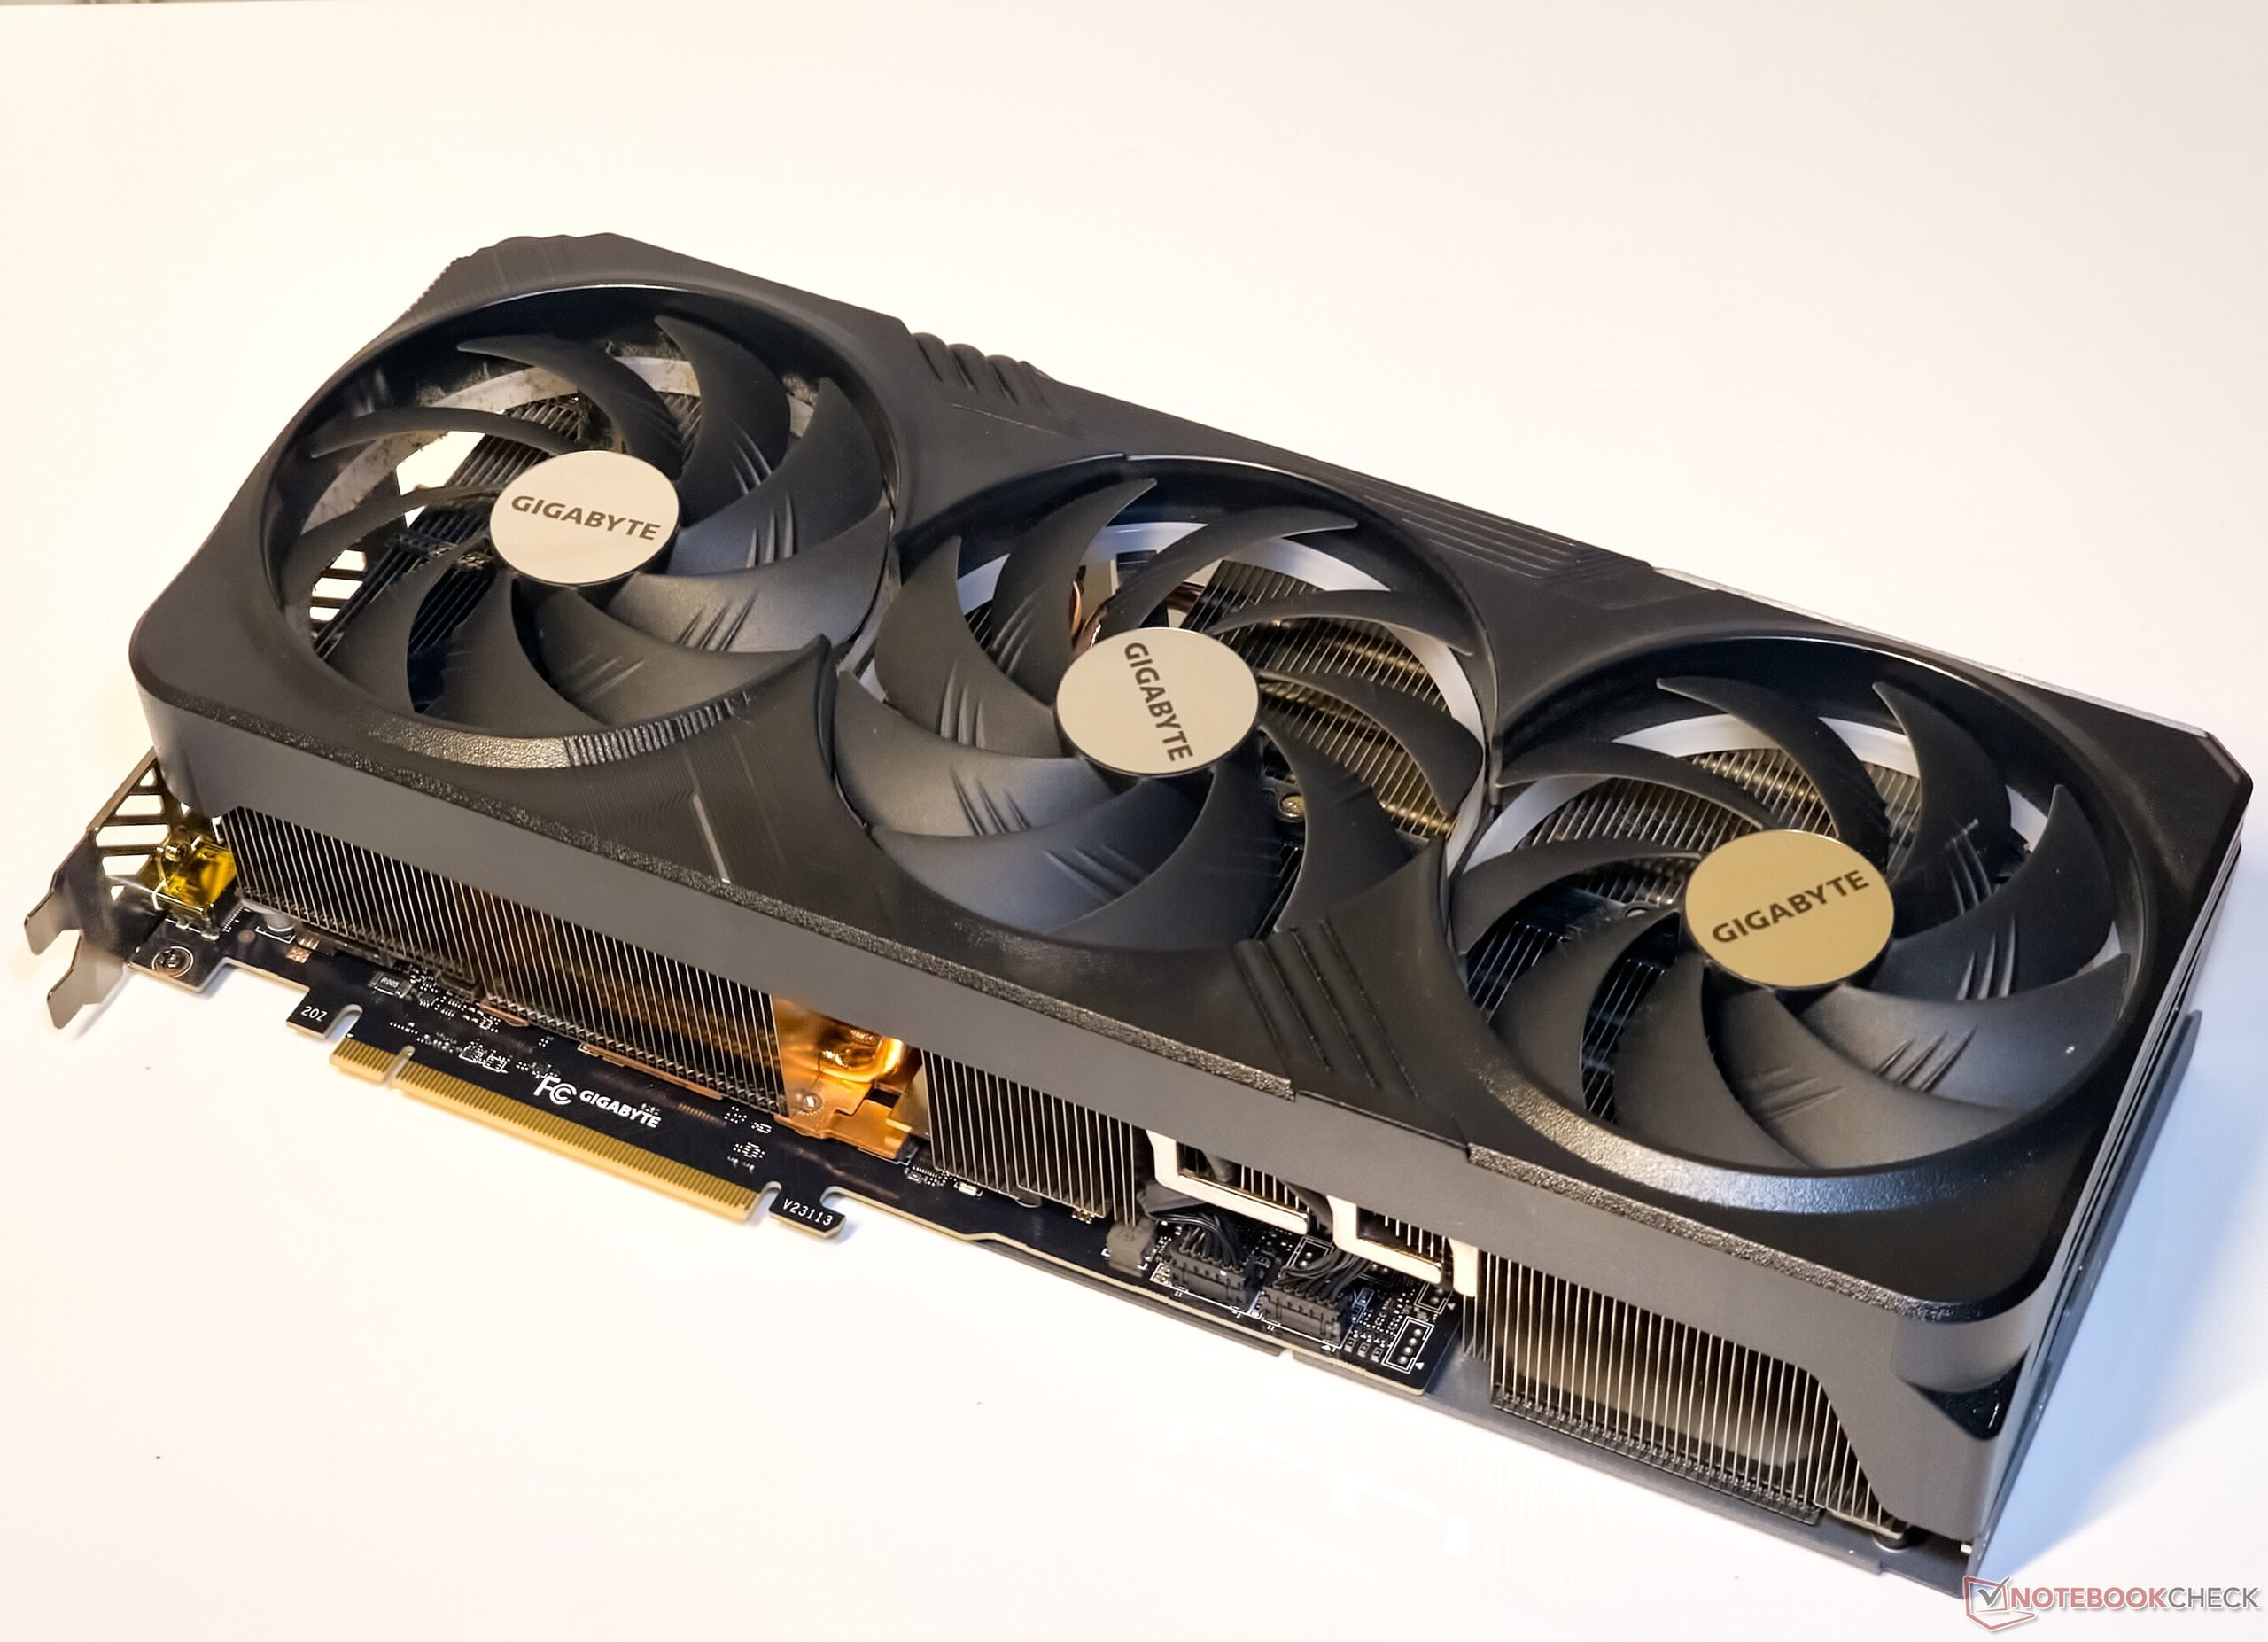
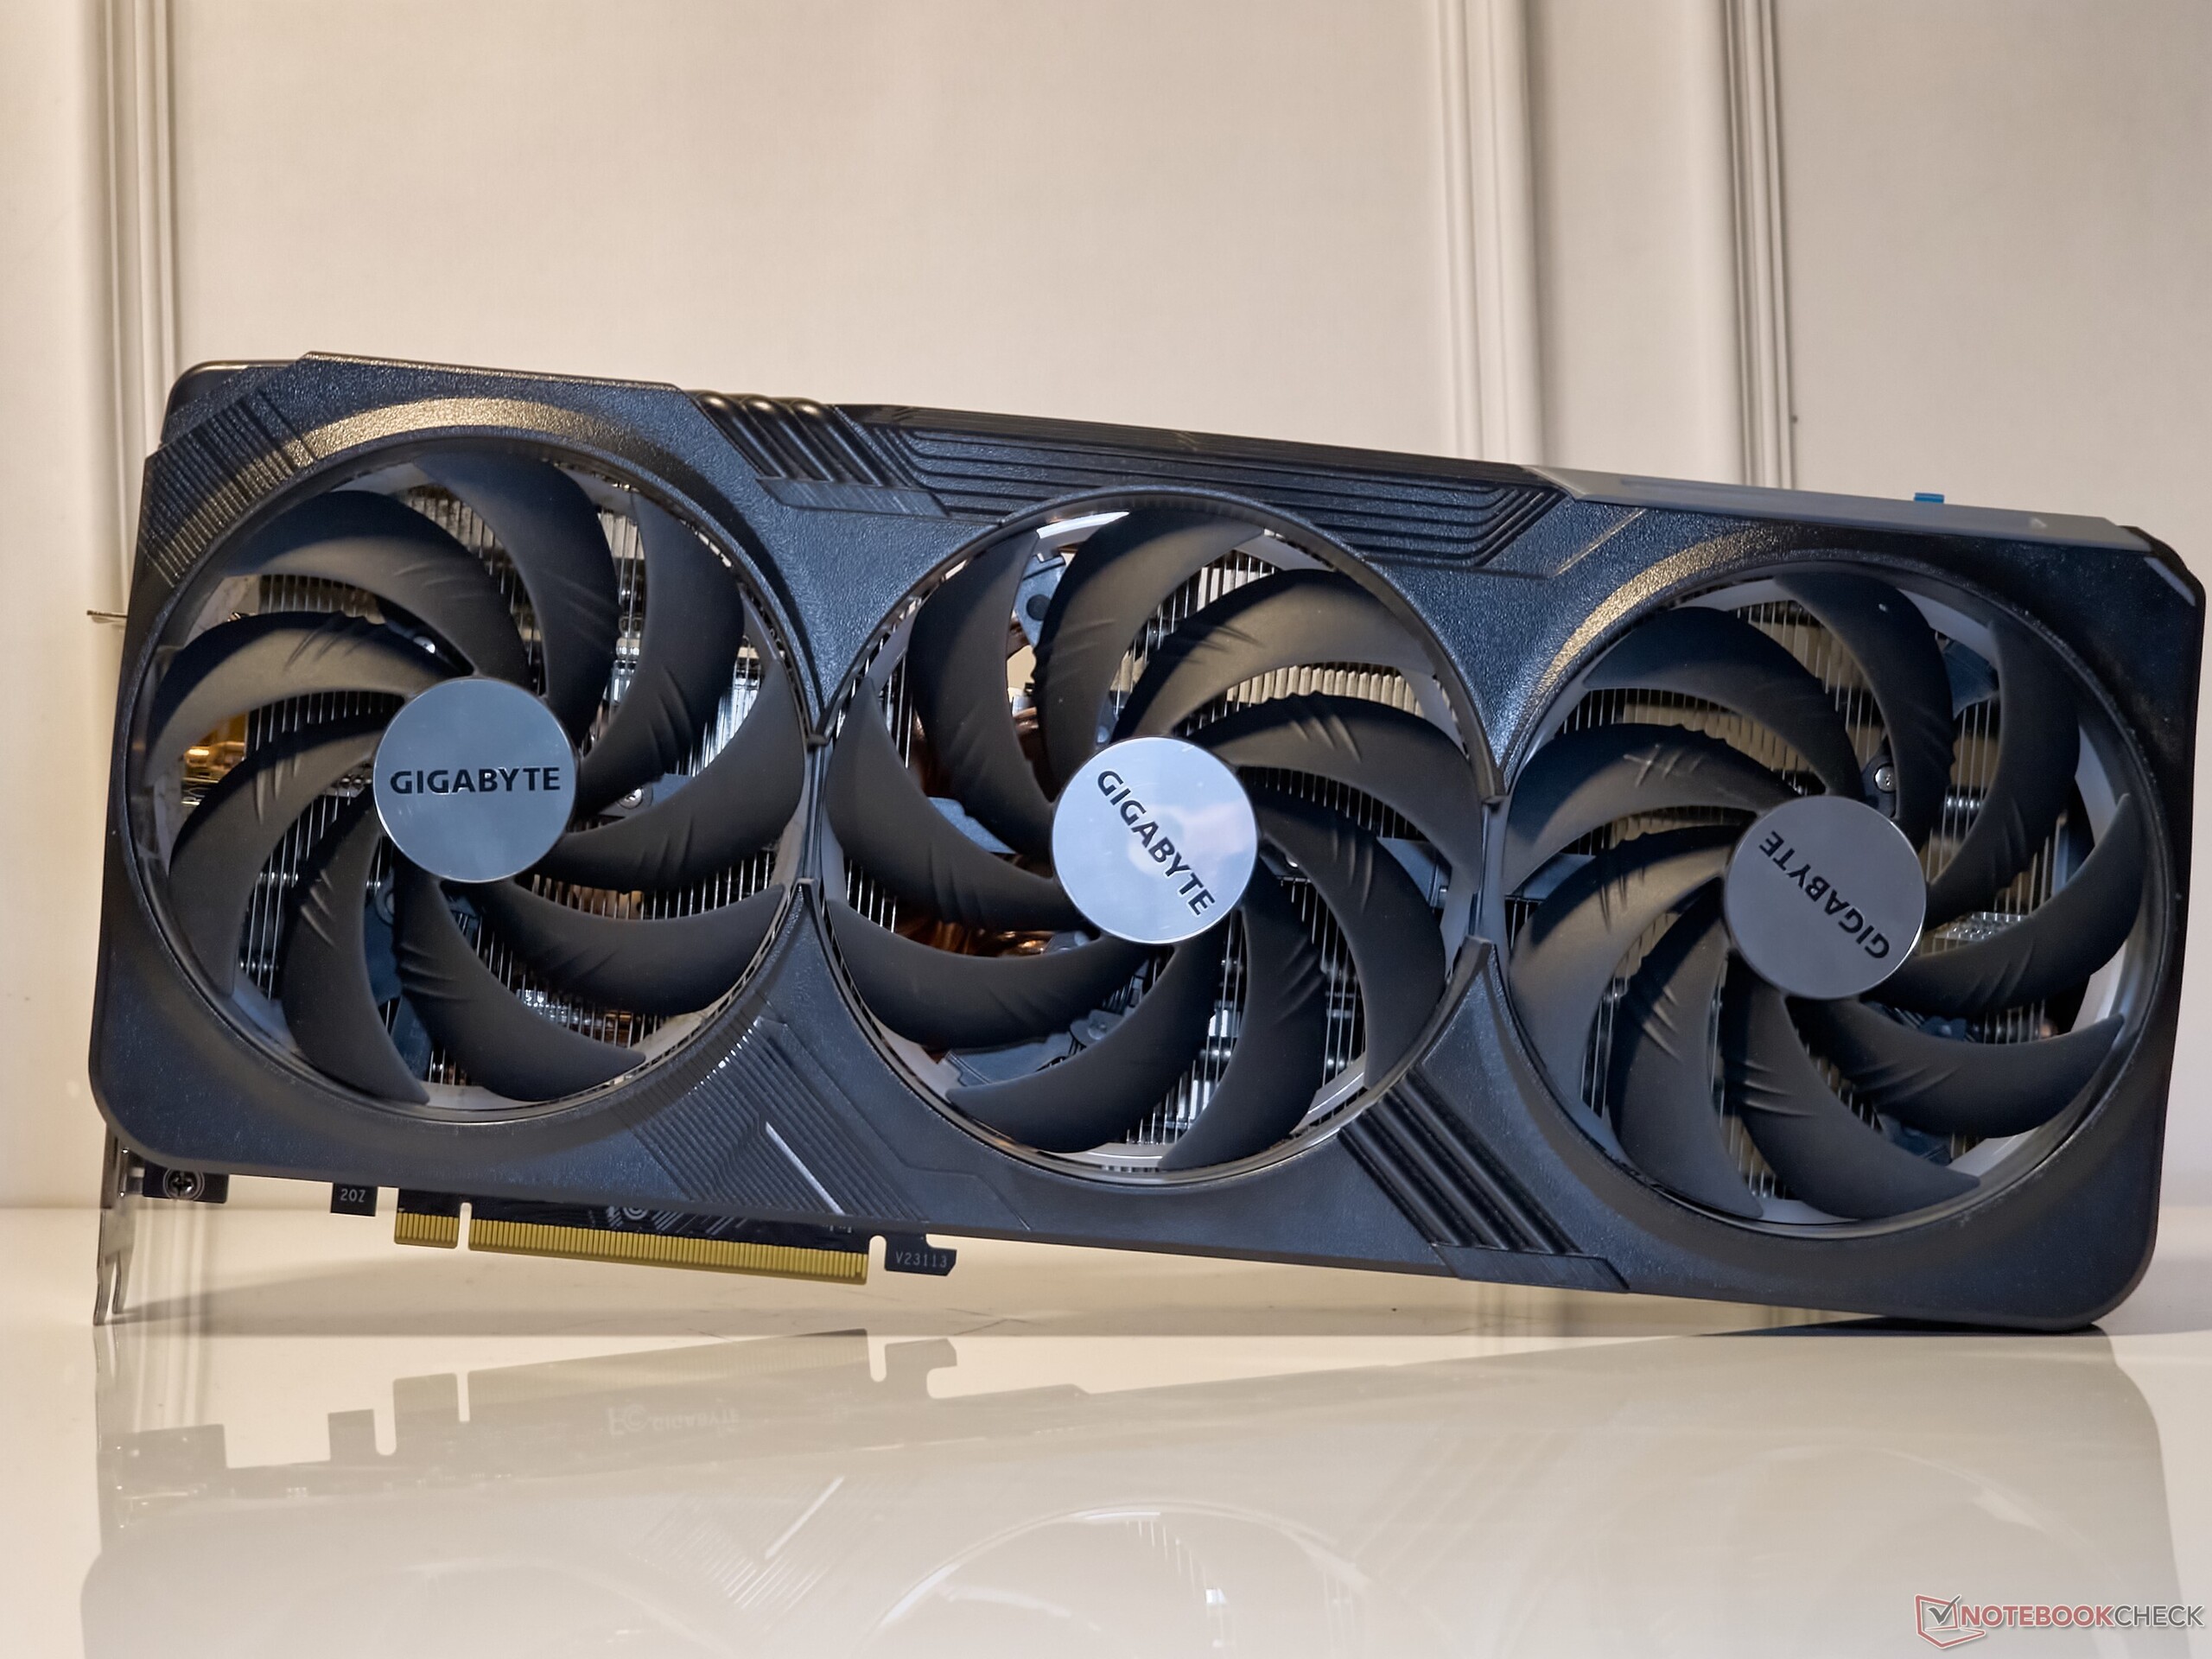
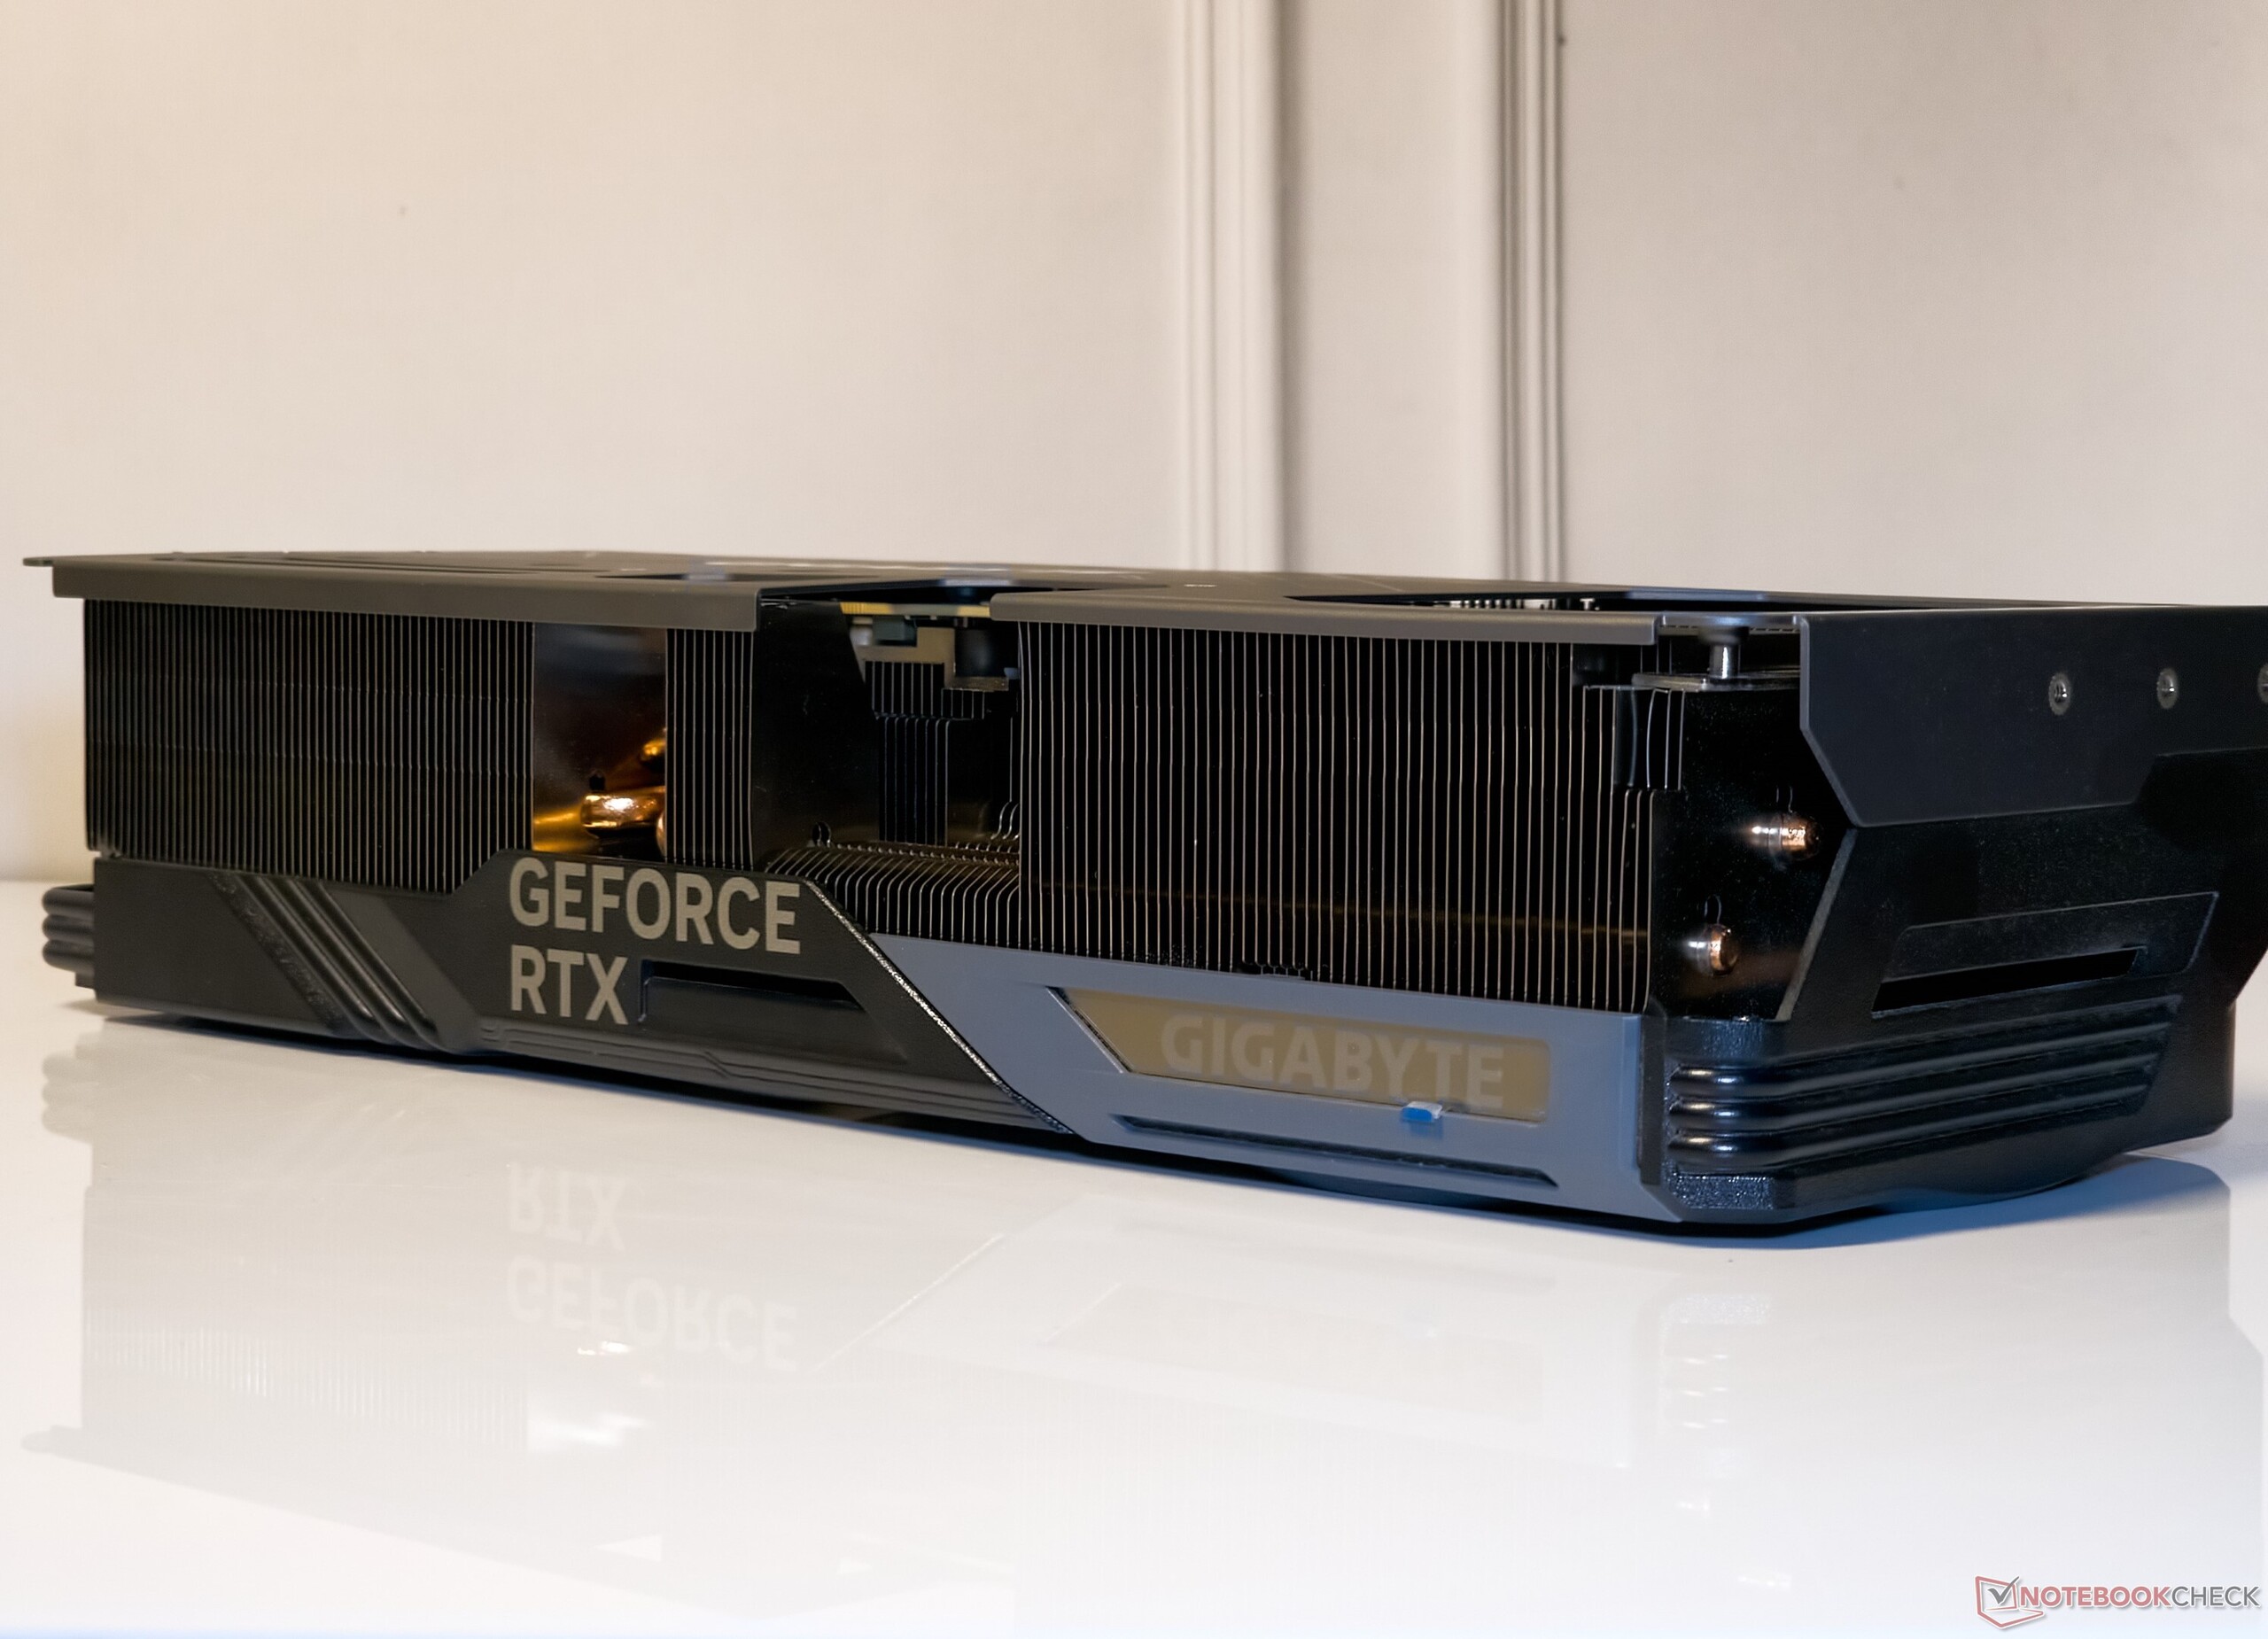
A Gigabyte GeForce RTX 4080 Super Gaming OC de perto
A Gigabyte não alterou o design da RTX 4080 Super Gaming OC 16G em relação à sua antecessora não-Super. Com 342 x 150 x 75 mm e pesando cerca de 1,74 kg, a RTX 4080 Super Gaming OC ocupa quase três slots PCIe na placa, portanto, ela se beneficia de um gabinete maior e de uma placa-mãe E-ATX, de preferência.
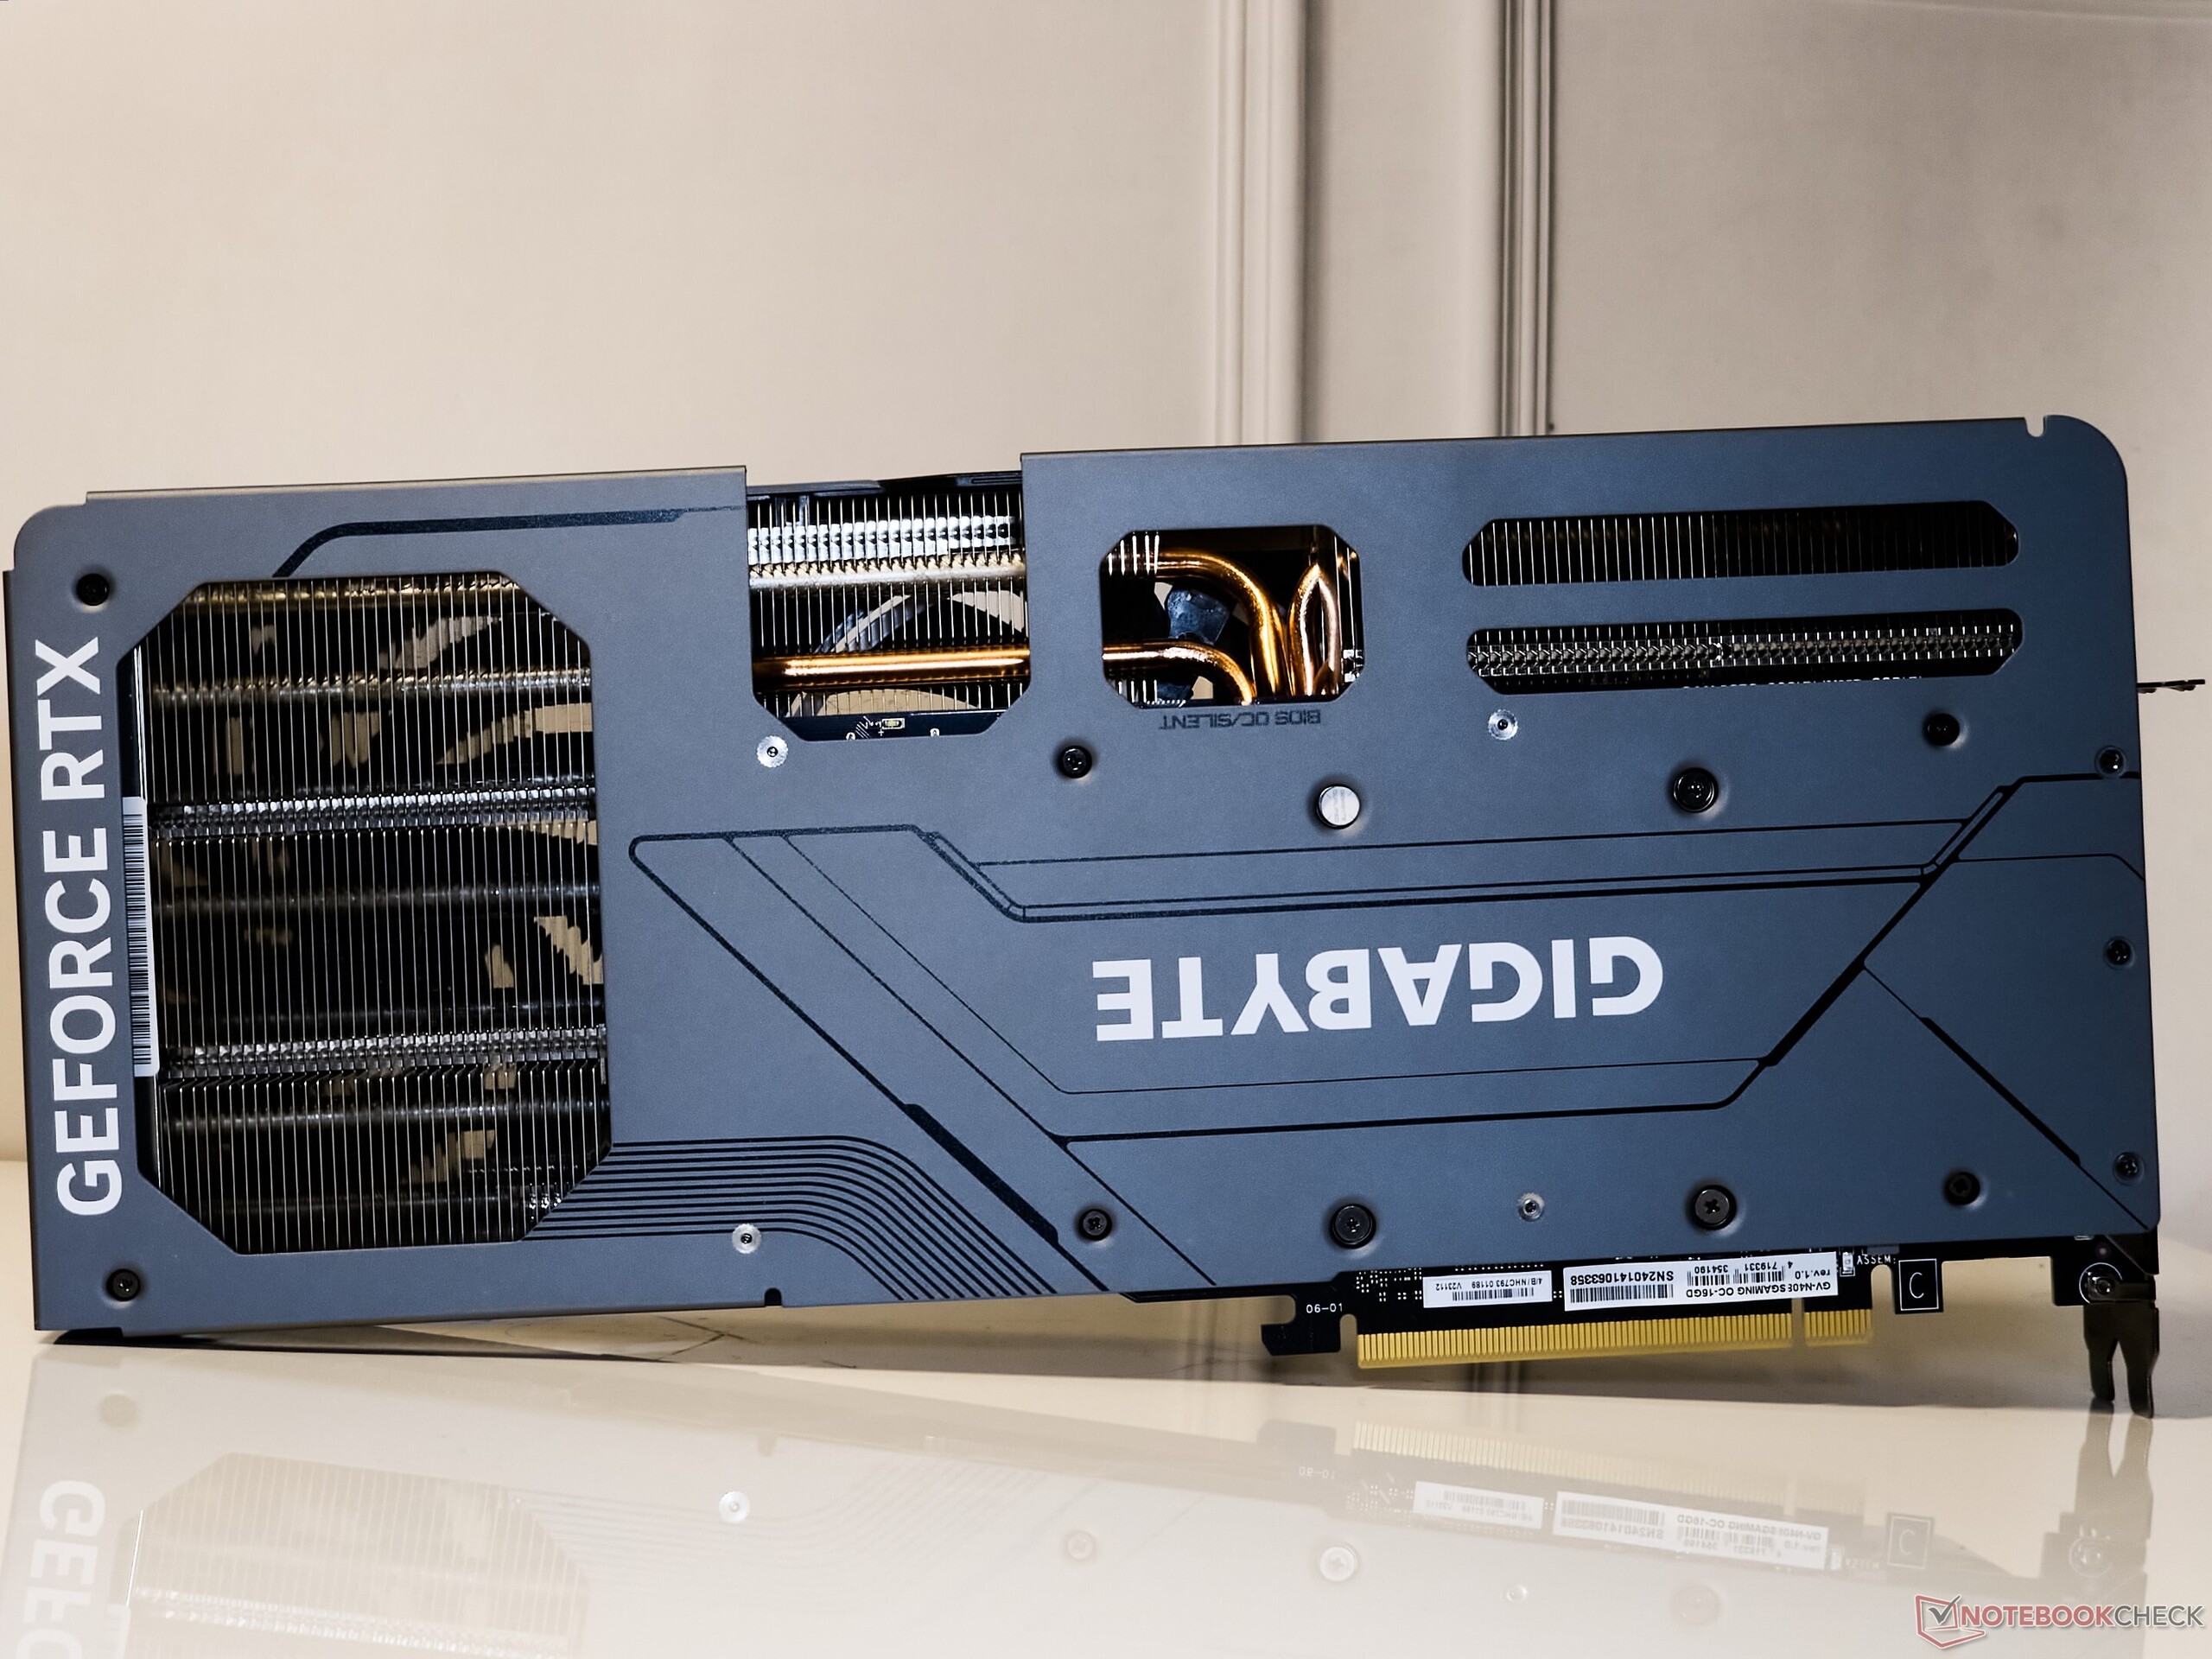
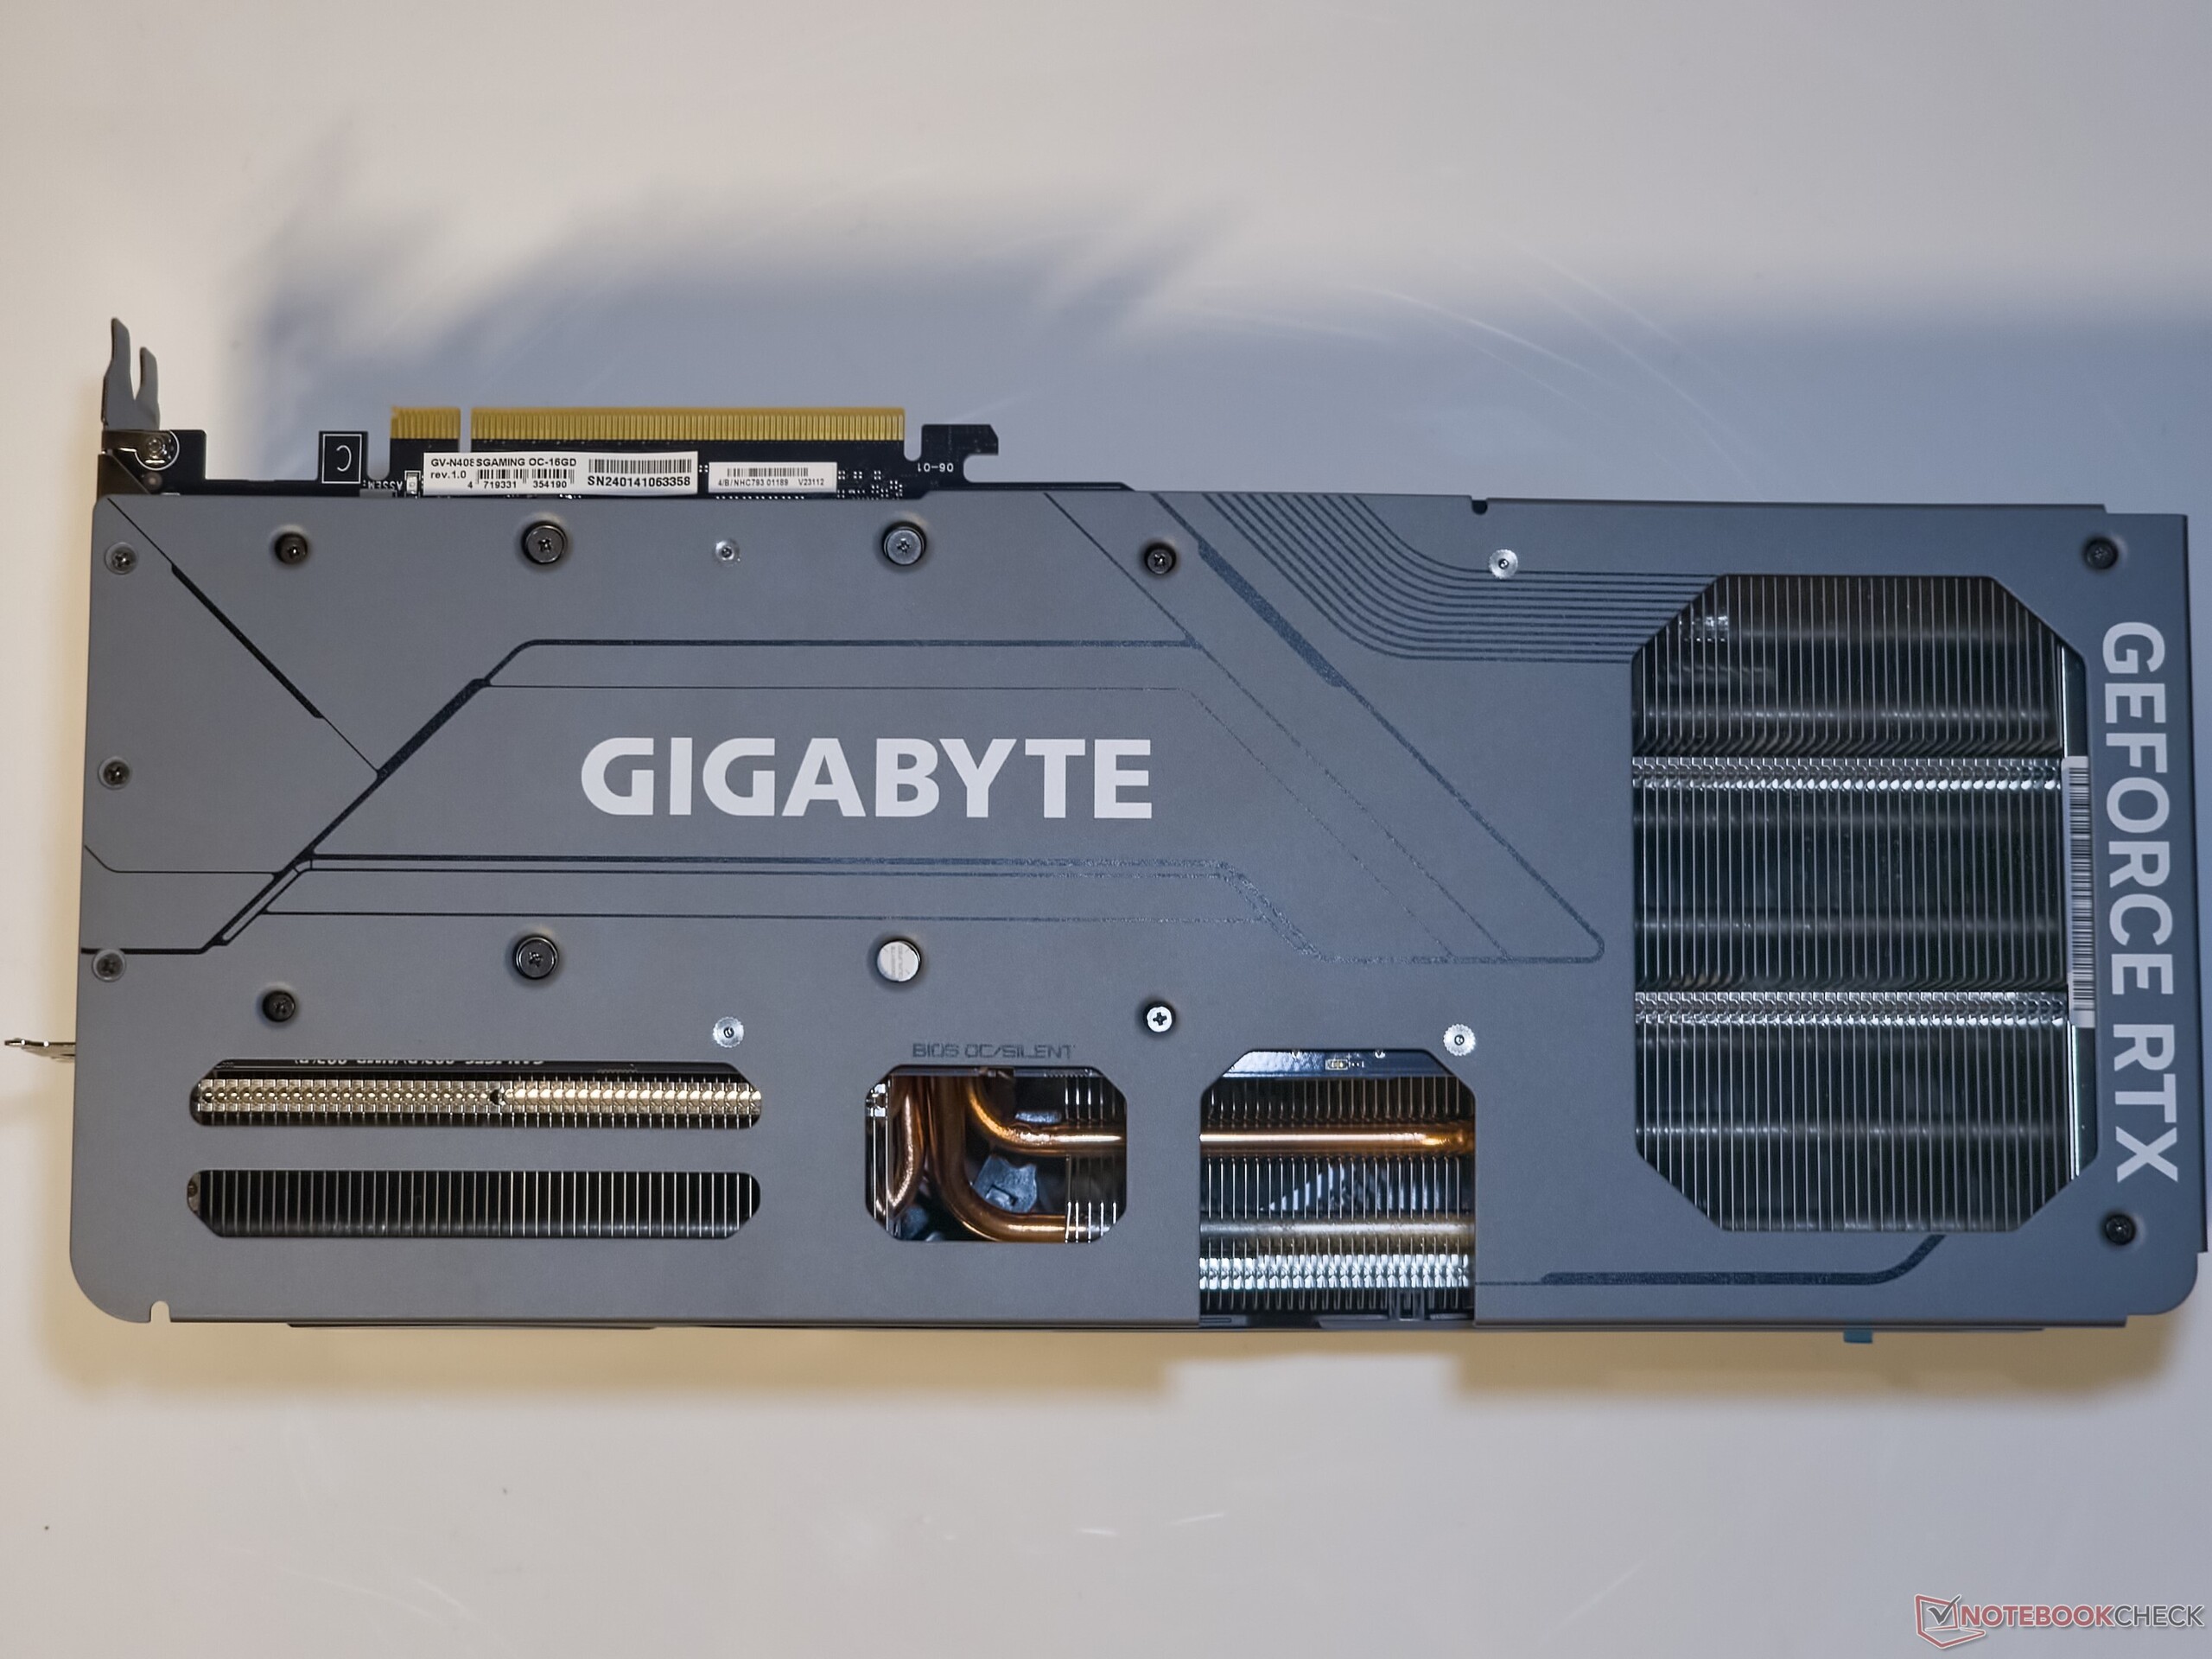
A placa apresenta um invólucro frontal de plástico, mas resistente, e uma placa traseira de metal. Os efeitos RGB são semelhantes aos que vimos com a RTX 4070 Super Gaming OC - um logotipo brilhante da Gigabyte na parte superior e um anel de iluminação ao longo da circunferência de cada ventoinha.
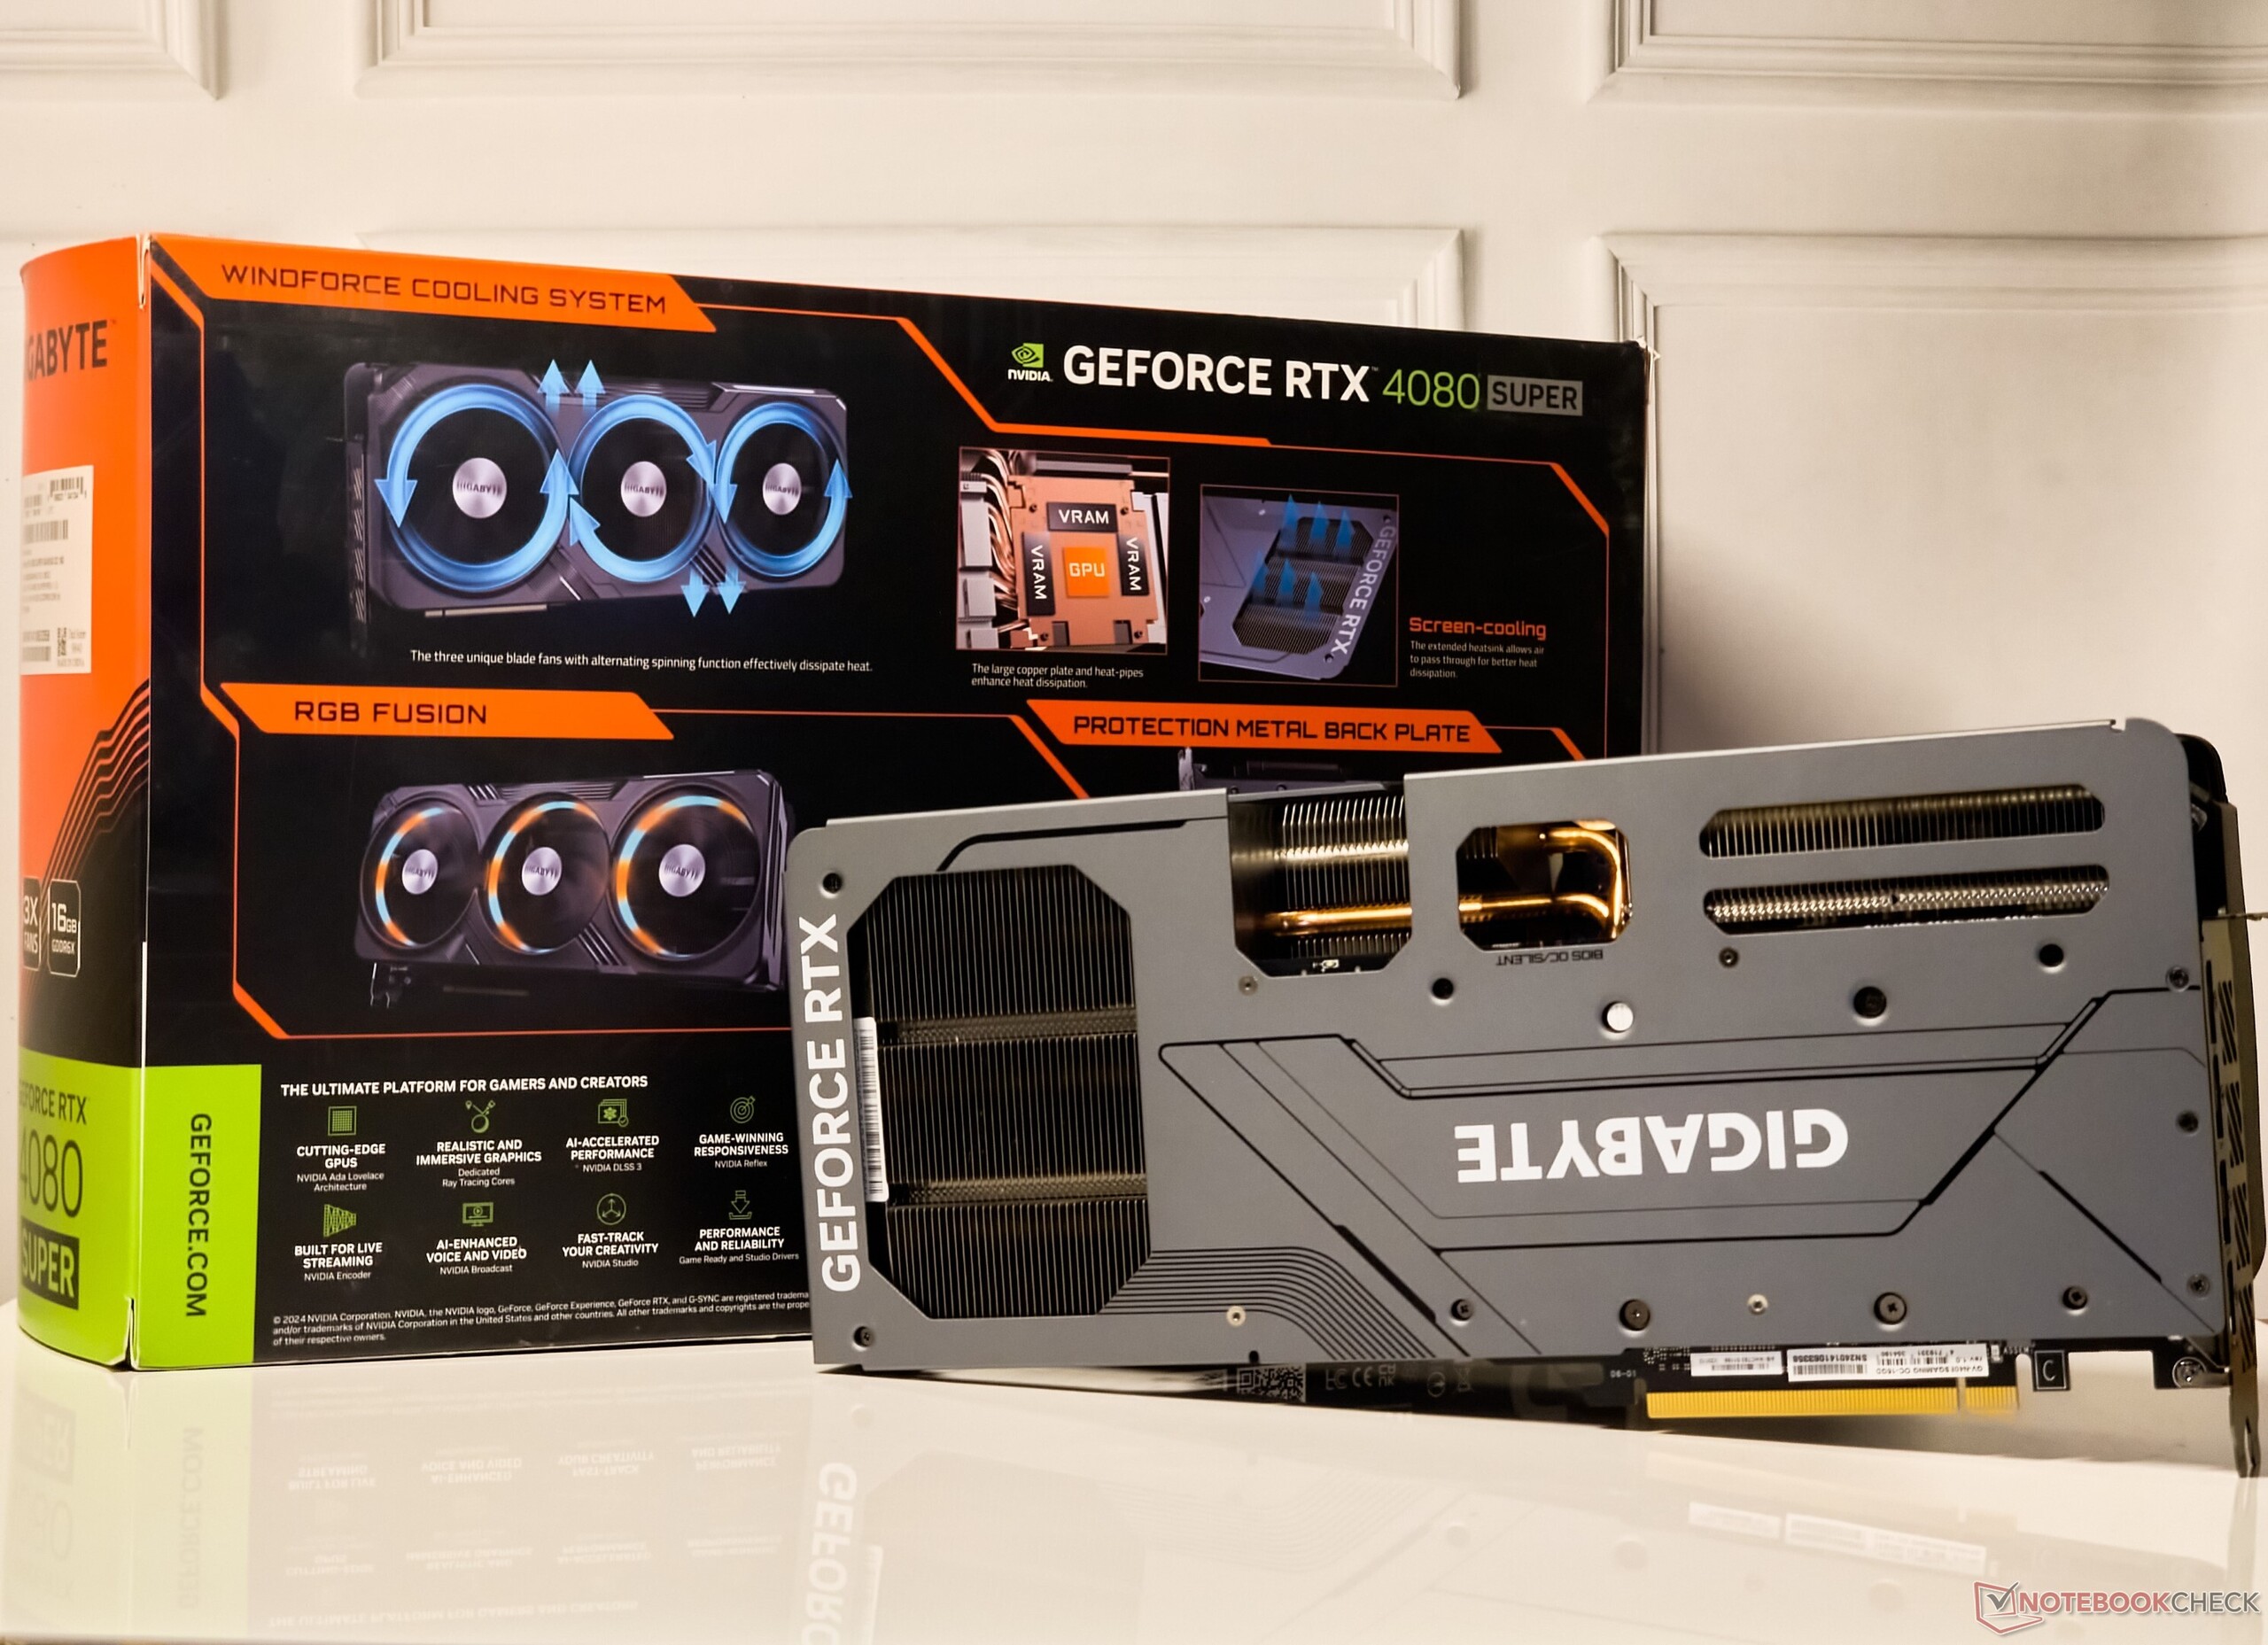
O conteúdo da caixa inclui um guia de início rápido, cartão de garantia, conector de alimentação de 12VHPWR para 3x 8 pinos, suportes de apoio e parafusos.
A RTX 4080 Super Gaming OC oferece o conjunto padrão de portas, incluindo 3 saídas DisplayPort 1.4 e 1 saída HDMI 2.1a.
Como é padrão nas placas Gigabyte, um interruptor dual-BIOS está presente para alternar entre os modos BIOS OC e Silent.
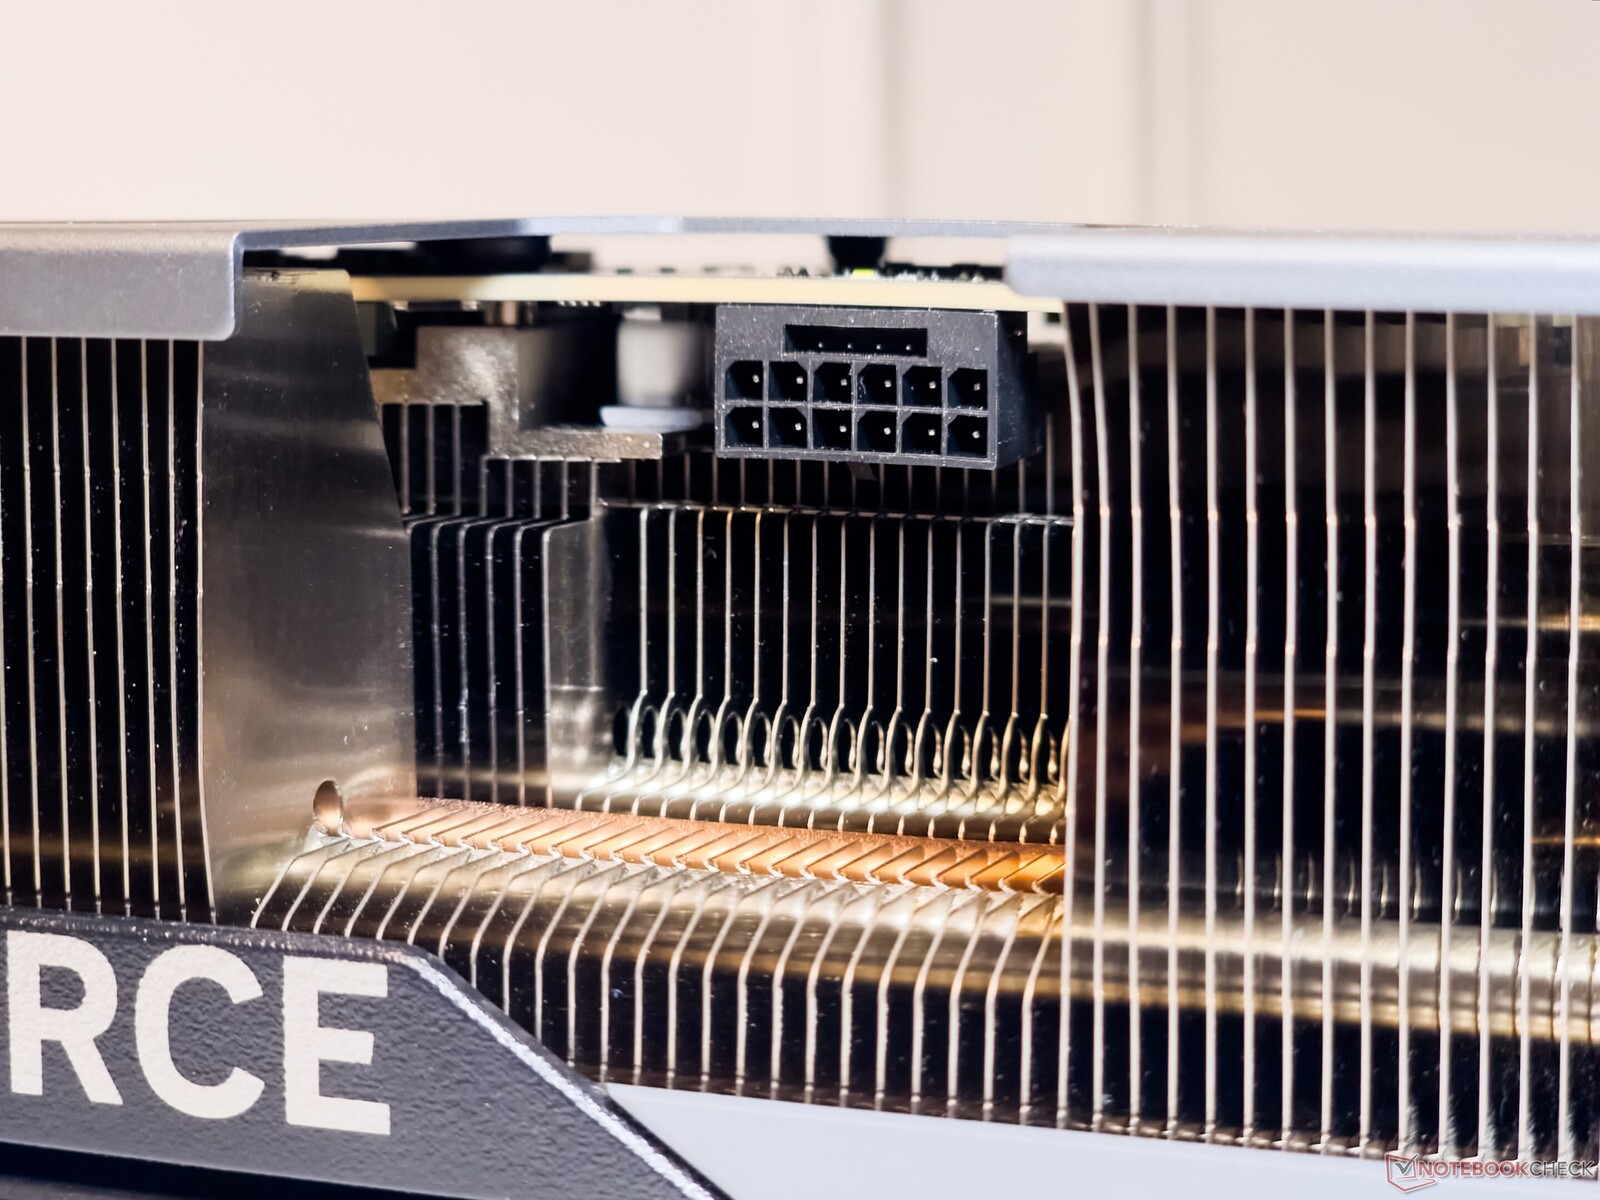
O fornecimento de energia para a GPU é feito pelo conector 12VHPWR, agora padrão. Não tivemos problemas em conseguir um ajuste confortável com o conector PCIe Gen 5 de 16 pinos da PSU. Como medida de precaução, a Gigabyte também fornece um indicador LED que brilha para indicar qualquer problema de conexão.


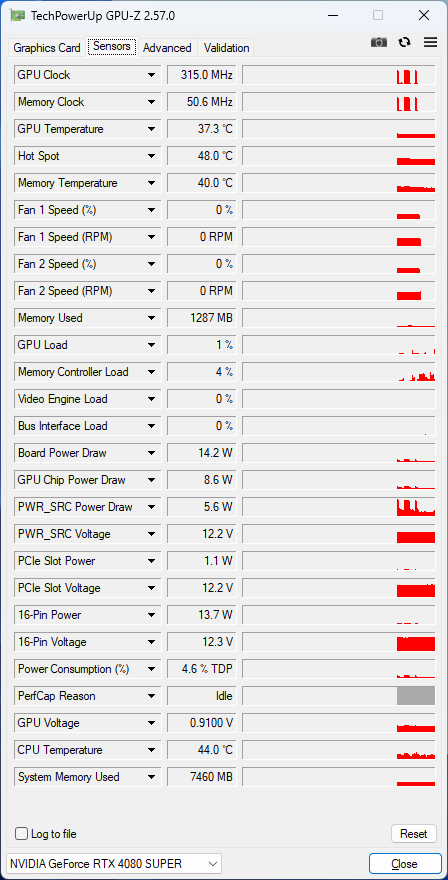
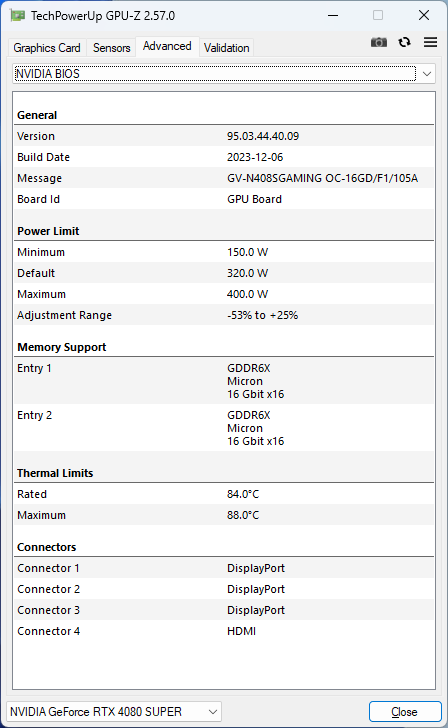
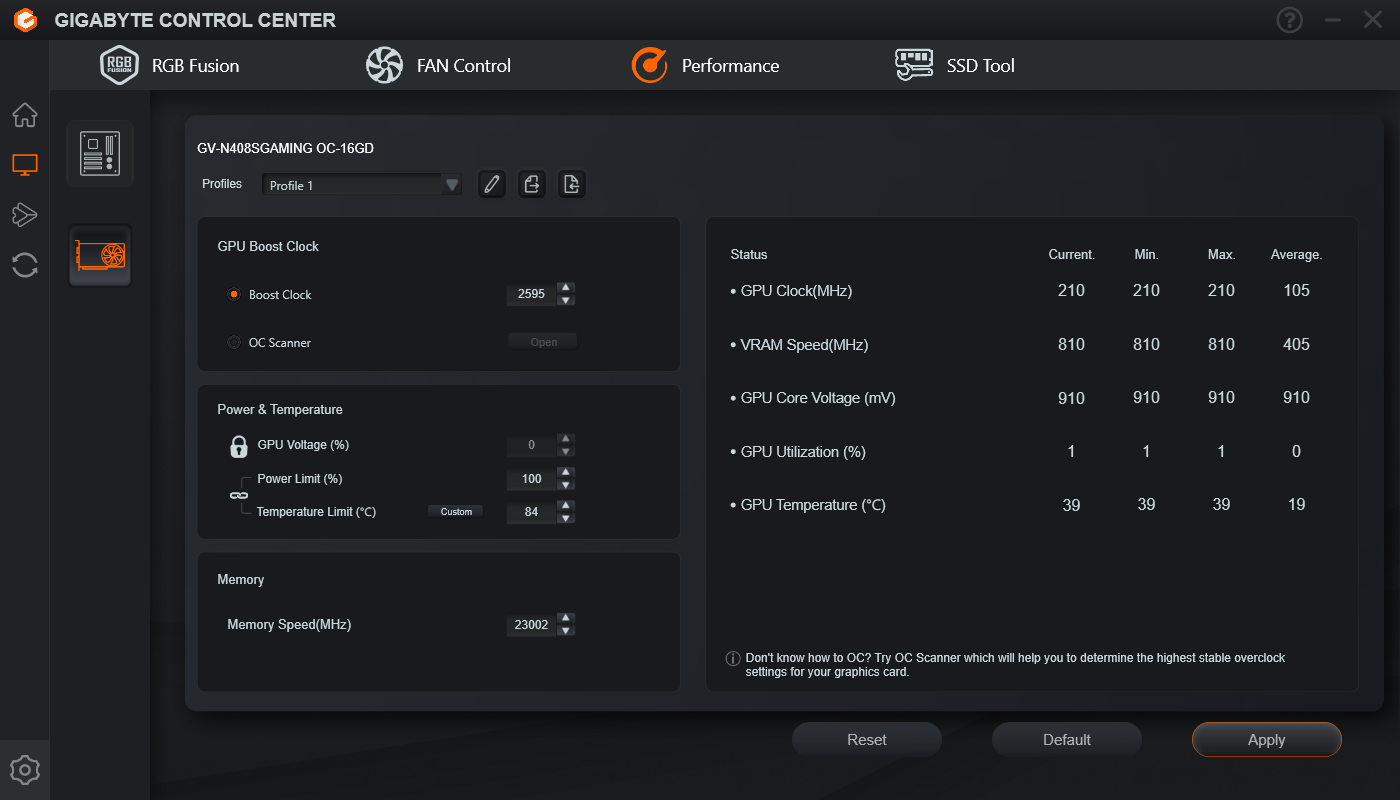
O Gigabyte GeForce RTX 4080 Super Gaming OC 16G pode aumentar até 2.595 MHz e tem uma margem de energia adicional de 25% para permitir aumentos de TGP de até 400 W.
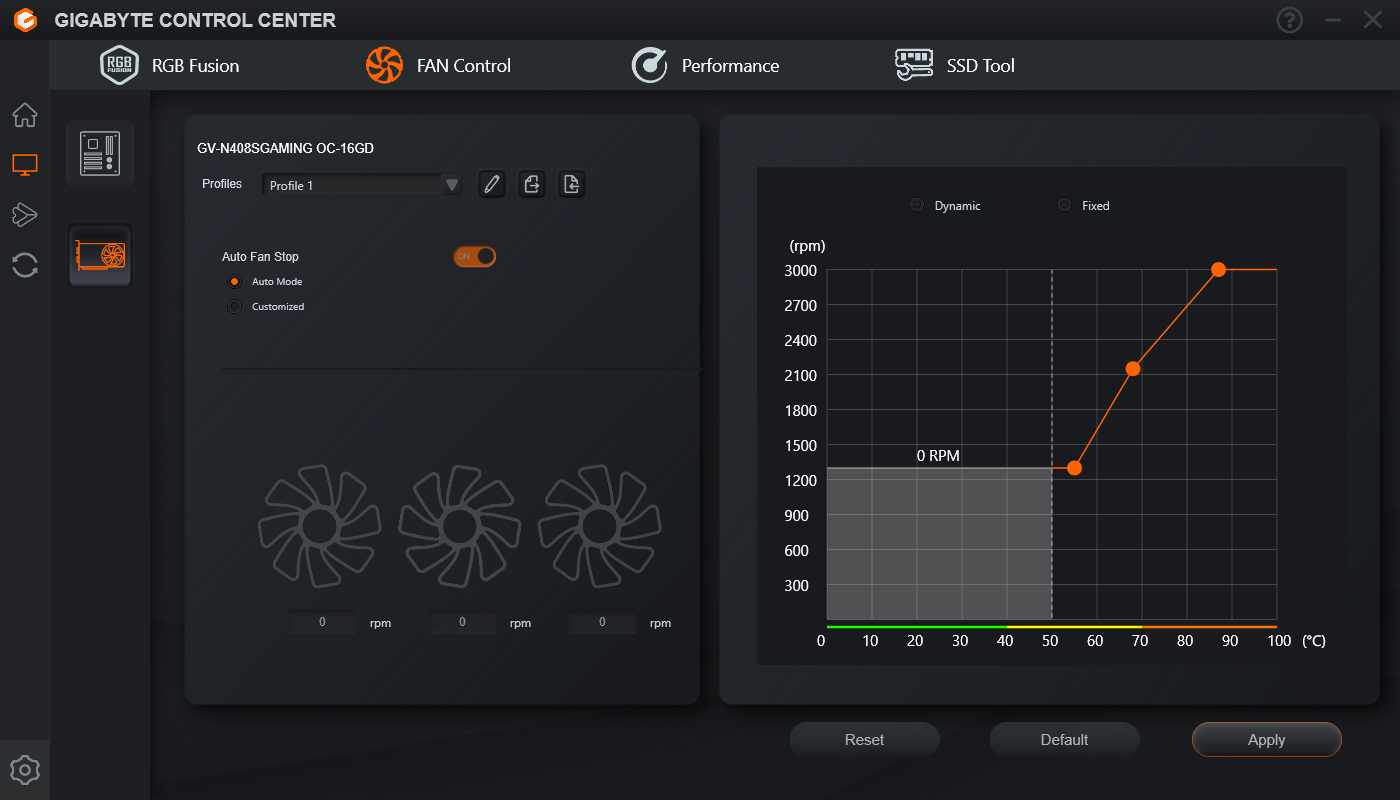
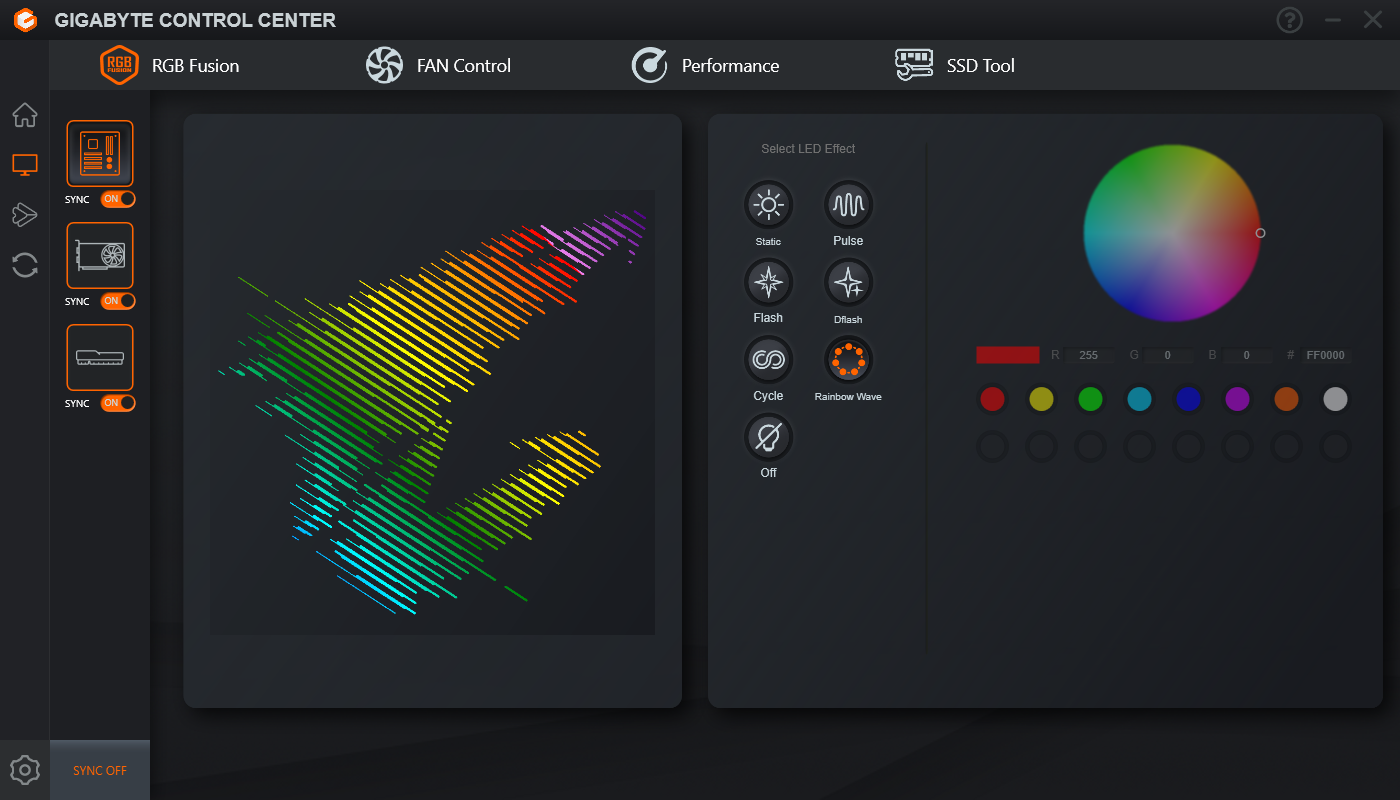
Aspectos da GPU, como overclocking, curvas da ventoinha e efeitos RGB, podem ser controlados pelo Gigabyte Control Center.
Banco de testes: RTX 4080 Super Gaming OC em conjunto com o Core i9-13900K
Nosso sistema de teste continua a se basear na plataforma Intel Core i9-13900K e Z790 para garantir que as placas não tenham um gargalo de CPU. A configuração inclui:
- Bancada de teste Cooler MasterFrame 700
- Intel Core i9-13900K com PL1=PL2
- Placa-mãe Gigabyte Z790 Aorus Master
- SSD Gigabyte Aorus Gen4 de 2 TB NVMe
- SSD NVMe Sabrent Rocket 4 Plus Gen4 de 2 TB
- 2x 16 GB de RAM Kingston Fury Renegade DDR5-6400 com temporizações 32-39-39-80 a 1,40 V
- MonitorMSI MAG 274UPF 4K 144 Hz
- Cooler Master MasterLiquid ML360L V2 ARGB AiO cooler
- Fonte de alimentação totalmente modular Cooler Master MVE Gold V2 1250 ATX 3.0
Foi usado o Windows 11 23H2 com os patches mais recentes, juntamente com o Nvidia Game Ready Driver versão 552.12.
Com base em nossos testes internos, os números de desempenho do Core i9-13900K e do chipset Z790 são comparáveis aos de um AMD Ryzen 9 7950X e X670E.
Gostaríamos de agradecer à Cooler Master por fornecer a bancada de teste, o cooler e a PSU, à Gigabyte pela placa-mãe, CPU e SSD, à Sabrent pelo SSD, à MSI pelo monitor e à Kingston pela memória.
Benchmarks sintéticos: ganhos gerais de 5% em comparação com a RTX 4080
O desempenho cumulativo de benchmark sintético mostra que a RTX 4080 Super Gaming OC tem 5% de vantagem sobre a RTX 4080 Founders Edition (FE), o que corresponde a um aumento equivalente em núcleos CUDA. Foram observados deltas maiores entre essas duas placas no 3DMark Port Royal (+7%) e no 3DMark 11 Performance GPU (11%).
A RTX 4080 Super Gaming OC está amplamente alinhada com a AMD Radeon RX 7900 XTX em testes sintéticos gerais, mas a última mostra ganhos decentes no 3DMark Fire Strike e Time Spy.
As pontuações da Unigine mostram um ganho de 2 a 5% com a RTX 4080 Super Gaming OC em comparação com a RTX 4080 Founders Edition.
A RTX 4090 Founders Edition continua a ser a placa a ser batida com pontuações 25% mais altas do que a RTX 4080 Super Gaming OC.
3DMark 11: 1280x720 Performance GPU
3DMark: 1920x1080 Fire Strike Graphics | 3840x2160 Fire Strike Ultra Graphics | Fire Strike Extreme Graphics | 2560x1440 Time Spy Graphics | 2560x1440 Port Royal Graphics | 2560x1440 Speed Way Score
Unigine Heaven 4.0: Extreme Preset DX11 | Extreme Preset OpenGL
Unigine Valley 1.0: 1920x1080 Extreme HD DirectX AA:x8 | 1920x1080 Extreme HD Preset OpenGL AA:x8
Unigine Superposition: 1280x720 720p Low | 1920x1080 1080p Extreme | 3840x2160 4k Optimized | 7680x4320 8k Optimized
| Performance rating | |
| NVIDIA GeForce RTX 4090 Founders Edition | |
| AMD Radeon RX 7900 XTX | |
| Gigabyte GeForce RTX 4080 Super Gaming OC | |
| NVIDIA GeForce RTX 4080 Founders Edition | |
| Média da turma Desktop | |
| AMD Radeon RX 7900 XT | |
| Asus TUF Gaming GeForce RTX 4070 Ti Super | |
| Gigabyte Aorus GeForce RTX 4070 Ti Master | |
| Asus TUF Gaming GeForce RTX 4070 Ti | |
| Média NVIDIA GeForce RTX 4070 Ti | |
| Gigabyte GeForce RTX 4070 Super Gaming OC 12G | |
| Média NVIDIA GeForce RTX 3090 | |
| Média NVIDIA GeForce RTX 3080 Ti | |
| NVIDIA GeForce RTX 4070 Super Founders Edition | |
| AMD Radeon RX 7800 XT | |
| Zotac Gaming GeForce RTX 4070 AMP Airo | |
| Média NVIDIA GeForce RTX 3080 -1! | |
| Sapphire Pulse Radeon RX 7700 XT | |
| Média NVIDIA Titan RTX | |
| Média NVIDIA GeForce RTX 4060 Ti 8G | |
| KFA2 GeForce RTX 4060 Ti EX, 16GB GDDR6 | |
| XFX Speedster QICK 308 Radeon RX 7600 Black Edition | |
| KFA2 GeForce RTX 4060 1-Click-OC 2X | |
| 3DMark / Speed Way Score | |
| NVIDIA GeForce RTX 4090 Founders Edition | |
| Gigabyte GeForce RTX 4080 Super Gaming OC | |
| Média da turma Desktop (492 - 14564, n=42, últimos 2 anos) | |
| NVIDIA GeForce RTX 4080 Founders Edition | |
| Asus TUF Gaming GeForce RTX 4070 Ti Super | |
| AMD Radeon RX 7900 XTX | |
| Gigabyte Aorus GeForce RTX 4070 Ti Master | |
| Média NVIDIA GeForce RTX 4070 Ti (5392 - 5546, n=6) | |
| Asus TUF Gaming GeForce RTX 4070 Ti | |
| Asus TUF Gaming GeForce RTX 4070 Ti (Quiet BIOS) | |
| Gigabyte GeForce RTX 4070 Super Gaming OC 12G | |
| Média NVIDIA GeForce RTX 3090 (5173 - 5299, n=4) | |
| Média NVIDIA GeForce RTX 3080 Ti (5195 - 5223, n=2) | |
| NVIDIA GeForce RTX 4070 Super Founders Edition | |
| AMD Radeon RX 7900 XT | |
| Zotac Gaming GeForce RTX 4070 AMP Airo | |
| AMD Radeon RX 7800 XT | |
| Média NVIDIA Titan RTX (3182 - 3205, n=3) | |
| Média NVIDIA GeForce RTX 4060 Ti 8G (3158 - 3206, n=3) | |
| KFA2 GeForce RTX 4060 Ti EX, 16GB GDDR6 | |
| Sapphire Pulse Radeon RX 7700 XT | |
| KFA2 GeForce RTX 4060 1-Click-OC 2X | |
| XFX Speedster QICK 308 Radeon RX 7600 Black Edition | |
| Unigine Heaven 4.0 / Extreme Preset DX11 | |
| NVIDIA GeForce RTX 4090 Founders Edition | |
| Gigabyte GeForce RTX 4080 Super Gaming OC | |
| AMD Radeon RX 7900 XTX | |
| NVIDIA GeForce RTX 4080 Founders Edition | |
| AMD Radeon RX 7900 XT | |
| Gigabyte Aorus GeForce RTX 4070 Ti Master | |
| Asus TUF Gaming GeForce RTX 4070 Ti | |
| Média da turma Desktop (10.9 - 545, n=44, últimos 2 anos) | |
| Média NVIDIA GeForce RTX 4070 Ti (298 - 319, n=5) | |
| Asus TUF Gaming GeForce RTX 4070 Ti Super | |
| Média NVIDIA GeForce RTX 3090 (272 - 315, n=12) | |
| Média NVIDIA GeForce RTX 3080 Ti (290 - 312, n=4) | |
| Gigabyte GeForce RTX 4070 Super Gaming OC 12G | |
| NVIDIA GeForce RTX 4070 Super Founders Edition | |
| Zotac Gaming GeForce RTX 4070 AMP Airo | |
| Média NVIDIA GeForce RTX 3080 (233 - 253, n=2) | |
| AMD Radeon RX 7800 XT | |
| Média NVIDIA Titan RTX (207 - 248, n=12) | |
| Sapphire Pulse Radeon RX 7700 XT | |
| Média NVIDIA GeForce RTX 4060 Ti 8G (170.7 - 181.6, n=4) | |
| KFA2 GeForce RTX 4060 Ti EX, 16GB GDDR6 | |
| KFA2 GeForce RTX 4060 1-Click-OC 2X | |
| XFX Speedster QICK 308 Radeon RX 7600 Black Edition | |
| Unigine Heaven 4.0 / Extreme Preset OpenGL | |
| NVIDIA GeForce RTX 4090 Founders Edition | |
| Gigabyte GeForce RTX 4080 Super Gaming OC | |
| AMD Radeon RX 7900 XTX | |
| NVIDIA GeForce RTX 4080 Founders Edition | |
| AMD Radeon RX 7900 XT | |
| Asus TUF Gaming GeForce RTX 4070 Ti Super | |
| Média da turma Desktop (11.7 - 551, n=30, últimos 2 anos) | |
| Gigabyte Aorus GeForce RTX 4070 Ti Master | |
| Média NVIDIA GeForce RTX 4070 Ti (291 - 297, n=4) | |
| Asus TUF Gaming GeForce RTX 4070 Ti | |
| Gigabyte GeForce RTX 4070 Super Gaming OC 12G | |
| NVIDIA GeForce RTX 4070 Super Founders Edition | |
| Média NVIDIA GeForce RTX 3080 Ti (264 - 282, n=4) | |
| Média NVIDIA GeForce RTX 3090 (188.2 - 284, n=11) | |
| AMD Radeon RX 7800 XT | |
| Média NVIDIA GeForce RTX 3080 (232 - 243, n=2) | |
| Zotac Gaming GeForce RTX 4070 AMP Airo | |
| Média NVIDIA Titan RTX (203 - 299, n=12) | |
| Sapphire Pulse Radeon RX 7700 XT | |
| Média NVIDIA GeForce RTX 4060 Ti 8G (173 - 176, n=3) | |
| KFA2 GeForce RTX 4060 Ti EX, 16GB GDDR6 | |
| XFX Speedster QICK 308 Radeon RX 7600 Black Edition | |
| KFA2 GeForce RTX 4060 1-Click-OC 2X | |
| Unigine Valley 1.0 / Extreme HD DirectX | |
| NVIDIA GeForce RTX 4090 Founders Edition | |
| Gigabyte GeForce RTX 4080 Super Gaming OC | |
| NVIDIA GeForce RTX 4080 Founders Edition | |
| AMD Radeon RX 7900 XTX | |
| AMD Radeon RX 7900 XT | |
| Asus TUF Gaming GeForce RTX 4070 Ti Super | |
| Asus TUF Gaming GeForce RTX 4070 Ti | |
| Média NVIDIA GeForce RTX 3080 Ti (206 - 240, n=4) | |
| Média NVIDIA GeForce RTX 3090 (184.2 - 247, n=12) | |
| Média NVIDIA GeForce RTX 4070 Ti (208 - 230, n=5) | |
| Gigabyte GeForce RTX 4070 Super Gaming OC 12G | |
| NVIDIA GeForce RTX 4070 Super Founders Edition | |
| Gigabyte Aorus GeForce RTX 4070 Ti Master | |
| Média da turma Desktop (9.8 - 295, n=44, últimos 2 anos) | |
| Zotac Gaming GeForce RTX 4070 AMP Airo | |
| AMD Radeon RX 7800 XT | |
| Média NVIDIA GeForce RTX 3080 (176.2 - 181.8, n=2) | |
| Média NVIDIA Titan RTX (135 - 191.4, n=12) | |
| Sapphire Pulse Radeon RX 7700 XT | |
| Média NVIDIA GeForce RTX 4060 Ti 8G (128.3 - 132.9, n=4) | |
| KFA2 GeForce RTX 4060 Ti EX, 16GB GDDR6 | |
| KFA2 GeForce RTX 4060 1-Click-OC 2X | |
| XFX Speedster QICK 308 Radeon RX 7600 Black Edition | |
| Unigine Valley 1.0 / Extreme HD Preset OpenGL | |
| NVIDIA GeForce RTX 4090 Founders Edition | |
| Gigabyte GeForce RTX 4080 Super Gaming OC | |
| NVIDIA GeForce RTX 4080 Founders Edition | |
| AMD Radeon RX 7900 XTX | |
| Asus TUF Gaming GeForce RTX 4070 Ti Super | |
| Gigabyte Aorus GeForce RTX 4070 Ti Master | |
| AMD Radeon RX 7900 XT | |
| Média NVIDIA GeForce RTX 4070 Ti (197.4 - 231, n=4) | |
| Asus TUF Gaming GeForce RTX 4070 Ti | |
| Média NVIDIA GeForce RTX 3090 (158.8 - 226, n=11) | |
| Média NVIDIA GeForce RTX 3080 Ti (195.1 - 210, n=4) | |
| Média da turma Desktop (9.1 - 313, n=30, últimos 2 anos) | |
| NVIDIA GeForce RTX 4070 Super Founders Edition | |
| Gigabyte GeForce RTX 4070 Super Gaming OC 12G | |
| AMD Radeon RX 7800 XT | |
| Zotac Gaming GeForce RTX 4070 AMP Airo | |
| Média NVIDIA GeForce RTX 3080 (163.8 - 172, n=2) | |
| Média NVIDIA Titan RTX (139.2 - 181.2, n=12) | |
| Sapphire Pulse Radeon RX 7700 XT | |
| Média NVIDIA GeForce RTX 4060 Ti 8G (116.5 - 118.8, n=3) | |
| KFA2 GeForce RTX 4060 Ti EX, 16GB GDDR6 | |
| KFA2 GeForce RTX 4060 1-Click-OC 2X | |
| XFX Speedster QICK 308 Radeon RX 7600 Black Edition | |
| Unigine Superposition / 720p Low | |
| Asus TUF Gaming GeForce RTX 4070 Ti | |
| NVIDIA GeForce RTX 4090 Founders Edition | |
| Gigabyte Aorus GeForce RTX 4070 Ti Master | |
| Média NVIDIA GeForce RTX 4070 Ti (48835 - 56396, n=4) | |
| Zotac Gaming GeForce RTX 4070 AMP Airo | |
| Gigabyte GeForce RTX 4080 Super Gaming OC | |
| NVIDIA GeForce RTX 4080 Founders Edition | |
| NVIDIA GeForce RTX 4070 Super Founders Edition | |
| Gigabyte GeForce RTX 4070 Super Gaming OC 12G | |
| Asus TUF Gaming GeForce RTX 4070 Ti Super | |
| Média da turma Desktop (4614 - 64541, n=27, últimos 2 anos) | |
| Média NVIDIA GeForce RTX 3090 (33329 - 63518, n=11) | |
| Média NVIDIA GeForce RTX 3080 Ti (43163 - 50738, n=4) | |
| Média NVIDIA GeForce RTX 4060 Ti 8G (46504 - 47695, n=3) | |
| AMD Radeon RX 7900 XTX | |
| AMD Radeon RX 7900 XT | |
| KFA2 GeForce RTX 4060 1-Click-OC 2X | |
| AMD Radeon RX 7800 XT | |
| Sapphire Pulse Radeon RX 7700 XT | |
| KFA2 GeForce RTX 4060 Ti EX, 16GB GDDR6 | |
| XFX Speedster QICK 308 Radeon RX 7600 Black Edition | |
| Média NVIDIA Titan RTX (25622 - 50876, n=9) | |
| Média NVIDIA GeForce RTX 3080 (30851 - 32183, n=2) | |
| Unigine Superposition / 1080p Extreme | |
| NVIDIA GeForce RTX 4090 Founders Edition | |
| AMD Radeon RX 7900 XTX | |
| Gigabyte GeForce RTX 4080 Super Gaming OC | |
| Média da turma Desktop (280 - 28841, n=30, últimos 2 anos) | |
| NVIDIA GeForce RTX 4080 Founders Edition | |
| AMD Radeon RX 7900 XT | |
| Gigabyte Aorus GeForce RTX 4070 Ti Master | |
| Asus TUF Gaming GeForce RTX 4070 Ti Super | |
| Asus TUF Gaming GeForce RTX 4070 Ti | |
| Média NVIDIA GeForce RTX 4070 Ti (12837 - 13448, n=4) | |
| Média NVIDIA GeForce RTX 3090 (11806 - 12694, n=12) | |
| Gigabyte GeForce RTX 4070 Super Gaming OC 12G | |
| Média NVIDIA GeForce RTX 3080 Ti (12038 - 12347, n=4) | |
| NVIDIA GeForce RTX 4070 Super Founders Edition | |
| Média NVIDIA GeForce RTX 3080 (10572 - 10822, n=2) | |
| AMD Radeon RX 7800 XT | |
| Zotac Gaming GeForce RTX 4070 AMP Airo | |
| Média NVIDIA Titan RTX (8916 - 9285, n=9) | |
| Sapphire Pulse Radeon RX 7700 XT | |
| KFA2 GeForce RTX 4060 Ti EX, 16GB GDDR6 | |
| Média NVIDIA GeForce RTX 4060 Ti 8G (7085 - 7833, n=3) | |
| XFX Speedster QICK 308 Radeon RX 7600 Black Edition | |
| KFA2 GeForce RTX 4060 1-Click-OC 2X | |
| Unigine Superposition / 4k Optimized | |
| NVIDIA GeForce RTX 4090 Founders Edition | |
| AMD Radeon RX 7900 XTX | |
| Gigabyte GeForce RTX 4080 Super Gaming OC | |
| Média da turma Desktop (2379 - 45354, n=42, últimos 2 anos) | |
| NVIDIA GeForce RTX 4080 Founders Edition | |
| Asus TUF Gaming GeForce RTX 4070 Ti Super | |
| AMD Radeon RX 7900 XT | |
| Gigabyte Aorus GeForce RTX 4070 Ti Master | |
| Asus TUF Gaming GeForce RTX 4070 Ti | |
| Média NVIDIA GeForce RTX 4070 Ti (16889 - 17290, n=5) | |
| Média NVIDIA GeForce RTX 3090 (15794 - 16868, n=12) | |
| Média NVIDIA GeForce RTX 3080 Ti (16108 - 16412, n=4) | |
| Gigabyte GeForce RTX 4070 Super Gaming OC 12G | |
| NVIDIA GeForce RTX 4070 Super Founders Edition | |
| Média NVIDIA GeForce RTX 3080 (13984 - 14243, n=2) | |
| AMD Radeon RX 7800 XT | |
| Zotac Gaming GeForce RTX 4070 AMP Airo | |
| Média NVIDIA Titan RTX (11937 - 12644, n=9) | |
| Sapphire Pulse Radeon RX 7700 XT | |
| Média NVIDIA GeForce RTX 4060 Ti 8G (9438 - 9722, n=4) | |
| KFA2 GeForce RTX 4060 Ti EX, 16GB GDDR6 | |
| KFA2 GeForce RTX 4060 1-Click-OC 2X | |
| XFX Speedster QICK 308 Radeon RX 7600 Black Edition | |
| Unigine Superposition / 8k Optimized | |
| NVIDIA GeForce RTX 4090 Founders Edition | |
| Média da turma Desktop (914 - 18770, n=42, últimos 2 anos) | |
| AMD Radeon RX 7900 XTX | |
| Gigabyte GeForce RTX 4080 Super Gaming OC | |
| NVIDIA GeForce RTX 4080 Founders Edition | |
| Média NVIDIA GeForce RTX 3090 (6961 - 7521, n=12) | |
| Asus TUF Gaming GeForce RTX 4070 Ti Super | |
| Média NVIDIA GeForce RTX 3080 Ti (6920 - 7161, n=4) | |
| AMD Radeon RX 7900 XT | |
| Gigabyte Aorus GeForce RTX 4070 Ti Master | |
| Asus TUF Gaming GeForce RTX 4070 Ti | |
| Média NVIDIA GeForce RTX 4070 Ti (6276 - 6454, n=5) | |
| Média NVIDIA GeForce RTX 3080 (6243 - 6346, n=2) | |
| Gigabyte GeForce RTX 4070 Super Gaming OC 12G | |
| NVIDIA GeForce RTX 4070 Super Founders Edition | |
| Média NVIDIA Titan RTX (5255 - 5571, n=9) | |
| AMD Radeon RX 7800 XT | |
| Zotac Gaming GeForce RTX 4070 AMP Airo | |
| Sapphire Pulse Radeon RX 7700 XT | |
| Média NVIDIA GeForce RTX 4060 Ti 8G (3477 - 3571, n=4) | |
| KFA2 GeForce RTX 4060 Ti EX, 16GB GDDR6 | |
| KFA2 GeForce RTX 4060 1-Click-OC 2X | |
| XFX Speedster QICK 308 Radeon RX 7600 Black Edition | |
3DMark 11: 1280x720 Performance GPU
3DMark: 1920x1080 Fire Strike Graphics | 3840x2160 Fire Strike Ultra Graphics | Fire Strike Extreme Graphics | 2560x1440 Time Spy Graphics | 2560x1440 Port Royal Graphics | 2560x1440 Speed Way Score
Unigine Heaven 4.0: Extreme Preset DX11 | Extreme Preset OpenGL
Unigine Valley 1.0: 1920x1080 Extreme HD DirectX AA:x8 | 1920x1080 Extreme HD Preset OpenGL AA:x8
Unigine Superposition: 1280x720 720p Low | 1920x1080 1080p Extreme | 3840x2160 4k Optimized | 7680x4320 8k Optimized
| 3DMark 11 Performance | 57532 pontos | |
| 3DMark Ice Storm Standard Score | 294683 pontos | |
| 3DMark Cloud Gate Standard Score | 80761 pontos | |
| 3DMark Fire Strike Score | 45427 pontos | |
| 3DMark Fire Strike Extreme Score | 31385 pontos | |
| 3DMark Time Spy Score | 27111 pontos | |
Ajuda | ||
Desempenho de computação: Ganhos significativos em relação à RX 7900 XTX
A RTX 4080 Super Gaming OC é capaz de concluir a renderização do Blender CUDA Classroom um segundo mais rápido do que a RTX 4080 FE e é cerca de 3% mais rápida no V-Ray 5 CUDA.
As pontuações do LuxMark Sala estão empatadas entre essas duas GPUs, e a RTX 4080 Super Gaming OC consegue uma enorme vantagem de 62% sobre a RX 7900 XTX nesse teste.
Embora tanto a RX 7900 XT e a RX 7900 XTX tenham um bom desempenho na maioria dos testes ComputeMark, a RTX 4080 Super Gaming OC obtém uma vantagem significativa no QJuliaRayTrace, que coloca a placa da Gigabyte ligeiramente à frente dos dois carros-chefe da AMD nesse benchmark.
Blender: v3.3 Classroom CUDA | v3.3 Classroom OPTIX/RTX
LuxMark v2.0 64Bit: Room GPUs-only | Sala GPUs-only
ComputeMark v2.1: 1024x600 Normal, Score | 1024x600 Normal, QJuliaRayTrace | 1024x600 Normal, Mandel Scalar | 1024x600 Normal, Mandel Vector | 1024x600 Normal, Fluid 2DTexArr | 1024x600 Normal, Fluid 3DTex
| V-Ray 5 Benchmark / GPU CUDA | |
| NVIDIA GeForce RTX 4090 Founders Edition (5.0.1) | |
| Gigabyte GeForce RTX 4080 Super Gaming OC (5.0.1) | |
| NVIDIA GeForce RTX 4080 Founders Edition | |
| Média da turma Desktop (356 - 5824, n=40, últimos 2 anos) | |
| Asus TUF Gaming GeForce RTX 4070 Ti Super (5.0.1) | |
| Gigabyte Aorus GeForce RTX 4070 Ti Master (5.0.1) | |
| Média NVIDIA GeForce RTX 4070 Ti (2278 - 2395, n=5) | |
| Asus TUF Gaming GeForce RTX 4070 Ti (5.0.1) | |
| Gigabyte GeForce RTX 4070 Super Gaming OC 12G (5.0.1) | |
| NVIDIA GeForce RTX 4070 Super Founders Edition (5.0.1) | |
| Média NVIDIA GeForce RTX 3080 Ti (2045 - 2070, n=3) | |
| Média NVIDIA GeForce RTX 3090 (1616 - 2131, n=15) | |
| Zotac Gaming GeForce RTX 4070 AMP Airo (5.0.1) | |
| KFA2 GeForce RTX 4060 Ti EX, 16GB GDDR6 (5.0.1) | |
| Média NVIDIA GeForce RTX 4060 Ti 8G (1375 - 1400, n=3) | |
| KFA2 GeForce RTX 4060 1-Click-OC 2X (5.0.1) | |
| Média NVIDIA Titan RTX (668 - 1052, n=7) | |
| AMD Radeon RX 7800 XT (5.0.1) | |
| Sapphire Pulse Radeon RX 7700 XT (5.0.1) | |
| XFX Speedster QICK 308 Radeon RX 7600 Black Edition (5.0.1) | |
| V-Ray 5 Benchmark / GPU RTX | |
| NVIDIA GeForce RTX 4090 Founders Edition (5.0.1) | |
| Média da turma Desktop (1408 - 7496, n=35, últimos 2 anos) | |
| Gigabyte GeForce RTX 4080 Super Gaming OC (5.0.1) | |
| NVIDIA GeForce RTX 4080 Founders Edition | |
| Asus TUF Gaming GeForce RTX 4070 Ti Super (5.0.1) | |
| Gigabyte Aorus GeForce RTX 4070 Ti Master (5.0.1) | |
| Asus TUF Gaming GeForce RTX 4070 Ti (5.0.1) | |
| Média NVIDIA GeForce RTX 4070 Ti (3054 - 3221, n=5) | |
| Gigabyte GeForce RTX 4070 Super Gaming OC 12G (5.0.1) | |
| NVIDIA GeForce RTX 4070 Super Founders Edition (5.0.1) | |
| Média NVIDIA GeForce RTX 3090 (2551 - 2979, n=15) | |
| Média NVIDIA GeForce RTX 3080 Ti (2727 - 2883, n=3) | |
| Zotac Gaming GeForce RTX 4070 AMP Airo (5.0.1) | |
| AMD Radeon RX 7800 XT (5.0.1) | |
| KFA2 GeForce RTX 4060 Ti EX, 16GB GDDR6 (5.0.1) | |
| Sapphire Pulse Radeon RX 7700 XT (5.0.1) | |
| Média NVIDIA GeForce RTX 4060 Ti 8G (1860 - 2024, n=3) | |
| KFA2 GeForce RTX 4060 1-Click-OC 2X (5.0.1) | |
| Média NVIDIA Titan RTX (1246 - 1348, n=7) | |
| Blender / v3.3 Classroom CUDA | |
| KFA2 GeForce RTX 4060 1-Click-OC 2X (3.3.3) | |
| Média NVIDIA Titan RTX (n=1) | |
| Média NVIDIA GeForce RTX 4060 Ti 8G (n=1) | |
| Zotac Gaming GeForce RTX 4070 AMP Airo (3.3.3) | |
| Média NVIDIA GeForce RTX 3080 Ti (21 - 22, n=2) | |
| Média NVIDIA GeForce RTX 3090 (20 - 22, n=13) | |
| NVIDIA GeForce RTX 4070 Super Founders Edition (3.3.3) | |
| Gigabyte GeForce RTX 4070 Super Gaming OC 12G (3.3.3) | |
| Média NVIDIA GeForce RTX 4070 Ti (18 - 19, n=3) | |
| Média da turma Desktop (8 - 54, n=31, últimos 2 anos) | |
| Gigabyte Aorus GeForce RTX 4070 Ti Master (3.3.2) | |
| Asus TUF Gaming GeForce RTX 4070 Ti Super (3.3.3) | |
| NVIDIA GeForce RTX 4080 Founders Edition (3.3.3) | |
| Gigabyte GeForce RTX 4080 Super Gaming OC (3.3.3) | |
| Blender / v3.3 Classroom OPTIX/RTX | |
| KFA2 GeForce RTX 4060 1-Click-OC 2X (3.3.3) | |
| Média NVIDIA Titan RTX (n=1) | |
| KFA2 GeForce RTX 4060 Ti EX, 16GB GDDR6 (3.3.3) | |
| Média NVIDIA GeForce RTX 4060 Ti 8G (17 - 18, n=3) | |
| Média NVIDIA GeForce RTX 3080 Ti (14 - 15, n=2) | |
| Zotac Gaming GeForce RTX 4070 AMP Airo (3.3.3) | |
| Média NVIDIA GeForce RTX 3090 (13 - 14, n=13) | |
| Asus TUF Gaming GeForce RTX 4070 Ti (3.3.2) | |
| Média NVIDIA GeForce RTX 4070 Ti (11 - 12, n=5) | |
| Gigabyte Aorus GeForce RTX 4070 Ti Master (3.3.2) | |
| NVIDIA GeForce RTX 4070 Super Founders Edition (3.3.3) | |
| Gigabyte GeForce RTX 4070 Super Gaming OC 12G (3.3.3) | |
| Média da turma Desktop (5 - 19, n=30, últimos 2 anos) | |
| Asus TUF Gaming GeForce RTX 4070 Ti Super (3.3.3) | |
| NVIDIA GeForce RTX 4080 Founders Edition (3.3.3) | |
| NVIDIA GeForce RTX 4090 Founders Edition (3.3.0) | |
| Gigabyte GeForce RTX 4080 Super Gaming OC (3.3.3) | |
| LuxMark v2.0 64Bit / Room GPUs-only | |
| NVIDIA GeForce RTX 4090 Founders Edition | |
| Gigabyte GeForce RTX 4080 Super Gaming OC | |
| NVIDIA GeForce RTX 4080 Founders Edition | |
| Asus TUF Gaming GeForce RTX 4070 Ti Super | |
| Média da turma Desktop (370 - 14722, n=40, últimos 2 anos) | |
| Gigabyte Aorus GeForce RTX 4070 Ti Master | |
| Asus TUF Gaming GeForce RTX 4070 Ti | |
| NVIDIA GeForce RTX 4070 Super Founders Edition | |
| Gigabyte GeForce RTX 4070 Super Gaming OC 12G | |
| Média NVIDIA GeForce RTX 4070 Ti (7625 - 8436, n=5) | |
| Zotac Gaming GeForce RTX 4070 AMP Airo | |
| Média NVIDIA GeForce RTX 3080 Ti (5772 - 6464, n=4) | |
| Média NVIDIA GeForce RTX 3090 (5727 - 5985, n=10) | |
| AMD Radeon RX 7900 XTX | |
| Média NVIDIA GeForce RTX 3080 (5112 - 5198, n=2) | |
| Média NVIDIA GeForce RTX 4060 Ti 8G (4558 - 5058, n=4) | |
| Média NVIDIA Titan RTX (4643 - 4703, n=2) | |
| KFA2 GeForce RTX 4060 Ti EX, 16GB GDDR6 | |
| AMD Radeon RX 7900 XT | |
| KFA2 GeForce RTX 4060 1-Click-OC 2X | |
| AMD Radeon RX 7800 XT | |
| Sapphire Pulse Radeon RX 7700 XT | |
| XFX Speedster QICK 308 Radeon RX 7600 Black Edition | |
| LuxMark v2.0 64Bit / Sala GPUs-only | |
| NVIDIA GeForce RTX 4090 Founders Edition | |
| NVIDIA GeForce RTX 4080 Founders Edition | |
| Gigabyte GeForce RTX 4080 Super Gaming OC | |
| Gigabyte Aorus GeForce RTX 4070 Ti Master | |
| Asus TUF Gaming GeForce RTX 4070 Ti | |
| Asus TUF Gaming GeForce RTX 4070 Ti Super | |
| Média NVIDIA GeForce RTX 4070 Ti (17719 - 20305, n=5) | |
| Média da turma Desktop (600 - 33461, n=40, últimos 2 anos) | |
| Gigabyte GeForce RTX 4070 Super Gaming OC 12G | |
| NVIDIA GeForce RTX 4070 Super Founders Edition | |
| Média NVIDIA GeForce RTX 3080 Ti (14871 - 16438, n=4) | |
| Zotac Gaming GeForce RTX 4070 AMP Airo | |
| AMD Radeon RX 7900 XTX | |
| Média NVIDIA GeForce RTX 3090 (14590 - 15242, n=10) | |
| AMD Radeon RX 7900 XT | |
| Média NVIDIA GeForce RTX 3080 (12797 - 12980, n=2) | |
| Média NVIDIA GeForce RTX 4060 Ti 8G (11159 - 12428, n=4) | |
| KFA2 GeForce RTX 4060 Ti EX, 16GB GDDR6 | |
| Média NVIDIA Titan RTX (10799 - 10996, n=2) | |
| AMD Radeon RX 7800 XT | |
| KFA2 GeForce RTX 4060 1-Click-OC 2X | |
| Sapphire Pulse Radeon RX 7700 XT | |
| XFX Speedster QICK 308 Radeon RX 7600 Black Edition | |
| ComputeMark v2.1 / Normal, Score | |
| NVIDIA GeForce RTX 4090 Founders Edition | |
| Gigabyte GeForce RTX 4080 Super Gaming OC | |
| AMD Radeon RX 7900 XTX | |
| NVIDIA GeForce RTX 4080 Founders Edition | |
| Média da turma Desktop (1629 - 120417, n=44, últimos 2 anos) | |
| AMD Radeon RX 7900 XT | |
| Asus TUF Gaming GeForce RTX 4070 Ti Super | |
| Gigabyte Aorus GeForce RTX 4070 Ti Master | |
| Asus TUF Gaming GeForce RTX 4070 Ti | |
| Média NVIDIA GeForce RTX 4070 Ti (49909 - 52251, n=5) | |
| Média NVIDIA GeForce RTX 3080 Ti (47377 - 48892, n=4) | |
| Gigabyte GeForce RTX 4070 Super Gaming OC 12G | |
| NVIDIA GeForce RTX 4070 Super Founders Edition | |
| Média NVIDIA GeForce RTX 3090 (44948 - 49118, n=10) | |
| AMD Radeon RX 7800 XT | |
| Zotac Gaming GeForce RTX 4070 AMP Airo | |
| Média NVIDIA GeForce RTX 3080 (39924 - 41594, n=2) | |
| Sapphire Pulse Radeon RX 7700 XT | |
| KFA2 GeForce RTX 4060 Ti EX, 16GB GDDR6 | |
| Média NVIDIA GeForce RTX 4060 Ti 8G (29999 - 32410, n=4) | |
| Média NVIDIA Titan RTX (27907 - 29830, n=3) | |
| XFX Speedster QICK 308 Radeon RX 7600 Black Edition | |
| KFA2 GeForce RTX 4060 1-Click-OC 2X | |
| ComputeMark v2.1 / Normal, QJuliaRayTrace | |
| NVIDIA GeForce RTX 4090 Founders Edition | |
| Gigabyte GeForce RTX 4080 Super Gaming OC | |
| NVIDIA GeForce RTX 4080 Founders Edition | |
| Gigabyte Aorus GeForce RTX 4070 Ti Master | |
| Asus TUF Gaming GeForce RTX 4070 Ti Super | |
| Asus TUF Gaming GeForce RTX 4070 Ti | |
| Média NVIDIA GeForce RTX 4070 Ti (20405 - 21619, n=5) | |
| Média da turma Desktop (403 - 40008, n=44, últimos 2 anos) | |
| Gigabyte GeForce RTX 4070 Super Gaming OC 12G | |
| NVIDIA GeForce RTX 4070 Super Founders Edition | |
| AMD Radeon RX 7900 XTX | |
| Média NVIDIA GeForce RTX 3080 Ti (17050 - 17749, n=4) | |
| Média NVIDIA GeForce RTX 3090 (16403 - 18223, n=11) | |
| Zotac Gaming GeForce RTX 4070 AMP Airo | |
| AMD Radeon RX 7900 XT | |
| Média NVIDIA GeForce RTX 3080 (14718 - 15508, n=2) | |
| KFA2 GeForce RTX 4060 Ti EX, 16GB GDDR6 | |
| AMD Radeon RX 7800 XT | |
| Média NVIDIA GeForce RTX 4060 Ti 8G (12697 - 13822, n=4) | |
| Sapphire Pulse Radeon RX 7700 XT | |
| KFA2 GeForce RTX 4060 1-Click-OC 2X | |
| Média NVIDIA Titan RTX (9418 - 10129, n=3) | |
| XFX Speedster QICK 308 Radeon RX 7600 Black Edition | |
| ComputeMark v2.1 / Normal, Mandel Scalar | |
| NVIDIA GeForce RTX 4090 Founders Edition | |
| AMD Radeon RX 7900 XTX | |
| Gigabyte GeForce RTX 4080 Super Gaming OC | |
| NVIDIA GeForce RTX 4080 Founders Edition | |
| AMD Radeon RX 7900 XT | |
| Média da turma Desktop (490 - 28468, n=44, últimos 2 anos) | |
| Asus TUF Gaming GeForce RTX 4070 Ti Super | |
| Gigabyte Aorus GeForce RTX 4070 Ti Master | |
| Asus TUF Gaming GeForce RTX 4070 Ti | |
| Média NVIDIA GeForce RTX 4070 Ti (11924 - 12449, n=5) | |
| Gigabyte GeForce RTX 4070 Super Gaming OC 12G | |
| AMD Radeon RX 7800 XT | |
| Média NVIDIA GeForce RTX 3080 Ti (11049 - 11318, n=4) | |
| NVIDIA GeForce RTX 4070 Super Founders Edition | |
| Média NVIDIA GeForce RTX 3090 (10650 - 11564, n=11) | |
| Sapphire Pulse Radeon RX 7700 XT | |
| Média NVIDIA GeForce RTX 3080 (9554 - 9938, n=2) | |
| Zotac Gaming GeForce RTX 4070 AMP Airo | |
| KFA2 GeForce RTX 4060 Ti EX, 16GB GDDR6 | |
| Média NVIDIA GeForce RTX 4060 Ti 8G (6996 - 7511, n=4) | |
| XFX Speedster QICK 308 Radeon RX 7600 Black Edition | |
| Média NVIDIA Titan RTX (5977 - 6406, n=3) | |
| KFA2 GeForce RTX 4060 1-Click-OC 2X | |
| ComputeMark v2.1 / Normal, Mandel Vector | |
| NVIDIA GeForce RTX 4090 Founders Edition | |
| AMD Radeon RX 7900 XTX | |
| AMD Radeon RX 7900 XT | |
| Gigabyte GeForce RTX 4080 Super Gaming OC | |
| Média da turma Desktop (318 - 24838, n=44, últimos 2 anos) | |
| NVIDIA GeForce RTX 4080 Founders Edition | |
| Gigabyte Aorus GeForce RTX 4070 Ti Master | |
| Asus TUF Gaming GeForce RTX 4070 Ti Super | |
| Asus TUF Gaming GeForce RTX 4070 Ti | |
| Média NVIDIA GeForce RTX 4070 Ti (10424 - 10888, n=5) | |
| AMD Radeon RX 7800 XT | |
| Gigabyte GeForce RTX 4070 Super Gaming OC 12G | |
| Média NVIDIA GeForce RTX 3080 Ti (9513 - 9860, n=4) | |
| NVIDIA GeForce RTX 4070 Super Founders Edition | |
| Sapphire Pulse Radeon RX 7700 XT | |
| Média NVIDIA GeForce RTX 3090 (8038 - 10097, n=11) | |
| Zotac Gaming GeForce RTX 4070 AMP Airo | |
| Média NVIDIA GeForce RTX 3080 (7148 - 7540, n=2) | |
| KFA2 GeForce RTX 4060 Ti EX, 16GB GDDR6 | |
| Média NVIDIA GeForce RTX 4060 Ti 8G (6419 - 6929, n=4) | |
| XFX Speedster QICK 308 Radeon RX 7600 Black Edition | |
| Média NVIDIA Titan RTX (4944 - 5440, n=3) | |
| KFA2 GeForce RTX 4060 1-Click-OC 2X | |
| ComputeMark v2.1 / Normal, Fluid 2DTexArr | |
| AMD Radeon RX 7900 XTX | |
| NVIDIA GeForce RTX 4090 Founders Edition | |
| AMD Radeon RX 7900 XT | |
| Gigabyte GeForce RTX 4080 Super Gaming OC | |
| NVIDIA GeForce RTX 4080 Founders Edition | |
| Média da turma Desktop (188 - 8647, n=44, últimos 2 anos) | |
| Asus TUF Gaming GeForce RTX 4070 Ti Super | |
| Média NVIDIA GeForce RTX 3080 Ti (4453 - 4546, n=4) | |
| AMD Radeon RX 7800 XT | |
| Média NVIDIA GeForce RTX 3090 (4344 - 4608, n=11) | |
| Média NVIDIA GeForce RTX 3080 (4087 - 4159, n=2) | |
| Média NVIDIA Titan RTX (3691 - 3828, n=3) | |
| Média NVIDIA GeForce RTX 4070 Ti (3539 - 3724, n=5) | |
| Gigabyte GeForce RTX 4070 Super Gaming OC 12G | |
| NVIDIA GeForce RTX 4070 Super Founders Edition | |
| Gigabyte Aorus GeForce RTX 4070 Ti Master | |
| Asus TUF Gaming GeForce RTX 4070 Ti | |
| Zotac Gaming GeForce RTX 4070 AMP Airo | |
| Sapphire Pulse Radeon RX 7700 XT | |
| KFA2 GeForce RTX 4060 Ti EX, 16GB GDDR6 | |
| Média NVIDIA GeForce RTX 4060 Ti 8G (1924 - 2060, n=4) | |
| KFA2 GeForce RTX 4060 1-Click-OC 2X | |
| XFX Speedster QICK 308 Radeon RX 7600 Black Edition | |
| ComputeMark v2.1 / Normal, Fluid 3DTex | |
| NVIDIA GeForce RTX 4090 Founders Edition | |
| AMD Radeon RX 7900 XTX | |
| Média da turma Desktop (222 - 18731, n=44, últimos 2 anos) | |
| AMD Radeon RX 7900 XT | |
| Gigabyte GeForce RTX 4080 Super Gaming OC | |
| NVIDIA GeForce RTX 4080 Founders Edition | |
| Média NVIDIA GeForce RTX 3090 (5246 - 5520, n=11) | |
| Média NVIDIA GeForce RTX 3080 Ti (5312 - 5422, n=4) | |
| Asus TUF Gaming GeForce RTX 4070 Ti Super | |
| AMD Radeon RX 7800 XT | |
| Média NVIDIA GeForce RTX 3080 (4417 - 4450, n=2) | |
| Média NVIDIA Titan RTX (3877 - 4027, n=3) | |
| Média NVIDIA GeForce RTX 4070 Ti (3616 - 3789, n=5) | |
| Gigabyte Aorus GeForce RTX 4070 Ti Master | |
| NVIDIA GeForce RTX 4070 Super Founders Edition | |
| Asus TUF Gaming GeForce RTX 4070 Ti | |
| Gigabyte GeForce RTX 4070 Super Gaming OC 12G | |
| Zotac Gaming GeForce RTX 4070 AMP Airo | |
| Sapphire Pulse Radeon RX 7700 XT | |
| KFA2 GeForce RTX 4060 Ti EX, 16GB GDDR6 | |
| Média NVIDIA GeForce RTX 4060 Ti 8G (1962 - 2090, n=4) | |
| KFA2 GeForce RTX 4060 1-Click-OC 2X | |
| XFX Speedster QICK 308 Radeon RX 7600 Black Edition | |
Blender: v3.3 Classroom CUDA | v3.3 Classroom OPTIX/RTX
LuxMark v2.0 64Bit: Room GPUs-only | Sala GPUs-only
ComputeMark v2.1: 1024x600 Normal, Score | 1024x600 Normal, QJuliaRayTrace | 1024x600 Normal, Mandel Scalar | 1024x600 Normal, Mandel Vector | 1024x600 Normal, Fluid 2DTexArr | 1024x600 Normal, Fluid 3DTex
* ... menor é melhor
Desempenho em jogos: A RX 7900 XTX está à frente em rasterização
Embora a RTX 4090 ainda continue sendo a GPU mais cobiçada dois anos após seu lançamento, a nova RTX 4080 Super é o carro-chefe da Nvidia para os gamers.
A RTX 4080 Super Gaming OC está 12% à frente da RTX 4080 FE em testes cumulativos de jogos em 1080p, 1440p e 4K Ultra, superando a RTX 3090 em 28%.
A RX 7900 XTX ainda consegue uma vantagem de 4% sobre a RTX 4080 Super Gaming OC, apesar de a última apresentar bons ganhos em F1 22, Borderlands 3e Final Fantasy XV.
A RTX 4080 Super é capaz de atingir 100 fps em muitos títulos AAA em 4K Ultra. Recomenda-se o uso de upscalers, como DLSS, FSR e XeSS, para uma experiência de jogo mais suave em títulos modernos com muita textura, incluindo Cyberpunk 2077 2.0 Phantom Libertyalan Wake 2 e Avatar: Frontiers of Pandora.
The Witcher 3: 3840x2160 Ultra Graphics & Postprocessing (HBAO+) | 3840x2160 High Graphics & Postprocessing (Nvidia HairWorks Off) | 1920x1080 Ultra Graphics & Postprocessing (HBAO+)
Metro Exodus: 3840x2160 Ultra Quality AF:16x | 2560x1440 Ultra Quality AF:16x | 1920x1080 Ultra Quality AF:16x
Control: 3840x2160 High Quality Preset | 2560x1440 High Quality Preset | 1920x1080 High Quality Preset
Borderlands 3: 3840x2160 Badass Overall Quality (DX11) | 2560x1440 Badass Overall Quality (DX11) | 1920x1080 Badass Overall Quality (DX11)
Shadow of the Tomb Raider: 3840x2160 Highest Preset AA:T | 2560x1440 Highest Preset AA:T | 1920x1080 Highest Preset AA:T
F1 22: 3840x2160 Ultra High Preset AA:T AF:16x | 2560x1440 Ultra High Preset AA:T AF:16x | 1920x1080 Ultra High Preset AA:T AF:16x
Final Fantasy XV Benchmark: 3840x2160 High Quality | 2560x1440 High Quality | 1920x1080 High Quality
| Performance rating | |
| NVIDIA GeForce RTX 4090 Founders Edition | |
| AMD Radeon RX 7900 XTX | |
| Gigabyte GeForce RTX 4080 Super Gaming OC | |
| AMD Radeon RX 7900 XT | |
| NVIDIA GeForce RTX 4080 Founders Edition | |
| Asus TUF Gaming GeForce RTX 4070 Ti Super -1! | |
| Asus TUF Gaming GeForce RTX 4070 Ti | |
| Gigabyte Aorus GeForce RTX 4070 Ti Master | |
| Média NVIDIA GeForce RTX 4070 Ti | |
| Gigabyte GeForce RTX 4070 Super Gaming OC 12G | |
| Média NVIDIA GeForce RTX 3080 Ti | |
| Média NVIDIA GeForce RTX 3090 | |
| NVIDIA GeForce RTX 4070 Super Founders Edition | |
| AMD Radeon RX 7800 XT | |
| Zotac Gaming GeForce RTX 4070 AMP Airo | |
| Média NVIDIA GeForce RTX 3080 | |
| Sapphire Pulse Radeon RX 7700 XT | |
| Média NVIDIA Titan RTX | |
| Média NVIDIA GeForce RTX 4060 Ti 8G | |
| KFA2 GeForce RTX 4060 Ti EX, 16GB GDDR6 | |
| KFA2 GeForce RTX 4060 1-Click-OC 2X | |
| XFX Speedster QICK 308 Radeon RX 7600 Black Edition | |
| The Witcher 3 / Ultra Graphics & Postprocessing (HBAO+) | |
| NVIDIA GeForce RTX 4090 Founders Edition | |
| AMD Radeon RX 7900 XTX | |
| Gigabyte GeForce RTX 4080 Super Gaming OC | |
| NVIDIA GeForce RTX 4080 Founders Edition | |
| AMD Radeon RX 7900 XT | |
| Asus TUF Gaming GeForce RTX 4070 Ti Super | |
| Asus TUF Gaming GeForce RTX 4070 Ti | |
| Média NVIDIA GeForce RTX 4070 Ti (92.4 - 98.3, n=4) | |
| Média NVIDIA GeForce RTX 3080 Ti (93.1 - 96.4, n=4) | |
| Gigabyte Aorus GeForce RTX 4070 Ti Master | |
| Média NVIDIA GeForce RTX 3090 (85.4 - 98.5, n=10) | |
| Gigabyte GeForce RTX 4070 Super Gaming OC 12G | |
| NVIDIA GeForce RTX 4070 Super Founders Edition | |
| Média NVIDIA GeForce RTX 3080 (78 - 85.7, n=2) | |
| AMD Radeon RX 7800 XT | |
| Zotac Gaming GeForce RTX 4070 AMP Airo | |
| Média NVIDIA Titan RTX (n=1) | |
| Sapphire Pulse Radeon RX 7700 XT | |
| Média NVIDIA GeForce RTX 4060 Ti 8G (53.9 - 54.3, n=3) | |
| KFA2 GeForce RTX 4060 Ti EX, 16GB GDDR6 | |
| XFX Speedster QICK 308 Radeon RX 7600 Black Edition | |
| KFA2 GeForce RTX 4060 1-Click-OC 2X | |
| The Witcher 3 / High Graphics & Postprocessing (Nvidia HairWorks Off) | |
| NVIDIA GeForce RTX 4090 Founders Edition | |
| Gigabyte GeForce RTX 4080 Super Gaming OC | |
| NVIDIA GeForce RTX 4080 Founders Edition | |
| AMD Radeon RX 7900 XTX | |
| AMD Radeon RX 7900 XT | |
| Média NVIDIA GeForce RTX 3080 Ti (149 - 156.8, n=4) | |
| Média NVIDIA GeForce RTX 3090 (128 - 160.2, n=14) | |
| Asus TUF Gaming GeForce RTX 4070 Ti | |
| Gigabyte Aorus GeForce RTX 4070 Ti Master | |
| Média NVIDIA GeForce RTX 4070 Ti (143 - 151.9, n=4) | |
| Gigabyte GeForce RTX 4070 Super Gaming OC 12G | |
| NVIDIA GeForce RTX 4070 Super Founders Edition | |
| Zotac Gaming GeForce RTX 4070 AMP Airo | |
| Média NVIDIA GeForce RTX 3080 (114 - 115, n=2) | |
| AMD Radeon RX 7800 XT | |
| Média NVIDIA Titan RTX (94 - 107.1, n=28) | |
| Sapphire Pulse Radeon RX 7700 XT | |
| Média NVIDIA GeForce RTX 4060 Ti 8G (78.5 - 80.4, n=3) | |
| KFA2 GeForce RTX 4060 Ti EX, 16GB GDDR6 | |
| KFA2 GeForce RTX 4060 1-Click-OC 2X | |
| XFX Speedster QICK 308 Radeon RX 7600 Black Edition | |
| The Witcher 3 / Ultra Graphics & Postprocessing (HBAO+) | |
| NVIDIA GeForce RTX 4090 Founders Edition | |
| AMD Radeon RX 7900 XTX | |
| AMD Radeon RX 7900 XT | |
| NVIDIA GeForce RTX 4080 Founders Edition | |
| Gigabyte GeForce RTX 4080 Super Gaming OC | |
| Asus TUF Gaming GeForce RTX 4070 Ti | |
| Média NVIDIA GeForce RTX 4070 Ti (217 - 230, n=5) | |
| Gigabyte Aorus GeForce RTX 4070 Ti Master | |
| Asus TUF Gaming GeForce RTX 4070 Ti Super | |
| Gigabyte GeForce RTX 4070 Super Gaming OC 12G | |
| NVIDIA GeForce RTX 4070 Super Founders Edition | |
| AMD Radeon RX 7800 XT | |
| Média NVIDIA GeForce RTX 3090 (160 - 192.6, n=18) | |
| Média NVIDIA GeForce RTX 3080 Ti (174 - 184.6, n=4) | |
| Zotac Gaming GeForce RTX 4070 AMP Airo | |
| Sapphire Pulse Radeon RX 7700 XT | |
| Média NVIDIA GeForce RTX 3080 (145 - 152, n=2) | |
| Média NVIDIA GeForce RTX 4060 Ti 8G (134.1 - 140.6, n=4) | |
| Média NVIDIA Titan RTX (124 - 150, n=28) | |
| KFA2 GeForce RTX 4060 Ti EX, 16GB GDDR6 | |
| XFX Speedster QICK 308 Radeon RX 7600 Black Edition | |
| KFA2 GeForce RTX 4060 1-Click-OC 2X | |
| Metro Exodus / Ultra Quality | |
| NVIDIA GeForce RTX 4090 Founders Edition | |
| AMD Radeon RX 7900 XTX | |
| Gigabyte GeForce RTX 4080 Super Gaming OC | |
| NVIDIA GeForce RTX 4080 Founders Edition | |
| AMD Radeon RX 7900 XT | |
| Gigabyte Aorus GeForce RTX 4070 Ti Master | |
| Asus TUF Gaming GeForce RTX 4070 Ti | |
| Asus TUF Gaming GeForce RTX 4070 Ti Super | |
| Média NVIDIA GeForce RTX 4070 Ti (81.2 - 85, n=4) | |
| Gigabyte GeForce RTX 4070 Super Gaming OC 12G | |
| Média NVIDIA GeForce RTX 3080 Ti (74.2 - 77.1, n=4) | |
| Média NVIDIA GeForce RTX 3090 (70.6 - 77.3, n=12) | |
| NVIDIA GeForce RTX 4070 Super Founders Edition | |
| AMD Radeon RX 7800 XT | |
| Zotac Gaming GeForce RTX 4070 AMP Airo | |
| Média NVIDIA GeForce RTX 3080 (64.1 - 65.9, n=2) | |
| Sapphire Pulse Radeon RX 7700 XT | |
| Média NVIDIA Titan RTX (51.3 - 57.9, n=27) | |
| Média NVIDIA GeForce RTX 4060 Ti 8G (48.4 - 49.3, n=3) | |
| KFA2 GeForce RTX 4060 Ti EX, 16GB GDDR6 | |
| KFA2 GeForce RTX 4060 1-Click-OC 2X | |
| XFX Speedster QICK 308 Radeon RX 7600 Black Edition | |
| Metro Exodus / Ultra Quality | |
| NVIDIA GeForce RTX 4090 Founders Edition | |
| AMD Radeon RX 7900 XTX | |
| Gigabyte GeForce RTX 4080 Super Gaming OC | |
| AMD Radeon RX 7900 XT | |
| Gigabyte Aorus GeForce RTX 4070 Ti Master | |
| Asus TUF Gaming GeForce RTX 4070 Ti | |
| Asus TUF Gaming GeForce RTX 4070 Ti Super | |
| Média NVIDIA GeForce RTX 4070 Ti (126.7 - 132.3, n=4) | |
| NVIDIA GeForce RTX 4080 Founders Edition | |
| Gigabyte GeForce RTX 4070 Super Gaming OC 12G | |
| NVIDIA GeForce RTX 4070 Super Founders Edition | |
| Média NVIDIA GeForce RTX 3080 Ti (110 - 118, n=4) | |
| Média NVIDIA GeForce RTX 3090 (102 - 118.2, n=12) | |
| Zotac Gaming GeForce RTX 4070 AMP Airo | |
| AMD Radeon RX 7800 XT | |
| Média NVIDIA GeForce RTX 3080 (92.2 - 97.4, n=2) | |
| Sapphire Pulse Radeon RX 7700 XT | |
| Média NVIDIA Titan RTX (69 - 92.9, n=26) | |
| Média NVIDIA GeForce RTX 4060 Ti 8G (78.9 - 80.1, n=3) | |
| KFA2 GeForce RTX 4060 Ti EX, 16GB GDDR6 | |
| XFX Speedster QICK 308 Radeon RX 7600 Black Edition | |
| KFA2 GeForce RTX 4060 1-Click-OC 2X | |
| Metro Exodus / Ultra Quality | |
| NVIDIA GeForce RTX 4090 Founders Edition | |
| AMD Radeon RX 7900 XTX | |
| Gigabyte GeForce RTX 4080 Super Gaming OC | |
| AMD Radeon RX 7900 XT | |
| Asus TUF Gaming GeForce RTX 4070 Ti | |
| Gigabyte Aorus GeForce RTX 4070 Ti Master | |
| Média NVIDIA GeForce RTX 4070 Ti (155.6 - 161.4, n=4) | |
| Asus TUF Gaming GeForce RTX 4070 Ti Super | |
| Gigabyte GeForce RTX 4070 Super Gaming OC 12G | |
| NVIDIA GeForce RTX 4080 Founders Edition | |
| NVIDIA GeForce RTX 4070 Super Founders Edition | |
| Média NVIDIA GeForce RTX 3080 Ti (131 - 144.2, n=5) | |
| Média NVIDIA GeForce RTX 3090 (108 - 145, n=12) | |
| Zotac Gaming GeForce RTX 4070 AMP Airo | |
| AMD Radeon RX 7800 XT | |
| Sapphire Pulse Radeon RX 7700 XT | |
| Média NVIDIA GeForce RTX 3080 (111 - 116, n=2) | |
| Média NVIDIA Titan RTX (73 - 116, n=27) | |
| Média NVIDIA GeForce RTX 4060 Ti 8G (100.6 - 101.8, n=3) | |
| KFA2 GeForce RTX 4060 Ti EX, 16GB GDDR6 | |
| XFX Speedster QICK 308 Radeon RX 7600 Black Edition | |
| KFA2 GeForce RTX 4060 1-Click-OC 2X | |
| Control / High Quality Preset | |
| NVIDIA GeForce RTX 4090 Founders Edition | |
| AMD Radeon RX 7900 XTX | |
| Gigabyte GeForce RTX 4080 Super Gaming OC | |
| AMD Radeon RX 7900 XT | |
| NVIDIA GeForce RTX 4080 Founders Edition | |
| Asus TUF Gaming GeForce RTX 4070 Ti Super | |
| Média NVIDIA GeForce RTX 4070 Ti (63.8 - 66.2, n=4) | |
| Asus TUF Gaming GeForce RTX 4070 Ti | |
| Gigabyte Aorus GeForce RTX 4070 Ti Master | |
| Média NVIDIA GeForce RTX 3080 Ti (63.9 - 64.9, n=3) | |
| Média NVIDIA GeForce RTX 3090 (61.3 - 66, n=5) | |
| AMD Radeon RX 7800 XT | |
| Gigabyte GeForce RTX 4070 Super Gaming OC 12G | |
| NVIDIA GeForce RTX 4070 Super Founders Edition | |
| Média NVIDIA GeForce RTX 3080 (56.2 - 56.7, n=2) | |
| Zotac Gaming GeForce RTX 4070 AMP Airo | |
| Média NVIDIA Titan RTX (45.2 - 47.3, n=3) | |
| Sapphire Pulse Radeon RX 7700 XT | |
| KFA2 GeForce RTX 4060 Ti EX, 16GB GDDR6 | |
| Média NVIDIA GeForce RTX 4060 Ti 8G (34.3 - 37.3, n=3) | |
| XFX Speedster QICK 308 Radeon RX 7600 Black Edition | |
| KFA2 GeForce RTX 4060 1-Click-OC 2X | |
| Control / High Quality Preset | |
| NVIDIA GeForce RTX 4090 Founders Edition | |
| AMD Radeon RX 7900 XTX | |
| AMD Radeon RX 7900 XT | |
| Gigabyte GeForce RTX 4080 Super Gaming OC | |
| Asus TUF Gaming GeForce RTX 4070 Ti | |
| Gigabyte Aorus GeForce RTX 4070 Ti Master | |
| Asus TUF Gaming GeForce RTX 4070 Ti Super | |
| Média NVIDIA GeForce RTX 3080 Ti (122 - 125.5, n=3) | |
| Média NVIDIA GeForce RTX 4070 Ti (100 - 130.6, n=4) | |
| Média NVIDIA GeForce RTX 3090 (115.8 - 123.7, n=5) | |
| AMD Radeon RX 7800 XT | |
| NVIDIA GeForce RTX 4080 Founders Edition | |
| Gigabyte GeForce RTX 4070 Super Gaming OC 12G | |
| NVIDIA GeForce RTX 4070 Super Founders Edition | |
| Média NVIDIA GeForce RTX 3080 (105 - 106, n=2) | |
| Zotac Gaming GeForce RTX 4070 AMP Airo | |
| Sapphire Pulse Radeon RX 7700 XT | |
| Média NVIDIA Titan RTX (89 - 93.6, n=3) | |
| Média NVIDIA GeForce RTX 4060 Ti 8G (69.2 - 75.3, n=3) | |
| KFA2 GeForce RTX 4060 Ti EX, 16GB GDDR6 | |
| XFX Speedster QICK 308 Radeon RX 7600 Black Edition | |
| KFA2 GeForce RTX 4060 1-Click-OC 2X | |
| Control / High Quality Preset | |
| AMD Radeon RX 7900 XTX | |
| NVIDIA GeForce RTX 4090 Founders Edition | |
| AMD Radeon RX 7900 XT | |
| Gigabyte GeForce RTX 4080 Super Gaming OC | |
| Asus TUF Gaming GeForce RTX 4070 Ti | |
| Gigabyte Aorus GeForce RTX 4070 Ti Master | |
| Média NVIDIA GeForce RTX 4070 Ti (196.6 - 202, n=4) | |
| Asus TUF Gaming GeForce RTX 4070 Ti Super | |
| AMD Radeon RX 7800 XT | |
| Média NVIDIA GeForce RTX 3080 Ti (181 - 190.7, n=3) | |
| Gigabyte GeForce RTX 4070 Super Gaming OC 12G | |
| Média NVIDIA GeForce RTX 3090 (172.2 - 189.2, n=5) | |
| NVIDIA GeForce RTX 4070 Super Founders Edition | |
| NVIDIA GeForce RTX 4080 Founders Edition | |
| Zotac Gaming GeForce RTX 4070 AMP Airo | |
| Sapphire Pulse Radeon RX 7700 XT | |
| Média NVIDIA GeForce RTX 3080 (151 - 155, n=2) | |
| Média NVIDIA Titan RTX (135 - 141.9, n=3) | |
| Média NVIDIA GeForce RTX 4060 Ti 8G (115.7 - 120.2, n=3) | |
| KFA2 GeForce RTX 4060 Ti EX, 16GB GDDR6 | |
| XFX Speedster QICK 308 Radeon RX 7600 Black Edition | |
| KFA2 GeForce RTX 4060 1-Click-OC 2X | |
| Borderlands 3 / Badass Overall Quality (DX11) | |
| NVIDIA GeForce RTX 4090 Founders Edition | |
| Gigabyte GeForce RTX 4080 Super Gaming OC | |
| NVIDIA GeForce RTX 4080 Founders Edition | |
| AMD Radeon RX 7900 XTX | |
| Asus TUF Gaming GeForce RTX 4070 Ti Super | |
| Gigabyte Aorus GeForce RTX 4070 Ti Master | |
| AMD Radeon RX 7900 XT | |
| Asus TUF Gaming GeForce RTX 4070 Ti | |
| Média NVIDIA GeForce RTX 4070 Ti (71.9 - 74.9, n=4) | |
| Média NVIDIA GeForce RTX 3090 (68 - 75.3, n=13) | |
| Média NVIDIA GeForce RTX 3080 Ti (71.2 - 74, n=4) | |
| Gigabyte GeForce RTX 4070 Super Gaming OC 12G | |
| NVIDIA GeForce RTX 4070 Super Founders Edition | |
| Média NVIDIA GeForce RTX 3080 (61.5 - 61.9, n=2) | |
| Zotac Gaming GeForce RTX 4070 AMP Airo | |
| AMD Radeon RX 7800 XT | |
| Sapphire Pulse Radeon RX 7700 XT | |
| Média NVIDIA Titan RTX (46 - 52.8, n=29) | |
| Média NVIDIA GeForce RTX 4060 Ti 8G (43.1 - 43.7, n=3) | |
| KFA2 GeForce RTX 4060 Ti EX, 16GB GDDR6 | |
| XFX Speedster QICK 308 Radeon RX 7600 Black Edition | |
| KFA2 GeForce RTX 4060 1-Click-OC 2X | |
| Borderlands 3 / Badass Overall Quality (DX11) | |
| NVIDIA GeForce RTX 4090 Founders Edition | |
| Gigabyte GeForce RTX 4080 Super Gaming OC | |
| NVIDIA GeForce RTX 4080 Founders Edition | |
| AMD Radeon RX 7900 XTX | |
| Asus TUF Gaming GeForce RTX 4070 Ti Super | |
| Gigabyte Aorus GeForce RTX 4070 Ti Master | |
| Asus TUF Gaming GeForce RTX 4070 Ti | |
| Média NVIDIA GeForce RTX 4070 Ti (134.3 - 142, n=4) | |
| AMD Radeon RX 7900 XT | |
| Gigabyte GeForce RTX 4070 Super Gaming OC 12G | |
| NVIDIA GeForce RTX 4070 Super Founders Edition | |
| Média NVIDIA GeForce RTX 3080 Ti (114 - 130.2, n=4) | |
| Média NVIDIA GeForce RTX 3090 (105 - 131.6, n=13) | |
| Zotac Gaming GeForce RTX 4070 AMP Airo | |
| AMD Radeon RX 7800 XT | |
| Média NVIDIA GeForce RTX 3080 (95.7 - 103, n=2) | |
| Sapphire Pulse Radeon RX 7700 XT | |
| Média NVIDIA Titan RTX (74 - 93.1, n=29) | |
| Média NVIDIA GeForce RTX 4060 Ti 8G (83.9 - 85.2, n=3) | |
| KFA2 GeForce RTX 4060 Ti EX, 16GB GDDR6 | |
| XFX Speedster QICK 308 Radeon RX 7600 Black Edition | |
| KFA2 GeForce RTX 4060 1-Click-OC 2X | |
| Borderlands 3 / Badass Overall Quality (DX11) | |
| NVIDIA GeForce RTX 4090 Founders Edition | |
| Asus TUF Gaming GeForce RTX 4070 Ti | |
| Gigabyte GeForce RTX 4080 Super Gaming OC | |
| Gigabyte Aorus GeForce RTX 4070 Ti Master | |
| AMD Radeon RX 7900 XTX | |
| Média NVIDIA GeForce RTX 4070 Ti (171.4 - 186.9, n=4) | |
| NVIDIA GeForce RTX 4080 Founders Edition | |
| Asus TUF Gaming GeForce RTX 4070 Ti Super | |
| AMD Radeon RX 7900 XT | |
| Gigabyte GeForce RTX 4070 Super Gaming OC 12G | |
| NVIDIA GeForce RTX 4070 Super Founders Edition | |
| Zotac Gaming GeForce RTX 4070 AMP Airo | |
| Média NVIDIA GeForce RTX 3080 Ti (129 - 164.9, n=4) | |
| Média NVIDIA GeForce RTX 3090 (117 - 170.1, n=13) | |
| AMD Radeon RX 7800 XT | |
| Sapphire Pulse Radeon RX 7700 XT | |
| Média NVIDIA GeForce RTX 3080 (117 - 128, n=2) | |
| Média NVIDIA GeForce RTX 4060 Ti 8G (121.5 - 123.5, n=3) | |
| KFA2 GeForce RTX 4060 Ti EX, 16GB GDDR6 | |
| Média NVIDIA Titan RTX (77.2 - 128.7, n=29) | |
| XFX Speedster QICK 308 Radeon RX 7600 Black Edition | |
| KFA2 GeForce RTX 4060 1-Click-OC 2X | |
| Shadow of the Tomb Raider / Highest Preset | |
| NVIDIA GeForce RTX 4090 Founders Edition | |
| AMD Radeon RX 7900 XTX | |
| Gigabyte GeForce RTX 4080 Super Gaming OC | |
| NVIDIA GeForce RTX 4080 Founders Edition | |
| AMD Radeon RX 7900 XT | |
| Asus TUF Gaming GeForce RTX 4070 Ti Super | |
| Gigabyte Aorus GeForce RTX 4070 Ti Master | |
| Asus TUF Gaming GeForce RTX 4070 Ti | |
| Média NVIDIA GeForce RTX 4070 Ti (102.7 - 104.9, n=4) | |
| Gigabyte GeForce RTX 4070 Super Gaming OC 12G | |
| Média NVIDIA GeForce RTX 3090 (89.3 - 99.7, n=12) | |
| Média NVIDIA GeForce RTX 3080 Ti (93 - 98.6, n=3) | |
| NVIDIA GeForce RTX 4070 Super Founders Edition | |
| Média NVIDIA GeForce RTX 3080 (83.9 - 87.9, n=2) | |
| Zotac Gaming GeForce RTX 4070 AMP Airo | |
| AMD Radeon RX 7800 XT | |
| Média NVIDIA Titan RTX (59 - 71.1, n=24) | |
| Sapphire Pulse Radeon RX 7700 XT | |
| KFA2 GeForce RTX 4060 Ti EX, 16GB GDDR6 | |
| Média NVIDIA GeForce RTX 4060 Ti 8G (58.1 - 58.7, n=3) | |
| KFA2 GeForce RTX 4060 1-Click-OC 2X | |
| XFX Speedster QICK 308 Radeon RX 7600 Black Edition | |
| Shadow of the Tomb Raider / Highest Preset | |
| NVIDIA GeForce RTX 4090 Founders Edition | |
| AMD Radeon RX 7900 XTX | |
| Gigabyte GeForce RTX 4080 Super Gaming OC | |
| Asus TUF Gaming GeForce RTX 4070 Ti Super | |
| Gigabyte Aorus GeForce RTX 4070 Ti Master | |
| AMD Radeon RX 7900 XT | |
| Asus TUF Gaming GeForce RTX 4070 Ti | |
| Média NVIDIA GeForce RTX 4070 Ti (195.9 - 204, n=4) | |
| NVIDIA GeForce RTX 4080 Founders Edition | |
| Gigabyte GeForce RTX 4070 Super Gaming OC 12G | |
| Média NVIDIA GeForce RTX 3090 (137 - 172.3, n=12) | |
| NVIDIA GeForce RTX 4070 Super Founders Edition | |
| Média NVIDIA GeForce RTX 3080 Ti (157 - 173.3, n=3) | |
| Zotac Gaming GeForce RTX 4070 AMP Airo | |
| AMD Radeon RX 7800 XT | |
| Média NVIDIA GeForce RTX 3080 (147 - 152, n=2) | |
| Sapphire Pulse Radeon RX 7700 XT | |
| Média NVIDIA GeForce RTX 4060 Ti 8G (119.3 - 121.2, n=3) | |
| KFA2 GeForce RTX 4060 Ti EX, 16GB GDDR6 | |
| Média NVIDIA Titan RTX (98 - 128, n=23) | |
| KFA2 GeForce RTX 4060 1-Click-OC 2X | |
| XFX Speedster QICK 308 Radeon RX 7600 Black Edition | |
| Shadow of the Tomb Raider / Highest Preset | |
| NVIDIA GeForce RTX 4090 Founders Edition | |
| AMD Radeon RX 7900 XTX | |
| AMD Radeon RX 7900 XT | |
| Asus TUF Gaming GeForce RTX 4070 Ti | |
| Gigabyte Aorus GeForce RTX 4070 Ti Master | |
| Média NVIDIA GeForce RTX 4070 Ti (263 - 280, n=4) | |
| Gigabyte GeForce RTX 4080 Super Gaming OC | |
| Asus TUF Gaming GeForce RTX 4070 Ti Super | |
| Gigabyte GeForce RTX 4070 Super Gaming OC 12G | |
| NVIDIA GeForce RTX 4070 Super Founders Edition | |
| Zotac Gaming GeForce RTX 4070 AMP Airo | |
| NVIDIA GeForce RTX 4080 Founders Edition | |
| AMD Radeon RX 7800 XT | |
| Média NVIDIA GeForce RTX 3080 Ti (178 - 238, n=3) | |
| Média NVIDIA GeForce RTX 3090 (145 - 240, n=14) | |
| Sapphire Pulse Radeon RX 7700 XT | |
| KFA2 GeForce RTX 4060 Ti EX, 16GB GDDR6 | |
| Média NVIDIA GeForce RTX 4060 Ti 8G (181.6 - 184, n=3) | |
| Média NVIDIA GeForce RTX 3080 (177 - 185, n=2) | |
| Média NVIDIA Titan RTX (106 - 178.8, n=24) | |
| KFA2 GeForce RTX 4060 1-Click-OC 2X | |
| XFX Speedster QICK 308 Radeon RX 7600 Black Edition | |
The Witcher 3: 3840x2160 Ultra Graphics & Postprocessing (HBAO+) | 3840x2160 High Graphics & Postprocessing (Nvidia HairWorks Off) | 1920x1080 Ultra Graphics & Postprocessing (HBAO+)
Metro Exodus: 3840x2160 Ultra Quality AF:16x | 2560x1440 Ultra Quality AF:16x | 1920x1080 Ultra Quality AF:16x
Control: 3840x2160 High Quality Preset | 2560x1440 High Quality Preset | 1920x1080 High Quality Preset
Borderlands 3: 3840x2160 Badass Overall Quality (DX11) | 2560x1440 Badass Overall Quality (DX11) | 1920x1080 Badass Overall Quality (DX11)
Shadow of the Tomb Raider: 3840x2160 Highest Preset AA:T | 2560x1440 Highest Preset AA:T | 1920x1080 Highest Preset AA:T
F1 22: 3840x2160 Ultra High Preset AA:T AF:16x | 2560x1440 Ultra High Preset AA:T AF:16x | 1920x1080 Ultra High Preset AA:T AF:16x
Final Fantasy XV Benchmark: 3840x2160 High Quality | 2560x1440 High Quality | 1920x1080 High Quality
Desempenho do Ray Tracing
Jogos como Metro Exodus (sem a Enhanced Edition), Controle Far Cry 6 vemos que a RX 7900 XTX consegue superar por pouco a RTX 4080 Super Gaming OC em ray tracing nativo de 1080p Ultra.
Dito isso, a RTX 4080 Super Gaming OC consegue entre 3 e 17% de vantagem sobre a RTX 4080 FE em ray tracing de resolução nativa.
| Alan Wake 2 | |
| 3840x2160 High Preset + High Ray Tracing + Quality DLSS + FG | |
| Média da turma Desktop (26.2 - 152.7, n=18, últimos 2 anos) | |
| Gigabyte GeForce RTX 4080 Super Gaming OC | |
| NVIDIA GeForce RTX 4080 Founders Edition | |
| Asus TUF Gaming GeForce RTX 4070 Ti Super | |
| Média NVIDIA GeForce RTX 4070 Ti (n=1) | |
| Gigabyte GeForce RTX 4070 Super Gaming OC 12G | |
| NVIDIA GeForce RTX 4070 Super Founders Edition | |
| Média NVIDIA GeForce RTX 4060 Ti 8G (n=1) | |
| 1920x1080 High Preset + High Ray Tracing | |
| Gigabyte GeForce RTX 4080 Super Gaming OC | |
| Asus TUF Gaming GeForce RTX 4070 Ti Super | |
| NVIDIA GeForce RTX 4080 Founders Edition | |
| Média NVIDIA GeForce RTX 4070 Ti (n=1) | |
| Média da turma Desktop (23.8 - 132.2, n=28, últimos 2 anos) | |
| Gigabyte GeForce RTX 4070 Super Gaming OC 12G | |
| NVIDIA GeForce RTX 4070 Super Founders Edition | |
| Média NVIDIA GeForce RTX 3090 (44.6 - 52, n=3) | |
| Média NVIDIA GeForce RTX 4060 Ti 8G (n=1) | |
| Média NVIDIA Titan RTX (n=1) | |
| Sapphire Pulse Radeon RX 7700 XT | |
| XFX Speedster QICK 308 Radeon RX 7600 Black Edition | |
| baixo | média | alto | ultra | QHD | 4K DLSS | 4K FSR | 4K | |
|---|---|---|---|---|---|---|---|---|
| GTA V (2015) | 188.2 | 188 | 186.9 | 165.4 | 164.6 | 163.6 | ||
| The Witcher 3 (2015) | 470 | 241 | 196.2 | 186.4 | ||||
| Dota 2 Reborn (2015) | 273 | 245 | 236 | 222 | 214 | |||
| Final Fantasy XV Benchmark (2018) | 235 | 236 | 225 | 193.5 | 117.8 | |||
| X-Plane 11.11 (2018) | 236 | 207 | 154.9 | 132.2 | ||||
| Far Cry 5 (2018) | 206 | 202 | 193 | 134 | ||||
| Strange Brigade (2018) | 626 | 519 | 501 | 480 | 389 | 197.3 | ||
| Shadow of the Tomb Raider (2018) | 271 | 262 | 224 | 127.5 | ||||
| Metro Exodus (2019) | 203 | 169.4 | 144.9 | 97.7 | ||||
| Control (2019) | 221 | 206 | 145 | 86.4 | 76.5 | |||
| Borderlands 3 (2019) | 184.4 | 186.3 | 161.6 | 97.6 | ||||
| Mafia Definitive Edition (2020) | 248 | 232 | 202 | 111.4 | ||||
| Watch Dogs Legion (2020) | 149 | 144.5 | 127 | 80.5 | ||||
| Far Cry 6 (2021) | 212 | 194.4 | 179.8 | 162.8 | 99.3 | |||
| Dying Light 2 (2022) | 217 | 165.9 | 123.7 | 65 | ||||
| Cyberpunk 2077 1.6 (2022) | 209 | 208 | 198.4 | 187.8 | 127.9 | 63 | ||
| Ghostwire Tokyo (2022) | 299 | 298 | 247 | 120 | ||||
| F1 22 (2022) | 368 | 166.4 | 112.9 | 59.2 | ||||
| F1 23 (2023) | 393 | 165.4 | 108.3 | 94.5 | 54.5 | |||
| Baldur's Gate 3 (2023) | 245 | 237 | 232 | 186.8 | 160.7 | 97.6 | ||
| Cyberpunk 2077 (2023) | 197.5 | 198.3 | 186.9 | 173.8 | 121.7 | 55.6 | ||
| Assassin's Creed Mirage (2023) | 243 | 191 | 158 | 135 | 101 | |||
| Alan Wake 2 (2023) | 130.1 | 122.4 | 90.1 | 77.6 | 53.5 | |||
| Avatar Frontiers of Pandora (2023) | 158.9 | 128.8 | 90.1 | 81.1 | 48.4 | |||
| Skull & Bones (2024) | 205 | 172 | 137 | 114 | 105 | 101 | 78 |
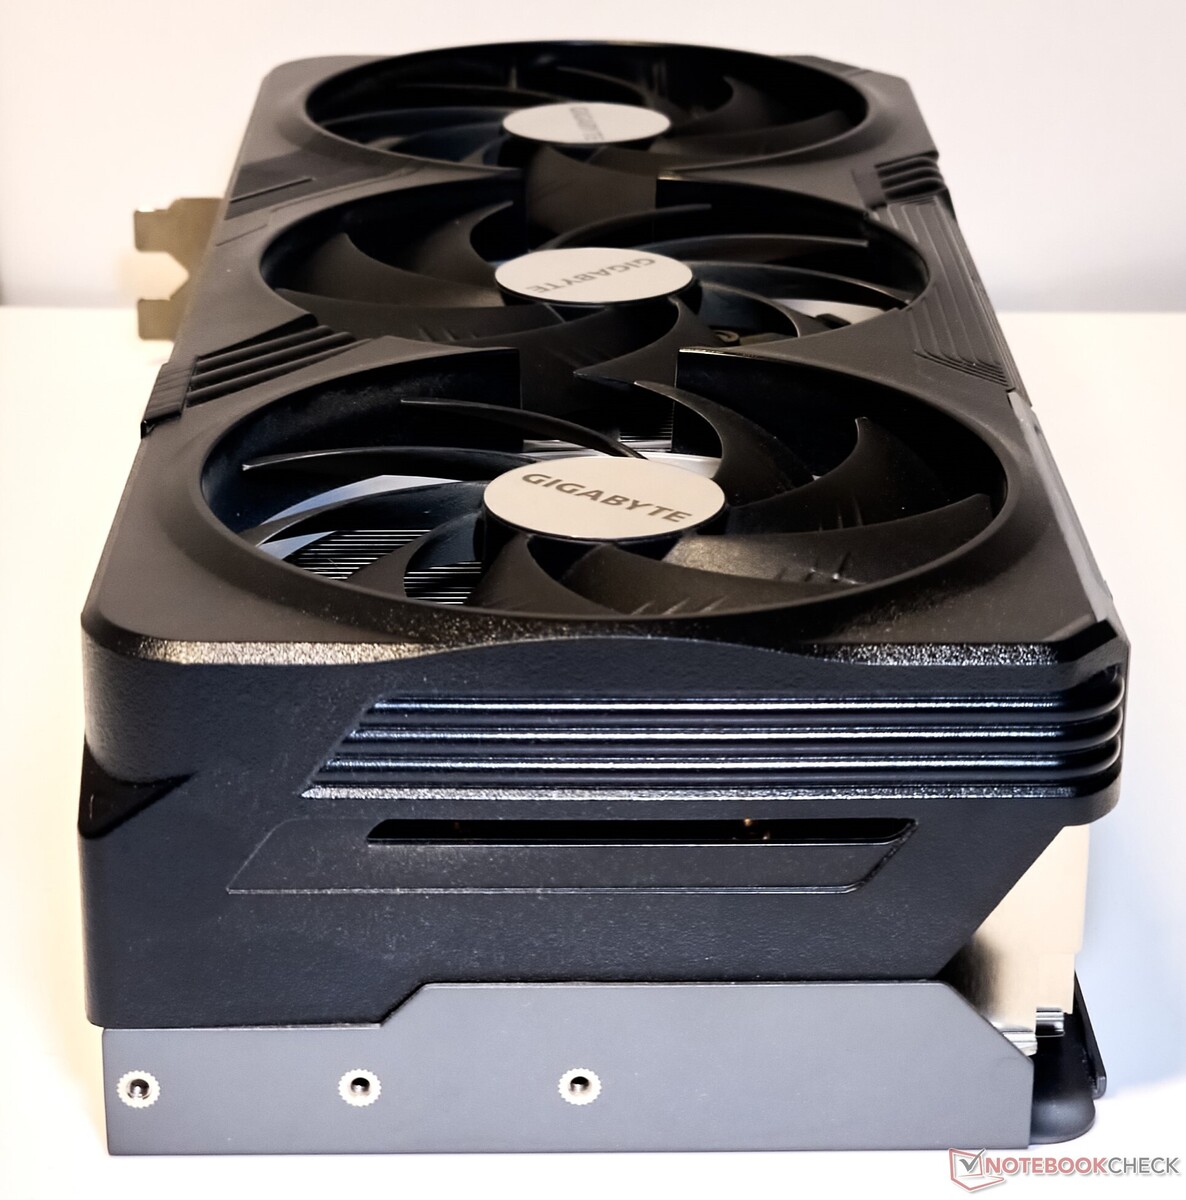
Emissões: Ruído mais alto, mas desempenho relativamente livre de aceleração sob estresse
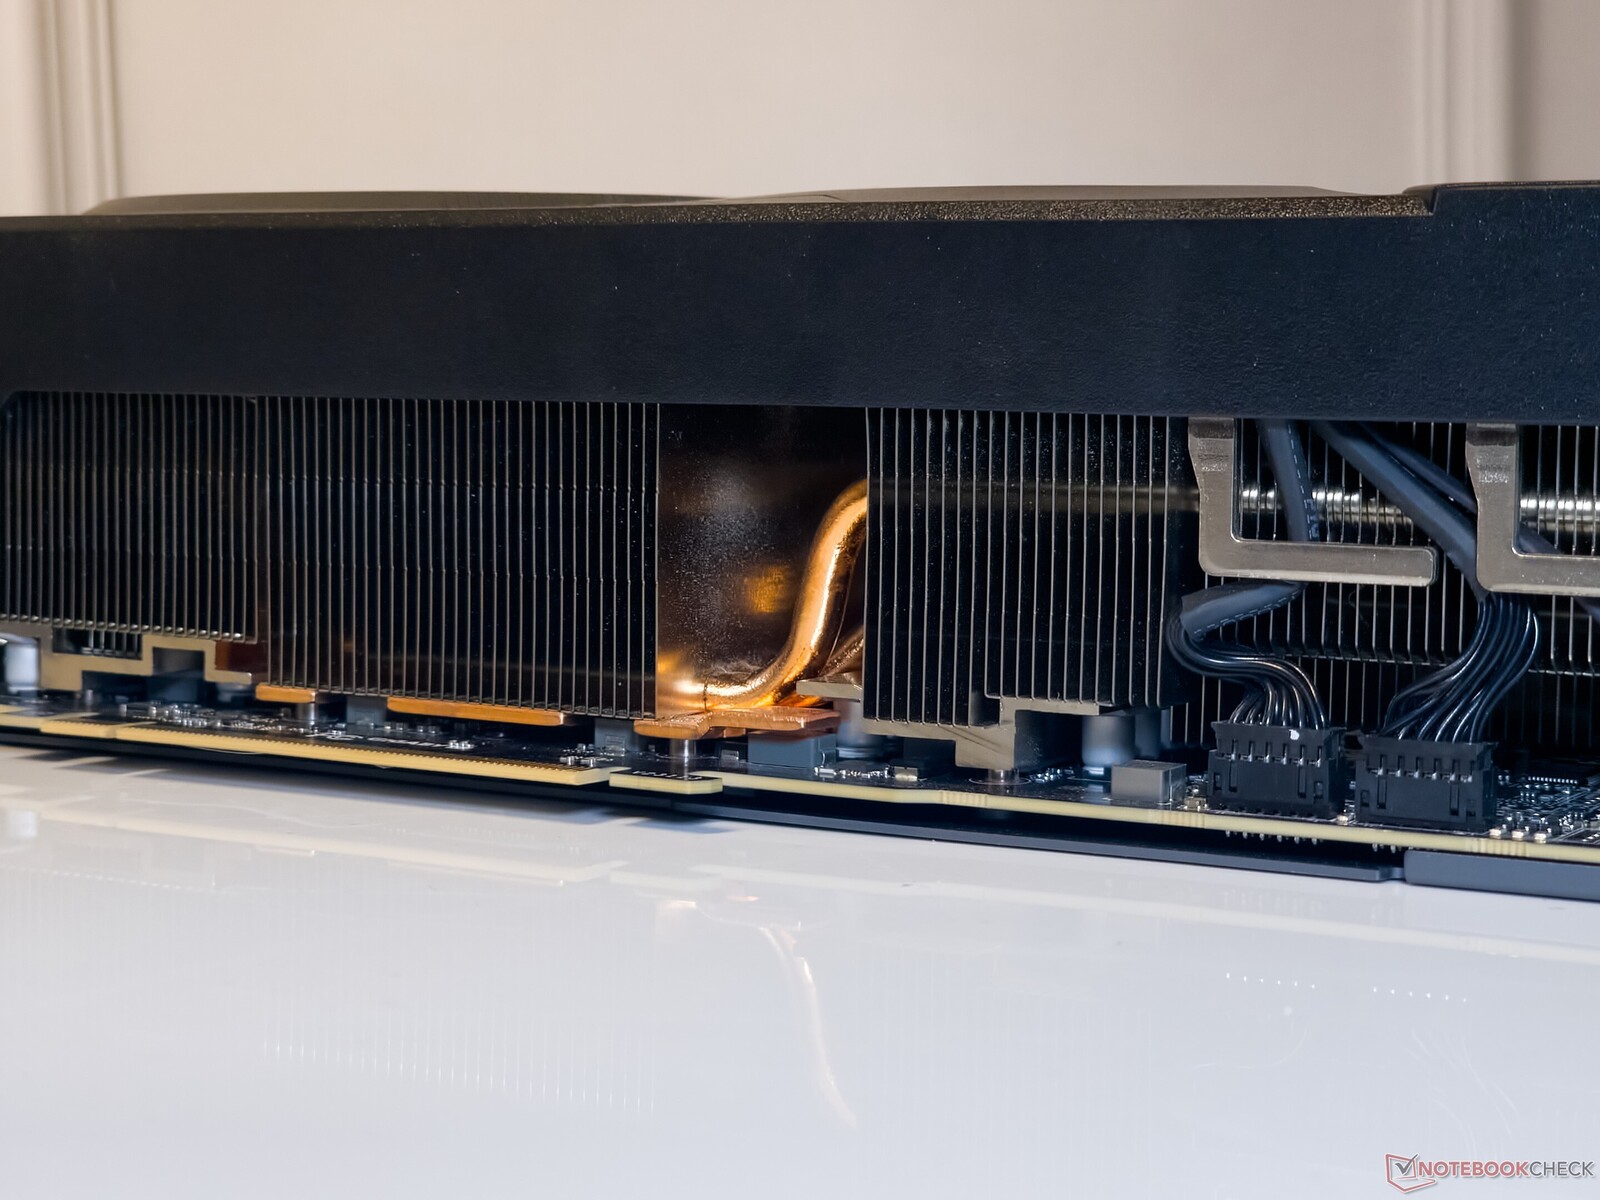
A RTX 4080 Super Gaming OC utiliza o sistema de resfriamento WindForce da Gigabyte, que é composto por três ventoinhas de rotação alternada de 110 mm e nove heatpipes, juntamente com uma placa de cobre de contato direto.
De acordo com a Gigabyte, as ventoinhas de rolamento de manga usam um nano lubrificante de grafeno que supostamente ajuda a prolongar a vida útil semelhante às ventoinhas de rolamento de esferas duplas.
A placa traseira de metal apresenta um grande recorte para a exaustão de ar que é, na verdade, uma extensão do dissipador de calor.
Testes de estresse
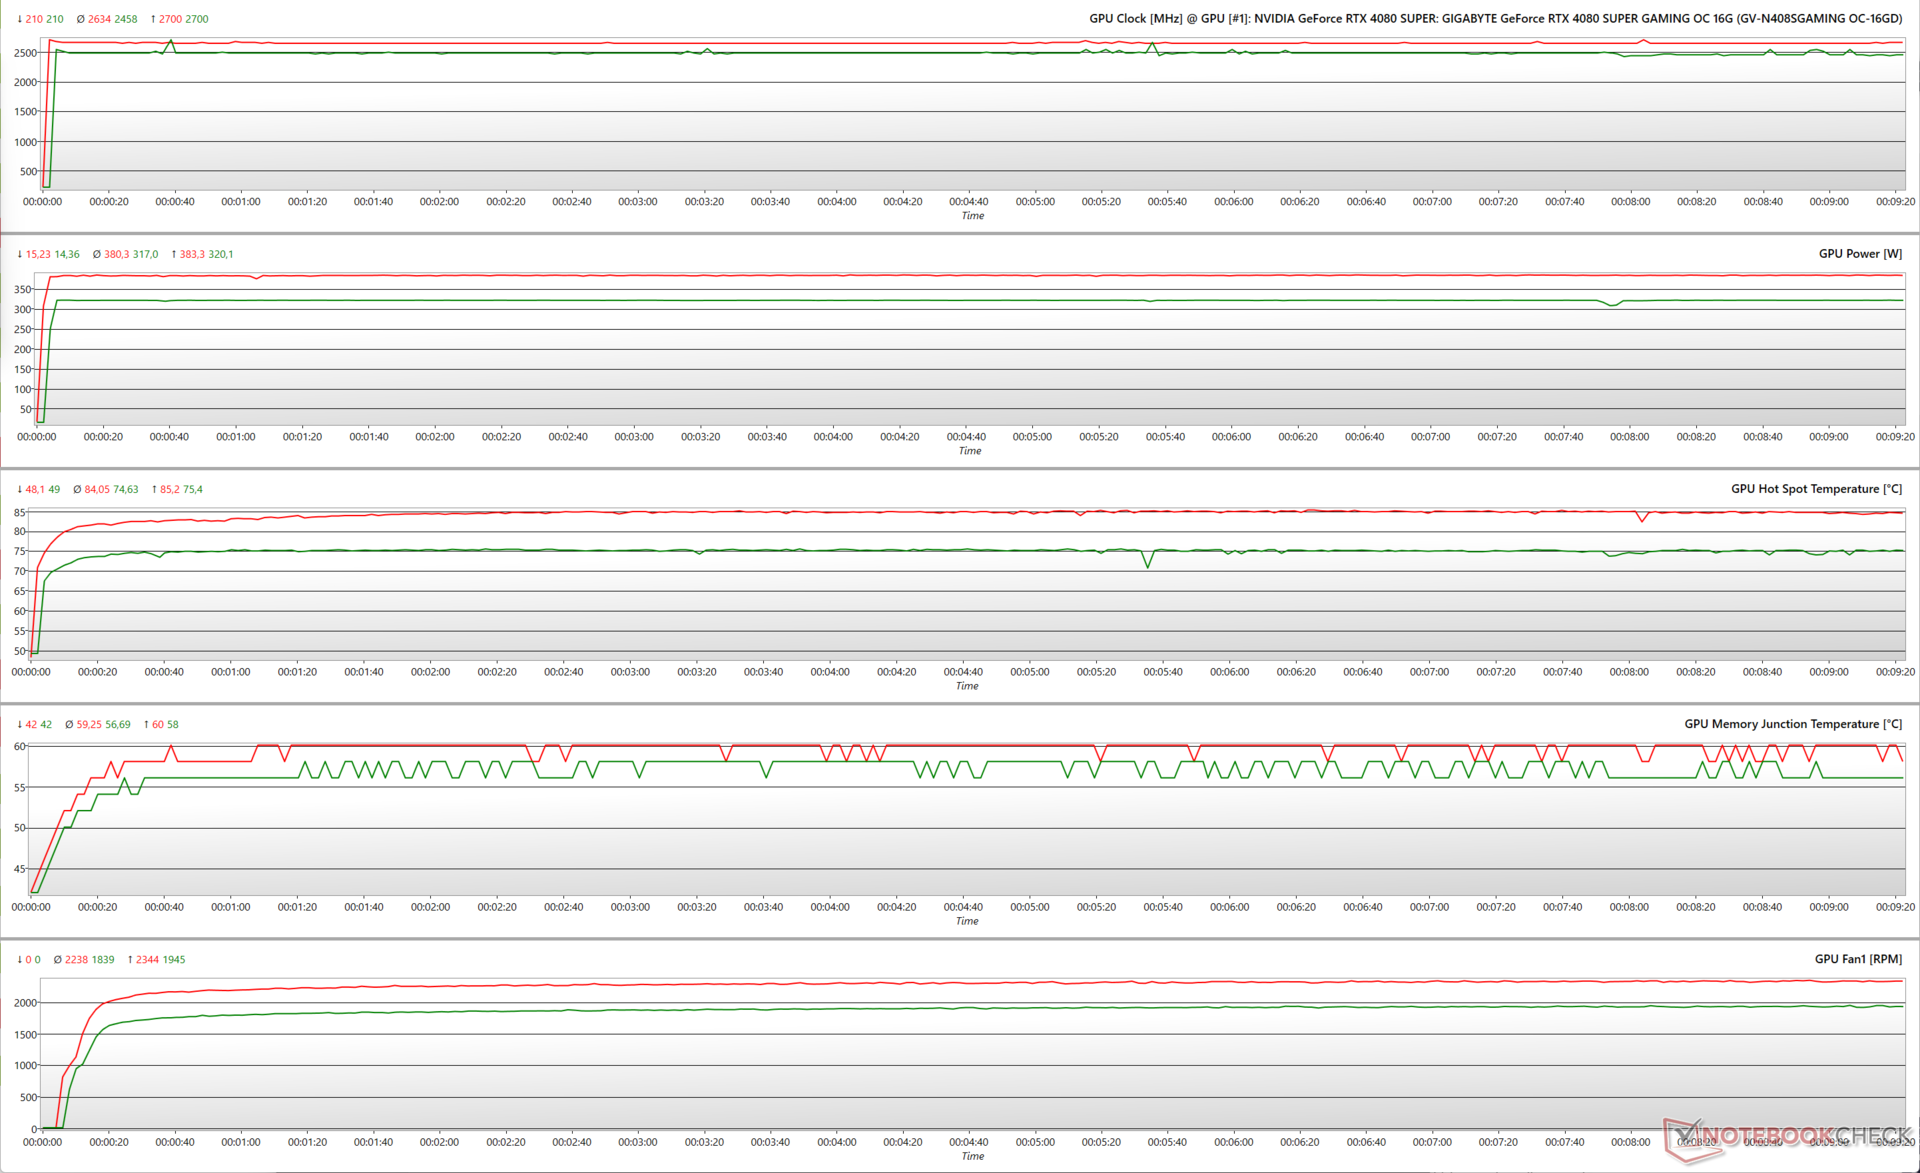
Ao testar o RTX 4080 Super Gaming OC com FurMark (1.280 x 720, sem AA), a GPU utiliza o TGP de 320 W disponível em uma meta de energia de 100% (PT). Isso resulta em um boost clock médio de 2.458 MHz e temperaturas de ponto de acesso próximas à marca de 75 °C.
Em um PT de 125%, a GPU só consegue usar 383 W dos 400 W teoricamente disponíveis. Isso também foi observado anteriormente com a RTX 4070 Super Gaming OC.
Vemos a GPU atingindo clocks médios de 2.634 MHz, com a temperatura do ponto de acesso subindo correspondentemente para 84°C.
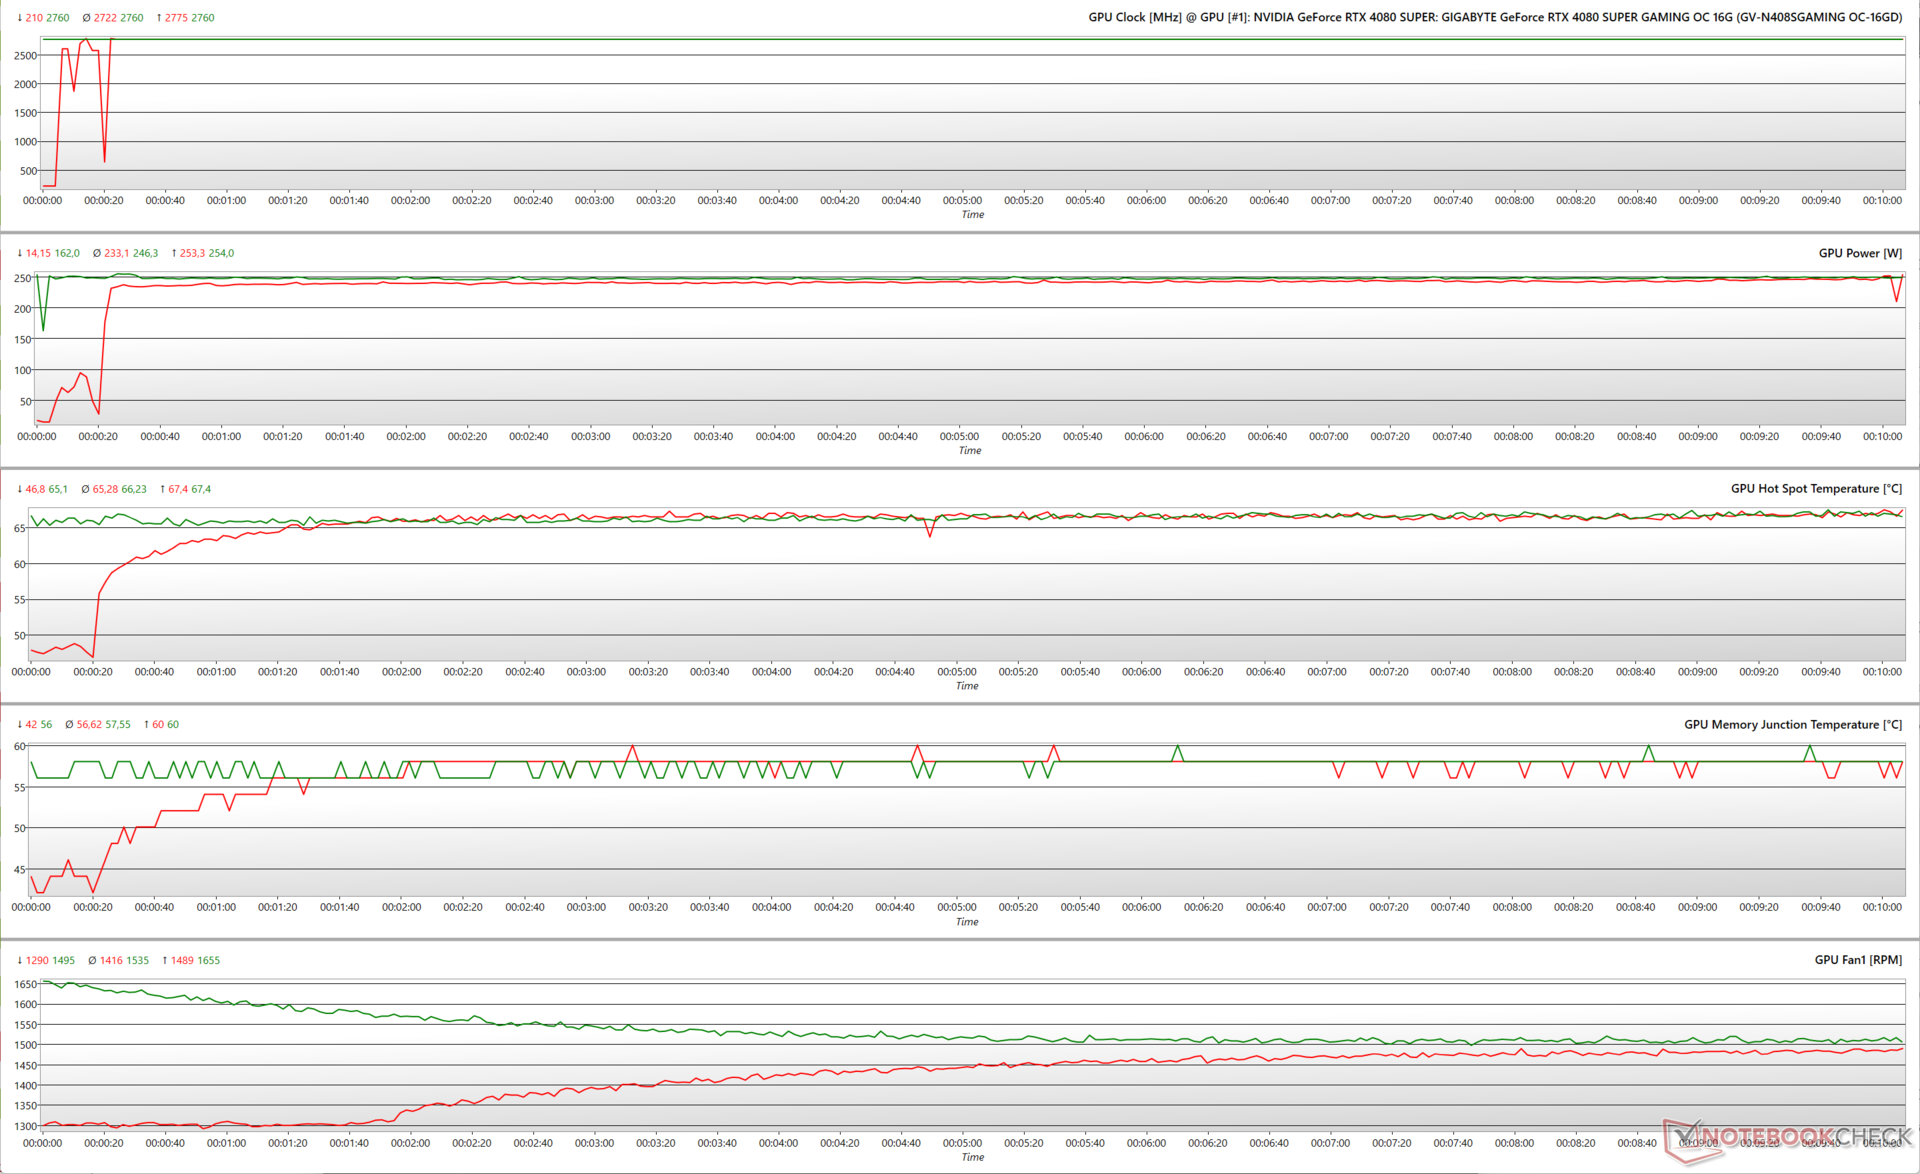
Ao executar o O Witcher 3 a 1080p Ultra, a RTX 4080 Super Gaming OC consegue manter um clock estável de 2.760 MHz a 100% PT e consome 254 W.
Como é a norma com as placas Ada, aumentar a meta de potência em cargas de trabalho de jogos não confere benefícios aparentes. Parâmetros como velocidade do clock, consumo de energia e temperaturas do ponto de acesso são idênticos no estresse do Witcher 3 mesmo a 125% PT.
O gráfico Witcher 3 FPS
O sistema de resfriamento WindForce da Gigabyte parece estar funcionando bem para aliviar qualquer preocupação com o estrangulamento. Não observamos nenhuma queda nos quadros durante o teste de estresse com o Witcher 3 em 1080p Ultra e 4K Ultra.
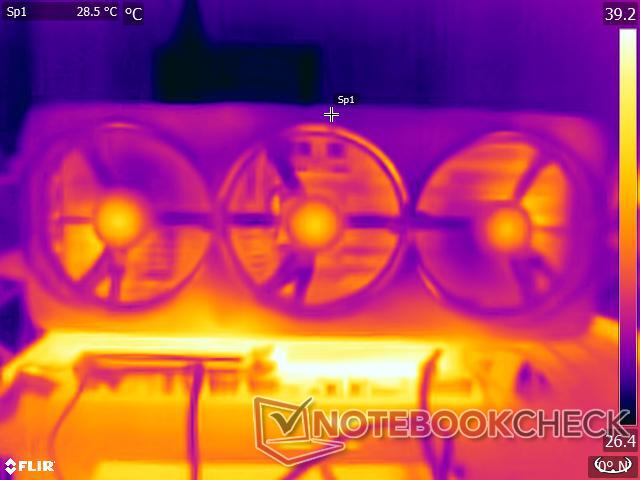
Temperaturas da superfície
As temperaturas da superfície sob carga são toleráveis em sua maior parte. Em uma temperatura ambiente de 23 °C, a cobertura plástica frontal permanece relativamente fria a 28,5 °C, enquanto o painel traseiro de metal atinge quase 48 °C.
A região próxima ao conector 12VHPWR também fica bastante quente, chegando a 50 °C.


Níveis de ruído
A RTX 4080 Super Gaming OC tem um perfil de ruído mais alto em comparação com o que observamos anteriormente com a RTX 4070 Super Gaming OC.
Dito isso, as ventoinhas param totalmente no modo inativo e começam a acelerar somente depois que as temperaturas do núcleo atingem a marca de 55 °C, de acordo com a curva padrão da ventoinha.
Os usuários podem selecionar entre os modos BIOS OC e Silent VBIOS, mas não observamos nenhuma diferença significativa entre esses dois modos durante os testes. Na verdade, a chave VBIOS parece redundante, pois é possível ajustar facilmente as curvas da ventoinha de acordo com a preferência do usuário no aplicativo Gigabyte Control Center.
No entanto, registramos um nível máximo de pressão sonora (SPL) de 54,21 dB(A) ao testar a GPU com o FurMark no modo OC do BIOS com um PT de 125%.
Os níveis de ruído durante os jogos com o Witcher 3 a 1080p Ultra ficaram abaixo de 50 dB(A) SPL em todos os modos testados.
| Teste de estresse | Modo VBIOS/ Alvo de energia | Max. Velocidade do ventilador (RPM) | Ruído do ventilador dB(A) |
| FurMark 1280 x 720, sem AA | BIOS OC / 100% | 1.937 | 49,37 |
| FurMark 1280 x 720, sem AA | BIOS silenciosa / 100% | 1.997 | 50,09 |
| FurMark 1280 x 720, sem AA | BIOS OC / 125% | 2.326 | 54,21 |
| FurMark 1280 x 720, sem AA | BIOS silenciosa / 125% | 2.302 | 54,10 |
| A Witcher 3 1080p Ultra | BIOS OC / 100% | 1.814 | 48,24 |
| A Witcher 3 1080p Ultra | Silent BIOS / 100% | 1.801 | 48,66 |
| A Witcher 3 1080p Ultra | BIOS OC / 125% | 1.866 | 49,29 |
| A Witcher 3 1080p Ultra | BIOS silenciosa / 125% | 1.813 | 49,13 |
Gerenciamento de energia: Comparável à RTX 4080 FE com 100% PT
A RTX 4080 Super Gaming OC não é a mais econômica quando se trata de consumo de energia, dado o poderoso AD103 die, mas ainda é 20% mais econômica em comparação com a RX 7900 XTX.
O consumo de energia da placa da Gigabyte durante os testes FurMark e The Witcher 3 é comparável ao da RTX 4080 FE em um PT de 100%, embora seja 6% menos eficiente do que a última.
O consumo de energia durante a reprodução do Witcher 3 em 1080p Ultra é apenas marginalmente maior, indo de 100% para 125% PT, em comparação com um delta de 15% mais perceptível no FurMark.
Power Consumption: External monitor
| 1280x720 FurMark 1.19 GPU Stress Test (external Monitor) | |
| 1920x1080 The Witcher 3 ultra (external Monitor) | |
* ... menor é melhor
Pro
Contra
Veredicto: ganhos incrementais com o AD103 completo a um preço reduzido

A Gigabyte GeForce RTX 4080 Super Gaming OC 16G substitui totalmente sua antecessora RTX 4080 por um preço mais baixo, oferecendo 5% mais shaders, um aumento nominal de 45 MHz e memória um pouco mais rápida. A Gigabyte manteve todos os aspectos familiares da variante de última geração - um design de três slots, configuração WindForce de ventilador triplo com nove heatpipes e RGB decente.
No geral, a placa da Gigabyte consegue ficar um pouco à frente da RTX 4080 Founders Edition em sintéticos correspondentes ao aumento na contagem de shaders. Os deltas foram surpreendentemente mais amplos nos testes de jogos, mas os ganhos exatos, se houver, dependerão do jogo em si e da resolução em que o usuário estiver jogando.
A RTX 4090 Founders Edition (US$ 1.599 na Best Buy) ainda lidera os gráficos, e a Nvidia tem pouco incentivo para lançar uma RTX 4090 Ti ou Super, já que a Team Red parece indiferente a qualquer tentativa de perturbar o status quo do carro-chefe.
A Gigabyte RTX 4080 Super Gaming OC 16G oferece excelente desempenho em jogos 4K, que só melhora com o suporte às novas tecnologias DLSS. O aumento de US$ 50 em relação ao RTX 4080 Super FE não é totalmente desperdiçado, mas o AMD Radeon RX 7900 XTX é uma oferta igualmente competente se o senhor quiser economizar um pouco mais."
A Nvidia parece ter jogado bem suas cartas (trocadilho intencional) ao reduzir o preço de venda da RTX 4080 FE em US$ 200. Idealmente, esse deveria ter sido o preço em 2022, mas demorou um pouco até que a AMD Radeon RX 7900 XTX (a partir de US$ 926 na Amazon) chegasse para oferecer qualquer semelhança de concorrência.
Ambas as placas são excelentes para jogos com alta taxa de atualização em 1440p e 4K nativo de 60 fps, mas a RX 7900 XTX parece ser uma aposta melhor em termos de custo-benefício nesse segmento.
No entanto, a RTX 4080 Super Gaming OC vem com benefícios que somente as placas da Nvidia podem oferecer no momento. Isso inclui melhor desempenho geral de traçado de raios, juntamente com suporte para geração de quadros DLSS 3 e tecnologias de reconstrução de raios DLSS 3.5, além de eficiência energética maciçamente aprimorada.
A Gigabyte oferece um conjunto de recursos decente para a marca adicional de US$ 50, como um cooler de alta capacidade, switch VBIOS duplo, boa estética, suportes de apoio para evitar a queda da GPU e uma garantia de quatro anos.
Mas será que faz sentido gastar mil dólares em uma nova GPU neste momento? Talvez não. A RTX 4070 Super (a partir de US$ 600 na Amazon) já é capaz de oferecer jogos em 4K decentes com alguma ajuda de upscaling, e talvez seja prudente esperar para ver o que as próximas GPUs Nvidia Blackwell e AMD RDNA 4 têm a oferecer ainda este ano.
A RTX 4080 não-Super original está oficialmente esgotada, mas não é uma má ideia procurar algumas ótimas pechinchas no mercado local.
Preço e disponibilidade
A Gigabyte GeForce RTX 4080 Super Gaming OC 16G tem preço oficial de US$ 1.050 MSRP, mas atualmente está sendo vendida por US$ 1.100 na Amazon US e na Best Buy US.
A placa ainda não está listada na Amazon Índia, mas os preços em lojas de varejo locais podem variar de ₹1.20.000 a ₹1.28.000.
Transparência
A seleção dos dispositivos a serem analisados é feita pela nossa equipe editorial. A amostra de teste foi fornecida ao autor como empréstimo pelo fabricante ou varejista para fins desta revisão. O credor não teve influência nesta revisão, nem o fabricante recebeu uma cópia desta revisão antes da publicação. Não houve obrigação de publicar esta revisão. Como empresa de mídia independente, a Notebookcheck não está sujeita à autoridade de fabricantes, varejistas ou editores.
É assim que o Notebookcheck está testando
Todos os anos, o Notebookcheck analisa de forma independente centenas de laptops e smartphones usando procedimentos padronizados para garantir que todos os resultados sejam comparáveis. Desenvolvemos continuamente nossos métodos de teste há cerca de 20 anos e definimos padrões da indústria no processo. Em nossos laboratórios de teste, equipamentos de medição de alta qualidade são utilizados por técnicos e editores experientes. Esses testes envolvem um processo de validação em vários estágios. Nosso complexo sistema de classificação é baseado em centenas de medições e benchmarks bem fundamentados, o que mantém a objetividade.Price comparison

