Análise do Asus TUF Gaming GeForce RTX 4070 Ti Super: AD103 mid-ranger que desafia a RX 7900 XT e substitui a RTX 3090 Ti por US$ 300 a menos

Nvidia lançou a RTX 4070 Ti Super juntamente com a RTX 4070 Super e a RTX 4080 Super durante a CES 2024. Com essa atualização, a RTX 4070 Ti Super agora se tornou uma GPU AD103, que traz consigo uma atualização substancial do subsistema de memória, juntamente com os aumentos habituais na contagem de núcleos CUDA.
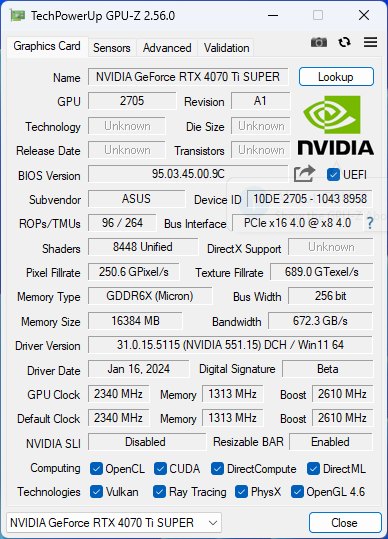
A RTX 4070 Ti Super agora conta com 8.448 núcleos CUDA, o que representa um aumento de 10% em relação aos 7.680 shaders da RTX 4070 Ti original. A transição para o silício AD103 fornece à placa um barramento de memória de 16 GB GDDR6X de 256 bits que produz uma largura de banda de 672 GB/s.
Mais uma vez, a Nvidia optou por não oferecer uma Founders Edition para a RTX 4070 Ti Super, mas há muitas opções de escolha entre as ofertas de parceiros de placas de vídeo (AiB). A maioria das AiBs tem placas voltadas para o MSRP de US$ 799, mas também oferece SKUs com recursos adicionais por um preço mais alto.
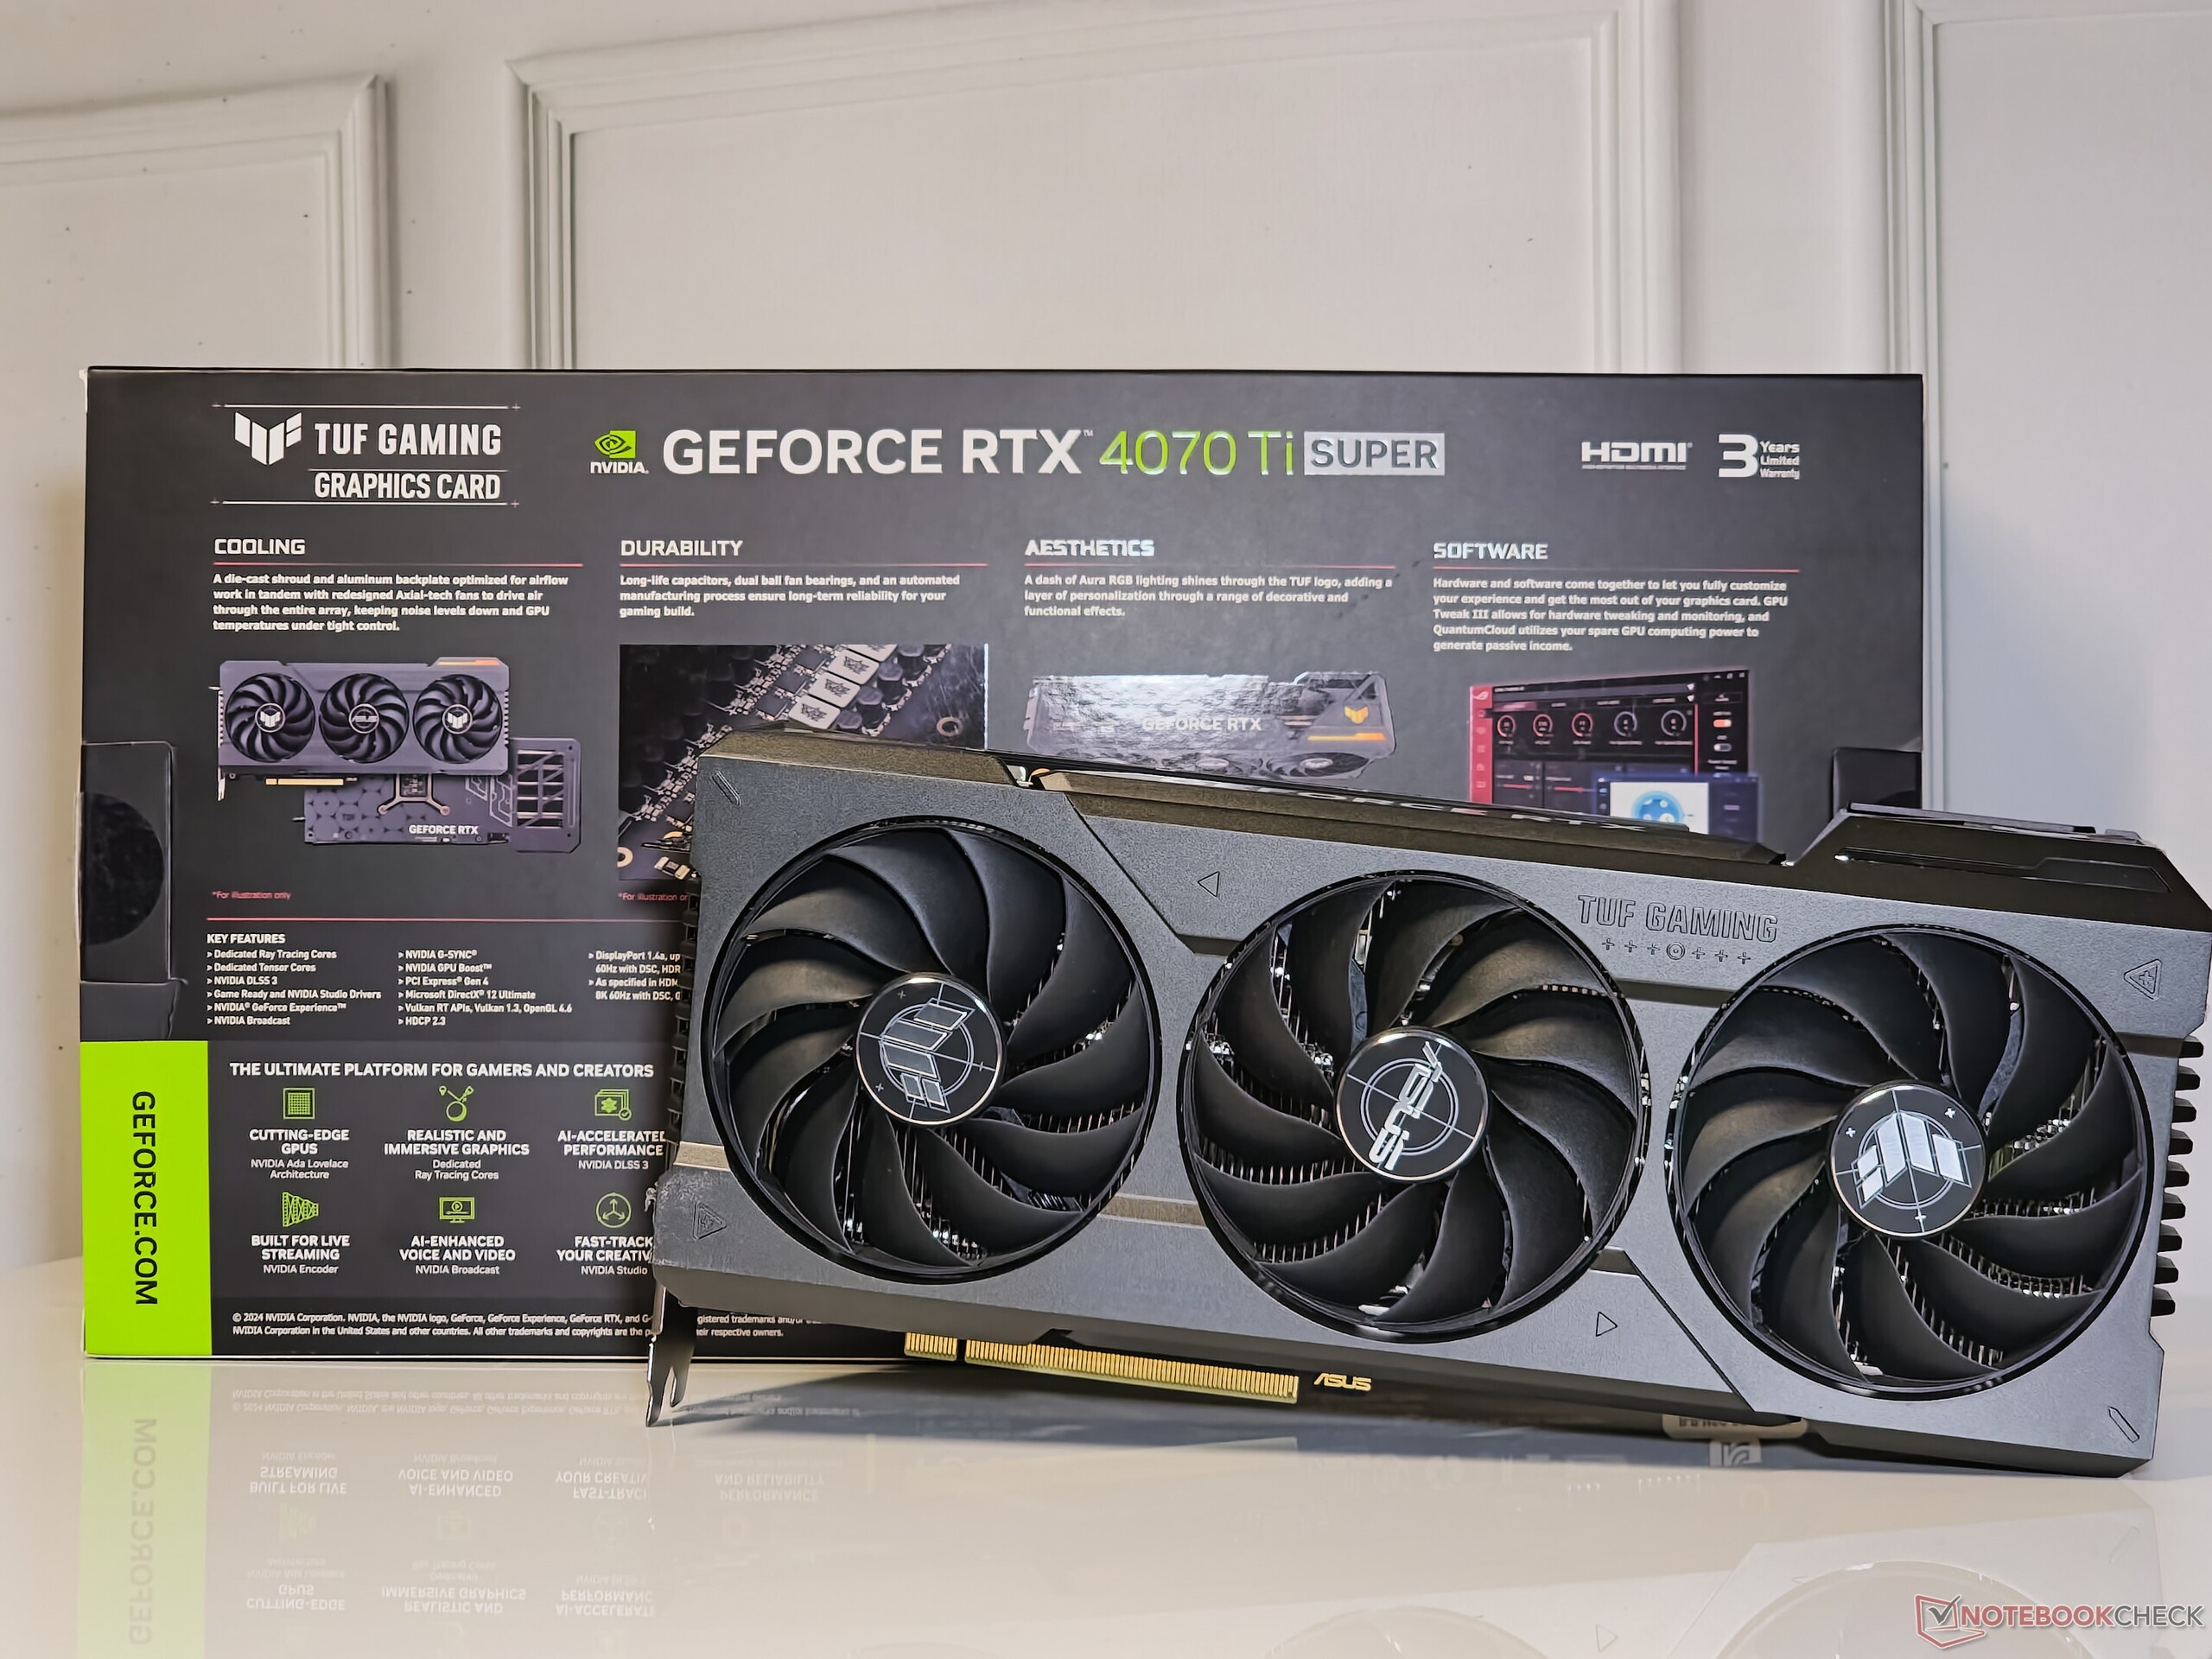
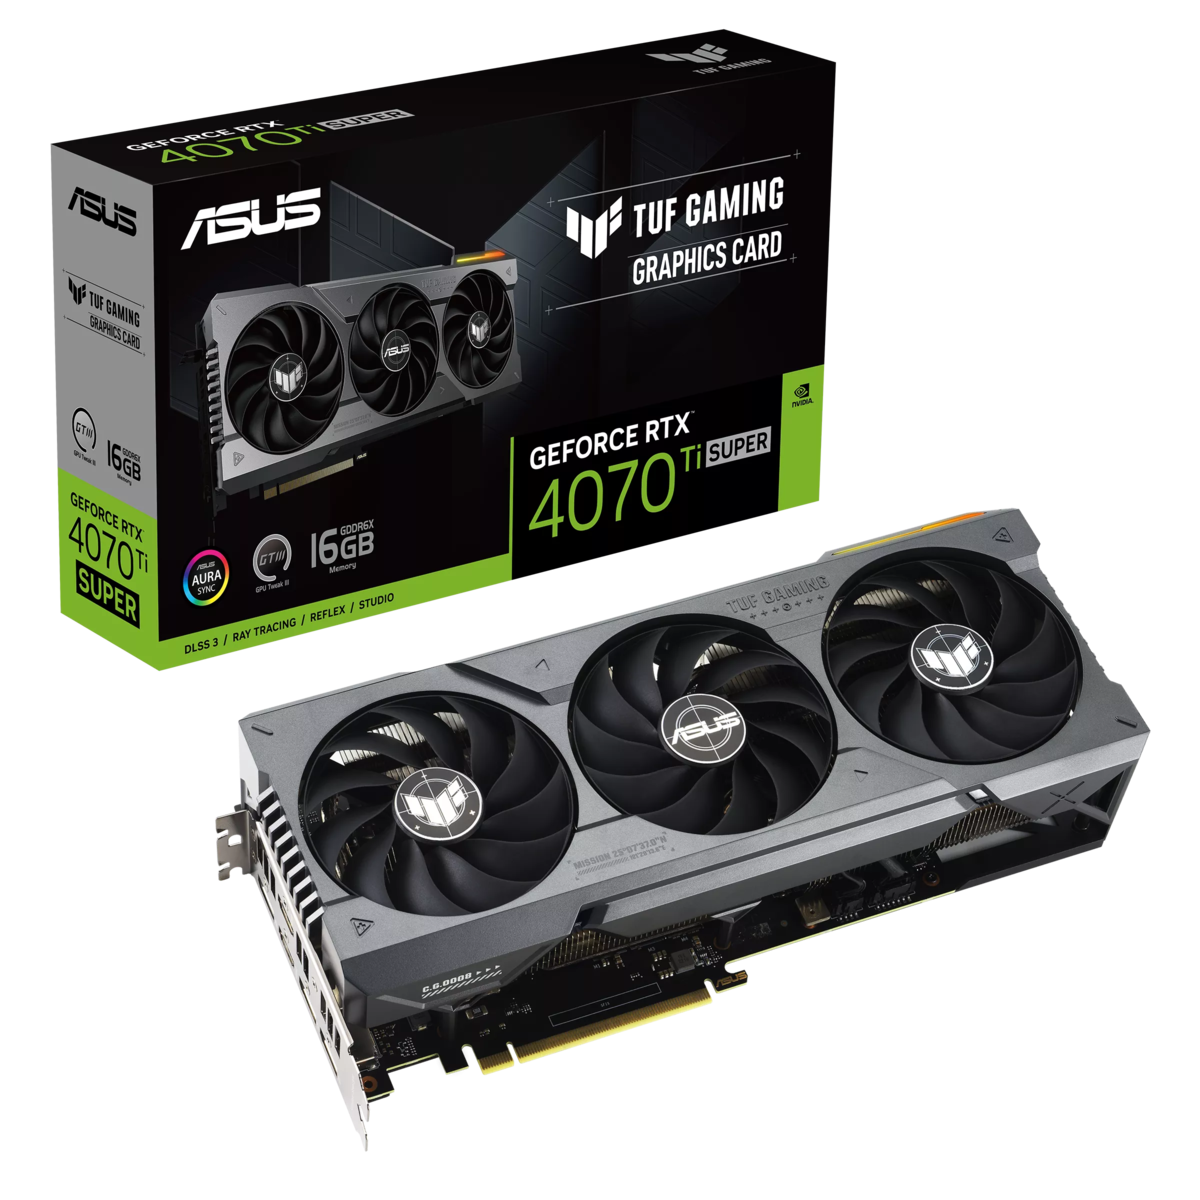
Em relação a isso, temos agora conosco a nova Asus TUF Gaming GeForce RTX 4070 Ti Super. Essa placa é vendida por US$ 799 ou ₹95.000 na Índia e vem com uma garantia de três anos. A Asus também está oferecendo uma variante OC dessa placa que substitui totalmente a original TUF Gaming GeForce RTX 4070 Ti OC que analisamos no ano passado.
Nesta análise, colocamos a Asus TUF Gaming GeForce RTX 4070 Ti Super à prova e verificamos se essas melhorias de hardware resultam em ganhos tangíveis em benchmarks sintéticos e jogos.
Comparação da Asus TUF Gaming RTX 4070 Ti Super com outras GPUs da Nvidia
| Especificação | RTX 4090 FE | RTX 4080 Super FE | RTX 4080 FE | Asus TUF RTX 4070 Ti Super | Asus TUF RTX 4070 Ti | RTX 4070 Super | ZotacRTX 4070 AMP Airo | KFA2RTX 4060 Ti EX | RTX 3090 Ti FE | RTX 3090 FE | RTX 3080 Ti FE | RTX 3070 Ti FE | RTX 3070 FE | Titan RTX |
|---|---|---|---|---|---|---|---|---|---|---|---|---|---|---|
| Chip | AD102 | AD103 | AD103 | AD103 | AD104 | AD104 | AD104 | AD106 | GA102 | GA102 | GA102 | GA104 | GA104 | TU102 |
| Processo FinFET | 4N personalizado | 4N personalizado | 4N personalizado | 4N personalizado | 4N personalizado | 4N personalizado | 4N personalizado | 4N personalizado | 8 nm | 8 nm | 8 nm | 8 nm | 8 nm | 12 nm |
| Núcleos CUDA | 16.384 | 10.240 | 9.728 | 8.448 | 7.680 | 7.168 | 5.888 | 4.352 | 10.752 | 10.496 | 10.240 | 6.144 | 5.888 | 4.608 |
| Unidades de textura | 512 | 320 | 304 | 264 | 240 | 224 | 184 | 136 | 336 | 328 | 320 | 192 | 184 | 288 |
| Núcleos de Tensor | 512 4ª Geração | 320 4ª Geração | 304 4ª Geração | 264 4ª Geração | 240 4ª Geração | 224 4ª Geração | 184 4ª Geração | 136 4ª Geração | 336 3ª Geração | 328 3ª Geração | 320 3ª Geração | 192 3ª Geração | 184 3ª Geração | 576 2ª Geração |
| RT Cores | 128 3ª geração | 80 3ª geração | 76 3ª geração | 66 3ª geração | 60 3ª geração | 56 3ª geração | 46 3ª geração | 34 3ª geração | 84 2ª geração | 82 2ª geração | 80 2ª geração | 48 2ª geração | 46 2ª geração | 72 |
| Relógio base da GPU | 2.235 MHz | 2.295 MHz | 2.205 MHz | 2.340 MHz | 2.310 MHz | 1.980 MHz | 1.920 MHz | 2.310 MHz | 1.560 MHz | 1.395 MHz | 1.365 MHz | 1.575 MHz | 1.500 MHz | 1.350 MHz |
| Relógio de aumento da GPU | 2.520 MHz | 2.550 MHz | 2.505 MHz | 2.610 MHz | 2.760 MHz | 2.565 MHz | 2.535 MHz | 2.535 MHz | 1.860 MHz | 1.695 MHz | 1.665 MHz | 1.770 MHz | 1.750 MHz | 1.770 MHz |
| Barramento de memória | 384-bit | 256-bit | 256-bit | 256-bit | 192-bit | 192-bit | 192-bit | 128-bit | 384-bit | 384-bit | 384-bit | 256-bit | 256-bit | 384-bit |
| Largura de banda da memória | 1.008 GB/s | 736,3 GB/s | 716,8 GB/s | 672 GB/s | 504 GB/s | 504 GB/s | 504 GB/s | 288 GB/s | 1.008 GB/s | 936 GB/s | 912 GB/s | 608 GB/s | 448 GB/s | 672 GB/s |
| Memória de vídeo | 24 GB GDDR6X | 16 GB GDDR6X | 16 GB GDDR6X | 16 GB GDDR6X | 12 GB GDDR6X | 12 GB GDDR6X | 12 GB GDDR6X | 8 GB GDDR6 | 24 GB GDDR6X | 24 GB GDDR6X | 12 GB GDDR6X | 8 GB GDDR6X | 8 GB GDDR6 | 24 GB GDDR6 |
| Consumo de energia | 450 W | 320 W | 320 W | 285 W | 285 W | 220 W | 215 W | 160 W | 450 W | 350 W | 350 W | 290 W | 220 W | 280 W |
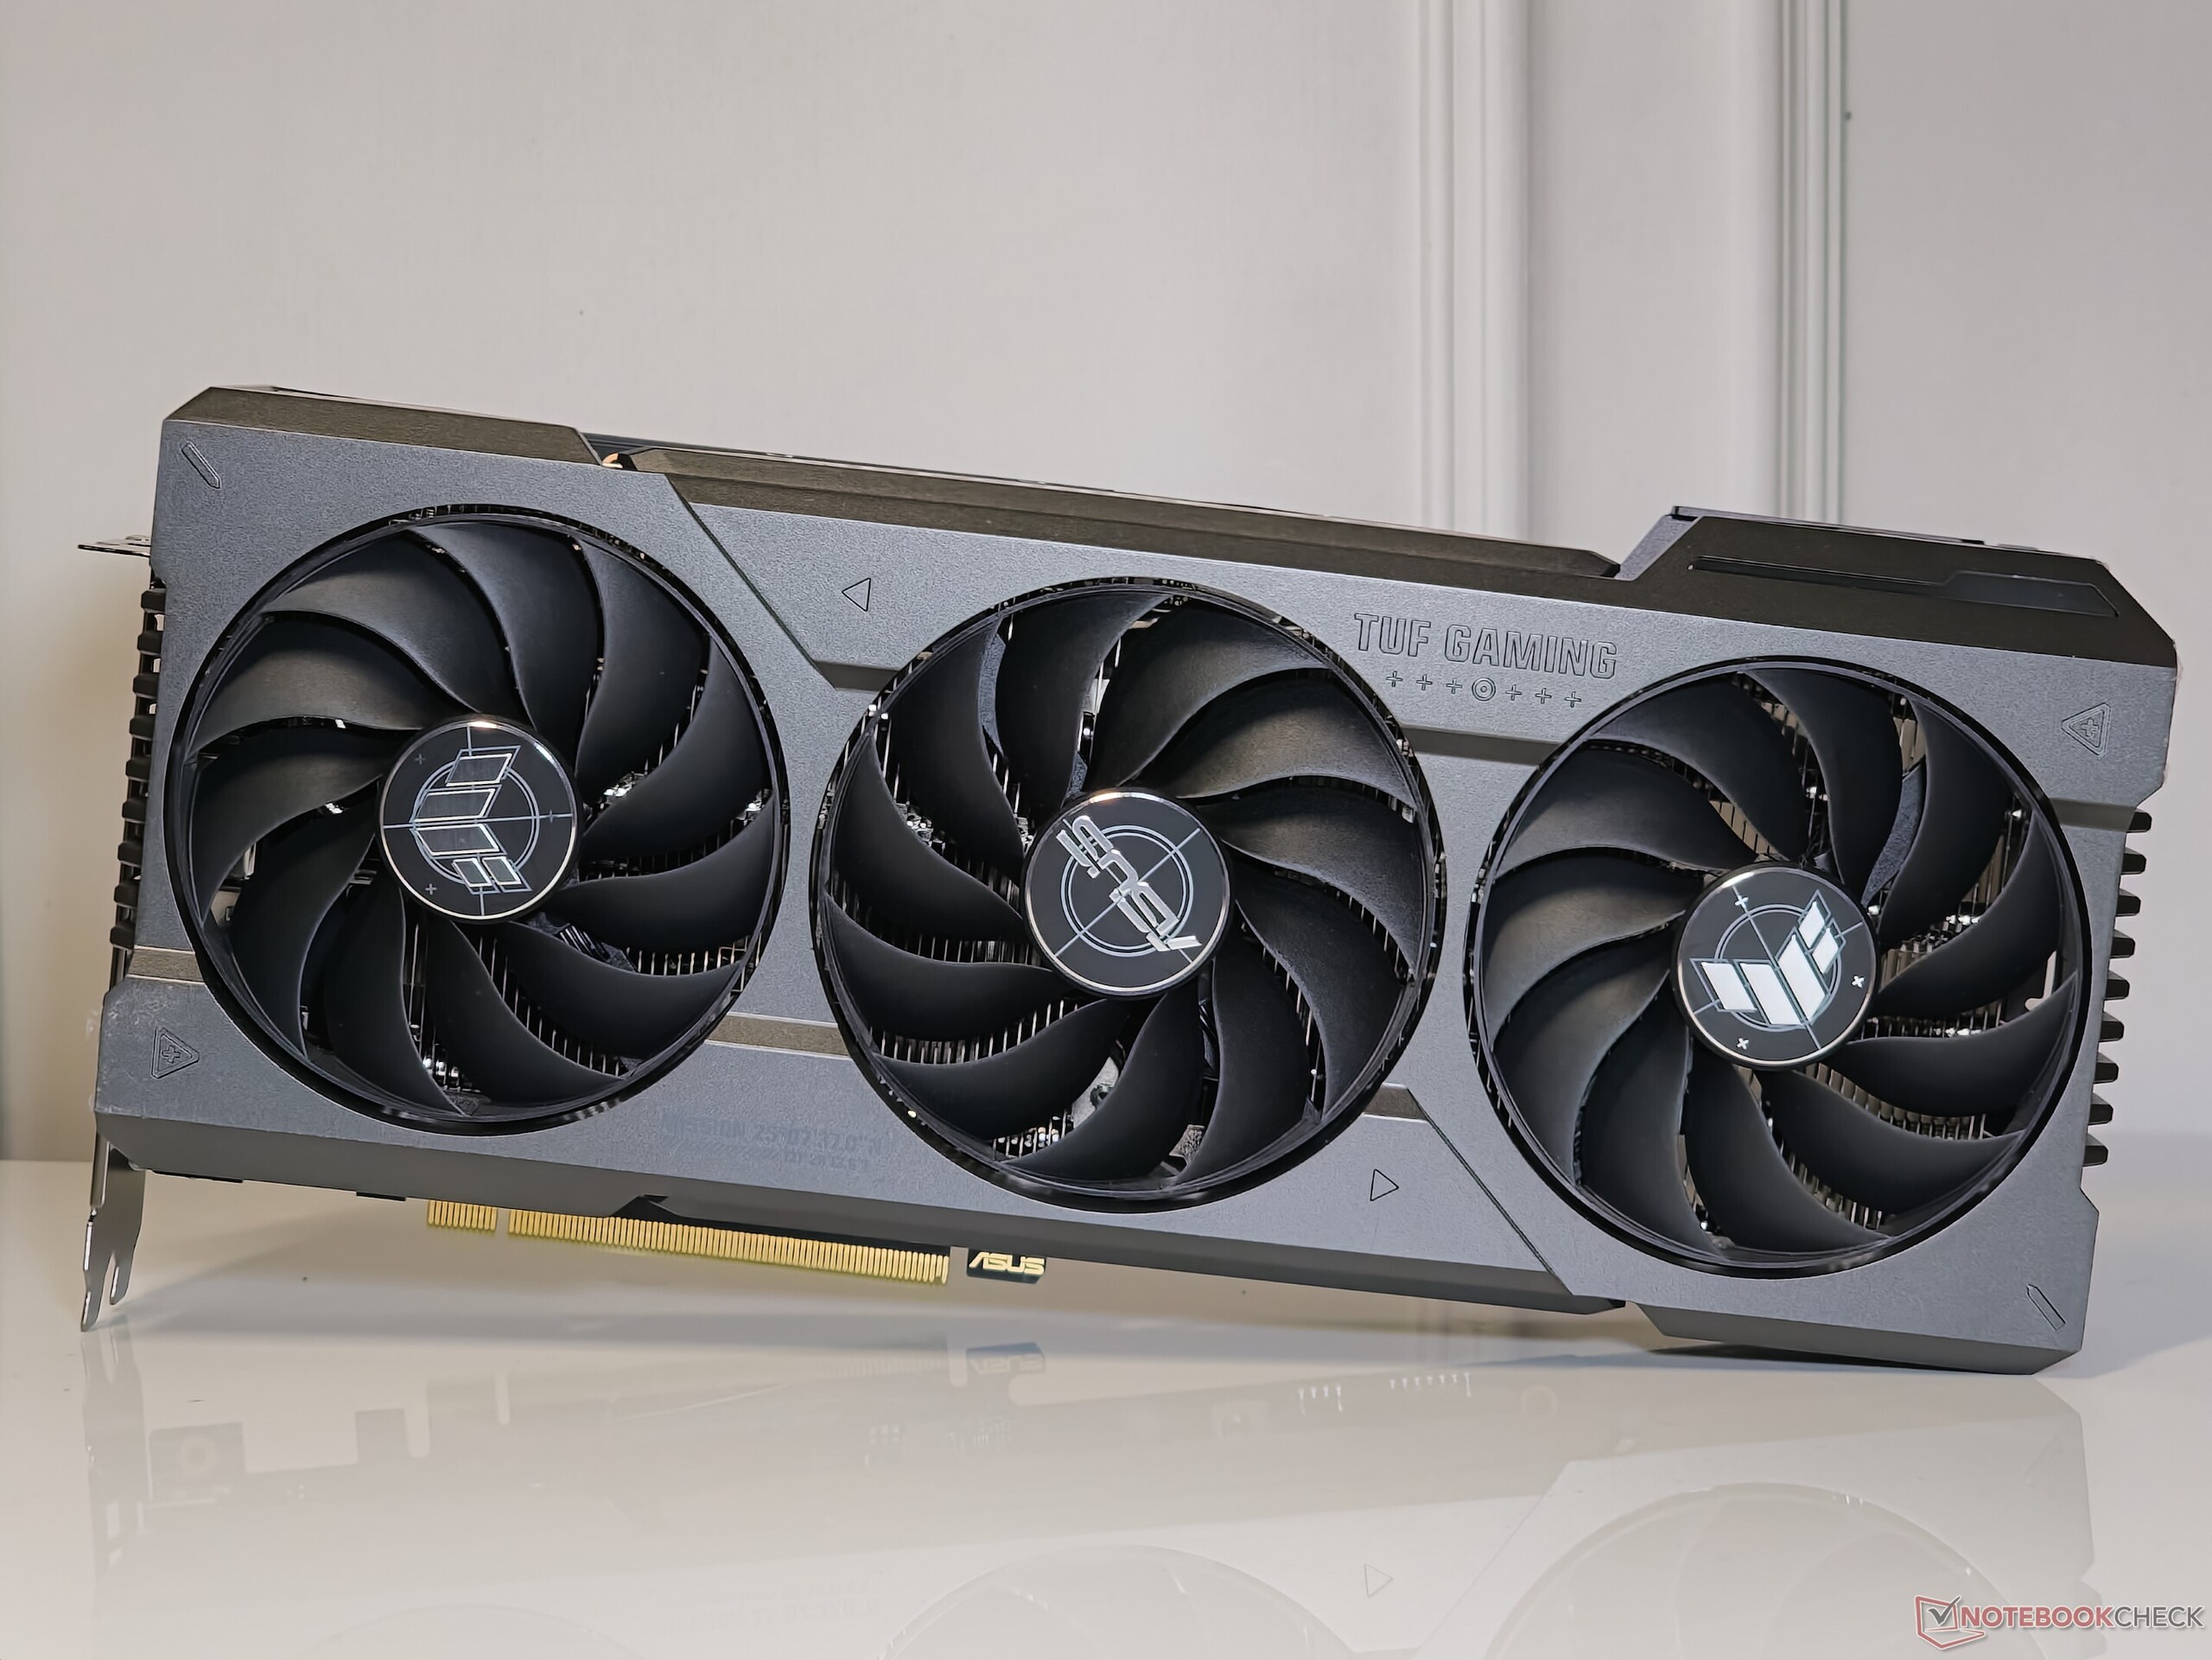
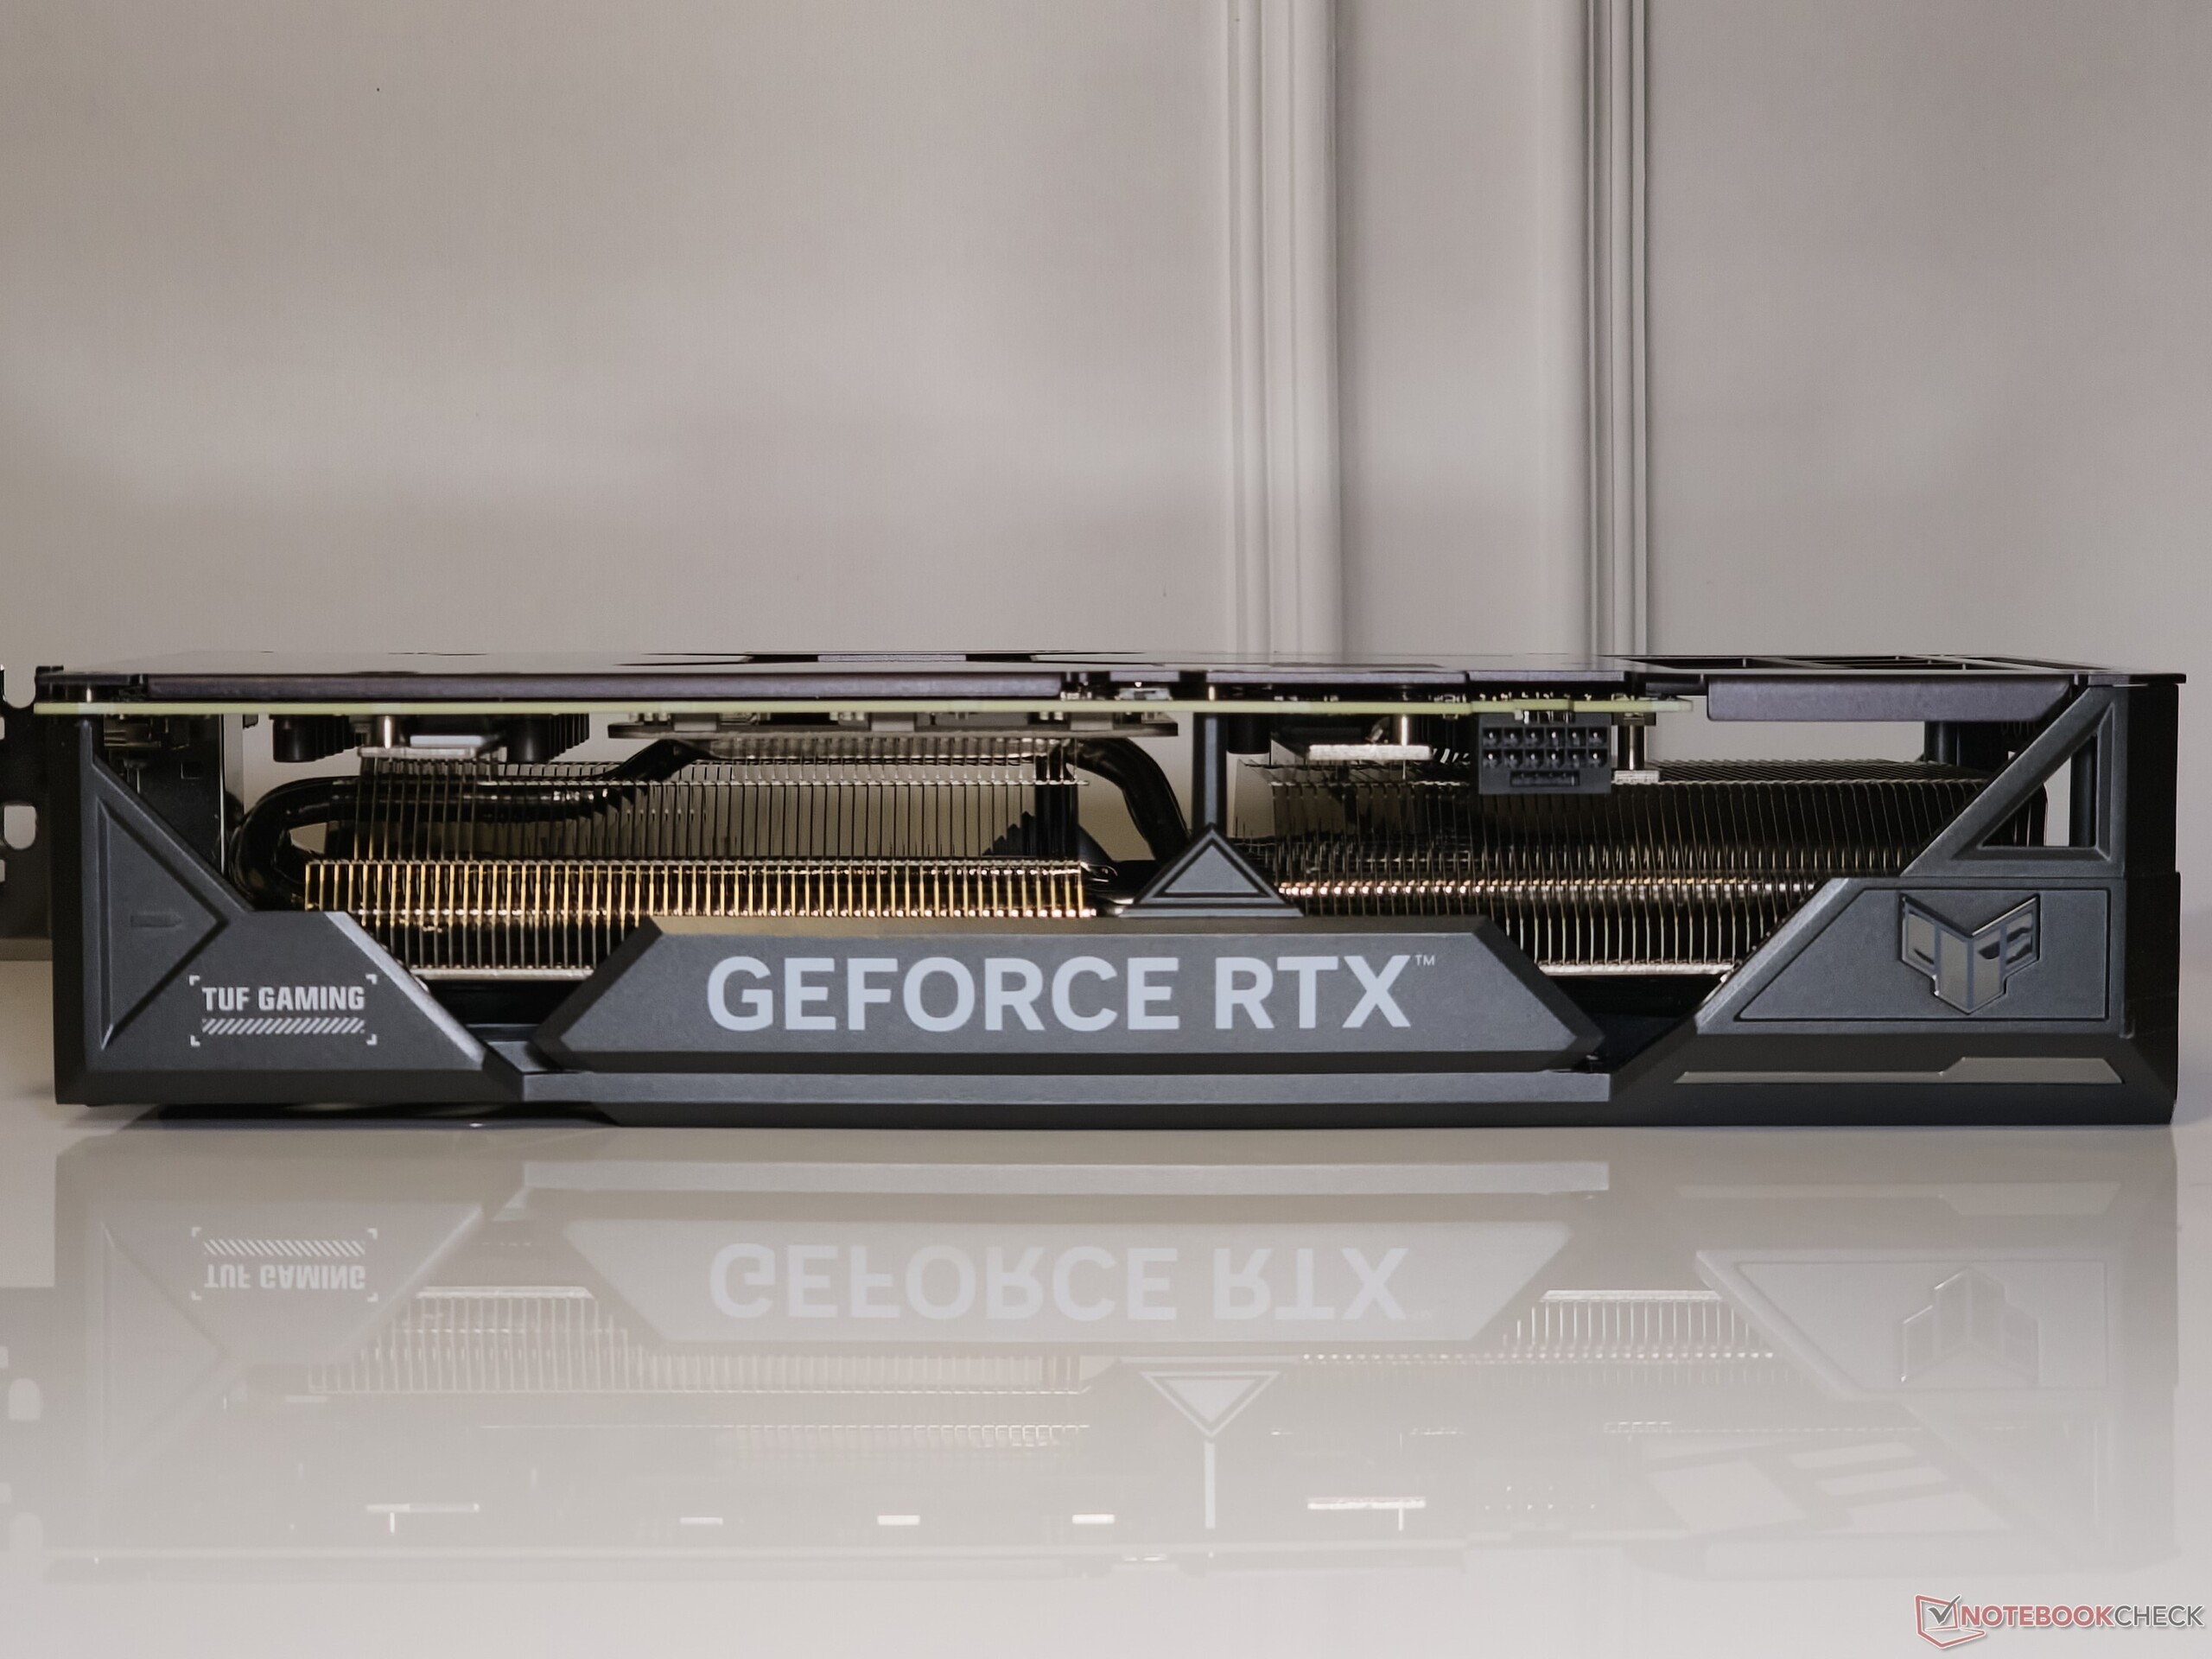
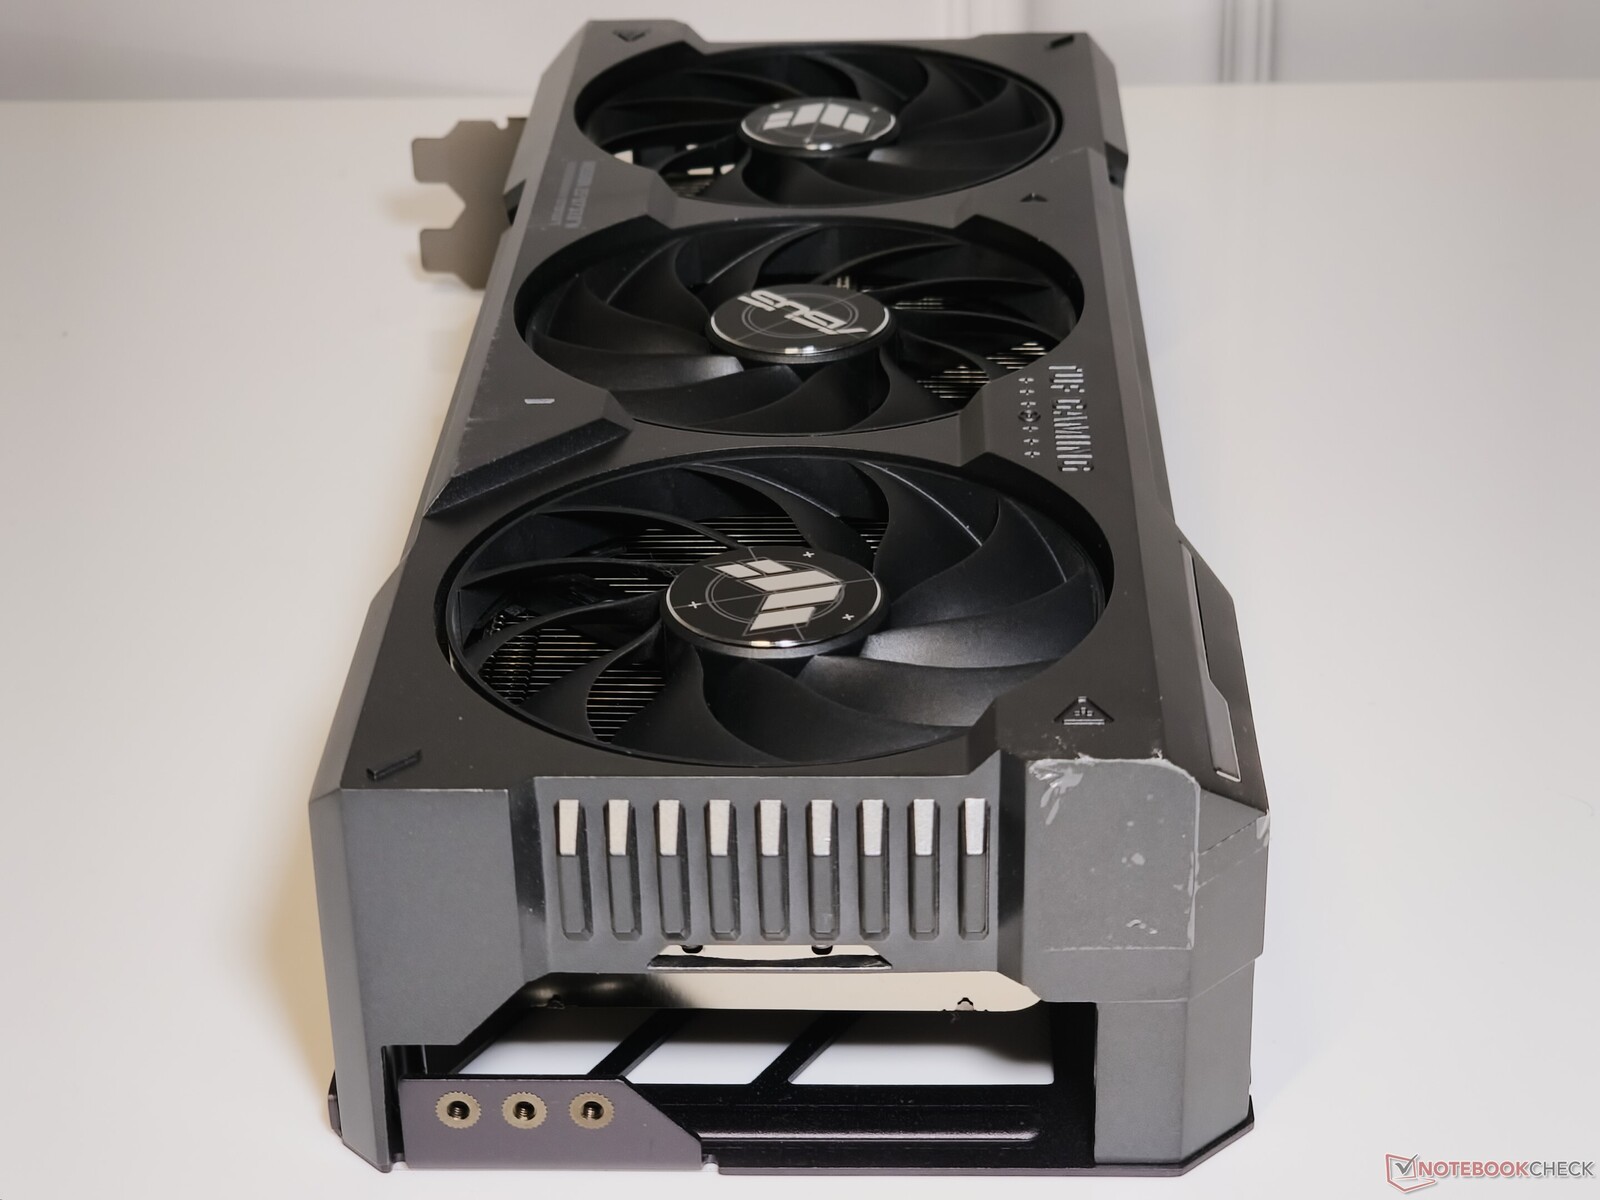
O Asus TUF Gaming GeForce RTX 4070 Ti Super de perto
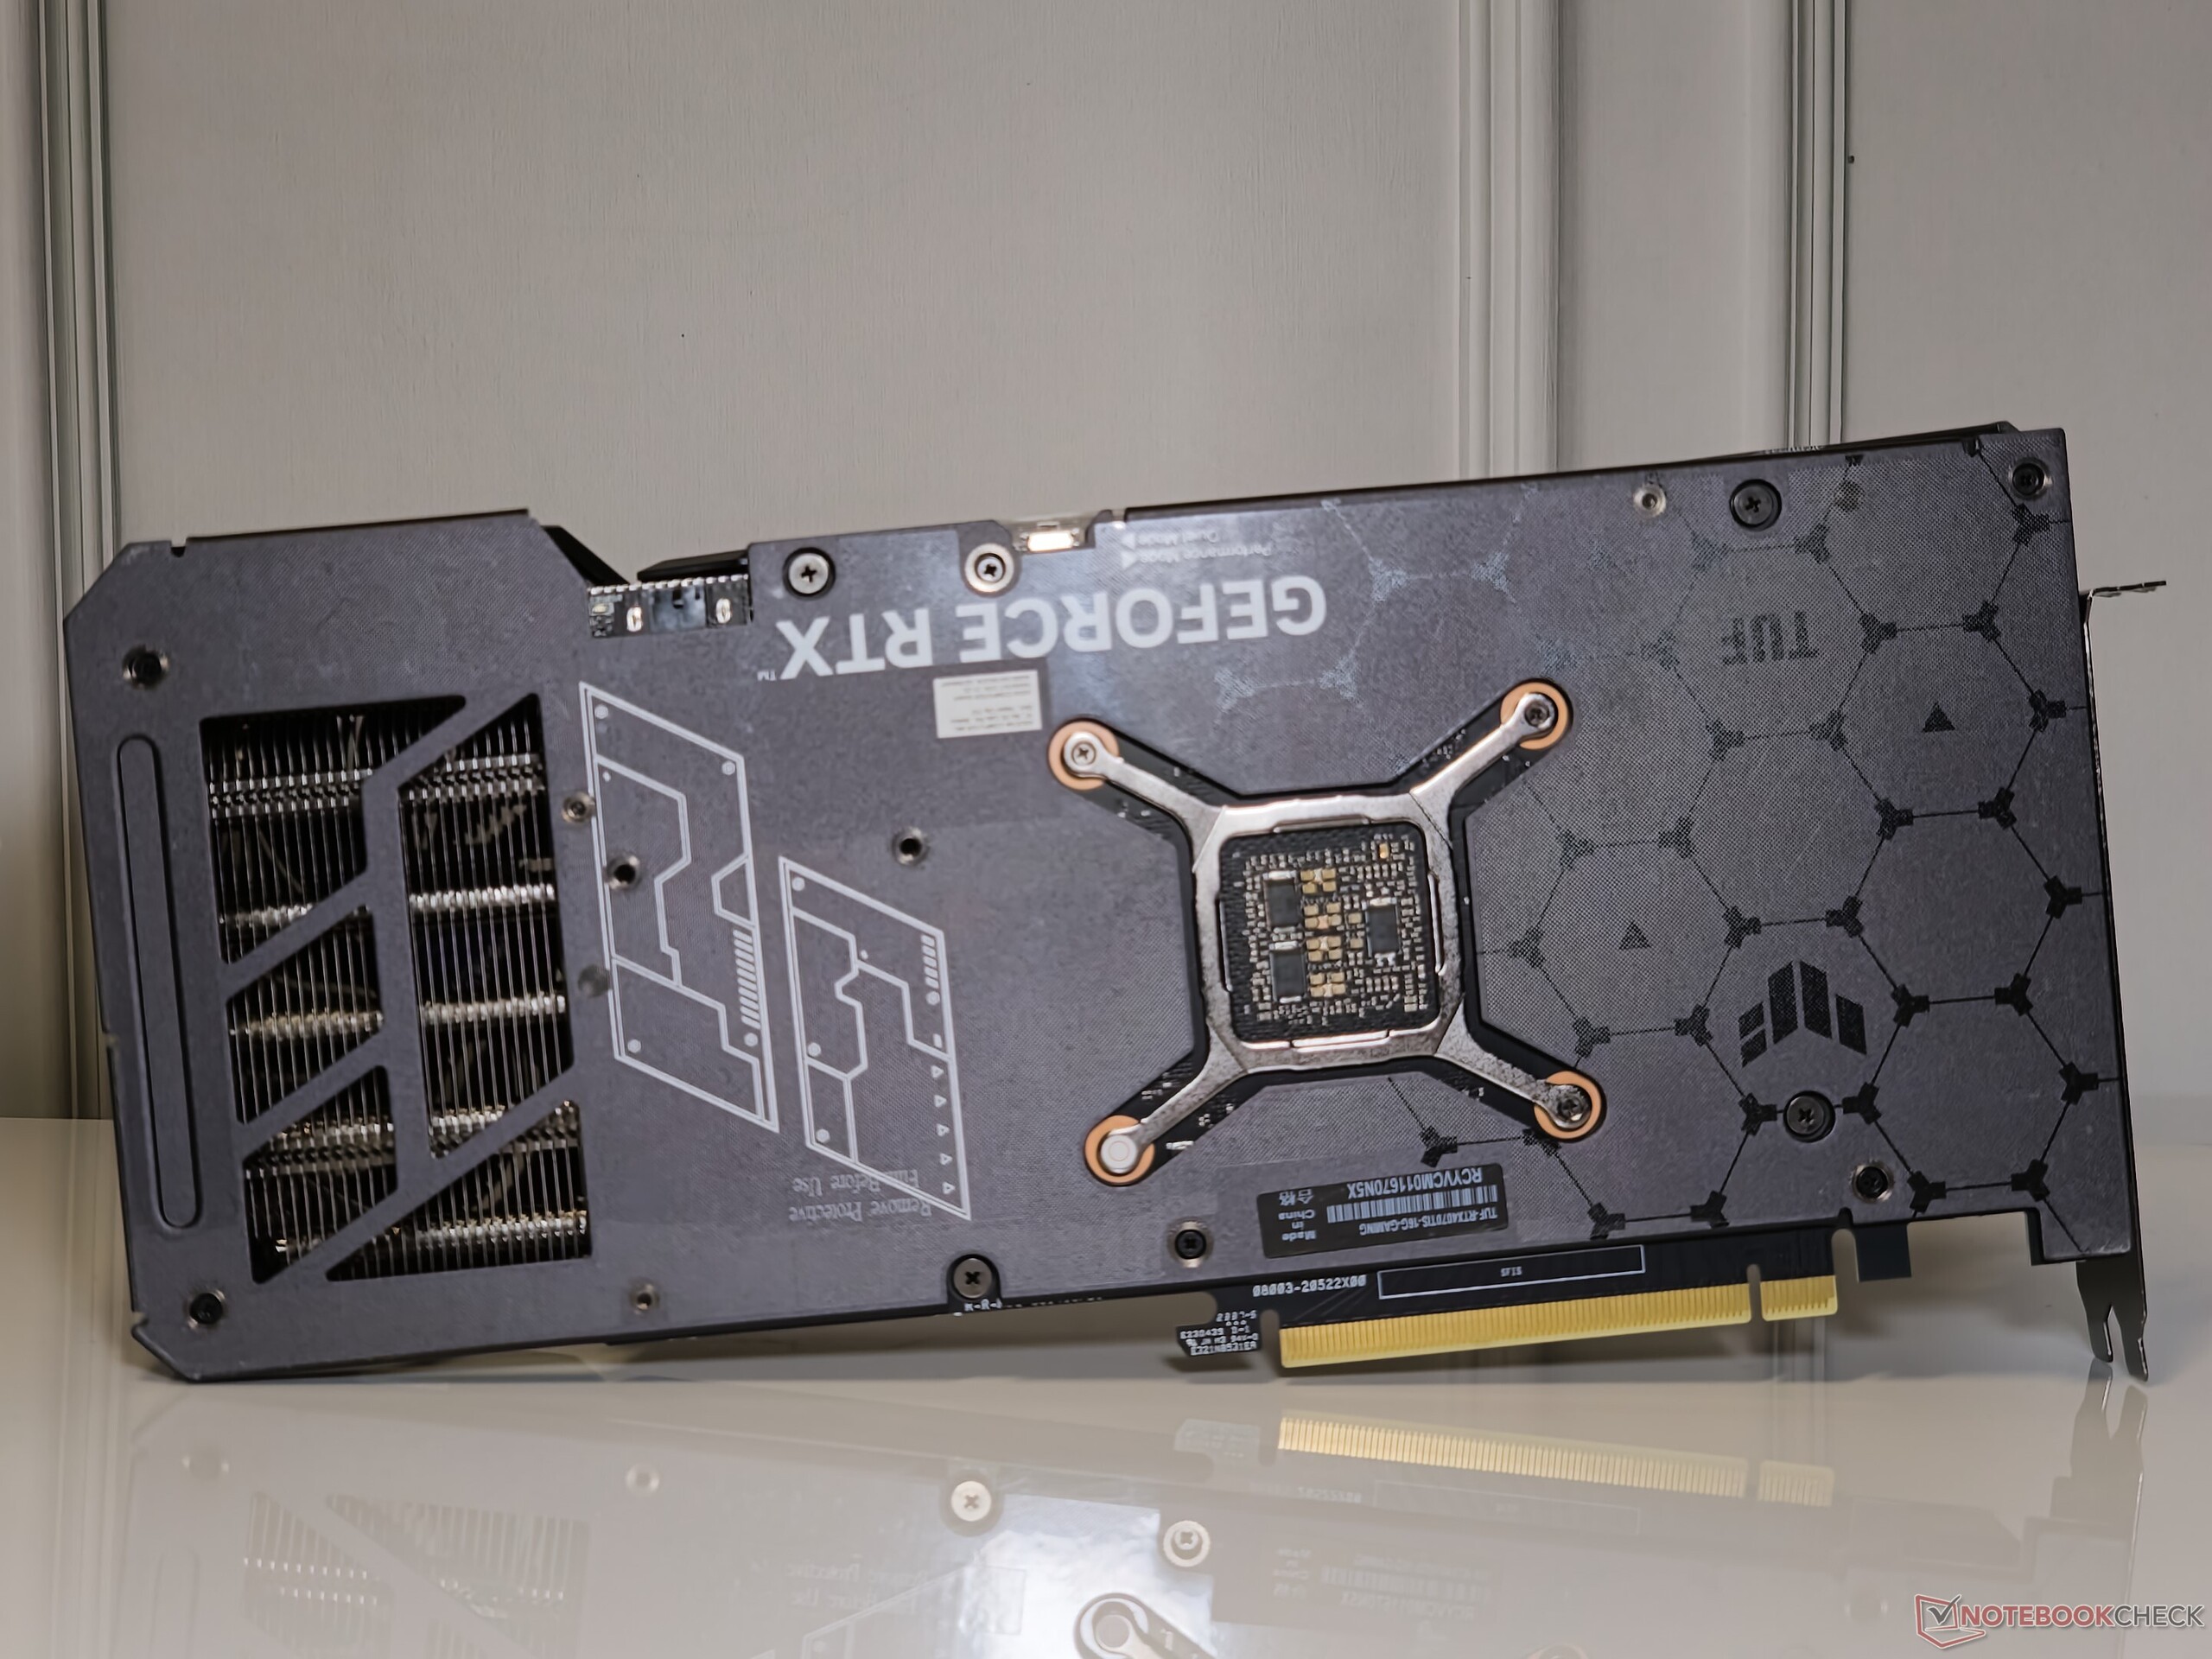
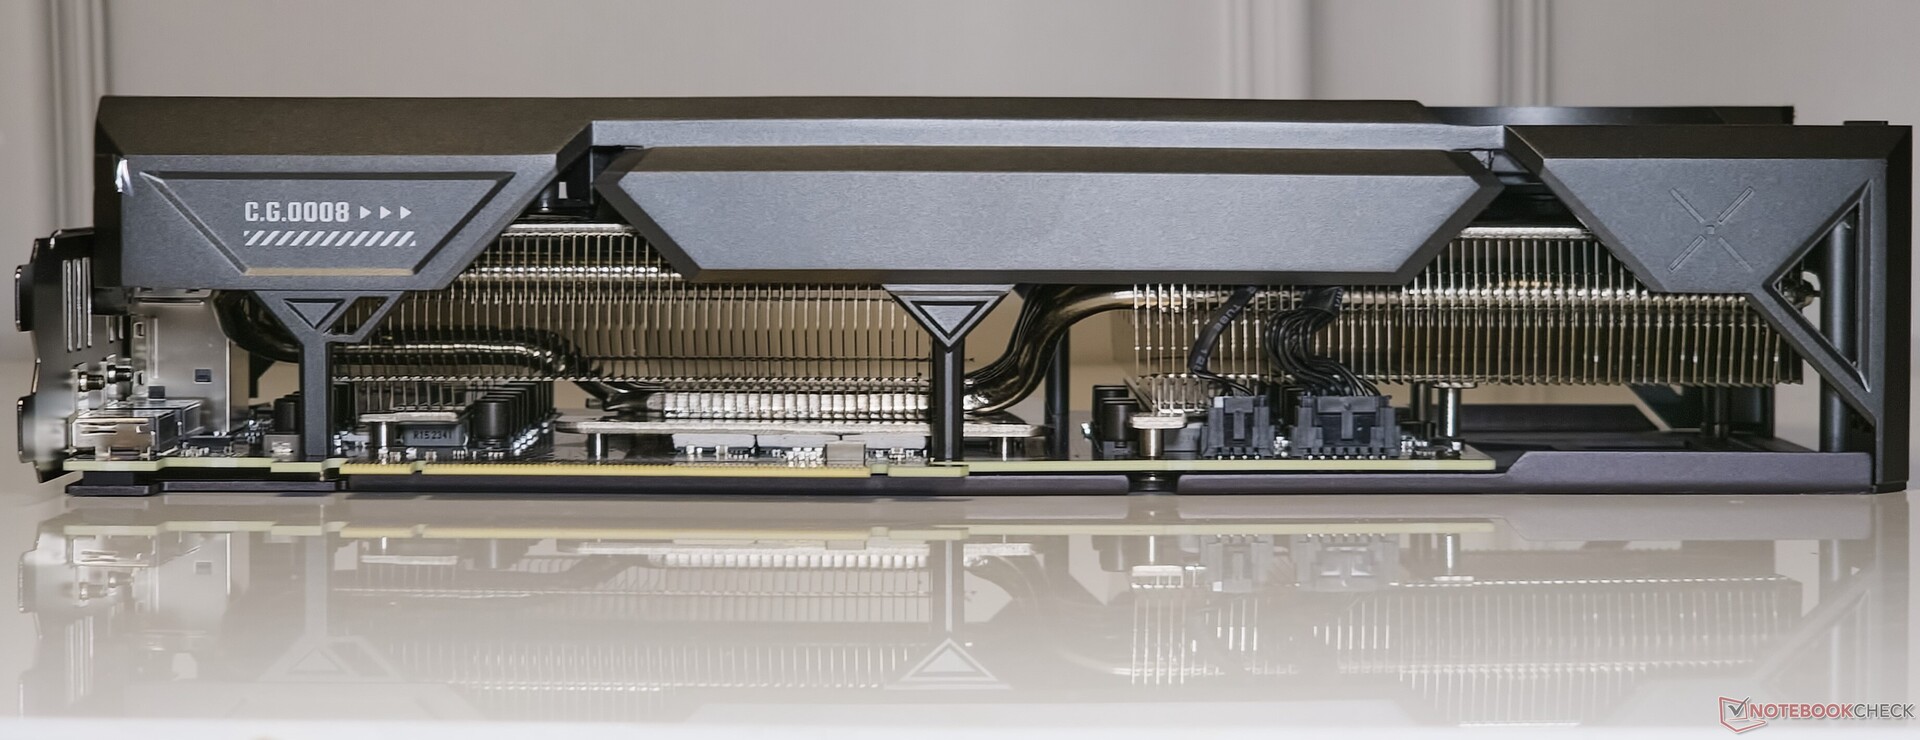
A placa TUF pode ser a oferta de nível básico da Asus para a RTX 4070 Ti Super, mas é construída como um tanque. A placa apresenta uma cobertura metálica, uma raridade em ofertas não premium. A placa traseira de metal aumenta o peso tranquilizador e apresenta recortes para ventilação.
Com 305 x 138 x 65 mm, a TUF Gaming GeForce RTX 4070 Ti Super não hesita em ocupar quase 3,5 slots na placa. Isso é algo que deve ser levado em conta se o senhor estiver planejando adicionar outras placas de expansão e tiver uma placa ATX ou menor com slots PCIe bem espaçados.
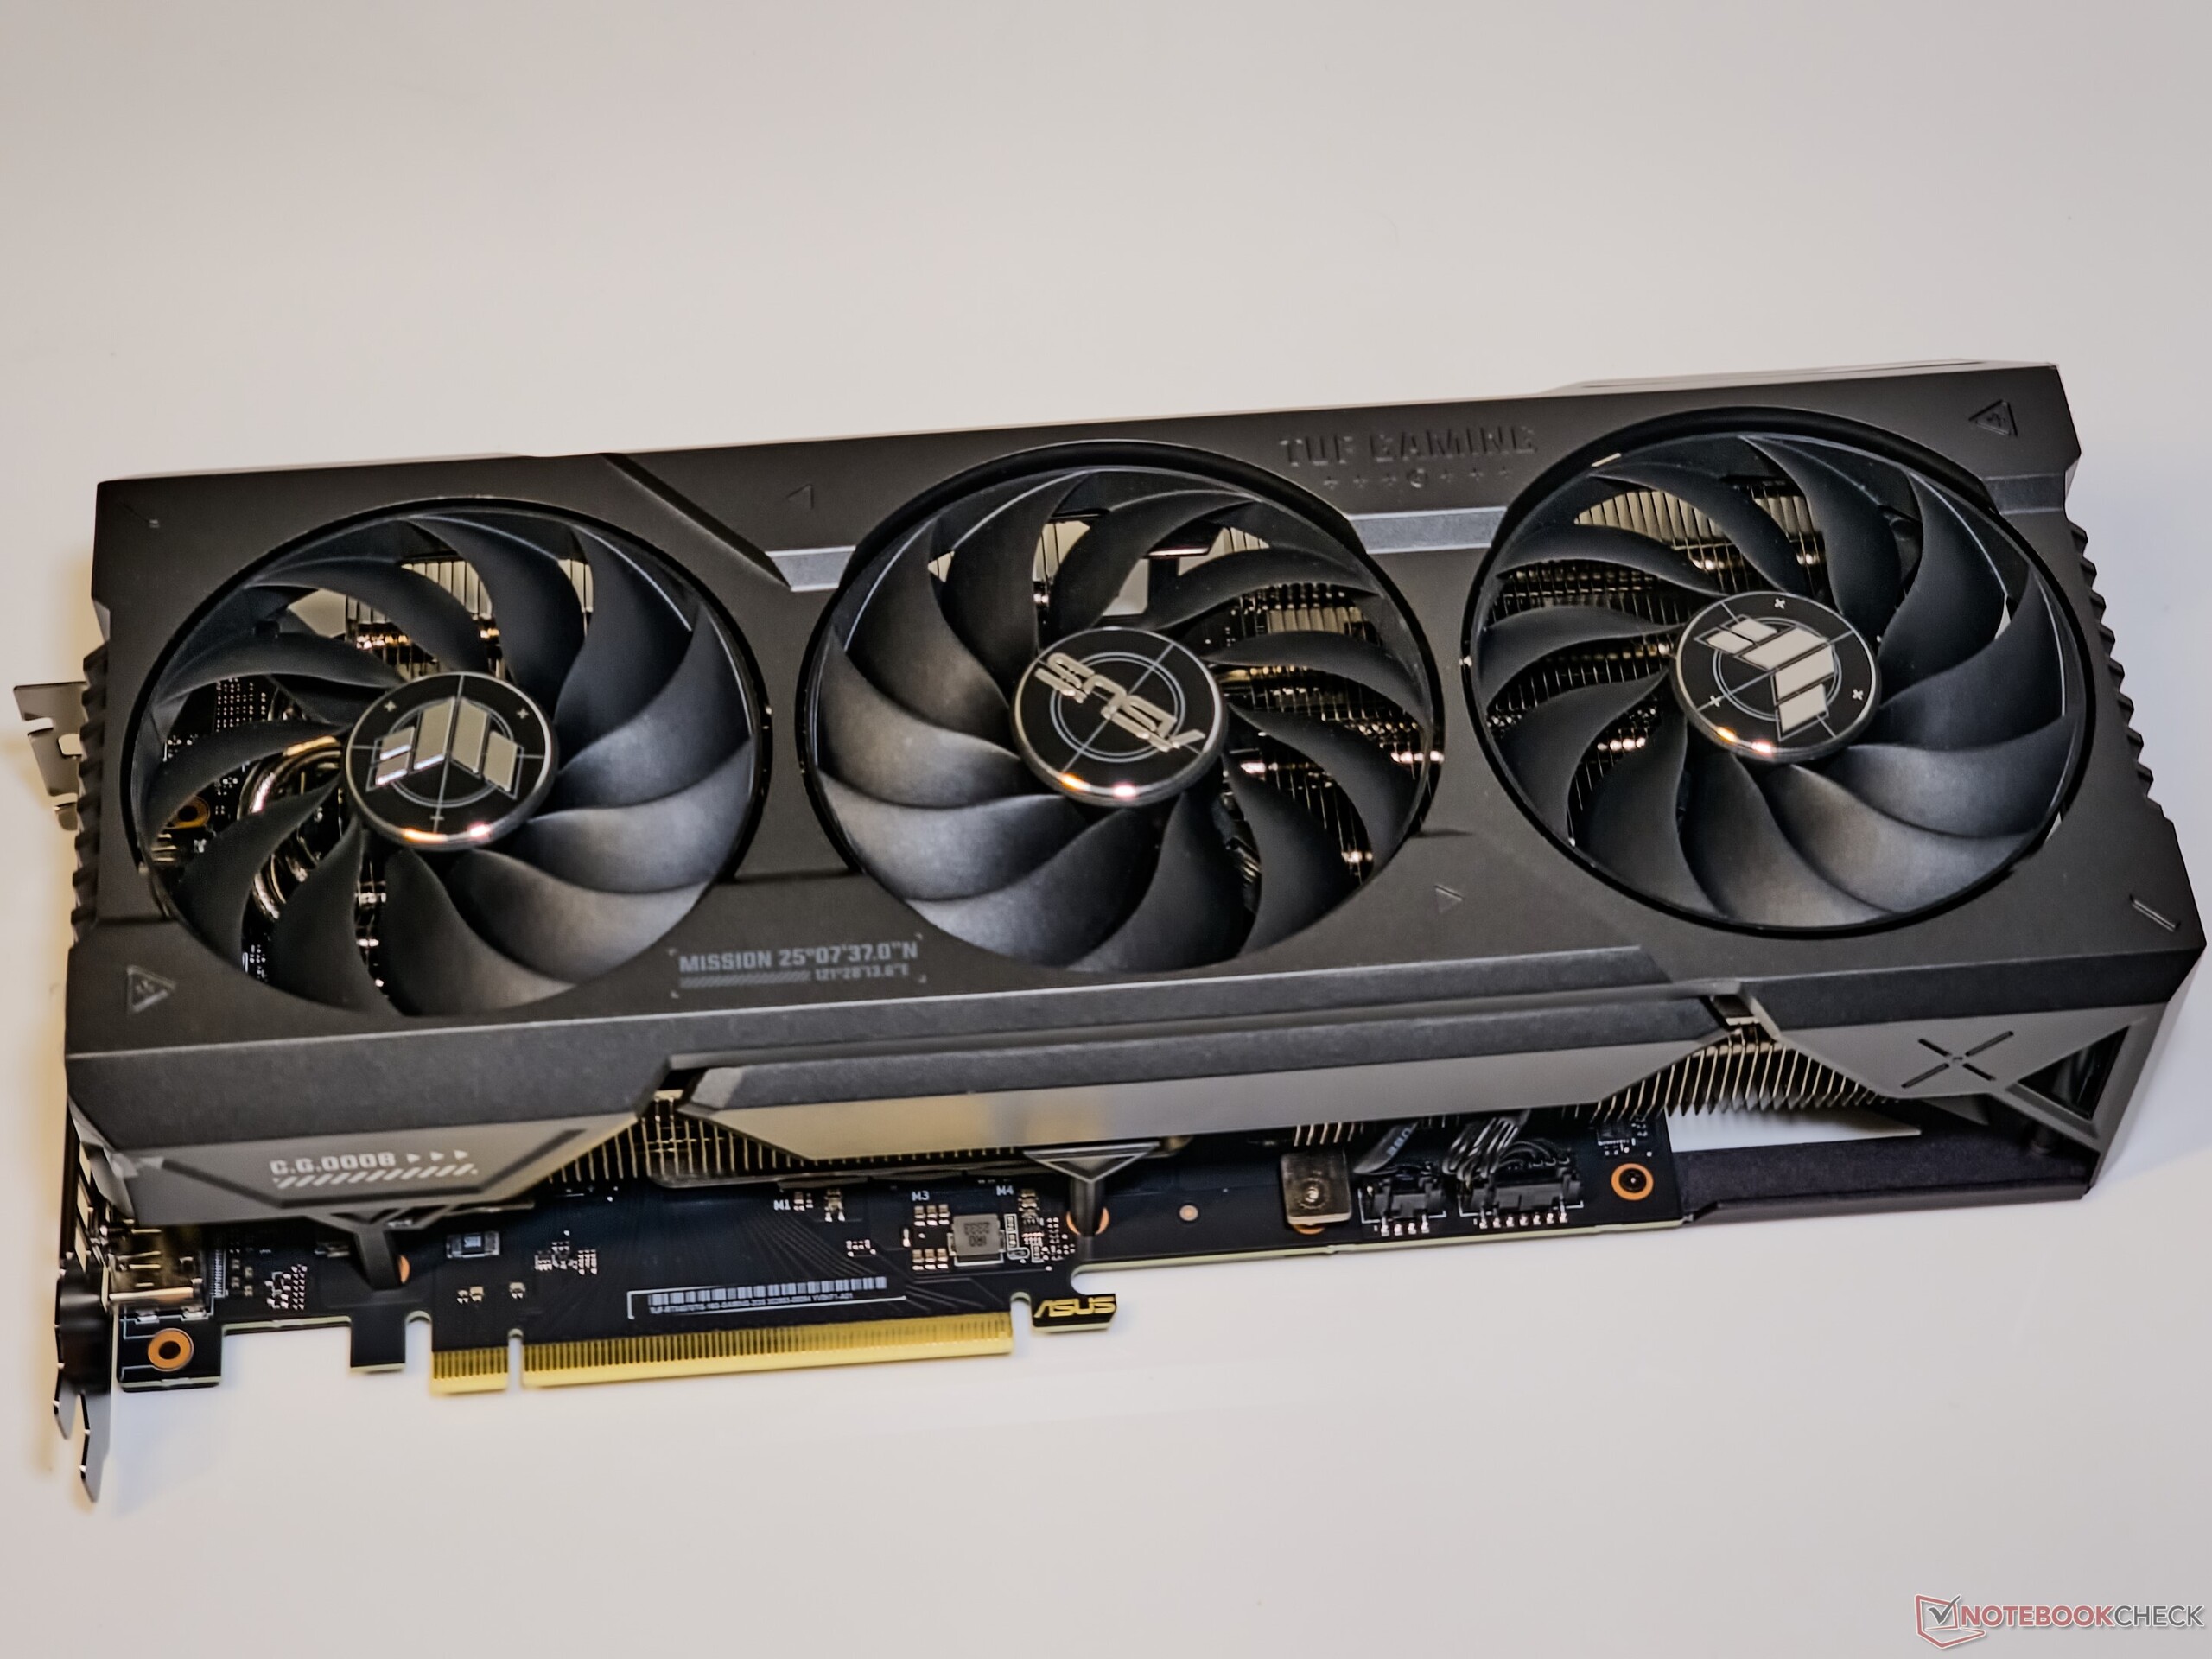
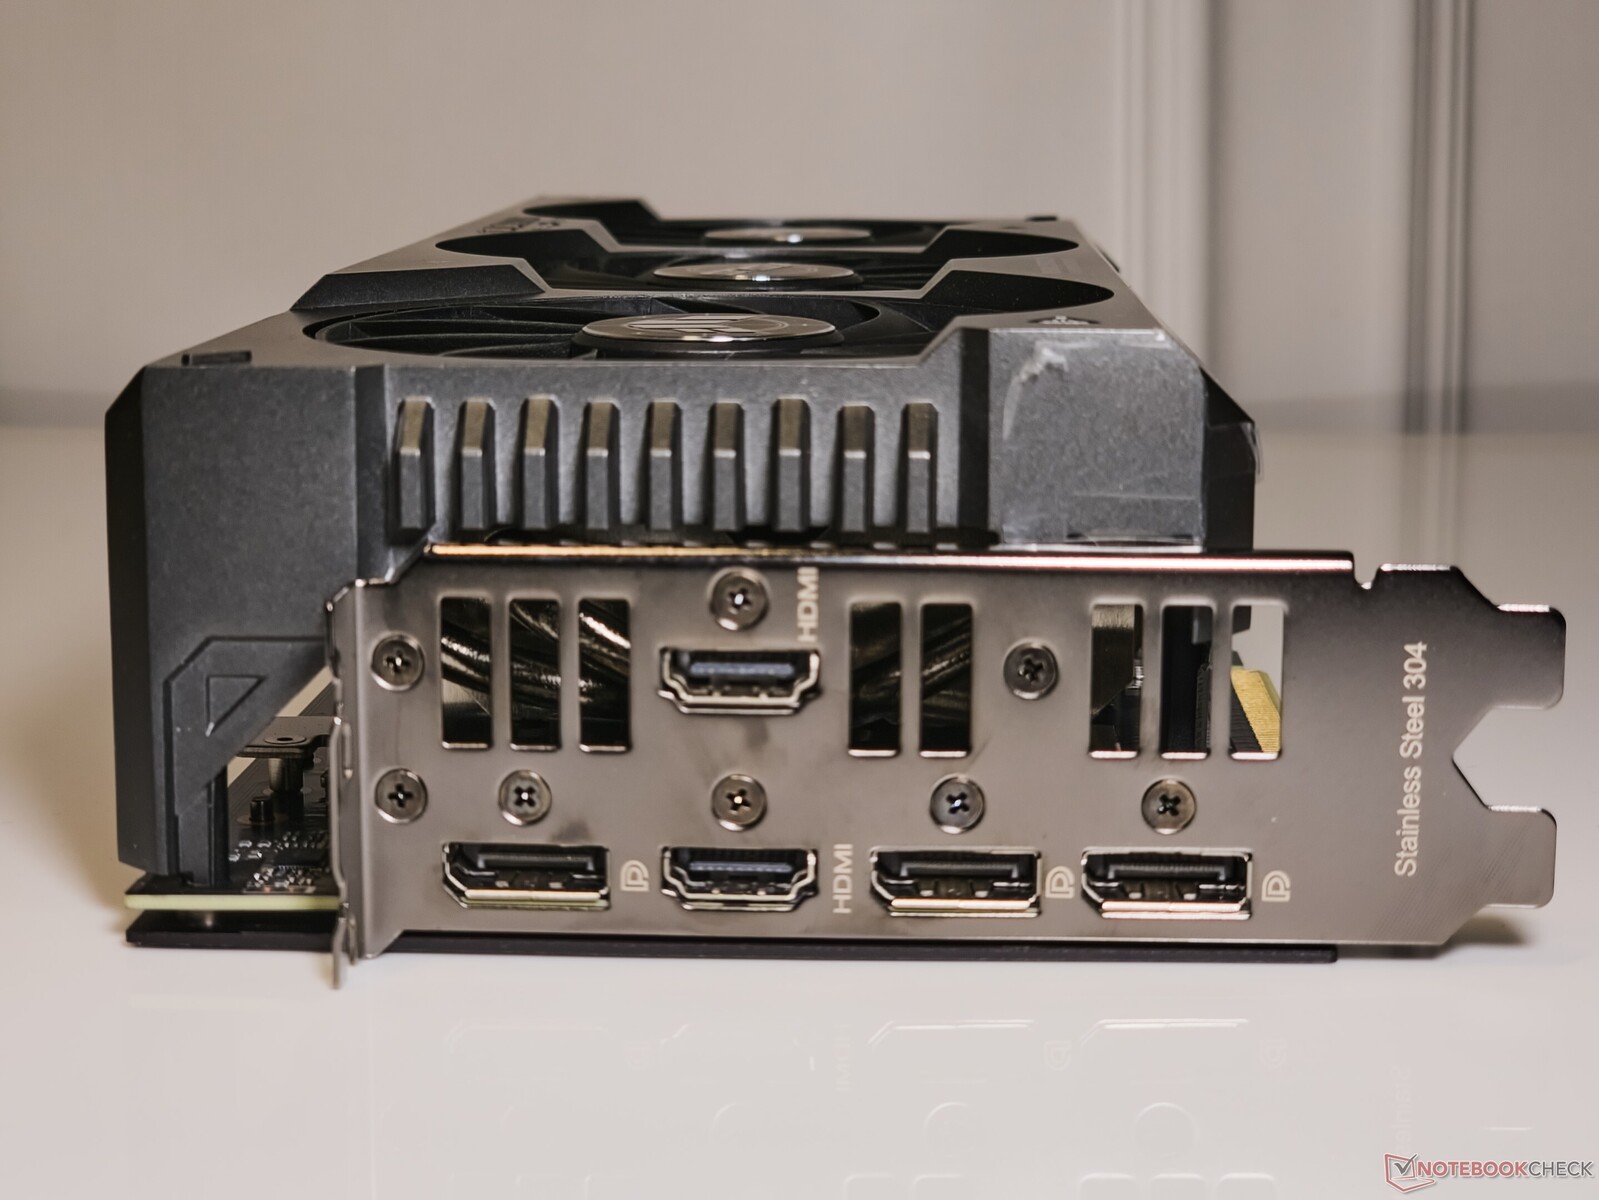
Como a maioria das outras placas da Asus, a TUF Gaming GeForce RTX 4070 Ti Super também vem com cinco portas, o que não costuma acontecer com a grande maioria das placas existentes no mercado.
Além das habituais 3 saídas DisplayPort-1.4 e da saída HDMI 2.1a, a Asus também oferece uma porta HDMI 2.1a adicional que pode ser útil para conectar uma TV ou monitores que não tenham DisplayPort.
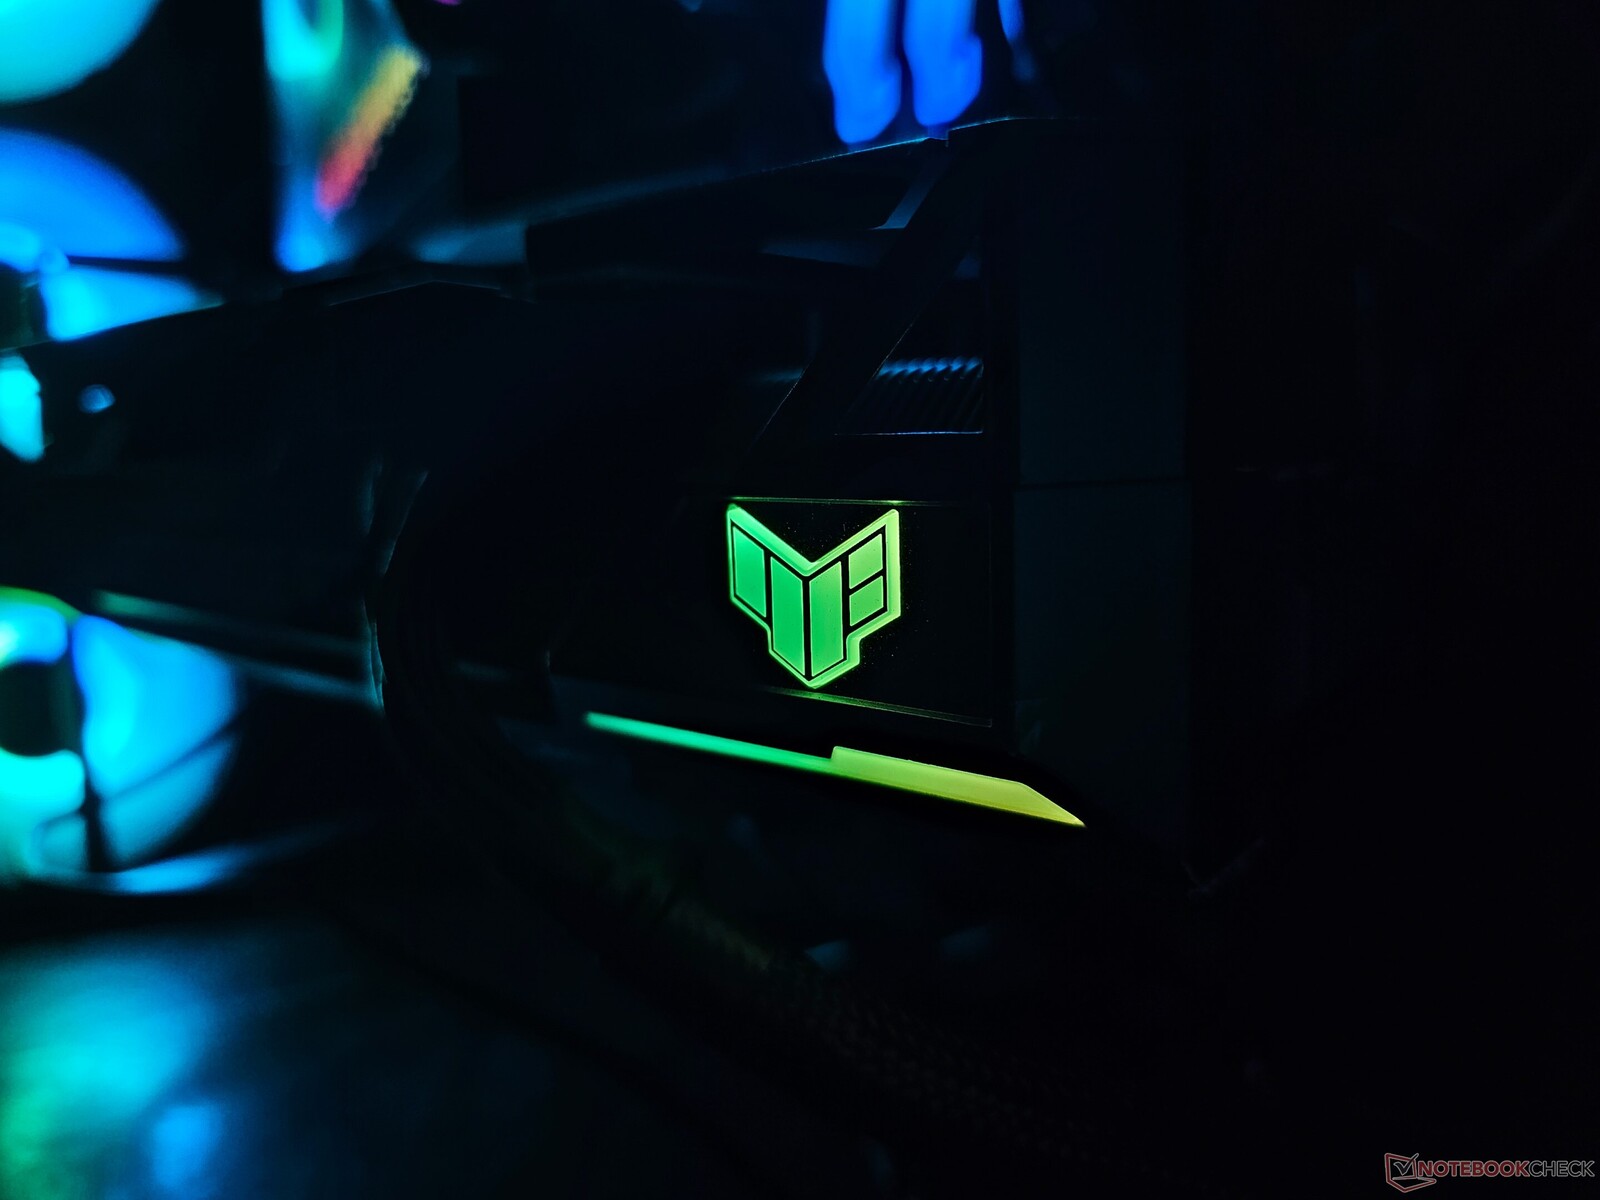
Ao contrário de suas contrapartes Strix, as placas TUF têm uma iluminação RGB mais suave. As únicas áreas que ficam iluminadas são o logotipo da TUF e uma pequena barra de luz abaixo dele. Ainda assim, a iluminação é eficaz e pode ser personalizada por meio do software GPU Tweak III da Asus ou de qualquer utilitário compatível com o Aura Sync.
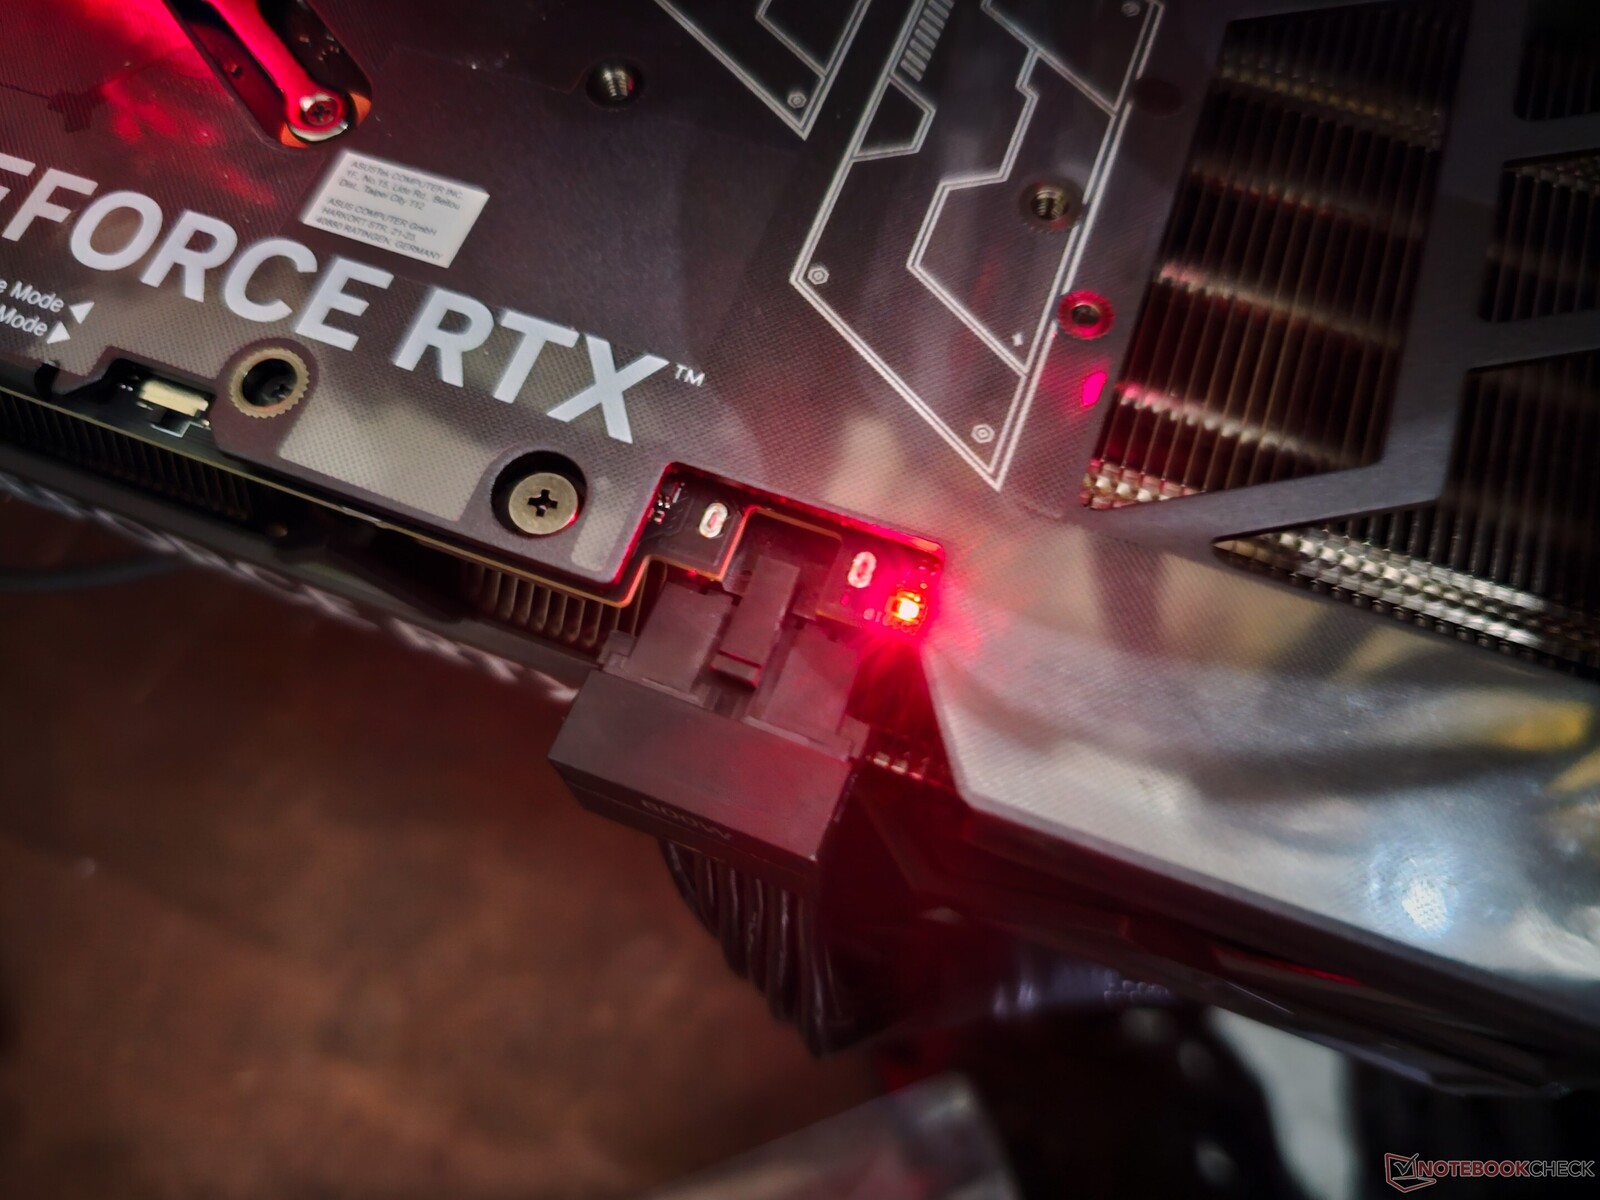
A fonte de alimentação é controlada pelo conector padrão 12VHPWR. A Asus fornece um adaptador de 12VHPWR para 2x 8 pinos na caixa que se encaixa perfeitamente no conector.
O conector de alimentação também possui um útil indicador LED vermelho que acende para indicar uma conexão incorreta ou uma fonte de alimentação inadequada. Infelizmente, o indicador brilha mesmo durante o desligamento do sistema, o que pode confundir os usuários.
A Asus oferece um sistema dual-BIOS que pode ser alternado entre os modos Desempenho e Silencioso. Realizamos todos os testes no modo Desempenho e usamos o modo Silencioso para comparar os níveis de ruído da ventoinha.

Os cartões TUF também vêm com um conjunto decente de acessórios, que inclui:
- Cartão de coleção TUF
- adaptador de alimentação de 12VHPWR para 2x 8 pinos
- Cartão de agradecimento
- Certificado TUF Gaming
- Guia de início rápido
- Informações sobre a garantia
- Gancho e presilha de velcro da TUF
- Suporte para GPU da TUF com chave de fenda embutida
A TUF Gaming GeForce RTX 4070 Ti Super tem um aumento nominal de até 2.610 MHz, que é a especificação de referência da Nvidia para essa GPU. Isso é 150 MHz mais baixo do que o oferecido com a RTX 4070 Ti não Super original, mas o clock base agora recebe um aumento de 30 MHz para 2.340 MHz.
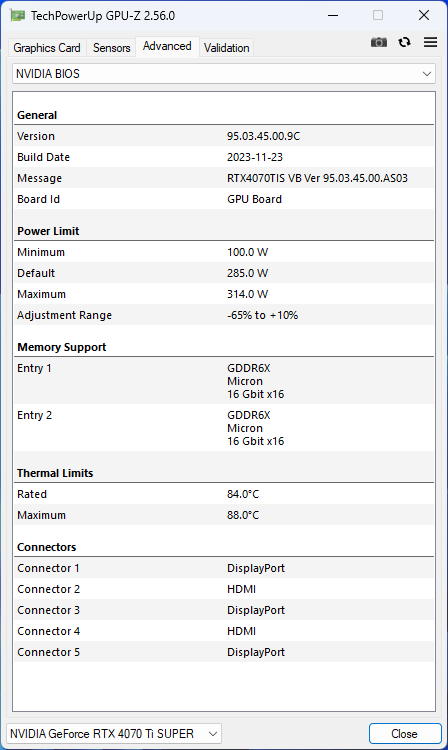
Apesar dos aumentos na largura de banda da memória e na contagem de shaders, a TUF Gaming GeForce RTX 4070 Ti Super opera com um TGP de 285 W semelhante ao da RTX 4070 Ti.
Há um potencial limitado para aumentar a utilização de energia em 10% para um TGP maior de 314 W.
O banco de testes: A RTX 4070 Ti Super e o Core i9-13900K formam uma ótima dupla
Nosso sistema de teste é baseado no Intel Core i9-13900K e na plataforma Z790. Ele inclui os seguintes componentes:
- Bancada de teste Cooler MasterFrame 700
- Intel Core i9-13900K com PL1=PL2
- Placa-mãe Gigabyte Z790 Aorus Master
- SSD Gigabyte Aorus Gen4 2 TB NVMe
- SSD NVMe Sabrent Rocket 4 Plus Gen4 de 2 TB
- 2x 16 GB de RAM Kingston Fury Renegade DDR5-6400 com temporizações 32-39-39-80 a 1,40 V
- Monitor Gigabyte M28U 4K 144 Hz
- Cooler AiO Gigabyte Aorus Waterforce X II 360 Cooler AiO
- Fonte de alimentação totalmente modular Cooler Master MVE Gold V2 1250 ATX 3.0
Foi usado o Windows 11 23H2 com os patches mais recentes, juntamente com o Nvidia Game Ready Driver versão 551.15.
Gostaríamos de agradecer à Cooler Master por fornecer a bancada de teste e a PSU, à Gigabyte pela placa-mãe, CPU, SSD, cooler AiO e monitor, à Sabrent pelo SSD e à Kingston pela memória.
Benchmarks sintéticos: Consolida firmemente seus ganhos em relação à RTX 3090 Ti
Nos testes sintéticos cumulativos, observamos uma melhoria geral de apenas 3% com a TUF Gaming GeForce RTX 4070 Ti Super em comparação com a RTX 4070 Ti e até 12% em comparação com a RTX 4070 Super Founders Edition.
Individualmente, os melhores ganhos resultam de benchmarks em resoluções mais altas. Por exemplo, o 3DMark Fire Strike Ultra mostra um ganho de 4% em comparação com a média da RTX 4070 Ti, enquanto os testes Unigine Superposition 4K e 8K Optimized aumentam esse delta para 11%.
O RTX 4070 Ti Super fica ainda mais à frente do carro-chefe da Ampere RTX 3090 Ti da Ampere em 5%, enquanto fica atrás da AMD Radeon RX 7900 XT pela mesma margem.
3DMark 11: 1280x720 Performance GPU
3DMark: 1920x1080 Fire Strike Graphics | 3840x2160 Fire Strike Ultra Graphics | Fire Strike Extreme Graphics | 2560x1440 Time Spy Graphics
Unigine Heaven 4.0: Extreme Preset DX11 | Extreme Preset OpenGL
Unigine Valley 1.0: 1920x1080 Extreme HD DirectX AA:x8 | 1920x1080 Extreme HD Preset OpenGL AA:x8
Unigine Superposition: 1280x720 720p Low | 1920x1080 1080p Extreme | 3840x2160 4k Optimized | 7680x4320 8k Optimized
| Performance rating | |
| NVIDIA GeForce RTX 4090 Founders Edition | |
| AMD Radeon RX 7900 XTX | |
| NVIDIA GeForce RTX 4080 Founders Edition | |
| Média da turma Desktop | |
| AMD Radeon RX 7900 XT | |
| Asus TUF Gaming GeForce RTX 4070 Ti Super | |
| Gigabyte Aorus GeForce RTX 4070 Ti Master | |
| Asus TUF Gaming GeForce RTX 4070 Ti | |
| Média NVIDIA GeForce RTX 4070 Ti | |
| Zotac Gaming GeForce RTX 3090 Ti AMP Extreme Holo | |
| Sapphire AMD Radeon RX 6950 XT Nitro+ Pure | |
| Gigabyte GeForce RTX 4070 Super Gaming OC 12G | |
| Média NVIDIA GeForce RTX 3090 | |
| Média NVIDIA GeForce RTX 3080 Ti | |
| NVIDIA GeForce RTX 4070 Super Founders Edition | |
| AMD Radeon RX 7800 XT | |
| AMD Radeon RX 6900 XT | |
| Zotac Gaming GeForce RTX 4070 AMP Airo | |
| AMD Radeon RX 6800 XT | |
| Média NVIDIA GeForce RTX 3080 | |
| KFA2 GeForce RTX 3070 Ti SG | |
| Sapphire Pulse Radeon RX 7700 XT | |
| Média NVIDIA Titan RTX | |
| Média NVIDIA GeForce RTX 3070 | |
| Média NVIDIA GeForce RTX 4060 Ti 8G | |
| KFA2 GeForce RTX 4060 Ti EX, 16GB GDDR6 | |
| XFX Speedster QICK 308 Radeon RX 7600 Black Edition | |
| KFA2 GeForce RTX 4060 1-Click-OC 2X | |
3DMark 11: 1280x720 Performance GPU
3DMark: 1920x1080 Fire Strike Graphics | 3840x2160 Fire Strike Ultra Graphics | Fire Strike Extreme Graphics | 2560x1440 Time Spy Graphics
Unigine Heaven 4.0: Extreme Preset DX11 | Extreme Preset OpenGL
Unigine Valley 1.0: 1920x1080 Extreme HD DirectX AA:x8 | 1920x1080 Extreme HD Preset OpenGL AA:x8
Unigine Superposition: 1280x720 720p Low | 1920x1080 1080p Extreme | 3840x2160 4k Optimized | 7680x4320 8k Optimized
| 3DMark 11 Performance | 54278 pontos | |
| 3DMark Ice Storm Standard Score | 287297 pontos | |
| 3DMark Cloud Gate Standard Score | 79438 pontos | |
| 3DMark Fire Strike Score | 42631 pontos | |
| 3DMark Fire Strike Extreme Score | 27105 pontos | |
| 3DMark Time Spy Score | 23540 pontos | |
Ajuda | ||
Desempenho de computação: Escalas correspondentes ao aumento do número de núcleos CUDA
O impacto do aumento do número de núcleos CUDA é mais visível em testes de computação como o V-Ray e o Blender. No V-Ray 5, a TUF Gaming GeForce RTX 4070 Ti Super apresenta uma impressionante vantagem de 11% e 14% nos benchmarks CUDA e RTX em comparação com a média da RTX 4070 Ti. As placas AMD estão em uma desvantagem óbvia nesses testes.
No entanto, onde elas brilham é nos testes de GPU LuxMark Sala, com até mesmo a RX 6950 XT mostrando boas vantagens sobre a RTX 4090 Founders Edition. Dito isso, a RTX 4070 Ti Super mostra um aumento decente de 11% em relação à TUF Gaming GeForce RTX 4070 Ti OC e à Aorus GeForce RTX 4070 Ti Master na GPU LuxMark Room.
A TUF Gaming GeForce RTX 4070 Ti Super também é capaz de concluir a renderização do Blender 3.3 Classroom CUDA e Optix 1,5 segundos mais rápido do que a média da RTX 4070 Ti.
V-Ray Benchmark Next 4.10: GPU
Blender: v3.3 Classroom CUDA | v3.3 Classroom OPTIX/RTX
LuxMark v2.0 64Bit: Room GPUs-only | Sala GPUs-only
ComputeMark v2.1: 1024x600 Normal, Score | 1024x600 Normal, QJuliaRayTrace | 1024x600 Normal, Mandel Scalar | 1024x600 Normal, Mandel Vector | 1024x600 Normal, Fluid 2DTexArr | 1024x600 Normal, Fluid 3DTex
| Blender / v3.3 Classroom CUDA | |
| KFA2 GeForce RTX 4060 1-Click-OC 2X (3.3.3) | |
| Média NVIDIA GeForce RTX 3070 (n=1) | |
| KFA2 GeForce RTX 3070 Ti SG (3.3.0) | |
| Média NVIDIA Titan RTX (n=1) | |
| Média NVIDIA GeForce RTX 4060 Ti 8G (n=1) | |
| Zotac Gaming GeForce RTX 4070 AMP Airo (3.3.3) | |
| Média NVIDIA GeForce RTX 3080 Ti (21 - 22, n=2) | |
| Média NVIDIA GeForce RTX 3090 (20 - 22, n=13) | |
| NVIDIA GeForce RTX 4070 Super Founders Edition (3.3.3) | |
| Gigabyte GeForce RTX 4070 Super Gaming OC 12G (3.3.3) | |
| Média NVIDIA GeForce RTX 4070 Ti (18 - 19, n=3) | |
| Média da turma Desktop (8 - 54, n=31, últimos 2 anos) | |
| Gigabyte Aorus GeForce RTX 4070 Ti Master (3.3.2) | |
| Asus TUF Gaming GeForce RTX 4070 Ti Super (3.3.3) | |
| Blender / v3.3 Classroom OPTIX/RTX | |
| Média NVIDIA GeForce RTX 3070 (n=1) | |
| KFA2 GeForce RTX 4060 1-Click-OC 2X (3.3.3) | |
| Média NVIDIA Titan RTX (n=1) | |
| KFA2 GeForce RTX 3070 Ti SG (3.3.0) | |
| KFA2 GeForce RTX 4060 Ti EX, 16GB GDDR6 (3.3.3) | |
| Média NVIDIA GeForce RTX 4060 Ti 8G (17 - 18, n=3) | |
| Média NVIDIA GeForce RTX 3080 Ti (14 - 15, n=2) | |
| Zotac Gaming GeForce RTX 4070 AMP Airo (3.3.3) | |
| Média NVIDIA GeForce RTX 3090 (13 - 14, n=13) | |
| Asus TUF Gaming GeForce RTX 4070 Ti (3.3.2) | |
| Média NVIDIA GeForce RTX 4070 Ti (11 - 12, n=5) | |
| Gigabyte Aorus GeForce RTX 4070 Ti Master (3.3.2) | |
| NVIDIA GeForce RTX 4070 Super Founders Edition (3.3.3) | |
| Gigabyte GeForce RTX 4070 Super Gaming OC 12G (3.3.3) | |
| Média da turma Desktop (5 - 19, n=30, últimos 2 anos) | |
| NVIDIA GeForce RTX 4080 Founders Edition (3.3.0) | |
| Asus TUF Gaming GeForce RTX 4070 Ti Super (3.3.3) | |
| NVIDIA GeForce RTX 4090 Founders Edition (3.3.0) | |
V-Ray Benchmark Next 4.10: GPU
Blender: v3.3 Classroom CUDA | v3.3 Classroom OPTIX/RTX
LuxMark v2.0 64Bit: Room GPUs-only | Sala GPUs-only
ComputeMark v2.1: 1024x600 Normal, Score | 1024x600 Normal, QJuliaRayTrace | 1024x600 Normal, Mandel Scalar | 1024x600 Normal, Mandel Vector | 1024x600 Normal, Fluid 2DTexArr | 1024x600 Normal, Fluid 3DTex
* ... menor é melhor
Desempenho em jogos: No mesmo nível da RTX 3090 Ti e da RX 7900 XT em QHD e 4K Ultra
Ao contrário dos testes sintéticos, nem todos os jogos são escalonados de acordo com o aumento da contagem de shaders. Dessa forma, vemos apenas um aumento de 4% em relação à média da RTX 4070 Ti não-Super no desempenho cumulativo de jogos em QHD e 4K.
Jogos como The Witcher 3 e Shadow of the Tomb Raider mostram ganhos de até 5% em 4K Ultra com a RTX 4070 Ti Super em comparação com a média da RTX 4070 Ti não-Super. Os deltas aumentam para 8% com Borderlands 3 e até 11% com Final Fantasy XV em 4K Ultra.
Isso coloca a RTX 4070 Ti Super no mesmo patamar da RTX 3090 Ti e da Radeon RX 7900 XT quando se trata de jogos, especialmente em configurações QHD e 4K Ultra.
Assim como a RTX 4070 Super, a Nvidia continua a lançar a RTX 4070 Ti Super para os jogadores de QHD. Embora essa placa certamente beneficie aqueles com telas QHD de alta taxa de atualização, a RTX 4070 Ti Super pode executar confortavelmente um bom número de títulos AAA modernos e um pouco mais antigos em 4K 60 ou mais.
No entanto, alguns dos títulos com textura particularmente pesada, como Cyberpunk 2077 Phantom Liberty, Alan Wake 2, Avatar: Frontiers of Pandora e similares, exigirão alguma assistência de upscaling para uma experiência de jogo mais suave em 4K Ultra.
Desempenho do ray tracing nativo
O desempenho do ray tracing em 1080p Ultra está no mesmo nível ou é apenas marginalmente melhor que o da RTX 4070 Ti, com The Callisto Protocol mostrando um ganho decente de 9%.
A RTX 4070 Ti Super tem uma vantagem em ray tracing 4K Ultra, evidenciada por um aumento de 4% em Cyberpunk 2077 1.6 e ganhos de 10% em Control.
A diferença se torna mais acentuada quando comparada com a RTX 4070 Super Founders Edition. Aqui, a RTX 4070 Ti Super mostra um benefício significativo de 22% no ray tracing de Alan Wake 2 1080p e Cyberpunk 2077 Phantom Liberty 4K.
| baixo | média | alto | ultra | QHD | 4K DLSS | 4K | |
|---|---|---|---|---|---|---|---|
| GTA V (2015) | 187.6 | 187.6 | 187.4 | 160.1 | 155.3 | 182.1 | |
| The Witcher 3 (2015) | 558 | 430 | 210 | 159.3 | |||
| Dota 2 Reborn (2015) | 245 | 228 | 226 | 202 | 203 | ||
| Final Fantasy XV Benchmark (2018) | 235 | 235 | 209 | 168.8 | 98.9 | ||
| X-Plane 11.11 (2018) | 224 | 196.7 | 150 | 127.8 | |||
| Far Cry 5 (2018) | 203 | 197 | 188 | 187 | 119 | ||
| Strange Brigade (2018) | 568 | 467 | 442 | 407 | 306 | 161.9 | |
| Shadow of the Tomb Raider (2018) | 273 | 269 | 256 | 205 | 109.5 | ||
| Metro Exodus (2019) | 236 | 193.5 | 158.3 | 130.9 | 84.4 | ||
| Control (2019) | 226 | 196.9 | 130.3 | 78.9 | 66.4 | ||
| Borderlands 3 (2019) | 192.1 | 176.8 | 169.6 | 143.6 | 79.4 | ||
| Mafia Definitive Edition (2020) | 239 | 231 | 181 | 96.6 | |||
| Watch Dogs Legion (2020) | 171.2 | 159.3 | 144.2 | 115.9 | 68.6 | ||
| Far Cry 6 (2021) | 209 | 191 | 169 | 154 | 91 | ||
| Dying Light 2 (2022) | 213 | 162.2 | 121.5 | 63.7 | |||
| Cyberpunk 2077 1.6 (2022) | 196.9 | 195.9 | 172.3 | 157.5 | 103.6 | 49.7 | |
| Ghostwire Tokyo (2022) | 278 | 282 | 283 | 217 | 99.2 | ||
| F1 22 (2022) | 371 | 384 | 336 | 144.9 | 95.1 | 48.9 | |
| The Callisto Protocol (2022) | 210.62 | 202.94 | 149.39 | 114.82 | 70.04 | ||
| F1 23 (2023) | 385 | 402 | 363 | 138.2 | 90 | 77.4 | 45.1 |
| Baldur's Gate 3 (2023) | 246 | 223 | 218 | 157.8 | 133.9 | 117.2 | |
| Cyberpunk 2077 (2023) | 188.5 | 188.5 | 170.8 | 150.3 | 94.9 | 42.3 | |
| Assassin's Creed Mirage (2023) | 221 | 206 | 170 | 136 | 112 | 84 | |
| Alan Wake 2 (2023) | 124.7 | 114.4 | 82.5 | 63.7 | 44.7 | ||
| Call of Duty Modern Warfare 3 2023 (2023) | 227 | 184 | 179 | 133 | 112 | 84 | |
| Avatar Frontiers of Pandora (2023) | 163 | 141.8 | 113.2 | 76.6 | 68.9 | 39.8 |
Emissões: Baixo ruído do ventilador, mas temperaturas de superfície mais altas sob carga
O Asus TUF Gaming GeForce RTX 4070 Ti Super apresenta o que a empresa chama de ventoinhas de tecnologia axial com rolamentos de esferas duplos que reduzem o ruído e duram mais.
Um toque agradável é a possibilidade de remover a cobertura de metal para limpar as ventoinhas, se necessário, sem precisar desmontar a própria placa.
A TUF Gaming GeForce RTX 4070 Ti Super emprega um total de seis heatpipes para uma transferência eficiente de calor da GPU, do VRM e da memória.
Testes de estresse
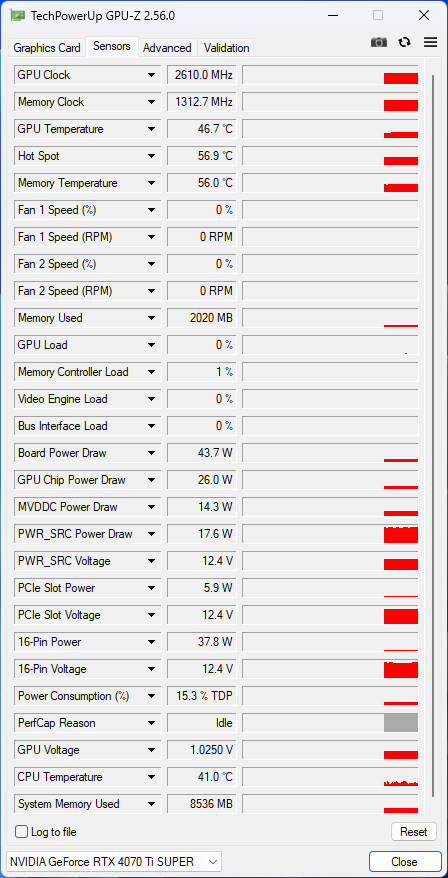
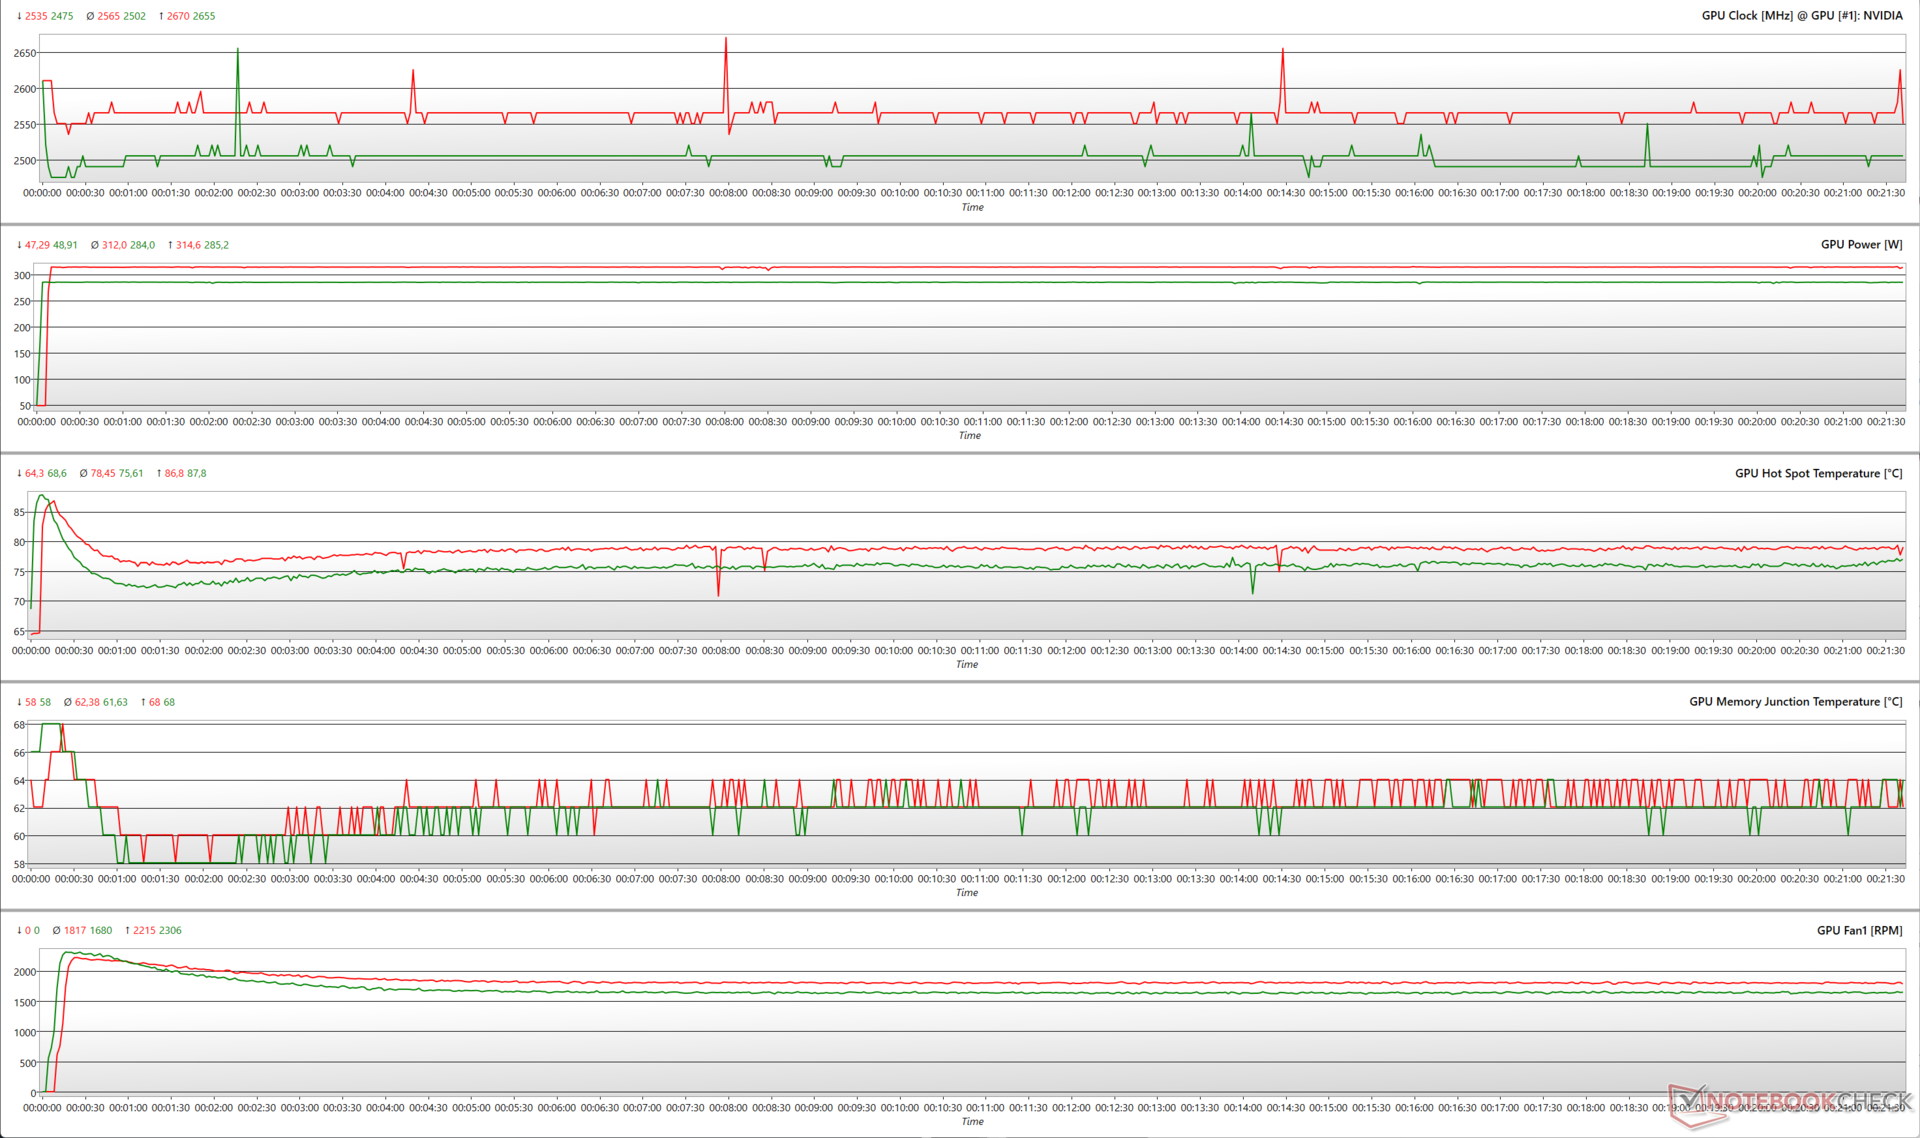
Em uma meta de energia de 100% (PT), o TUF Gaming GeForce RTX 4070 Ti Super pode aumentar até 2.655 MHz durante um estresse FurMark em 1280 x 720 sem AA, utilizando um TGP de 285 W.
Ao aumentar a meta de energia para 110%, a placa atinge aumentos de até 2.670 MHz e consome quase 315 W. Isso também resulta em uma temperatura média de ponto quente ligeiramente mais alta de ~78,5 °C e uma velocidade média mais alta da ventoinha de 1.817 RPM.
O estresse com o Witcher 3 em 1080p Ultra mostra um perfil de clock semelhante em 100% PT e 110% PT com aumento máximo de 2.715 MHz. A RTX 4070 Ti Super não precisa utilizar todo o headroom de 315 W disponível para atingir esse clock - um comportamento que é consistente com outras GPUs Ada que analisamos até agora.
A temperatura média do hot spot da GPU e a velocidade média da ventoinha registram apenas aumentos nominais de 3,8% e 11%, respectivamente, a 110% PT.
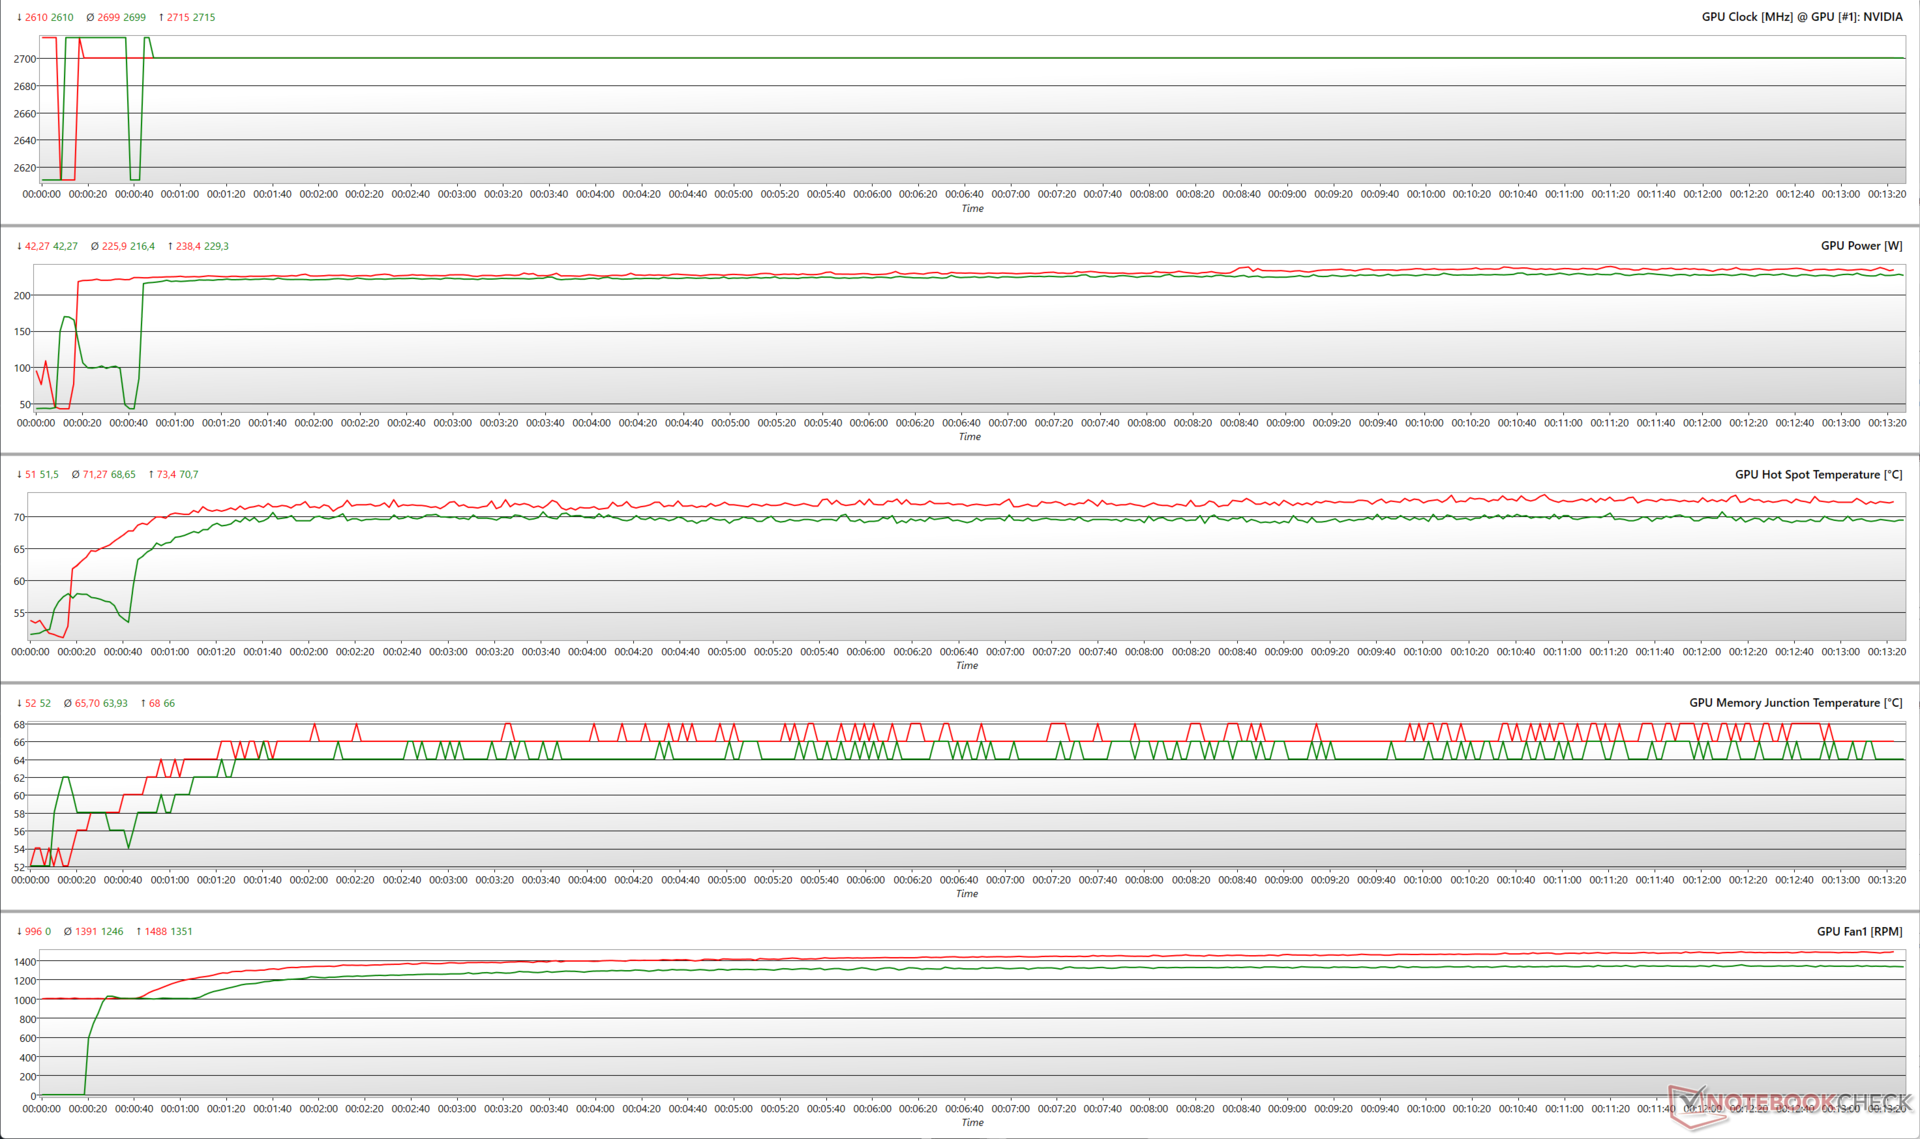
O gráfico Witcher 3 FPS
O sistema de resfriamento da Asus parece estar fazendo um bom trabalho ao ajudar a TUF Gaming GeForce RTX 4070 Ti Super a manter taxas de quadros estáveis no Witcher 3 em 1080p Ultra e 4K Ultra.
o 4K Ultra mostra uma queda inicial de 109 para 101 fps, mas a placa consegue manter uma taxa de quadros bastante consistente depois disso.
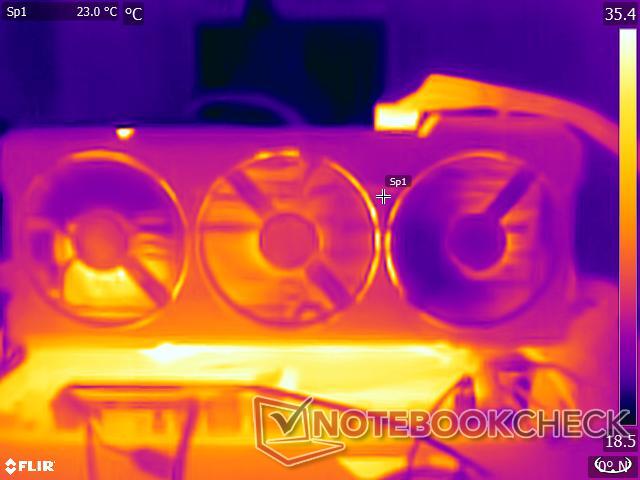
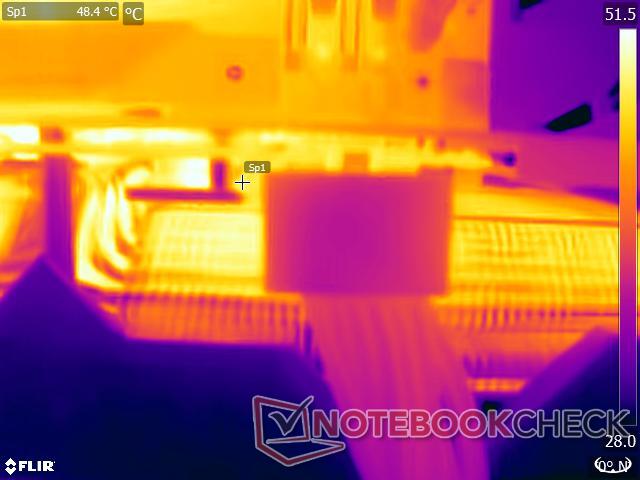
Temperaturas da superfície
Embora o sistema de resfriamento seja capaz de garantir um desempenho sem aceleração para a própria GPU, descobrimos que a TUF Gaming GeForce RTX 4070 Ti Super apresenta temperaturas de superfície relativamente altas.
Em uma temperatura ambiente de 22 °C, a cobertura frontal de metal não esquenta muito, mas a placa traseira aquece até ~56 °C, enquanto a área da GPU pode atingir 76 °C. A área ao redor do conector 12VHPWR permanece relativamente fria a 48,4 °C.


Níveis de ruído
A implementação de ventilador triplo da Asus geralmente tem emissões de ruído de ventilador toleráveis, o que já vimos antes com o TUF Gaming GeForce RTX 4070 Ti OC também.
Entre as três ventoinhas do TUF RTX 4070 Ti Super, duas giram no sentido anti-horário, enquanto a ventoinha central se equilibra com um giro no sentido horário. A Asus implementa uma parada completa da ventoinha quando está ociosa, com 55 °C sendo o limite de temperatura do núcleo antes que as ventoinhas entrem em funcionamento.
O TUF Gaming RTX 4070 Ti Super permite alternar entre os modos Performance e Quiet VBIOS. O modo Silencioso permite curvas de ventoinha mais apertadas, e todos os outros parâmetros não são afetados. Dito isso, não há diferença perceptível entre esses modos VBIOS para todos os fins práticos.
A placa permaneceu abaixo de 35 dB(A) em todas as cargas FurMark e abaixo de 30 dB(A) durante o estresse do The Witcher 3 1080p Ultra. O nível máximo de pressão sonora (SPL) que registramos foi de 35,88 dB(A) no VBIOS de desempenho com um PT de 110%.
Essa é uma boa melhoria em relação ao TUF RTX 4070 Ti OC anterior, que tinha emissões próximas a 46 dB(A) na carga FurMark. Observe também que nossas medições de SPL foram feitas com uma configuração de bancada de teste aberta, o que significa que as ventoinhas devem ser praticamente inaudíveis em um gabinete ATX típico.
| Teste de estresse | Modo VBIOS/ Alvo de energia | Ruído do ventilador dB(A) |
|---|---|---|
| FurMark 1280 x 720, sem AA | Desempenho / 100% | 33.71 |
| FurMark 1280 x 720, sem AA | Silencioso / 100% | 33.05 |
| FurMark 1280 x 720, sem AA | Desempenho / 110% | 35,88 |
| FurMark 1280 x 720, sem AA | Silencioso / 110% | 35,55 |
| O Witcher 3 1080p Ultra | Desempenho / 100% | 28,40 |
| O Witcher 3 1080p Ultra | Silencioso / 100% | 27,77 |
| O Witcher 3 1080p Ultra | Desempenho / 110% | 29,51 |
| O Witcher 3 1080p Ultra | Silencioso / 110% | 28,55 |
Gerenciamento de energia: Consumo de energia mais econômico do que o da RTX 4070 Ti
Apesar de um aumento nas especificações, a TUF RTX 4070 Ti Super é bastante econômica quando se trata de consumo de energia e é ainda mais econômica do que a média da RTX 4070 Ti nos testes de consumo de energia FurMark e The Witcher 3. Em termos de eficiência energética, a TUF RTX 4070 Ti Super está logo atrás da RTX 4090 Founders Edition.
Como é de praxe com as placas Nvidia Ada Lovelace, a RTX 4070 Ti Super mostra um consumo de energia total do sistema semelhante na parede com metas de energia de 100% e 110% no The Witcher 3 a 1080p Ultra. Isso está de acordo com nossas observações no teste de estresse acima.
Power Consumption: External monitor
| 1280x720 FurMark 1.19 GPU Stress Test (external Monitor) | |
| 1920x1080 The Witcher 3 ultra (external Monitor) | |
* ... menor é melhor
Pro
Contra
Veredicto: O que a RTX 4070 Ti original deveria ter sido

A RTX 4070 Ti Super substitui a rTX 4070 Ti original original com o mesmo preço sugerido de US$ 799. Ao contrário da RTX 4070 Superque apresenta um aumento substancial de 21% nos shaders em relação ao RTX 4070o RTX 4070 Ti Super oferece apenas um aumento de 10% nos núcleos CUDA em comparação com o RTX 4070 Ti, o que pode nem sempre oferecer ganhos tangíveis em cenários de jogos do mundo real.
No entanto, a transição para o silício AD103 significa que a RTX 4070 Ti Super é agora uma espécie de "GPU de médio porte mais completa" que compartilha a mesa de jantar com as RTX 4080 e a RTX 4080 Super. Um benefício consequente é um subsistema de memória de 256 bits mais rápido e 16 GB GDDR6X VRAM que o AD104 simplesmente não pode suportar.
Por sua vez, o Asus TUF Gaming GeForce RTX 4070 Ti Super oferece excelente qualidade de construção, portas adicionais e excelente desempenho com base nas especificações de referência. Embora também haja uma SKU OC, a SKU básica testada de US$ 799 oferece tudo o que o senhor precisa para aproveitar ao máximo o mais recente participante do AD103.
O novo Asus TUF Gaming GeForce RTX 4070 Ti Super, baseado no AD103, joga com perfeição em 1440p Ultra e alta taxa de quadros, além de oferecer recursos decentes de computação e 4K Ultra, merecendo, portanto, uma consideração séria pelo preço pedido de US$ 799.
A Asus equipou o TUF Gaming GeForce RTX 4070 Ti Super com um sistema de resfriamento robusto. Embora as temperaturas da superfície pareçam ser mais altas, o resfriamento de seis tubos de calor com ventilador triplo permite que a GPU AD103 funcione sem problemas de estrangulamento com níveis de ruído do ventilador altamente toleráveis.
A RTX 4070 Ti Super faz maravilhas para jogos em Ultra 1440p, mas é francamente um exagero para essa resolução. Se o senhor é principalmente um jogador de 1440p que não se envolve muito com cargas de trabalho de computação, pode economizar uns bons US$ 200 optando pelo RTX 4070 Super.
AMD Radeon RX 7900 XT placas como a XFX Speedster MERC310(US$ 740 na Amazon) ou a Asus TUF Gaming RX 7900 XT OC(US$ 880 na Amazon) também são opções viáveis, especialmente se o senhor priorizar apenas o desempenho de rasterização e estiver satisfeito com o upscaling de FSR.
Dito isso, o TUF Gaming RTX 4070 Ti Super oferece uma proposta geral melhor, devido à sua capacidade superior de traçado de raios e suporte para geração de quadros DLSS 3 e reconstrução de raios DLSS 3.5.
É interessante, considerando que a RTX 3090 Tique essa placa substitui com folga, custava 2,5x o preço sugerido na época.
Preço e disponibilidade
A Asus TUF Gaming GeForce RTX 4070 Ti Super pode ser adquirida na Best Buy US por US$ 800 para a variante básica, enquanto a OC SKU é vendida por US$ 850.
Na Índia, a TUF Gaming GeForce RTX 4070 Ti Super tem preço oficial de ₹95.000, sendo que o preço real depende do distribuidor. Atualmente, a Amazon India está oferecendo a edição OC dessa placa por ₹1,08,499.
Transparência
A seleção dos dispositivos a serem analisados é feita pela nossa equipe editorial. A amostra de teste foi fornecida ao autor como empréstimo pelo fabricante ou varejista para fins desta revisão. O credor não teve influência nesta revisão, nem o fabricante recebeu uma cópia desta revisão antes da publicação. Não houve obrigação de publicar esta revisão. Como empresa de mídia independente, a Notebookcheck não está sujeita à autoridade de fabricantes, varejistas ou editores.
É assim que o Notebookcheck está testando
Todos os anos, o Notebookcheck analisa de forma independente centenas de laptops e smartphones usando procedimentos padronizados para garantir que todos os resultados sejam comparáveis. Desenvolvemos continuamente nossos métodos de teste há cerca de 20 anos e definimos padrões da indústria no processo. Em nossos laboratórios de teste, equipamentos de medição de alta qualidade são utilizados por técnicos e editores experientes. Esses testes envolvem um processo de validação em vários estágios. Nosso complexo sistema de classificação é baseado em centenas de medições e benchmarks bem fundamentados, o que mantém a objetividade.Price comparison

