Análise da estação de trabalho de ponta Dell Precision 7875: AMD Ryzen Threadripper PRO 7995WX com 96 núcleos e Nvidia RTX 6000
")
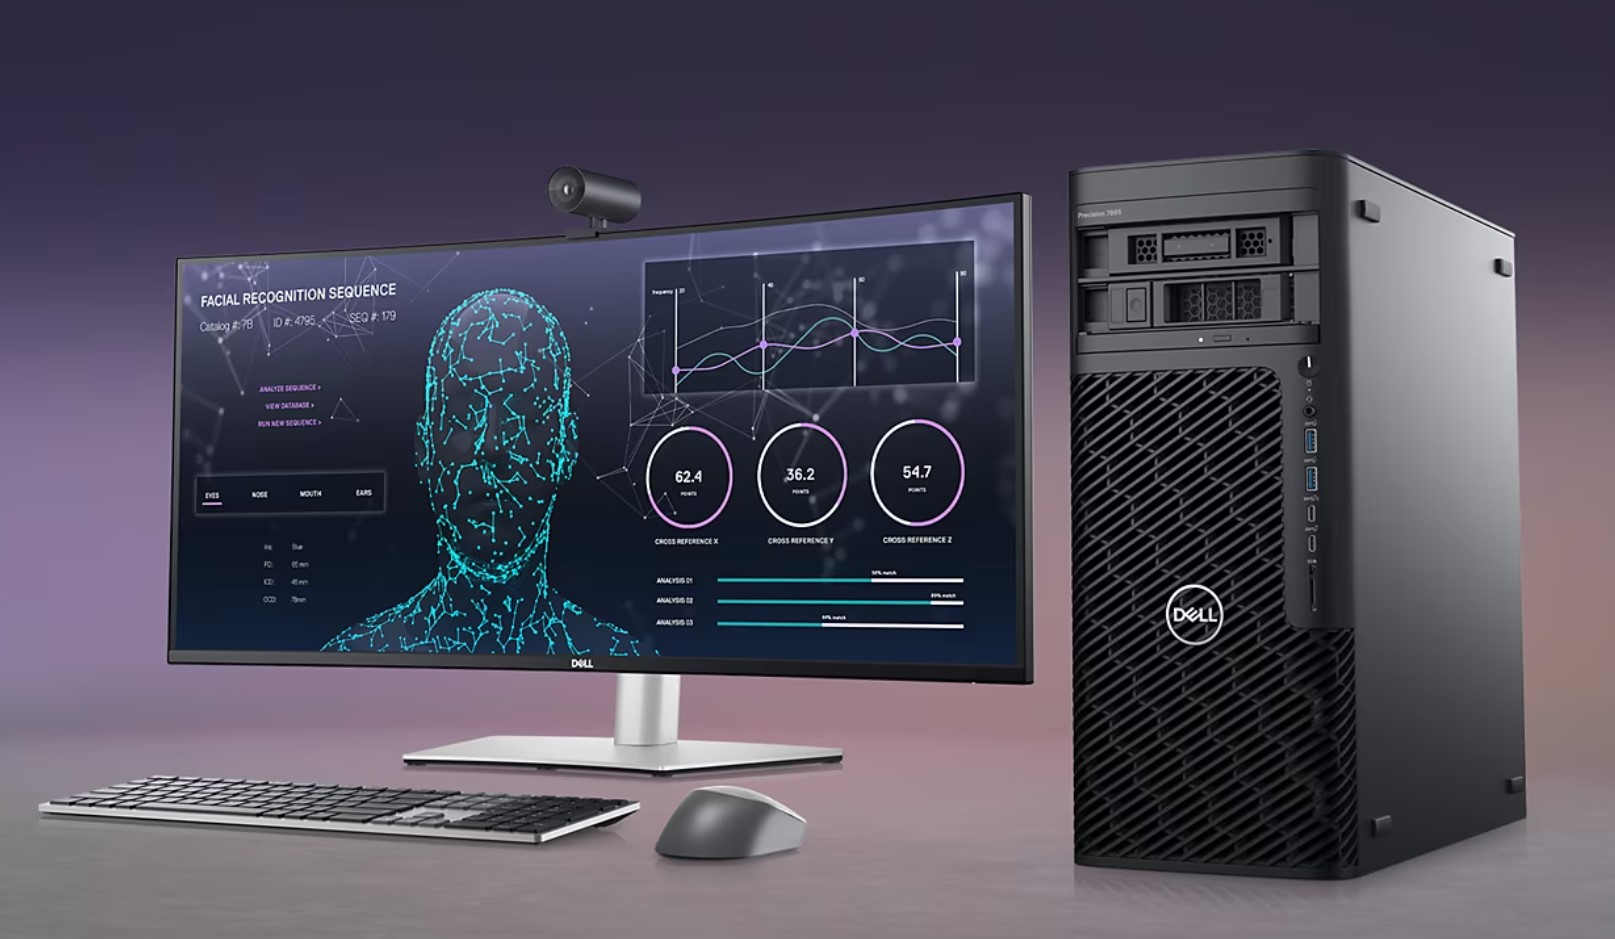
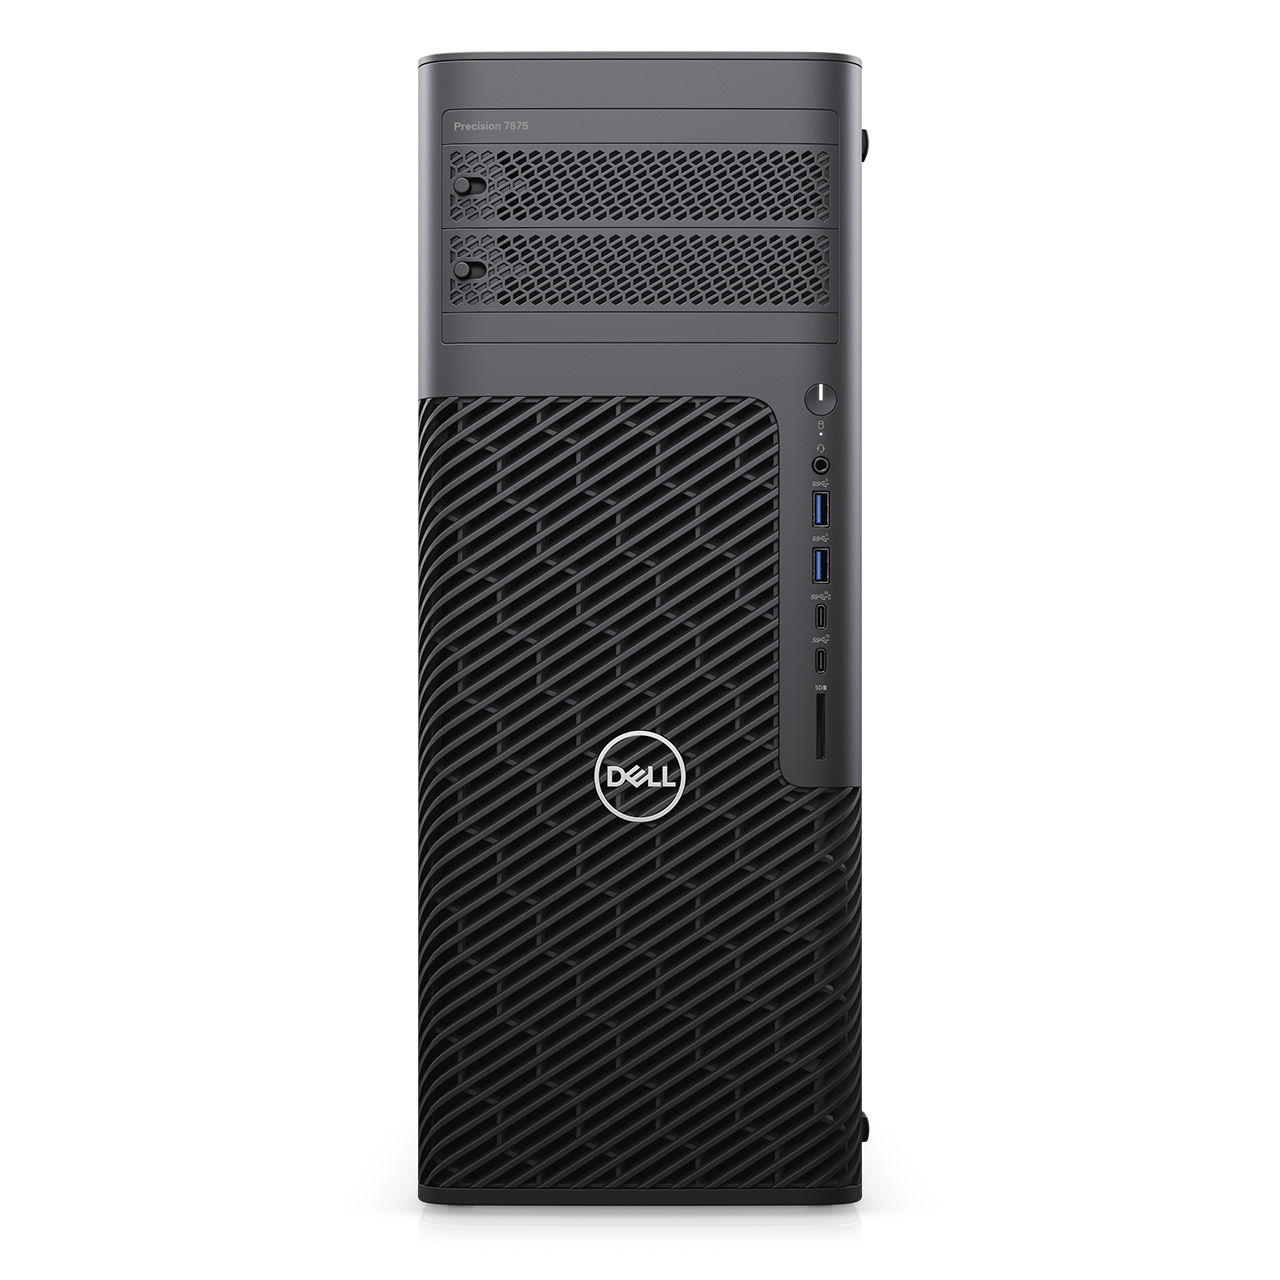
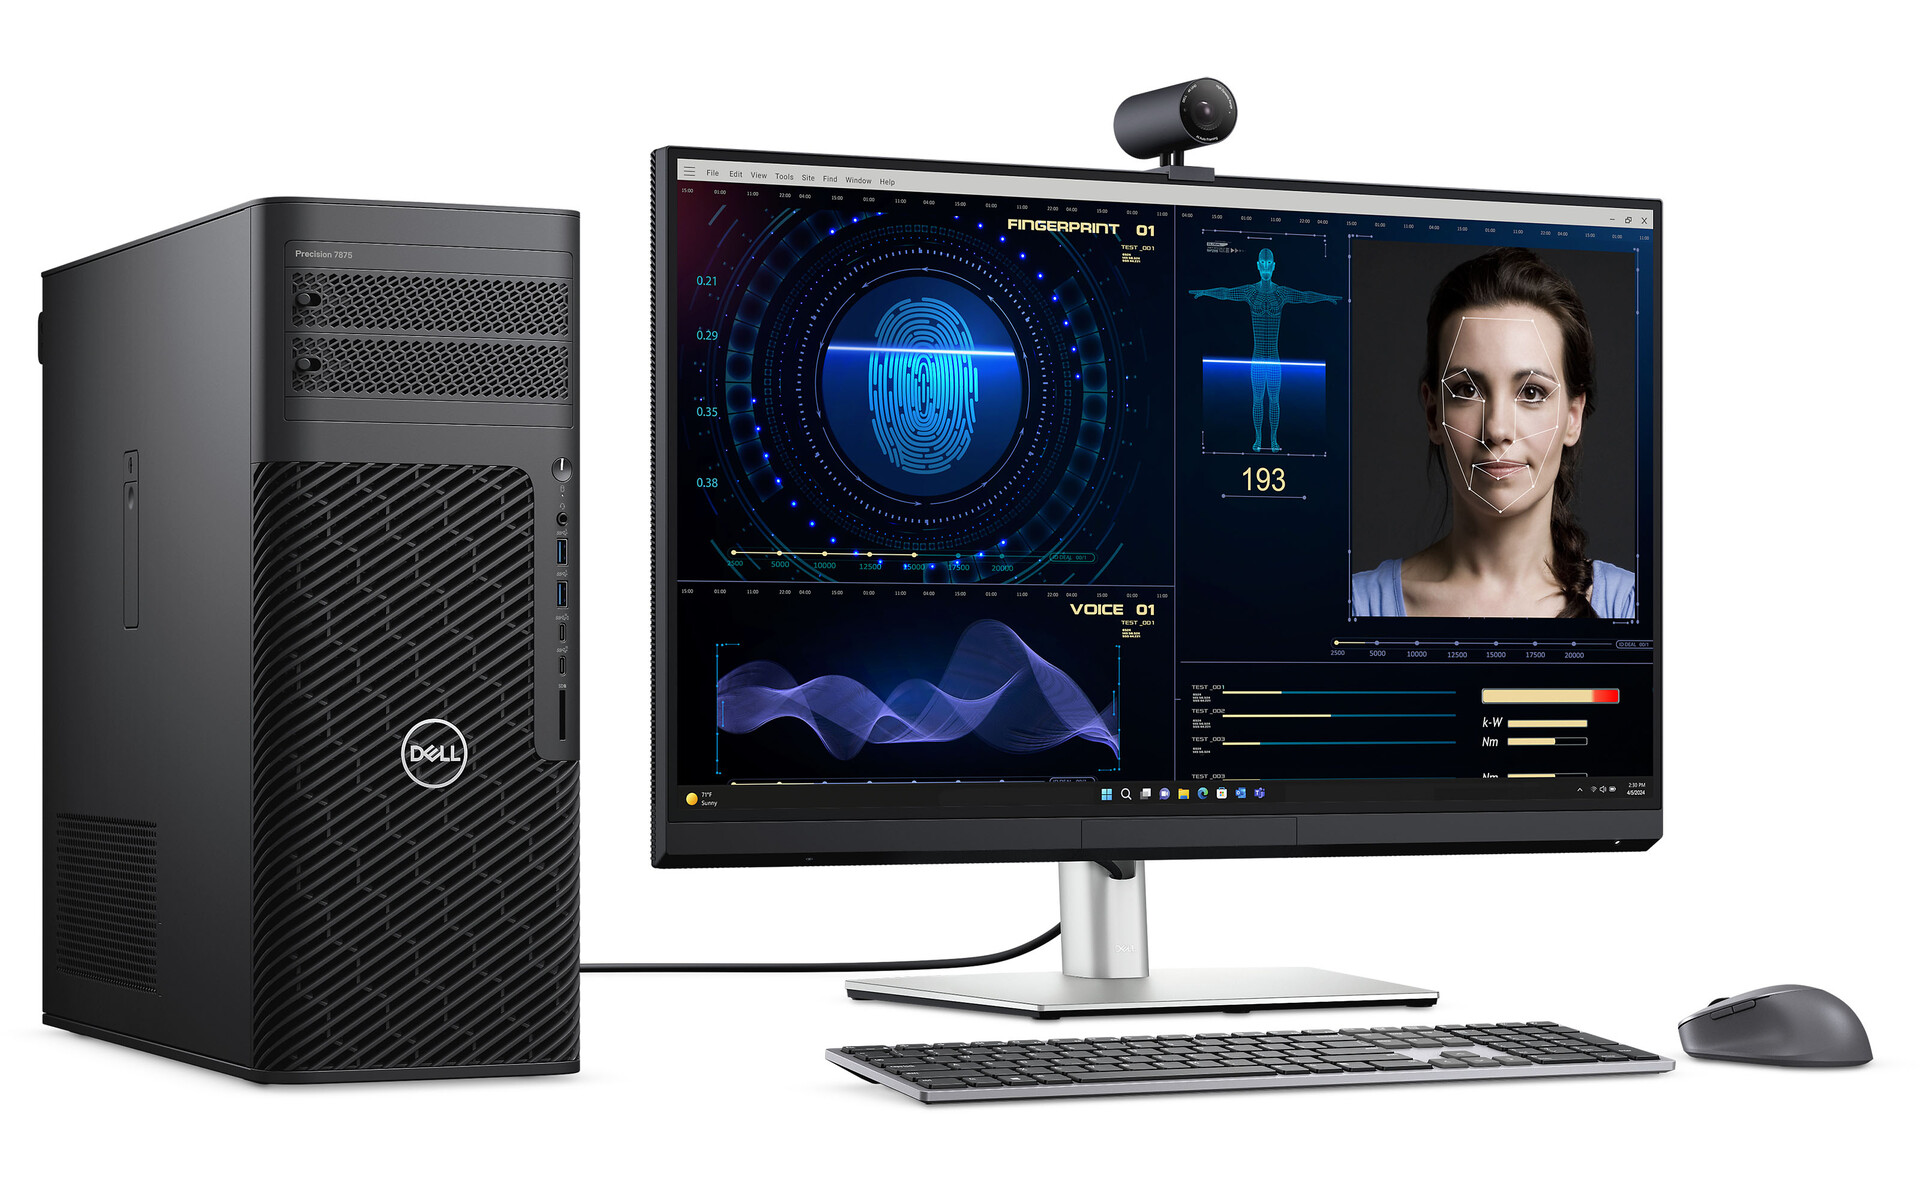
A Precision 7865 Tower Workstation é uma estação de trabalho de alto desempenho da Dell. Com a adição dos mais recentes processadores AMD Ryzen Threadripper da série 7000, a estação de trabalho agora suporta até 96 núcleos de computação e 192 threads. Além disso, ela possui até 1.024 GB de RAM e está equipada com duas placas de vídeo de estação de trabalho de última geração, o que a torna adequada para tarefas excepcionalmente exigentes.
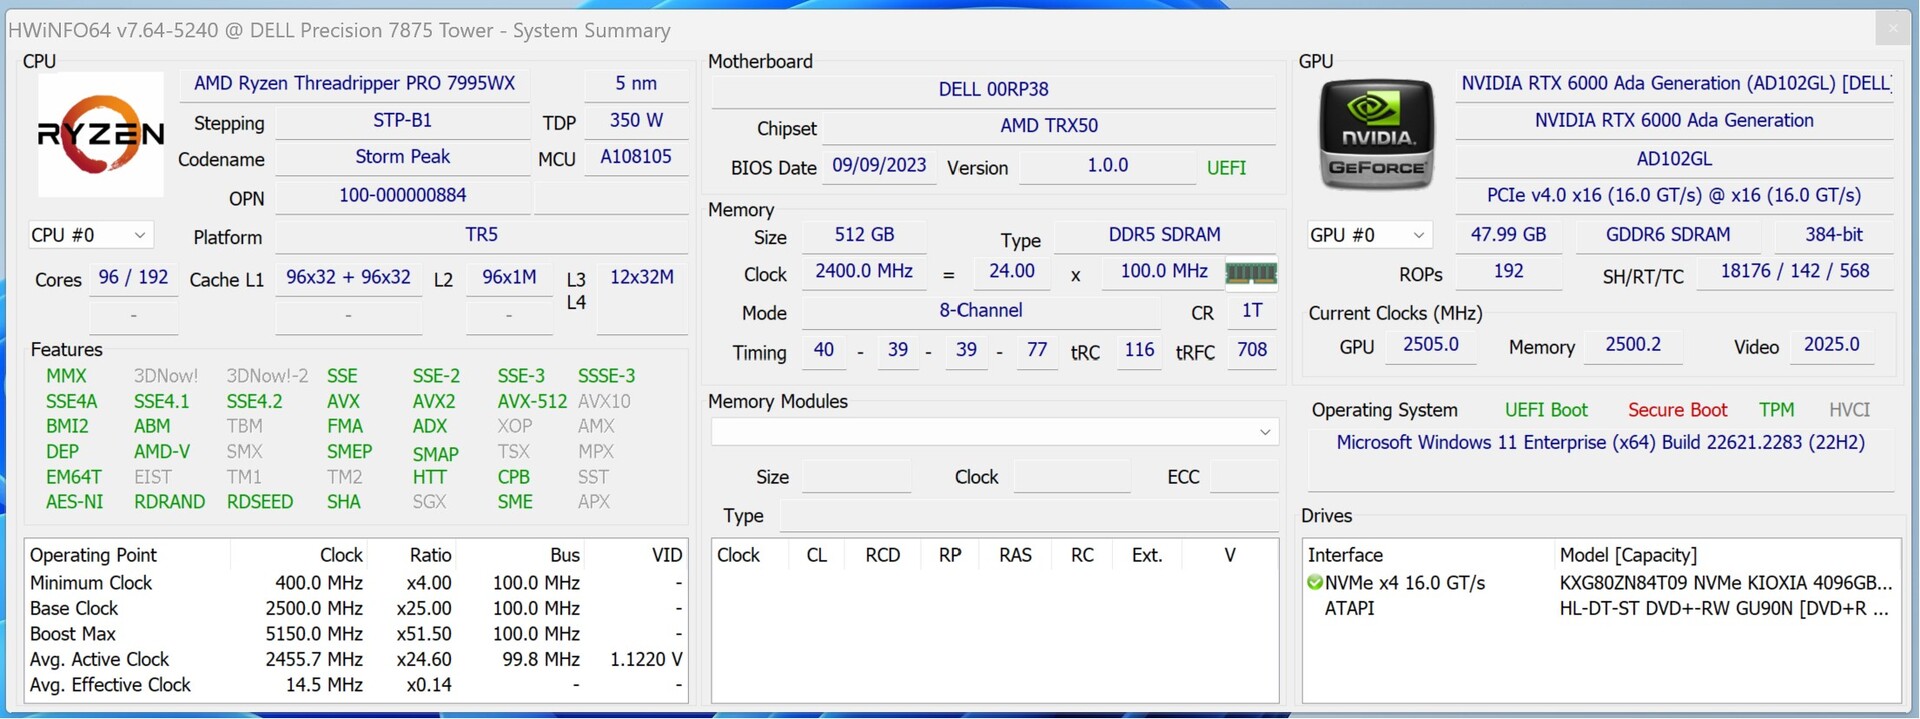
Tivemos a oportunidade de testar a nova estação de trabalho de ponta, que conta com o AMD Ryzen Threadripper Pro 7995WX com 512 GB RDIMM e um SSD de 4 TB. Além disso, o sistema incorpora duas placas Placas de vídeo Nvidia RTX 6000 Ada Generation da Nvidia. Embora não haja informações oficiais sobre o preço do sistema de teste, uma análise detalhada dos preços indica uma faixa de cinco dígitos para a configuração de teste. Essas unidades não se destinam ao uso doméstico, mas encontram seu nicho em ambientes comerciais em que uma potência de computação substancial é essencial, e tempo é dinheiro. A longo prazo, esses sistemas podem se mostrar econômicos se o tempo economizado justificar o investimento.
É claro que a Dell não fornece apenas o modelo superior; os sistemas podem ser personalizados e adaptados a necessidades específicas por meio das opções de configuração da loja.
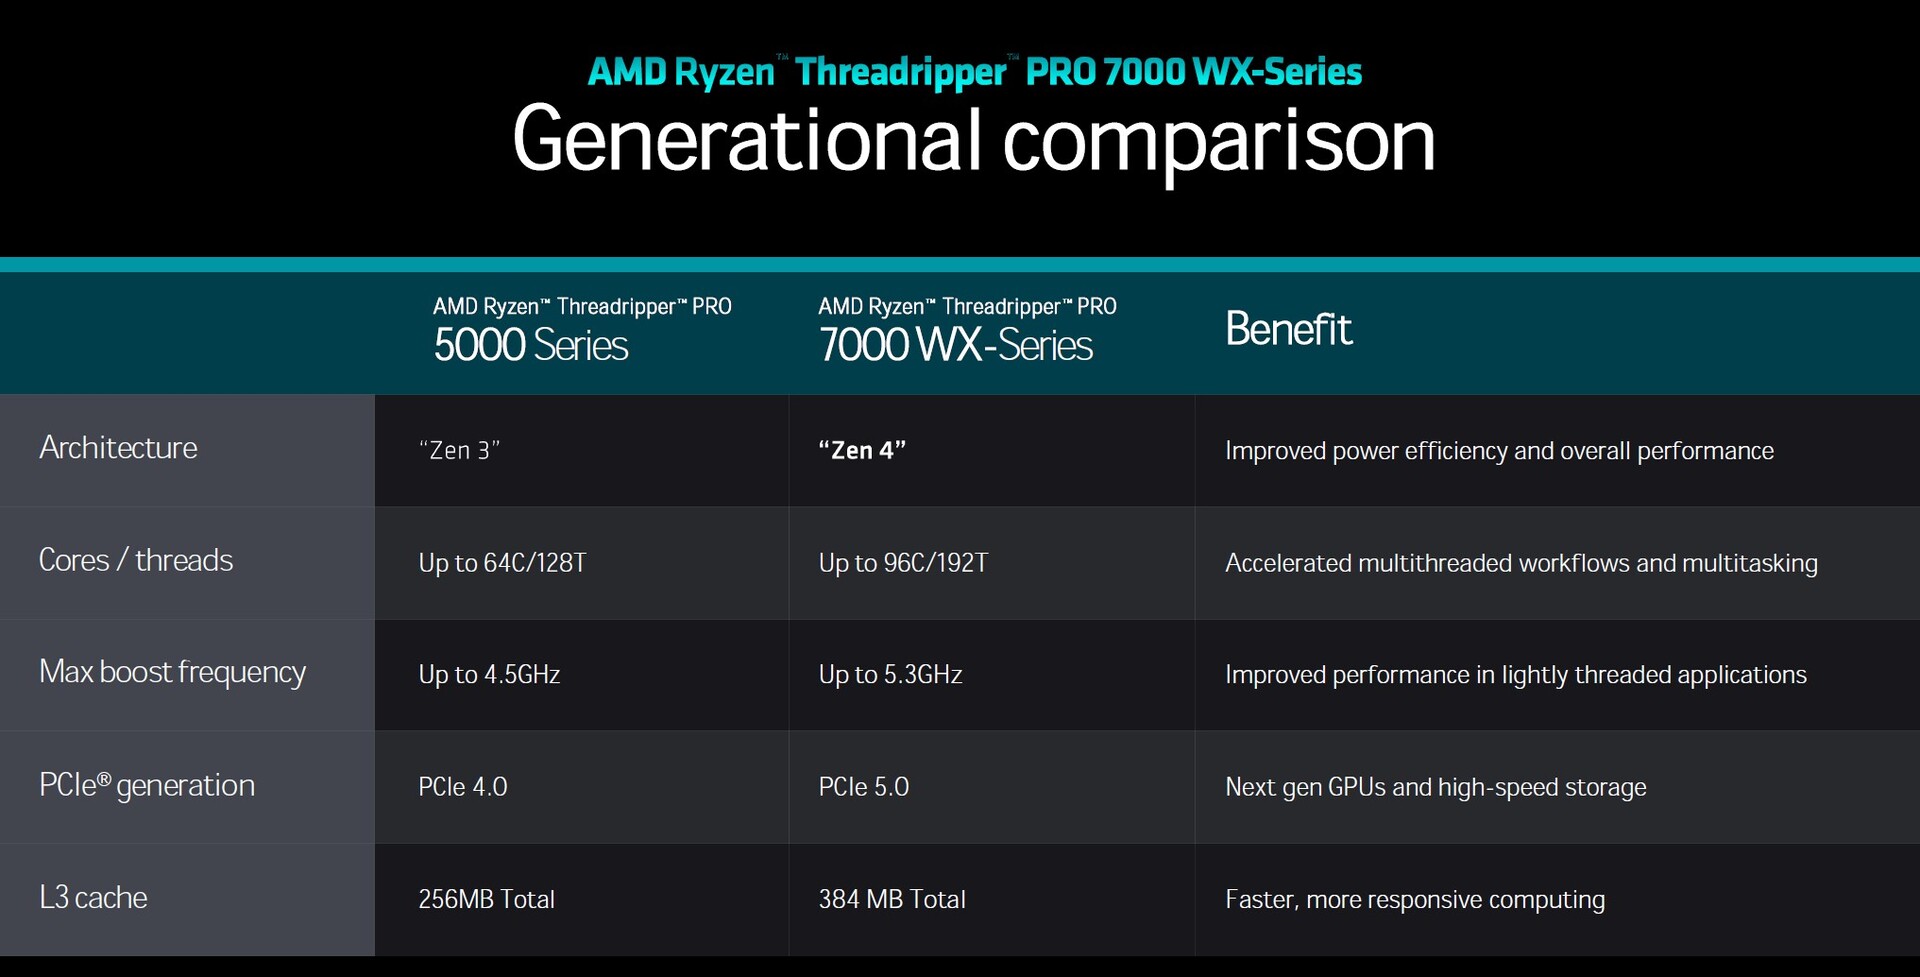
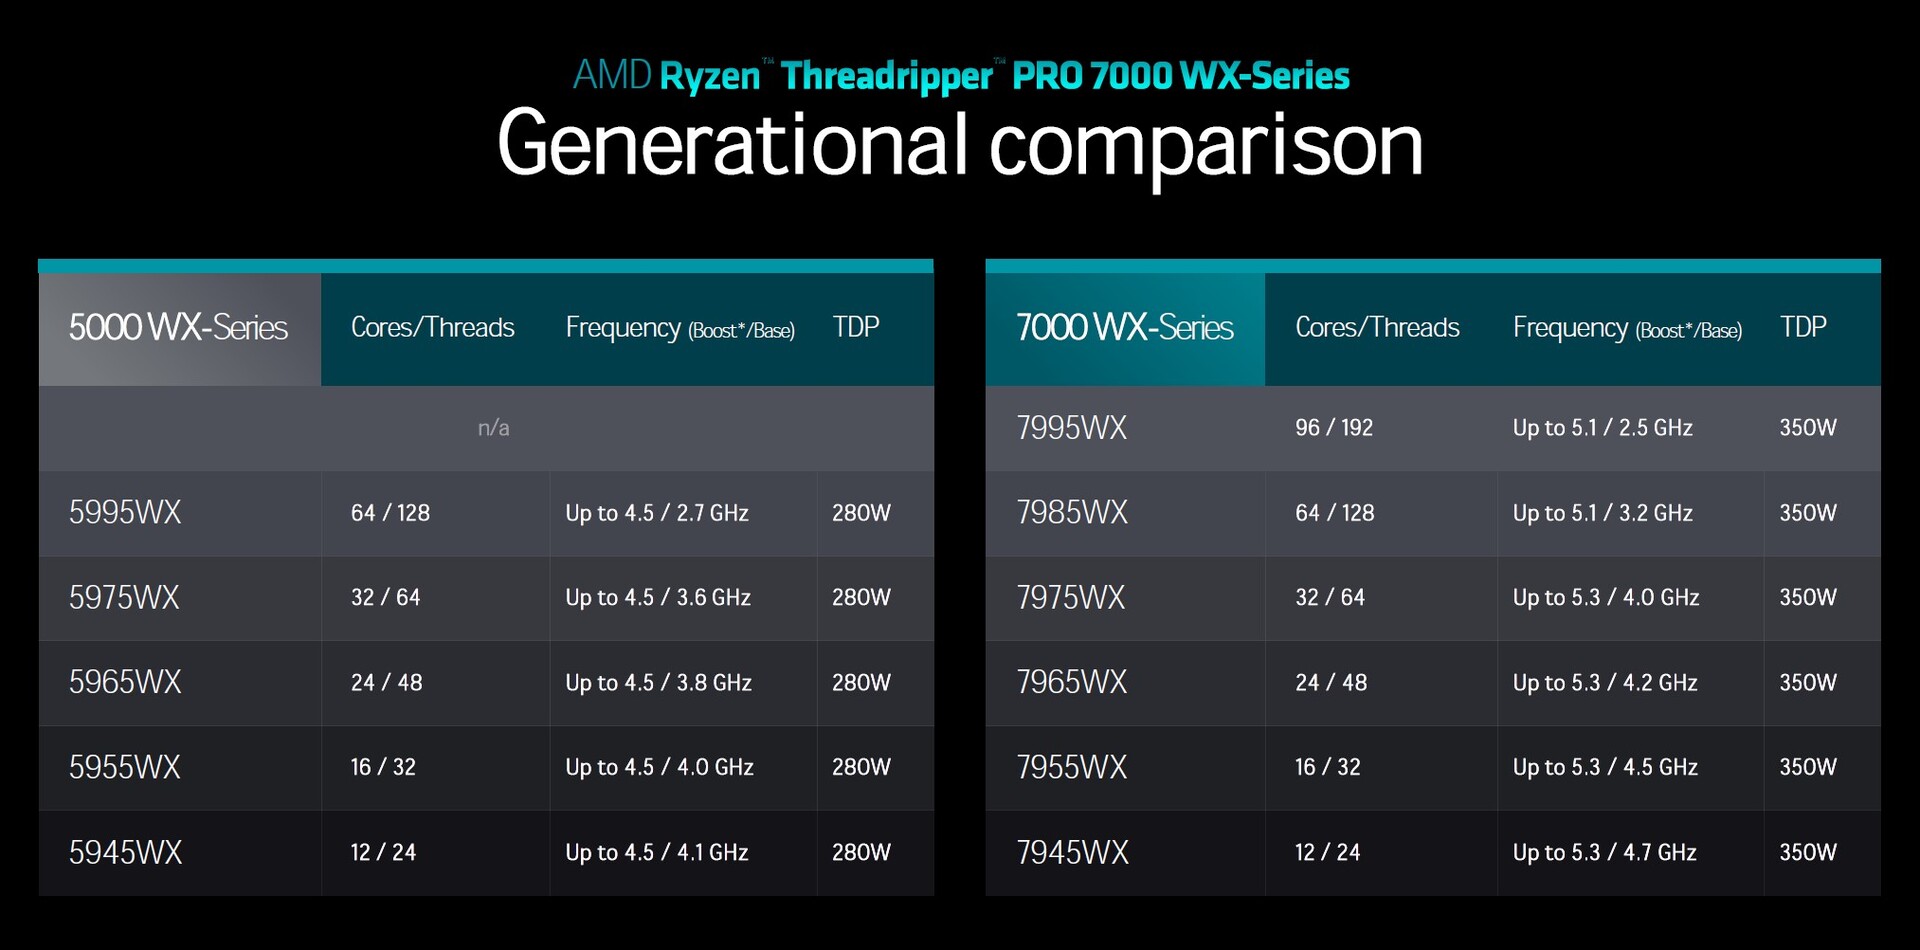
Detalhes sobre o Threadripper-7000-WX-Serie
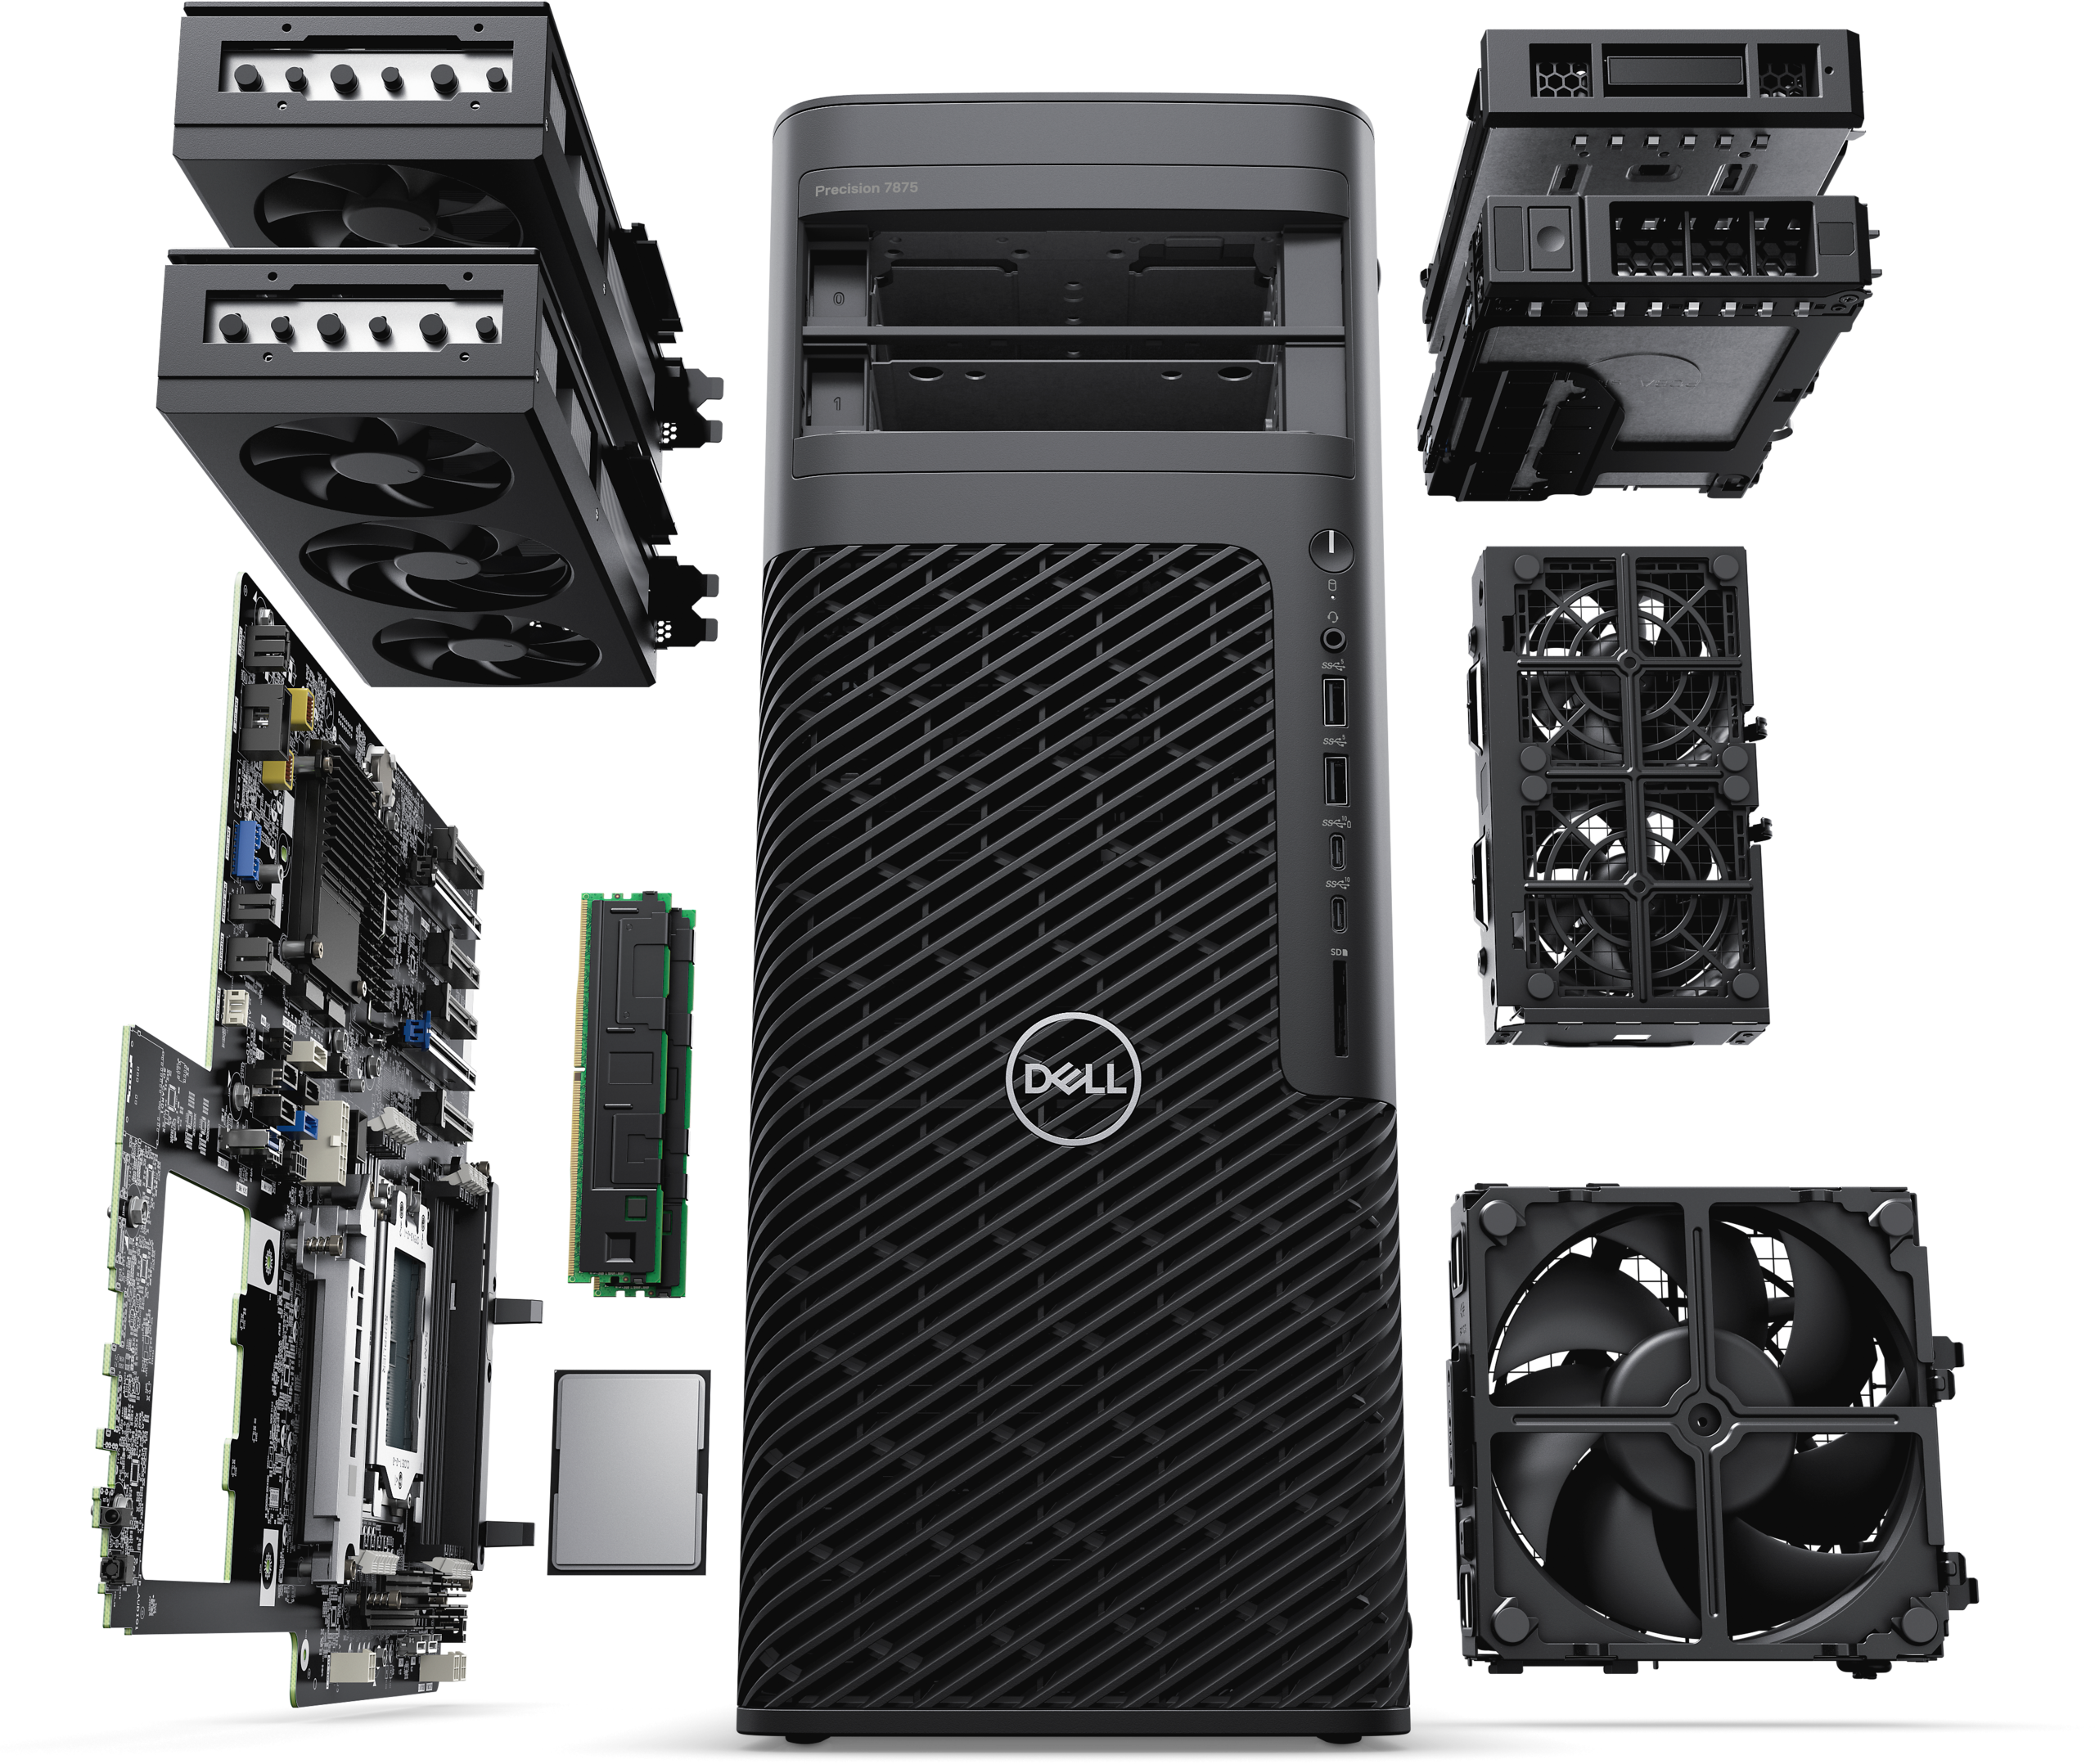
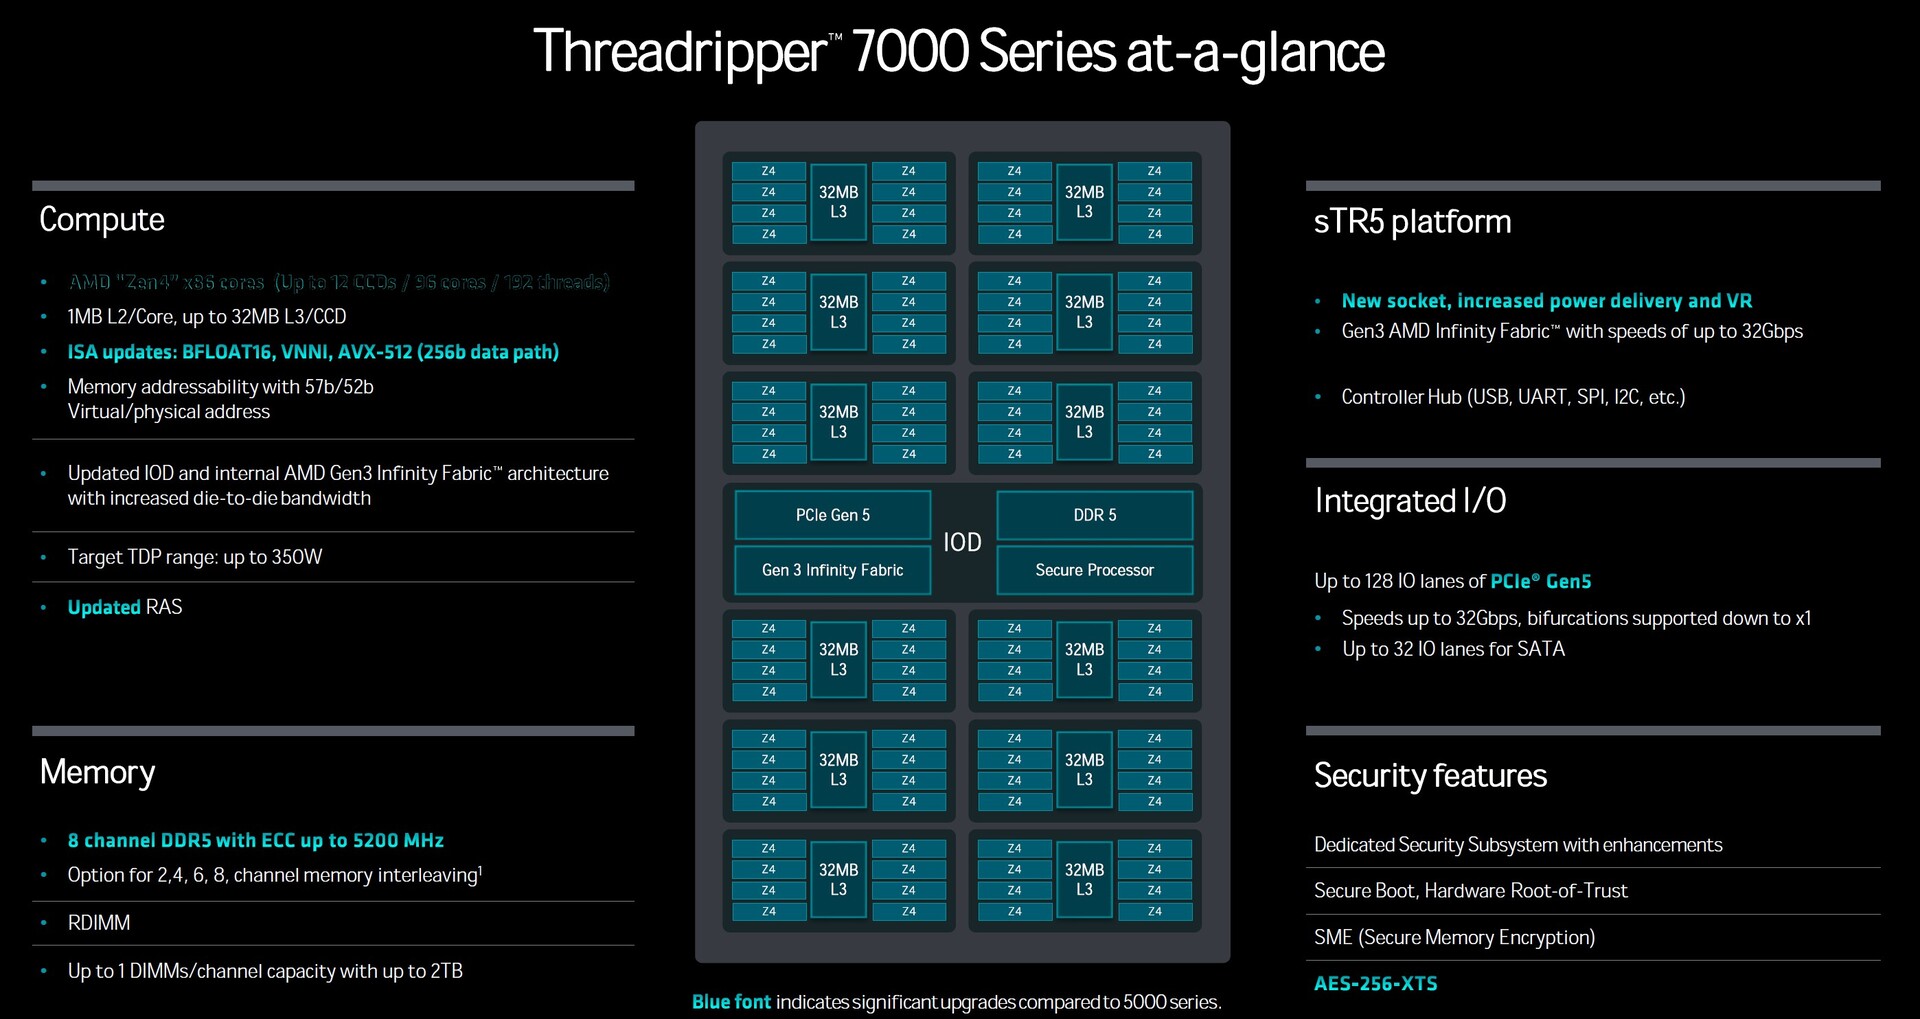
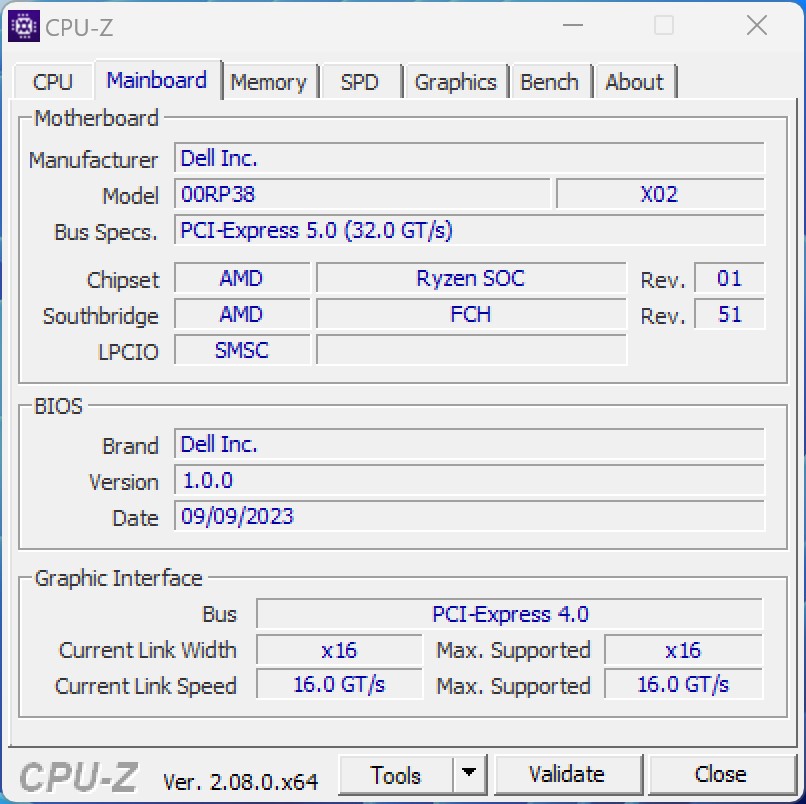
A AMD ofereceu um ganho significativo de desempenho em relação ao Zen3 com suas CPUs Ryzen 7000 baseadas no Zen4, ampliando seu foco para os setores de servidores e estações de trabalho. Enquanto os processadores Threadripper anteriores da série 5000 usavam núcleos Zen3 e tinham um máximo de 64 núcleos nativos, a versão mais recente de ponta, o AMD Ryzen Threadripper Pro 7995WX, tem incríveis 96 núcleos. A arquitetura do chipset é mantida, com 12 CPU Compute Dies (CCDs) localizados abaixo do dissipador de calor. Velocidades de clock mais altas, atingindo até 5,1 GHz no modo de aumento, e um aumento no cache L3 são atualizações notáveis. A adição do PCIe 5.0 é compatível com o padrão mais recente, garantindo que as futuras placas gráficas possam trabalhar com a capacidade máxima. Esse padrão também aprimora os dispositivos de armazenamento em massa, usando altas velocidades de dados nos setores de servidores e estações de trabalho.
Informações importantes sobre as condições de teste
A Dell nos deu a oportunidade de testar remotamente a estação de trabalho em torre Dell Precision 7875. Infelizmente, isso significa que não tivemos acesso direto ao hardware. A conexão com o sistema de teste foi estabelecida por meio do Parsec, o que resultou em uma pequena perda de desempenho, conforme observado pela Dell. No entanto, espera-se que essa perda esteja na faixa baixa de um dígito. A conexão ativa também tem impacto no desempenho 3D. Infelizmente, nem todos os testes puderam ser realizados, pois muitas vezes não era prático iniciar o aplicativo 3D via Parsec. Além disso, não podemos fornecer informações sobre as emissões da unidade de teste.
Benchmarks de processador
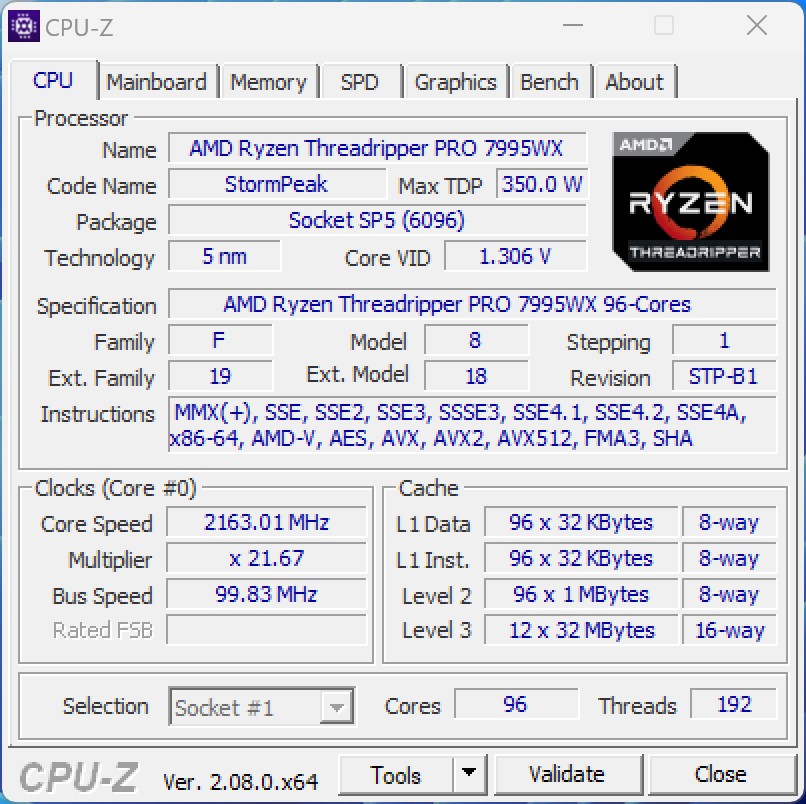
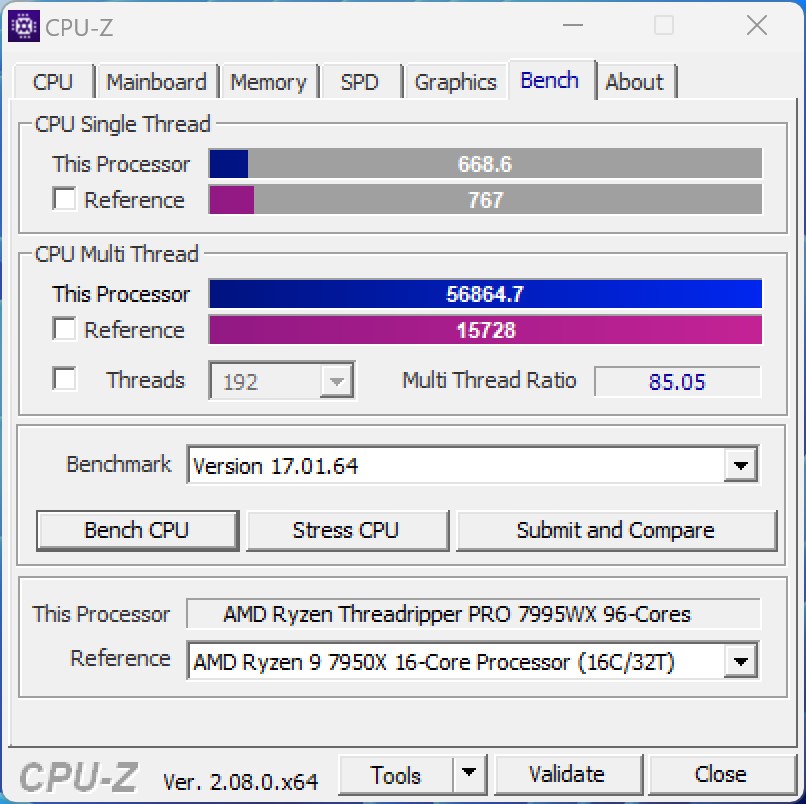
O AMD Ryzen Threadripper Pro 7995WX oferece desempenho substancial, especialmente em cenários em que o software gerencia com eficiência um grande número de núcleos de computação. Em nossos testes, encontramos exemplos negativos em que determinados softwares tiveram dificuldades para lidar com essa abundância de núcleos de computação. Mesmo assim, o AMD Ryzen Threadripper Pro 7995WX continua competitivo em relação a todos os processadores que testamos até agora. Entretanto, em termos de desempenho de núcleo único, ele fica aquém dos atuais processadores da Intel e da AMD no setor de consumo. No entanto, quando comparado ao seu antecessor, o AMD Ryzen Threadripper Pro 3995WXobservamos um aumento significativo no desempenho de mais de 40%. Quanto à contraparte da Intel para os modelos Threadripper da AMD, os modelos Sapphire Rapids, que atualmente oferecem um máximo de 56 núcleos, infelizmente, não temos dados comparativos.
O AMD Ryzen Threadripper Pro 7995WX opera em um clock base de 2,5 GHz, com o potencial de atingir até 5,1 GHz no modo de aumento. Em comparação com seus antecessores, a AMD também aumentou o consumo máximo de energia, atingindo agora até 350 watts, um valor que confirmamos durante os testes.
Para comparações e benchmarks adicionais, consulte nossa Tabela de comparação de CPUs.
| Cinebench R23 | |
| Single Core | |
| Intel Core i9-14900K | |
| AMD Ryzen 9 7950X3D | |
| AMD Ryzen 9 7950X | |
| AMD Ryzen Threadripper PRO 7995WX | |
| AMD Ryzen Threadripper PRO 3995WX | |
| Multi Core | |
| AMD Ryzen Threadripper PRO 7995WX | |
| AMD Ryzen Threadripper PRO 3995WX | |
| Intel Core i9-14900K | |
| AMD Ryzen 9 7950X | |
| AMD Ryzen 9 7950X3D | |
| Cinebench R20 | |
| CPU (Single Core) | |
| Intel Core i9-14900K | |
| AMD Ryzen 9 7950X | |
| AMD Ryzen 9 7950X3D | |
| AMD Ryzen Threadripper PRO 7995WX | |
| AMD Ryzen Threadripper PRO 3995WX | |
| CPU (Multi Core) | |
| AMD Ryzen Threadripper PRO 7995WX | |
| AMD Ryzen Threadripper PRO 3995WX | |
| Intel Core i9-14900K | |
| AMD Ryzen 9 7950X | |
| AMD Ryzen 9 7950X3D | |
| Cinebench 2024 | |
| CPU Multi Core | |
| AMD Ryzen Threadripper PRO 7995WX | |
| Intel Core i9-14900K | |
| CPU Single Core | |
| Intel Core i9-14900K | |
| AMD Ryzen Threadripper PRO 7995WX | |
| Cinebench R15 | |
| CPU Single 64Bit | |
| Intel Core i9-14900K | |
| AMD Ryzen 9 7950X | |
| AMD Ryzen 9 7950X3D | |
| AMD Ryzen Threadripper PRO 7995WX | |
| AMD Ryzen Threadripper PRO 3995WX | |
| CPU Multi 64Bit | |
| AMD Ryzen Threadripper PRO 7995WX | |
| AMD Ryzen Threadripper PRO 3995WX | |
| Intel Core i9-14900K | |
| AMD Ryzen 9 7950X | |
| AMD Ryzen 9 7950X3D | |
| Cinebench R11.5 | |
| CPU Single 64Bit | |
| Intel Core i9-14900K | |
| AMD Ryzen 9 7950X | |
| AMD Ryzen 9 7950X3D | |
| AMD Ryzen Threadripper PRO 7995WX | |
| AMD Ryzen Threadripper PRO 3995WX | |
| CPU Multi 64Bit | |
| AMD Ryzen Threadripper PRO 7995WX | |
| Intel Core i9-14900K | |
| AMD Ryzen 9 7950X | |
| AMD Ryzen 9 7950X3D | |
| AMD Ryzen Threadripper PRO 3995WX | |
| Cinebench R10 | |
| Rendering Single CPUs 64Bit | |
| Intel Core i9-14900K | |
| AMD Ryzen 9 7950X | |
| AMD Ryzen Threadripper PRO 3995WX | |
| AMD Ryzen 9 7950X3D | |
| AMD Ryzen Threadripper PRO 7995WX | |
| Rendering Multiple CPUs 64Bit | |
| Intel Core i9-14900K | |
| AMD Ryzen 9 7950X | |
| AMD Ryzen Threadripper PRO 3995WX | |
| AMD Ryzen 9 7950X3D | |
| AMD Ryzen Threadripper PRO 7995WX | |
| Blender - v2.79 BMW27 CPU | |
| AMD Ryzen 9 7950X3D | |
| AMD Ryzen 9 7950X | |
| Intel Core i9-14900K | |
| AMD Ryzen Threadripper PRO 3995WX | |
| AMD Ryzen Threadripper PRO 7995WX | |
| wPrime 2.10 | |
| 32m | |
| AMD Ryzen Threadripper PRO 7995WX | |
| AMD Ryzen Threadripper PRO 3995WX | |
| Intel Core i9-14900K | |
| AMD Ryzen 9 7950X3D | |
| AMD Ryzen 9 7950X | |
| 1024m | |
| Intel Core i9-14900K | |
| AMD Ryzen 9 7950X3D | |
| AMD Ryzen 9 7950X | |
| AMD Ryzen Threadripper PRO 3995WX | |
| AMD Ryzen Threadripper PRO 7995WX | |
| X264 HD Benchmark 4.0 | |
| Pass 1 | |
| Intel Core i9-14900K | |
| AMD Ryzen 9 7950X3D | |
| AMD Ryzen 9 7950X | |
| AMD Ryzen Threadripper PRO 7995WX | |
| AMD Ryzen Threadripper PRO 3995WX | |
| Pass 2 | |
| Intel Core i9-14900K | |
| AMD Ryzen Threadripper PRO 7995WX | |
| AMD Ryzen 9 7950X | |
| AMD Ryzen 9 7950X3D | |
| AMD Ryzen Threadripper PRO 3995WX | |
| WinRAR - Result | |
| AMD Ryzen Threadripper PRO 7995WX | |
| AMD Ryzen 9 7950X | |
| Intel Core i9-14900K | |
| AMD Ryzen 9 7950X3D | |
| AMD Ryzen Threadripper PRO 3995WX | |
| TrueCrypt | |
| AES Mean 100MB | |
| AMD Ryzen Threadripper PRO 7995WX | |
| AMD Ryzen 9 7950X | |
| AMD Ryzen 9 7950X3D | |
| Intel Core i9-14900K | |
| AMD Ryzen Threadripper PRO 3995WX | |
| Twofish Mean 100MB | |
| Intel Core i9-14900K | |
| AMD Ryzen Threadripper PRO 7995WX | |
| AMD Ryzen Threadripper PRO 3995WX | |
| AMD Ryzen 9 7950X | |
| AMD Ryzen 9 7950X3D | |
| Serpent Mean 100MB | |
| AMD Ryzen Threadripper PRO 7995WX | |
| AMD Ryzen Threadripper PRO 3995WX | |
| AMD Ryzen 9 7950X | |
| AMD Ryzen 9 7950X3D | |
| Intel Core i9-14900K | |
| 3DMark 11 - 1280x720 Performance Physics | |
| AMD Ryzen 9 7950X3D | |
| Intel Core i9-14900K | |
| AMD Ryzen 9 7950X | |
| AMD Ryzen Threadripper PRO 7995WX | |
| AMD Ryzen Threadripper PRO 3995WX | |
| AMD Ryzen Threadripper PRO 3975WX | |
| 7-Zip 18.03 | |
| 7z b 4 | |
| AMD Ryzen Threadripper PRO 7995WX | |
| AMD Ryzen 9 7950X | |
| AMD Ryzen 9 7950X3D | |
| Intel Core i9-14900K | |
| AMD Ryzen Threadripper PRO 3995WX | |
| 7z b 4 -mmt1 | |
| AMD Ryzen 9 7950X | |
| AMD Ryzen 9 7950X3D | |
| Intel Core i9-14900K | |
| AMD Ryzen Threadripper PRO 7995WX | |
| AMD Ryzen Threadripper PRO 3995WX | |
| HWBOT x265 Benchmark v2.2 - 4k Preset | |
| AMD Ryzen Threadripper PRO 7995WX | |
| AMD Ryzen Threadripper PRO 3995WX | |
| AMD Ryzen 9 7950X | |
| Intel Core i9-14900K | |
| AMD Ryzen 9 7950X3D | |
| R Benchmark 2.5 - Overall mean | |
| AMD Ryzen Threadripper PRO 3995WX | |
| AMD Ryzen Threadripper PRO 7995WX | |
| AMD Ryzen 9 7950X3D | |
| AMD Ryzen 9 7950X | |
| Intel Core i9-14900K | |
| LibreOffice - 20 Documents To PDF | |
| AMD Ryzen Threadripper PRO 3995WX | |
| AMD Ryzen Threadripper PRO 7995WX | |
| AMD Ryzen 9 7950X3D | |
| AMD Ryzen 9 7950X | |
| Intel Core i9-14900K | |
| WebXPRT 3 - Overall | |
| AMD Ryzen 9 7950X3D | |
| Intel Core i9-14900K | |
| AMD Ryzen 9 7950X | |
| AMD Ryzen Threadripper PRO 7995WX | |
| AMD Ryzen Threadripper PRO 3995WX | |
| Mozilla Kraken 1.1 - Total | |
| AMD Ryzen Threadripper PRO 3995WX | |
| AMD Ryzen Threadripper PRO 7995WX | |
| AMD Ryzen 9 7950X3D | |
| AMD Ryzen 9 7950X | |
| Intel Core i9-14900K | |
| 3DMark | |
| 3840x2160 Fire Strike Ultra Physics | |
| Intel Core i9-14900K | |
| AMD Ryzen 9 7950X3D | |
| AMD Ryzen 9 7950X | |
| AMD Ryzen Threadripper PRO 7995WX | |
| AMD Ryzen Threadripper PRO 3995WX | |
| AMD Ryzen Threadripper PRO 3975WX | |
| 1920x1080 Fire Strike Physics | |
| Intel Core i9-14900K | |
| AMD Ryzen 9 7950X3D | |
| AMD Ryzen 9 7950X | |
| AMD Ryzen Threadripper PRO 7995WX | |
| AMD Ryzen Threadripper PRO 3995WX | |
| AMD Ryzen Threadripper PRO 3975WX | |
| 2560x1440 Time Spy CPU | |
| Intel Core i9-14900K | |
| AMD Ryzen 9 7950X3D | |
| AMD Ryzen 9 7950X | |
| AMD Ryzen Threadripper PRO 7995WX | |
| AMD Ryzen Threadripper PRO 3975WX | |
| AMD Ryzen Threadripper PRO 3995WX | |
| Geekbench 6.0 | |
| Multi-Core | |
| AMD Ryzen Threadripper PRO 7995WX | |
| Intel Core i9-14900K | |
| Single-Core | |
| Intel Core i9-14900K | |
| AMD Ryzen Threadripper PRO 7995WX | |
| Geekbench 6.7 | |
| Multi-Core | |
| AMD Ryzen Threadripper PRO 7995WX | |
| Intel Core i9-14900K | |
| AMD Ryzen 9 7950X3D | |
| Single-Core | |
| Intel Core i9-14900K | |
| AMD Ryzen 9 7950X3D | |
| AMD Ryzen Threadripper PRO 7995WX | |
* ... menor é melhor
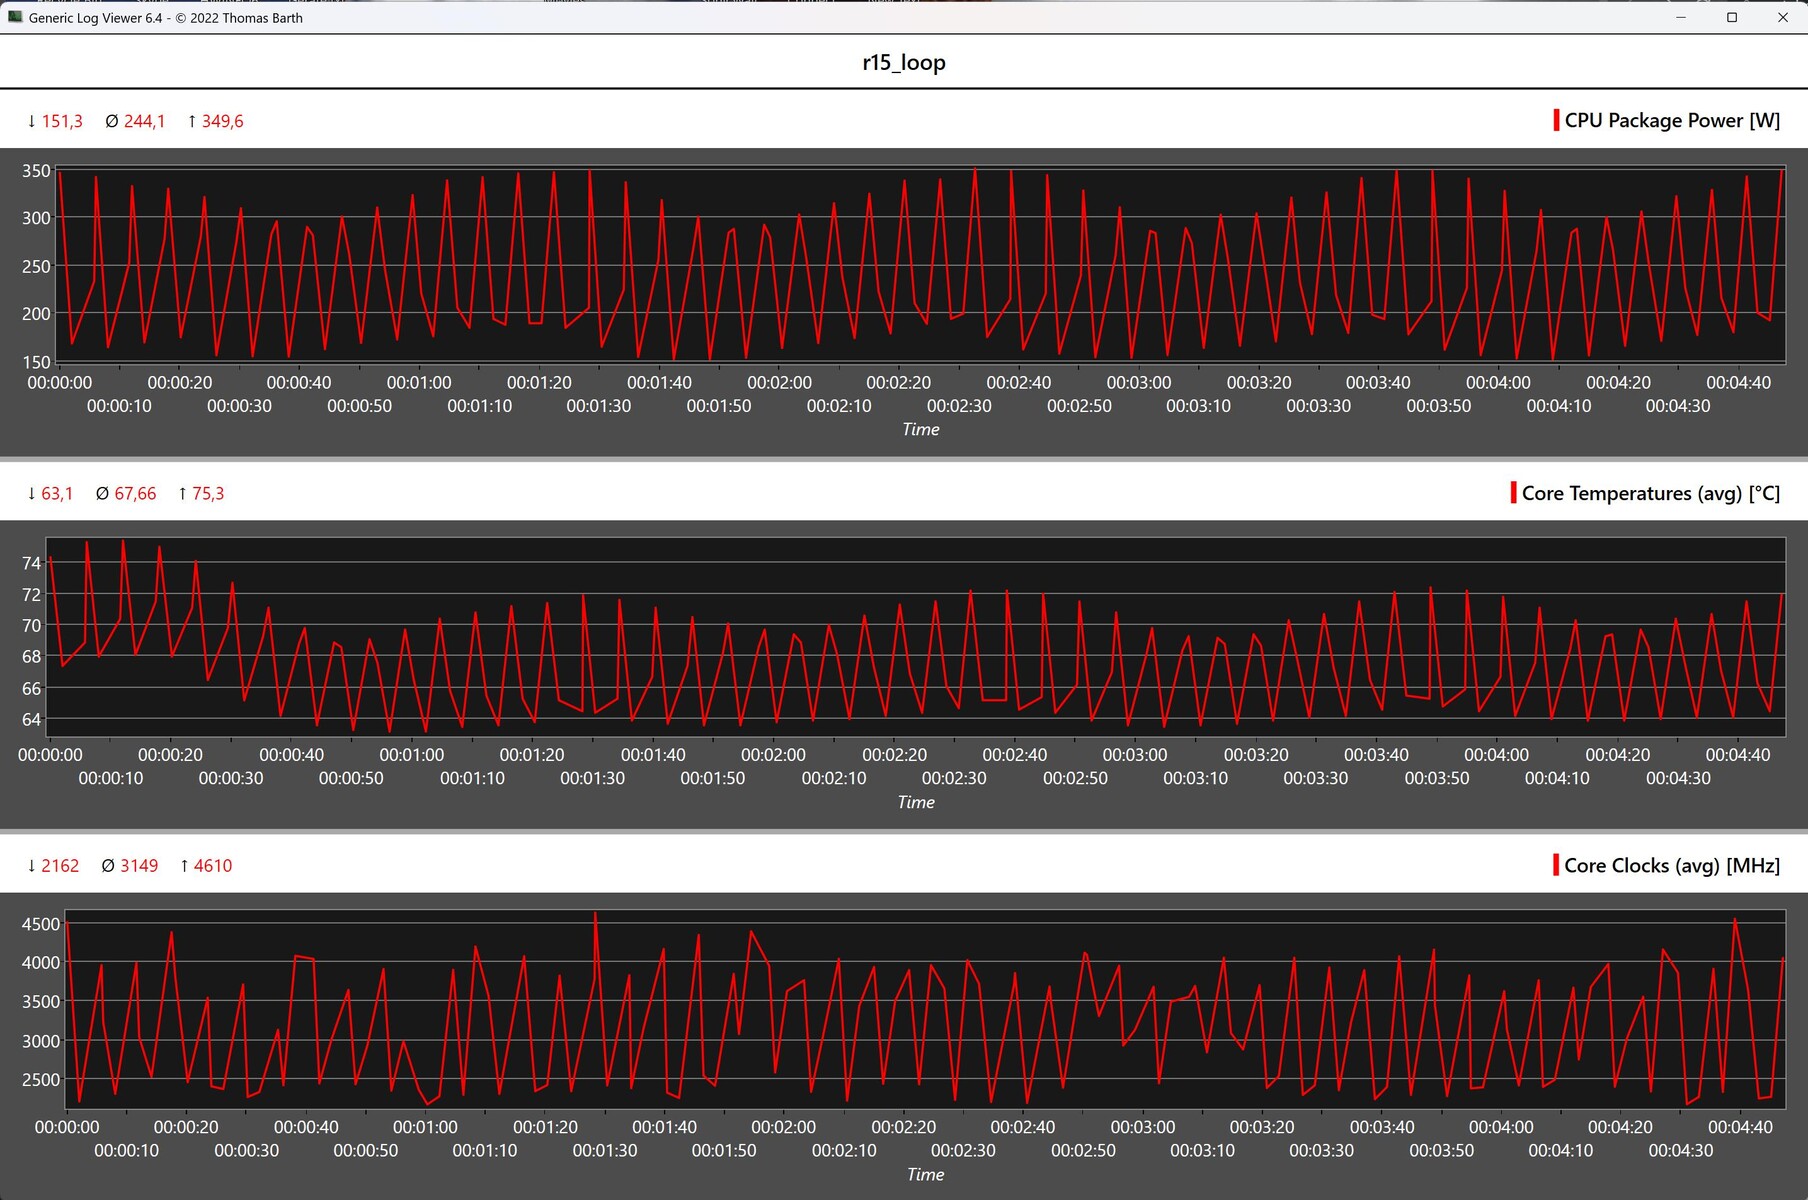
Workstation Dell Precision 7875 Tower em Cinebench R15 Multi Loop
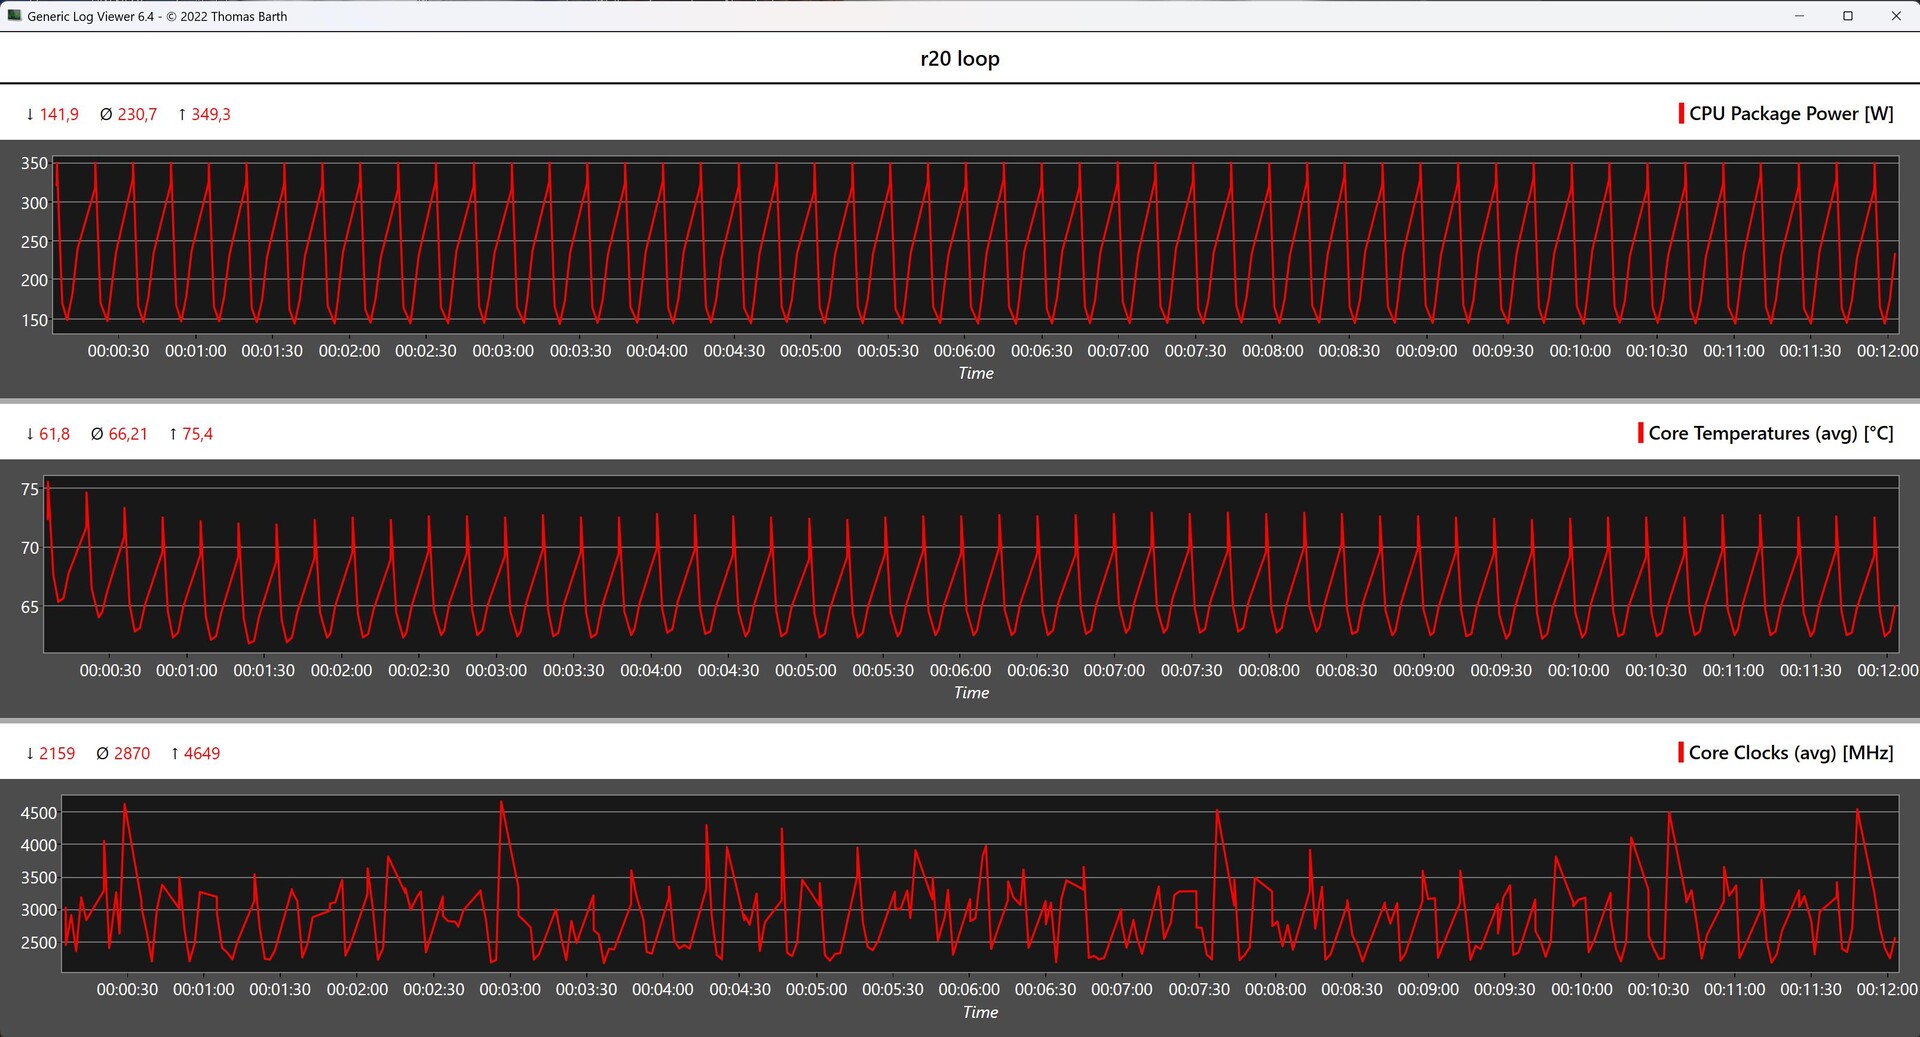
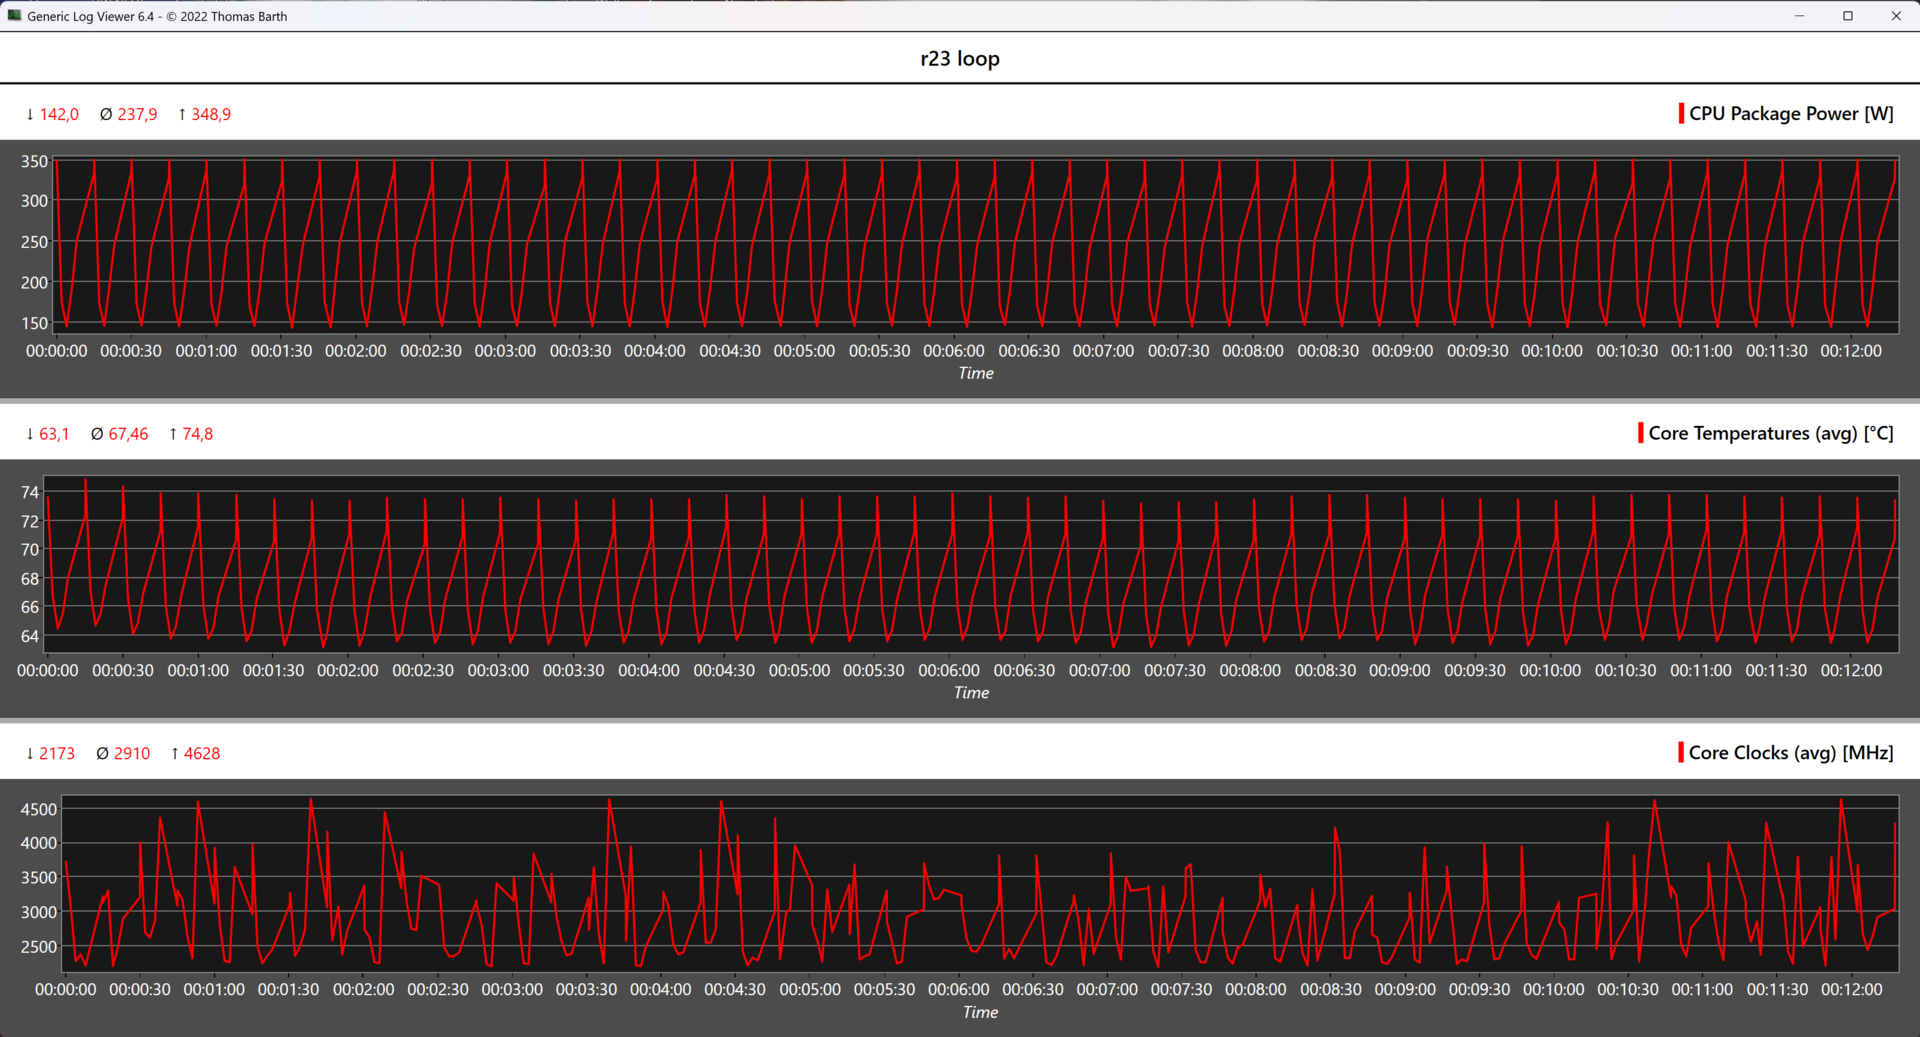
A estação de trabalho Dell Precision 7875 Tower se destaca durante o teste de estresse do Cinebench R15 Multi Loop, apresentando um resultado excepcional. Ao longo das 50 execuções, observamos apenas pequenas flutuações no desempenho, descartando qualquer queda significativa na potência com recursos cada vez menores. Os dados de telemetria revelam que o processador pode ser operado de forma consistente com a potência máxima de 350 watts sem apresentar problemas. Além disso, o sistema demonstrou desempenho estável em testes de estresse envolvendo o Cinebench R20 Multi Loop e o Cinebench R23 Multi Loop.
Benchmarks sintéticos e desempenho de aplicativos
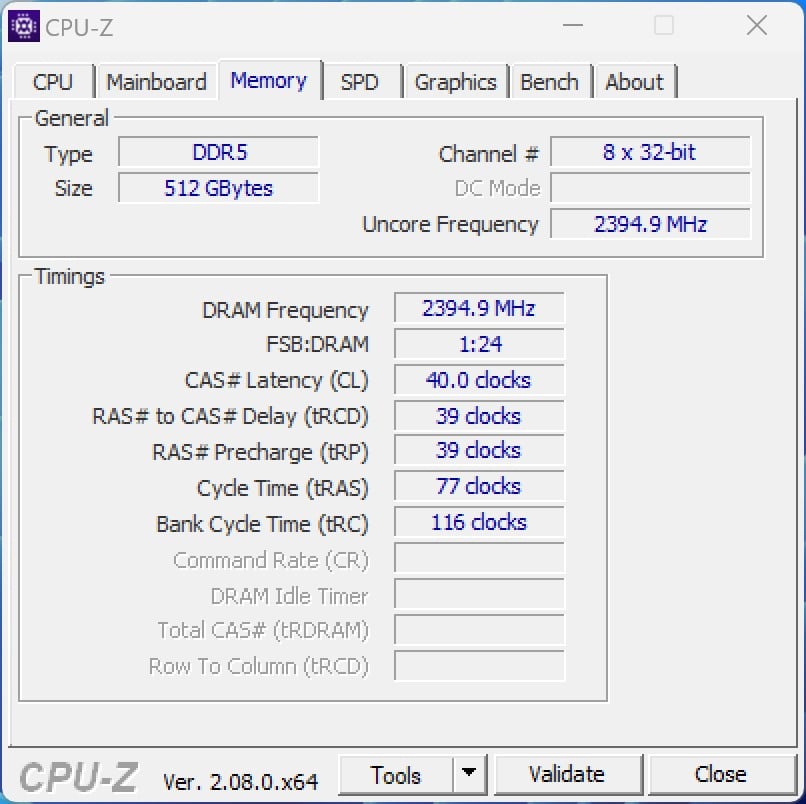
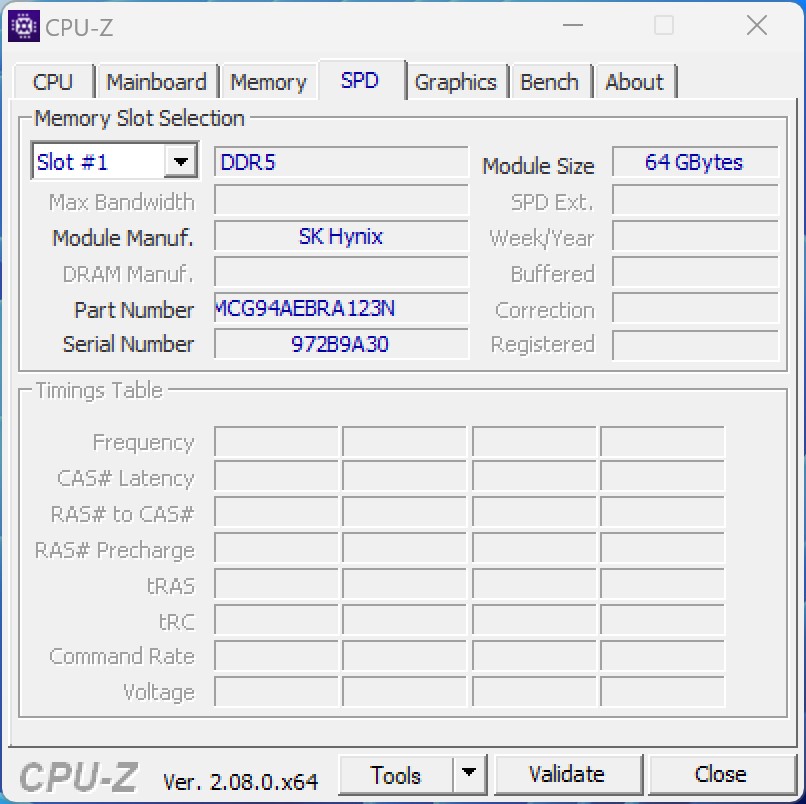
Os testes sintéticos realizados com o sistema de teste indicam que o número substancial de núcleos de computação não pode ser totalmente aproveitado, o que faz com que o sistema tenha dificuldades para superar seus concorrentes. Embora o Dell Precision 7875 Tower tenha saído vitorioso em uma comparação direta com o Lenovo ThinkStation P620 baseado no AMD Ryzen Threadripper Pro 3995WXa vantagem mais significativa está nos testes de RAM. A operação de octa-canal do nosso sistema de teste permite que ele afirme uma liderança clara com valores impressionantes. A RDRAMM instalada, com clock de 4.800 MT/s, é notavelmente grande, com 512 GB. Além disso, a RAM apresenta suporte a ECC, um recurso esperado como padrão no setor de estações de trabalho.
| 3DMark | |
| 1920x1080 Fire Strike Physics | |
| Intel Core i9-14900K | |
| AMD Ryzen 9 7950X3D | |
| AMD Ryzen 9 7950X | |
| AMD Ryzen Threadripper PRO 7995WX | |
| AMD Ryzen Threadripper PRO 3995WX | |
| AMD Ryzen Threadripper PRO 3975WX | |
| 2560x1440 Time Spy CPU | |
| Intel Core i9-14900K | |
| AMD Ryzen 9 7950X3D | |
| AMD Ryzen 9 7950X | |
| AMD Ryzen Threadripper PRO 7995WX | |
| AMD Ryzen Threadripper PRO 3975WX | |
| AMD Ryzen Threadripper PRO 3995WX | |
| 3DMark 11 - 1280x720 Performance Physics | |
| AMD Ryzen 9 7950X3D | |
| Intel Core i9-14900K | |
| AMD Ryzen 9 7950X | |
| AMD Ryzen Threadripper PRO 7995WX | |
| AMD Ryzen Threadripper PRO 3995WX | |
| AMD Ryzen Threadripper PRO 3975WX | |
| CrossMark - Overall | |
| Intel Core i9-14900K | |
| AMD Ryzen 9 7950X | |
| AMD Ryzen 9 7950X3D | |
| AMD Ryzen Threadripper PRO 7995WX | |
| AIDA64 / Memory Copy | |
| AMD Ryzen Threadripper PRO 7995WX | |
| AMD Ryzen Threadripper PRO 3995WX | |
| Intel Core i9-14900K | |
| Intel Core i9-14900K | |
| AMD Ryzen 9 7950X3D | |
| AMD Ryzen 9 7950X | |
| Média da turma (4514 - 234662, n=2226) | |
| AIDA64 / Memory Read | |
| AMD Ryzen Threadripper PRO 7995WX | |
| AMD Ryzen Threadripper PRO 3995WX | |
| Intel Core i9-14900K | |
| Intel Core i9-14900K | |
| AMD Ryzen 9 7950X3D | |
| AMD Ryzen 9 7950X | |
| Média da turma (4031 - 271066, n=2188) | |
| AIDA64 / Memory Write | |
| AMD Ryzen Threadripper PRO 7995WX | |
| AMD Ryzen Threadripper PRO 3995WX | |
| AMD Ryzen 9 7950X3D | |
| Intel Core i9-14900K | |
| Intel Core i9-14900K | |
| AMD Ryzen 9 7950X | |
| Média da turma (3506 - 242868, n=2193) | |
| AIDA64 / Memory Latency | |
| AMD Ryzen Threadripper PRO 3995WX | |
| Média da turma (6.1 - 536, n=2254) | |
| AMD Ryzen Threadripper PRO 7995WX | |
| Intel Core i9-14900K | |
| Intel Core i9-14900K | |
| AMD Ryzen 9 7950X3D | |
| AMD Ryzen 9 7950X | |
* ... menor é melhor
desempenho 3D
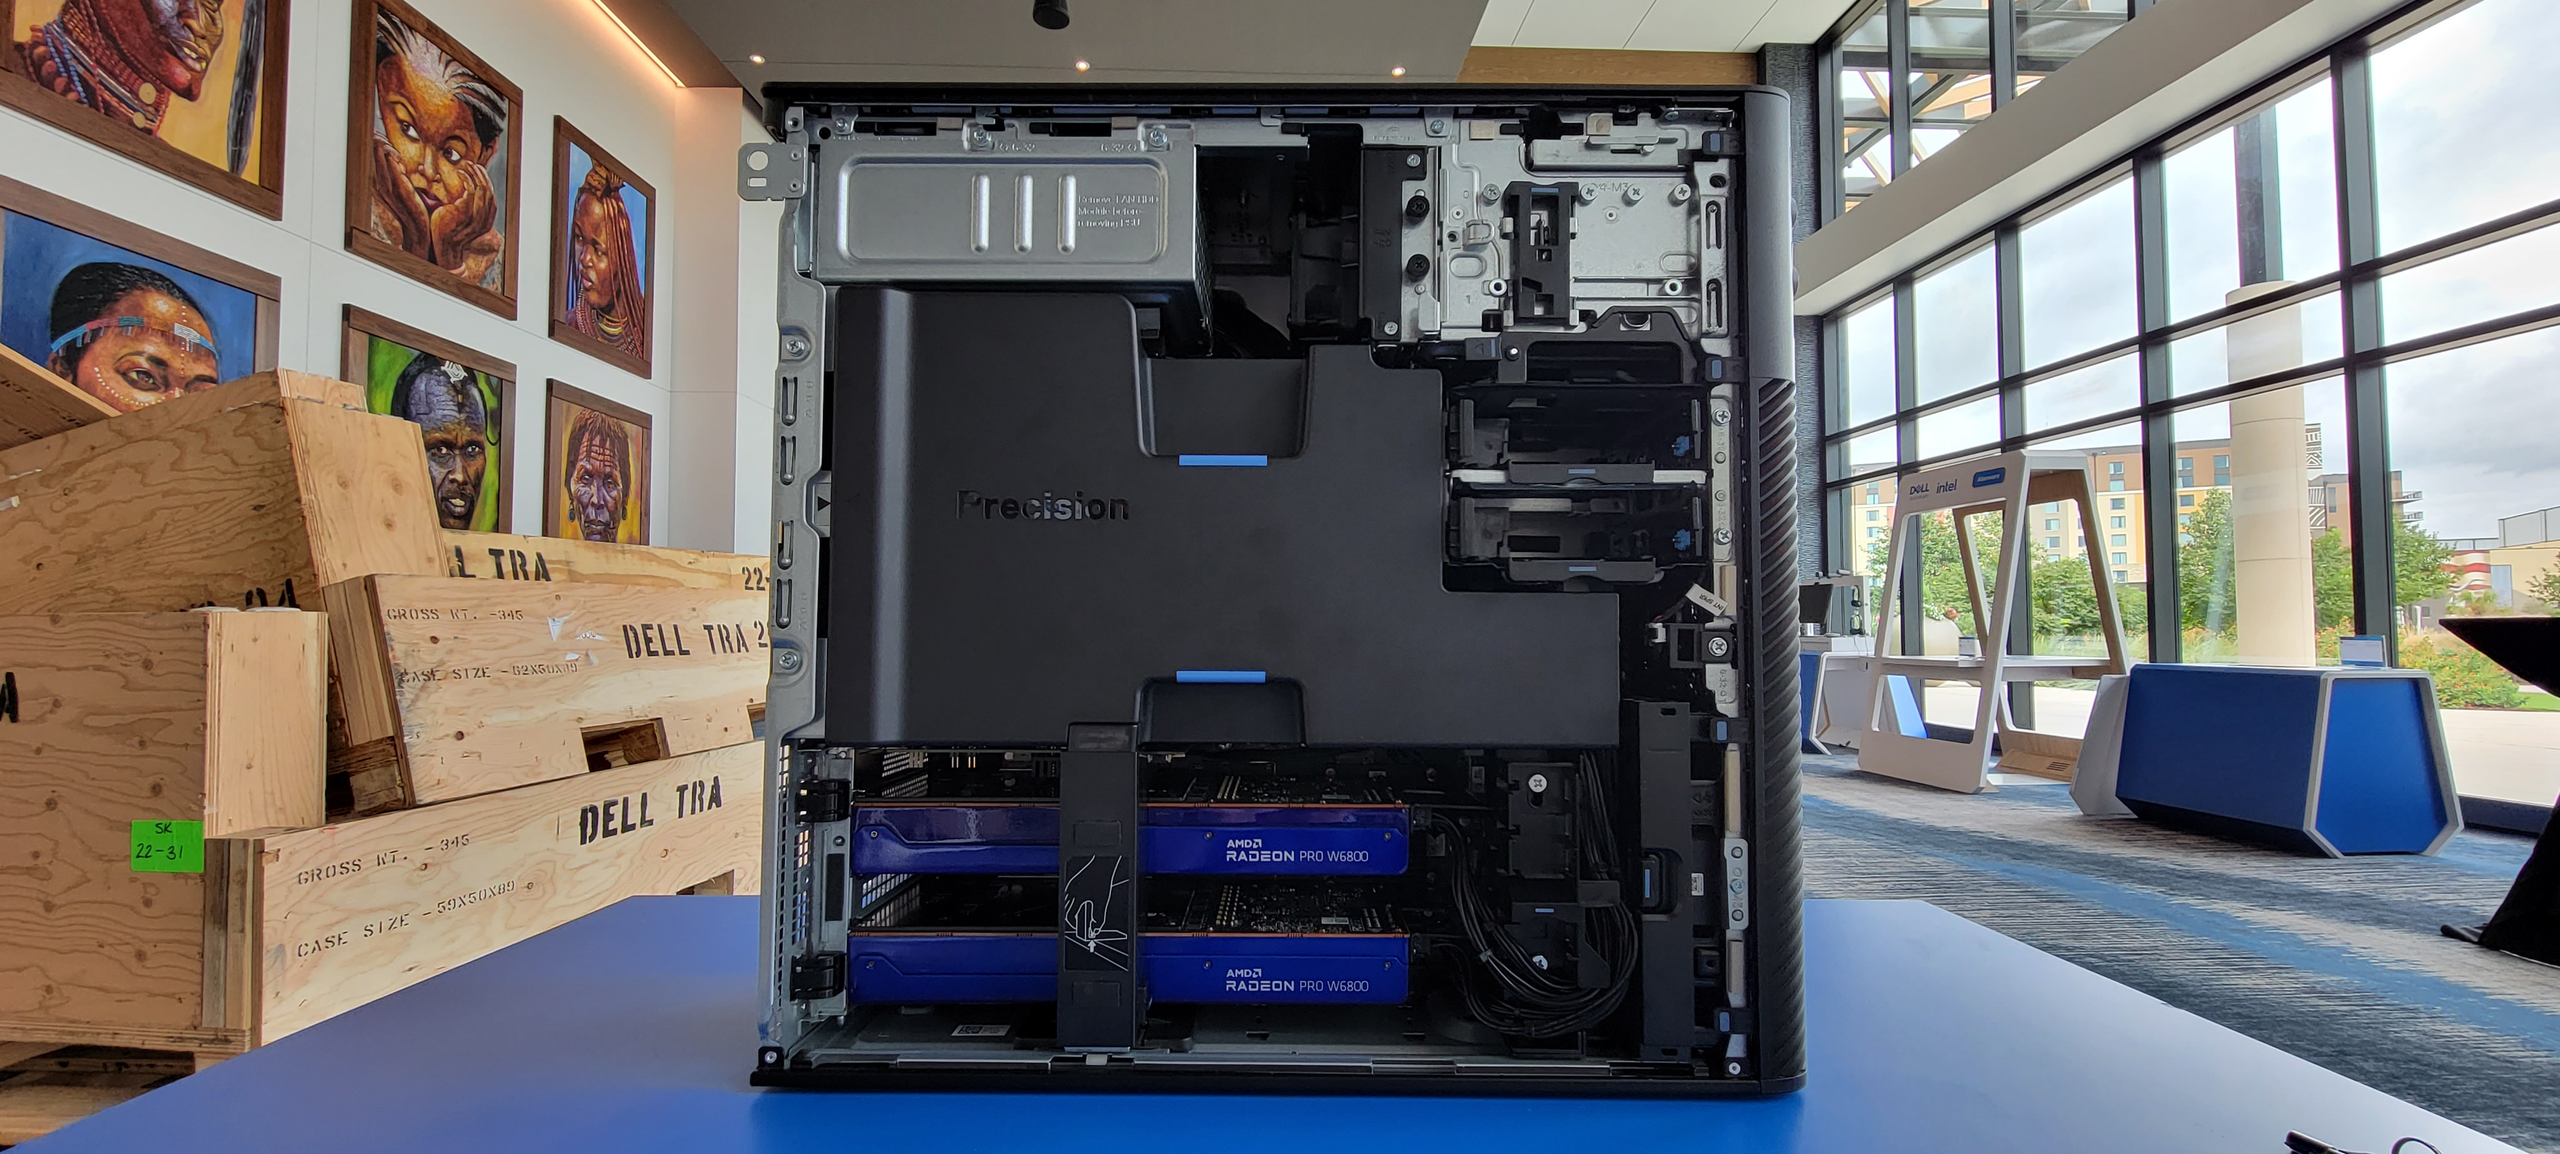
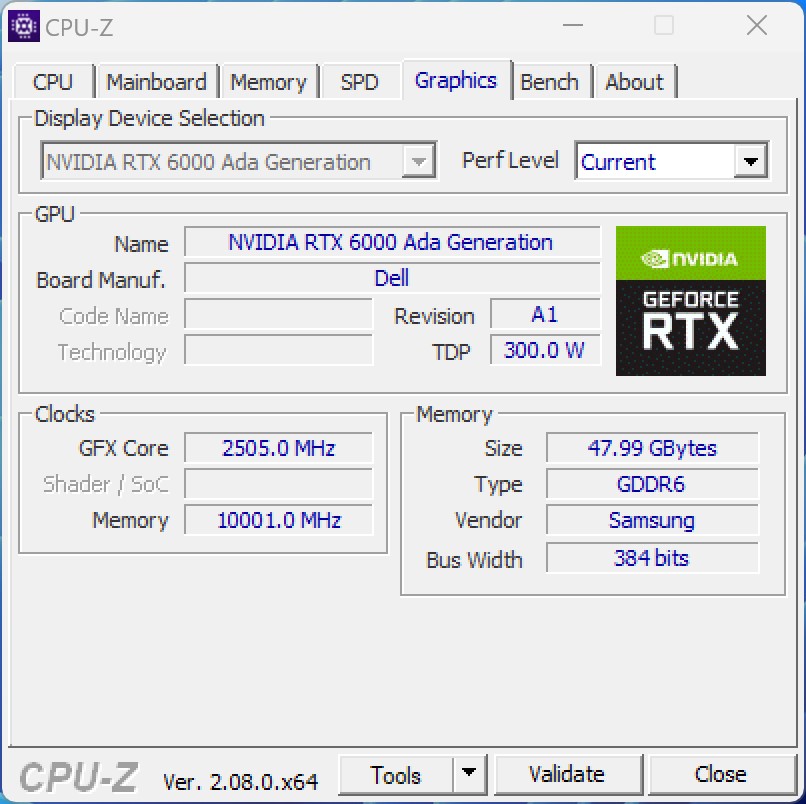
A Dell equipou a Workstation Dell Precision 7875 Tower com duas placas de vídeo Nvidia, especificamente modelos RTX 6000 da atual geração Ada, cada uma com 48 GB de VRAM. Devido a possíveis dificuldades com várias GPUs em alguns testes, realizamos os testes com uma única placa de vídeo. O chip gráfico empregado é o AD102 em configuração completa, com 18.176 shaders. Notavelmente, a Nvidia GeForce RTX 4090 utiliza um modelo um pouco menor, com a Nvidia limitando o consumo de energia a 300 watts. Em contraste com a Nvidia GeForce RTX 4090, a RTX 6000 emprega VRAM GDDR6 padrão com uma largura de banda de memória ligeiramente menor.
Durante nossos testes, os resultados foram um pouco fracos em comparação com nossos outros sistemas de teste. É importante reiterar que o desempenho 3D completo não pôde ser reproduzido devido às limitações do ambiente de teste. No entanto, a Nvidia RTX 6000 Ada Generation se destaca nos testes de renderização, apresentando ganhos significativos de desempenho em alguns casos. Dependendo da análise, observamos um aumento de energia de até 96% em comparação com uma Nvidia GeForce RTX 4090. Isso destaca o impacto substancial das otimizações de driver, infelizmente limitadas a GPUs de estações de trabalho profissionais.
A estação de trabalho Dell Precision 7875 Tower também é compatível com as placas de vídeo Radeon PRO da AMD. O carro-chefe atual, a AMD Radeon Pro W7900, oferece 48 GB de VRAM.
Para comparações e benchmarks adicionais, consulte nossa tabela de comparação de GPUs.
| AMD Ryzen Threadripper PRO 7995WX, NVIDIA RTX 6000 Ada Generation RTX 6000 Ada Generation, TR Pro 7995WX | AMD Ryzen Threadripper PRO 3995WX, AMD Radeon Pro W6800 Radeon Pro W6800, TR Pro 3995WX, WDC PC SN720 SDAPNTW-256G | AMD Ryzen Threadripper PRO 3975WX, NVIDIA RTX A6000 RTX A6000, TR Pro 3975WX | AMD Ryzen 9 7950X, NVIDIA Titan RTX Titan RTX, R9 7950X | Intel Core i9-14900K, NVIDIA GeForce RTX 4090 GeForce RTX 4090, i9-14900K, WDC PC SN720 SDAQNTW-512G | AMD Ryzen 9 7950X, NVIDIA GeForce RTX 4090 GeForce RTX 4090, R9 7950X, Corsair MP600 GS | AMD Ryzen 9 7950X3D, NVIDIA GeForce RTX 4090 GeForce RTX 4090, R9 7950X3D | |
|---|---|---|---|---|---|---|---|
| SPECviewperf 2020 | -49% | -51% | -54% | -39% | -43% | -42% | |
| 3840x2160 Siemens NX (snx-04) (fps) | 974 | 434 -55% | 481 -51% | 375 -61% | 47.2 -95% | 41.3 -96% | 42.5 -96% |
| 3840x2160 Medical (medical-03) (fps) | 79 | 52 -34% | 37.9 -52% | 16.5 -79% | 40.3 -49% | 45.9 -42% | 46.2 -42% |
| 3840x2160 Energy (energy-03) (fps) | 457 | 87.7 -81% | 63 -86% | 93.9 -79% | 230 -50% | 141 -69% | 140 -69% |
| 3840x2160 Creo (creo-03) (fps) | 191 | 87.8 -54% | 111 -42% | 135 -29% | 148 -23% | 133 -30% | 140 -27% |
| 3840x2160 CATIA (catia-06) (fps) | 139 | 76.2 -45% | 82.4 -41% | 90.9 -35% | 97.1 -30% | 95.3 -31% | 95.9 -31% |
| 3840x2160 3ds Max (3dsmax-07) (fps) | 207 | 162 -22% | 137 -34% | 118 -43% | 236 14% | 228 10% | 236 14% |
| SPECviewperf 13 | -46% | -38% | -41% | -12% | -16% | -14% | |
| 3ds Max (3dsmax-06) (fps) | 496.95 | 318 -36% | 338 -32% | 321 -35% | 567 14% | 563 13% | 573 15% |
| Catia (catia-05) (fps) | 578.86 | 389 -33% | 371 -36% | 534 -8% | 428 -26% | 402 -31% | 427 -26% |
| Creo (creo-02) (fps) | 590.13 | 366 -38% | 386 -35% | 618 5% | 552 -6% | 577 -2% | |
| Energy (energy-02) (fps) | 230.06 | 87.8 -62% | 132 -43% | 51.8 -77% | 127 -45% | 126 -45% | 127 -45% |
| Maya (maya-05) (fps) | 637.3 | 395 -38% | 415 -35% | 499 -22% | 881 38% | 715 12% | 748 17% |
| Medical (medical-02) (fps) | 331.9 | 116 -65% | 184 -45% | 92 -72% | 180 -46% | 186 -44% | 189 -43% |
| Showcase (showcase-02) (fps) | 430.2 | 216 -50% | 255 -41% | 198 -54% | 400 -7% | 455 6% | 456 6% |
| Siemens NX (snx-03) (fps) | 437 | 638 | 512 | 56.3 | 49.1 | 49.3 | |
| Solidworks (sw-04) (fps) | 278 | 173 -38% | 192 -31% | 218 -22% | 199 -28% | 186 -33% | 191 -31% |
| SPECviewperf 12 | -44% | -39% | -36% | -14% | -28% | -19% | |
| 1900x1060 3ds Max (3dsmax-05) (fps) | 473 | 311 -34% | 336 -29% | 315 -33% | 565 19% | 571 21% | 560 18% |
| 1900x1060 Catia (catia-04) (fps) | 349 | 248 -29% | 229 -34% | 332 -5% | 291 -17% | 257 -26% | 274 -21% |
| 1900x1060 Creo (creo-01) (fps) | 250 | 101 -60% | 136 -46% | 197 -21% | 127 -49% | 115 -54% | 118 -53% |
| 1900x1060 Energy (energy-01) (fps) | 58.2 | 37.8 -35% | 39.8 -32% | 28.8 -51% | 84.7 46% | 54.7 -6% | 80.1 38% |
| 1900x1060 Maya (maya-04) (fps) | 266 | 157 -41% | 144 -46% | 260 -2% | 340 28% | 317 19% | 329 24% |
| 1900x1060 Medical (medical-01) (fps) | 282 | 165 -41% | 159 -44% | 101 -64% | 303 7% | 119 -58% | 212 -25% |
| 1900x1060 Showcase (showcase-01) (fps) | 429 | 215 -50% | 255 -41% | 197 -54% | 398 -7% | 457 7% | 427 0% |
| 1900x1060 Siemens NX (snx-02) (fps) | 677 | 243 -64% | 351 -48% | 283 -58% | 31.4 -95% | 27.1 -96% | 27.4 -96% |
| 1900x1060 Solidworks (sw-03) (fps) | 319 | 185 -42% | 225 -29% | 207 -35% | 139 -56% | 126 -61% | 130 -59% |
| Média Total (Programa/Configurações) | -46% /
-46% | -43% /
-42% | -44% /
-42% | -22% /
-20% | -29% /
-28% | -25% /
-23% |
Benchmarks de jogos
| Performance rating - Percent | |
| AMD Ryzen 7 7800X3D, NVIDIA GeForce RTX 4090 | |
| AMD Ryzen 9 7950X3D, NVIDIA GeForce RTX 4090 | |
| Intel Core i9-13900K, NVIDIA GeForce RTX 4090 | |
| AMD Ryzen 9 7950X, NVIDIA GeForce RTX 4090 | |
| AMD Ryzen 5 7600X, NVIDIA GeForce RTX 4090 | |
| Intel Core i7-13700K, NVIDIA GeForce RTX 4090 | |
| Intel Core i7-13700, NVIDIA GeForce RTX 4090 | |
| Intel Core i7-12700, NVIDIA GeForce RTX 4090 | |
| AMD Ryzen Threadripper PRO 7995WX, NVIDIA RTX 6000 Ada Generation | |
| Intel Core i5-13400, NVIDIA GeForce RTX 4090 | |
| Intel Core i5-12400F, NVIDIA GeForce RTX 4090 | |
| Far Cry 5 | |
| 1920x1080 Ultra Preset AA:T | |
| AMD Ryzen 7 7800X3D, NVIDIA GeForce RTX 4090 | |
| AMD Ryzen 9 7950X3D, NVIDIA GeForce RTX 4090 | |
| Intel Core i9-13900K, NVIDIA GeForce RTX 4090 | |
| AMD Ryzen 9 7950X, NVIDIA GeForce RTX 4090 | |
| AMD Ryzen 5 7600X, NVIDIA GeForce RTX 4090 | |
| Intel Core i7-13700, NVIDIA GeForce RTX 4090 | |
| Intel Core i7-13700K, NVIDIA GeForce RTX 4090 | |
| Intel Core i7-12700, NVIDIA GeForce RTX 4090 | |
| Intel Core i5-13400, NVIDIA GeForce RTX 4090 | |
| Intel Core i5-12400F, NVIDIA GeForce RTX 4090 | |
| AMD Ryzen Threadripper PRO 7995WX, NVIDIA RTX 6000 Ada Generation | |
| 1280x720 Low Preset AA:T | |
| AMD Ryzen 7 7800X3D, NVIDIA GeForce RTX 4090 | |
| AMD Ryzen 9 7950X3D, NVIDIA GeForce RTX 4090 | |
| Intel Core i9-13900K, NVIDIA GeForce RTX 4090 | |
| Intel Core i7-13700K, NVIDIA GeForce RTX 4090 | |
| AMD Ryzen 5 7600X, NVIDIA GeForce RTX 4090 | |
| AMD Ryzen 9 7950X, NVIDIA GeForce RTX 4090 | |
| Intel Core i7-13700, NVIDIA GeForce RTX 4090 | |
| Intel Core i7-12700, NVIDIA GeForce RTX 4090 | |
| Intel Core i5-13400, NVIDIA GeForce RTX 4090 | |
| Intel Core i5-12400F, NVIDIA GeForce RTX 4090 | |
| AMD Ryzen Threadripper PRO 7995WX, NVIDIA RTX 6000 Ada Generation | |
| X-Plane 11.11 | |
| 1920x1080 high (fps_test=3) | |
| AMD Ryzen 7 7800X3D, NVIDIA GeForce RTX 4090 | |
| AMD Ryzen 9 7950X3D, NVIDIA GeForce RTX 4090 | |
| Intel Core i9-13900K, NVIDIA GeForce RTX 4090 | |
| AMD Ryzen 9 7950X, NVIDIA GeForce RTX 4090 | |
| AMD Ryzen 5 7600X, NVIDIA GeForce RTX 4090 | |
| Intel Core i7-13700K, NVIDIA GeForce RTX 4090 | |
| Intel Core i7-13700, NVIDIA GeForce RTX 4090 | |
| AMD Ryzen Threadripper PRO 7995WX, NVIDIA RTX 6000 Ada Generation | |
| Intel Core i7-12700, NVIDIA GeForce RTX 4090 | |
| Intel Core i5-13400, NVIDIA GeForce RTX 4090 | |
| Intel Core i5-12400F, NVIDIA GeForce RTX 4090 | |
| 1280x720 low (fps_test=1) | |
| Intel Core i9-13900K, NVIDIA GeForce RTX 4090 | |
| AMD Ryzen 9 7950X3D, NVIDIA GeForce RTX 4090 | |
| Intel Core i7-13700K, NVIDIA GeForce RTX 4090 | |
| AMD Ryzen 9 7950X, NVIDIA GeForce RTX 4090 | |
| AMD Ryzen 7 7800X3D, NVIDIA GeForce RTX 4090 | |
| Intel Core i7-13700, NVIDIA GeForce RTX 4090 | |
| AMD Ryzen 5 7600X, NVIDIA GeForce RTX 4090 | |
| Intel Core i7-12700, NVIDIA GeForce RTX 4090 | |
| AMD Ryzen Threadripper PRO 7995WX, NVIDIA RTX 6000 Ada Generation | |
| Intel Core i5-13400, NVIDIA GeForce RTX 4090 | |
| Intel Core i5-12400F, NVIDIA GeForce RTX 4090 | |
| Final Fantasy XV Benchmark | |
| 1920x1080 High Quality | |
| AMD Ryzen 9 7950X, NVIDIA GeForce RTX 4090 | |
| AMD Ryzen 7 7800X3D, NVIDIA GeForce RTX 4090 | |
| Intel Core i9-13900K, NVIDIA GeForce RTX 4090 | |
| AMD Ryzen 9 7950X3D, NVIDIA GeForce RTX 4090 | |
| Intel Core i7-13700K, NVIDIA GeForce RTX 4090 | |
| AMD Ryzen 5 7600X, NVIDIA GeForce RTX 4090 | |
| Intel Core i7-13700, NVIDIA GeForce RTX 4090 | |
| Intel Core i7-12700, NVIDIA GeForce RTX 4090 | |
| AMD Ryzen Threadripper PRO 7995WX, NVIDIA RTX 6000 Ada Generation | |
| Intel Core i5-13400, NVIDIA GeForce RTX 4090 | |
| Intel Core i5-12400F, NVIDIA GeForce RTX 4090 | |
| 1280x720 Lite Quality | |
| Intel Core i9-13900K, NVIDIA GeForce RTX 4090 | |
| AMD Ryzen 9 7950X, NVIDIA GeForce RTX 4090 | |
| AMD Ryzen 5 7600X, NVIDIA GeForce RTX 4090 | |
| Intel Core i7-13700, NVIDIA GeForce RTX 4090 | |
| Intel Core i7-13700K, NVIDIA GeForce RTX 4090 | |
| AMD Ryzen 7 7800X3D, NVIDIA GeForce RTX 4090 | |
| AMD Ryzen 9 7950X3D, NVIDIA GeForce RTX 4090 | |
| Intel Core i7-12700, NVIDIA GeForce RTX 4090 | |
| AMD Ryzen Threadripper PRO 7995WX, NVIDIA RTX 6000 Ada Generation | |
| Intel Core i5-12400F, NVIDIA GeForce RTX 4090 | |
| Intel Core i5-13400, NVIDIA GeForce RTX 4090 | |
| Dota 2 Reborn | |
| 1920x1080 ultra (3/3) best looking | |
| AMD Ryzen 7 7800X3D, NVIDIA GeForce RTX 4090 | |
| AMD Ryzen 9 7950X3D, NVIDIA GeForce RTX 4090 | |
| AMD Ryzen 9 7950X, NVIDIA GeForce RTX 4090 | |
| Intel Core i9-13900K, NVIDIA GeForce RTX 4090 | |
| AMD Ryzen 5 7600X, NVIDIA GeForce RTX 4090 | |
| Intel Core i7-13700K, NVIDIA GeForce RTX 4090 | |
| Intel Core i7-13700, NVIDIA GeForce RTX 4090 | |
| Intel Core i7-12700, NVIDIA GeForce RTX 4090 | |
| Intel Core i5-13400, NVIDIA GeForce RTX 4090 | |
| Intel Core i5-12400F, NVIDIA GeForce RTX 4090 | |
| AMD Ryzen Threadripper PRO 7995WX, NVIDIA RTX 6000 Ada Generation | |
| 1280x720 min (0/3) fastest | |
| AMD Ryzen 7 7800X3D, NVIDIA GeForce RTX 4090 | |
| AMD Ryzen 9 7950X3D, NVIDIA GeForce RTX 4090 | |
| AMD Ryzen 9 7950X, NVIDIA GeForce RTX 4090 | |
| Intel Core i9-13900K, NVIDIA GeForce RTX 4090 | |
| AMD Ryzen 5 7600X, NVIDIA GeForce RTX 4090 | |
| Intel Core i7-13700K, NVIDIA GeForce RTX 4090 | |
| Intel Core i7-13700, NVIDIA GeForce RTX 4090 | |
| Intel Core i7-12700, NVIDIA GeForce RTX 4090 | |
| Intel Core i5-12400F, NVIDIA GeForce RTX 4090 | |
| Intel Core i5-13400, NVIDIA GeForce RTX 4090 | |
| AMD Ryzen Threadripper PRO 7995WX, NVIDIA RTX 6000 Ada Generation | |
| The Witcher 3 | |
| 1920x1080 Ultra Graphics & Postprocessing (HBAO+) | |
| Intel Core i9-13900K, NVIDIA GeForce RTX 4090 | |
| AMD Ryzen 9 7950X, NVIDIA GeForce RTX 4090 | |
| AMD Ryzen 7 7800X3D, NVIDIA GeForce RTX 4090 | |
| AMD Ryzen 5 7600X, NVIDIA GeForce RTX 4090 | |
| Intel Core i7-13700K, NVIDIA GeForce RTX 4090 | |
| Intel Core i7-13700, NVIDIA GeForce RTX 4090 | |
| AMD Ryzen 9 7950X3D, NVIDIA GeForce RTX 4090 | |
| Intel Core i7-12700, NVIDIA GeForce RTX 4090 | |
| Intel Core i5-13400, NVIDIA GeForce RTX 4090 | |
| Intel Core i5-12400F, NVIDIA GeForce RTX 4090 | |
| AMD Ryzen Threadripper PRO 7995WX, NVIDIA RTX 6000 Ada Generation | |
| 1024x768 Low Graphics & Postprocessing | |
| AMD Ryzen 9 7950X3D, NVIDIA GeForce RTX 4090 | |
| AMD Ryzen 7 7800X3D, NVIDIA GeForce RTX 4090 | |
| AMD Ryzen 9 7950X, NVIDIA GeForce RTX 4090 | |
| Intel Core i9-13900K, NVIDIA GeForce RTX 4090 | |
| AMD Ryzen 5 7600X, NVIDIA GeForce RTX 4090 | |
| Intel Core i7-13700K, NVIDIA GeForce RTX 4090 | |
| Intel Core i7-13700, NVIDIA GeForce RTX 4090 | |
| AMD Ryzen Threadripper PRO 7995WX, NVIDIA RTX 6000 Ada Generation | |
| Intel Core i7-12700, NVIDIA GeForce RTX 4090 | |
| Intel Core i5-13400, NVIDIA GeForce RTX 4090 | |
| Intel Core i5-12400F, NVIDIA GeForce RTX 4090 | |
| Borderlands 3 | |
| 1280x720 Very Low Overall Quality (DX11) | |
| AMD Ryzen 7 7800X3D, NVIDIA GeForce RTX 4090 | |
| AMD Ryzen 9 7950X3D, NVIDIA GeForce RTX 4090 | |
| Intel Core i9-13900K, NVIDIA GeForce RTX 4090 | |
| AMD Ryzen 9 7950X, NVIDIA GeForce RTX 4090 | |
| AMD Ryzen 5 7600X, NVIDIA GeForce RTX 4090 | |
| Intel Core i7-13700, NVIDIA GeForce RTX 4090 | |
| Intel Core i7-13700K, NVIDIA GeForce RTX 4090 | |
| Intel Core i7-12700, NVIDIA GeForce RTX 4090 | |
| AMD Ryzen Threadripper PRO 7995WX, NVIDIA RTX 6000 Ada Generation | |
| Intel Core i5-13400, NVIDIA GeForce RTX 4090 | |
| Intel Core i5-12400F, NVIDIA GeForce RTX 4090 | |
| 1920x1080 Badass Overall Quality (DX11) | |
| AMD Ryzen 9 7950X3D, NVIDIA GeForce RTX 4090 | |
| AMD Ryzen 7 7800X3D, NVIDIA GeForce RTX 4090 | |
| AMD Ryzen 9 7950X, NVIDIA GeForce RTX 4090 | |
| Intel Core i9-13900K, NVIDIA GeForce RTX 4090 | |
| AMD Ryzen 5 7600X, NVIDIA GeForce RTX 4090 | |
| Intel Core i7-13700K, NVIDIA GeForce RTX 4090 | |
| Intel Core i7-13700, NVIDIA GeForce RTX 4090 | |
| Intel Core i7-12700, NVIDIA GeForce RTX 4090 | |
| AMD Ryzen Threadripper PRO 7995WX, NVIDIA RTX 6000 Ada Generation | |
| Intel Core i5-13400, NVIDIA GeForce RTX 4090 | |
| Intel Core i5-12400F, NVIDIA GeForce RTX 4090 | |
| Far Cry New Dawn | |
| 1280x720 Low Preset | |
| AMD Ryzen 7 7800X3D, NVIDIA GeForce RTX 4090 | |
| AMD Ryzen 9 7950X3D, NVIDIA GeForce RTX 4090 | |
| Intel Core i9-13900K, NVIDIA GeForce RTX 4090 | |
| Intel Core i7-13700, NVIDIA GeForce RTX 4090 | |
| Intel Core i7-13700K, NVIDIA GeForce RTX 4090 | |
| AMD Ryzen 9 7950X, NVIDIA GeForce RTX 4090 | |
| AMD Ryzen 5 7600X, NVIDIA GeForce RTX 4090 | |
| Intel Core i7-12700, NVIDIA GeForce RTX 4090 | |
| Intel Core i5-13400, NVIDIA GeForce RTX 4090 | |
| Intel Core i5-12400F, NVIDIA GeForce RTX 4090 | |
| AMD Ryzen Threadripper PRO 7995WX, NVIDIA RTX 6000 Ada Generation | |
| 1920x1080 Ultra Preset | |
| AMD Ryzen 7 7800X3D, NVIDIA GeForce RTX 4090 | |
| AMD Ryzen 9 7950X3D, NVIDIA GeForce RTX 4090 | |
| Intel Core i9-13900K, NVIDIA GeForce RTX 4090 | |
| AMD Ryzen 9 7950X, NVIDIA GeForce RTX 4090 | |
| Intel Core i7-13700K, NVIDIA GeForce RTX 4090 | |
| AMD Ryzen 5 7600X, NVIDIA GeForce RTX 4090 | |
| Intel Core i7-13700, NVIDIA GeForce RTX 4090 | |
| Intel Core i7-12700, NVIDIA GeForce RTX 4090 | |
| Intel Core i5-13400, NVIDIA GeForce RTX 4090 | |
| Intel Core i5-12400F, NVIDIA GeForce RTX 4090 | |
| AMD Ryzen Threadripper PRO 7995WX, NVIDIA RTX 6000 Ada Generation | |
| Shadow of the Tomb Raider | |
| 1280x720 Lowest Preset | |
| AMD Ryzen 7 7800X3D, NVIDIA GeForce RTX 4090 | |
| AMD Ryzen 9 7950X3D, NVIDIA GeForce RTX 4090 | |
| AMD Ryzen 9 7950X, NVIDIA GeForce RTX 4090 | |
| AMD Ryzen 5 7600X, NVIDIA GeForce RTX 4090 | |
| Intel Core i9-13900K, NVIDIA GeForce RTX 4090 | |
| Intel Core i7-13700, NVIDIA GeForce RTX 4090 | |
| Intel Core i7-13700K, NVIDIA GeForce RTX 4090 | |
| AMD Ryzen Threadripper PRO 7995WX, NVIDIA RTX 6000 Ada Generation | |
| Intel Core i7-12700, NVIDIA GeForce RTX 4090 | |
| Intel Core i5-13400, NVIDIA GeForce RTX 4090 | |
| Intel Core i5-12400F, NVIDIA GeForce RTX 4090 | |
| 1920x1080 Highest Preset AA:T | |
| AMD Ryzen 7 7800X3D, NVIDIA GeForce RTX 4090 | |
| AMD Ryzen 9 7950X3D, NVIDIA GeForce RTX 4090 | |
| AMD Ryzen 9 7950X, NVIDIA GeForce RTX 4090 | |
| Intel Core i9-13900K, NVIDIA GeForce RTX 4090 | |
| AMD Ryzen 5 7600X, NVIDIA GeForce RTX 4090 | |
| Intel Core i7-13700K, NVIDIA GeForce RTX 4090 | |
| Intel Core i7-13700, NVIDIA GeForce RTX 4090 | |
| AMD Ryzen Threadripper PRO 7995WX, NVIDIA RTX 6000 Ada Generation | |
| Intel Core i7-12700, NVIDIA GeForce RTX 4090 | |
| Intel Core i5-13400, NVIDIA GeForce RTX 4090 | |
| Intel Core i5-12400F, NVIDIA GeForce RTX 4090 | |
| Tiny Tina's Wonderlands | |
| 1920x1080 Low Preset (DX12) | |
| AMD Ryzen 7 7800X3D, NVIDIA GeForce RTX 4090 | |
| AMD Ryzen 9 7950X3D, NVIDIA GeForce RTX 4090 | |
| AMD Ryzen 9 7950X, NVIDIA GeForce RTX 4090 | |
| AMD Ryzen 5 7600X, NVIDIA GeForce RTX 4090 | |
| Intel Core i9-13900K, NVIDIA GeForce RTX 4090 | |
| Intel Core i7-13700, NVIDIA GeForce RTX 4090 | |
| Intel Core i7-13700K, NVIDIA GeForce RTX 4090 | |
| AMD Ryzen Threadripper PRO 7995WX, NVIDIA RTX 6000 Ada Generation | |
| Intel Core i7-12700, NVIDIA GeForce RTX 4090 | |
| Intel Core i5-13400, NVIDIA GeForce RTX 4090 | |
| Intel Core i5-12400F, NVIDIA GeForce RTX 4090 | |
| 1920x1080 Badass Preset (DX12) | |
| AMD Ryzen 7 7800X3D, NVIDIA GeForce RTX 4090 | |
| AMD Ryzen 9 7950X3D, NVIDIA GeForce RTX 4090 | |
| AMD Ryzen 9 7950X, NVIDIA GeForce RTX 4090 | |
| AMD Ryzen 5 7600X, NVIDIA GeForce RTX 4090 | |
| Intel Core i9-13900K, NVIDIA GeForce RTX 4090 | |
| Intel Core i7-13700, NVIDIA GeForce RTX 4090 | |
| Intel Core i7-13700K, NVIDIA GeForce RTX 4090 | |
| Intel Core i7-12700, NVIDIA GeForce RTX 4090 | |
| AMD Ryzen Threadripper PRO 7995WX, NVIDIA RTX 6000 Ada Generation | |
| Intel Core i5-13400, NVIDIA GeForce RTX 4090 | |
| Intel Core i5-12400F, NVIDIA GeForce RTX 4090 | |
| Metro Exodus | |
| 1280x720 Low Quality AF:4x | |
| AMD Ryzen 7 7800X3D, NVIDIA GeForce RTX 4090 | |
| AMD Ryzen 5 7600X, NVIDIA GeForce RTX 4090 | |
| AMD Ryzen 9 7950X, NVIDIA GeForce RTX 4090 | |
| AMD Ryzen 9 7950X3D, NVIDIA GeForce RTX 4090 | |
| Intel Core i7-13700, NVIDIA GeForce RTX 4090 | |
| Intel Core i9-13900K, NVIDIA GeForce RTX 4090 | |
| Intel Core i7-13700K, NVIDIA GeForce RTX 4090 | |
| Intel Core i7-12700, NVIDIA GeForce RTX 4090 | |
| Intel Core i5-12400F, NVIDIA GeForce RTX 4090 | |
| Intel Core i5-13400, NVIDIA GeForce RTX 4090 | |
| AMD Ryzen Threadripper PRO 7995WX, NVIDIA RTX 6000 Ada Generation | |
| 1920x1080 Ultra Quality AF:16x | |
| AMD Ryzen 7 7800X3D, NVIDIA GeForce RTX 4090 | |
| AMD Ryzen 9 7950X, NVIDIA GeForce RTX 4090 | |
| AMD Ryzen 5 7600X, NVIDIA GeForce RTX 4090 | |
| AMD Ryzen 9 7950X3D, NVIDIA GeForce RTX 4090 | |
| Intel Core i9-13900K, NVIDIA GeForce RTX 4090 | |
| Intel Core i7-13700, NVIDIA GeForce RTX 4090 | |
| Intel Core i7-13700K, NVIDIA GeForce RTX 4090 | |
| Intel Core i7-12700, NVIDIA GeForce RTX 4090 | |
| Intel Core i5-13400, NVIDIA GeForce RTX 4090 | |
| Intel Core i5-12400F, NVIDIA GeForce RTX 4090 | |
| AMD Ryzen Threadripper PRO 7995WX, NVIDIA RTX 6000 Ada Generation | |
| baixo | média | alto | ultra | QHD | 4K DLSS | 4K | |
|---|---|---|---|---|---|---|---|
| The Witcher 3 (2015) | 661 | 579 | 489 | 260 | 219 | 183.5 | |
| Dota 2 Reborn (2015) | 168.7 | 159 | 164.8 | 153.6 | 153.1 | ||
| Final Fantasy XV Benchmark (2018) | 228 | 228 | 201 | 194.7 | 124.2 | ||
| X-Plane 11.11 (2018) | 163.5 | 155.6 | 123.3 | 100.7 | |||
| Far Cry 5 (2018) | 144 | 130 | 126 | 118 | 118 | 115 | |
| Shadow of the Tomb Raider (2018) | 265 | 250 | 240 | 233 | 219 | 127.9 | |
| Far Cry New Dawn (2019) | 127 | 113 | 109 | 100 | 99 | 98 | |
| Metro Exodus (2019) | 167.6 | 125 | 114.4 | 103.6 | 94.5 | 89.8 | |
| Borderlands 3 (2019) | 181.9 | 156.5 | 153.2 | 141 | 138.1 | 87.7 | |
| Horizon Zero Dawn (2020) | 238 | 220 | 208 | 199 | 192 | 173 | 125 |
| Far Cry 6 (2021) | 177.8 | 159.2 | 143.5 | 142.9 | 138.9 | 109.9 | |
| Tiny Tina's Wonderlands (2022) | 334 | 265 | 232 | 219 | 175.3 | 87.3 | |
| A Plague Tale Requiem (2022) | 183.6 | 169.3 | 160.6 | 131 | 94.2 | 108.4 | 54 |
| The Witcher 3 v4 (2023) | 287 | 248 | 219 | 210 | 208 | 128.1 | |
| Starfield (2023) | 140.5 | 129 | 112.6 | 103.9 | 89.1 | 62.9 | |
| Cyberpunk 2077 (2023) | 164.2 | 162.5 | 155.3 | 147.2 | 131 | 60.3 | |
| Total War Pharaoh (2023) | 330.6 | 215.3 | 157.5 | 140.9 | 140.7 | 112.7 |
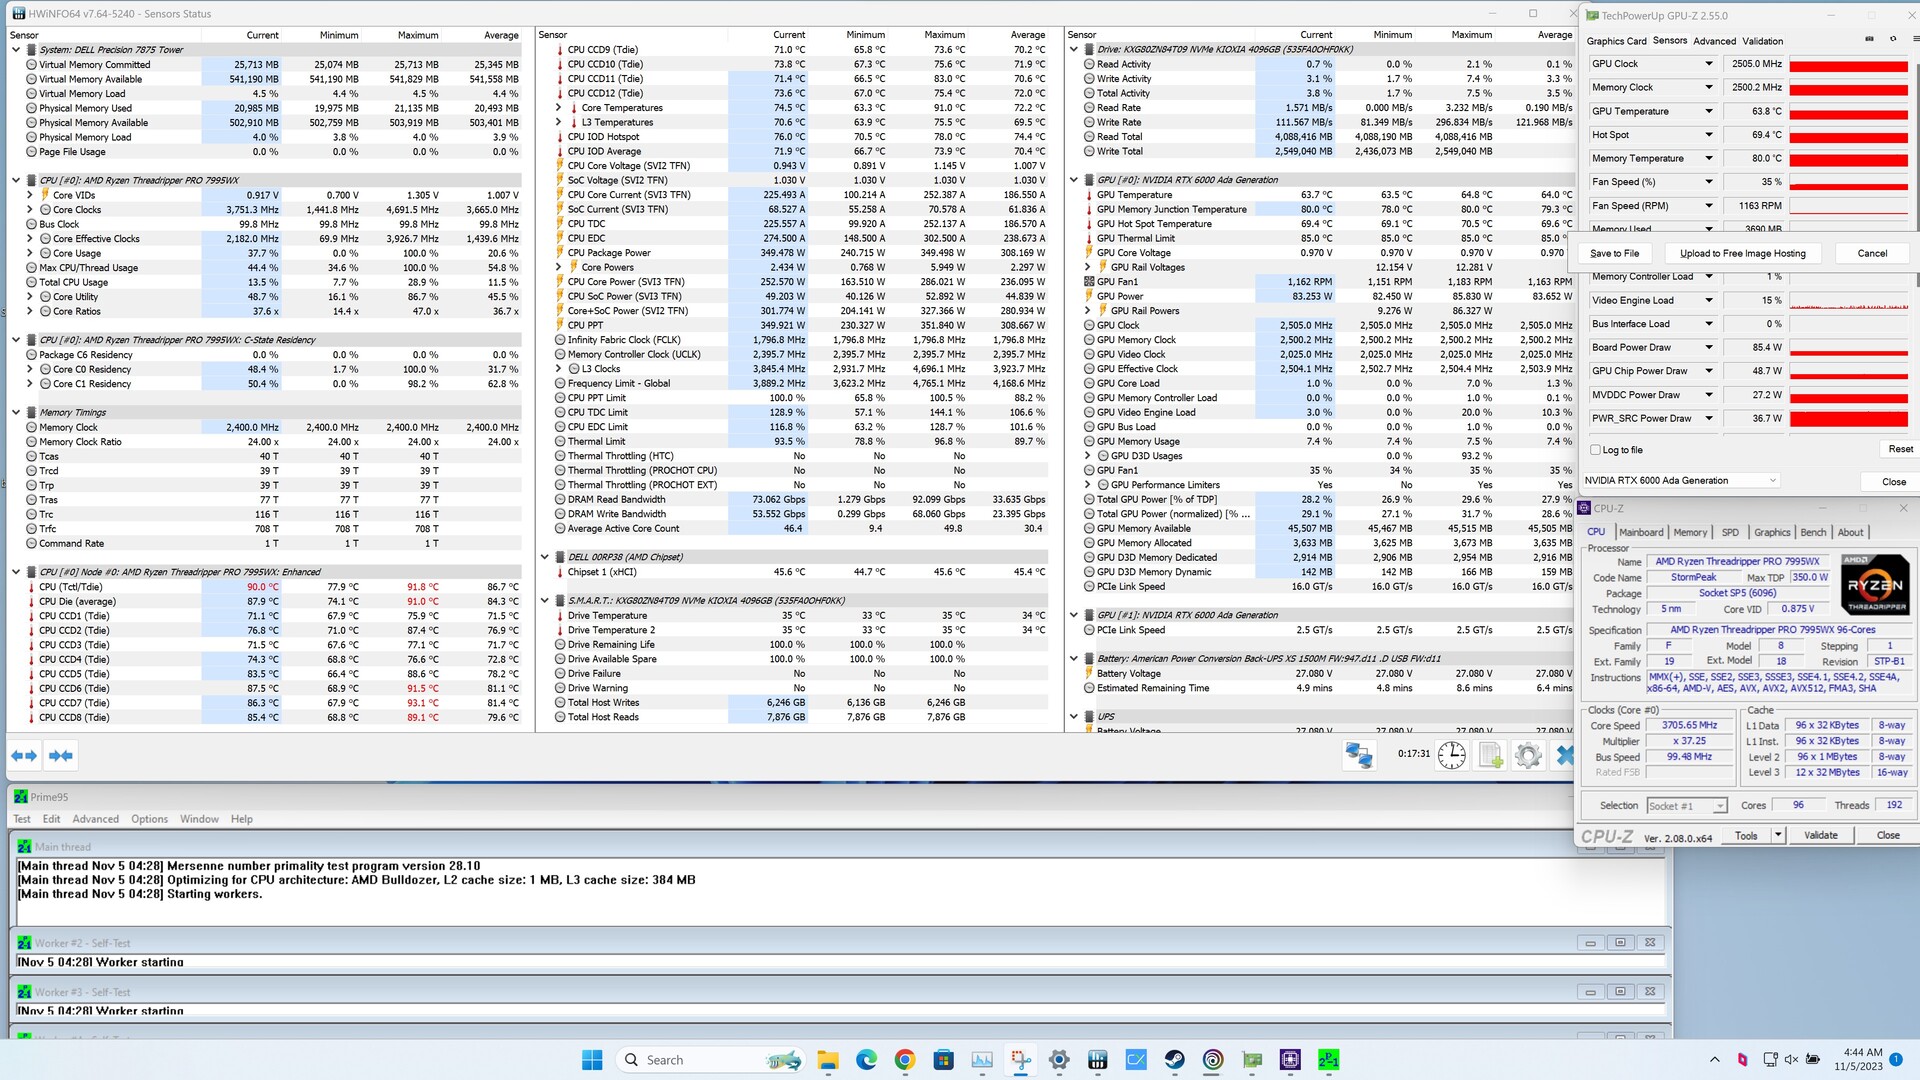
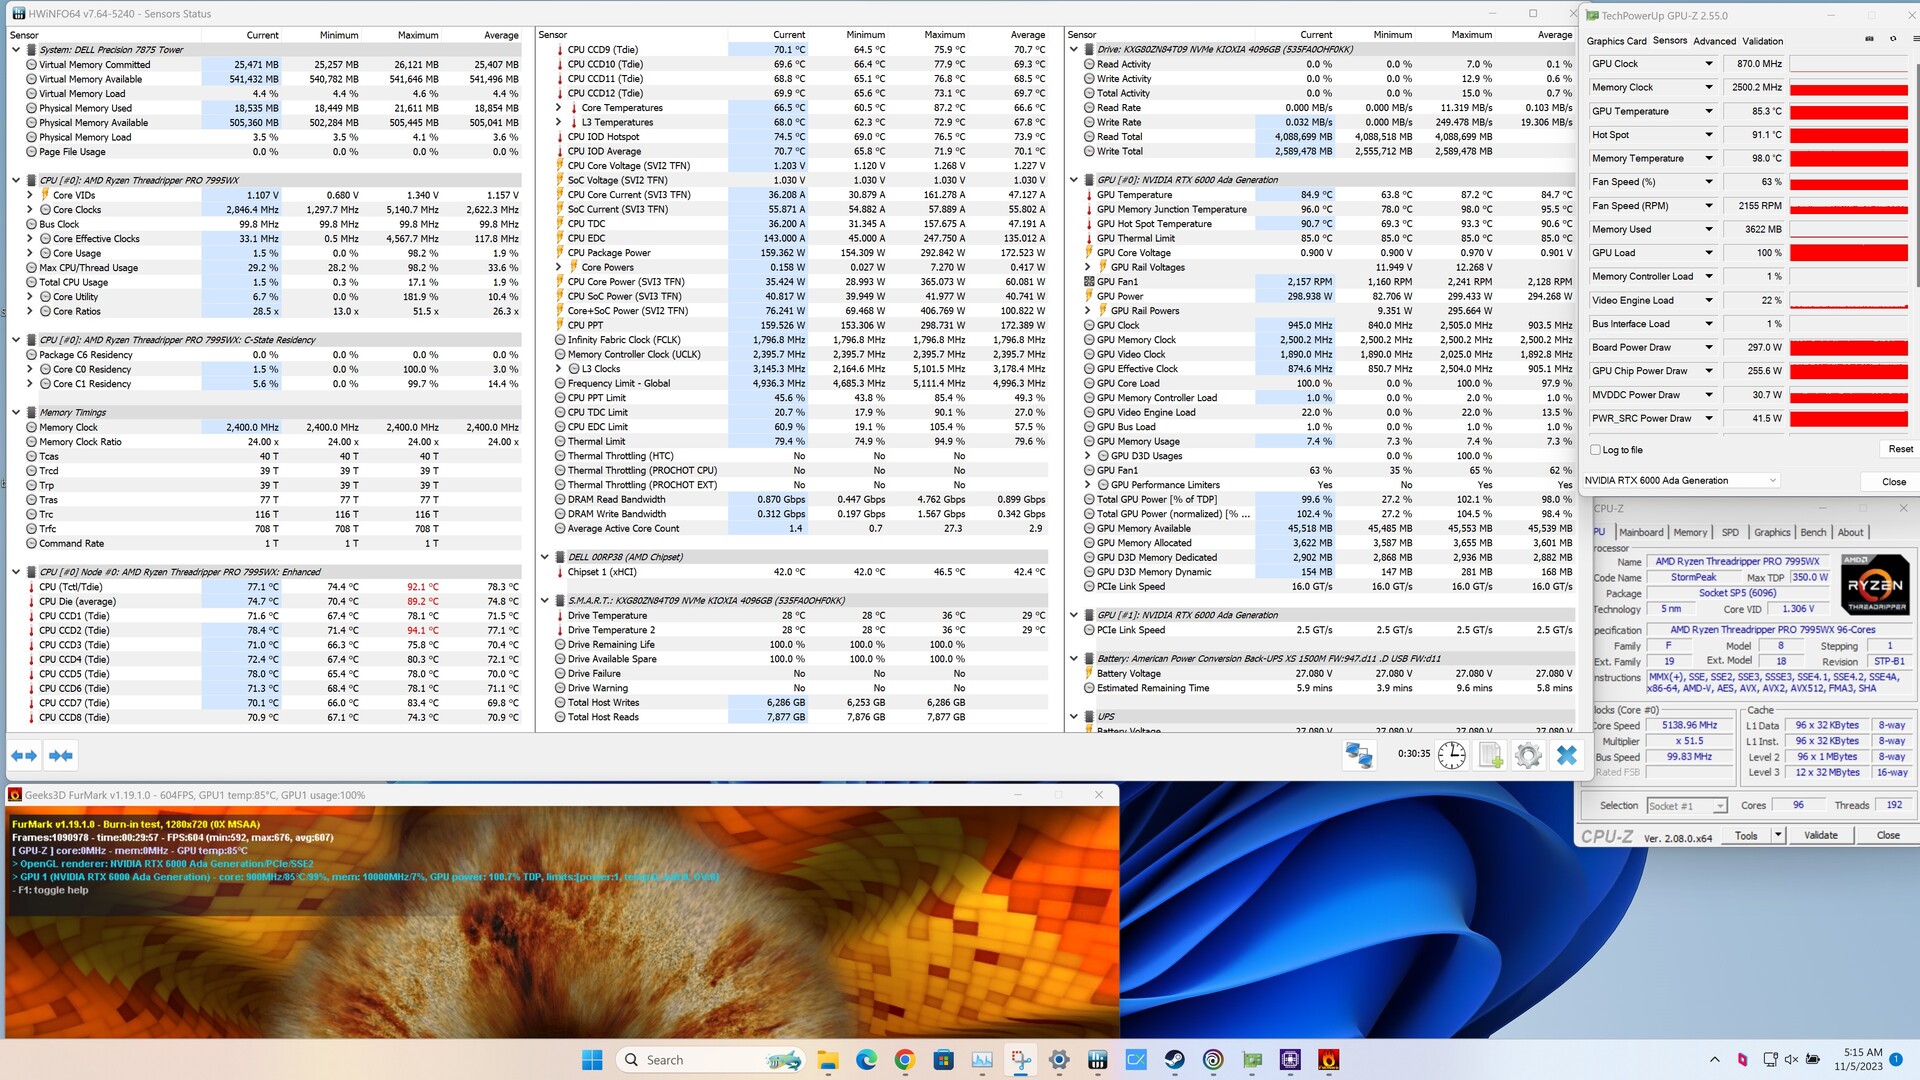
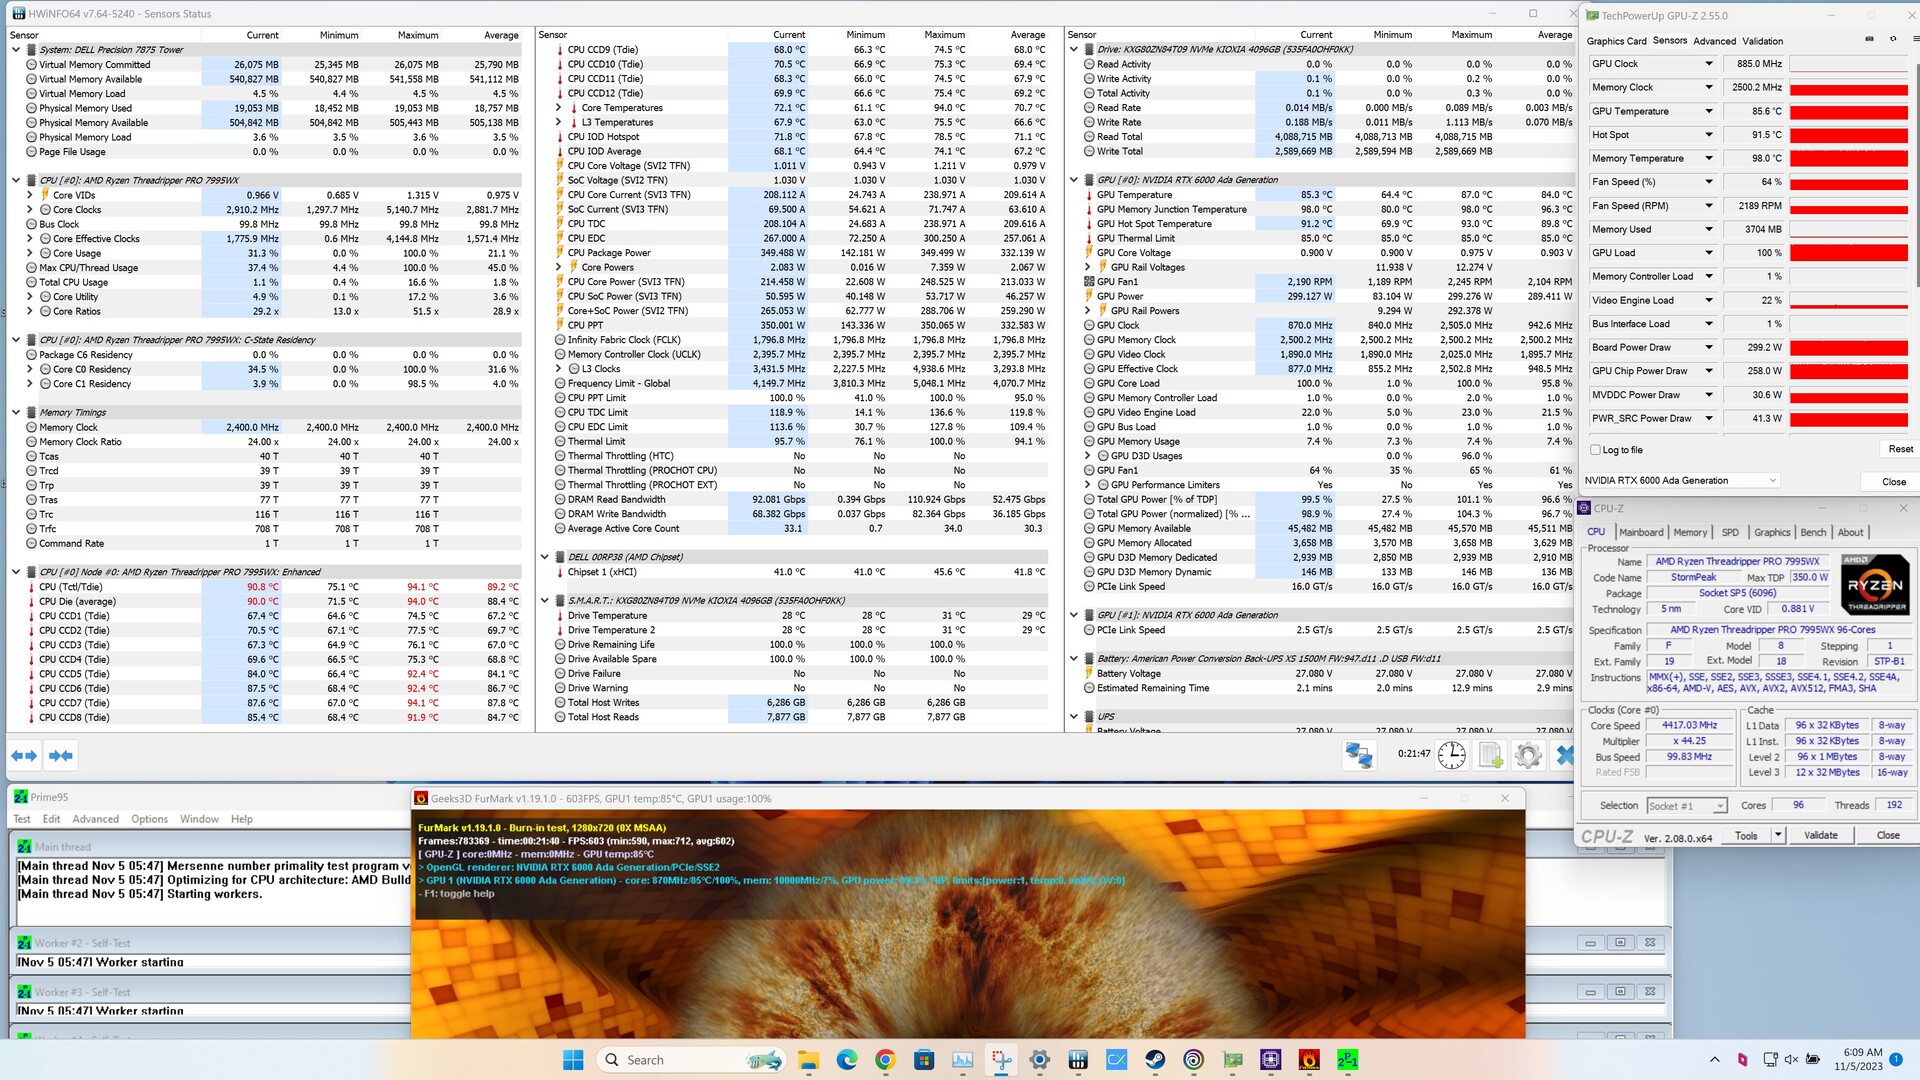
Emissões
Devido às condições de teste, os valores de emissão são derivados exclusivamente dos resultados do HWiNFO. O sistema foi submetido a um teste de estresse em três cenários diferentes. No teste de estresse Prime95, o AMD Ryzen Threadripper Pro 7995WX demonstrou uma operação estável. Operando a 3,6 GHz, o processador excedeu consistentemente o clock base de 2,5 GHz. A temperatura se estabilizou em torno de 87 °C, atingindo pouco menos de 92 °C em seu pico. A geração Nvidia RTX 6000 Ada manteve o desempenho máximo durante todo o teste de estresse, sem perda de desempenho observada a 300 watts. No entanto, registramos um valor de ponto quente de 91 °C para a GPU, enquanto a VRAM atingiu até 98 °C. Quando a CPU e a GPU foram carregadas simultaneamente, não houve diferenças significativas. A temperatura média do AMD Ryzen Threadripper Pro 7995WX subiu ligeiramente para 89 °C.
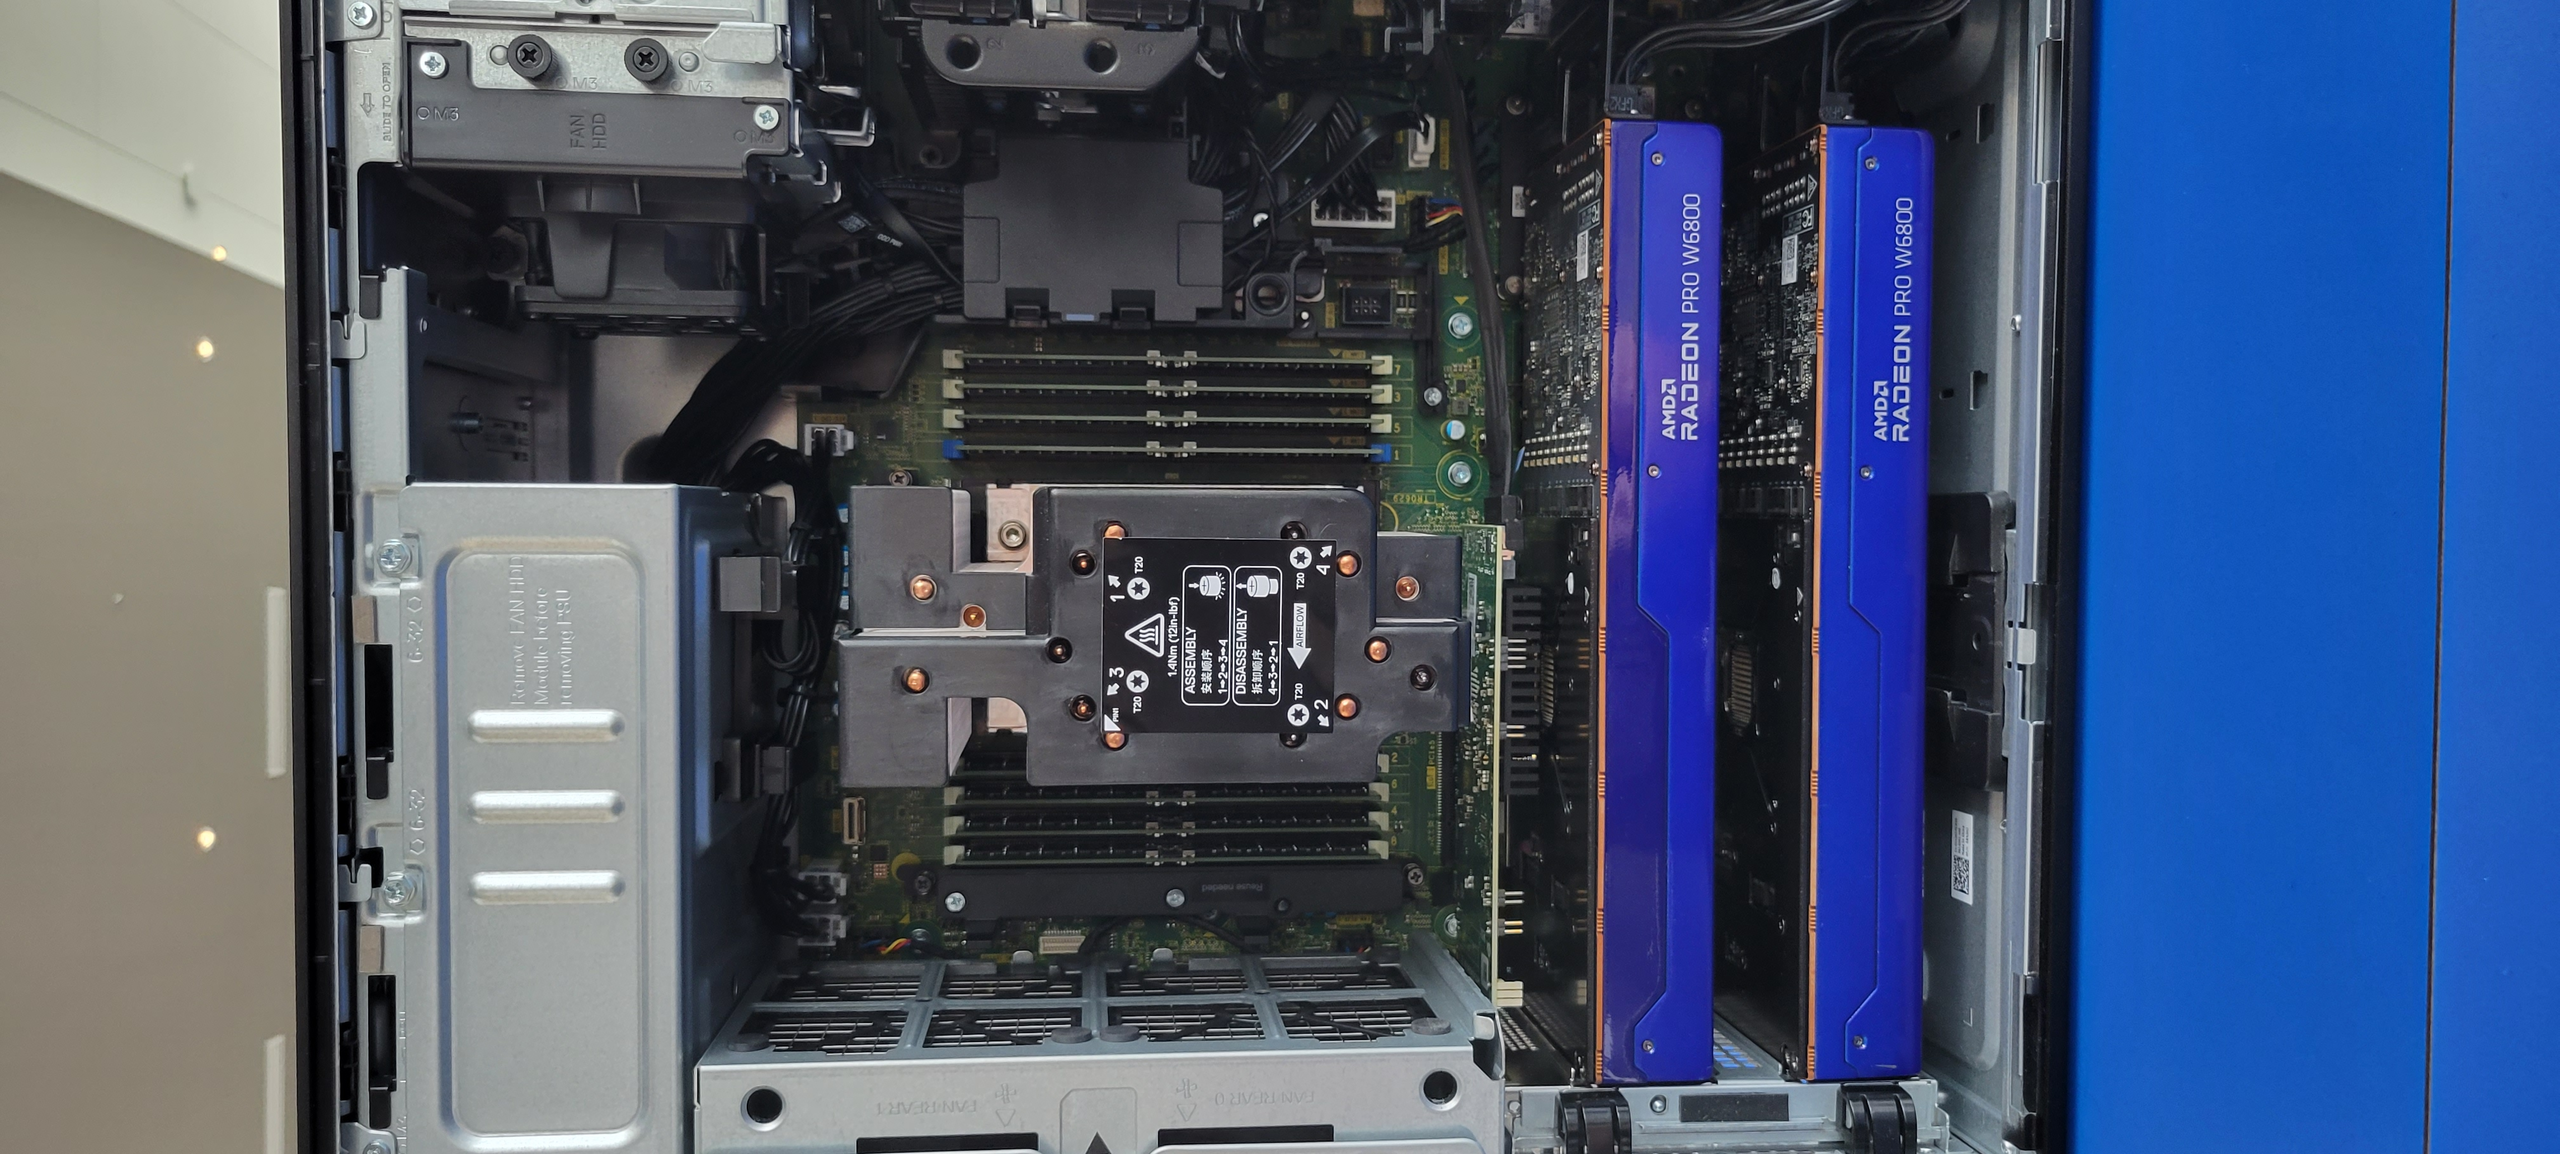
O conceito de resfriamento para a estação de trabalho em torre Dell Precision 7875 adota um design de câmara. A área superior cobre o processador e a RAM, direcionando o fluxo de ar diretamente sobre os componentes para resfriamento. As duas placas de vídeo estão situadas na área inferior e recebem ar fresco de um ventilador montado na frente. Vale a pena observar que a Nvidia equipou a geração RTX 6000 Ada com um design de soprador, expelindo o calor residual diretamente do gabinete. Esse conceito também foi utilizado algumas vezes em placas de vídeo para consumidores.
Pro
Contra
Veredicto - Estação de trabalho de alto nível pelo preço de um carro de médio porte
A Workstation Dell Precision 7875 Tower integra os processadores de workstation mais rápidos da AMD, estabelecendo novos padrões de referência em desempenho puro. Alimentado pela arquitetura Zen4, o AMD Ryzen Threadripper Pro 7995WX oferece uma capacidade de computação substancial e combina até 96 núcleos sob o dissipador de calor, uma conquista inovadora. Consequentemente, o processador pode lidar simultaneamente com até 192 threads. Juntamente com 512 GB de RAM e duas placas de vídeo Nvidia RTX 6000 da geração Ada, essa estação de trabalho pode lidar com eficiência com projetos que exigem muitos recursos.
Todos esses componentes estão alojados em um gabinete em torre relativamente compacto, equipado com um sofisticado sistema de resfriamento. Durante os testes, não foram atingidas temperaturas críticas superiores a 100°C, o que confirma a eficácia do conceito de resfriamento e garante uma operação tranquila, mesmo sob carga total.
Equipada com o AMD Ryzen Threadripper Pro 7995WX, a estação de trabalho em torre Dell Precision 7875 possui o processador mais rápido disponível atualmente para aplicativos com vários núcleos.
Em conjunto com o processador, a placa de vídeo integrada é um elemento crucial de um PC de estação de trabalho. O modelo superior da Nvidia, a geração RTX 6000 Ada, oferece ampla potência. Em comparação com a GeForce RTX 4090 da Nvidia, o modelo profissional, que apresenta a versão completa do AD102, pode oferecer um desempenho significativamente maior, desde que haja suporte eficaz do driver durante vários testes de renderização.
Embora a empresa ainda não tenha finalizado os detalhes de preços, a loja interna da Dell permite que os usuários configurem a Dell Precision 7875 Tower Workstation de acordo com suas preferências. Os modelos de nível básico começam em apenas ~ $3.000 USD. Para aqueles que querem ir além dos limites, é possível montar um sistema que custa mais de US$ 50.000.
Preço e disponibilidade
A estação de trabalho em torre Dell Precision 7875, na configuração testada aqui, não está disponível no momento. No entanto, a Workstation Dell Precision 7875 Tower com modelos Threadripper da geração 5000 está disponível na página da loja do fabricante. Os preços para o modelo básico começam em apenas ~ $3.000 USD.
Transparência
A seleção dos dispositivos a serem analisados é feita pela nossa equipe editorial. A amostra de teste foi fornecida ao autor como empréstimo pelo fabricante ou varejista para fins desta revisão. O credor não teve influência nesta revisão, nem o fabricante recebeu uma cópia desta revisão antes da publicação. Não houve obrigação de publicar esta revisão. Como empresa de mídia independente, a Notebookcheck não está sujeita à autoridade de fabricantes, varejistas ou editores.
É assim que o Notebookcheck está testando
Todos os anos, o Notebookcheck analisa de forma independente centenas de laptops e smartphones usando procedimentos padronizados para garantir que todos os resultados sejam comparáveis. Desenvolvemos continuamente nossos métodos de teste há cerca de 20 anos e definimos padrões da indústria no processo. Em nossos laboratórios de teste, equipamentos de medição de alta qualidade são utilizados por técnicos e editores experientes. Esses testes envolvem um processo de validação em vários estágios. Nosso complexo sistema de classificação é baseado em centenas de medições e benchmarks bem fundamentados, o que mantém a objetividade.
