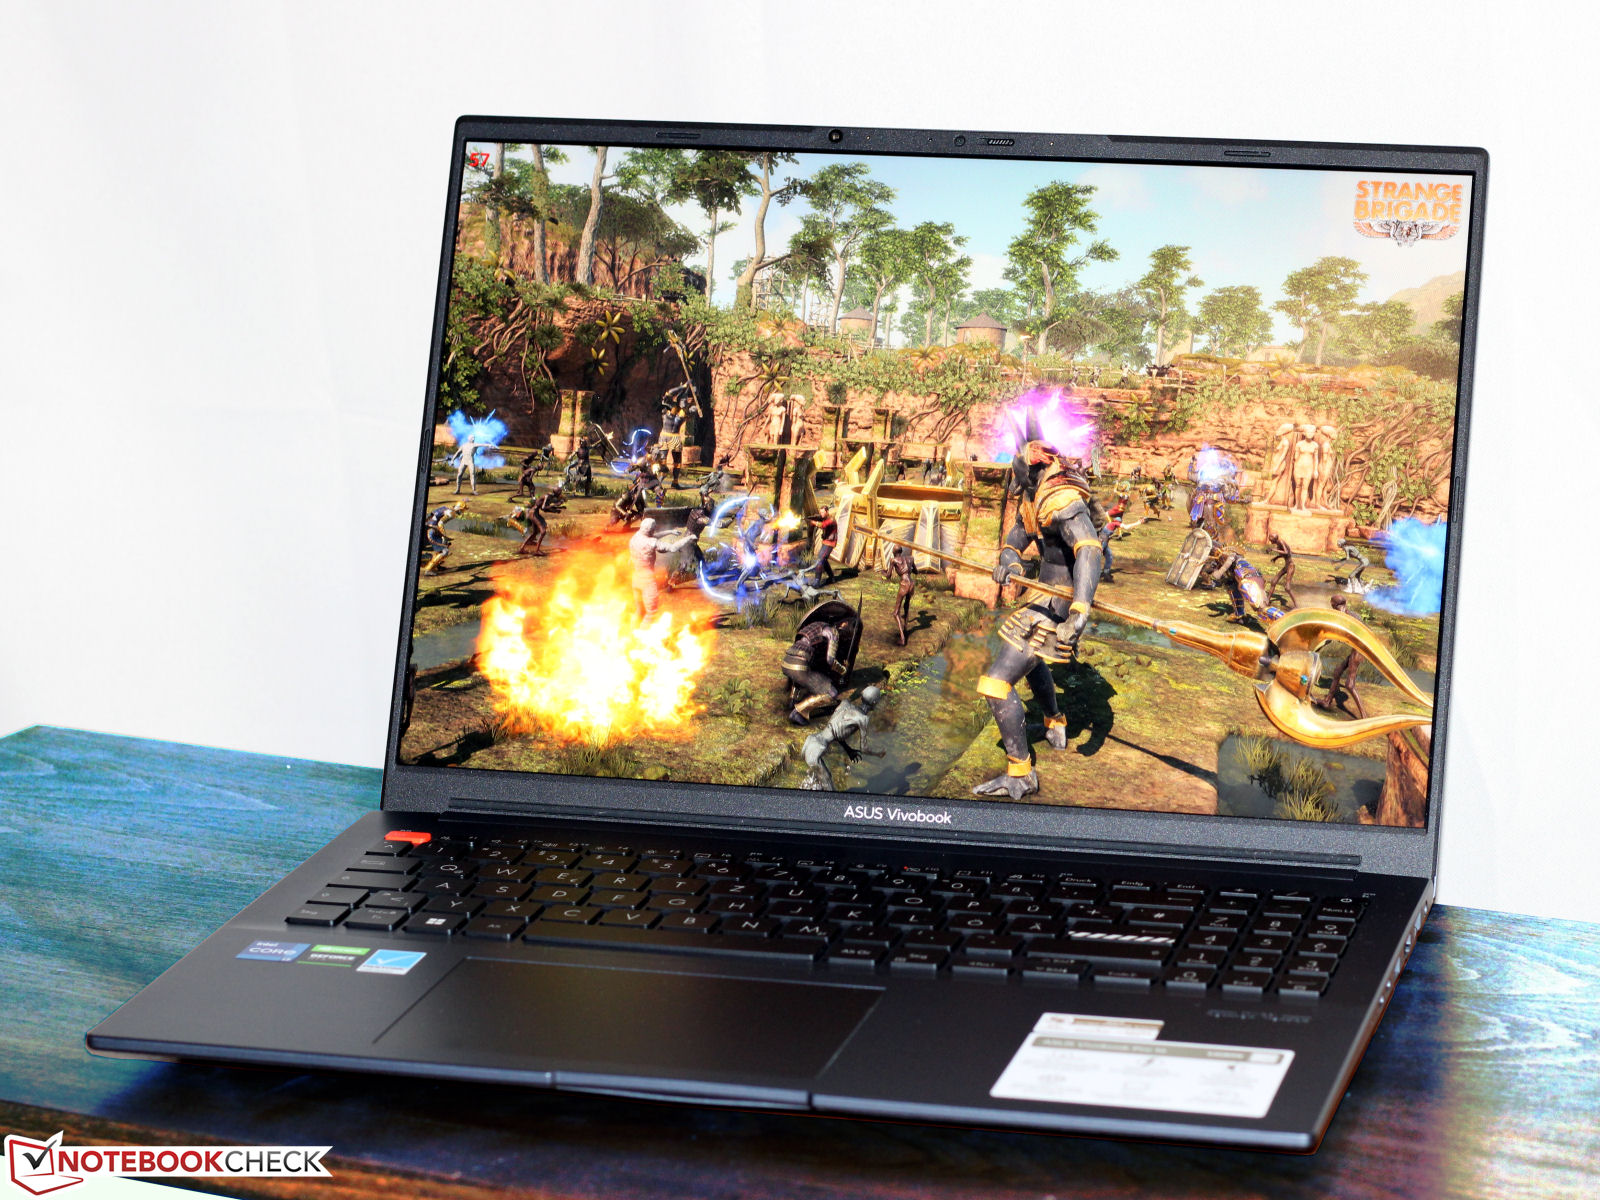
Análise do Asus VivoBook Pro 16: Um laptop multimídia com Core i7, RTX 3050 Ti e DCI-P3
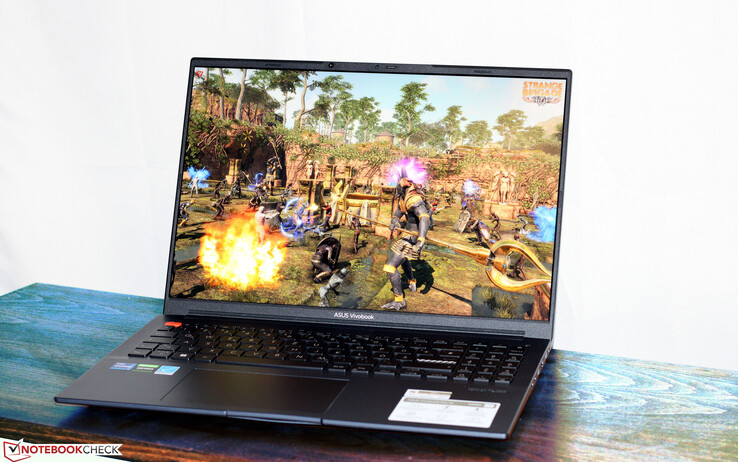
O Asus VivoBook é um laptop portátil de 16 polegadas para gamers e profissionais criativos. O laptop vem com hardware adequado: ACore i7-12700H,GeForce RTX 3050 Tie uma tela IPS brilhante no formato 16:10, com excelente precisão de cores. Esse laptop é semelhante aoVivoBook Pro 16X que testamos anteriormente, mas eles não têm a mesma estrutura. Os concorrentes desse laptop incluem o Dell Inspiron 16 Plus 7620e oXMG Fusion 15 (Mid 22)e oAcer Swift X 16.
Possíveis concorrentes em comparação
Avaliação | Data | Modelo | Peso | Altura | Size | Resolução | Preço |
|---|---|---|---|---|---|---|---|
| 86.3 % v7 (old) | 05/2023 | Asus VivoBook Pro 16 i7-12700H, GeForce RTX 3050 Ti Laptop GPU | 1.9 kg | 20 mm | 16.00" | 2560x1600 | |
| 86.4 % v7 (old) | 11/2022 | Acer Swift X SFX16-52G-77RX i7-1260P, A370M | 1.8 kg | 21.2 mm | 16.00" | 2560x1600 | |
| 87.4 % v7 (old) | 08/2022 | Dell Inspiron 16 Plus 7620 i7-12700H, GeForce RTX 3050 Ti Laptop GPU | 2.1 kg | 18.99 mm | 16.00" | 3072x1920 | |
| 87.4 % v7 (old) | 08/2022 | Schenker XMG Fusion 15 (Mid 22) i7-11800H, GeForce RTX 3070 Laptop GPU | 1.9 kg | 21.65 mm | 15.60" | 2560x1440 |
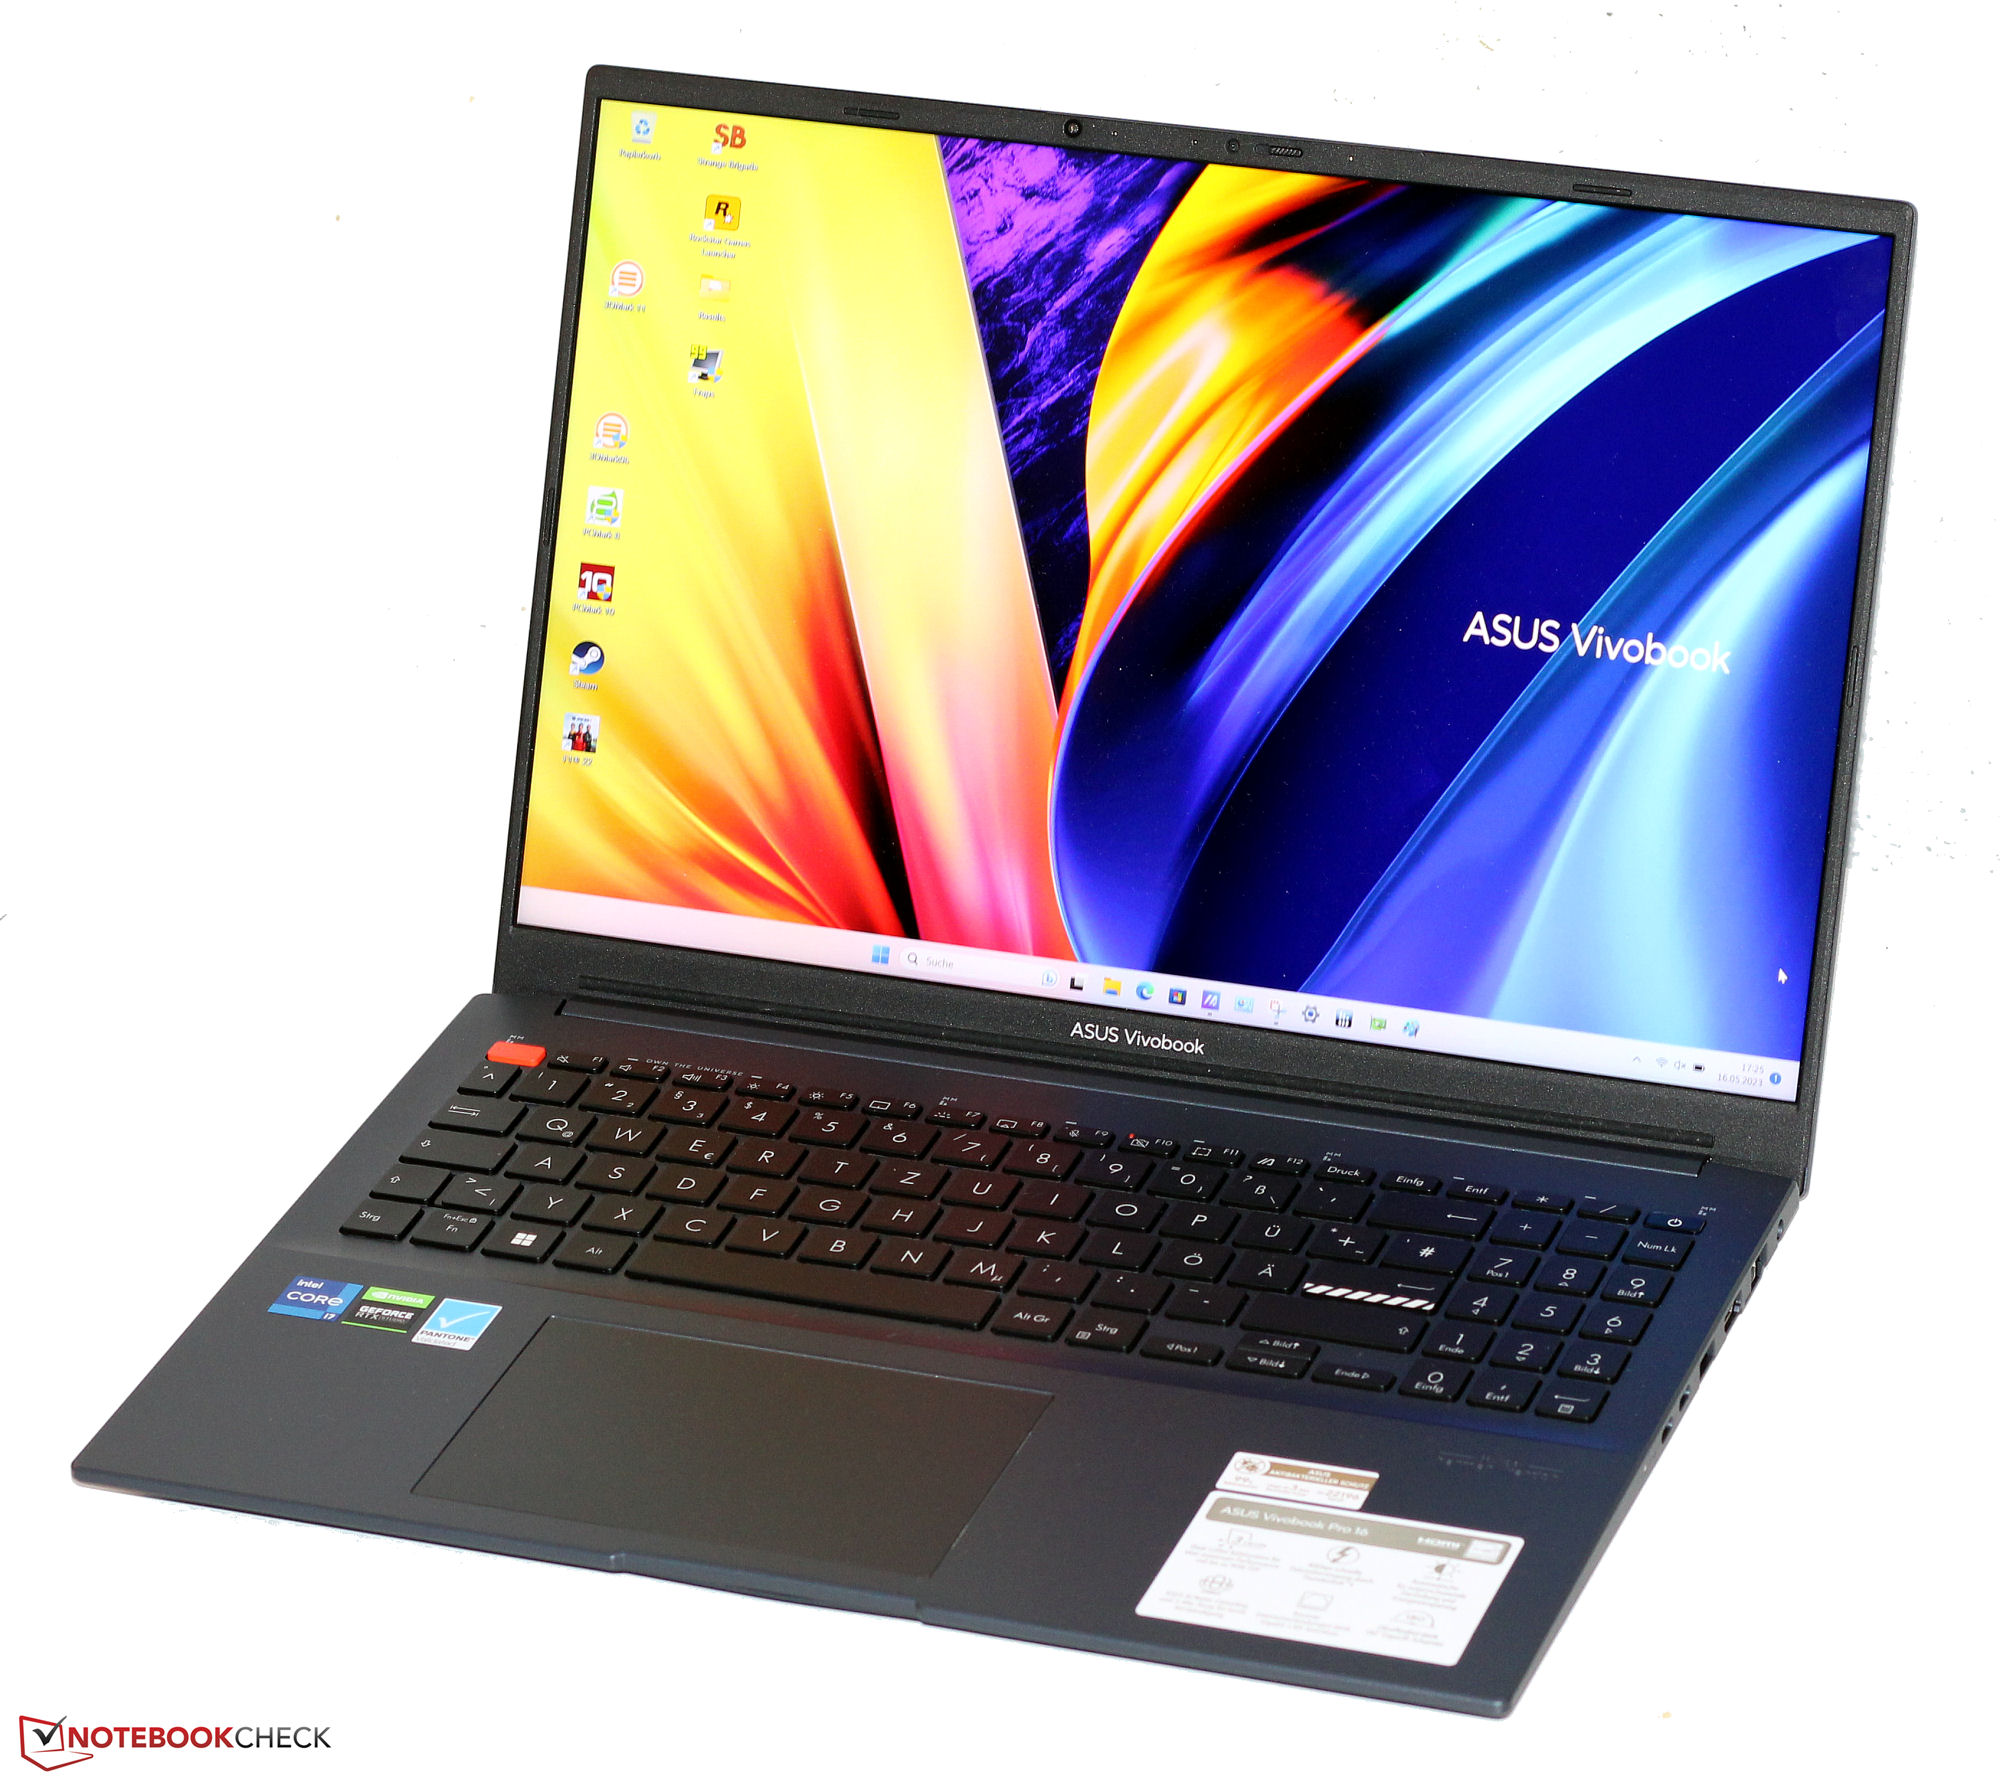
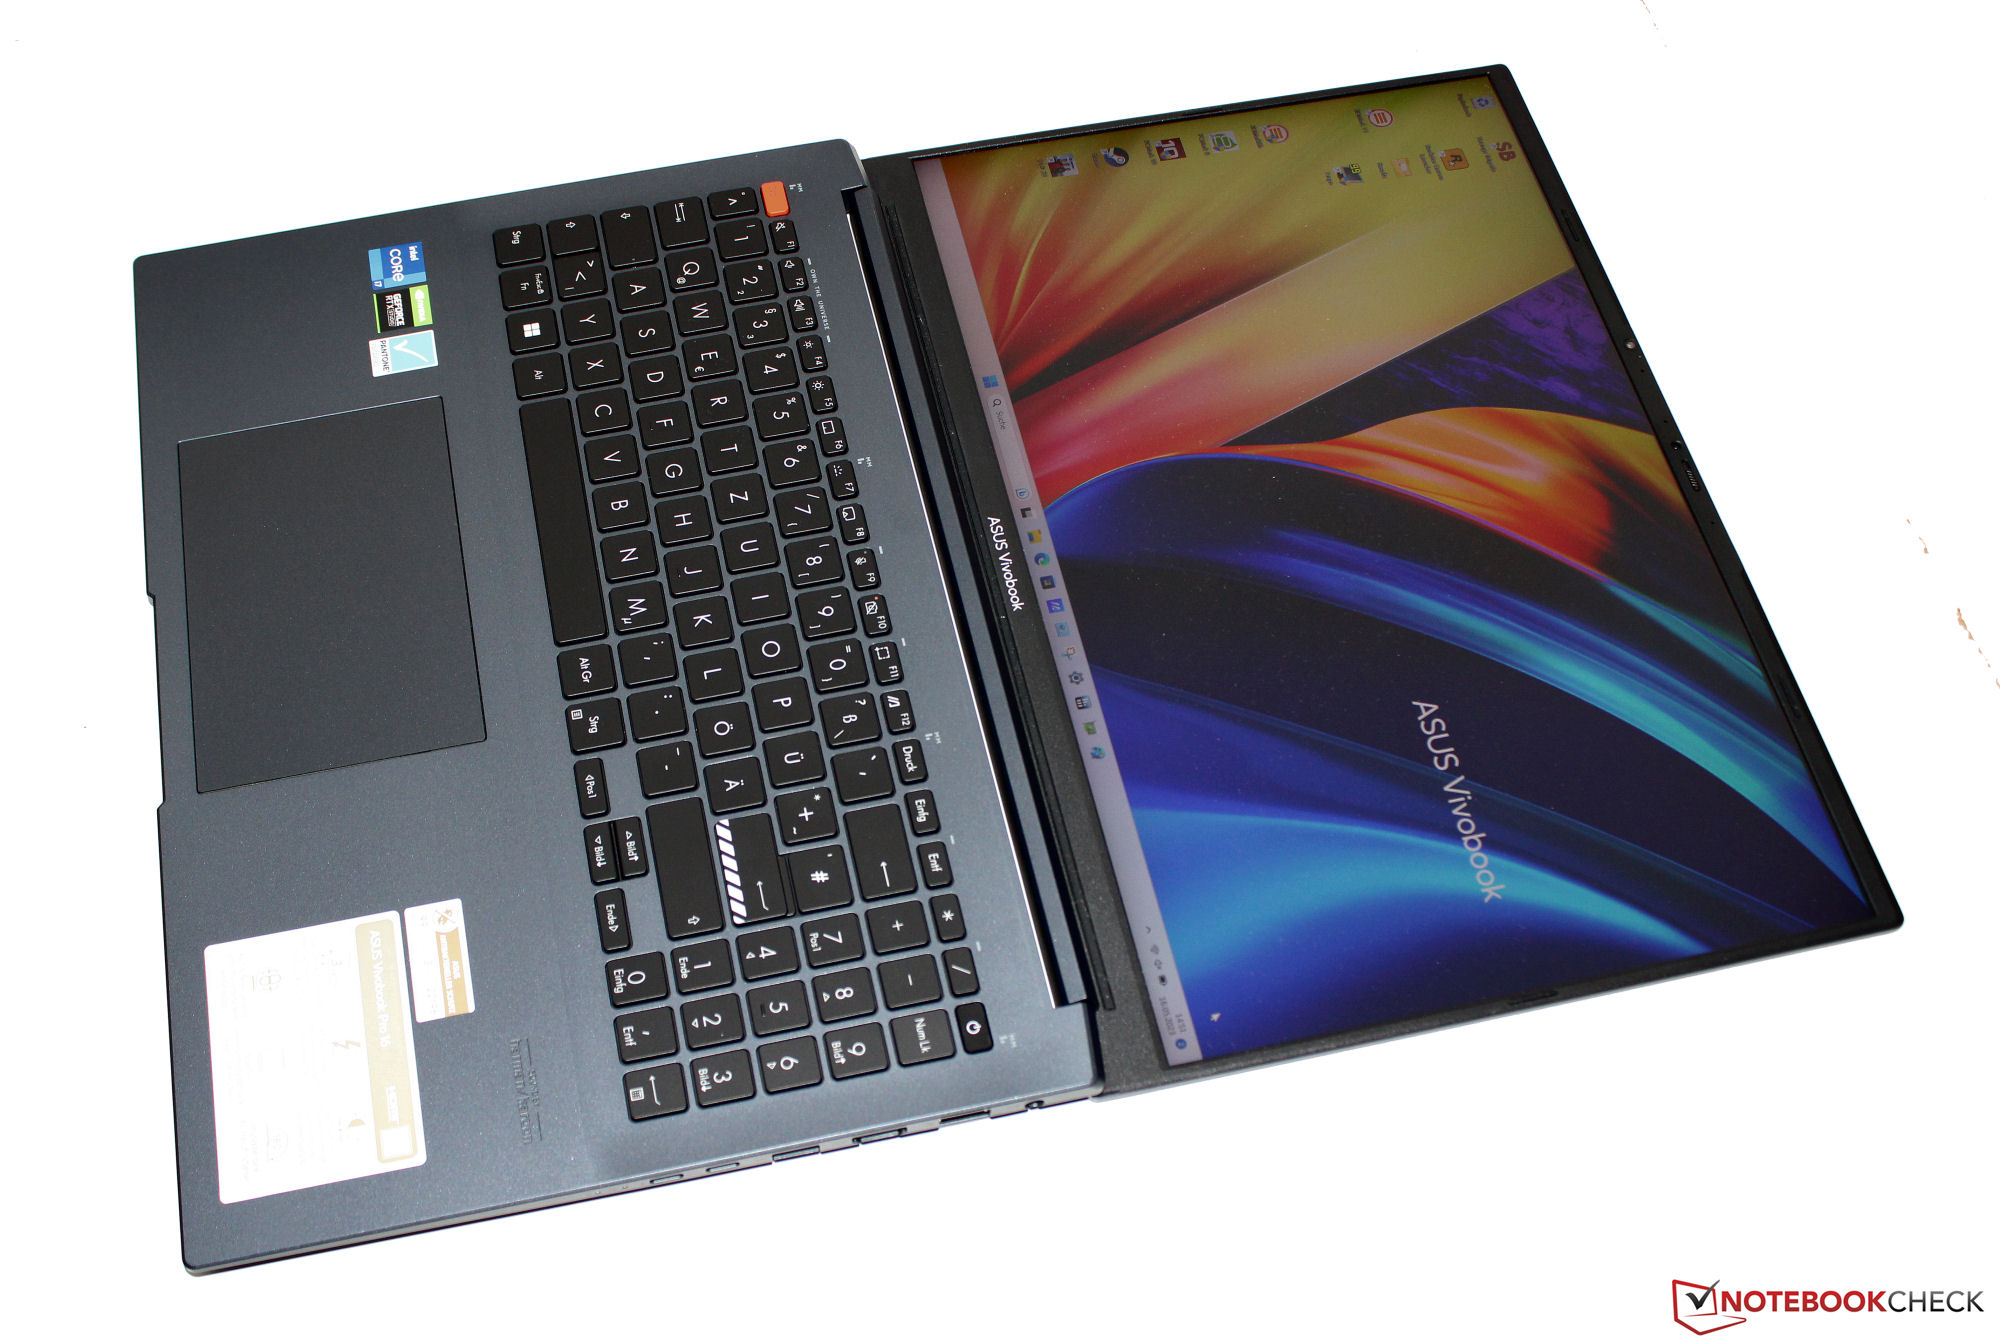
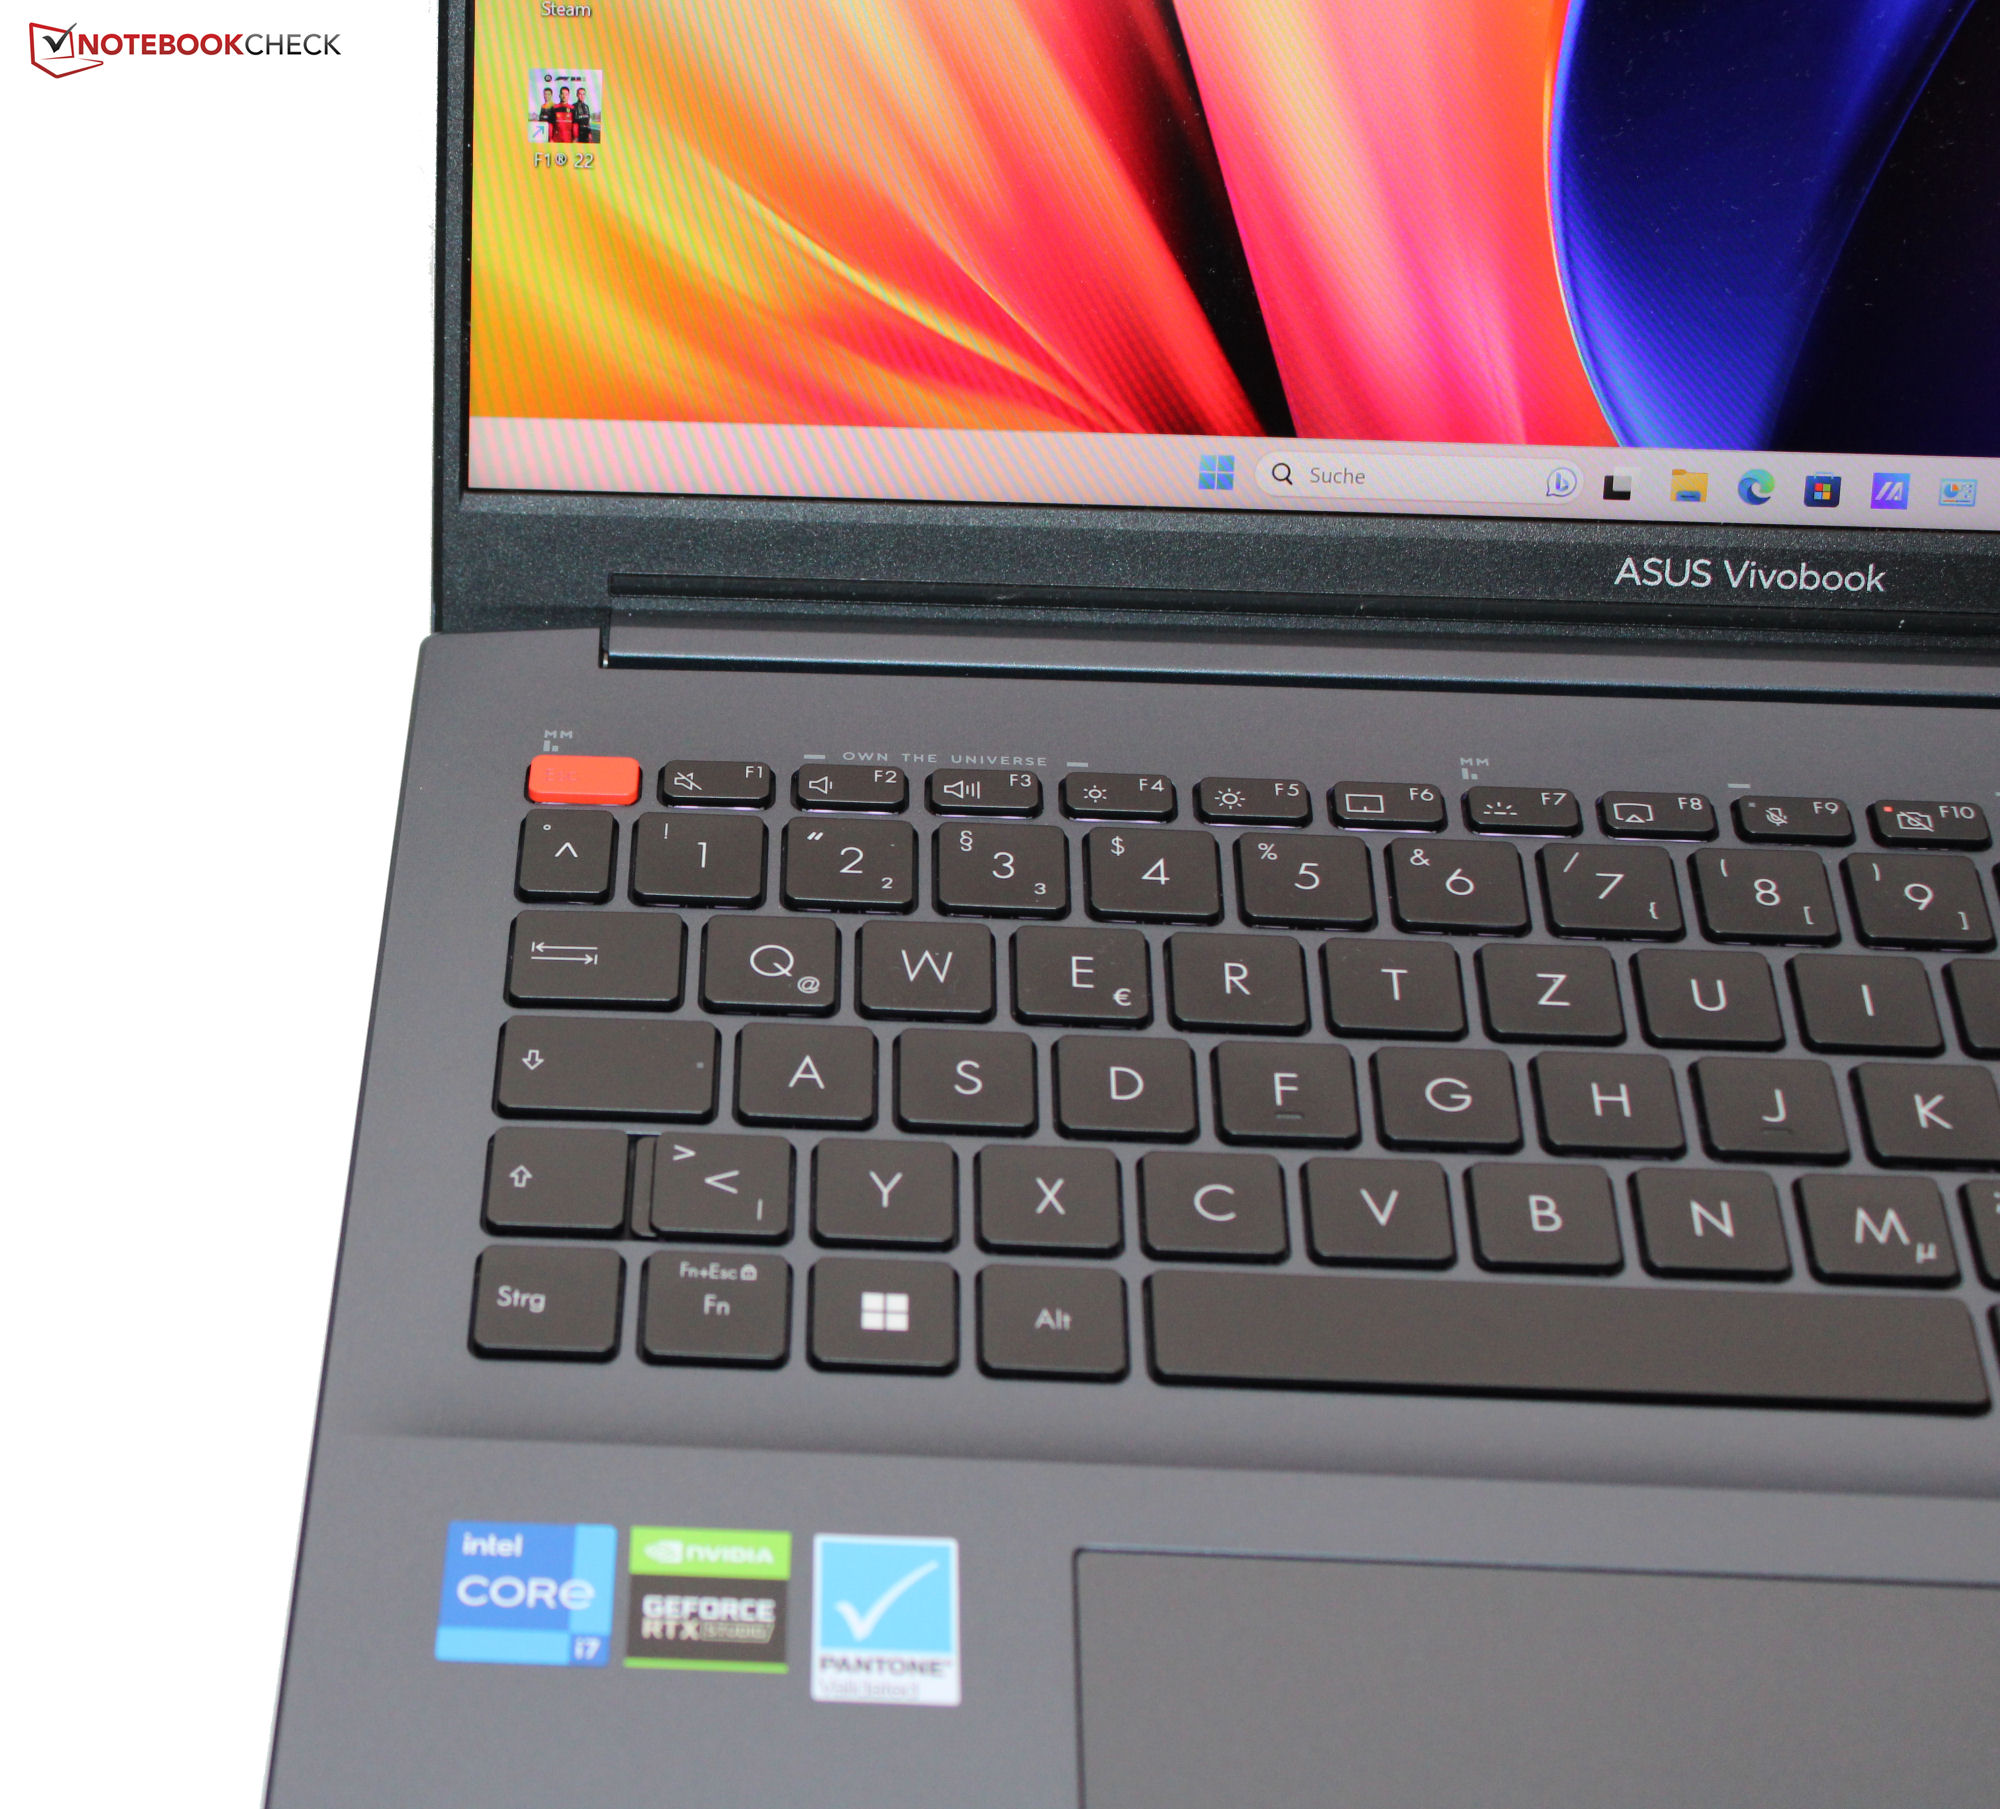
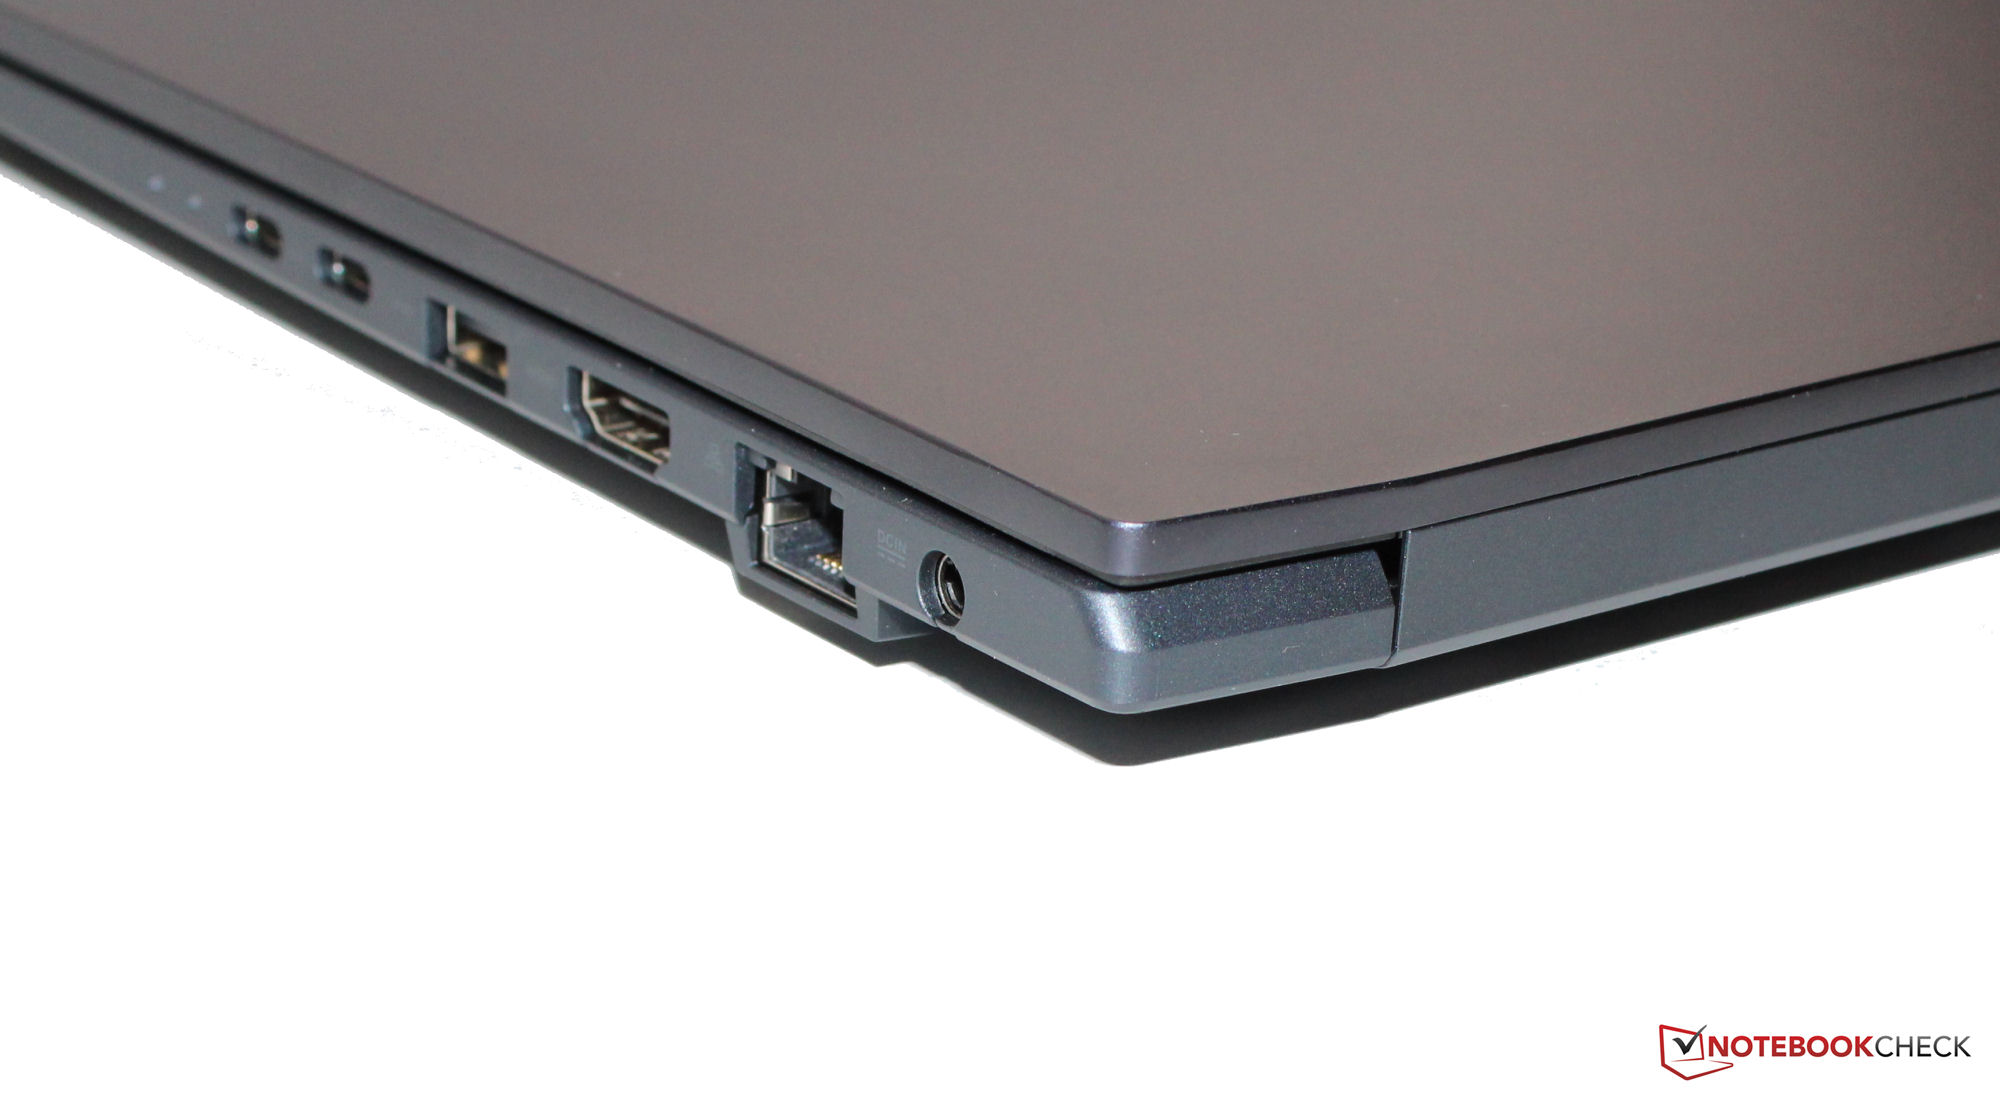
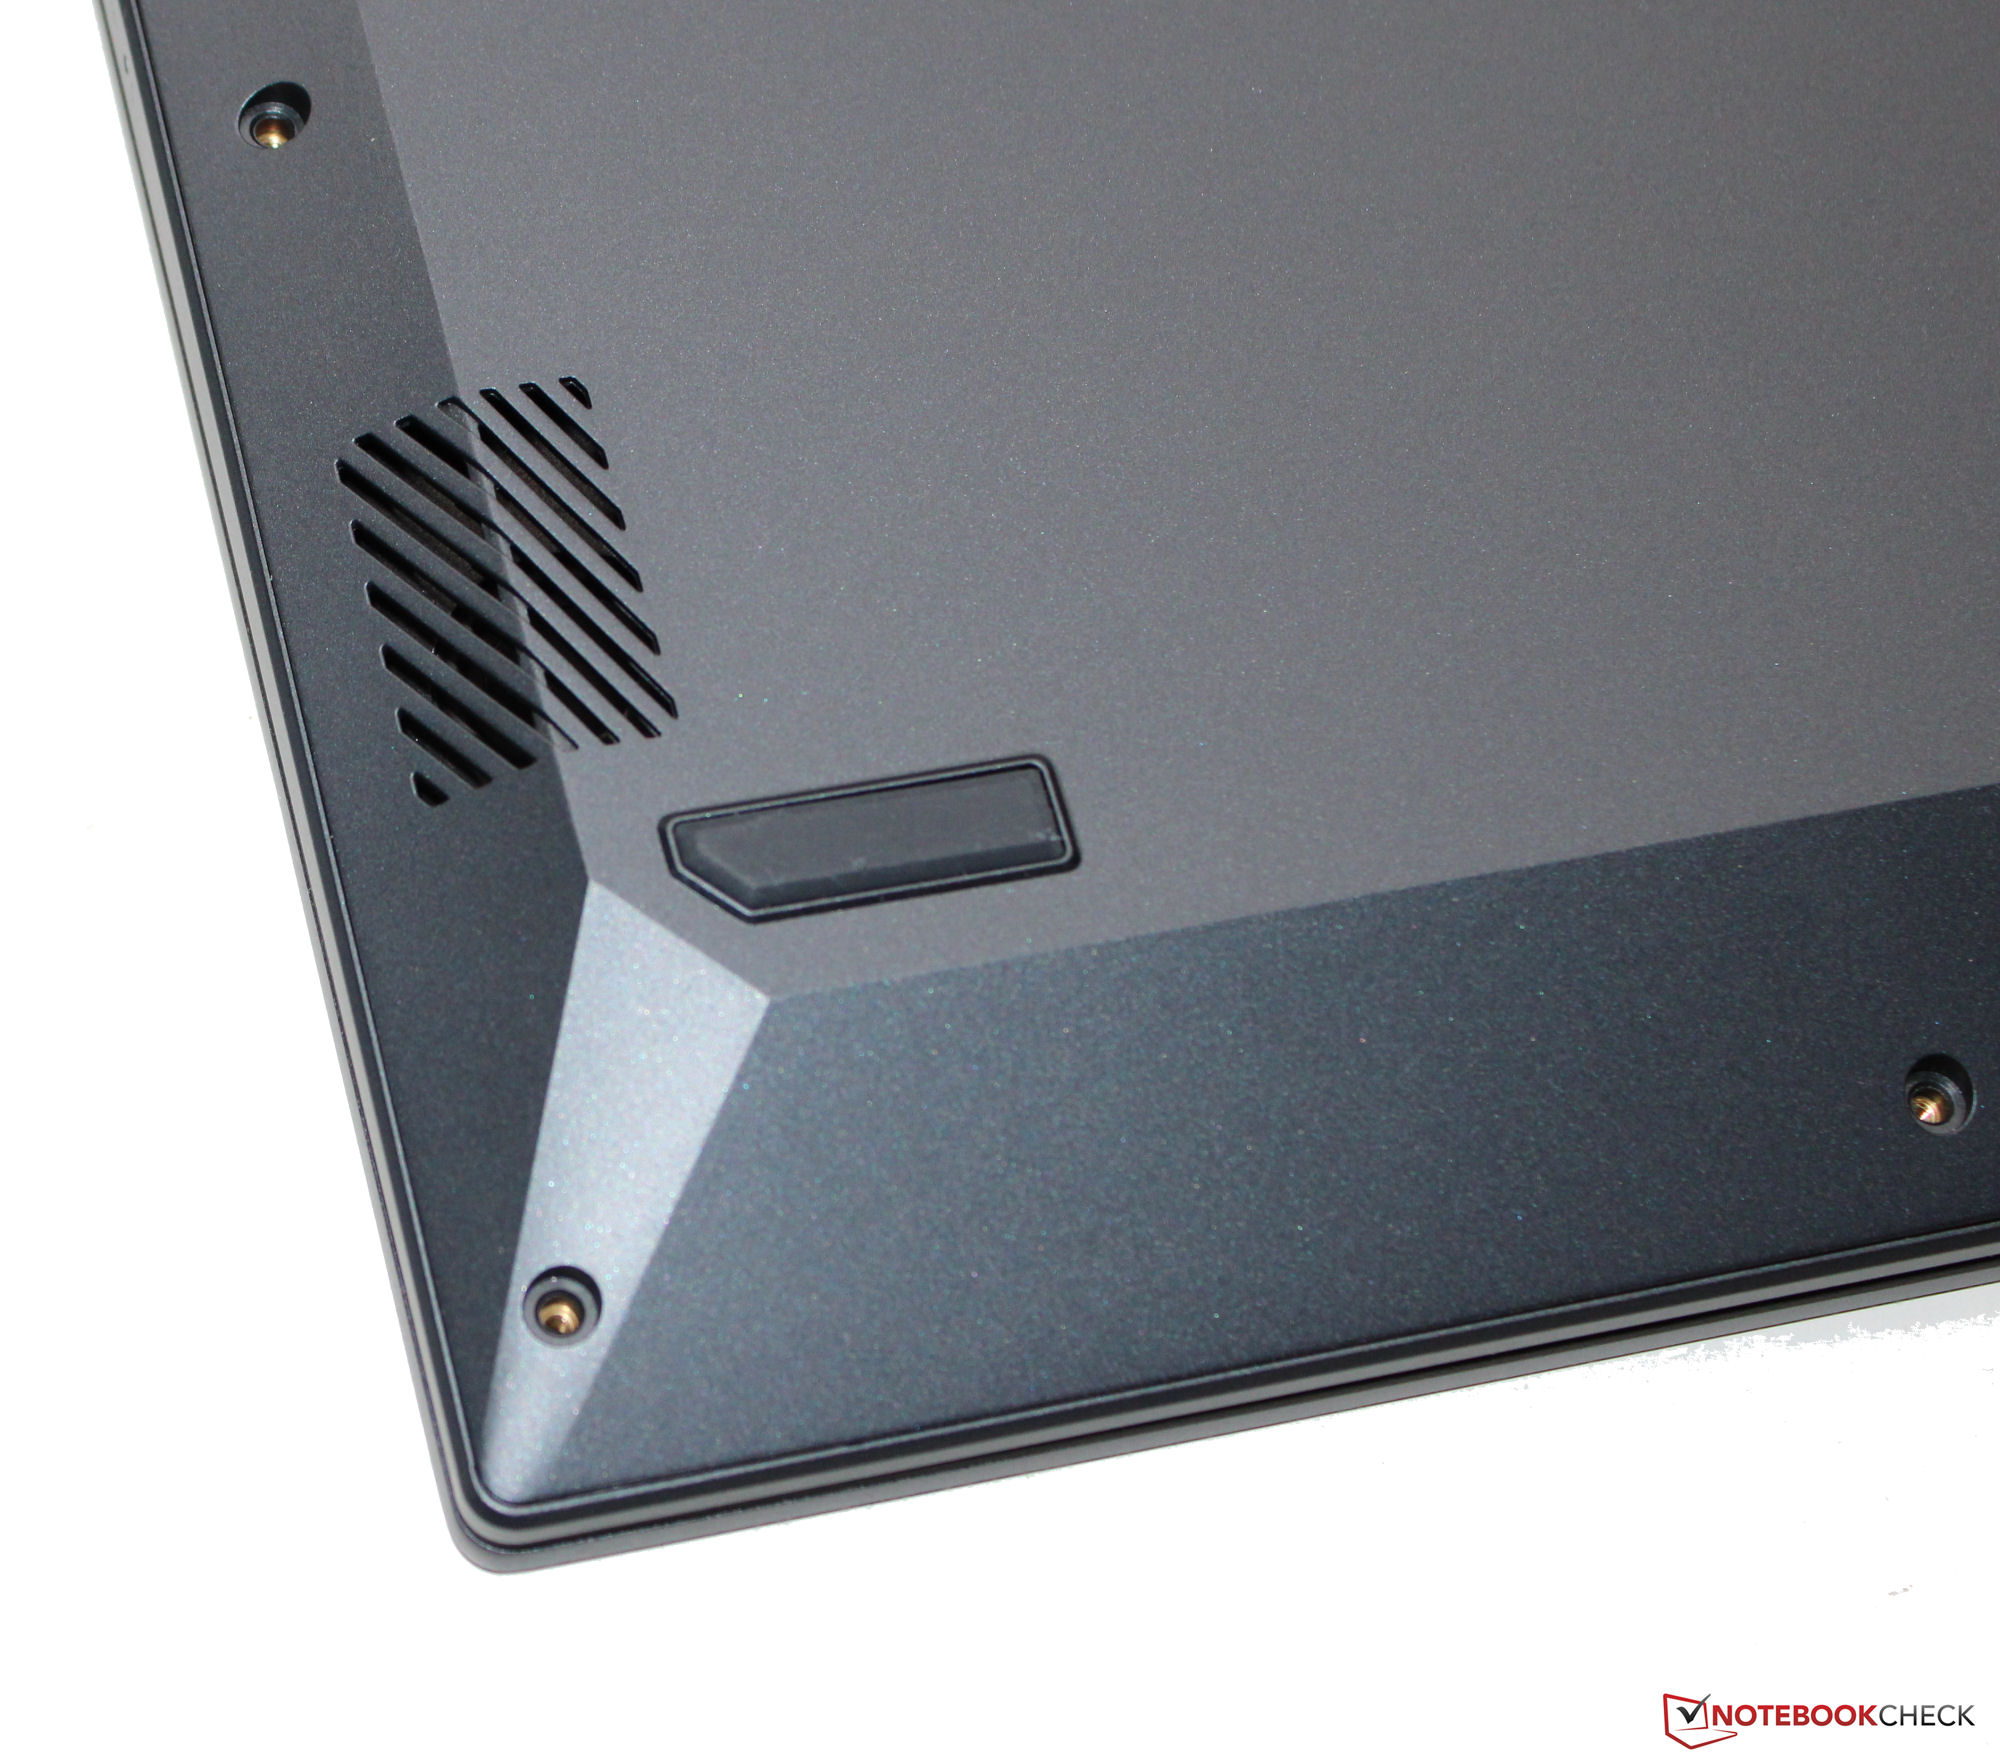
Case e recursos - O VivoBook com Thunderbolt 4
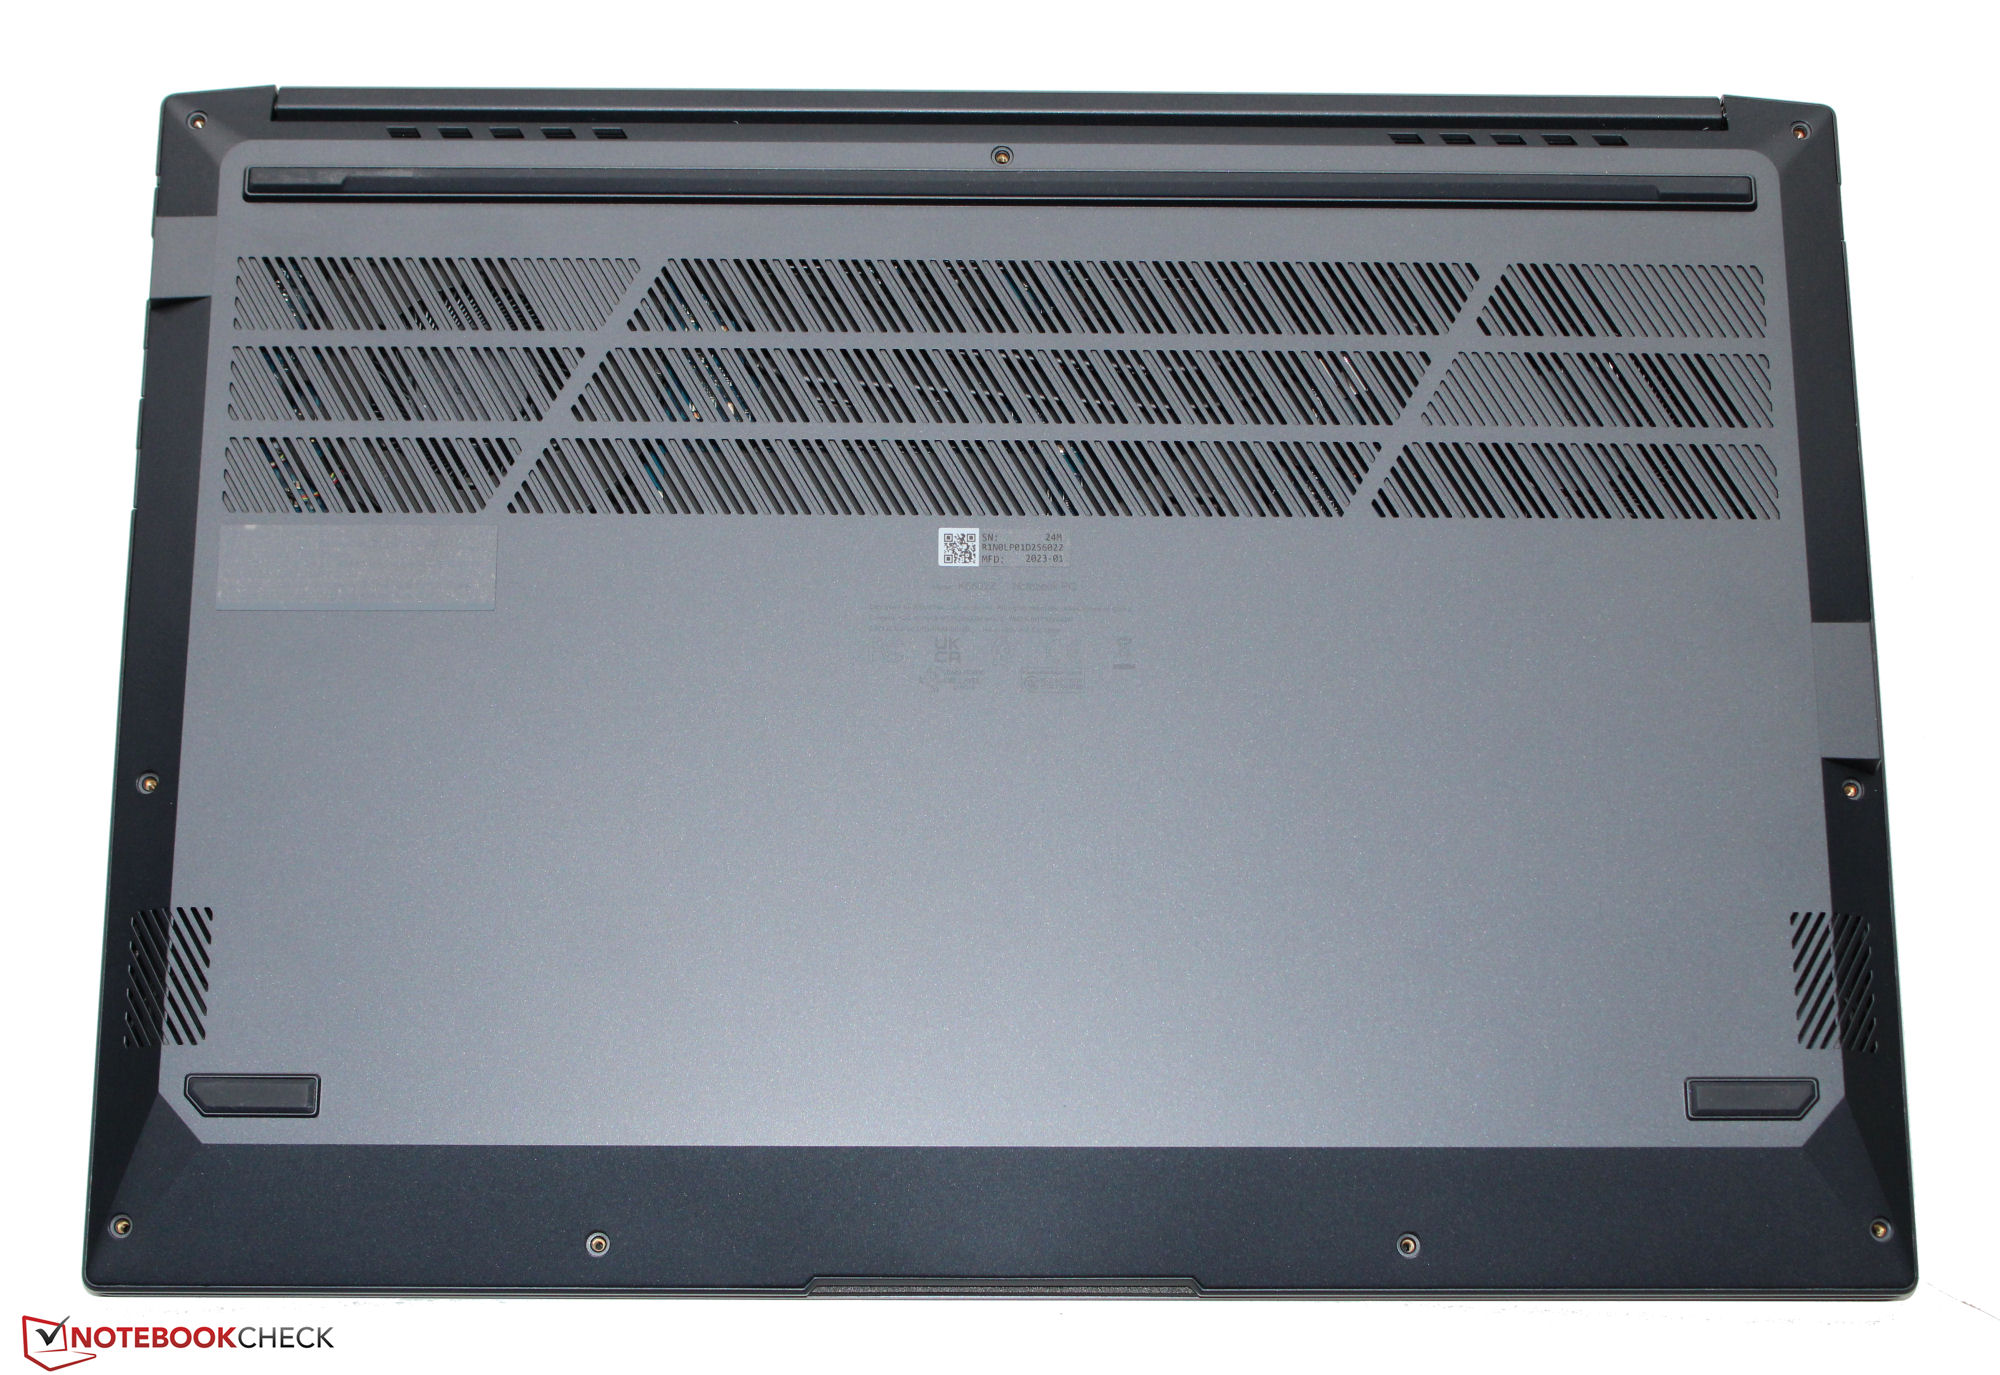
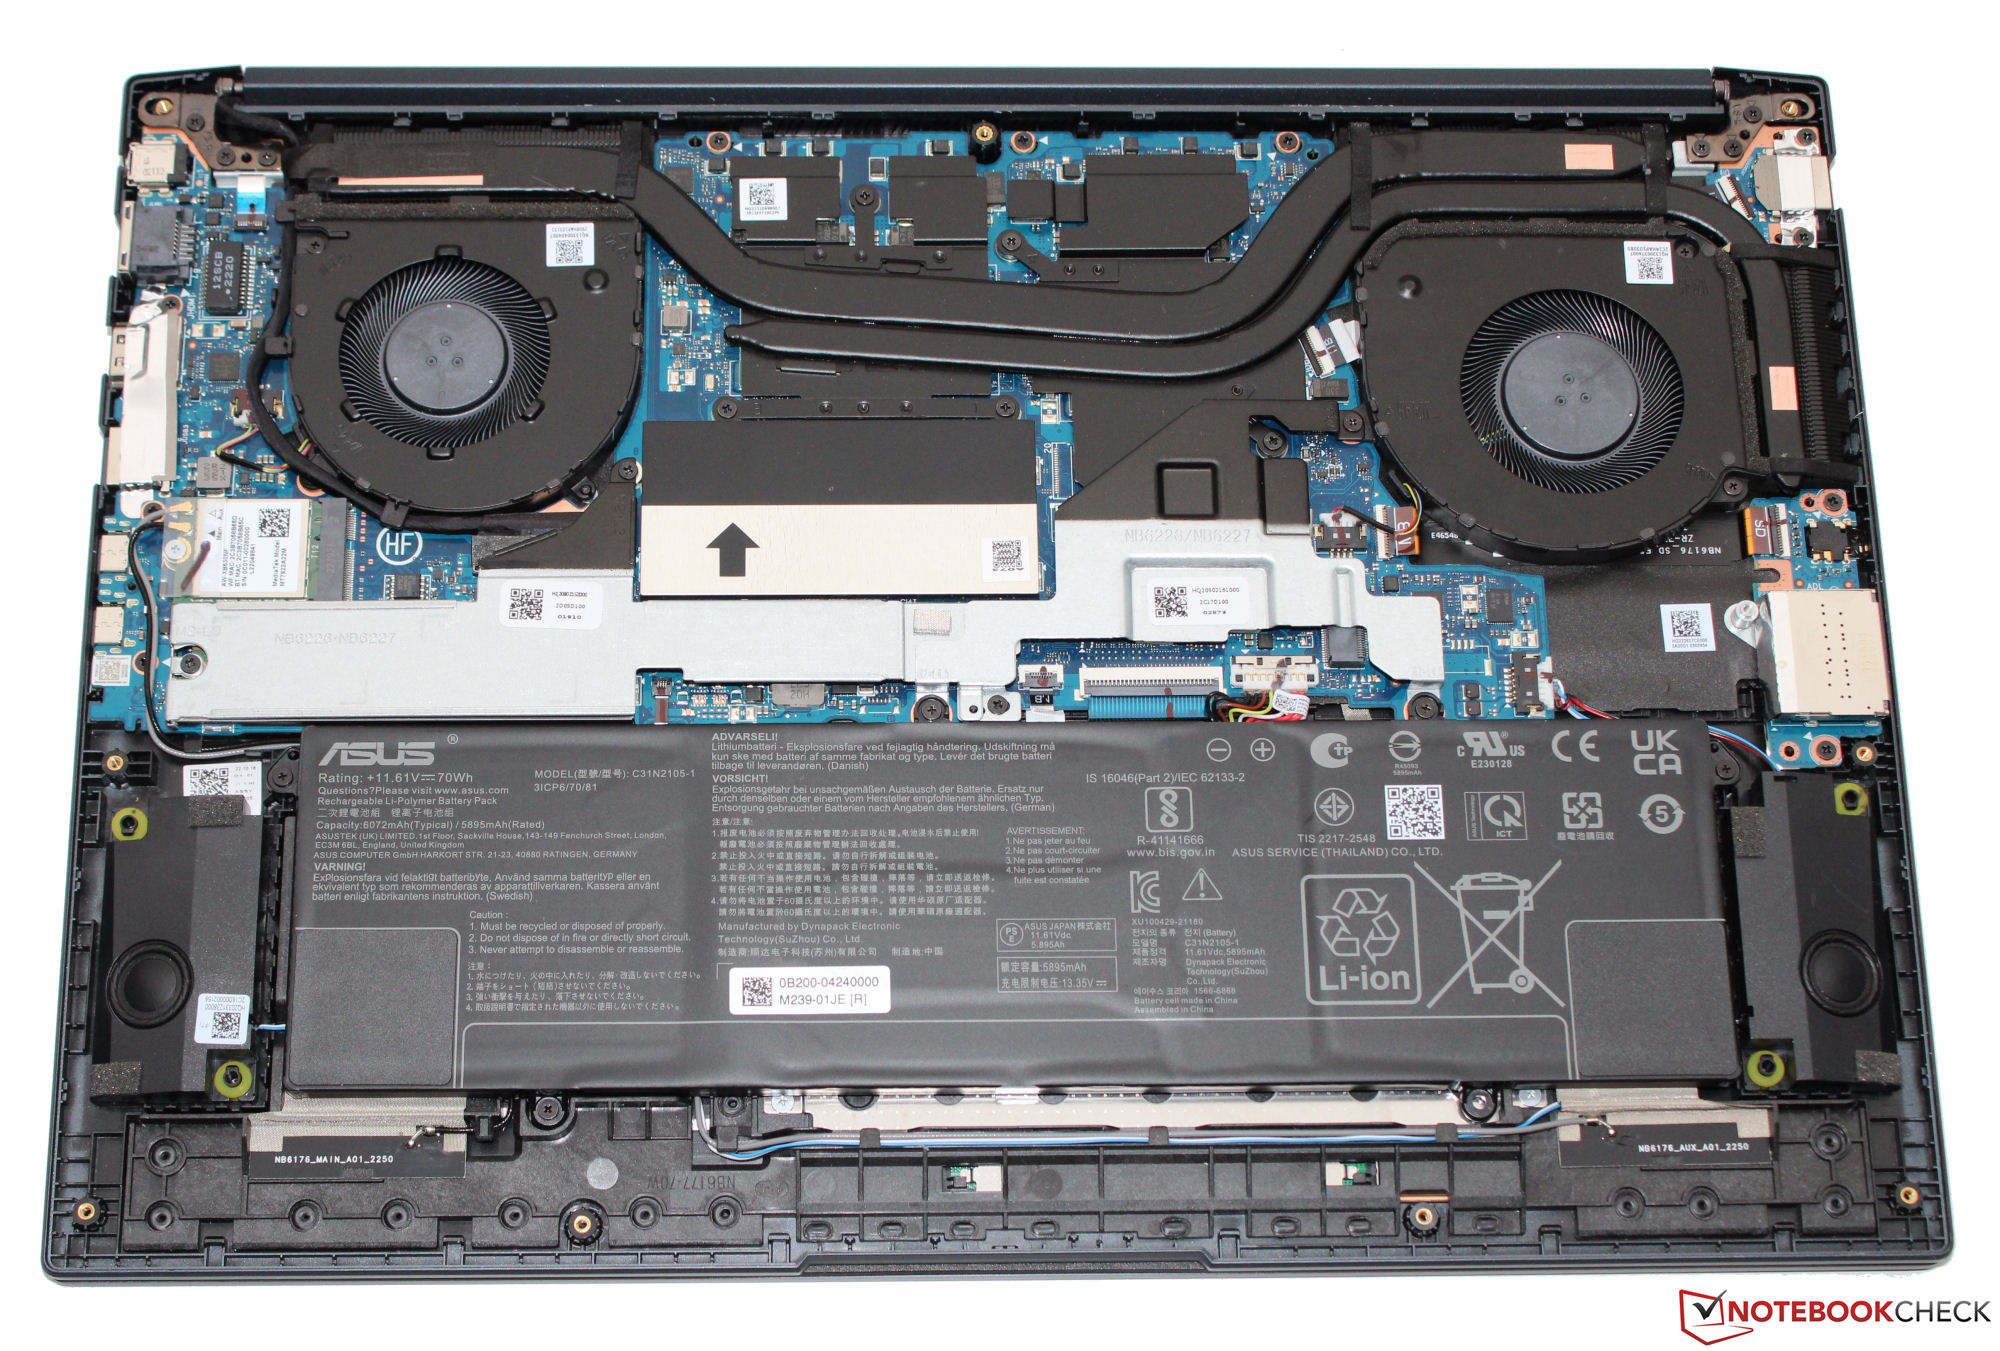
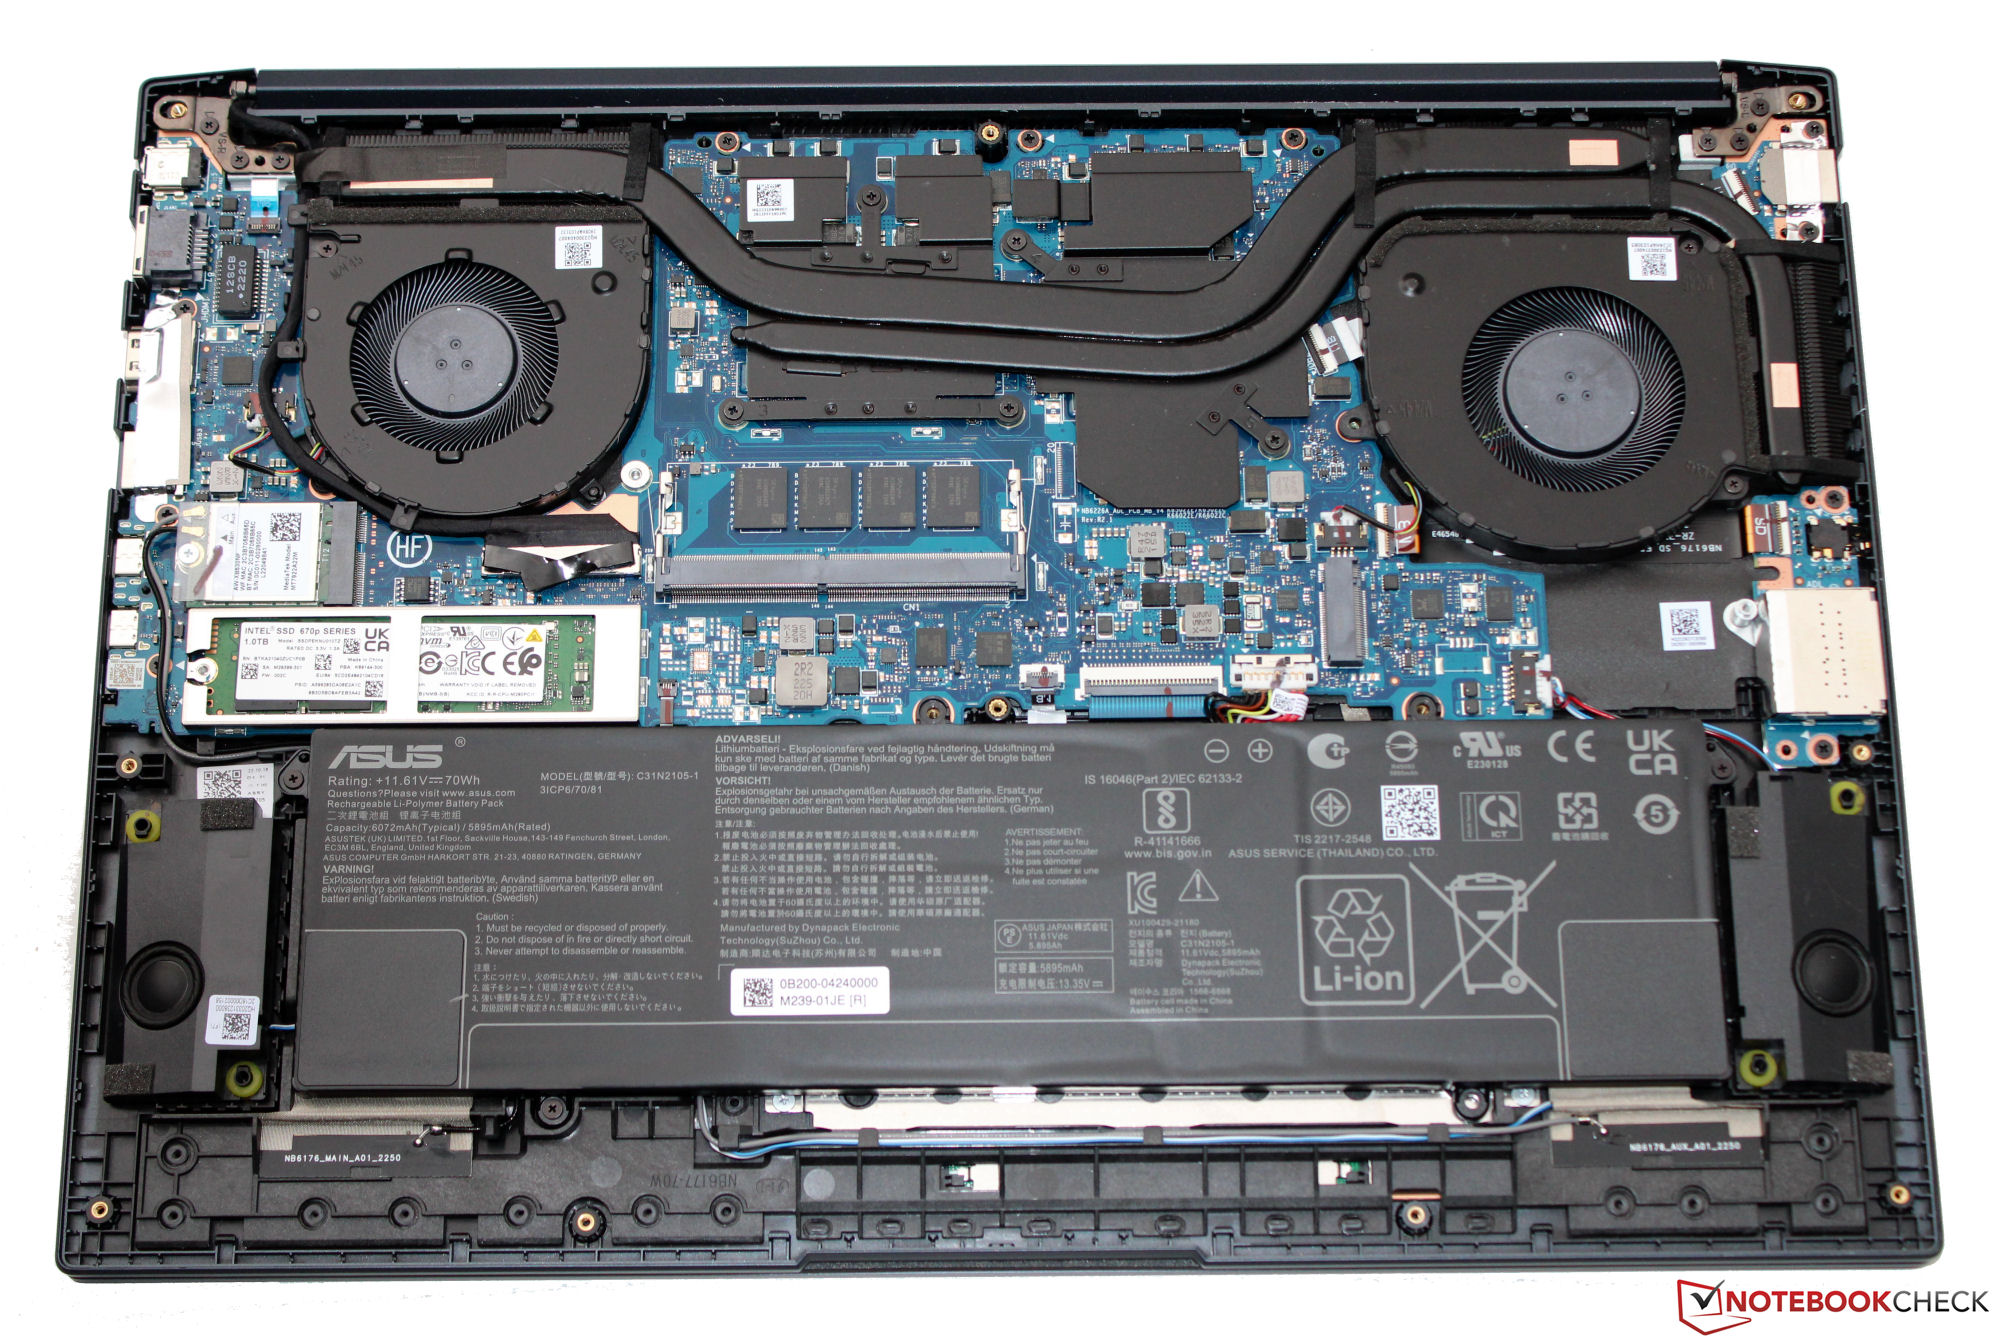
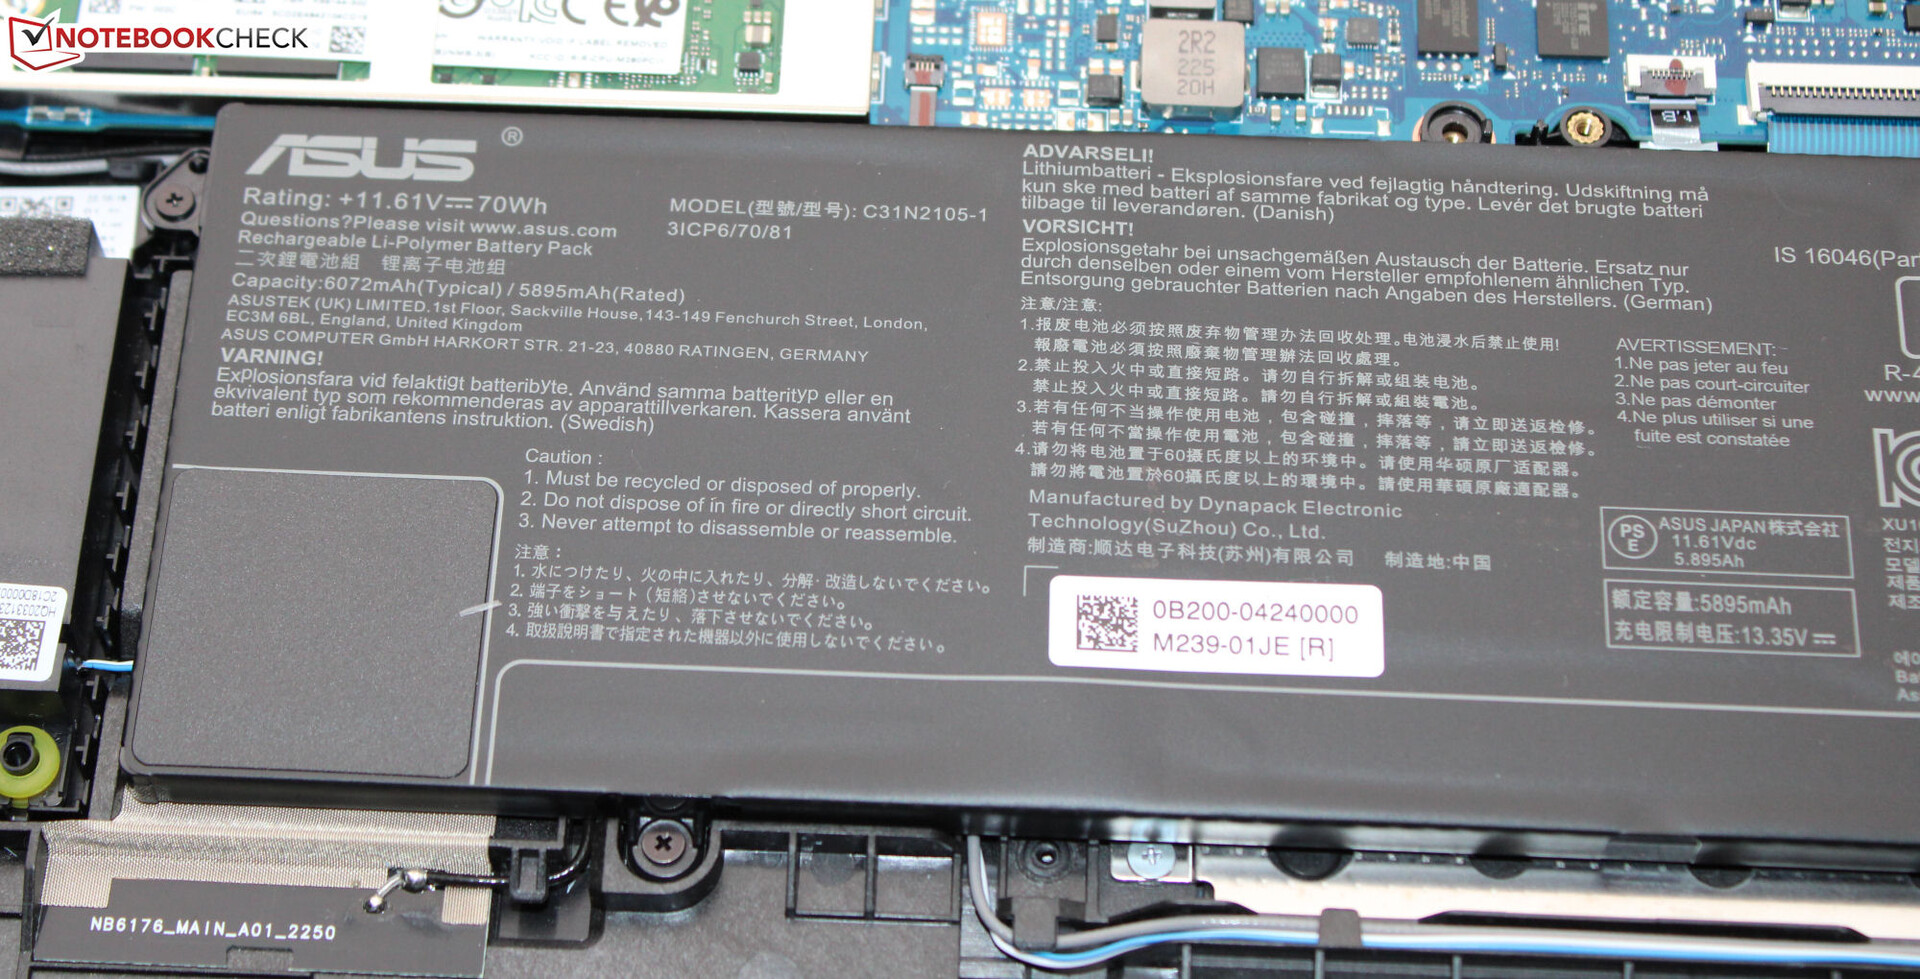
O VivoBook é azul escuro (Quiet Blue) e tem superfícies lisas e foscas. Sua unidade de base (plástico) e a tampa (traseira de alumínio) podem ser torcidas com um pouco de facilidade. O ângulo máximo em que você pode abrir a tampa é de 180 graus. A bateria (aparafusada, não colada) e o restante das partes internas do laptop podem ser acessados depois de remover a parte inferior do gabinete.
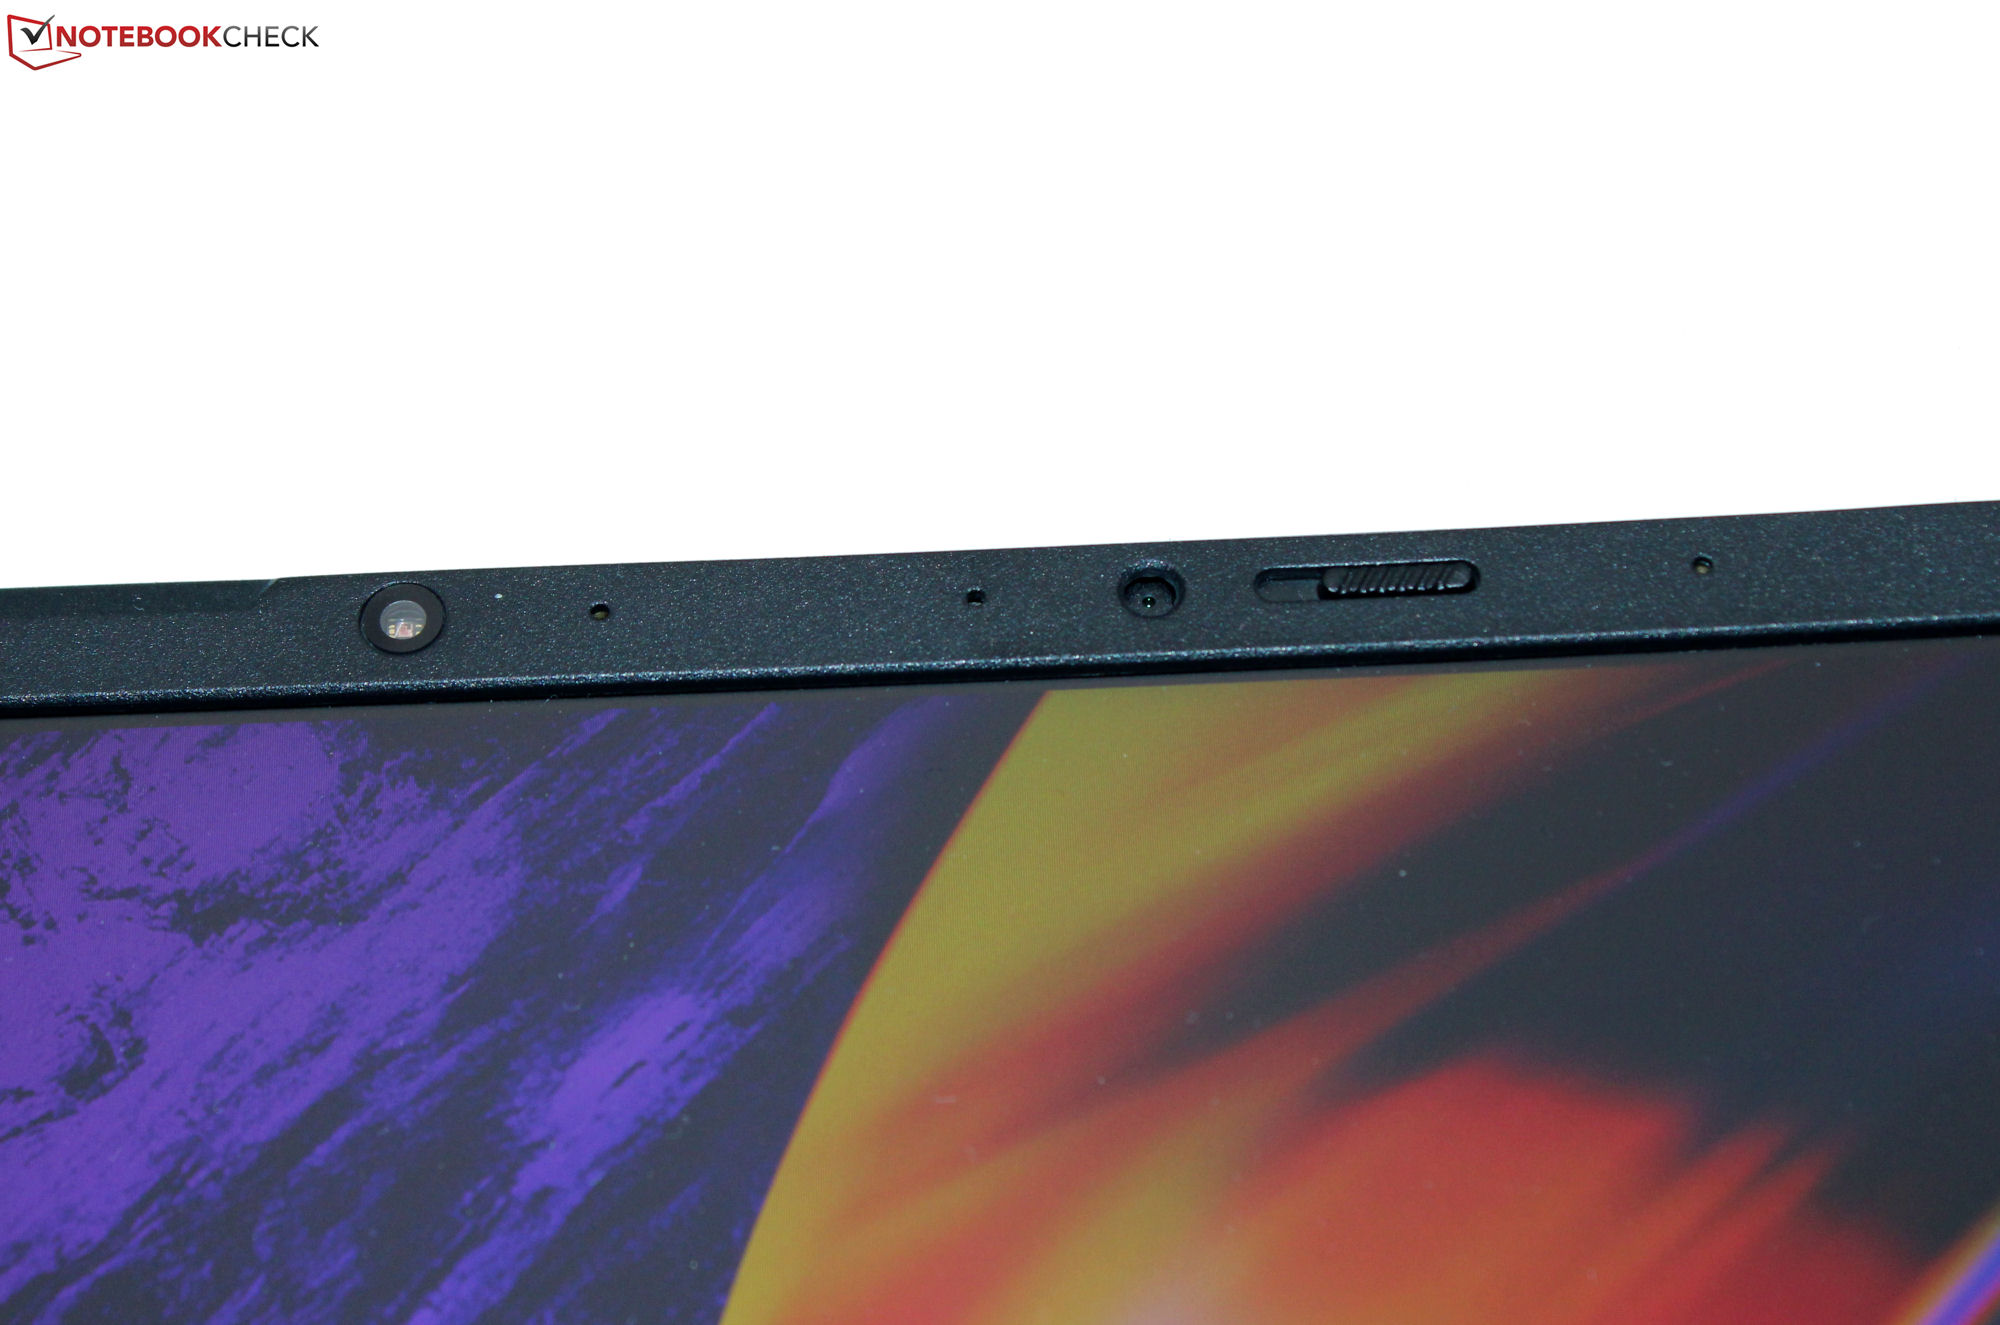
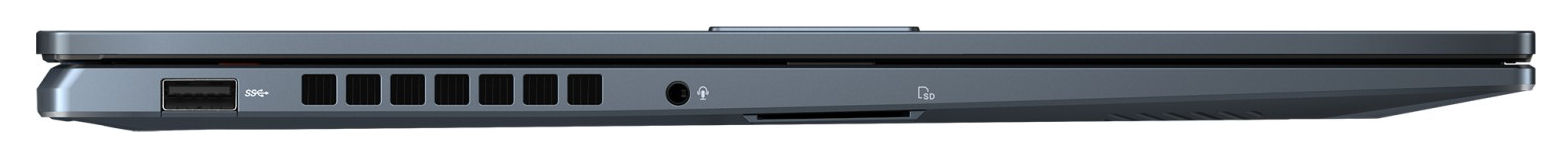
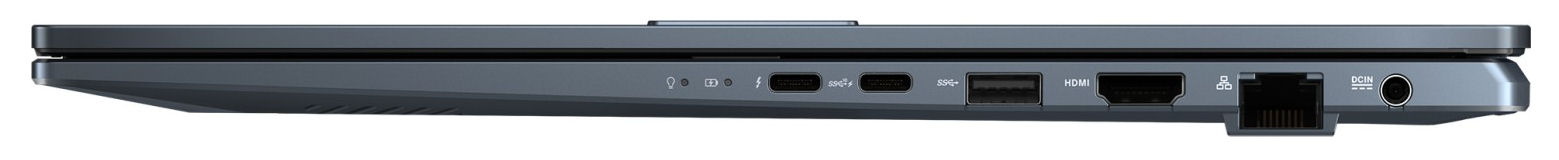
O dispositivo tem duas portas USB-A (USB 3.2 Gen 1), bem como duas portas USB-C (1x Thunderbolt 4, 1x USB 3.2 Gen 2). Estas últimas suportam fornecimento de energia e a porta TB4 também pode emitir um sinal DisplayPort. No total, há duas saídas de vídeo (1x DP, 1x HDMI). O leitor de cartão SD (cartão de referência: AV PRO microSD 128 GB V60) oferece velocidades médias. Um ponto positivo: A webcam (2,1 MP, máx. 1.920 x 1.080 pixels) tem uma cobertura mecânica.
Em condições ideais (sem dispositivos WiFi nas proximidades, curta distância entre o laptop e o PC servidor), é possível obter ótimas taxas de dados WiFi. O laptop usa um chip WiFi 6E (Mediatek MT7922). As conexões com fio são feitas por um chip Realtek (RTL 816878111; 1 GBit/s).
| SD Card Reader | |
| average JPG Copy Test (av. of 3 runs) | |
| Média da turma Multimedia (23 - 531, n=40, últimos 2 anos) | |
| Schenker XMG Fusion 15 (Mid 22) (AV PRO microSD 128 GB V60) | |
| Asus VivoBook Pro 16 (AV Pro SD microSD 128 GB V60) | |
| Dell Inspiron 16 Plus 7620 (Toshiba Exceria Pro SDXC 64 GB UHS-II) | |
| maximum AS SSD Seq Read Test (1GB) | |
| Média da turma Multimedia (37.3 - 1455, n=39, últimos 2 anos) | |
| Asus VivoBook Pro 16 (AV Pro SD microSD 128 GB V60) | |
| Dell Inspiron 16 Plus 7620 (Toshiba Exceria Pro SDXC 64 GB UHS-II) | |


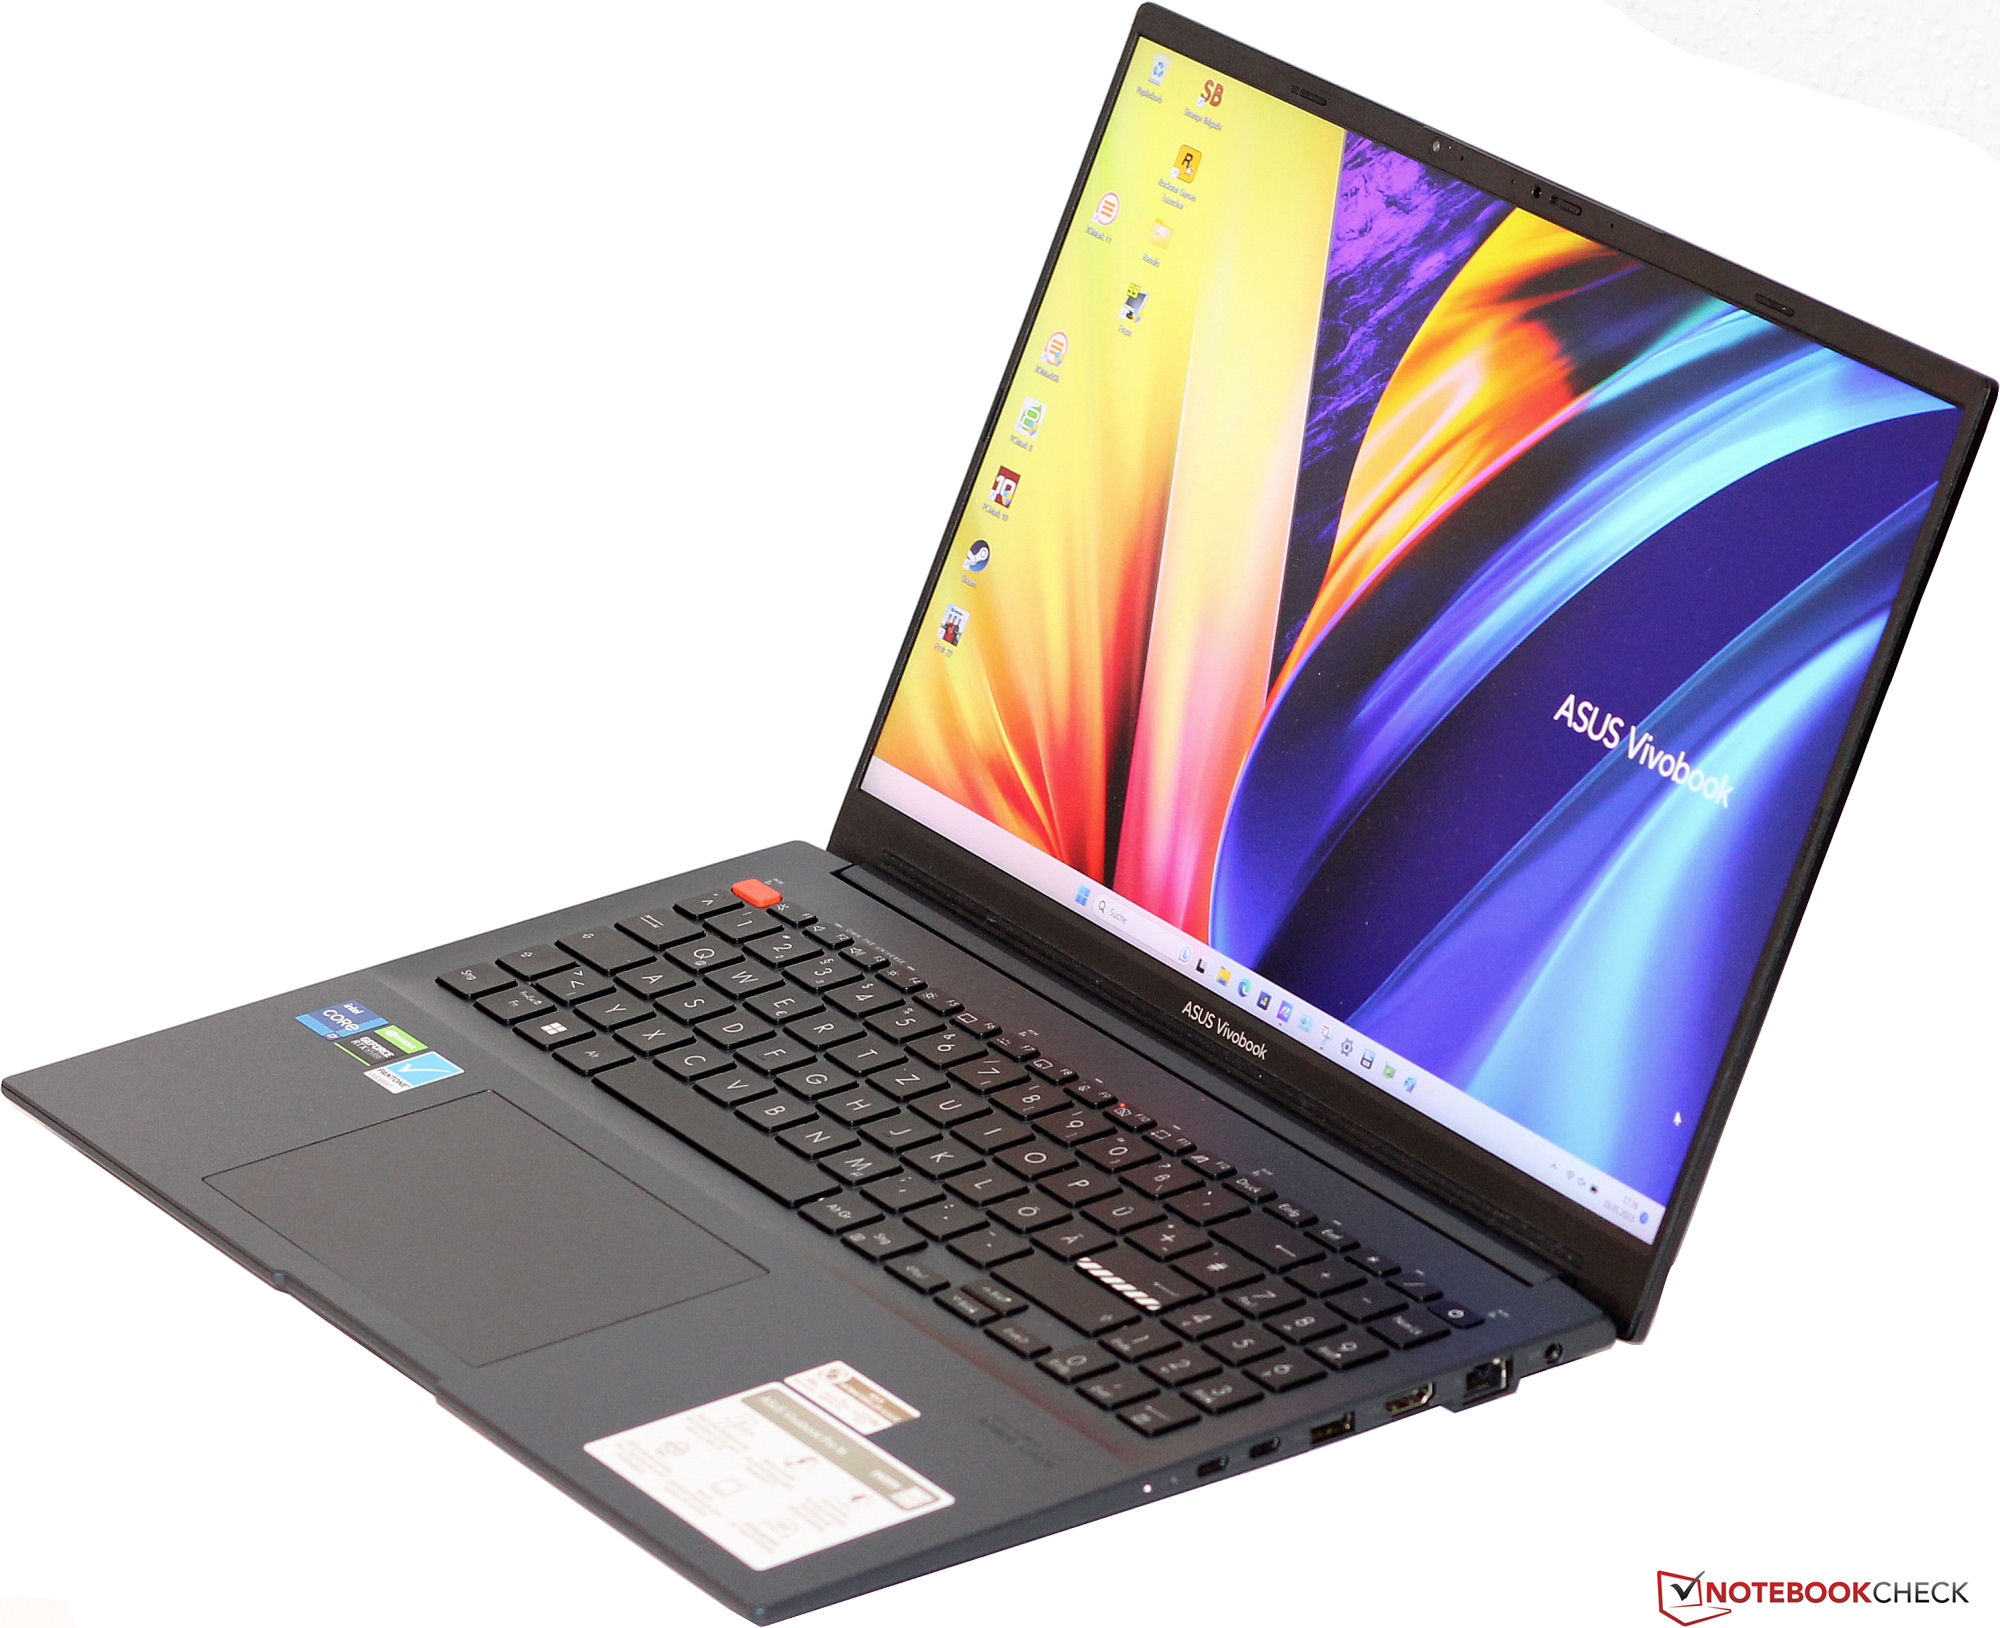
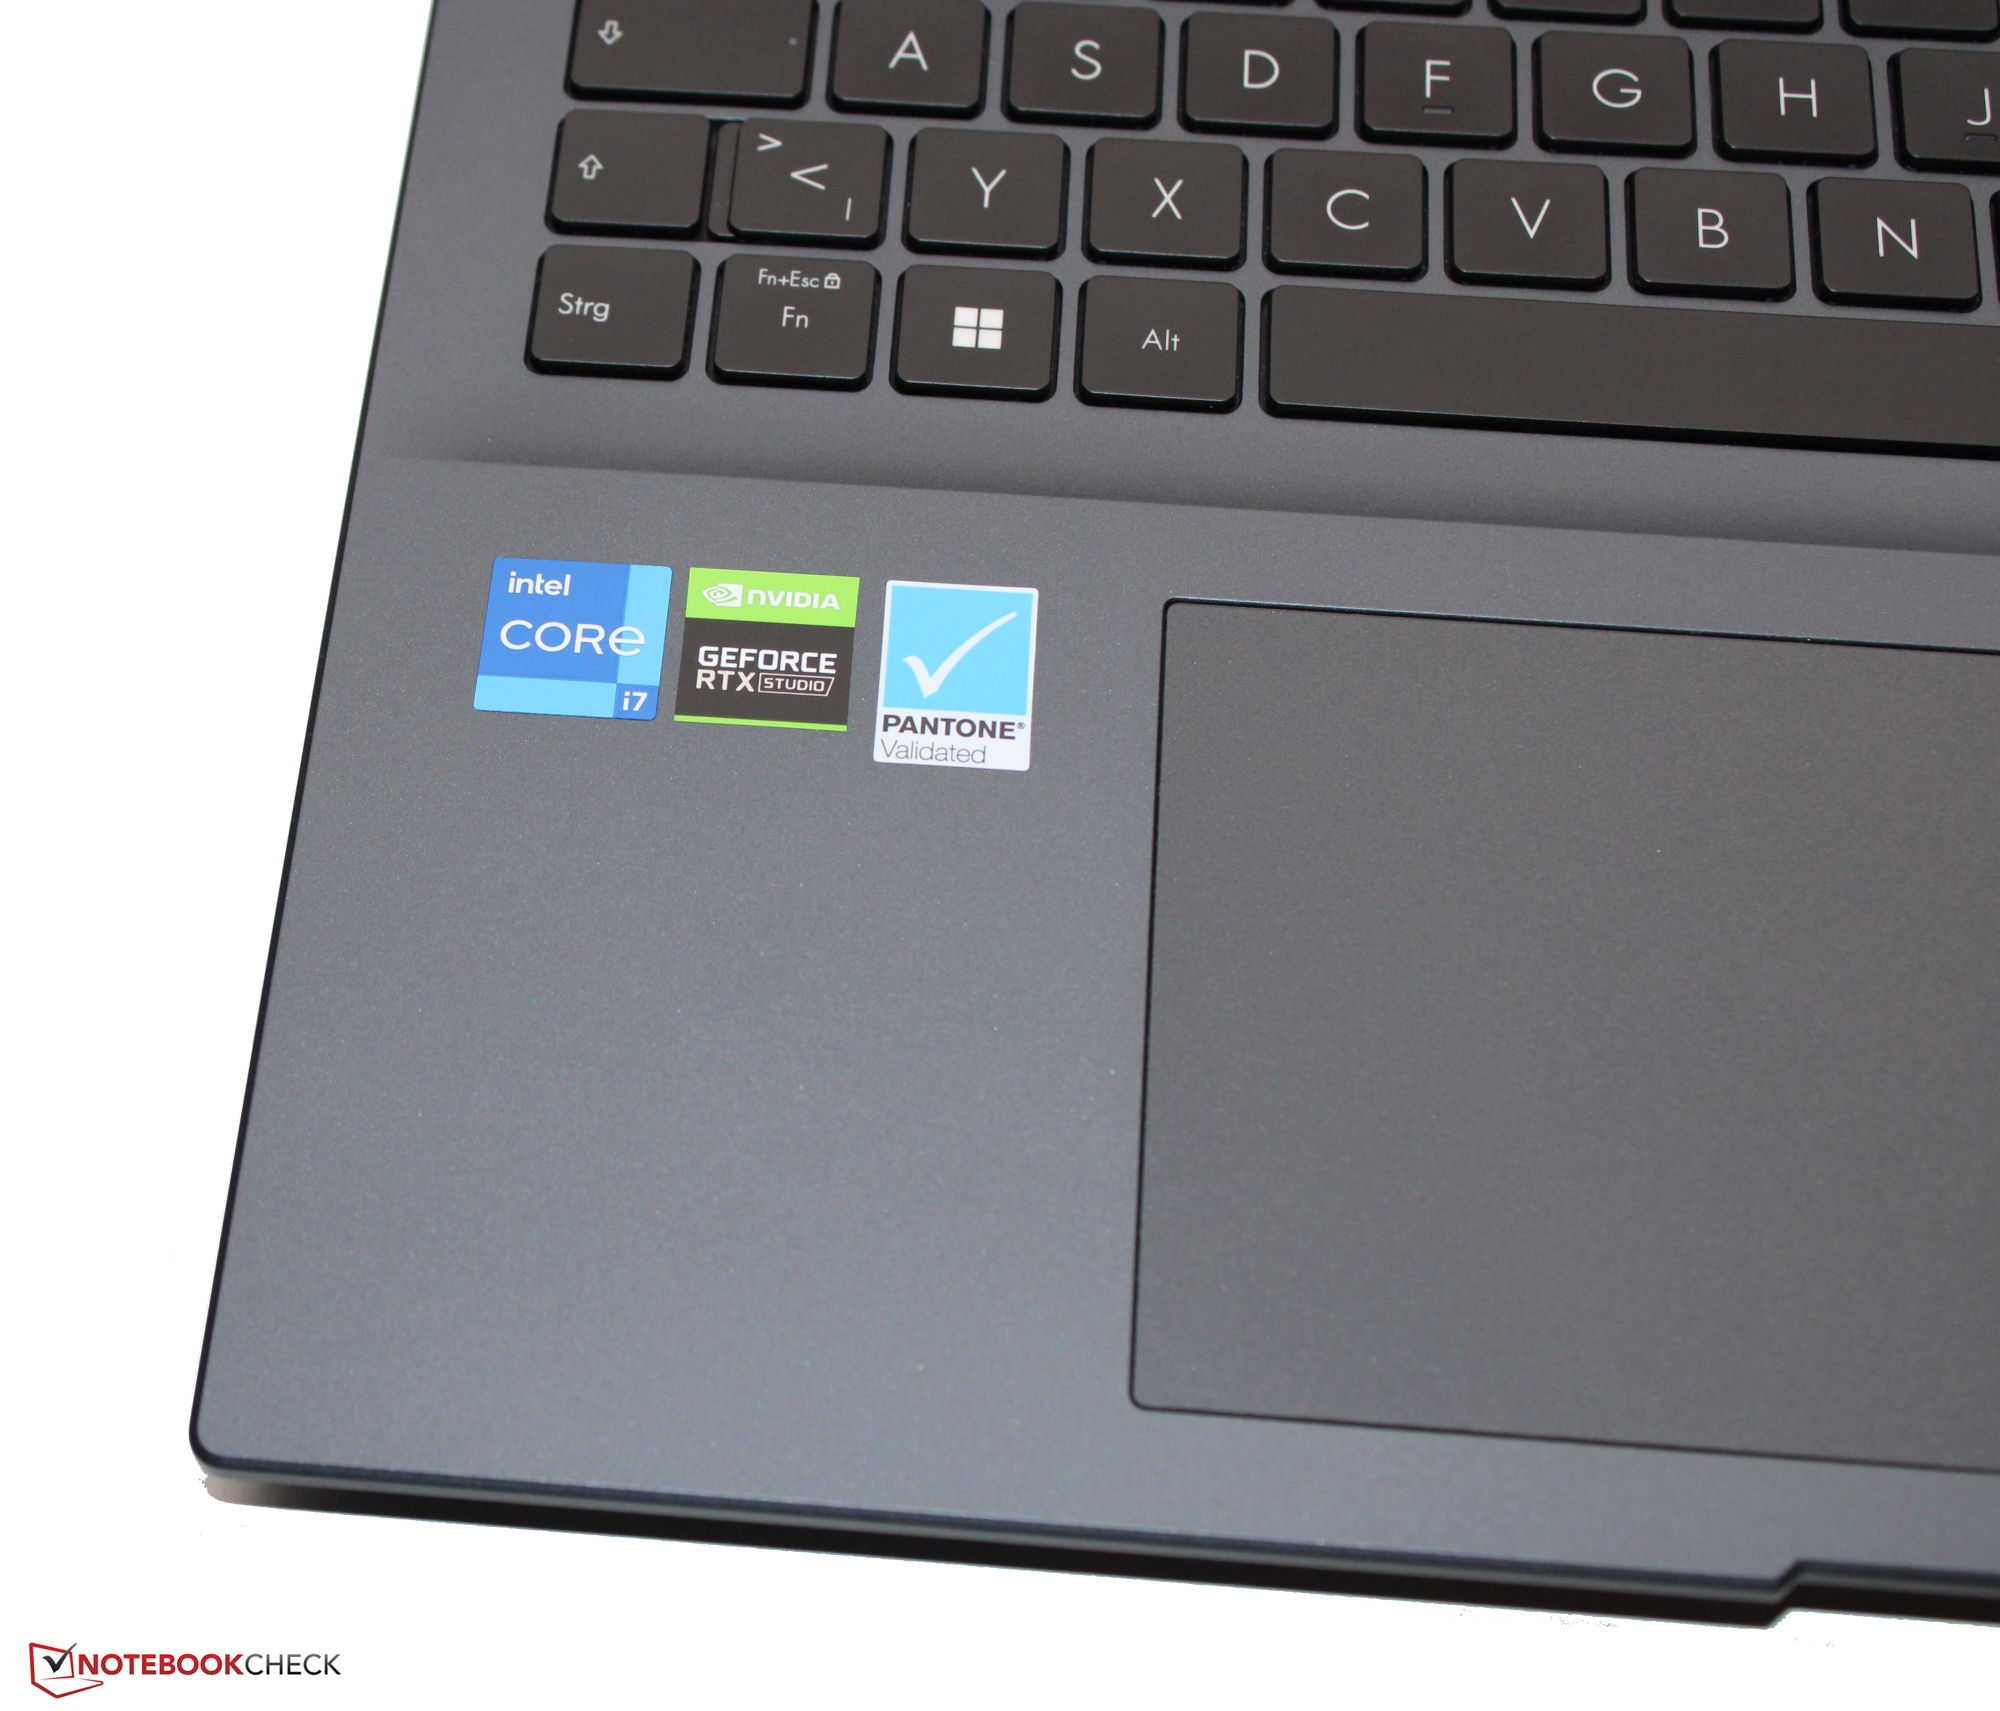
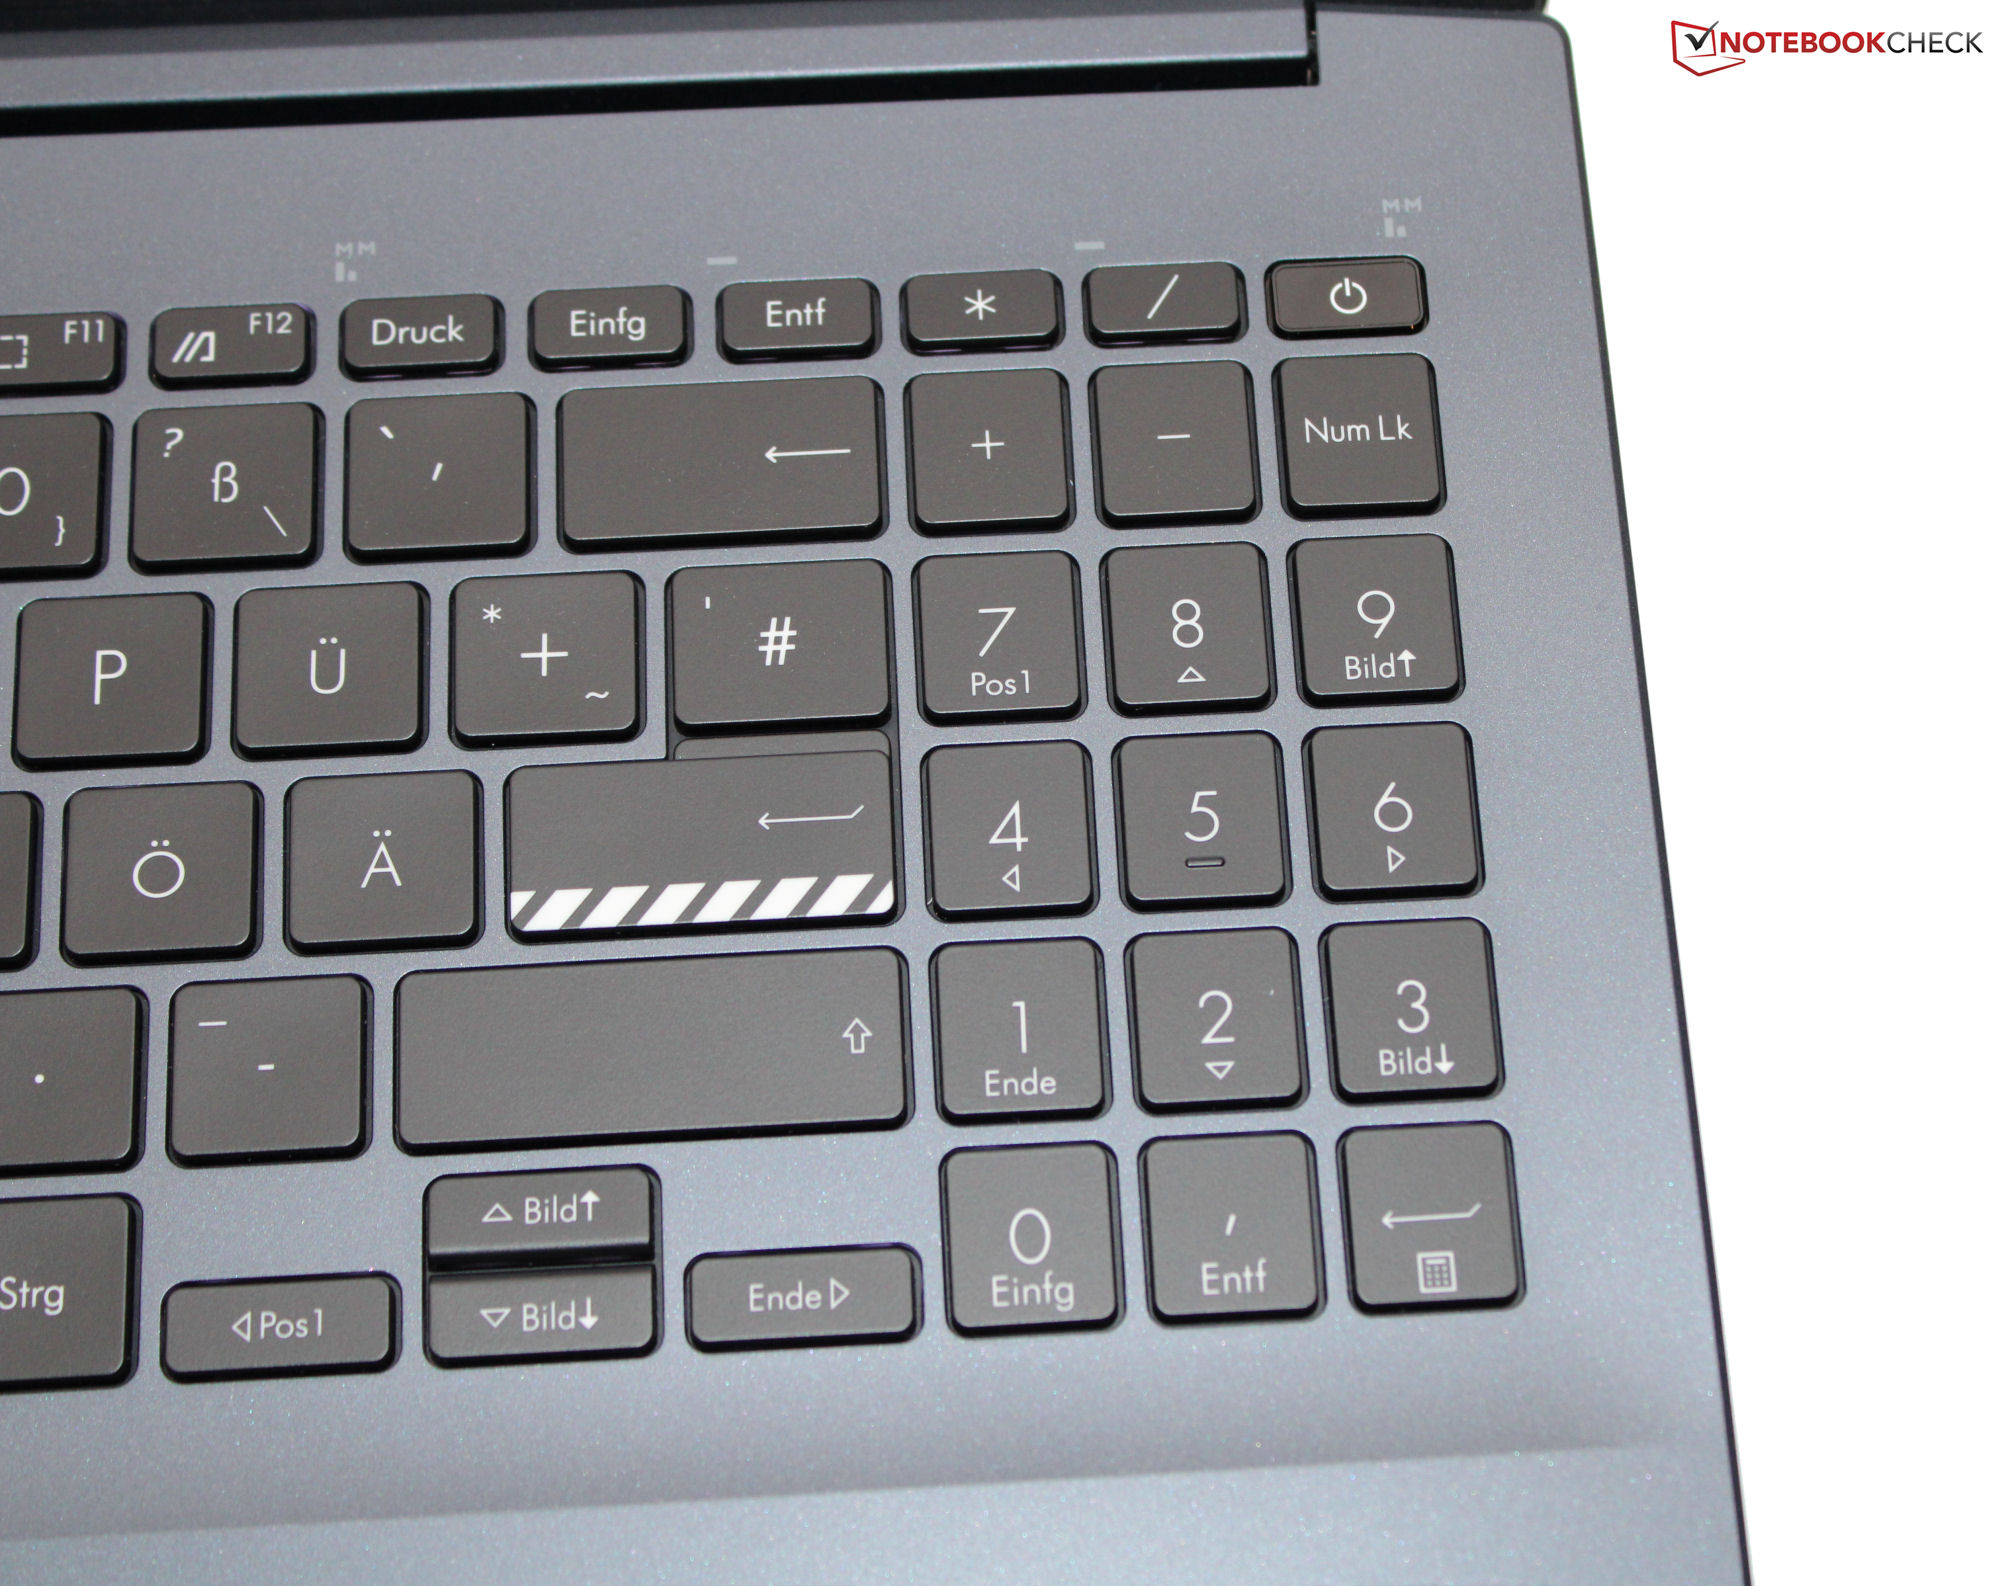
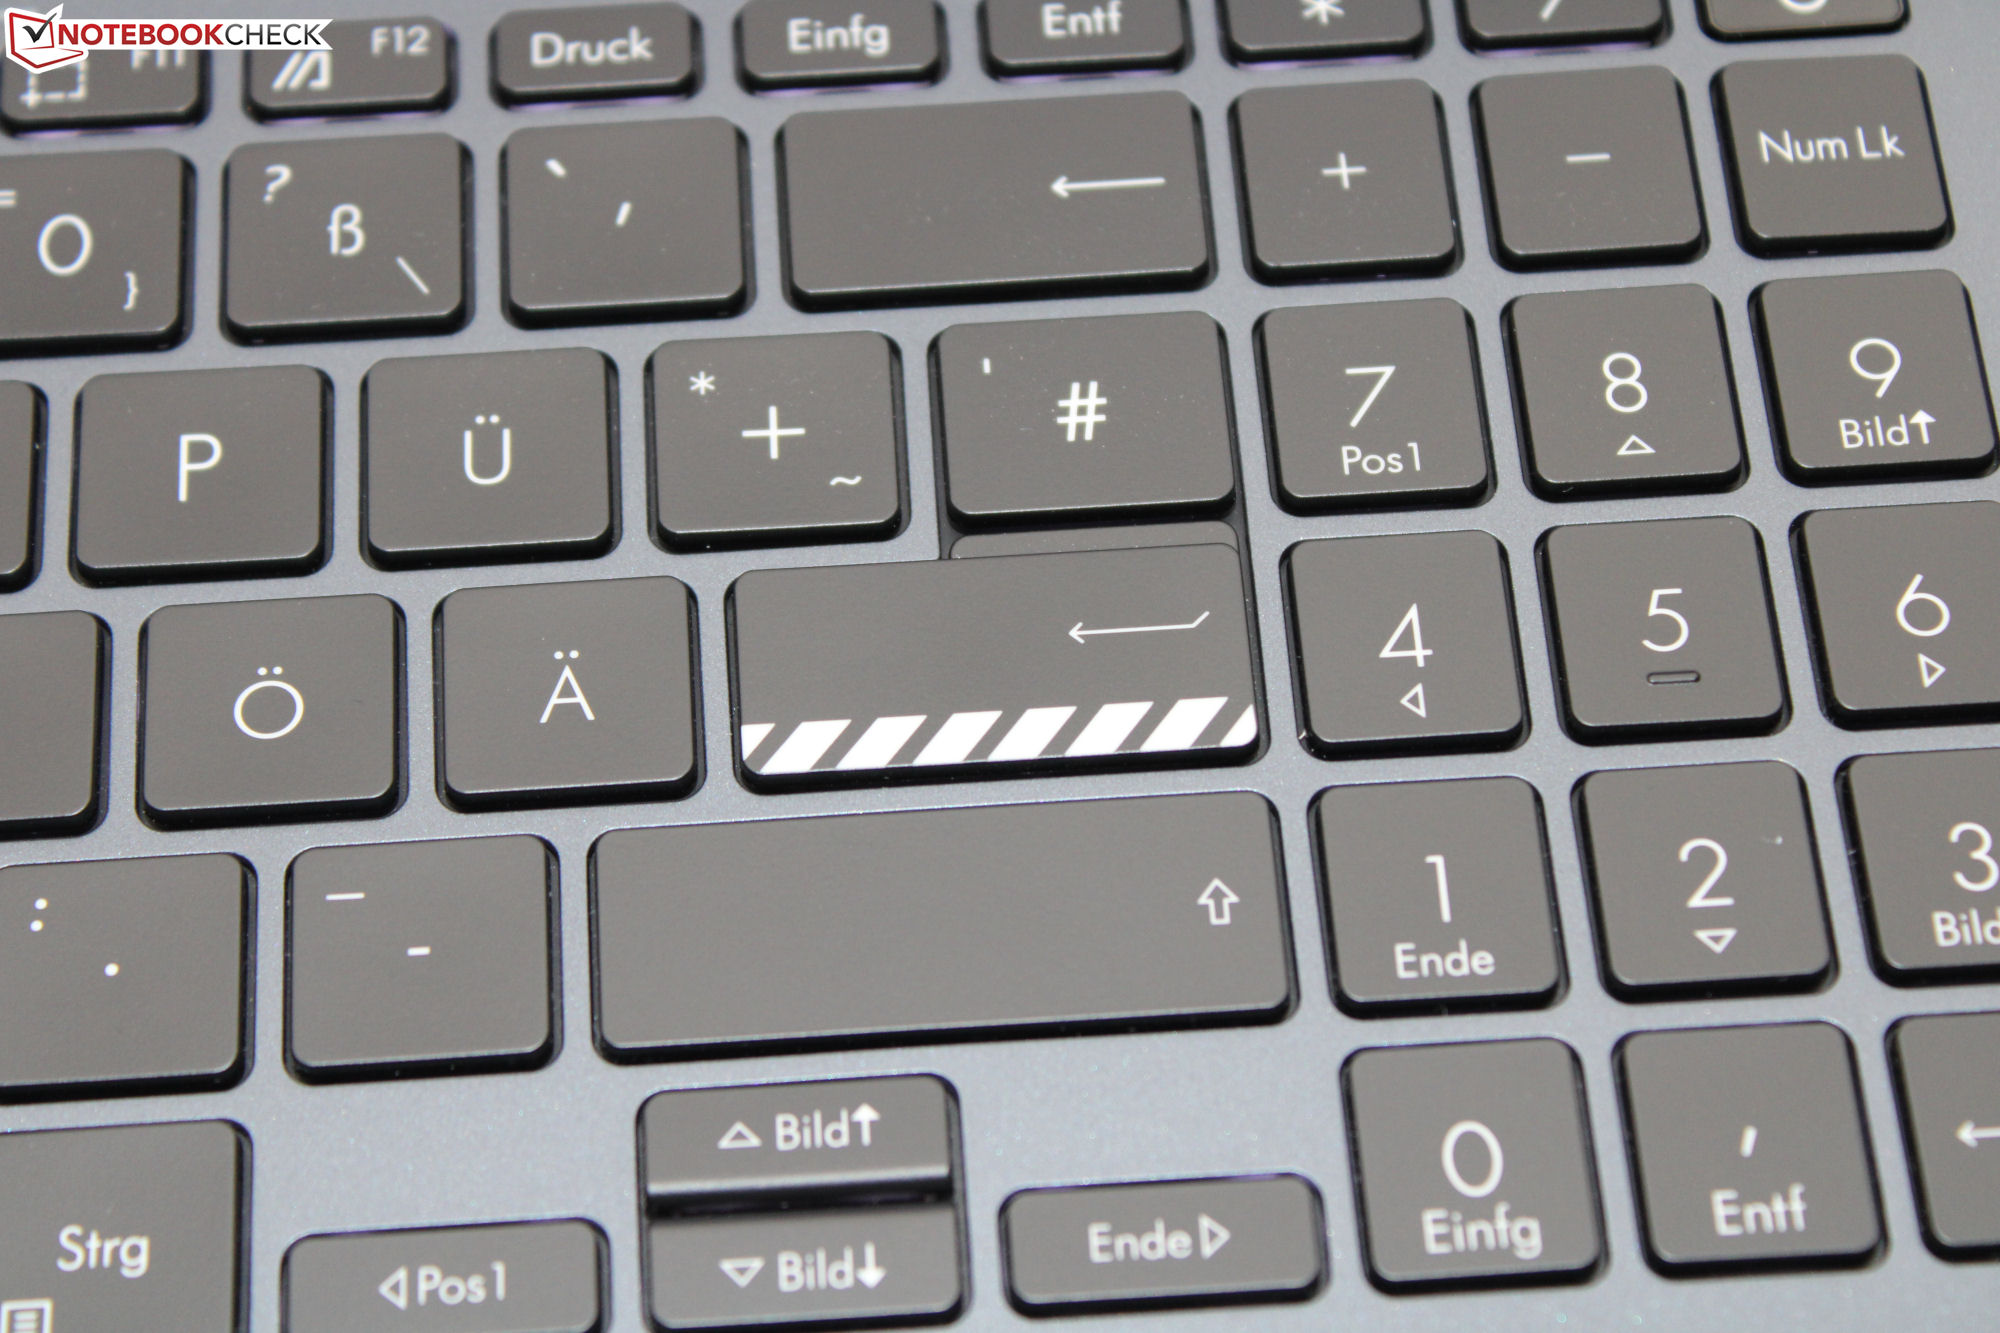
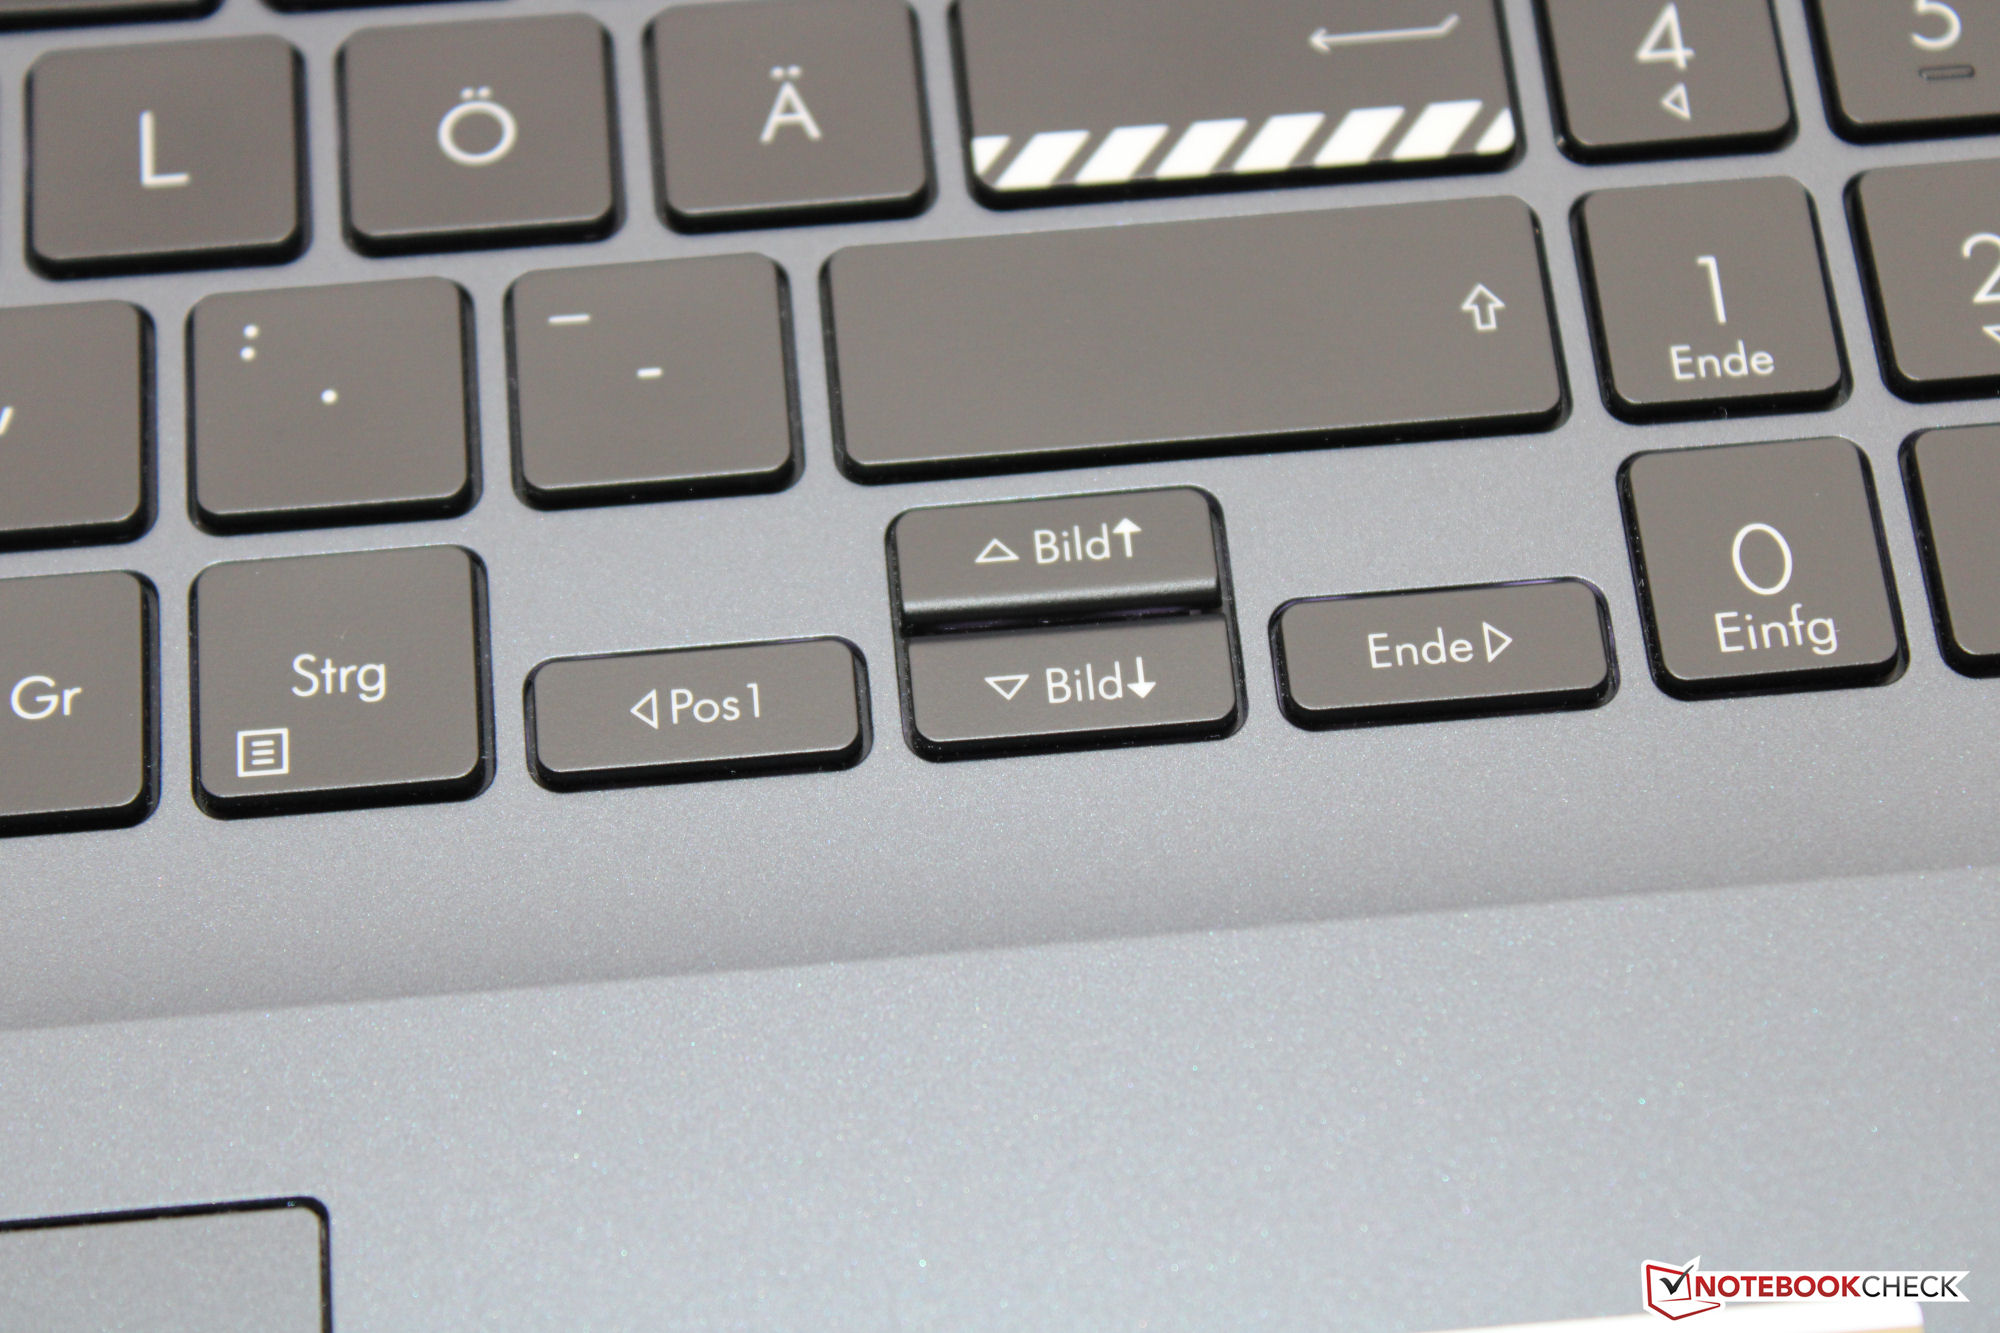
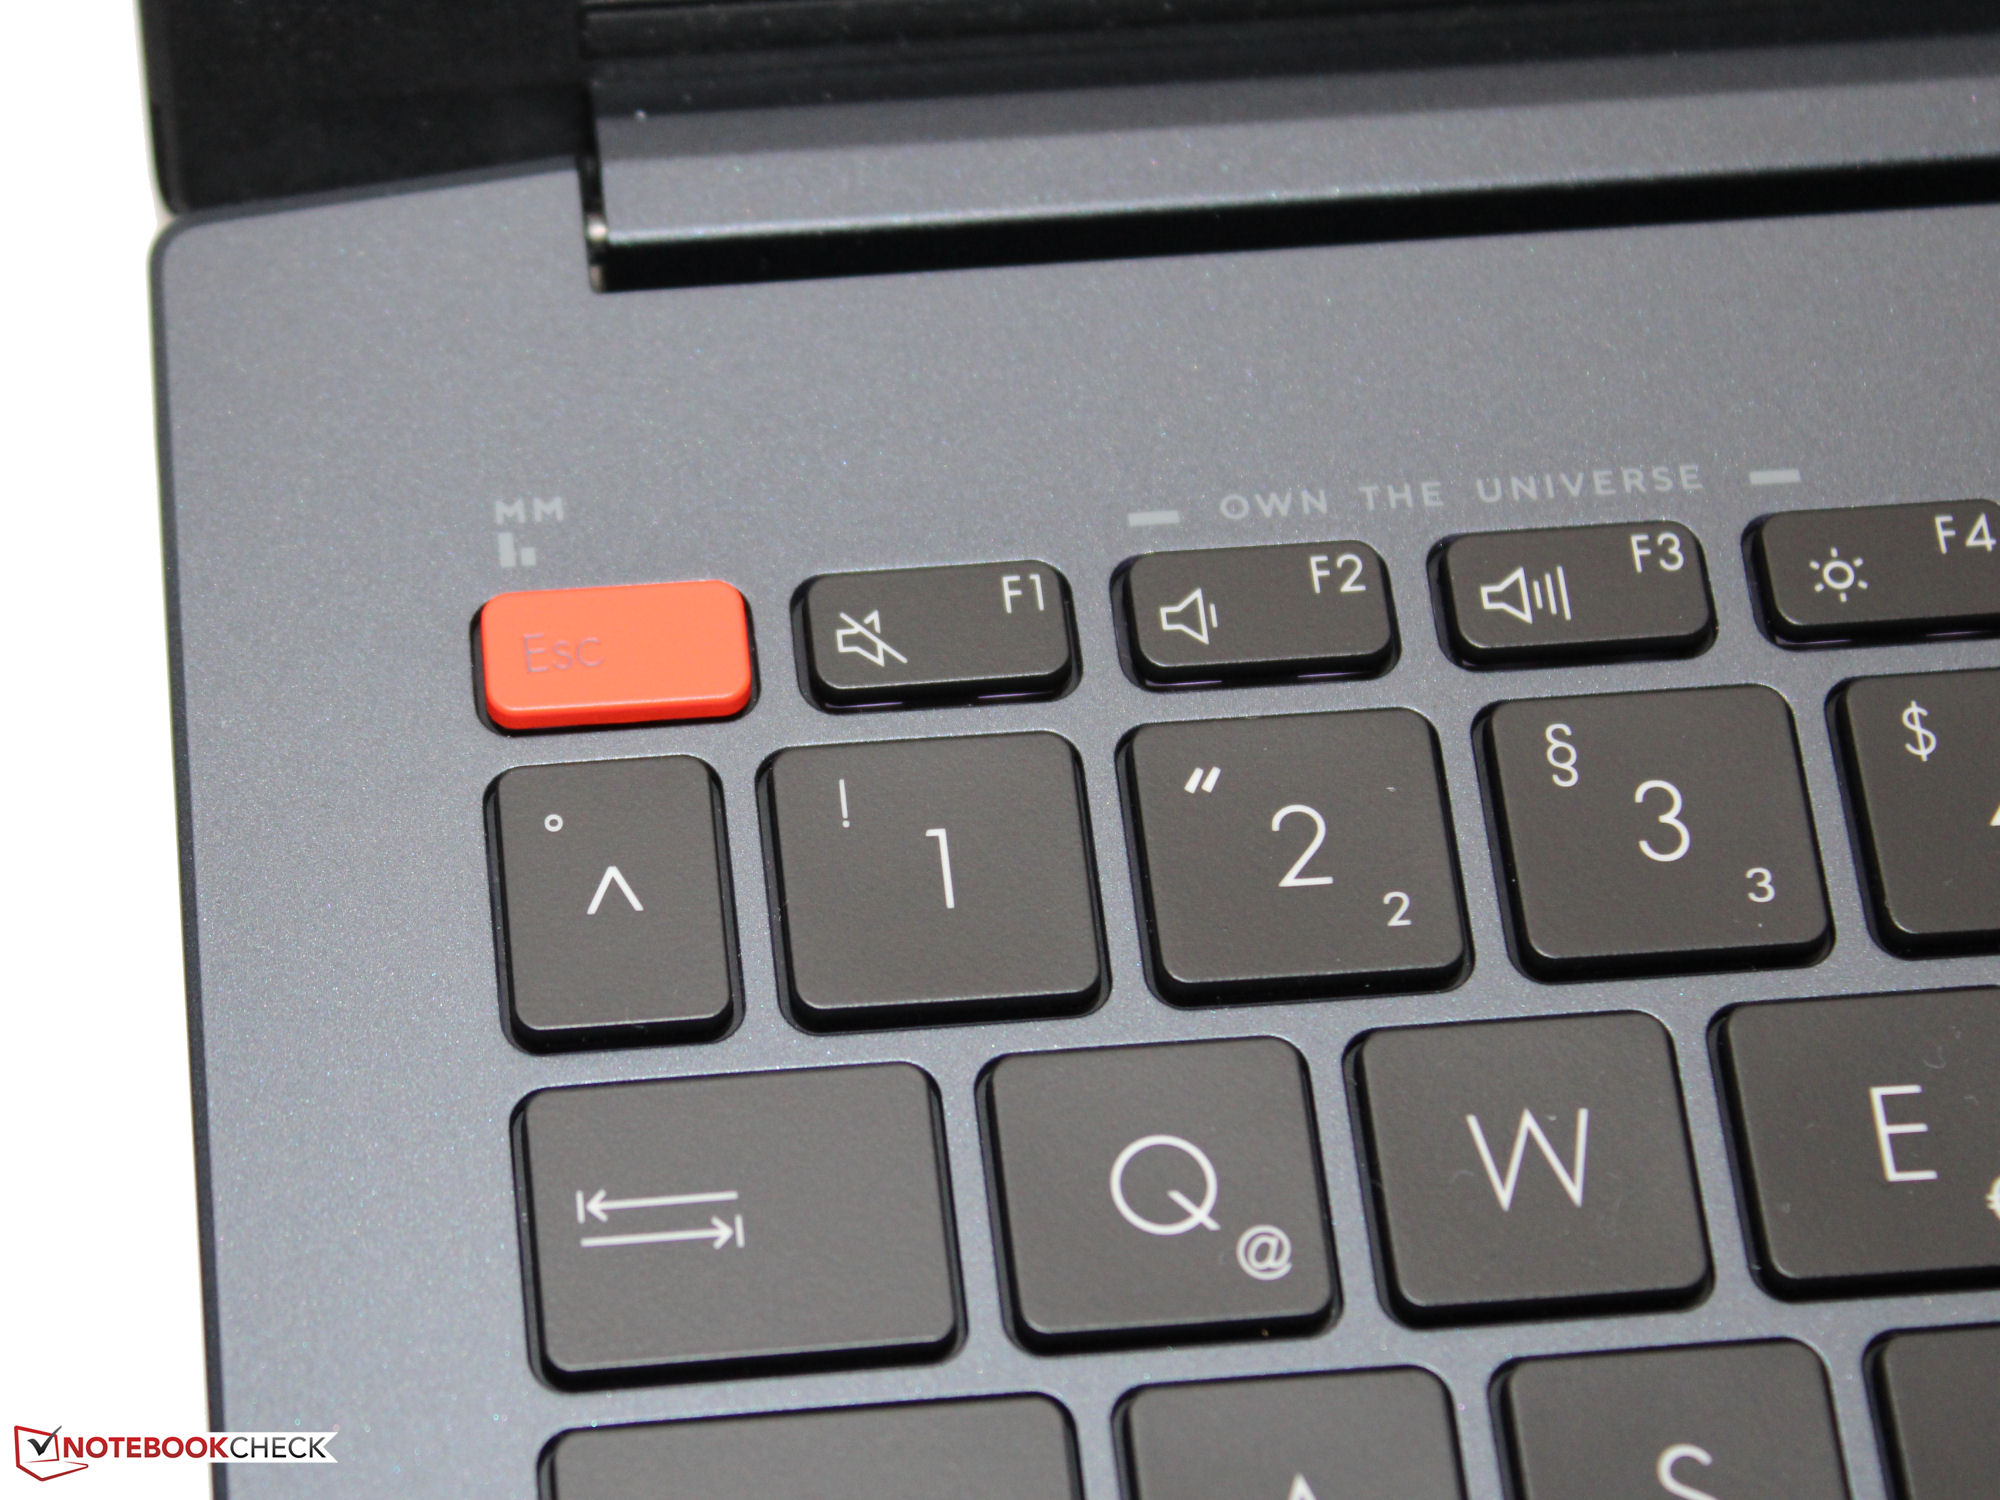
Dispositivos de entrada - O computador Asus com um teclado iluminado
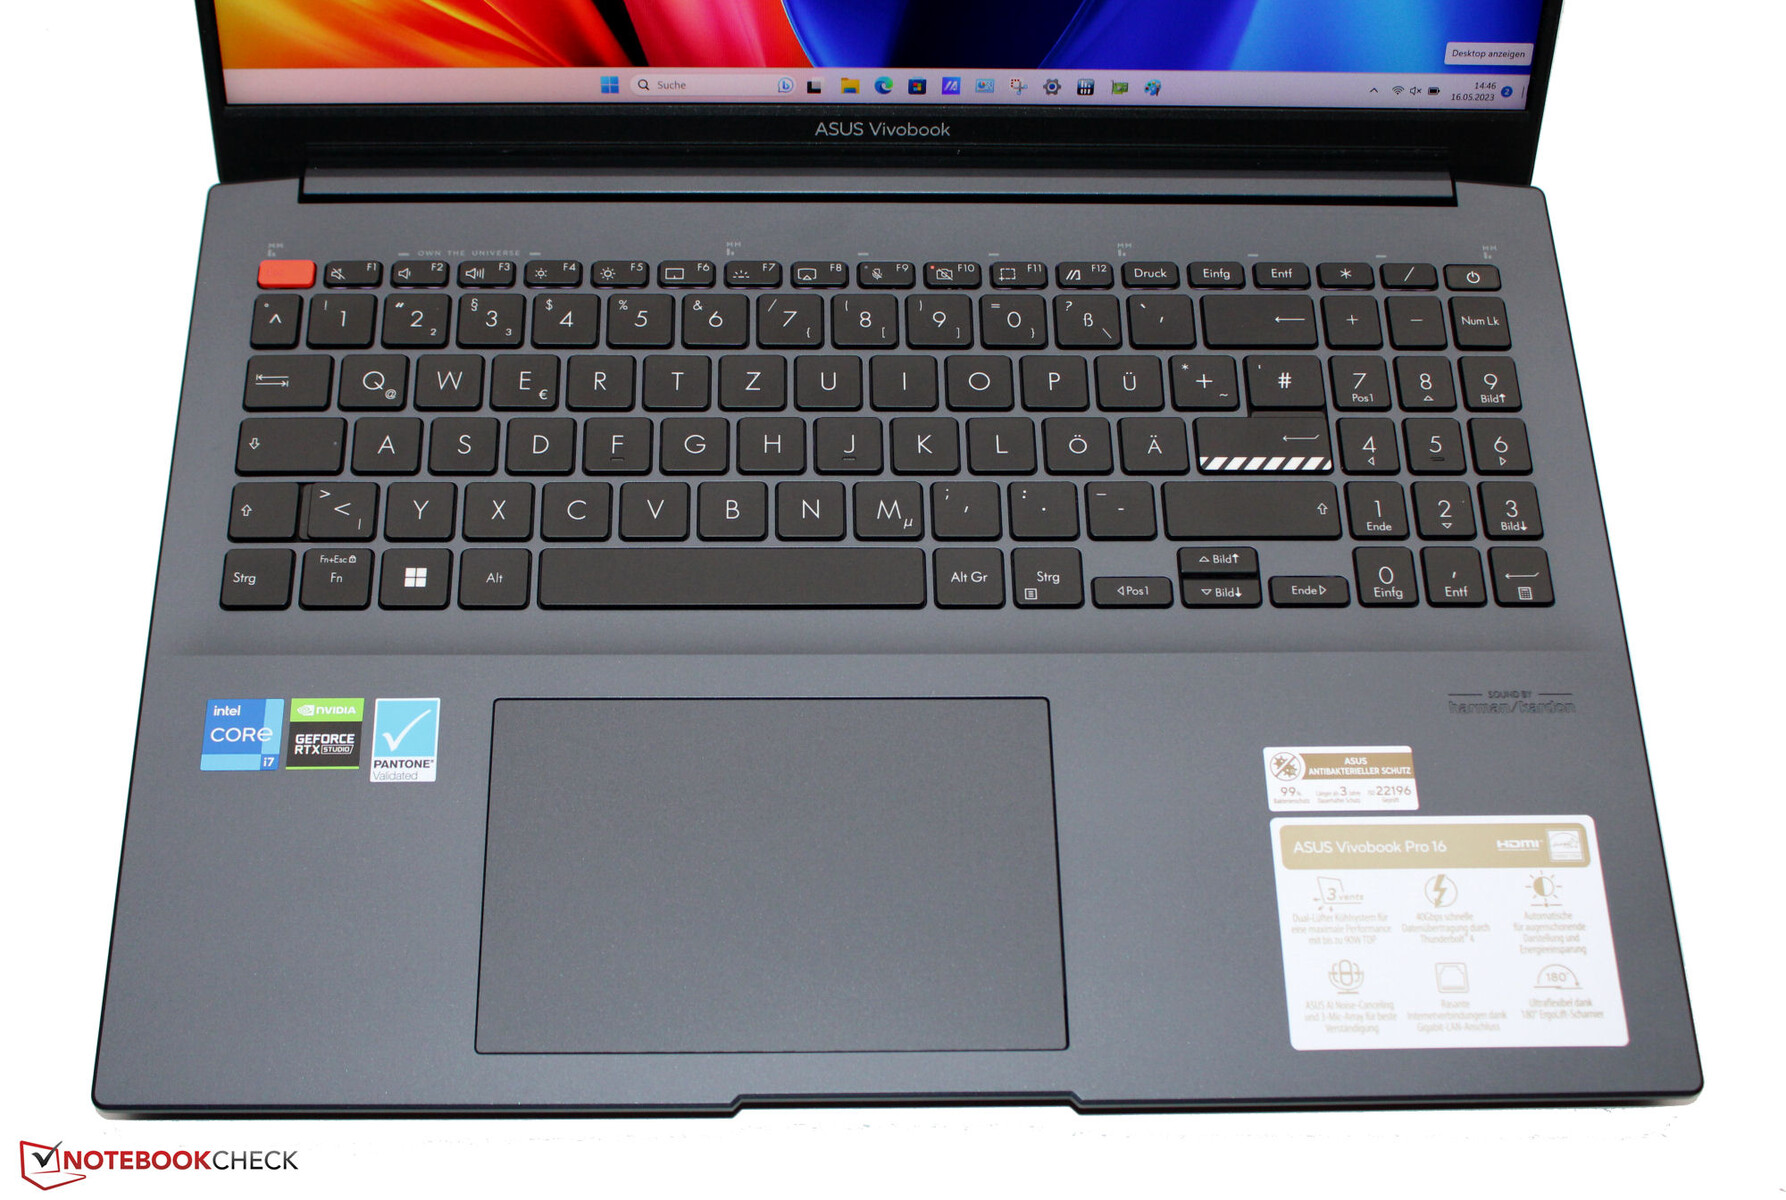
As teclas do teclado chiclet (parcialmente curvas e com três modos de iluminação) têm uma elevação de nível médio e um ponto de pressão claro. Elas têm bons níveis de resistência, mas poderiam ser um pouco mais nítidas. O teclado tem uma leve elasticidade quando você está digitando, o que não é realmente algo negativo. No geral, o teclado do notebook Asus é bom para o uso diário.
Um click pad (13 x 8,5 cm) substitui a necessidade de um mouse e sua superfície lisa faz com que seus dedos deslizem sobre ele confortavelmente. Ele reage aos comandos até as bordas, tem uma elevação mínima e um ponto de pressão claro.
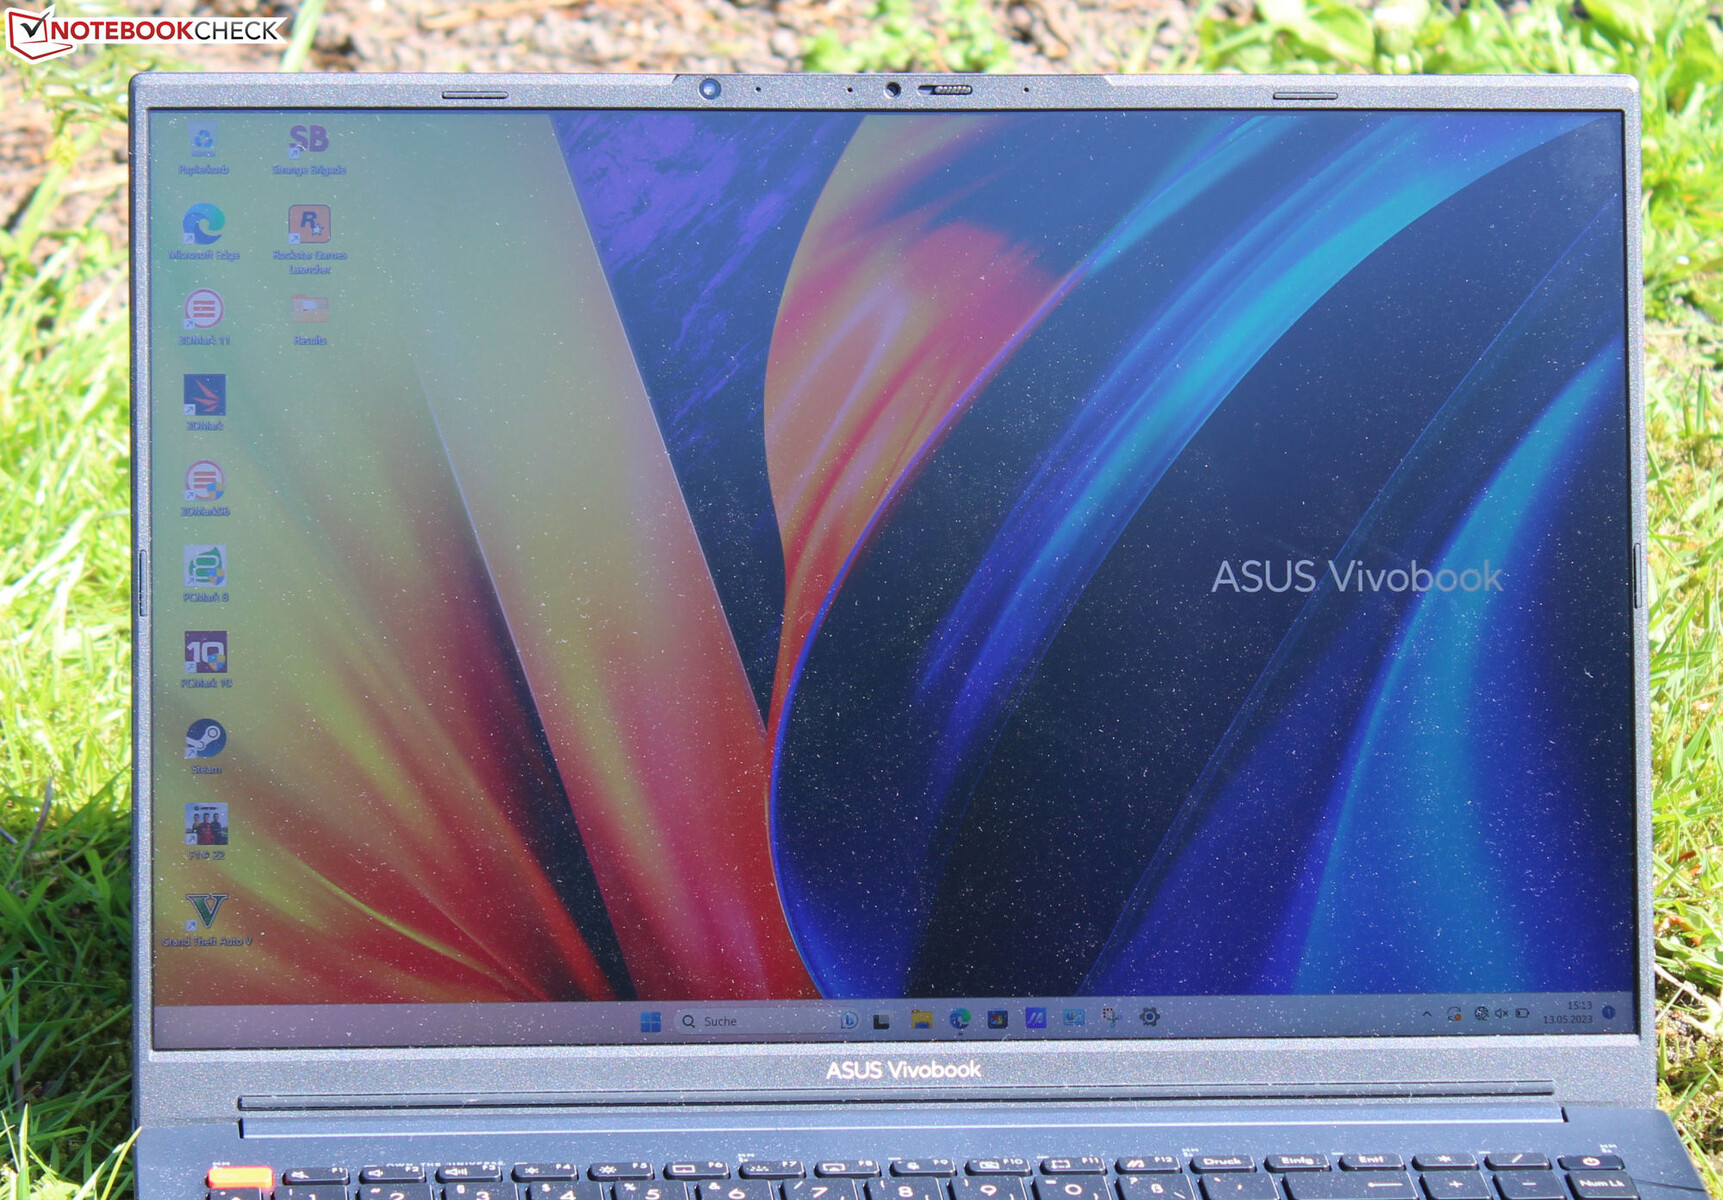
Tela - painel 16:10 com cobertura DCI-P3
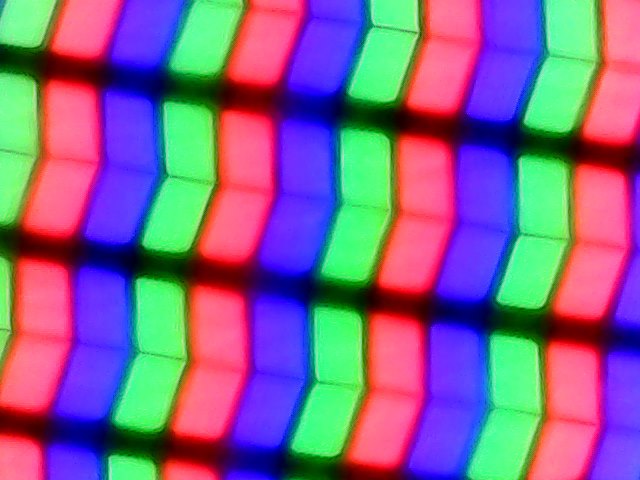
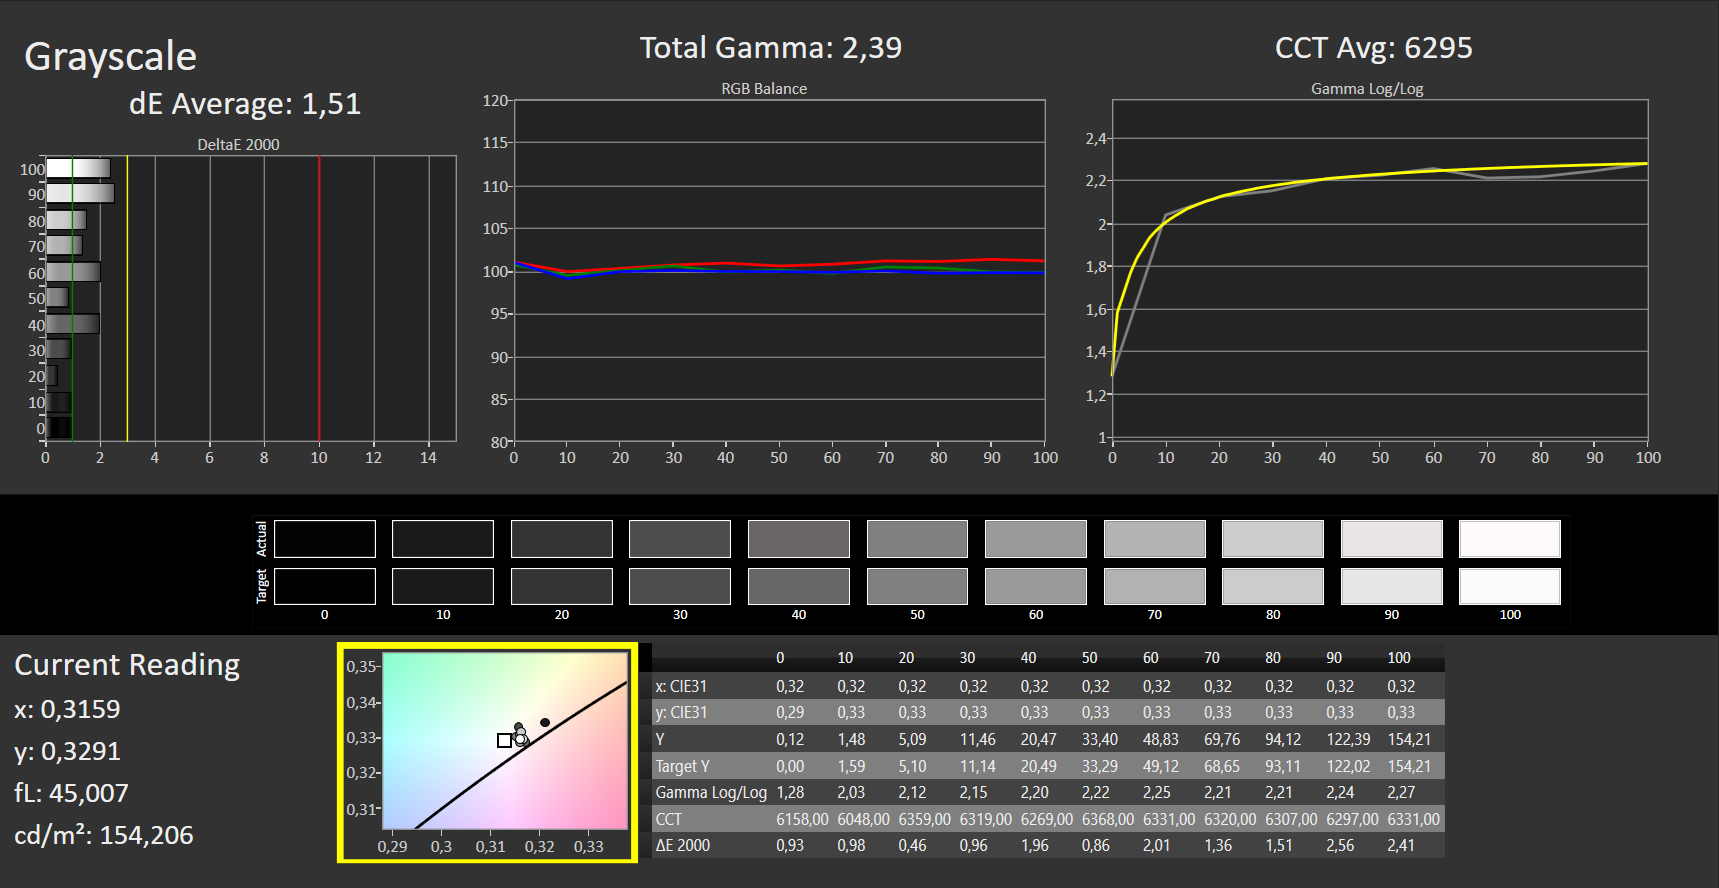
O painel de 120 Hz de reação rápida no formato 16:10 não mostra sinais de oscilação de PWM em todos os níveis de brilho. O brilho e o contraste na tela fosca de 16 polegadas (2.560 x 1.600 pixels) são exatamente como deveriam ser (> 300 cd/m² ou 1.000:1).
| |||||||||||||||||||||||||
iluminação: 87 %
iluminação com acumulador: 509 cd/m²
Contraste: 1440:1 (Preto: 0.35 cd/m²)
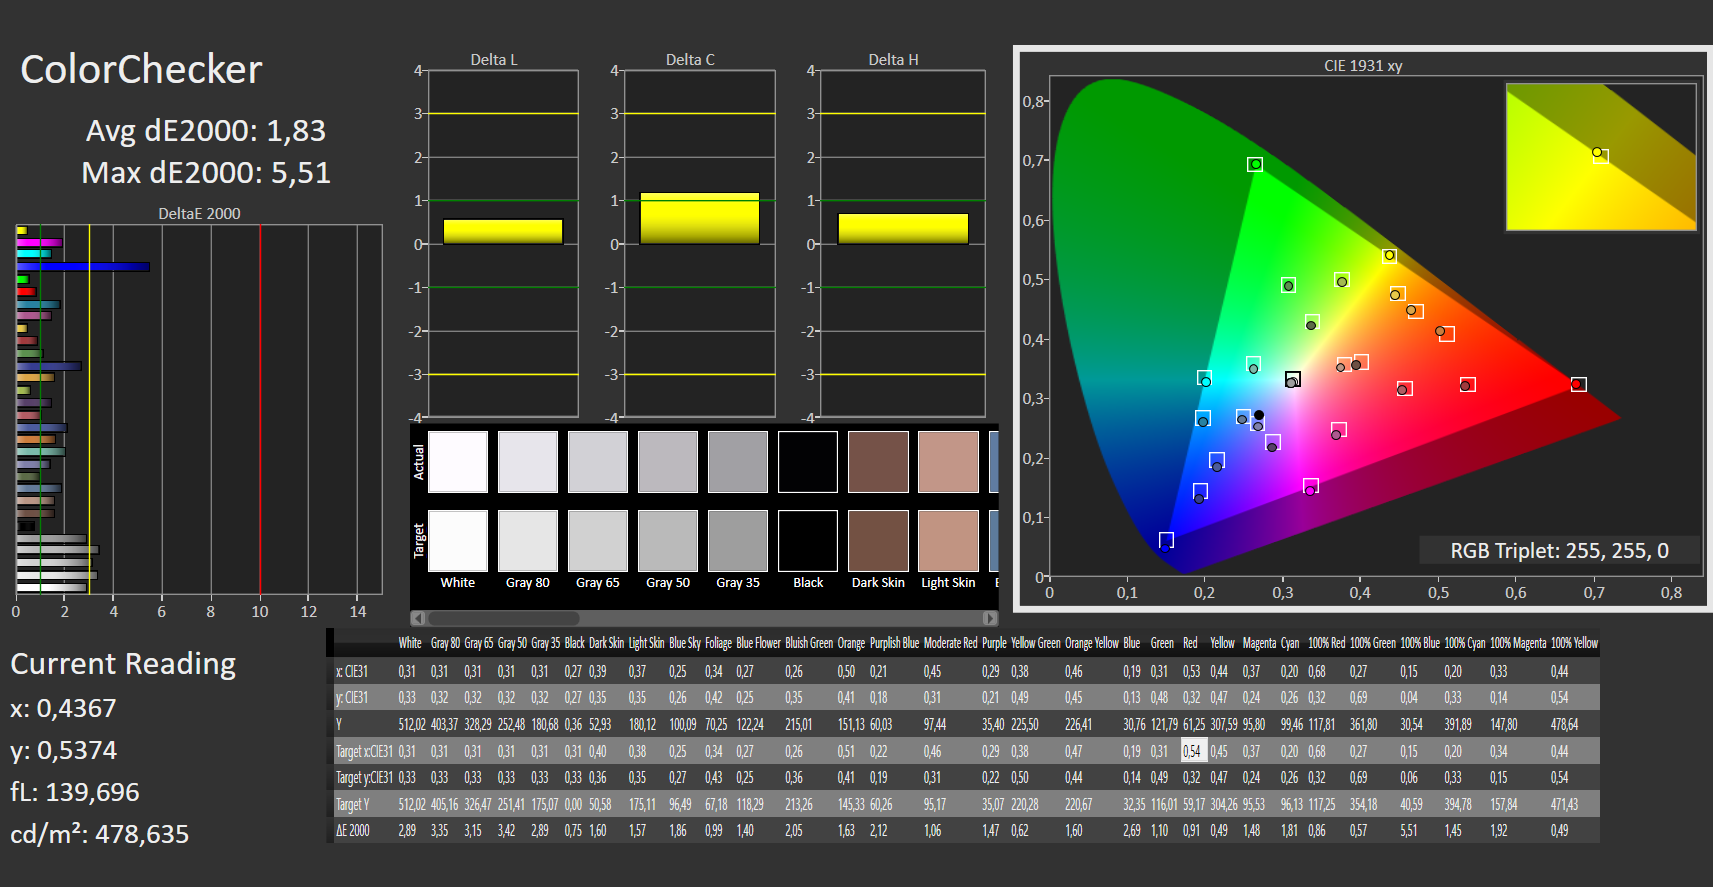
ΔE ColorChecker Calman: 1.83 | ∀{0.5-29.43 Ø4.71}
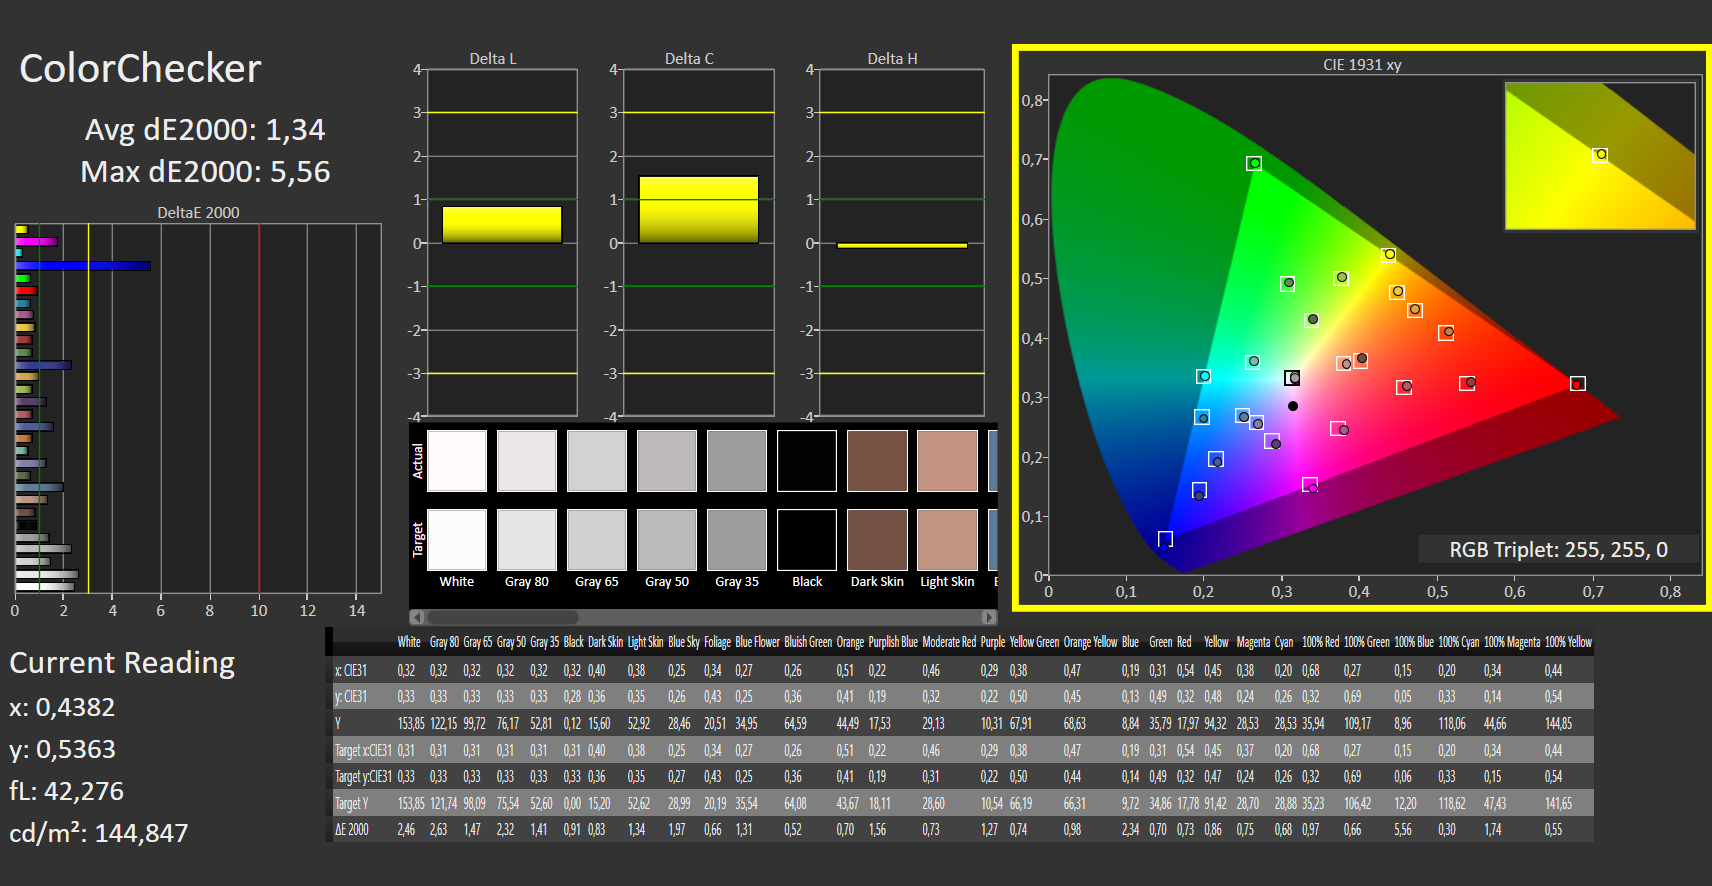
calibrated: 1.34
ΔE Greyscale Calman: 3.02 | ∀{0.09-98 Ø4.96}
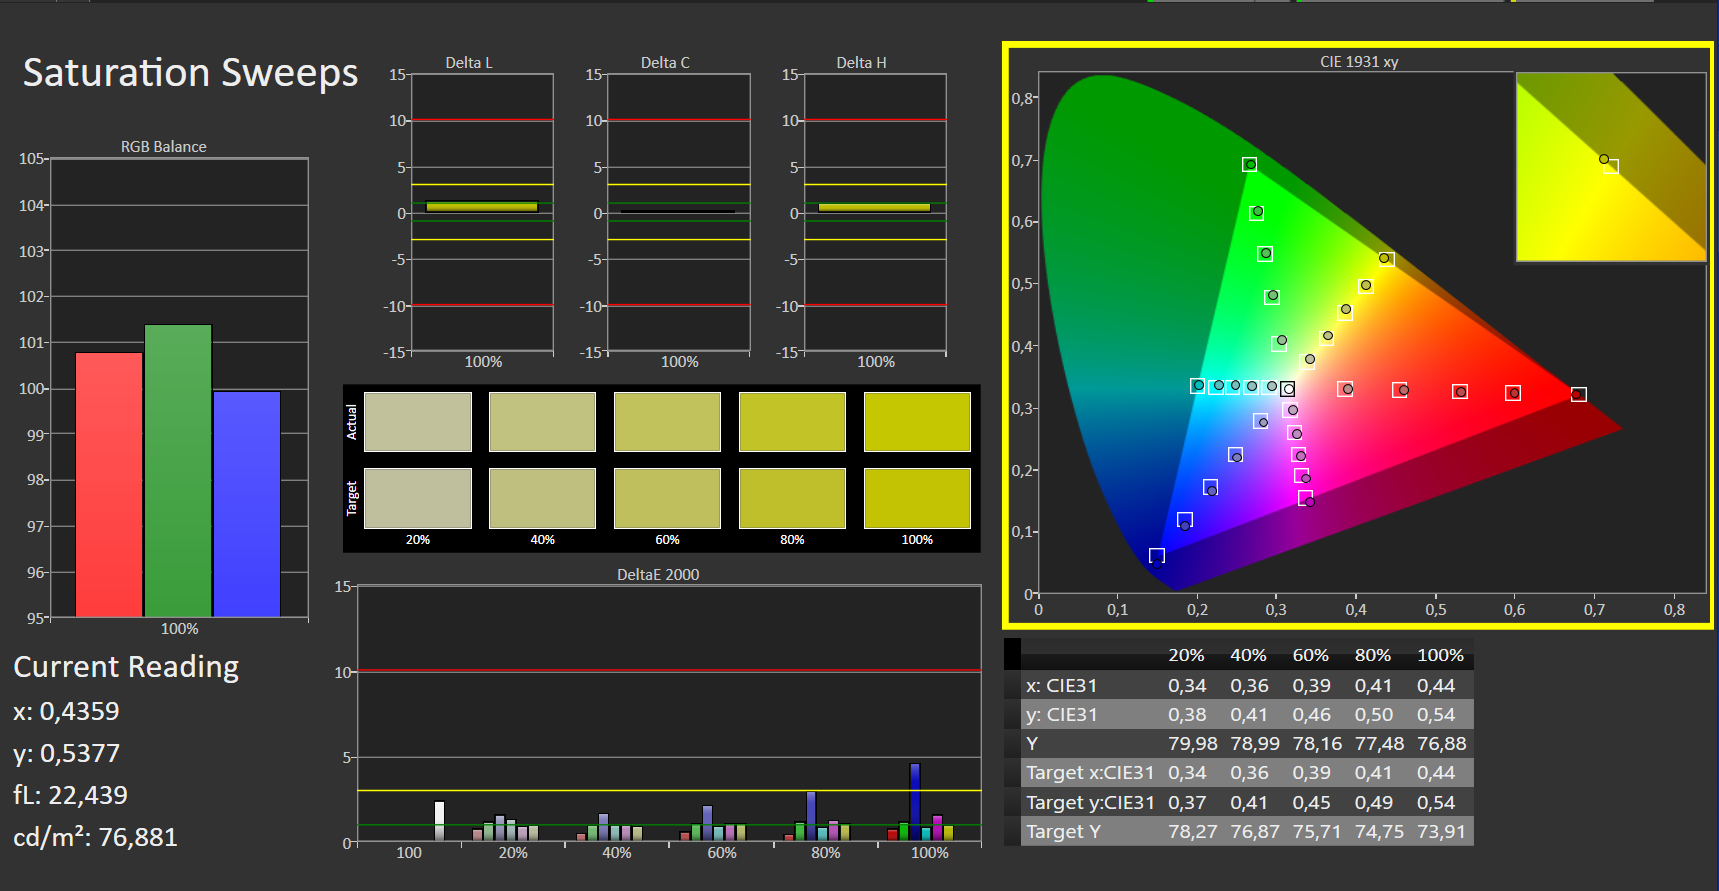
86.1% AdobeRGB 1998 (Argyll 3D)
99.9% sRGB (Argyll 3D)
98.5% Display P3 (Argyll 3D)
Gamma: 2.39
CCT: 6688 K
| Asus VivoBook Pro 16 Au Optronics B160QAN02.L, IPS, 2560x1600, 16" | Dell Inspiron 16 Plus 7620 BOE NE16N41, IPS, 3072x1920, 16" | Schenker XMG Fusion 15 (Mid 22) BOE CQ NE156QHM-NY2, IPS, 2560x1440, 15.6" | Acer Swift X SFX16-52G-77RX B160QAN02.M, IPS-LED, 2560x1600, 16" | |
|---|---|---|---|---|
| Display | -14% | -19% | -11% | |
| Display P3 Coverage (%) | 98.5 | 70.8 -28% | 67.3 -32% | 76.4 -22% |
| sRGB Coverage (%) | 99.9 | 99.5 0% | 96.7 -3% | 100 0% |
| AdobeRGB 1998 Coverage (%) | 86.1 | 73.2 -15% | 68.2 -21% | 76.6 -11% |
| Response Times | -1025% | -234% | -819% | |
| Response Time Grey 50% / Grey 80% * (ms) | 2 ? | 38 ? -1800% | 11.6 ? -480% | 33 ? -1550% |
| Response Time Black / White * (ms) | 8 ? | 28 ? -250% | 7 ? 12% | 15 ? -88% |
| PWM Frequency (Hz) | ||||
| Screen | 7% | -32% | -4% | |
| Brightness middle (cd/m²) | 504 | 288.9 -43% | 326 -35% | 411 -18% |
| Brightness (cd/m²) | 465 | 276 -41% | 303 -35% | 378 -19% |
| Brightness Distribution (%) | 87 | 92 6% | 89 2% | 83 -5% |
| Black Level * (cd/m²) | 0.35 | 0.26 26% | 0.33 6% | 0.29 17% |
| Contrast (:1) | 1440 | 1111 -23% | 988 -31% | 1417 -2% |
| Colorchecker dE 2000 * | 1.83 | 1.88 -3% | 2.73 -49% | 2.18 -19% |
| Colorchecker dE 2000 max. * | 5.51 | 4.37 21% | 9.54 -73% | 4.84 12% |
| Colorchecker dE 2000 calibrated * | 1.34 | 0.42 69% | 1.36 -1% | 1.48 -10% |
| Greyscale dE 2000 * | 3.02 | 1.4 54% | 5.2 -72% | 2.68 11% |
| Gamma | 2.39 92% | 2.3 96% | 2.074 106% | 2.43 91% |
| CCT | 6688 97% | 6634 98% | 6911 94% | 6717 97% |
| Média Total (Programa/Configurações) | -344% /
-145% | -95% /
-58% | -278% /
-122% |
* ... menor é melhor
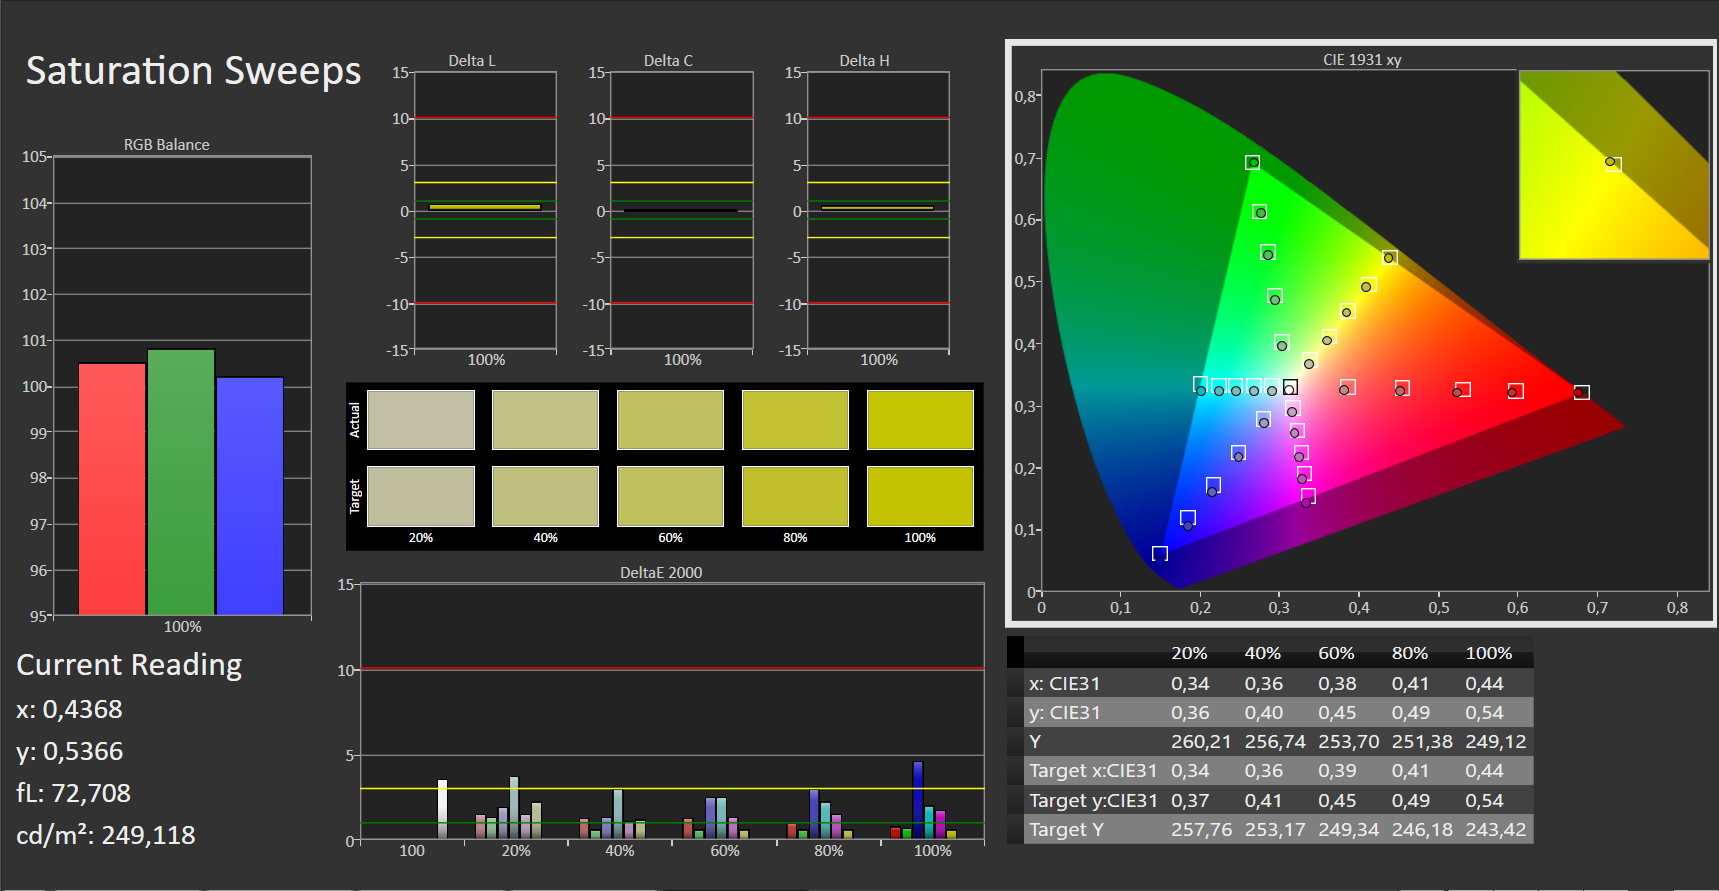
A certificação X Rite Pantone da tela significa que ela tem uma representação de cores muito natural: Com desvios de cerca de 1,8, ela oferece resultados aceitáveis (DeltaE < 3) assim que sai da caixa. A calibração leva a um desvio menor de 1,3 e a tons de cinza mais equilibrados. A precisão das cores não é problema: o painel pode representar todo o espaço de cores DCI P3 e 86% do espaço Adobe RGB.

Exibir tempos de resposta
| ↔ Tempo de resposta preto para branco | ||
|---|---|---|
| 8 ms ... ascensão ↗ e queda ↘ combinadas | ↗ 1 ms ascensão |  |
| ↘ 7 ms queda | ||
| A tela mostra taxas de resposta rápidas em nossos testes e deve ser adequada para jogos. Em comparação, todos os dispositivos testados variam de 0.1 (mínimo) a 240 (máximo) ms. » 22 % de todos os dispositivos são melhores. Isso significa que o tempo de resposta medido é melhor que a média de todos os dispositivos testados (19.8 ms). | ||
| ↔ Tempo de resposta 50% cinza a 80% cinza | ||
| 2 ms ... ascensão ↗ e queda ↘ combinadas | ↗ 1 ms ascensão |  |
| ↘ 1 ms queda | ||
| A tela mostra taxas de resposta muito rápidas em nossos testes e deve ser muito adequada para jogos em ritmo acelerado. Em comparação, todos os dispositivos testados variam de 0.165 (mínimo) a 636 (máximo) ms. » 10 % de todos os dispositivos são melhores. Isso significa que o tempo de resposta medido é melhor que a média de todos os dispositivos testados (31 ms). | ||
Cintilação da tela / PWM (modulação por largura de pulso)
| Tela tremeluzindo / PWM não detectado |     | ||
[pwm_comparison] Em comparação: 52 % de todos os dispositivos testados não usam PWM para escurecer a tela. Se PWM foi detectado, uma média de 7757 (mínimo: 5 - máximo: 343500) Hz foi medida. | |||
Seu painel IPS estável com ângulo de visão pode ser lido facilmente de qualquer ângulo. Em ambientes externos, a tela geralmente permanece legível, desde que o sol não esteja brilhando muito forte.
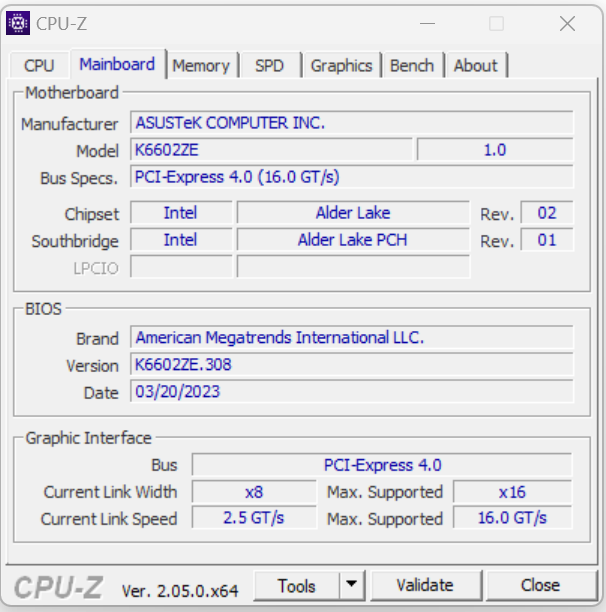
Desempenho - Alder Lake e Ampere
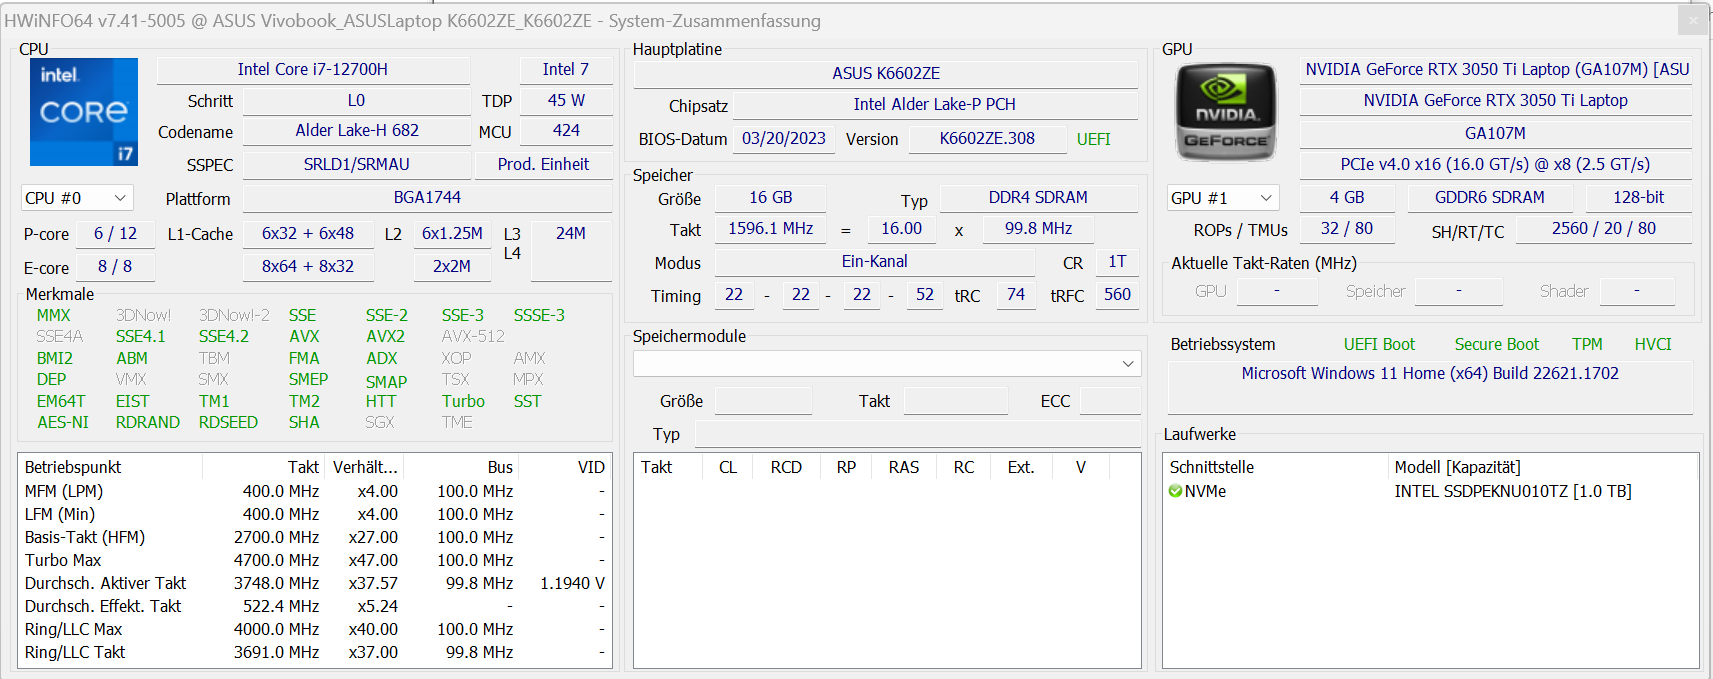
A série VivoBook Pro 16 consiste em 5 faixas de modelos (consulte número do modelo) que são baseadas em diferentes gerações de CPU e GPU. O atual modelo K6602ZE usa CPUs Alder Lake e umaGeForce-RTX-3050-TgPU. O MRSP do nosso dispositivo de teste é de US$ 1.247. Outras variantes não estavam disponíveis no momento do teste.
Condições de teste
É possível alternar entre três modos de resfriamento específicos do fabricante (consulte a tabela) usando a combinação de teclas "Fn" + "F". Usamos o "modo padrão" (benchmarks) e o "modo silencioso" (teste de bateria).
| Modo de desempenho | Modo padrão | Modo sussurro | |
|---|---|---|---|
| Limite de potência 1 (HWInfo) | 80 watts | 50 watts | 28 watts |
| Limite de potência 2 (HWInfo) | 120 watts | 120 watts | 120 watts |
| TGP (Witcher 3) | 65 watts | 50 watts | 25 watts |
Processador
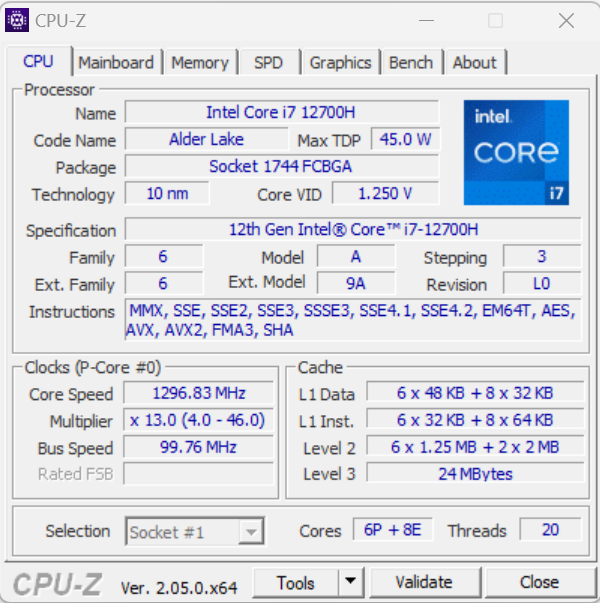
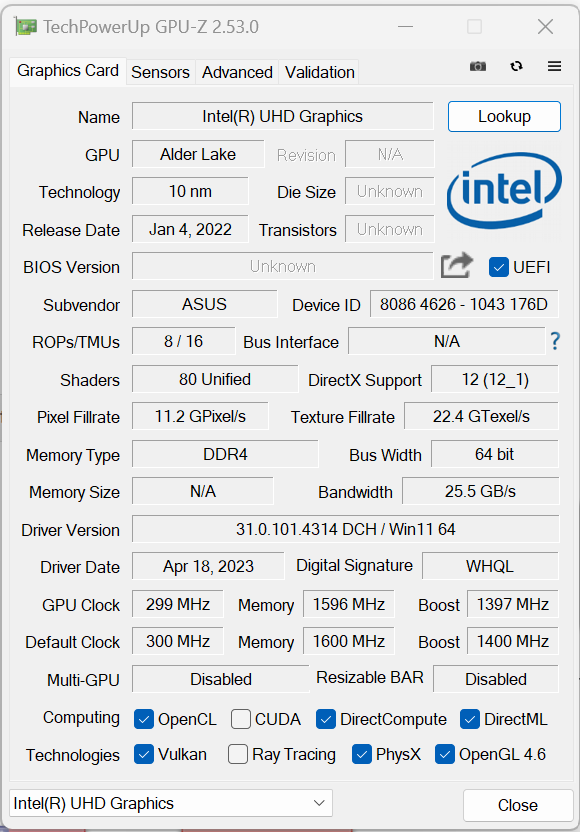
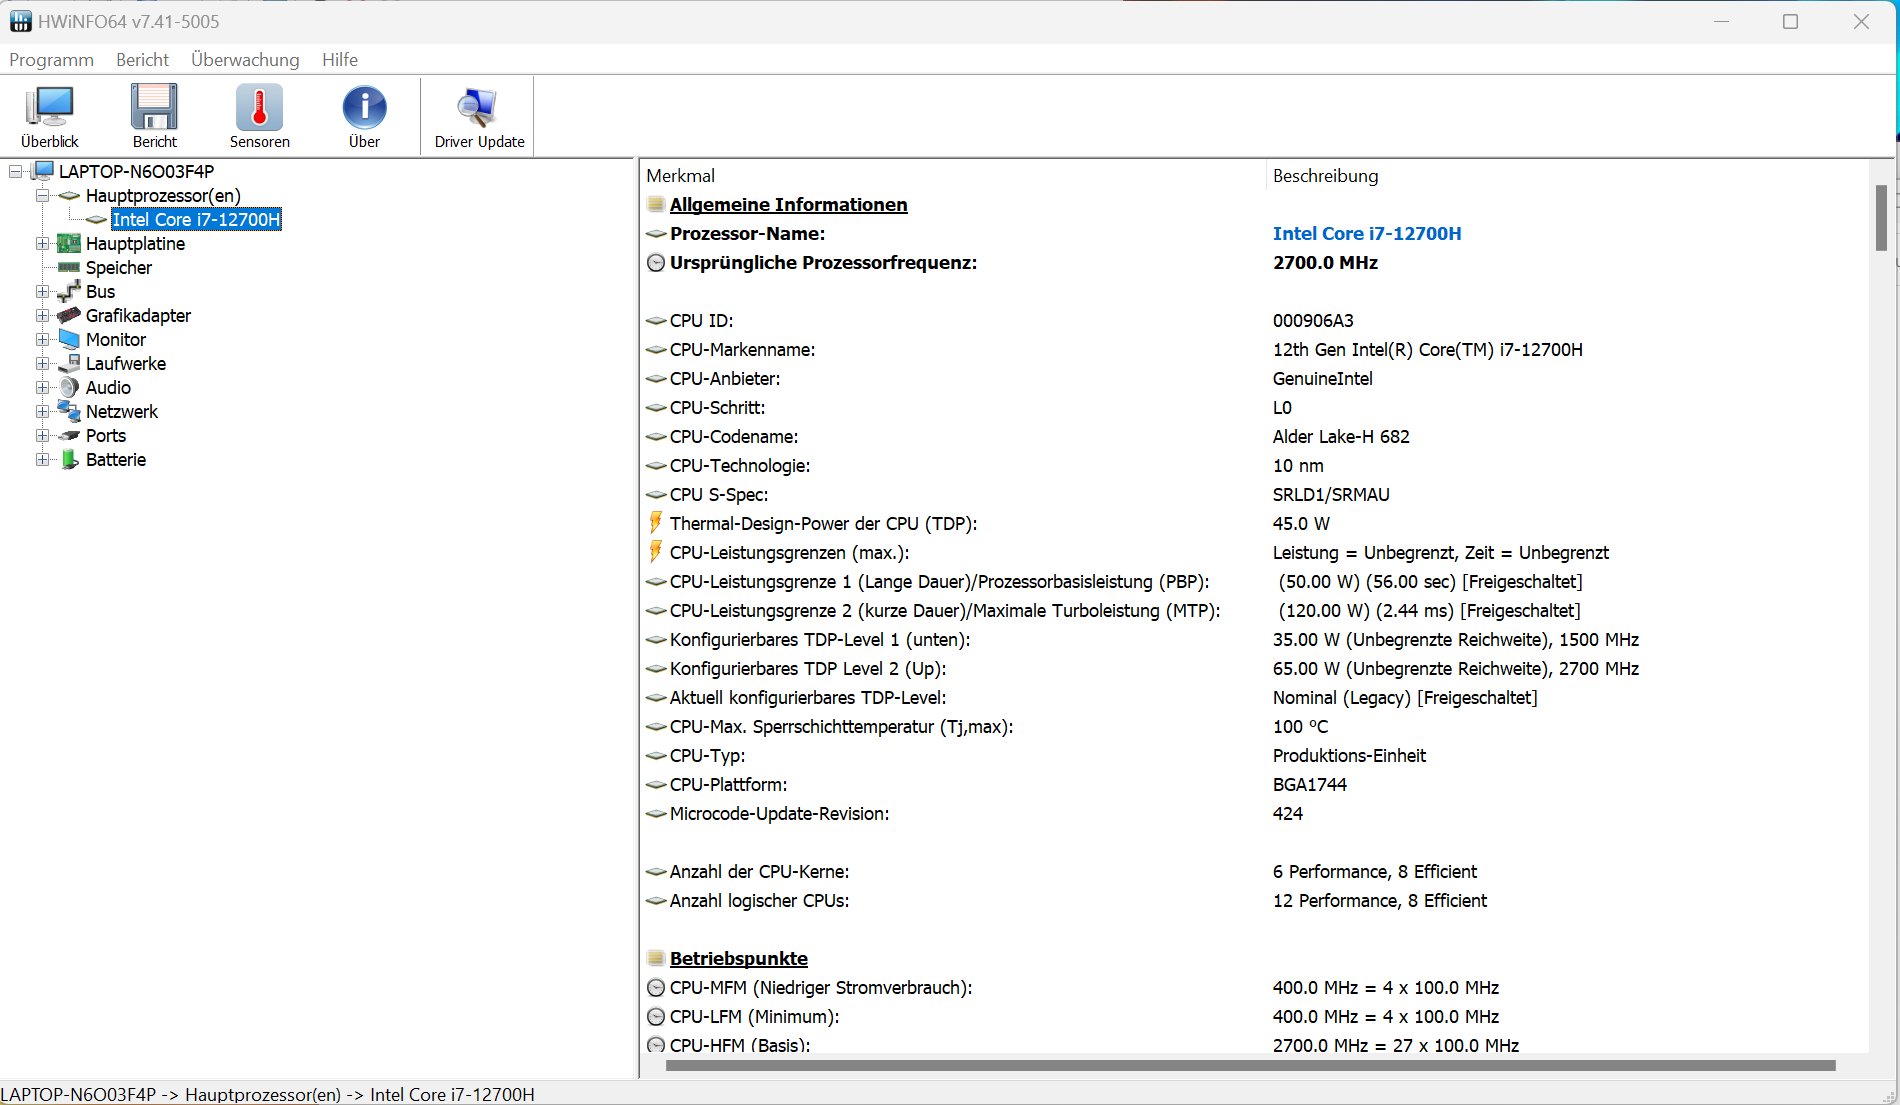
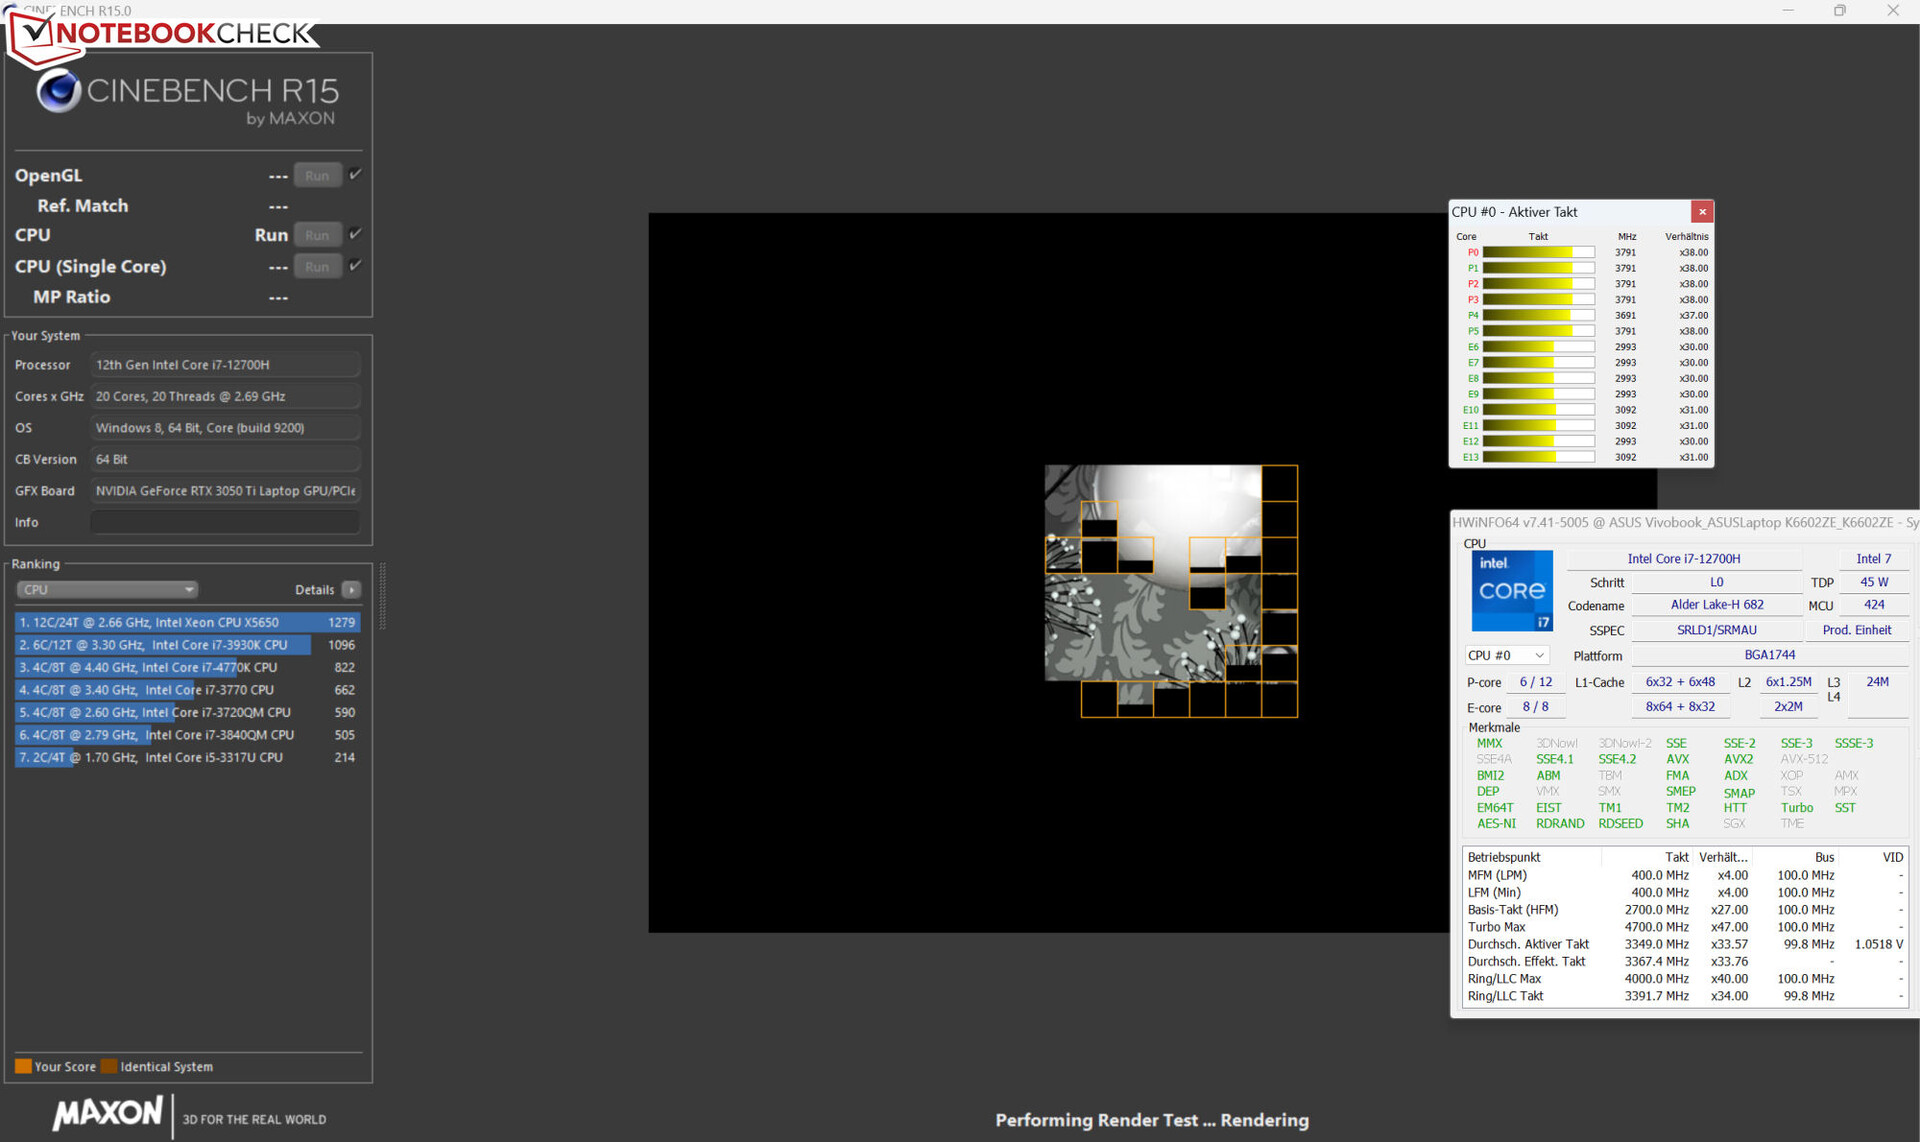
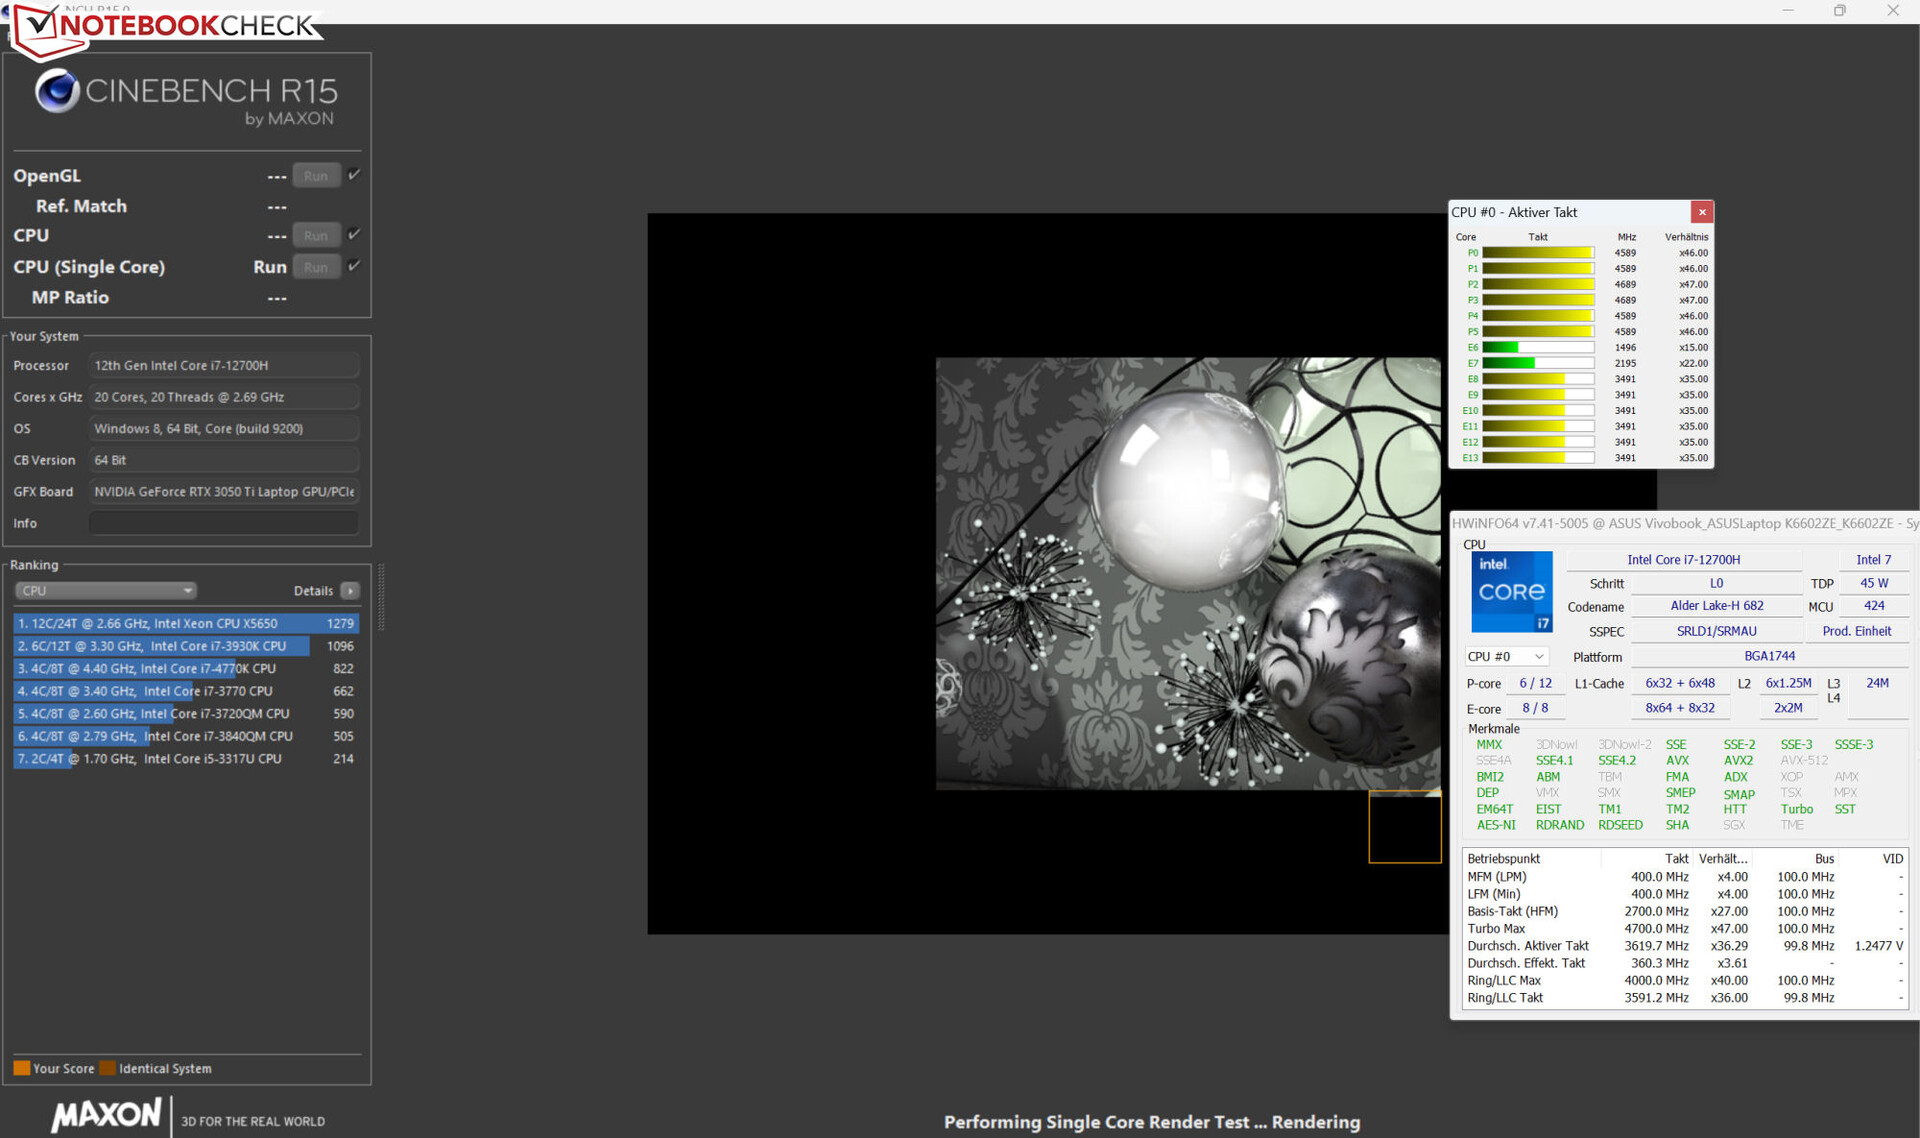
O processador do laptopCore-i7-12700H(Alder Lake) do laptop consiste em 6 núcleos de desempenho (hyper threading, 2,4 - 4,7 GHz) e 8 núcleos de eficiência (sem hyper threading, 1,8 - 3,5 GHz). No total, isso soma 20 núcleos lógicos de CPU.
Medimos os melhores resultados de benchmark usando o "modo de desempenho" ativado, embora a distância para o "modo padrão" tenha sido mínima. De qualquer forma, esses valores estão abaixo da média da CPU. No modo de bateria, seu desempenho de thread único (127 pontos) foi reduzido em maior grau do que seu desempenho de thread múltiplo (1.695 pontos).
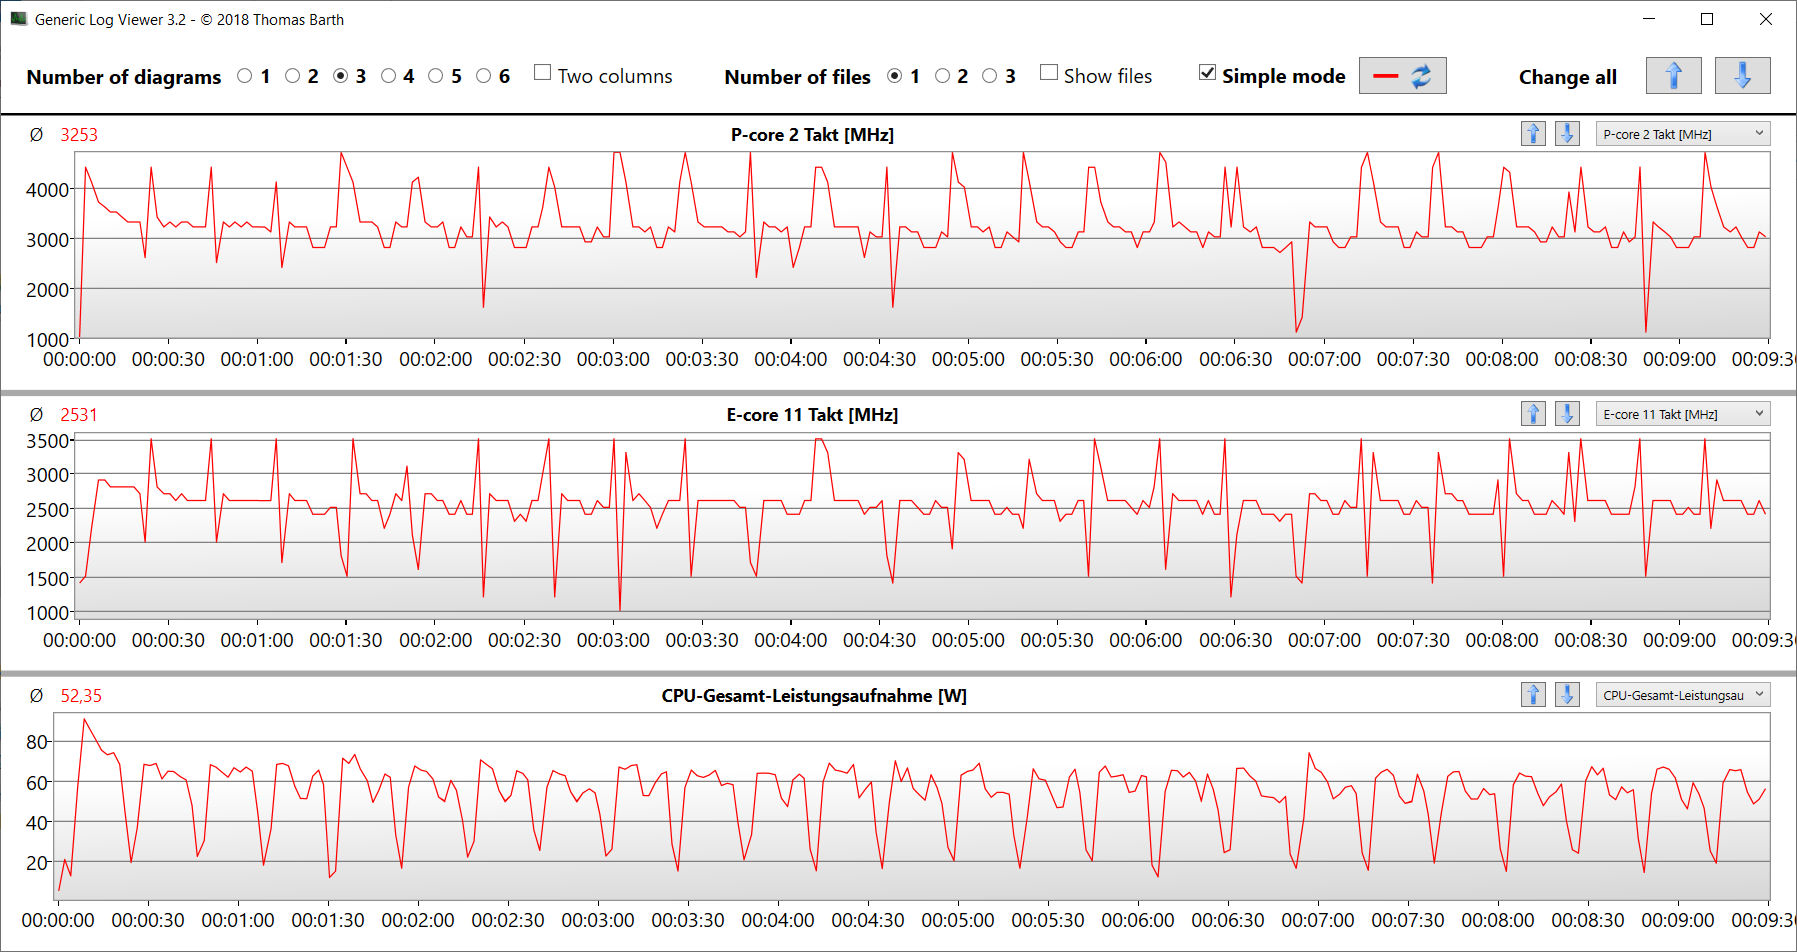
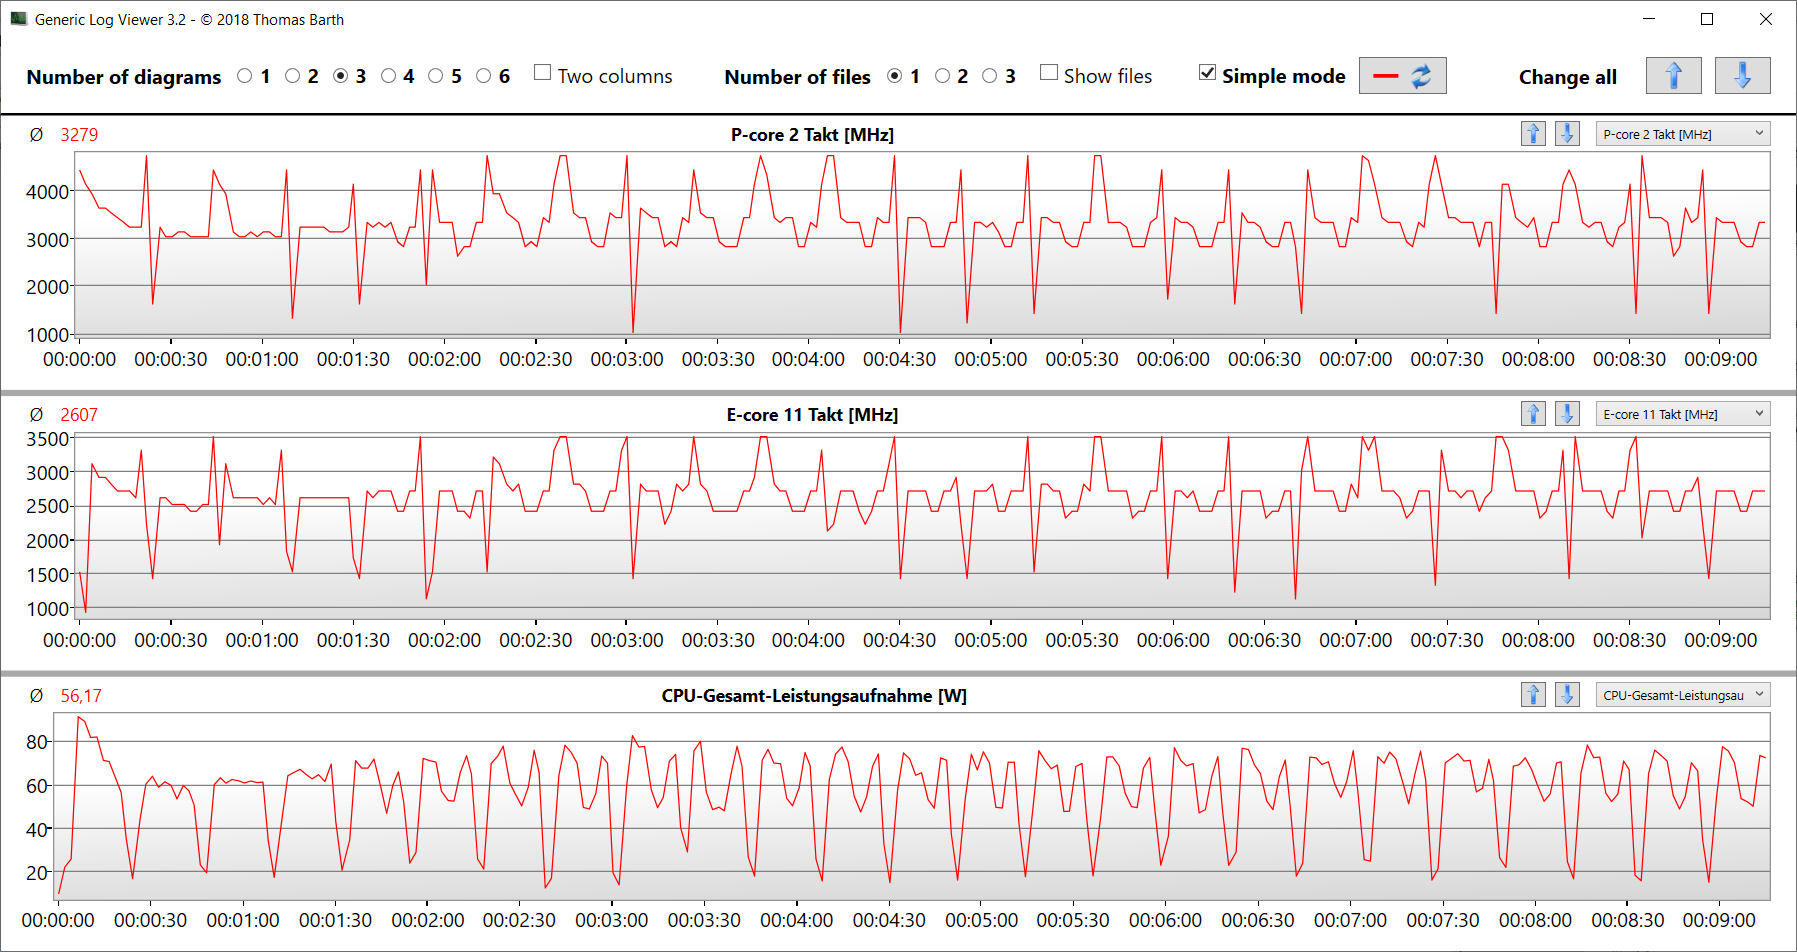
O teste de loop CB15 mostrou isso: A carga contínua de vários threads fez com que a taxa de clock do turbo caísse da primeira à quarta execução. Posteriormente, as taxas permaneceram constantes. O uso do "modo de desempenho" não levou a nenhuma melhoria de desempenho.
Cinebench R15 Multi continuous test
| CPU Performance rating - Percent | |
| Média da turma Multimedia | |
| Média Intel Core i7-12700H | |
| Dell Inspiron 16 Plus 7620 | |
| Asus VivoBook Pro 16 | |
| Acer Swift X SFX16-52G-77RX | |
| Schenker XMG Fusion 15 (Mid 22) | |
* ... menor é melhor
AIDA64: FP32 Ray-Trace | FPU Julia | CPU SHA3 | CPU Queen | FPU SinJulia | FPU Mandel | CPU AES | CPU ZLib | FP64 Ray-Trace | CPU PhotoWorxx
| Performance rating | |
| Média da turma Multimedia | |
| Schenker XMG Fusion 15 (Mid 22) | |
| Asus VivoBook Pro 16 | |
| Dell Inspiron 16 Plus 7620 | |
| Média Intel Core i7-12700H | |
| Acer Swift X SFX16-52G-77RX | |
| AIDA64 / FP32 Ray-Trace | |
| Média da turma Multimedia (2214 - 50388, n=55, últimos 2 anos) | |
| Asus VivoBook Pro 16 (v6.75.6100) | |
| Dell Inspiron 16 Plus 7620 (v6.70.6000) | |
| Schenker XMG Fusion 15 (Mid 22) (v6.70.6000) | |
| Média Intel Core i7-12700H (2585 - 17957, n=64) | |
| Acer Swift X SFX16-52G-77RX (v6.70.6000) | |
| AIDA64 / FPU Julia | |
| Média da turma Multimedia (12867 - 201874, n=56, últimos 2 anos) | |
| Asus VivoBook Pro 16 (v6.75.6100) | |
| Dell Inspiron 16 Plus 7620 (v6.70.6000) | |
| Schenker XMG Fusion 15 (Mid 22) (v6.70.6000) | |
| Média Intel Core i7-12700H (12439 - 90760, n=64) | |
| Acer Swift X SFX16-52G-77RX (v6.70.6000) | |
| AIDA64 / CPU SHA3 | |
| Schenker XMG Fusion 15 (Mid 22) (v6.70.6000) | |
| Média da turma Multimedia (626 - 8623, n=56, últimos 2 anos) | |
| Asus VivoBook Pro 16 (v6.75.6100) | |
| Média Intel Core i7-12700H (833 - 4242, n=64) | |
| Dell Inspiron 16 Plus 7620 (v6.70.6000) | |
| Acer Swift X SFX16-52G-77RX (v6.70.6000) | |
| AIDA64 / CPU Queen | |
| Asus VivoBook Pro 16 (v6.75.6100) | |
| Média Intel Core i7-12700H (57923 - 103202, n=63) | |
| Dell Inspiron 16 Plus 7620 (v6.70.6000) | |
| Schenker XMG Fusion 15 (Mid 22) | |
| Acer Swift X SFX16-52G-77RX (v6.70.6000) | |
| Média da turma Multimedia (13483 - 181505, n=43, últimos 2 anos) | |
| AIDA64 / FPU SinJulia | |
| Média Intel Core i7-12700H (3249 - 9939, n=64) | |
| Média da turma Multimedia (886 - 28794, n=56, últimos 2 anos) | |
| Asus VivoBook Pro 16 (v6.75.6100) | |
| Schenker XMG Fusion 15 (Mid 22) (v6.70.6000) | |
| Dell Inspiron 16 Plus 7620 (v6.70.6000) | |
| Acer Swift X SFX16-52G-77RX (v6.70.6000) | |
| AIDA64 / FPU Mandel | |
| Média da turma Multimedia (6395 - 105740, n=55, últimos 2 anos) | |
| Schenker XMG Fusion 15 (Mid 22) (v6.70.6000) | |
| Asus VivoBook Pro 16 (v6.75.6100) | |
| Dell Inspiron 16 Plus 7620 (v6.70.6000) | |
| Média Intel Core i7-12700H (7135 - 44760, n=64) | |
| Acer Swift X SFX16-52G-77RX (v6.70.6000) | |
| AIDA64 / CPU AES | |
| Schenker XMG Fusion 15 (Mid 22) (v6.70.6000) | |
| Média Intel Core i7-12700H (31839 - 144360, n=64) | |
| Média da turma Multimedia (8171 - 126790, n=56, últimos 2 anos) | |
| Asus VivoBook Pro 16 (v6.75.6100) | |
| Dell Inspiron 16 Plus 7620 (v6.70.6000) | |
| Acer Swift X SFX16-52G-77RX (v6.70.6000) | |
| AIDA64 / CPU ZLib | |
| Média da turma Multimedia (143.8 - 2022, n=56, últimos 2 anos) | |
| Dell Inspiron 16 Plus 7620 (v6.70.6000) | |
| Média Intel Core i7-12700H (305 - 1171, n=64) | |
| Asus VivoBook Pro 16 (v6.75.6100) | |
| Schenker XMG Fusion 15 (Mid 22) (v6.70.6000) | |
| Acer Swift X SFX16-52G-77RX (v6.70.6000) | |
| AIDA64 / FP64 Ray-Trace | |
| Média da turma Multimedia (1014 - 26875, n=56, últimos 2 anos) | |
| Asus VivoBook Pro 16 (v6.75.6100) | |
| Schenker XMG Fusion 15 (Mid 22) (v6.70.6000) | |
| Dell Inspiron 16 Plus 7620 (v6.70.6000) | |
| Média Intel Core i7-12700H (1437 - 9692, n=64) | |
| Acer Swift X SFX16-52G-77RX (v6.70.6000) | |
| AIDA64 / CPU PhotoWorxx | |
| Média da turma Multimedia (8187 - 88154, n=56, últimos 2 anos) | |
| Acer Swift X SFX16-52G-77RX (v6.70.6000) | |
| Dell Inspiron 16 Plus 7620 (v6.70.6000) | |
| Média Intel Core i7-12700H (12863 - 52207, n=64) | |
| Schenker XMG Fusion 15 (Mid 22) (v6.70.6000) | |
| Asus VivoBook Pro 16 (v6.75.6100) | |
Desempenho do sistema
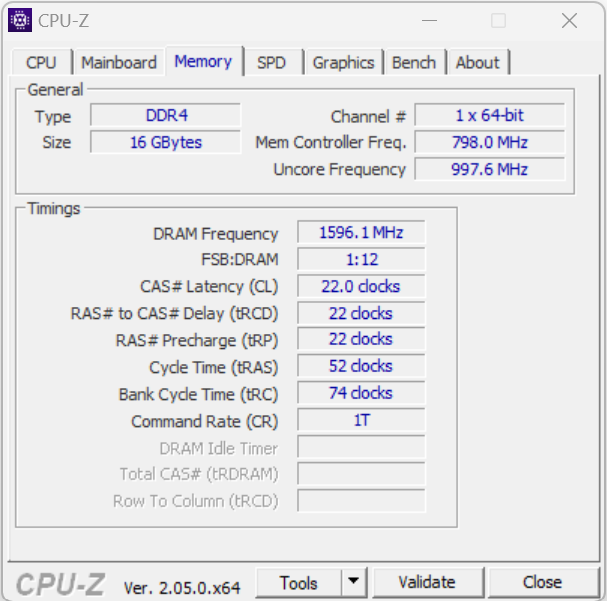
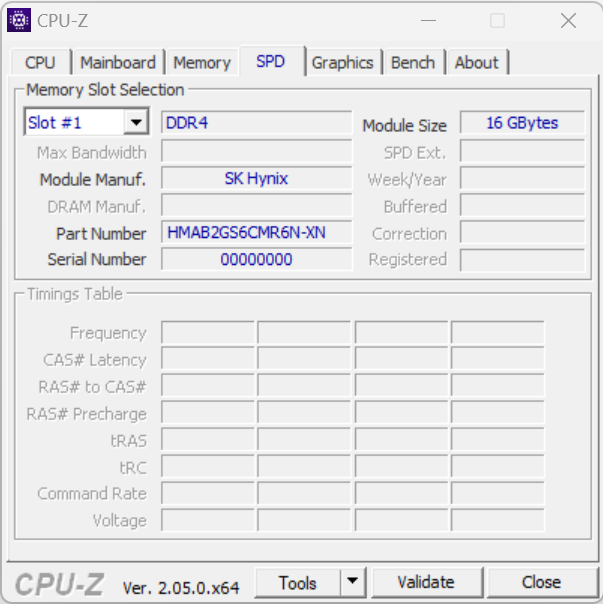
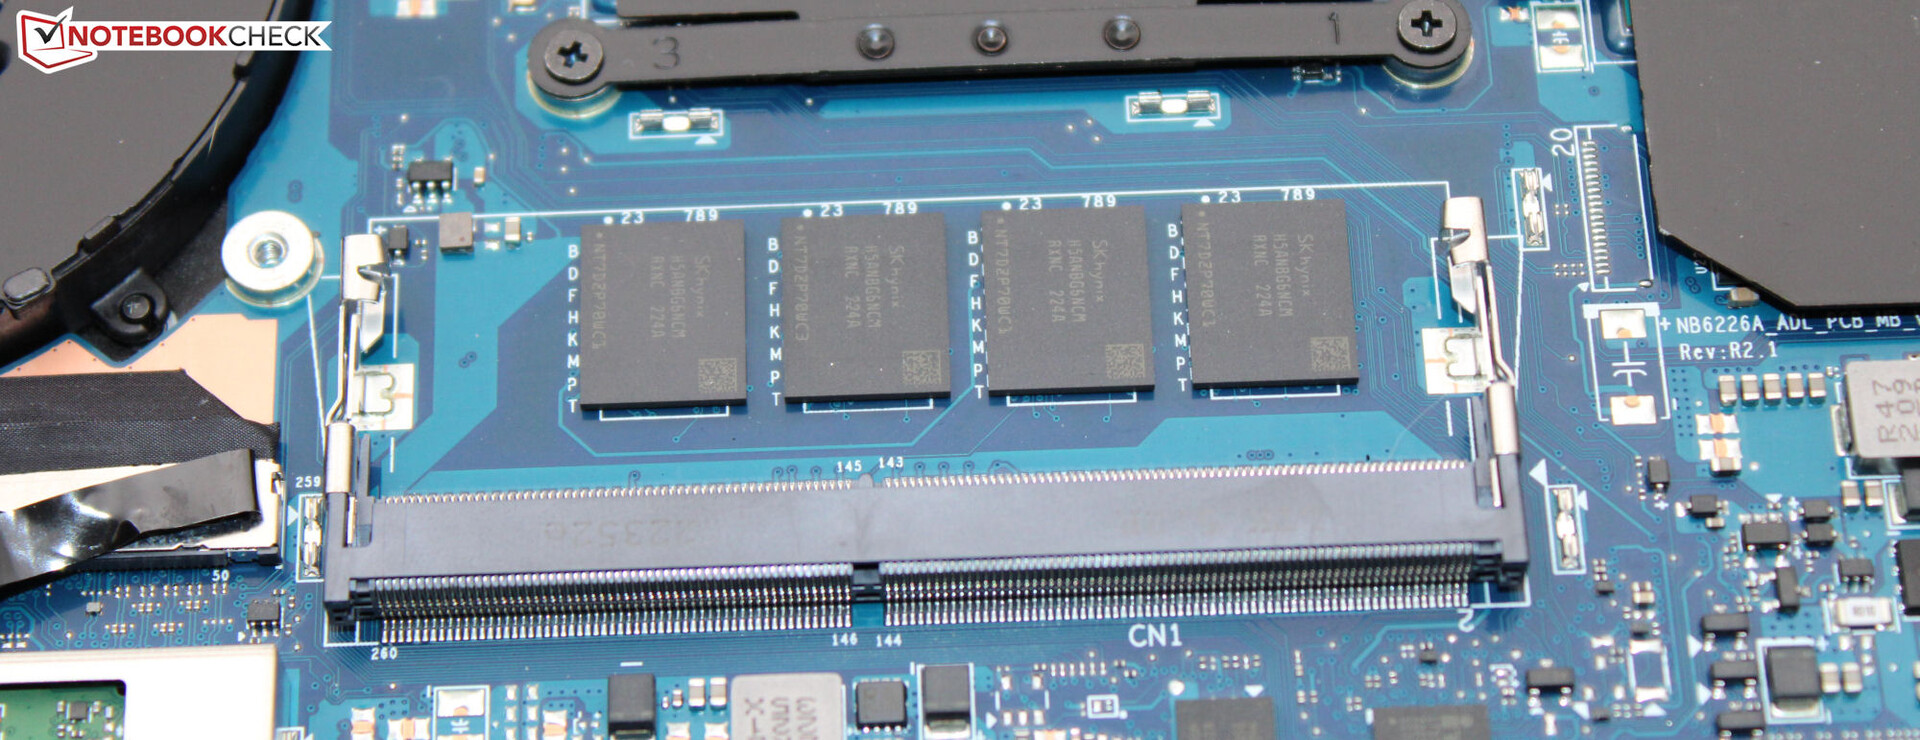
Seu sistema de execução suave domina os jogos, o streaming e a renderização. Uma parte de seu poder de processamento fica ociosa, pois a RAM (16 GB, DDR4-3200, integrada) funciona apenas no modo de canal único. A instalação de um módulo de memória (= modo de canal duplo ativo) resolveria esse problema e também aumentaria suas taxas de dados para níveis semelhantes aos de seus concorrentes com o mesmo armazenamento.
CrossMark: Overall | Productivity | Creativity | Responsiveness
| PCMark 10 / Score | |
| Média da turma Multimedia (4325 - 10386, n=54, últimos 2 anos) | |
| Dell Inspiron 16 Plus 7620 | |
| Média Intel Core i7-12700H, NVIDIA GeForce RTX 3050 Ti Laptop GPU (6623 - 7075, n=5) | |
| Asus VivoBook Pro 16 | |
| Schenker XMG Fusion 15 (Mid 22) | |
| Acer Swift X SFX16-52G-77RX | |
| PCMark 10 / Essentials | |
| Acer Swift X SFX16-52G-77RX | |
| Média da turma Multimedia (8025 - 11664, n=53, últimos 2 anos) | |
| Média Intel Core i7-12700H, NVIDIA GeForce RTX 3050 Ti Laptop GPU (9540 - 10970, n=5) | |
| Dell Inspiron 16 Plus 7620 | |
| Schenker XMG Fusion 15 (Mid 22) | |
| Asus VivoBook Pro 16 | |
| PCMark 10 / Productivity | |
| Média da turma Multimedia (7323 - 18233, n=53, últimos 2 anos) | |
| Dell Inspiron 16 Plus 7620 | |
| Média Intel Core i7-12700H, NVIDIA GeForce RTX 3050 Ti Laptop GPU (8530 - 9555, n=5) | |
| Asus VivoBook Pro 16 | |
| Schenker XMG Fusion 15 (Mid 22) | |
| Acer Swift X SFX16-52G-77RX | |
| PCMark 10 / Digital Content Creation | |
| Média da turma Multimedia (3651 - 16240, n=53, últimos 2 anos) | |
| Dell Inspiron 16 Plus 7620 | |
| Asus VivoBook Pro 16 | |
| Média Intel Core i7-12700H, NVIDIA GeForce RTX 3050 Ti Laptop GPU (8855 - 9542, n=5) | |
| Acer Swift X SFX16-52G-77RX | |
| Schenker XMG Fusion 15 (Mid 22) | |
| CrossMark / Overall | |
| Média da turma Multimedia (866 - 2728, n=62, últimos 2 anos) | |
| Dell Inspiron 16 Plus 7620 | |
| Acer Swift X SFX16-52G-77RX | |
| Média Intel Core i7-12700H, NVIDIA GeForce RTX 3050 Ti Laptop GPU (1654 - 1872, n=5) | |
| Asus VivoBook Pro 16 | |
| Schenker XMG Fusion 15 (Mid 22) | |
| CrossMark / Productivity | |
| Média da turma Multimedia (931 - 2489, n=62, últimos 2 anos) | |
| Acer Swift X SFX16-52G-77RX | |
| Asus VivoBook Pro 16 | |
| Média Intel Core i7-12700H, NVIDIA GeForce RTX 3050 Ti Laptop GPU (1595 - 1792, n=5) | |
| Dell Inspiron 16 Plus 7620 | |
| Schenker XMG Fusion 15 (Mid 22) | |
| CrossMark / Creativity | |
| Média da turma Multimedia (907 - 3465, n=62, últimos 2 anos) | |
| Dell Inspiron 16 Plus 7620 | |
| Média Intel Core i7-12700H, NVIDIA GeForce RTX 3050 Ti Laptop GPU (1699 - 1993, n=5) | |
| Acer Swift X SFX16-52G-77RX | |
| Asus VivoBook Pro 16 | |
| Schenker XMG Fusion 15 (Mid 22) | |
| CrossMark / Responsiveness | |
| Asus VivoBook Pro 16 | |
| Acer Swift X SFX16-52G-77RX | |
| Schenker XMG Fusion 15 (Mid 22) | |
| Média Intel Core i7-12700H, NVIDIA GeForce RTX 3050 Ti Laptop GPU (1383 - 1768, n=5) | |
| Média da turma Multimedia (605 - 2024, n=62, últimos 2 anos) | |
| Dell Inspiron 16 Plus 7620 | |
| PCMark 8 Home Score Accelerated v2 | 4565 pontos | |
| PCMark 8 Work Score Accelerated v2 | 5386 pontos | |
| PCMark 10 Score | 6652 pontos | |
Ajuda | ||
| AIDA64 / Memory Copy | |
| Média da turma Multimedia (11299 - 132135, n=56, últimos 2 anos) | |
| Acer Swift X SFX16-52G-77RX | |
| Dell Inspiron 16 Plus 7620 | |
| Média Intel Core i7-12700H (25615 - 80511, n=64) | |
| Schenker XMG Fusion 15 (Mid 22) | |
| Asus VivoBook Pro 16 | |
| AIDA64 / Memory Read | |
| Média da turma Multimedia (11624 - 174586, n=56, últimos 2 anos) | |
| Acer Swift X SFX16-52G-77RX | |
| Dell Inspiron 16 Plus 7620 | |
| Média Intel Core i7-12700H (25586 - 79442, n=64) | |
| Schenker XMG Fusion 15 (Mid 22) | |
| Asus VivoBook Pro 16 | |
| AIDA64 / Memory Write | |
| Média da turma Multimedia (11755 - 134998, n=56, últimos 2 anos) | |
| Acer Swift X SFX16-52G-77RX | |
| Dell Inspiron 16 Plus 7620 | |
| Média Intel Core i7-12700H (23679 - 88660, n=64) | |
| Schenker XMG Fusion 15 (Mid 22) | |
| Asus VivoBook Pro 16 | |
| AIDA64 / Memory Latency | |
| Média da turma Multimedia (7 - 535, n=55, últimos 2 anos) | |
| Acer Swift X SFX16-52G-77RX | |
| Dell Inspiron 16 Plus 7620 | |
| Schenker XMG Fusion 15 (Mid 22) | |
| Asus VivoBook Pro 16 | |
| Média Intel Core i7-12700H (76.2 - 133.9, n=62) | |
* ... menor é melhor
Latência DPC
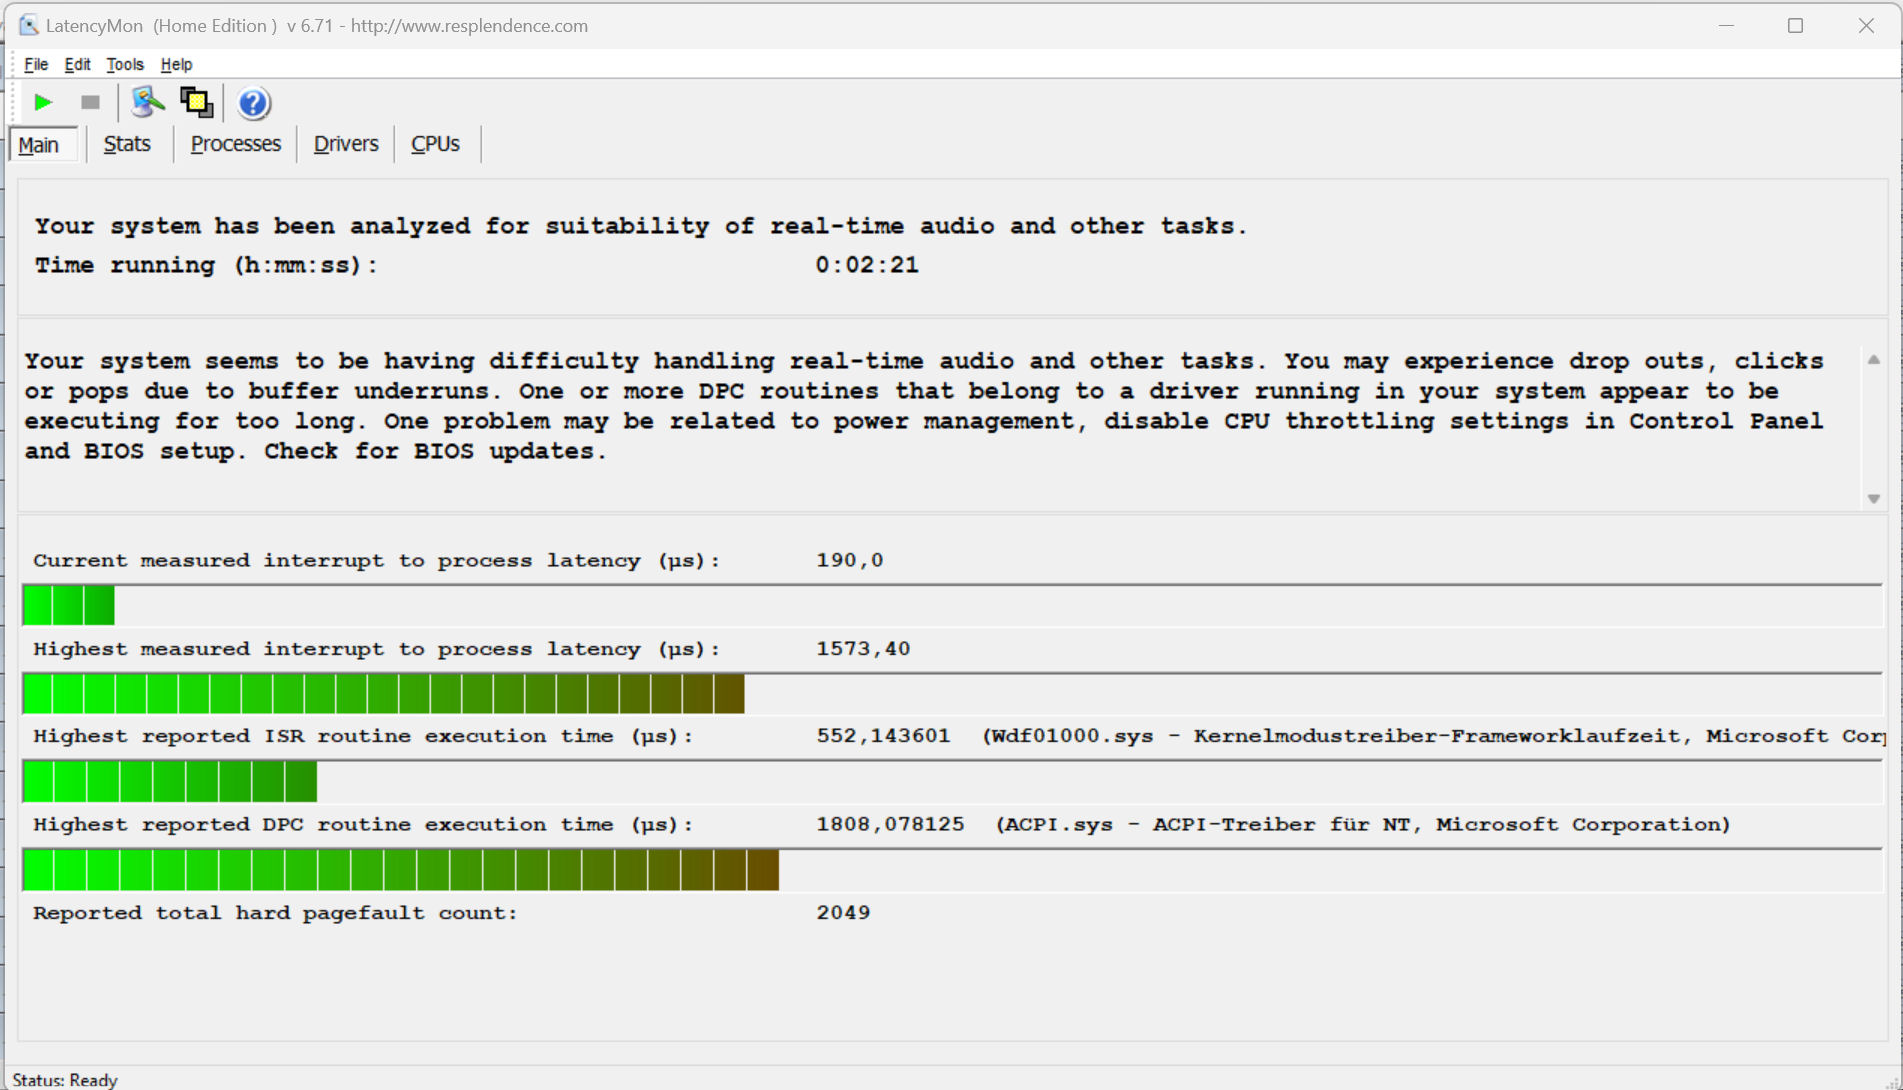
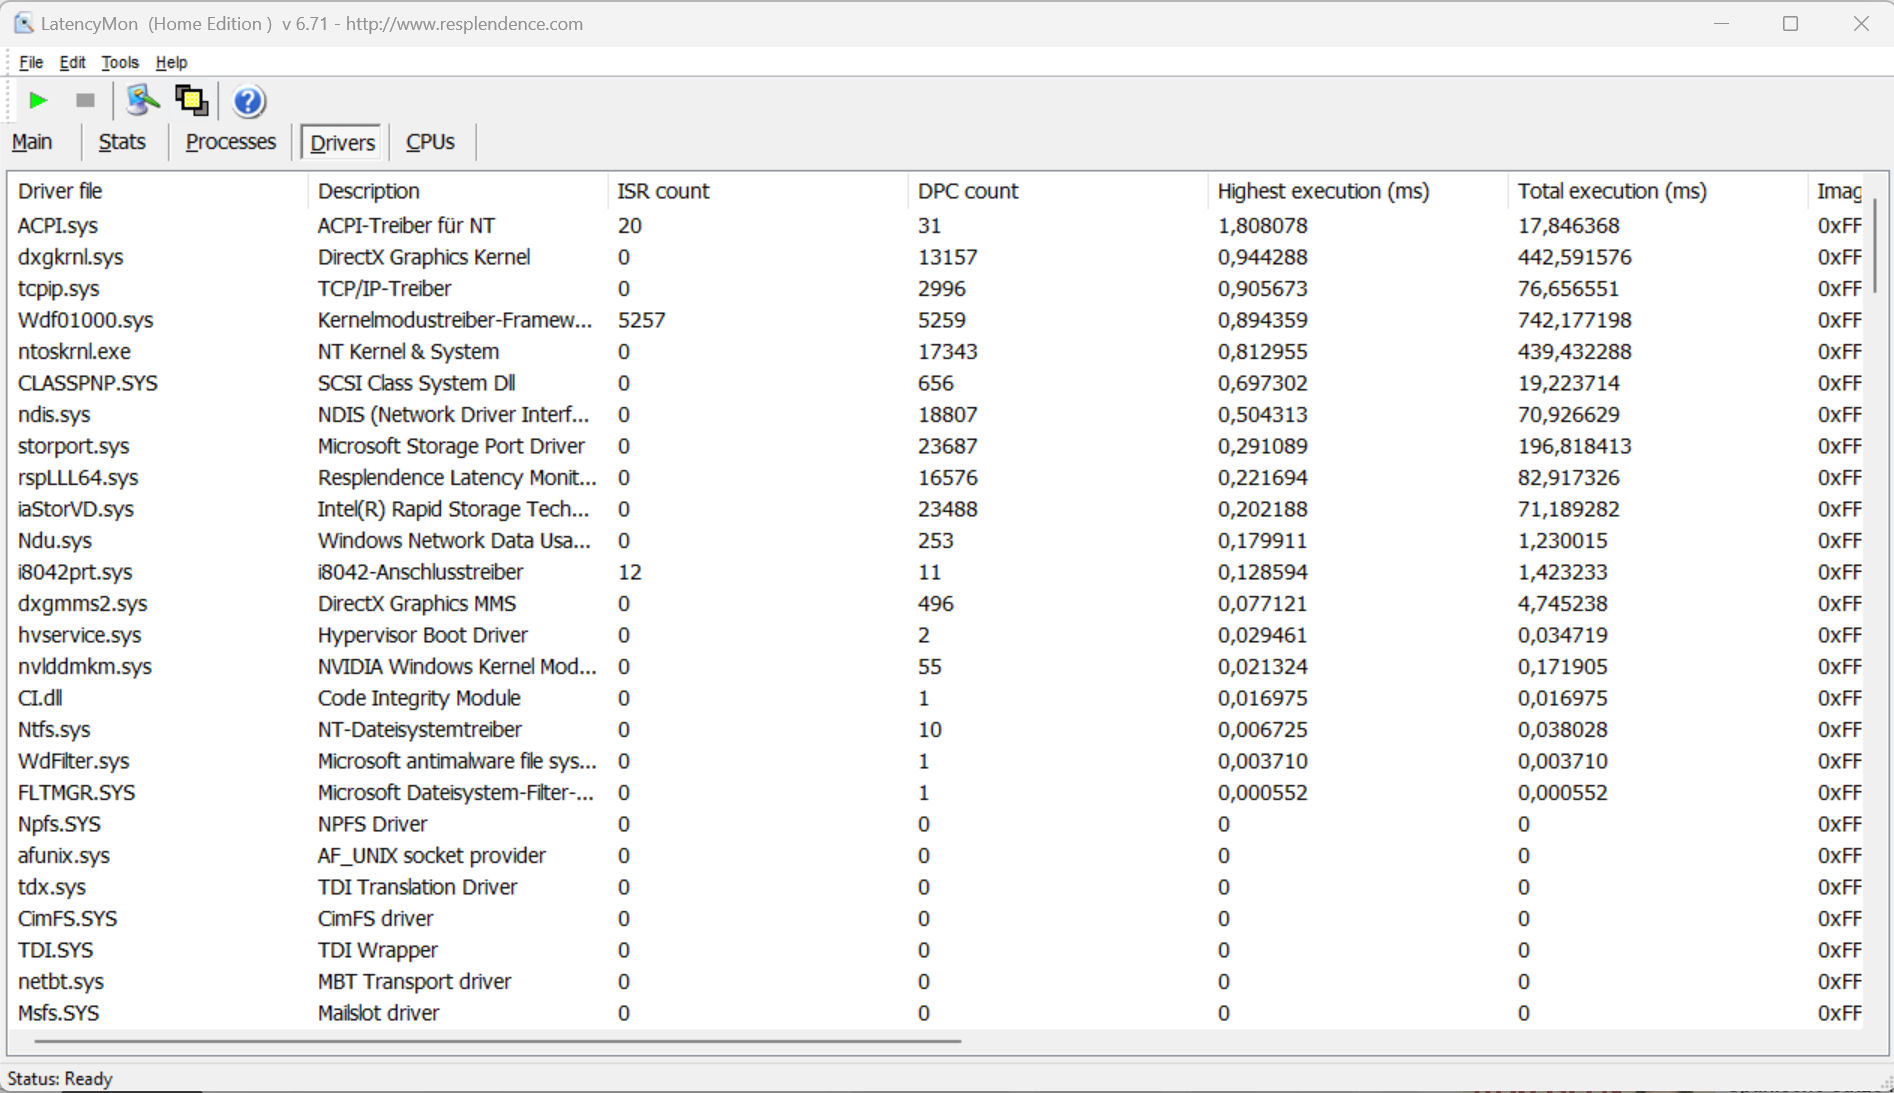
O teste padronizado do monitor de latência (navegação na Web, reprodução de vídeo 4k, alta carga do Prime95) revelou algumas anomalias. O sistema não parece ser adequado para edição de vídeo e áudio em tempo real. Futuras atualizações de software podem levar a melhorias ou até mesmo a degradações.
| DPC Latencies / LatencyMon - interrupt to process latency (max), Web, Youtube, Prime95 | |
| Schenker XMG Fusion 15 (Mid 22) | |
| Asus VivoBook Pro 16 | |
| Dell Inspiron 16 Plus 7620 | |
| Acer Swift X SFX16-52G-77RX | |
* ... menor é melhor
Dispositivos de armazenamento
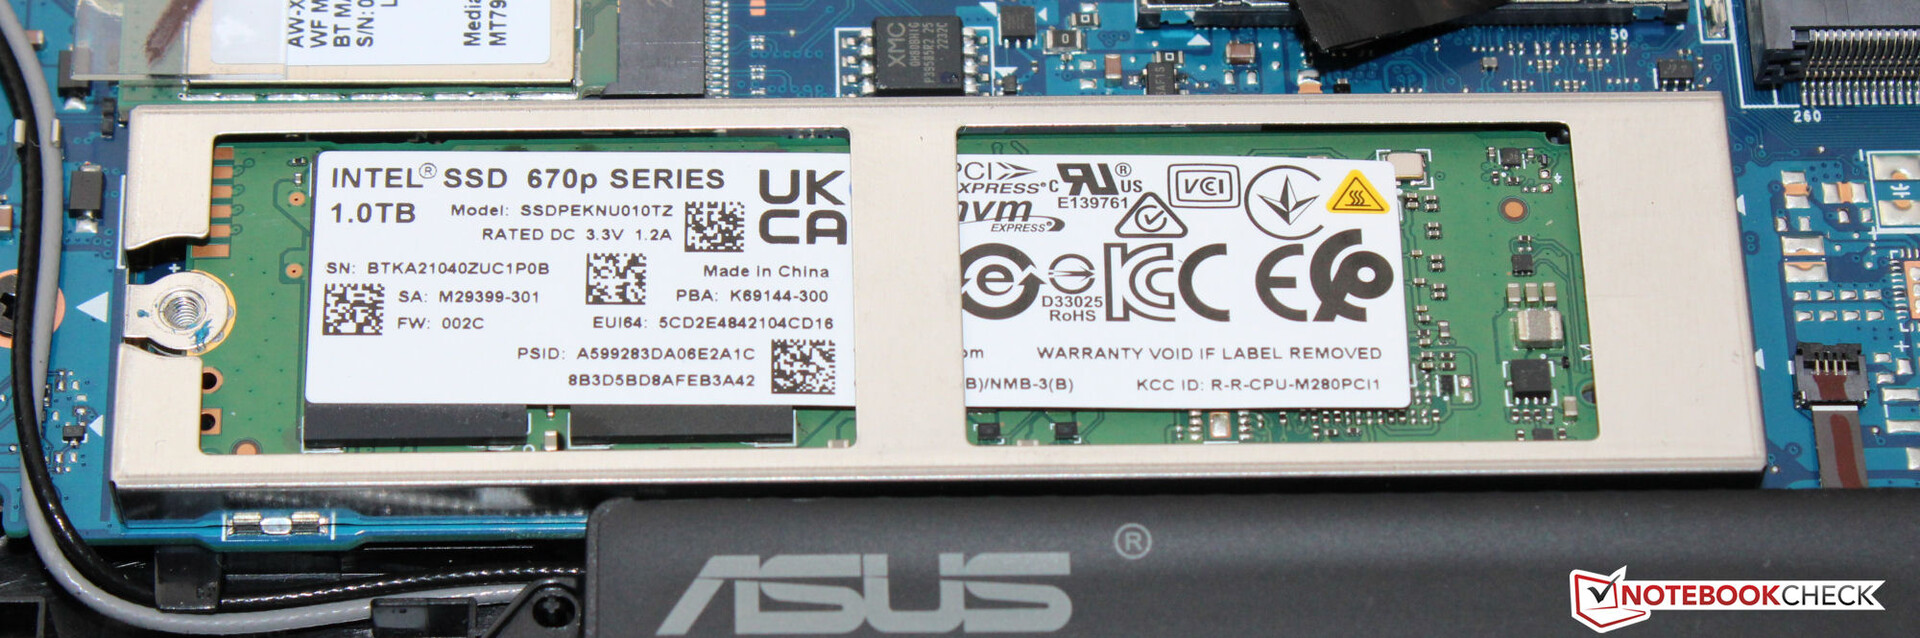
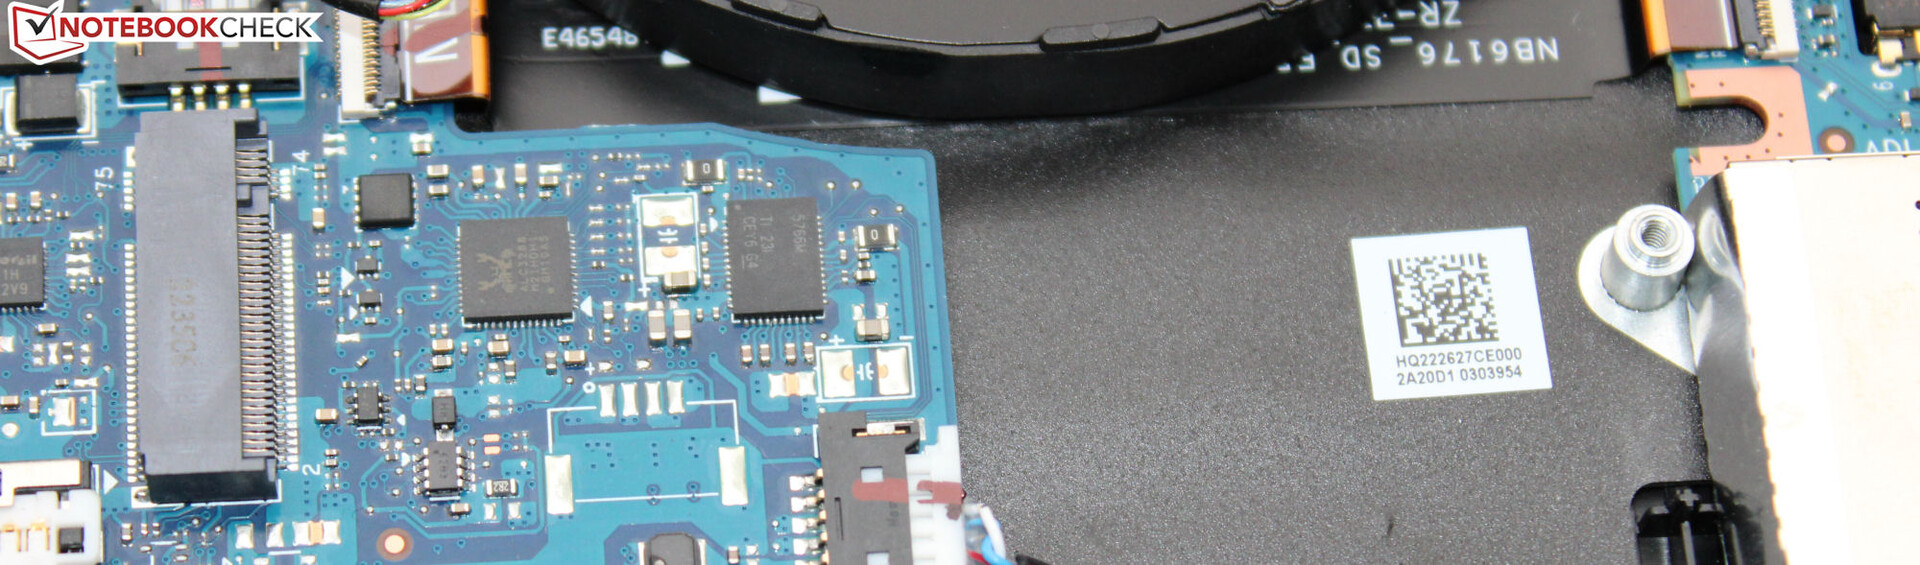
A Asus equipou o notebook com um SSD PCIe-3 (M.2-2280) da Intel, com capacidade de 1 TB. Ele oferece boas taxas de dados, mas não pode ser classificado como um SSD de elite. O computador oferece espaço para um segundo SSD.

| Drive Performance rating - Percent | |
| Acer Swift X SFX16-52G-77RX | |
| Schenker XMG Fusion 15 (Mid 22) | |
| Média da turma Multimedia | |
| Asus VivoBook Pro 16 | |
| Média Intel SSD 670p SSDPEKNU010TZ | |
| Dell Inspiron 16 Plus 7620 | |
* ... menor é melhor
reading continuous performance: DiskSpd Read Loop, Queue Depth 8
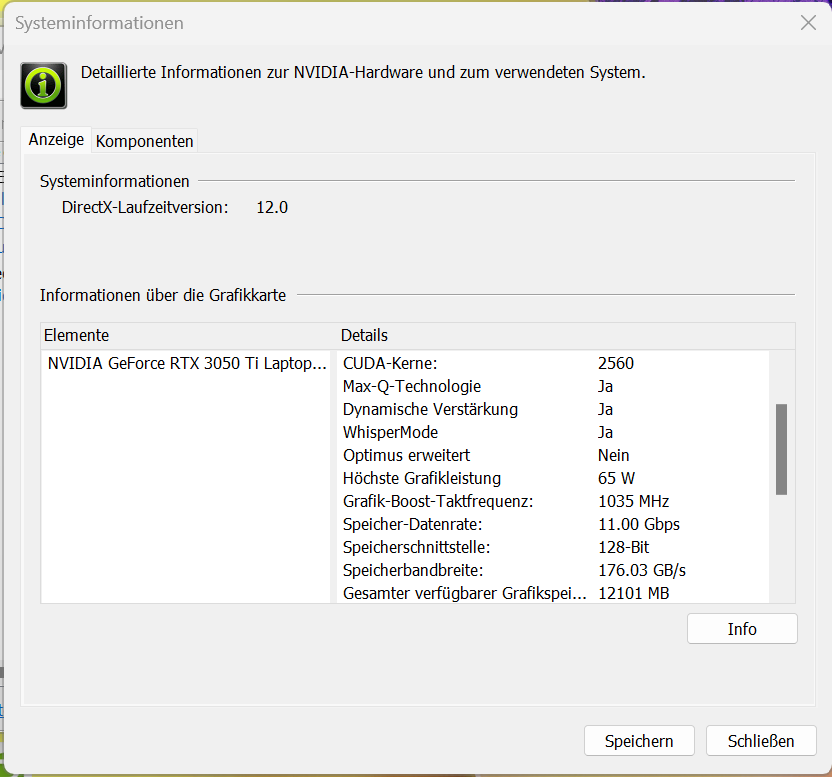
Placa de vídeo
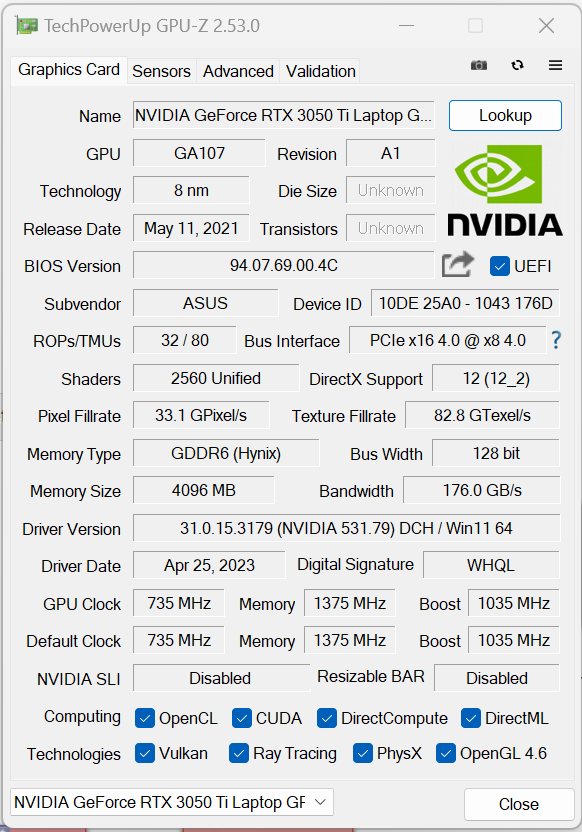
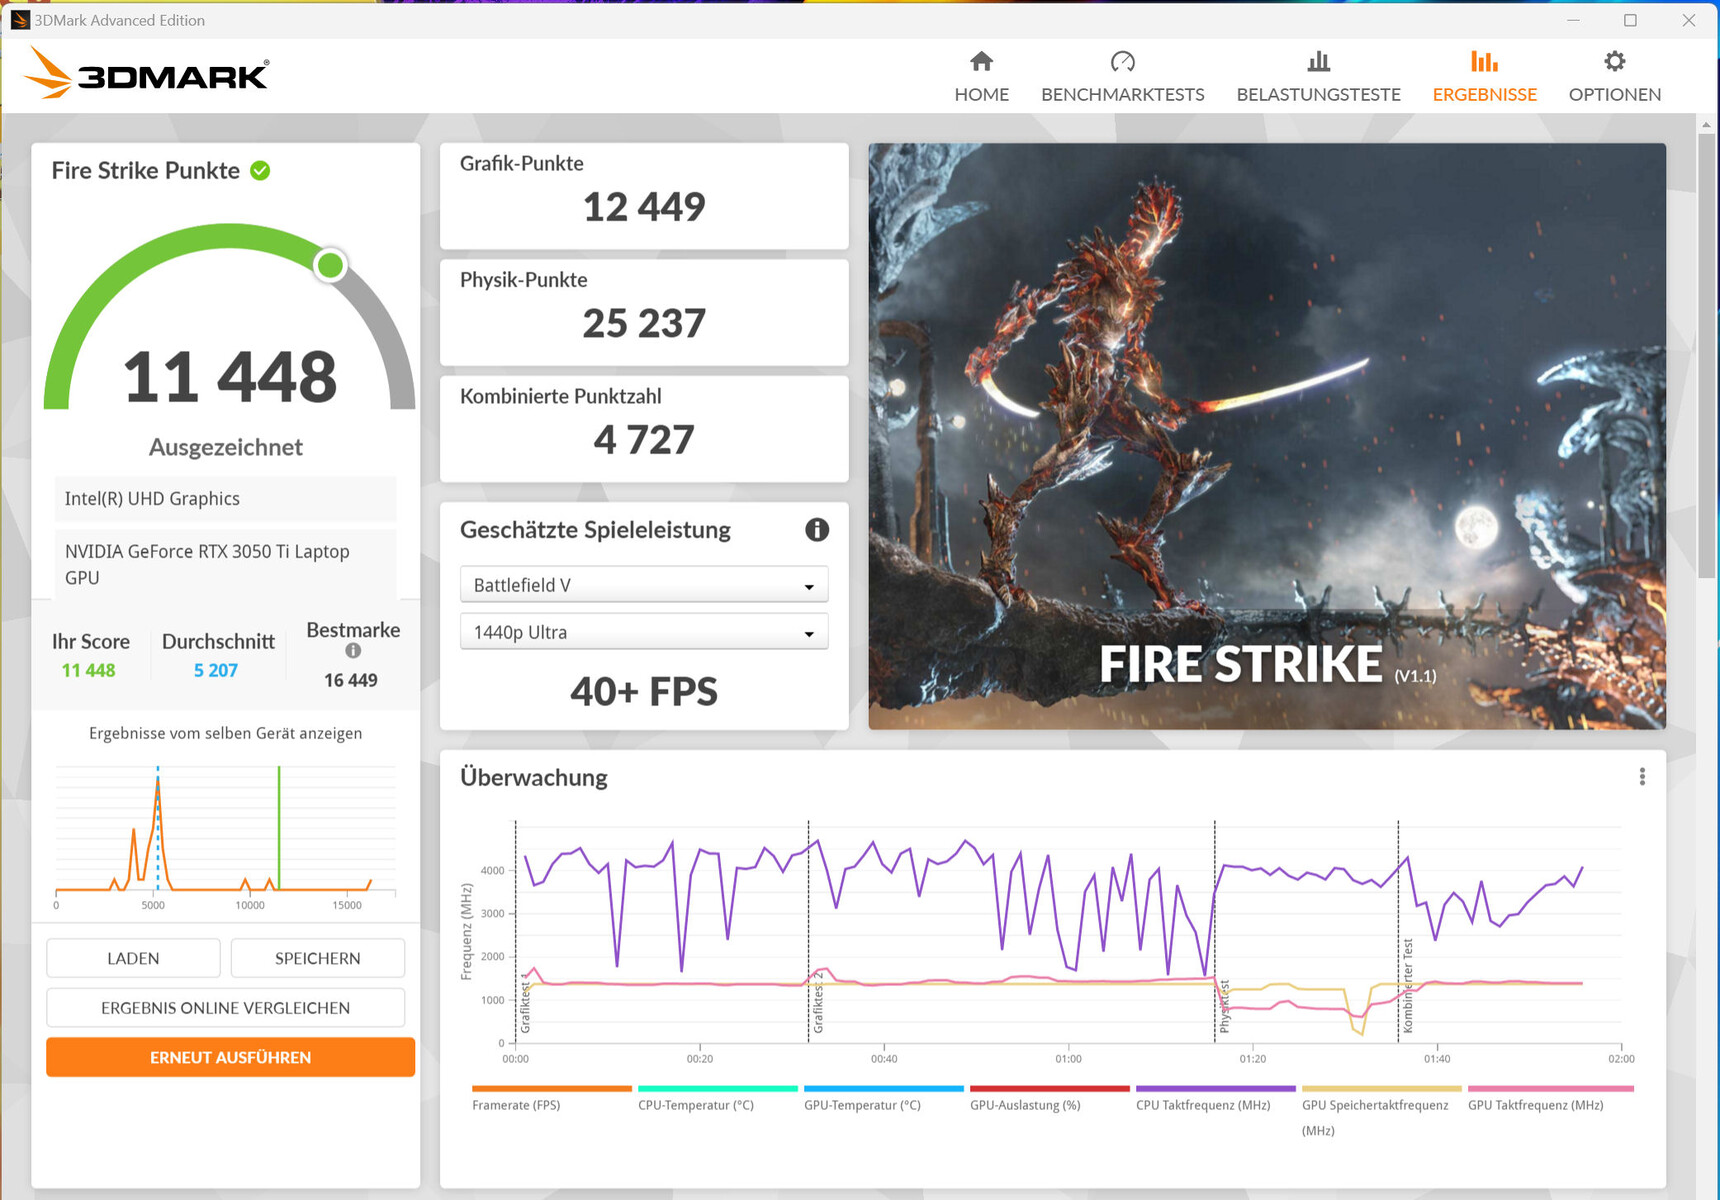
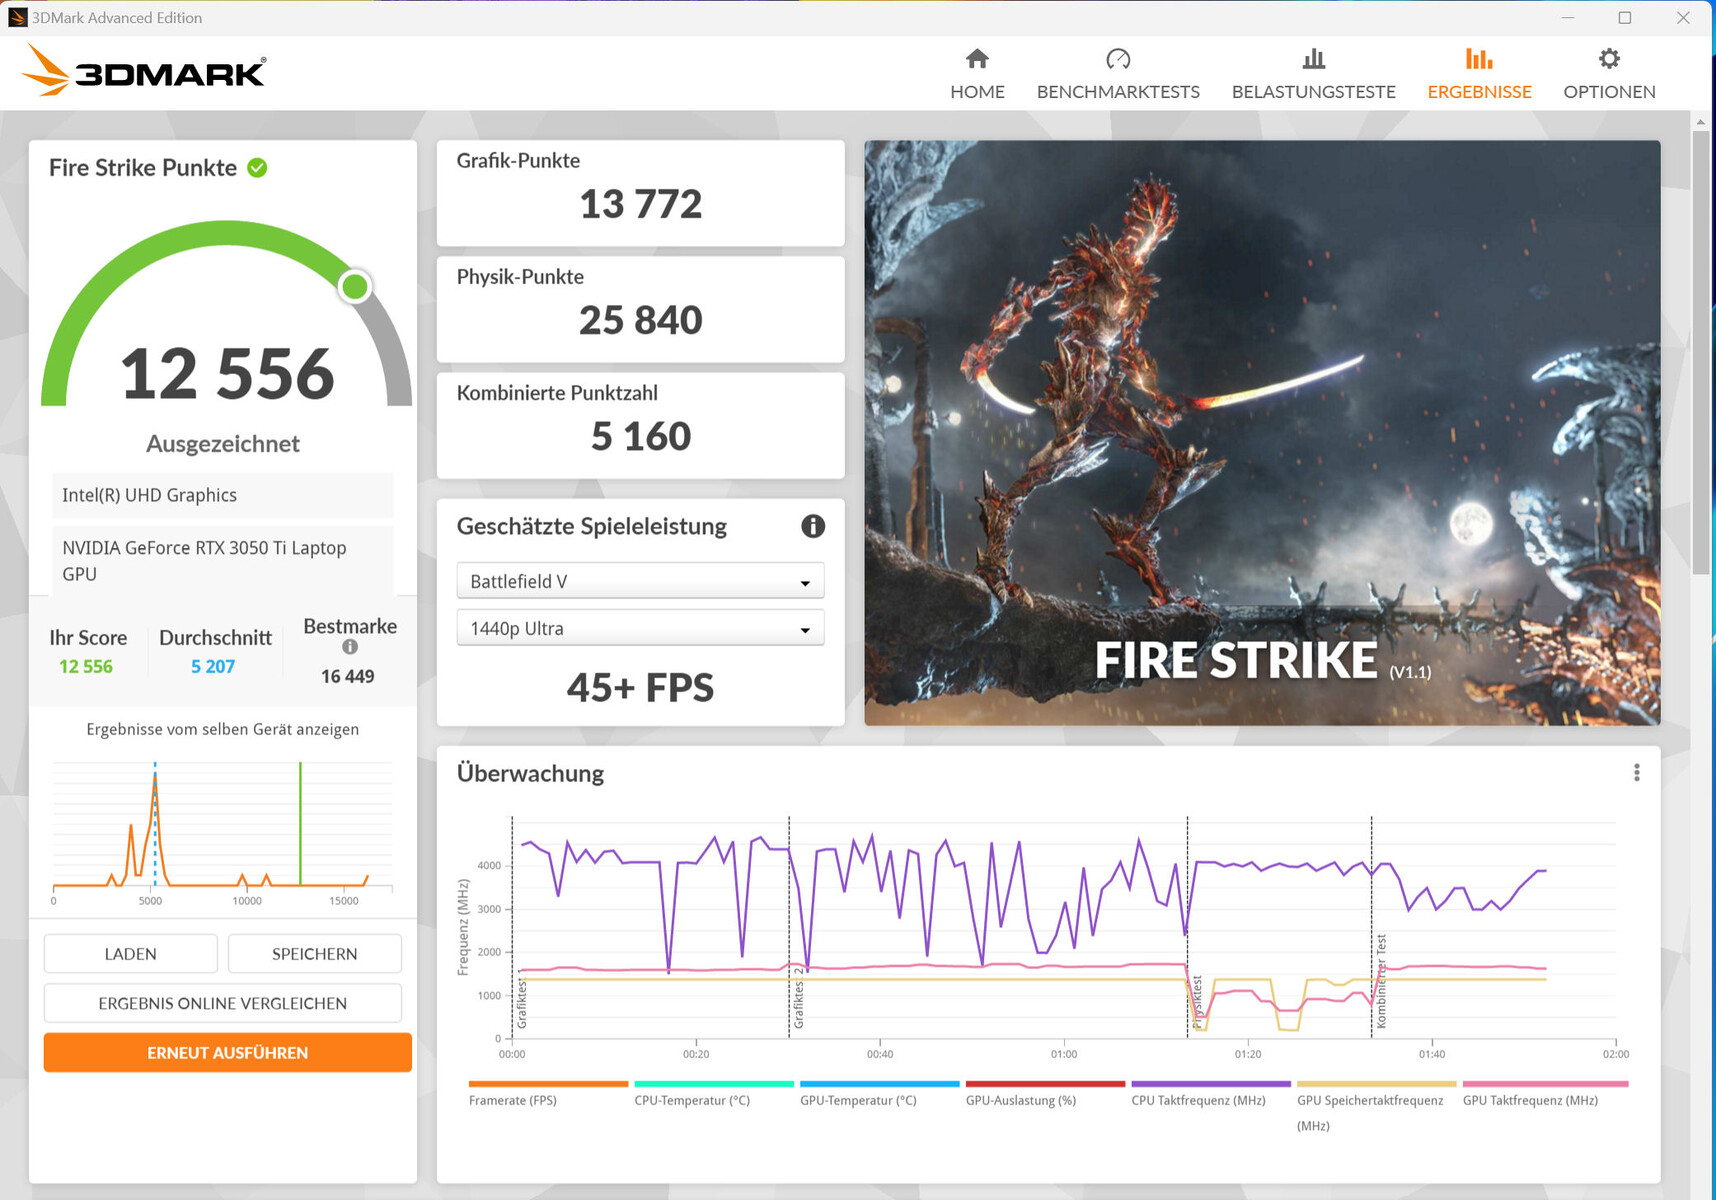
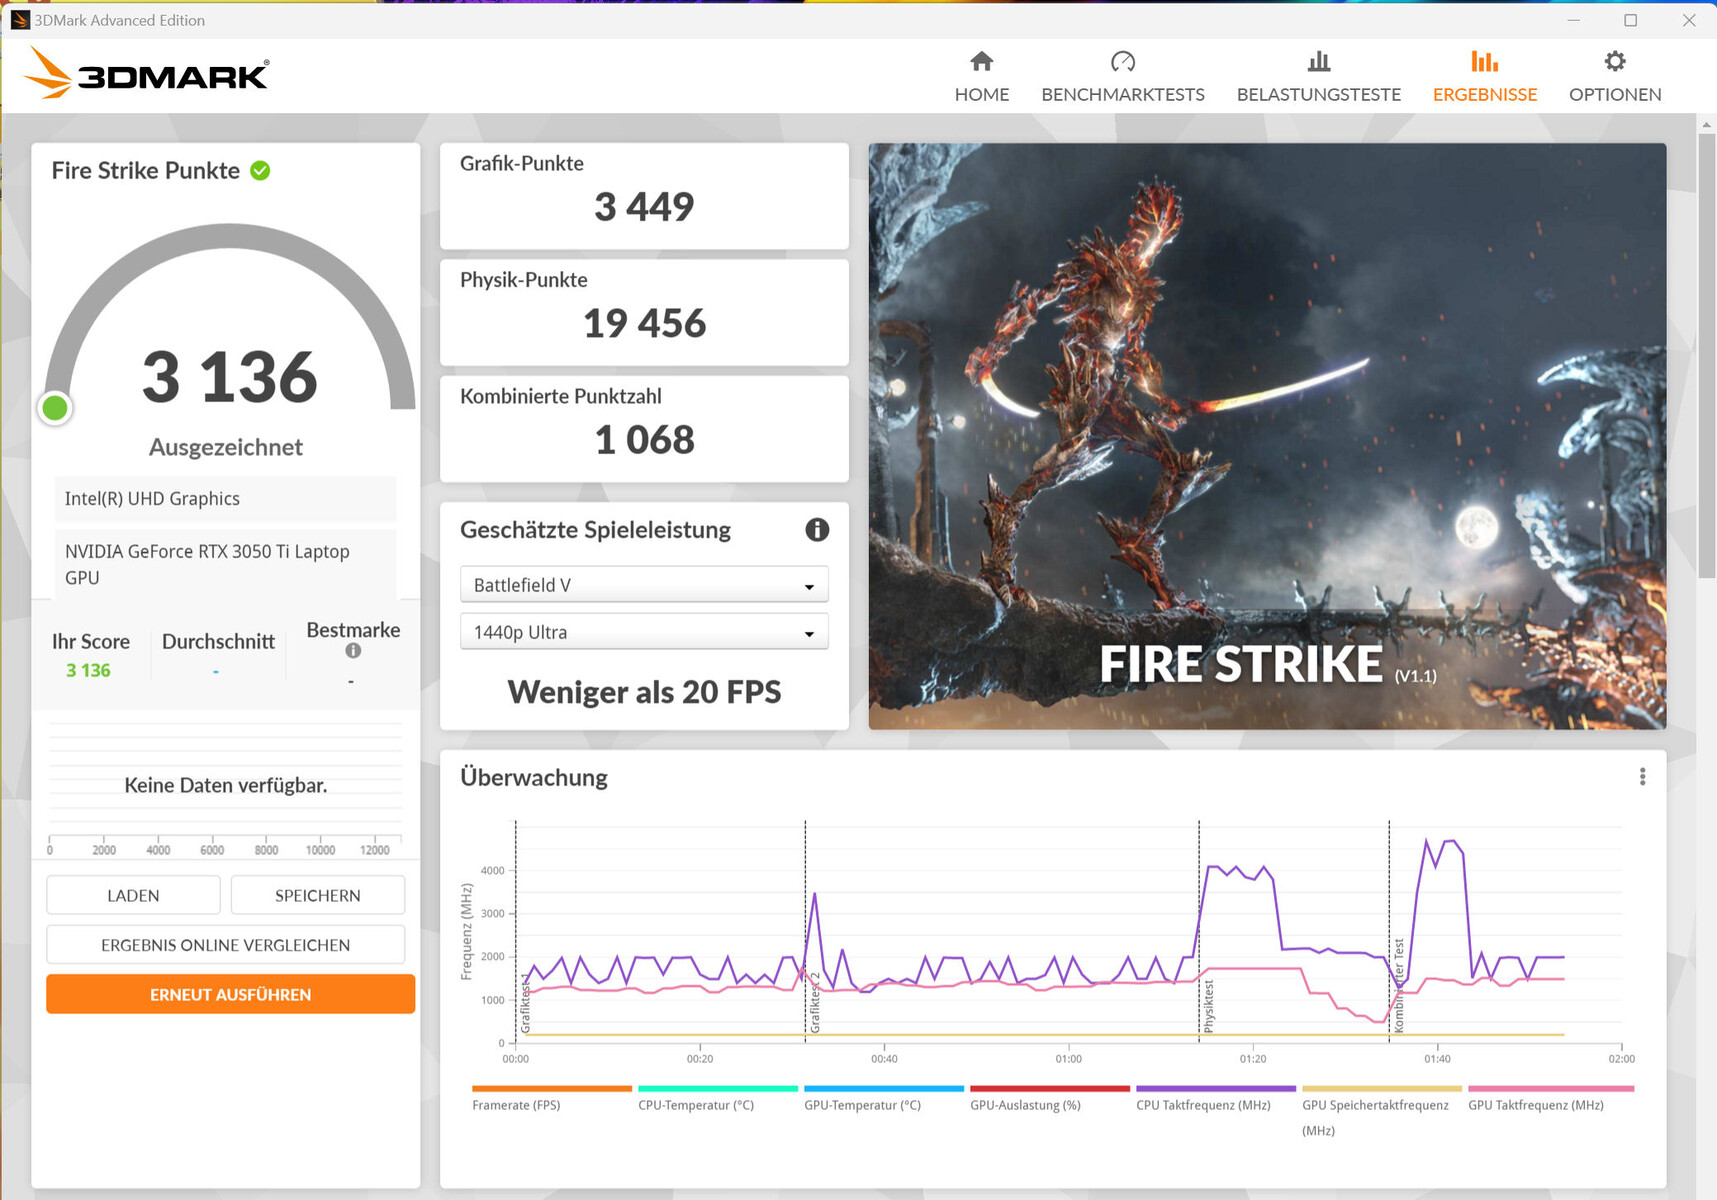
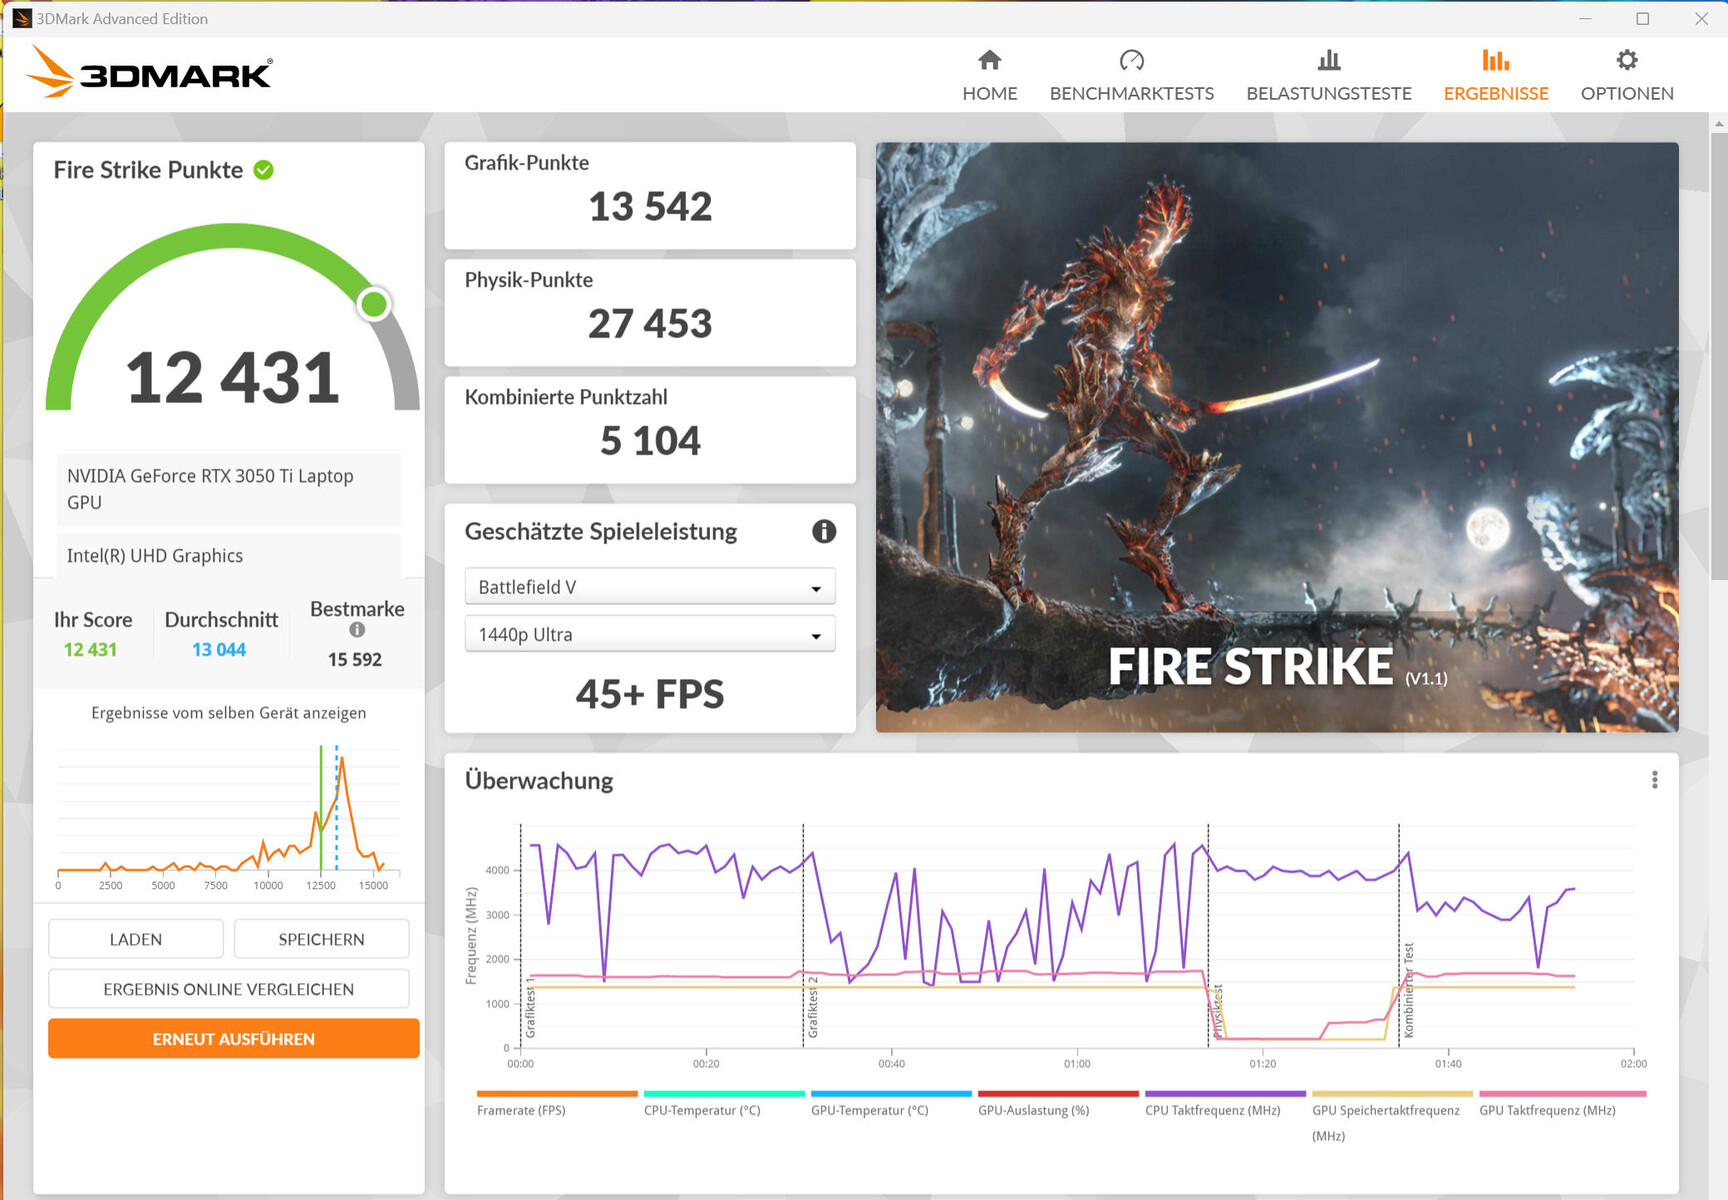
Nossos benchmarks e testes de jogos revelaram que a GeForce RTX 3050 Tipara laptop (TGP: 65 watts) ficaram um pouco abaixo da média da GPU ("modo padrão"). O uso do "modo de desempenho" levou a taxas de 10 a 15% mais altas - de acordo com o teste Witcher 3, a TGP estava esgotada. O uso do modo dGPU (por meio do aplicativo MyAsus) não levou a nenhuma melhoria no desempenho.
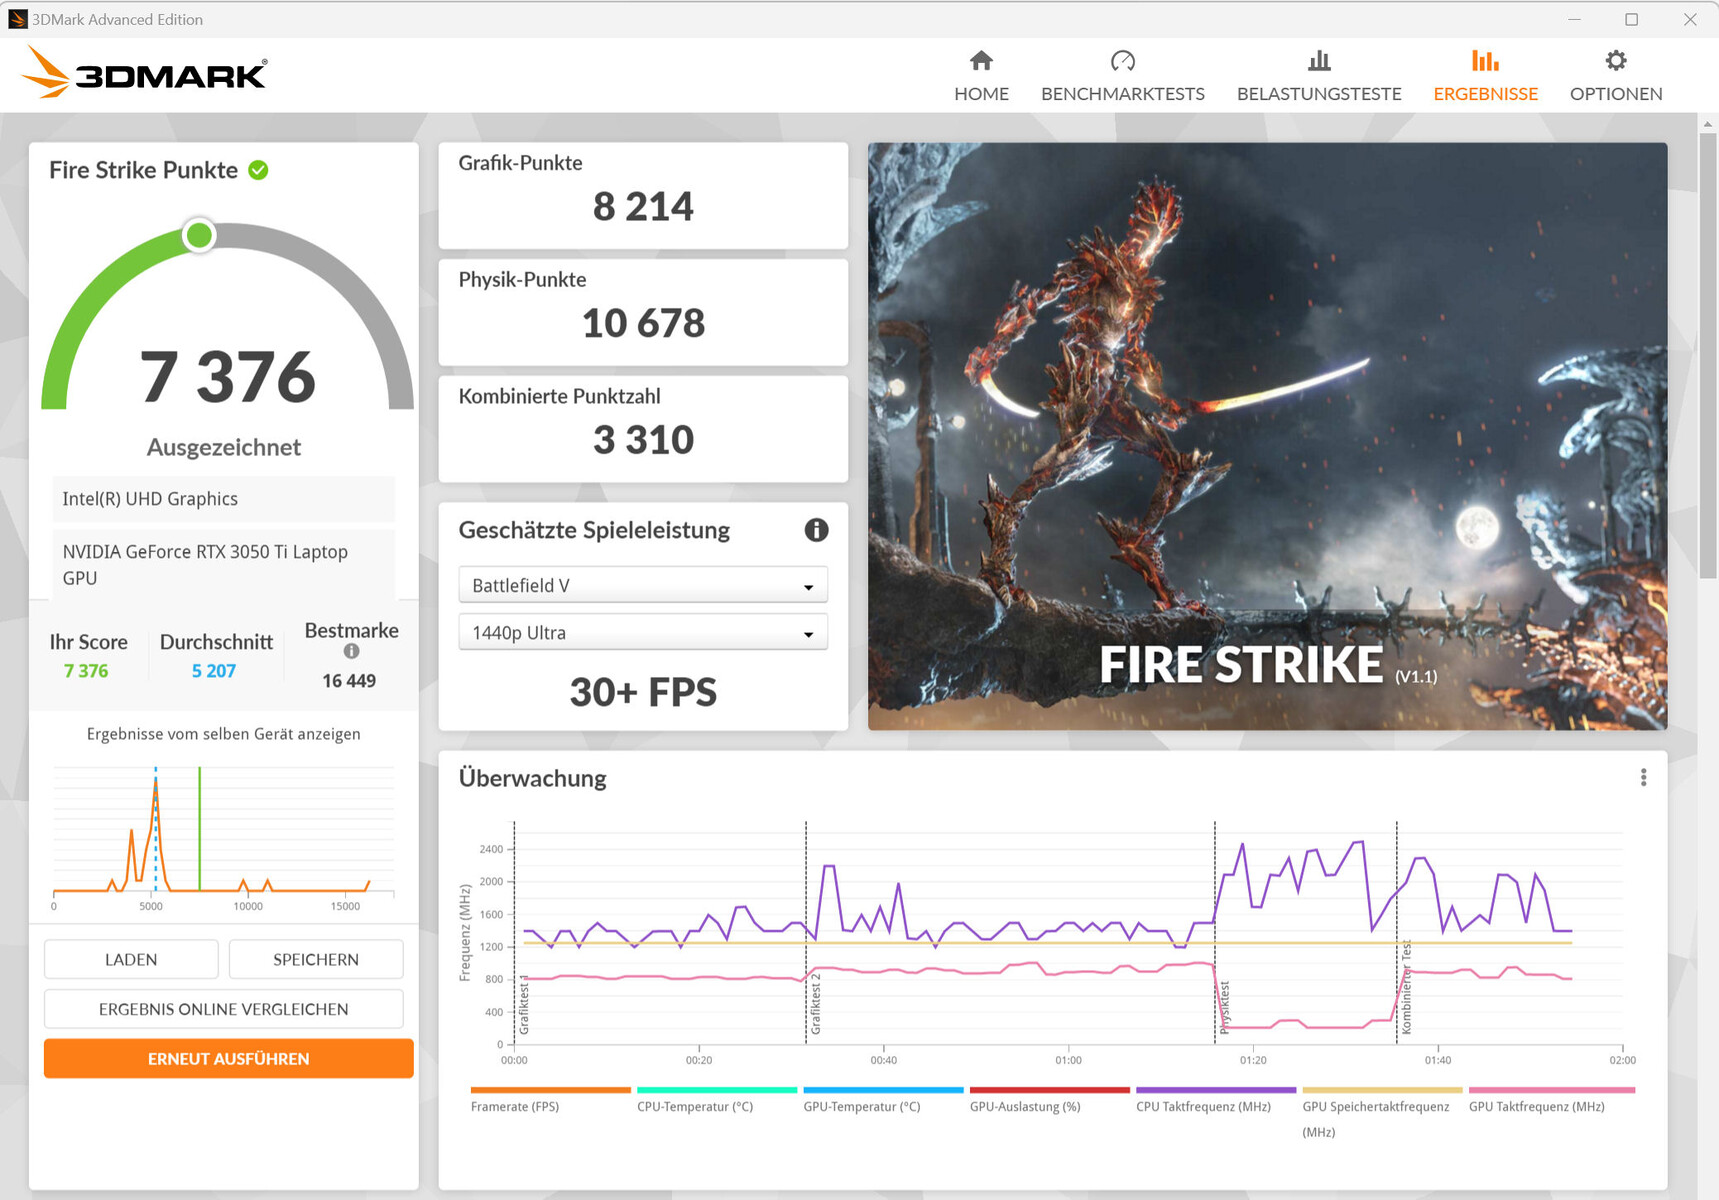
O computador permite jogos em FHD usando configurações baixas a altas e jogos em HD usando configurações baixas a médias (modo whisper). O último reduziu o TGP para 25 watts, o que resultou em menos emissões de ruído.
| 3DMark 06 Standard Score | 45370 pontos | |
| 3DMark 11 Performance | 16180 pontos | |
| 3DMark Cloud Gate Standard Score | 45033 pontos | |
| 3DMark Fire Strike Score | 11448 pontos | |
| 3DMark Time Spy Score | 4969 pontos | |
Ajuda | ||
| Geekbench 6.0 | |
| GPU Vulkan 6.0 | |
| Média da turma Multimedia (n=1últimos 2 anos) | |
| Asus VivoBook Pro 16 | |
| Média NVIDIA GeForce RTX 3050 Ti Laptop GPU (n=1) | |
| GPU OpenCL 6.0 | |
| Média da turma Multimedia (n=1últimos 2 anos) | |
| Asus VivoBook Pro 16 | |
| Média NVIDIA GeForce RTX 3050 Ti Laptop GPU (n=1) | |
| V-Ray Benchmark Next 4.10 | |
| GPU | |
| Schenker XMG Fusion 15 (Mid 22) (v4.10.07 ) | |
| Média da turma Multimedia (32 - 1191, n=55, últimos 2 anos) | |
| Média NVIDIA GeForce RTX 3050 Ti Laptop GPU (171 - 216, n=22) | |
| Asus VivoBook Pro 16 (v4.10.07 ) | |
| Acer Swift X SFX16-52G-77RX (v4.10.07 ) | |
| CPU | |
| Média da turma Multimedia (4772 - 35165, n=55, últimos 2 anos) | |
| Asus VivoBook Pro 16 (v4.10.07 ) | |
| Acer Swift X SFX16-52G-77RX (v4.10.07 ) | |
| Schenker XMG Fusion 15 (Mid 22) (v4.10.07 ) | |
| Média NVIDIA GeForce RTX 3050 Ti Laptop GPU (5796 - 16665, n=22) | |
* ... menor é melhor
| The Witcher 3 - 1920x1080 Ultra Graphics & Postprocessing (HBAO+) | |
| Schenker XMG Fusion 15 (Mid 22) | |
| Dell Inspiron 16 Plus 7620 | |
| Média da turma Multimedia (11 - 121, n=10, últimos 2 anos) | |
| Média NVIDIA GeForce RTX 3050 Ti Laptop GPU (19 - 58.5, n=29) | |
| Asus VivoBook Pro 16 | |
| Acer Swift X SFX16-52G-77RX | |
| Final Fantasy XV Benchmark - 1920x1080 High Quality | |
| Schenker XMG Fusion 15 (Mid 22) (1.3) | |
| Média da turma Multimedia (7.61 - 144.4, n=60, últimos 2 anos) | |
| Dell Inspiron 16 Plus 7620 (1.3) | |
| Média NVIDIA GeForce RTX 3050 Ti Laptop GPU (23.5 - 106, n=24) | |
| Asus VivoBook Pro 16 (1.3) | |
| Acer Swift X SFX16-52G-77RX (1.3) | |
| Strange Brigade - 1920x1080 ultra AA:ultra AF:16 | |
| Schenker XMG Fusion 15 (Mid 22) (1.47.22.14 D3D12) | |
| Média da turma Multimedia (13.3 - 303, n=60, últimos 2 anos) | |
| Dell Inspiron 16 Plus 7620 (1.47.22.14 D3D12) | |
| Média NVIDIA GeForce RTX 3050 Ti Laptop GPU (34.8 - 101.3, n=25) | |
| Asus VivoBook Pro 16 (1.47.22.14 D3D12) | |
| Acer Swift X SFX16-52G-77RX (1.47.22.14 D3D12) | |
| Dota 2 Reborn - 1920x1080 ultra (3/3) best looking | |
| Dell Inspiron 16 Plus 7620 | |
| Schenker XMG Fusion 15 (Mid 22) | |
| Média NVIDIA GeForce RTX 3050 Ti Laptop GPU (67.3 - 145, n=27) | |
| Asus VivoBook Pro 16 | |
| Média da turma Multimedia (29 - 179.9, n=62, últimos 2 anos) | |
| Acer Swift X SFX16-52G-77RX | |
Witcher 3 FPS diagram
| baixo | média | alto | ultra | QHD | |
|---|---|---|---|---|---|
| GTA V (2015) | 175.1 | 170.9 | 111.9 | 53.8 | 39 |
| The Witcher 3 (2015) | 218.5 | 150.8 | 87.6 | 47.1 | |
| Dota 2 Reborn (2015) | 134.6 | 118.9 | 108.5 | 101.6 | |
| Final Fantasy XV Benchmark (2018) | 112.7 | 65 | 46.2 | 32 | |
| X-Plane 11.11 (2018) | 125.4 | 110.2 | 90.5 | ||
| Strange Brigade (2018) | 241 | 121.2 | 98.3 | 84.5 | 61 |
| Doom Eternal (2020) | 188.1 | 120 | |||
| Flight Simulator 2020 (2020) | 99 | 52.1 | 38.4 | 26.4 | 19.6 |
| F1 22 (2022) | 127.5 | 115.3 | 73.1 | 24.3 | 17.4 |
| FIFA 23 (2022) | 78.2 | ||||
| Uncharted Legacy of Thieves Collection (2022) | 48.4 | 30.5 | 20.6 | 20 | 14.1 |
| Call of Duty Modern Warfare 2 2022 (2022) | 63 | 58 | 44 | 36 | |
| Spider-Man Miles Morales (2022) | 66.6 | 53.6 | 44.8 | 36.8 | 26.3 |
| The Callisto Protocol (2022) | 82.5 | 62.2 | 58.3 | 31.7 | 21.4 |
| Need for Speed Unbound (2022) | 73.9 | 62.6 | 35.5 | 27.9 | 15.6 |
| High On Life (2023) | 104.7 | 77.5 | 60.3 | 50.8 | 31.8 |
| The Witcher 3 v4 (2023) | 88.4 | 75.6 | 36.8 | 32.4 | 19.6 |
| Dead Space Remake (2023) | 37.2 | 35.1 | 28.2 | 24.6 | 9.81 |
| Hogwarts Legacy (2023) | 63.9 | 50 | 40.2 | 32.8 | 25 |
| Returnal (2023) | 52 | 50 | 45 | 34 | 27 |
| Atomic Heart (2023) | 94.3 | 71.4 | 41.6 | 32.3 | 24.5 |
| Company of Heroes 3 (2023) | 106.2 | 91.1 | 68.4 | 68.5 | 48.8 |
| Sons of the Forest (2023) | 54.9 | 38.8 | 35.4 | 33.3 | 25.6 |
| Resident Evil 4 Remake (2023) | 74.6 | 47.4 | 41 | 8.97 | 7.82 |
| The Last of Us (2023) | 44.9 | 32.9 | 25.6 | ||
| Dead Island 2 (2023) | 95.7 | 75.7 | 64.1 | 58 | 45.9 |
| Star Wars Jedi Survivor (2023) | 36.9 | 31 | 28.9 | 25.8 | 15.4 |
Emissões e energia - O computador Asus é barulhento
Emissões de ruído
No modo inativo, bem como no uso diário (escritório, Internet), o laptop geralmente funciona de forma silenciosa, às vezes até silenciosamente. Com carga total, medimos emissões de ruído de até 61,5 dB(A) ("modo de desempenho") - muito alto. O uso do "modo padrão" levou a uma relação mais equilibrada entre ruído e desempenho - mesmo assim, o cooler fez bastante barulho.
o "modo sussurro" provavelmente será a primeira opção da maioria dos usuários, pois faz exatamente o que diz na embalagem: as ventoinhas funcionam em baixa velocidade, mesmo sob carga, e são quase inaudíveis, às custas da potência de processamento. Os jogos ainda são possíveis, mas somente em HD.
Barulho
| Ocioso |
| 25.2 / 25.2 / 25.2 dB |
| Carga |
| 55.1 / 61.5 dB |
 | ||
30 dB silencioso 40 dB(A) audível 50 dB(A) ruidosamente alto |
||
min: | ||
| Asus VivoBook Pro 16 GeForce RTX 3050 Ti Laptop GPU, i7-12700H, Intel SSD 670p SSDPEKNU010TZ | Dell Inspiron 16 Plus 7620 GeForce RTX 3050 Ti Laptop GPU, i7-12700H, Kioxia BG5 KBG50ZNS512G | Schenker XMG Fusion 15 (Mid 22) GeForce RTX 3070 Laptop GPU, i7-11800H, Samsung SSD 980 Pro 1TB MZ-V8P1T0BW | Acer Swift X SFX16-52G-77RX A370M, i7-1260P, WDC PC SN810 1TB | |
|---|---|---|---|---|
| Noise | 3% | 0% | 8% | |
| desligado / ambiente * (dB) | 25.2 | 23.3 8% | 26 -3% | 25 1% |
| Idle Minimum * (dB) | 25.2 | 25.7 -2% | 26 -3% | 25 1% |
| Idle Average * (dB) | 25.2 | 26.1 -4% | 28 -11% | 25 1% |
| Idle Maximum * (dB) | 25.2 | 30.6 -21% | 31 -23% | 25 1% |
| Load Average * (dB) | 55.1 | 46.2 16% | 45 18% | 44.7 19% |
| Load Maximum * (dB) | 61.5 | 49.4 20% | 48 22% | 45.6 26% |
| Witcher 3 ultra * (dB) | 49.2 | 46 |
* ... menor é melhor
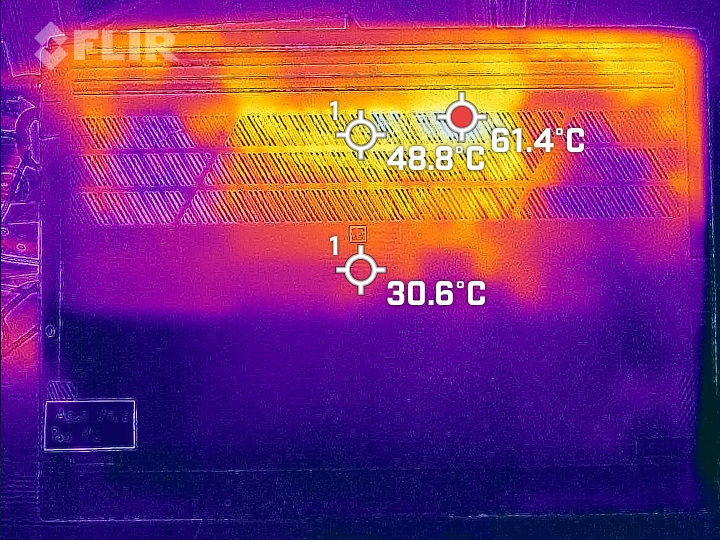
Temperatura
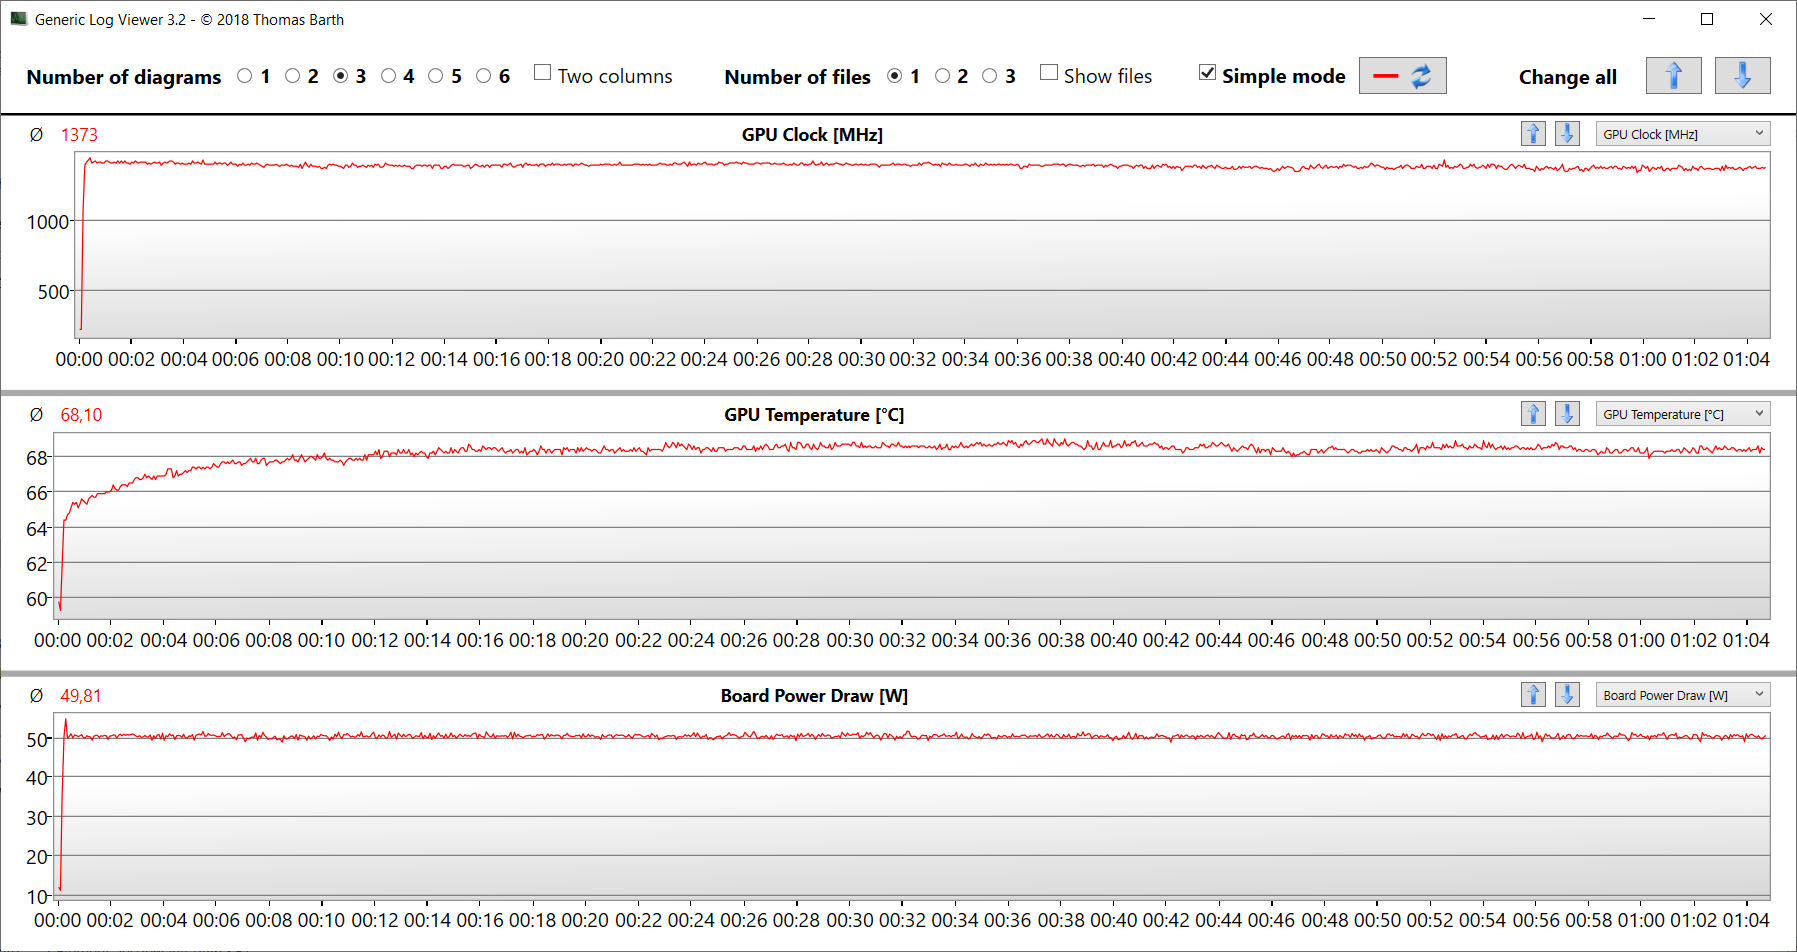
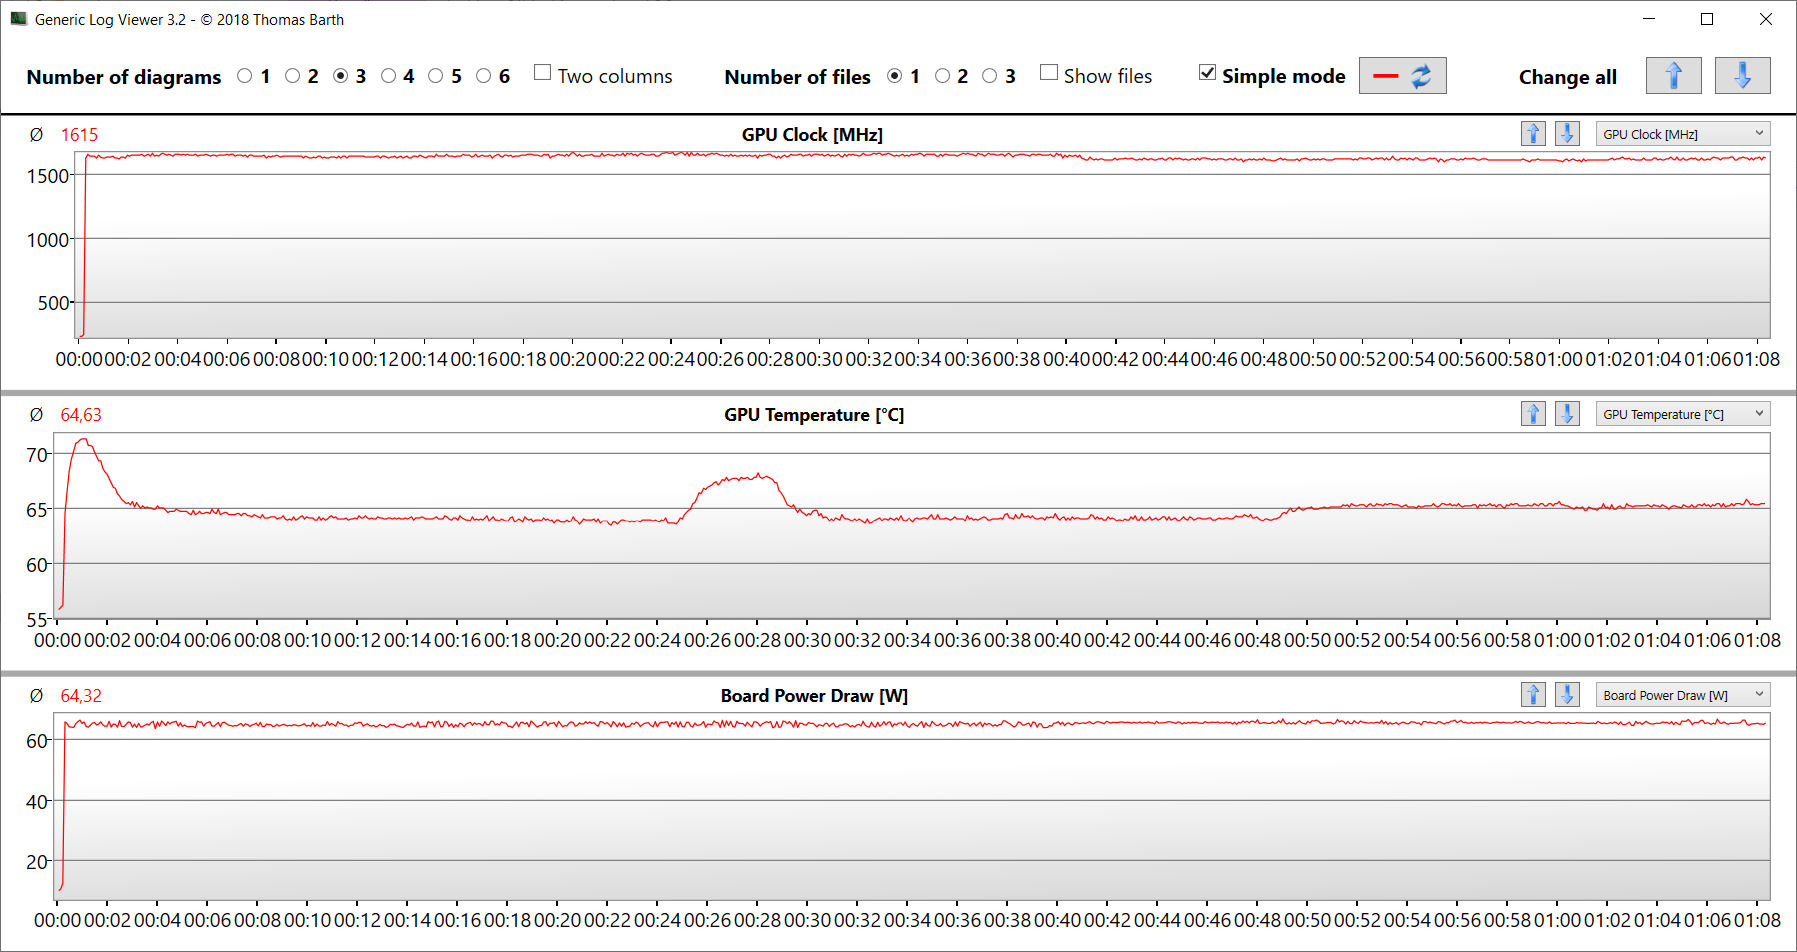
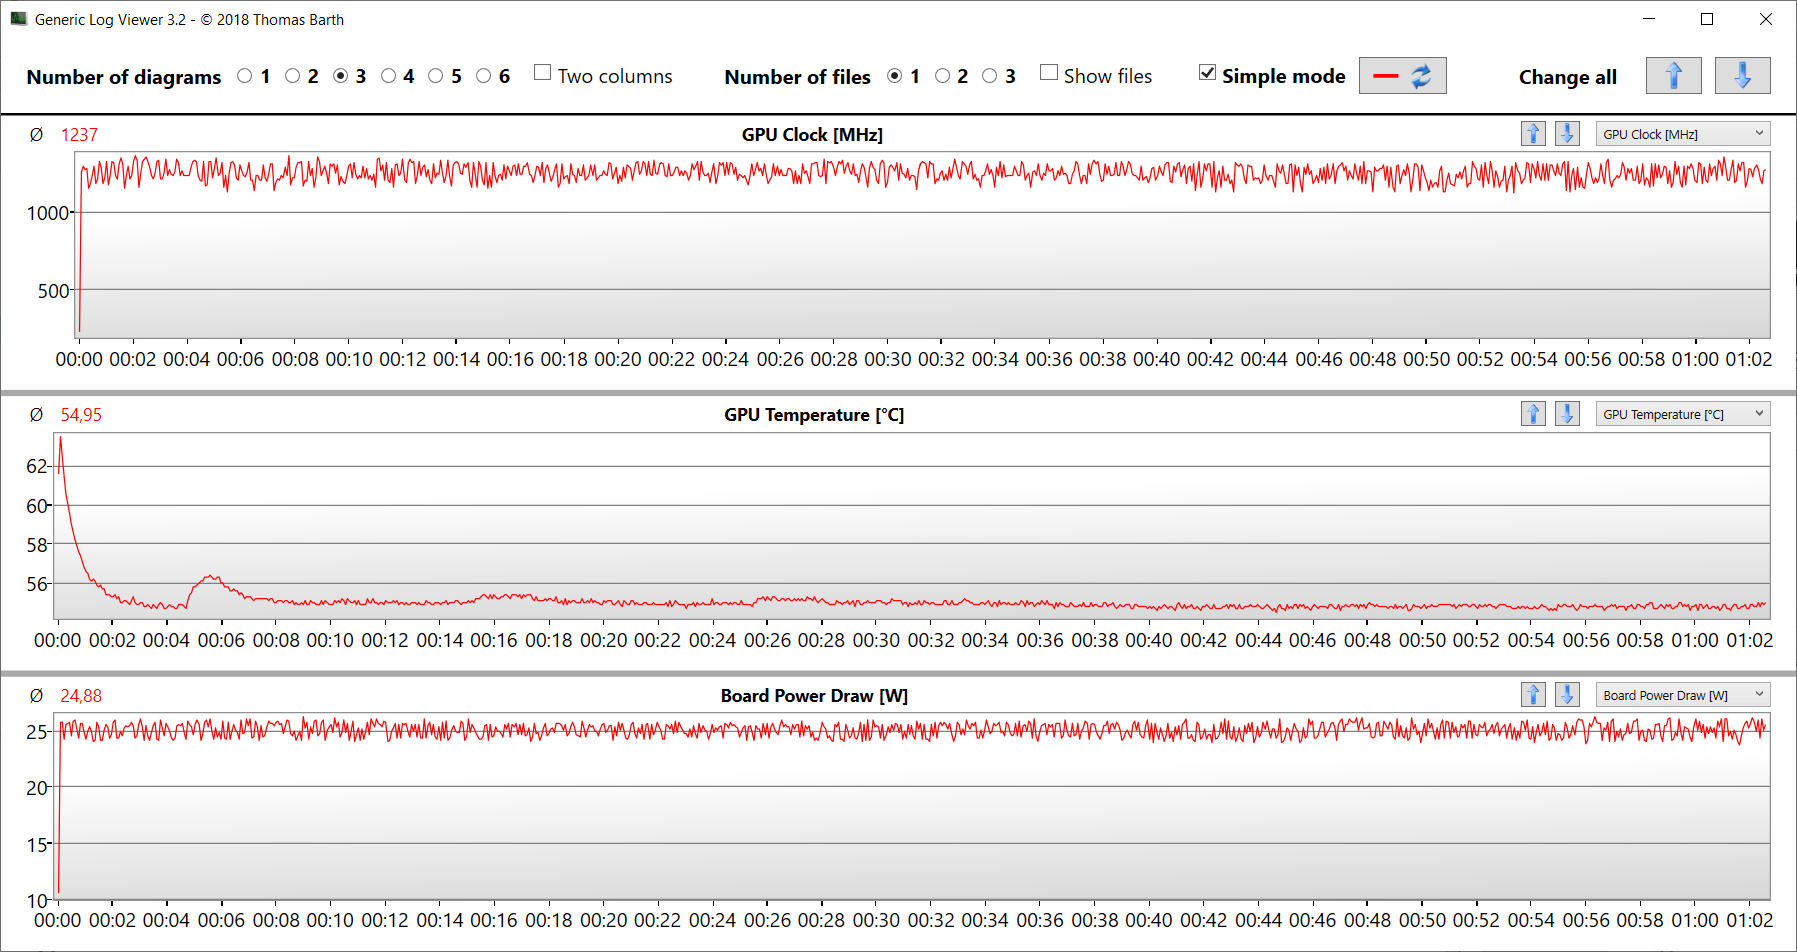
Quando carregado, o laptop atingiu temperaturas bastante altas, mas, em média, suas temperaturas atingiram níveis moderados. Isso significa que medimos um máximo de 55,5 °C durante nosso teste de estresse. No entanto, no uso diário, as temperaturas geralmente se encontram dentro de uma faixa aceitável.
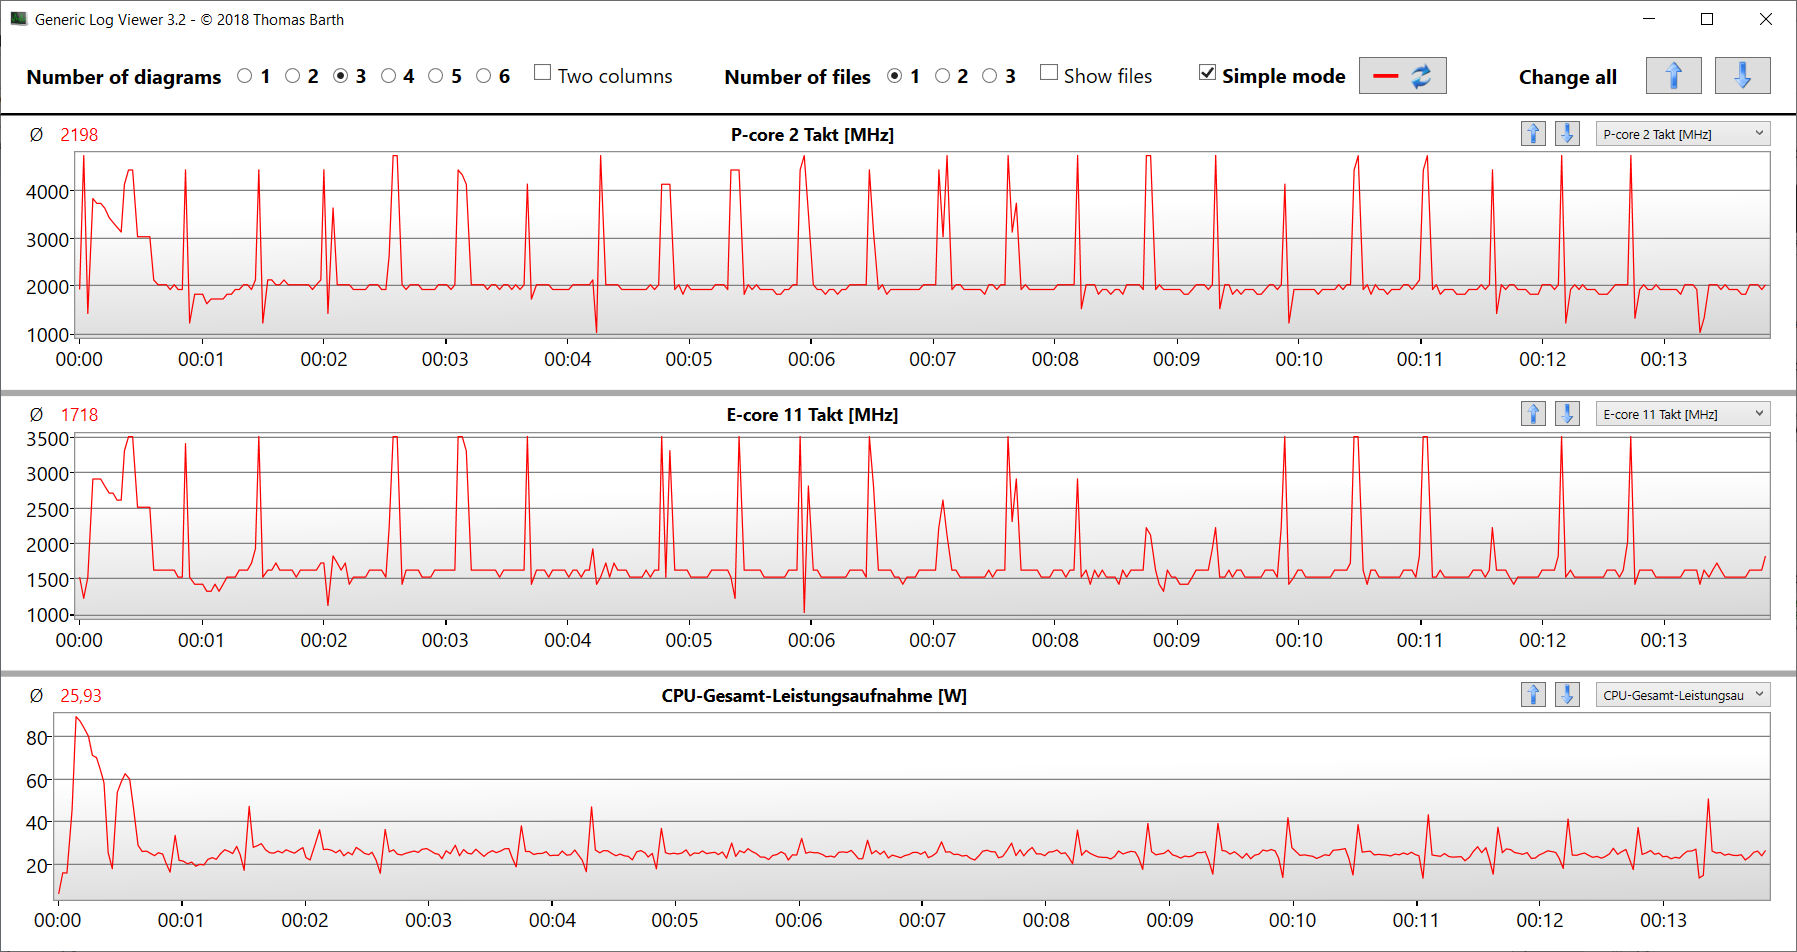
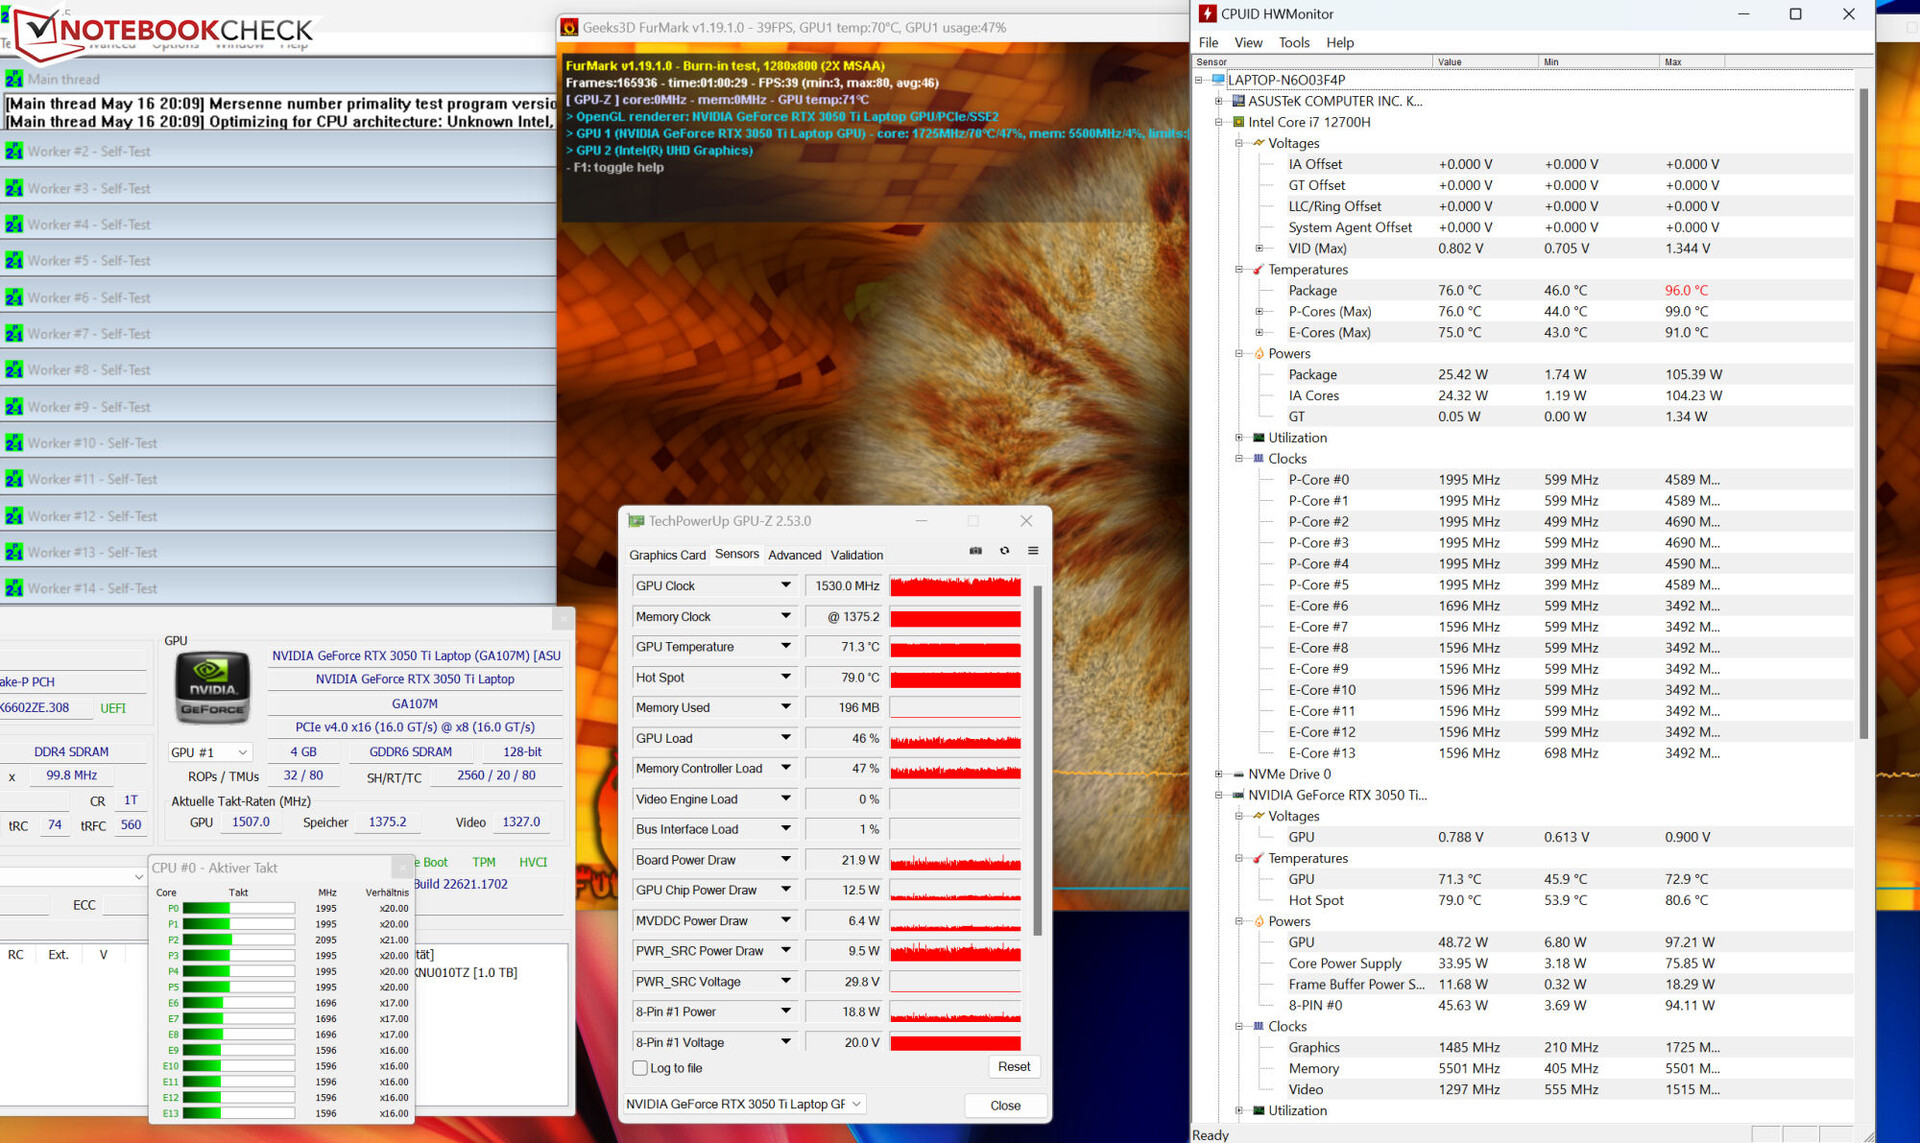
O teste de estresse (Prime95 e Furmark em uso contínuo) simula um cenário extremo para testar a estabilidade do sistema em carga total. A CPU começou o teste de estresse com taxas de clock médias (P: 3,2 - 3,3 GHz; E: 2,7 GHz) e o núcleo gráfico tinha uma taxa de 1,1 - 1,4 GHz. Enquanto as taxas da CPU caíram no decorrer do teste, as taxas de clock da GPU aumentaram um pouco.
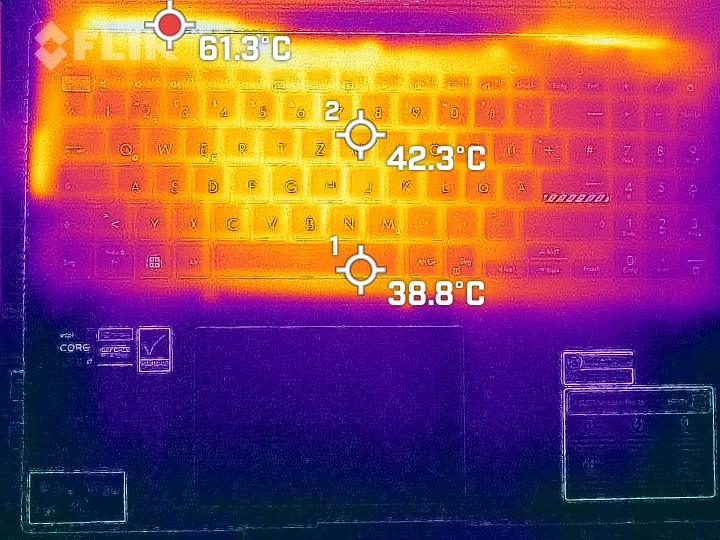
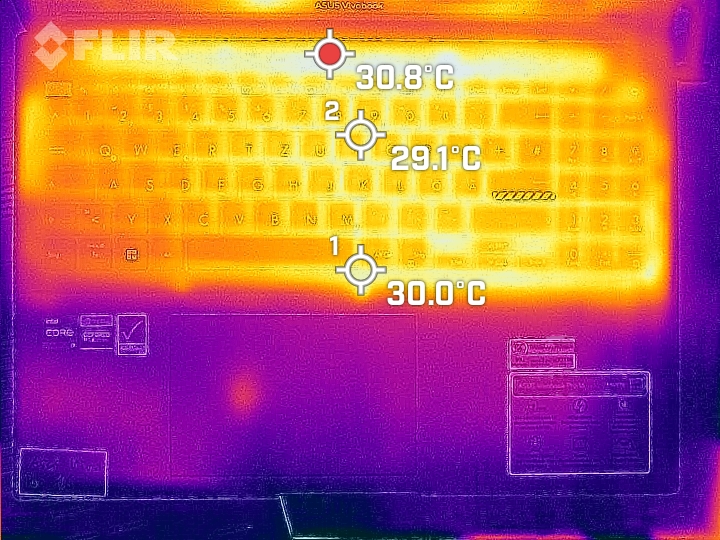
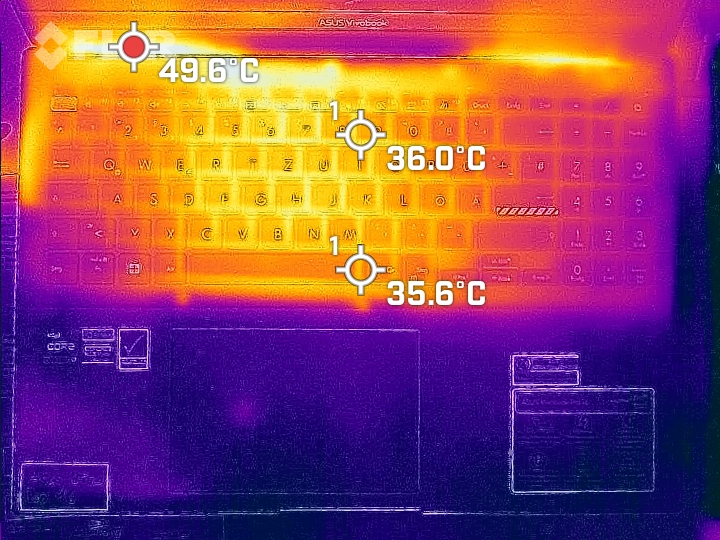
(±) A temperatura máxima no lado superior é 44.2 °C / 112 F, em comparação com a média de 36.8 °C / 98 F , variando de 21 a 71 °C para a classe Multimedia.
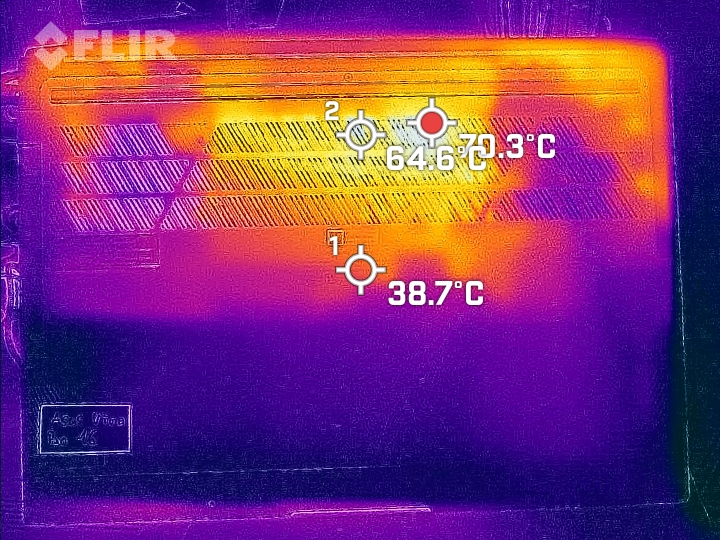
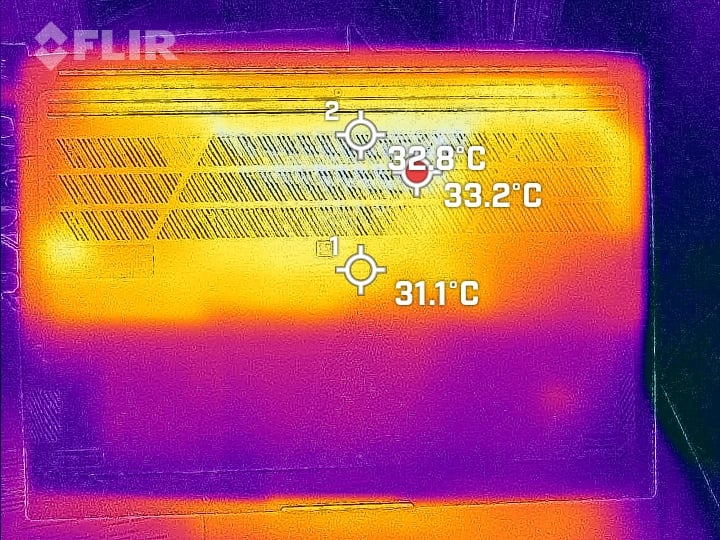
(-) A parte inferior aquece até um máximo de 53 °C / 127 F, em comparação com a média de 39.1 °C / 102 F
(+) Em uso inativo, a temperatura média para o lado superior é 27.9 °C / 82 F, em comparação com a média do dispositivo de 31.3 °C / ### class_avg_f### F.
(±) Jogando The Witcher 3, a temperatura média para o lado superior é 33.3 °C / 92 F, em comparação com a média do dispositivo de 31.3 °C / ## #class_avg_f### F.
(+) Os apoios para as mãos e o touchpad são mais frios que a temperatura da pele, com um máximo de 23.7 °C / 74.7 F e, portanto, são frios ao toque.
(+) A temperatura média da área do apoio para as mãos de dispositivos semelhantes foi 28.7 °C / 83.7 F (+5 °C / 9 F).
| Asus VivoBook Pro 16 Intel Core i7-12700H, NVIDIA GeForce RTX 3050 Ti Laptop GPU | Dell Inspiron 16 Plus 7620 Intel Core i7-12700H, NVIDIA GeForce RTX 3050 Ti Laptop GPU | Schenker XMG Fusion 15 (Mid 22) Intel Core i7-11800H, NVIDIA GeForce RTX 3070 Laptop GPU | Acer Swift X SFX16-52G-77RX Intel Core i7-1260P, Intel Arc A370M | |
|---|---|---|---|---|
| Heat | 10% | -13% | 3% | |
| Maximum Upper Side * (°C) | 44.2 | 46 -4% | 52 -18% | 49.4 -12% |
| Maximum Bottom * (°C) | 53 | 45.8 14% | 63 -19% | 55.5 -5% |
| Idle Upper Side * (°C) | 32.1 | 29.2 9% | 37 -15% | 28.4 12% |
| Idle Bottom * (°C) | 38.4 | 31 19% | 38 1% | 32.6 15% |
* ... menor é melhor
Alto-falantes
Os alto-falantes estéreo produzem um som decente, mas quase nenhum baixo.
Asus VivoBook Pro 16 análise de áudio
(+) | os alto-falantes podem tocar relativamente alto (###valor### dB)
Graves 100 - 315Hz
(-) | quase nenhum baixo - em média 20.8% menor que a mediana
(±) | a linearidade dos graves é média (12.8% delta para a frequência anterior)
Médios 400 - 2.000 Hz
(+) | médios equilibrados - apenas 2.2% longe da mediana
(+) | médios são lineares (4.7% delta para frequência anterior)
Altos 2 - 16 kHz
(±) | máximos mais altos - em média 7.4% maior que a mediana
(+) | os máximos são lineares (5.9% delta da frequência anterior)
Geral 100 - 16.000 Hz
(±) | a linearidade do som geral é média (16.2% diferença em relação à mediana)
Comparado com a mesma classe
» 41% de todos os dispositivos testados nesta classe foram melhores, 7% semelhantes, 51% piores
» O melhor teve um delta de 5%, a média foi 17%, o pior foi 45%
Comparado com todos os dispositivos testados
» 26% de todos os dispositivos testados foram melhores, 6% semelhantes, 68% piores
» O melhor teve um delta de 4%, a média foi 23%, o pior foi 134%
Dell Inspiron 16 Plus 7620 análise de áudio
(+) | os alto-falantes podem tocar relativamente alto (###valor### dB)
Graves 100 - 315Hz
(-) | quase nenhum baixo - em média 22.2% menor que a mediana
(±) | a linearidade dos graves é média (9.7% delta para a frequência anterior)
Médios 400 - 2.000 Hz
(+) | médios equilibrados - apenas 3.3% longe da mediana
(+) | médios são lineares (5.3% delta para frequência anterior)
Altos 2 - 16 kHz
(+) | agudos equilibrados - apenas 2.5% longe da mediana
(+) | os máximos são lineares (4.7% delta da frequência anterior)
Geral 100 - 16.000 Hz
(+) | o som geral é linear (13.4% diferença em relação à mediana)
Comparado com a mesma classe
» 28% de todos os dispositivos testados nesta classe foram melhores, 5% semelhantes, 68% piores
» O melhor teve um delta de 5%, a média foi 17%, o pior foi 45%
Comparado com todos os dispositivos testados
» 14% de todos os dispositivos testados foram melhores, 4% semelhantes, 82% piores
» O melhor teve um delta de 4%, a média foi 23%, o pior foi 134%
Consumo de energia
O laptop não apresentou nenhuma taxa de consumo de energia evidente. Os valores que medimos estão em um nível normal para o hardware instalado. O teste Witcher 3 foi executado com consumo de energia constante. Sua fonte de alimentação (150 watts) tem tamanho suficiente.
| desligado | |
| Ocioso | |
| Carga |
|
Key:
min: | |
| Asus VivoBook Pro 16 i7-12700H, GeForce RTX 3050 Ti Laptop GPU, Intel SSD 670p SSDPEKNU010TZ, IPS, 2560x1600, 16" | Dell Inspiron 16 Plus 7620 i7-12700H, GeForce RTX 3050 Ti Laptop GPU, Kioxia BG5 KBG50ZNS512G, IPS, 3072x1920, 16" | Schenker XMG Fusion 15 (Mid 22) i7-11800H, GeForce RTX 3070 Laptop GPU, Samsung SSD 980 Pro 1TB MZ-V8P1T0BW, IPS, 2560x1440, 15.6" | Acer Swift X SFX16-52G-77RX i7-1260P, A370M, WDC PC SN810 1TB, IPS-LED, 2560x1600, 16" | Média NVIDIA GeForce RTX 3050 Ti Laptop GPU | Média da turma Multimedia | |
|---|---|---|---|---|---|---|
| Power Consumption | 12% | -26% | 42% | 10% | 32% | |
| Idle Minimum * (Watt) | 8.7 | 6.8 22% | 12 -38% | 3.7 57% | 8.2 ? 6% | 5.72 ? 34% |
| Idle Average * (Watt) | 13.1 | 9.6 27% | 17 -30% | 7.6 42% | 12.6 ? 4% | 10.2 ? 22% |
| Idle Maximum * (Watt) | 18.3 | 17 7% | 24 -31% | 11.1 39% | 17.2 ? 6% | 12.4 ? 32% |
| Load Average * (Watt) | 116 | 117.5 -1% | 106 9% | 70 40% | 92 ? 21% | 65.5 ? 44% |
| Witcher 3 ultra * (Watt) | 117.6 | 113.1 4% | 159.9 -36% | 68.8 41% | ||
| Load Maximum * (Watt) | 162 | 137.4 15% | 208 -28% | 108 33% | 139.1 ? 14% | 114 ? 30% |
* ... menor é melhor
power consumption Witcher 3 / stress test
Power consumption with external monitor
Duração da bateria
O laptop de 16 polegadas conseguiu um tempo de execução de 7:14 h em nosso teste prático de WLAN (mapeamento da carga ao chamar sites através de um script) - um valor decente, mas não excelente. No campo de comparação, o VivoBook ocupa o último lugar.
Pro
Contra
Veredicto - Um multimídia versátil com uma tela impressionante
Edição de vídeos e fotos, streaming, renderização e jogos: Tudo isso faz parte dos principais pontos fortes do VivoBook Pro 16. Seu processadorCore 7-12700HeGeForce Laptop RTX 3050 Tifornecem toda a potência necessária - ambos os componentes funcionam consistentemente com altas taxas de clock. No entanto, ele não é usado em todo o seu potencial, pois a RAM só funciona no modo de canal único.
O VivoBook Pro 16 da Asus é um laptop adequado para jogadores e criadores que não dão muita importância a ter o hardware mais novo.
O laptop só esquenta um pouco quando carregado, mas pode ficar muito alto - ou até mesmo muito alto. Um ponto positivo: O dispositivo oferece um modo silencioso que pode reduzir as emissões de ruído que o laptop produz às custas de seu desempenho, o que pode, pelo menos, permitir um trabalho um pouco mais relaxado.
Sua construção compacta, peso relativamente pequeno (1,9 kg) e tempos de execução decentes (WLAN: 7:15 h) tornam o VivoBook um dispositivo bastante móvel. Um ponto positivo: A bateria pode ser carregada usando uma fonte de alimentação USB-C (mín. 65 watts, 20 V) - ambas as portas USB-C suportam fornecimento de energia. Você não precisa continuar usando a fonte de alimentação proprietária incluída.
Nossa amostra de teste não tem uma tela OLED, mas ela geralmente está disponível na série VivoBook Pro 16. Você não deve perdê-la: A tela IPS instalada (16 polegadas, 2.560 x 1.600 pixels) no formato 16:10 impressiona pelo brilho, bom contraste, ângulos de visão estáveis, tempos de reação curtos, ótima representação de cores e excelente cobertura do espaço de cores.
como alternativa, você pode dar uma olhada noDell Inspiron 16 Plus 7620: Com desempenho comparável, ele oferece tempos de execução consideravelmente melhores. Uma alternativa econômica é oAcer Swift X 16que oferece desempenho gráfico inferior, mas pode oferecer tempos de execução muito bons e um preço de cerca de US$ 1.000.
Preço e disponibilidade
A versão do Asus VivoBook Pro 16 que testamos pode ser adquirida na Amazon por US$ 1.247.
Asus VivoBook Pro 16
- 05/22/2023 v7 (old)
Sascha Mölck
Transparência
A seleção dos dispositivos a serem analisados é feita pela nossa equipe editorial. A amostra de teste foi fornecida ao autor como empréstimo pelo fabricante ou varejista para fins desta revisão. O credor não teve influência nesta revisão, nem o fabricante recebeu uma cópia desta revisão antes da publicação. Não houve obrigação de publicar esta revisão. Como empresa de mídia independente, a Notebookcheck não está sujeita à autoridade de fabricantes, varejistas ou editores.
É assim que o Notebookcheck está testando
Todos os anos, o Notebookcheck analisa de forma independente centenas de laptops e smartphones usando procedimentos padronizados para garantir que todos os resultados sejam comparáveis. Desenvolvemos continuamente nossos métodos de teste há cerca de 20 anos e definimos padrões da indústria no processo. Em nossos laboratórios de teste, equipamentos de medição de alta qualidade são utilizados por técnicos e editores experientes. Esses testes envolvem um processo de validação em vários estágios. Nosso complexo sistema de classificação é baseado em centenas de medições e benchmarks bem fundamentados, o que mantém a objetividade.Price comparison

