Schenker XMG Fusion 15 (meados de 22) em revisão: Laptop leve RTX 3070 com boa duração da bateria
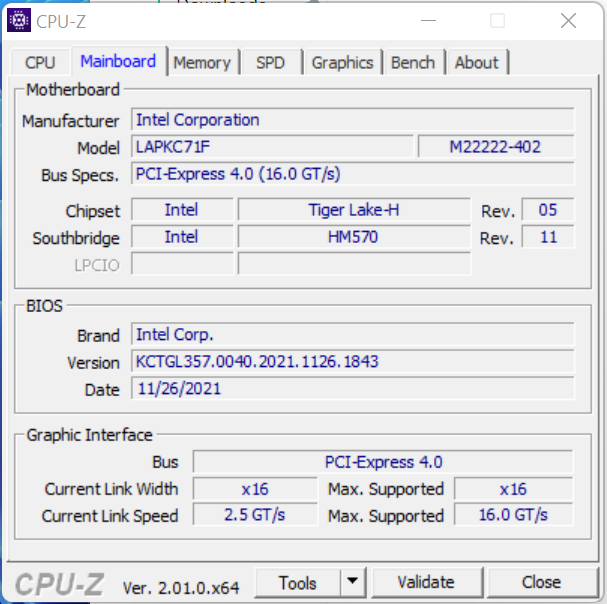
O Schenker XMG Fusion 15 é principalmente um laptop para jogos, mas também é projetado para o setor criativo. O dispositivo oferece um compromisso entre desempenho, tamanho pequeno e portabilidade: hardware de alta qualidade (Núcleo i7-11800H,GeForce Computador portátil RTX 3070) é emparelhado com uma bateria de 93 Wh e embalado em uma caixa compacta. A embalagem inteira pesa pouco menos de 2 kg (~4,4 lb). Um barebone da Intel (NUC X15 Laptop Kit C71FBF) serve como base para o Fusion
Seus concorrentes são dispositivos igualmente compactos e leves, como o Razer Blade 15 Modelo de baseoMSI Delta 15e oAsus TUF Dash F15 FX517ZR. O grupo mais amplo de concorrentes inclui laptops como o Acer Nitro 5 AN515-58e o HP Omen 16.
Possíveis concorrentes em comparação
Avaliação | Data | Modelo | Peso | Altura | Size | Resolução | Preço |
|---|---|---|---|---|---|---|---|
| 87.4 % v7 (old) | 08/2022 | Schenker XMG Fusion 15 (Mid 22) i7-11800H, GeForce RTX 3070 Laptop GPU | 1.9 kg | 21.65 mm | 15.60" | 2560x1440 | |
| 85.8 % v7 (old) | 07/2022 | Asus TUF Dash F15 FX517ZR i7-12650H, GeForce RTX 3070 Laptop GPU | 2 kg | 20.7 mm | 15.60" | 2560x1440 | |
| 84 % v7 (old) | 06/2022 | Acer Nitro 5 AN515-58-72QR i7-12700H, GeForce RTX 3070 Ti Laptop GPU | 2.5 kg | 26.8 mm | 15.60" | 2560x1440 | |
| 85.5 % v7 (old) | 05/2022 | HP Omen 16-b1090ng i7-12700H, GeForce RTX 3070 Ti Laptop GPU | 2.3 kg | 23 mm | 16.10" | 2560x1440 | |
| 82.9 % v7 (old) | 10/2021 | MSI Delta 15 A5EFK R9 5900HX, Radeon RX 6700M | 2 kg | 19 mm | 15.60" | 1920x1080 | |
| 85.5 % v7 (old) | 03/2021 | Razer Blade 15 Base Edition 2021, i7-10750H RTX 3060 i7-10750H, GeForce RTX 3060 Laptop GPU | 2.1 kg | 19.9 mm | 15.60" | 1920x1080 |
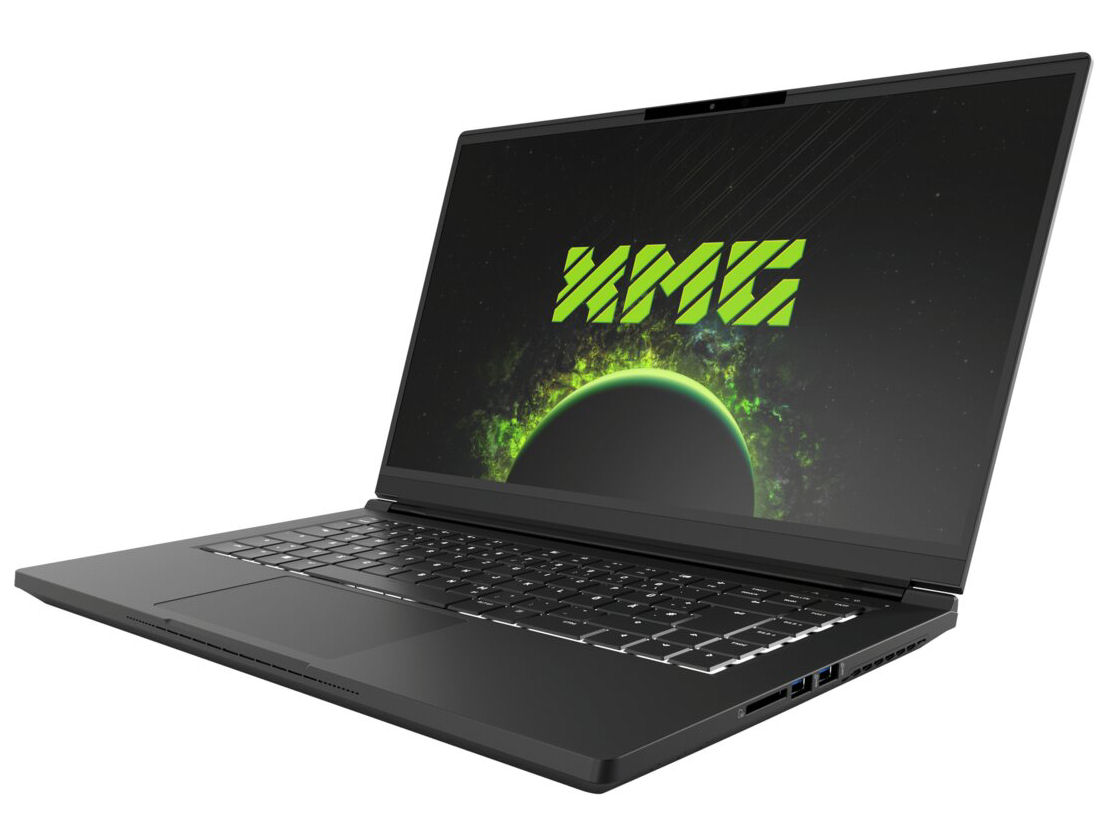
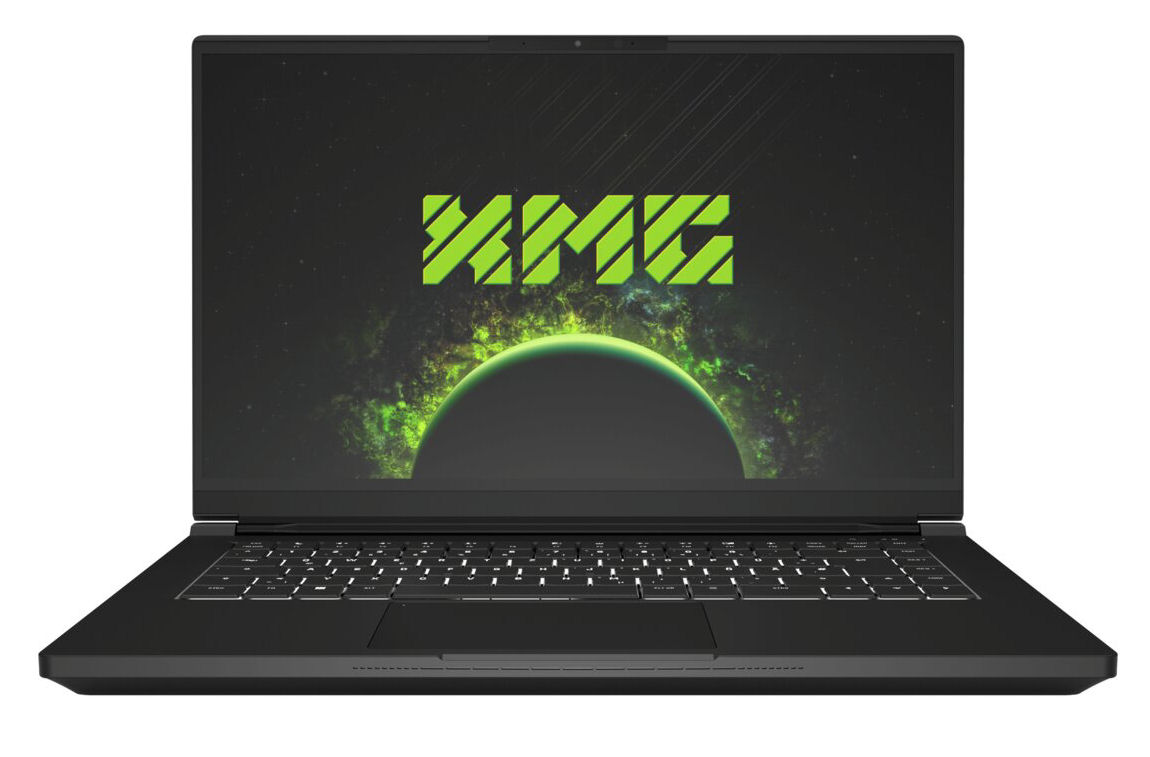
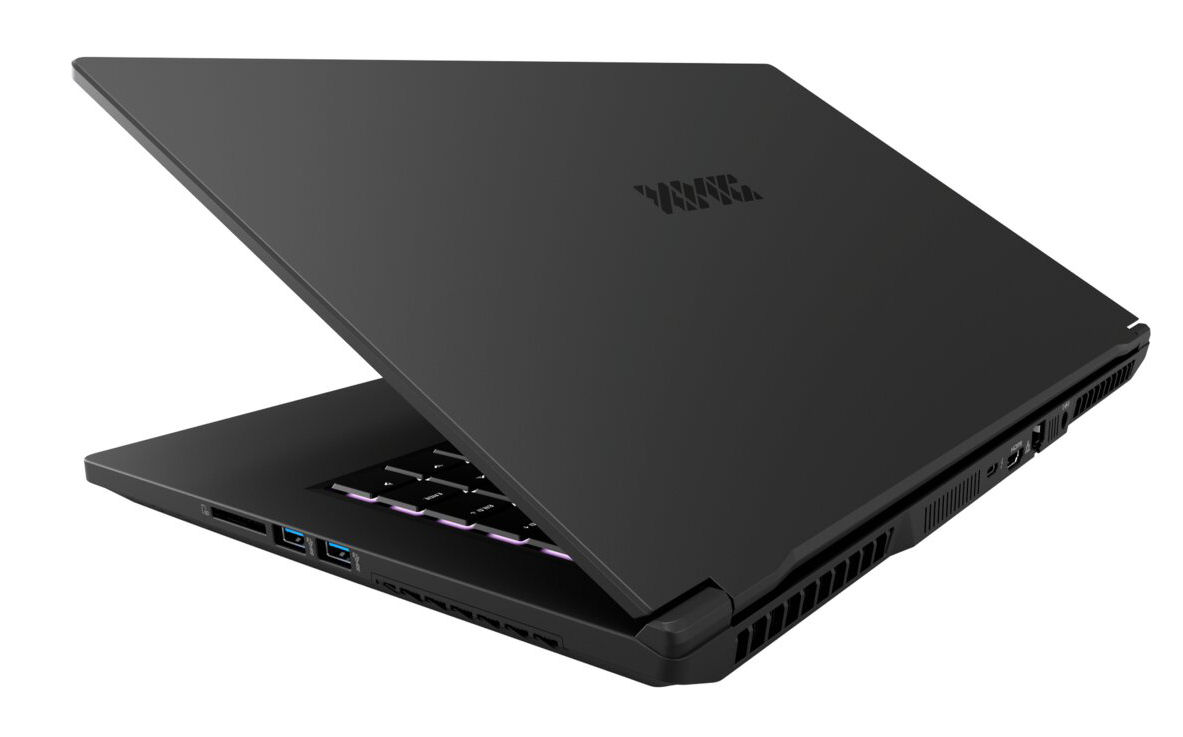
Case - Um chassi de magnésio para a Fusão
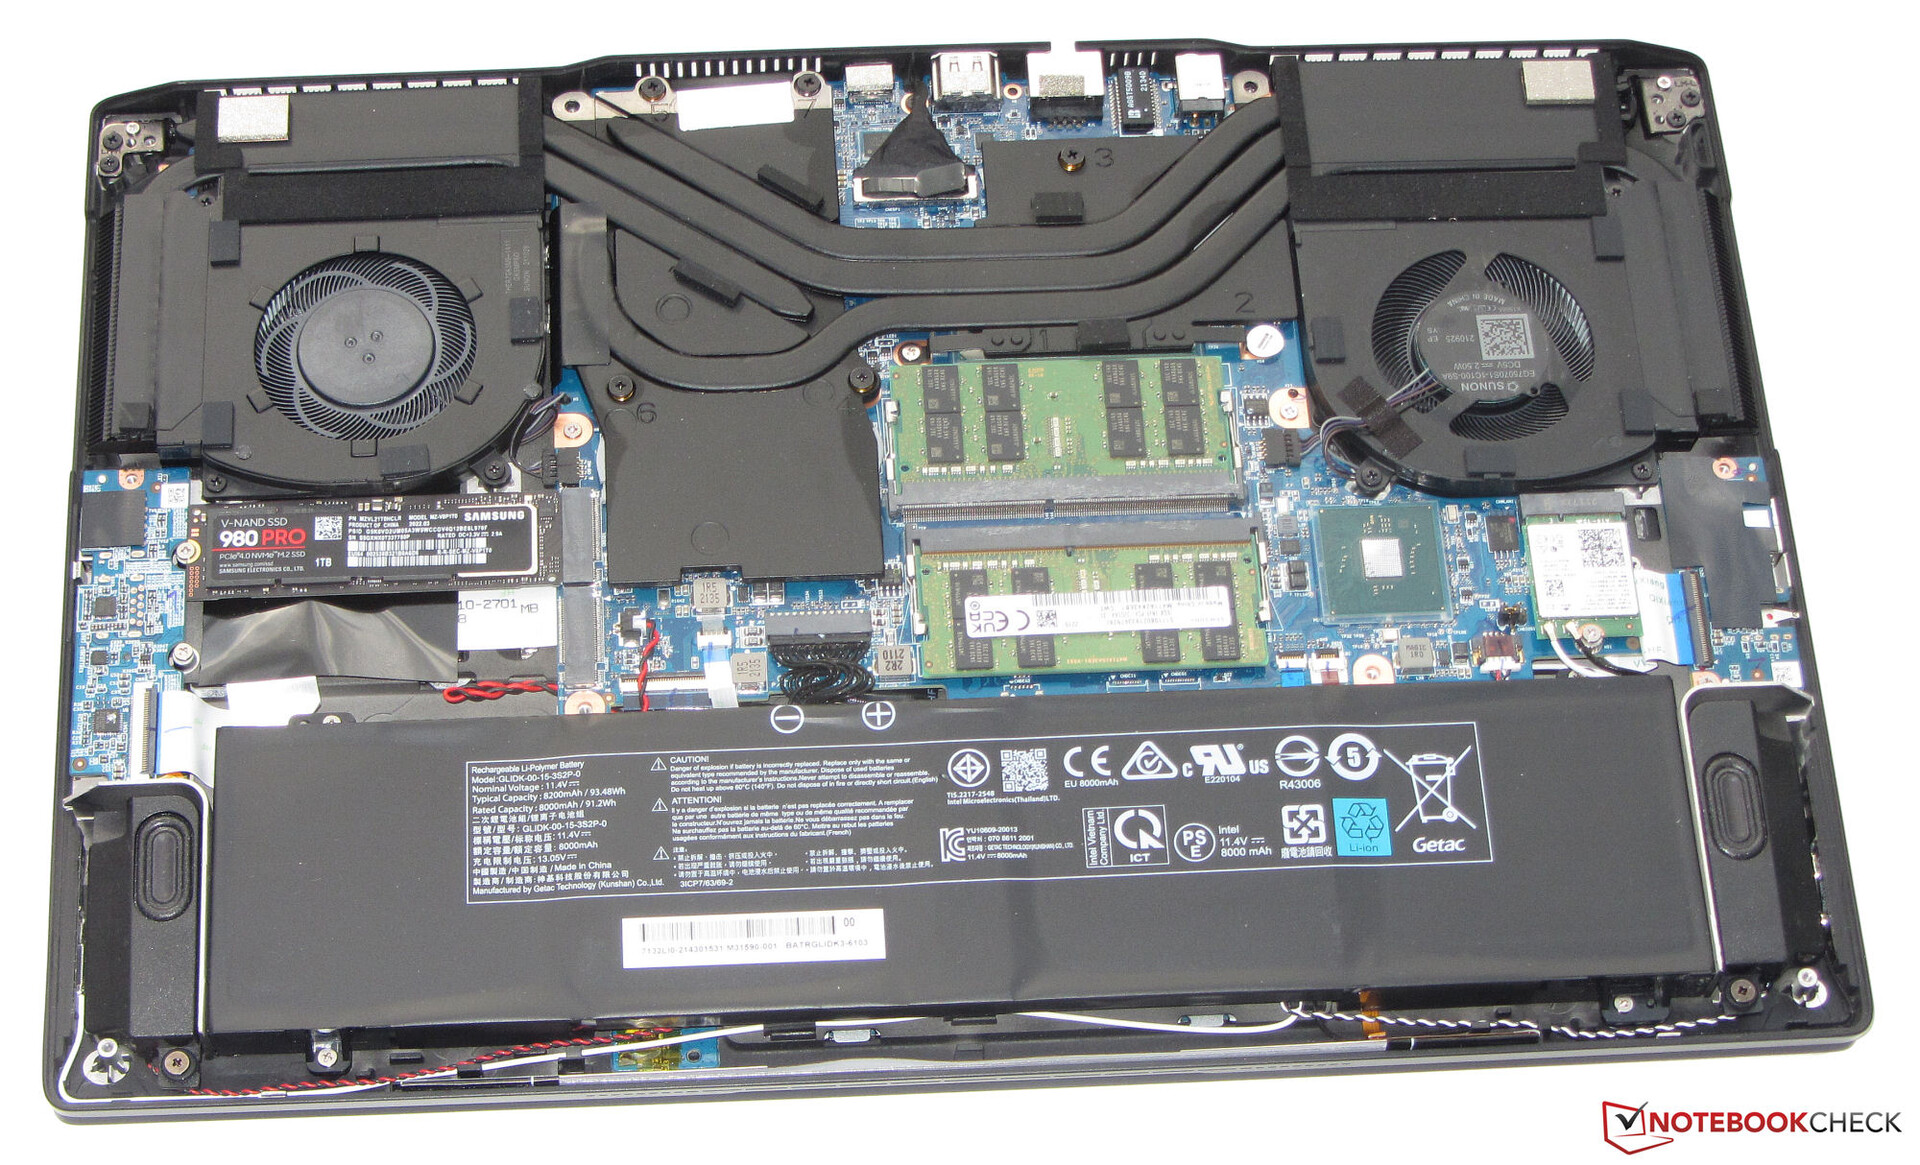
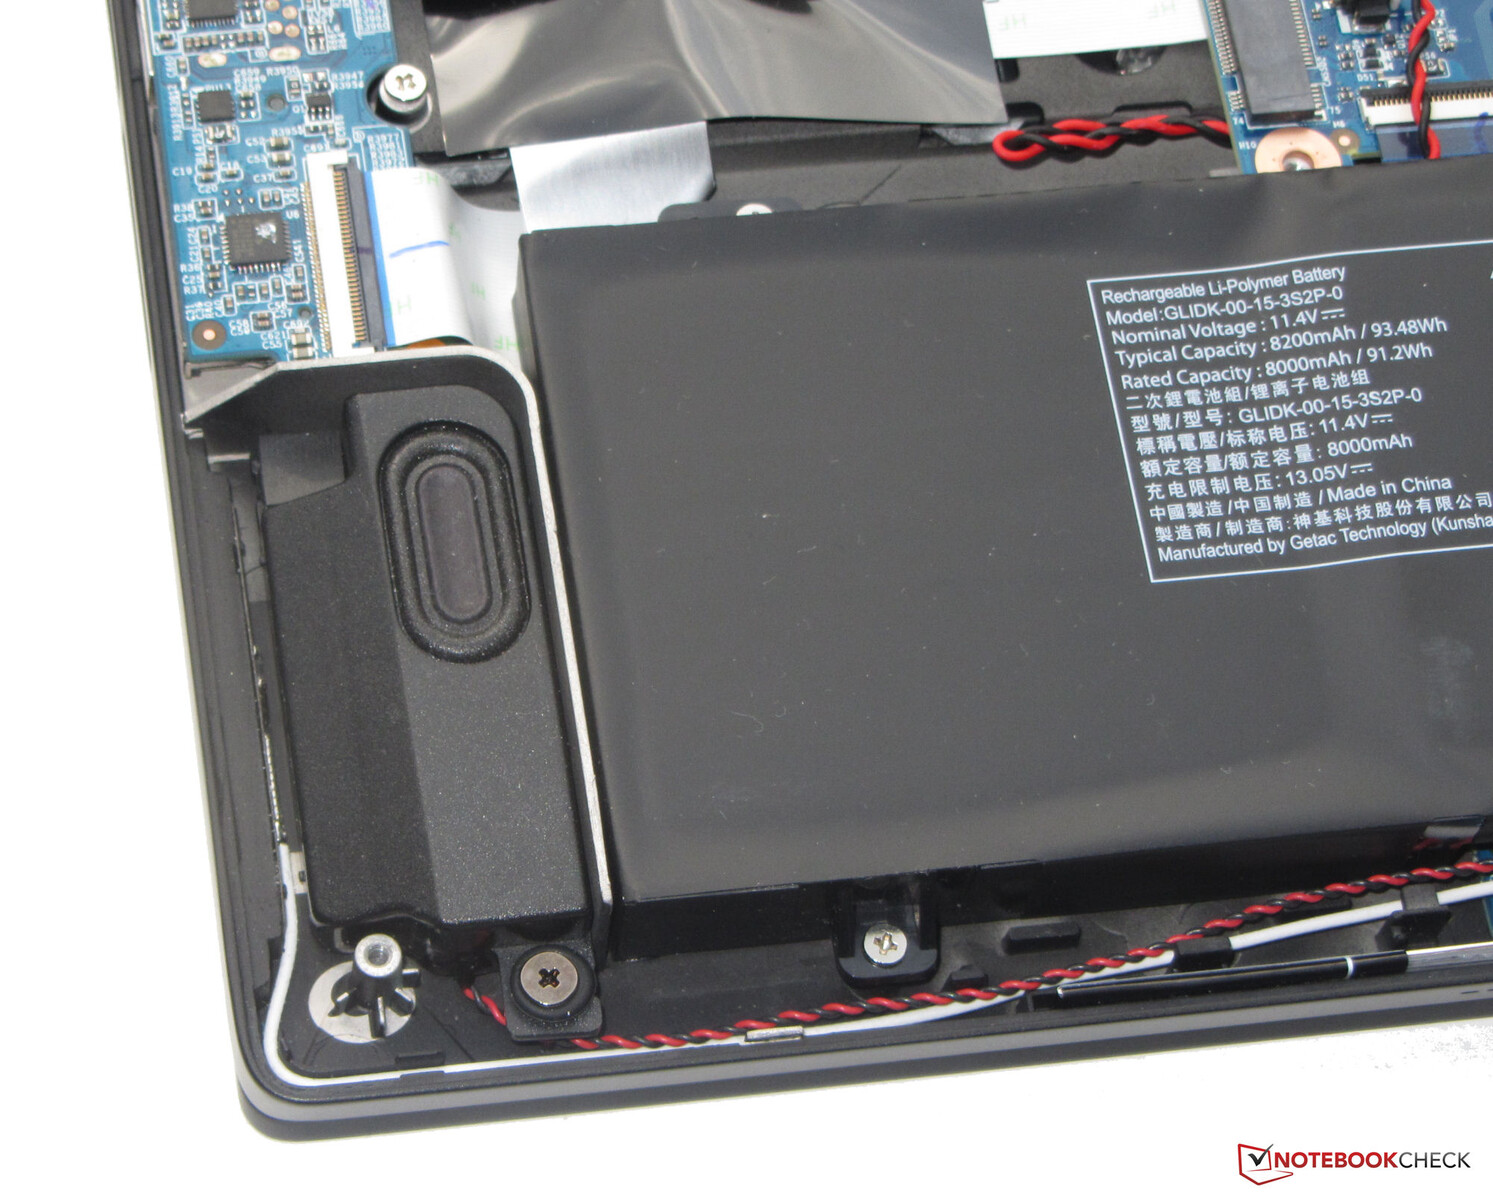
A caixa preta mate é fabricada a partir de uma liga de magnésio, e oferece um design elegante e sem frescuras. A Schenker opta por superfícies lisas. Uma faixa LED configurável (RGB) no lado do estojo que está de frente para o usuário fornece alguma cor além da iluminação do teclado. A bateria é incorporada ao dispositivo (parafusada, não colada). É possível acessar o interior após remover a tampa inferior.
O laptop não apresenta nenhuma falha de fabricação. As dimensões da fenda são precisas, e não há saliências de material a serem encontradas. A unidade base dificilmente pode ser dobrada, mas a tampa pode. As dobradiças mantêm a tampa firmemente na posição, e o ângulo máximo de abertura é de 180 graus. É possível uma abertura de uma mão da tampa.

A Fusão não pode corresponder às dimensões compactas do Lâmina 15mas reduz seu peso em cerca de 200 gramas (~7 oz). Isto o torna o dispositivo mais leve no campo de comparação
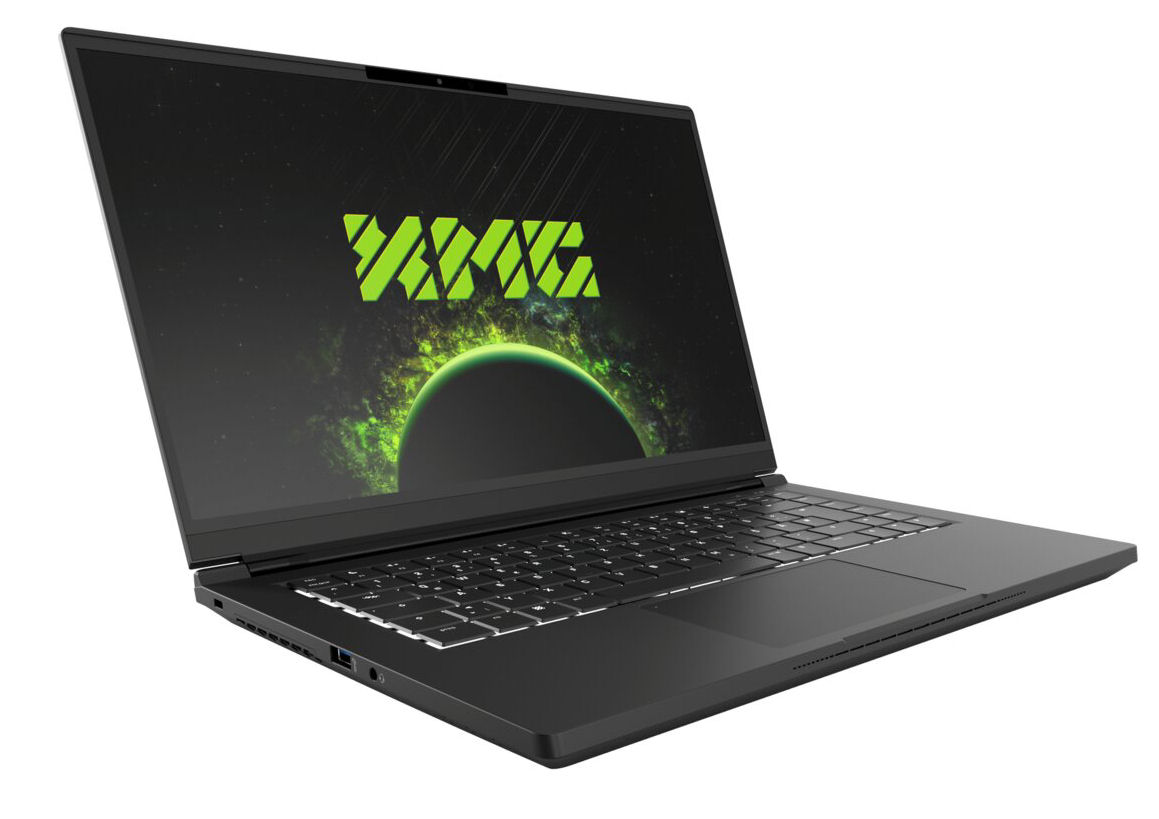
Conectividade - XMG 15 equipado com Thunderbolt 4
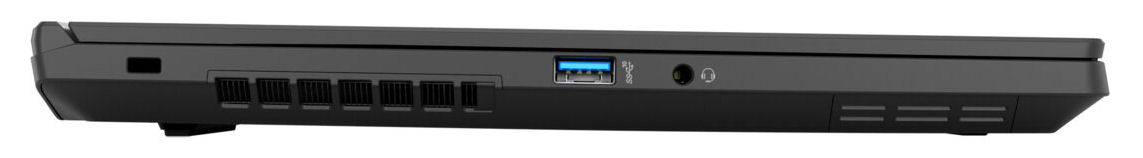
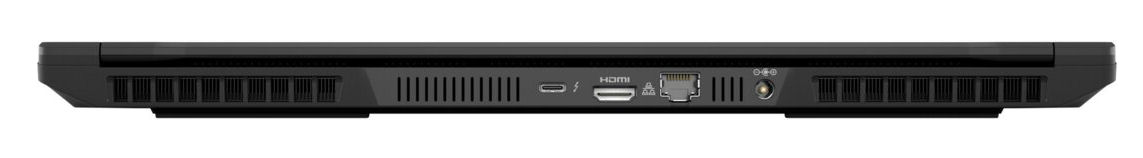
O Fusion tem três portas USB-A (USB 3.2 Gen 2) e uma porta USB-C (Thunderbolt 4). Esta última suporta DisplayPort via USB-C. Ao todo, o laptop oferece duas saídas de vídeo (1x DP, 1x HDMI). Além disso, há uma tomada de áudio combinada, uma porta Gigabit Ethernet e um slot para um trava de cabo.
As portas são distribuídas por três lados do laptop. Ótimo: As saídas de vídeo, a porta Ethernet e a conexão de energia estão localizadas na parte de trás do dispositivo. Portanto, os cabos correspondentes correm em direção à parte de trás e não atrapalham.
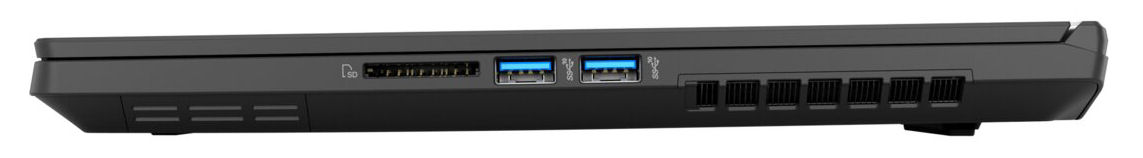
Leitor de cartões SD
Com taxas máximas de transferência de 77 MB/s (transferência de 250 arquivos de imagem jpg de cerca de 5 MB cada), o leitor de cartões de memória SD (cartão de referência: 128 GB AV PRO V60 microSD) exibe velocidades médias
| SD Card Reader - average JPG Copy Test (av. of 3 runs) | |
| Média da turma Gaming (20.9 - 210, n=54, últimos 2 anos) | |
| Schenker XMG Fusion 15 (Mid 22) (AV PRO microSD 128 GB V60) | |
| HP Omen 16-b1090ng (AV PRO microSD 128 GB V60) | |
Comunicação
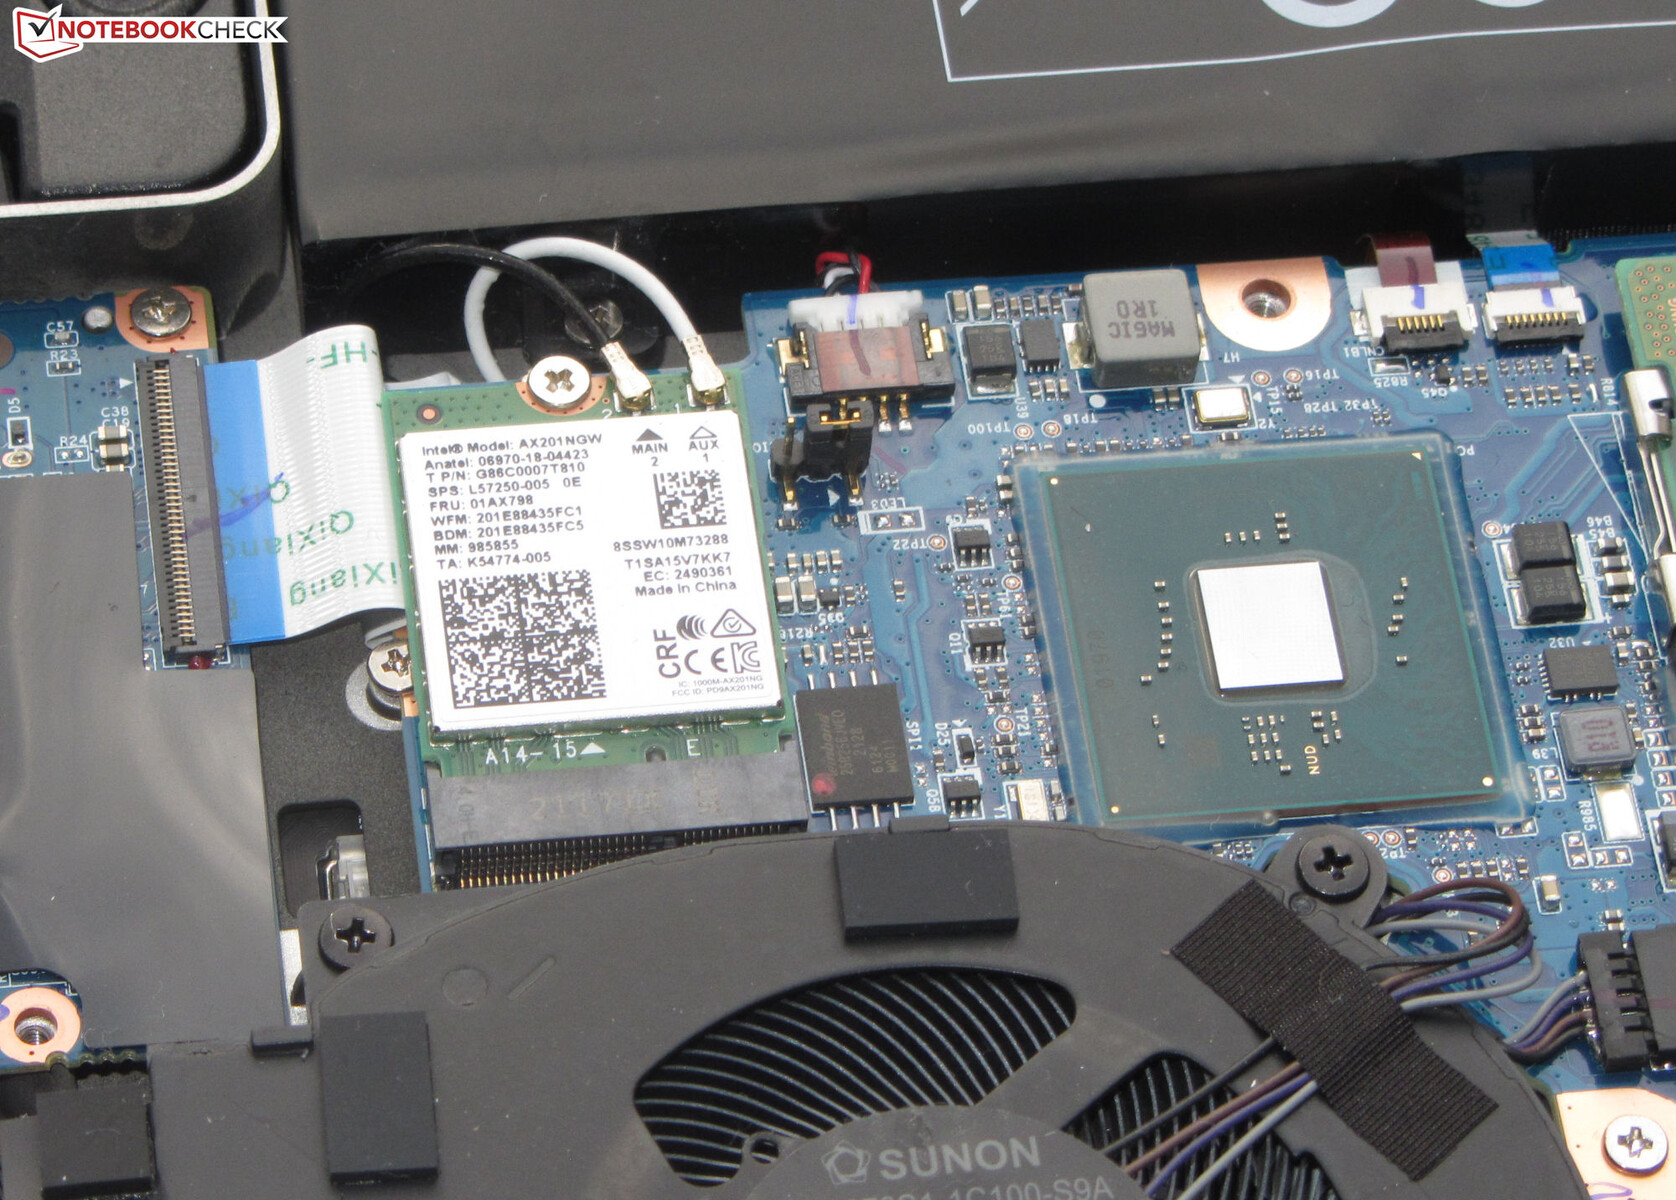
As taxas de transferência Wi-Fi determinadas sob condições ideais (nenhum outro dispositivo Wi-Fi próximo, distância curta entre laptop e PC servidor) são muito boas, e estão em linha com as capacidades do chip Wi-Fi (Intel AX201; 802.11ax). Um chip Gigabit Ethernet (Intel I225-V, 2,5 gigabits) lida com conexões de rede com fio
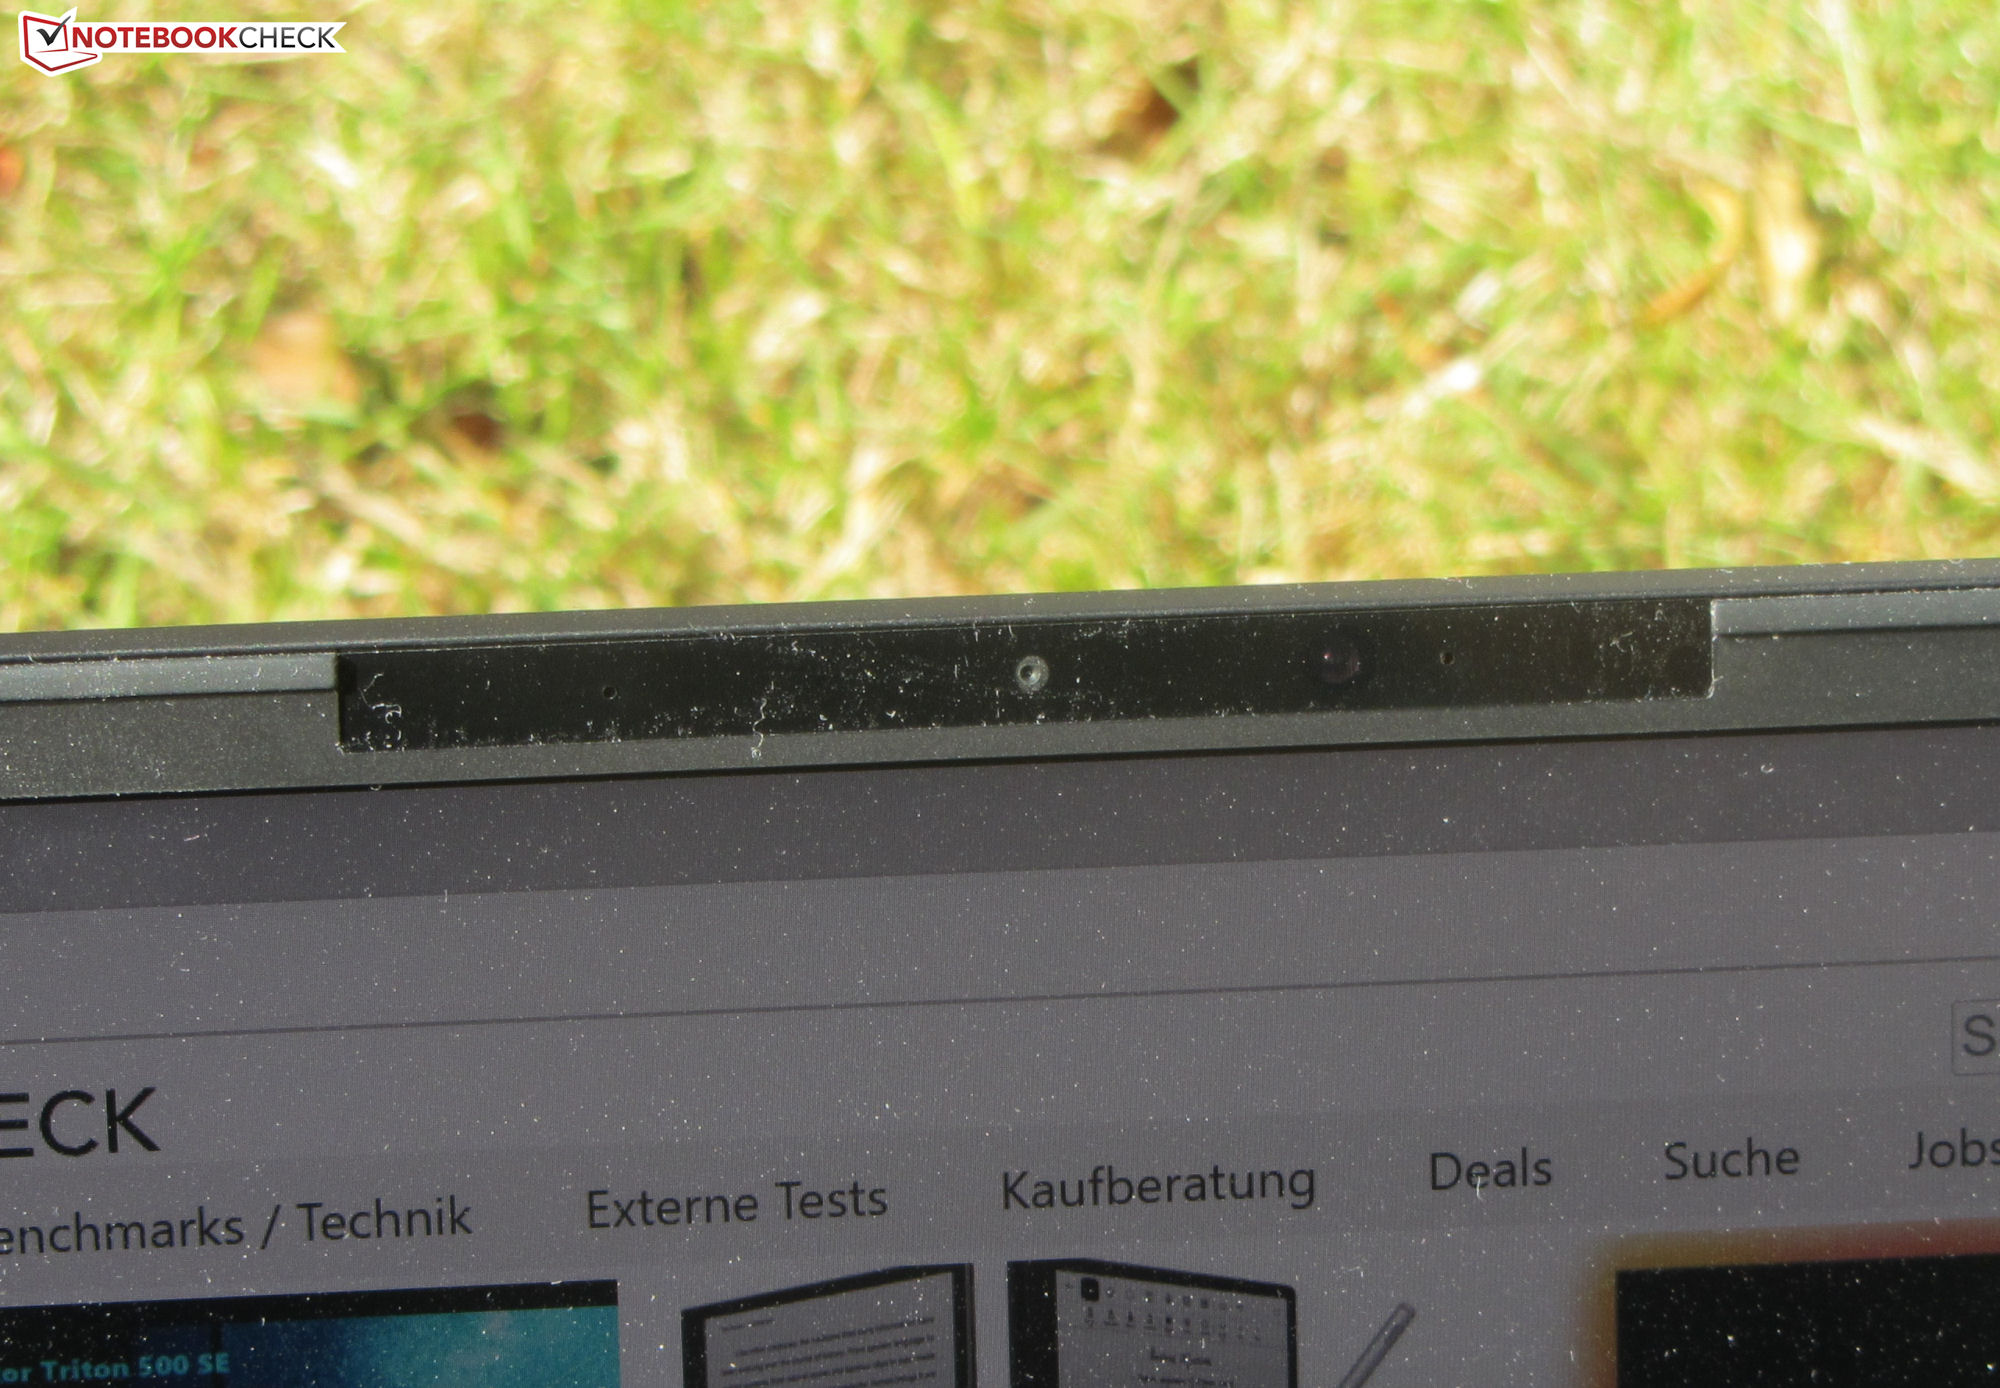
Webcam
A webcam (0,9 MP) produz imagens em uma resolução máxima de 1.280x720 pixels. Há problemas com a precisão das cores: As cores se desviam do alvo. A câmera não possui um obturador mecânico

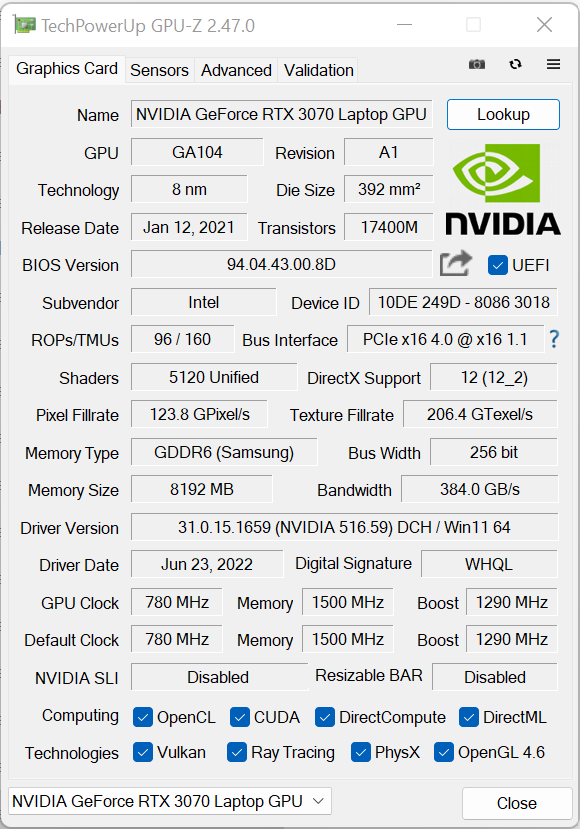
 GeForce RTX 3070 Laptop GPU, i7-11800H, Samsung SSD 980 Pro 1TB MZ-V8P1T0BW")
 GeForce RTX 3070 Laptop GPU, i7-11800H, Samsung SSD 980 Pro 1TB MZ-V8P1T0BW")
Acessórios
Junto com as informações de garantia e um manual do usuário impresso, o laptop vem com um dispositivo USB (drivers, instruções), adesivos e um mouse pad
Manutenção
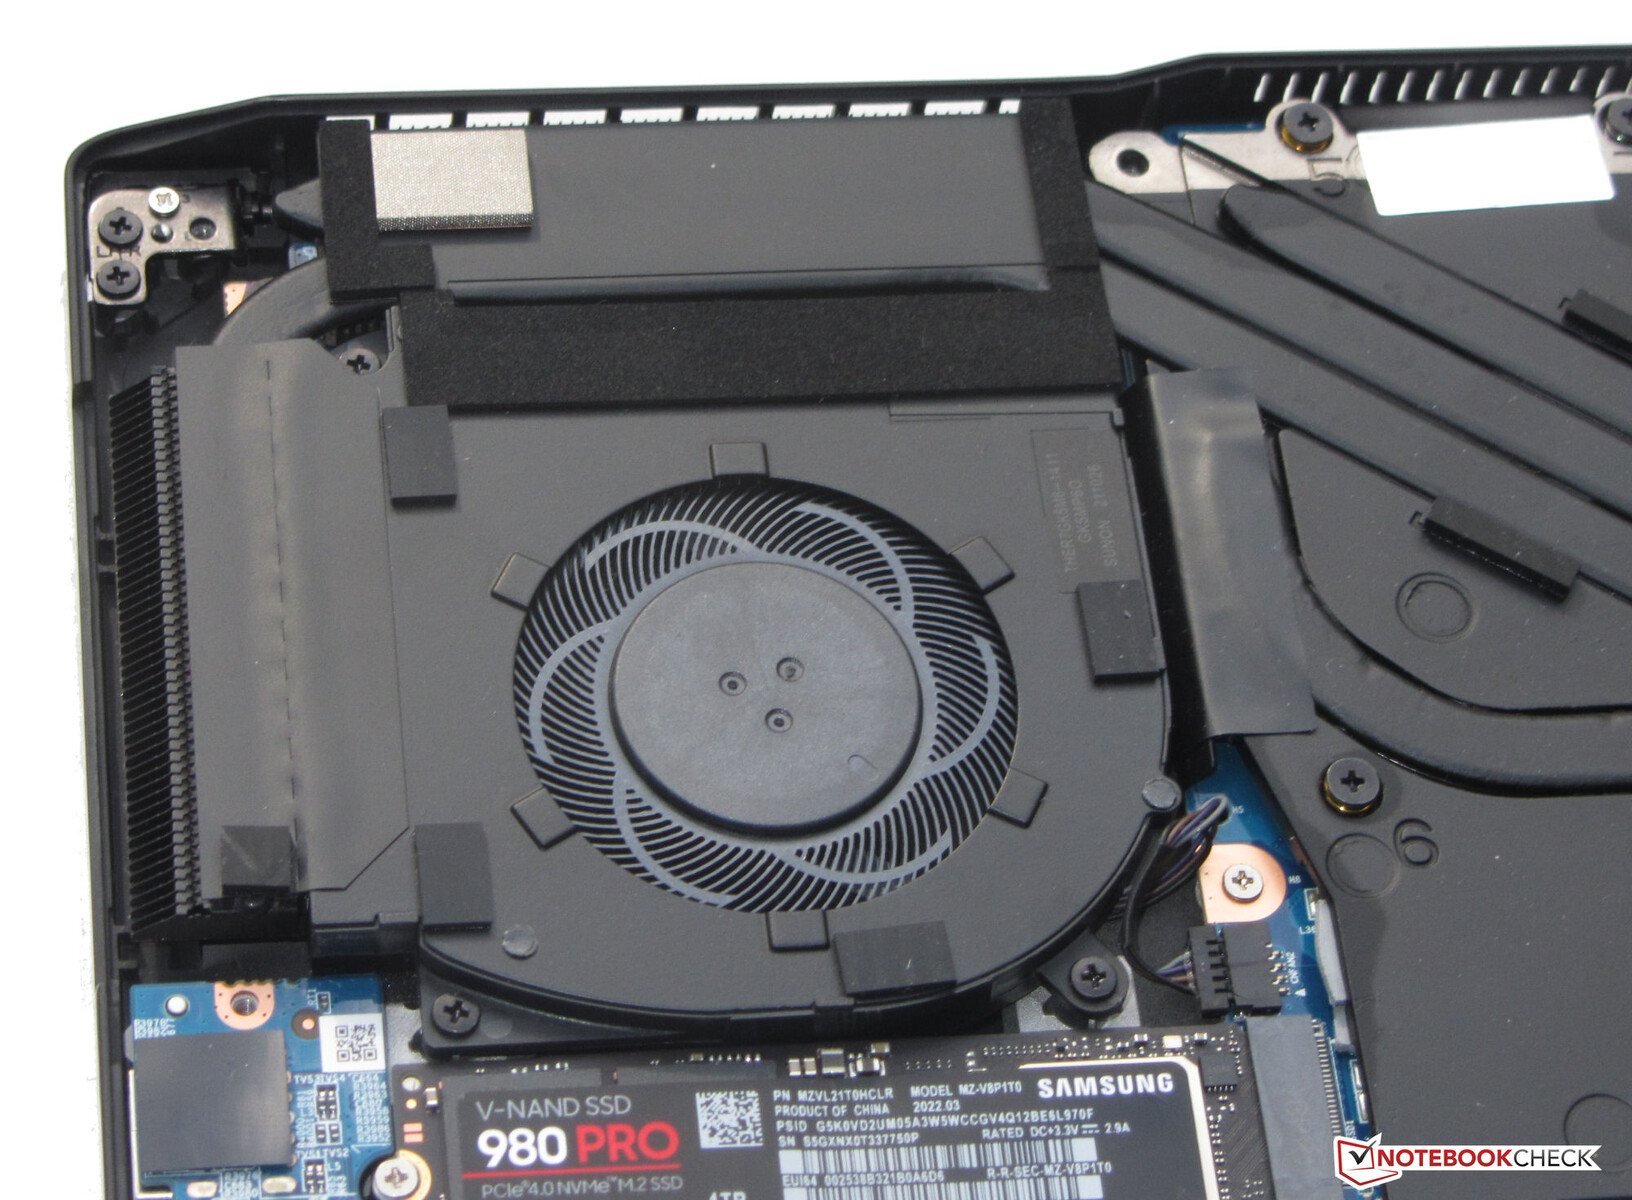
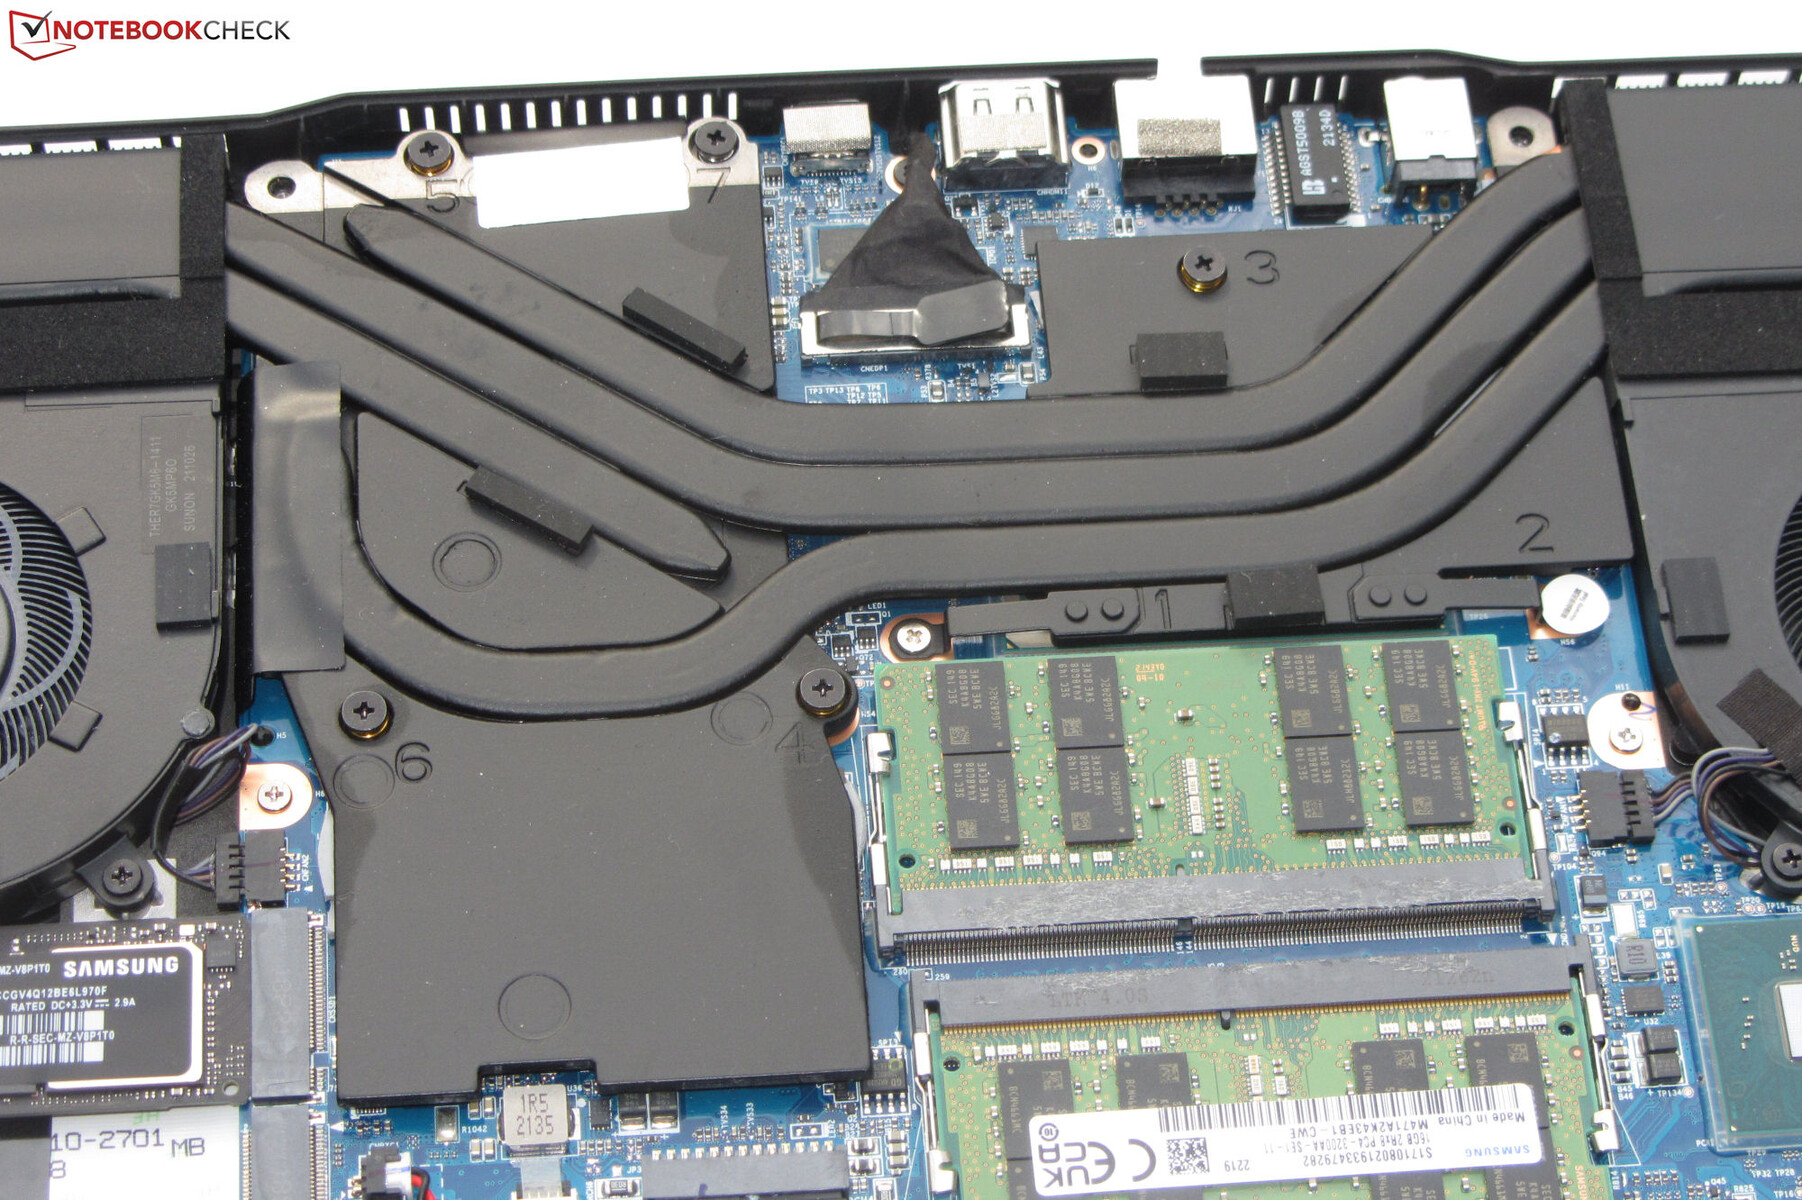
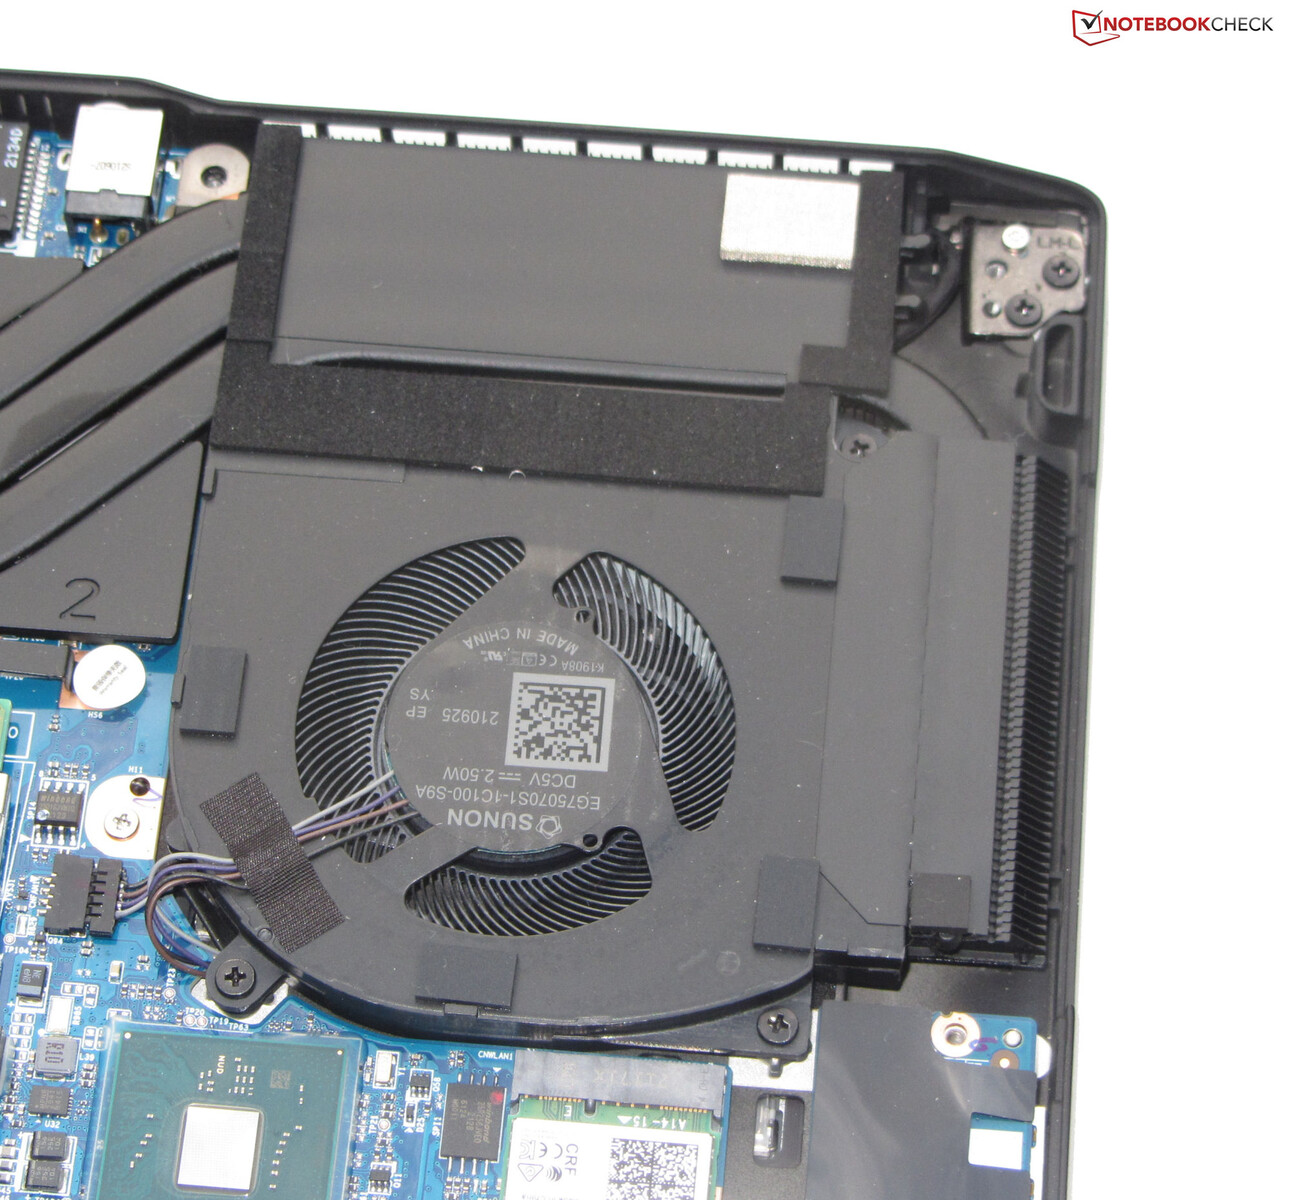
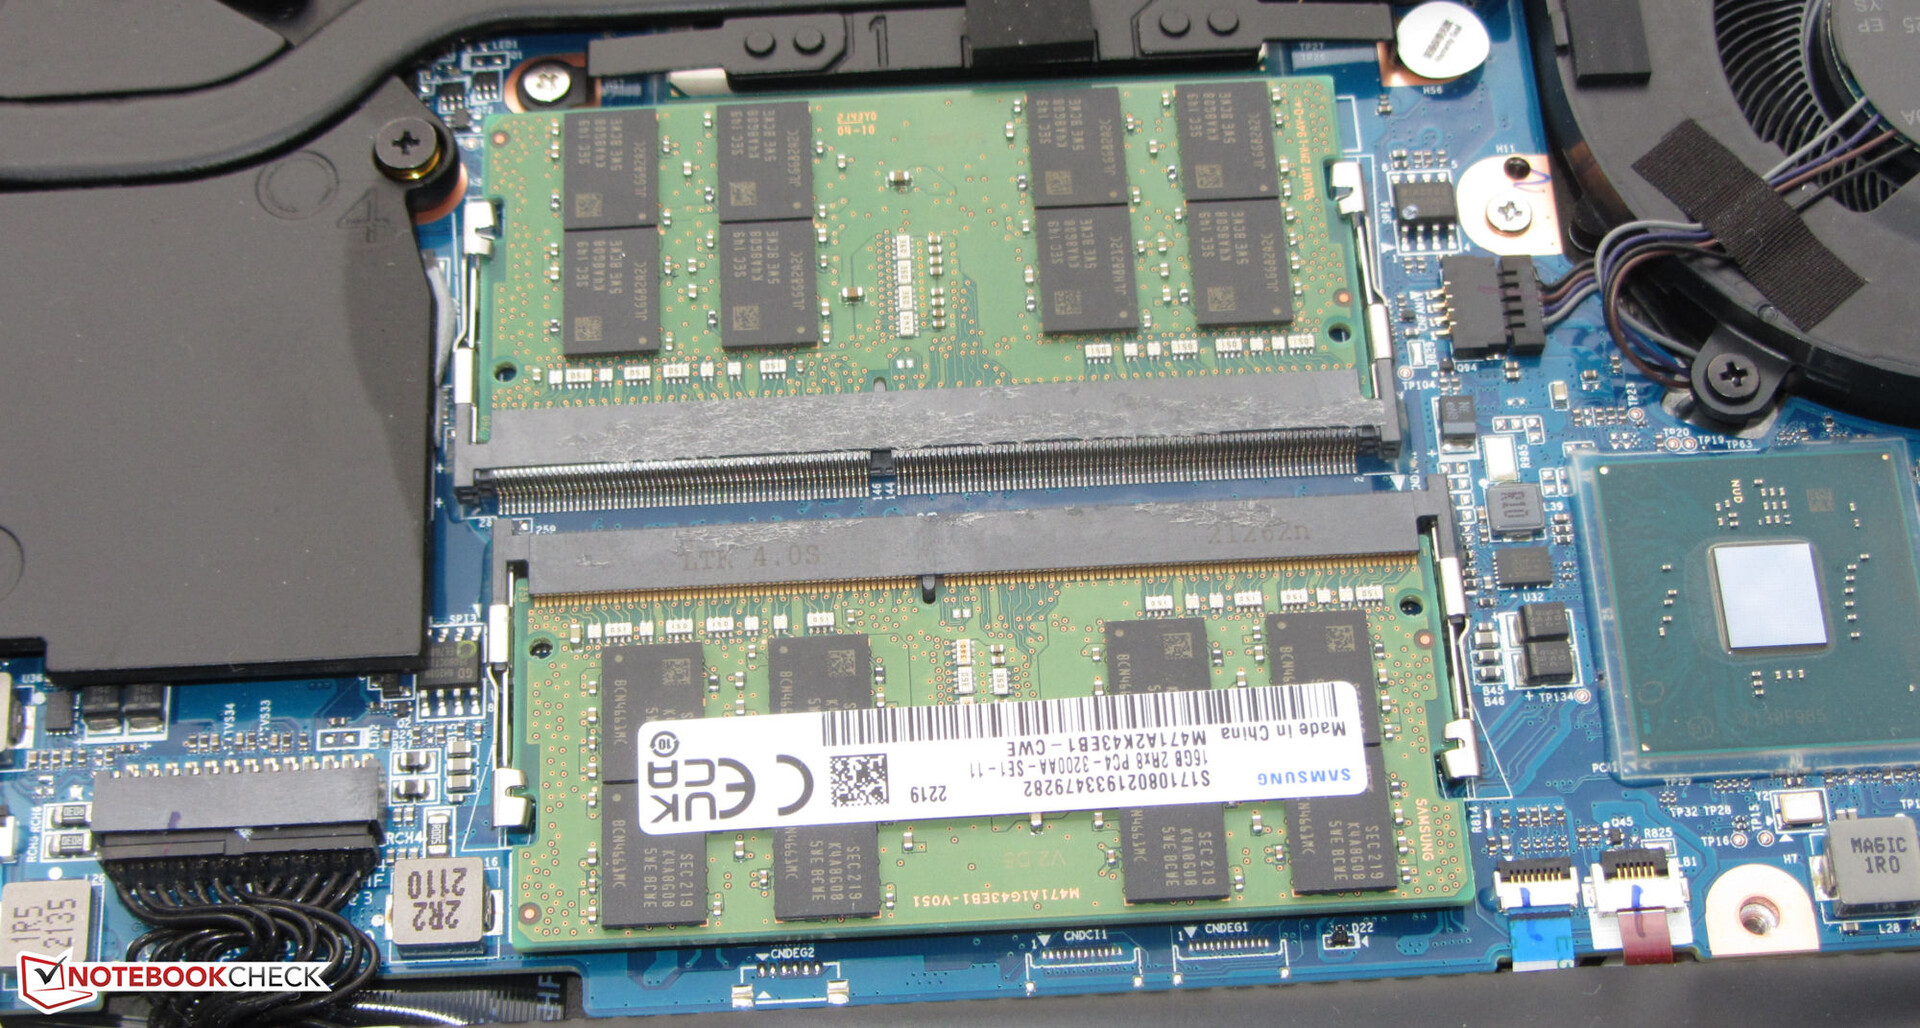
Os procedimentos de manutenção e atualização podem ser realizados sem problemas. Após soltar todos os parafusos no fundo do dispositivo, a tampa inferior pode ser removida com bastante facilidade. Você então tem acesso aos slots de RAM (ambos ocupados), o SSD (PCIe 4), o segundo slot M.2-2280 (PCIe 3/SATA), o módulo Wi-Fi, os ventiladores, a bateria BIOS e a bateria
Garantia
A garantia básica cobre dois anos - incluindo serviço de coleta e 6 meses de reparo rápido (reparo dentro de 48 horas). Uma garantia de 36 meses custa entre 100 e 149 Euros (~$99,53 e $148,30) - dependendo do período de reparo rápido selecionado
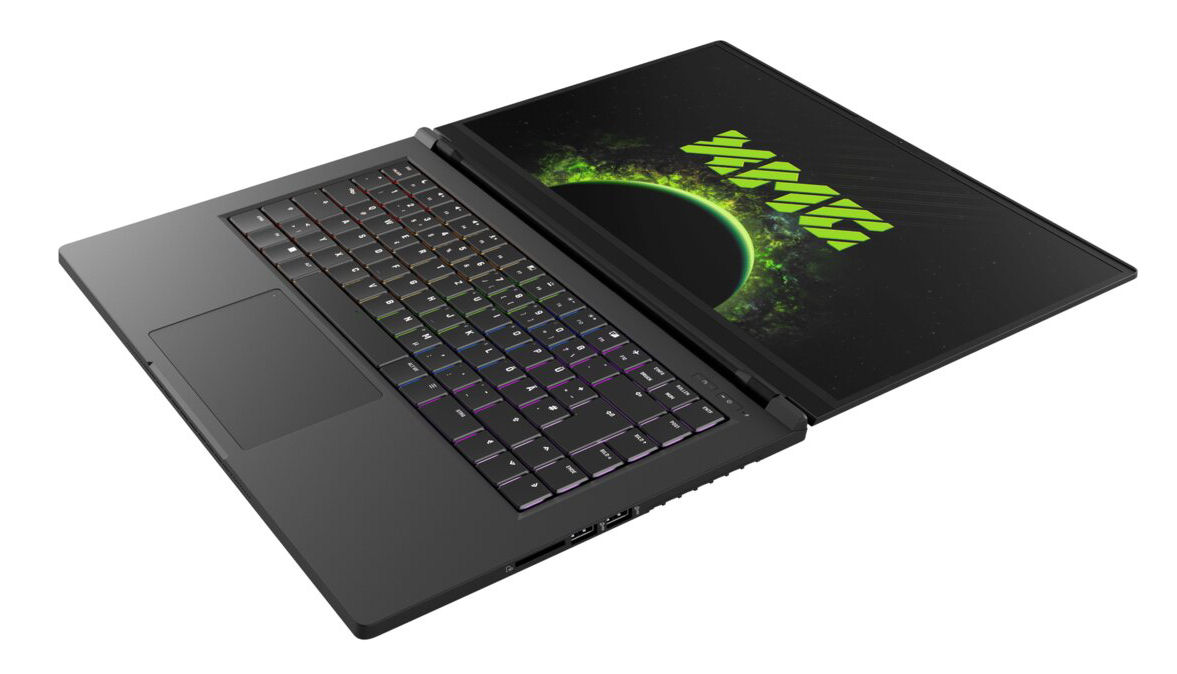
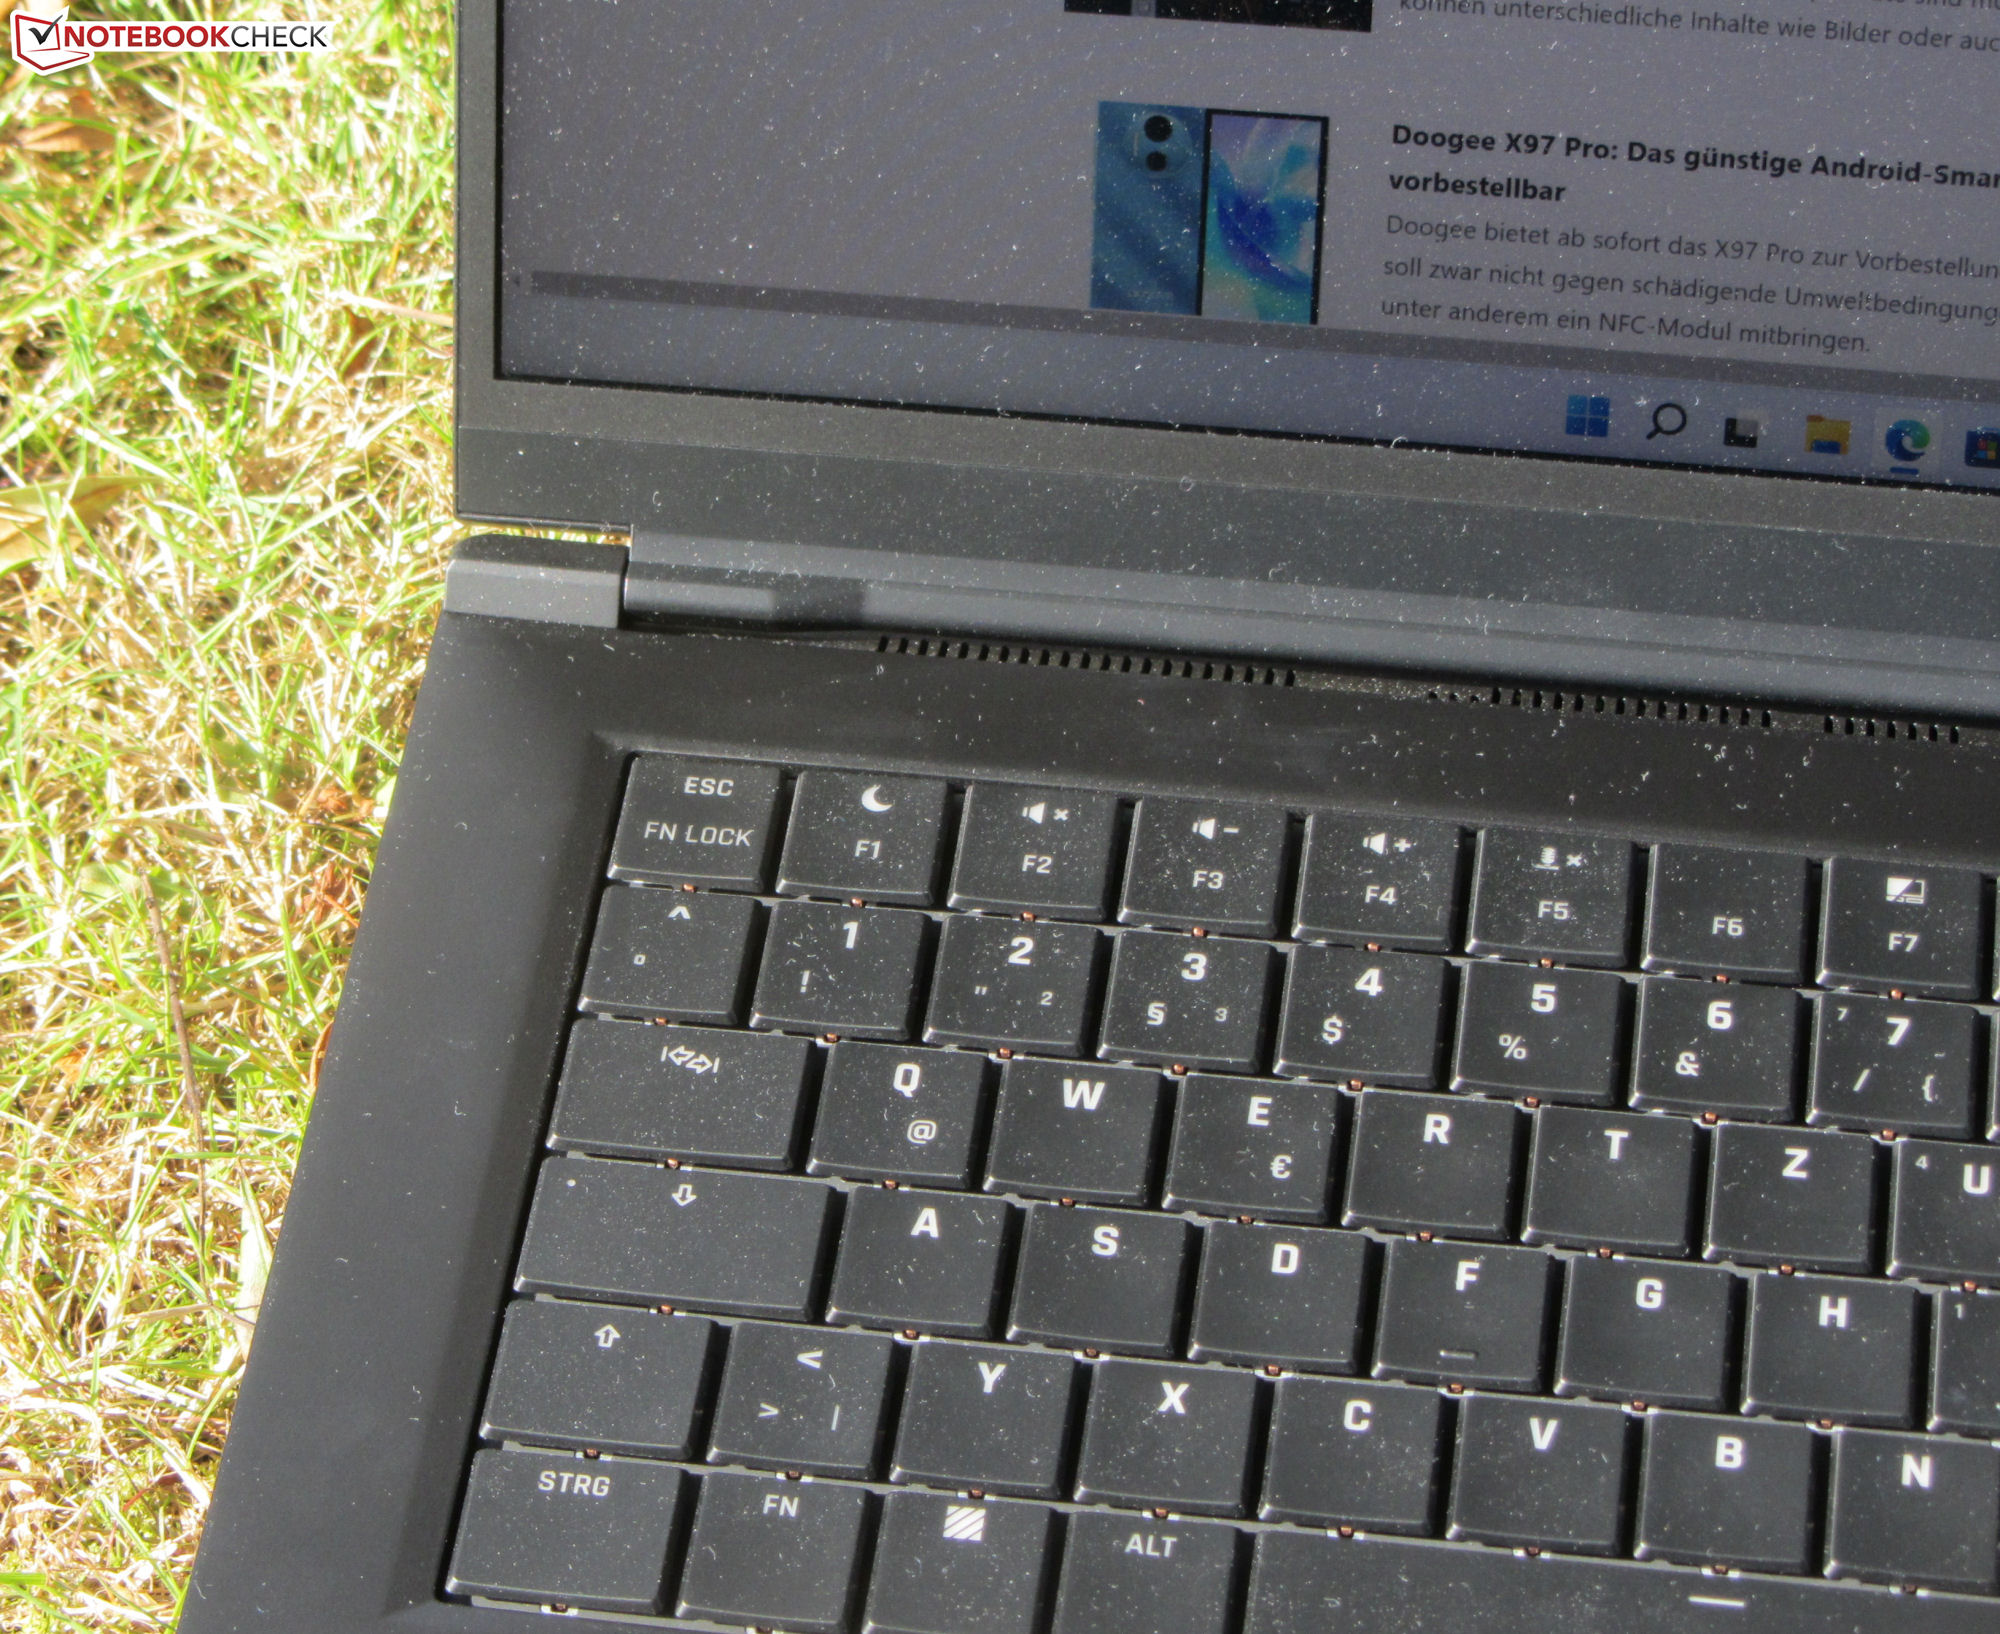
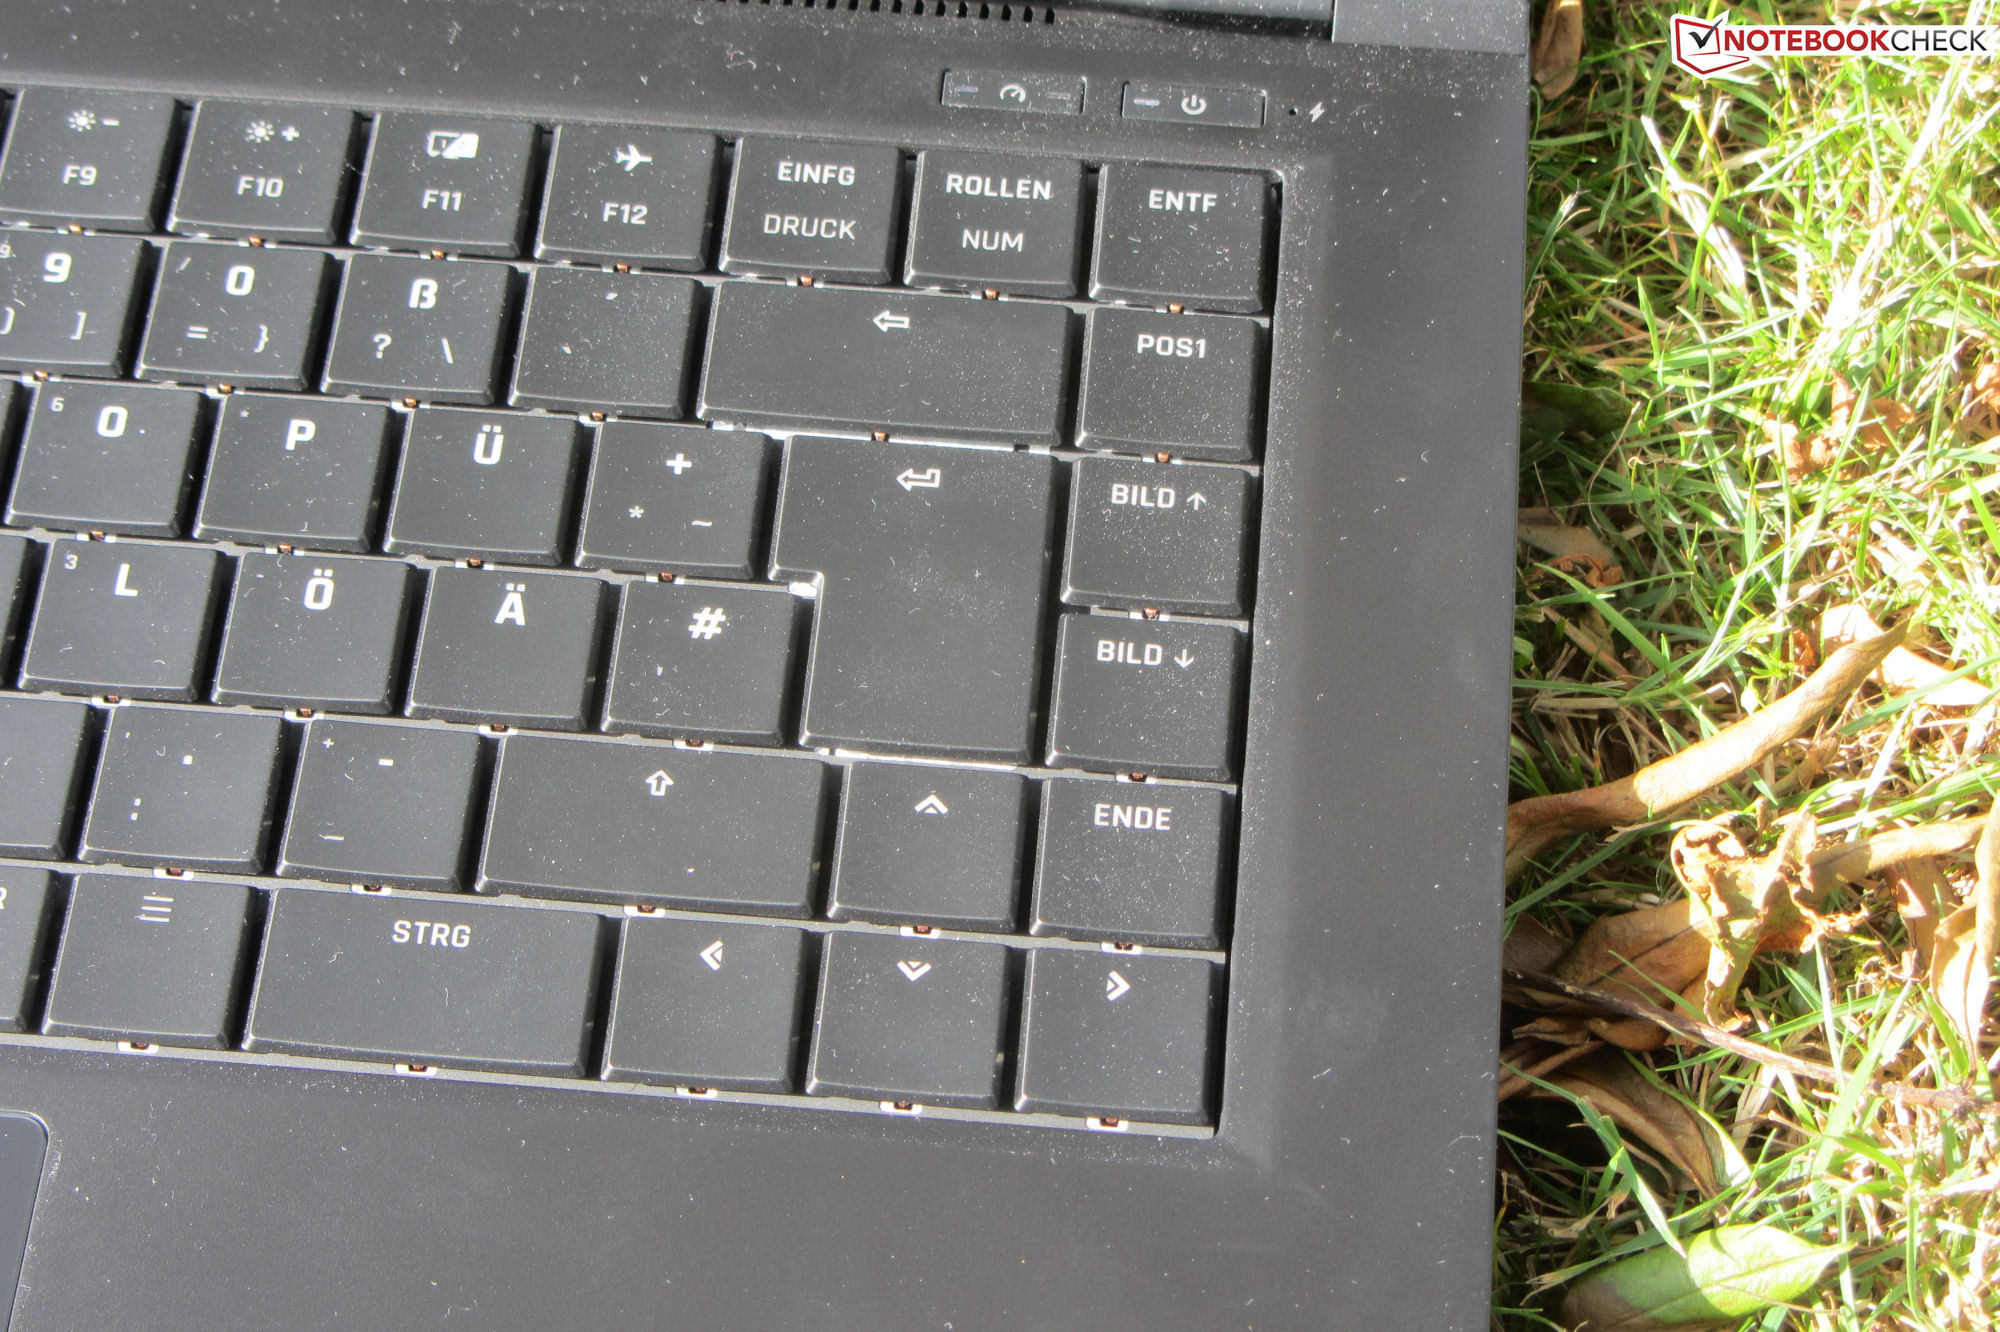
Dispositivos de entrada - O laptop Schenker vem com um teclado mecânico
Teclado
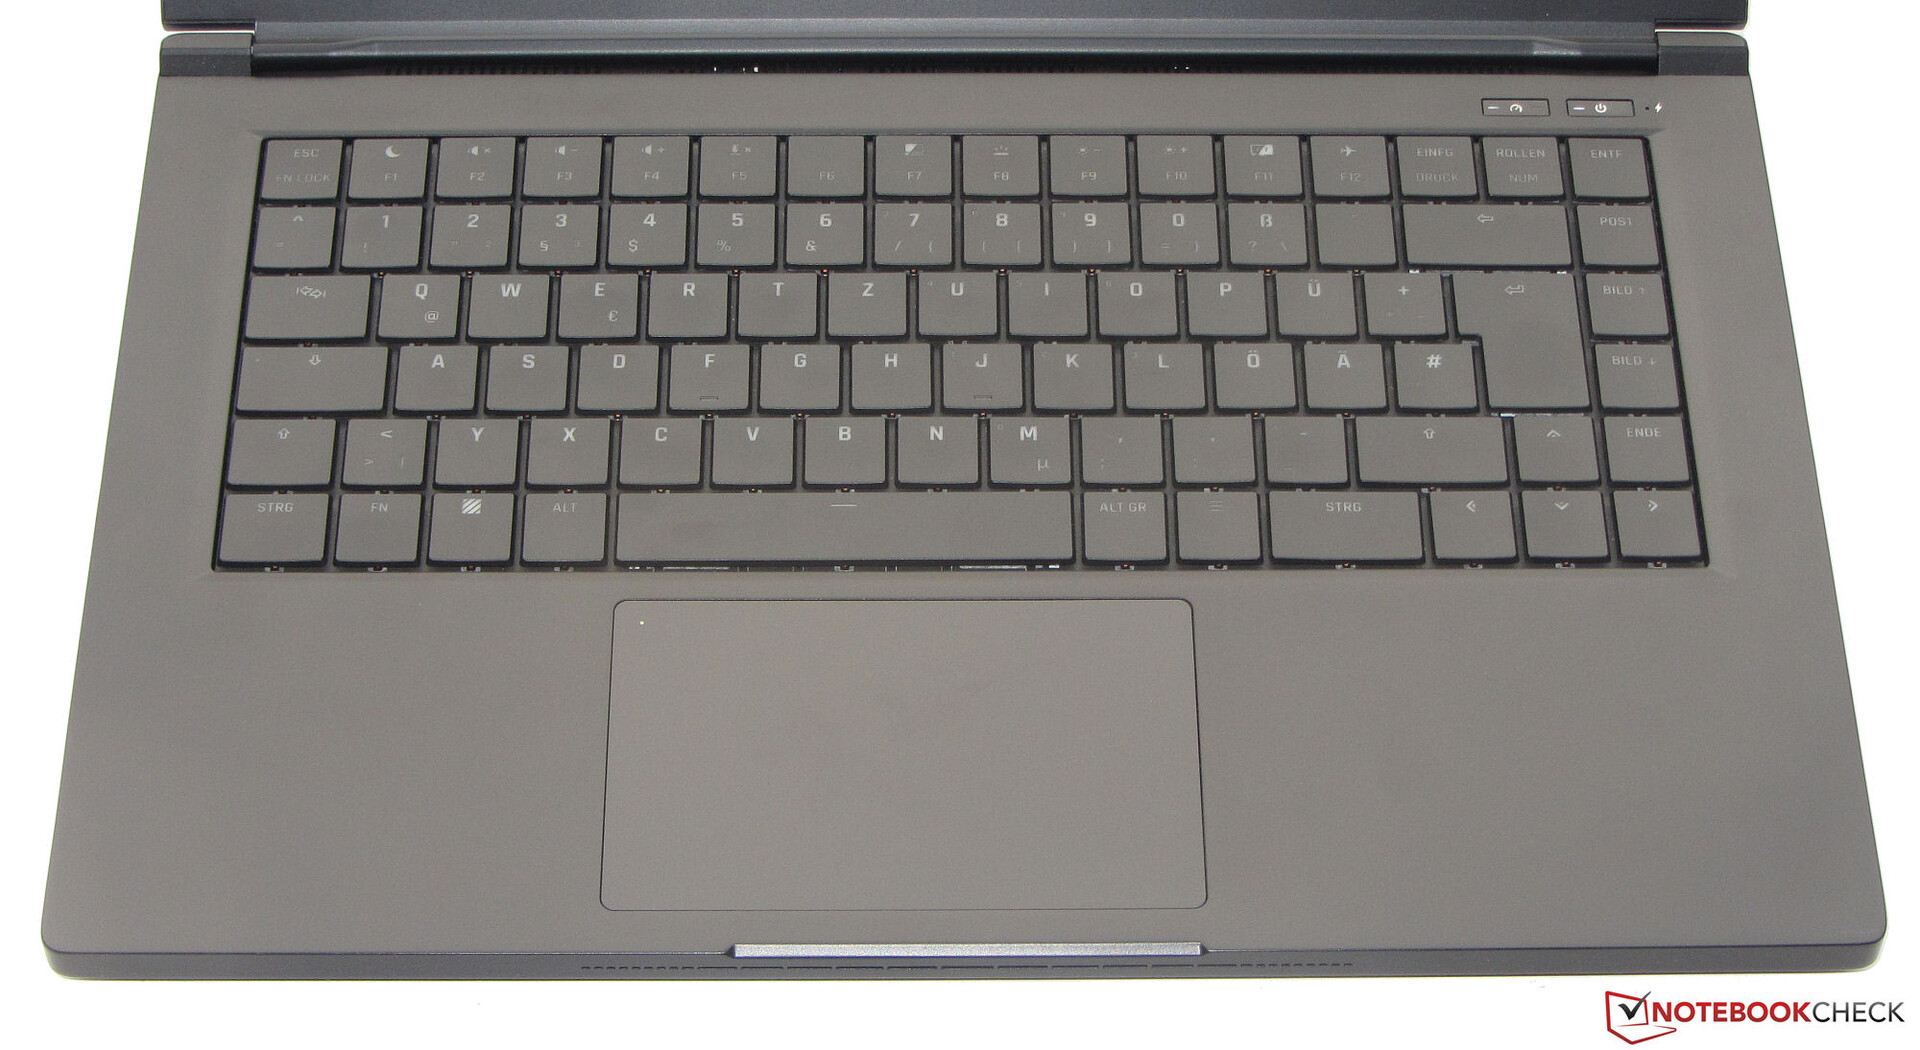
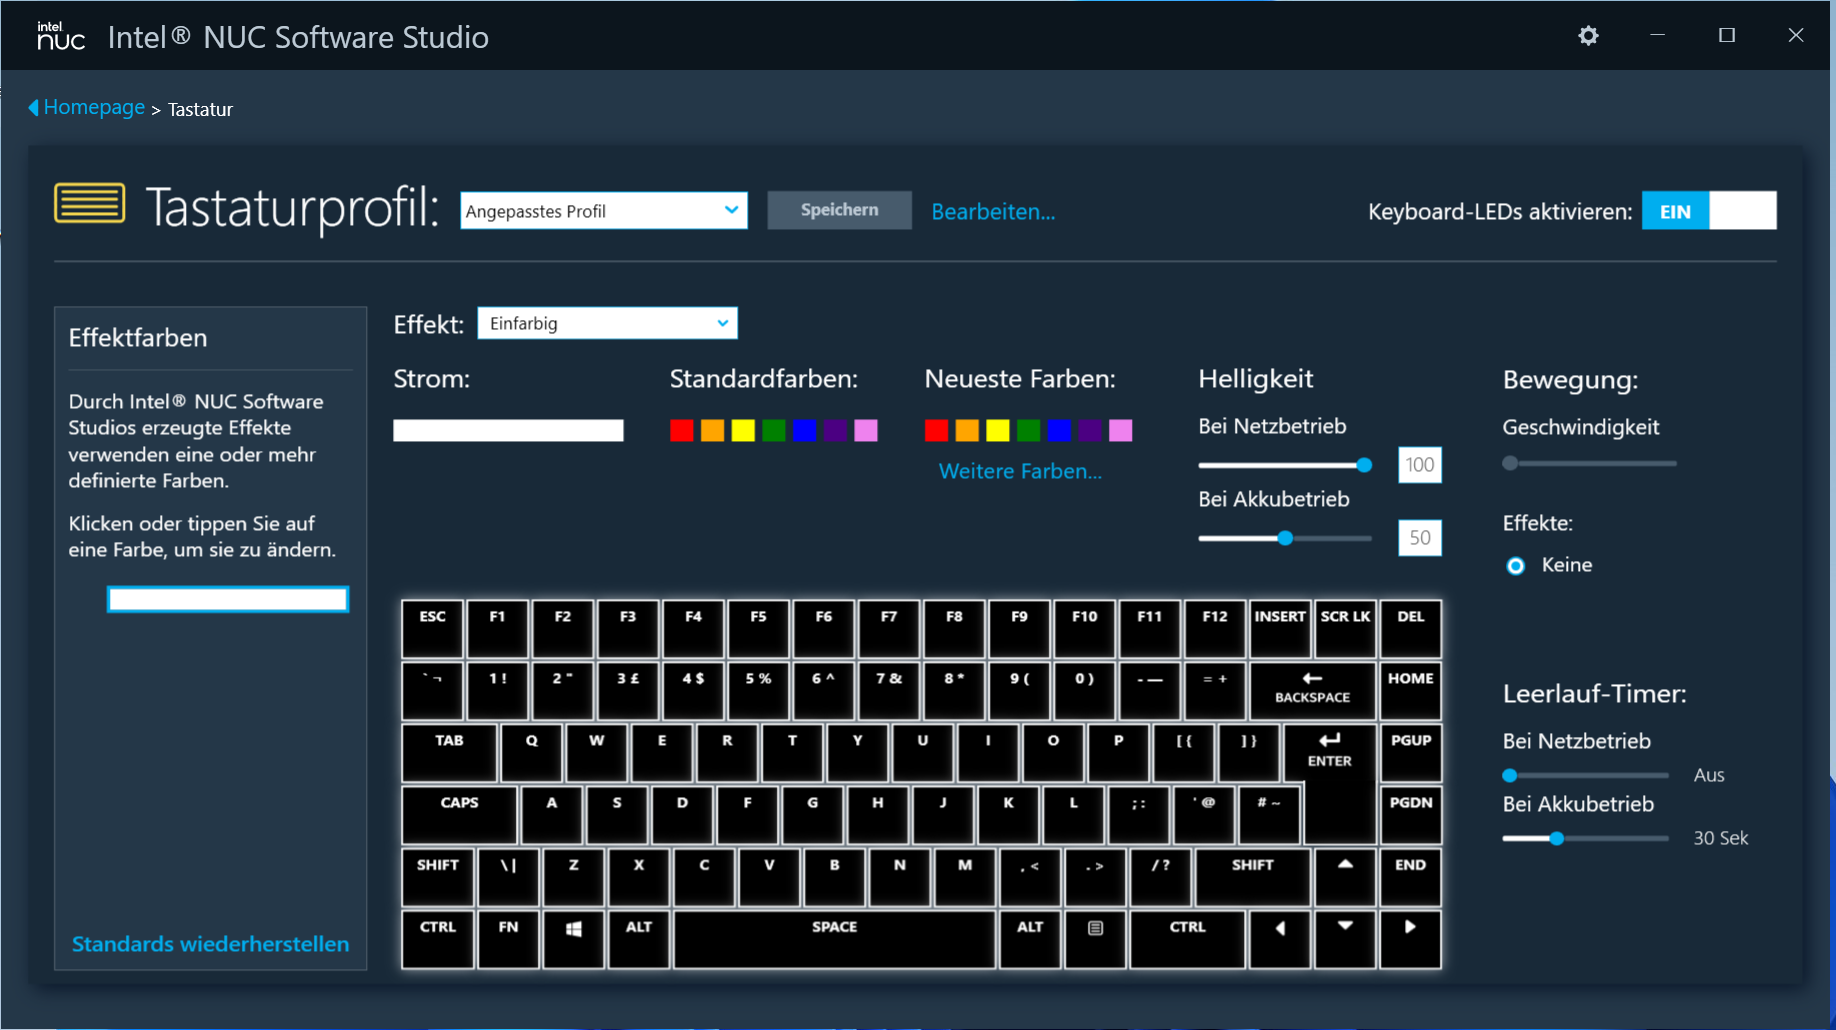
O teclado mecânico (com iluminação de uma tecla RGB) consiste em teclas côncavas curvas. Estas oferecem um curso médio e têm um ponto de pressão claramente audível e perceptível. O teclado não cede durante a digitação. A iluminação de dois estágios é controlada através de uma tecla de função. No geral, este é um teclado equilibrado e bem feito
Touchpad
Um ClickPad multitouch-capable (cerca de 11,7 x 7,2 cm/~4,6 x 2,8 in) serve como substituto do mouse. Sua superfície lisa facilita o deslizamento dos dedos sobre ele. O tapete tem um curso curto e um ponto de pressão claro. Um toque duplo no canto superior esquerdo liga e desliga a almofada (indicado por um LED)
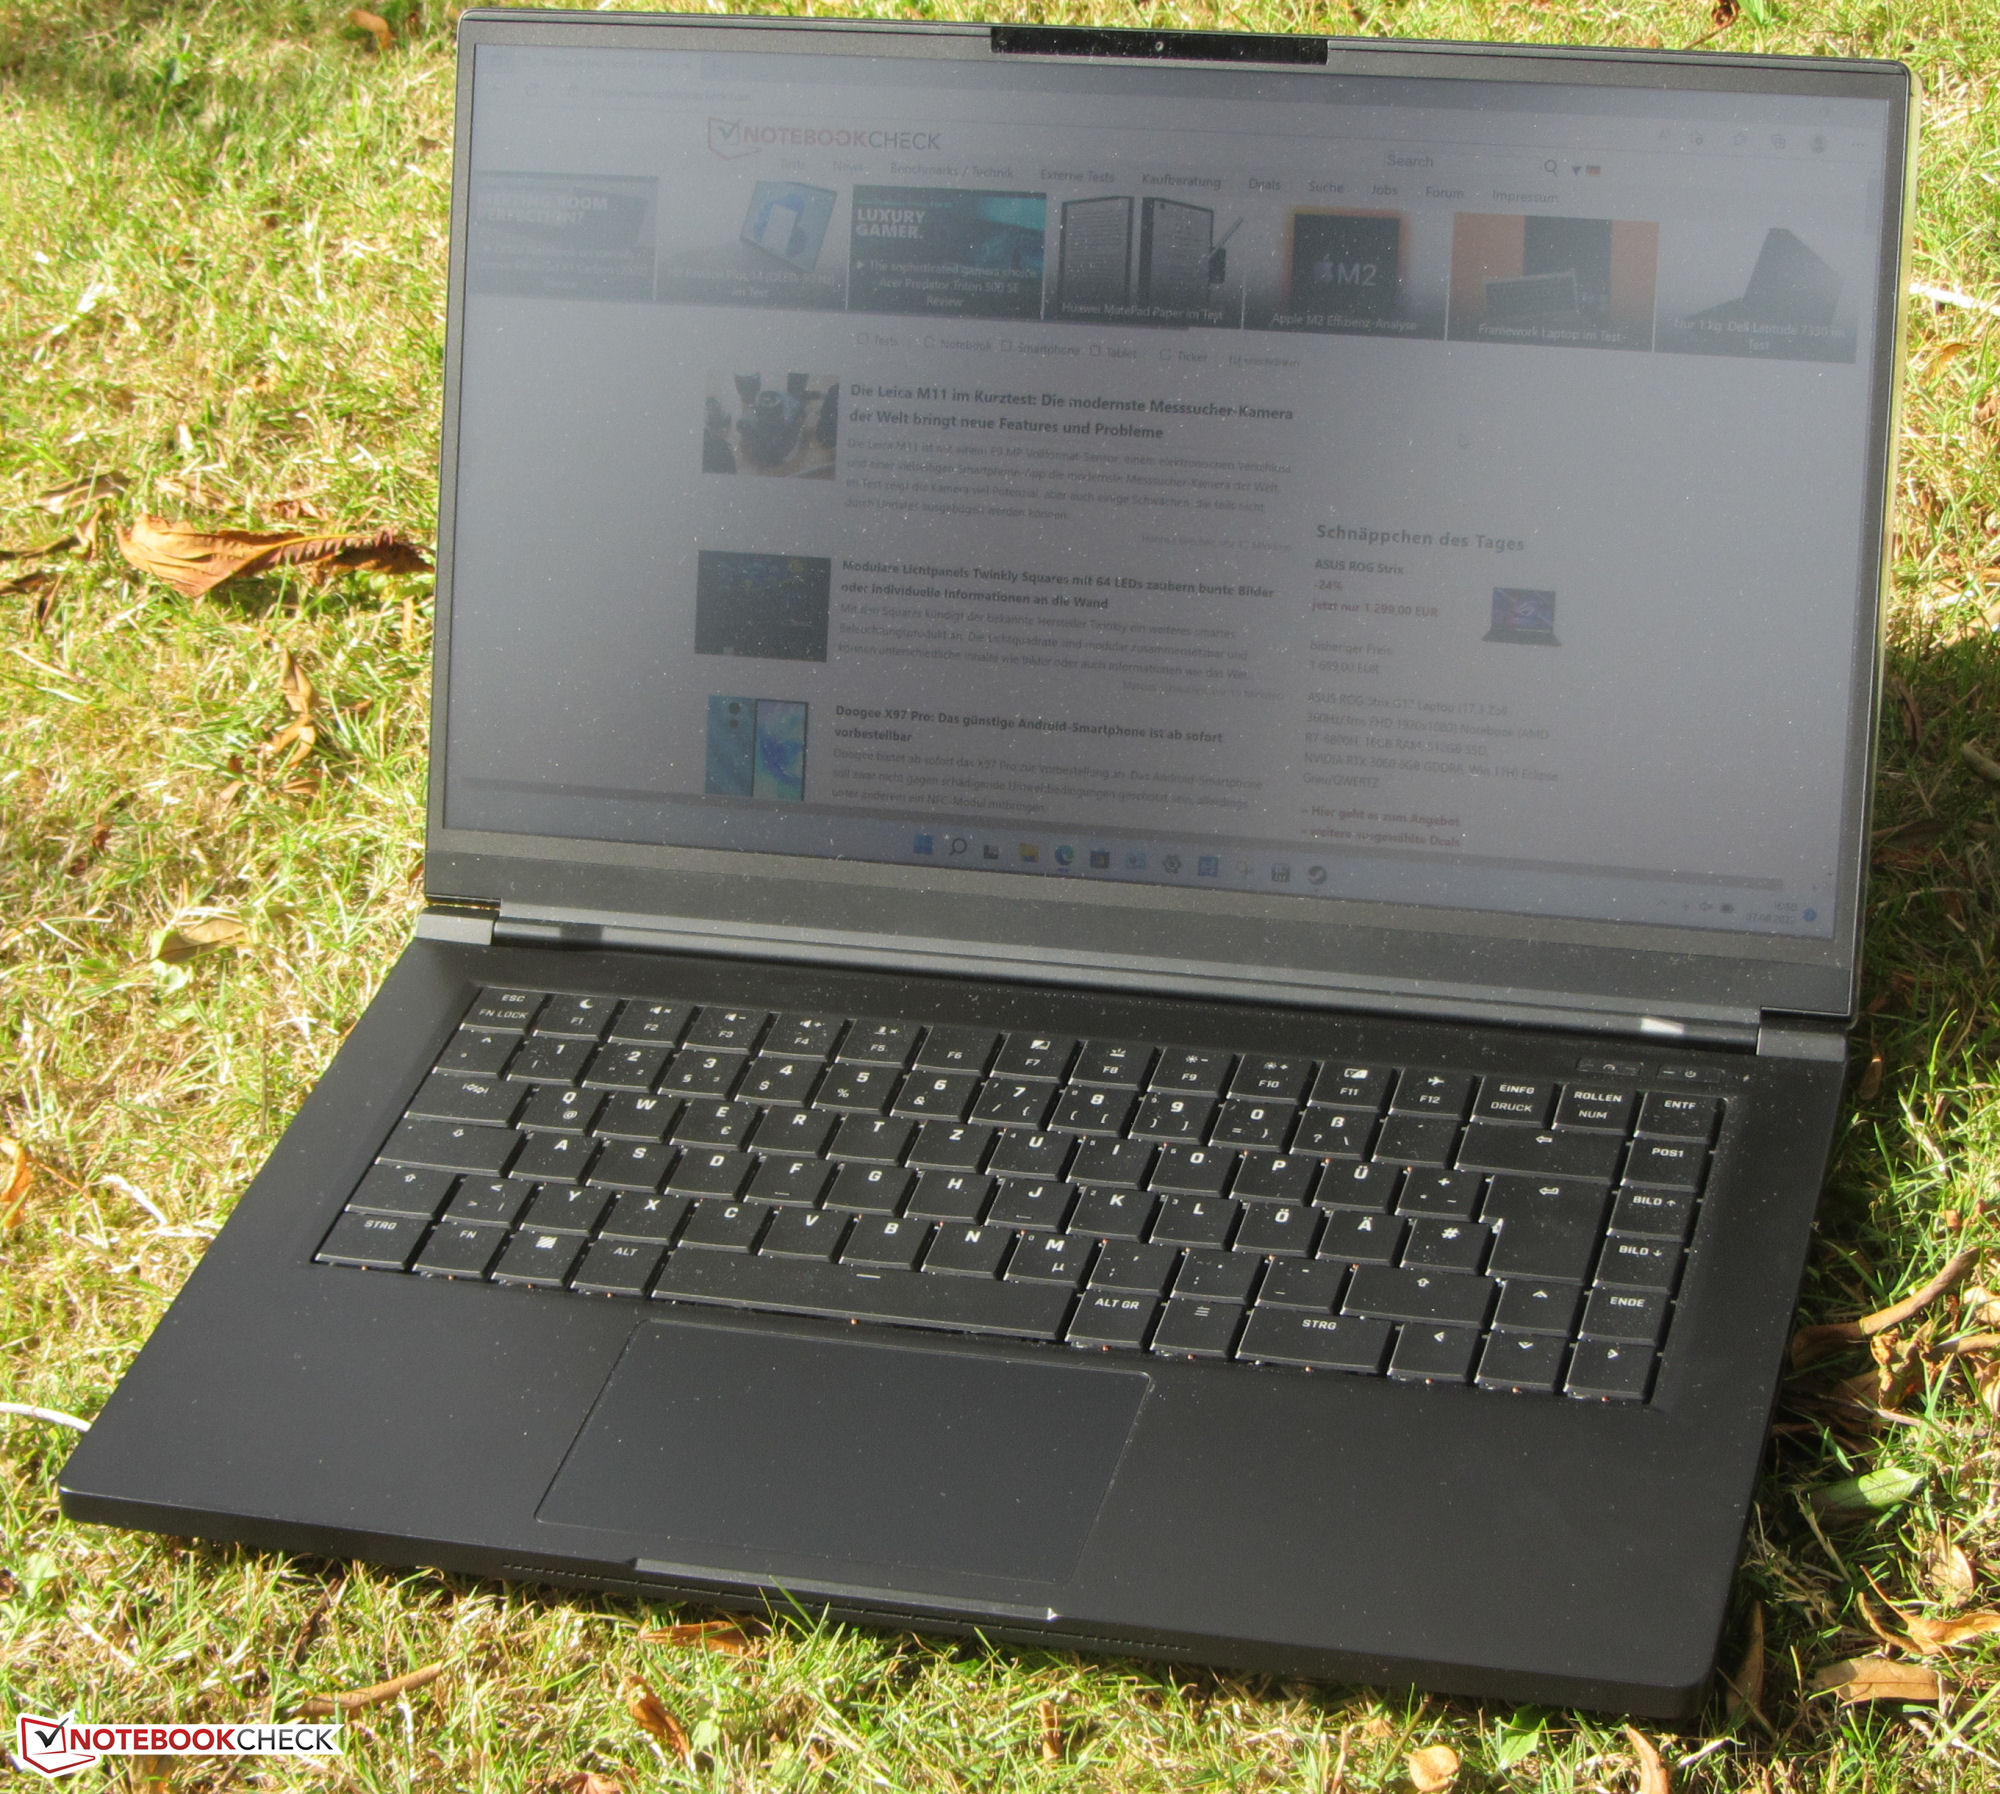
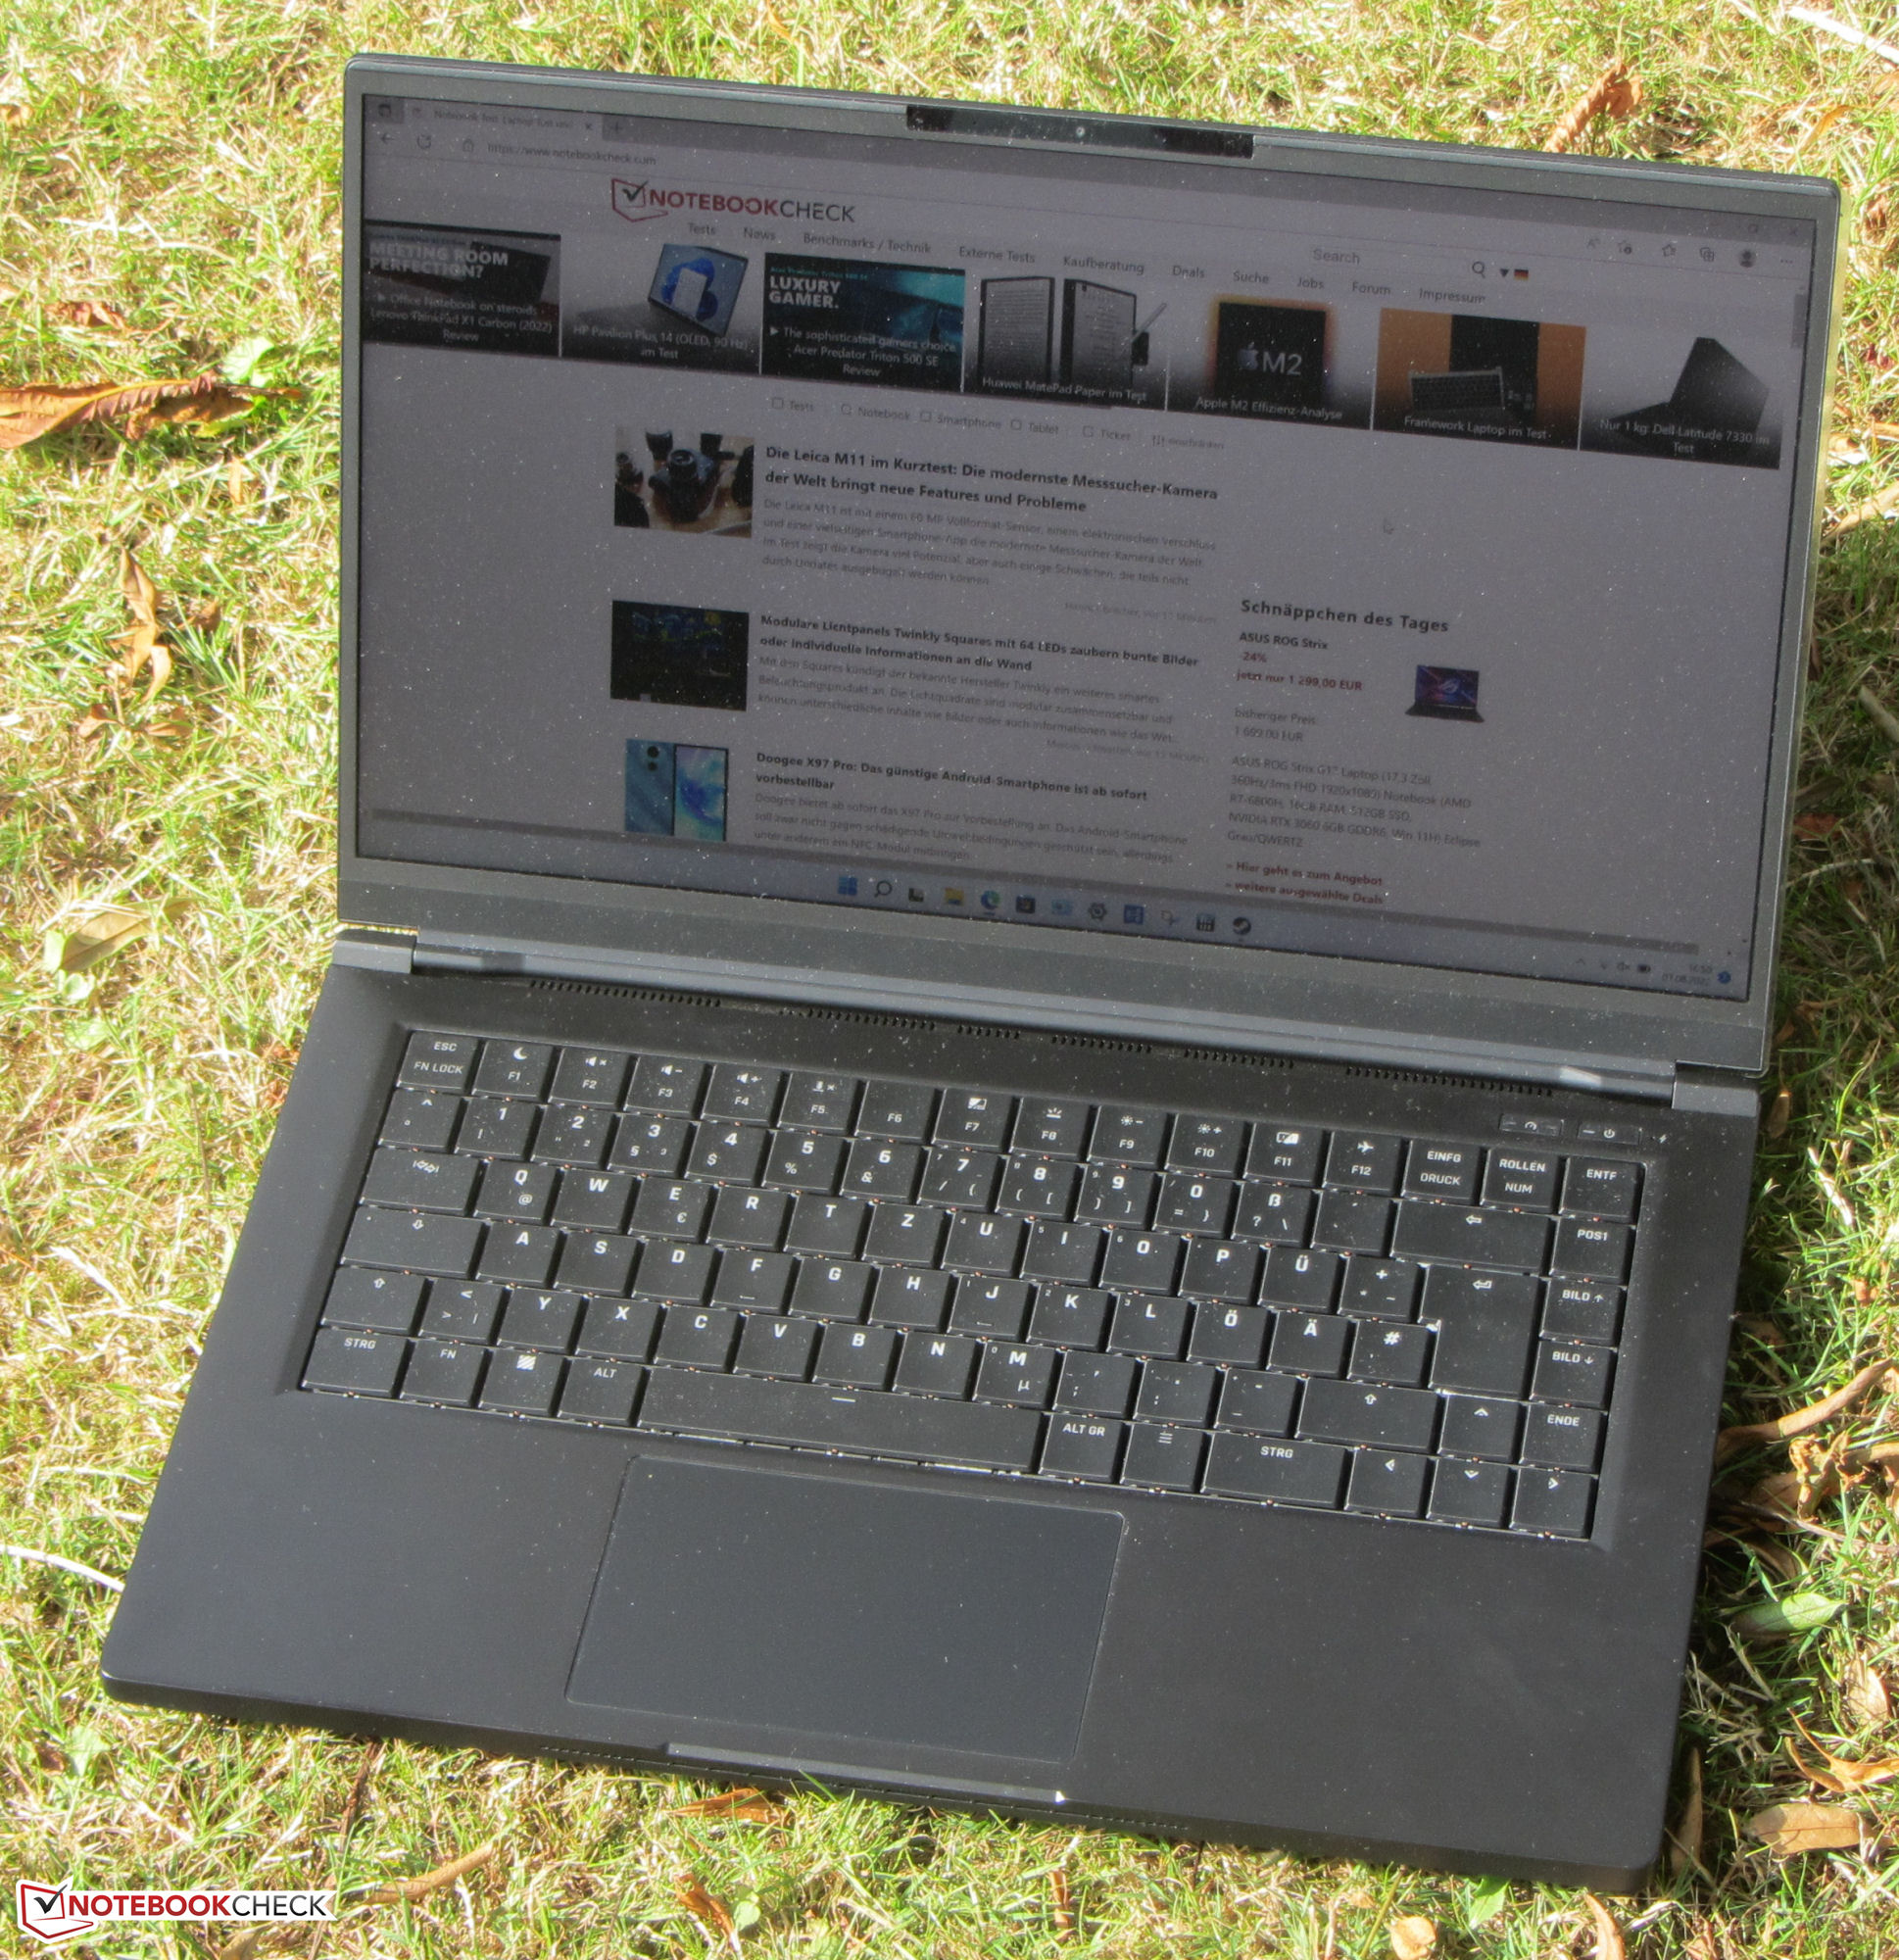
Visor - IPS a bordo
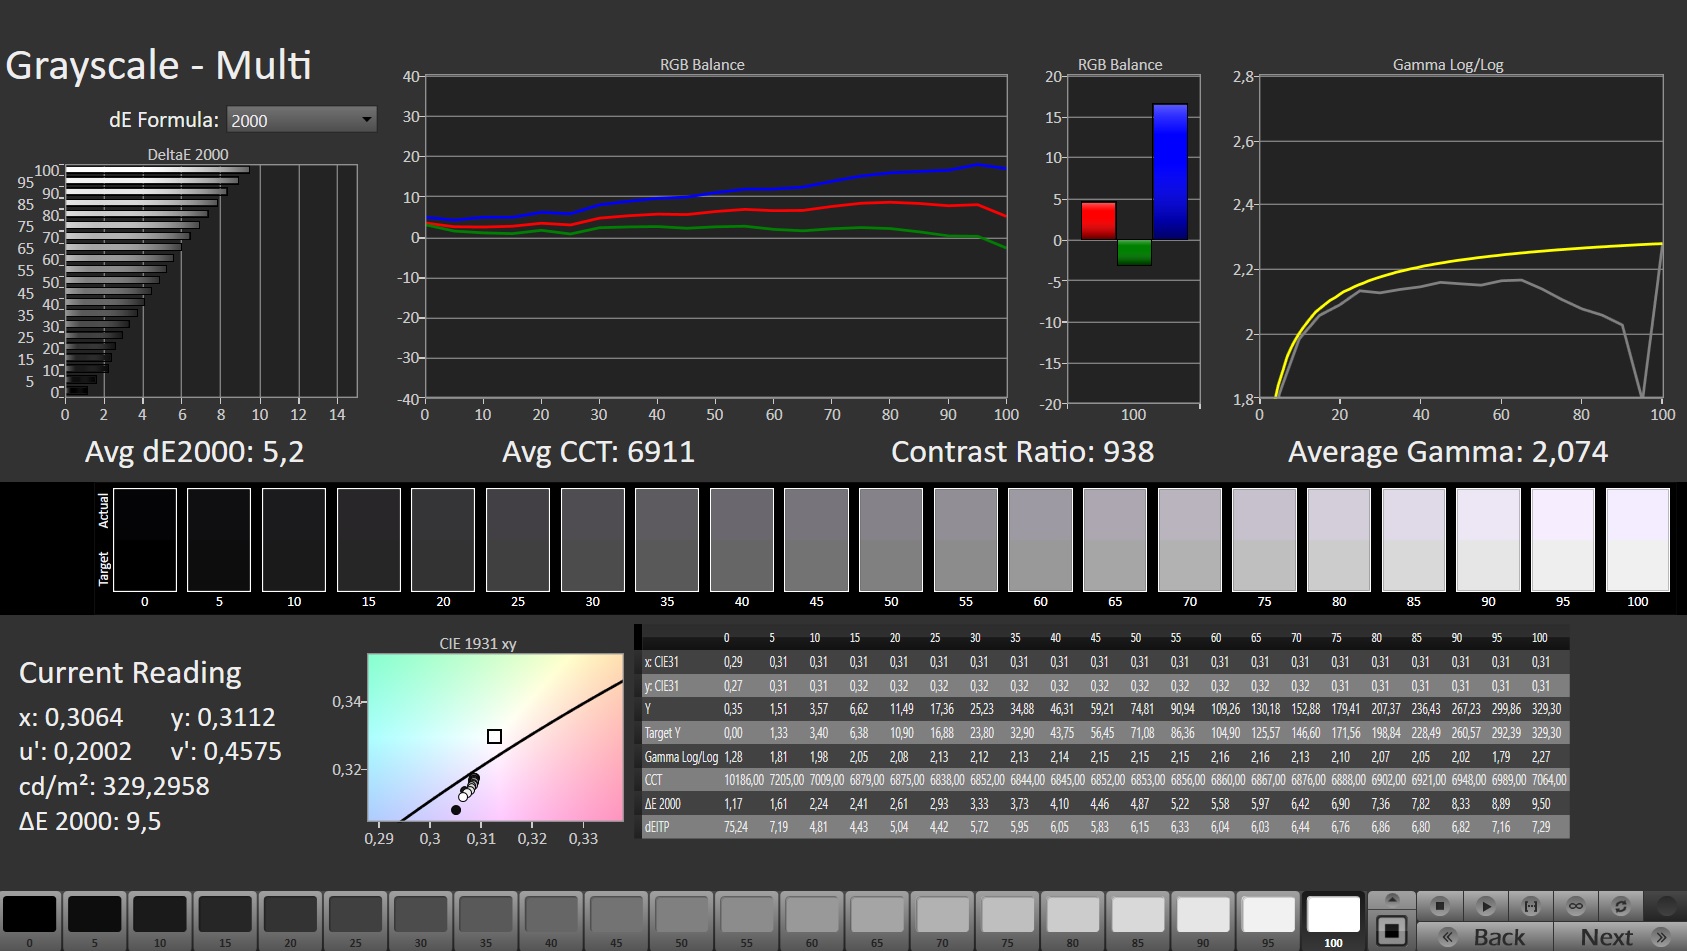
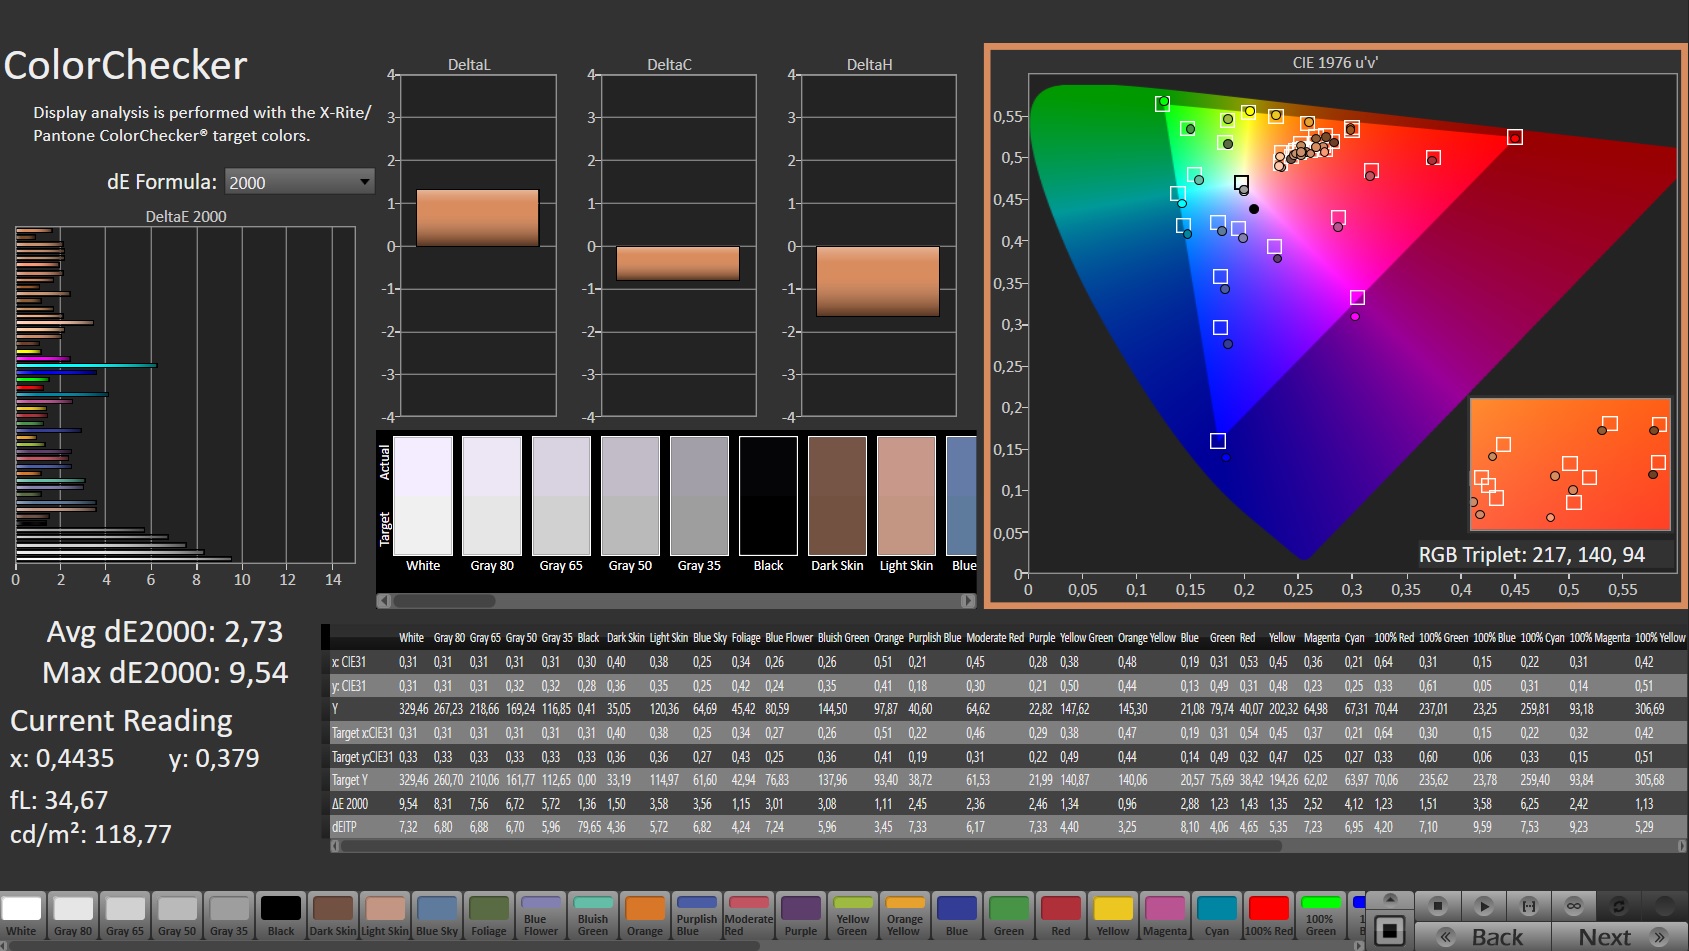
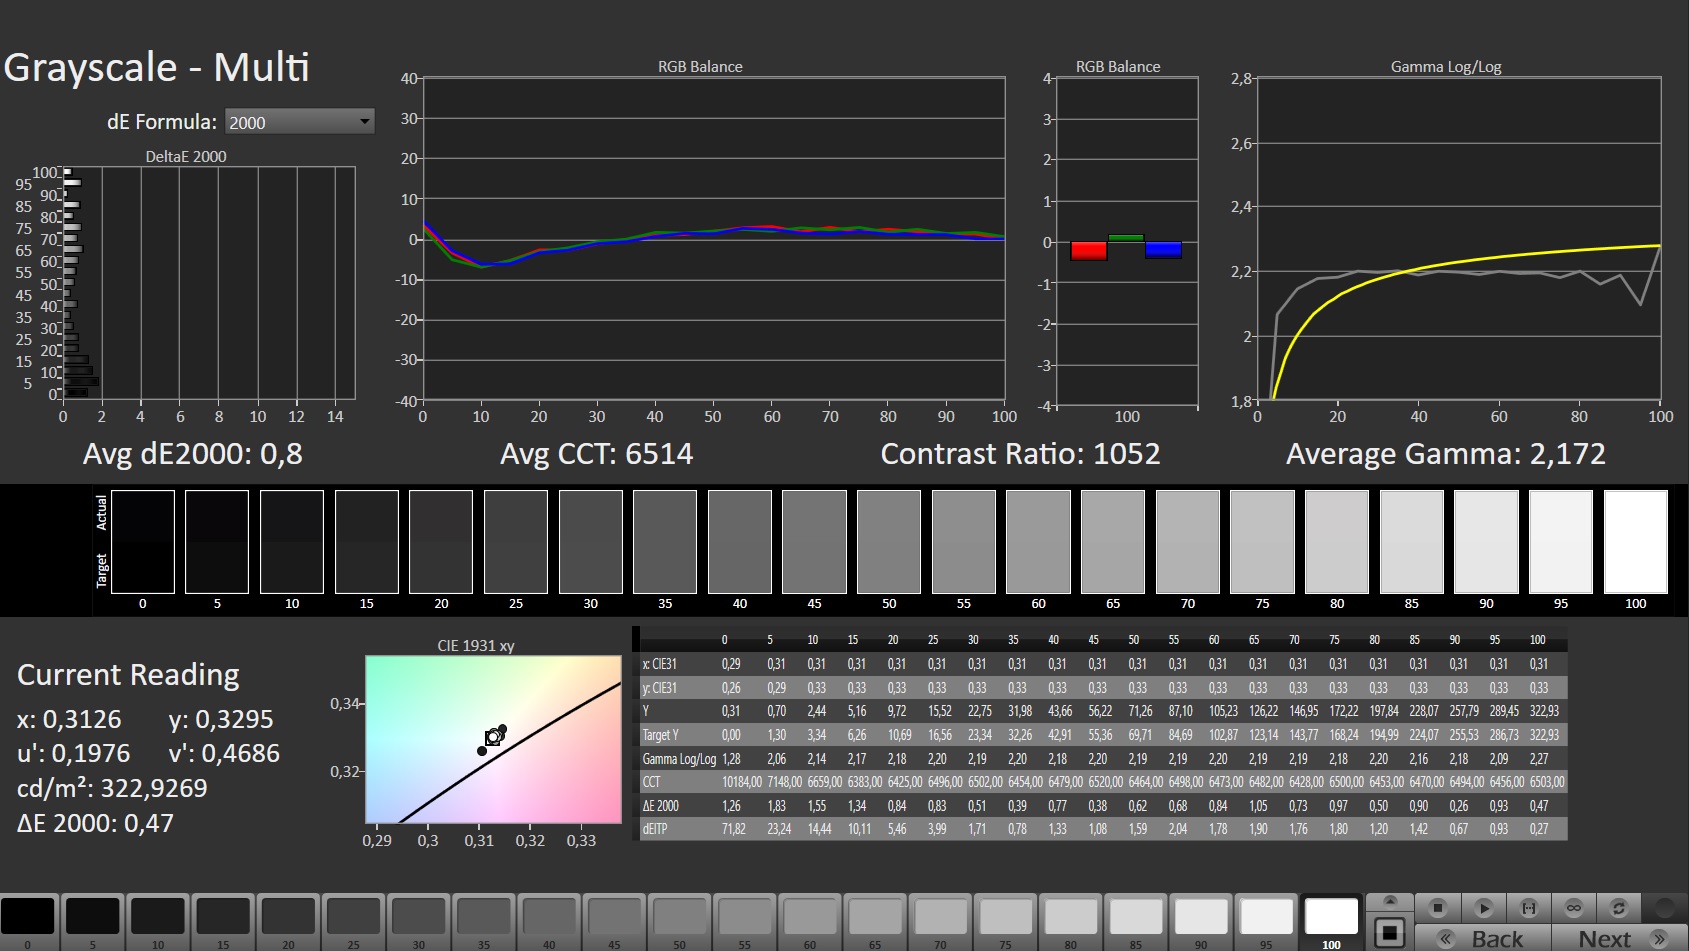
O brilho (303,1 cd/m²) e o contraste (988:1) da tela mate de 15,6 polegadas (2.560x1.440 pixels) mal atingem suas respectivas metas. O painel de 165 Hz tem tempos de resposta rápidos. Nenhuma cintilação do PWM pôde ser detectada

| |||||||||||||||||||||||||
iluminação: 89 %
iluminação com acumulador: 326 cd/m²
Contraste: 988:1 (Preto: 0.33 cd/m²)
ΔE ColorChecker Calman: 2.73 | ∀{0.5-29.43 Ø4.71}
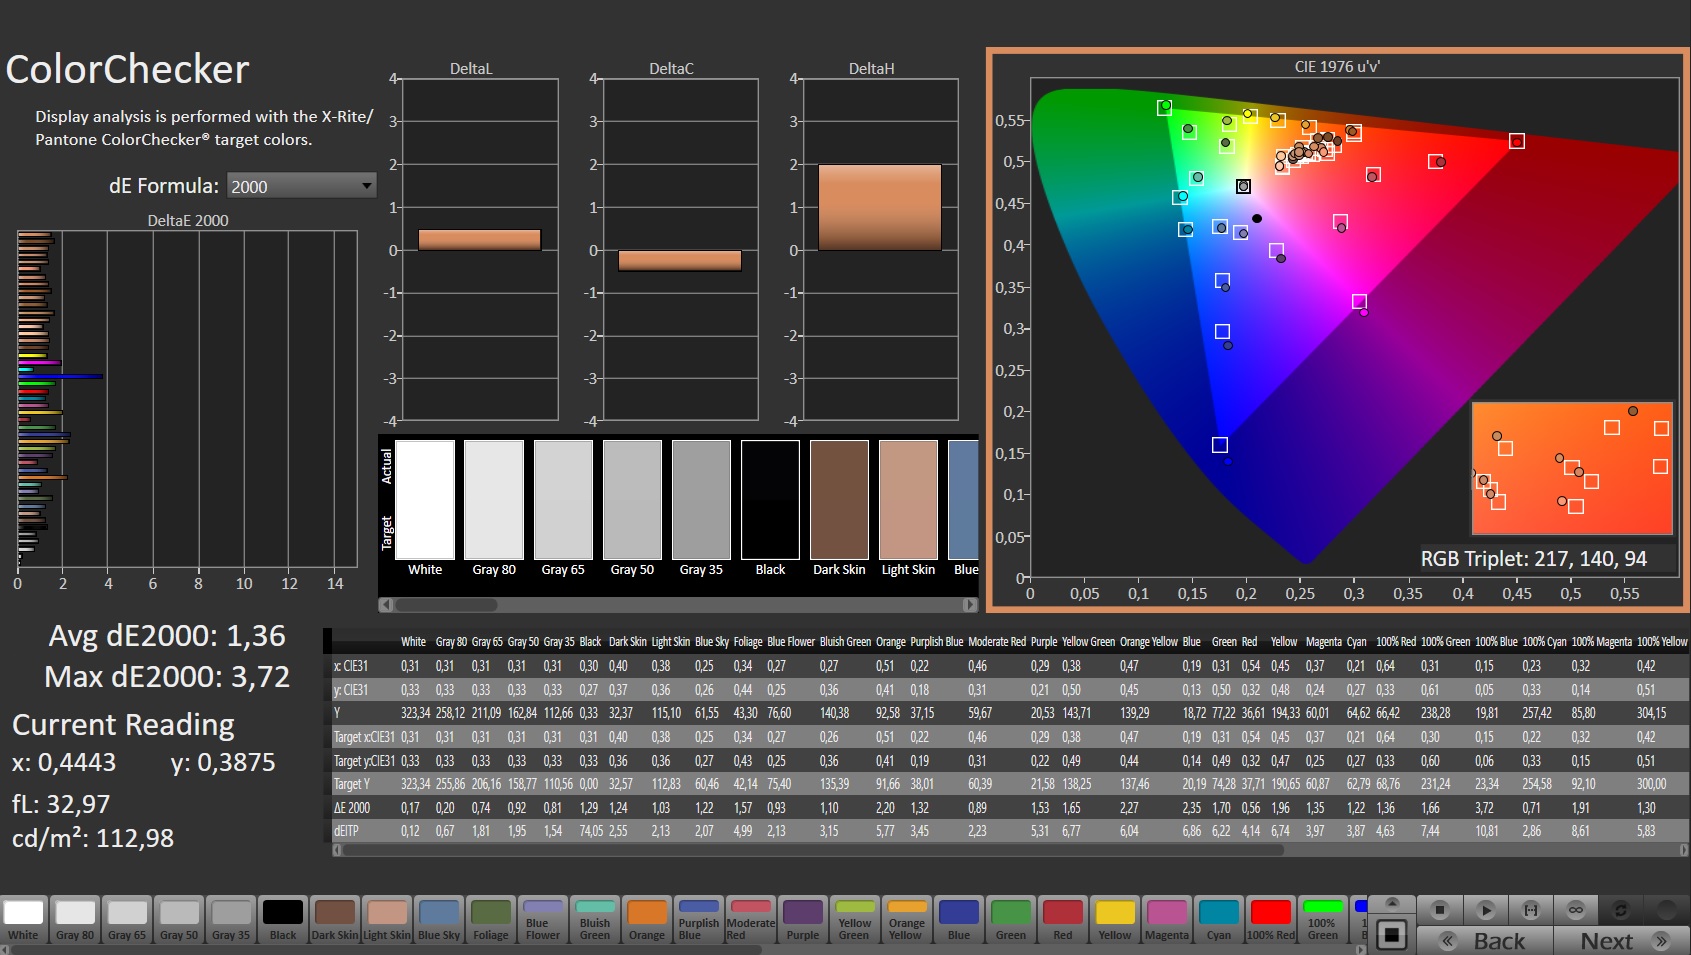
calibrated: 1.36
ΔE Greyscale Calman: 5.2 | ∀{0.09-98 Ø4.96}
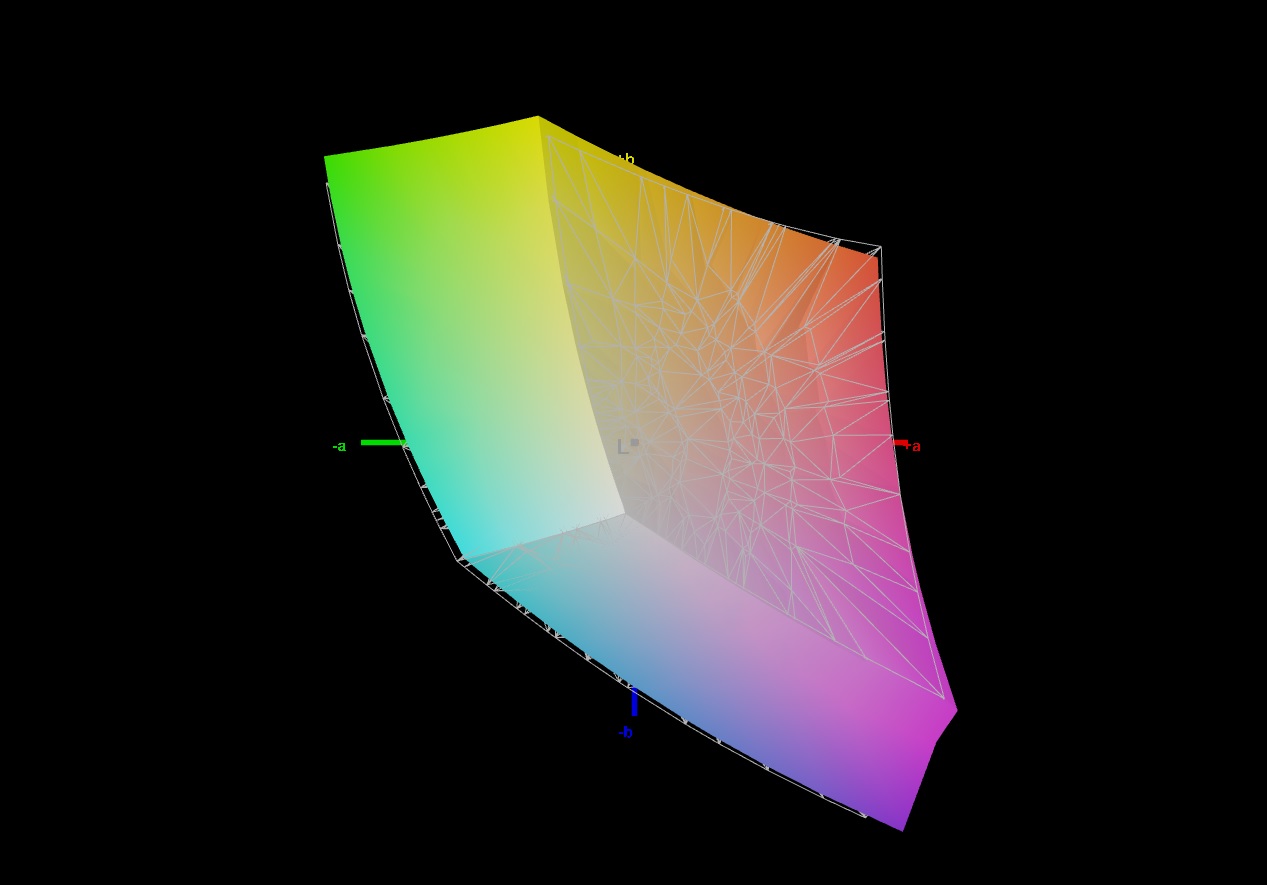
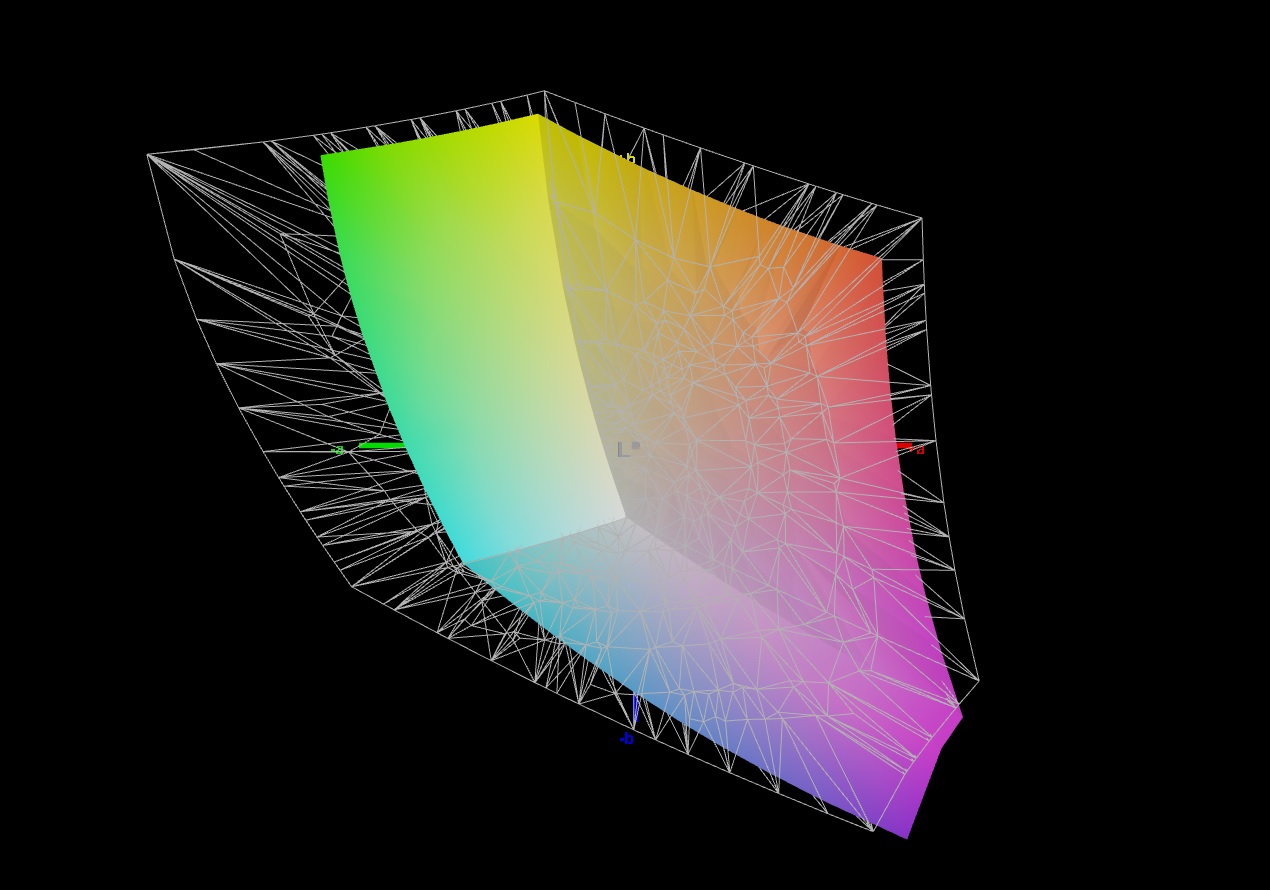
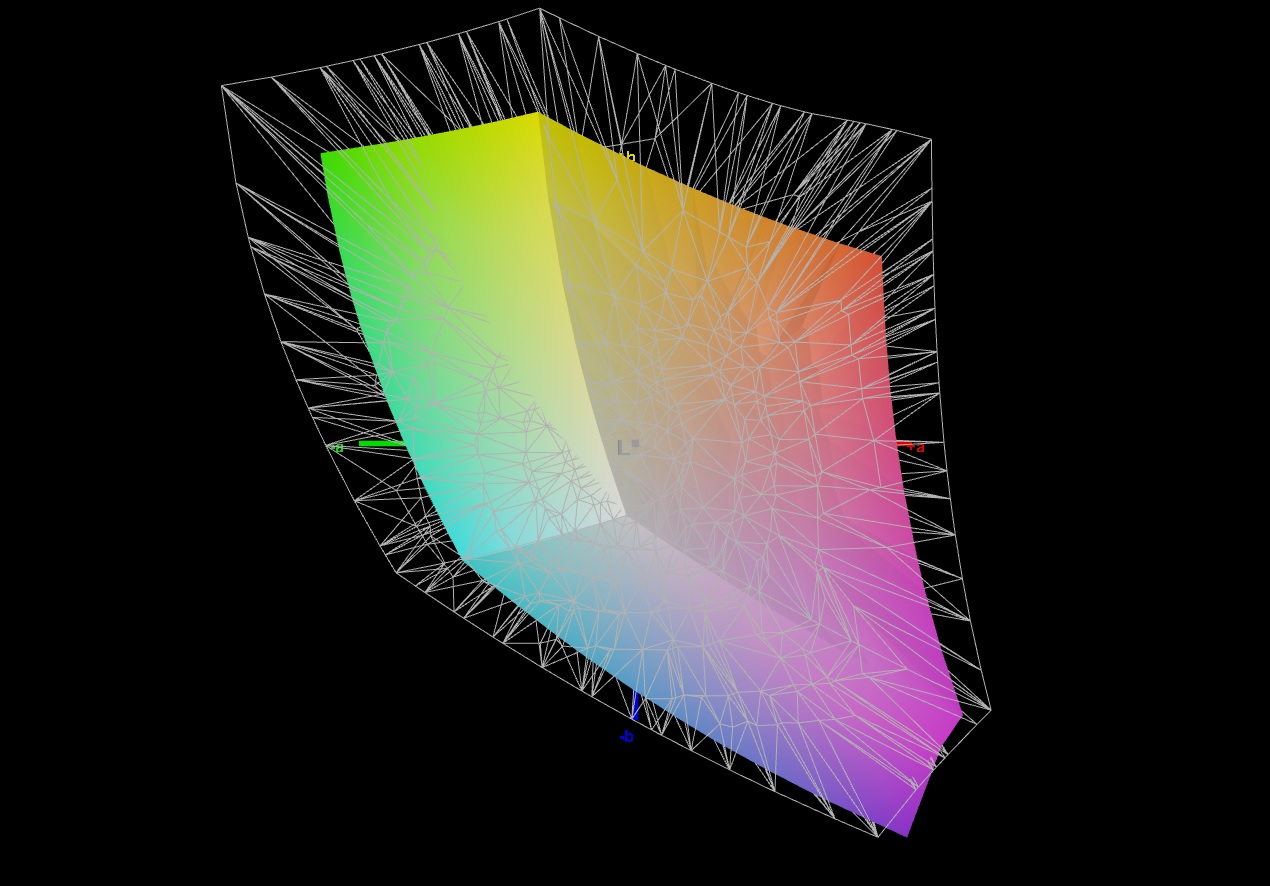
68.2% AdobeRGB 1998 (Argyll 3D)
96.7% sRGB (Argyll 3D)
67.3% Display P3 (Argyll 3D)
Gamma: 2.074
CCT: 6911 K
| Schenker XMG Fusion 15 (Mid 22) BOE CQ NE156QHM-NY2, IPS, 2560x1440, 15.6" | Asus TUF Dash F15 FX517ZR BOE CQ NE156QHM-NY1, IPS, 2560x1440, 15.6" | Acer Nitro 5 AN515-58-72QR Chi Mei N156KME-GNA, IPS, 2560x1440, 15.6" | HP Omen 16-b1090ng BOE09E5, IPS, 2560x1440, 16.1" | MSI Delta 15 A5EFK LQ156M1JW03 (SHP155D), IPS-Level, 1920x1080, 15.6" | Razer Blade 15 Base Edition 2021, i7-10750H RTX 3060 BOE NV156FHM-N4K, IPS, 1920x1080, 15.6" | |
|---|---|---|---|---|---|---|
| Display | 25% | 23% | 4% | -0% | -4% | |
| Display P3 Coverage (%) | 67.3 | 98.4 46% | 95.6 42% | 71 5% | 66.5 -1% | 64.3 -4% |
| sRGB Coverage (%) | 96.7 | 99.9 3% | 99.8 3% | 97.9 1% | 97.8 1% | 91.8 -5% |
| AdobeRGB 1998 Coverage (%) | 68.2 | 85.9 26% | 85.2 25% | 73.3 7% | 67.6 -1% | 65.5 -4% |
| Response Times | 9% | -41% | -30% | -30% | -10% | |
| Response Time Grey 50% / Grey 80% * (ms) | 11.6 ? | 5.6 ? 52% | 15.7 ? -35% | 14.5 ? -25% | 12.8 ? -10% | 8.8 ? 24% |
| Response Time Black / White * (ms) | 7 ? | 9.4 ? -34% | 10.2 ? -46% | 9.4 ? -34% | 10.4 ? -49% | 10 ? -43% |
| PWM Frequency (Hz) | 23580 ? | 1000 ? | ||||
| Screen | 20% | 8% | -5% | 1% | -12% | |
| Brightness middle (cd/m²) | 326 | 286 -12% | 332 2% | 335 3% | 291 -11% | 317.2 -3% |
| Brightness (cd/m²) | 303 | 266 -12% | 303 0% | 319 5% | 266 -12% | 306 1% |
| Brightness Distribution (%) | 89 | 87 -2% | 86 -3% | 90 1% | 88 -1% | 89 0% |
| Black Level * (cd/m²) | 0.33 | 0.25 24% | 0.29 12% | 0.28 15% | 0.36 -9% | 0.31 6% |
| Contrast (:1) | 988 | 1144 16% | 1145 16% | 1196 21% | 808 -18% | 1023 4% |
| Colorchecker dE 2000 * | 2.73 | 2.14 22% | 3.61 -32% | 4.38 -60% | 2.98 -9% | 4.37 -60% |
| Colorchecker dE 2000 max. * | 9.54 | 5.22 45% | 7.71 19% | 9.48 1% | 7.59 20% | 6.62 31% |
| Colorchecker dE 2000 calibrated * | 1.36 | 0.67 51% | 0.59 57% | 1.33 2% | 0.91 33% | 2.67 -96% |
| Greyscale dE 2000 * | 5.2 | 2.8 46% | 5.2 -0% | 7 -35% | 4.2 19% | 4.5 13% |
| Gamma | 2.074 106% | 2.23 99% | 2.155 102% | 2.103 105% | 2.293 96% | 2.4 92% |
| CCT | 6911 94% | 7092 92% | 6724 97% | 6244 104% | 7624 85% | 7418 88% |
| Color Space (Percent of AdobeRGB 1998) (%) | 59.2 | |||||
| Color Space (Percent of sRGB) (%) | 91.4 | |||||
| Média Total (Programa/Configurações) | 18% /
19% | -3% /
4% | -10% /
-7% | -10% /
-3% | -9% /
-10% |
* ... menor é melhor
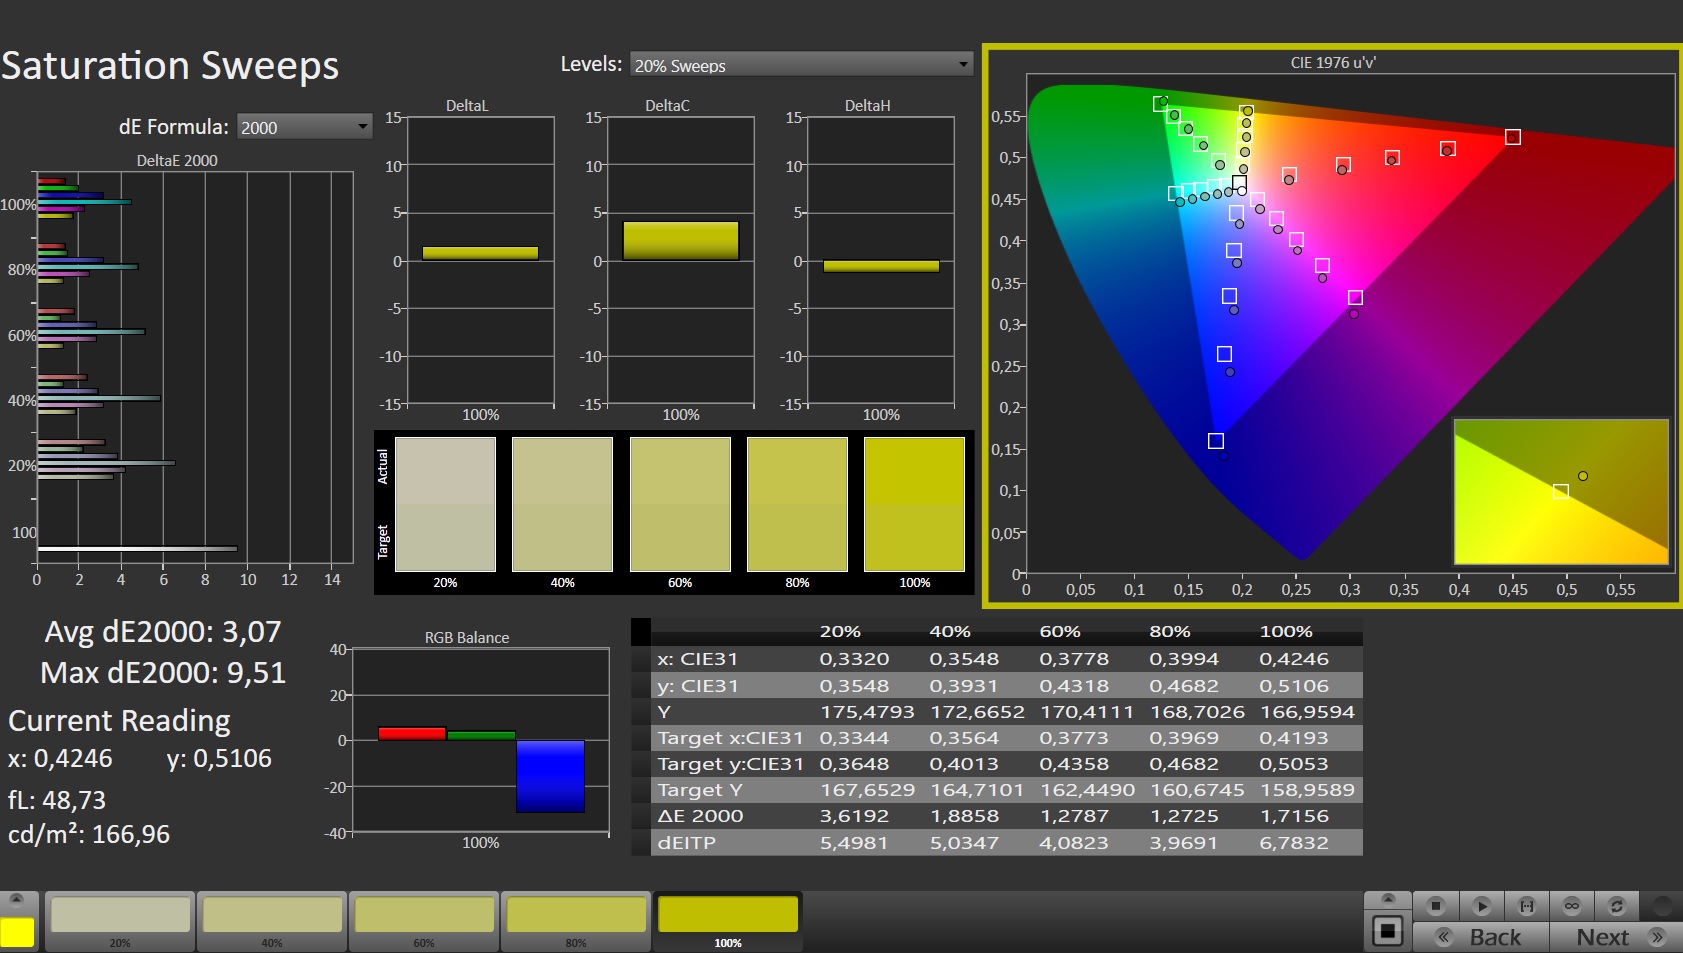
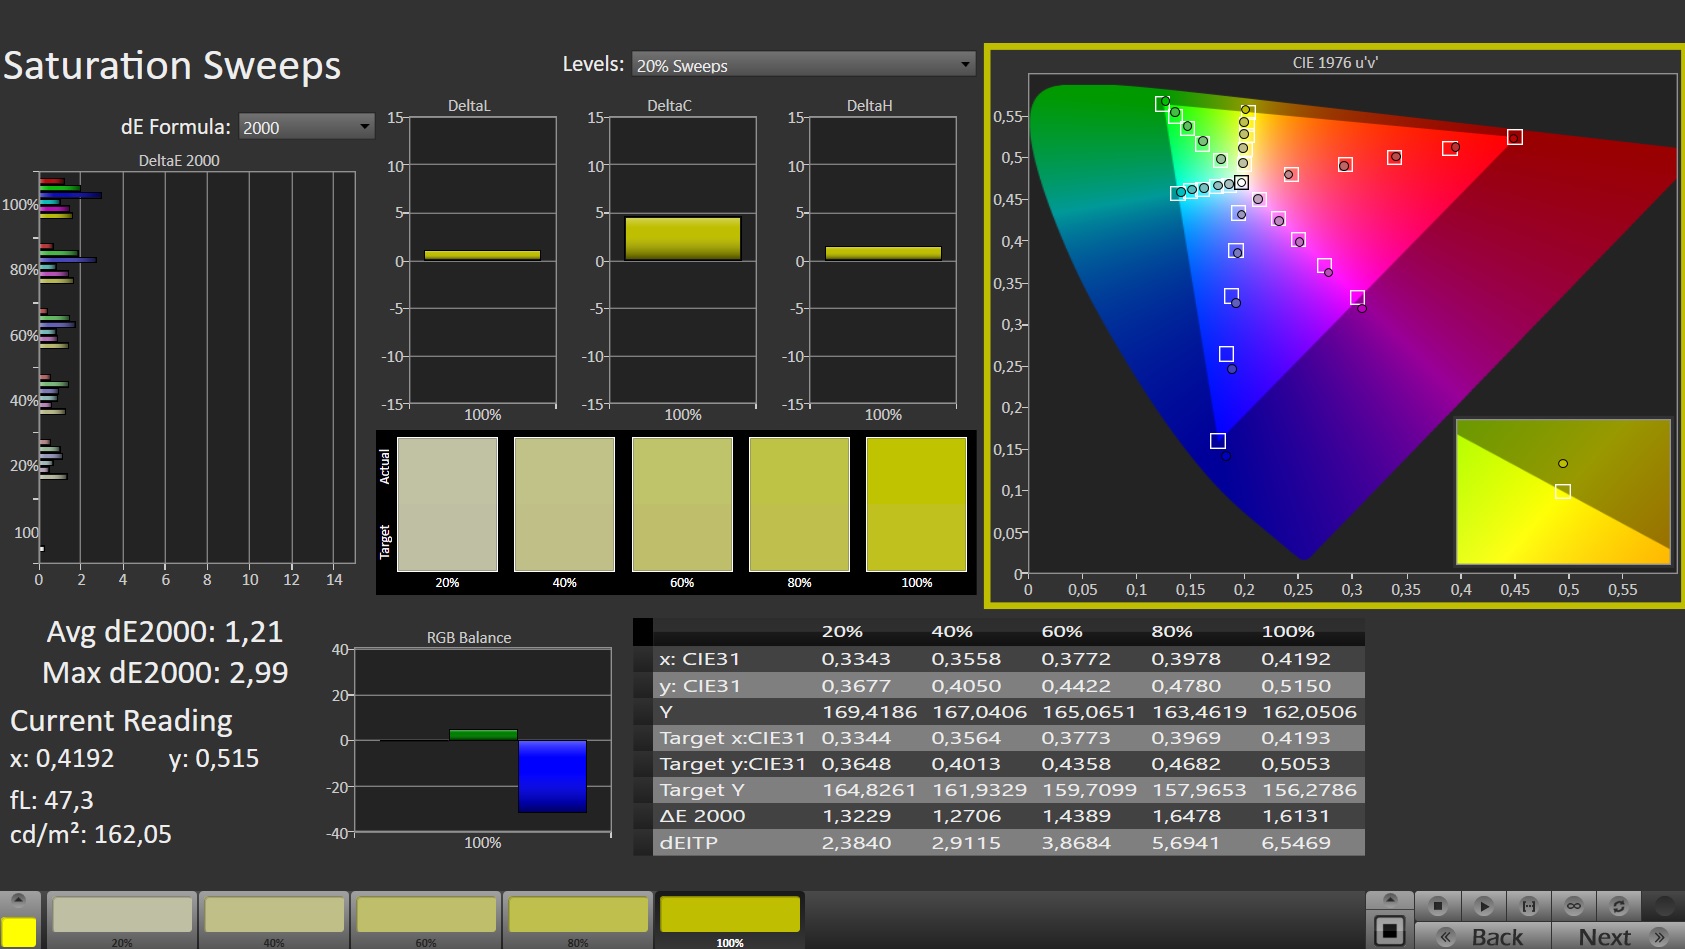
Logo desde a caixa o display reproduz bem as cores. O desvio de 2,73 está dentro da faixa do alvo (Delta E < 3) - este pequeno desvio não é perceptível para os telespectadores. A calibração leva a melhorias: O desvio da cor cai para 1,36, e a escala de cinza é exibida de forma mais equilibrada. O visor pode reproduzir o espaço de cor sRGB (96,7%) quase completamente; os espaços de cor AdobeRGB e DCI-P3 são reproduzidos a 68% e 67%, respectivamente
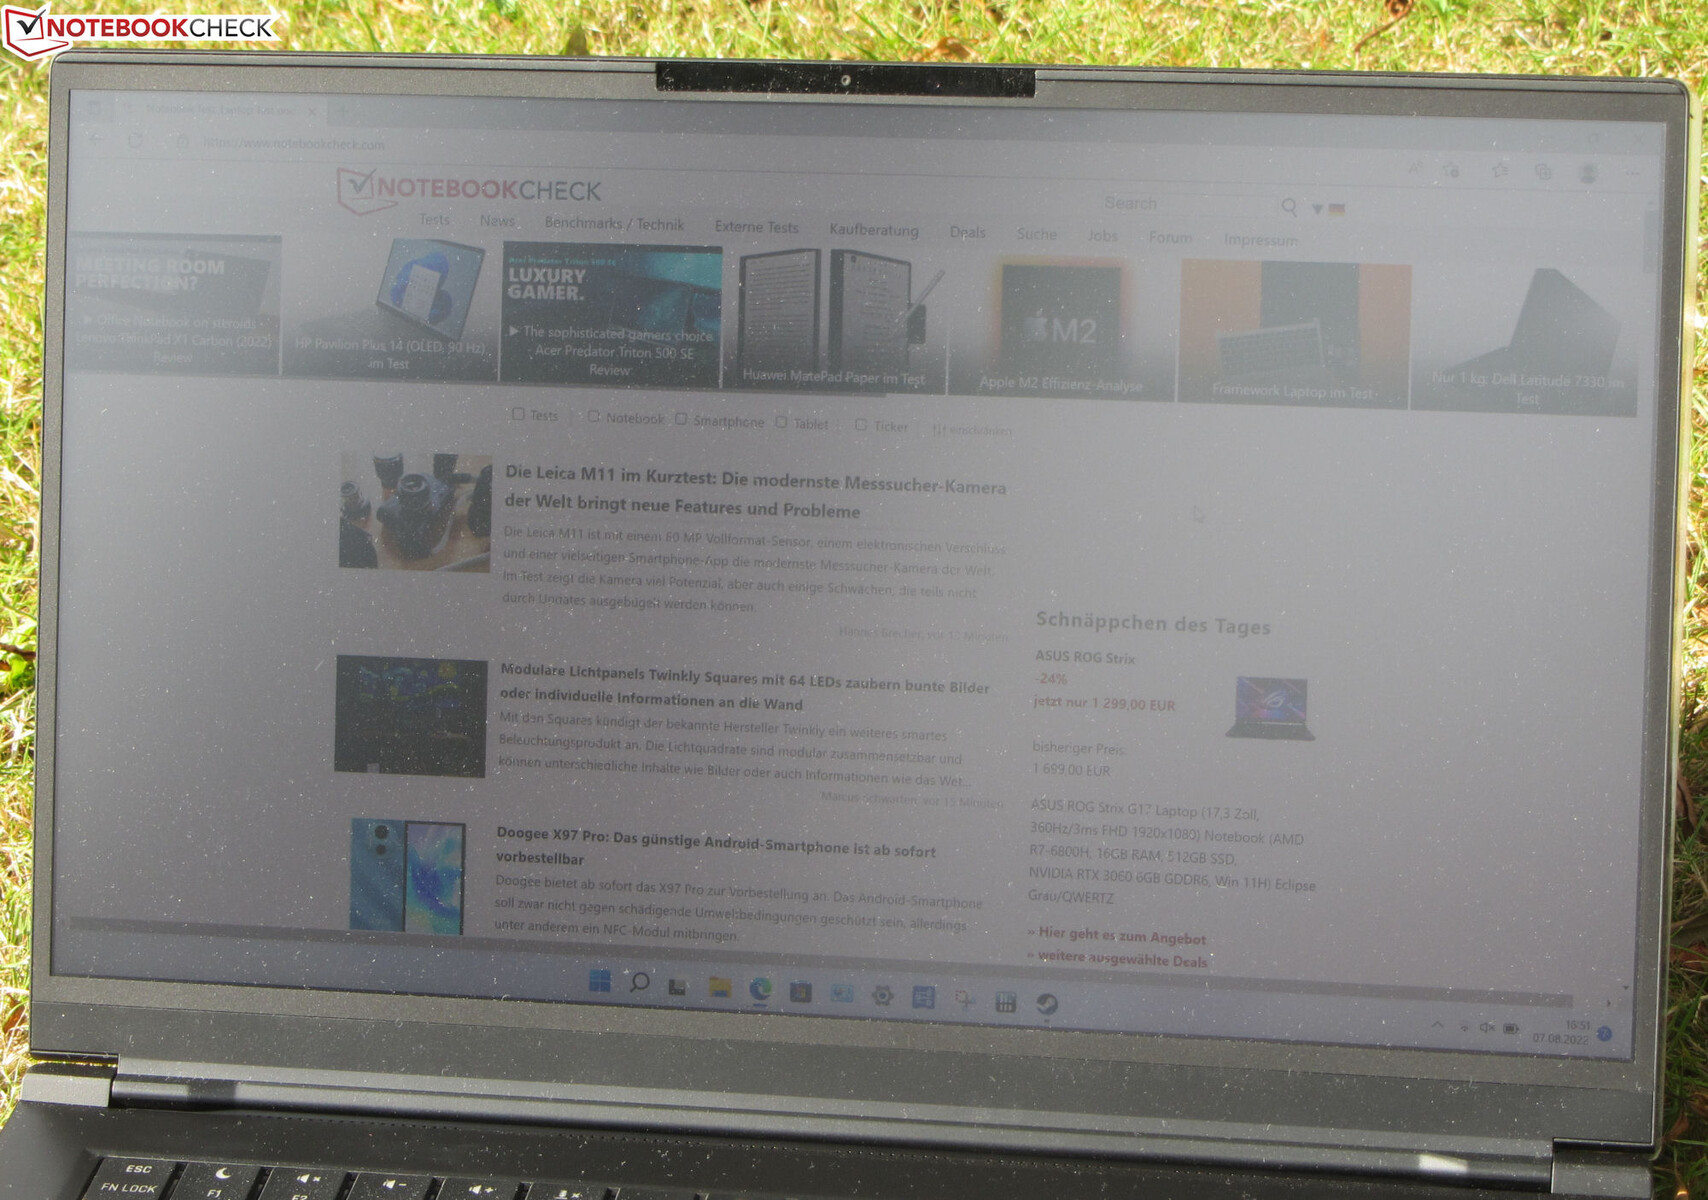
O painel IPS estável em ângulo de visão é legível a partir de qualquer posição. A legibilidade ao ar livre é possível quando o sol não está brilhando muito

Exibir tempos de resposta
| ↔ Tempo de resposta preto para branco | ||
|---|---|---|
| 7 ms ... ascensão ↗ e queda ↘ combinadas | ↗ 3.3 ms ascensão | 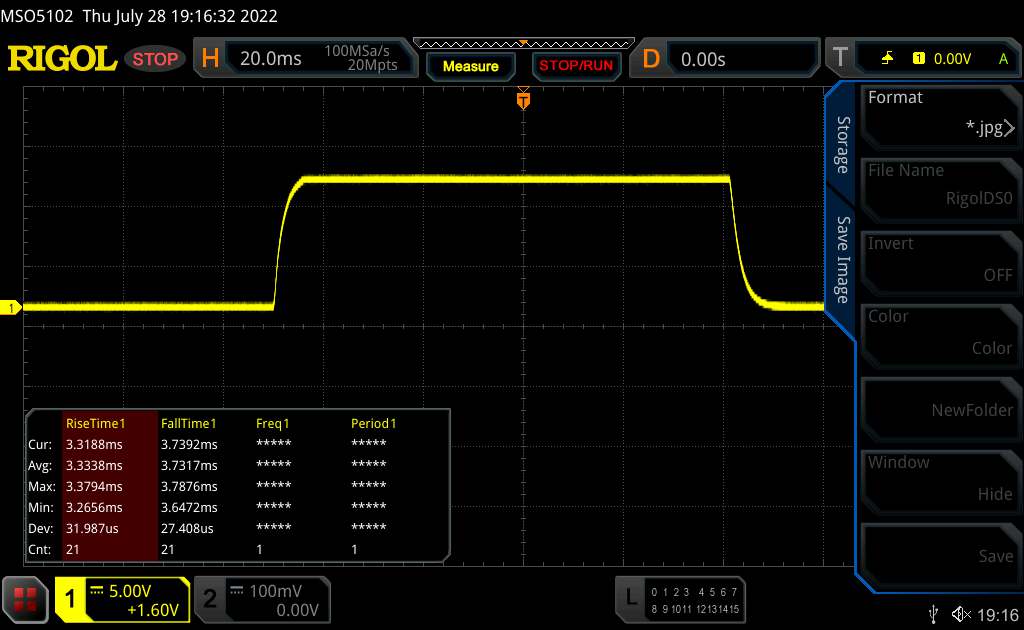 |
| ↘ 3.7 ms queda | ||
| A tela mostra taxas de resposta muito rápidas em nossos testes e deve ser muito adequada para jogos em ritmo acelerado. Em comparação, todos os dispositivos testados variam de 0.1 (mínimo) a 240 (máximo) ms. » 21 % de todos os dispositivos são melhores. Isso significa que o tempo de resposta medido é melhor que a média de todos os dispositivos testados (19.8 ms). | ||
| ↔ Tempo de resposta 50% cinza a 80% cinza | ||
| 11.6 ms ... ascensão ↗ e queda ↘ combinadas | ↗ 5.6 ms ascensão | 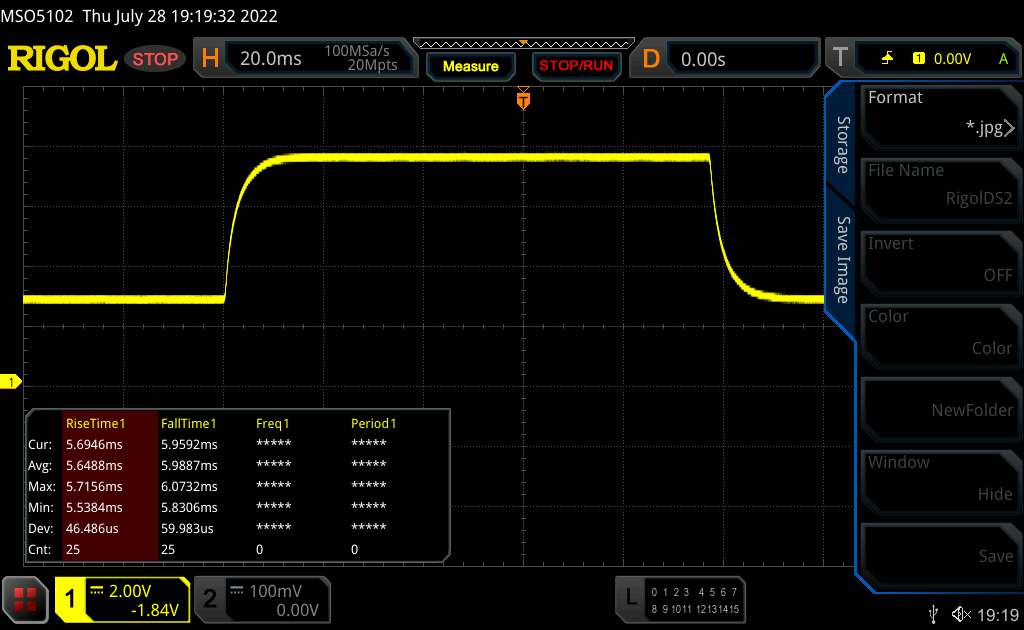 |
| ↘ 6 ms queda | ||
| A tela mostra boas taxas de resposta em nossos testes, mas pode ser muito lenta para jogadores competitivos. Em comparação, todos os dispositivos testados variam de 0.165 (mínimo) a 636 (máximo) ms. » 25 % de todos os dispositivos são melhores. Isso significa que o tempo de resposta medido é melhor que a média de todos os dispositivos testados (31 ms). | ||
Cintilação da tela / PWM (modulação por largura de pulso)
| Tela tremeluzindo / PWM não detectado | 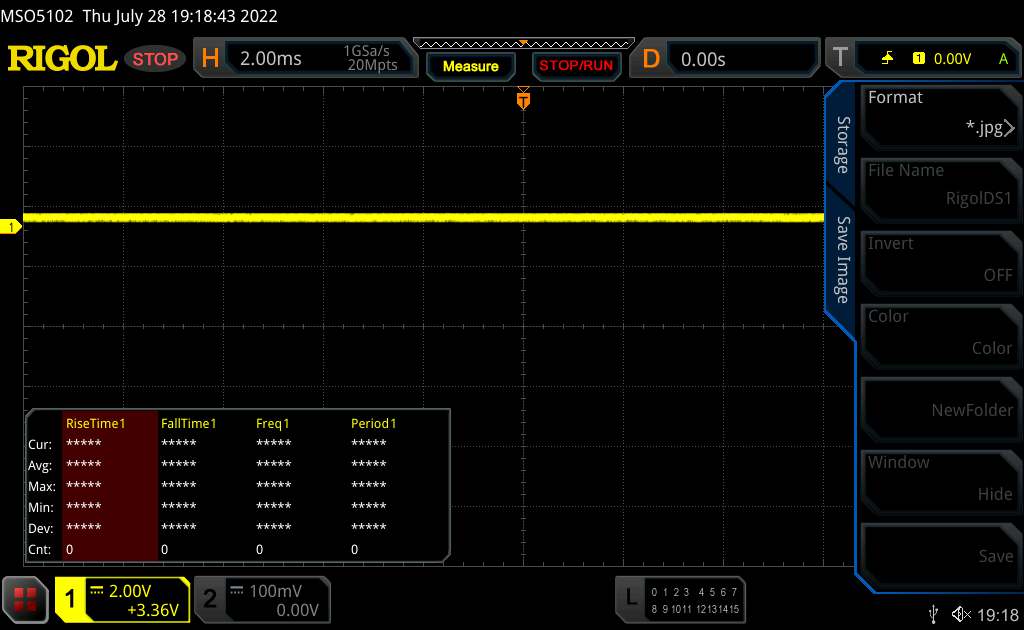 | ||
[pwm_comparison] Em comparação: 52 % de todos os dispositivos testados não usam PWM para escurecer a tela. Se PWM foi detectado, uma média de 7757 (mínimo: 5 - máximo: 343500) Hz foi medida. | |||
Desempenho - Tiger Lake encontra a Ampere
Com o XMG Fusion 15, a Schenker tem um poderoso laptop de 15,6 polegadas em sua linha de produtos que foi projetado para várias áreas de aplicação
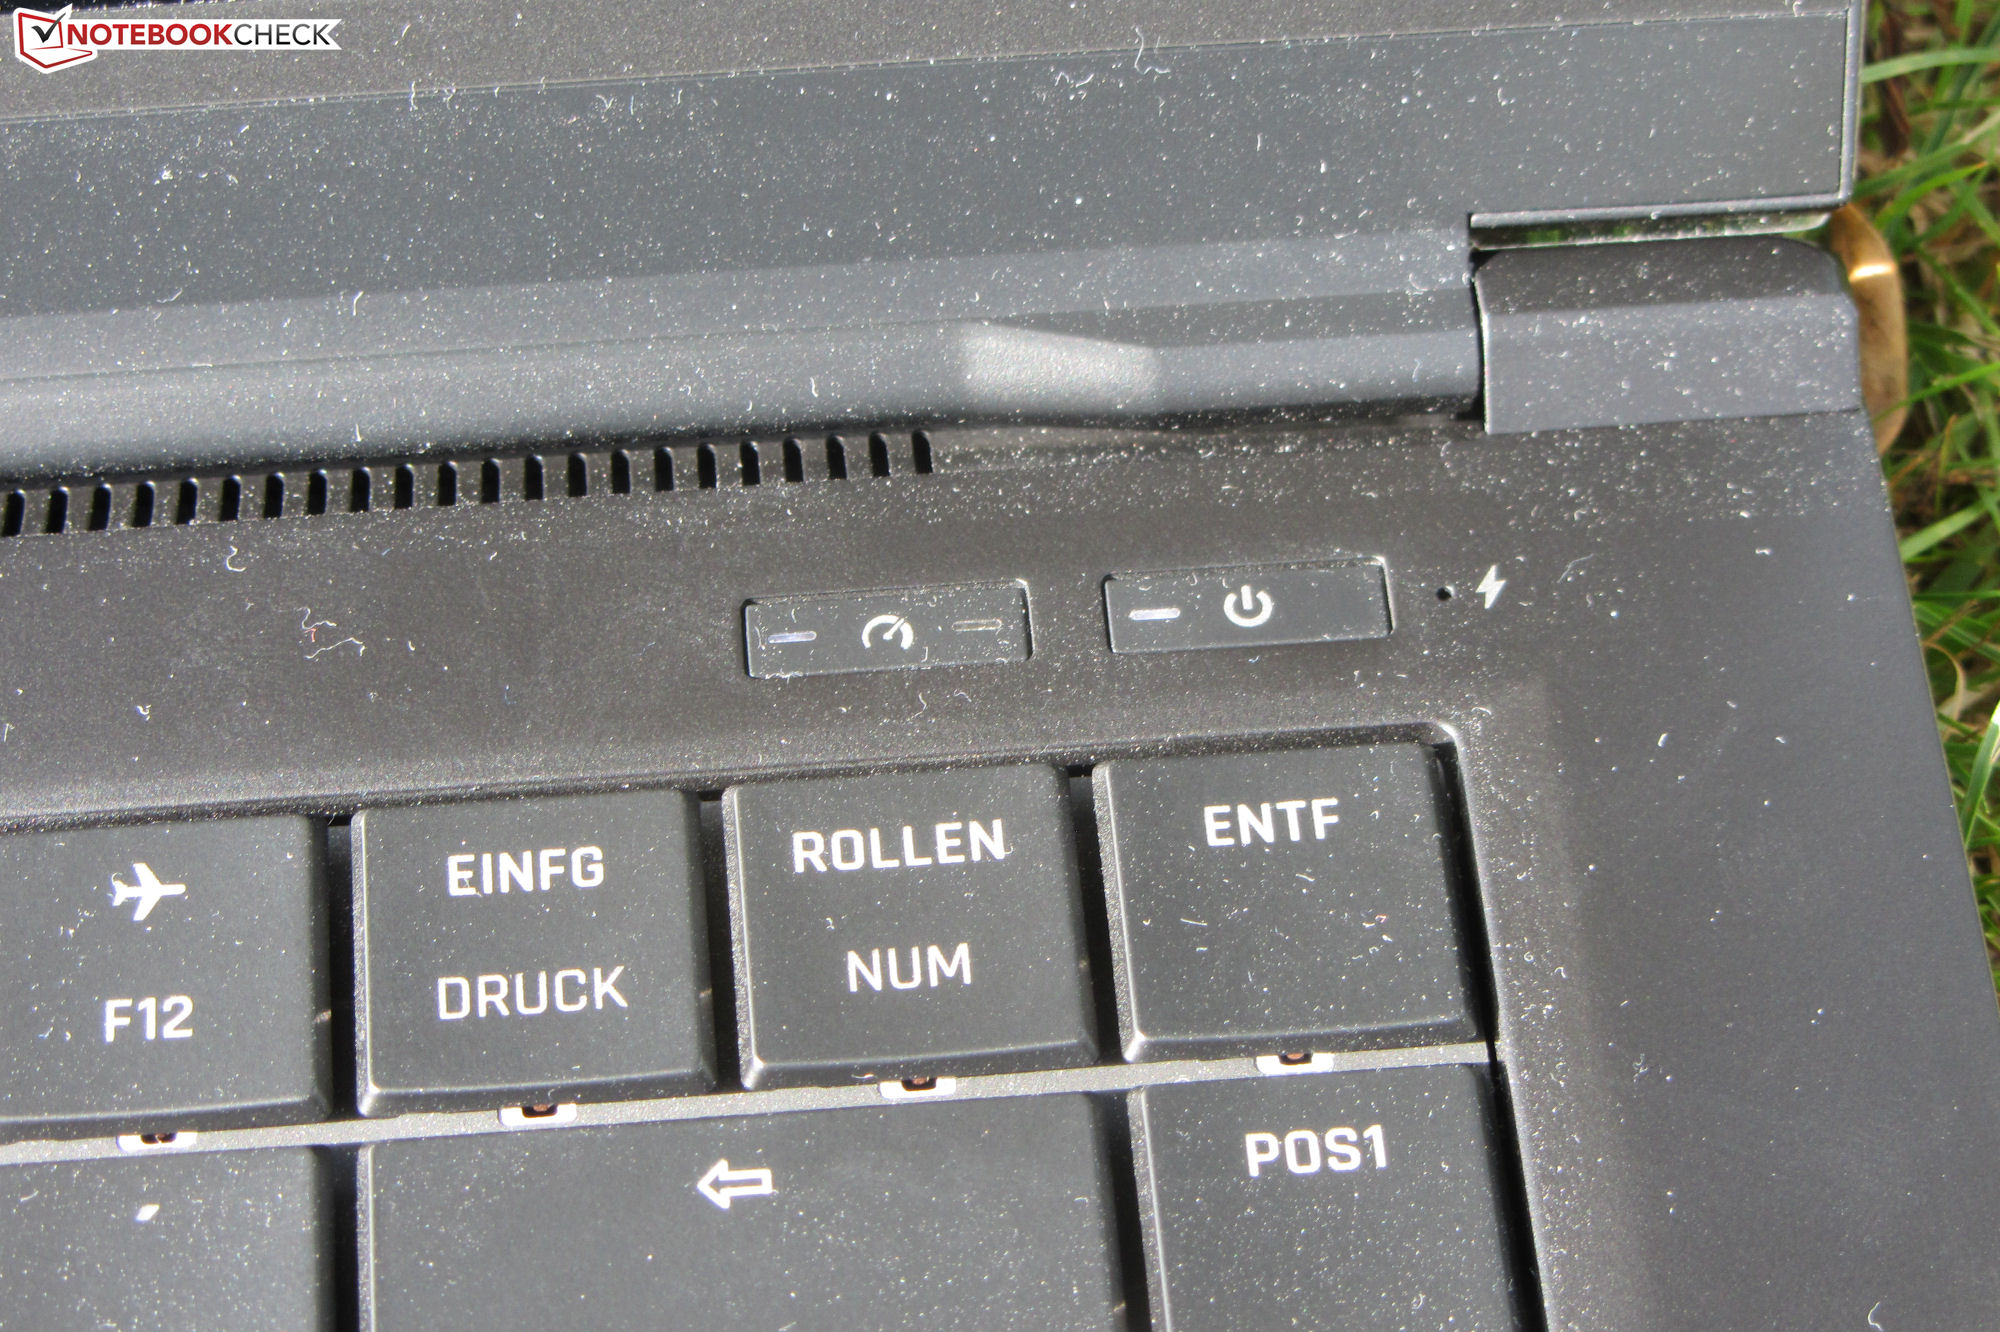
Condições de teste
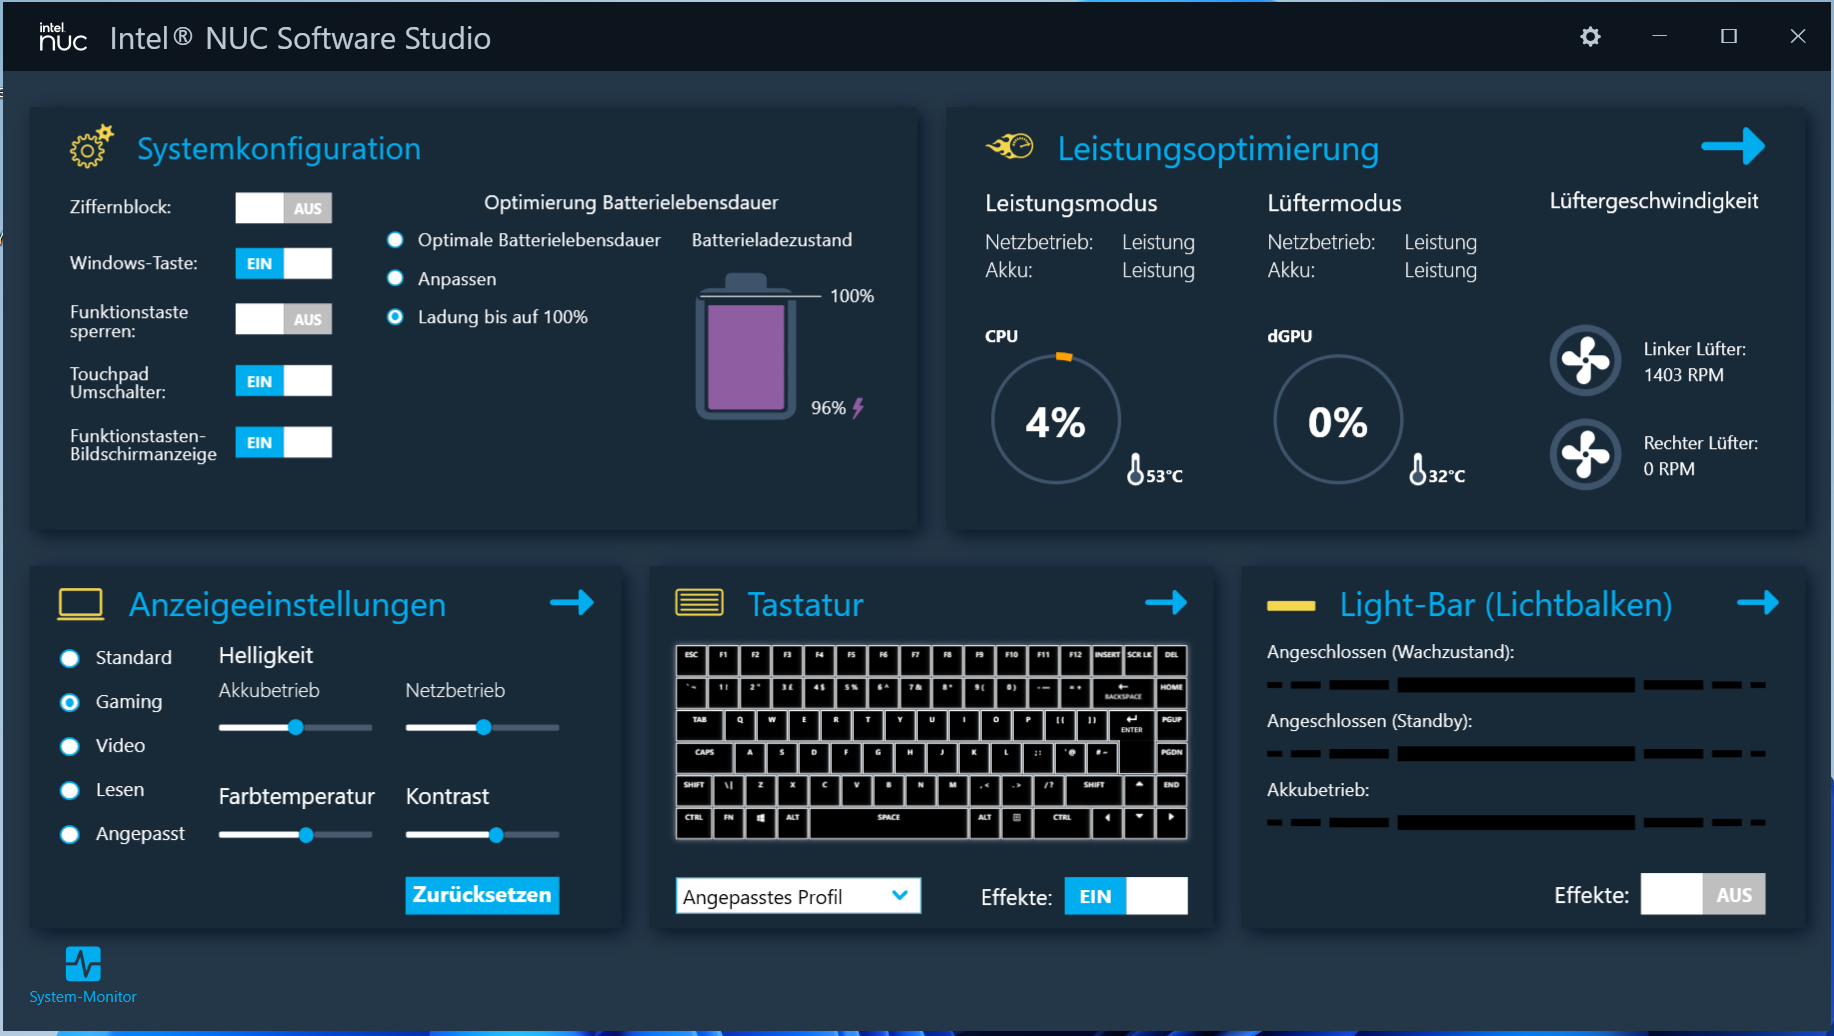
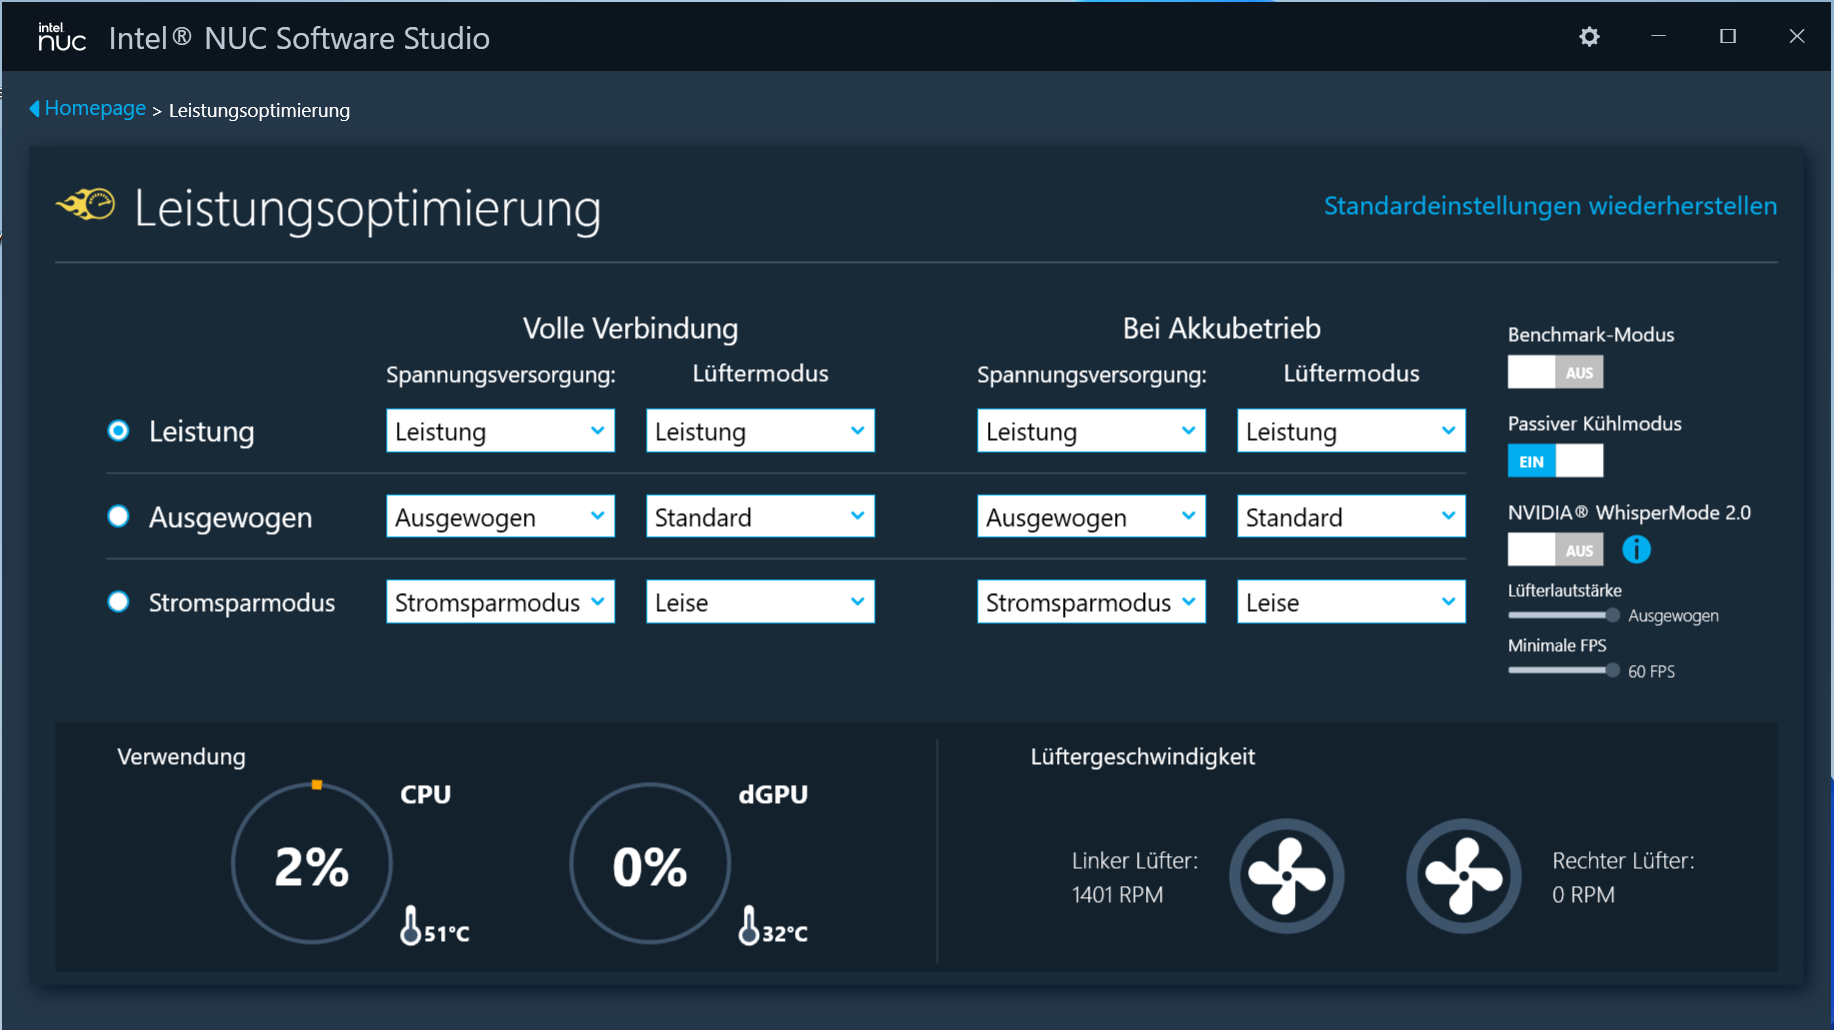
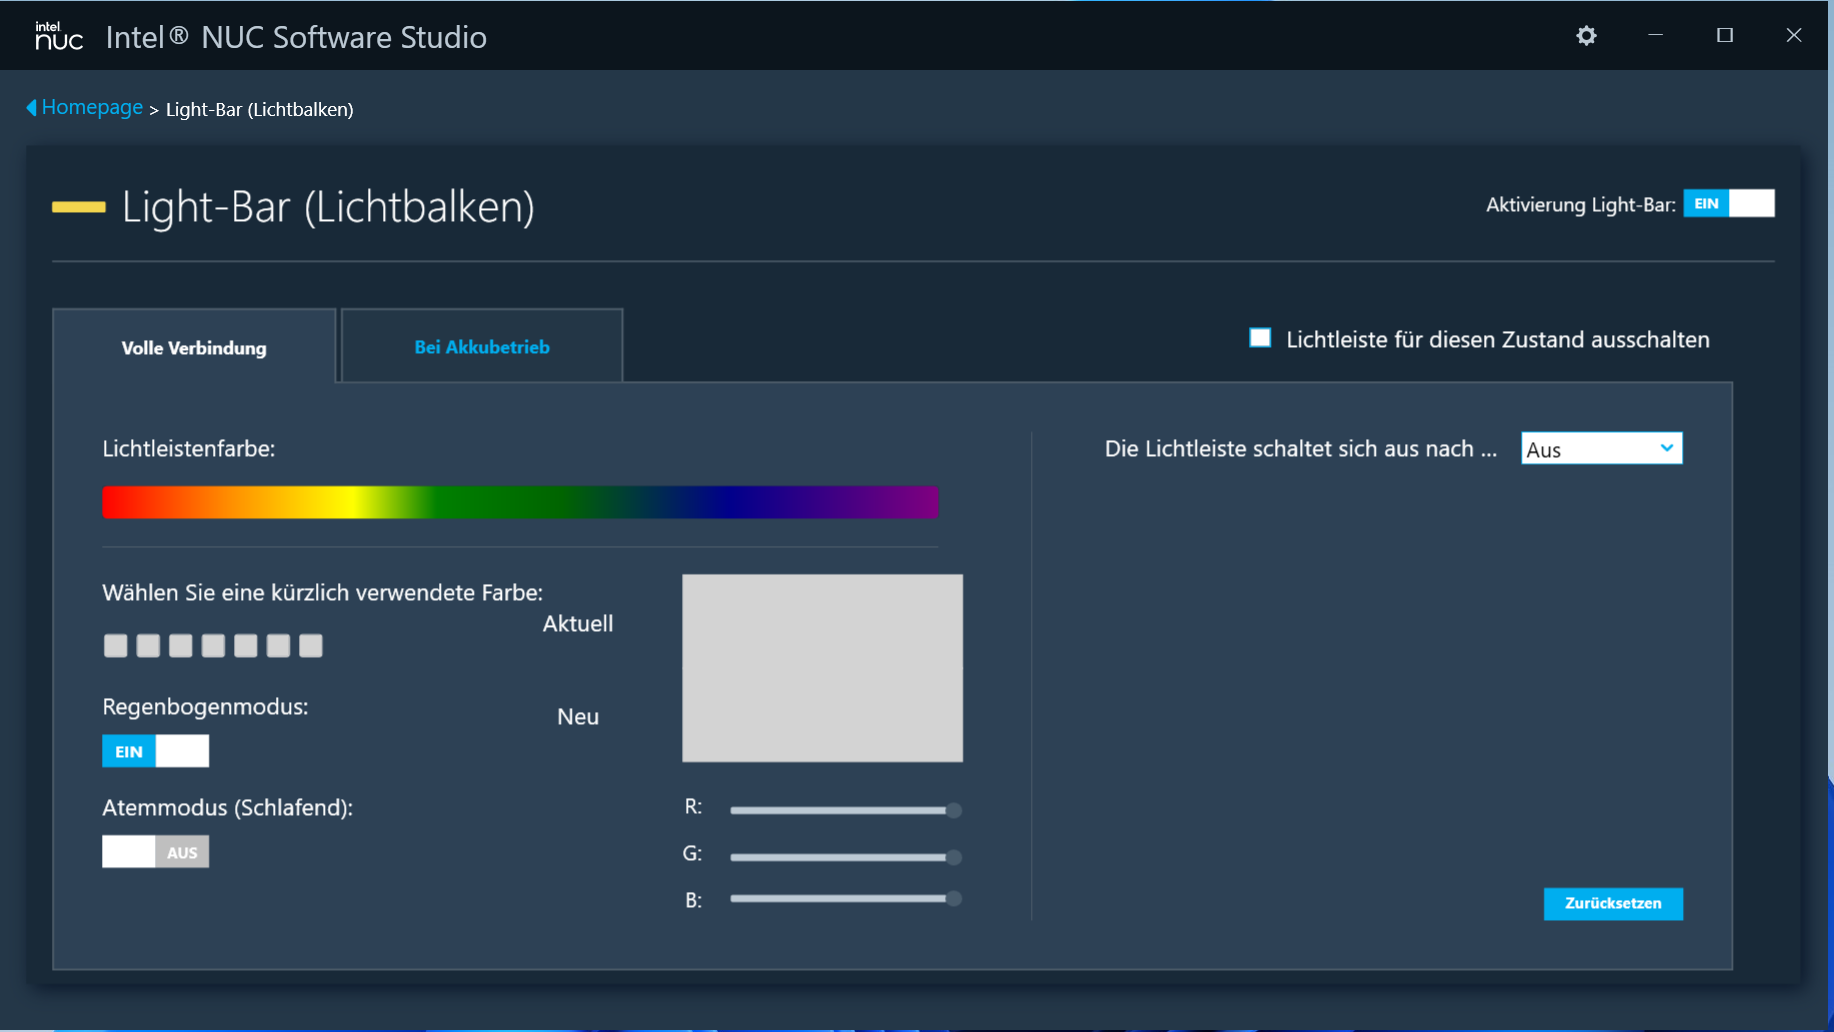
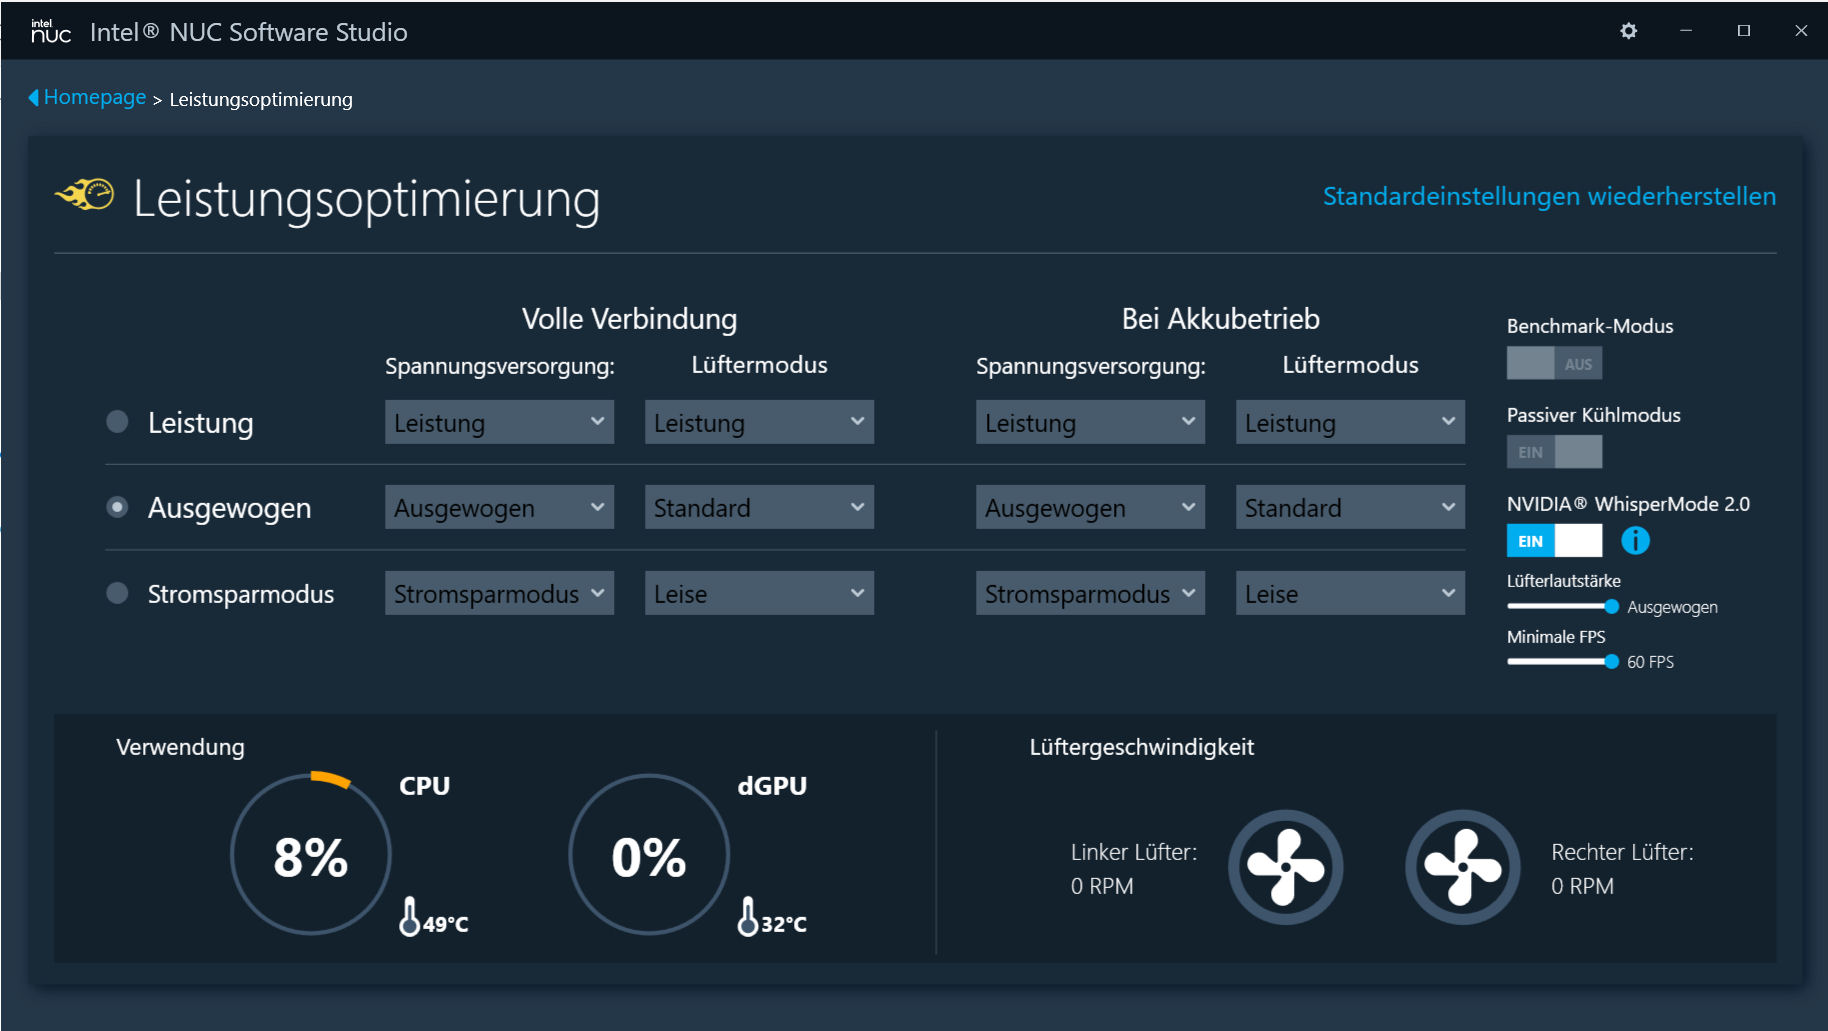
O centro de controle pré-instalado do laptop (Intel NUC Software Studio) permite aos usuários ajustar o desempenho, entre outras coisas. Há três perfis de desempenho disponíveis, que podem ser alternados dentro da aplicação ou através de um botão separado (ao lado do botão de alimentação). Um quarto perfil está disponível dentro do centro, que só pode ser ativado com um clique do mouse: "Benchmark mode". Este perfil libera o máximo desempenho do hardware incorporado e permite que os ventiladores trabalhem continuamente com a potência máxima.
Nosso teste é executado usando o perfil "Balanceado" e a função ativa "Modo de Resfriamento Passivo". Estas são as configurações padrão fora da caixa. O modo de resfriamento passivo faz com que os ventiladores parem assim que as temperaturas o permitam. Caso contrário, um ventilador funcionaria permanentemente a uma velocidade baixa.
| Desempenho | Equilibrado | Economia de energia | Modo Benchmark | |
|---|---|---|---|---|
| Limite de potência 1 | 65 W | 45 W | 30 W | 100 W |
| Limite de potência 2 | 90 W | 65 W | 60 W | 110 W |
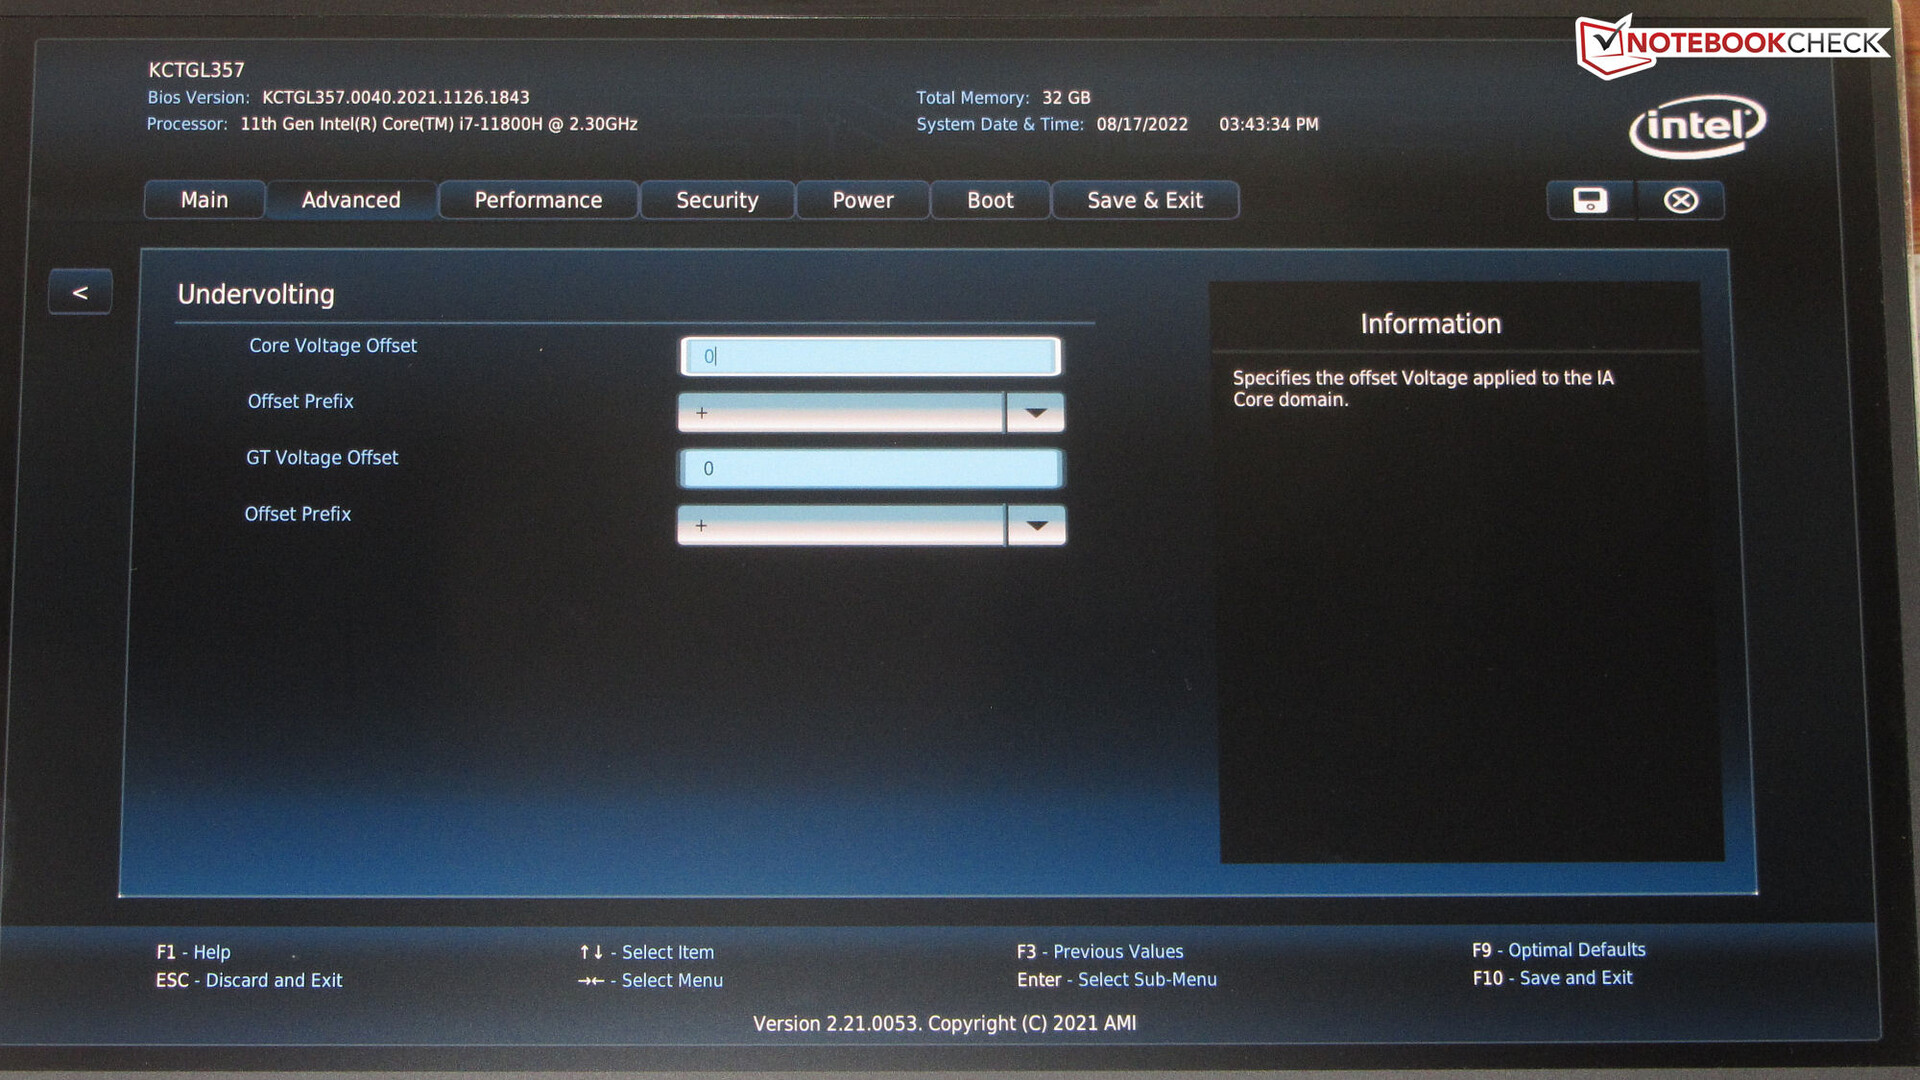
Subvoltagem via BIOS
O processador e o iGPU podem ser operados com tensões menores do que as pretendidas pelo fabricante (subvoltagem). Como resultado, o consumo de energia e o desenvolvimento de calor diminuem. Mas tenha cuidado: Baixar demais a voltagem pode levar a um sistema instável ou defeituoso. Neste caso, é necessário voltar ao nível de voltagem anterior. A subvoltagem é feita por conta e risco do próprio usuário
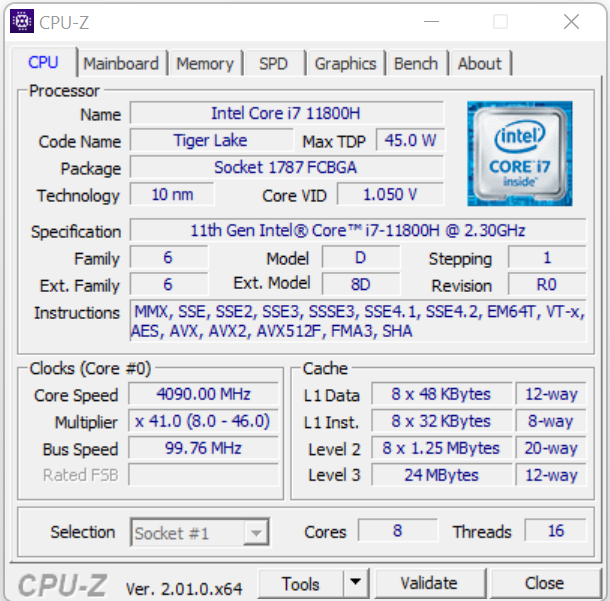
Processador
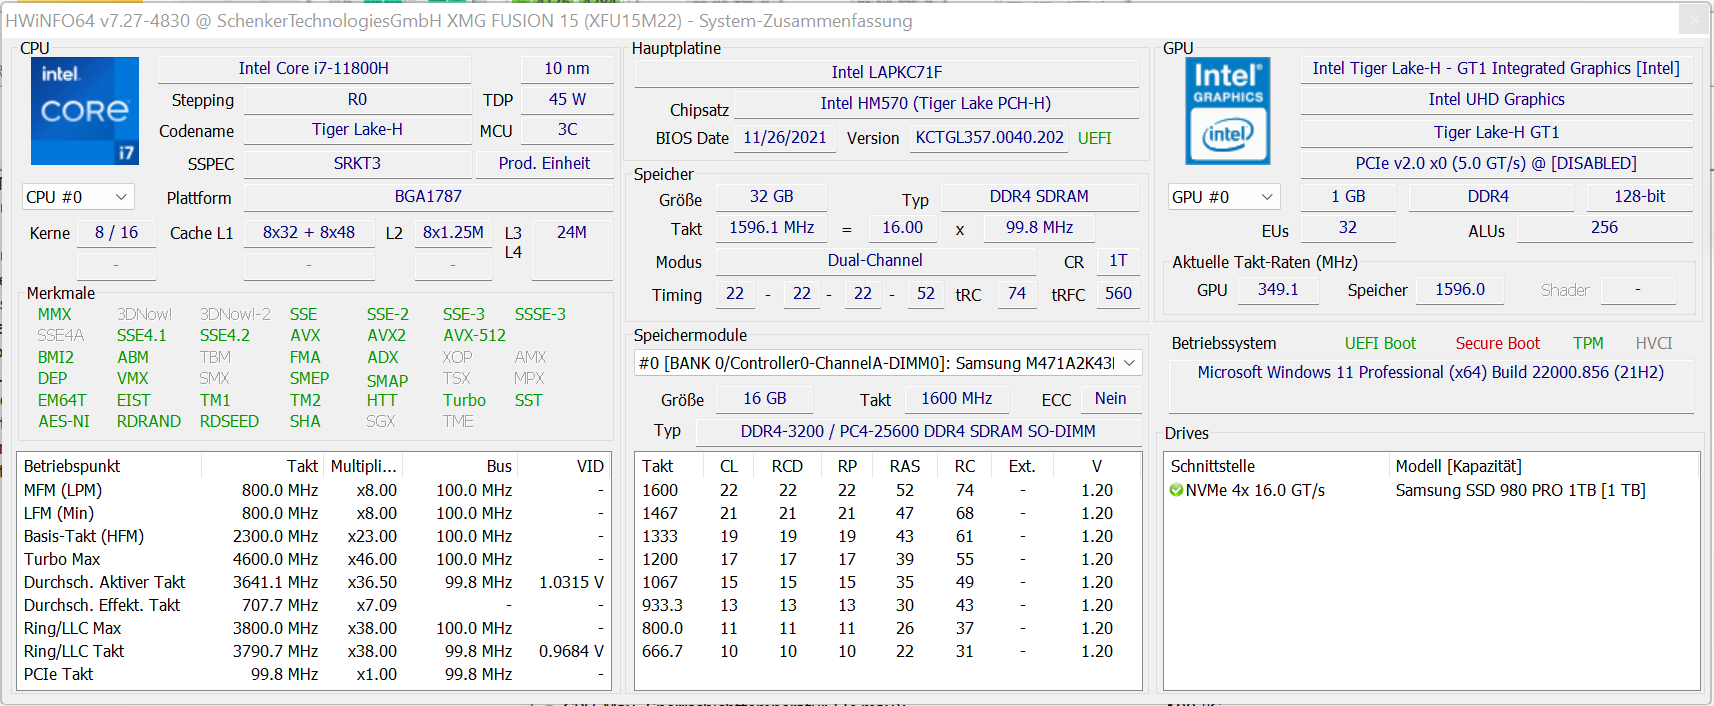
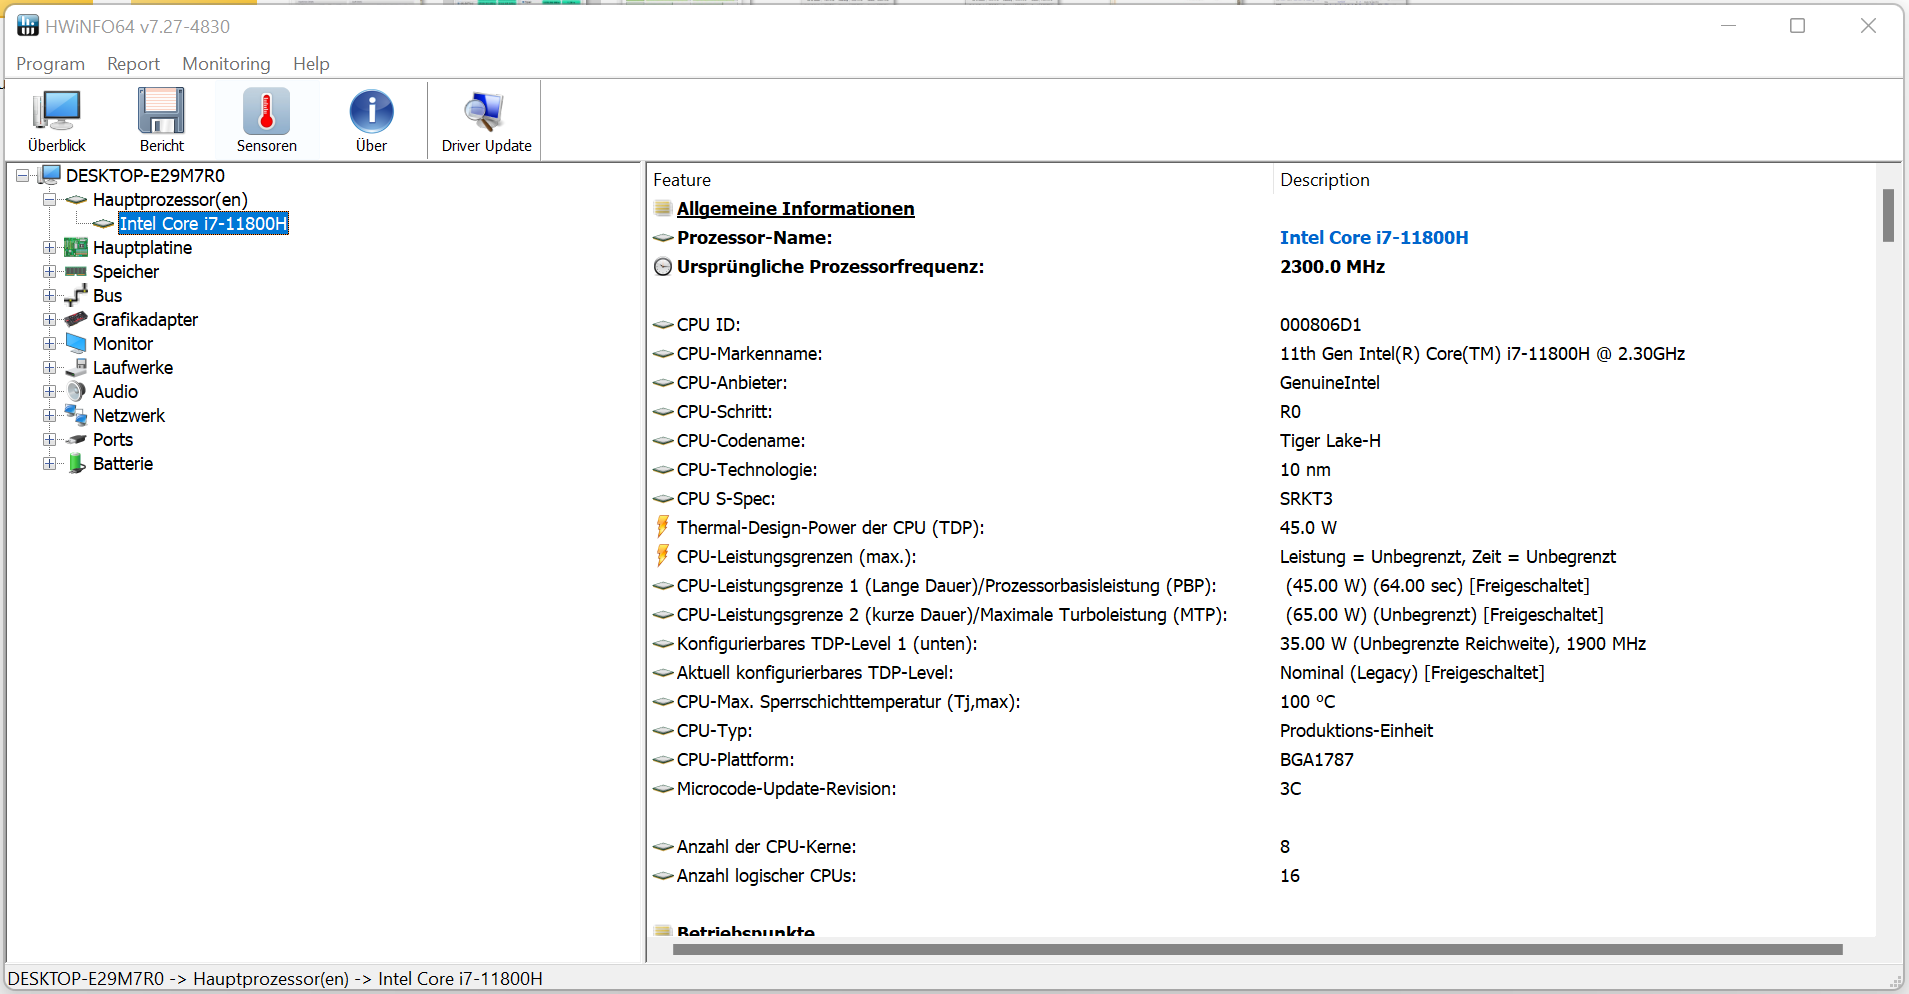
O
Core-i7-11800H processador quad-core (Tiger Lake) funciona a uma taxa de relógio de base de 2,3 GHz. Um aumento para 4,2 GHz (oito núcleos) ou 4,6 GHz (um núcleo) é possível via Turbo. Suporta hiper-Threading (dois fios por núcleo).
O teste de rosca múltipla do benchmark Cinebench R15 é processado em 1,3 a 4,2 GHz, enquanto o teste de rosca única é executado em 1,1 a 4,6 GHz. As taxas de relógio permanecem em um nível similar na potência da bateria.
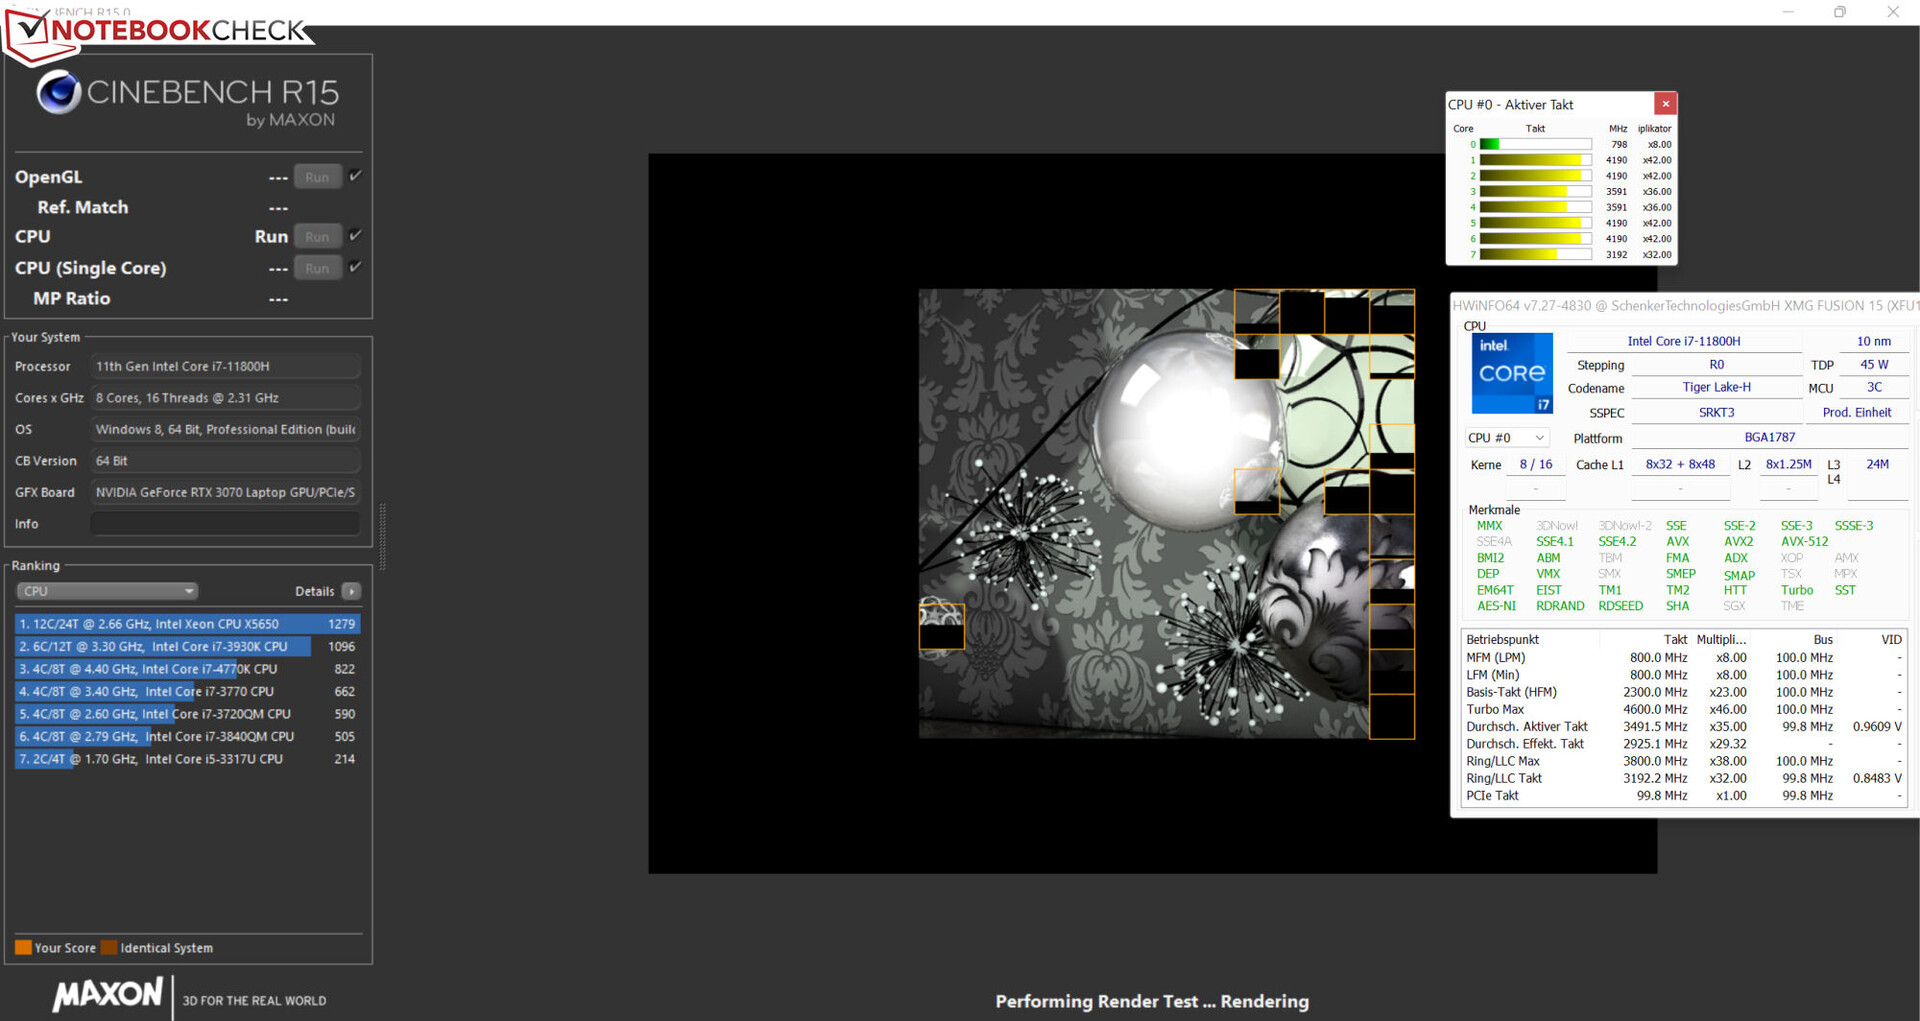

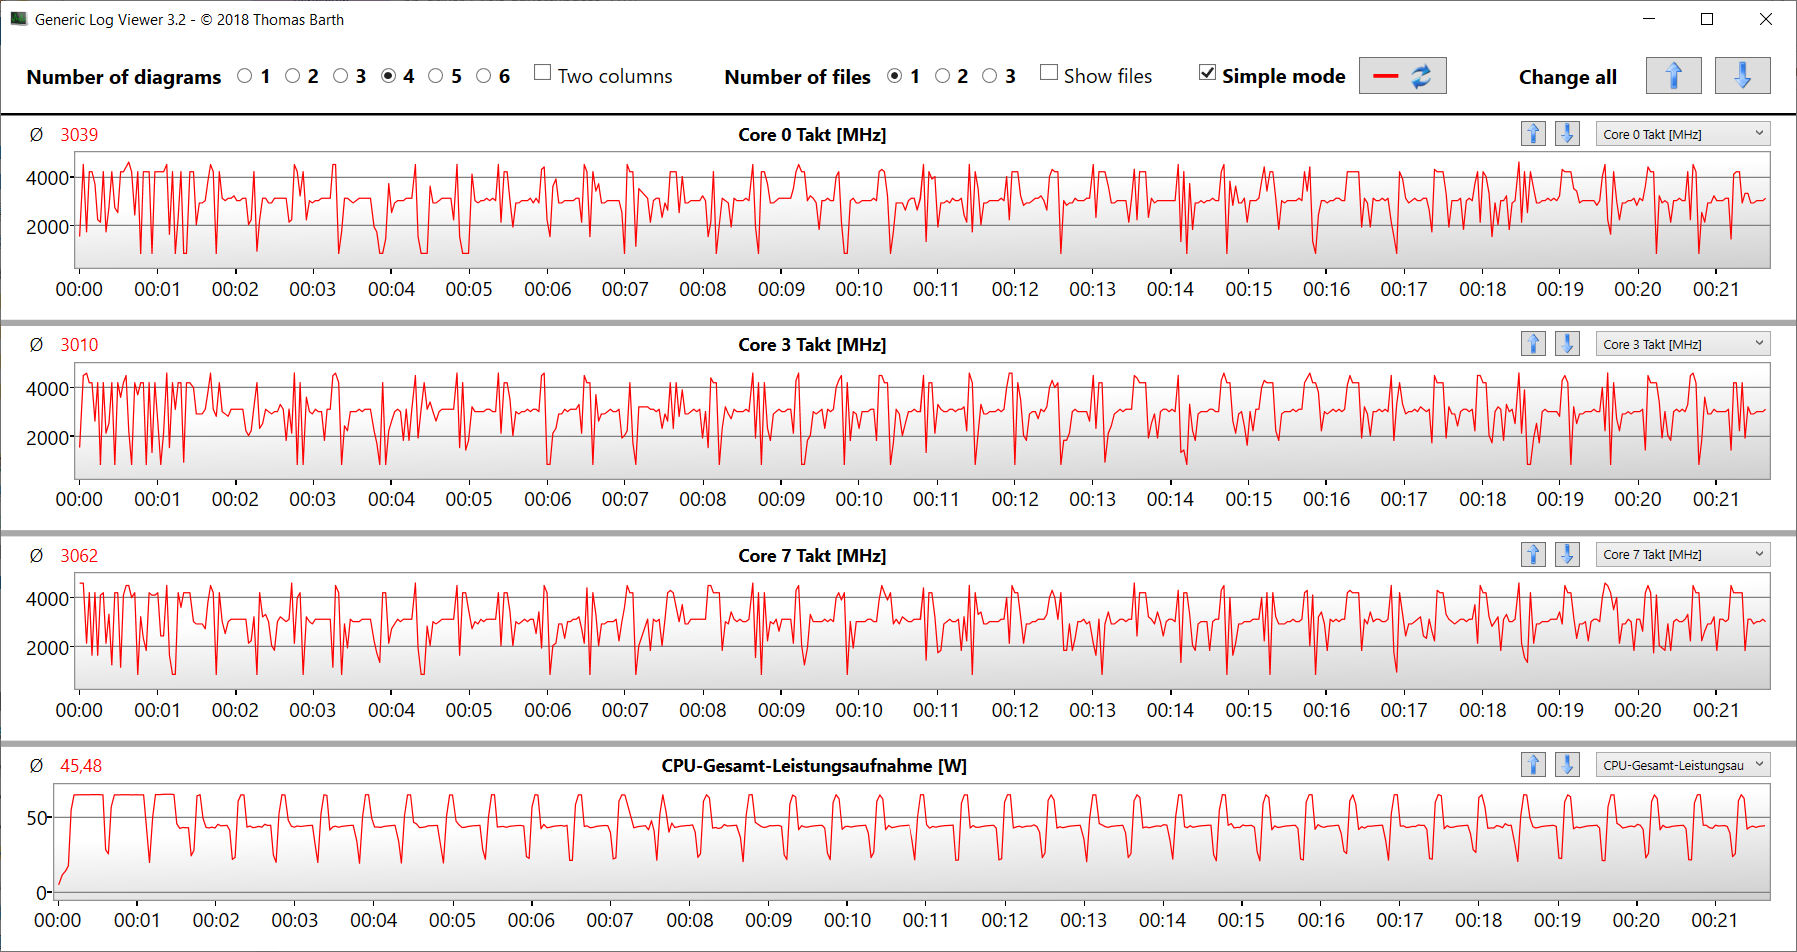
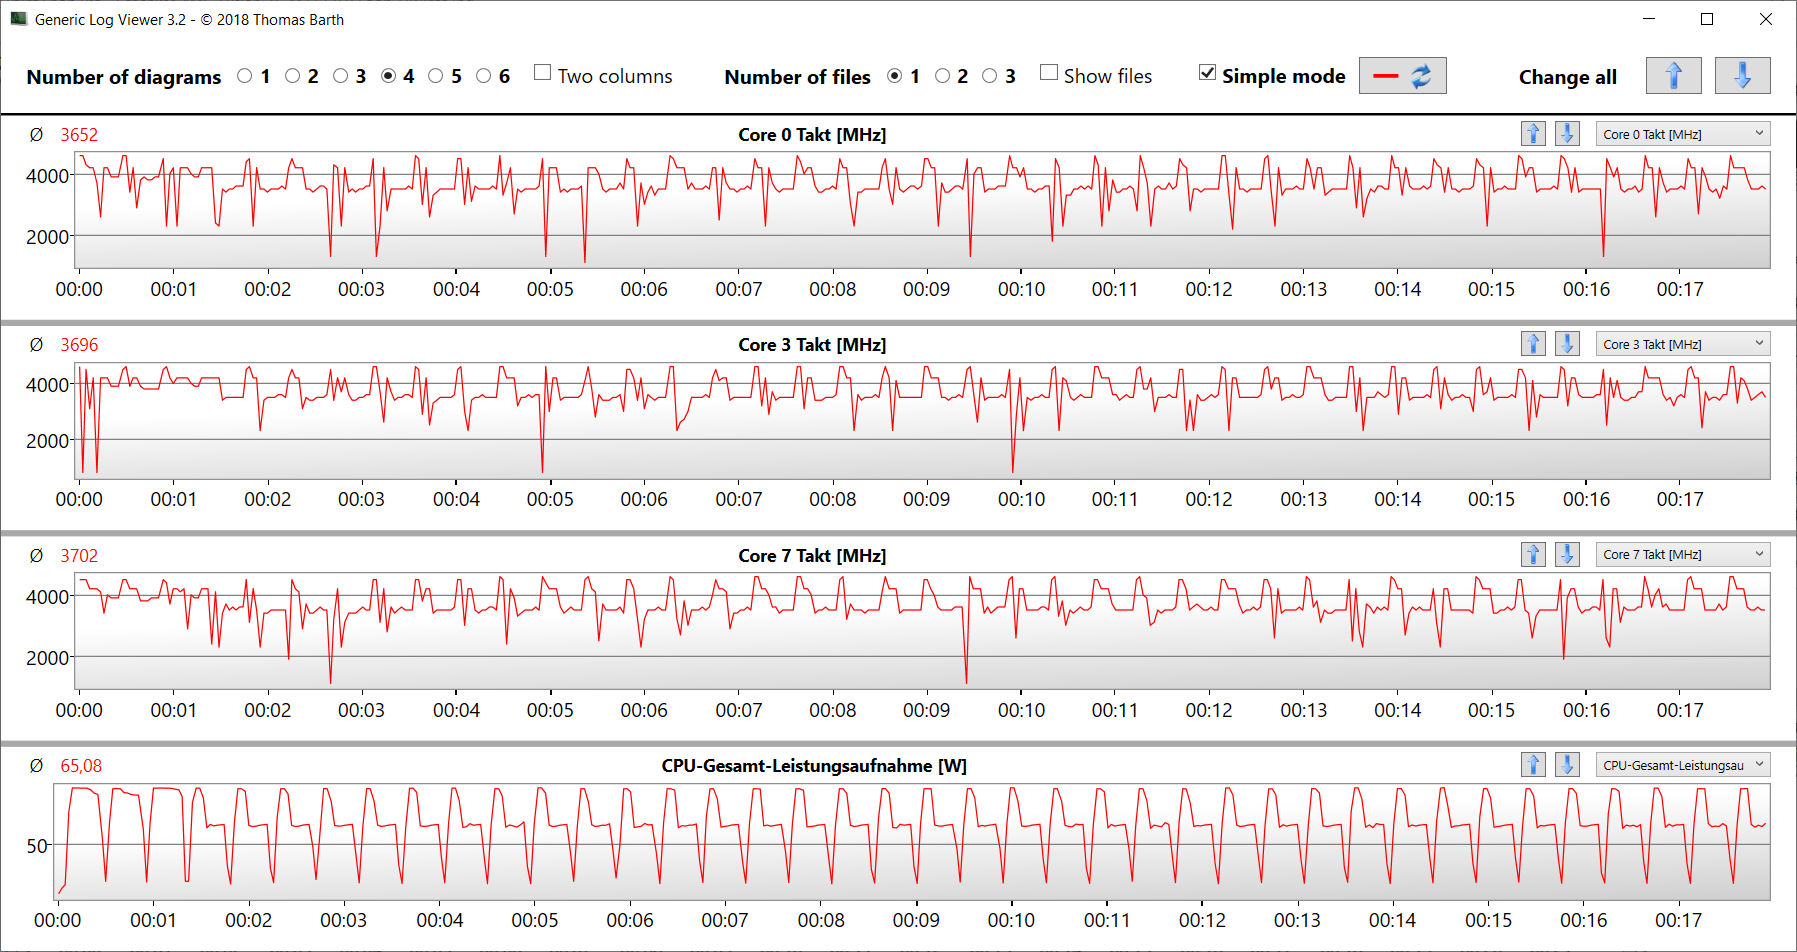
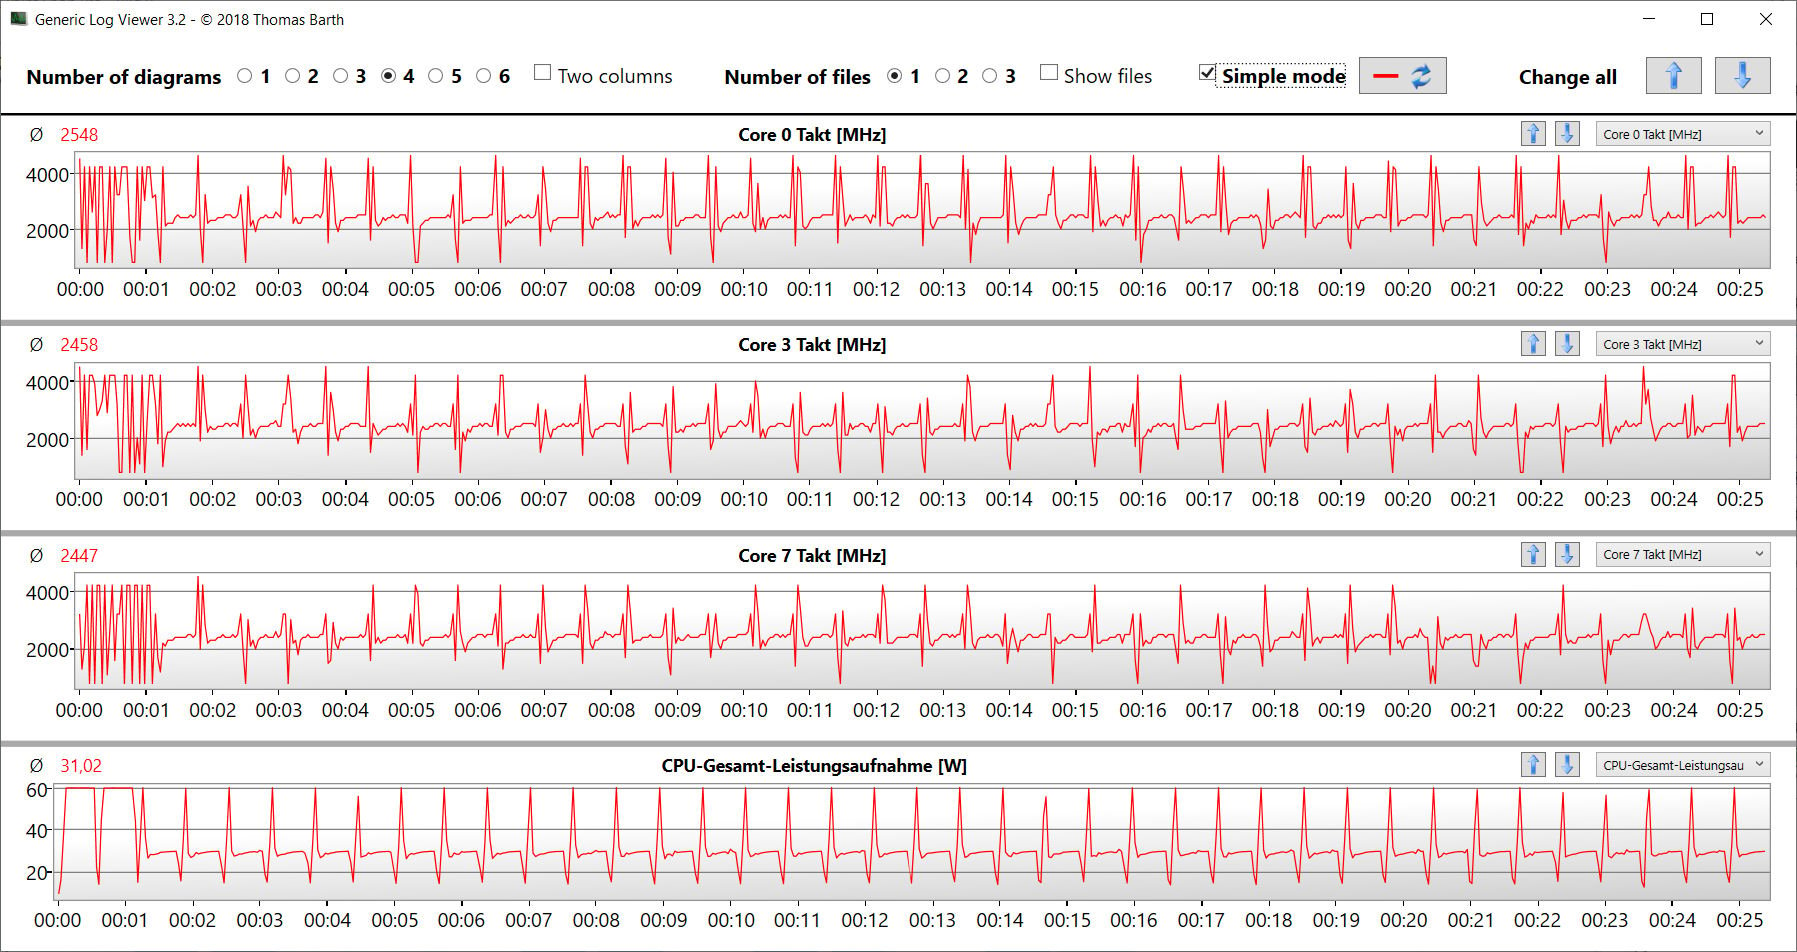
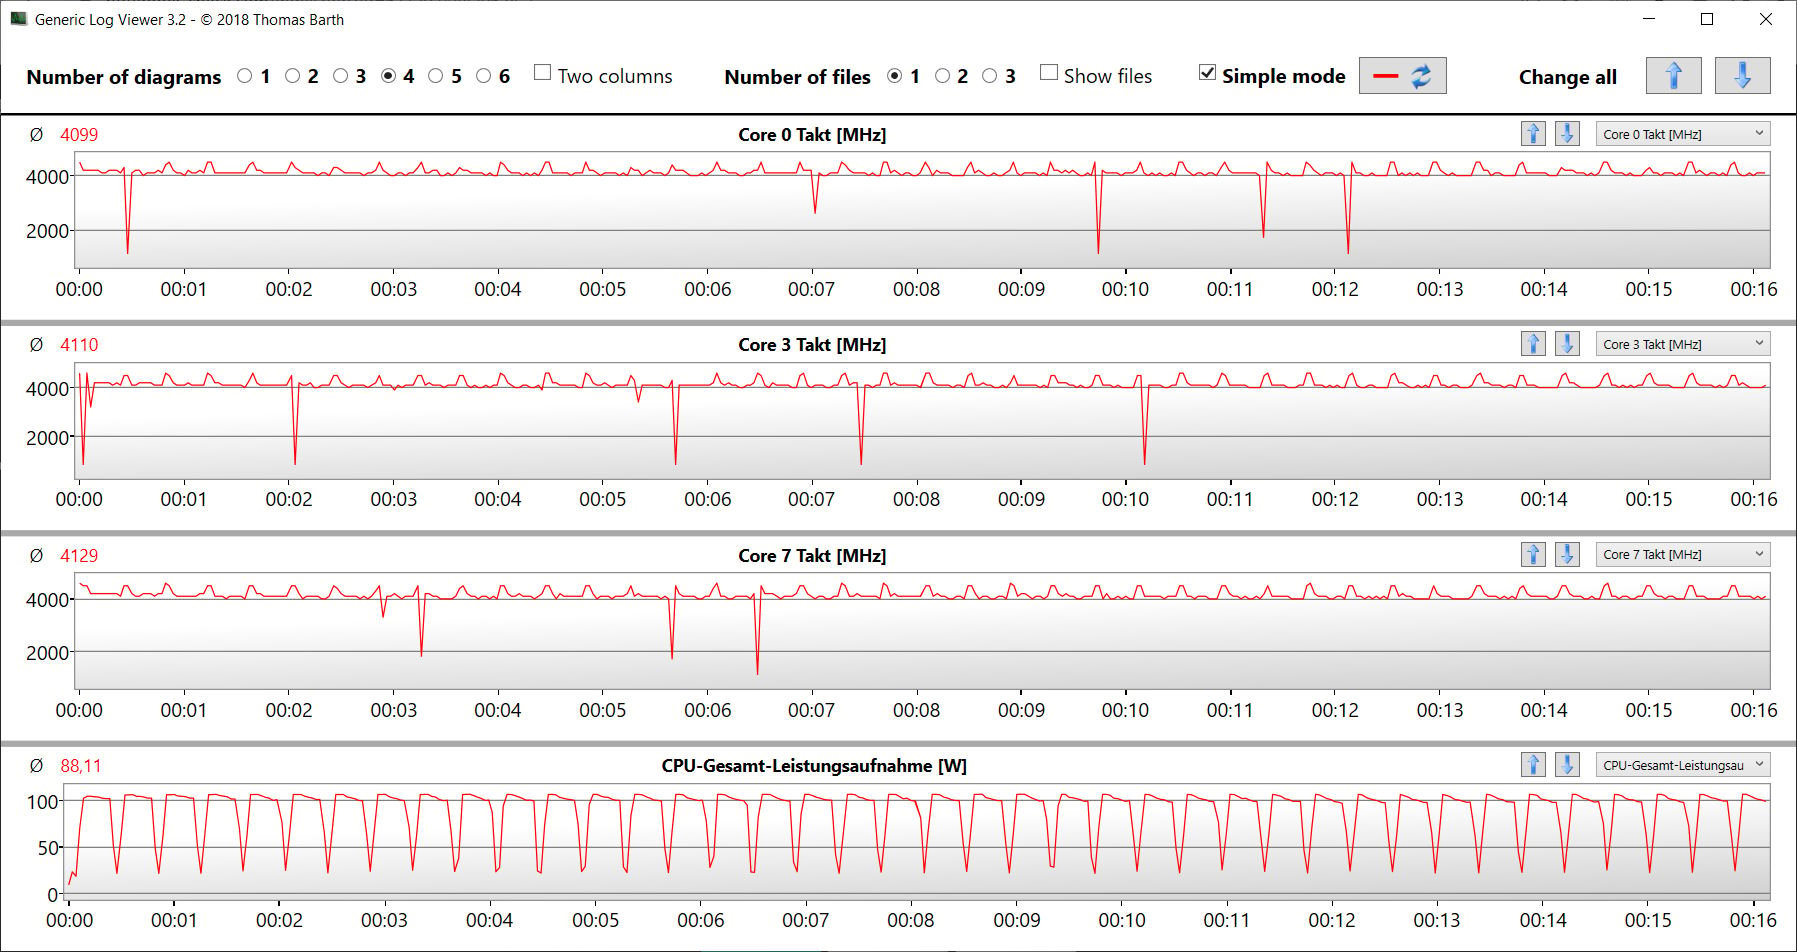
Verificamos se a CPU Turbo é utilizada de forma consistente quando conectada, executando o teste multithread do benchmark Cinebench R15 por pelo menos 30 minutos. O perfil "Benchmark Mode" explora o Turbo da CPU quase completamente.
Cinebench R15 Multi endurance test
| CPU Performance rating - Percent | |
| Média da turma Gaming | |
| HP Omen 16-b1090ng | |
| Acer Nitro 5 AN515-58-72QR | |
| Asus TUF Dash F15 FX517ZR | |
| Schenker XMG Fusion 15 (Mid 22) | |
| Schenker XMG Fusion 15 (Mid 22) | |
| MSI Delta 15 A5EFK | |
| Média Intel Core i7-11800H | |
| Schenker XMG Fusion 15 (Mid 22) | |
| Schenker XMG Fusion 15 (Mid 22) | |
| Razer Blade 15 Base Edition 2021, i7-10750H RTX 3060 | |
| Cinebench R23 | |
| Multi Core | |
| Média da turma Gaming (10488 - 42661, n=107, últimos 2 anos) | |
| Acer Nitro 5 AN515-58-72QR | |
| HP Omen 16-b1090ng | |
| Asus TUF Dash F15 FX517ZR | |
| Schenker XMG Fusion 15 (Mid 22) (Benchmark-Modus) | |
| Schenker XMG Fusion 15 (Mid 22) (Leistung) | |
| MSI Delta 15 A5EFK | |
| Média Intel Core i7-11800H (6508 - 14088, n=48) | |
| Schenker XMG Fusion 15 (Mid 22) | |
| Schenker XMG Fusion 15 (Mid 22) (Stromsparmodus) | |
| Razer Blade 15 Base Edition 2021, i7-10750H RTX 3060 | |
| Single Core | |
| Média da turma Gaming (1166 - 2415, n=107, últimos 2 anos) | |
| Acer Nitro 5 AN515-58-72QR | |
| Asus TUF Dash F15 FX517ZR | |
| HP Omen 16-b1090ng | |
| Schenker XMG Fusion 15 (Mid 22) | |
| Schenker XMG Fusion 15 (Mid 22) (Benchmark-Modus) | |
| Schenker XMG Fusion 15 (Mid 22) (Leistung) | |
| Média Intel Core i7-11800H (1386 - 1522, n=45) | |
| Schenker XMG Fusion 15 (Mid 22) (Stromsparmodus) | |
| MSI Delta 15 A5EFK | |
| Razer Blade 15 Base Edition 2021, i7-10750H RTX 3060 | |
| Cinebench R20 | |
| CPU (Multi Core) | |
| Média da turma Gaming (4029 - 16433, n=106, últimos 2 anos) | |
| Acer Nitro 5 AN515-58-72QR | |
| HP Omen 16-b1090ng | |
| Asus TUF Dash F15 FX517ZR | |
| Schenker XMG Fusion 15 (Mid 22) (Benchmark-Modus) | |
| Schenker XMG Fusion 15 (Mid 22) (Leistung) | |
| MSI Delta 15 A5EFK | |
| Média Intel Core i7-11800H (2498 - 5408, n=50) | |
| Schenker XMG Fusion 15 (Mid 22) | |
| Schenker XMG Fusion 15 (Mid 22) (Stromsparmodus) | |
| Razer Blade 15 Base Edition 2021, i7-10750H RTX 3060 | |
| CPU (Single Core) | |
| Média da turma Gaming (442 - 913, n=106, últimos 2 anos) | |
| Asus TUF Dash F15 FX517ZR | |
| HP Omen 16-b1090ng | |
| Acer Nitro 5 AN515-58-72QR | |
| Schenker XMG Fusion 15 (Mid 22) (Benchmark-Modus) | |
| Schenker XMG Fusion 15 (Mid 22) (Leistung) | |
| Schenker XMG Fusion 15 (Mid 22) | |
| MSI Delta 15 A5EFK | |
| Média Intel Core i7-11800H (520 - 586, n=47) | |
| Schenker XMG Fusion 15 (Mid 22) (Stromsparmodus) | |
| Razer Blade 15 Base Edition 2021, i7-10750H RTX 3060 | |
| Cinebench R15 | |
| CPU Multi 64Bit | |
| Média da turma Gaming (1578 - 6330, n=105, últimos 2 anos) | |
| HP Omen 16-b1090ng | |
| Acer Nitro 5 AN515-58-72QR | |
| Asus TUF Dash F15 FX517ZR | |
| MSI Delta 15 A5EFK | |
| Schenker XMG Fusion 15 (Mid 22) (Benchmark-Modus) | |
| Schenker XMG Fusion 15 (Mid 22) (Leistung) | |
| Média Intel Core i7-11800H (1342 - 2173, n=50) | |
| Schenker XMG Fusion 15 (Mid 22) | |
| Schenker XMG Fusion 15 (Mid 22) (Stromsparmodus) | |
| Razer Blade 15 Base Edition 2021, i7-10750H RTX 3060 | |
| CPU Single 64Bit | |
| Média da turma Gaming (188.8 - 350, n=106, últimos 2 anos) | |
| Acer Nitro 5 AN515-58-72QR | |
| HP Omen 16-b1090ng | |
| Asus TUF Dash F15 FX517ZR | |
| MSI Delta 15 A5EFK | |
| Schenker XMG Fusion 15 (Mid 22) | |
| Schenker XMG Fusion 15 (Mid 22) (Leistung) | |
| Schenker XMG Fusion 15 (Mid 22) (Benchmark-Modus) | |
| Média Intel Core i7-11800H (201 - 231, n=46) | |
| Schenker XMG Fusion 15 (Mid 22) (Stromsparmodus) | |
| Razer Blade 15 Base Edition 2021, i7-10750H RTX 3060 | |
| Blender - v2.79 BMW27 CPU | |
| Razer Blade 15 Base Edition 2021, i7-10750H RTX 3060 | |
| Schenker XMG Fusion 15 (Mid 22) (Stromsparmodus) | |
| Schenker XMG Fusion 15 (Mid 22) | |
| Média Intel Core i7-11800H (217 - 454, n=46) | |
| Schenker XMG Fusion 15 (Mid 22) (Leistung) | |
| MSI Delta 15 A5EFK | |
| Asus TUF Dash F15 FX517ZR | |
| Schenker XMG Fusion 15 (Mid 22) (Benchmark-Modus) | |
| Acer Nitro 5 AN515-58-72QR | |
| HP Omen 16-b1090ng | |
| Média da turma Gaming (79 - 330, n=104, últimos 2 anos) | |
| 7-Zip 18.03 | |
| 7z b 4 | |
| Média da turma Gaming (33491 - 148086, n=105, últimos 2 anos) | |
| HP Omen 16-b1090ng | |
| MSI Delta 15 A5EFK | |
| Asus TUF Dash F15 FX517ZR | |
| Acer Nitro 5 AN515-58-72QR | |
| Schenker XMG Fusion 15 (Mid 22) (Benchmark-Modus) | |
| Schenker XMG Fusion 15 (Mid 22) (Leistung) | |
| Média Intel Core i7-11800H (33718 - 56758, n=46) | |
| Schenker XMG Fusion 15 (Mid 22) | |
| Schenker XMG Fusion 15 (Mid 22) (Stromsparmodus) | |
| Razer Blade 15 Base Edition 2021, i7-10750H RTX 3060 | |
| 7z b 4 -mmt1 | |
| Média da turma Gaming (4199 - 7436, n=105, últimos 2 anos) | |
| HP Omen 16-b1090ng | |
| Acer Nitro 5 AN515-58-72QR | |
| Asus TUF Dash F15 FX517ZR | |
| MSI Delta 15 A5EFK | |
| Schenker XMG Fusion 15 (Mid 22) (Benchmark-Modus) | |
| Schenker XMG Fusion 15 (Mid 22) | |
| Média Intel Core i7-11800H (5138 - 5732, n=46) | |
| Schenker XMG Fusion 15 (Mid 22) (Leistung) | |
| Schenker XMG Fusion 15 (Mid 22) (Stromsparmodus) | |
| Razer Blade 15 Base Edition 2021, i7-10750H RTX 3060 | |
| Geekbench 5.5 | |
| Multi-Core | |
| Média da turma Gaming (6460 - 28263, n=105, últimos 2 anos) | |
| HP Omen 16-b1090ng | |
| Asus TUF Dash F15 FX517ZR | |
| Acer Nitro 5 AN515-58-72QR | |
| Schenker XMG Fusion 15 (Mid 22) (Benchmark-Modus) | |
| Schenker XMG Fusion 15 (Mid 22) (Leistung) | |
| MSI Delta 15 A5EFK | |
| Média Intel Core i7-11800H (4655 - 9851, n=40) | |
| Schenker XMG Fusion 15 (Mid 22) | |
| Schenker XMG Fusion 15 (Mid 22) (Stromsparmodus) | |
| Razer Blade 15 Base Edition 2021, i7-10750H RTX 3060 | |
| Single-Core | |
| Média da turma Gaming (986 - 2474, n=105, últimos 2 anos) | |
| HP Omen 16-b1090ng | |
| Asus TUF Dash F15 FX517ZR | |
| Acer Nitro 5 AN515-58-72QR | |
| Schenker XMG Fusion 15 (Mid 22) (Benchmark-Modus) | |
| Schenker XMG Fusion 15 (Mid 22) (Leistung) | |
| Schenker XMG Fusion 15 (Mid 22) | |
| MSI Delta 15 A5EFK | |
| Média Intel Core i7-11800H (1429 - 1625, n=40) | |
| Schenker XMG Fusion 15 (Mid 22) (Stromsparmodus) | |
| Razer Blade 15 Base Edition 2021, i7-10750H RTX 3060 | |
| HWBOT x265 Benchmark v2.2 - 4k Preset | |
| Média da turma Gaming (11.5 - 44.4, n=105, últimos 2 anos) | |
| HP Omen 16-b1090ng | |
| Acer Nitro 5 AN515-58-72QR | |
| Asus TUF Dash F15 FX517ZR | |
| Schenker XMG Fusion 15 (Mid 22) (Benchmark-Modus) | |
| Schenker XMG Fusion 15 (Mid 22) (Leistung) | |
| MSI Delta 15 A5EFK | |
| Média Intel Core i7-11800H (7.38 - 17.4, n=46) | |
| Schenker XMG Fusion 15 (Mid 22) | |
| Schenker XMG Fusion 15 (Mid 22) (Stromsparmodus) | |
| Razer Blade 15 Base Edition 2021, i7-10750H RTX 3060 | |
| LibreOffice - 20 Documents To PDF | |
| MSI Delta 15 A5EFK | |
| Média da turma Gaming (33.2 - 88.8, n=105, últimos 2 anos) | |
| Razer Blade 15 Base Edition 2021, i7-10750H RTX 3060 | |
| Schenker XMG Fusion 15 (Mid 22) | |
| Média Intel Core i7-11800H (38.6 - 59.9, n=45) | |
| Schenker XMG Fusion 15 (Mid 22) (Stromsparmodus) | |
| Schenker XMG Fusion 15 (Mid 22) (Benchmark-Modus) | |
| Schenker XMG Fusion 15 (Mid 22) (Leistung) | |
| Acer Nitro 5 AN515-58-72QR | |
| HP Omen 16-b1090ng | |
| Asus TUF Dash F15 FX517ZR | |
| R Benchmark 2.5 - Overall mean | |
| Razer Blade 15 Base Edition 2021, i7-10750H RTX 3060 | |
| Schenker XMG Fusion 15 (Mid 22) (Stromsparmodus) | |
| Média Intel Core i7-11800H (0.548 - 0.615, n=46) | |
| Schenker XMG Fusion 15 (Mid 22) | |
| Schenker XMG Fusion 15 (Mid 22) (Leistung) | |
| Schenker XMG Fusion 15 (Mid 22) (Benchmark-Modus) | |
| MSI Delta 15 A5EFK | |
| Asus TUF Dash F15 FX517ZR | |
| Acer Nitro 5 AN515-58-72QR | |
| HP Omen 16-b1090ng | |
| Média da turma Gaming (0.3439 - 0.759, n=106, últimos 2 anos) | |
* ... menor é melhor
AIDA64: FP32 Ray-Trace | FPU Julia | CPU SHA3 | CPU Queen | FPU SinJulia | FPU Mandel | CPU AES | CPU ZLib | FP64 Ray-Trace | CPU PhotoWorxx
| Performance rating | |
| Média da turma Gaming | |
| MSI Delta 15 A5EFK | |
| Schenker XMG Fusion 15 (Mid 22) | |
| Schenker XMG Fusion 15 (Mid 22) | |
| Schenker XMG Fusion 15 (Mid 22) | |
| Asus TUF Dash F15 FX517ZR | |
| Média Intel Core i7-11800H | |
| HP Omen 16-b1090ng | |
| Schenker XMG Fusion 15 (Mid 22) | |
| Acer Nitro 5 AN515-58-72QR | |
| AIDA64 / FP32 Ray-Trace | |
| Média da turma Gaming (10227 - 85542, n=105, últimos 2 anos) | |
| Schenker XMG Fusion 15 (Mid 22) (v6.70.6000, Benchmark-Modus) | |
| Schenker XMG Fusion 15 (Mid 22) (v6.70.6000, Leistung) | |
| MSI Delta 15 A5EFK (v6.33.5700) | |
| Asus TUF Dash F15 FX517ZR (v6.70.6000) | |
| Média Intel Core i7-11800H (8772 - 15961, n=20) | |
| Schenker XMG Fusion 15 (Mid 22) (v6.70.6000) | |
| Schenker XMG Fusion 15 (Mid 22) (v6.70.6000, Stromsparmodus) | |
| Acer Nitro 5 AN515-58-72QR (v6.50.5800) | |
| HP Omen 16-b1090ng (v6.50.5800) | |
| AIDA64 / FPU Julia | |
| Média da turma Gaming (51376 - 238426, n=105, últimos 2 anos) | |
| MSI Delta 15 A5EFK (v6.33.5700) | |
| Asus TUF Dash F15 FX517ZR (v6.70.6000) | |
| Schenker XMG Fusion 15 (Mid 22) (v6.70.6000, Benchmark-Modus) | |
| Schenker XMG Fusion 15 (Mid 22) (v6.70.6000) | |
| Schenker XMG Fusion 15 (Mid 22) (v6.70.6000, Leistung) | |
| Média Intel Core i7-11800H (39404 - 65636, n=20) | |
| Schenker XMG Fusion 15 (Mid 22) (v6.70.6000, Stromsparmodus) | |
| Acer Nitro 5 AN515-58-72QR (v6.50.5800) | |
| HP Omen 16-b1090ng (v6.50.5800) | |
| AIDA64 / CPU SHA3 | |
| Média da turma Gaming (2180 - 10115, n=105, últimos 2 anos) | |
| Schenker XMG Fusion 15 (Mid 22) (v6.70.6000, Benchmark-Modus) | |
| Schenker XMG Fusion 15 (Mid 22) (v6.70.6000, Leistung) | |
| Schenker XMG Fusion 15 (Mid 22) (v6.70.6000) | |
| Média Intel Core i7-11800H (2599 - 4439, n=20) | |
| MSI Delta 15 A5EFK (v6.33.5700) | |
| Acer Nitro 5 AN515-58-72QR (v6.50.5800) | |
| Asus TUF Dash F15 FX517ZR (v6.70.6000) | |
| Schenker XMG Fusion 15 (Mid 22) (v6.70.6000, Stromsparmodus) | |
| HP Omen 16-b1090ng (v6.50.5800) | |
| AIDA64 / CPU Queen | |
| Média da turma Gaming (49785 - 173351, n=90, últimos 2 anos) | |
| MSI Delta 15 A5EFK (v6.33.5700) | |
| HP Omen 16-b1090ng (v6.50.5800) | |
| Acer Nitro 5 AN515-58-72QR (v6.50.5800) | |
| Schenker XMG Fusion 15 (Mid 22) (v6.70.6000, Leistung) | |
| Schenker XMG Fusion 15 (Mid 22) (v6.70.6000, Benchmark-Modus) | |
| Média Intel Core i7-11800H (85233 - 91941, n=20) | |
| Asus TUF Dash F15 FX517ZR (v6.70.6000) | |
| Schenker XMG Fusion 15 (Mid 22) (v6.70.6000, Stromsparmodus) | |
| Schenker XMG Fusion 15 (Mid 22) | |
| AIDA64 / FPU SinJulia | |
| Média da turma Gaming (4424 - 33636, n=105, últimos 2 anos) | |
| MSI Delta 15 A5EFK (v6.33.5700) | |
| Acer Nitro 5 AN515-58-72QR (v6.50.5800) | |
| Schenker XMG Fusion 15 (Mid 22) (v6.70.6000, Benchmark-Modus) | |
| Schenker XMG Fusion 15 (Mid 22) (v6.70.6000, Leistung) | |
| HP Omen 16-b1090ng (v6.50.5800) | |
| Média Intel Core i7-11800H (6420 - 9792, n=20) | |
| Schenker XMG Fusion 15 (Mid 22) (v6.70.6000) | |
| Asus TUF Dash F15 FX517ZR (v6.70.6000) | |
| Schenker XMG Fusion 15 (Mid 22) (v6.70.6000, Stromsparmodus) | |
| AIDA64 / FPU Mandel | |
| Média da turma Gaming (25115 - 128721, n=105, últimos 2 anos) | |
| MSI Delta 15 A5EFK (v6.33.5700) | |
| Schenker XMG Fusion 15 (Mid 22) (v6.70.6000, Benchmark-Modus) | |
| Schenker XMG Fusion 15 (Mid 22) (v6.70.6000, Leistung) | |
| Schenker XMG Fusion 15 (Mid 22) (v6.70.6000) | |
| Média Intel Core i7-11800H (23365 - 39464, n=20) | |
| Asus TUF Dash F15 FX517ZR (v6.70.6000) | |
| Schenker XMG Fusion 15 (Mid 22) (v6.70.6000, Stromsparmodus) | |
| Acer Nitro 5 AN515-58-72QR | |
| HP Omen 16-b1090ng (v6.50.5800) | |
| AIDA64 / CPU AES | |
| Schenker XMG Fusion 15 (Mid 22) (v6.70.6000, Benchmark-Modus) | |
| Schenker XMG Fusion 15 (Mid 22) (v6.70.6000) | |
| Schenker XMG Fusion 15 (Mid 22) (v6.70.6000, Leistung) | |
| MSI Delta 15 A5EFK (v6.33.5700) | |
| Média Intel Core i7-11800H (74617 - 149388, n=20) | |
| Média da turma Gaming (39258 - 247074, n=105, últimos 2 anos) | |
| Schenker XMG Fusion 15 (Mid 22) (v6.70.6000, Stromsparmodus) | |
| HP Omen 16-b1090ng (v6.50.5800) | |
| Asus TUF Dash F15 FX517ZR (v6.70.6000) | |
| Acer Nitro 5 AN515-58-72QR (v6.50.5800) | |
| AIDA64 / CPU ZLib | |
| Média da turma Gaming (574 - 2531, n=105, últimos 2 anos) | |
| Acer Nitro 5 AN515-58-72QR (v6.50.5800) | |
| HP Omen 16-b1090ng (v6.50.5800) | |
| Asus TUF Dash F15 FX517ZR (v6.70.6000) | |
| MSI Delta 15 A5EFK (v6.33.5700) | |
| Schenker XMG Fusion 15 (Mid 22) (v6.70.6000, Benchmark-Modus) | |
| Schenker XMG Fusion 15 (Mid 22) (v6.70.6000, Leistung) | |
| Schenker XMG Fusion 15 (Mid 22) (v6.70.6000) | |
| Schenker XMG Fusion 15 (Mid 22) (v6.70.6000, Stromsparmodus) | |
| Média Intel Core i7-11800H (461 - 830, n=43) | |
| AIDA64 / FP64 Ray-Trace | |
| Média da turma Gaming (5509 - 45446, n=105, últimos 2 anos) | |
| Schenker XMG Fusion 15 (Mid 22) (v6.70.6000, Benchmark-Modus) | |
| Schenker XMG Fusion 15 (Mid 22) (v6.70.6000, Leistung) | |
| MSI Delta 15 A5EFK (v6.33.5700) | |
| Asus TUF Dash F15 FX517ZR (v6.70.6000) | |
| Média Intel Core i7-11800H (4545 - 8717, n=21) | |
| Schenker XMG Fusion 15 (Mid 22) (v6.70.6000) | |
| Schenker XMG Fusion 15 (Mid 22) (v6.70.6000, Stromsparmodus) | |
| Acer Nitro 5 AN515-58-72QR (v6.50.5800) | |
| HP Omen 16-b1090ng (v6.50.5800) | |
| AIDA64 / CPU PhotoWorxx | |
| Média da turma Gaming (12271 - 89891, n=105, últimos 2 anos) | |
| HP Omen 16-b1090ng (v6.50.5800) | |
| Asus TUF Dash F15 FX517ZR (v6.70.6000) | |
| Schenker XMG Fusion 15 (Mid 22) (v6.70.6000, Benchmark-Modus) | |
| Schenker XMG Fusion 15 (Mid 22) (v6.70.6000, Leistung) | |
| Schenker XMG Fusion 15 (Mid 22) (v6.70.6000) | |
| Schenker XMG Fusion 15 (Mid 22) (v6.70.6000, Stromsparmodus) | |
| Média Intel Core i7-11800H (11898 - 26757, n=21) | |
| Acer Nitro 5 AN515-58-72QR (v6.50.5800) | |
| MSI Delta 15 A5EFK (v6.33.5700) | |
Desempenho do sistema
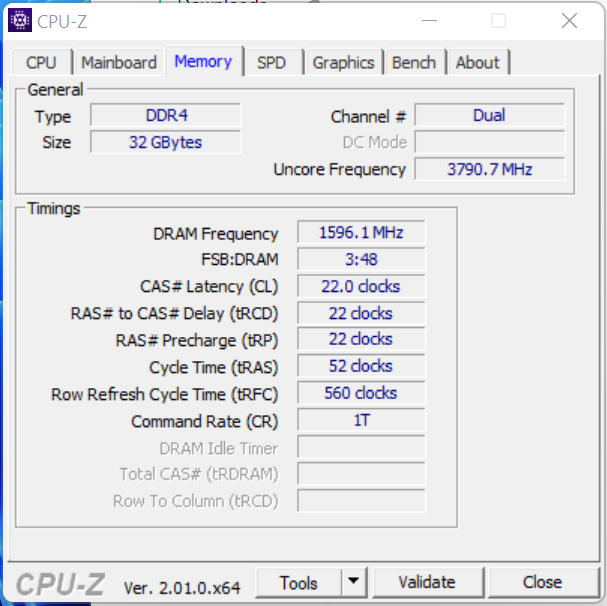
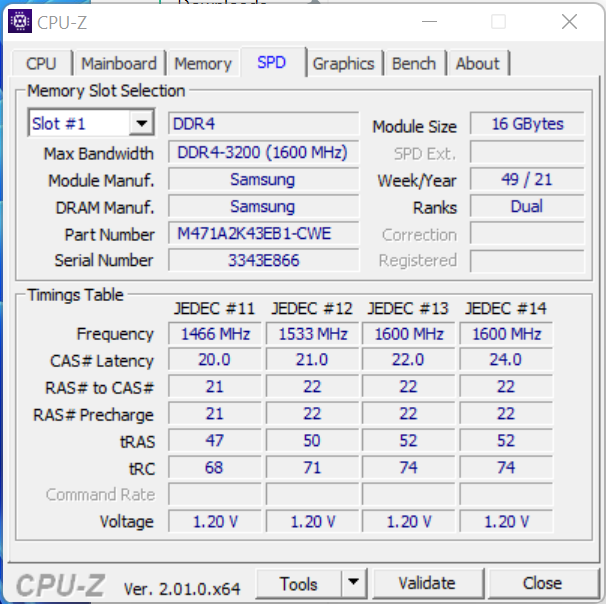
O sistema bem fundamentado e em bom funcionamento oferece poder de processamento suficiente para aplicações exigentes como renderização e jogos. Os resultados do PCMark são bons. As taxas de transferência da RAM estão em um nível normal para a memória DDR4-3200
CrossMark: Overall | Productivity | Creativity | Responsiveness
| PCMark 10 / Score | |
| Média da turma Gaming (5828 - 12414, n=93, últimos 2 anos) | |
| HP Omen 16-b1090ng | |
| MSI Delta 15 A5EFK | |
| Acer Nitro 5 AN515-58-72QR | |
| Média Intel Core i7-11800H, NVIDIA GeForce RTX 3070 Laptop GPU (6126 - 7311, n=11) | |
| Asus TUF Dash F15 FX517ZR | |
| Schenker XMG Fusion 15 (Mid 22) (Benchmark-Modus) | |
| Razer Blade 15 Base Edition 2021, i7-10750H RTX 3060 | |
| Schenker XMG Fusion 15 (Mid 22) | |
| PCMark 10 / Essentials | |
| Média da turma Gaming (8810 - 11935, n=97, últimos 2 anos) | |
| MSI Delta 15 A5EFK | |
| HP Omen 16-b1090ng | |
| Razer Blade 15 Base Edition 2021, i7-10750H RTX 3060 | |
| Média Intel Core i7-11800H, NVIDIA GeForce RTX 3070 Laptop GPU (9248 - 10832, n=11) | |
| Asus TUF Dash F15 FX517ZR | |
| Acer Nitro 5 AN515-58-72QR | |
| Schenker XMG Fusion 15 (Mid 22) (Benchmark-Modus) | |
| Schenker XMG Fusion 15 (Mid 22) | |
| PCMark 10 / Productivity | |
| Média da turma Gaming (6845 - 25323, n=95, últimos 2 anos) | |
| HP Omen 16-b1090ng | |
| Asus TUF Dash F15 FX517ZR | |
| MSI Delta 15 A5EFK | |
| Schenker XMG Fusion 15 (Mid 22) (Benchmark-Modus) | |
| Média Intel Core i7-11800H, NVIDIA GeForce RTX 3070 Laptop GPU (8571 - 9669, n=11) | |
| Acer Nitro 5 AN515-58-72QR | |
| Schenker XMG Fusion 15 (Mid 22) | |
| Razer Blade 15 Base Edition 2021, i7-10750H RTX 3060 | |
| PCMark 10 / Digital Content Creation | |
| Média da turma Gaming (7602 - 19954, n=95, últimos 2 anos) | |
| HP Omen 16-b1090ng | |
| MSI Delta 15 A5EFK | |
| Acer Nitro 5 AN515-58-72QR | |
| Média Intel Core i7-11800H, NVIDIA GeForce RTX 3070 Laptop GPU (7627 - 10851, n=11) | |
| Asus TUF Dash F15 FX517ZR | |
| Razer Blade 15 Base Edition 2021, i7-10750H RTX 3060 | |
| Schenker XMG Fusion 15 (Mid 22) (Benchmark-Modus) | |
| Schenker XMG Fusion 15 (Mid 22) | |
| CrossMark / Overall | |
| Média da turma Gaming (1366 - 2409, n=94, últimos 2 anos) | |
| Asus TUF Dash F15 FX517ZR | |
| Acer Nitro 5 AN515-58-72QR | |
| Schenker XMG Fusion 15 (Mid 22) | |
| Média Intel Core i7-11800H, NVIDIA GeForce RTX 3070 Laptop GPU (1569 - 1656, n=3) | |
| CrossMark / Productivity | |
| Média da turma Gaming (1386 - 2254, n=94, últimos 2 anos) | |
| Acer Nitro 5 AN515-58-72QR | |
| Asus TUF Dash F15 FX517ZR | |
| Schenker XMG Fusion 15 (Mid 22) | |
| Média Intel Core i7-11800H, NVIDIA GeForce RTX 3070 Laptop GPU (1573 - 1640, n=3) | |
| CrossMark / Creativity | |
| Média da turma Gaming (1343 - 2786, n=94, últimos 2 anos) | |
| Asus TUF Dash F15 FX517ZR | |
| Acer Nitro 5 AN515-58-72QR | |
| Schenker XMG Fusion 15 (Mid 22) | |
| Média Intel Core i7-11800H, NVIDIA GeForce RTX 3070 Laptop GPU (1613 - 1692, n=3) | |
| CrossMark / Responsiveness | |
| Média da turma Gaming (1226 - 2334, n=94, últimos 2 anos) | |
| Acer Nitro 5 AN515-58-72QR | |
| Schenker XMG Fusion 15 (Mid 22) | |
| Asus TUF Dash F15 FX517ZR | |
| Média Intel Core i7-11800H, NVIDIA GeForce RTX 3070 Laptop GPU (1435 - 1600, n=3) | |
| PCMark 8 Home Score Accelerated v2 | 4521 pontos | |
| PCMark 8 Creative Score Accelerated v2 | 6766 pontos | |
| PCMark 8 Work Score Accelerated v2 | 5851 pontos | |
| PCMark 10 Score | 6126 pontos | |
Ajuda | ||
| AIDA64 / Memory Copy | |
| Média da turma Gaming (21750 - 129946, n=105, últimos 2 anos) | |
| HP Omen 16-b1090ng | |
| Asus TUF Dash F15 FX517ZR | |
| Schenker XMG Fusion 15 (Mid 22) | |
| Acer Nitro 5 AN515-58-72QR | |
| Média Intel Core i7-11800H (24508 - 48144, n=21) | |
| MSI Delta 15 A5EFK | |
| AIDA64 / Memory Read | |
| Média da turma Gaming (22956 - 118858, n=105, últimos 2 anos) | |
| HP Omen 16-b1090ng | |
| Asus TUF Dash F15 FX517ZR | |
| Schenker XMG Fusion 15 (Mid 22) | |
| MSI Delta 15 A5EFK | |
| Média Intel Core i7-11800H (25882 - 50365, n=20) | |
| Acer Nitro 5 AN515-58-72QR | |
| AIDA64 / Memory Write | |
| Média da turma Gaming (22297 - 135096, n=105, últimos 2 anos) | |
| HP Omen 16-b1090ng | |
| Asus TUF Dash F15 FX517ZR | |
| Schenker XMG Fusion 15 (Mid 22) | |
| Acer Nitro 5 AN515-58-72QR | |
| MSI Delta 15 A5EFK | |
| Média Intel Core i7-11800H (22240 - 46214, n=20) | |
| AIDA64 / Memory Latency | |
| Média da turma Gaming (75.3 - 259, n=105, últimos 2 anos) | |
| Asus TUF Dash F15 FX517ZR | |
| Schenker XMG Fusion 15 (Mid 22) | |
| HP Omen 16-b1090ng | |
| MSI Delta 15 A5EFK | |
| Média Intel Core i7-11800H (71.9 - 104.1, n=44) | |
| Acer Nitro 5 AN515-58-72QR | |
| Acer Nitro 5 AN515-58-72QR | |
* ... menor é melhor
Latências DPC
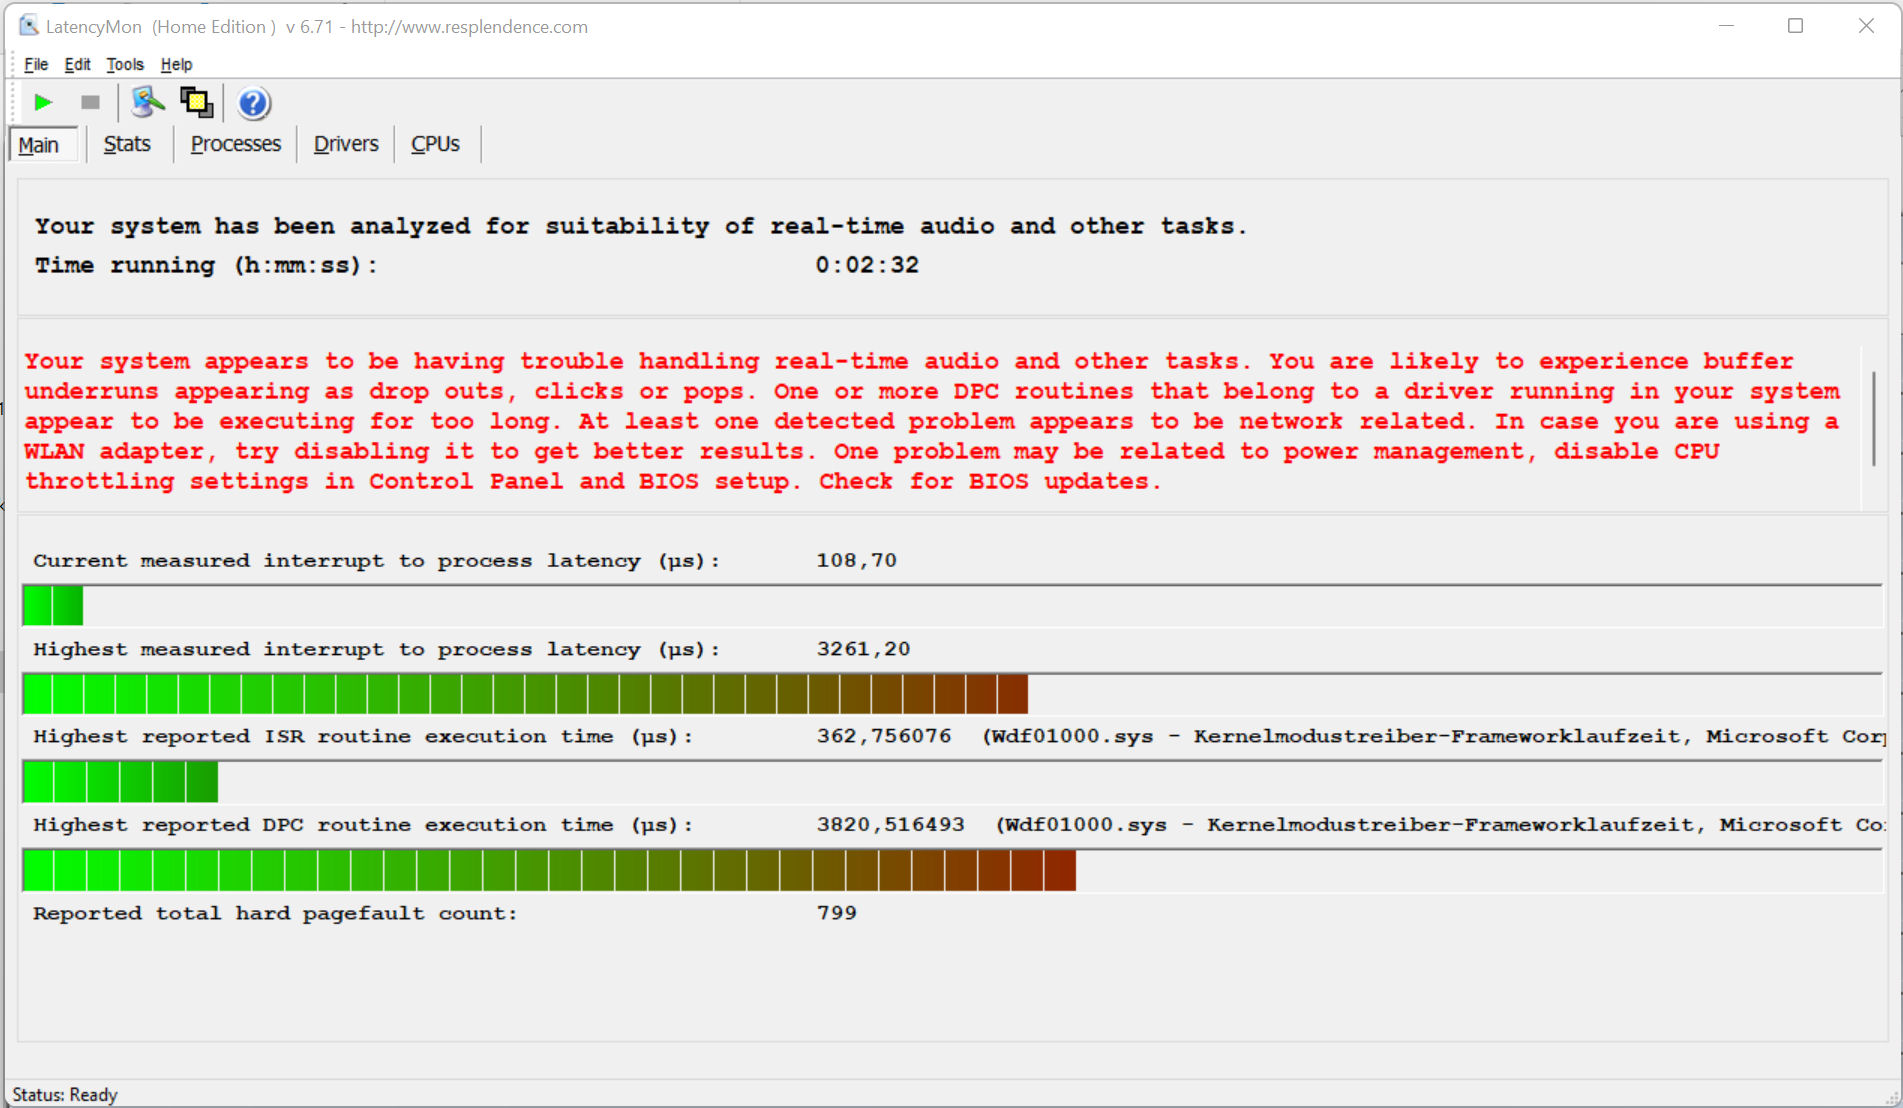
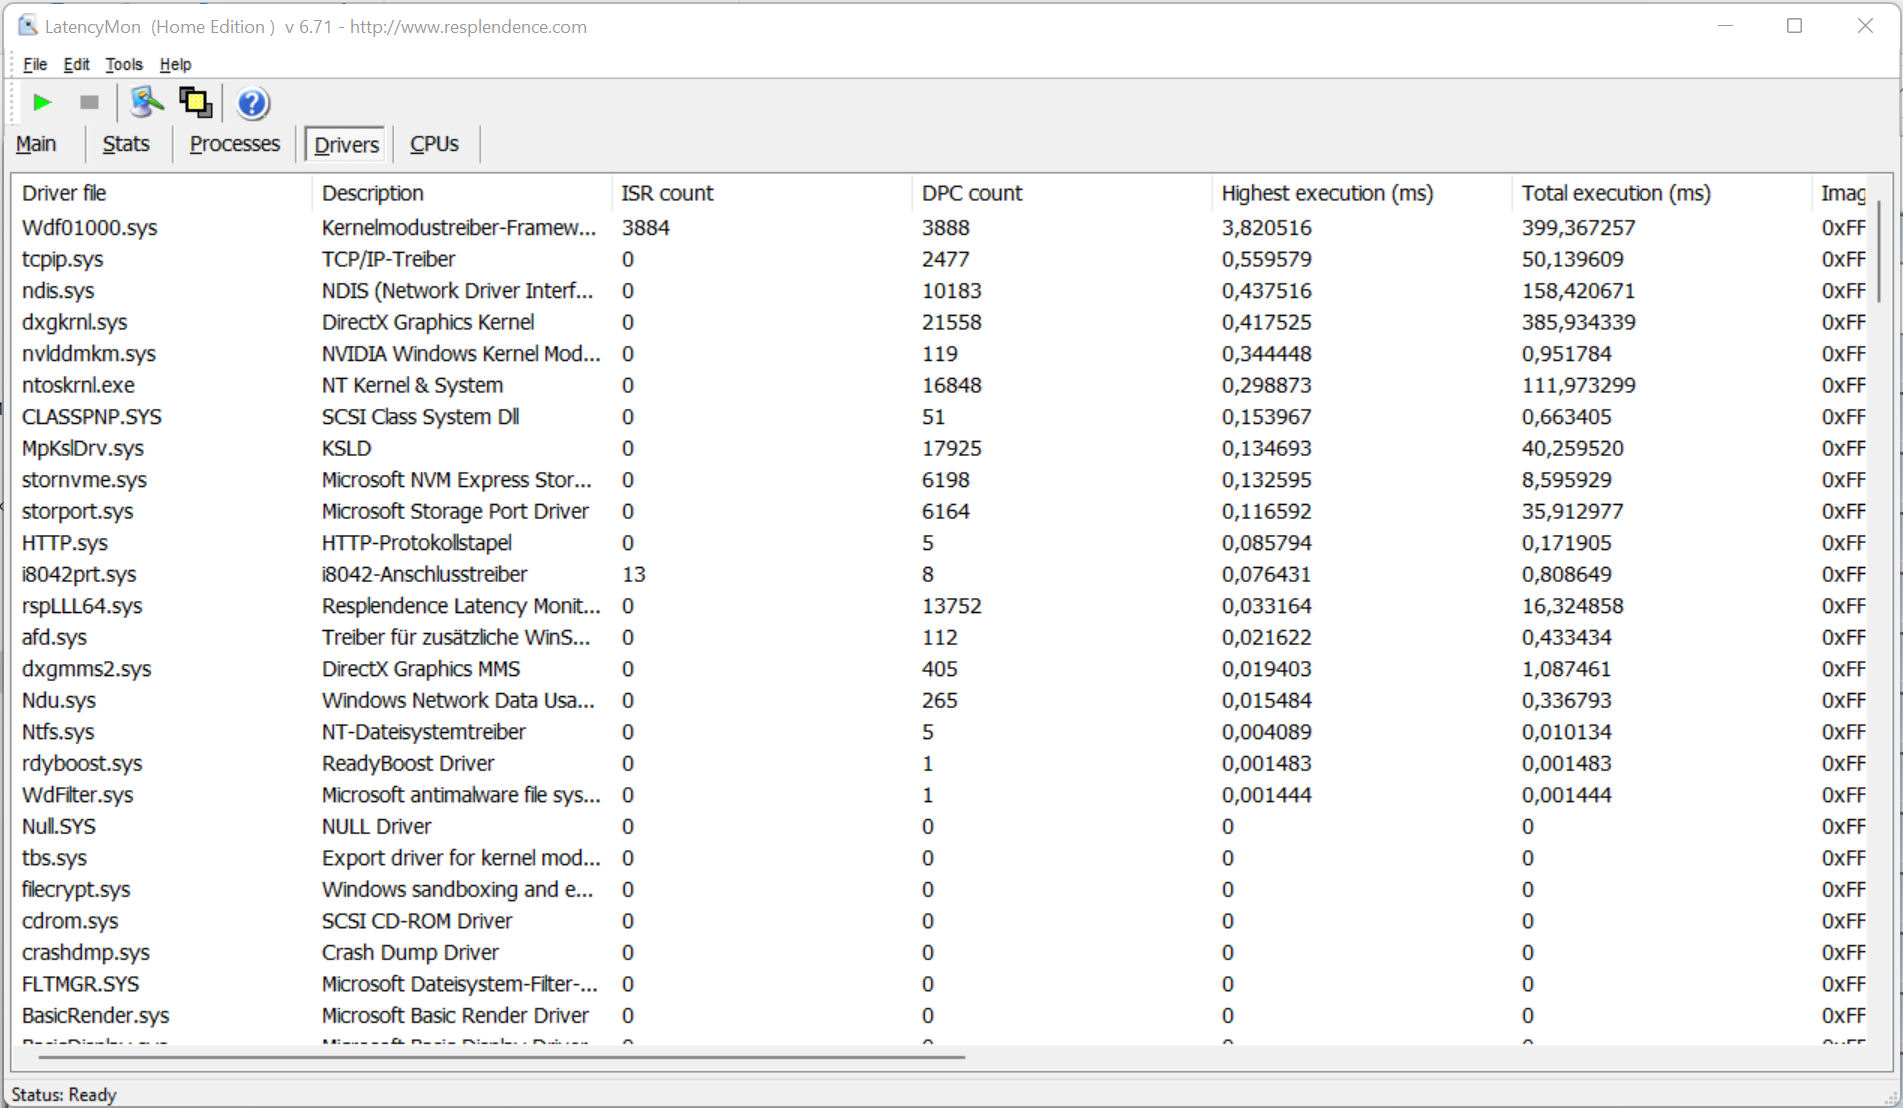
O teste de monitor de latência padronizado (navegação na web, reprodução de vídeo 4K, Prime95 de alta carga) revelou irregularidades com as latências DPC. O sistema não parece ser adequado para edição de vídeo e áudio em tempo real. Futuras atualizações de software podem levar a melhorias ou também a pior desempenho
| DPC Latencies / LatencyMon - interrupt to process latency (max), Web, Youtube, Prime95 | |
| Schenker XMG Fusion 15 (Mid 22) | |
| MSI Delta 15 A5EFK | |
| Acer Nitro 5 AN515-58-72QR | |
| HP Omen 16-b1090ng | |
| Razer Blade 15 Base Edition 2021, i7-10750H RTX 3060 | |
| Asus TUF Dash F15 FX517ZR | |
* ... menor é melhor
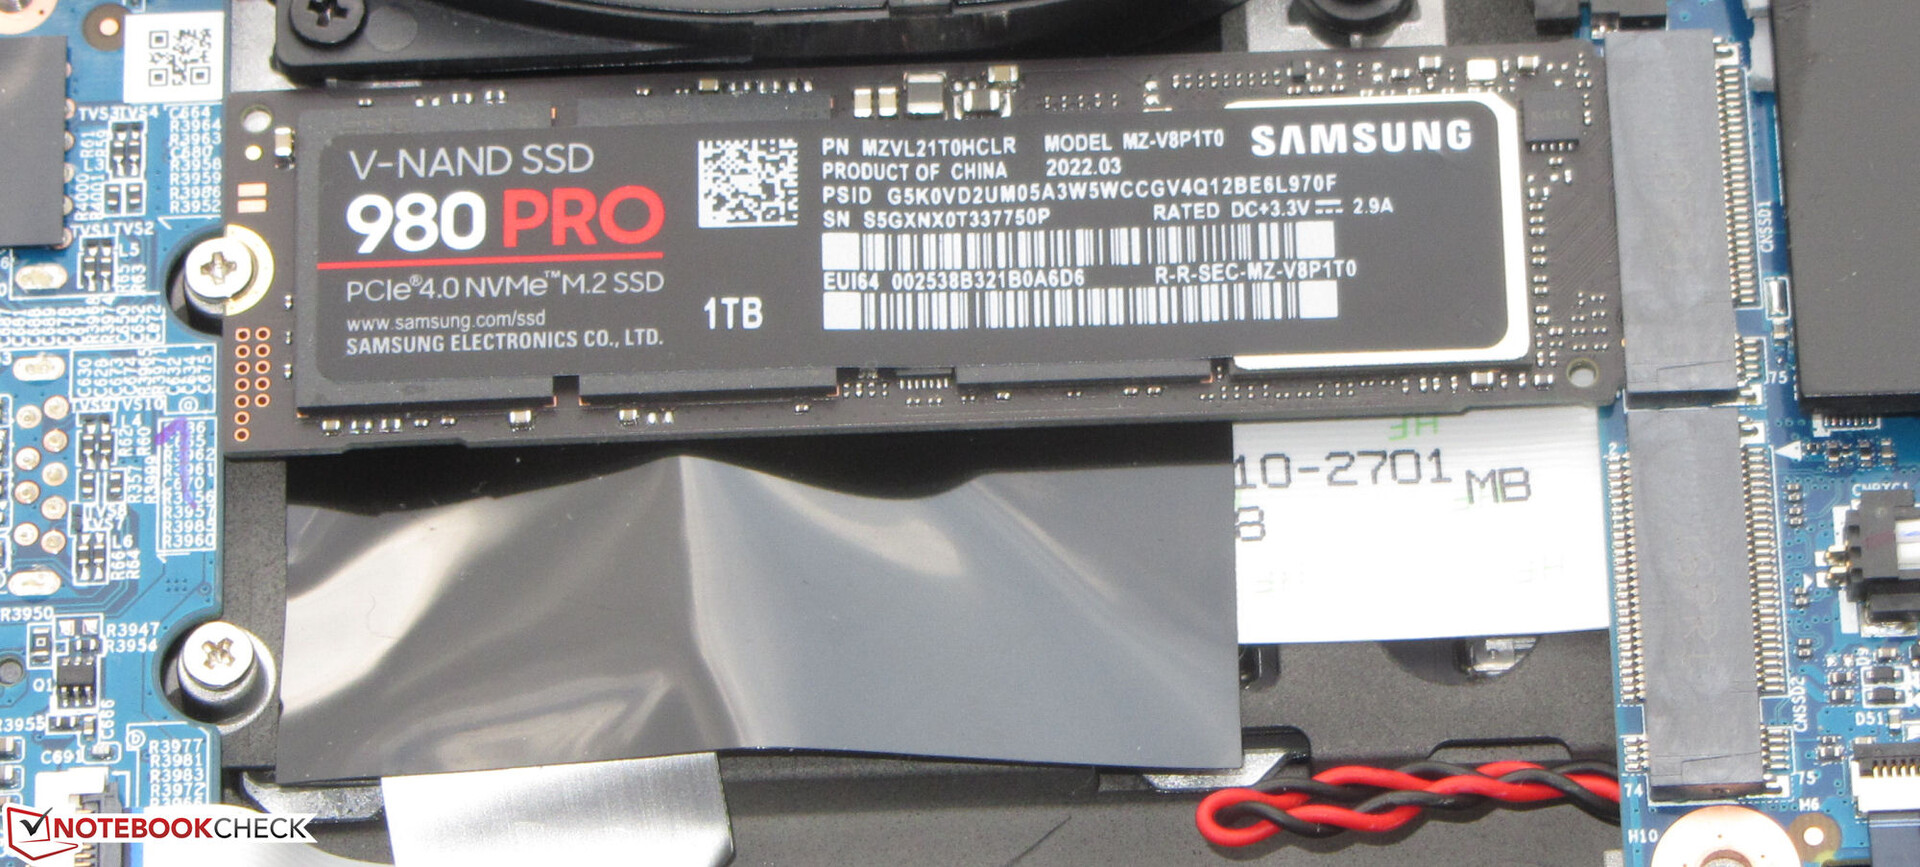
Armazenamento
A Schenker equipa o laptop com um SSD PCIe 4 (1 TB, M.2 2280) da Samsung que oferece excelentes taxas de transferência. O laptop tem espaço para um total de dois M.2-2280 SSDs (1x PCIe 4.0, 1x PCIe 3.0/SATA). O RAID 0/1 é suportado

* ... menor é melhor
Continuous load read: DiskSpd Read Loop, Queue Depth 8
Placa gráfica
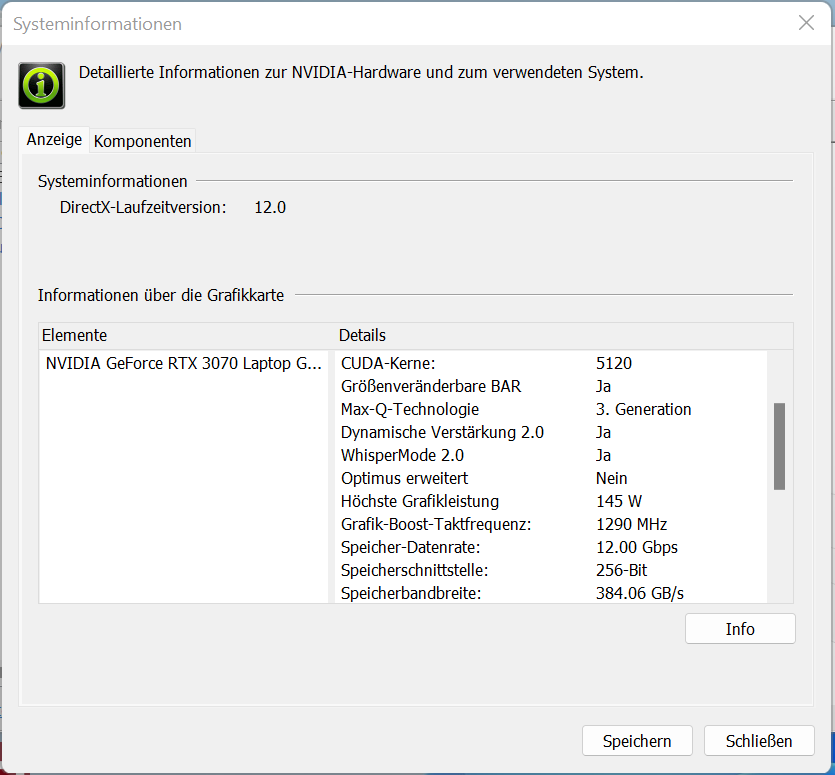
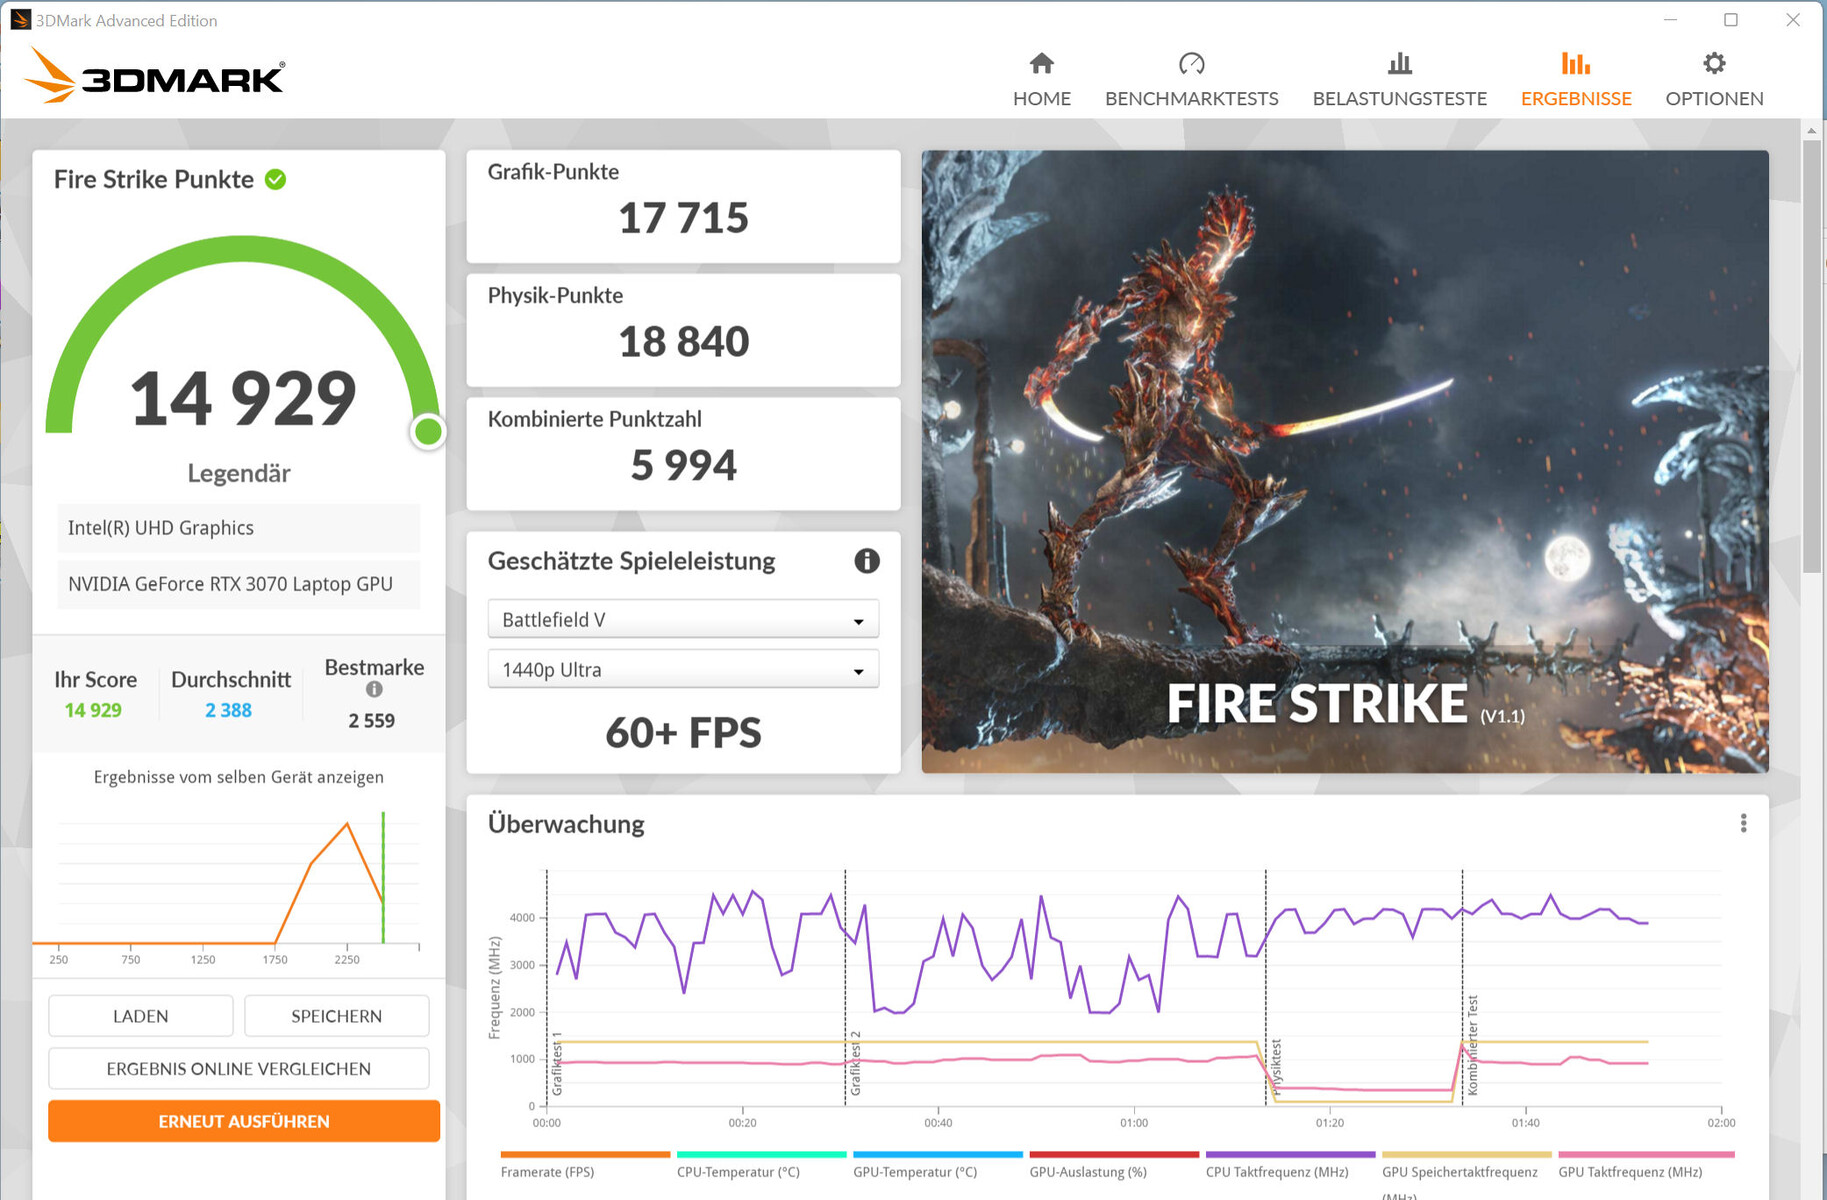
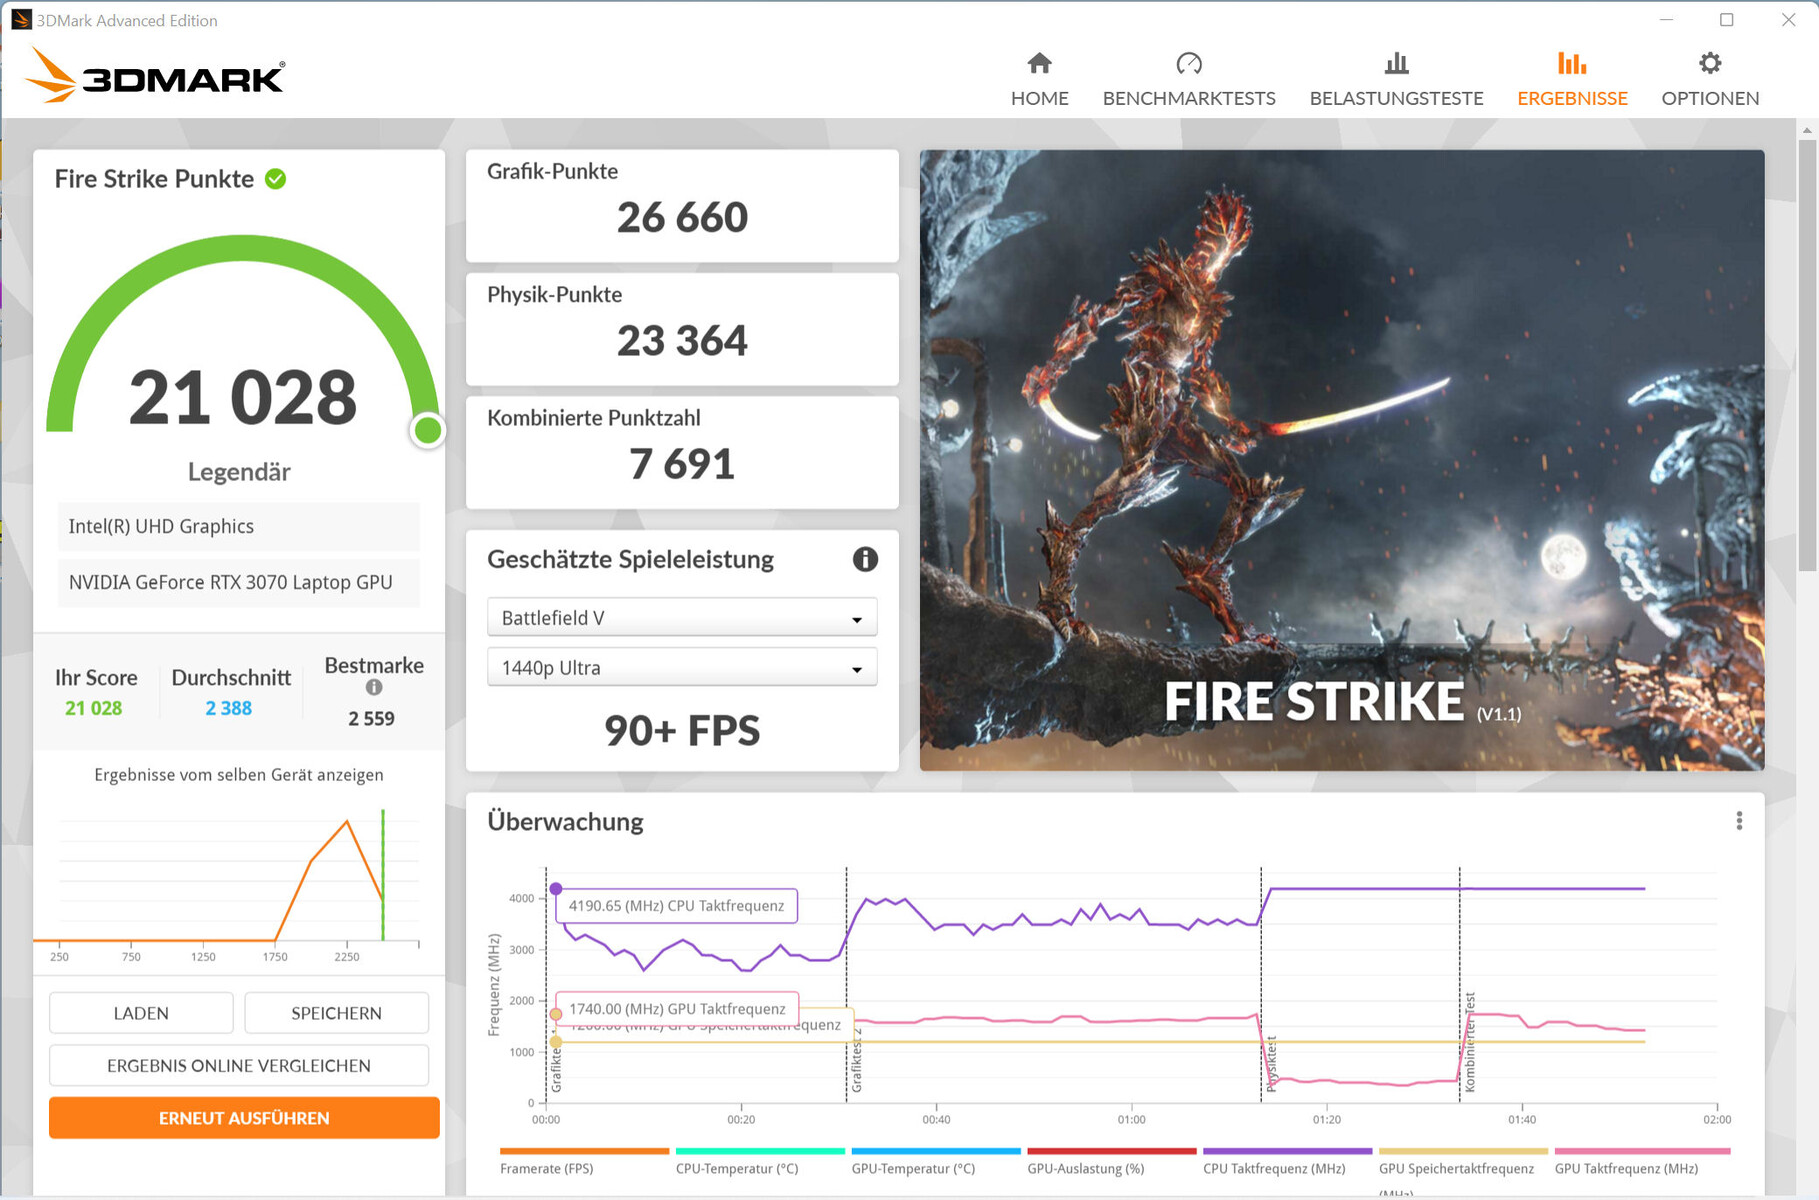
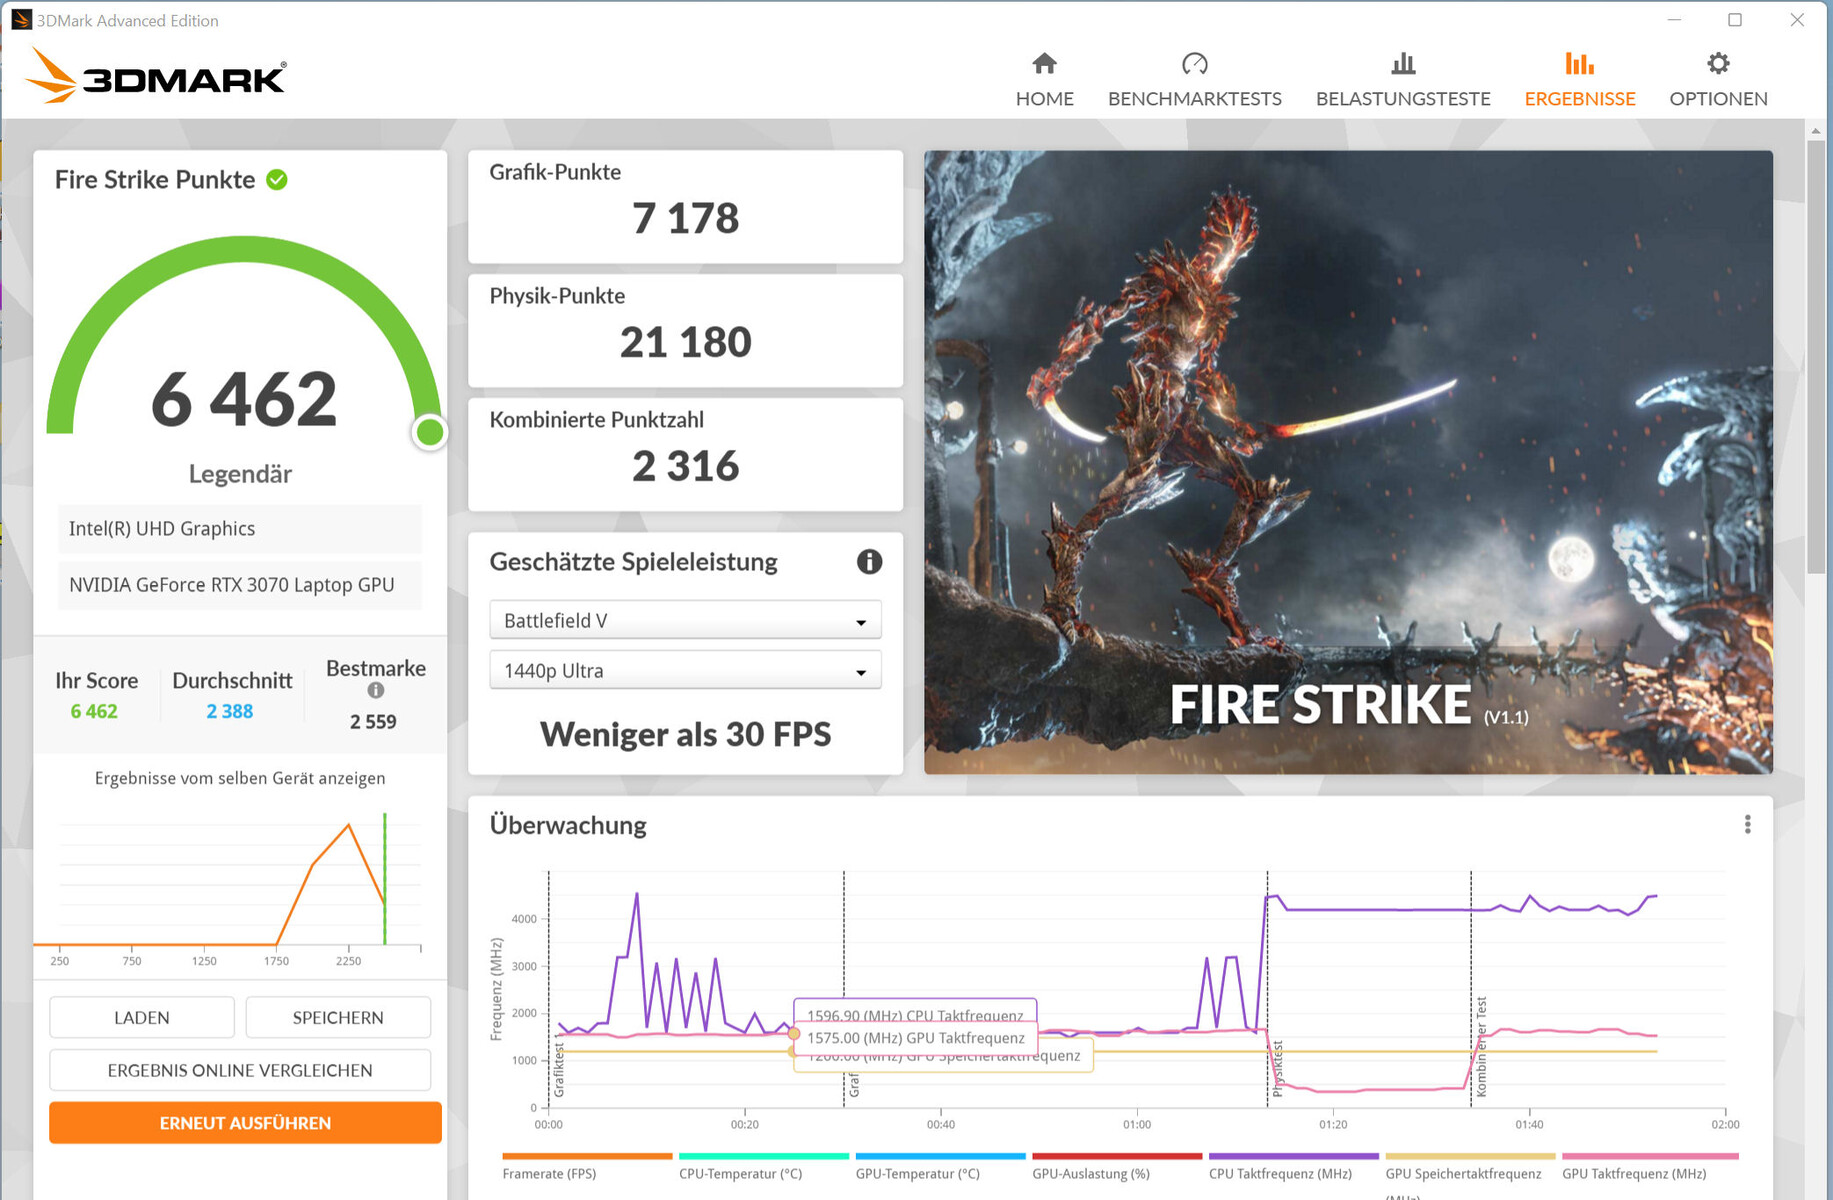
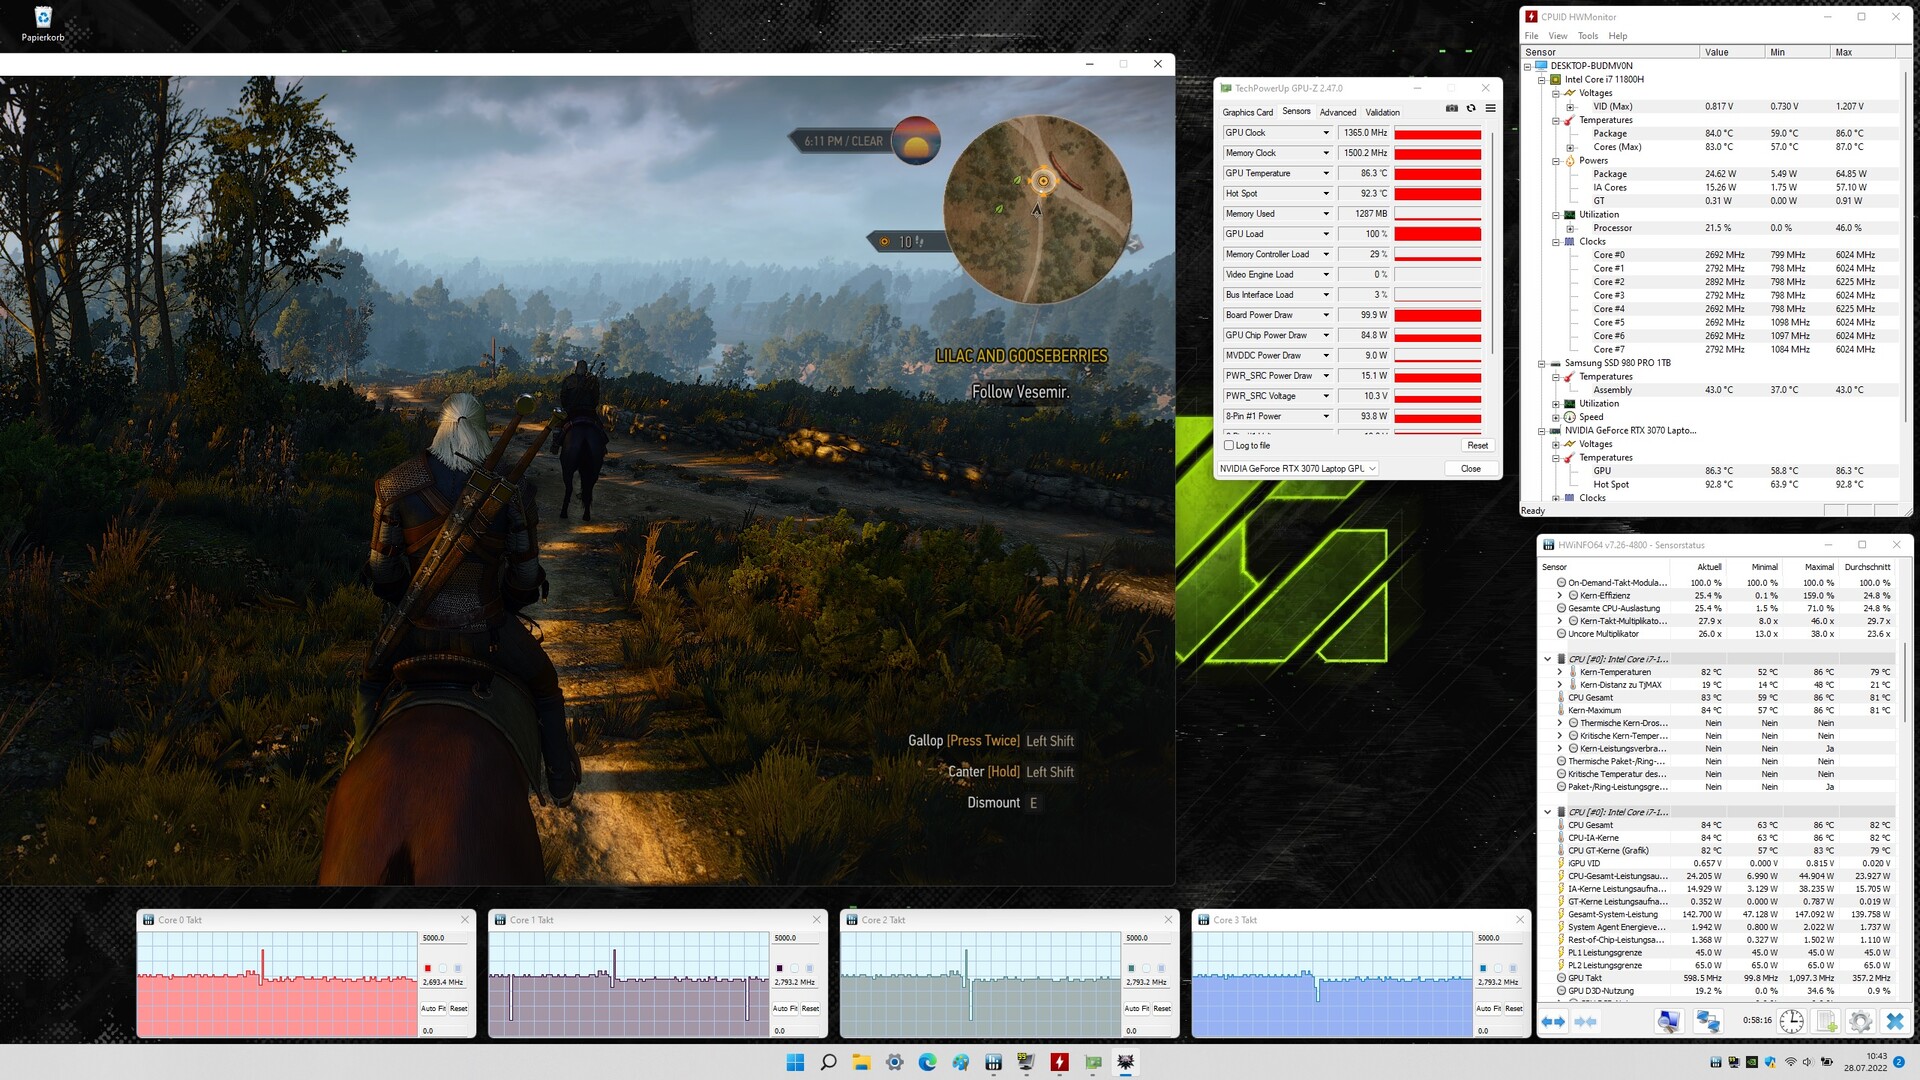
O desempenho real de uma GPU RTX 3000 depende de alguns fatores: Refrigeração, configuração de memória e o TGP máximo que um fabricante de laptop seleciona dentro dos limites definidos pela Nvidia. A Schenker fornece oGeForce Computador portátil RTX 3070 GPU com um TGP máximo de 145 watts (125 watts + 20 watts Dynamic Boost). Entretanto, o Dynamic Boost só é usado quando o perfil "Benchmark Mode" está ativo. A GPU pode acessar rapidamente a memória gráfica GDDR6 (8.192 MB).
O perfil "Equilibrado" leva a resultados de benchmark no mesmo nível que a média previamente determinada para o RTX 3070. O perfil "Benchmark Mode" permite que as taxas aumentem. Mesmo assim, o TGP máximo (145 W) não é totalmente utilizado - isto é mostrado pelo nosso teste The Witcher 3. Entretanto, parte do Dynamic Boost é utilizado.
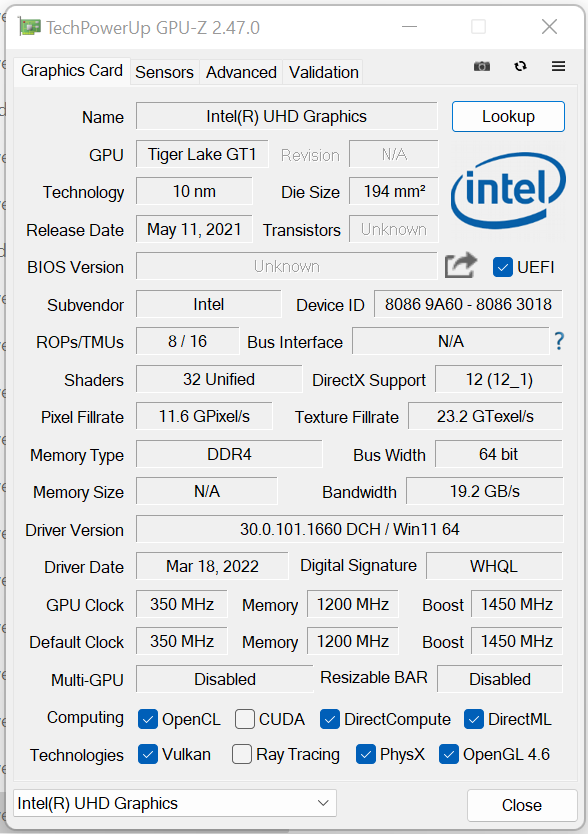
O é utilizado.UHD Graphics Xe 32EUs o núcleo gráfico integrado ao processador está ativo, e o laptop funciona com a solução de comutação gráfica Optimus da Nvidia. O Fusion não oferece a opção de saída direta de imagem através da GPU RTX 3070.

| 3DMark Performance rating - Percent | |
| Média da turma Gaming | |
| Schenker XMG Fusion 15 (Mid 22) | |
| Acer Nitro 5 AN515-58-72QR | |
| MSI Delta 15 A5EFK -1! | |
| Schenker XMG Fusion 15 (Mid 22) | |
| HP Omen 16-b1090ng | |
| Média NVIDIA GeForce RTX 3070 Laptop GPU | |
| Schenker XMG Fusion 15 (Mid 22) | |
| Asus TUF Dash F15 FX517ZR | |
| Razer Blade 15 Base Edition 2021, i7-10750H RTX 3060 | |
| Schenker XMG Fusion 15 (Mid 22) | |
| 3DMark 11 - 1280x720 Performance GPU | |
| Média da turma Gaming (21841 - 80022, n=104, últimos 2 anos) | |
| Schenker XMG Fusion 15 (Mid 22) (Benchmark-Modus) | |
| Acer Nitro 5 AN515-58-72QR | |
| Schenker XMG Fusion 15 (Mid 22) (Leistung) | |
| HP Omen 16-b1090ng | |
| MSI Delta 15 A5EFK | |
| Média NVIDIA GeForce RTX 3070 Laptop GPU (12535 - 38275, n=54) | |
| Schenker XMG Fusion 15 (Mid 22) | |
| Asus TUF Dash F15 FX517ZR | |
| Razer Blade 15 Base Edition 2021, i7-10750H RTX 3060 | |
| Schenker XMG Fusion 15 (Mid 22) (Stromsparmodus) | |
| Geekbench 5.5 - OpenCL Score | |
| Média da turma Gaming (80702 - 277970, n=101, últimos 2 anos) | |
| Acer Nitro 5 AN515-58-72QR | |
| Schenker XMG Apex 15 Max | |
| Schenker XMG Fusion 15 (Mid 22) (Benchmark-Modus) | |
| Schenker XMG Fusion 15 (Mid 22) (Leistung) | |
| Schenker XMG Fusion 15 (Mid 22) | |
| HP Omen 16-b1090ng | |
| Asus TUF Dash F15 FX517ZR | |
| Média NVIDIA GeForce RTX 3070 Laptop GPU (5732 - 125874, n=52) | |
| Razer Blade 15 Base Edition 2021, i7-10750H RTX 3060 | |
| MSI Delta 15 A5EFK | |
| Schenker XMG Fusion 15 (Mid 22) (Stromsparmodus) | |
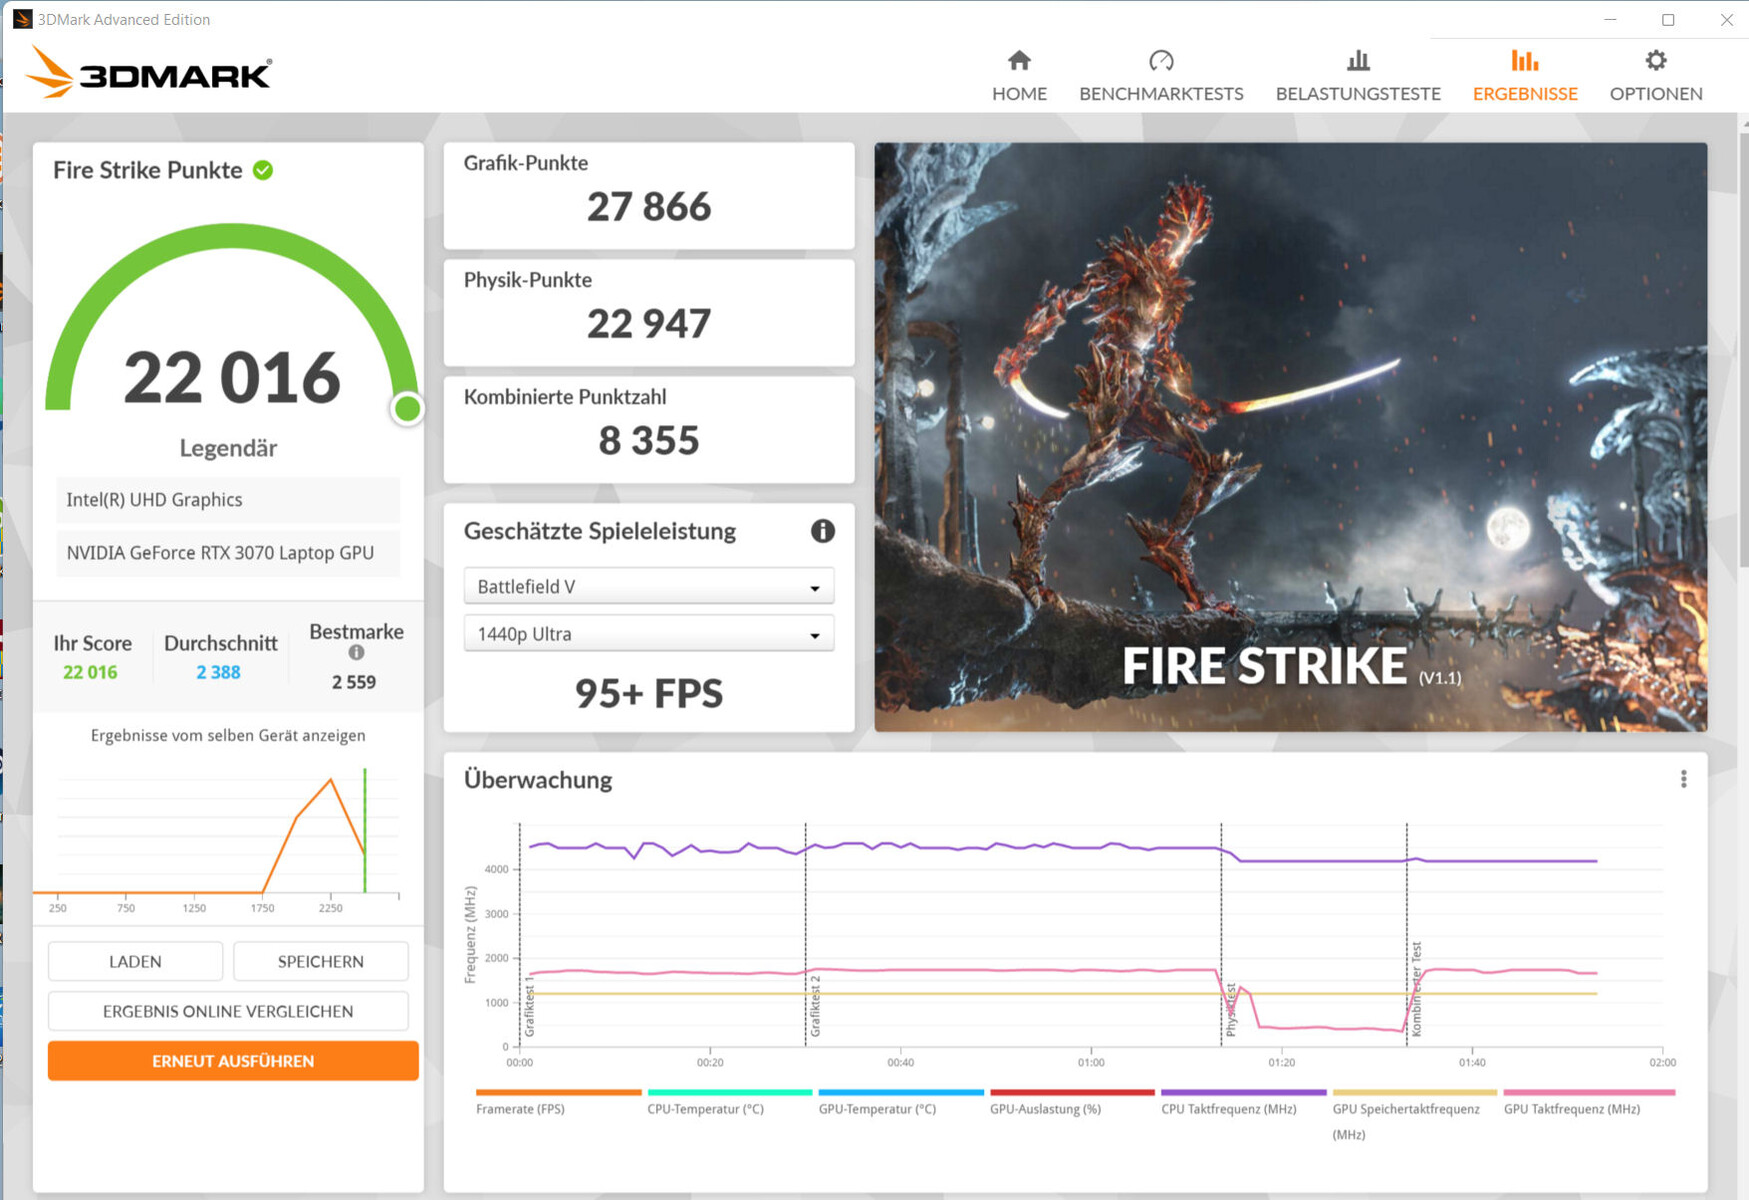
| 3DMark 11 Performance | 26211 pontos | |
| 3DMark Cloud Gate Standard Score | 48271 pontos | |
| 3DMark Fire Strike Score | 20150 pontos | |
| 3DMark Time Spy Score | 9025 pontos | |
Ajuda | ||
Desempenho do jogo
O hardware permite jogos de QHD em configurações altas ao máximo. Resoluções mais altas também podem ser usadas quando um display correspondente é conectado - com ajustes reduzidos às vezes. As taxas de quadros estão no mesmo nível da média RTX 3070. O perfil "Benchmark Mode" leva a um aumento nas taxas de quadros
| The Witcher 3 - 1920x1080 Ultra Graphics & Postprocessing (HBAO+) | |
| Média da turma Gaming (104.7 - 240, n=7, últimos 2 anos) | |
| Schenker XMG Fusion 15 (Mid 22) (Benchmark-Modus) | |
| Acer Nitro 5 AN515-58-72QR | |
| HP Omen 16-b1090ng | |
| MSI Delta 15 A5EFK | |
| Schenker XMG Fusion 15 (Mid 22) | |
| Média NVIDIA GeForce RTX 3070 Laptop GPU (34.9 - 109, n=52) | |
| Asus TUF Dash F15 FX517ZR | |
| Razer Blade 15 Base Edition 2021, i7-10750H RTX 3060 | |
| Dota 2 Reborn - 1920x1080 ultra (3/3) best looking | |
| Média da turma Gaming (84.8 - 248, n=107, últimos 2 anos) | |
| HP Omen 16-b1090ng | |
| Acer Nitro 5 AN515-58-72QR | |
| Schenker XMG Fusion 15 (Mid 22) | |
| Schenker XMG Fusion 15 (Mid 22) (Benchmark-Modus) | |
| Razer Blade 15 Base Edition 2021, i7-10750H RTX 3060 | |
| Média NVIDIA GeForce RTX 3070 Laptop GPU (26.9 - 163.9, n=58) | |
| Schenker XMG Fusion 15 (Mid 22) (Leistung) | |
| MSI Delta 15 A5EFK | |
| Asus TUF Dash F15 FX517ZR | |
| Schenker XMG Fusion 15 (Mid 22) (Stromsparmodus) | |
| X-Plane 11.11 - 1920x1080 high (fps_test=3) | |
| HP Omen 16-b1090ng | |
| Asus TUF Dash F15 FX517ZR | |
| Média da turma Gaming (55.5 - 143.5, n=109, últimos 2 anos) | |
| Acer Nitro 5 AN515-58-72QR | |
| Schenker XMG Fusion 15 (Mid 22) | |
| Média NVIDIA GeForce RTX 3070 Laptop GPU (12.4 - 118.8, n=61) | |
| Razer Blade 15 Base Edition 2021, i7-10750H RTX 3060 | |
| Schenker XMG Fusion 15 (Mid 22) (Benchmark-Modus) | |
| Schenker XMG Fusion 15 (Mid 22) (Leistung) | |
| Schenker XMG Fusion 15 (Mid 22) (Stromsparmodus) | |
| Final Fantasy XV Benchmark | |
| 1920x1080 High Quality | |
| Média da turma Gaming (41 - 215, n=95, últimos 2 anos) | |
| Schenker XMG Fusion 15 (Mid 22) (1.3, Benchmark-Modus) | |
| HP Omen 16-b1090ng | |
| Schenker XMG Fusion 15 (Mid 22) (1.3, Leistung) | |
| Schenker XMG Fusion 15 (Mid 22) (1.3) | |
| Acer Nitro 5 AN515-58-72QR (1.3) | |
| Média NVIDIA GeForce RTX 3070 Laptop GPU (27.9 - 107, n=49) | |
| Asus TUF Dash F15 FX517ZR (1.3) | |
| MSI Delta 15 A5EFK | |
| Razer Blade 15 Base Edition 2021, i7-10750H RTX 3060 (1.3) | |
| Schenker XMG Fusion 15 (Mid 22) (1.3, Stromsparmodus) | |
| 2560x1440 High Quality | |
| Média da turma Gaming (32.5 - 184.3, n=87, últimos 2 anos) | |
| Schenker XMG Fusion 15 (Mid 22) (1.3, Benchmark-Modus) | |
| Schenker XMG Fusion 15 (Mid 22) (1.3, Leistung) | |
| Schenker XMG Fusion 15 (Mid 22) (1.3) | |
| Acer Nitro 5 AN515-58-72QR (1.3) | |
| Média NVIDIA GeForce RTX 3070 Laptop GPU (19.8 - 79.9, n=25) | |
| Asus TUF Dash F15 FX517ZR (1.3) | |
| Schenker XMG Fusion 15 (Mid 22) (1.3, Stromsparmodus) | |
| GTA V | |
| 2560x1440 Highest AA:4xMSAA + FX AF:16x | |
| Média da turma Gaming (36.9 - 183.9, n=72, últimos 2 anos) | |
| Schenker XMG Fusion 15 (Mid 22) (Benchmark-Modus) | |
| Schenker XMG Fusion 15 (Mid 22) (Leistung) | |
| Schenker XMG Fusion 15 (Mid 22) | |
| Média NVIDIA GeForce RTX 3070 Laptop GPU (70.8 - 97.1, n=19) | |
| Acer Nitro 5 AN515-58-72QR | |
| Asus TUF Dash F15 FX517ZR | |
| 1920x1080 Highest AA:4xMSAA + FX AF:16x | |
| Média da turma Gaming (48.3 - 186.9, n=94, últimos 2 anos) | |
| HP Omen 16-b1090ng | |
| Schenker XMG Fusion 15 (Mid 22) (Benchmark-Modus) | |
| Asus TUF Dash F15 FX517ZR | |
| Schenker XMG Fusion 15 (Mid 22) (Leistung) | |
| Schenker XMG Fusion 15 (Mid 22) | |
| Acer Nitro 5 AN515-58-72QR | |
| Média NVIDIA GeForce RTX 3070 Laptop GPU (21.7 - 125.8, n=50) | |
| MSI Delta 15 A5EFK | |
| Razer Blade 15 Base Edition 2021, i7-10750H RTX 3060 | |
| Schenker XMG Fusion 15 (Mid 22) (Stromsparmodus) | |
| Strange Brigade | |
| 2560x1440 ultra AA:ultra AF:16 | |
| Média da turma Gaming (52.8 - 354, n=76, últimos 2 anos) | |
| Acer Nitro 5 AN515-58-72QR (1.47.22.14 D3D12) | |
| Schenker XMG Fusion 15 (Mid 22) (1.47.22.14 D3D12, Benchmark-Modus) | |
| Schenker XMG Fusion 15 (Mid 22) (1.47.22.14 D3D12) | |
| Média NVIDIA GeForce RTX 3070 Laptop GPU (82.3 - 140.5, n=18) | |
| Asus TUF Dash F15 FX517ZR (1.47.22.14 D3D12) | |
| 1920x1080 ultra AA:ultra AF:16 | |
| Média da turma Gaming (76.3 - 458, n=87, últimos 2 anos) | |
| Schenker XMG Fusion 15 (Mid 22) (1.47.22.14 D3D12, Benchmark-Modus) | |
| Acer Nitro 5 AN515-58-72QR (1.47.22.14 D3D12) | |
| Schenker XMG Fusion 15 (Mid 22) (1.47.22.14 D3D12, Leistung) | |
| MSI Delta 15 A5EFK (1.47.22.14 D3D12) | |
| Schenker XMG Fusion 15 (Mid 22) (1.47.22.14 D3D12) | |
| Média NVIDIA GeForce RTX 3070 Laptop GPU (36.2 - 194, n=46) | |
| Asus TUF Dash F15 FX517ZR (1.47.22.14 D3D12) | |
| HP Omen 16-b1090ng (1.47.22.14 D3D12) | |
| Razer Blade 15 Base Edition 2021, i7-10750H RTX 3060 (1.47.22.14 D3D12) | |
| Schenker XMG Fusion 15 (Mid 22) (1.47.22.14 D3D12, Stromsparmodus) | |
| F1 2021 | |
| 2560x1440 Ultra High Preset + Raytracing AA:T AF:16x | |
| Schenker XMG Fusion 15 (Mid 22) (874931, Benchmark-Modus) | |
| Schenker XMG Fusion 15 (Mid 22) (874931, Leistung) | |
| Média NVIDIA GeForce RTX 3070 Laptop GPU (67.1 - 90.2, n=11) | |
| Acer Nitro 5 AN515-58-72QR (874931) | |
| Schenker XMG Fusion 15 (Mid 22) (874931) | |
| Asus TUF Dash F15 FX517ZR (874931) | |
| 1920x1080 Ultra High Preset + Raytracing AA:T AF:16x | |
| Schenker XMG Fusion 15 (Mid 22) (874931, Benchmark-Modus) | |
| Schenker XMG Fusion 15 (Mid 22) (874931, Leistung) | |
| Acer Nitro 5 AN515-58-72QR (874931) | |
| Schenker XMG Fusion 15 (Mid 22) (874931) | |
| MSI Delta 15 A5EFK | |
| Média NVIDIA GeForce RTX 3070 Laptop GPU (33.1 - 123.1, n=23) | |
| Asus TUF Dash F15 FX517ZR (874931) | |
| Schenker XMG Fusion 15 (Mid 22) (874931, Stromsparmodus) | |
| Far Cry 5 | |
| 2560x1440 Ultra Preset AA:T | |
| Média da turma Gaming (93 - 149, n=5, últimos 2 anos) | |
| Schenker XMG Fusion 15 (Mid 22) (Benchmark-Modus) | |
| Média NVIDIA GeForce RTX 3070 Laptop GPU (81 - 101, n=18) | |
| Schenker XMG Fusion 15 (Mid 22) | |
| Asus TUF Dash F15 FX517ZR | |
| Acer Nitro 5 AN515-58-72QR | |
| 1920x1080 Ultra Preset AA:T | |
| Média da turma Gaming (70 - 151, n=6, últimos 2 anos) | |
| Schenker XMG Fusion 15 (Mid 22) (Benchmark-Modus) | |
| Schenker XMG Fusion 15 (Mid 22) | |
| Média NVIDIA GeForce RTX 3070 Laptop GPU (89 - 140, n=36) | |
| Asus TUF Dash F15 FX517ZR | |
| MSI Delta 15 A5EFK | |
| Acer Nitro 5 AN515-58-72QR | |
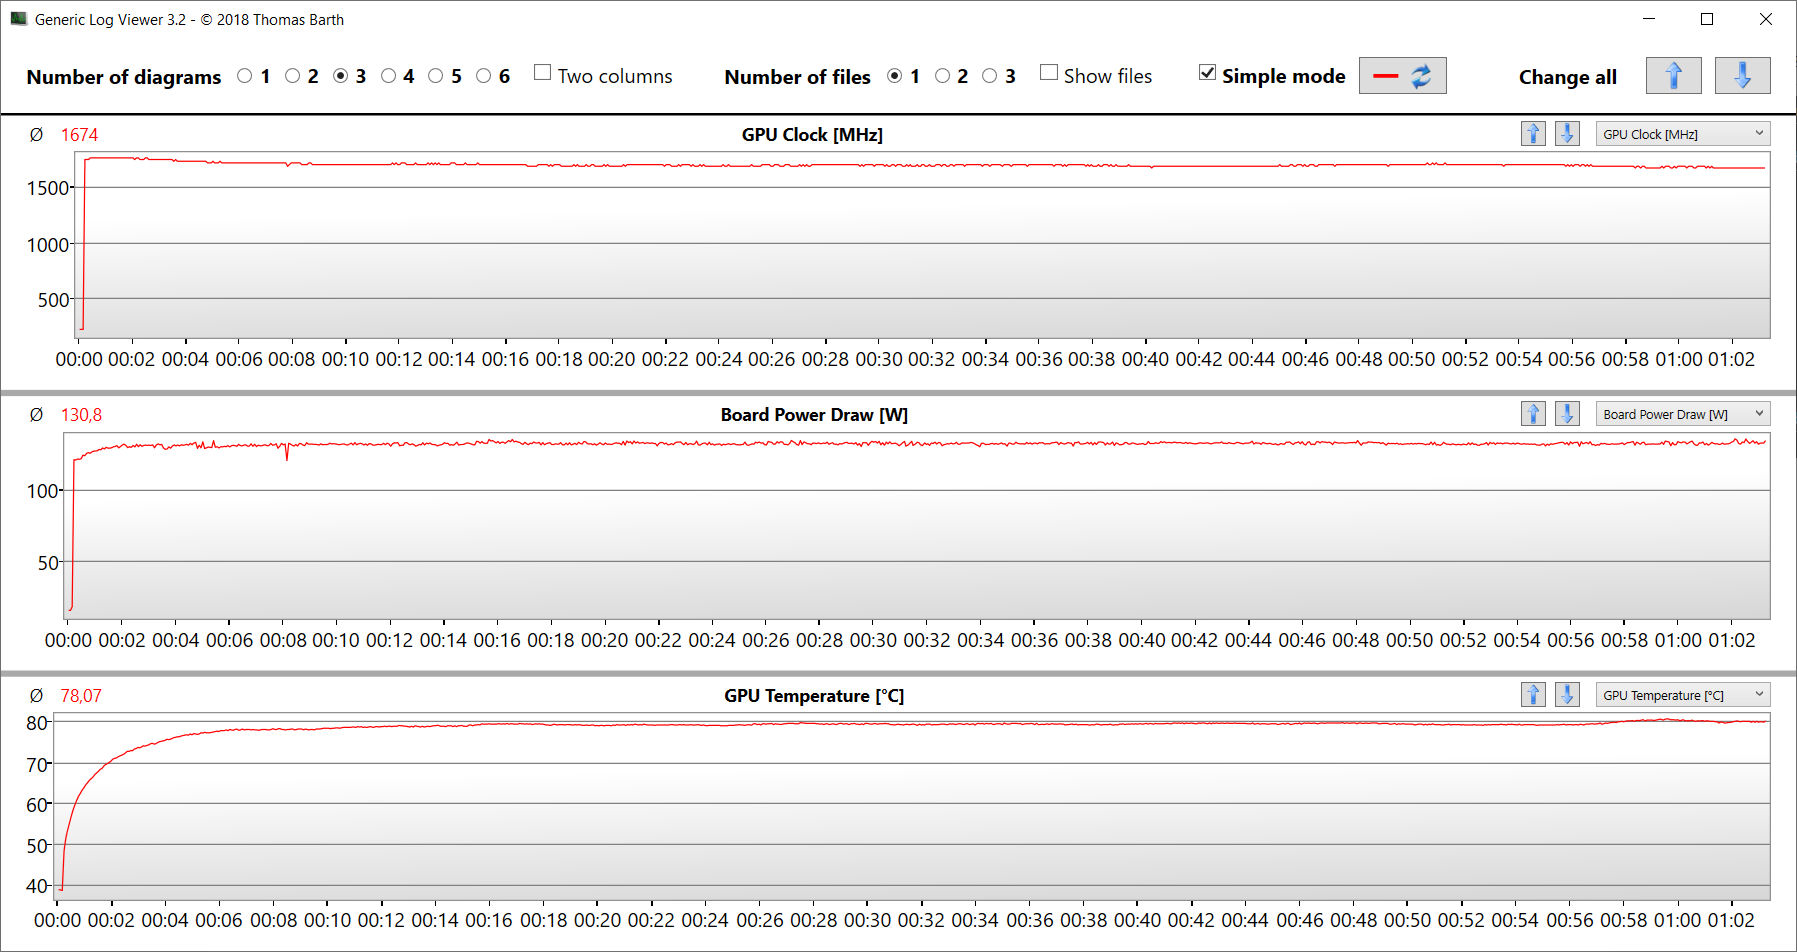
A fim de verificar se as taxas de quadros permanecem em grande parte constantes durante um longo período de tempo, deixamos o jogo Witcher 3 funcionar por cerca de 60 minutos com resolução Full HD e ajustes de qualidade máxima. O personagem não é movido. Não foi encontrada uma queda nas taxas de quadros
The Witcher 3 FPS diagram
| baixo | média | alto | ultra | QHD | |
|---|---|---|---|---|---|
| GTA V (2015) | 183.5 | 177 | 168.5 | 100 | 83.4 |
| The Witcher 3 (2015) | 348 | 260 | 163.4 | 91.8 | |
| Dota 2 Reborn (2015) | 155.7 | 139.4 | 132.8 | 125.3 | |
| Final Fantasy XV Benchmark (2018) | 171.3 | 121.6 | 93.8 | 72.1 | |
| X-Plane 11.11 (2018) | 121.2 | 111 | 86.8 | ||
| Far Cry 5 (2018) | 152 | 122 | 115 | 109 | 89 |
| Strange Brigade (2018) | 389 | 232 | 188.8 | 165.6 | 124.1 |
| F1 2021 (2021) | 267 | 194.2 | 170.1 | 105 | 79.8 |
Emissões - O laptop Schenker gera muito calor
Emissões sonoras
Os dois ventiladores produzem muito pouco ruído no uso diário (escritório, Internet). Eles até ficam parados ocasionalmente. As coisas ficam barulhentas sob carga total com níveis máximos de pressão sonora de 48 dB(A) (teste de estresse) e 46 dB(A) (nosso teste Witcher 3 ), respectivamente, mas isto não é excessivamente barulhento. A maioria dos concorrentes produz mais ruído, com apenas o Asus TUF Dash F15 estar praticamente ao mesmo nível
O desenvolvimento de ruídos sob carga pode ser reduzido de duas maneiras: Usando o perfil "Power-saving Mode" ou ativando o "WhisperMode 2.0" da GPU GeForce. O último pode ser ligado no Centro de Controle (na seção "Otimização de Performance"). Ele incorpora o perfil "Modo de Economia de Energia". O Modo Whisper deve atingir o nível de ruído mais baixo possível usando níveis de taxa de quadros suficientes para um jogo de computador (pelo menos 30 a 60 fps). A GPU não precisa trabalhar com potência total; ela produz menos calor e os ventiladores podem diminuir a velocidade.
Uma palavra sobre o perfil "Benchmark Mode": Os ventiladores funcionam continuamente em velocidade máxima e são - sem surpresas - claramente audíveis. Tudo isso é refletido em um constante assobio. Os ventiladores de nossa amostra de revisão não emitem nenhum ruído de fundo desagradável.
Barulho
| Ocioso |
| 26 / 28 / 31 dB |
| Carga |
| 45 / 48 dB |
 | ||
30 dB silencioso 40 dB(A) audível 50 dB(A) ruidosamente alto |
||
min: | ||
| Schenker XMG Fusion 15 (Mid 22) i7-11800H, GeForce RTX 3070 Laptop GPU | Asus TUF Dash F15 FX517ZR i7-12650H, GeForce RTX 3070 Laptop GPU | Acer Nitro 5 AN515-58-72QR i7-12700H, GeForce RTX 3070 Ti Laptop GPU | HP Omen 16-b1090ng i7-12700H, GeForce RTX 3070 Ti Laptop GPU | MSI Delta 15 A5EFK R9 5900HX, Radeon RX 6700M | Razer Blade 15 Base Edition 2021, i7-10750H RTX 3060 i7-10750H, GeForce RTX 3060 Laptop GPU | |
|---|---|---|---|---|---|---|
| Noise | -4% | -6% | -11% | -6% | 5% | |
| desligado / ambiente * (dB) | 26 | 26 -0% | 26 -0% | 26 -0% | 25 4% | 25.3 3% |
| Idle Minimum * (dB) | 26 | 26 -0% | 26 -0% | 30 -15% | 25 4% | 25.4 2% |
| Idle Average * (dB) | 28 | 32 -14% | 29 -4% | 31 -11% | 30 -7% | 25.4 9% |
| Idle Maximum * (dB) | 31 | 33 -6% | 33 -6% | 33 -6% | 40 -29% | 25.4 18% |
| Load Average * (dB) | 45 | 48 -7% | 47 -4% | 49 -9% | 47 -4% | 42.5 6% |
| Witcher 3 ultra * (dB) | 46 | 47 -2% | 53 -15% | 53 -15% | 48 -4% | 42 9% |
| Load Maximum * (dB) | 48 | 49 -2% | 53 -10% | 57 -19% | 51 -6% | 52.2 -9% |
* ... menor é melhor
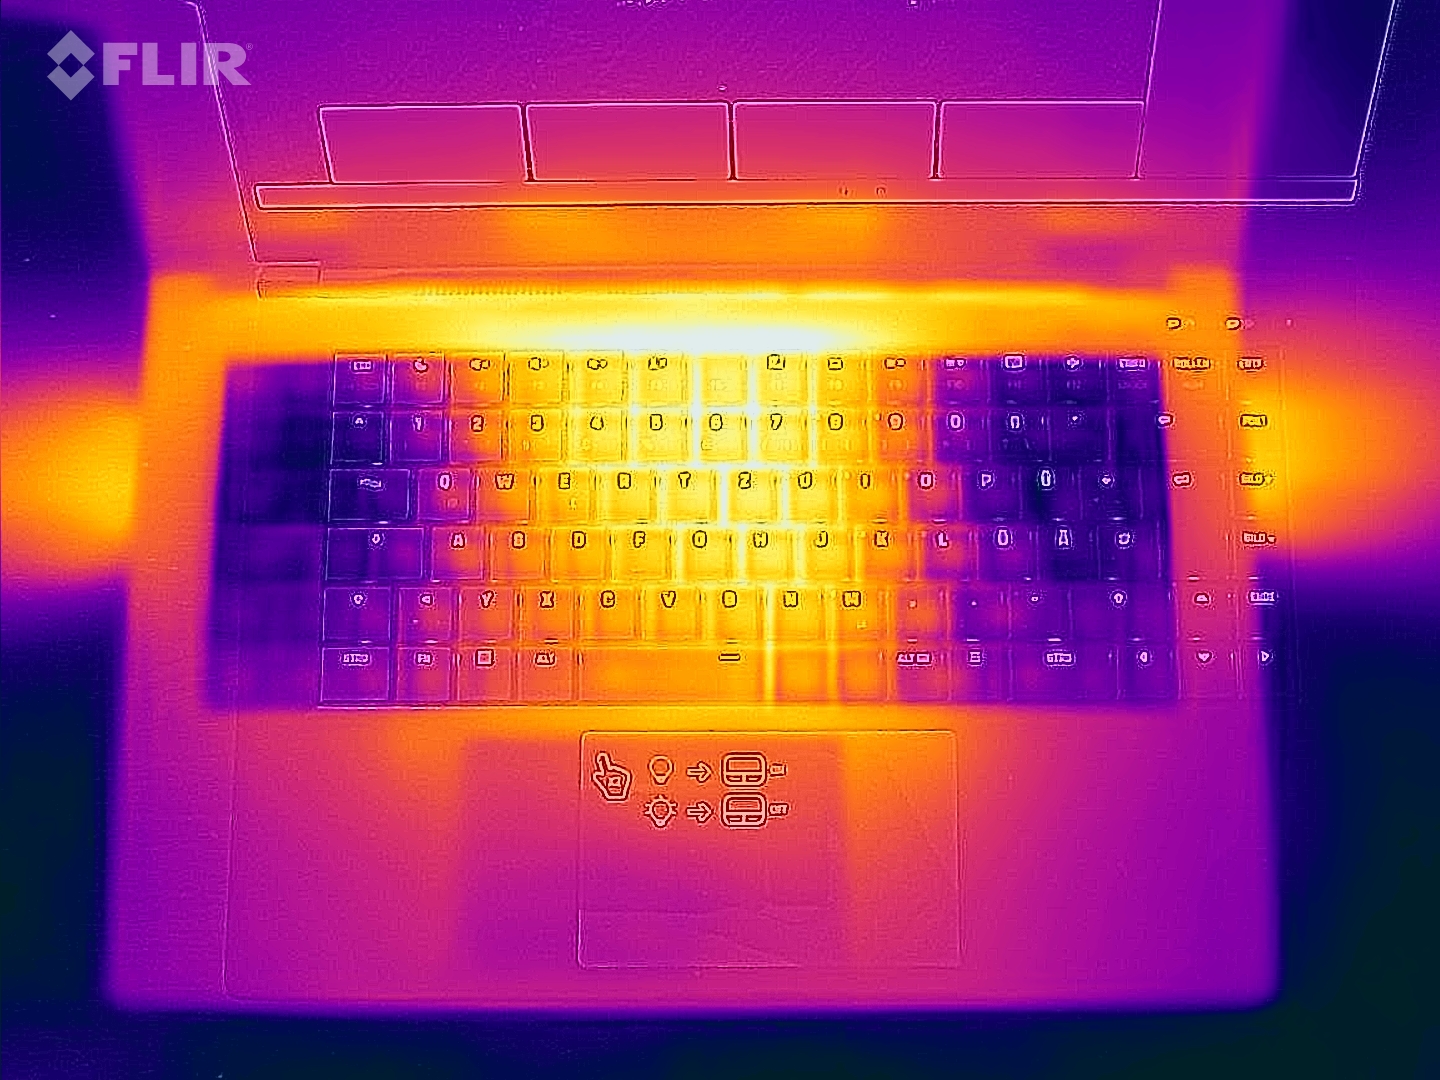
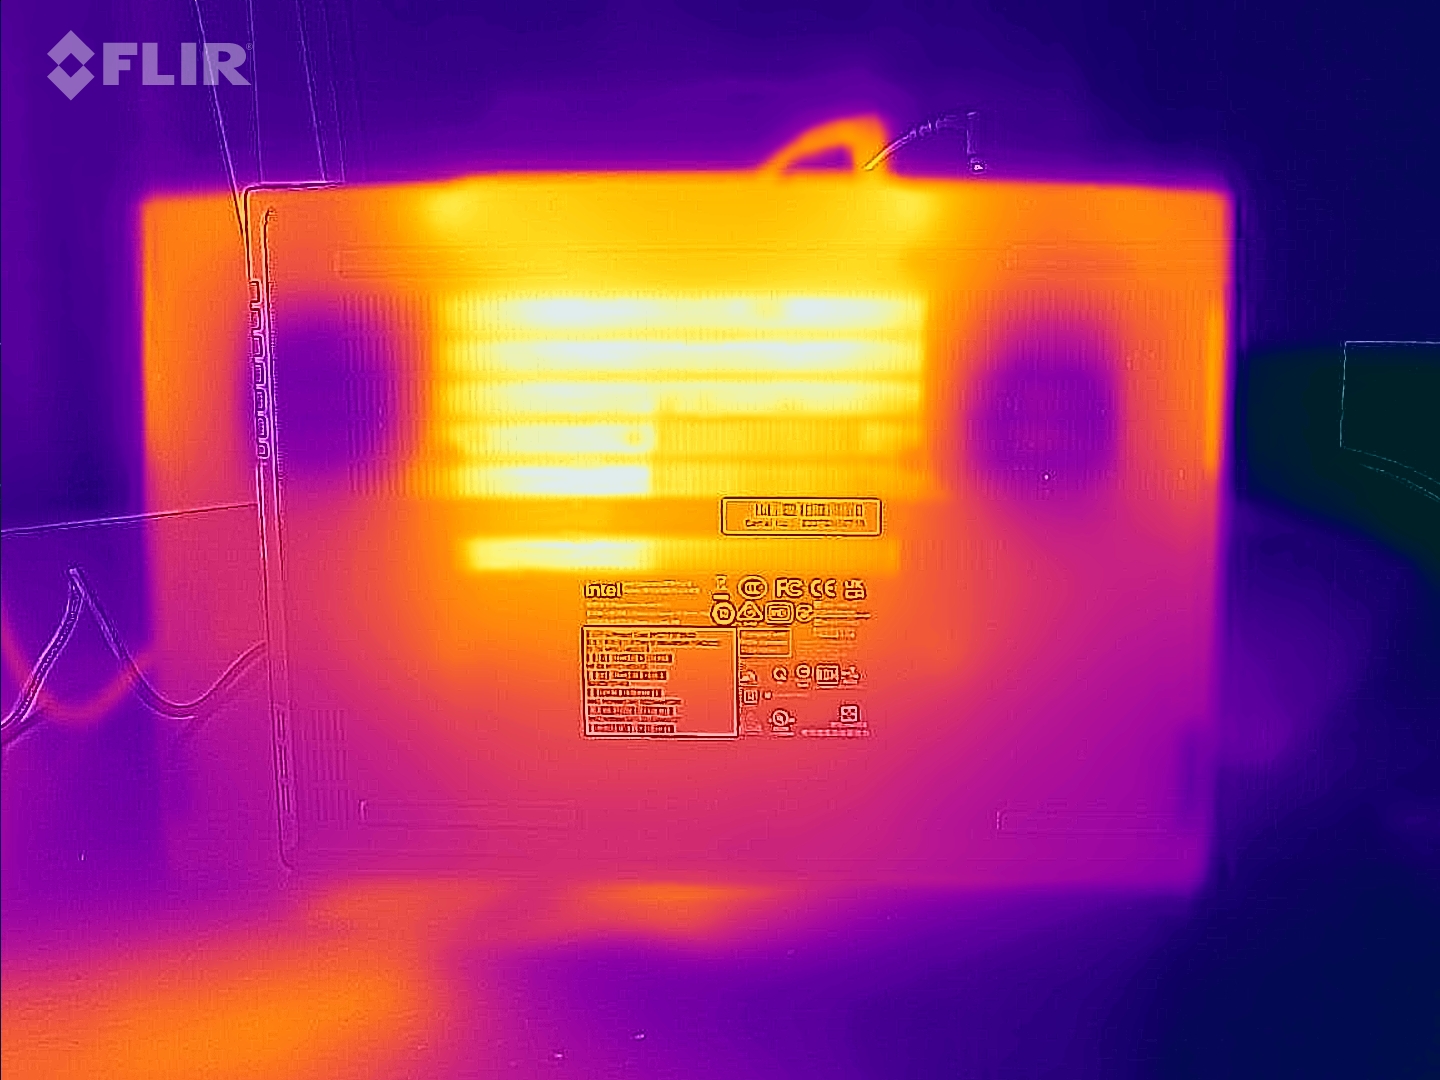
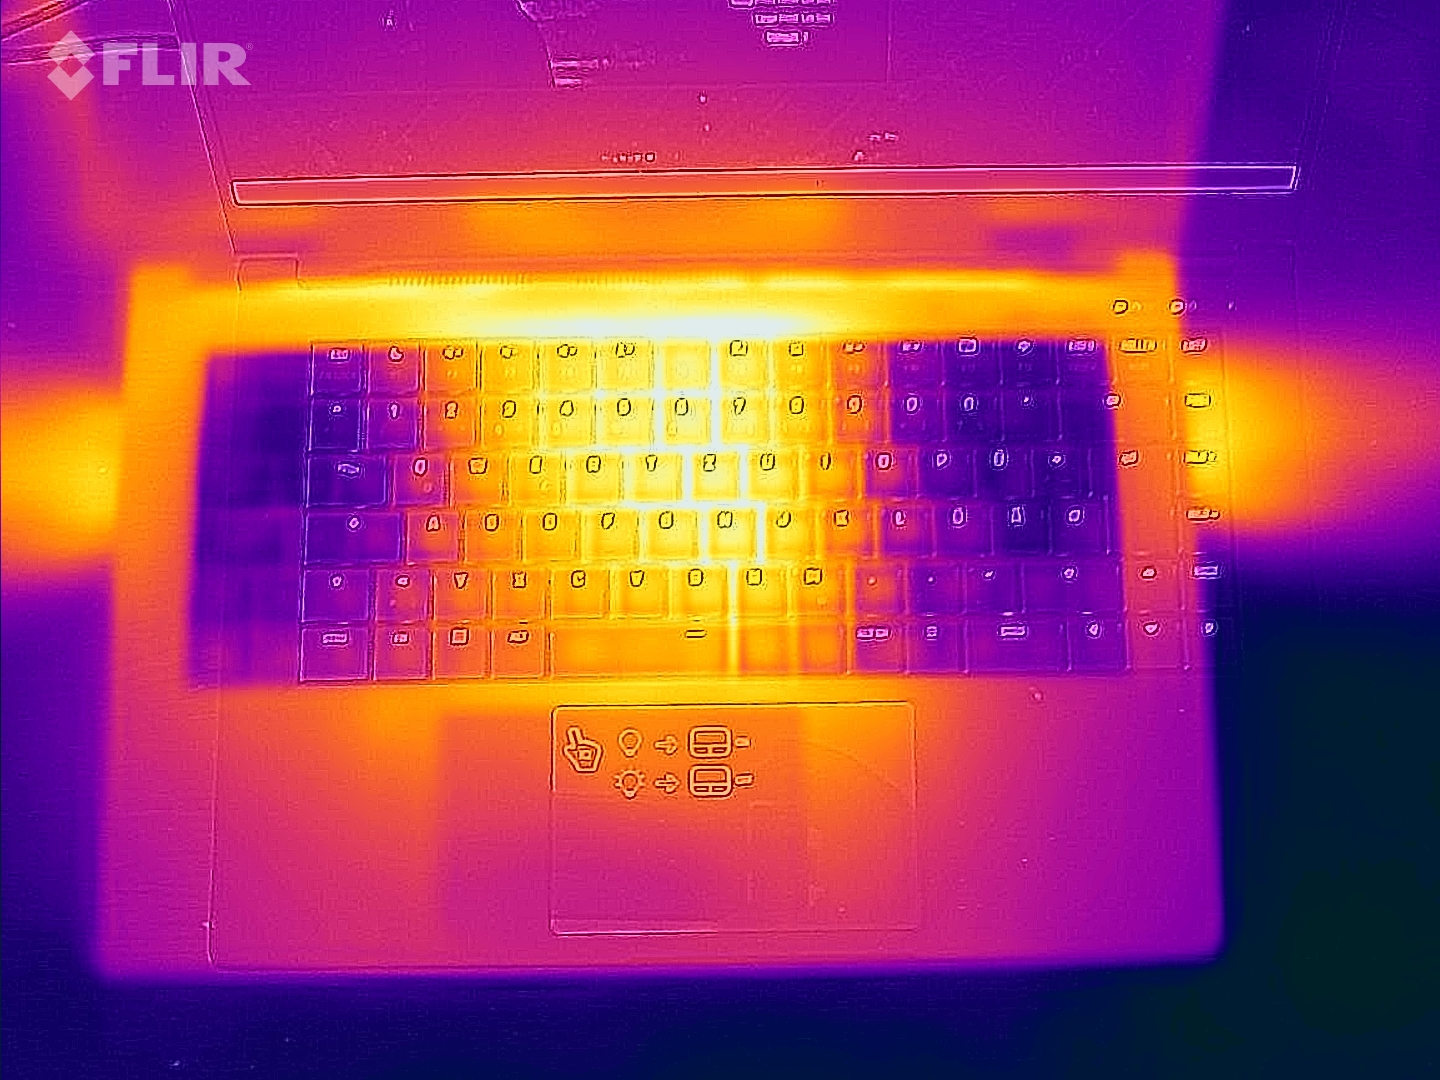
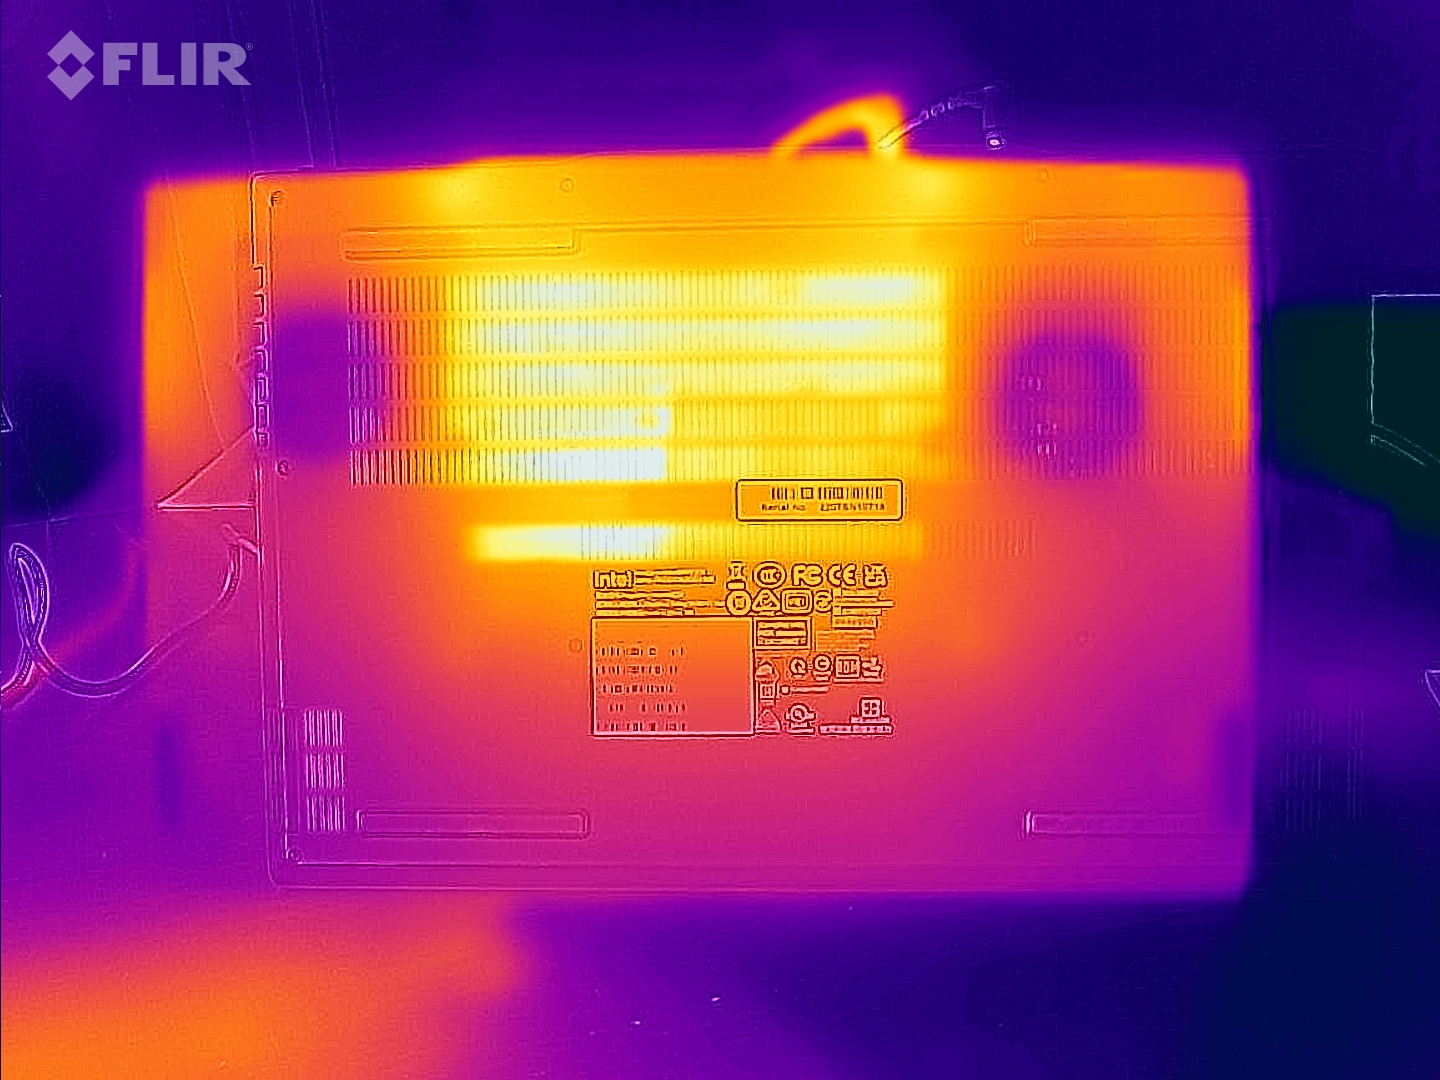
Temperatura
No uso diário (escritório, Internet), as temperaturas do estojo permanecem dentro de uma faixa aceitável. Entretanto, o laptop aquece significativamente sob carga (teste de estresse, nosso teste Witcher 3 ). Temperaturas pouco acima de 60 °C (~140 °F) podem ser registradas em vários pontos de medição. As temperaturas da CPU não são motivo de preocupação
(-) A temperatura máxima no lado superior é 52 °C / 126 F, em comparação com a média de 40.4 °C / 105 F , variando de 21.2 a 68.8 °C para a classe Gaming.
(-) A parte inferior aquece até um máximo de 63 °C / 145 F, em comparação com a média de 43.2 °C / 110 F
(±) Em uso inativo, a temperatura média para o lado superior é 35.6 °C / 96 F, em comparação com a média do dispositivo de 33.9 °C / ### class_avg_f### F.
(-) Jogando The Witcher 3, a temperatura média para o lado superior é 48.8 °C / 120 F, em comparação com a média do dispositivo de 33.9 °C / ## #class_avg_f### F.
(-) Os apoios para as mãos e o touchpad podem ficar muito quentes ao toque, com um máximo de 46 °C / 114.8 F.
(-) A temperatura média da área do apoio para as mãos de dispositivos semelhantes foi 28.8 °C / 83.8 F (-17.2 °C / -31 F).
| Schenker XMG Fusion 15 (Mid 22) Intel Core i7-11800H, NVIDIA GeForce RTX 3070 Laptop GPU | Asus TUF Dash F15 FX517ZR Intel Core i7-12650H, NVIDIA GeForce RTX 3070 Laptop GPU | Acer Nitro 5 AN515-58-72QR Intel Core i7-12700H, NVIDIA GeForce RTX 3070 Ti Laptop GPU | HP Omen 16-b1090ng Intel Core i7-12700H, NVIDIA GeForce RTX 3070 Ti Laptop GPU | MSI Delta 15 A5EFK AMD Ryzen 9 5900HX, AMD Radeon RX 6700M | Razer Blade 15 Base Edition 2021, i7-10750H RTX 3060 Intel Core i7-10750H, NVIDIA GeForce RTX 3060 Laptop GPU | |
|---|---|---|---|---|---|---|
| Heat | 8% | 12% | 22% | 14% | 12% | |
| Maximum Upper Side * (°C) | 52 | 52 -0% | 48 8% | 41 21% | 50 4% | 45.2 13% |
| Maximum Bottom * (°C) | 63 | 52 17% | 51 19% | 62 2% | 55 13% | 48 24% |
| Idle Upper Side * (°C) | 37 | 33 11% | 34 8% | 25 32% | 31 16% | 34.4 7% |
| Idle Bottom * (°C) | 38 | 36 5% | 33 13% | 26 32% | 30 21% | 37.2 2% |
* ... menor é melhor
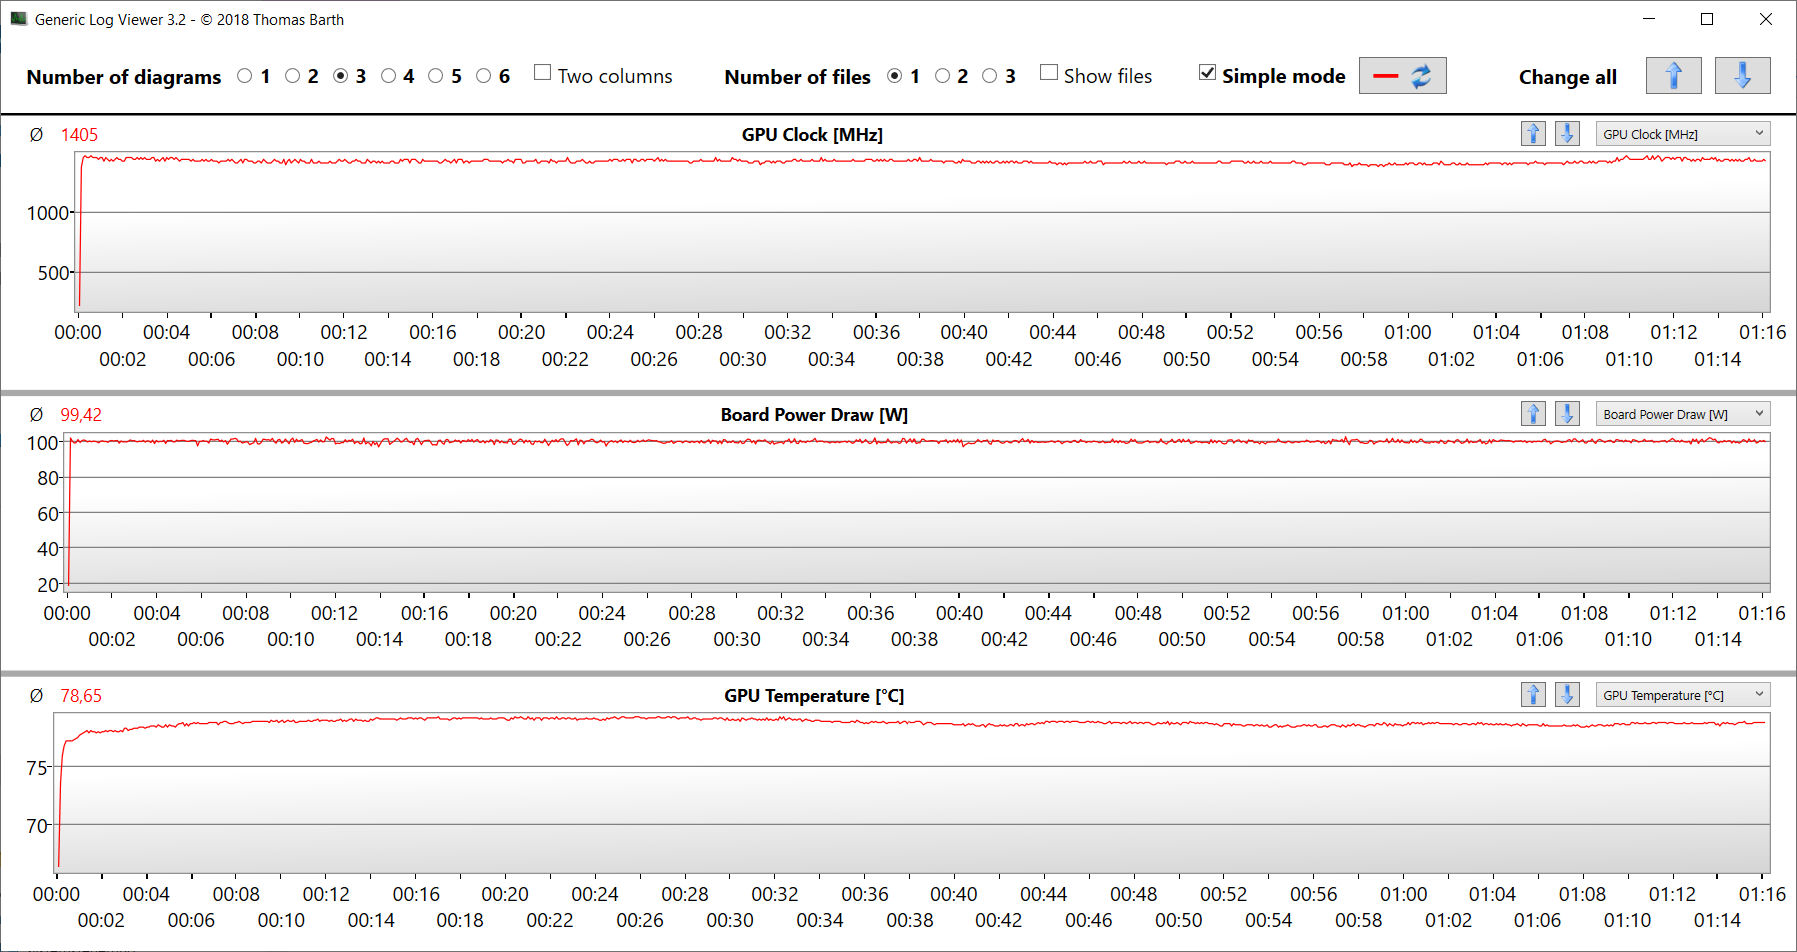
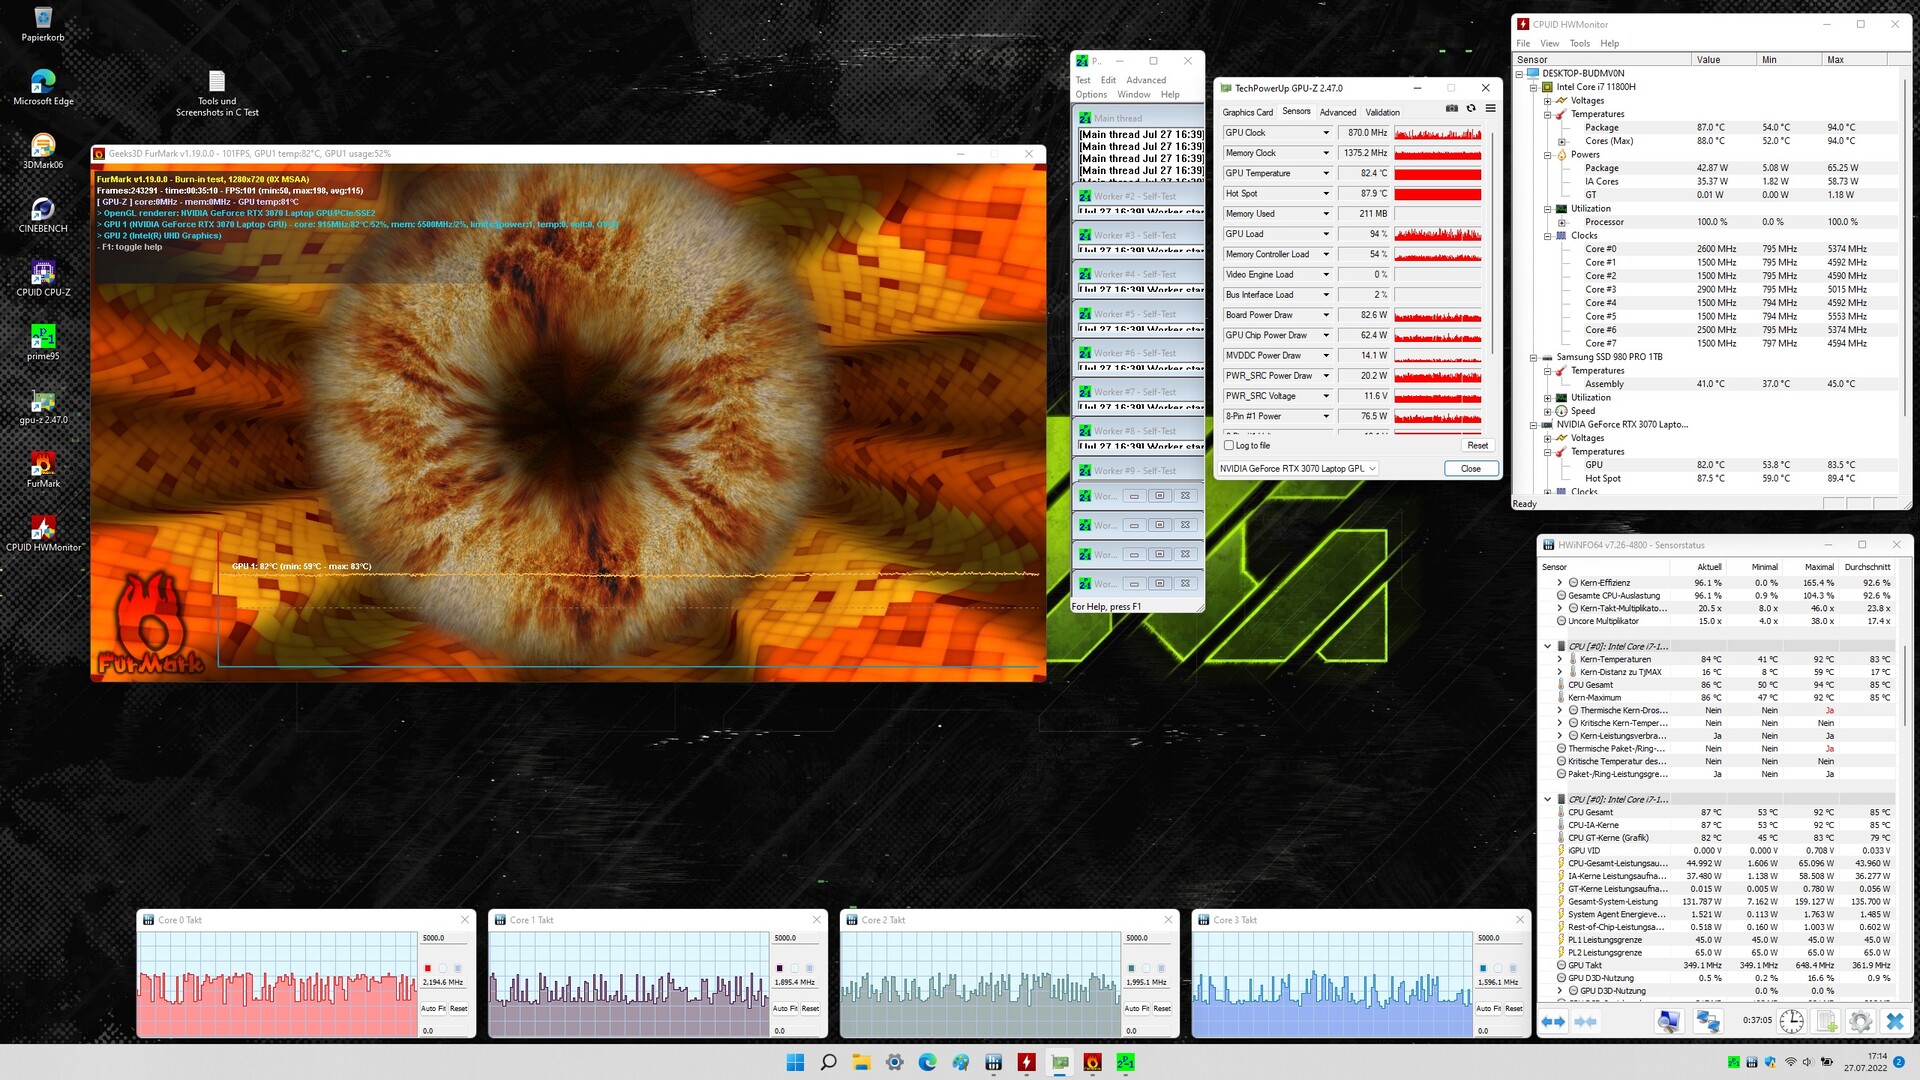
Teste de estresse
A CPU (1,8 a 4,2 GHz) e a GPU (1.000 a 1.700 MHz) iniciam o teste de estresse (Prime95 e FurMark funcionam por pelo menos uma hora) com um alto nível de velocidade de operação flutuante. À medida que o teste progride, as taxas do relógio caem. O teste de estresse representa um cenário extremo. Utilizamos este teste para verificar se o sistema permanece estável sob carga total.
Oradores
Os alto-falantes estéreo emitem um som relativamente bom, mas quase não tem graves. Recomendamos o uso de fones de ouvido ou alto-falantes externos para uma melhor experiência sonora
Schenker XMG Fusion 15 (Mid 22) análise de áudio
(+) | os alto-falantes podem tocar relativamente alto (###valor### dB)
Graves 100 - 315Hz
(-) | quase nenhum baixo - em média 17.6% menor que a mediana
(±) | a linearidade dos graves é média (12.1% delta para a frequência anterior)
Médios 400 - 2.000 Hz
(+) | médios equilibrados - apenas 3% longe da mediana
(+) | médios são lineares (3.9% delta para frequência anterior)
Altos 2 - 16 kHz
(+) | agudos equilibrados - apenas 2.8% longe da mediana
(+) | os máximos são lineares (5.5% delta da frequência anterior)
Geral 100 - 16.000 Hz
(+) | o som geral é linear (13.3% diferença em relação à mediana)
Comparado com a mesma classe
» 19% de todos os dispositivos testados nesta classe foram melhores, 5% semelhantes, 76% piores
» O melhor teve um delta de 6%, a média foi 18%, o pior foi 132%
Comparado com todos os dispositivos testados
» 14% de todos os dispositivos testados foram melhores, 3% semelhantes, 83% piores
» O melhor teve um delta de 4%, a média foi 23%, o pior foi 134%
Gerenciamento de energia - NUC proporciona uma boa vida útil da bateria
Consumo de energia
Em geral, o consumo de energia está em um nível normal para o hardware instalado aqui. Nosso teste Witcher 3 e o teste de estresse, respectivamente, resultam em um consumo médio de energia de 208 watts e até 160 watts, respectivamente. Enquanto nosso teste Witcher 3 é executado com consumo de energia constante, a demanda flutua e cai no decorrer do teste de estresse. A fonte de energia incluída (230 watts) é de capacidade suficiente
| desligado | |
| Ocioso | |
| Carga |
|
Key:
min: | |
| Schenker XMG Fusion 15 (Mid 22) i7-11800H, GeForce RTX 3070 Laptop GPU | Asus TUF Dash F15 FX517ZR i7-12650H, GeForce RTX 3070 Laptop GPU | Acer Nitro 5 AN515-58-72QR i7-12700H, GeForce RTX 3070 Ti Laptop GPU | HP Omen 16-b1090ng i7-12700H, GeForce RTX 3070 Ti Laptop GPU | MSI Delta 15 A5EFK R9 5900HX, Radeon RX 6700M | Razer Blade 15 Base Edition 2021, i7-10750H RTX 3060 i7-10750H, GeForce RTX 3060 Laptop GPU | Média NVIDIA GeForce RTX 3070 Laptop GPU | Média da turma Gaming | |
|---|---|---|---|---|---|---|---|---|
| Power Consumption | 10% | 2% | 17% | -2% | 2% | -16% | -10% | |
| Idle Minimum * (Watt) | 12 | 10 17% | 7 42% | 4 67% | 10 17% | 11.7 2% | 15.6 ? -30% | 13 ? -8% |
| Idle Average * (Watt) | 17 | 14 18% | 15 12% | 10 41% | 18 -6% | 16 6% | 20.1 ? -18% | 19 ? -12% |
| Idle Maximum * (Watt) | 24 | 20 17% | 24 -0% | 19 21% | 25 -4% | 29.3 -22% | 29.4 ? -22% | 24.6 ? -3% |
| Load Average * (Watt) | 106 | 122 -15% | 124 -17% | 114 -8% | 101 5% | 95.6 10% | 110.8 ? -5% | 110.7 ? -4% |
| Witcher 3 ultra * (Watt) | 159.9 | 138.6 13% | 195.1 -22% | 183.2 -15% | 187 -17% | 141.3 12% | ||
| Load Maximum * (Watt) | 208 | 189 9% | 220 -6% | 221 -6% | 217 -4% | 197 5% | 214 ? -3% | 259 ? -25% |
* ... menor é melhor
Energy consumption during The Witcher 3 / Stress test
Energy consumption with an external monitor
Duração da bateria
O laptop Schenker oferece a melhor vida útil da bateria no campo de comparação - sem surpresa: O laptop tem a maior capacidade de bateria (93 Wh). O equipamento de 15,6 polegadas atinge tempos de execução de 7:26 horas e 7:28 horas em nosso teste Wi-Fi (acessando websites através de um roteiro) e teste de vídeo (curta-metragem Big Buck Bunny (codificação H.264, Full HD) rodando em loop), respectivamente. Os recursos de economia de energia do laptop são desativados durante ambos os testes, e o brilho da tela é ajustado para cerca de 150 cd/m². Além disso, os módulos sem fio são desabilitados para o teste de vídeo
| Schenker XMG Fusion 15 (Mid 22) i7-11800H, GeForce RTX 3070 Laptop GPU, 93.48 Wh | Asus TUF Dash F15 FX517ZR i7-12650H, GeForce RTX 3070 Laptop GPU, 76 Wh | Acer Nitro 5 AN515-58-72QR i7-12700H, GeForce RTX 3070 Ti Laptop GPU, 57.5 Wh | HP Omen 16-b1090ng i7-12700H, GeForce RTX 3070 Ti Laptop GPU, 83 Wh | MSI Delta 15 A5EFK R9 5900HX, Radeon RX 6700M, 82 Wh | Razer Blade 15 Base Edition 2021, i7-10750H RTX 3060 i7-10750H, GeForce RTX 3060 Laptop GPU, 65 Wh | Média da turma Gaming | |
|---|---|---|---|---|---|---|---|
| Duração da bateria | -8% | -45% | -18% | -11% | -34% | -14% | |
| Reader / Idle (h) | 15.5 | 10.8 -30% | 5.7 -63% | 10.1 -35% | 11.1 -28% | 7.8 -50% | 8.27 ? -47% |
| H.264 (h) | 7.5 | 5.8 -23% | 4.7 -37% | 8.32 ? 11% | |||
| WiFi v1.3 (h) | 7.4 | 7 -5% | 3.9 -47% | 5.6 -24% | 7.9 7% | 4.8 -35% | 7.11 ? -4% |
| Load (h) | 1.8 | 2.3 28% | 1.2 -33% | 1.9 6% | 1.6 -11% | 1.5 -17% | 1.502 ? -17% |
Pro
Contra
Veredicto - Compacto e poderoso
Renderização e jogos estão entre as principais competências deste laptop compacto e leve. Os jogos de QHD são possíveis em configurações de alto a máximo. Seu foco não está no desempenho máximo, mas em um compromisso entre desempenho e portabilidade.
Com o XMG Fusion 15 (Mid 22), a Schenker fornece um laptop compacto para jogos completamente realizado. No entanto, ele não receberá nenhum ponto de estilo.
O Núcleo i7-11800H e o GeForce RTX 3070 pode funcionar a taxas de relógio consistentemente altas. Dependendo das configurações, as taxas de desempenho da GPU variam em ou acima da média RTX 3070. O laptop aquece muito fortemente sob carga, e o desenvolvimento de ruídos atinge o nível de classe habitual. O dispositivo pode operar silenciosamente no uso diário.
Uma bateria de 93 Wh garante tempos de execução práticos de cerca de 7:30 horas - uma taxa bastante boa. Pena: A bateria não pode ser carregada através da porta USB-C (Thunderbolt 4). Este teria sido um recurso muito útil, especialmente para um dispositivo que foi projetado para mobilidade. Entretanto, a porta Thunderbolt 4 abre opções de expansão na forma de uma solução de acoplamento ou uma GPU externa.
O teclado mecânico (com iluminação de fundo de uma tecla RGB) deixou uma boa impressão, e é provável que seja um critério importante para muitos compradores potenciais. A tela mate QHD (15,6 polegadas, IPS, 165 Hz) não sofre de nenhuma fraqueza importante, mas também não é uma tela superior. O painel marca pontos com boa reprodução de cores, cobertura de espaço de cores muito decente e tempos de resposta rápidos.
Uma alternativa para o Fusion seria o Asus TUF Dash F15 FX517ZRque também é leve e compacto. O laptop oferece melhor cobertura de espaço de cores, Adaptive Sync, um modo dGPU e Power Delivery. O desempenho da GPU está ligeiramente atrás do do Fusion 15, no entanto.
Preço e disponibilidade
O Schenker XMG Fusion 15 (meados de 2022) pode ser personalizado em . Loja online da Schenker. A variante de configuração fornecida a nós (Core i7-11800H, GeForce RTX 3070 Laptop, 32 GB RAM, 1 TB SSD, display QHD) está disponível por pouco menos de 2.000 Euros (~$1.991). Os modelos de entrada estão disponíveis a partir de cerca de 1.500 Euros (~$1.493).
Dica: Na hora de escrever, a loja online oferece um desconto de 150 Euros (~$149) em cada configuração do Fusion. O desconto é aplicado no carrinho de compras.
Schenker XMG Fusion 15 (Mid 22)
- 08/21/2022 v7 (old)
Sascha Mölck
Price comparison

