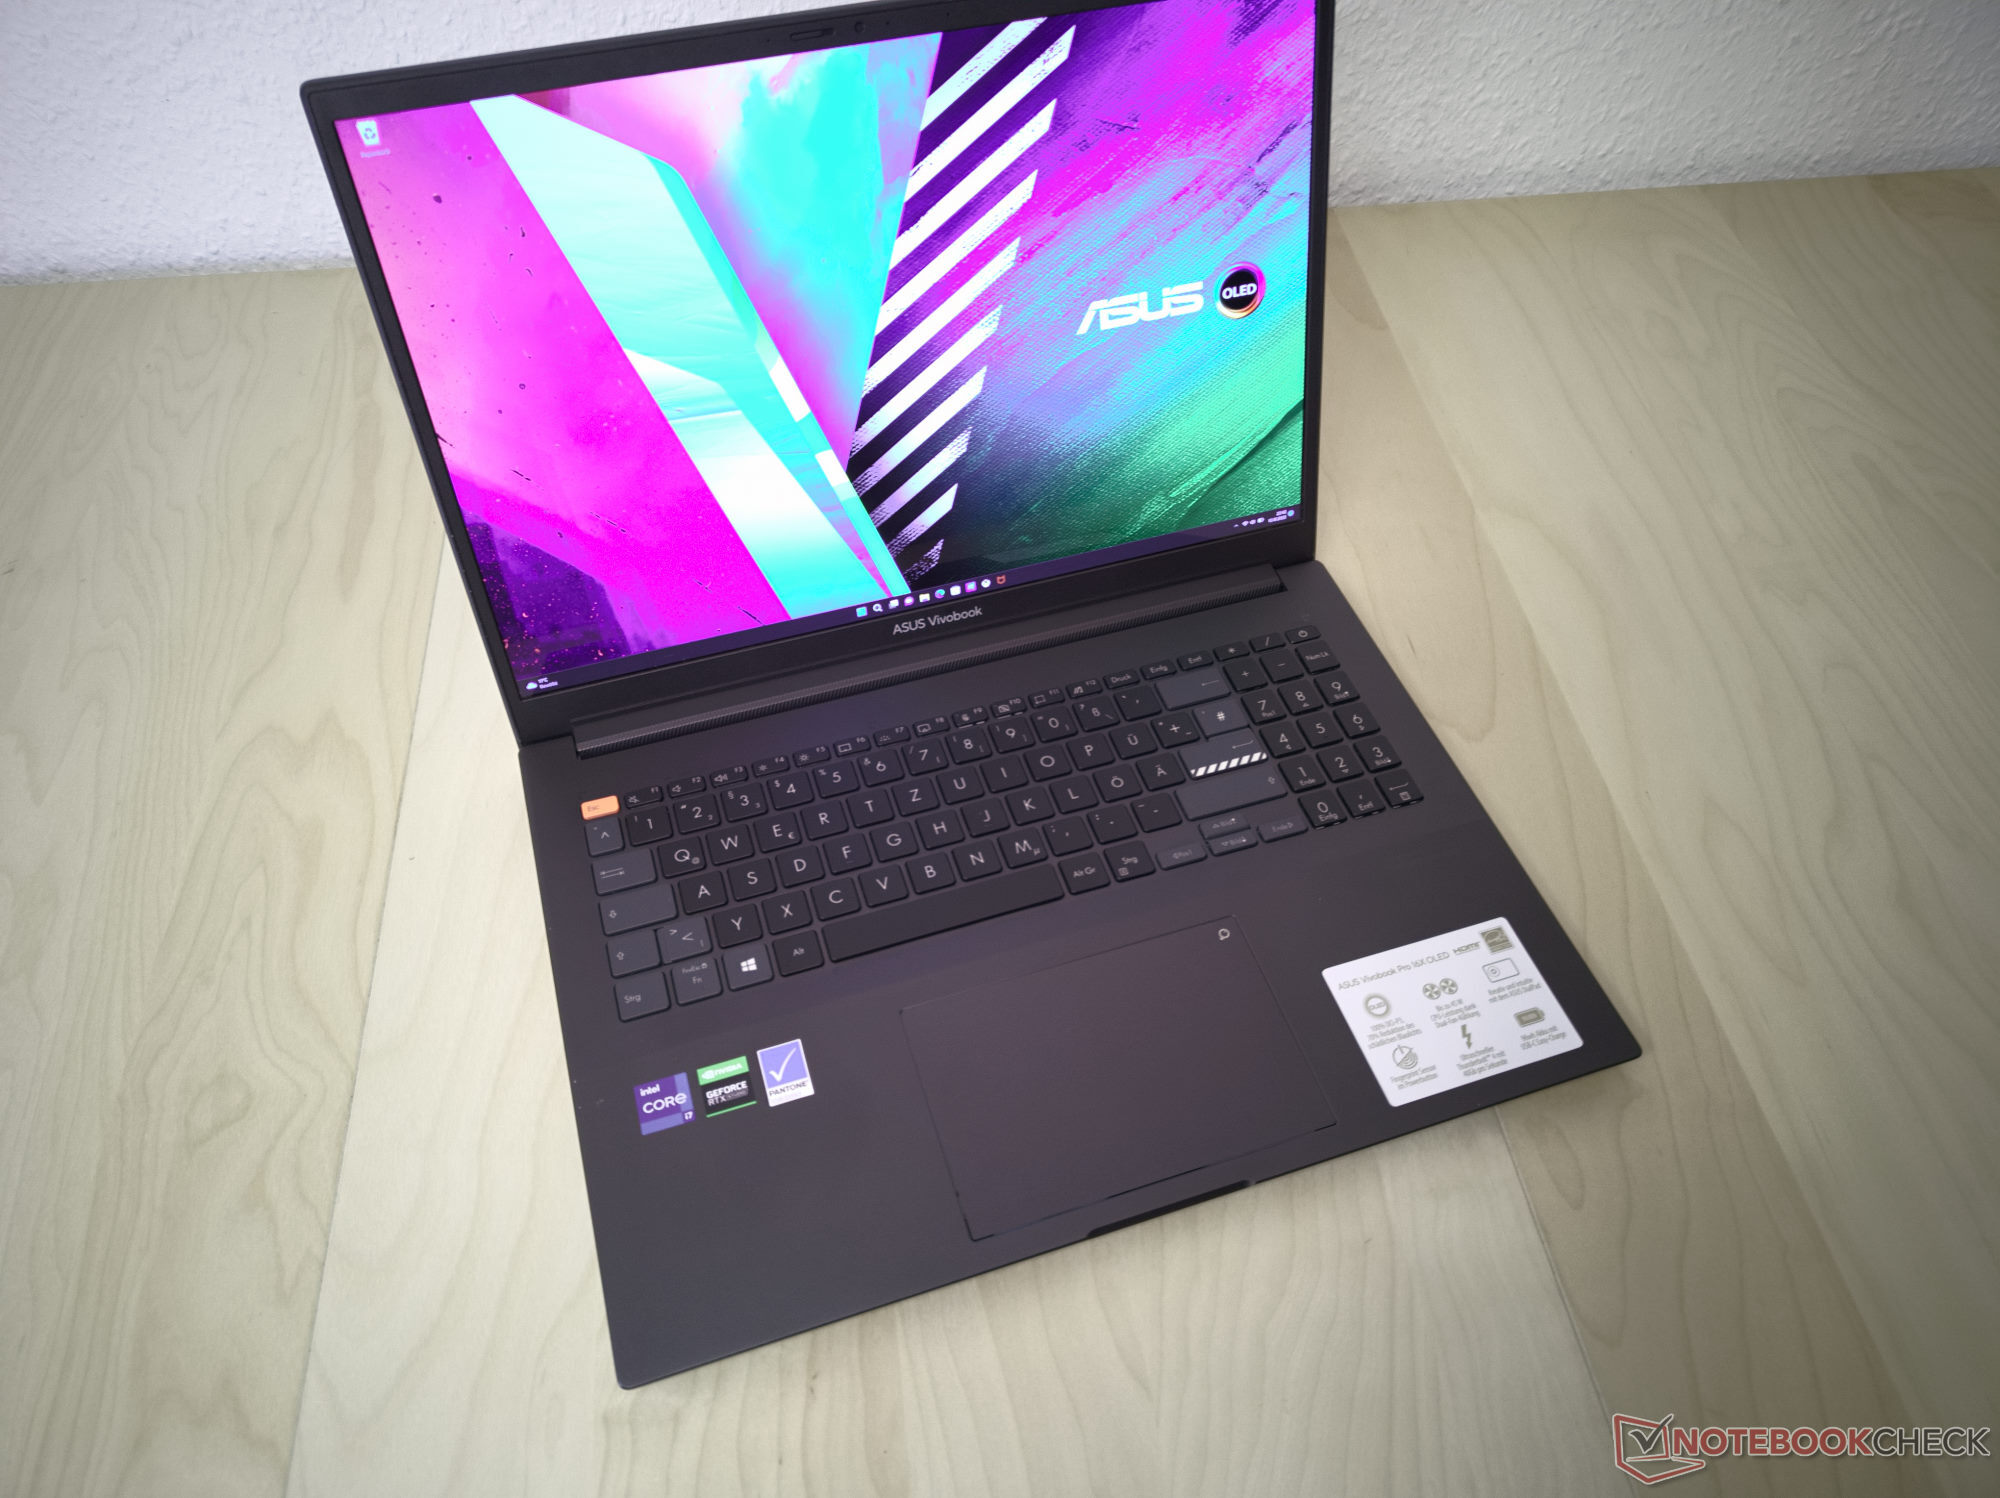
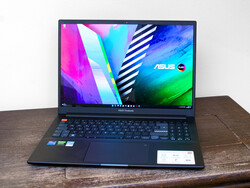
Asus Vivobook Pro 16X Laptop em revisão: Sistema Asus com um visor OLED topo de linha

Considerando suas características, o Asus Vivobook Pro 16X parece estar voltado para os criadores. Ele é equipado com um excelente visor OLED 16:10 e alcança bons resultados em vários pontos de referência. Isto é realizado com um Intel Core i7-11370H da última geração e um Nvidia GeForce RTX 3050. Alternativamente, o Vivobook Pro 16X também está disponível em várias outras configurações, que incluem os mais recentes processadores AMD ou Intel e várias opções de GPU Nvidia.
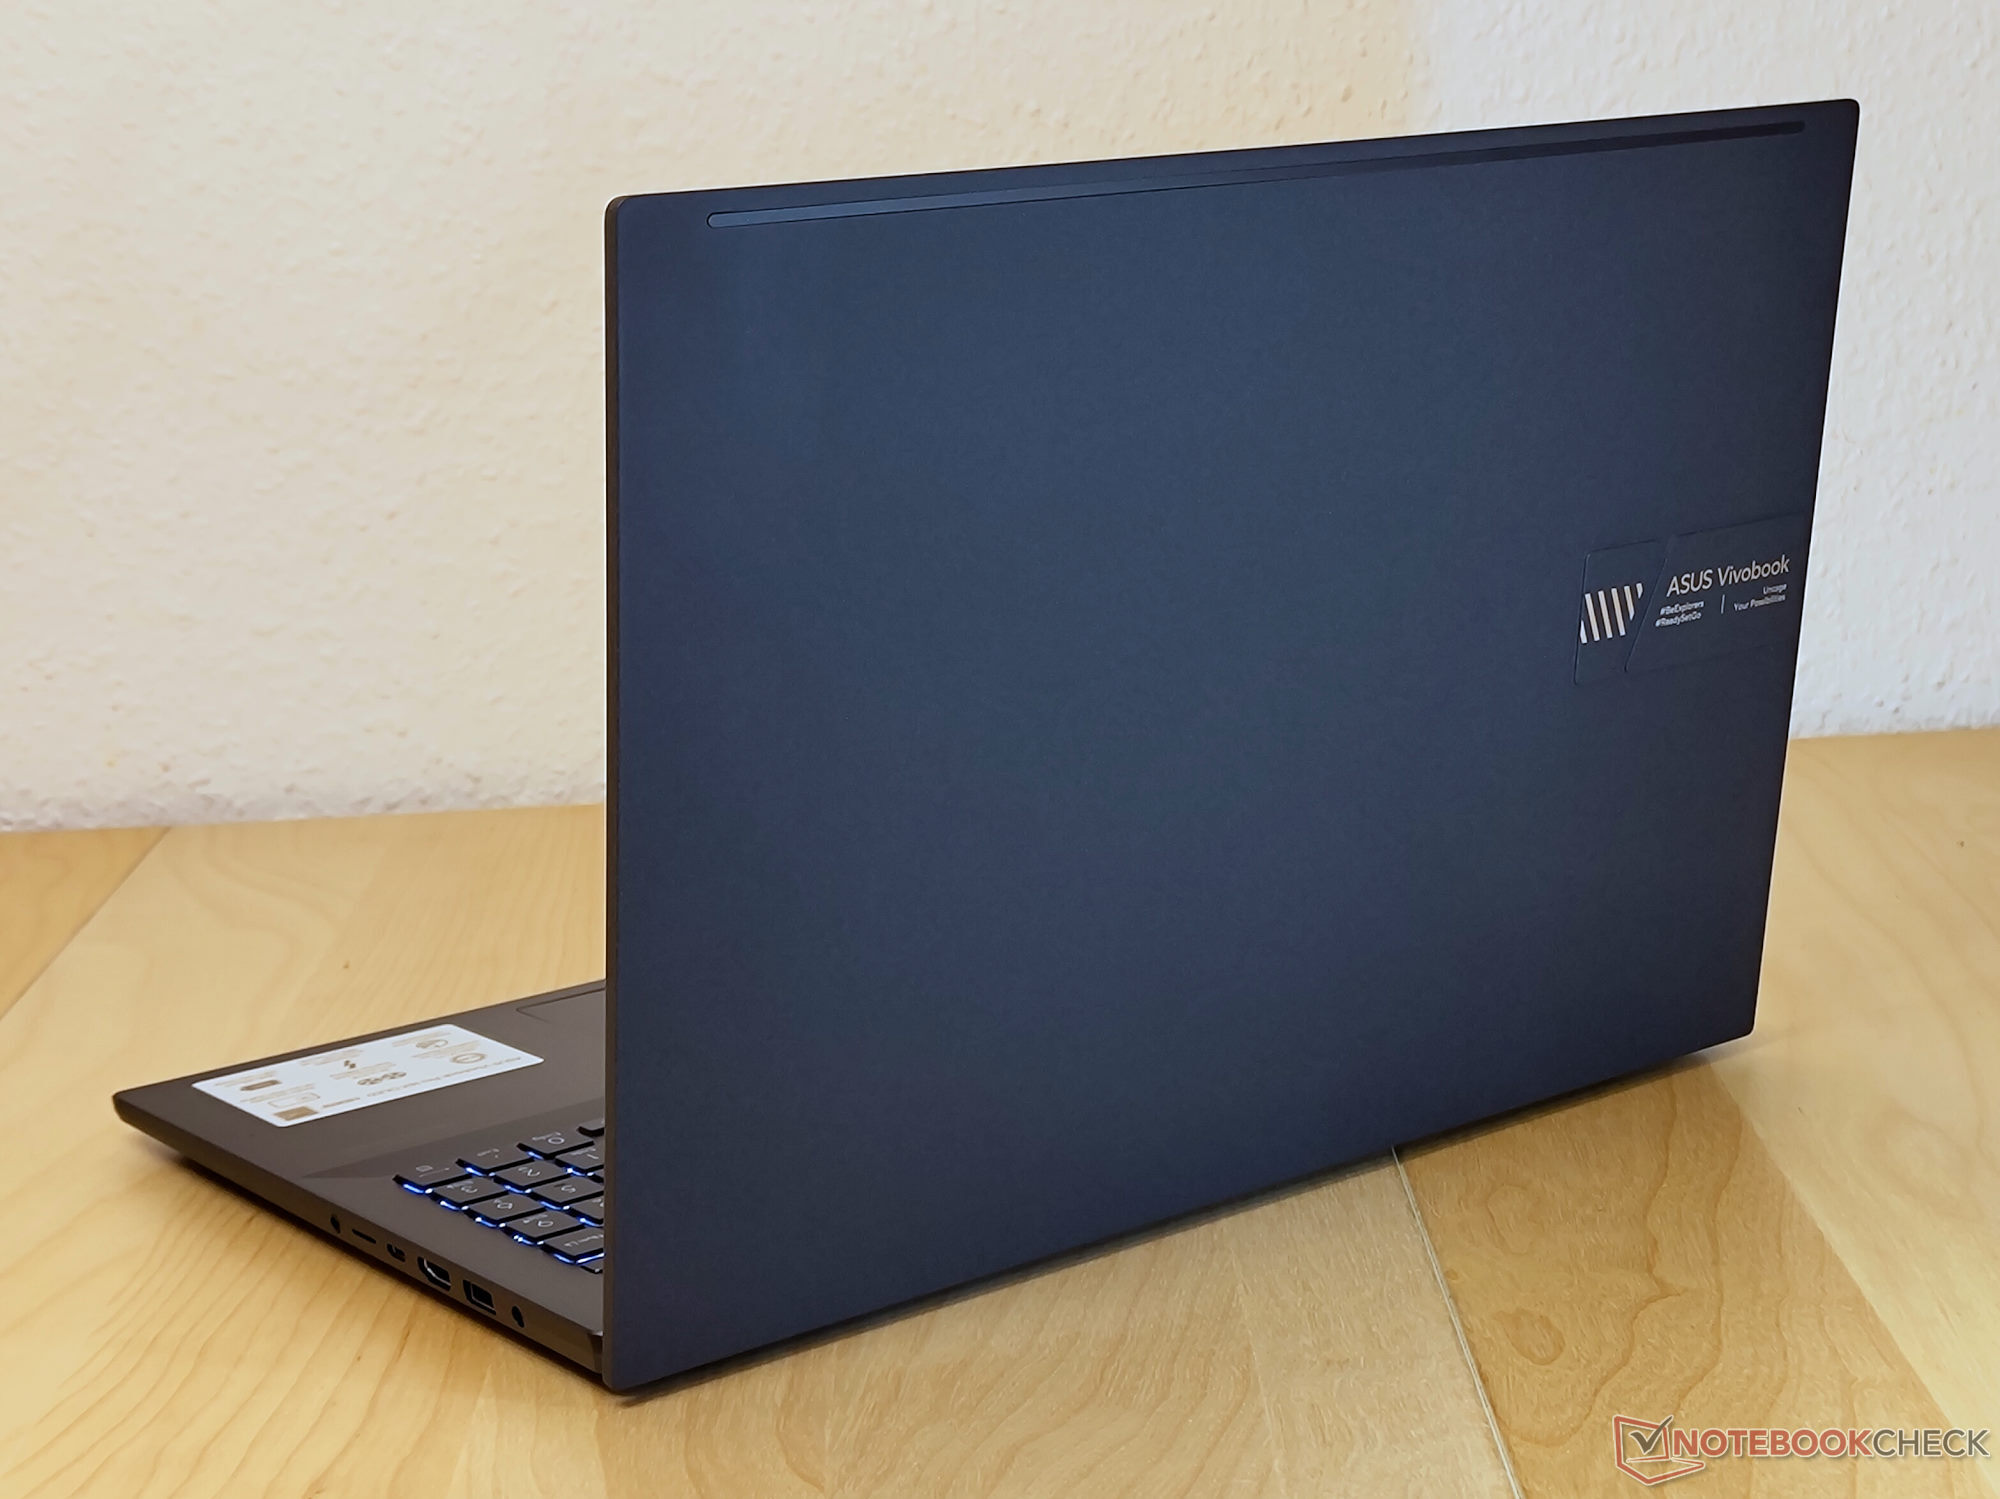
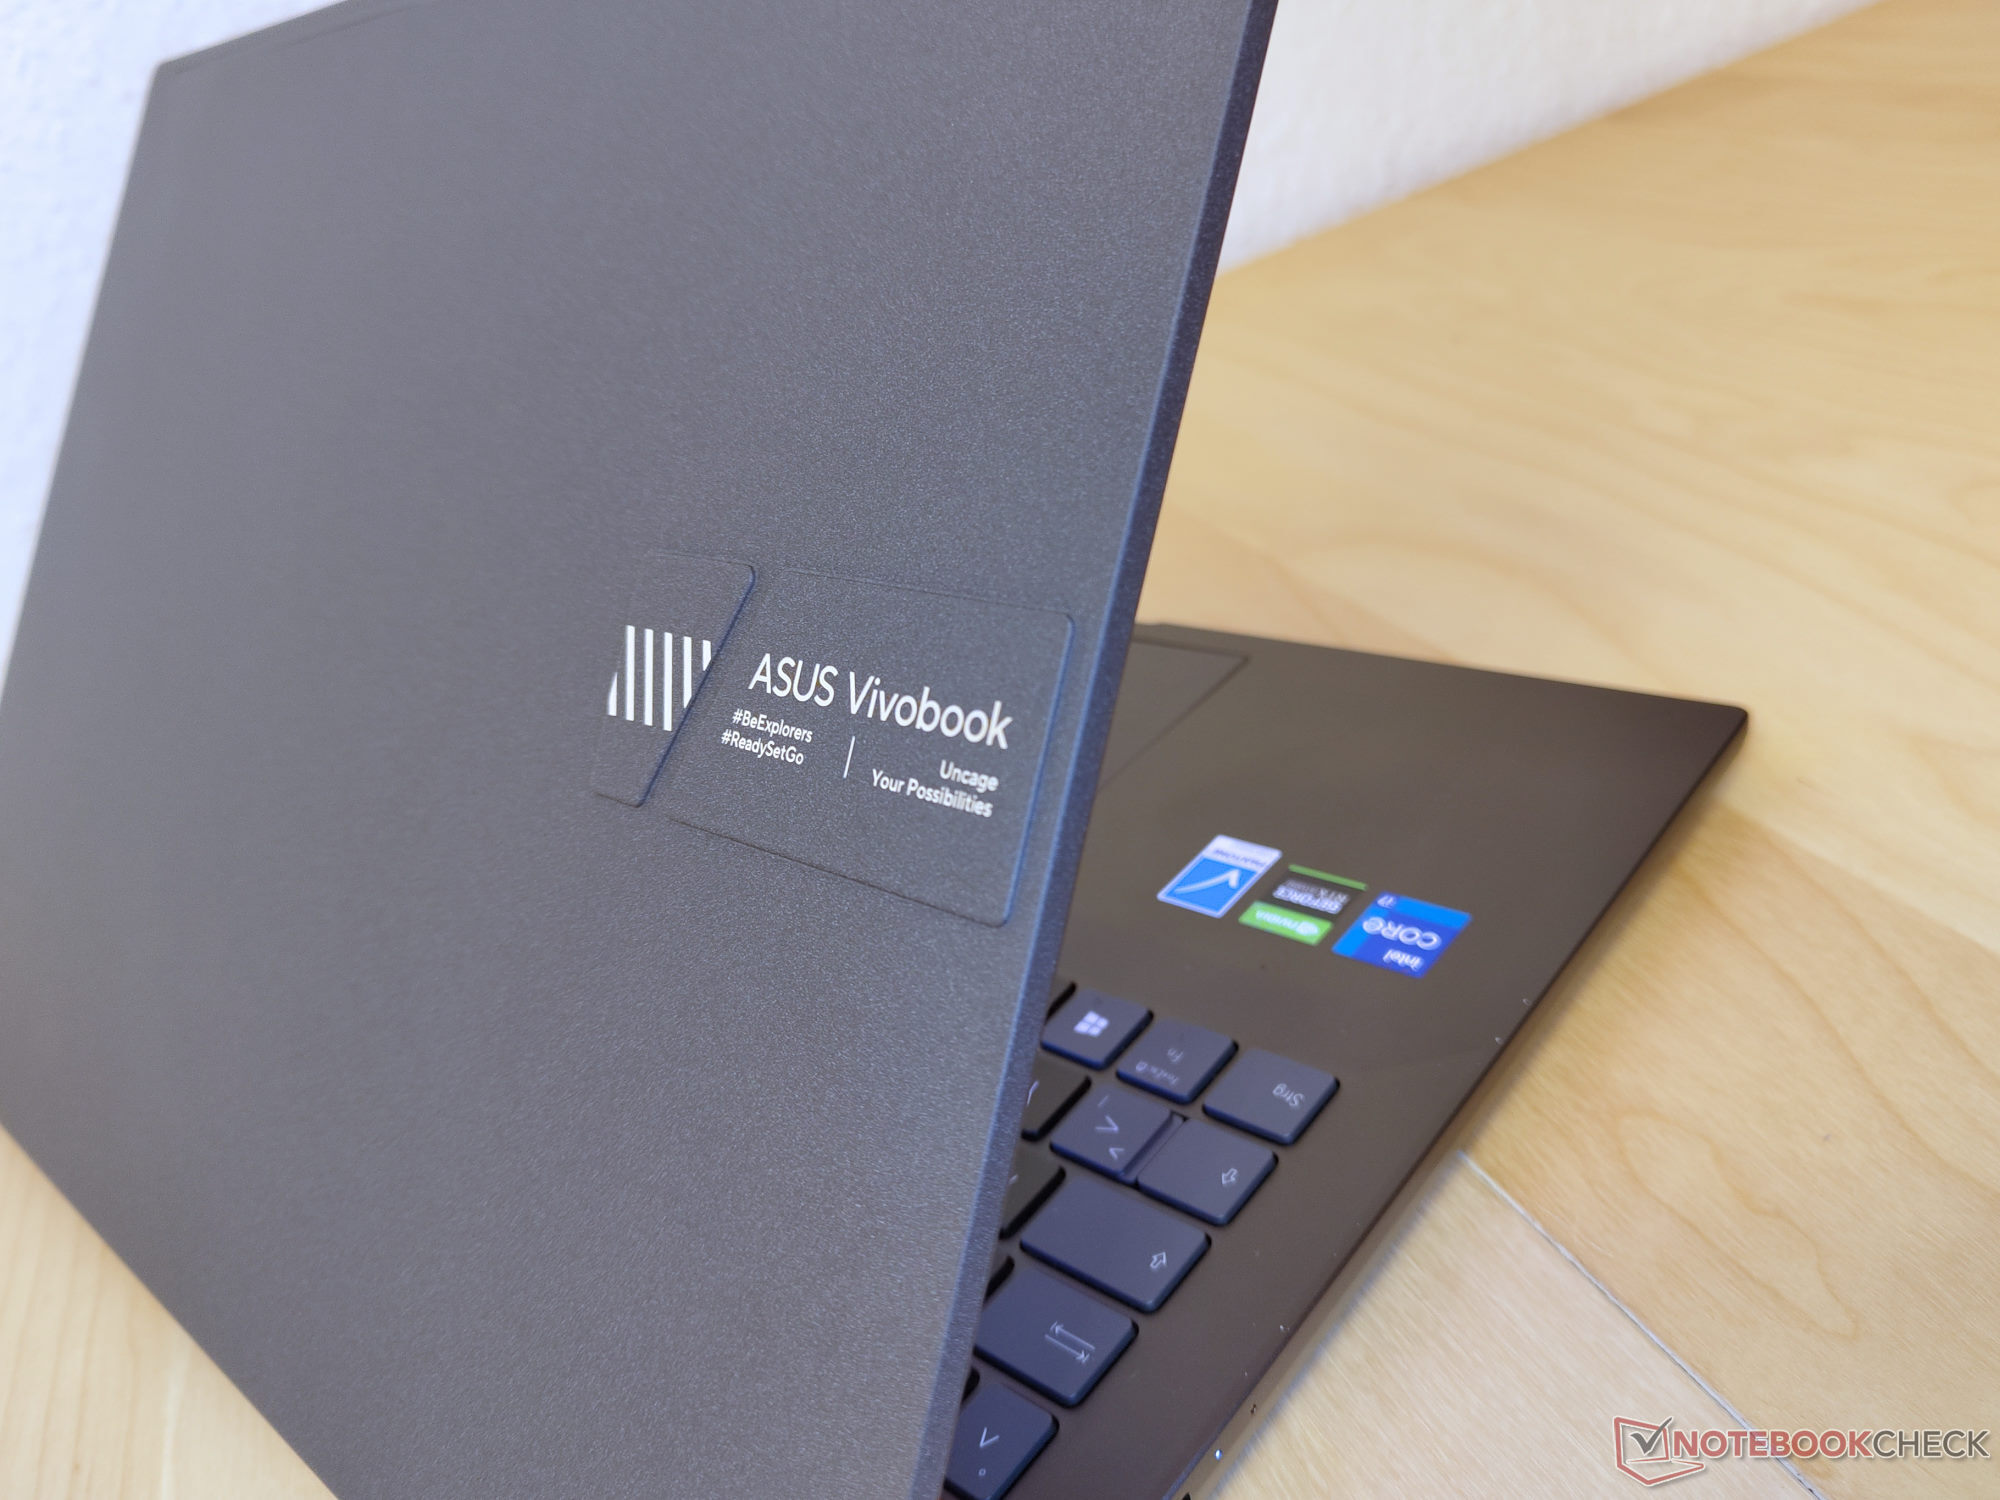
A apresentação visual do laptop se beneficia do uso generoso do alumínio. Graças ao seu acabamento em tecido, a tampa é particularmente resistente a arranhões e graxa.
Como o laptop multimídia está equipado com componentes poderosos, selecionamos laptops de várias categorias para nossa comparação. Por exemplo, tanto o mais barato Dell Inspiron 16 Plus 7610 e o significativamente mais caro ThinkPad X1 Extreme G4 são muito semelhantes em termos de características. Independentemente disso, o Vivobook é capaz de se diferenciar da concorrência devido a sua excelente tela OLED.
Possíveis concorrentes em comparação
Avaliação | Data | Modelo | Peso | Altura | Size | Resolução | Preço |
|---|---|---|---|---|---|---|---|
| 83.7 % v7 (old) | 11/2022 | Asus VivoBook Pro 16X OLED N7600PC-L2026X i7-11370H, GeForce RTX 3050 4GB Laptop GPU | 2 kg | 18.9 mm | 16.00" | 3840x2400 | |
| 84.2 % v7 (old) | 10/2022 | MSI Summit E16 Flip A12UDT-031 i7-1280P, GeForce RTX 3050 Ti Laptop GPU | 1.9 kg | 16.85 mm | 16.00" | 2560x1600 | |
| 89 % v7 (old) | 03/2022 | Microsoft Surface Laptop Studio i7 RTX 3050 Ti i7-11370H, GeForce RTX 3050 Ti Laptop GPU | 1.8 kg | 19 mm | 14.40" | 2400x1600 | |
| 86.7 % v7 (old) | 08/2021 | Dell Inspiron 16 Plus 7610 i7-11800H, GeForce RTX 3050 4GB Laptop GPU | 2 kg | 18.99 mm | 16.00" | 3072x1920 | |
| 89 % v7 (old) | 11/2021 | Lenovo ThinkPad X1 Extreme G4-20Y5CTO1WW (3050 Ti) i7-11800H, GeForce RTX 3050 Ti Laptop GPU | 2 kg | 18.2 mm | 16.00" | 3840x2400 | |
| 83.2 % v7 (old) | 09/2021 | Schenker XMG Focus 15 i7-11800H, GeForce RTX 3050 Ti Laptop GPU | 1.9 kg | 22 mm | 15.60" | 1920x1080 |
Estojo - Alumínio Superior, Inferior e Centro
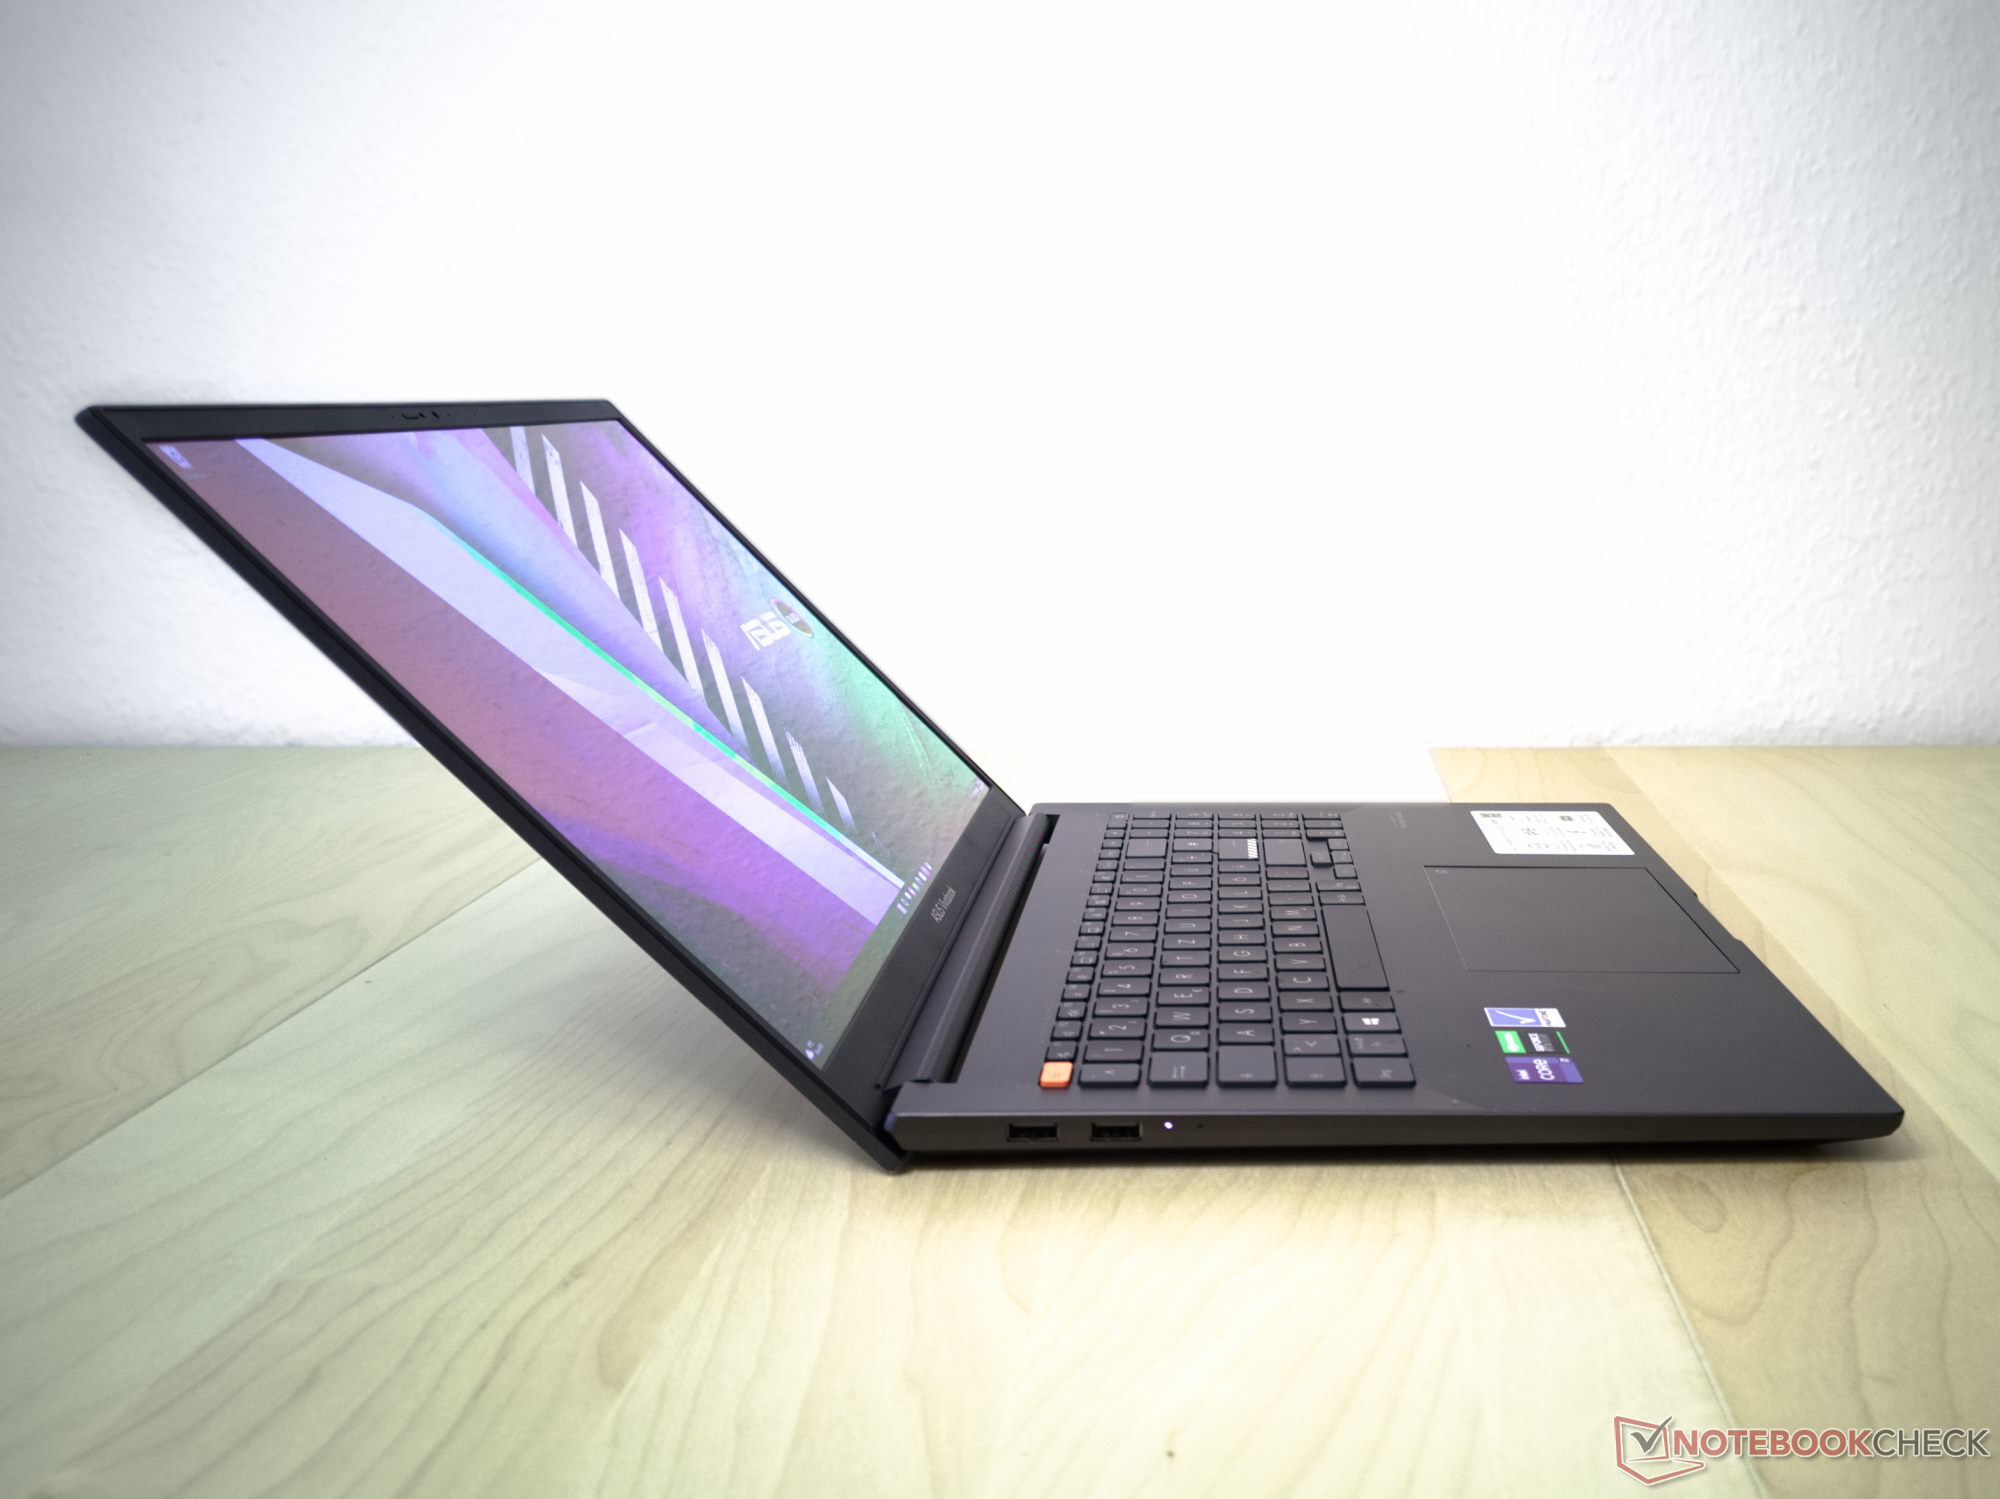
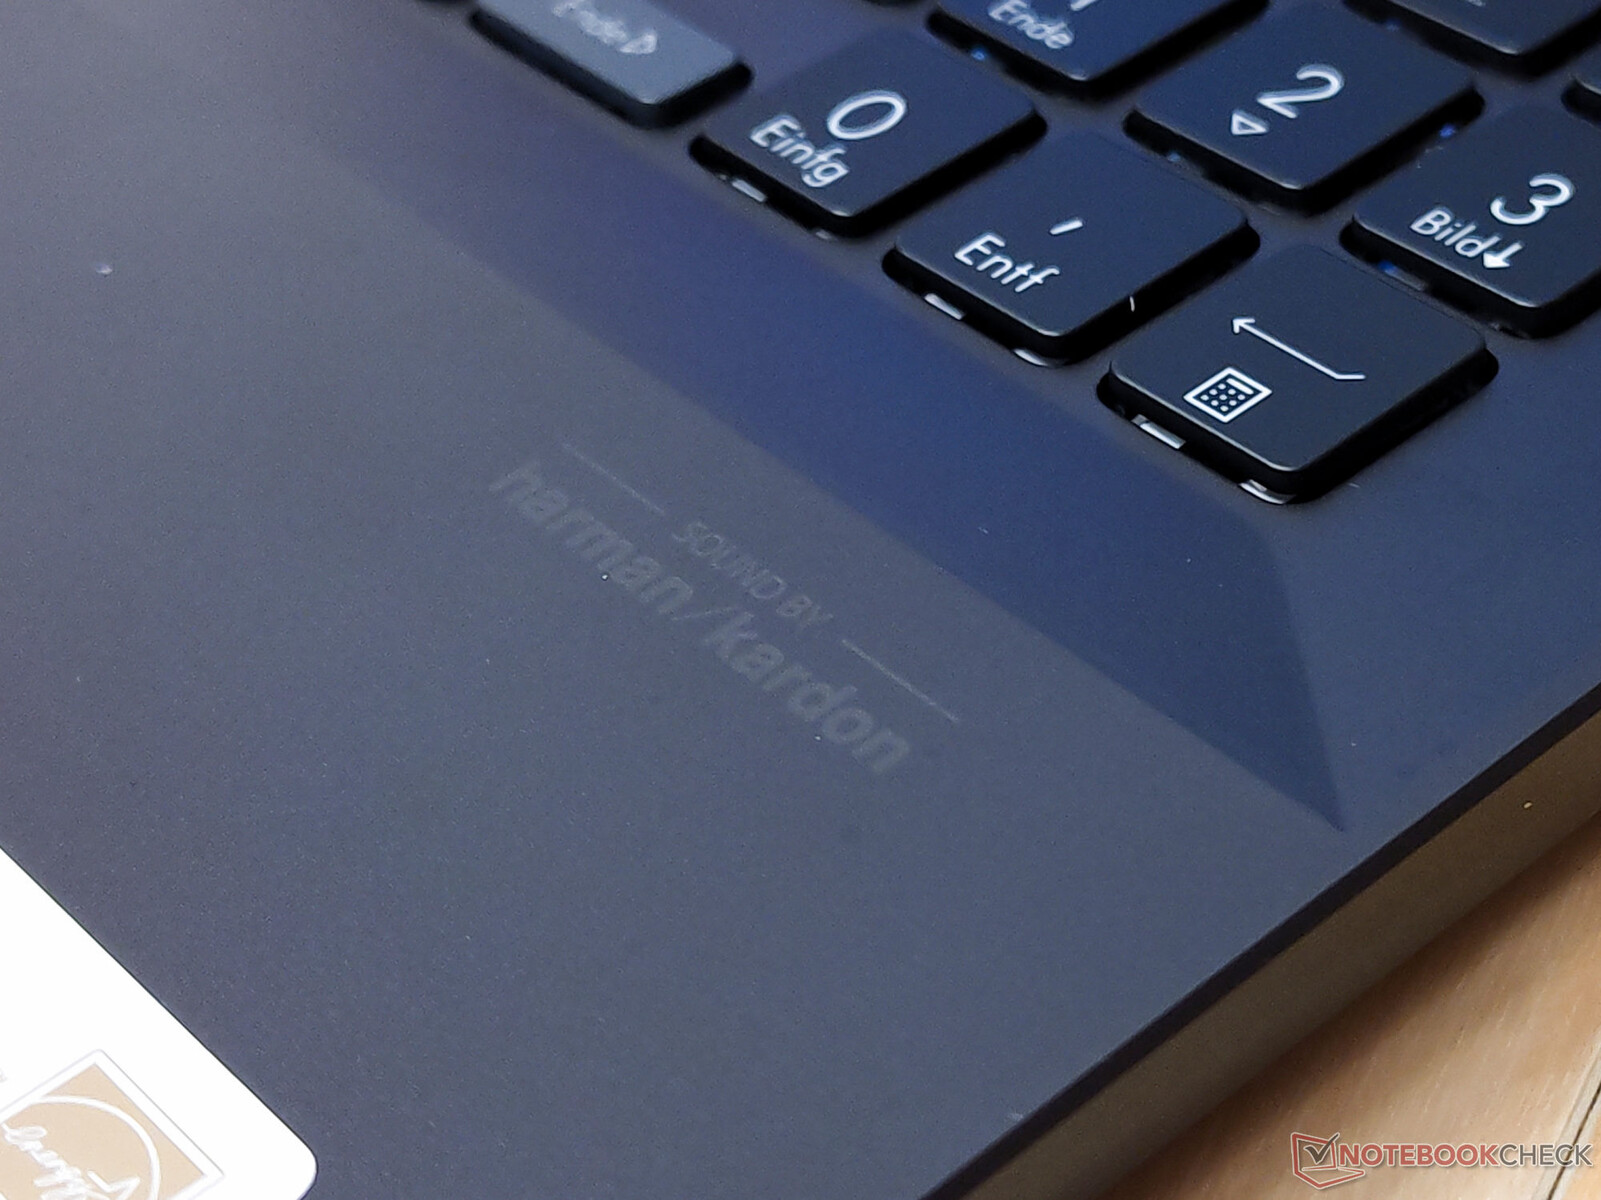
Embora isto possa não ser aparente à primeira vista, quase todo o chassi do Vivobook 16X é composto de alumínio. A unidade base foi pintada em antracite, enquanto um revestimento cinza escuro cobre a tampa. Esta última é fosca, muito robusta, e não atrai graxa. A Asus comercializa isto como revestimento de tecelagem. Dependendo do ângulo em que a luz atinge a superfície, ela pode parecer muito lisa ou muito áspera. Há um logotipo característico do Asus em uma área separada na parte de trás da tampa. O design do laptop multimídia é relativamente simples, caso contrário.
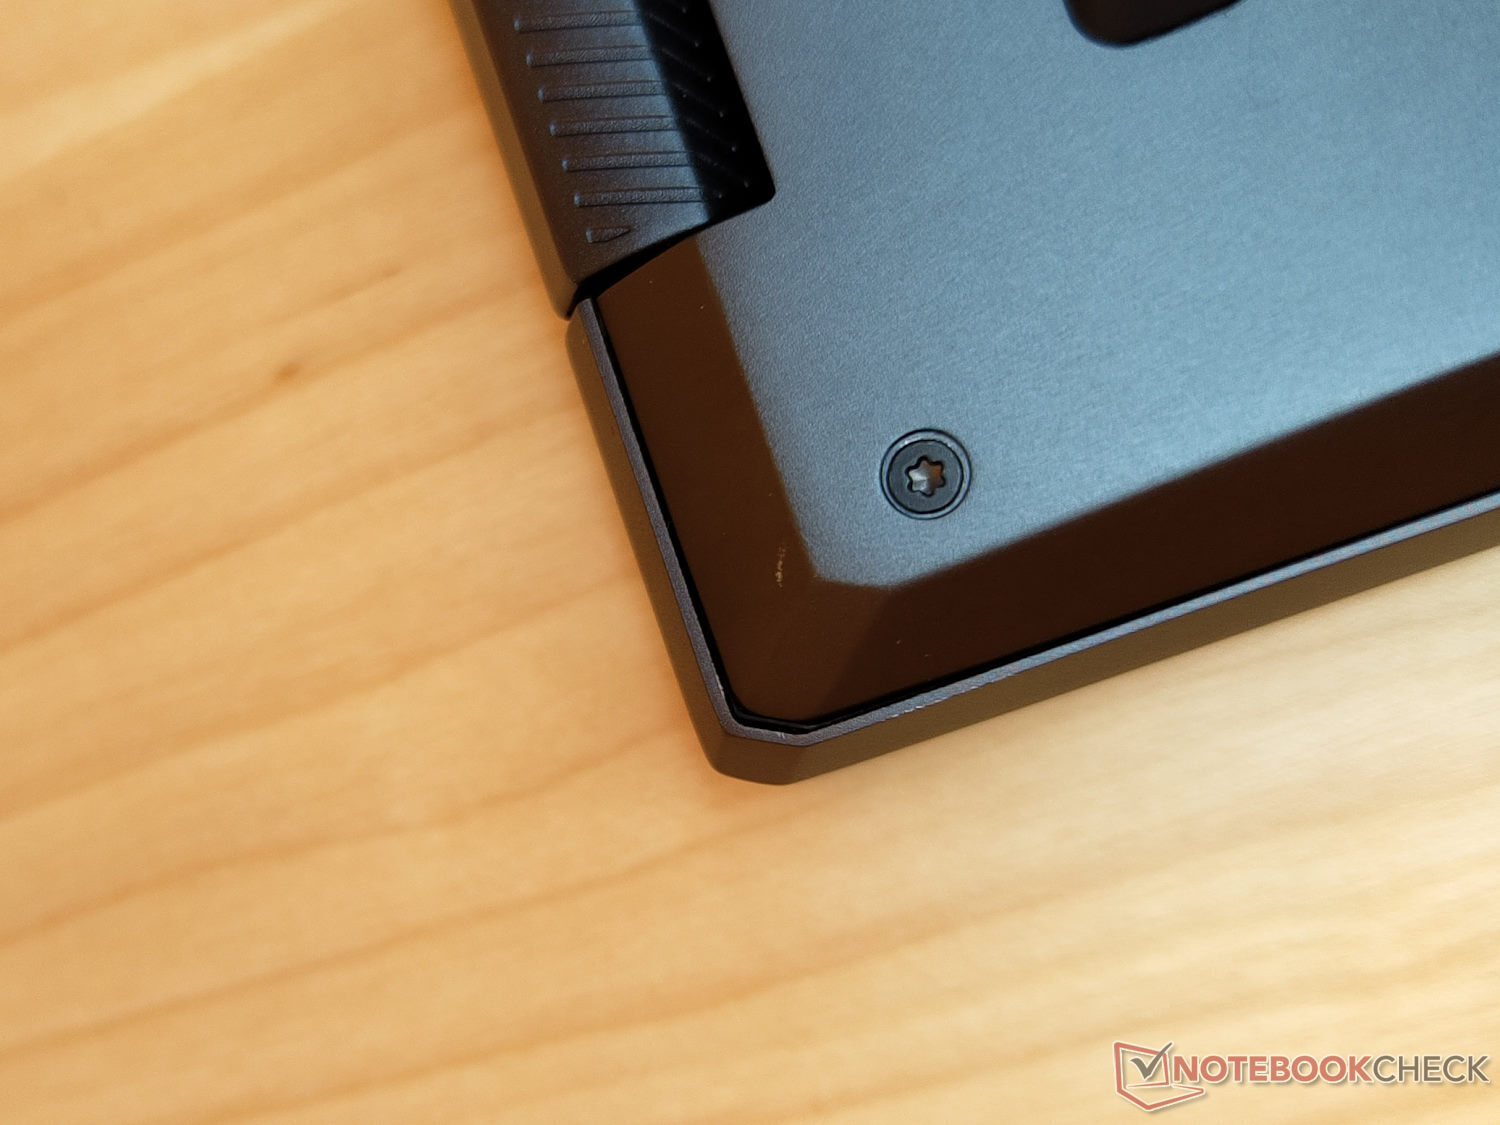
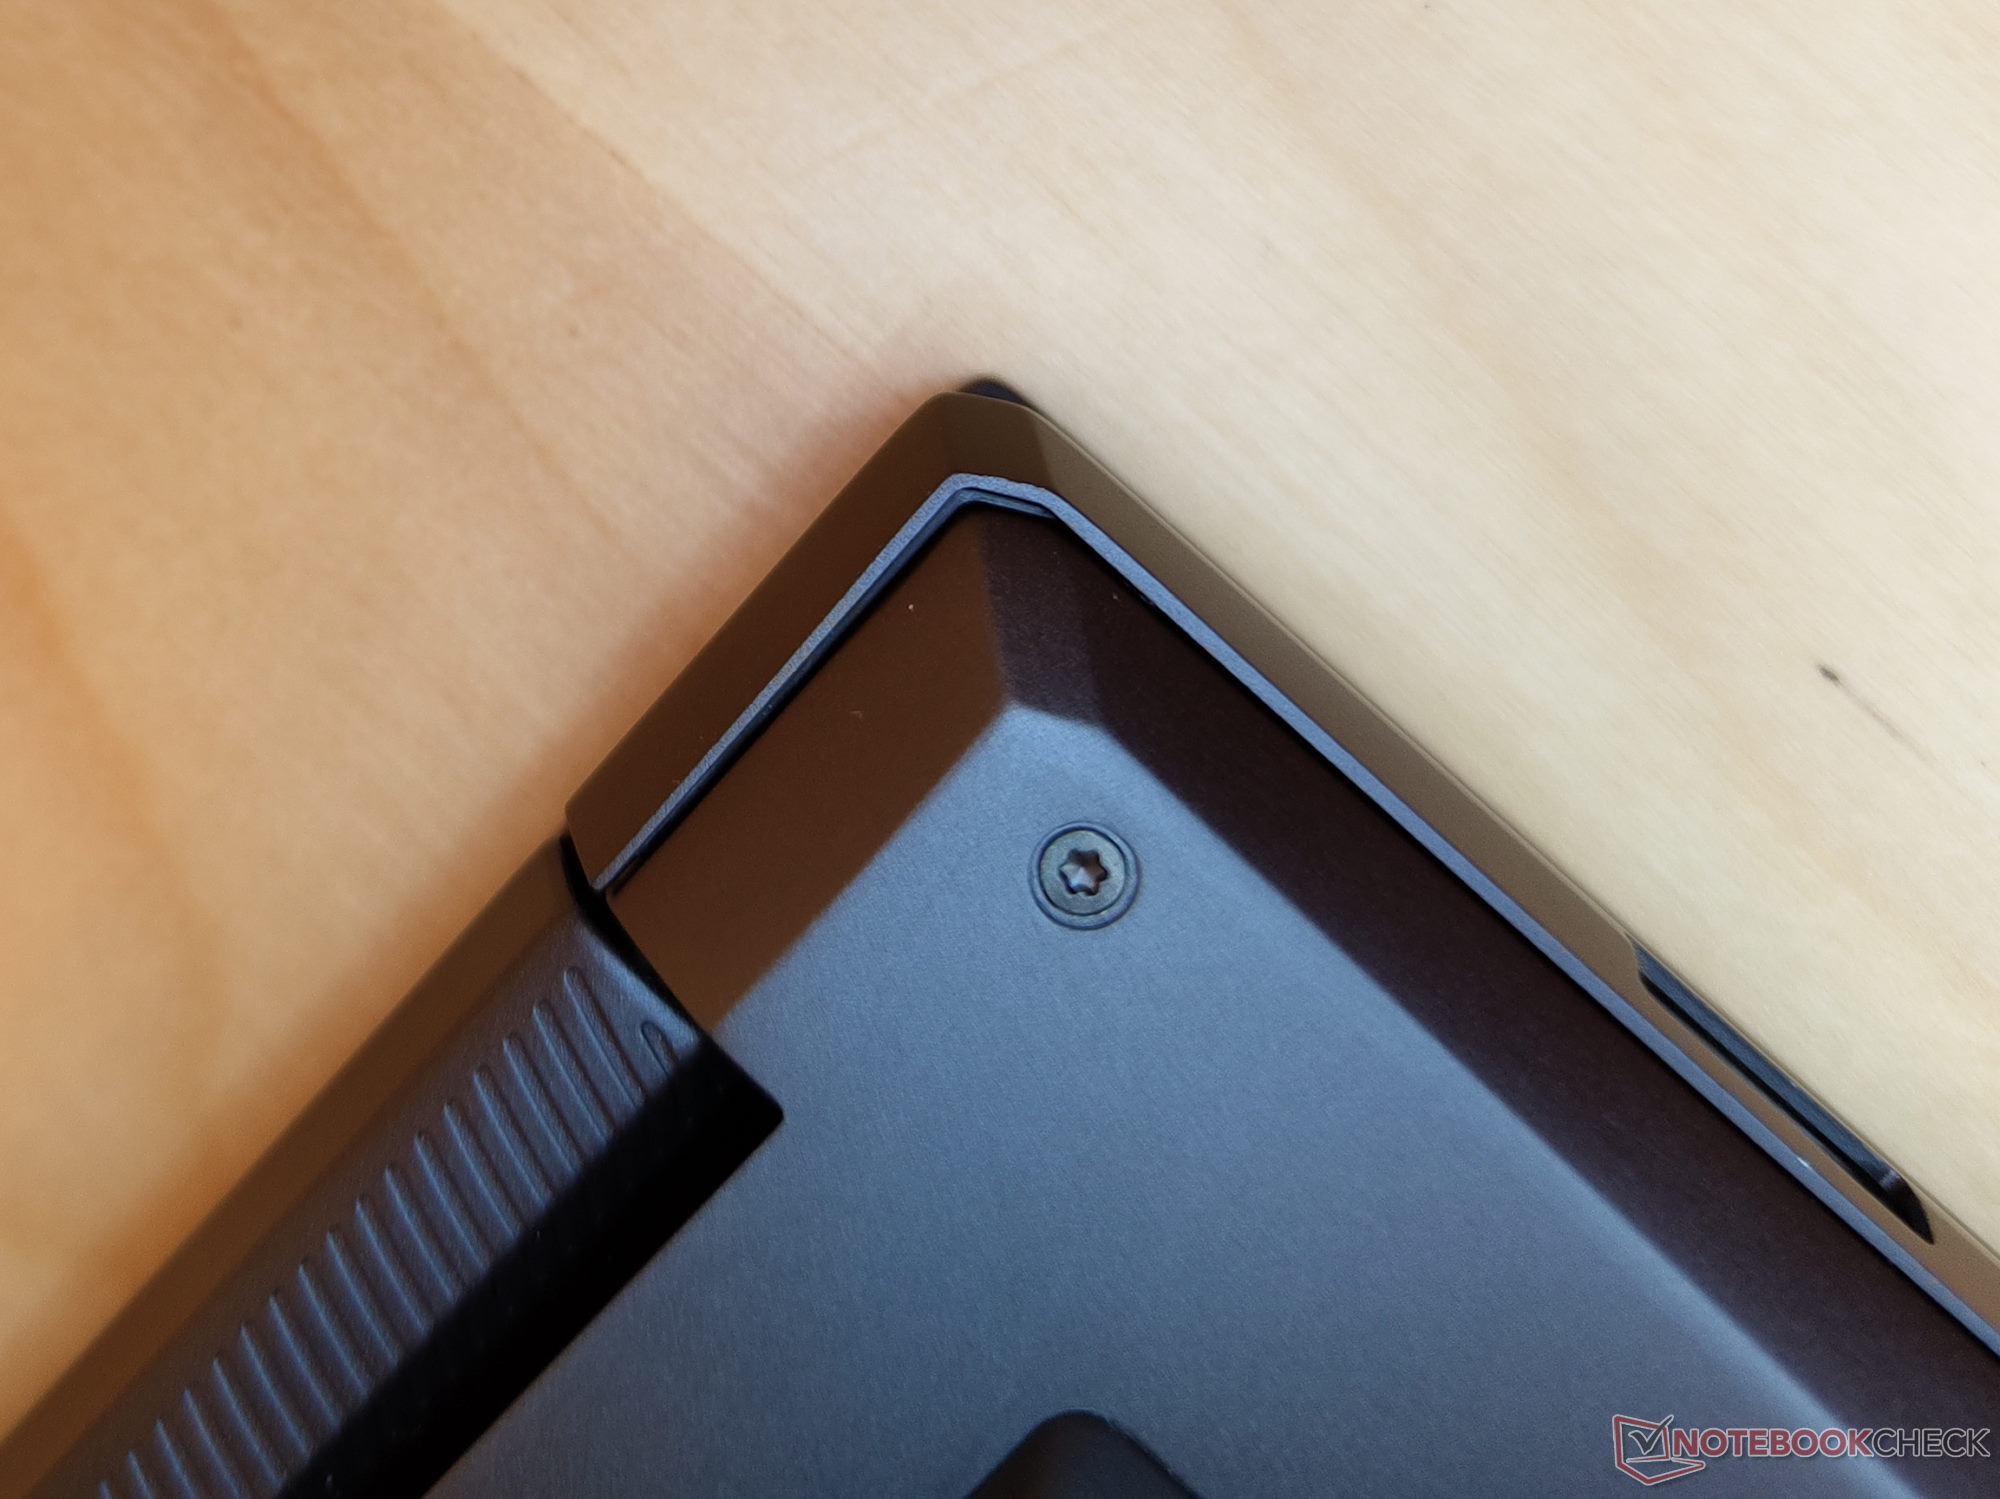
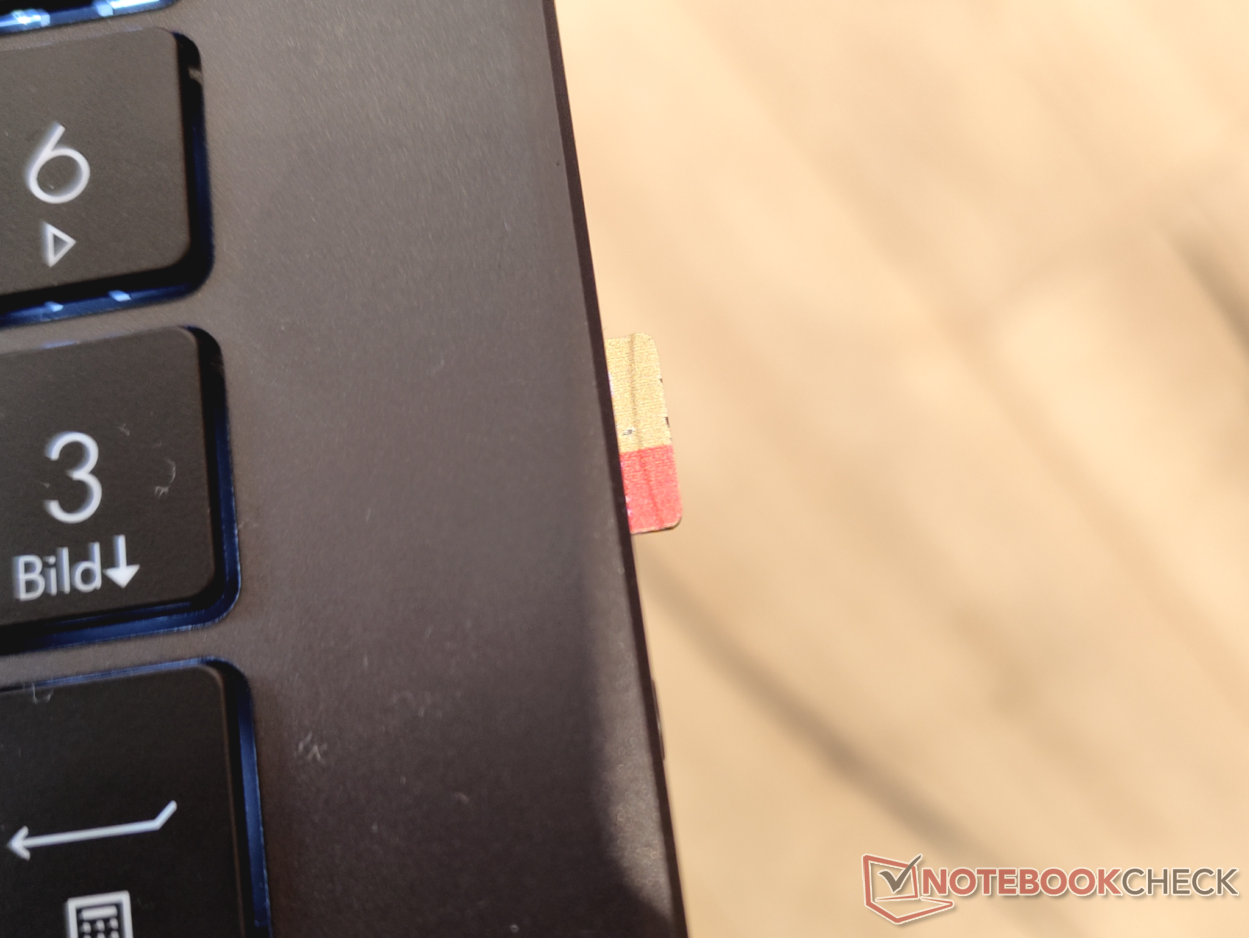
A rigidez do sistema de 16 polegadas se beneficia visivelmente do uso generoso do metal. Não conseguimos torcer significativamente a unidade base do laptop a partir dos cantos. Embora o mesmo não se aplique à tela, pelo menos não percebemos nenhum rangido. Embora a tampa possa ser aberta até um ângulo máximo de cerca de 130 graus com uma das mãos, não há grandes rangidos. Infelizmente, as folgas não são perfeitas nem mesmo em vários lugares. No canto inferior esquerdo do clickpad, há uma folga que expõe os interiores da caixa. Da mesma forma, há vários pontos com folgas irregulares na parte inferior. Nossa galeria de imagens mostra alguns exemplos das folgas que encontramos. Isto levanta a questão se as folgas maiores se destinam a compensar uma maior expansão térmica ou se as tolerâncias de fabricação são simplesmente muito grandes.
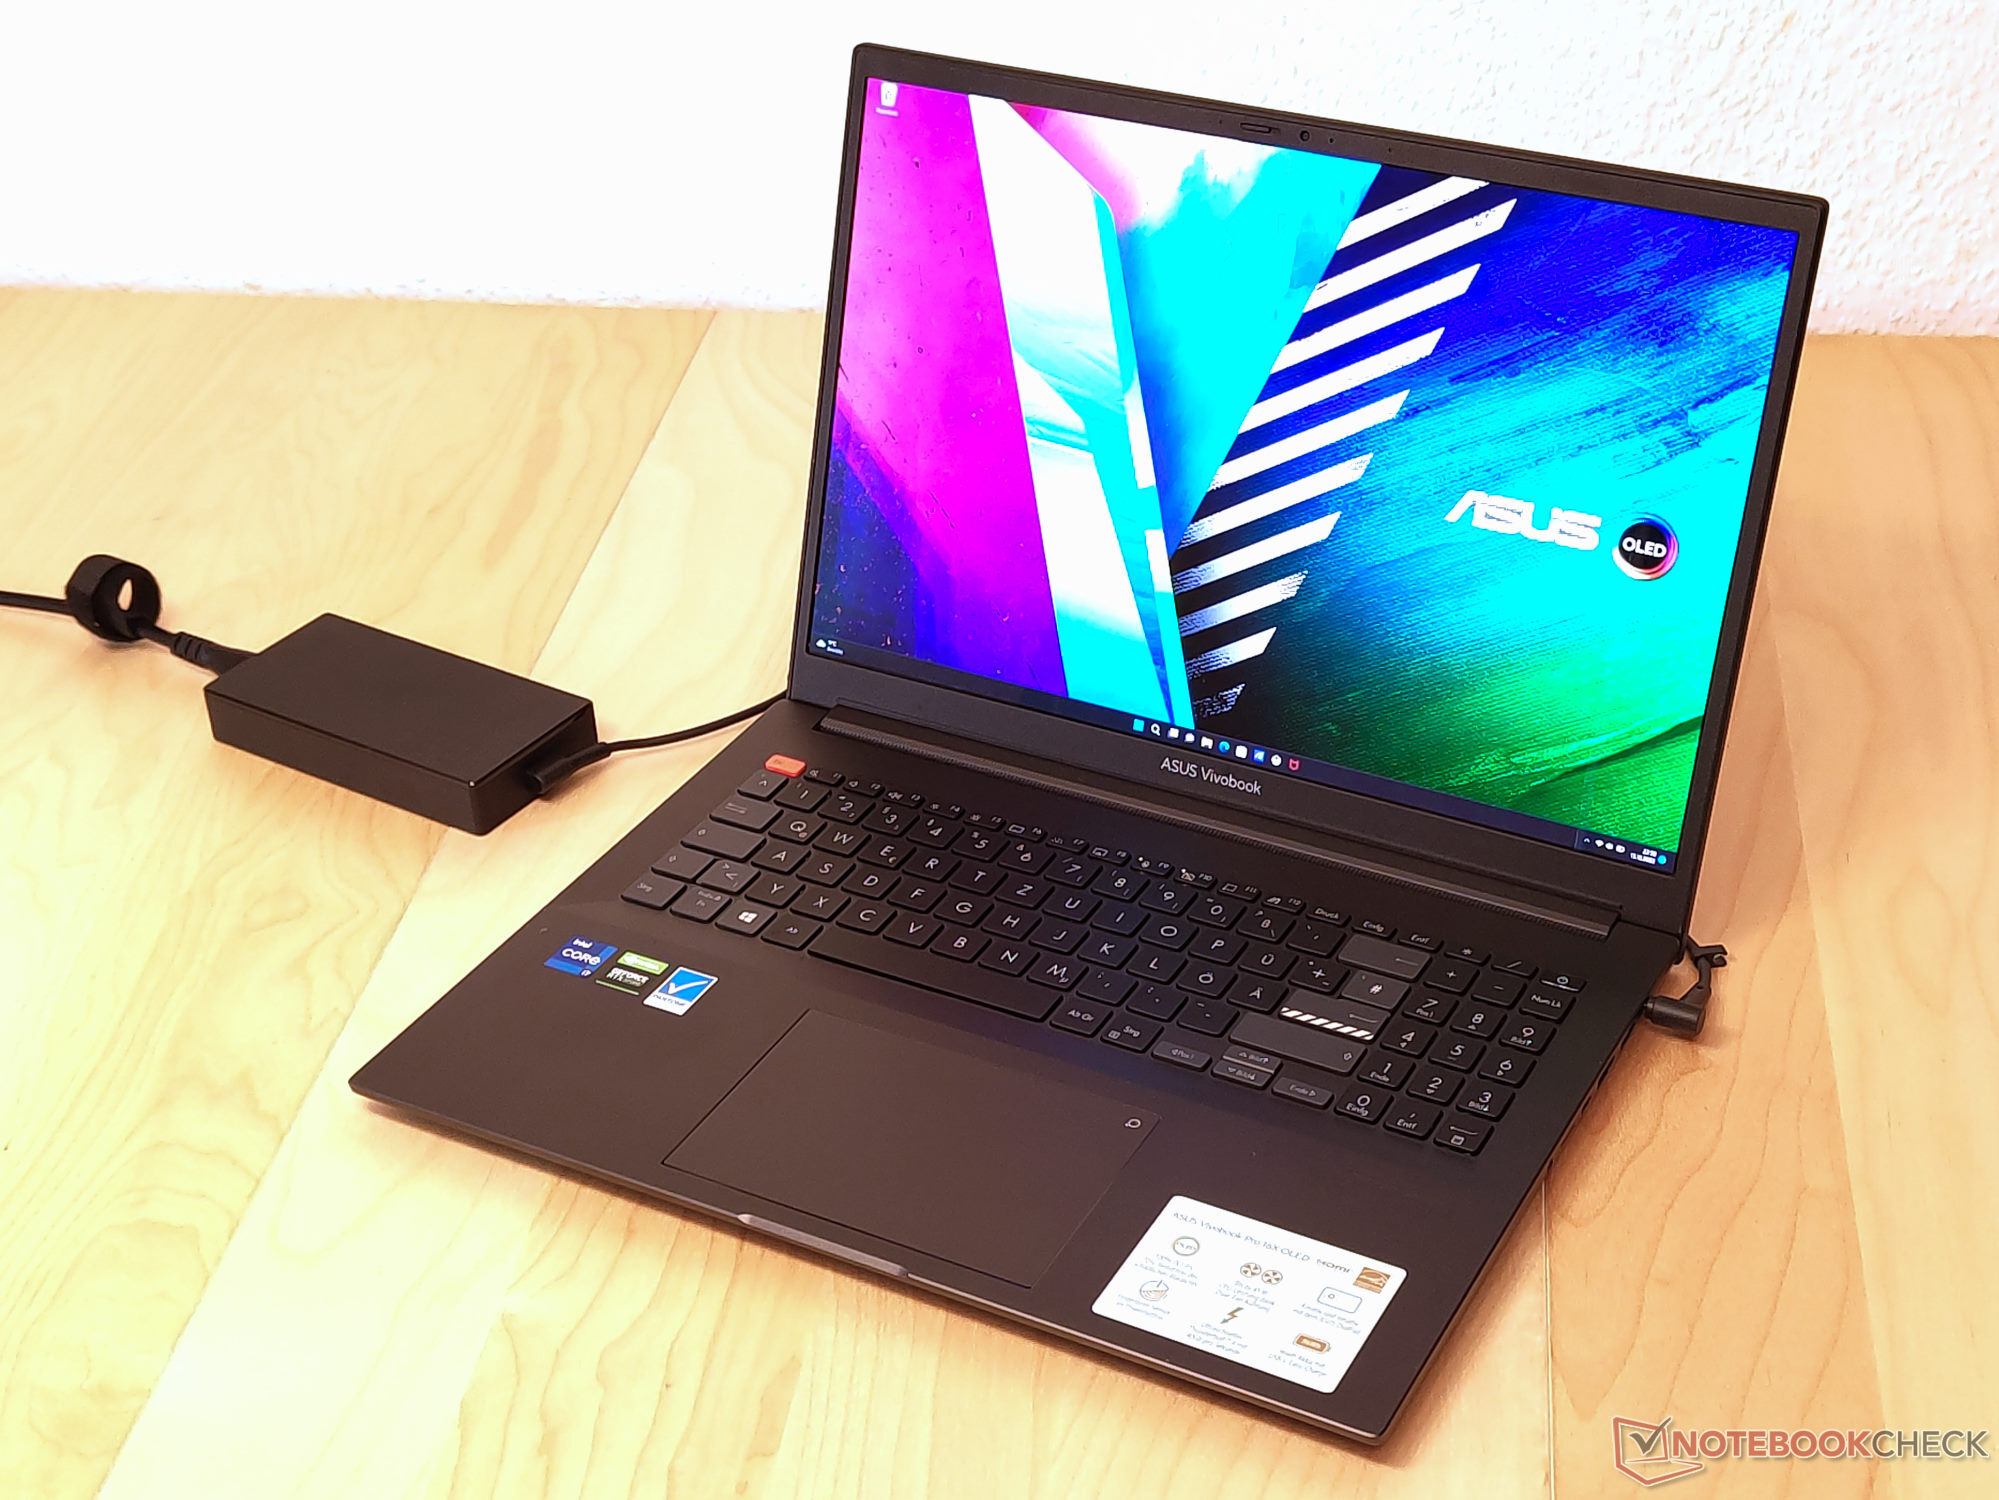
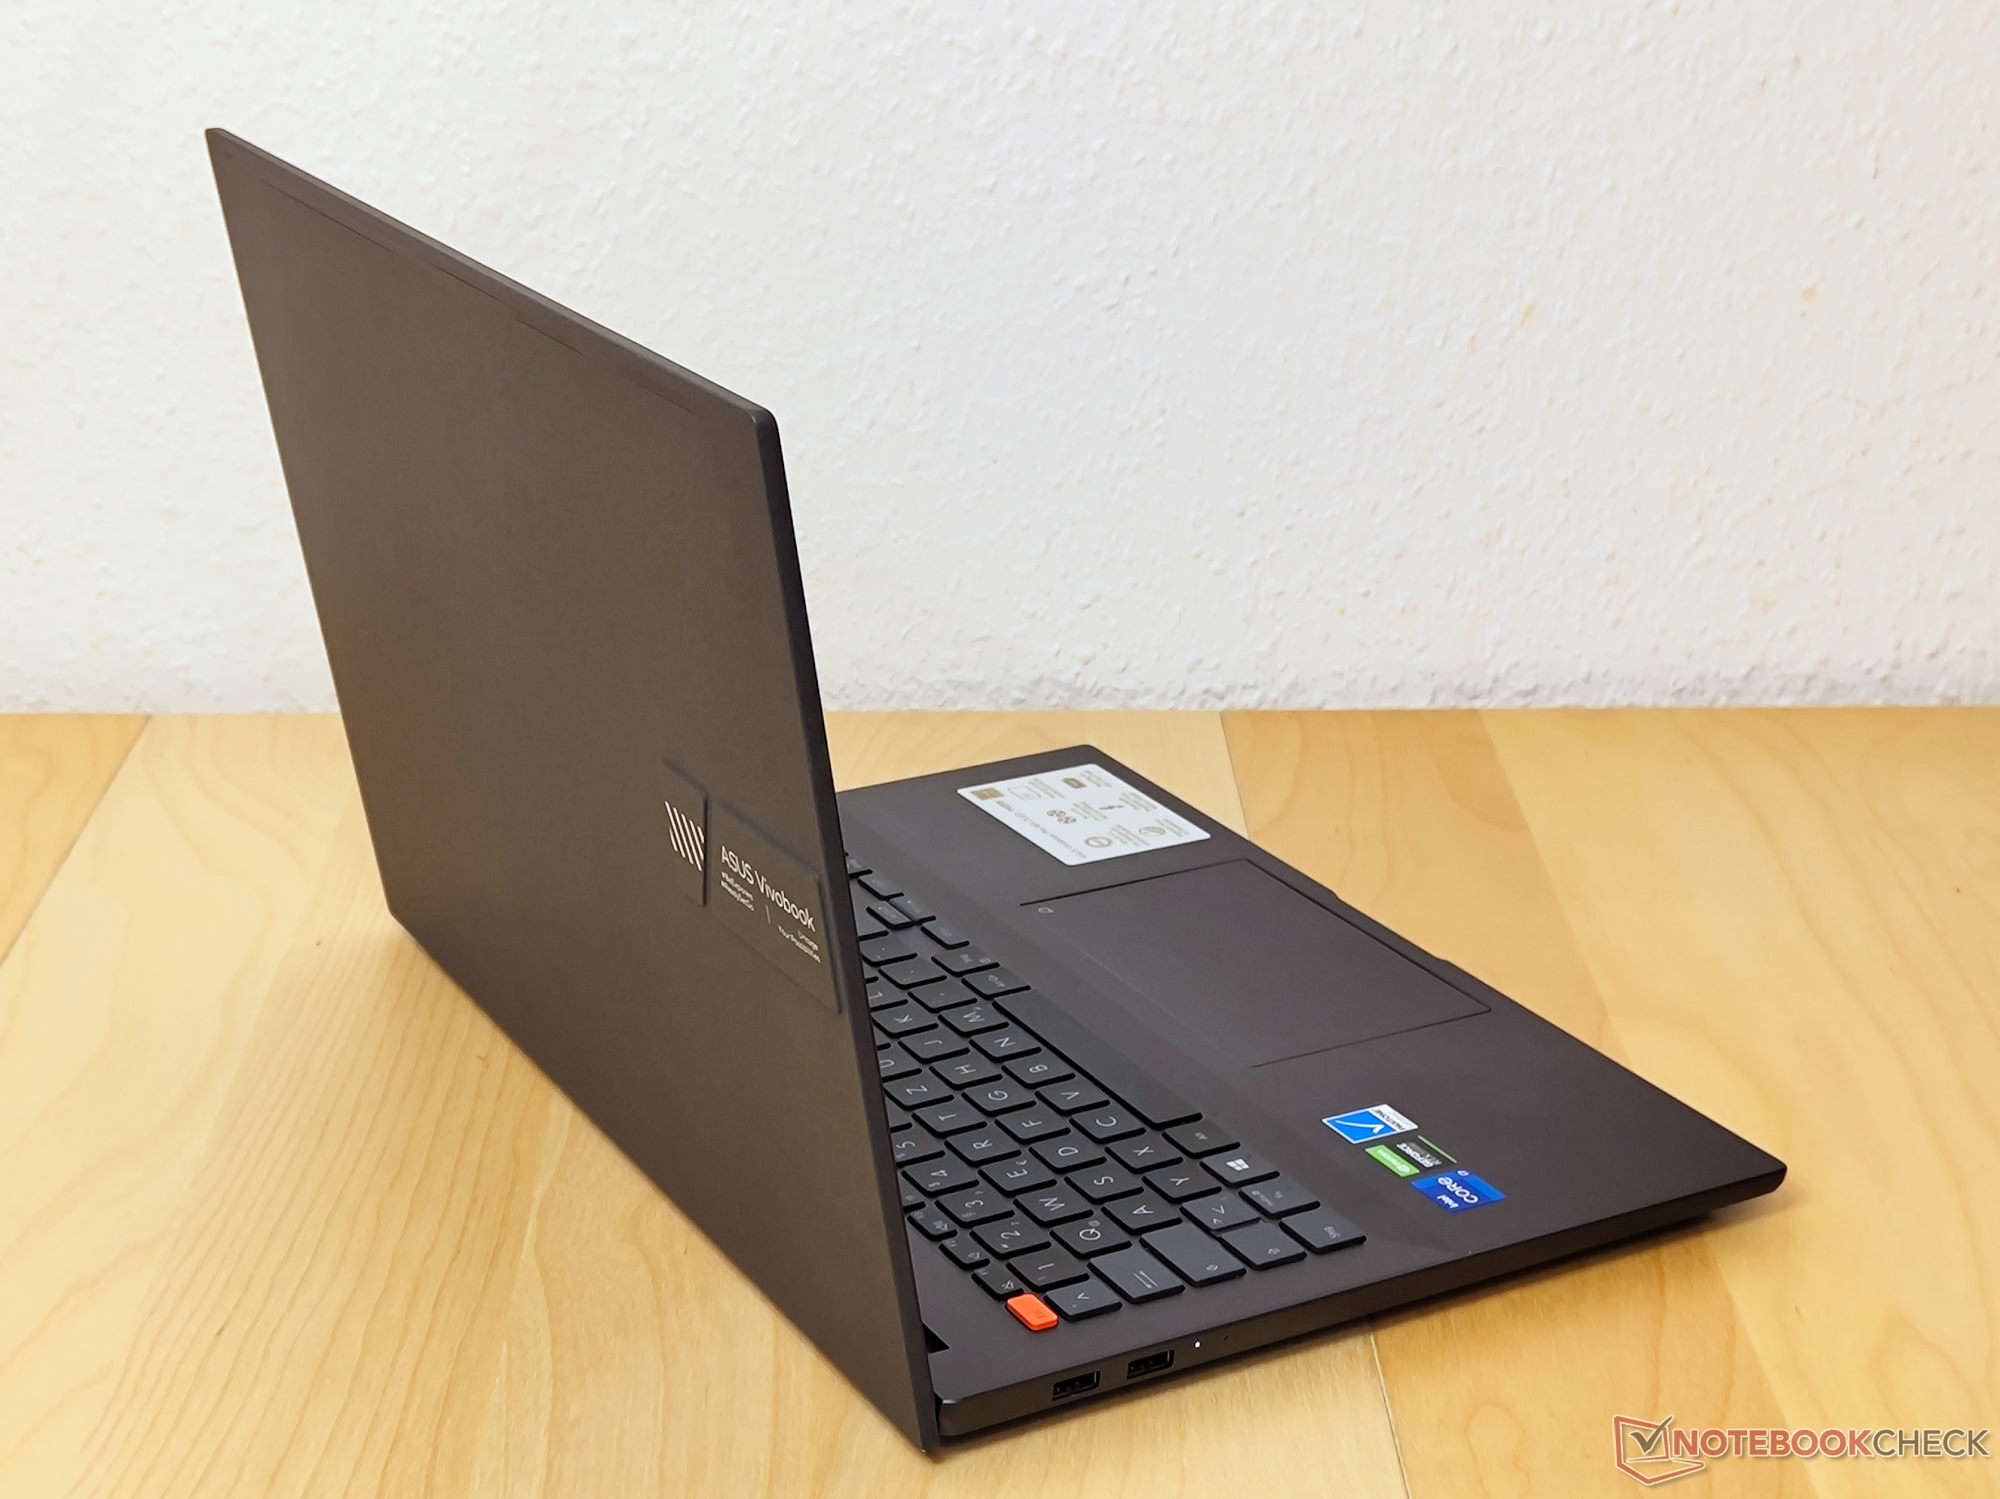
Devido às luneiras bastante finas, o Vivobook 16X OLED tende a ser ligeiramente menor que outros laptops de 16 polegadas, apesar de ser um dispositivo de 16 polegadas em si. Além disso, ele é bastante fino quando se leva em conta a GPU dedicada e a poderosa CPU. Em contraste, o peso é bastante alto. Em 1969 g (~4,34 lb), dificilmente pode ser descrito como leve. Combinado com os 446 g (~0,98 lb) adicionais para o adaptador AC e seu cabo, o Vivobook 16X chega a 2,4 kg (~5,29 lb) no total.
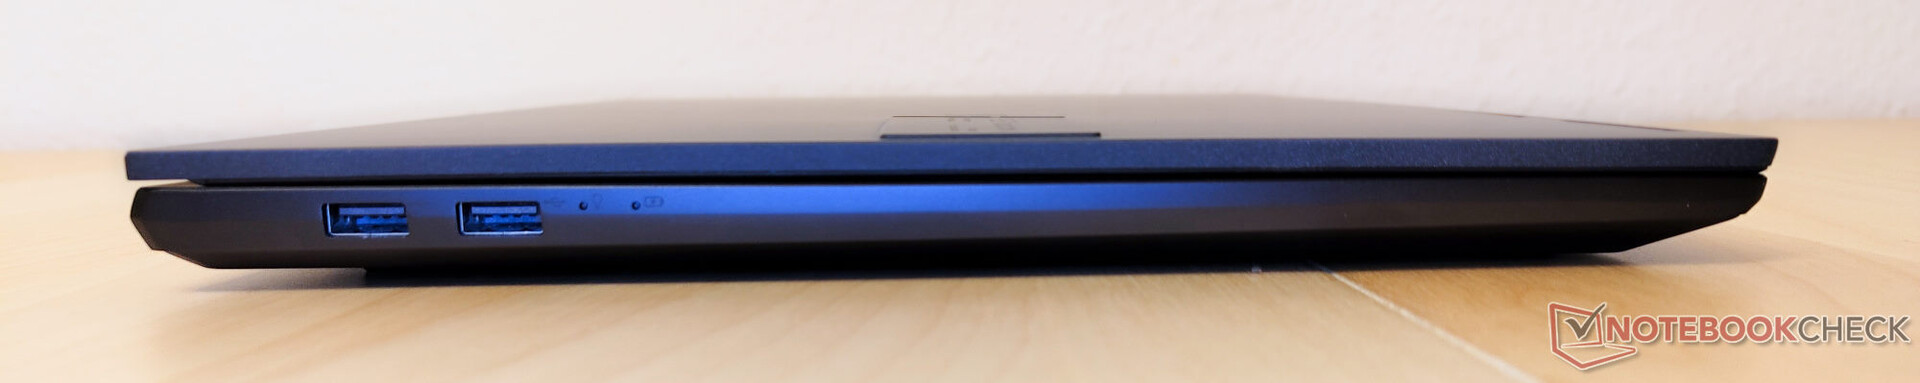
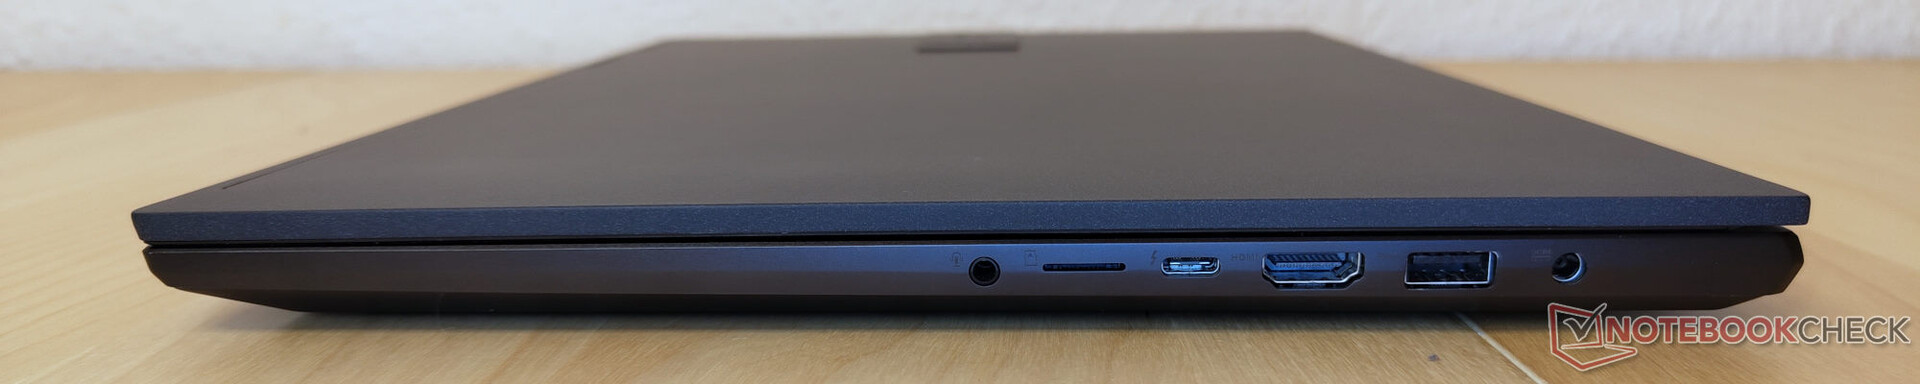
Conectividade - USB-C com Thunderbolt 4 na Direita, USB 2.0 na Esquerda
Graças ao USB tipo C com Thunderbolt 4 e Power Delivery, assim como 3x USB tipo A e HDMI 2.1, os usuários obtêm muita flexibilidade em termos de acessórios. Isto faz do lento leitor de cartões microSD uma escolha totalmente inapropriada. Para um dispositivo destinado aos criadores de conteúdo, um leitor de cartões SD de tamanho normal com velocidades de transferência decentes poderia ter sido uma escolha mais adequada. As duas portas USB tipo A, à esquerda, suportam apenas USB 2.0. A maioria das portas utilizáveis estão localizadas à direita. Para usuários destros que desejam usar um mouse externo, isto pode ser um pequeno inconveniente.
Leitor de cartões SD
O leitor de cartões SD não é um dos pontos fortes do Vivobook. Como ele só é conectado via USB 2.0, não pode alcançar boas velocidades mesmo com nosso cartão de referência AV PRO microSD 128 GB V60. O fato de que nem mesmo os cartões microSD podem ser inseridos completamente, também é um pouco decepcionante.
| SD Card Reader | |
| average JPG Copy Test (av. of 3 runs) | |
| MSI Summit E16 Flip A12UDT-031 (AV Pro SD microSD 128 GB V60) | |
| Lenovo ThinkPad X1 Extreme G4-20Y5CTO1WW (3050 Ti) (AV Pro V60) | |
| Média da turma Multimedia (23 - 531, n=36, últimos 2 anos) | |
| Schenker XMG Focus 15 (AV PRO microSD 128 GB V60) | |
| Asus VivoBook Pro 16X OLED N7600PC-L2026X | |
| Dell Inspiron 16 Plus 7610 (AV PRO microSD 128 GB V60) | |
| maximum AS SSD Seq Read Test (1GB) | |
| Média da turma Multimedia (37.3 - 1455, n=35, últimos 2 anos) | |
| Lenovo ThinkPad X1 Extreme G4-20Y5CTO1WW (3050 Ti) (AV Pro V60) | |
| MSI Summit E16 Flip A12UDT-031 (AV Pro SD microSD 128 GB V60) | |
| Schenker XMG Focus 15 (AV PRO microSD 128 GB V60) | |
| Asus VivoBook Pro 16X OLED N7600PC-L2026X | |
| Dell Inspiron 16 Plus 7610 (AV PRO microSD 128 GB V60) | |
Comunicação
Um chassi metálico muitas vezes complica a colocação das antenas Wi-Fi para o fabricante. Este também parece ser o caso do Asus Vivobook 16X, já que cerca de 700 Mb/s para up- e downloads estão abaixo do que esperamos do Wi-Fi 6 e também abaixo do que esperamos em nossa comparação.
Webcam
A Asus usa uma webcam 0,9-MP, que é uma escolha comum para laptops de consumo. Infelizmente, sua qualidade é igualmente pobre como resultado. Como a Lenovo Thinkbook 14 G4 e 15 G4 têm mostrado recentemente que há espaço para melhorias.


")
")
Segurança
Um sensor de impressão digital é integrado ao botão de alimentação. Outras características de segurança são limitadas ao TPM 2.0 do Intel Core i7 e outras soluções de software.
Acessórios
O pacote do Vivobook 16X OLED inclui apenas o essencial. O adaptador AC, a papelada e o laptop são embalados com pequenas quantidades de plástico.
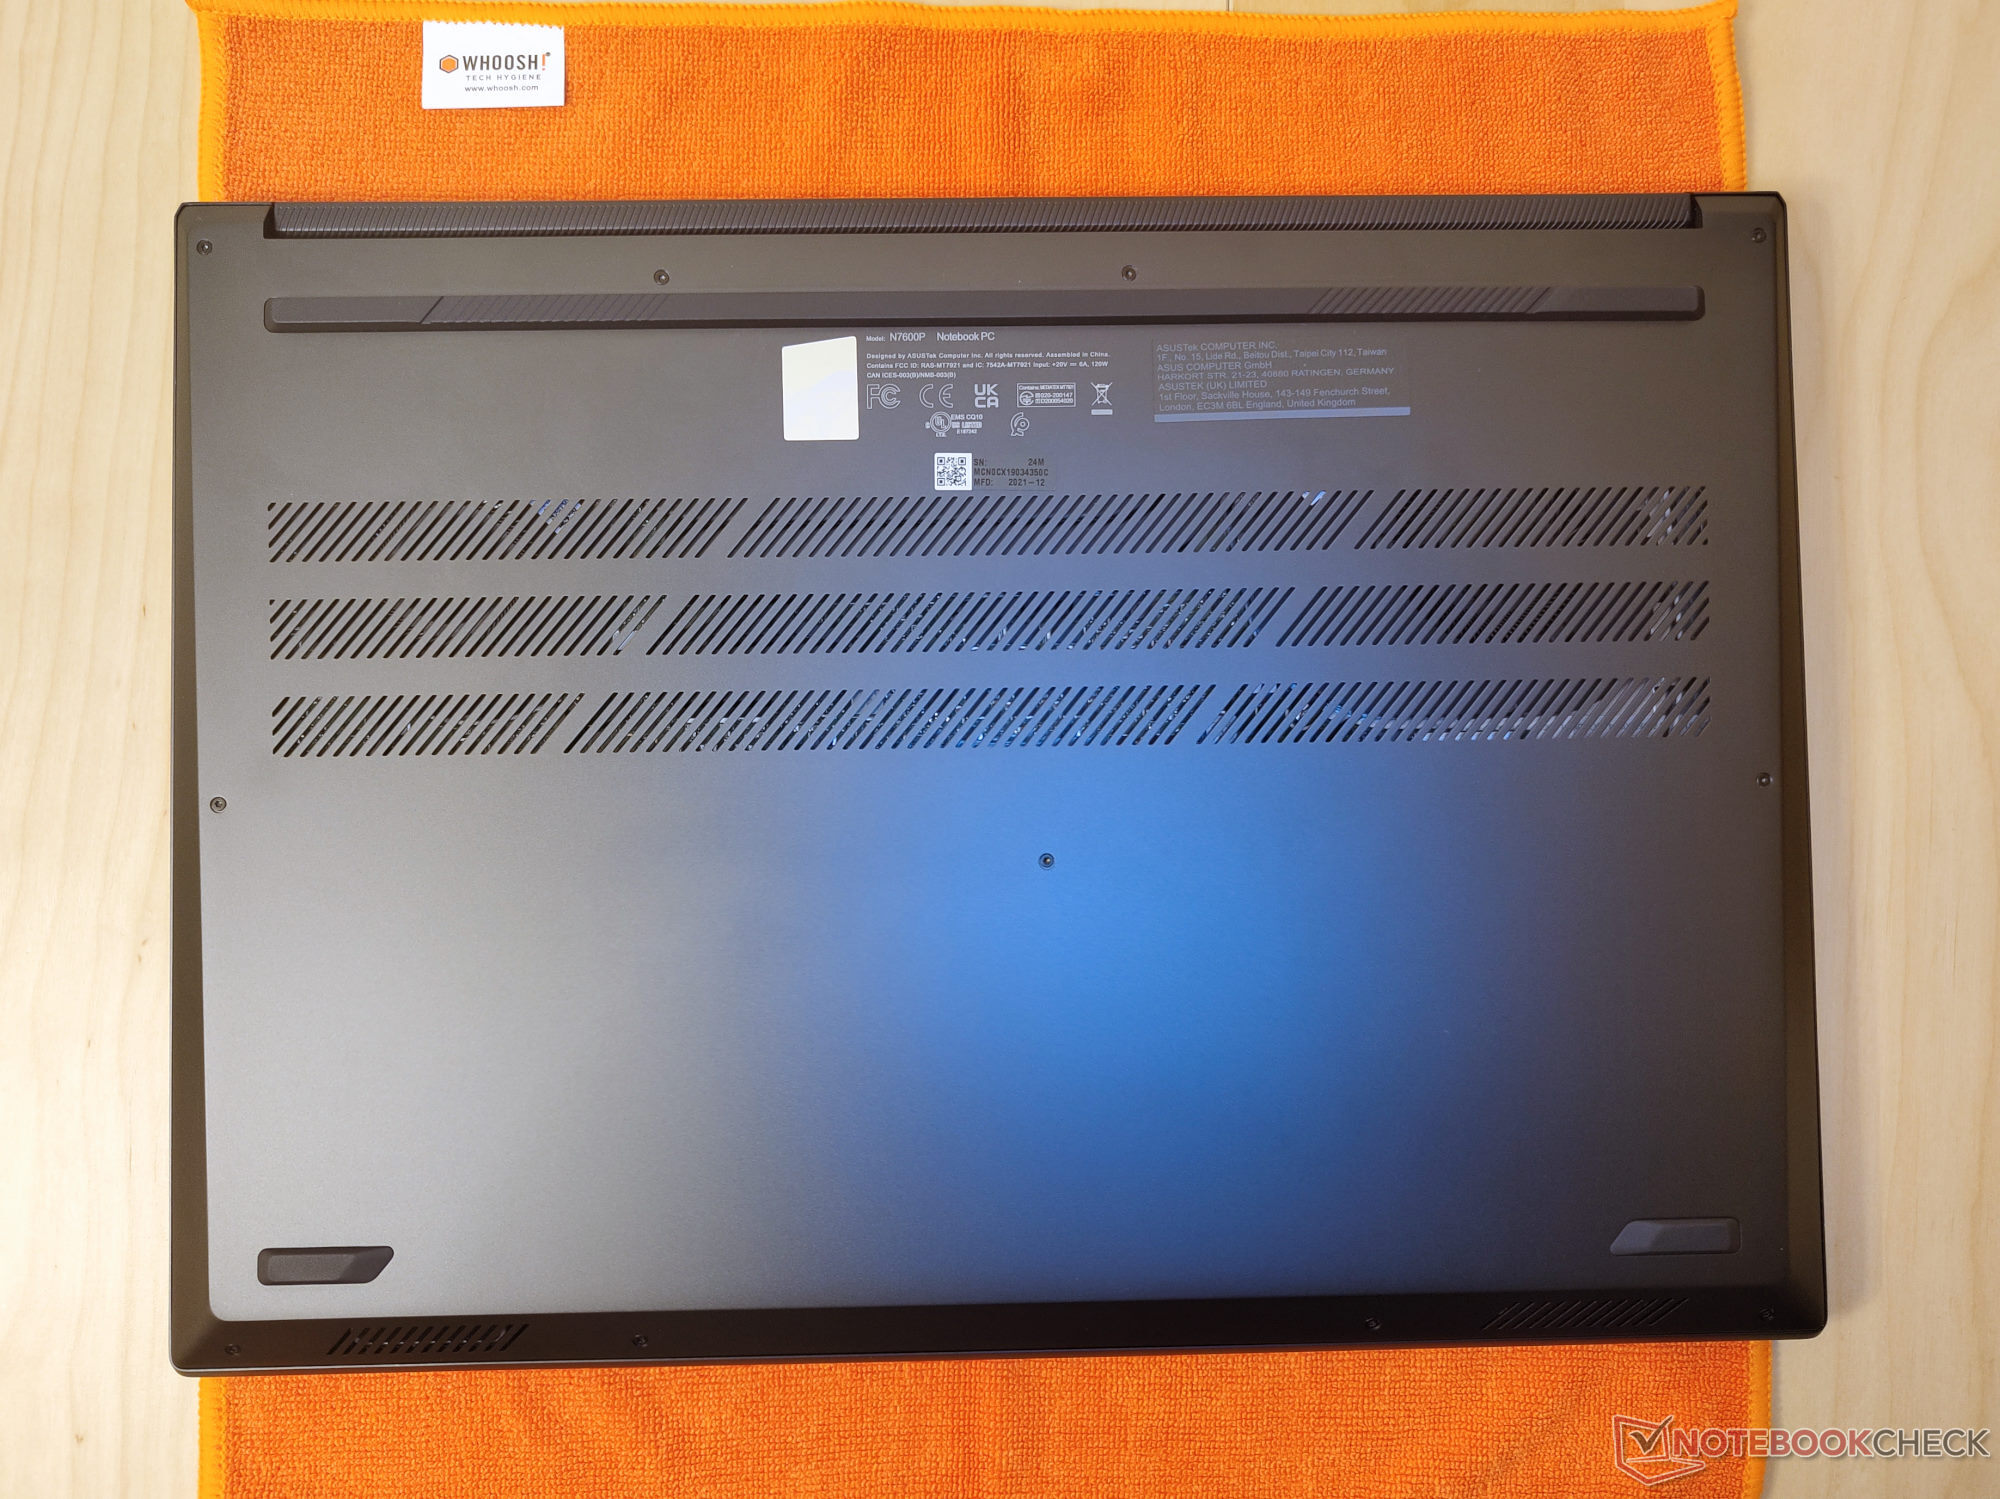
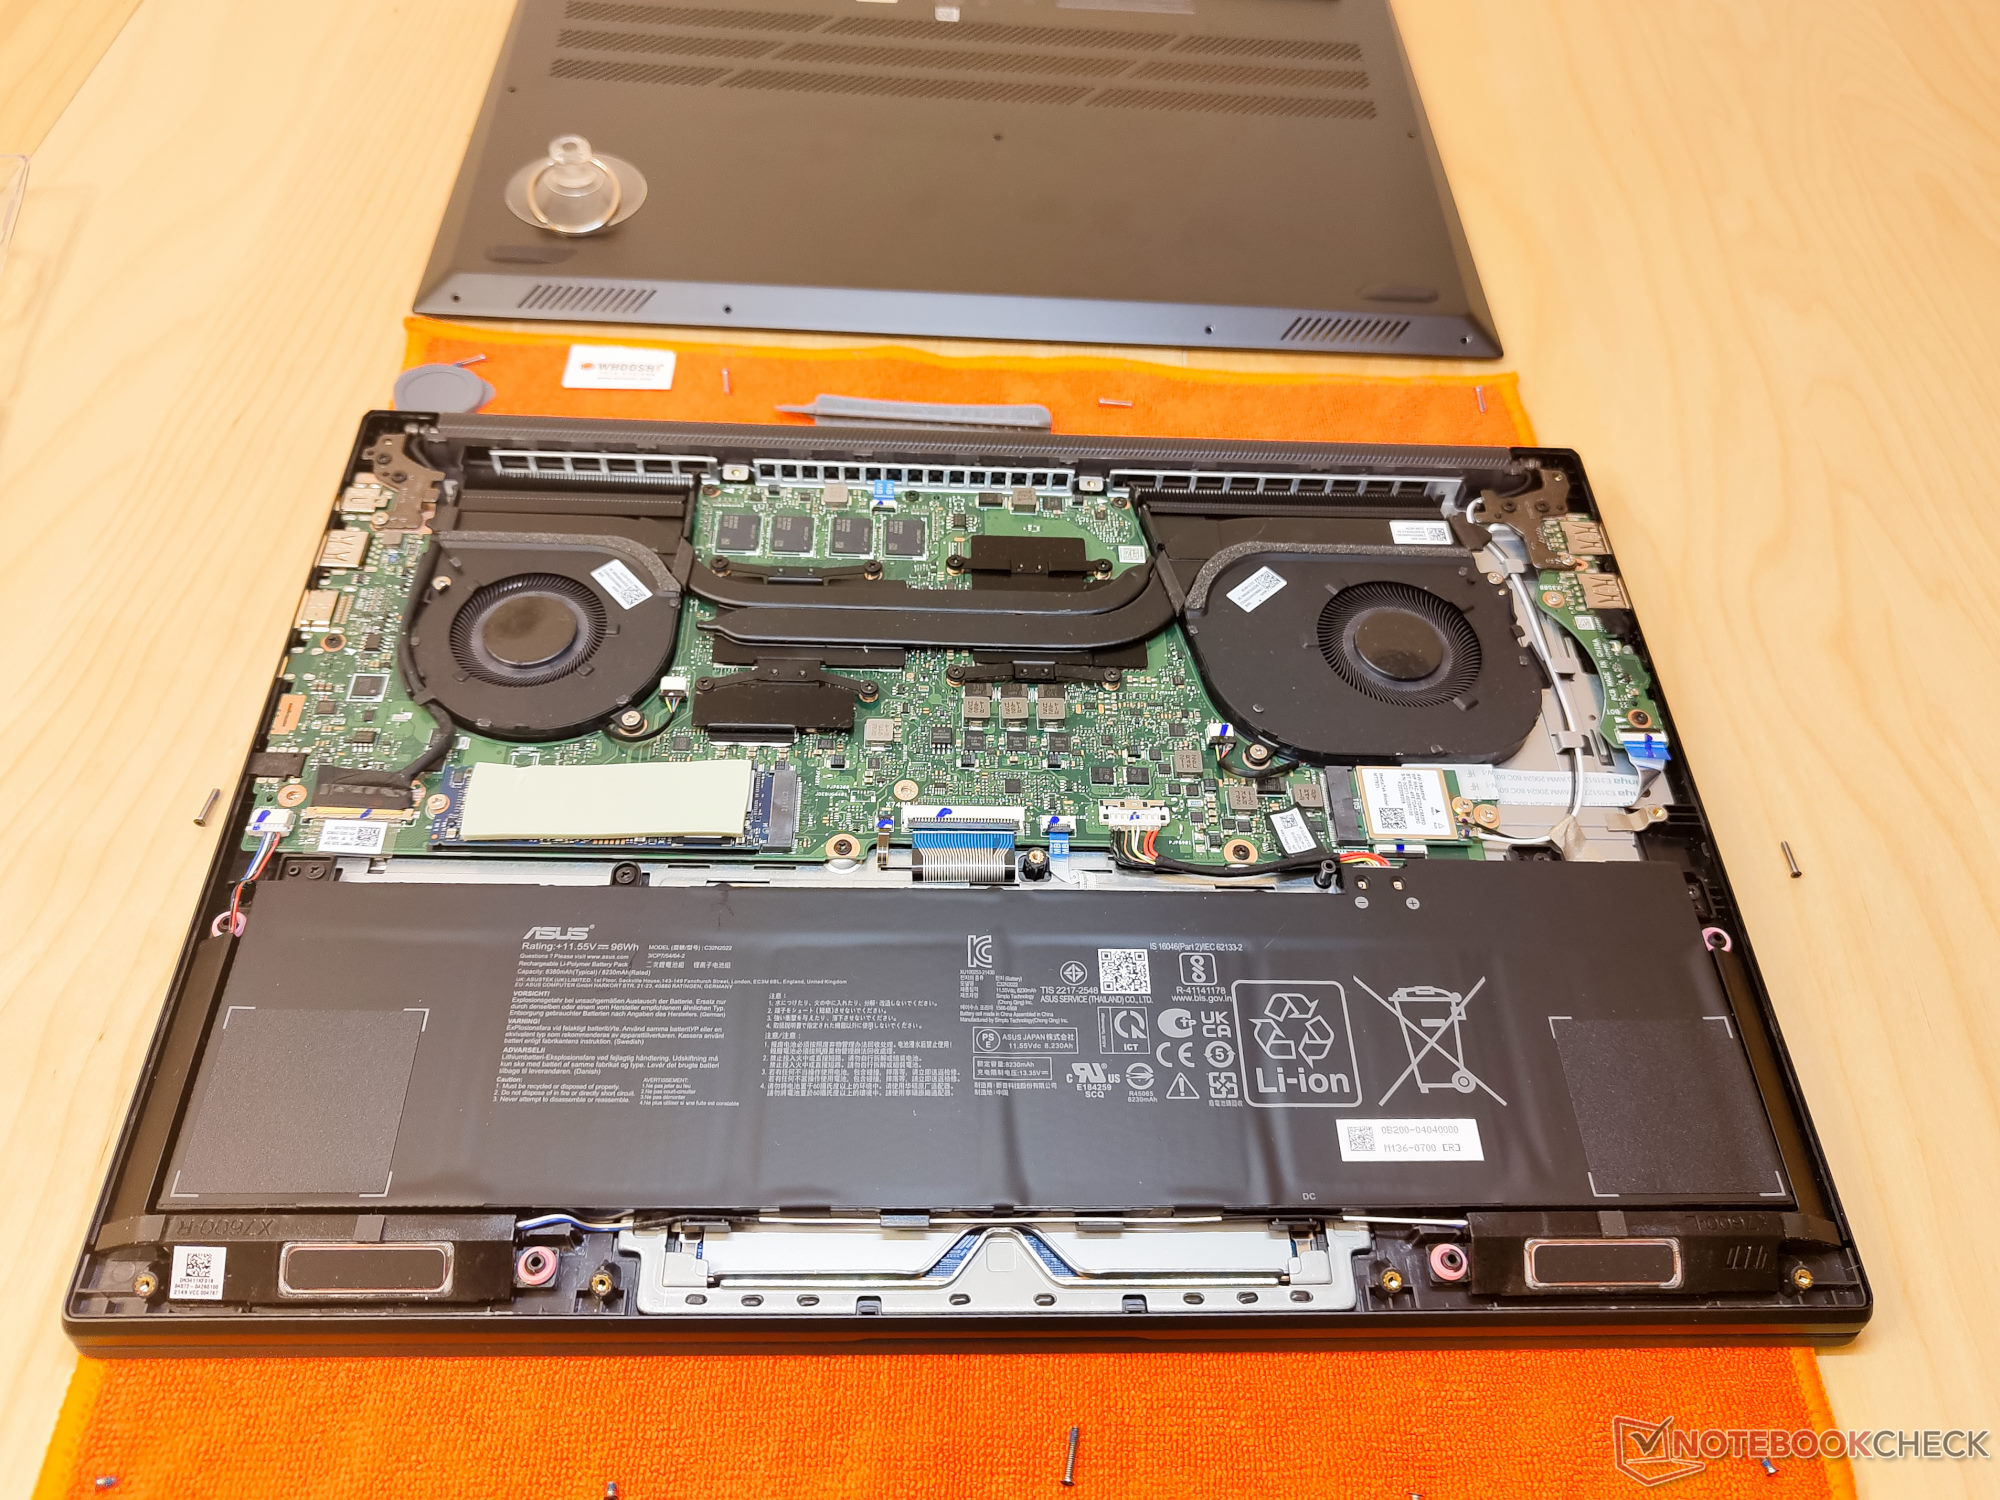
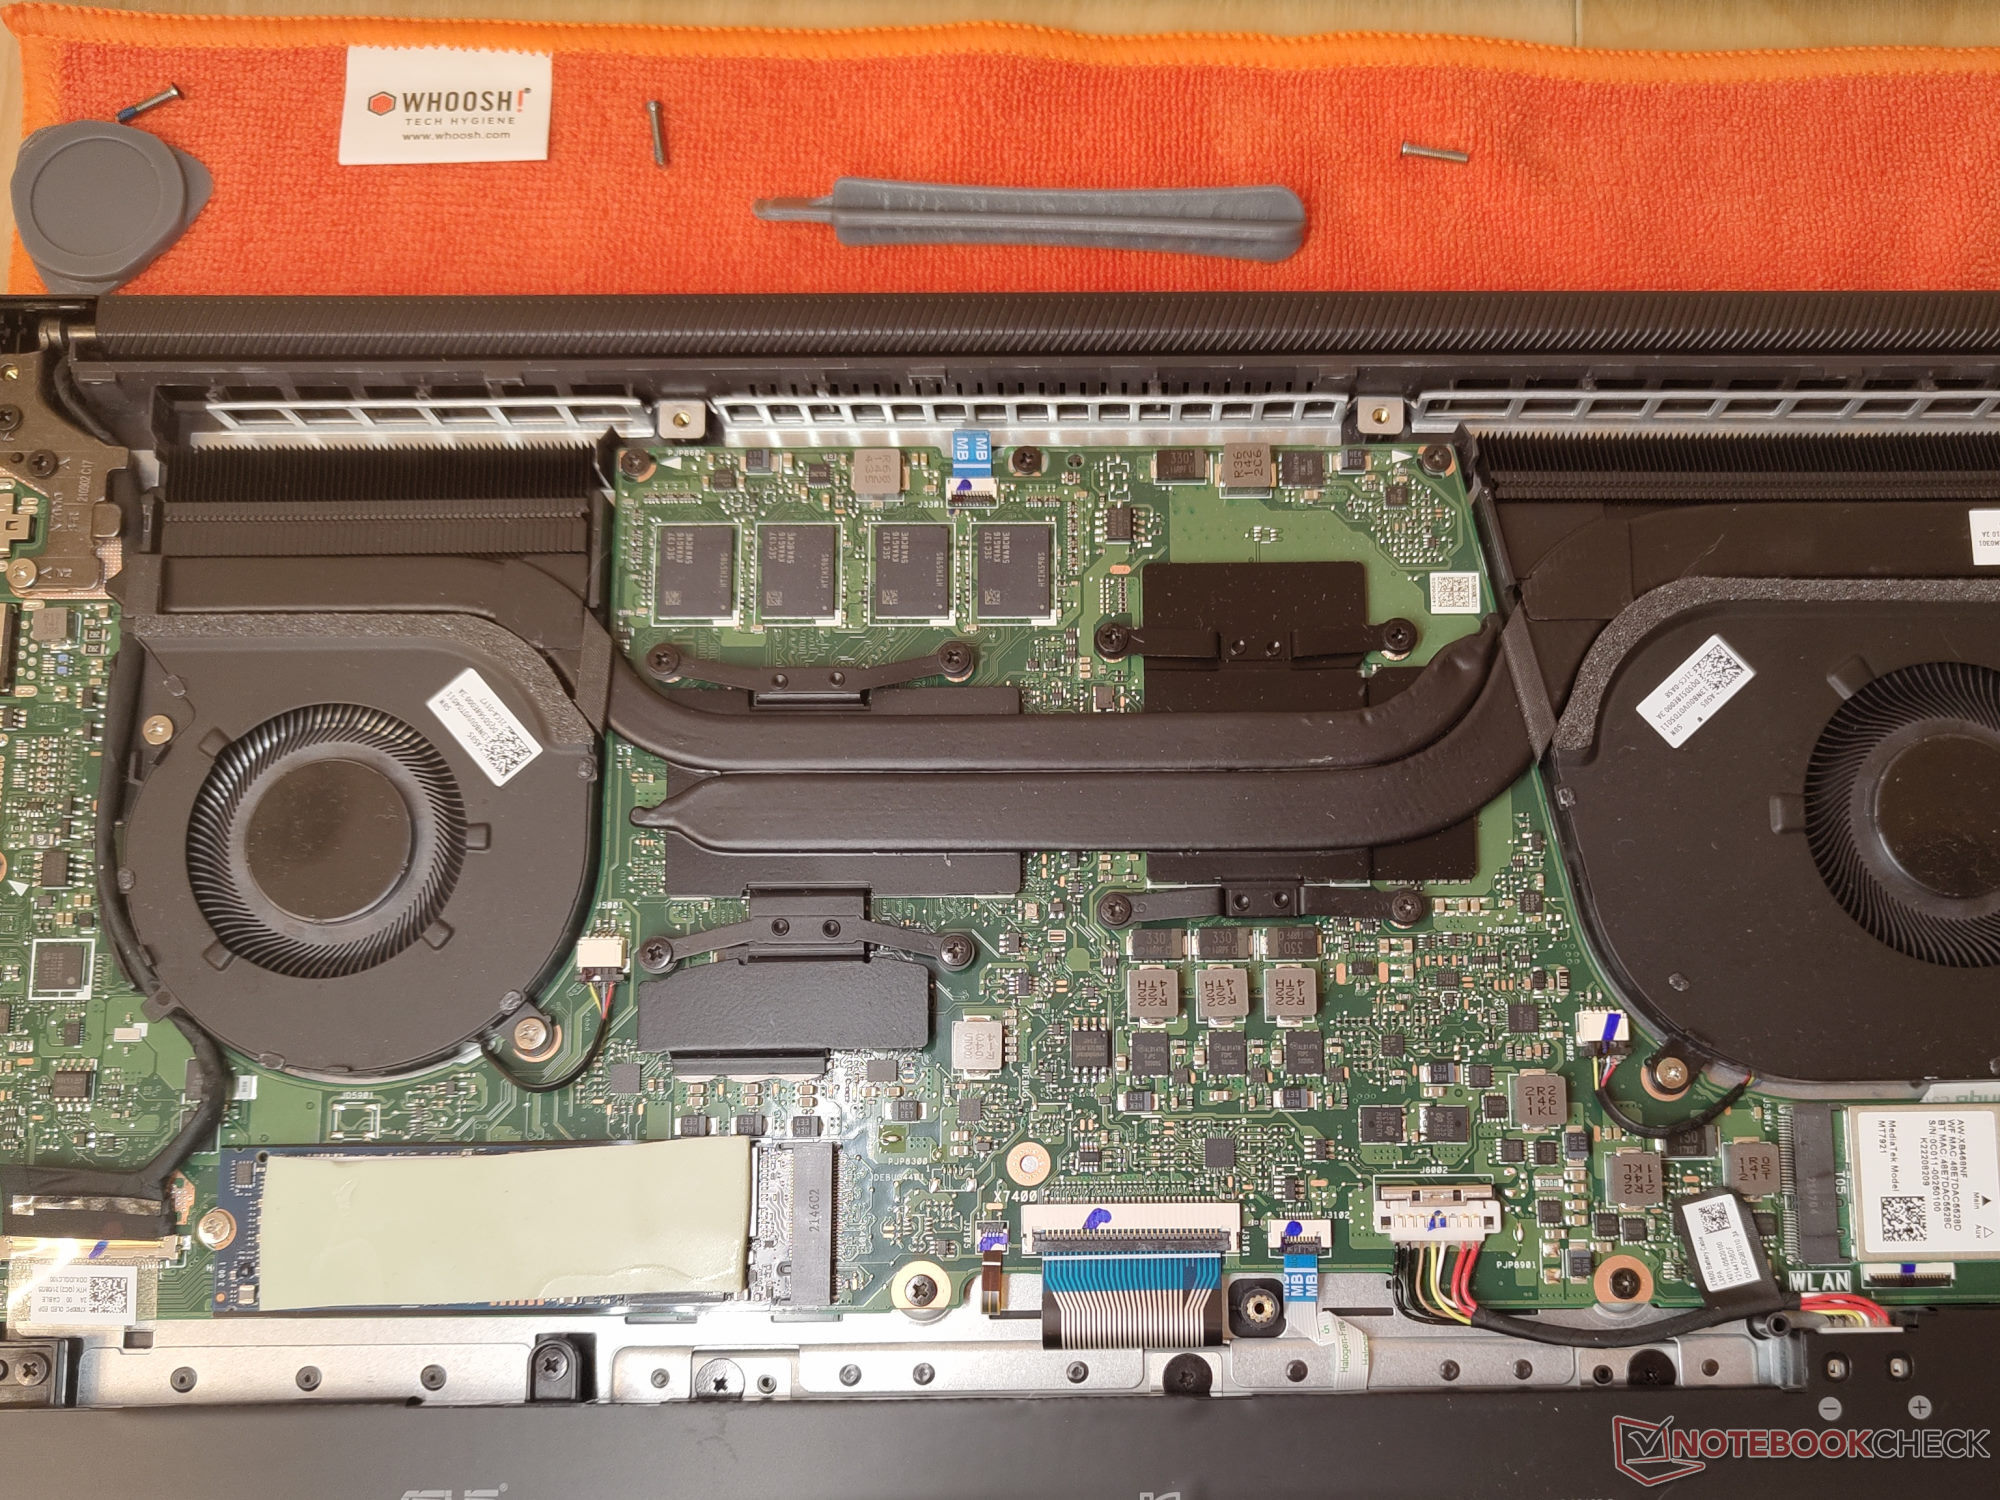
Manutenção
A unidade base é fixada por 11 parafusos TX5. Depois de afrouxá-los, o fundo ainda não pode ser removido facilmente. Aqui, recomendamos uma ventosa e um spudger de plástico para desalojar cuidadosamente a tampa. 16 GB de RAM são soldados à placa principal e, portanto, não podem ser melhorados. As atualizações fáceis são limitadas ao módulo Wi-Fi e ao M.2 SSD. Não há outras peças atualizáveis no Vivobook.
Garantia
O Vivobook Pro 16X vem com uma garantia padrão limitada de um ano quando adquirido nos EUA.
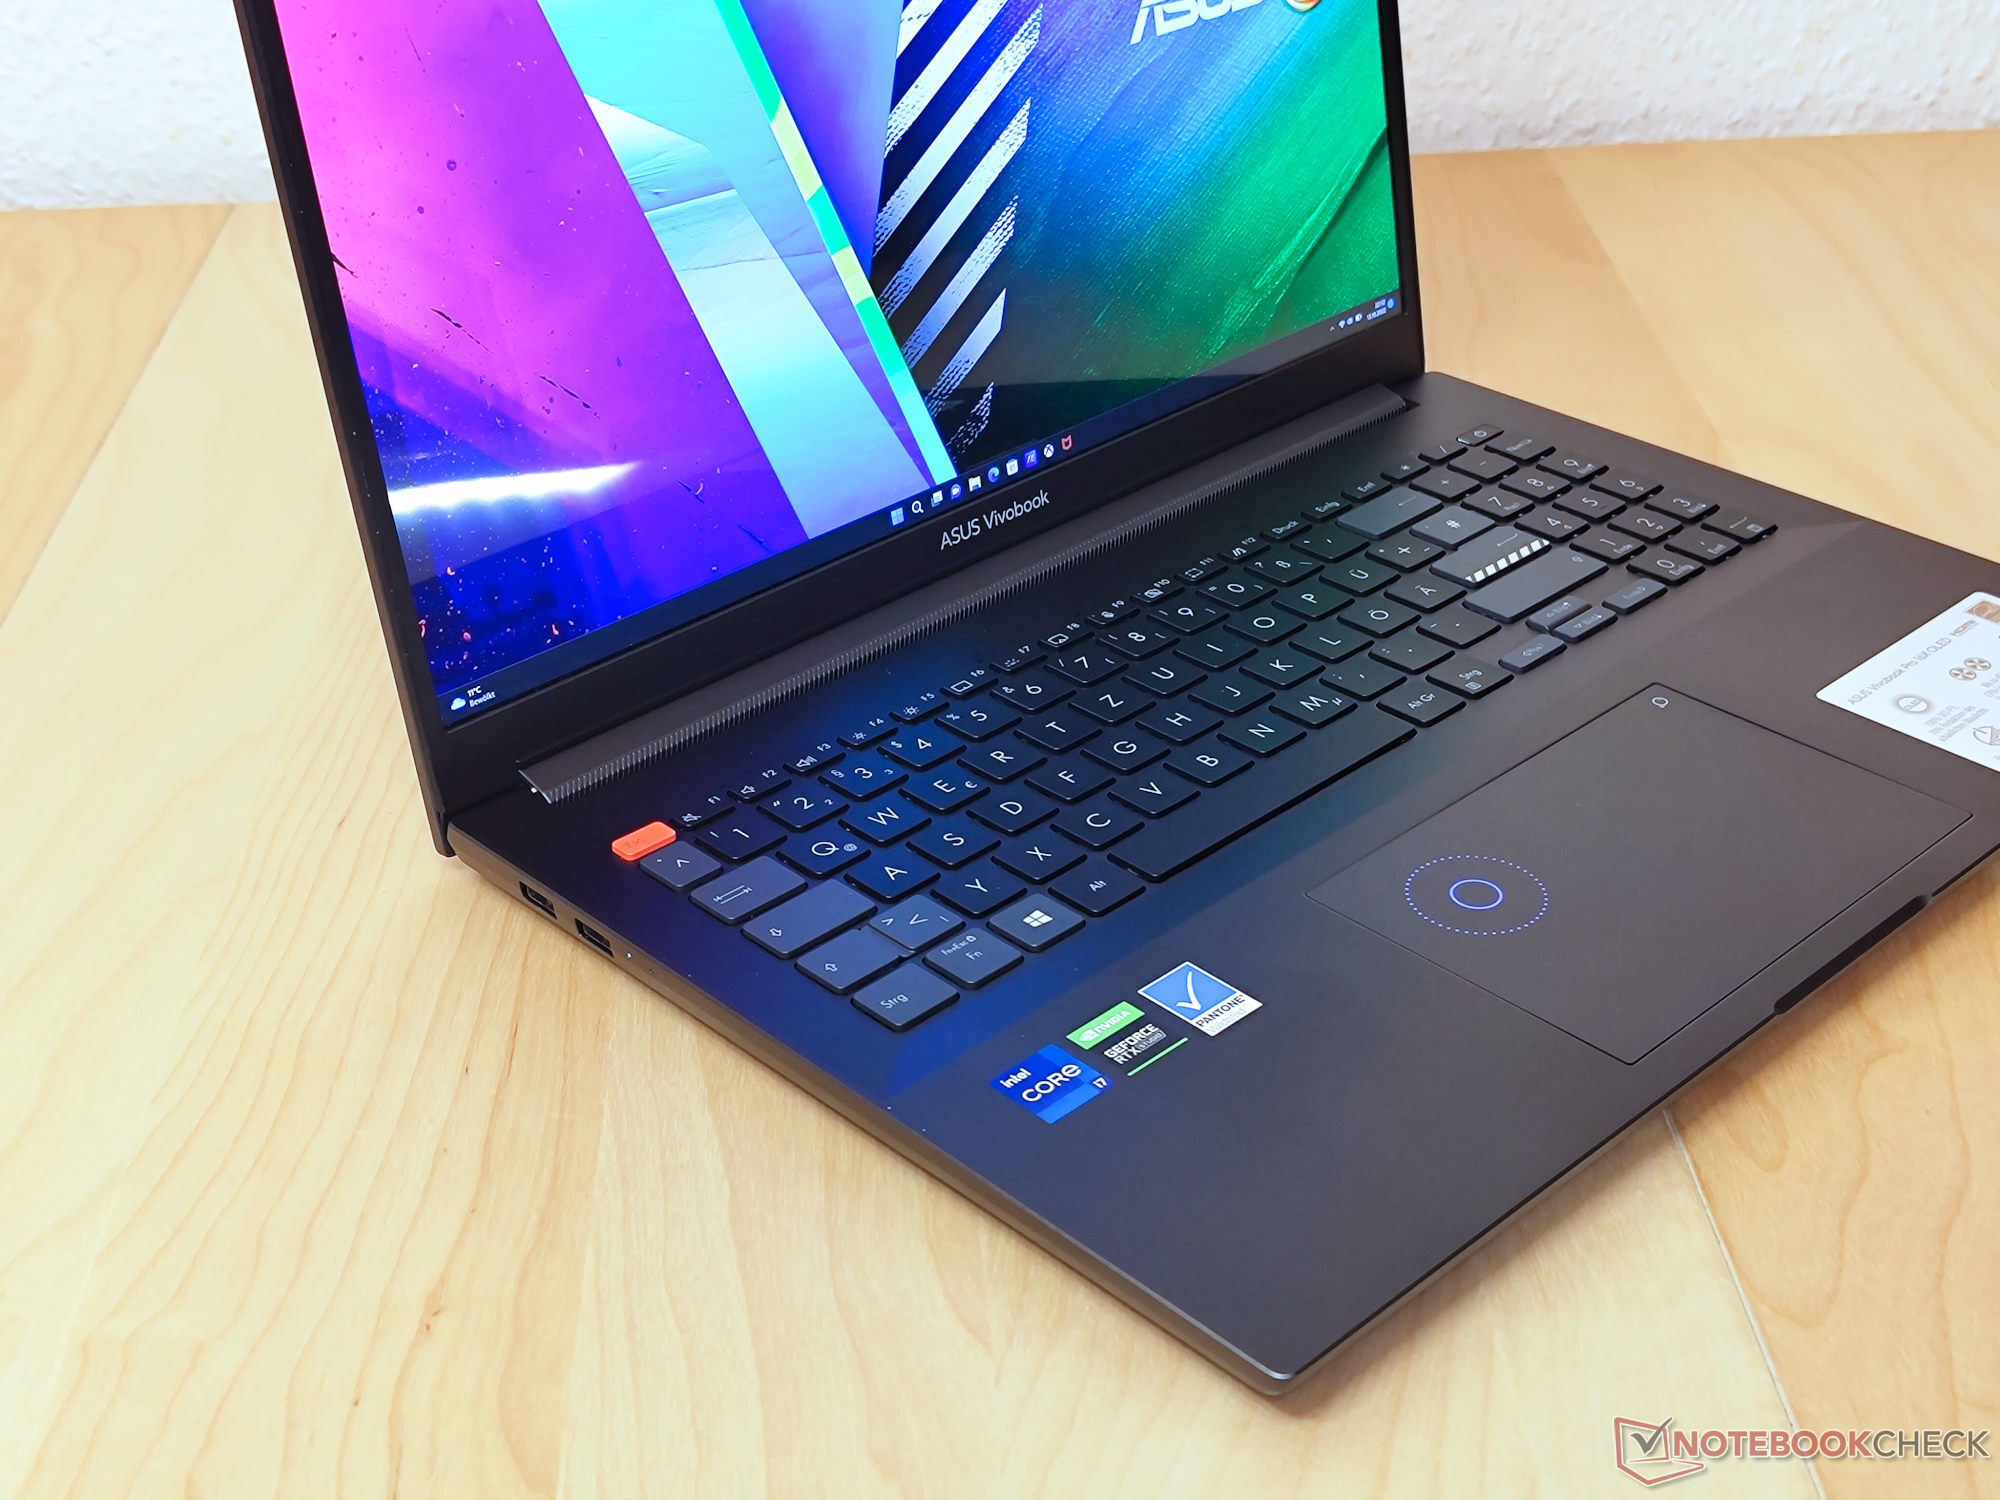
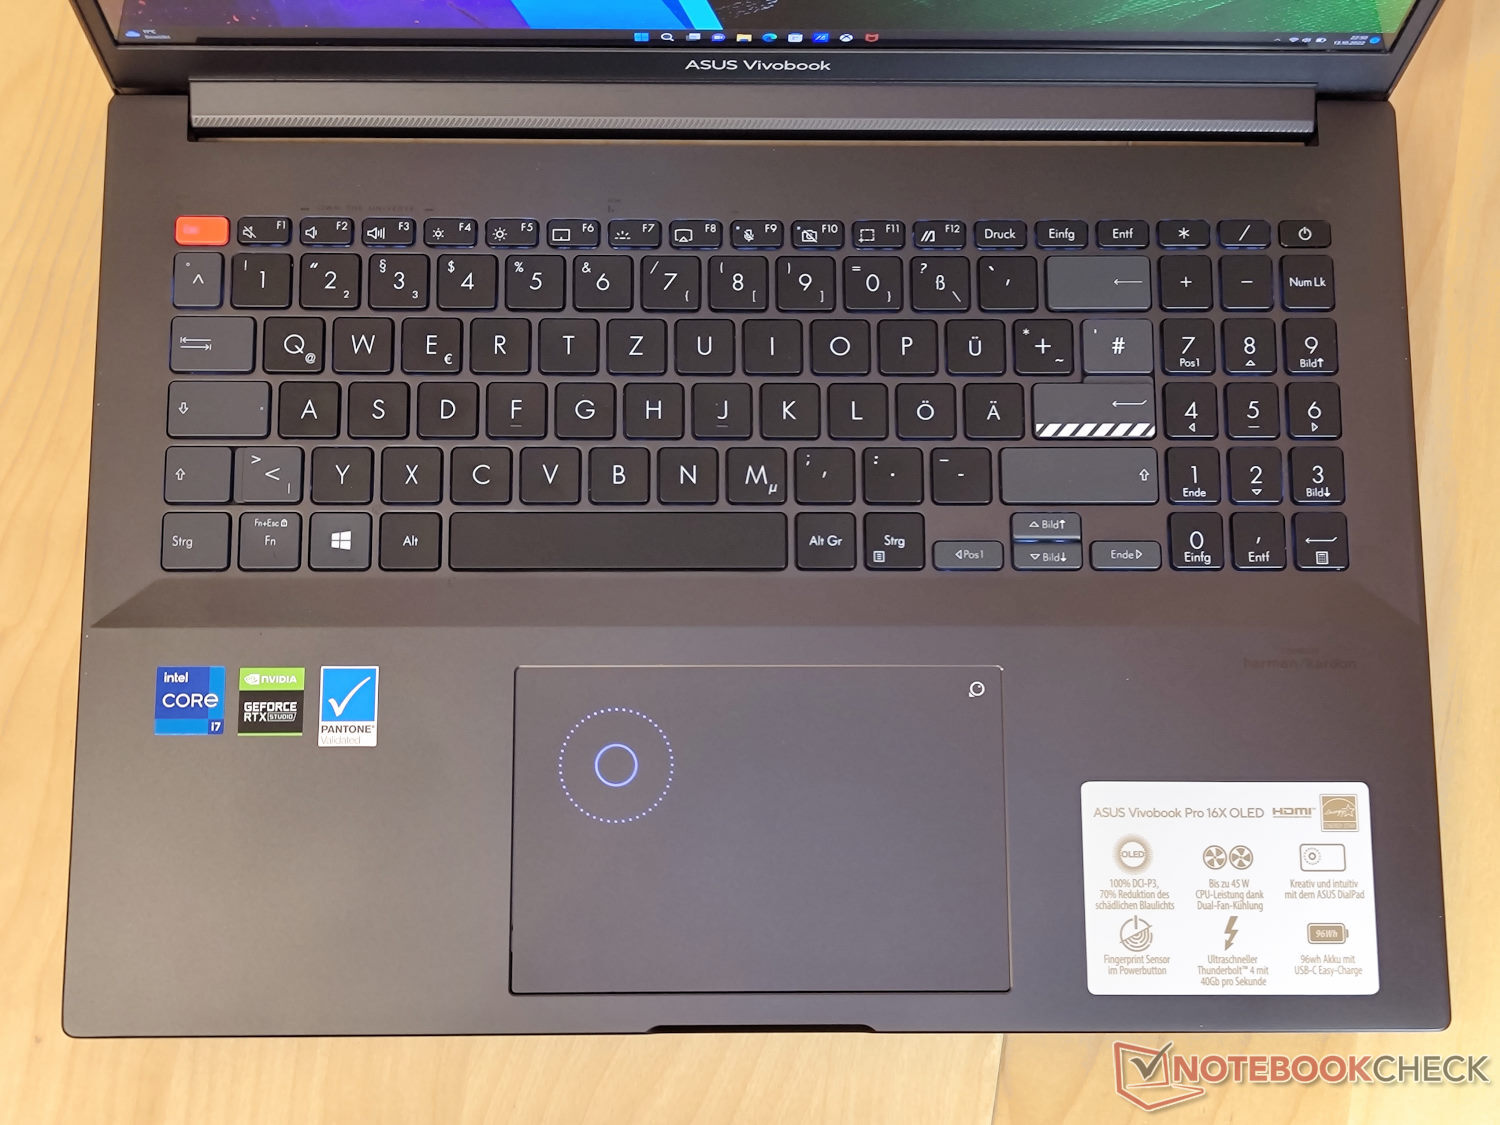
Dispositivos de entrada - Asus Dail e um teclado de tamanho normal
Teclado
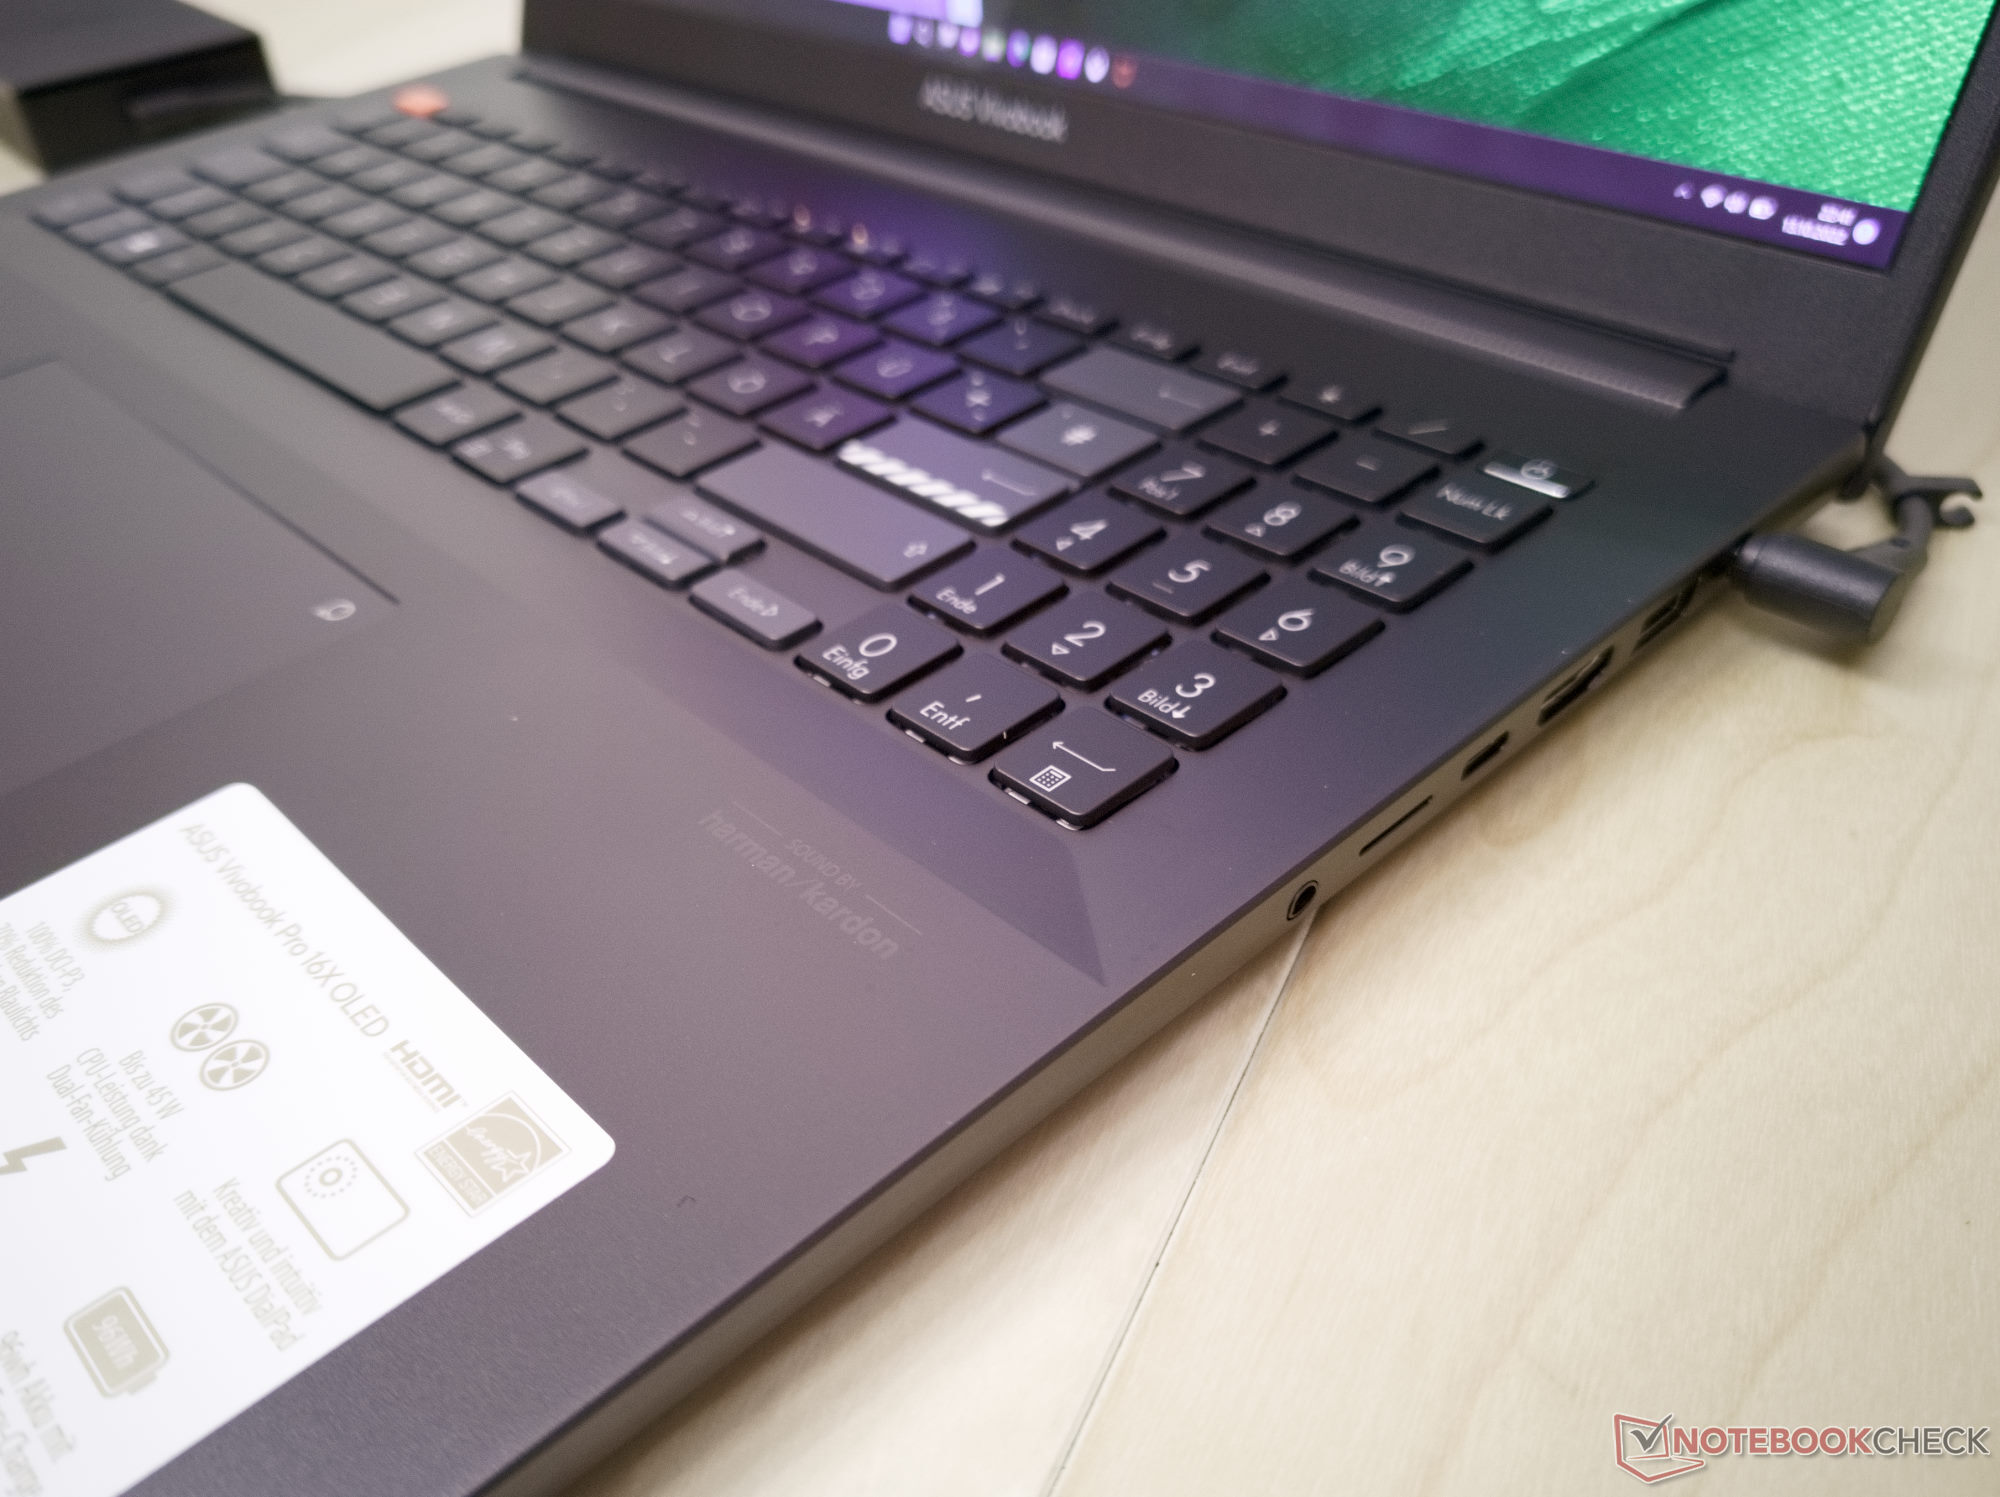
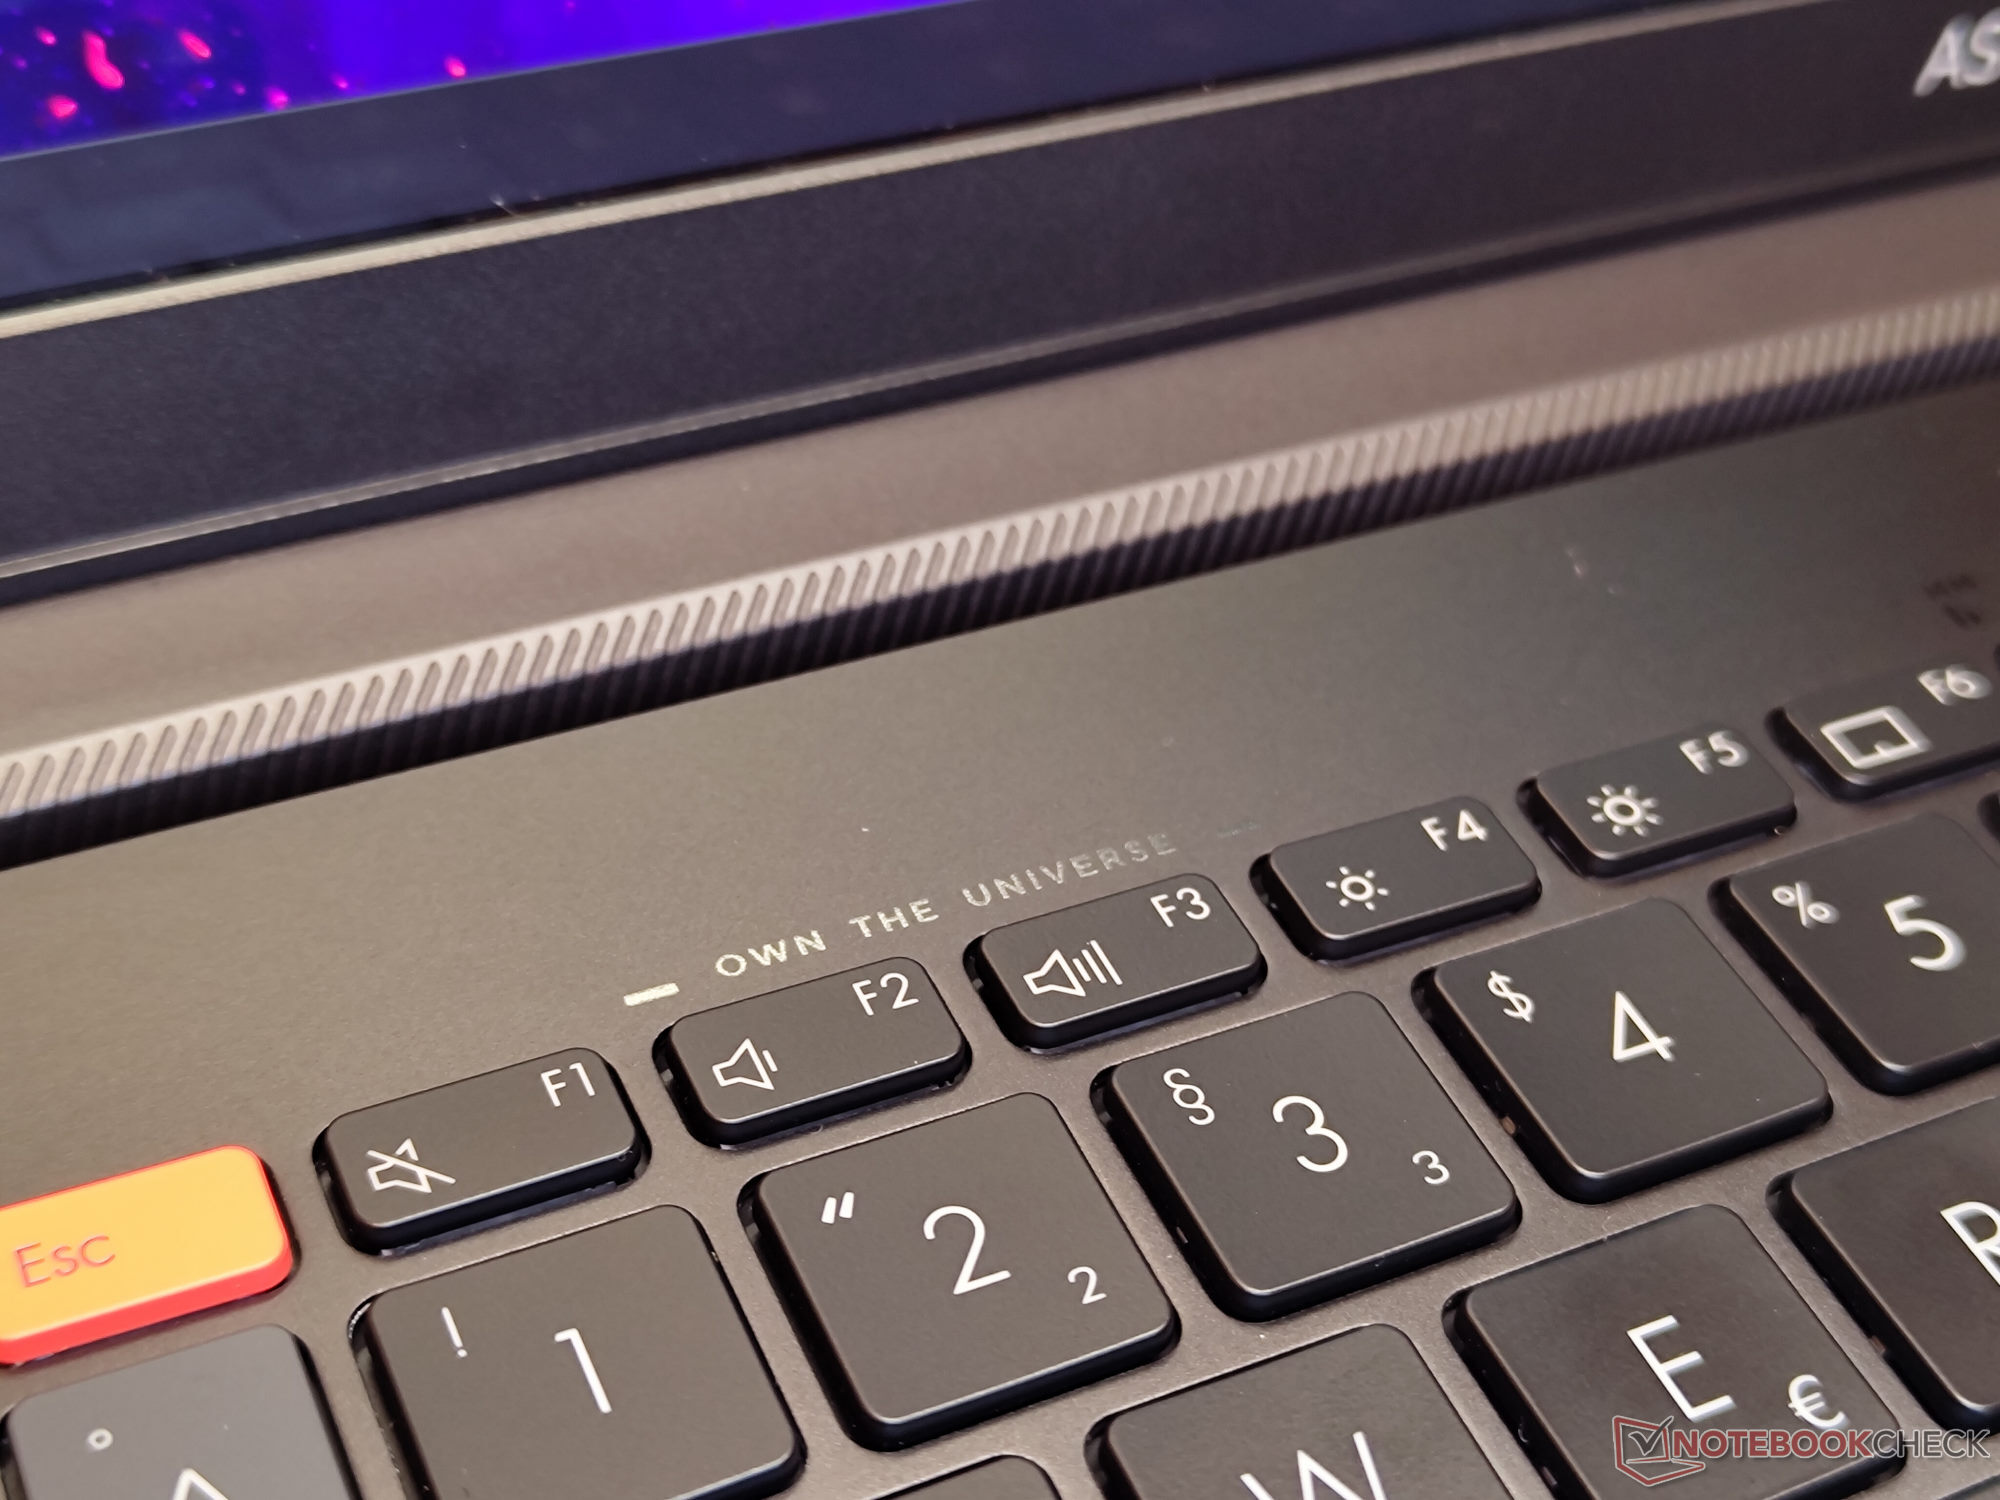
O teclado do Vivobook Pro 16X aproveita o espaço disponível no laptop de 16 polegadas e oferece um teclado numérico, além das teclas de altura normal. Os recursos mais comumente acessados podem ser acessados através das teclas de função. Os botões quadrados de 15 mm (~0,59 pol.) oferecem um curso confortável de 1,6 mm (~0,06 pol.) e um bom feedback táctil.
Touchpad
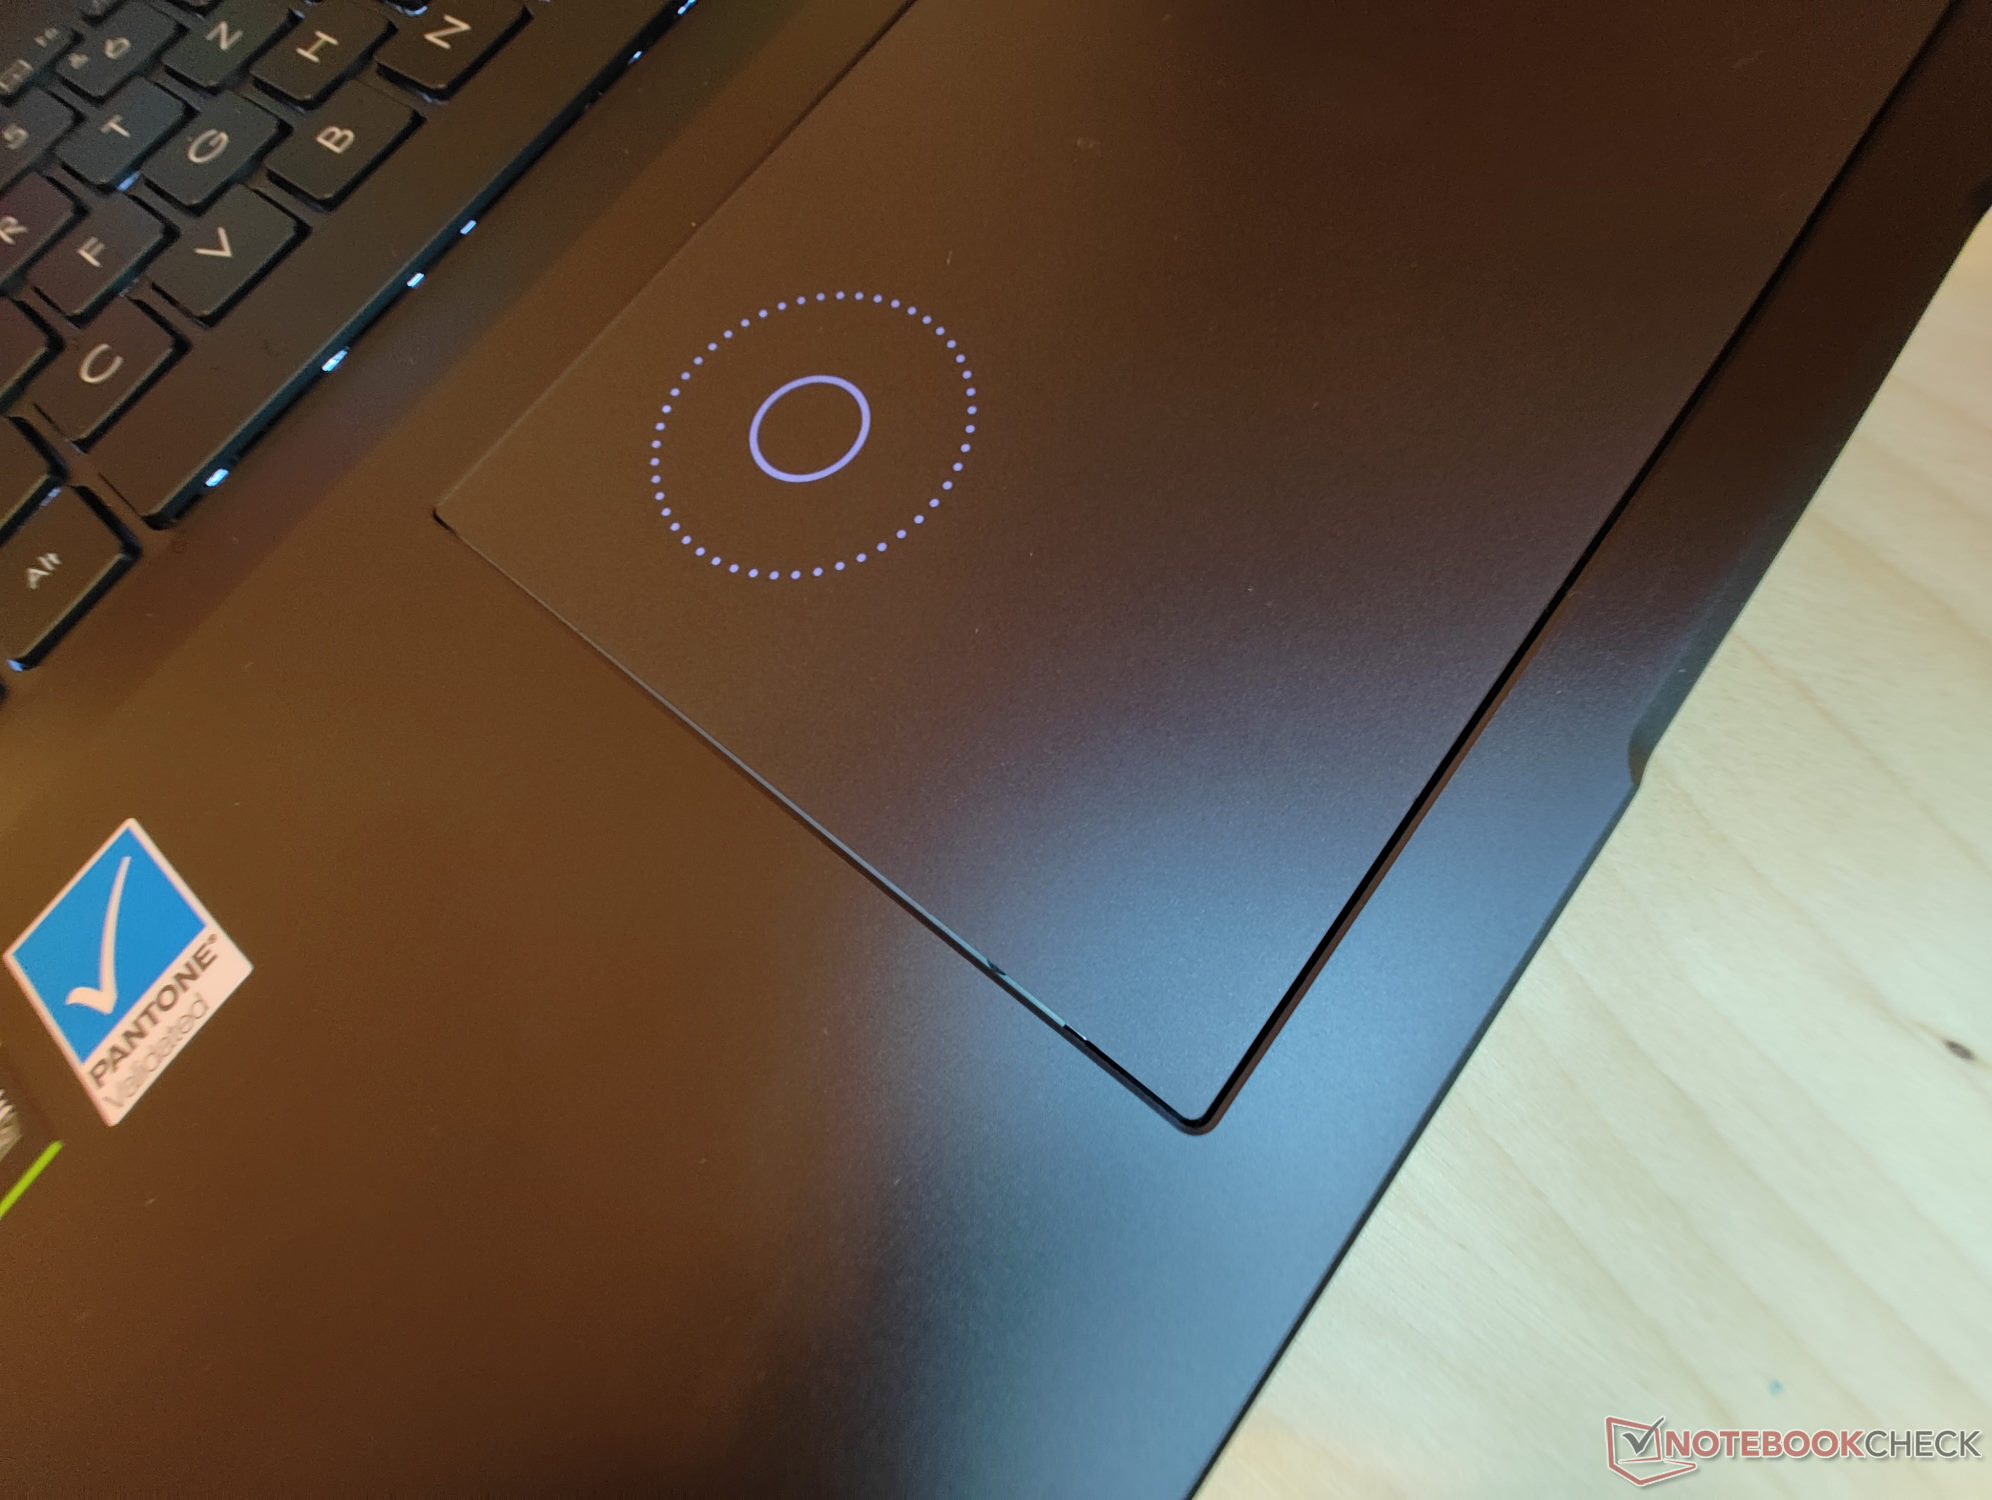
Como em alguns outros modelos Asus, o Vivobook Pro 16X também vem com o Asus Dial integrado ao touchpad. A superfície de entrada permite que os usuários alterem várias configurações após acessar o recurso com um deslize para baixo a partir do canto superior direito. Alternativamente, as funções do Microsoft Surface Dial também estão disponíveis. O clickpad tem um tamanho diagonal de 15,5 cm (~6,10 pol.) e boas propriedades de deslizamento, ao mesmo tempo em que é muito responsivo.
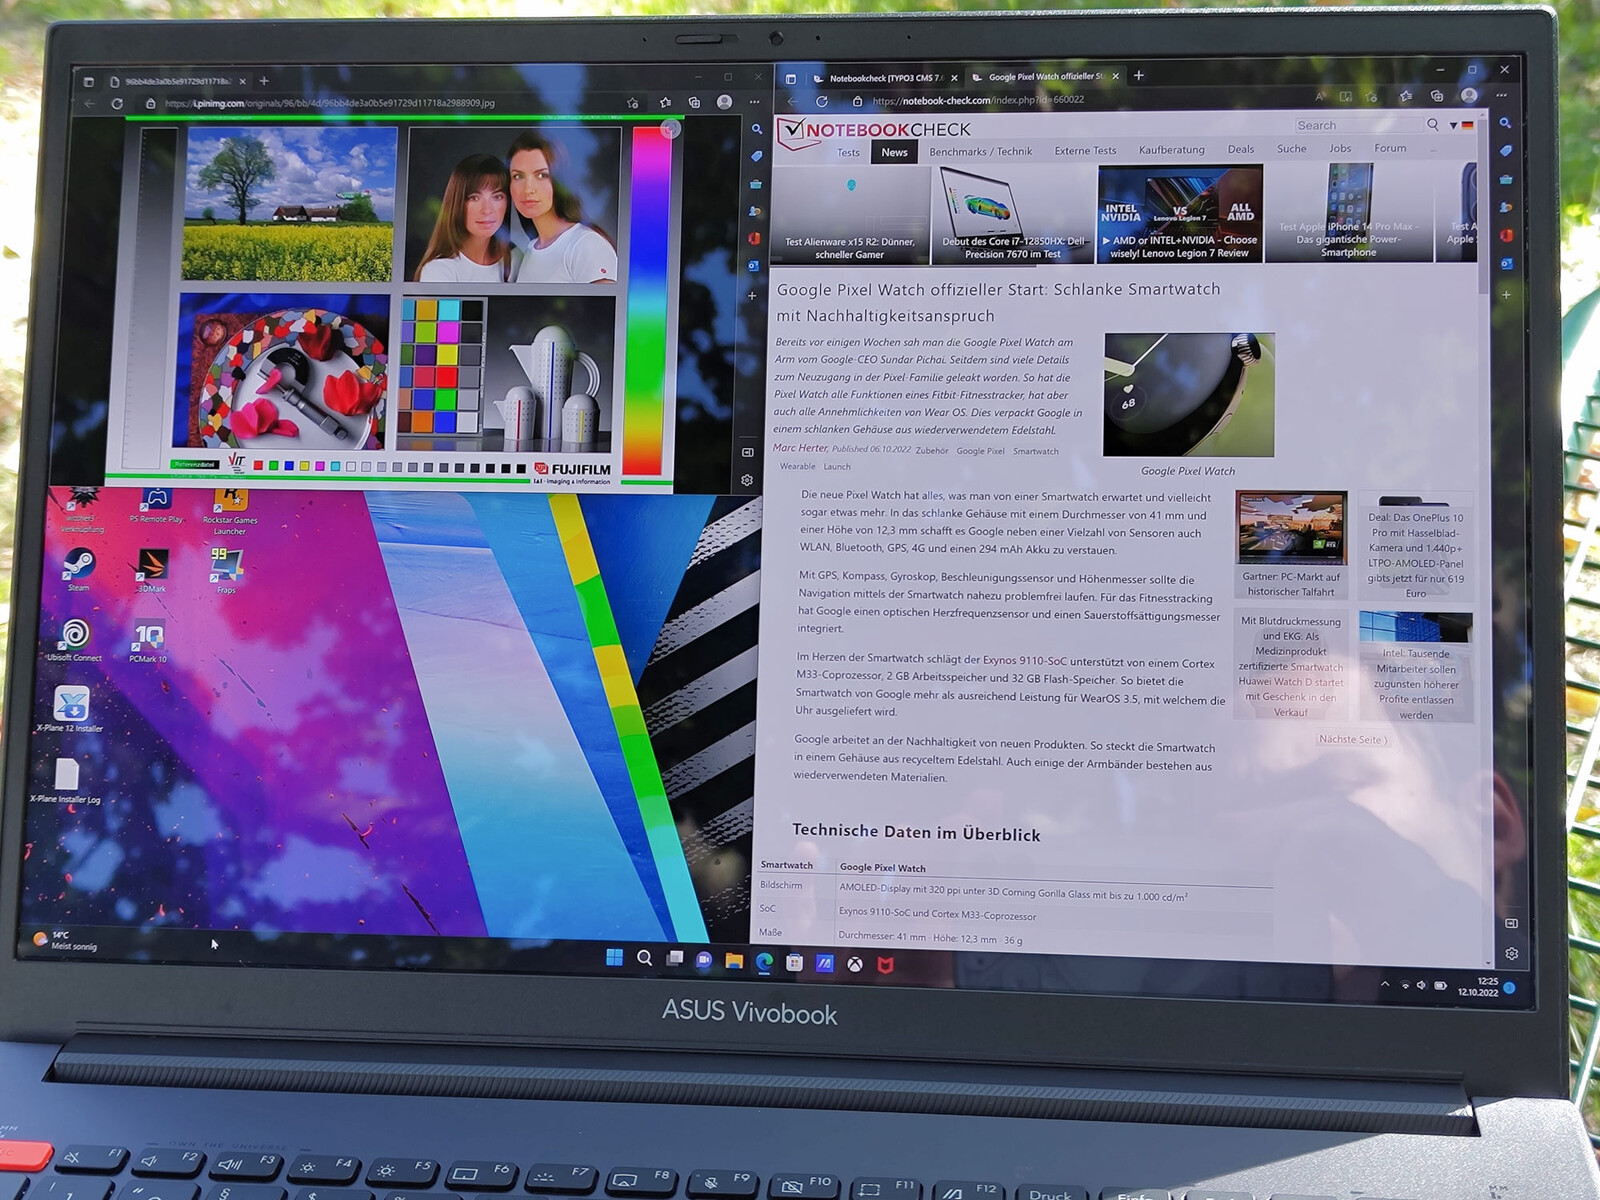
Visor - PC Windows com 16:10 OLED

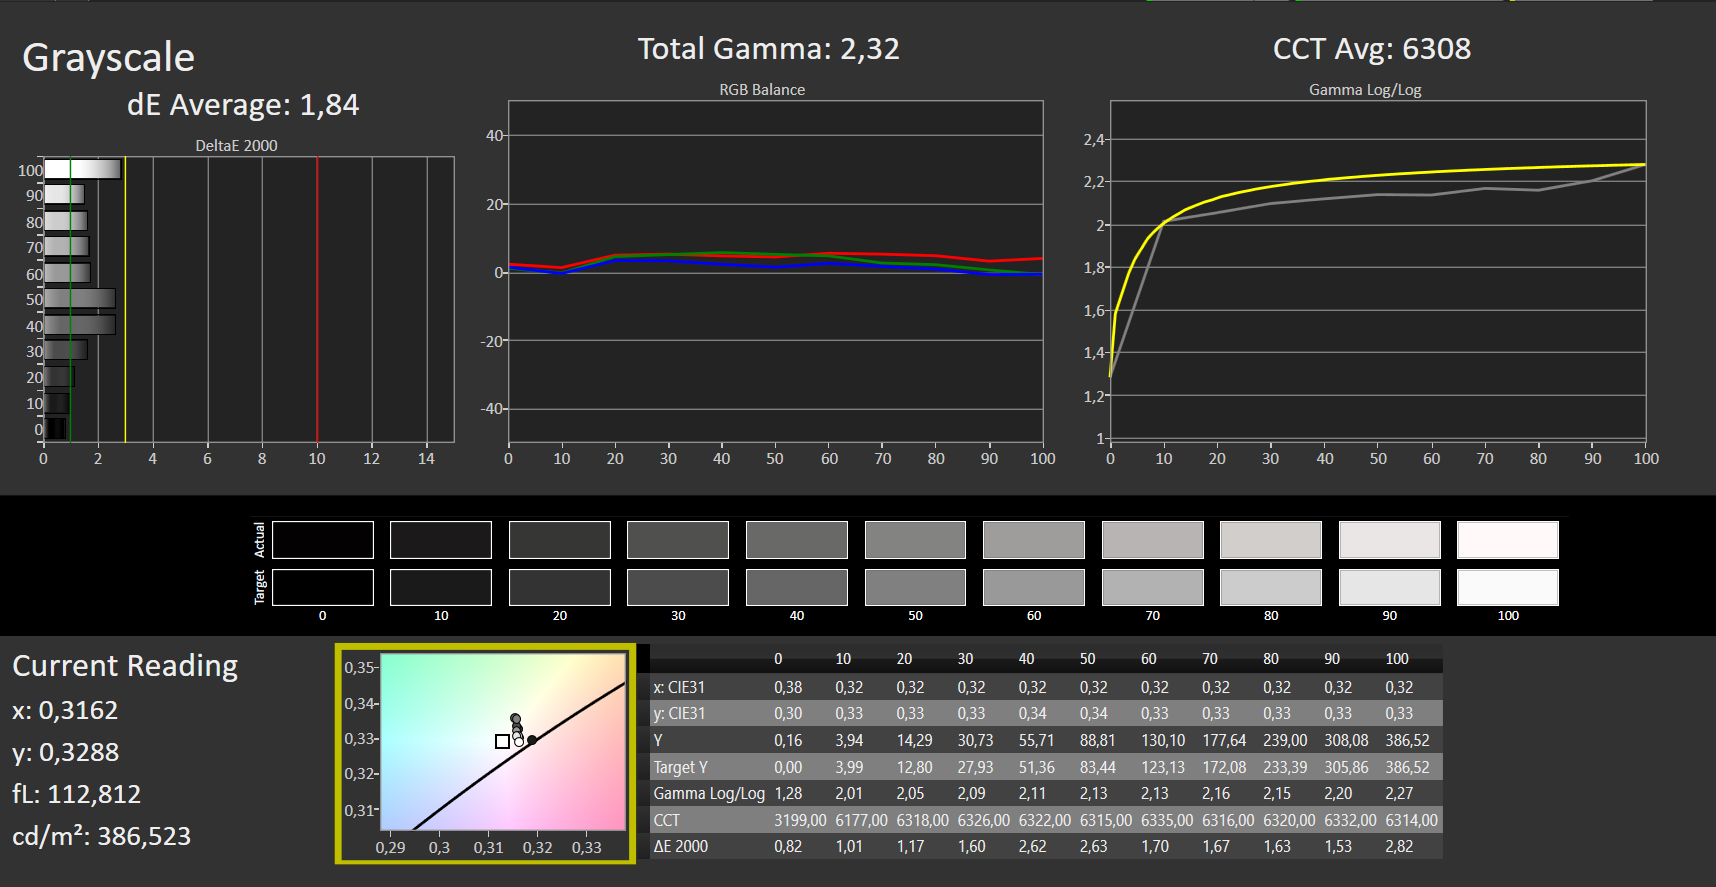
A grande exibição do Vivobook Pro 16X OLED é sua melhor característica de longe - isto é tanto uma coisa boa como uma coisa ruim. A tela é Pantone validada para uma excelente cobertura de espaço de cor com desvios de cor muito baixos à saída da fábrica. A tela 16:10 oferece cores naturais, um alto brilho máximo e uma resolução nativa de 3840 x 2400 pixels. No entanto, o painel OLED brilhante também apresenta inconvenientes. Brilho e reflexos são comuns sob a luz solar ou condições de iluminação subótimas.
A iluminação é muito uniforme, o que é típico dos painéis OLED. O desvio máximo em relação à média de 390-nit é de apenas 7 lêndeas. Devido à tecnologia subjacente, não há sangramento na tela. Da mesma forma, a relação de contraste de 2394:1 é excelente.
| |||||||||||||||||||||||||
iluminação: 96 %
iluminação com acumulador: 383 cd/m²
Contraste: 14185:1 (Preto: 0.027 cd/m²)
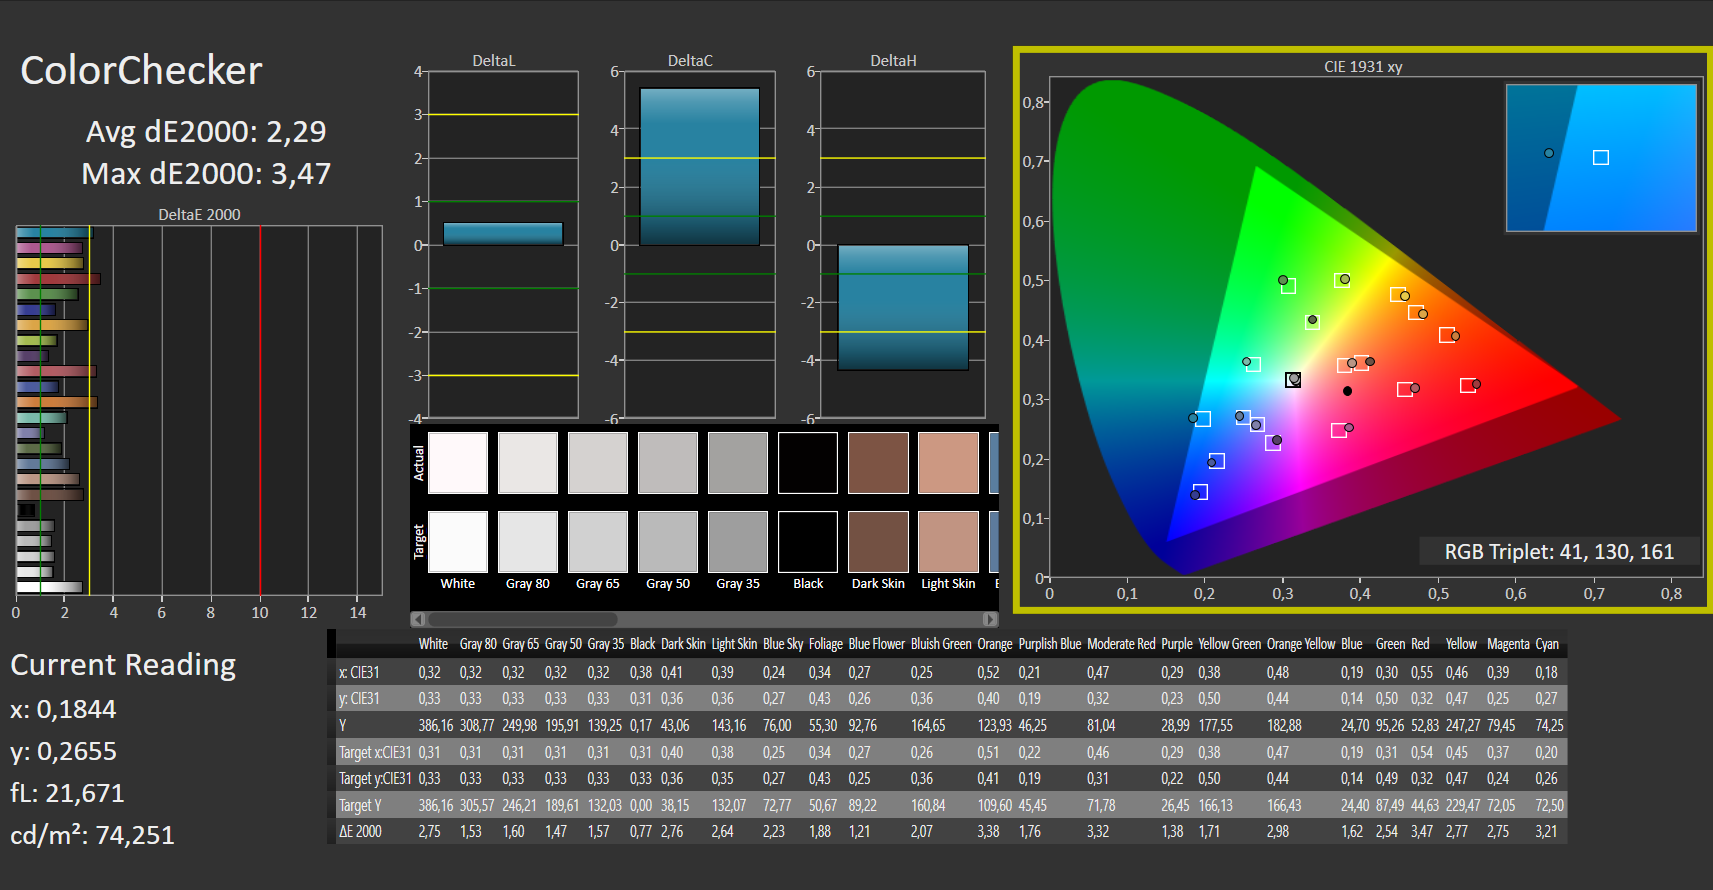
ΔE ColorChecker Calman: 2.29 | ∀{0.5-29.43 Ø4.71}
ΔE Greyscale Calman: 1.84 | ∀{0.09-98 Ø4.96}
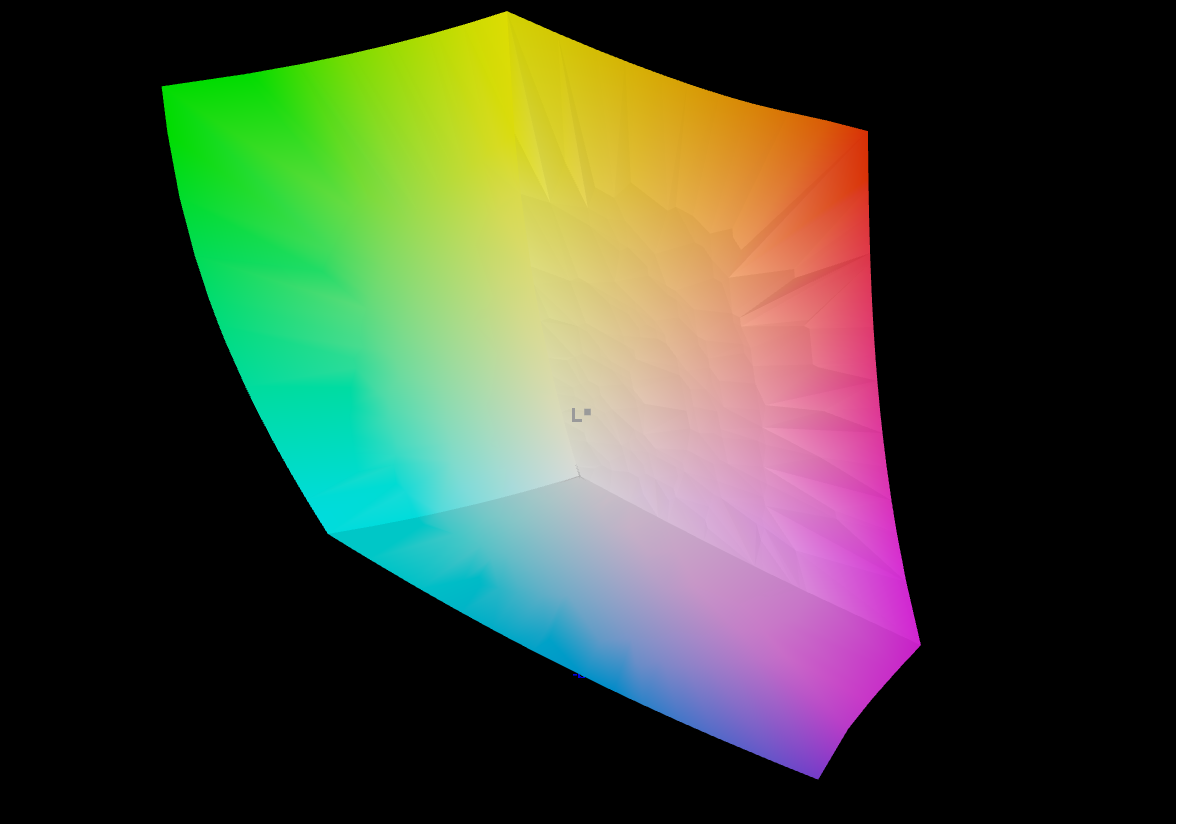
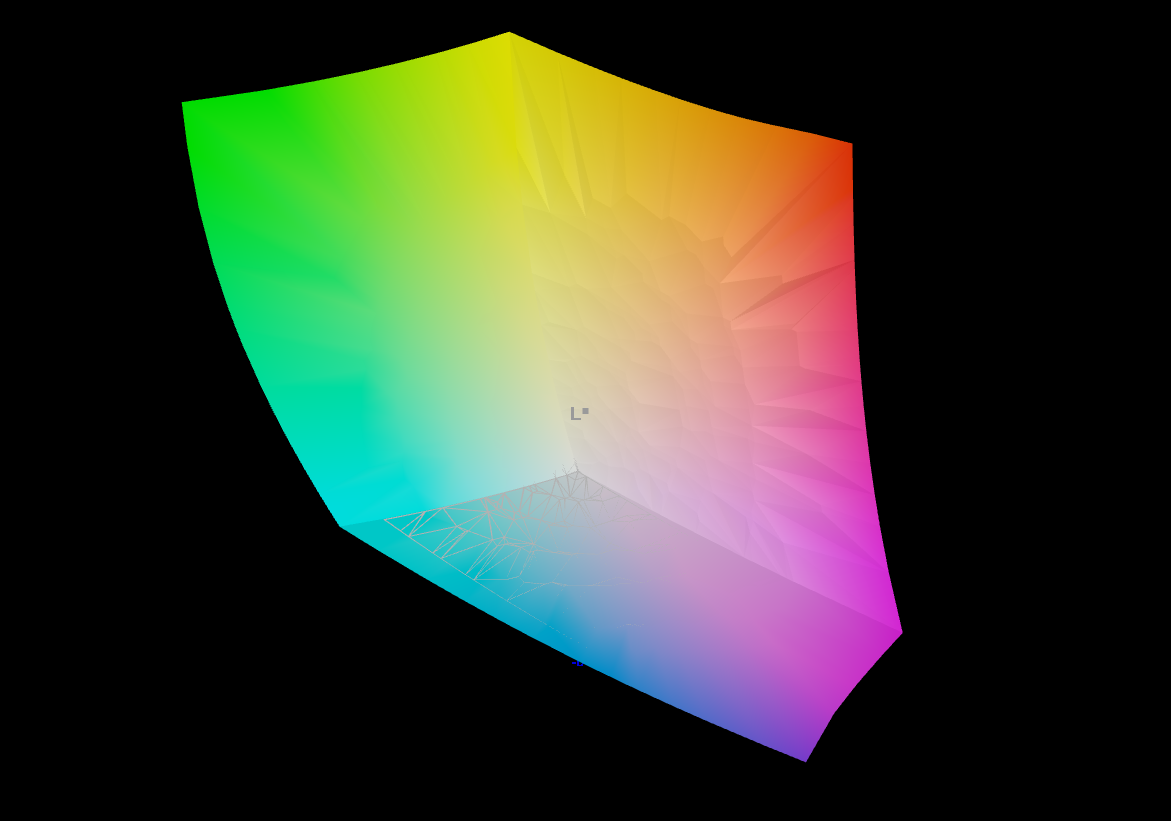
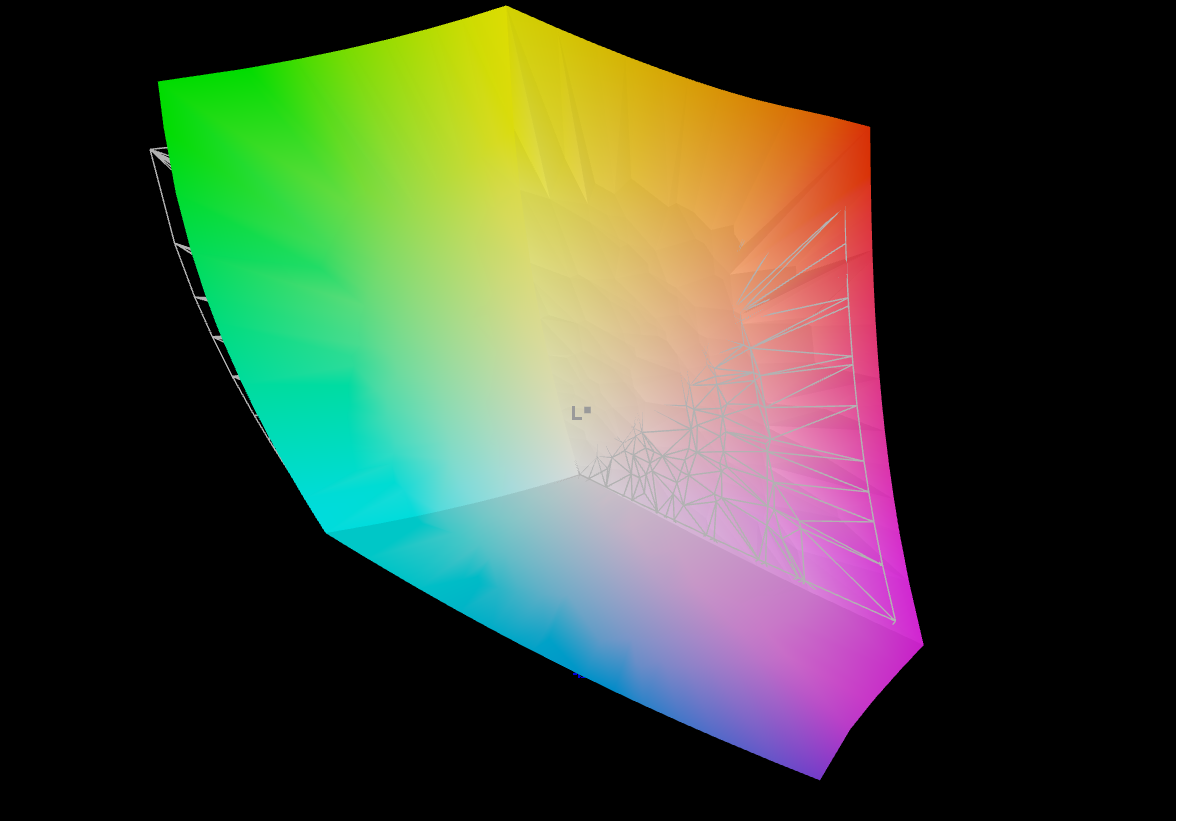
98.05% AdobeRGB 1998 (Argyll 3D)
100% sRGB (Argyll 3D)
99.9% Display P3 (Argyll 3D)
Gamma: 2.32
CCT: 6308 K
| Asus VivoBook Pro 16X OLED N7600PC-L2026X Samsung ATNA60YV02-0, OLED, 3840x2400, 16" | MSI Summit E16 Flip A12UDT-031 AU Optronics B16QAN02.N, IPS, 2560x1600, 16" | Microsoft Surface Laptop Studio i7 RTX 3050 Ti LQ144P1JX01, IPS, 2400x1600, 14.4" | Dell Inspiron 16 Plus 7610 AU Optronics B160QAN, IPS, 3072x1920, 16" | Lenovo ThinkPad X1 Extreme G4-20Y5CTO1WW (3050 Ti) LP160UQ1-SPB1, IPS LED, 3840x2400, 16" | Schenker XMG Focus 15 LG Philips LP156WFG-SPB5, IPS, 1920x1080, 15.6" | |
|---|---|---|---|---|---|---|
| Display | -4% | -13% | -17% | -6% | -24% | |
| Display P3 Coverage (%) | 99.9 | 98.9 -1% | 80.6 -19% | 74.1 -26% | 84.3 -16% | 64.6 -35% |
| sRGB Coverage (%) | 100 | 100 0% | 99.9 0% | 99.4 -1% | 98.3 -2% | 95.3 -5% |
| AdobeRGB 1998 Coverage (%) | 98.05 | 86.5 -12% | 78.5 -20% | 75.8 -23% | 97.8 0% | 66.5 -32% |
| Response Times | -775% | -3420% | -3280% | -3950% | -1020% | |
| Response Time Grey 50% / Grey 80% * (ms) | 1 | 13 ? -1200% | 58.4 ? -5740% | 49.2 ? -4820% | 60 ? -5900% | 18 ? -1700% |
| Response Time Black / White * (ms) | 2 ? | 9 ? -350% | 24 ? -1100% | 36.8 ? -1740% | 42 ? -2000% | 8.8 ? -340% |
| PWM Frequency (Hz) | 247 ? | 5000 ? | ||||
| Screen | -161% | -118% | -114% | -208% | -196% | |
| Brightness middle (cd/m²) | 383 | 314 -18% | 497 30% | 296.8 -23% | 639 67% | 418 9% |
| Brightness (cd/m²) | 390 | 294 -25% | 491 26% | 292 -25% | 612 57% | 376 -4% |
| Brightness Distribution (%) | 96 | 89 -7% | 92 -4% | 87 -9% | 84 -12% | 83 -14% |
| Black Level * (cd/m²) | 0.027 | 0.28 -937% | 0.29 -974% | 0.21 -678% | 0.47 -1641% | 0.41 -1419% |
| Contrast (:1) | 14185 | 1121 -92% | 1714 -88% | 1413 -90% | 1360 -90% | 1020 -93% |
| Colorchecker dE 2000 * | 2.29 | 3.08 -34% | 1.2 48% | 2.56 -12% | 2.2 4% | 1.67 27% |
| Colorchecker dE 2000 max. * | 3.47 | 5.49 -58% | 2.8 19% | 4.76 -37% | 5.3 -53% | 3.88 -12% |
| Greyscale dE 2000 * | 1.84 | 3.99 -117% | 1.9 -3% | 2.6 -41% | 1.7 8% | 2.9 -58% |
| Gamma | 2.32 95% | 2.3 96% | 2.14 103% | 2.07 106% | 2.31 95% | 2.26 97% |
| CCT | 6308 103% | 6219 105% | 6821 95% | 6628 98% | 6390 102% | 6209 105% |
| Colorchecker dE 2000 calibrated * | 0.88 | 0.8 | 1.86 | 1.4 | 0.98 | |
| Média Total (Programa/Configurações) | -313% /
-219% | -1184% /
-602% | -1137% /
-579% | -1388% /
-737% | -413% /
-283% |
* ... menor é melhor
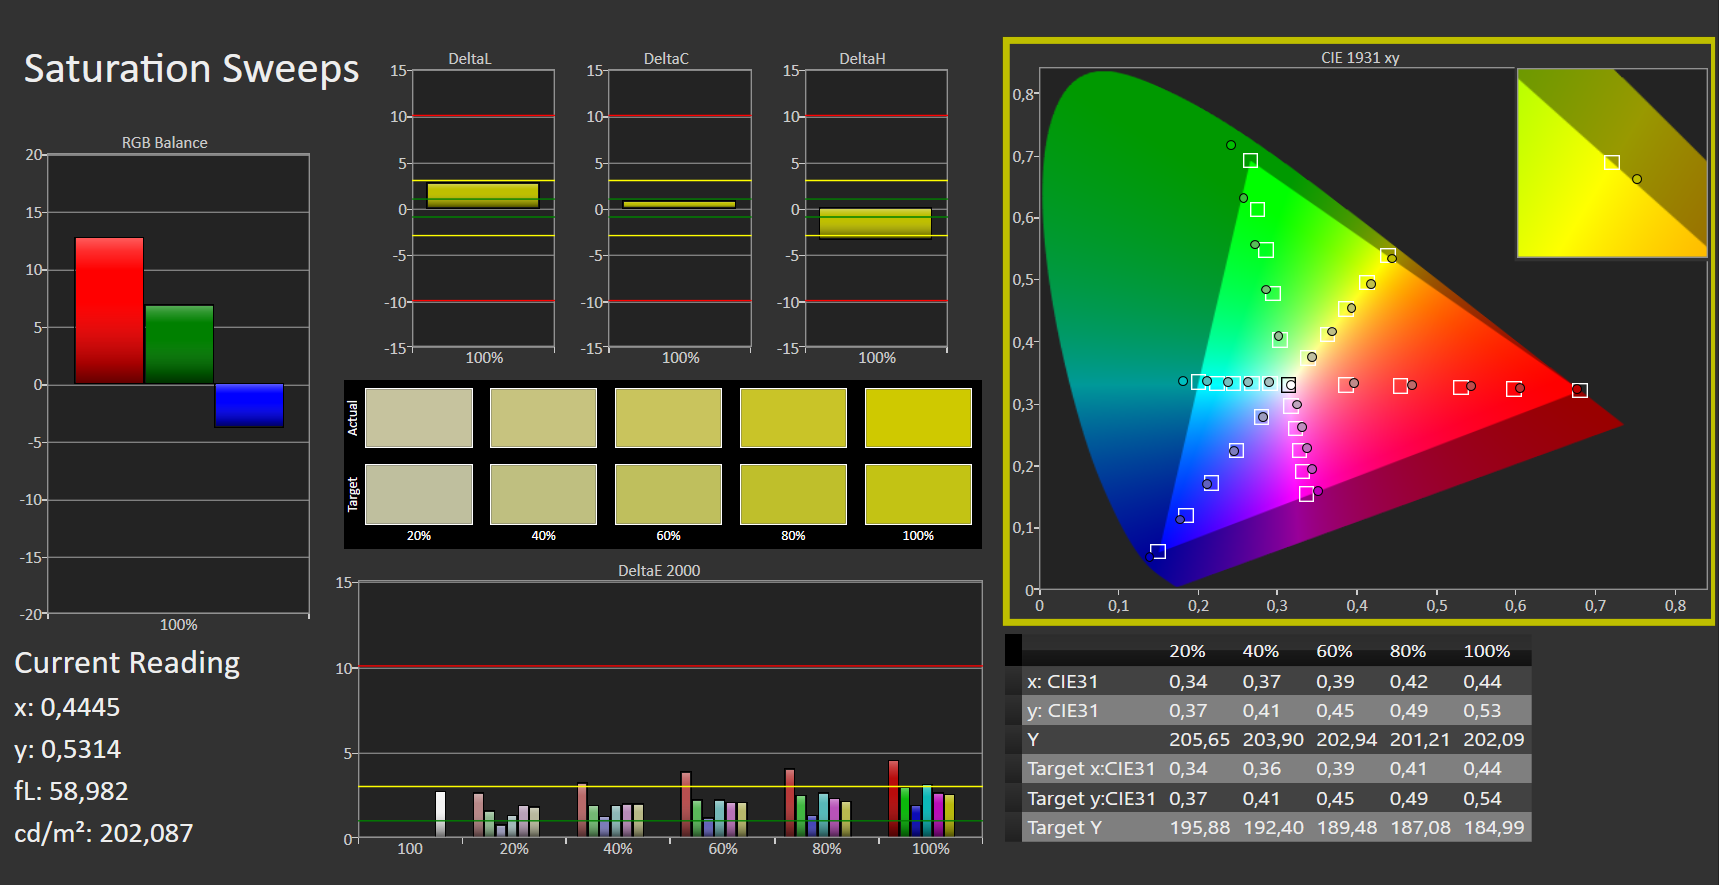
A validação de um display Pantone não se traduz necessariamente em uma ampla cobertura de espaço de cores ou cores extremamente precisas em todos os casos. O sistema de cores Pantone foi introduzido para tornar as cores para produtos e impressões mais comparáveis e previsíveis. Embora o sistema de cores, que abrange 1867 cores individuais para impressões e muitas outras cores específicas para produtos, seja bastante extenso, ele não necessariamente cobre totalmente grandes espaços de cores como a DisplayP3. Como resultado, um monitor que cobre apenas o menor espaço de cor sRGB ainda pode preencher os requisitos para o sistema de correspondência Pantone. Além disso, os desvios de cor fora do sistema Pantone podem ser maiores.
Em resumo, ainda vale a pena determinar quais espaços de cor uma tela é capaz de exibir e para quais casos de uso ela é adequada, mesmo no caso de uma tela validada Pantone. Os requisitos para a edição de vídeo podem ser muito diferentes dos requisitos de design gráfico para mídia impressa.
O painel OLED do Asus Vivobook cobre quase 100% do espaço das três cores relevantes. Graças à boa cobertura AdobeRGB e DisplayP3, o display é bem adequado para fotografia e edição de vídeo, respectivamente.
O display do Asus Vivobook validado pela Pantone tem um desvio de cor muito baixo à saída da fábrica. Em nosso teste com o software CalMAN ColorChecker, os desvios máximos de cor excedem apenas ligeiramente o valor deltaE alvo de 3. Com um deltaE médio de 2,29, a tela cai confortavelmente na faixa ideal.
Exibir tempos de resposta
| ↔ Tempo de resposta preto para branco | ||
|---|---|---|
| 2 ms ... ascensão ↗ e queda ↘ combinadas | ↗ 1 ms ascensão |  |
| ↘ 1 ms queda | ||
| A tela mostra taxas de resposta muito rápidas em nossos testes e deve ser muito adequada para jogos em ritmo acelerado. Em comparação, todos os dispositivos testados variam de 0.1 (mínimo) a 240 (máximo) ms. » 11 % de todos os dispositivos são melhores. Isso significa que o tempo de resposta medido é melhor que a média de todos os dispositivos testados (19.8 ms). | ||
| ↔ Tempo de resposta 50% cinza a 80% cinza | ||
| 1 ms ... ascensão ↗ e queda ↘ combinadas | ↗ 0 ms ascensão |  |
| ↘ 0 ms queda | ||
| A tela mostra taxas de resposta muito rápidas em nossos testes e deve ser muito adequada para jogos em ritmo acelerado. Em comparação, todos os dispositivos testados variam de 0.165 (mínimo) a 636 (máximo) ms. » 4 % de todos os dispositivos são melhores. Isso significa que o tempo de resposta medido é melhor que a média de todos os dispositivos testados (30.9 ms). | ||
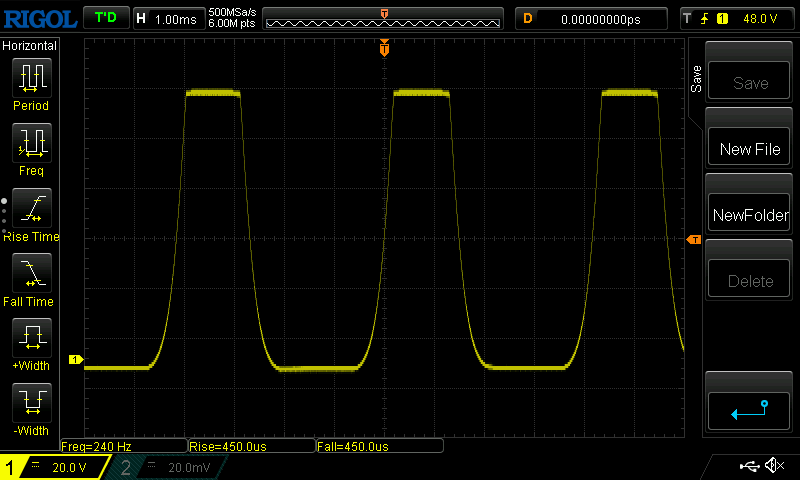
Cintilação da tela / PWM (modulação por largura de pulso)
| Tela tremeluzindo/PWM detectado | 247 Hz | ≤ 50 % configuração de brilho |  |
A luz de fundo da tela pisca em 247 Hz (pior caso, por exemplo, utilizando PWM) Cintilação detectada em uma configuração de brilho de 50 % e abaixo. Não deve haver cintilação ou PWM acima desta configuração de brilho. A frequência de 247 Hz é relativamente baixa, portanto, usuários sensíveis provavelmente notarão cintilação e sentirão fadiga ocular na configuração de brilho indicada e abaixo. [pwm_comparison] Em comparação: 52 % de todos os dispositivos testados não usam PWM para escurecer a tela. Se PWM foi detectado, uma média de 7744 (mínimo: 5 - máximo: 343500) Hz foi medida. | |||
Como de costume, a cintilação do visor OLED varia dependendo do ajuste de brilho, bem como das imagens exibidas. No caso do Vivobook Pro 16X, só detectamos cintilação em níveis de brilho de 50% e inferiores. Como esperado, o visor não escurece simultaneamente em sua totalidade e, em vez disso, apenas reduz o brilho em determinadas linhas. Isto reduz a fadiga visual no visor OLED quando comparado a um visor LCD com a mesma freqüência de cintilação.


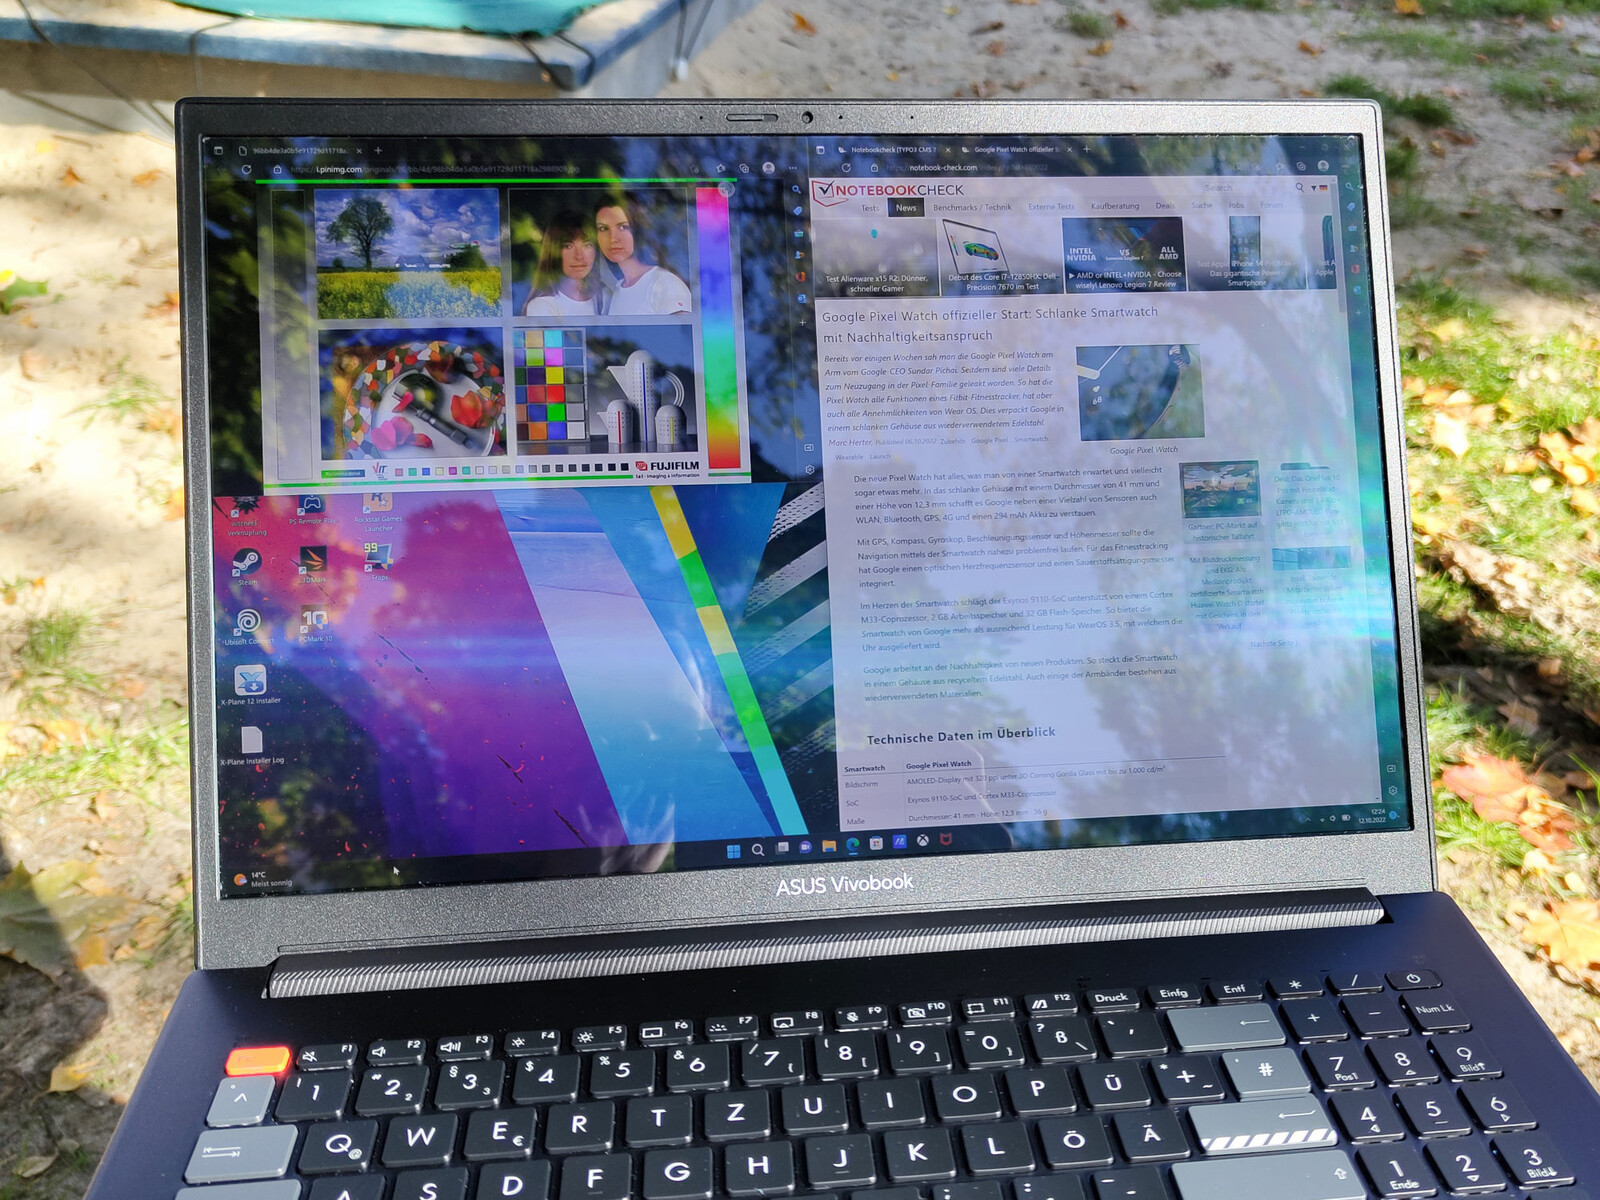
Apesar de seu alto brilho máximo, o visor brilhante OLED não é bem adequado para uso externo. O brilho e os reflexos degradam a qualidade da imagem percebida, particularmente quando o sol está brilhando. Em ângulos particularmente desfavoráveis sob o sol ou outras fontes de luz brilhante, o visor OLED mostra os padrões característicos de refração verde.
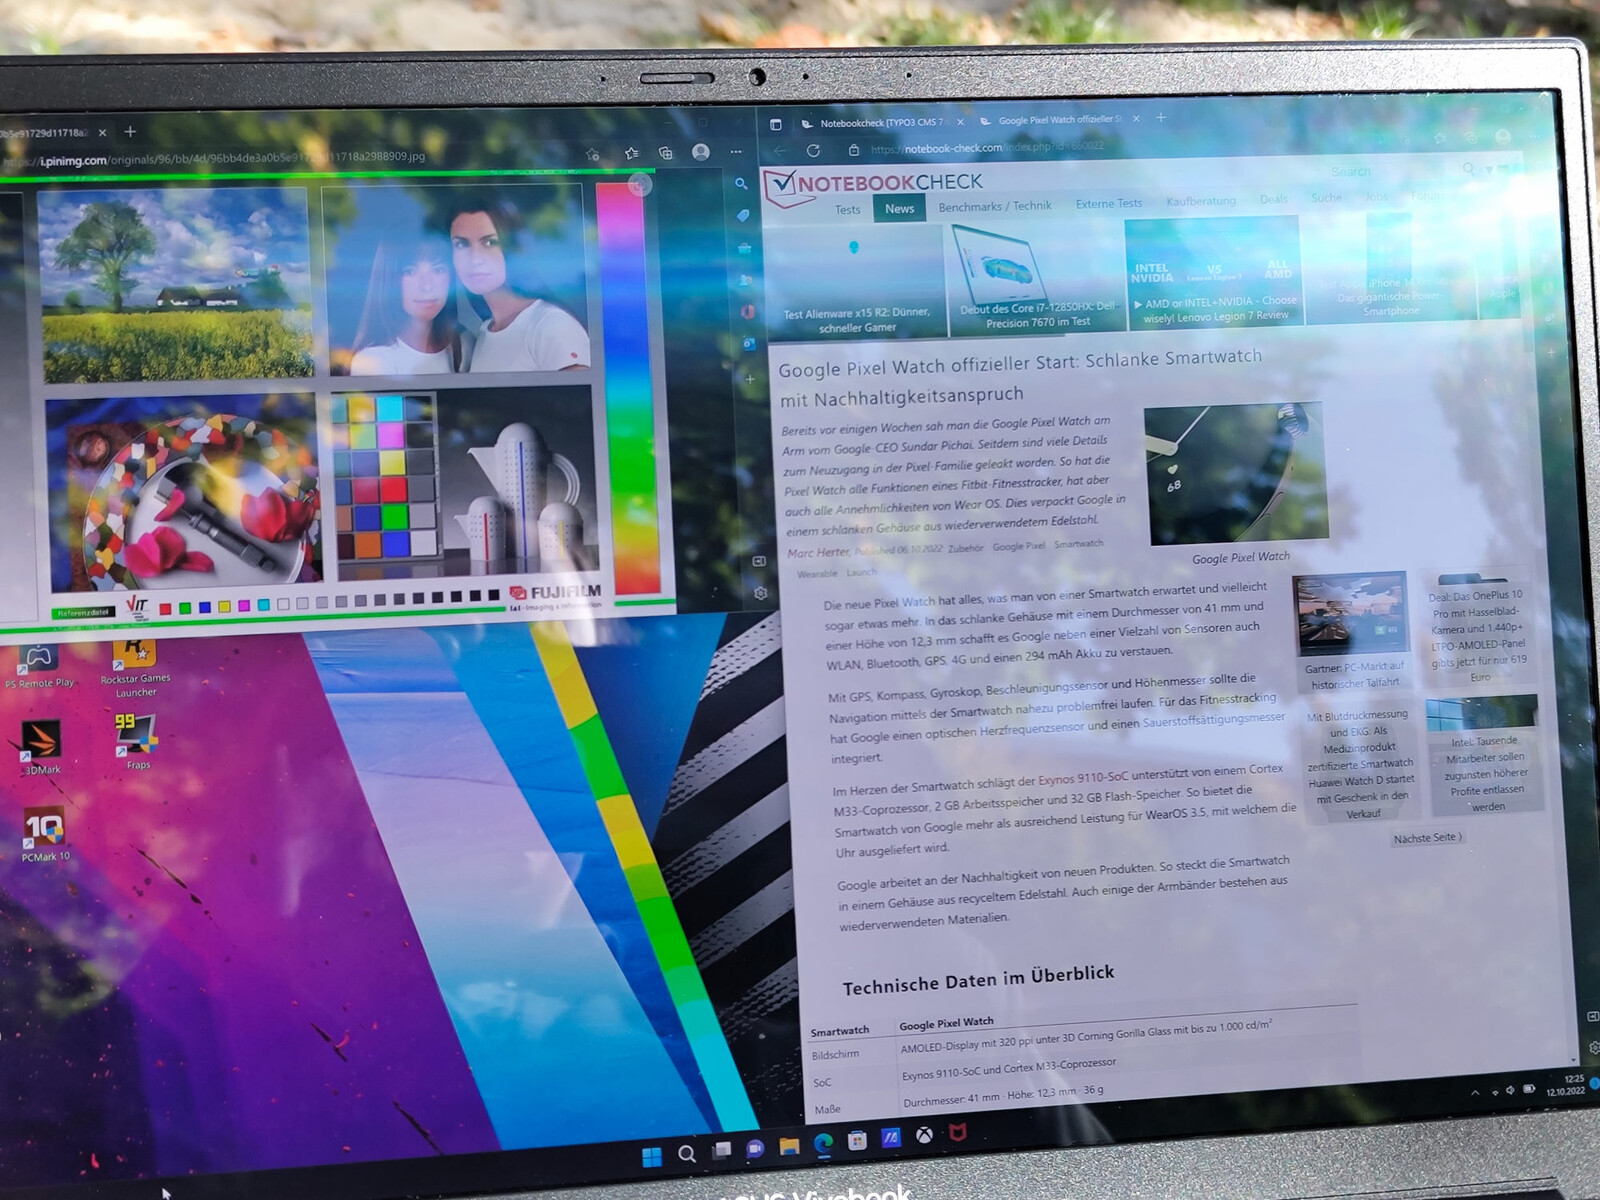
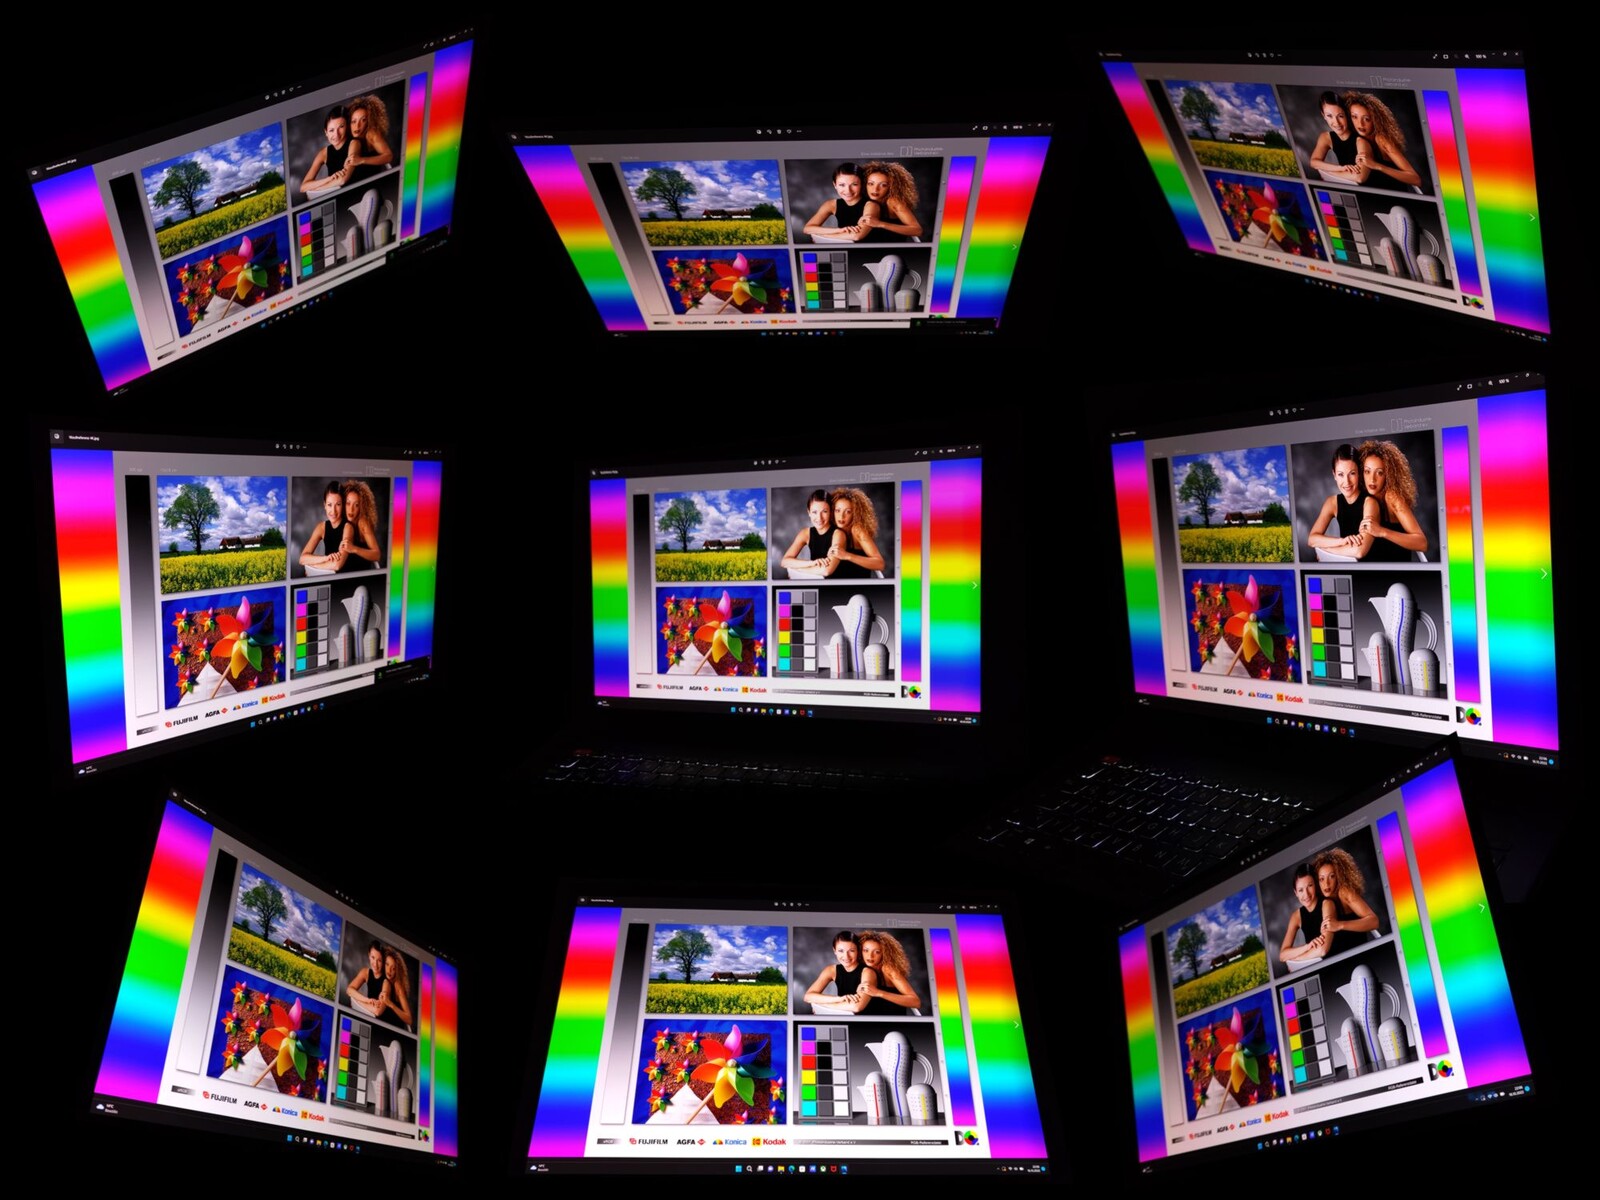
O visor de 16 polegadas não mostra nenhuma fraqueza em nossa análise do ângulo de visão. Mesmo de ângulos extremos, o brilho percebido e a precisão da cor do visor é excelente.
Desempenho - Joy and Grief with the Nvidia Studio Drivers
Há várias configurações do Asus Vivobook Pro 16X OLED disponíveis. Além dos processadores Intel 11th e 12th gen, o fabricante também oferece CPUs série AMD-Ryzen-5000 e AMD-Ryzen-6000. As opções de dGPU vão desde a Nvidia GeForce RTX 3050 até a GPU 3070 Ti.
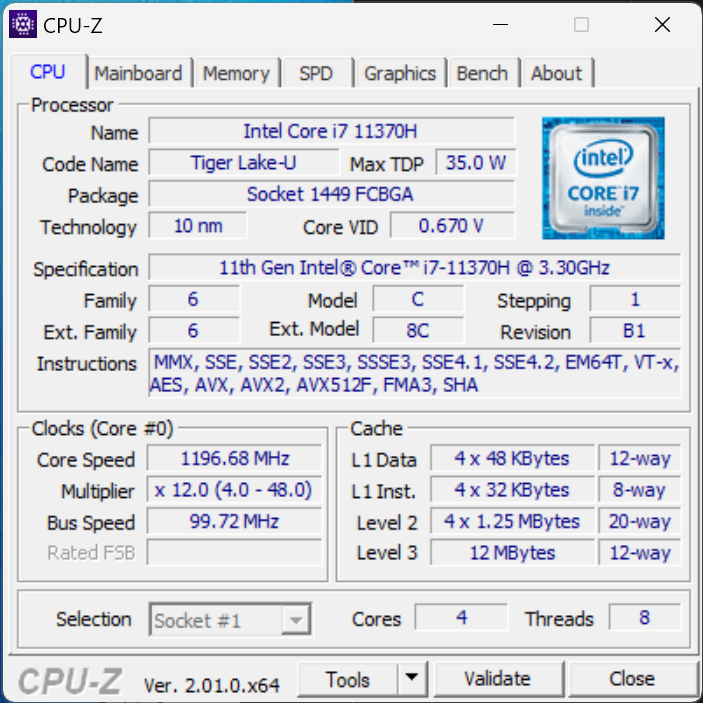
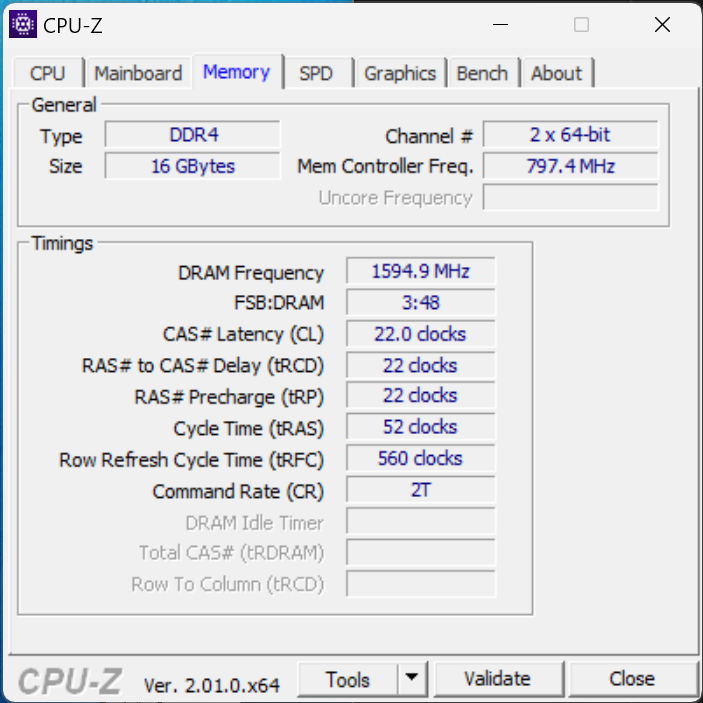
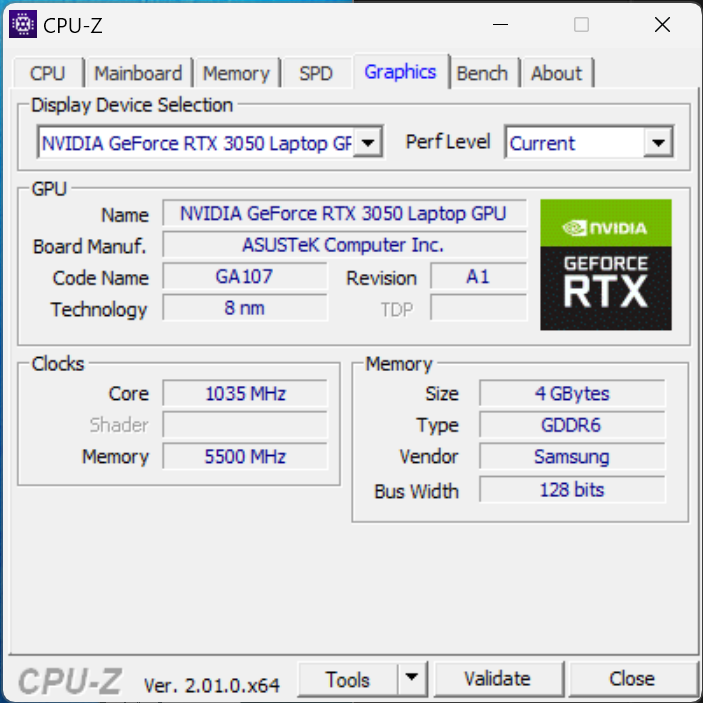
Nossa configuração se baseia em uma Intel Core i7 11370H CPU, uma GeForce RTX 3050 GPU, e 16 GB de RAM.
Condições de teste
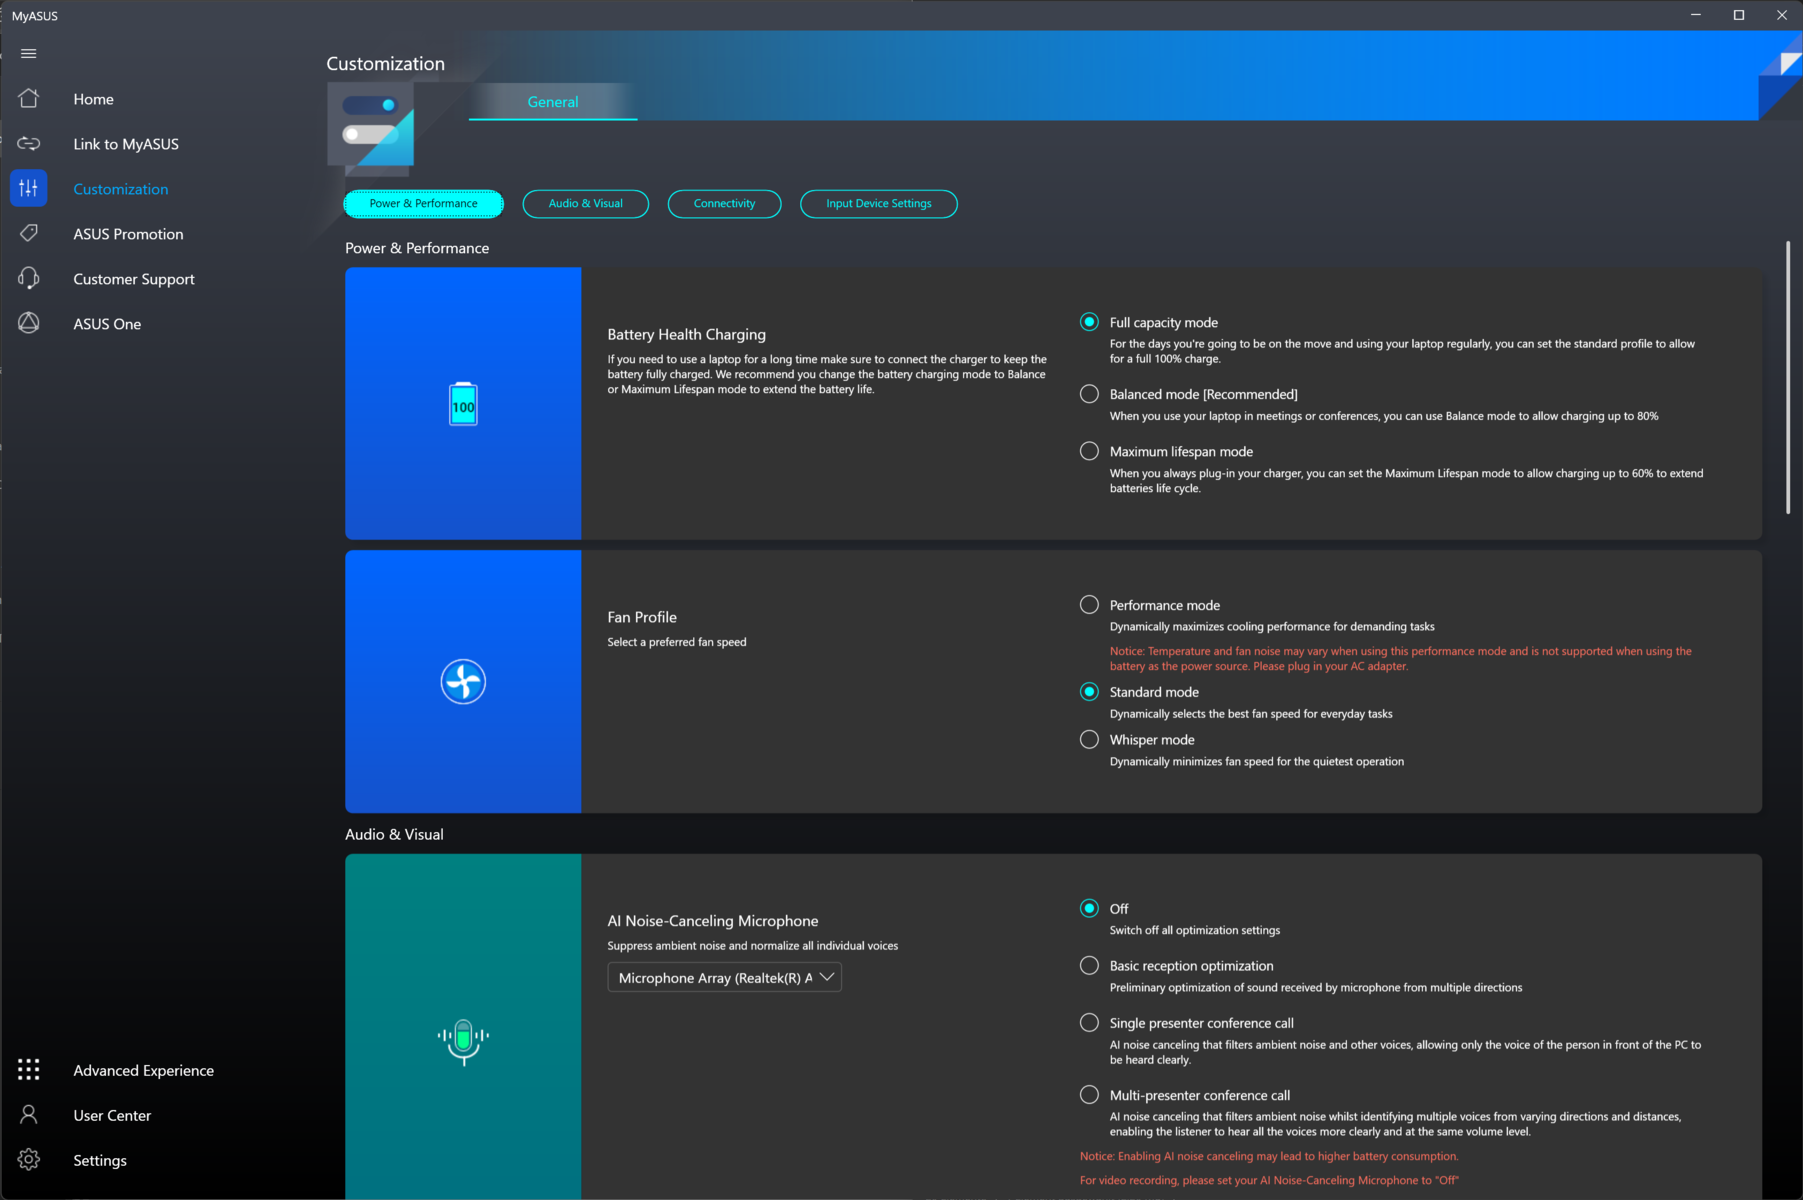
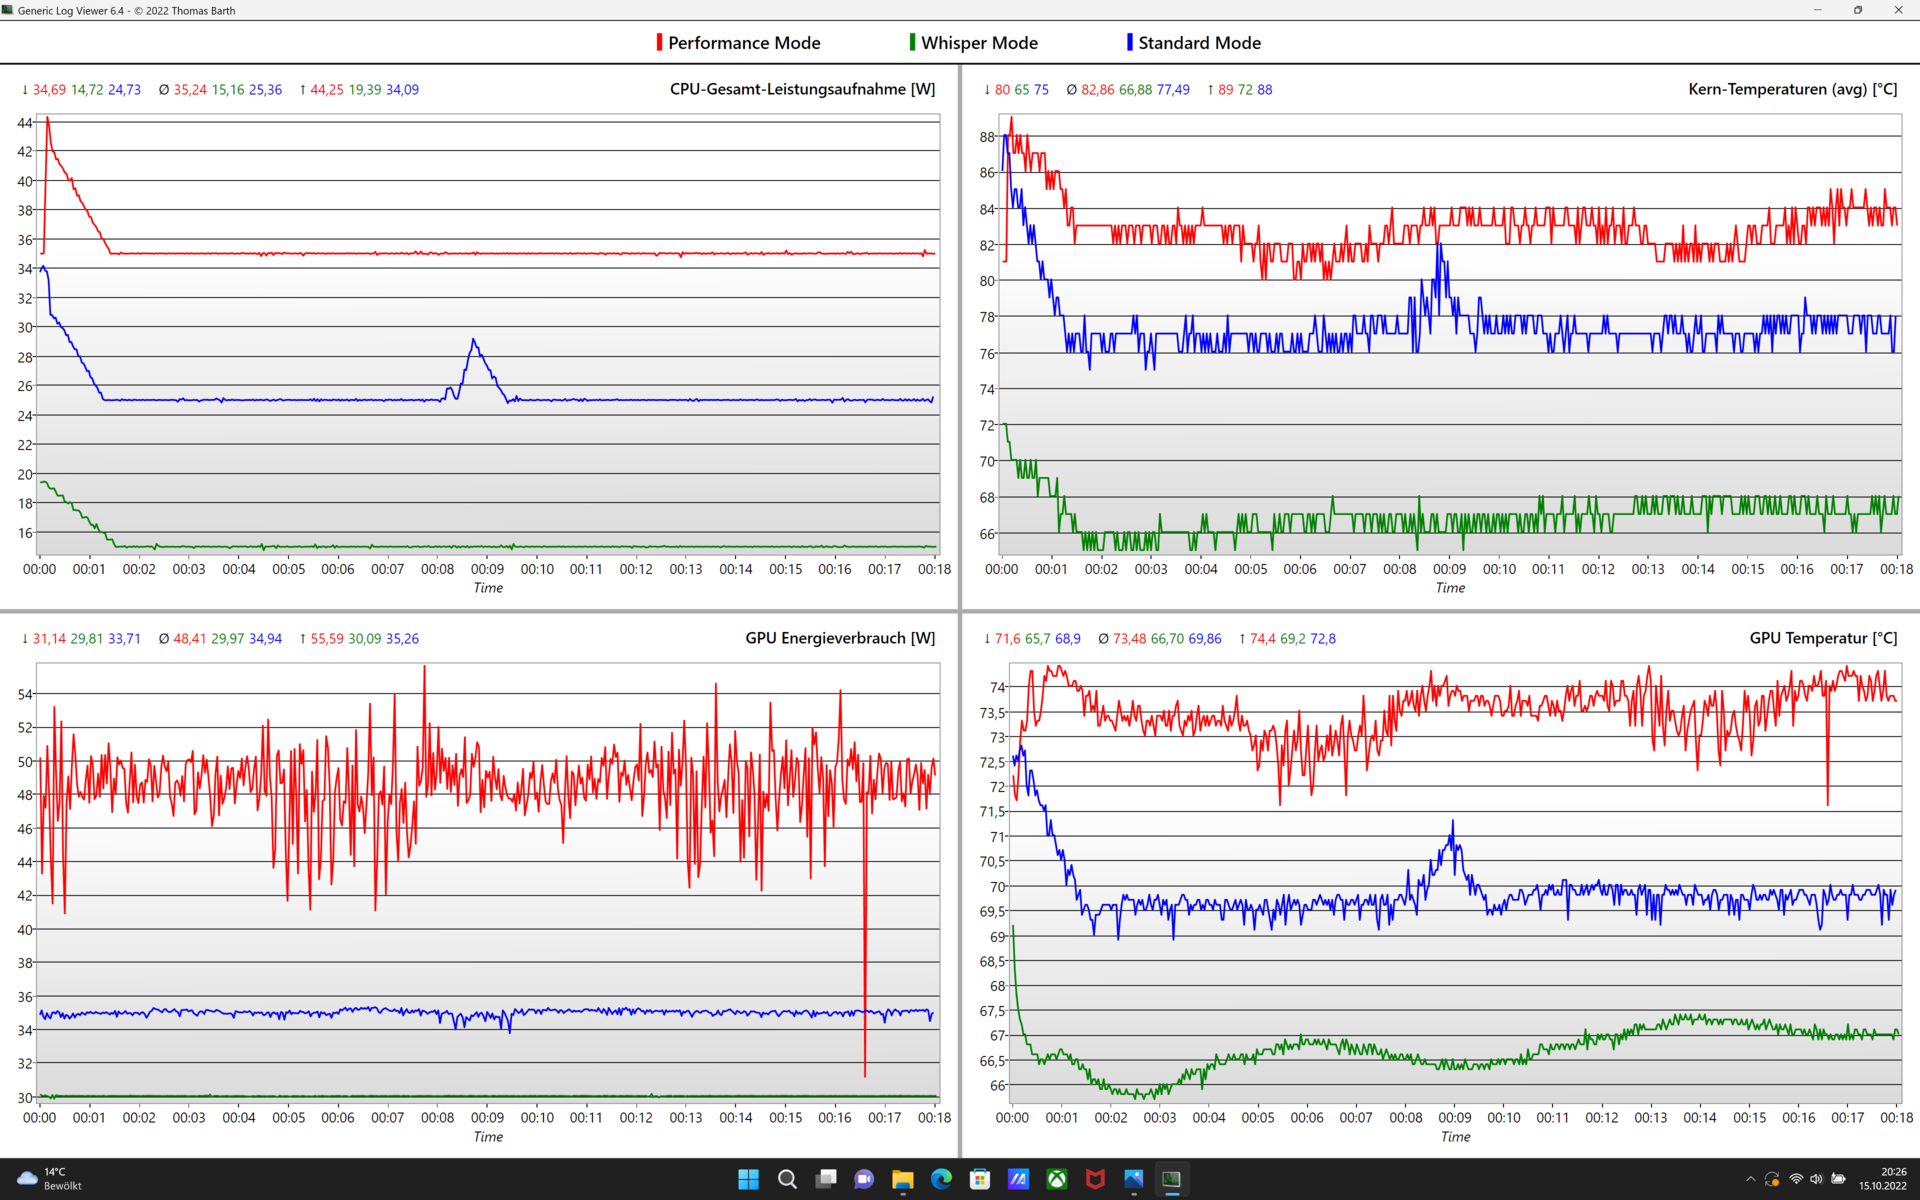
Quando se trata das configurações de energia do laptop, o Asus usa valores que excedem o TDP recomendado pela Intel em alguns casos. De acordo com nossos registros, oIntel Core i7 11370Hsustenta uma potência de até 45 W por curtos períodos. Entretanto, o consumo de energia da CPU pode cair para 25 W, dependendo da configuração do ventilador. A GPU dedicada da Nvidia GeForce RTX 3050 dentro do Vivobook é limitada a 50 watts. O modelo parece ser a menor variante Max-Q da placa gráfica. Para desenhar os 50 watts completos, a placa gráfica tem que fazer uso do orçamento de energia que compartilha com o processador. O consumo combinado não deve exceder 85 watts no modo de desempenho. Enquanto isso, os modos padrão e sussurro permitem um consumo combinado de apenas 60 e 45 watts, respectivamente.
Selecionamos o modo de desempenho do Asus antes de realizar os seguintes benchmarks. A fim de determinar a duração da bateria, escolhemos o modo de economia de energia. Para nossos testes de ruído, usamos todos os três modos de ventiladores.
Processador
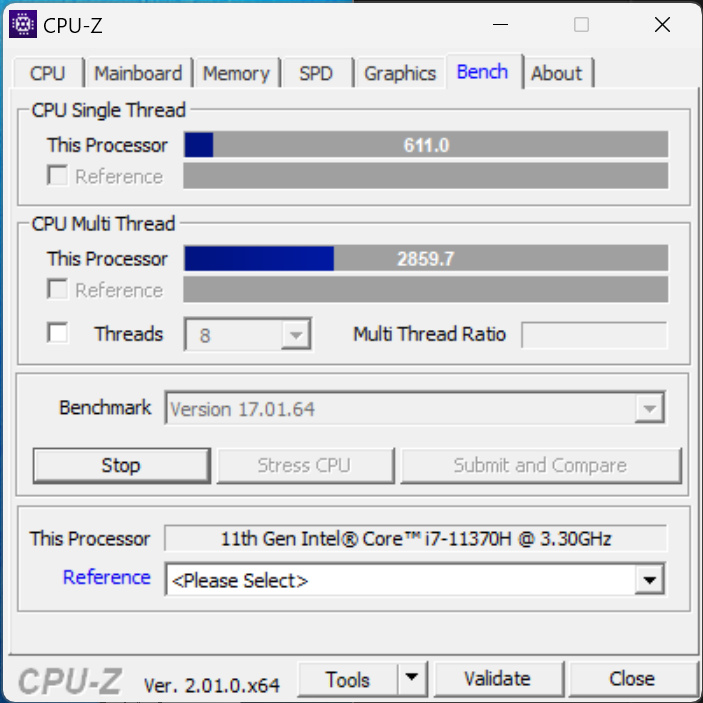
Nosso dispositivo de teste utiliza uma CPU Intel Core i7-11370H. Este processador é projetado para laptops finos, porém potentes e o TDP pode ser configurado com relativa liberdade. Com 35 watts, o Asus excede até mesmo o valor máximo recomendado pela Intel. Entretanto, este valor só é alcançado quando apenas a CPU está estressada e mesmo assim limitada a apenas alguns minutos. 55 watts de desempenho de impulso significa que o Intel SoC tem muito espaço de manobra. Dito isto, o Asus Vivobook Pro é mais um velocista do que um corredor de maratona. O alto nível de desempenho, que o laptop é capaz de alcançar com o 11370H, cai rapidamente após pouco tempo. O i7 da 11ª geração também não pode competir com os processadores Intel 12th gen, muito mais potentes.
Uma vez que o uso normal requer, na maioria das vezes, curtos intervalos de desempenho, o Vivobook é agradavelmente responsivo durante o uso diário. Em contraste, o laptop multimídia fica para trás nos benchmarks com estresse prolongado.
Cinebench R15 Multi Loop
Cinebench R23: Multi Core | Single Core
Cinebench R20: CPU (Multi Core) | CPU (Single Core)
Cinebench R15: CPU Multi 64Bit | CPU Single 64Bit
Blender: v2.79 BMW27 CPU
7-Zip 18.03: 7z b 4 | 7z b 4 -mmt1
Geekbench 5.5: Multi-Core | Single-Core
HWBOT x265 Benchmark v2.2: 4k Preset
LibreOffice : 20 Documents To PDF
R Benchmark 2.5: Overall mean
| CPU Performance rating | |
| Média da turma Multimedia | |
| MSI Summit E16 Flip A12UDT-031 | |
| Lenovo ThinkPad X1 Extreme G4-20Y5CTO1WW (3050 Ti) | |
| Dell Inspiron 16 Plus 7610 -2! | |
| Schenker XMG Focus 15 | |
| Microsoft Surface Laptop Studio i7 RTX 3050 Ti | |
| Média Intel Core i7-11370H | |
| Xiaomi Mi NoteBook Pro | |
| Asus VivoBook Pro 16X OLED N7600PC-L2026X | |
| Cinebench R23 / Multi Core | |
| Média da turma Multimedia (4861 - 33362, n=65, últimos 2 anos) | |
| MSI Summit E16 Flip A12UDT-031 | |
| Lenovo ThinkPad X1 Extreme G4-20Y5CTO1WW (3050 Ti) | |
| Schenker XMG Focus 15 | |
| Dell Inspiron 16 Plus 7610 | |
| Microsoft Surface Laptop Studio i7 RTX 3050 Ti | |
| Média Intel Core i7-11370H (3696 - 6646, n=12) | |
| Xiaomi Mi NoteBook Pro | |
| Asus VivoBook Pro 16X OLED N7600PC-L2026X | |
| Cinebench R23 / Single Core | |
| Média da turma Multimedia (1128 - 2459, n=64, últimos 2 anos) | |
| MSI Summit E16 Flip A12UDT-031 | |
| Asus VivoBook Pro 16X OLED N7600PC-L2026X | |
| Lenovo ThinkPad X1 Extreme G4-20Y5CTO1WW (3050 Ti) | |
| Dell Inspiron 16 Plus 7610 | |
| Microsoft Surface Laptop Studio i7 RTX 3050 Ti | |
| Xiaomi Mi NoteBook Pro | |
| Média Intel Core i7-11370H (1081 - 1556, n=11) | |
| Schenker XMG Focus 15 | |
| Cinebench R20 / CPU (Multi Core) | |
| Média da turma Multimedia (1887 - 12912, n=56, últimos 2 anos) | |
| MSI Summit E16 Flip A12UDT-031 | |
| Lenovo ThinkPad X1 Extreme G4-20Y5CTO1WW (3050 Ti) | |
| Schenker XMG Focus 15 | |
| Dell Inspiron 16 Plus 7610 | |
| Microsoft Surface Laptop Studio i7 RTX 3050 Ti | |
| Média Intel Core i7-11370H (1438 - 2578, n=11) | |
| Xiaomi Mi NoteBook Pro | |
| Asus VivoBook Pro 16X OLED N7600PC-L2026X | |
| Cinebench R20 / CPU (Single Core) | |
| Média da turma Multimedia (425 - 853, n=56, últimos 2 anos) | |
| MSI Summit E16 Flip A12UDT-031 | |
| Asus VivoBook Pro 16X OLED N7600PC-L2026X | |
| Lenovo ThinkPad X1 Extreme G4-20Y5CTO1WW (3050 Ti) | |
| Dell Inspiron 16 Plus 7610 | |
| Microsoft Surface Laptop Studio i7 RTX 3050 Ti | |
| Média Intel Core i7-11370H (475 - 601, n=11) | |
| Xiaomi Mi NoteBook Pro | |
| Schenker XMG Focus 15 | |
| Cinebench R15 / CPU Multi 64Bit | |
| Média da turma Multimedia (856 - 5224, n=60, últimos 2 anos) | |
| MSI Summit E16 Flip A12UDT-031 | |
| Lenovo ThinkPad X1 Extreme G4-20Y5CTO1WW (3050 Ti) | |
| Schenker XMG Focus 15 | |
| Dell Inspiron 16 Plus 7610 | |
| Asus VivoBook Pro 16X OLED N7600PC-L2026X | |
| Microsoft Surface Laptop Studio i7 RTX 3050 Ti | |
| Média Intel Core i7-11370H (606 - 1086, n=17) | |
| Xiaomi Mi NoteBook Pro | |
| Cinebench R15 / CPU Single 64Bit | |
| Média da turma Multimedia (184.8 - 326, n=58, últimos 2 anos) | |
| MSI Summit E16 Flip A12UDT-031 | |
| Lenovo ThinkPad X1 Extreme G4-20Y5CTO1WW (3050 Ti) | |
| Dell Inspiron 16 Plus 7610 | |
| Asus VivoBook Pro 16X OLED N7600PC-L2026X | |
| Asus VivoBook Pro 16X OLED N7600PC-L2026X | |
| Microsoft Surface Laptop Studio i7 RTX 3050 Ti | |
| Xiaomi Mi NoteBook Pro | |
| Média Intel Core i7-11370H (162.9 - 233, n=15) | |
| Schenker XMG Focus 15 | |
| Blender / v2.79 BMW27 CPU | |
| Xiaomi Mi NoteBook Pro | |
| Média Intel Core i7-11370H (432 - 762, n=11) | |
| Microsoft Surface Laptop Studio i7 RTX 3050 Ti | |
| Asus VivoBook Pro 16X OLED N7600PC-L2026X | |
| MSI Summit E16 Flip A12UDT-031 | |
| Schenker XMG Focus 15 | |
| Dell Inspiron 16 Plus 7610 | |
| Lenovo ThinkPad X1 Extreme G4-20Y5CTO1WW (3050 Ti) | |
| Média da turma Multimedia (100 - 557, n=57, últimos 2 anos) | |
| 7-Zip 18.03 / 7z b 4 | |
| Média da turma Multimedia (26062 - 130368, n=54, últimos 2 anos) | |
| Lenovo ThinkPad X1 Extreme G4-20Y5CTO1WW (3050 Ti) | |
| Schenker XMG Focus 15 | |
| Dell Inspiron 16 Plus 7610 | |
| MSI Summit E16 Flip A12UDT-031 | |
| Asus VivoBook Pro 16X OLED N7600PC-L2026X | |
| Microsoft Surface Laptop Studio i7 RTX 3050 Ti | |
| Média Intel Core i7-11370H (18961 - 28520, n=11) | |
| Xiaomi Mi NoteBook Pro | |
| 7-Zip 18.03 / 7z b 4 -mmt1 | |
| Média da turma Multimedia (3666 - 7545, n=55, últimos 2 anos) | |
| Lenovo ThinkPad X1 Extreme G4-20Y5CTO1WW (3050 Ti) | |
| Dell Inspiron 16 Plus 7610 | |
| Asus VivoBook Pro 16X OLED N7600PC-L2026X | |
| Xiaomi Mi NoteBook Pro | |
| Média Intel Core i7-11370H (5074 - 5550, n=11) | |
| MSI Summit E16 Flip A12UDT-031 | |
| Schenker XMG Focus 15 | |
| Microsoft Surface Laptop Studio i7 RTX 3050 Ti | |
| Geekbench 5.5 / Multi-Core | |
| Média da turma Multimedia (4652 - 20422, n=55, últimos 2 anos) | |
| MSI Summit E16 Flip A12UDT-031 | |
| Schenker XMG Focus 15 | |
| Lenovo ThinkPad X1 Extreme G4-20Y5CTO1WW (3050 Ti) | |
| Microsoft Surface Laptop Studio i7 RTX 3050 Ti | |
| Média Intel Core i7-11370H (3828 - 6115, n=10) | |
| Xiaomi Mi NoteBook Pro | |
| Asus VivoBook Pro 16X OLED N7600PC-L2026X | |
| Geekbench 5.5 / Single-Core | |
| Média da turma Multimedia (805 - 2974, n=55, últimos 2 anos) | |
| MSI Summit E16 Flip A12UDT-031 | |
| Lenovo ThinkPad X1 Extreme G4-20Y5CTO1WW (3050 Ti) | |
| Xiaomi Mi NoteBook Pro | |
| Microsoft Surface Laptop Studio i7 RTX 3050 Ti | |
| Média Intel Core i7-11370H (1376 - 1607, n=10) | |
| Asus VivoBook Pro 16X OLED N7600PC-L2026X | |
| Schenker XMG Focus 15 | |
| HWBOT x265 Benchmark v2.2 / 4k Preset | |
| Média da turma Multimedia (5.26 - 36.1, n=55, últimos 2 anos) | |
| Schenker XMG Focus 15 | |
| Lenovo ThinkPad X1 Extreme G4-20Y5CTO1WW (3050 Ti) | |
| Dell Inspiron 16 Plus 7610 | |
| MSI Summit E16 Flip A12UDT-031 | |
| Microsoft Surface Laptop Studio i7 RTX 3050 Ti | |
| Média Intel Core i7-11370H (4.98 - 8.82, n=11) | |
| Xiaomi Mi NoteBook Pro | |
| Asus VivoBook Pro 16X OLED N7600PC-L2026X | |
| LibreOffice / 20 Documents To PDF | |
| Microsoft Surface Laptop Studio i7 RTX 3050 Ti | |
| Asus VivoBook Pro 16X OLED N7600PC-L2026X | |
| MSI Summit E16 Flip A12UDT-031 | |
| Média da turma Multimedia (23.9 - 146.7, n=56, últimos 2 anos) | |
| Schenker XMG Focus 15 | |
| Dell Inspiron 16 Plus 7610 | |
| Média Intel Core i7-11370H (23.6 - 56.5, n=11) | |
| Xiaomi Mi NoteBook Pro | |
| Lenovo ThinkPad X1 Extreme G4-20Y5CTO1WW (3050 Ti) | |
| R Benchmark 2.5 / Overall mean | |
| Schenker XMG Focus 15 | |
| Microsoft Surface Laptop Studio i7 RTX 3050 Ti | |
| Xiaomi Mi NoteBook Pro | |
| Média Intel Core i7-11370H (0.544 - 0.596, n=11) | |
| Dell Inspiron 16 Plus 7610 | |
| Asus VivoBook Pro 16X OLED N7600PC-L2026X | |
| Lenovo ThinkPad X1 Extreme G4-20Y5CTO1WW (3050 Ti) | |
| MSI Summit E16 Flip A12UDT-031 | |
| Média da turma Multimedia (0.3604 - 0.947, n=55, últimos 2 anos) | |
* ... menor é melhor
AIDA64: FP32 Ray-Trace | FPU Julia | CPU SHA3 | CPU Queen | FPU SinJulia | FPU Mandel | CPU AES | CPU ZLib | FP64 Ray-Trace | CPU PhotoWorxx
| Performance rating | |
| Média da turma Multimedia | |
| Lenovo ThinkPad X1 Extreme G4-20Y5CTO1WW (3050 Ti) | |
| MSI Summit E16 Flip A12UDT-031 | |
| Média Intel Core i7-11370H | |
| Microsoft Surface Laptop Studio i7 RTX 3050 Ti | |
| Xiaomi Mi NoteBook Pro | |
| Asus VivoBook Pro 16X OLED N7600PC-L2026X | |
| AIDA64 / FP32 Ray-Trace | |
| Média da turma Multimedia (2214 - 50388, n=53, últimos 2 anos) | |
| Lenovo ThinkPad X1 Extreme G4-20Y5CTO1WW (3050 Ti) | |
| MSI Summit E16 Flip A12UDT-031 | |
| Microsoft Surface Laptop Studio i7 RTX 3050 Ti | |
| Média Intel Core i7-11370H (5204 - 8413, n=10) | |
| Xiaomi Mi NoteBook Pro | |
| Asus VivoBook Pro 16X OLED N7600PC-L2026X | |
| AIDA64 / FPU Julia | |
| Média da turma Multimedia (12867 - 201874, n=53, últimos 2 anos) | |
| MSI Summit E16 Flip A12UDT-031 | |
| Lenovo ThinkPad X1 Extreme G4-20Y5CTO1WW (3050 Ti) | |
| Microsoft Surface Laptop Studio i7 RTX 3050 Ti | |
| Média Intel Core i7-11370H (23958 - 34020, n=10) | |
| Xiaomi Mi NoteBook Pro | |
| Asus VivoBook Pro 16X OLED N7600PC-L2026X | |
| AIDA64 / CPU SHA3 | |
| Lenovo ThinkPad X1 Extreme G4-20Y5CTO1WW (3050 Ti) | |
| Média da turma Multimedia (626 - 8623, n=53, últimos 2 anos) | |
| MSI Summit E16 Flip A12UDT-031 | |
| Média Intel Core i7-11370H (1656 - 2297, n=10) | |
| Microsoft Surface Laptop Studio i7 RTX 3050 Ti | |
| Xiaomi Mi NoteBook Pro | |
| Asus VivoBook Pro 16X OLED N7600PC-L2026X | |
| AIDA64 / CPU Queen | |
| MSI Summit E16 Flip A12UDT-031 | |
| Lenovo ThinkPad X1 Extreme G4-20Y5CTO1WW (3050 Ti) | |
| Média da turma Multimedia (13483 - 181505, n=40, últimos 2 anos) | |
| Xiaomi Mi NoteBook Pro | |
| Média Intel Core i7-11370H (42086 - 52930, n=10) | |
| Microsoft Surface Laptop Studio i7 RTX 3050 Ti | |
| Asus VivoBook Pro 16X OLED N7600PC-L2026X | |
| AIDA64 / FPU SinJulia | |
| Lenovo ThinkPad X1 Extreme G4-20Y5CTO1WW (3050 Ti) | |
| MSI Summit E16 Flip A12UDT-031 | |
| Média da turma Multimedia (886 - 28794, n=53, últimos 2 anos) | |
| Xiaomi Mi NoteBook Pro | |
| Média Intel Core i7-11370H (3755 - 5027, n=10) | |
| Microsoft Surface Laptop Studio i7 RTX 3050 Ti | |
| Asus VivoBook Pro 16X OLED N7600PC-L2026X | |
| AIDA64 / FPU Mandel | |
| Média da turma Multimedia (6395 - 105740, n=53, últimos 2 anos) | |
| Lenovo ThinkPad X1 Extreme G4-20Y5CTO1WW (3050 Ti) | |
| MSI Summit E16 Flip A12UDT-031 | |
| Média Intel Core i7-11370H (14433 - 20417, n=10) | |
| Microsoft Surface Laptop Studio i7 RTX 3050 Ti | |
| Xiaomi Mi NoteBook Pro | |
| Asus VivoBook Pro 16X OLED N7600PC-L2026X | |
| AIDA64 / CPU AES | |
| Lenovo ThinkPad X1 Extreme G4-20Y5CTO1WW (3050 Ti) | |
| Xiaomi Mi NoteBook Pro | |
| Média Intel Core i7-11370H (44267 - 76866, n=10) | |
| Média da turma Multimedia (8171 - 126790, n=53, últimos 2 anos) | |
| MSI Summit E16 Flip A12UDT-031 | |
| Asus VivoBook Pro 16X OLED N7600PC-L2026X | |
| Microsoft Surface Laptop Studio i7 RTX 3050 Ti | |
| AIDA64 / CPU ZLib | |
| Média da turma Multimedia (143.8 - 2022, n=53, últimos 2 anos) | |
| MSI Summit E16 Flip A12UDT-031 | |
| Lenovo ThinkPad X1 Extreme G4-20Y5CTO1WW (3050 Ti) | |
| Xiaomi Mi NoteBook Pro | |
| Média Intel Core i7-11370H (289 - 422, n=10) | |
| Microsoft Surface Laptop Studio i7 RTX 3050 Ti | |
| Asus VivoBook Pro 16X OLED N7600PC-L2026X | |
| AIDA64 / FP64 Ray-Trace | |
| Média da turma Multimedia (1014 - 26875, n=53, últimos 2 anos) | |
| Lenovo ThinkPad X1 Extreme G4-20Y5CTO1WW (3050 Ti) | |
| MSI Summit E16 Flip A12UDT-031 | |
| Média Intel Core i7-11370H (2756 - 4551, n=10) | |
| Microsoft Surface Laptop Studio i7 RTX 3050 Ti | |
| Xiaomi Mi NoteBook Pro | |
| Asus VivoBook Pro 16X OLED N7600PC-L2026X | |
| AIDA64 / CPU PhotoWorxx | |
| Média da turma Multimedia (8187 - 88154, n=53, últimos 2 anos) | |
| MSI Summit E16 Flip A12UDT-031 | |
| Microsoft Surface Laptop Studio i7 RTX 3050 Ti | |
| Média Intel Core i7-11370H (15892 - 40069, n=10) | |
| Xiaomi Mi NoteBook Pro | |
| Asus VivoBook Pro 16X OLED N7600PC-L2026X | |
| Lenovo ThinkPad X1 Extreme G4-20Y5CTO1WW (3050 Ti) | |
Desempenho do sistema
Em nosso sistema de desempenho, benchmarks, o Vivobook Pro 16X OLED alcança ótimos resultados em geral. O sistema multimídia se situa muito acima da média. Ao mesmo tempo, porém, o Vivobook não consegue se igualar aos outros dispositivos em nossa comparação. O laptop sofre de um desempenho reduzido no PCMark 10 e CrossMark devido a dois problemas. Uma delas é a definição do perfil de desempenho que limita rapidamente o potencial de desempenho tanto da CPU quanto da GPU após um curto período de tempo e a segunda questão é a velocidade bastante lenta da RAM do laptop. Como resultado, os resultados dos testes de memória da AIDA são relativamente baixos e as latências altas.
Independentemente disso, o Vivobook Pro é muito ágil durante o uso diário e capaz de gerenciar tarefas ocasionais exigentes sem nenhum problema. A maioria dos benchmarks estressam um laptop significativamente mais do que um fluxo de trabalho normal.
CrossMark: Overall | Productivity | Creativity | Responsiveness
| PCMark 10 / Score | |
| Média da turma Multimedia (4325 - 10386, n=51, últimos 2 anos) | |
| Lenovo ThinkPad X1 Extreme G4-20Y5CTO1WW (3050 Ti) | |
| Schenker XMG Focus 15 | |
| Dell Inspiron 16 Plus 7610 | |
| MSI Summit E16 Flip A12UDT-031 | |
| Schenker Vision 14 | |
| Asus VivoBook Pro 16X OLED N7600PC-L2026X | |
| Média Intel Core i7-11370H, NVIDIA GeForce RTX 3050 4GB Laptop GPU (n=1) | |
| Microsoft Surface Laptop Studio i7 RTX 3050 Ti | |
| Lenovo IdeaPad Slim 7i Pro 14IHU5 | |
| Xiaomi Mi NoteBook Pro | |
| PCMark 10 / Essentials | |
| Lenovo ThinkPad X1 Extreme G4-20Y5CTO1WW (3050 Ti) | |
| Média da turma Multimedia (8025 - 11664, n=50, últimos 2 anos) | |
| Lenovo IdeaPad Slim 7i Pro 14IHU5 | |
| Schenker XMG Focus 15 | |
| Xiaomi Mi NoteBook Pro | |
| Dell Inspiron 16 Plus 7610 | |
| MSI Summit E16 Flip A12UDT-031 | |
| Schenker Vision 14 | |
| Asus VivoBook Pro 16X OLED N7600PC-L2026X | |
| Média Intel Core i7-11370H, NVIDIA GeForce RTX 3050 4GB Laptop GPU (n=1) | |
| Microsoft Surface Laptop Studio i7 RTX 3050 Ti | |
| PCMark 10 / Productivity | |
| Média da turma Multimedia (7323 - 18233, n=50, últimos 2 anos) | |
| Schenker Vision 14 | |
| Schenker XMG Focus 15 | |
| Asus VivoBook Pro 16X OLED N7600PC-L2026X | |
| Média Intel Core i7-11370H, NVIDIA GeForce RTX 3050 4GB Laptop GPU (n=1) | |
| Lenovo ThinkPad X1 Extreme G4-20Y5CTO1WW (3050 Ti) | |
| Dell Inspiron 16 Plus 7610 | |
| Microsoft Surface Laptop Studio i7 RTX 3050 Ti | |
| MSI Summit E16 Flip A12UDT-031 | |
| Xiaomi Mi NoteBook Pro | |
| Lenovo IdeaPad Slim 7i Pro 14IHU5 | |
| PCMark 10 / Digital Content Creation | |
| Média da turma Multimedia (3651 - 16240, n=50, últimos 2 anos) | |
| Schenker XMG Focus 15 | |
| Lenovo ThinkPad X1 Extreme G4-20Y5CTO1WW (3050 Ti) | |
| Dell Inspiron 16 Plus 7610 | |
| MSI Summit E16 Flip A12UDT-031 | |
| Schenker Vision 14 | |
| Asus VivoBook Pro 16X OLED N7600PC-L2026X | |
| Média Intel Core i7-11370H, NVIDIA GeForce RTX 3050 4GB Laptop GPU (n=1) | |
| Microsoft Surface Laptop Studio i7 RTX 3050 Ti | |
| Lenovo IdeaPad Slim 7i Pro 14IHU5 | |
| Xiaomi Mi NoteBook Pro | |
| CrossMark / Overall | |
| Média da turma Multimedia (866 - 2728, n=59, últimos 2 anos) | |
| MSI Summit E16 Flip A12UDT-031 | |
| Schenker Vision 14 | |
| Microsoft Surface Laptop Studio i7 RTX 3050 Ti | |
| Xiaomi Mi NoteBook Pro | |
| Asus VivoBook Pro 16X OLED N7600PC-L2026X | |
| Média Intel Core i7-11370H, NVIDIA GeForce RTX 3050 4GB Laptop GPU (n=1) | |
| CrossMark / Productivity | |
| Média da turma Multimedia (931 - 2489, n=59, últimos 2 anos) | |
| MSI Summit E16 Flip A12UDT-031 | |
| Schenker Vision 14 | |
| Xiaomi Mi NoteBook Pro | |
| Microsoft Surface Laptop Studio i7 RTX 3050 Ti | |
| Asus VivoBook Pro 16X OLED N7600PC-L2026X | |
| Média Intel Core i7-11370H, NVIDIA GeForce RTX 3050 4GB Laptop GPU (n=1) | |
| CrossMark / Creativity | |
| Média da turma Multimedia (907 - 3465, n=59, últimos 2 anos) | |
| MSI Summit E16 Flip A12UDT-031 | |
| Microsoft Surface Laptop Studio i7 RTX 3050 Ti | |
| Schenker Vision 14 | |
| Xiaomi Mi NoteBook Pro | |
| Asus VivoBook Pro 16X OLED N7600PC-L2026X | |
| Média Intel Core i7-11370H, NVIDIA GeForce RTX 3050 4GB Laptop GPU (n=1) | |
| CrossMark / Responsiveness | |
| MSI Summit E16 Flip A12UDT-031 | |
| Média da turma Multimedia (605 - 2024, n=59, últimos 2 anos) | |
| Schenker Vision 14 | |
| Xiaomi Mi NoteBook Pro | |
| Microsoft Surface Laptop Studio i7 RTX 3050 Ti | |
| Asus VivoBook Pro 16X OLED N7600PC-L2026X | |
| Média Intel Core i7-11370H, NVIDIA GeForce RTX 3050 4GB Laptop GPU (n=1) | |
| PCMark 10 Score | 5619 pontos | |
Ajuda | ||
| AIDA64 / Memory Copy | |
| Média da turma Multimedia (11299 - 132135, n=53, últimos 2 anos) | |
| MSI Summit E16 Flip A12UDT-031 | |
| Microsoft Surface Laptop Studio i7 RTX 3050 Ti | |
| Média Intel Core i7-11370H (32035 - 64524, n=10) | |
| Lenovo ThinkPad X1 Extreme G4-20Y5CTO1WW (3050 Ti) | |
| Xiaomi Mi NoteBook Pro | |
| Asus VivoBook Pro 16X OLED N7600PC-L2026X | |
| AIDA64 / Memory Read | |
| Média da turma Multimedia (11624 - 174586, n=53, últimos 2 anos) | |
| MSI Summit E16 Flip A12UDT-031 | |
| Microsoft Surface Laptop Studio i7 RTX 3050 Ti | |
| Média Intel Core i7-11370H (37216 - 62417, n=10) | |
| Lenovo ThinkPad X1 Extreme G4-20Y5CTO1WW (3050 Ti) | |
| Xiaomi Mi NoteBook Pro | |
| Asus VivoBook Pro 16X OLED N7600PC-L2026X | |
| AIDA64 / Memory Write | |
| Média da turma Multimedia (11755 - 134998, n=53, últimos 2 anos) | |
| Microsoft Surface Laptop Studio i7 RTX 3050 Ti | |
| MSI Summit E16 Flip A12UDT-031 | |
| Média Intel Core i7-11370H (36920 - 65610, n=10) | |
| Lenovo ThinkPad X1 Extreme G4-20Y5CTO1WW (3050 Ti) | |
| Asus VivoBook Pro 16X OLED N7600PC-L2026X | |
| Xiaomi Mi NoteBook Pro | |
| AIDA64 / Memory Latency | |
| MSI Summit E16 Flip A12UDT-031 | |
| Média da turma Multimedia (7 - 535, n=52, últimos 2 anos) | |
| Microsoft Surface Laptop Studio i7 RTX 3050 Ti | |
| Asus VivoBook Pro 16X OLED N7600PC-L2026X | |
| Média Intel Core i7-11370H (73.4 - 103, n=10) | |
| Lenovo ThinkPad X1 Extreme G4-20Y5CTO1WW (3050 Ti) | |
| Xiaomi Mi NoteBook Pro | |
| Dell Inspiron 16 Plus 7610 | |
* ... menor é melhor
Latência do DPC
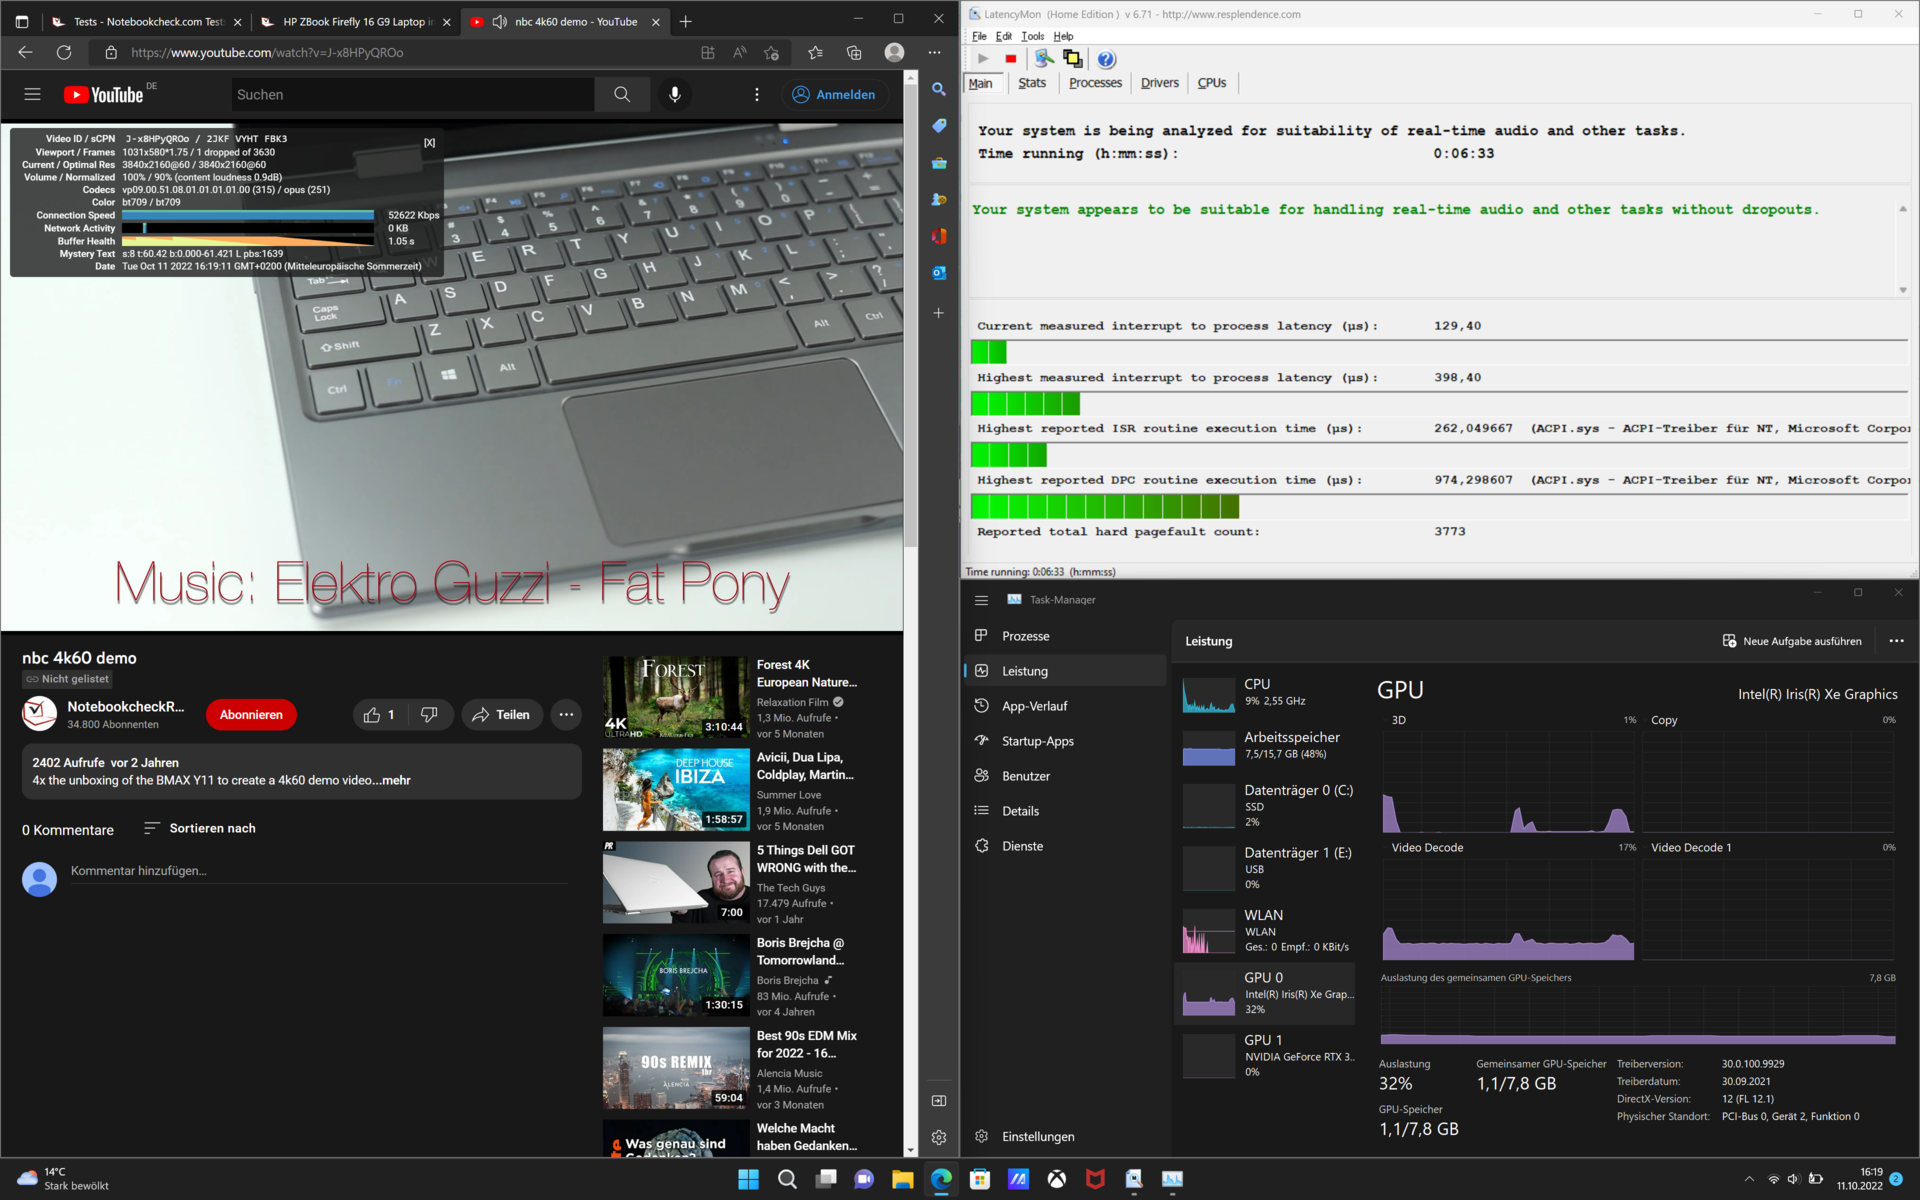
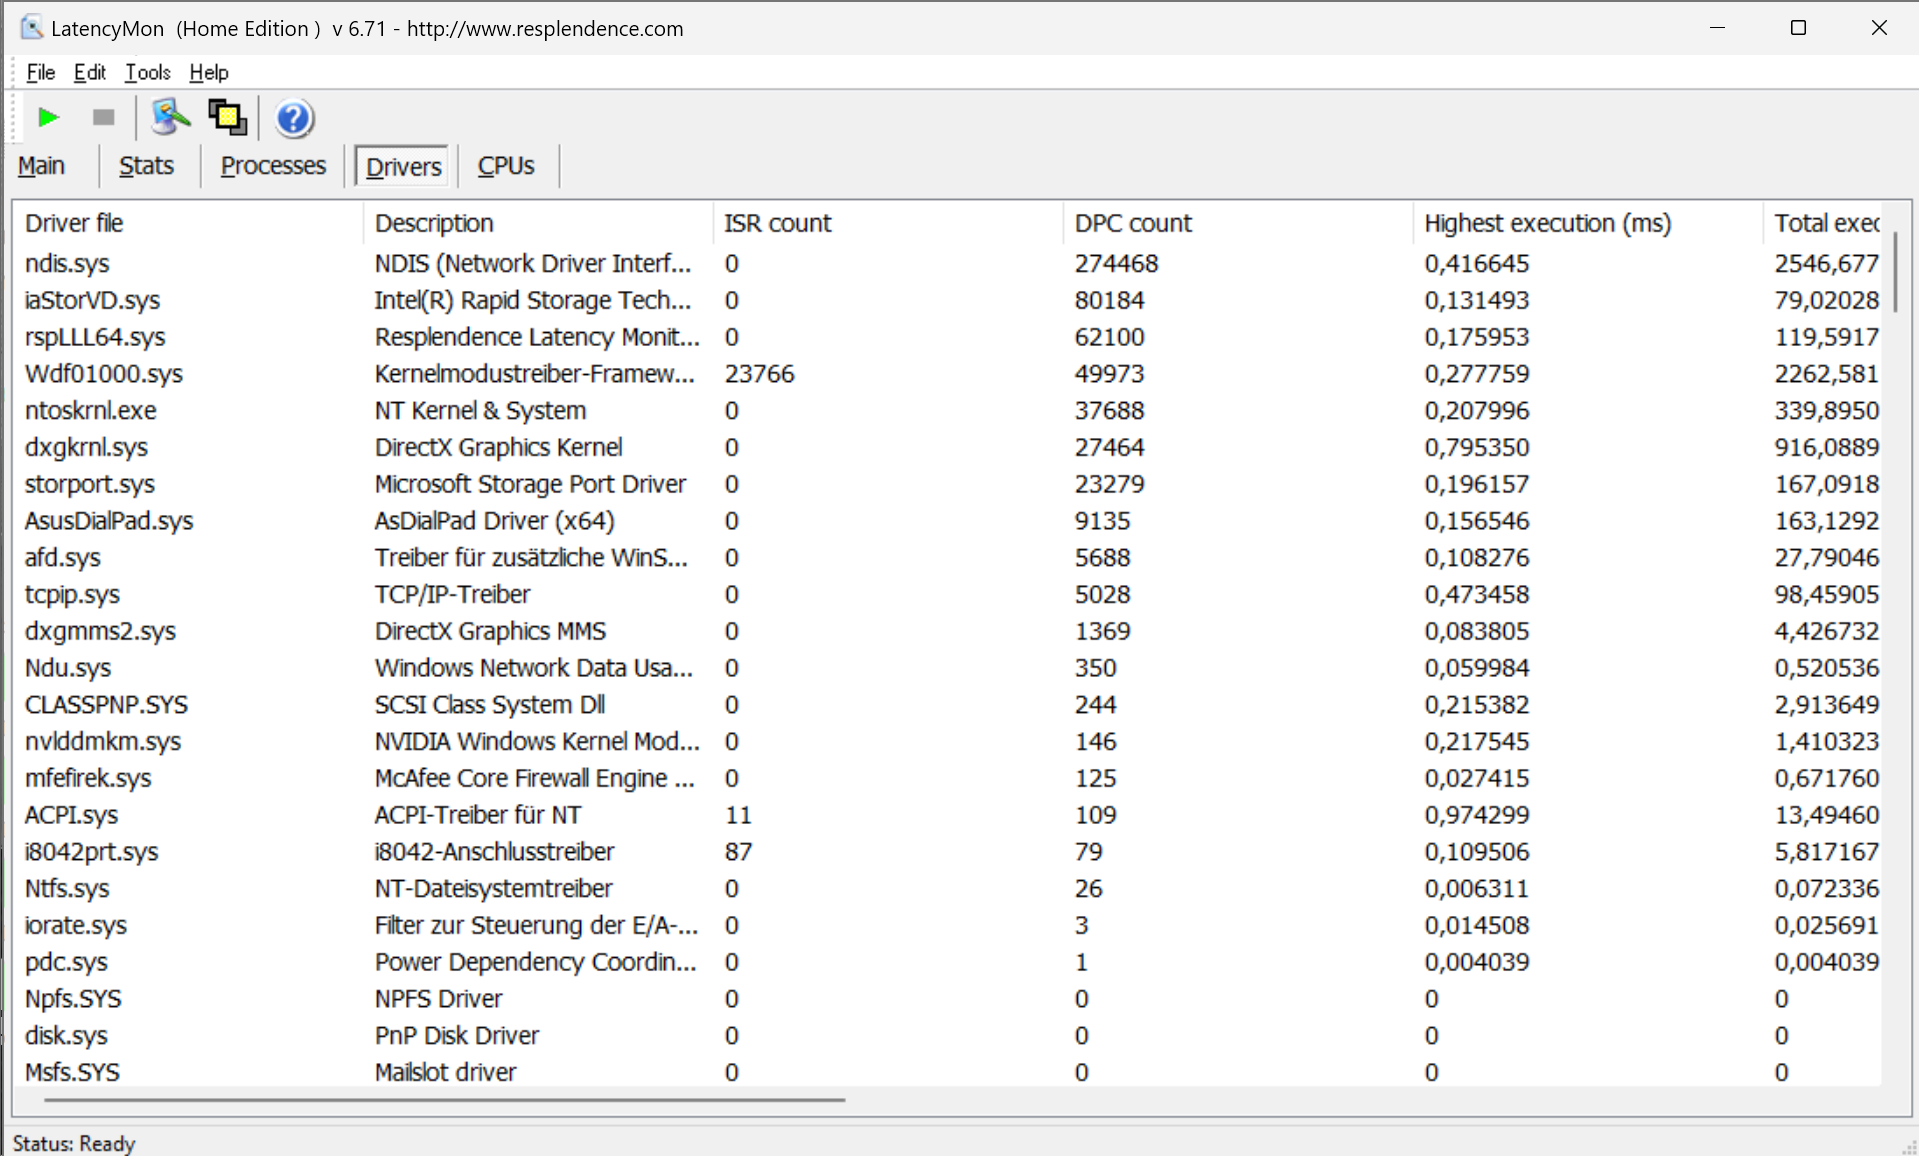
Antes de realizar nossos benchmarks, atualizamos o dispositivo com todos os drivers disponíveis e as últimas atualizações do Windows. No Vivobook Pro 16X, isto resulta em latências muito baixas de DPC. Gravamos um frame caído durante a reprodução de vídeo de um vídeo do YouTube de 4K com 60 Hz. Com a configuração atual de software e hardware, o laptop funciona muito bem.

| DPC Latencies / LatencyMon - interrupt to process latency (max), Web, Youtube, Prime95 | |
| Dell Inspiron 16 Plus 7610 | |
| Lenovo ThinkPad X1 Extreme G4-20Y5CTO1WW (3050 Ti) | |
| MSI Summit E16 Flip A12UDT-031 | |
| Microsoft Surface Laptop Studio i7 RTX 3050 Ti | |
| Schenker XMG Focus 15 | |
| Asus VivoBook Pro 16X OLED N7600PC-L2026X | |
* ... menor é melhor
Solução de armazenamento
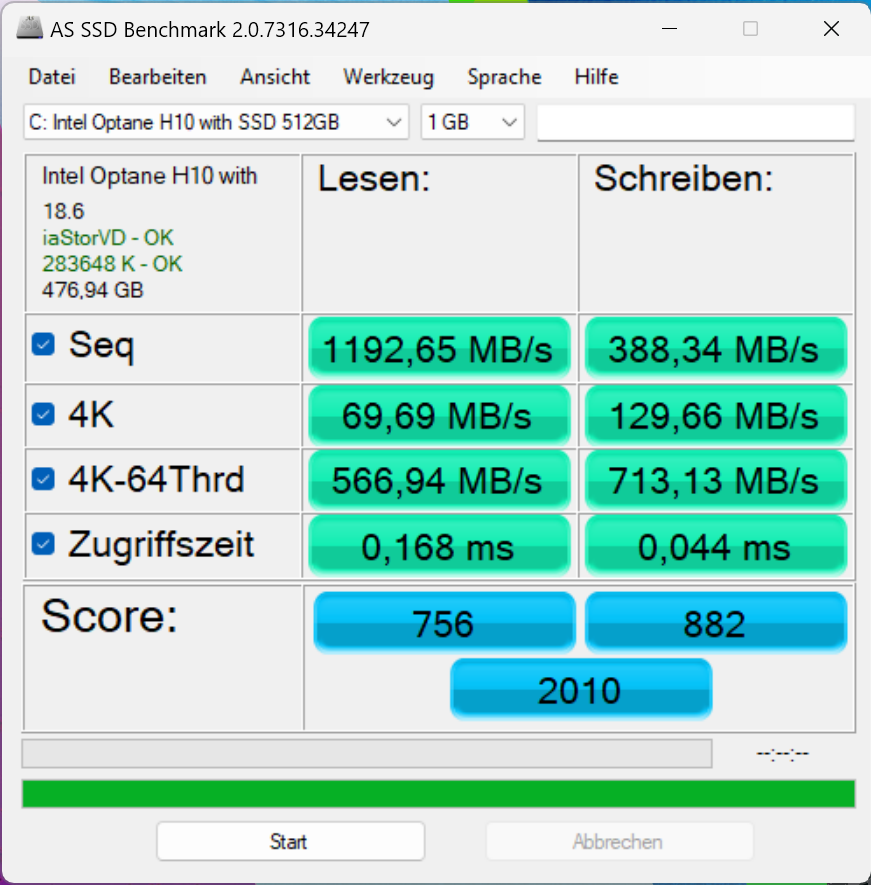
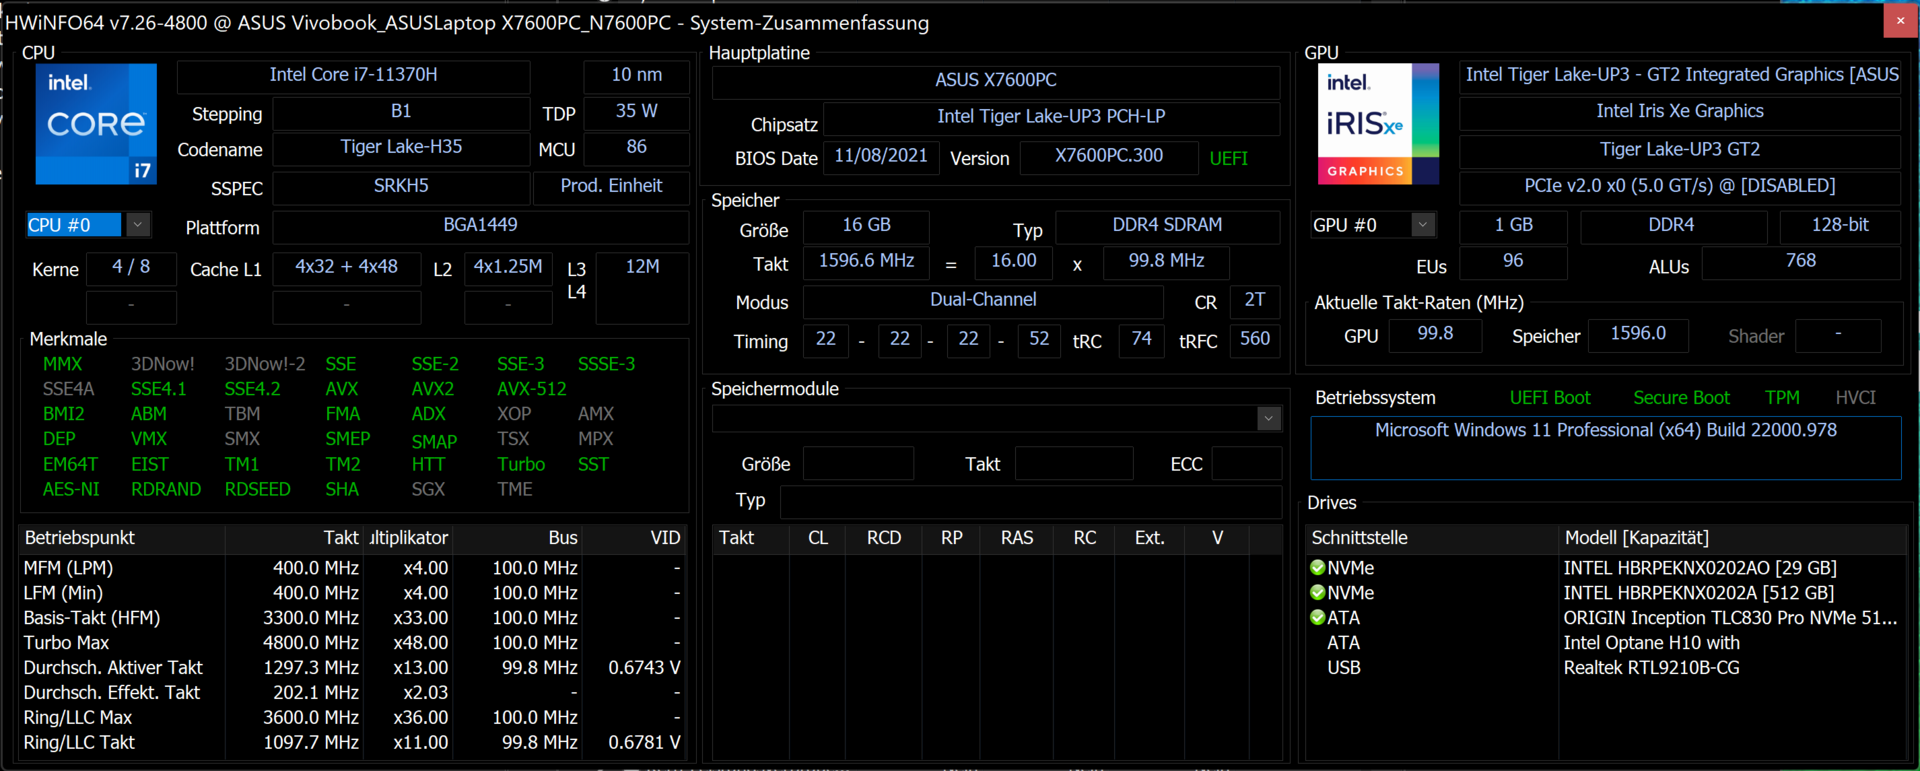
O SSD Optane Memory H10 NVMe da Intel é um conceito interessante. Existem dois tipos diferentes de memória e controladores na placa de circuito impresso. Perto da interface, há um módulo de memória Intel QLC 3D NAND de 512 GB com um controlador apropriado. Na parte de trás da memória M.2-2280, há um módulo de memória Optane Intel de 32-GB. Apesar disso, ele não é mais uma das opções de unidade mais rápidas. Em nosso Tabela SSD e HDDo módulo Intel, agora um dos lugares mais baixos. Deve-se notar que a unidade de tecnologia Intel Optane foi introduzido pela primeira vez em 2019, fazendo-o com três anos de idade no momento em que foi escrito. O SSD NVMe com cache Optane integrado de baixa latência só é conectado via PCIe3.0x4, ao invés do agora comum PCIe 4.0.
Nosso loop de leitura DiskSpd mostra rapidamente o layout interno do SSD. Assim que o controlador de memória registra acesso freqüente em um determinado arquivo, ele é transferido para a memória Optane e acessado de lá. Isto resulta em um aumento significativo de desempenho.

* ... menor é melhor
Disk Throttling: DiskSpd Read Loop, Queue Depth 8
Desempenho da GPU
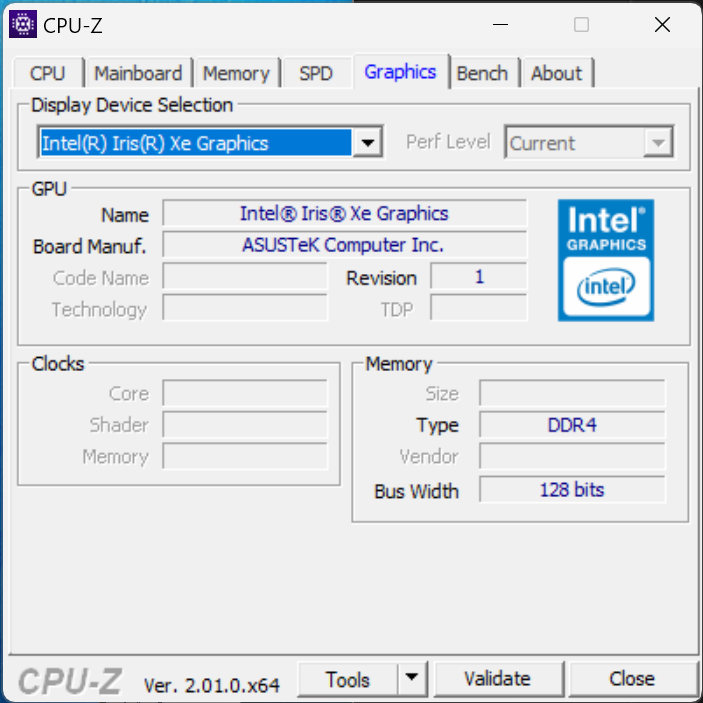
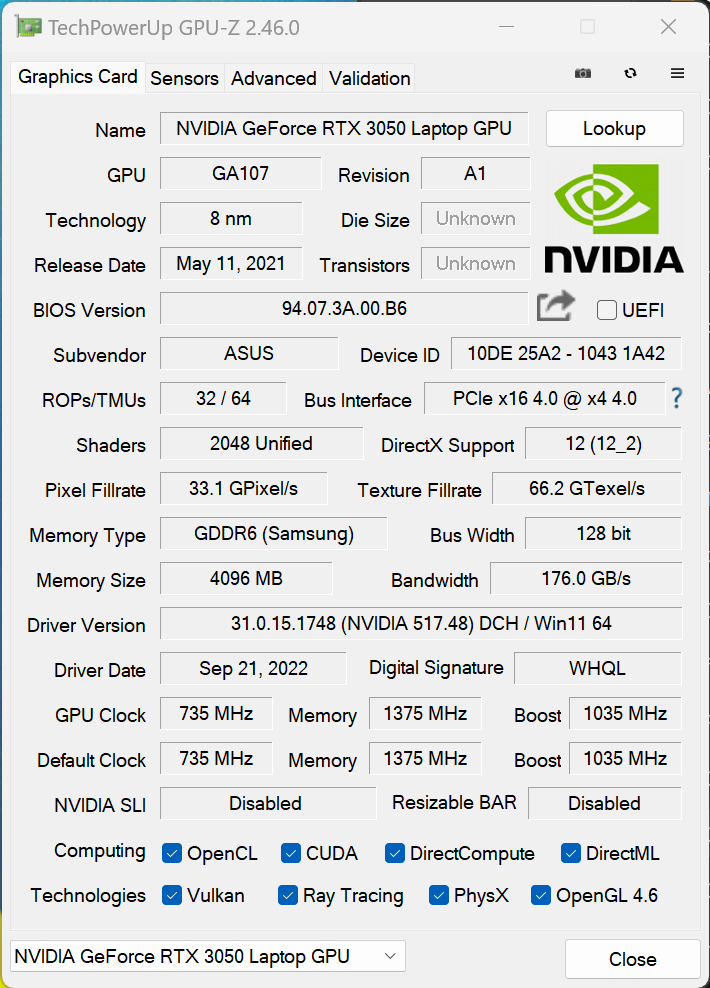
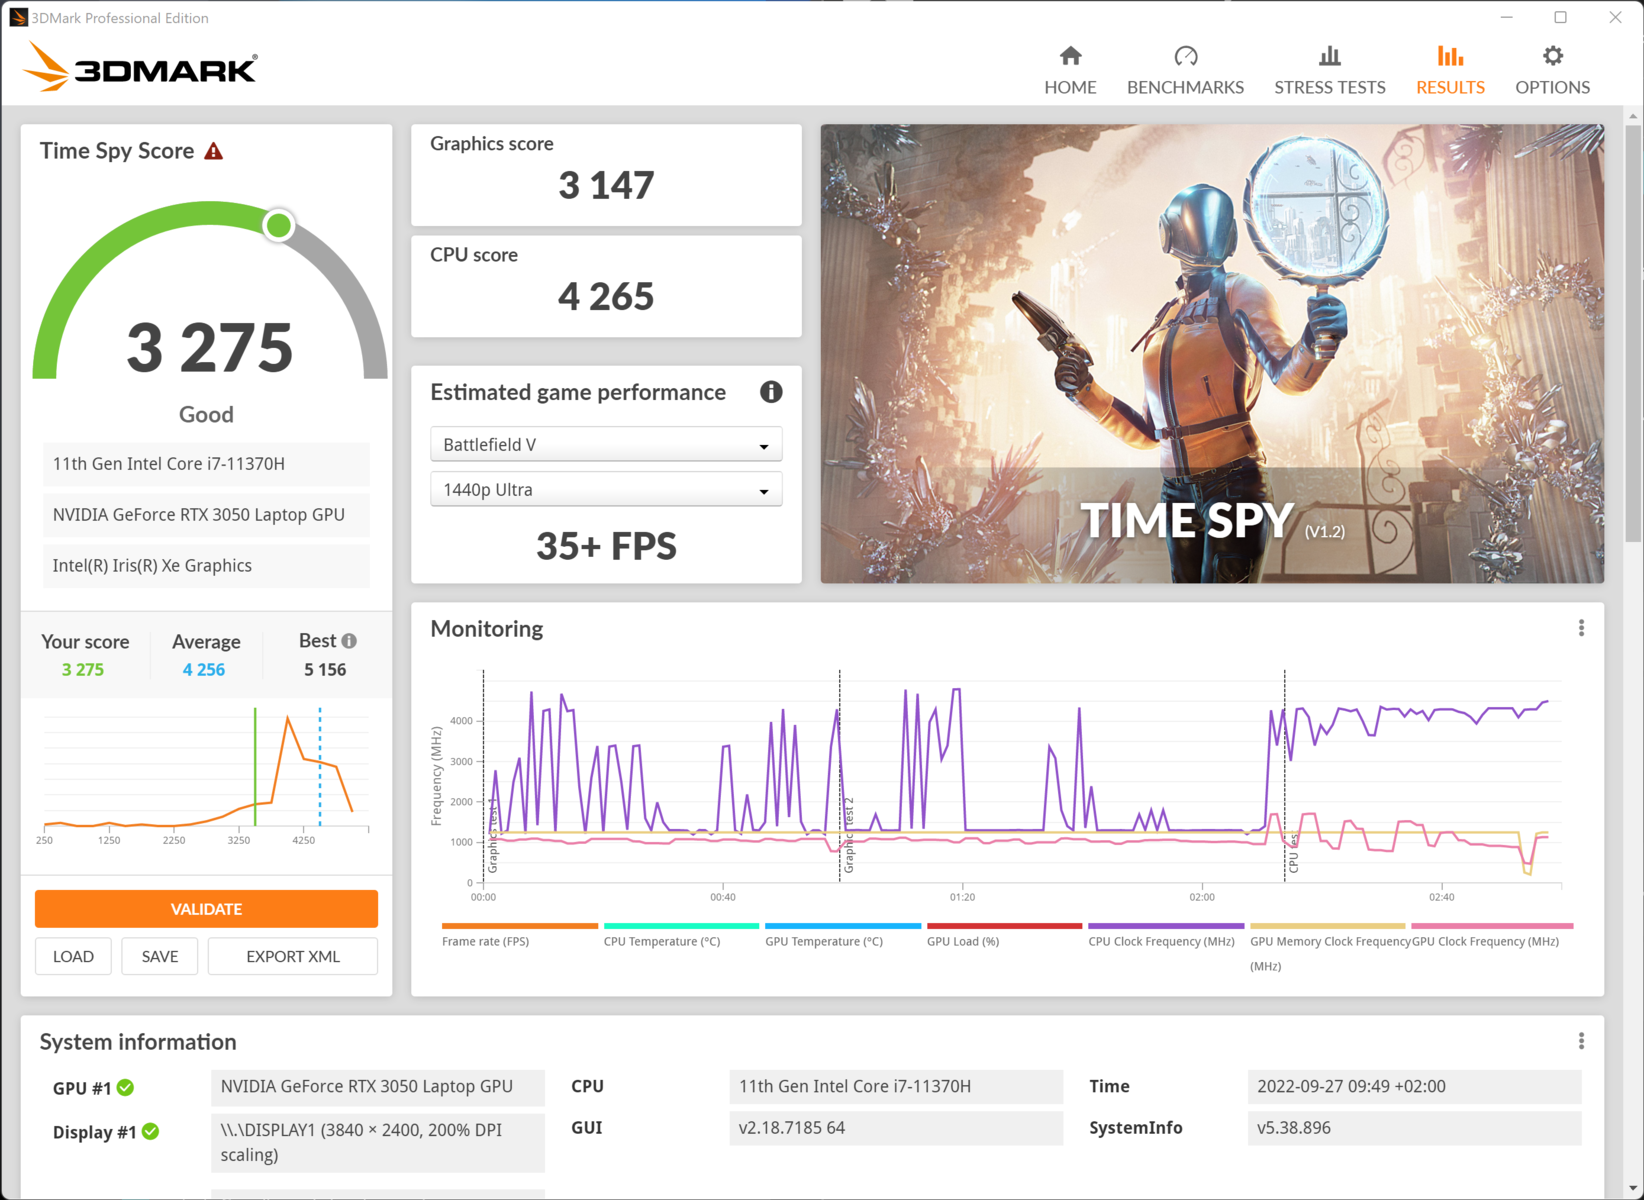
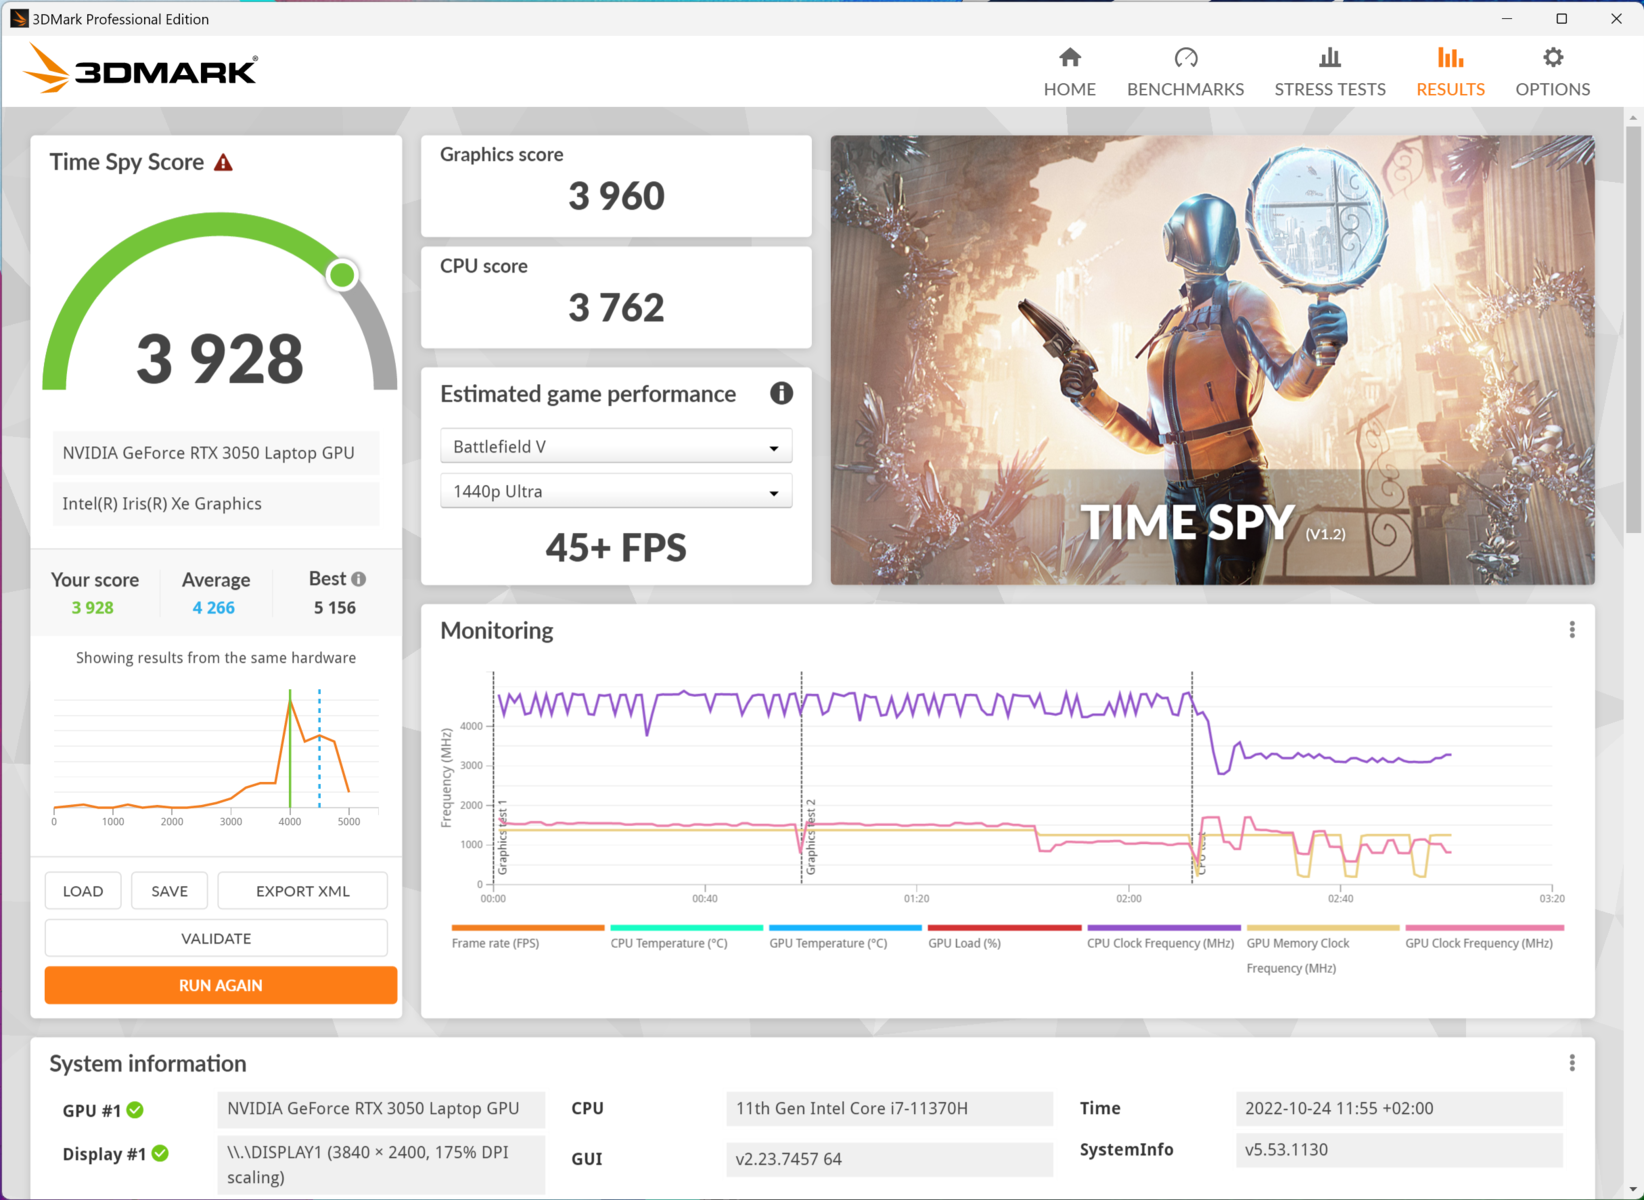
O Vivobook usa tanto o iGPU do Intel Core i7 e o Nvidia GeForce RTX 3050. Durante as cargas de trabalho pouco exigentes, o iGPU está ativo. Enquanto isso, o GeForce dGPU é responsável por tarefas mais exigentes. Em nossos testes, registramos um pico de consumo de 50 watts da GPU. Embora o desempenho seja bom, deve-se notar que esta é a opção mais fraca da série RTX 3000 da Nvidia. Como mostra nosso teste com o Blender, a GPU é capaz de renderizar cenas rapidamente. Em contraste, ela fica aquém de nossas expectativas nos benchmarks 3DMark. Isto pode ser causado pelo driver instalado do Nvidia Studio. Ele é menos otimizado para o desempenho dos jogos. Em troca, muitas aplicações profissionais como o Blender, Autodesk Maya e Adobe Illustrator recebem um aumento de performance. Uma visão geral oficial dos programas, que são suportados pelos drivers do Nvidia Studioestá disponível no site do fabricante.
O desempenho em modo de bateria é limitado. Aqui, o TGP cai para cerca de 25 watts. Isto corta o desempenho gráfico na metade. Entretanto, os resultados do benchmark 3DMark surpreendentemente não são tão severamente afetados como se esperava.
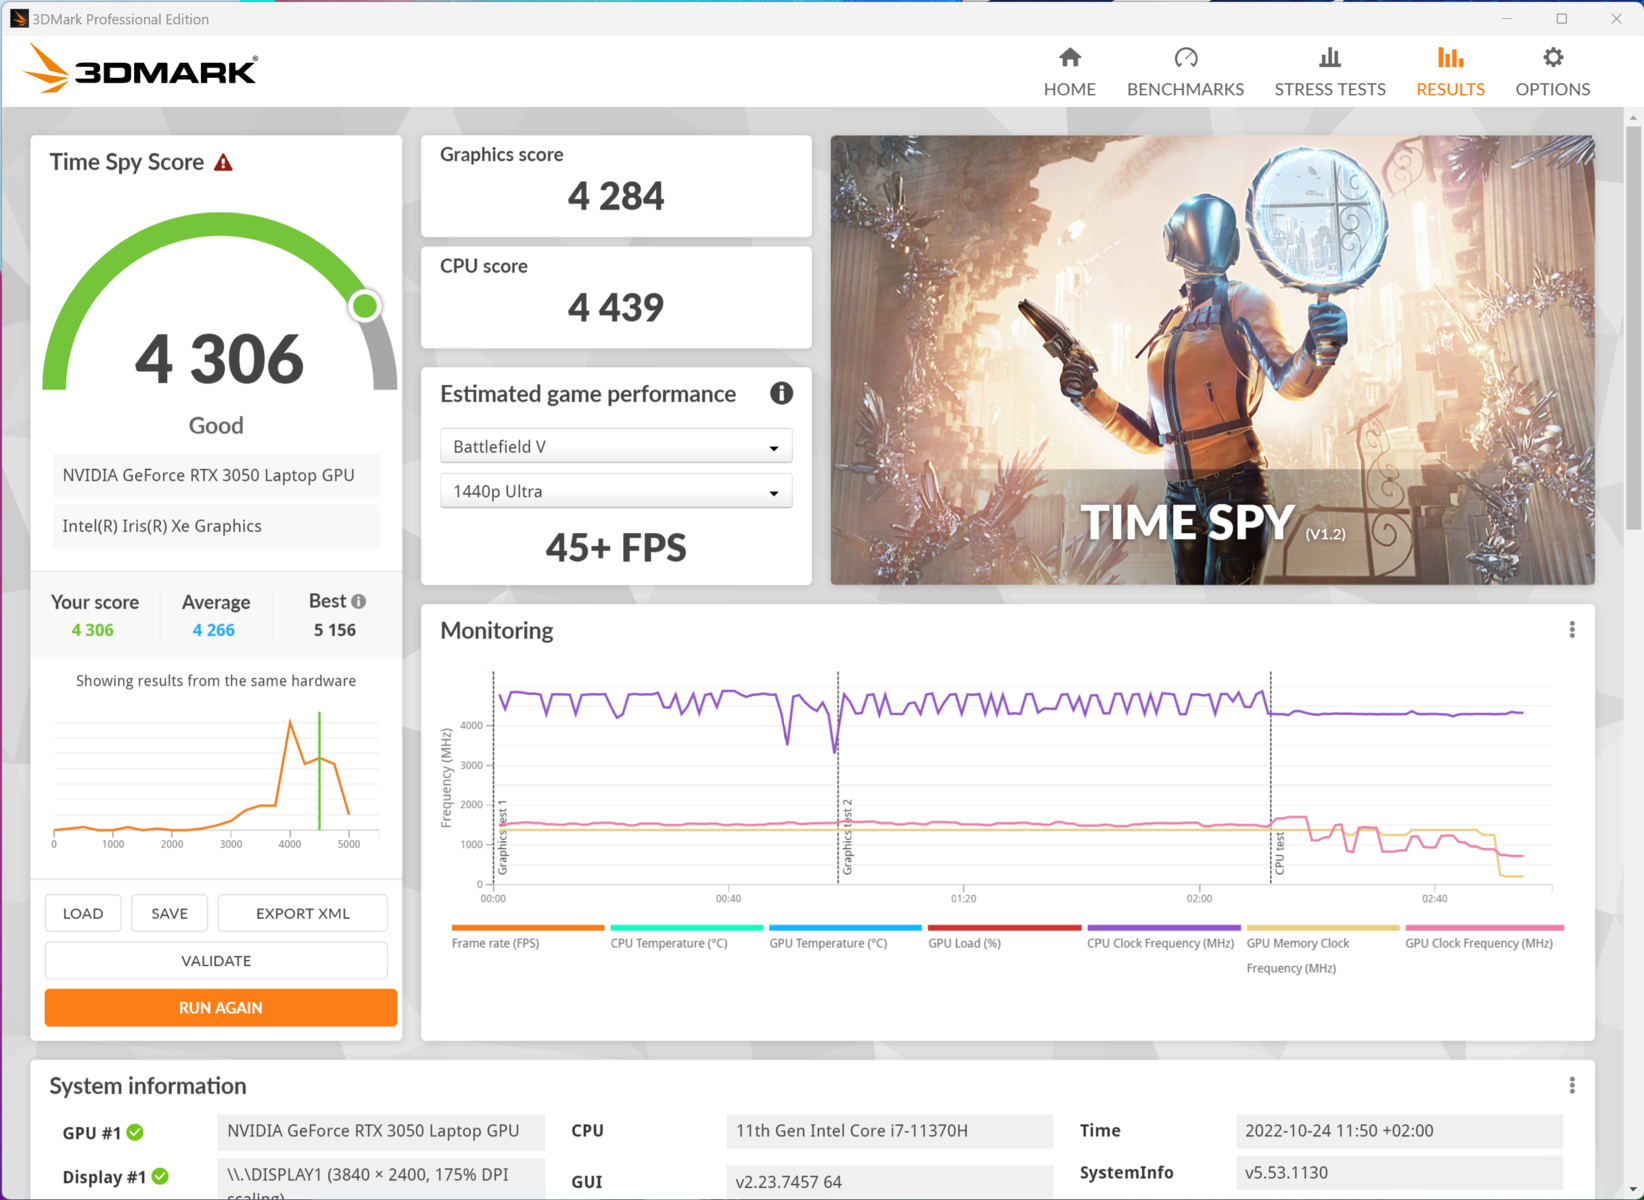
| 3DMark 11 Performance | 13624 pontos | |
| 3DMark Ice Storm Standard Score | 34267 pontos | |
| 3DMark Cloud Gate Standard Score | 20526 pontos | |
| 3DMark Fire Strike Score | 9732 pontos | |
| 3DMark Time Spy Score | 4310 pontos | |
Ajuda | ||
* ... menor é melhor
Desempenho nos jogos
O desempenho é suficiente para mais de 60 FPS em Full HD em quase todos os jogos que testamos. O Far Cry 5 é uma exceção. O jogo mostra um erro indicando que os drivers do Nvidia Studio não são suportados. F1 2022 mostra uma mensagem de erro semelhante.
As reservas de desempenho do 3050 mal são suficientes para a alta resolução nativa da tela OLED 4K. Embora as taxas de quadros ainda possam ser aceitáveis em certos casos, nossa visão geral"Jogos de computador em placas gráficas para laptops" mostra que o RTX 3050 tende a cair abaixo de 30 FPS a 4K.
Enquanto o Vivobook atinge resultados médios em geral comparados com outros dispositivos em nossa comparação, o laptop multimídia consegue superar algumas alternativas com o 3050 Ti nominalmente mais rápido.
| baixo | média | alto | ultra | QHD | 4K | |
|---|---|---|---|---|---|---|
| GTA V (2015) | 146.6 | 100.4 | 54.9 | |||
| The Witcher 3 (2015) | 193.3 | 117.8 | 61.3 | 47 | ||
| Dota 2 Reborn (2015) | 120.7 | 111.4 | 103.7 | 100.3 | 62.4 | |
| Final Fantasy XV Benchmark (2018) | 62 | 64.8 | 44.4 | 30.2 | ||
| X-Plane 11.11 (2018) | 95.3 | 78.4 | 66.9 | 41.4 | ||
| Far Cry 5 (2018) | 37 | 36 | 35 | 47 | ||
| Strange Brigade (2018) | 244 | 112.5 | 92.4 | 78.9 | ||
| F1 22 (2022) | 112.7 | 104.3 | 75 | 21.8 |
Emissões - O Laptop pode ser silencioso
Emissões sonoras
Embora não seja muito silencioso, o Vivobook permanece bastante silencioso sob a maioria das cargas. Durante o uso normal, o portátil não excede 40 dB(A). O nível de ruído aumenta para até 62,9 dB(A) somente quando se joga ou se realiza outras tarefas de computação intensiva. Os ventiladores podem distrair nestes cenários, especialmente porque o ruído é relativamente alto. No modo sussurro, os torcedores permanecem muito silenciosos ou ociosos.
Independentemente do modo de ventilador, o controle do ventilador tenta manter a velocidade do ventilador baixa durante o maior tempo possível. Embora isto seja vantajoso para os níveis de ruído do Vivobook Pro, é prejudicial para o desempenho sob carga.
Barulho
| Ocioso |
| 30 / 30 / 30 dB |
| Carga |
| 57.6 / 62.9 dB |
 | ||
30 dB silencioso 40 dB(A) audível 50 dB(A) ruidosamente alto |
||
min: | ||
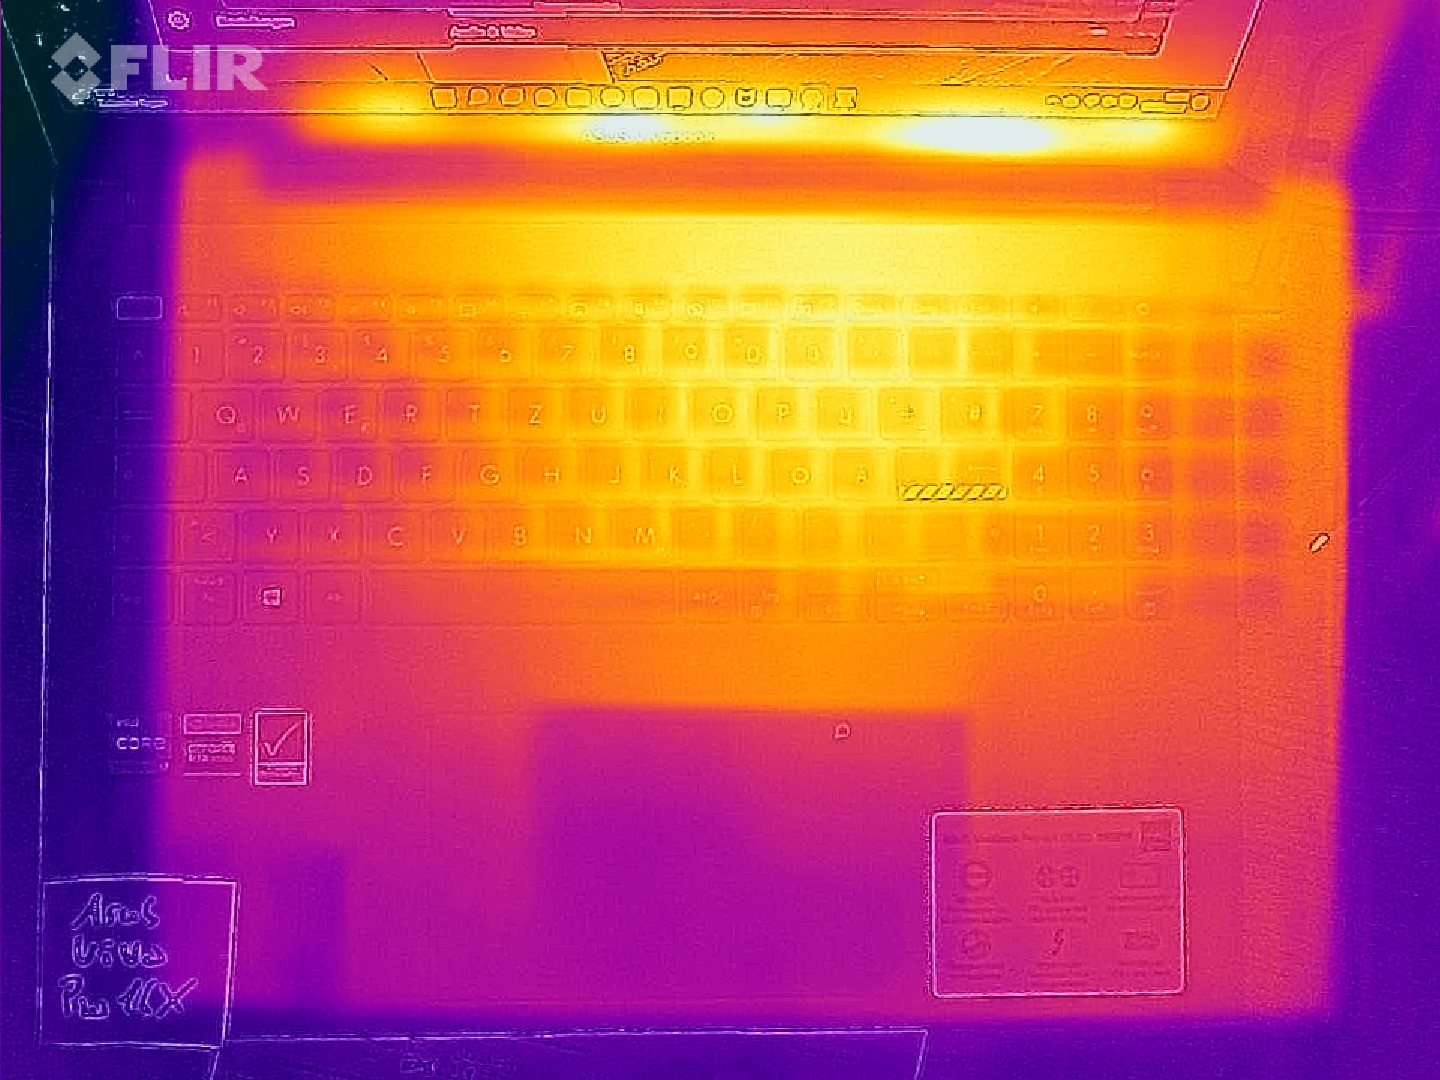
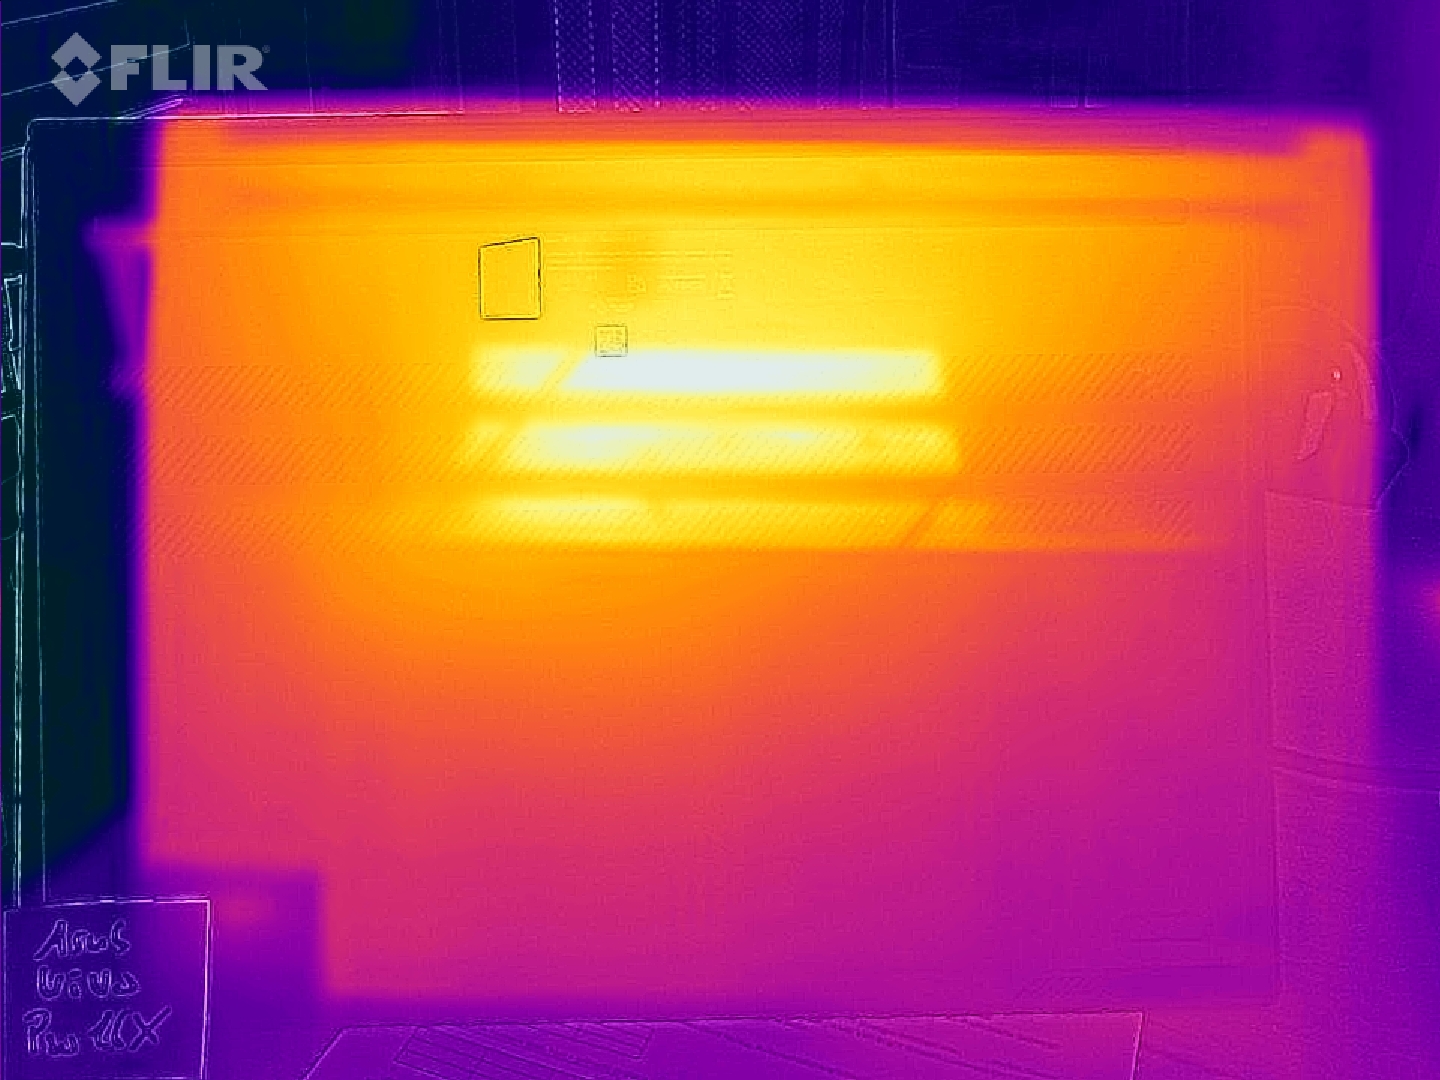
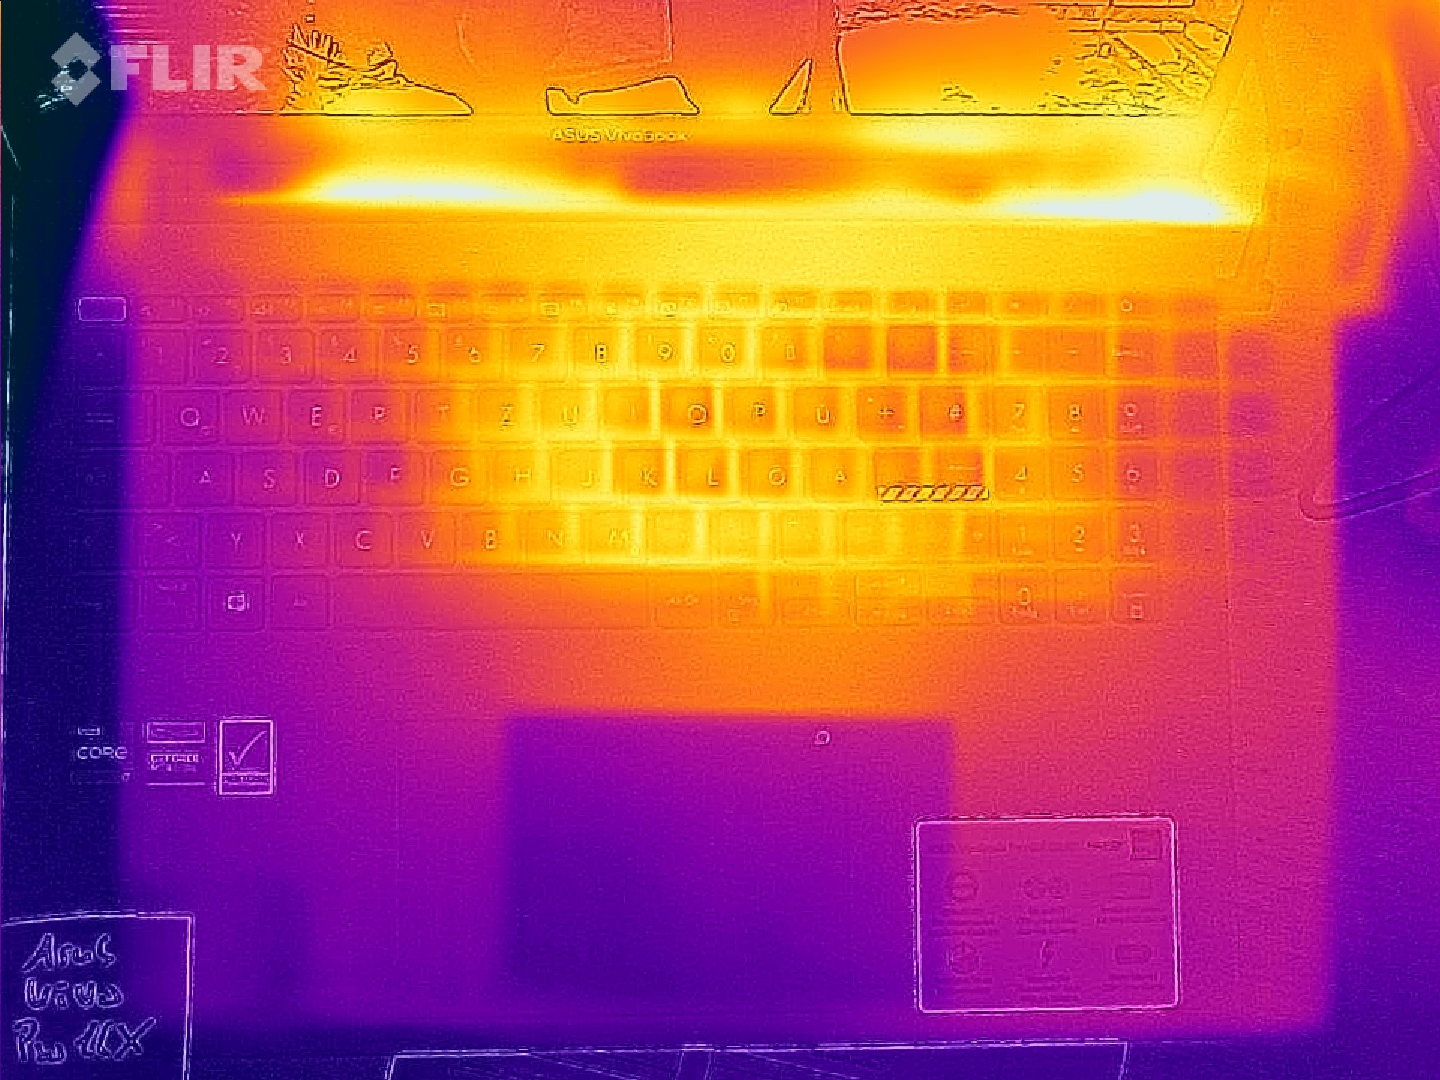
Temperaturas
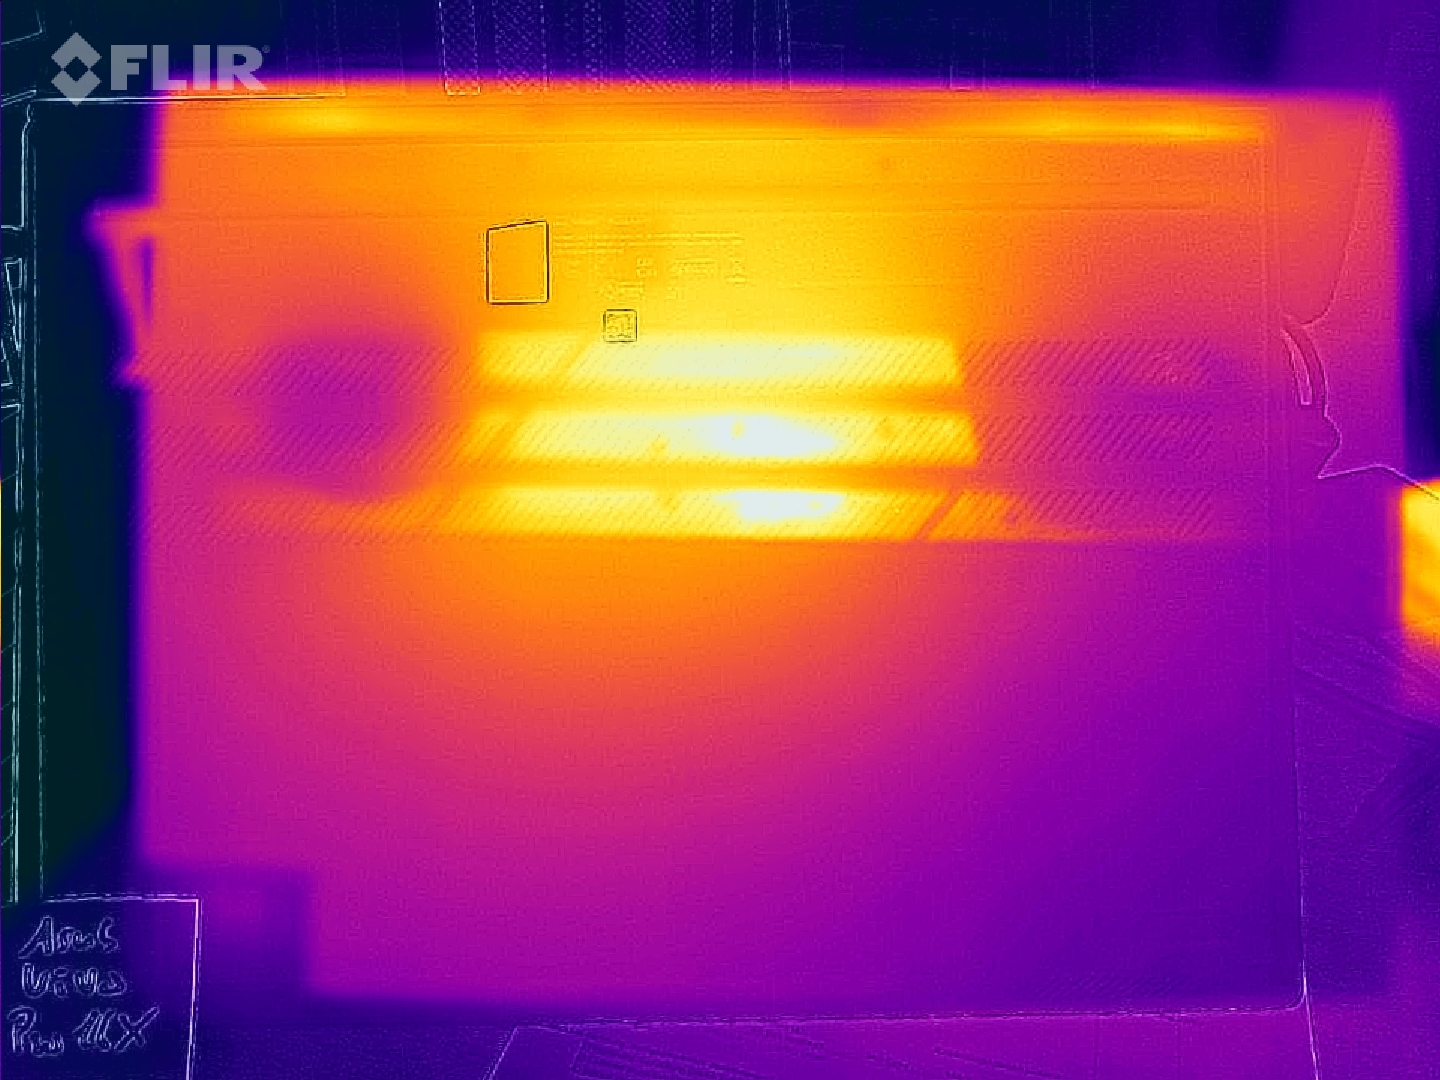
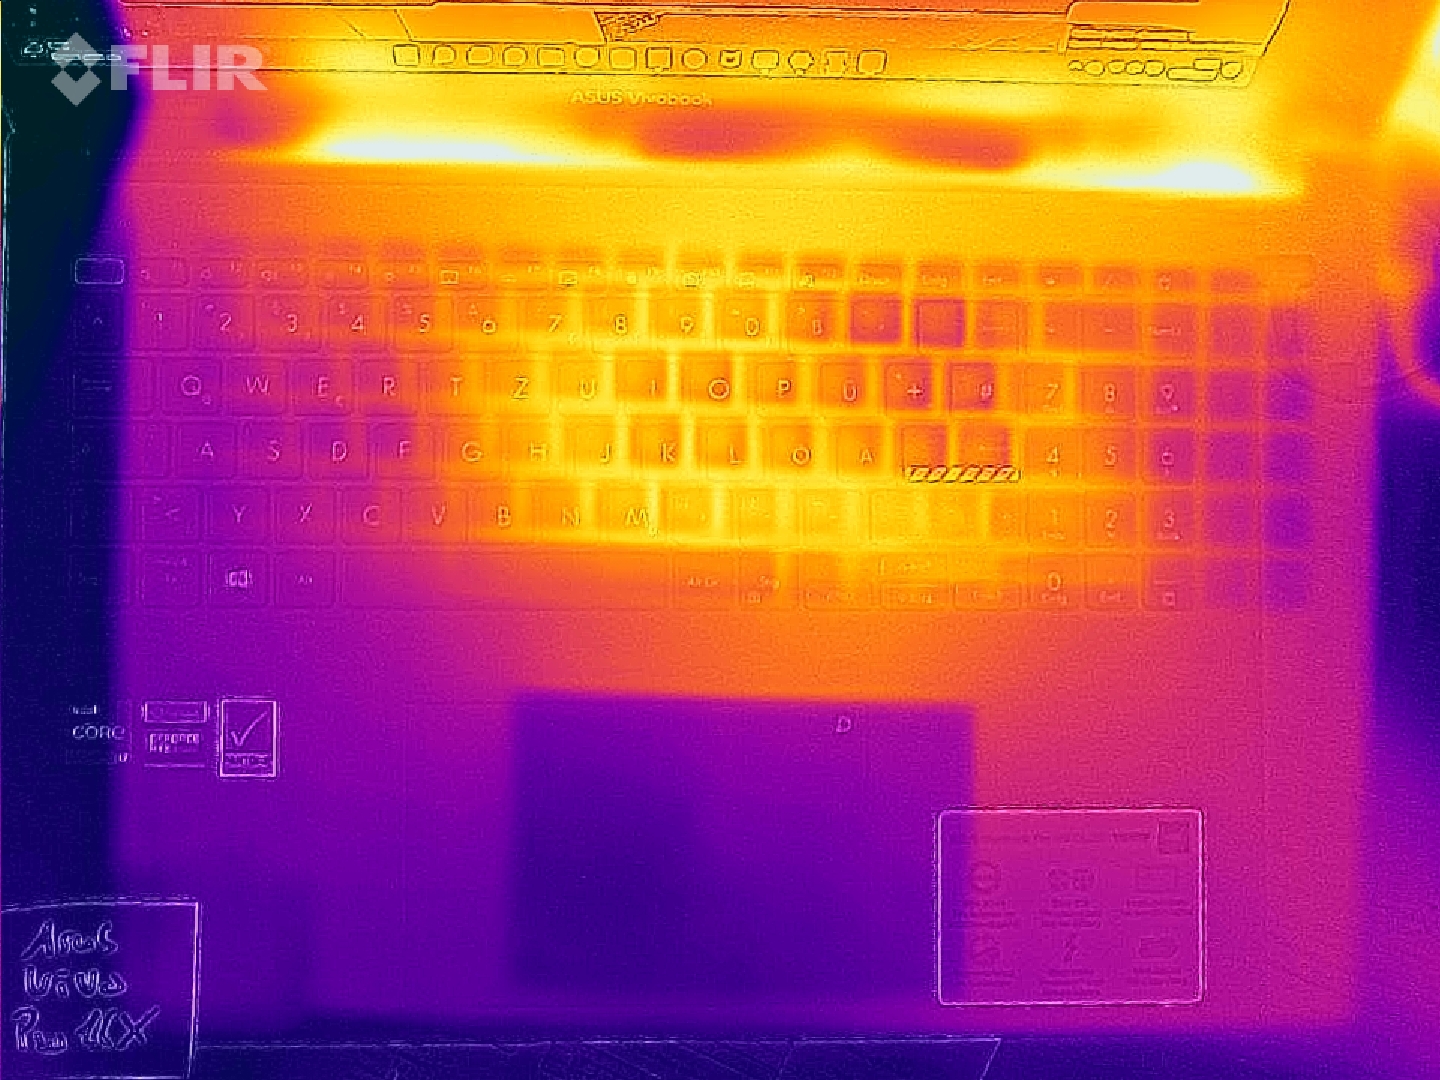
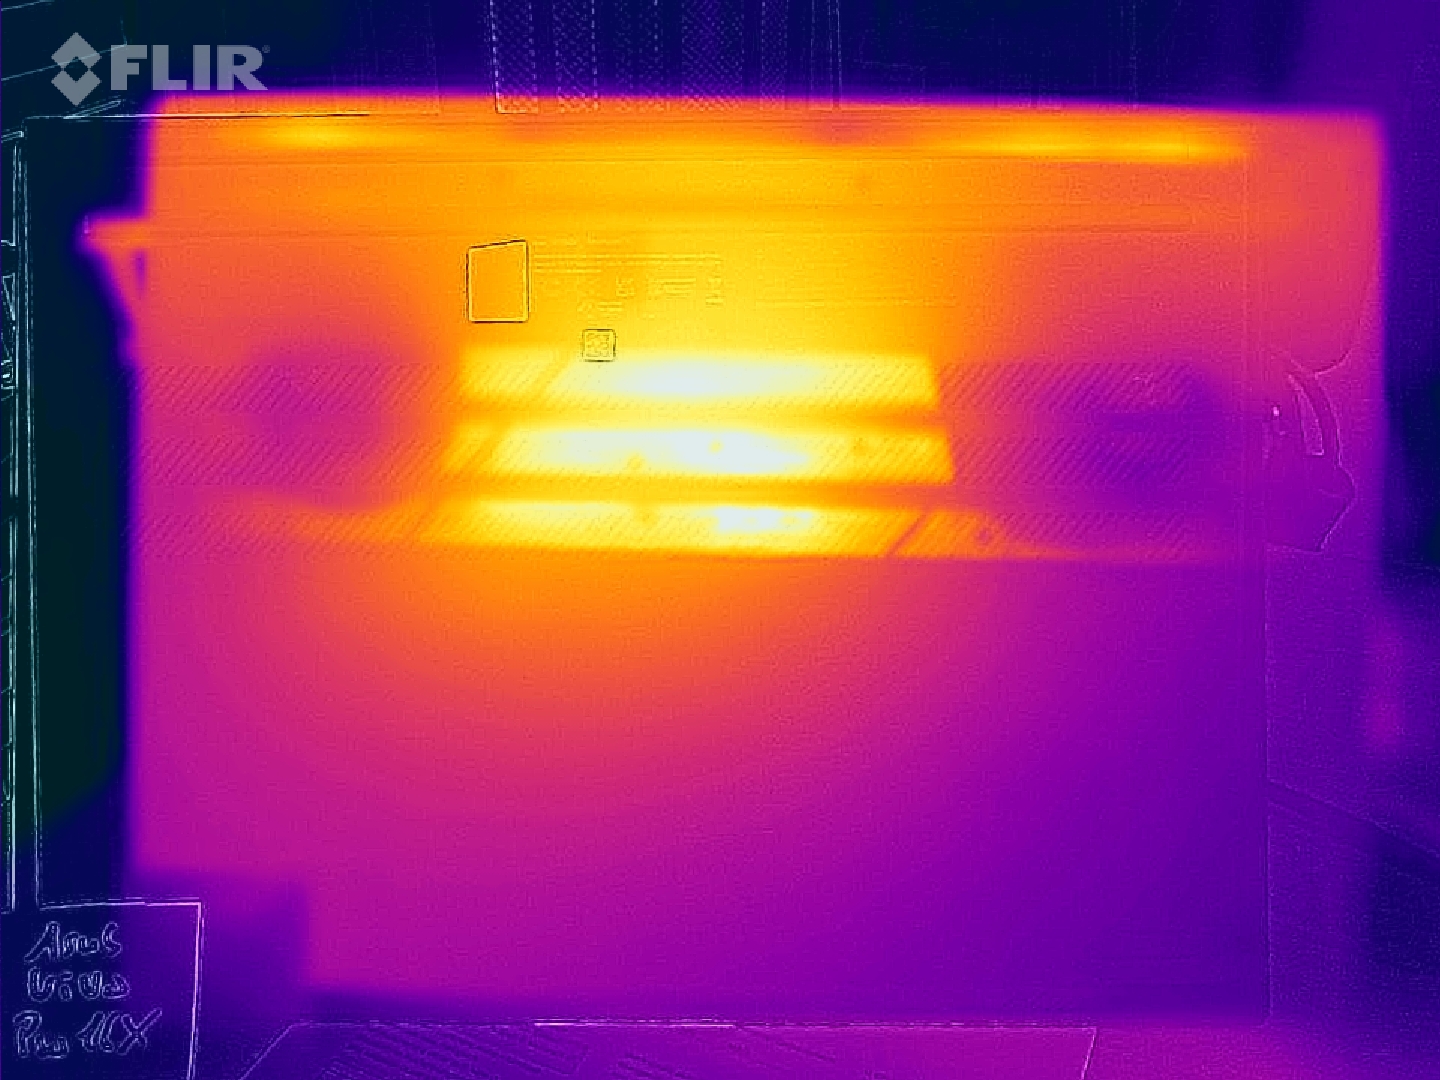
As temperaturas da superfície do Vivobook permanecem em níveis razoáveis em geral, embora tenhamos registrado temperaturas de repouso das palmas de mais de 30 °C (86 °F) sob carga a uma temperatura ambiente moderada. Quando estressados, os pontos quentes no fundo podem se tornar desconfortavelmente quentes. 50 °C (122 °F) no fundo é muito alto para ser confortável durante o uso no colo por períodos prolongados. Felizmente, a área dos pontos quentes no centro do laptop é bastante pequena. Assim, o Vivobook Pro ainda pode ser posicionado de uma forma que não seja um problema.
| Asus VivoBook Pro 16X OLED N7600PC-L2026X GeForce RTX 3050 4GB Laptop GPU, i7-11370H, Intel Optane Memory H10 with Solid State Storage 32GB + 512GB HBRPEKNX0202A(L/H) | MSI Summit E16 Flip A12UDT-031 GeForce RTX 3050 Ti Laptop GPU, i7-1280P, Samsung PM9A1 MZVL22T0HBLB | Microsoft Surface Laptop Studio i7 RTX 3050 Ti GeForce RTX 3050 Ti Laptop GPU, i7-11370H, SK Hynix PC711 1TB HFS001TDE9X084N | Dell Inspiron 16 Plus 7610 GeForce RTX 3050 4GB Laptop GPU, i7-11800H, Kingston OM3PDP3512B | Lenovo ThinkPad X1 Extreme G4-20Y5CTO1WW (3050 Ti) GeForce RTX 3050 Ti Laptop GPU, i7-11800H, Samsung PM9A1 MZVL21T0HCLR | Schenker XMG Focus 15 GeForce RTX 3050 Ti Laptop GPU, i7-11800H, Samsung SSD 970 EVO Plus 1TB | |
|---|---|---|---|---|---|---|
| Noise | 13% | 21% | 16% | 19% | -2% | |
| desligado / ambiente * (dB) | 25.15 | 25 1% | 24.7 2% | 24.4 3% | 23.52 6% | 24 5% |
| Idle Minimum * (dB) | 30 | 25 17% | 24.7 18% | 24.4 19% | 23.52 22% | 25 17% |
| Idle Average * (dB) | 30 | 25 17% | 24.7 18% | 24.4 19% | 23.52 22% | 30 -0% |
| Idle Maximum * (dB) | 30 | 28.9 4% | 24.7 18% | 24.4 19% | 23.52 22% | 43 -43% |
| Load Average * (dB) | 57.6 | 49.3 14% | 33.2 42% | 48.3 16% | 42.9 26% | 56 3% |
| Load Maximum * (dB) | 62.9 | 48.2 23% | 46.7 26% | 48.9 22% | 52.45 17% | 58 8% |
| Witcher 3 ultra * (dB) | 44.5 | 48.9 | 52.5 | 56 |
* ... menor é melhor
(±) A temperatura máxima no lado superior é 40.6 °C / 105 F, em comparação com a média de 36.8 °C / 98 F , variando de 21 a 71 °C para a classe Multimedia.
(-) A parte inferior aquece até um máximo de 53 °C / 127 F, em comparação com a média de 39.1 °C / 102 F
(+) Em uso inativo, a temperatura média para o lado superior é 26.3 °C / 79 F, em comparação com a média do dispositivo de 31.3 °C / ### class_avg_f### F.
(±) Jogando The Witcher 3, a temperatura média para o lado superior é 33.7 °C / 93 F, em comparação com a média do dispositivo de 31.3 °C / ## #class_avg_f### F.
(+) Os apoios para as mãos e o touchpad são mais frios que a temperatura da pele, com um máximo de 30.6 °C / 87.1 F e, portanto, são frios ao toque.
(±) A temperatura média da área do apoio para as mãos de dispositivos semelhantes foi 28.7 °C / 83.7 F (-1.9 °C / -3.4 F).
| Asus VivoBook Pro 16X OLED N7600PC-L2026X Intel Core i7-11370H, NVIDIA GeForce RTX 3050 4GB Laptop GPU | MSI Summit E16 Flip A12UDT-031 Intel Core i7-1280P, NVIDIA GeForce RTX 3050 Ti Laptop GPU | Microsoft Surface Laptop Studio i7 RTX 3050 Ti Intel Core i7-11370H, NVIDIA GeForce RTX 3050 Ti Laptop GPU | Dell Inspiron 16 Plus 7610 Intel Core i7-11800H, NVIDIA GeForce RTX 3050 4GB Laptop GPU | Lenovo ThinkPad X1 Extreme G4-20Y5CTO1WW (3050 Ti) Intel Core i7-11800H, NVIDIA GeForce RTX 3050 Ti Laptop GPU | Schenker XMG Focus 15 Intel Core i7-11800H, NVIDIA GeForce RTX 3050 Ti Laptop GPU | Xiaomi Mi NoteBook Pro Intel Core i7-11370H, Intel Iris Xe Graphics G7 96EUs | |
|---|---|---|---|---|---|---|---|
| Heat | -6% | 15% | -14% | -5% | -17% | -7% | |
| Maximum Upper Side * (°C) | 40.6 | 49.2 -21% | 42.3 -4% | 46.4 -14% | 49 -21% | 43 -6% | 48 -18% |
| Maximum Bottom * (°C) | 53 | 50.2 5% | 38.2 28% | 54.8 -3% | 44.4 16% | 46 13% | 45.8 14% |
| Idle Upper Side * (°C) | 29 | 29.4 -1% | 23.4 19% | 31.4 -8% | 32.1 -11% | 39 -34% | 32.2 -11% |
| Idle Bottom * (°C) | 28.3 | 30 -6% | 23.5 17% | 36.6 -29% | 29.8 -5% | 40 -41% | 32.2 -14% |
* ... menor é melhor
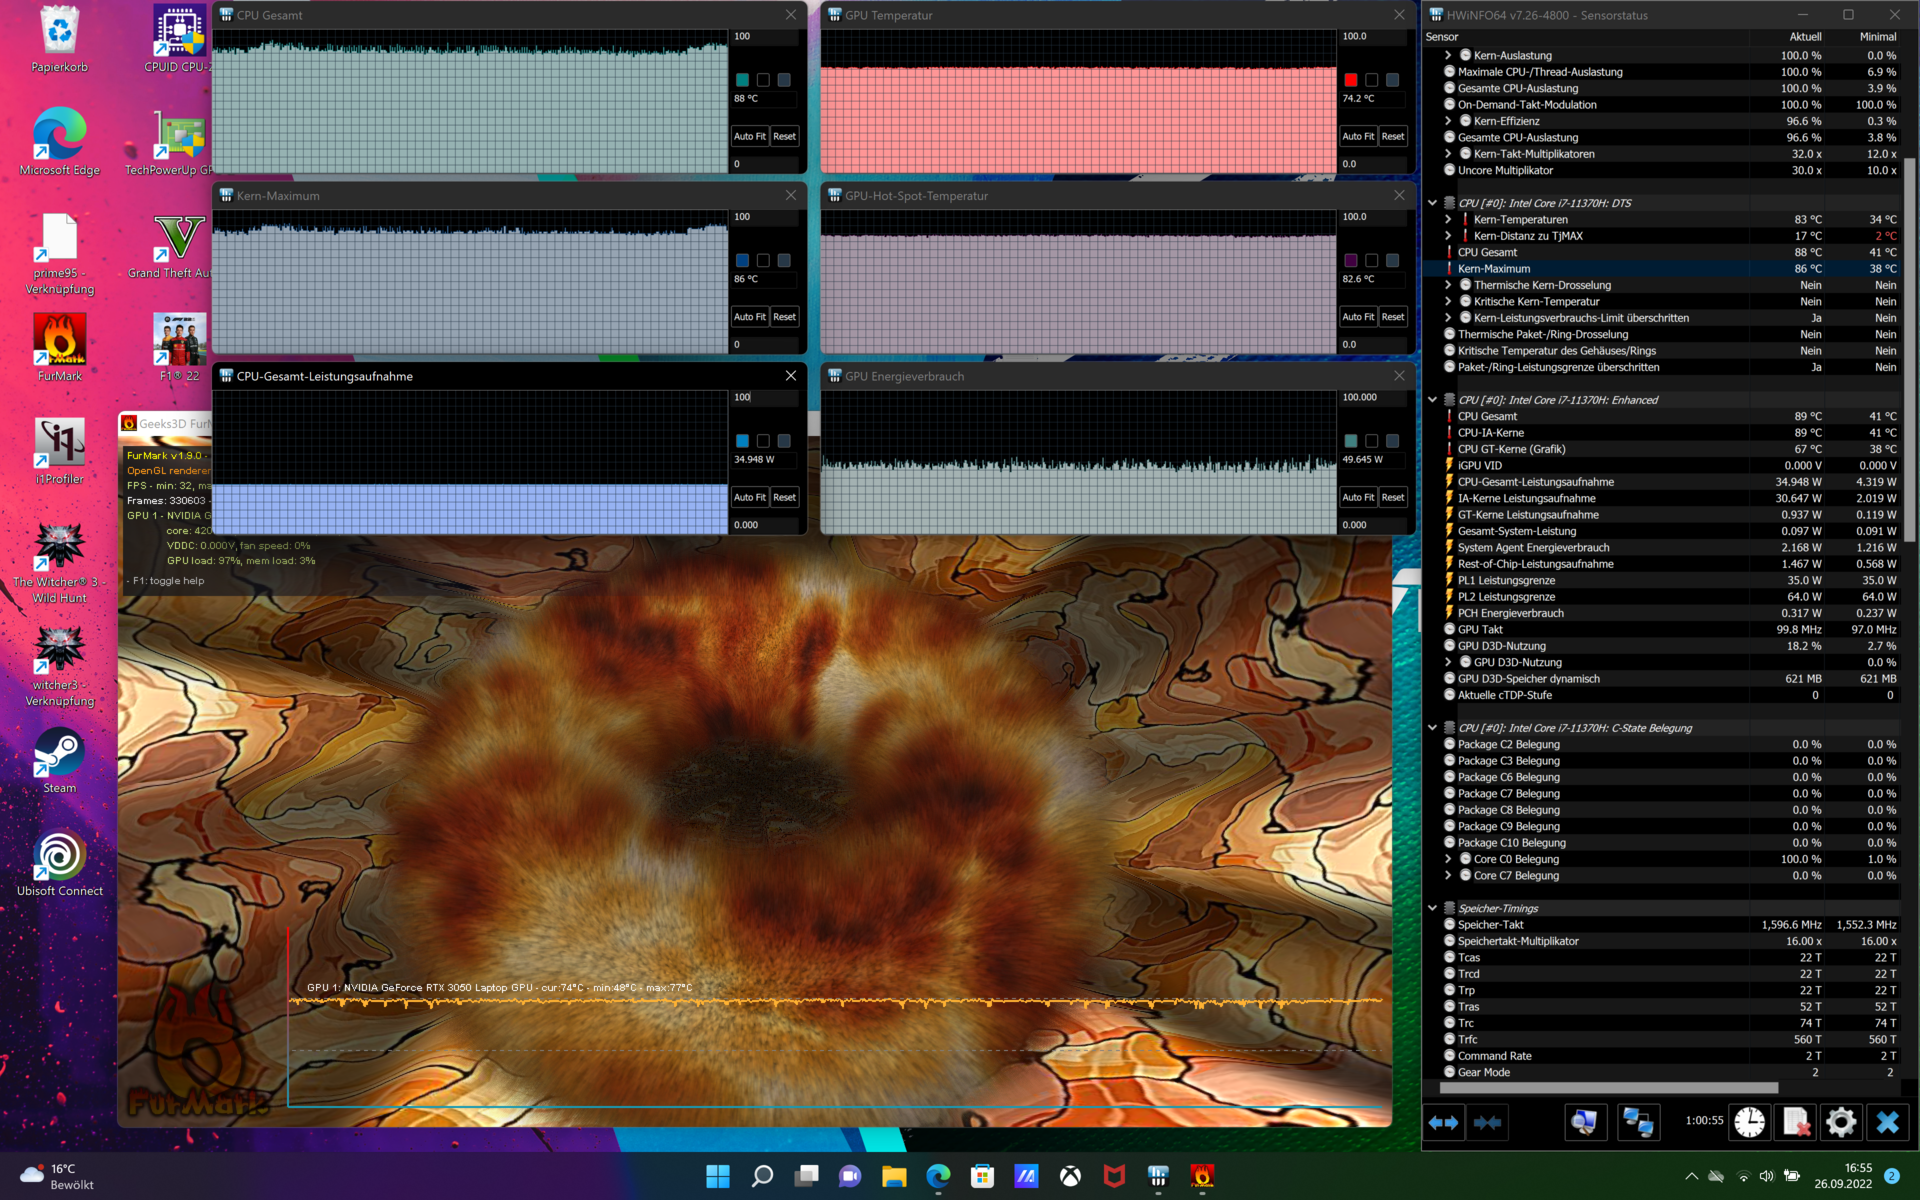
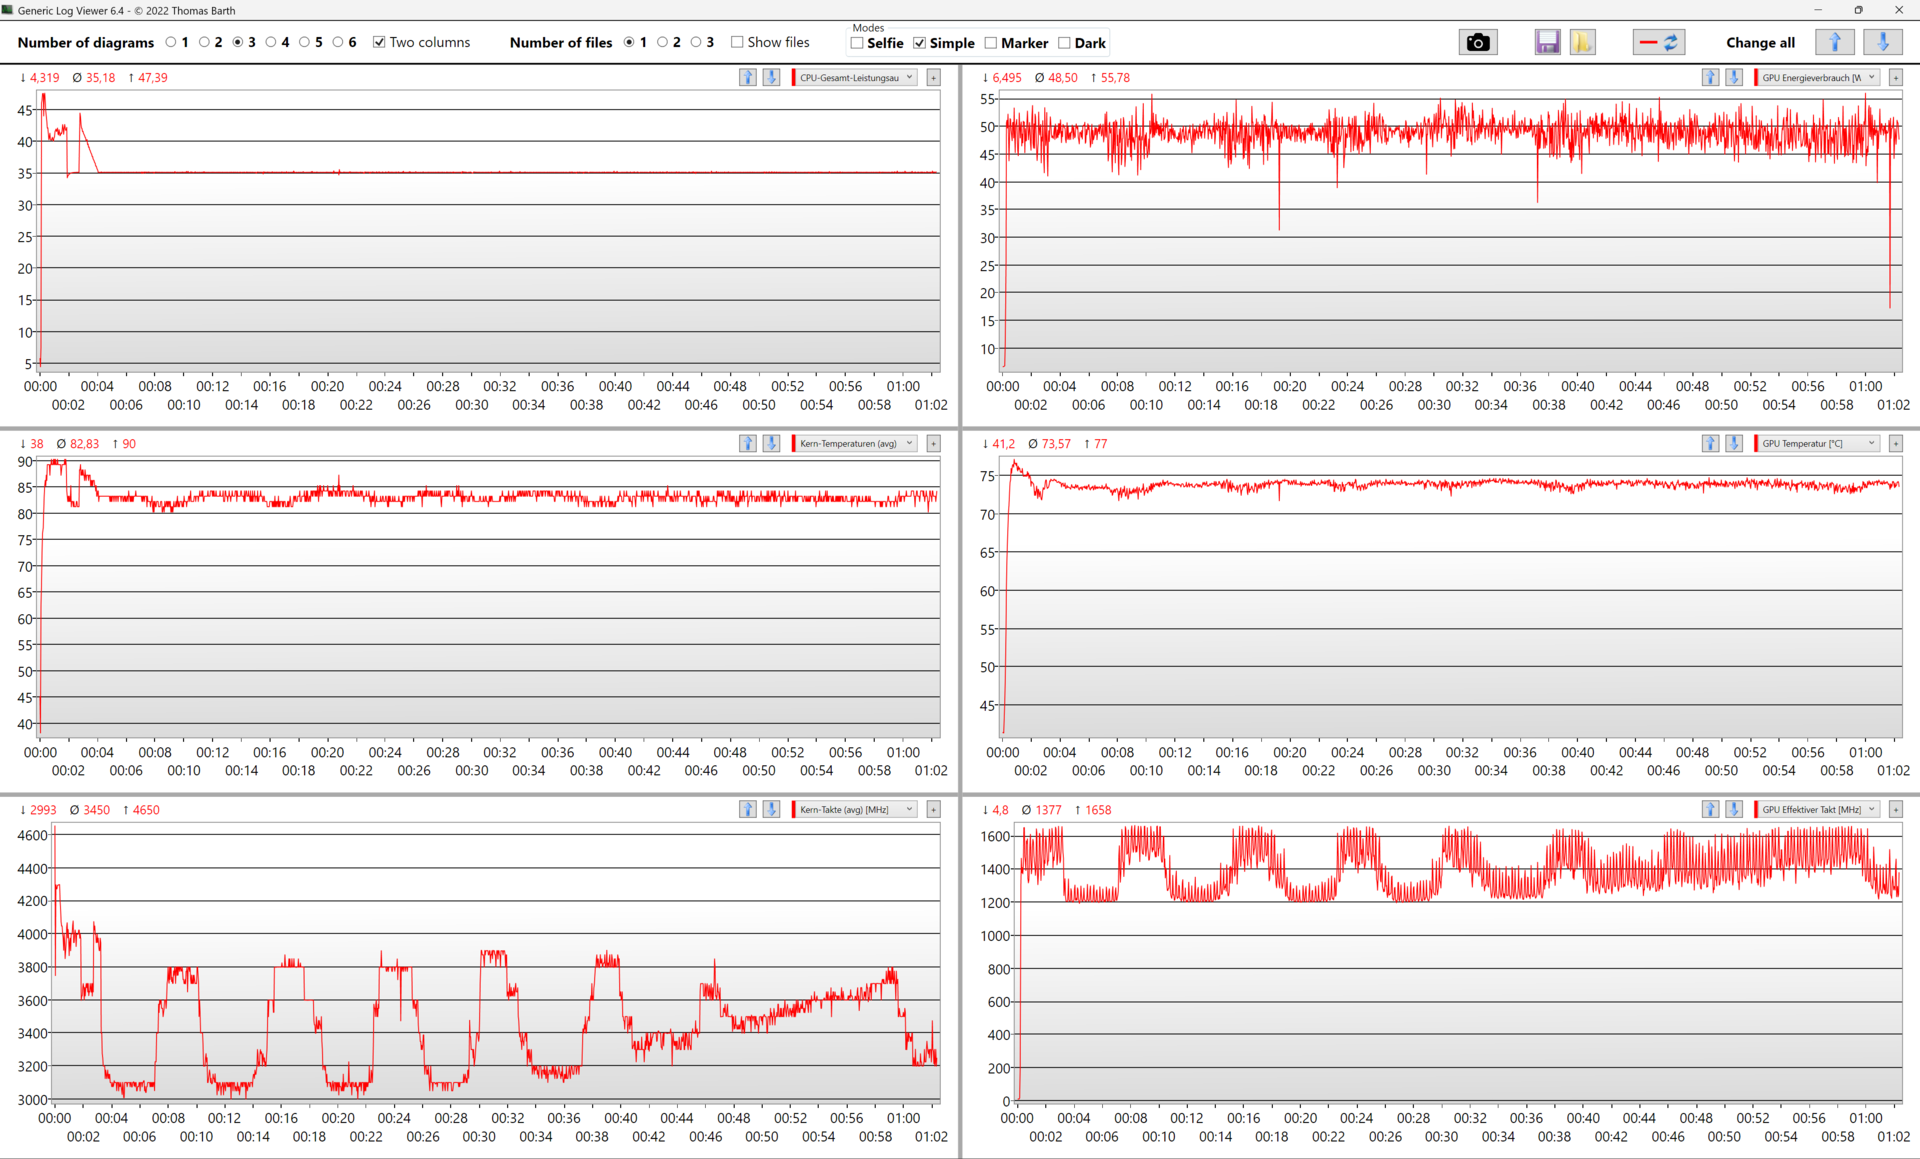
Teste de estresse
O desempenho do Vivobook Pro 16X cai maciçamente durante os dois primeiros minutos. Posteriormente, o desempenho do laptop permanece consistente. Isto também pode ser considerado como uma janela de impulso particularmente longa. O processador começa o teste de estresse com um impressionante 46 watts e depois cai lentamente para 35 watts. Isto corresponde ao máximo teórico PL1 para o Intel Core i7-11370H. As temperaturas permanecem não críticas mesmo sob estresse contínuo. Nenhum dos sensores informa acima de 90 °C (194 °F). Como resultado, as temperaturas de superfície também permanecem confortáveis na maioria das vezes.
Oradores
O Vivobook se esforça para produzir som linear. Apesar do logotipo "Sound by Harman/Kardon", a experiência sonora é relativamente pobre. Os pequenos alto-falantes carecem de graves. A significativa sobremodulação de freqüências mais altas é uma questão muito mais importante. Muitas vezes eles são muito altos, mesmo em níveis de volume mais baixos. A este respeito, há espaço para melhorias.
Asus VivoBook Pro 16X OLED N7600PC-L2026X análise de áudio
(+) | os alto-falantes podem tocar relativamente alto (###valor### dB)
Graves 100 - 315Hz
(-) | quase nenhum baixo - em média 19.4% menor que a mediana
(±) | a linearidade dos graves é média (7.8% delta para a frequência anterior)
Médios 400 - 2.000 Hz
(+) | médios equilibrados - apenas 1.3% longe da mediana
(+) | médios são lineares (2.7% delta para frequência anterior)
Altos 2 - 16 kHz
(±) | máximos mais altos - em média 7.7% maior que a mediana
(+) | os máximos são lineares (6.8% delta da frequência anterior)
Geral 100 - 16.000 Hz
(±) | a linearidade do som geral é média (16% diferença em relação à mediana)
Comparado com a mesma classe
» 40% de todos os dispositivos testados nesta classe foram melhores, 6% semelhantes, 54% piores
» O melhor teve um delta de 5%, a média foi 17%, o pior foi 45%
Comparado com todos os dispositivos testados
» 25% de todos os dispositivos testados foram melhores, 5% semelhantes, 69% piores
» O melhor teve um delta de 4%, a média foi 23%, o pior foi 134%
MSI Summit E16 Flip A12UDT-031 análise de áudio
(±) | o volume do alto-falante é médio, mas bom (###valor### dB)
Graves 100 - 315Hz
(-) | quase nenhum baixo - em média 23.6% menor que a mediana
(-) | graves não são lineares (15.1% delta para frequência anterior)
Médios 400 - 2.000 Hz
(±) | médios mais altos - em média 5.6% maior que a mediana
(±) | a linearidade dos médios é média (7.4% delta para frequência anterior)
Altos 2 - 16 kHz
(±) | máximos mais altos - em média 5.6% maior que a mediana
(+) | os máximos são lineares (4.5% delta da frequência anterior)
Geral 100 - 16.000 Hz
(±) | a linearidade do som geral é média (22.6% diferença em relação à mediana)
Comparado com a mesma classe
» 68% de todos os dispositivos testados nesta classe foram melhores, 5% semelhantes, 27% piores
» O melhor teve um delta de 6%, a média foi 20%, o pior foi 57%
Comparado com todos os dispositivos testados
» 67% de todos os dispositivos testados foram melhores, 6% semelhantes, 28% piores
» O melhor teve um delta de 4%, a média foi 23%, o pior foi 134%
Schenker XMG Focus 15 análise de áudio
(±) | o volume do alto-falante é médio, mas bom (###valor### dB)
Graves 100 - 315Hz
(-) | quase nenhum baixo - em média 25.5% menor que a mediana
(±) | a linearidade dos graves é média (8.4% delta para a frequência anterior)
Médios 400 - 2.000 Hz
(+) | médios equilibrados - apenas 4.9% longe da mediana
(+) | médios são lineares (5.6% delta para frequência anterior)
Altos 2 - 16 kHz
(+) | agudos equilibrados - apenas 1.7% longe da mediana
(+) | os máximos são lineares (4.1% delta da frequência anterior)
Geral 100 - 16.000 Hz
(±) | a linearidade do som geral é média (20% diferença em relação à mediana)
Comparado com a mesma classe
» 70% de todos os dispositivos testados nesta classe foram melhores, 7% semelhantes, 23% piores
» O melhor teve um delta de 6%, a média foi 18%, o pior foi 132%
Comparado com todos os dispositivos testados
» 51% de todos os dispositivos testados foram melhores, 8% semelhantes, 40% piores
» O melhor teve um delta de 4%, a média foi 23%, o pior foi 134%
Gerenciamento de energia - Sem tempo de funcionamento recorde, apesar da bateria de 96Wh
Consumo de energia
O Vivobook Pro 16X OLED mostra valores razoáveis de consumo em nossos testes. Naturalmente, o hardware potente requer um pouco mais de potência ao realizar tarefas exigentes. Enquanto ocioso, o consumo de energia do laptop Asus é ligeiramente aumentado em alguns watts em relação a outros dispositivos em nossa comparação. Entretanto, descobrimos com freqüência que os laptops com displays OLED estavam em ligeira desvantagem neste aspecto, em comparação com os modelos LCD.
| desligado | |
| Ocioso | |
| Carga |
|
Key:
min: | |
| Asus VivoBook Pro 16X OLED N7600PC-L2026X i7-11370H, GeForce RTX 3050 4GB Laptop GPU, Intel Optane Memory H10 with Solid State Storage 32GB + 512GB HBRPEKNX0202A(L/H), OLED, 3840x2400, 16" | MSI Summit E16 Flip A12UDT-031 i7-1280P, GeForce RTX 3050 Ti Laptop GPU, Samsung PM9A1 MZVL22T0HBLB, IPS, 2560x1600, 16" | Microsoft Surface Laptop Studio i7 RTX 3050 Ti i7-11370H, GeForce RTX 3050 Ti Laptop GPU, SK Hynix PC711 1TB HFS001TDE9X084N, IPS, 2400x1600, 14.4" | Dell Inspiron 16 Plus 7610 i7-11800H, GeForce RTX 3050 4GB Laptop GPU, Kingston OM3PDP3512B, IPS, 3072x1920, 16" | Lenovo ThinkPad X1 Extreme G4-20Y5CTO1WW (3050 Ti) i7-11800H, GeForce RTX 3050 Ti Laptop GPU, Samsung PM9A1 MZVL21T0HCLR, IPS LED, 3840x2400, 16" | Schenker XMG Focus 15 i7-11800H, GeForce RTX 3050 Ti Laptop GPU, Samsung SSD 970 EVO Plus 1TB, IPS, 1920x1080, 15.6" | Média NVIDIA GeForce RTX 3050 4GB Laptop GPU | Média da turma Multimedia | |
|---|---|---|---|---|---|---|---|---|
| Power Consumption | -12% | 30% | -12% | -47% | -89% | -2% | 13% | |
| Idle Minimum * (Watt) | 8.9 | 9.8 -10% | 2.6 71% | 7.7 13% | 10.3 -16% | 23 -158% | 7.17 ? 19% | 5.62 ? 37% |
| Idle Average * (Watt) | 10.2 | 15.3 -50% | 7.1 30% | 10.7 -5% | 22.06 -116% | 25 -145% | 10.4 ? -2% | 10.2 ? -0% |
| Idle Maximum * (Watt) | 12 | 16.3 -36% | 7.9 34% | 16.8 -40% | 23 -92% | 29 -142% | 14.8 ? -23% | 12.5 ? -4% |
| Load Average * (Watt) | 94 | 87 7% | 76.8 18% | 100.39 -7% | 102.57 -9% | 106 -13% | 89.7 ? 5% | 65 ? 31% |
| Witcher 3 ultra * (Watt) | 93.1 | 86.1 8% | 83 11% | 108 -16% | 106 -14% | 128 -37% | ||
| Load Maximum * (Watt) | 112 | 100 11% | 97.3 13% | 129 -15% | 147.8 -32% | 156 -39% | 124.8 ? -11% | 111.9 ? -0% |
* ... menor é melhor
Consumption Witcher 3 / Stress Test
Consumption external Monitor
Vida útil da bateria
Devido à alta capacidade da bateria de 96 Wh, pode-se esperar uma longa vida útil da bateria. A capacidade quase atinge o limite legal para um laptop. No entanto, o visor OLED de 16 polegadas de alta resolução é claramente generoso com seu uso dos recursos da bateria. No brilho máximo, nosso dispositivo de teste Asus dura apenas cerca de 6:30 horas em nosso teste Wi-Fi do mundo real. A redução do brilho para 150 lêndeas já resulta em mais 2 horas de funcionamento. Um método popular de economia de energia para displays OLED é forçar o uso de um modo escuro sempre que possível. Cada área brilhante no visor consome energia. Como muitas grandes áreas brancas são freqüentemente exibidas durante nosso teste de navegação na web, é particularmente imperdoável para os visores OLED.
| Asus VivoBook Pro 16X OLED N7600PC-L2026X i7-11370H, GeForce RTX 3050 4GB Laptop GPU, 96 Wh | MSI Summit E16 Flip A12UDT-031 i7-1280P, GeForce RTX 3050 Ti Laptop GPU, 82 Wh | Microsoft Surface Laptop Studio i7 RTX 3050 Ti i7-11370H, GeForce RTX 3050 Ti Laptop GPU, 58 Wh | Dell Inspiron 16 Plus 7610 i7-11800H, GeForce RTX 3050 4GB Laptop GPU, 86 Wh | Lenovo ThinkPad X1 Extreme G4-20Y5CTO1WW (3050 Ti) i7-11800H, GeForce RTX 3050 Ti Laptop GPU, 90 Wh | Schenker XMG Focus 15 i7-11800H, GeForce RTX 3050 Ti Laptop GPU, 49 Wh | Média da turma Multimedia | |
|---|---|---|---|---|---|---|---|
| Duração da bateria | -18% | -34% | 44% | -38% | -53% | 44% | |
| Reader / Idle (h) | 11.1 | 20.5 85% | 6.5 -41% | 24.9 ? 124% | |||
| WiFi v1.3 (h) | 8.7 | 7.1 -18% | 8 -8% | 9.9 14% | 6.6 -24% | 3.9 -55% | 12.3 ? 41% |
| Load (h) | 2.5 | 1 -60% | 3.3 32% | 1.2 -52% | 0.9 -64% | 1.645 ? -34% | |
| H.264 (h) | 12.3 | 6.7 | 16.8 ? |
Pro
Contra
Veredicto - Desempenho Médio, Exibição Excepcional
A tela do Asus Vivobook Pro 16X OLED é, sem dúvida, sua melhor característica. O painel OLED brilha com cores naturais e tempos de resposta muito rápidos. Seus inconvenientes são quase totalmente limitados ao uso externo. As características do laptop correspondem em sua maioria às nossas expectativas de um laptop multimídia de médio alcance superior. Dito isto, o armazenamento um pouco lento do Optane e o número da versão inferior nas portas USB à esquerda são um tanto decepcionantes. O USB 2.0 está desatualizado pelos padrões de hoje.
O chassi de alumínio é sutil, mas visualmente atrativo. O revestimento da trama é surpreendentemente resistente à graxa, agradável ao toque, e sempre uma visão interessante de se ver. Infelizmente, o Asus deixou cair a bola quando se trata da qualidade de construção. A impressão geral sofre de desníveis em múltiplas áreas.
A fantástica exibição OLED do Asus Vivobook Pro 16X é o centro das atenções. Entretanto, o laptop também oferece um nível de desempenho médio-alto e um estojo geral decente. O pacote é completado por recursos interessantes como o Asus Dial.
Em termos de preço, cerca de 1.600 USD coloca o Vivobook na faixa média superior. Em relação a outros dispositivos desta categoria, as características, qualidade de construção e design são adequados. Enquanto isso, o Dell Inspiron 16 Plus 7610 é significativamente mais barato. Este último oferece características similares, um bom visor IPS e pode ser adquirido por pouco mais de 1000 USD junto a vários varejistas. Dito isto, outras configurações do Asus Vivobook 16X também estão disponíveis por significativamente menos, dependendo do modelo.
Preço e Disponibilidade
Uma configuração similar do Asus Vivobook está disponível no site Amazon.com por cerca de 1500 USD. Em Newegg, a mesma configuração, mas com 16 GB ao invés de 32 GB de RAM, está à venda no momento por 999 USD (preço normal 1399 USD).
Asus VivoBook Pro 16X OLED N7600PC-L2026X
- 11/07/2022 v7 (old)
Marc Herter
Price comparison

