Veredicto - Aparência profissional para escritório ou casa
Um dos aspectos mais atraentes do Beelink SEi13 Pro é seu design inspirado em Apple, pois o sistema se integra mais facilmente em ambientes de escritório ou domésticos do que os antigos designs de plástico pesado do SER7 ou SEi12 geração. A construção e os materiais de maior qualidade não implicaram em preços significativamente mais altos, o que significa que o SEi13 Pro permanece relativamente acessível na faixa de US$ 500 a US$ 600.
O desempenho da CPU e as portas também continuam fortes, com o Core i9-13900HK e três tipos de portas de saída de vídeo sendo mais do que suficientes para a maioria das configurações de escritório ou multimídia. Também gostamos de seu silêncio e de suas dimensões mais compactas em comparação com o maior e mais caro GTi13 Ultra maior e mais caro, que vem com exatamente o mesmo processador Intel para praticamente o mesmo nível de desempenho.
Embora a maioria dos usuários ache o SEi13 Pro suficiente, os usuários avançados podem se incomodar com a falta de aceleração de IA da CPU e com o fraco desempenho gráfico geral, mesmo para uma GPU integrada. Os alto-falantes estéreo integrados, embora sejam bons no papel, não são altos o suficiente para encher salas de conferência ou salas de estar. A falta de recursos como VESA, suporte a Thunderbolt e até mesmo um leitor de cartão SD pode limitar as opções de conectividade e afetar negativamente a experiência do usuário. A atualização para o GTi13 Ultra resolve alguns desses problemas, enquanto as alternativas da AMD, como o SER8 podem fornecer mais potência gráfica por aproximadamente o mesmo preço.
Pro
Contra
Preço e disponibilidade
A Amazon já está enviando o Beelink SEi13 Pro por US$ 540. Os usuários também podem comprar diretamente do fabricante pelo mesmo preço.
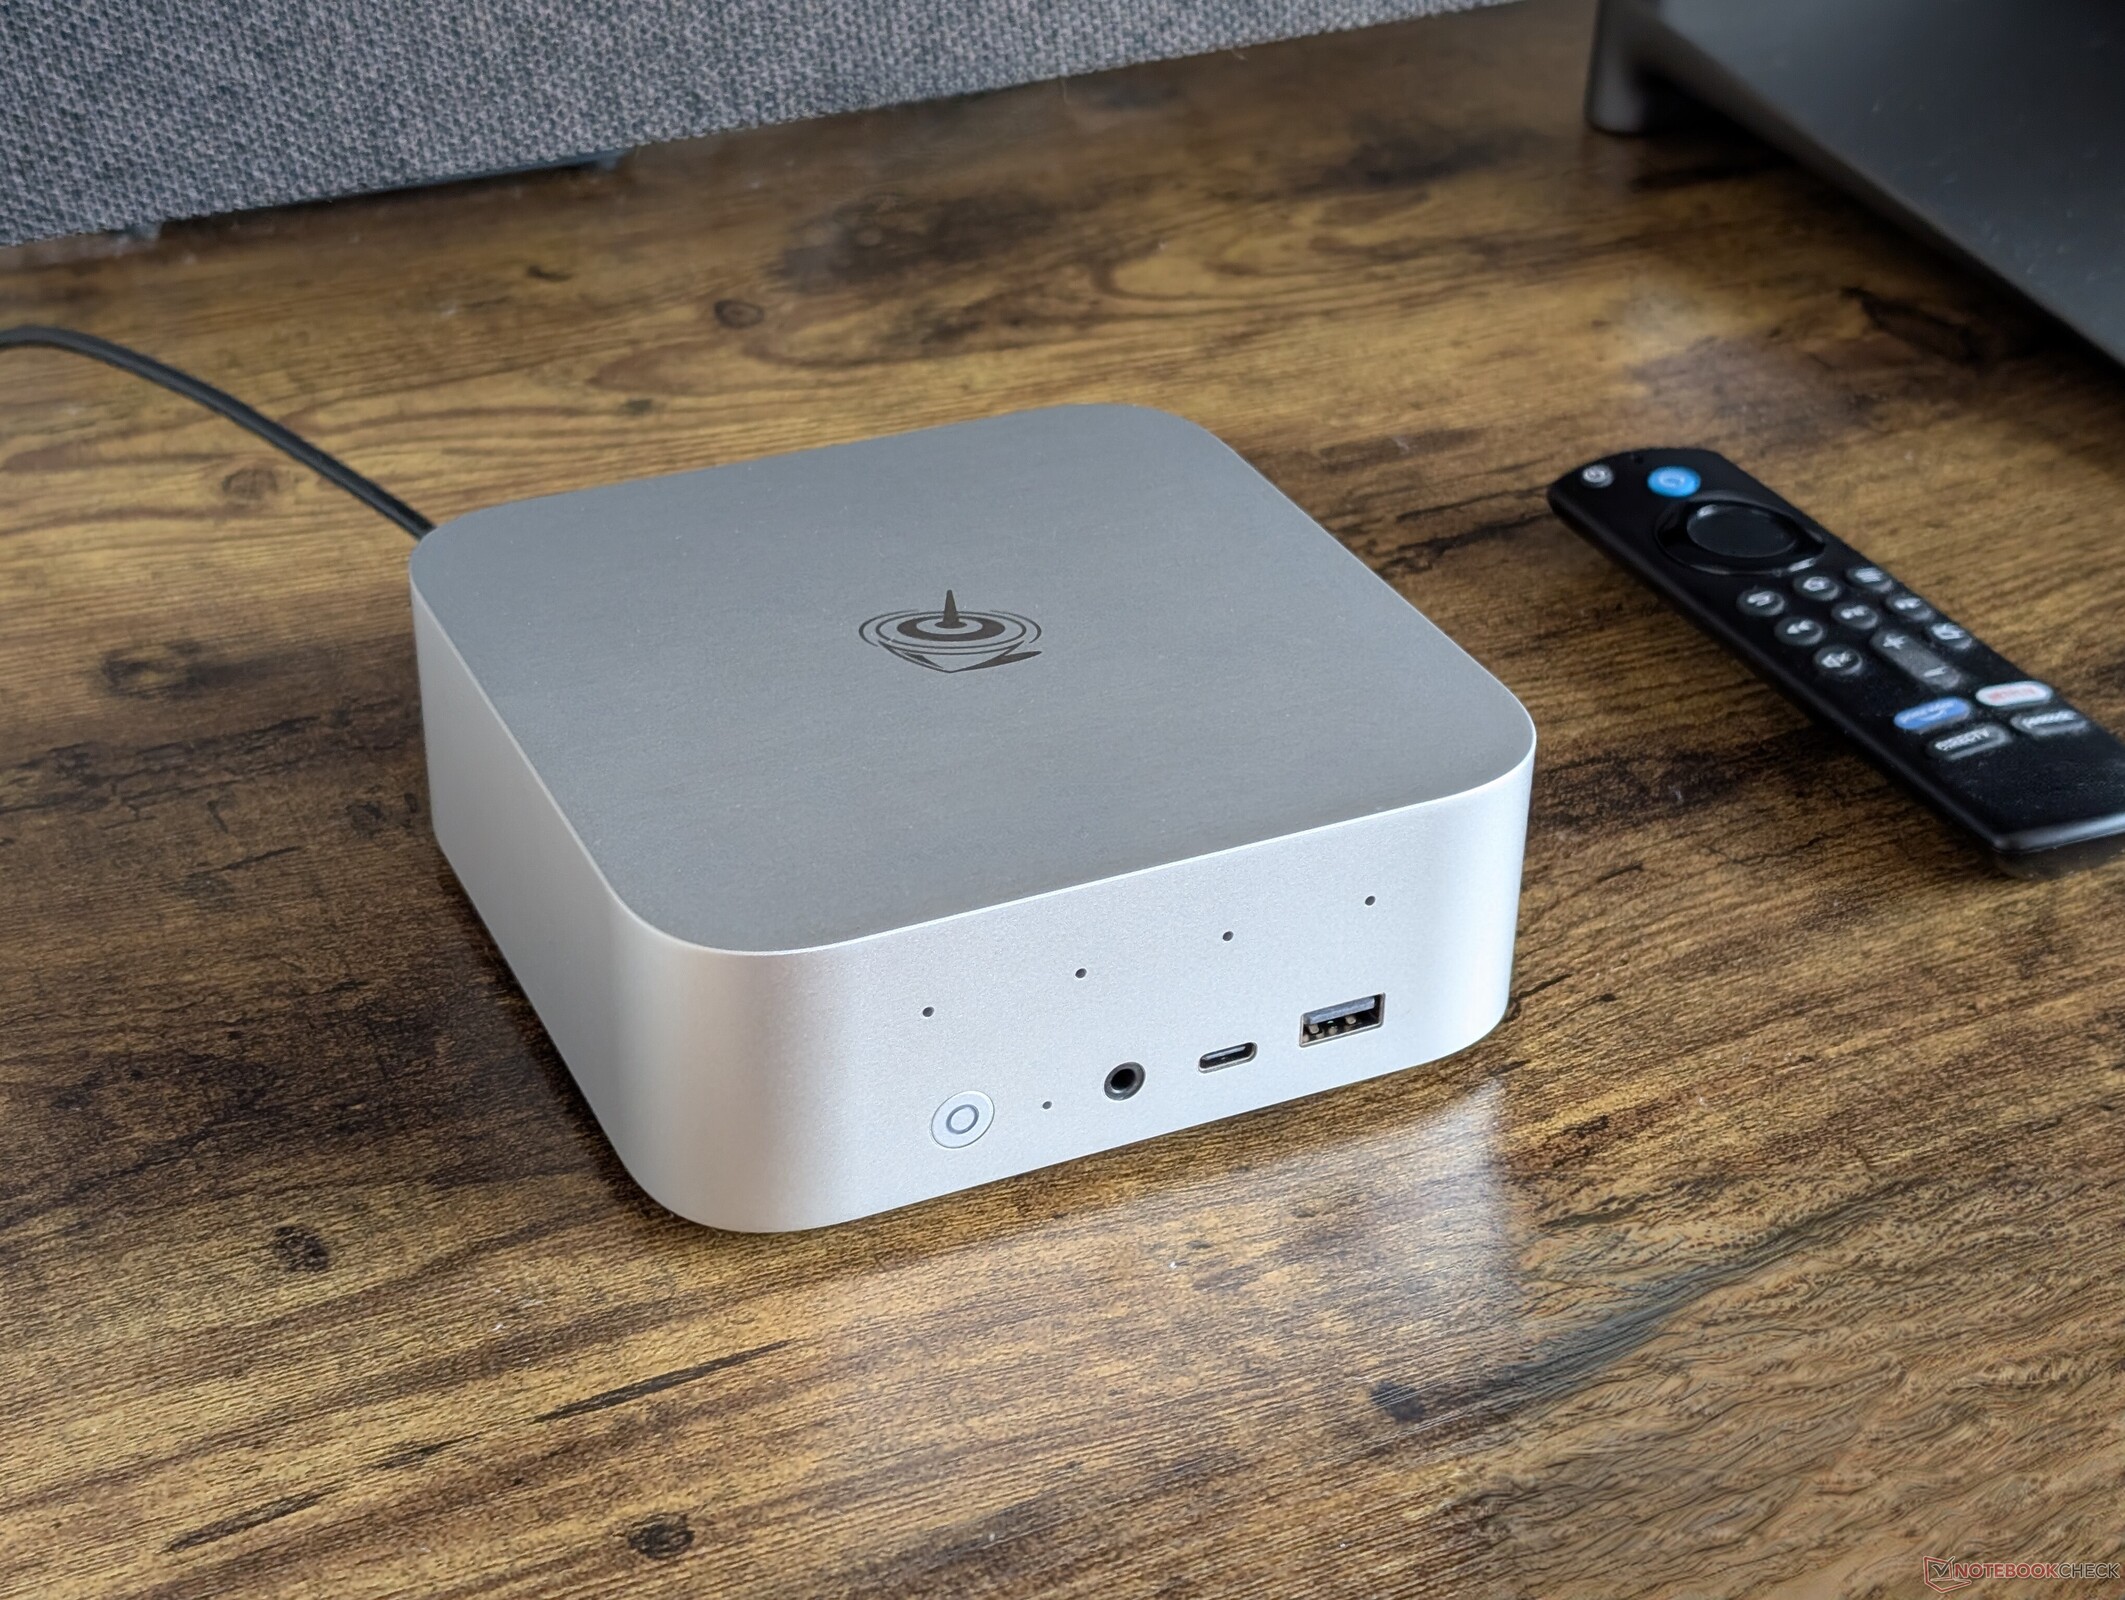
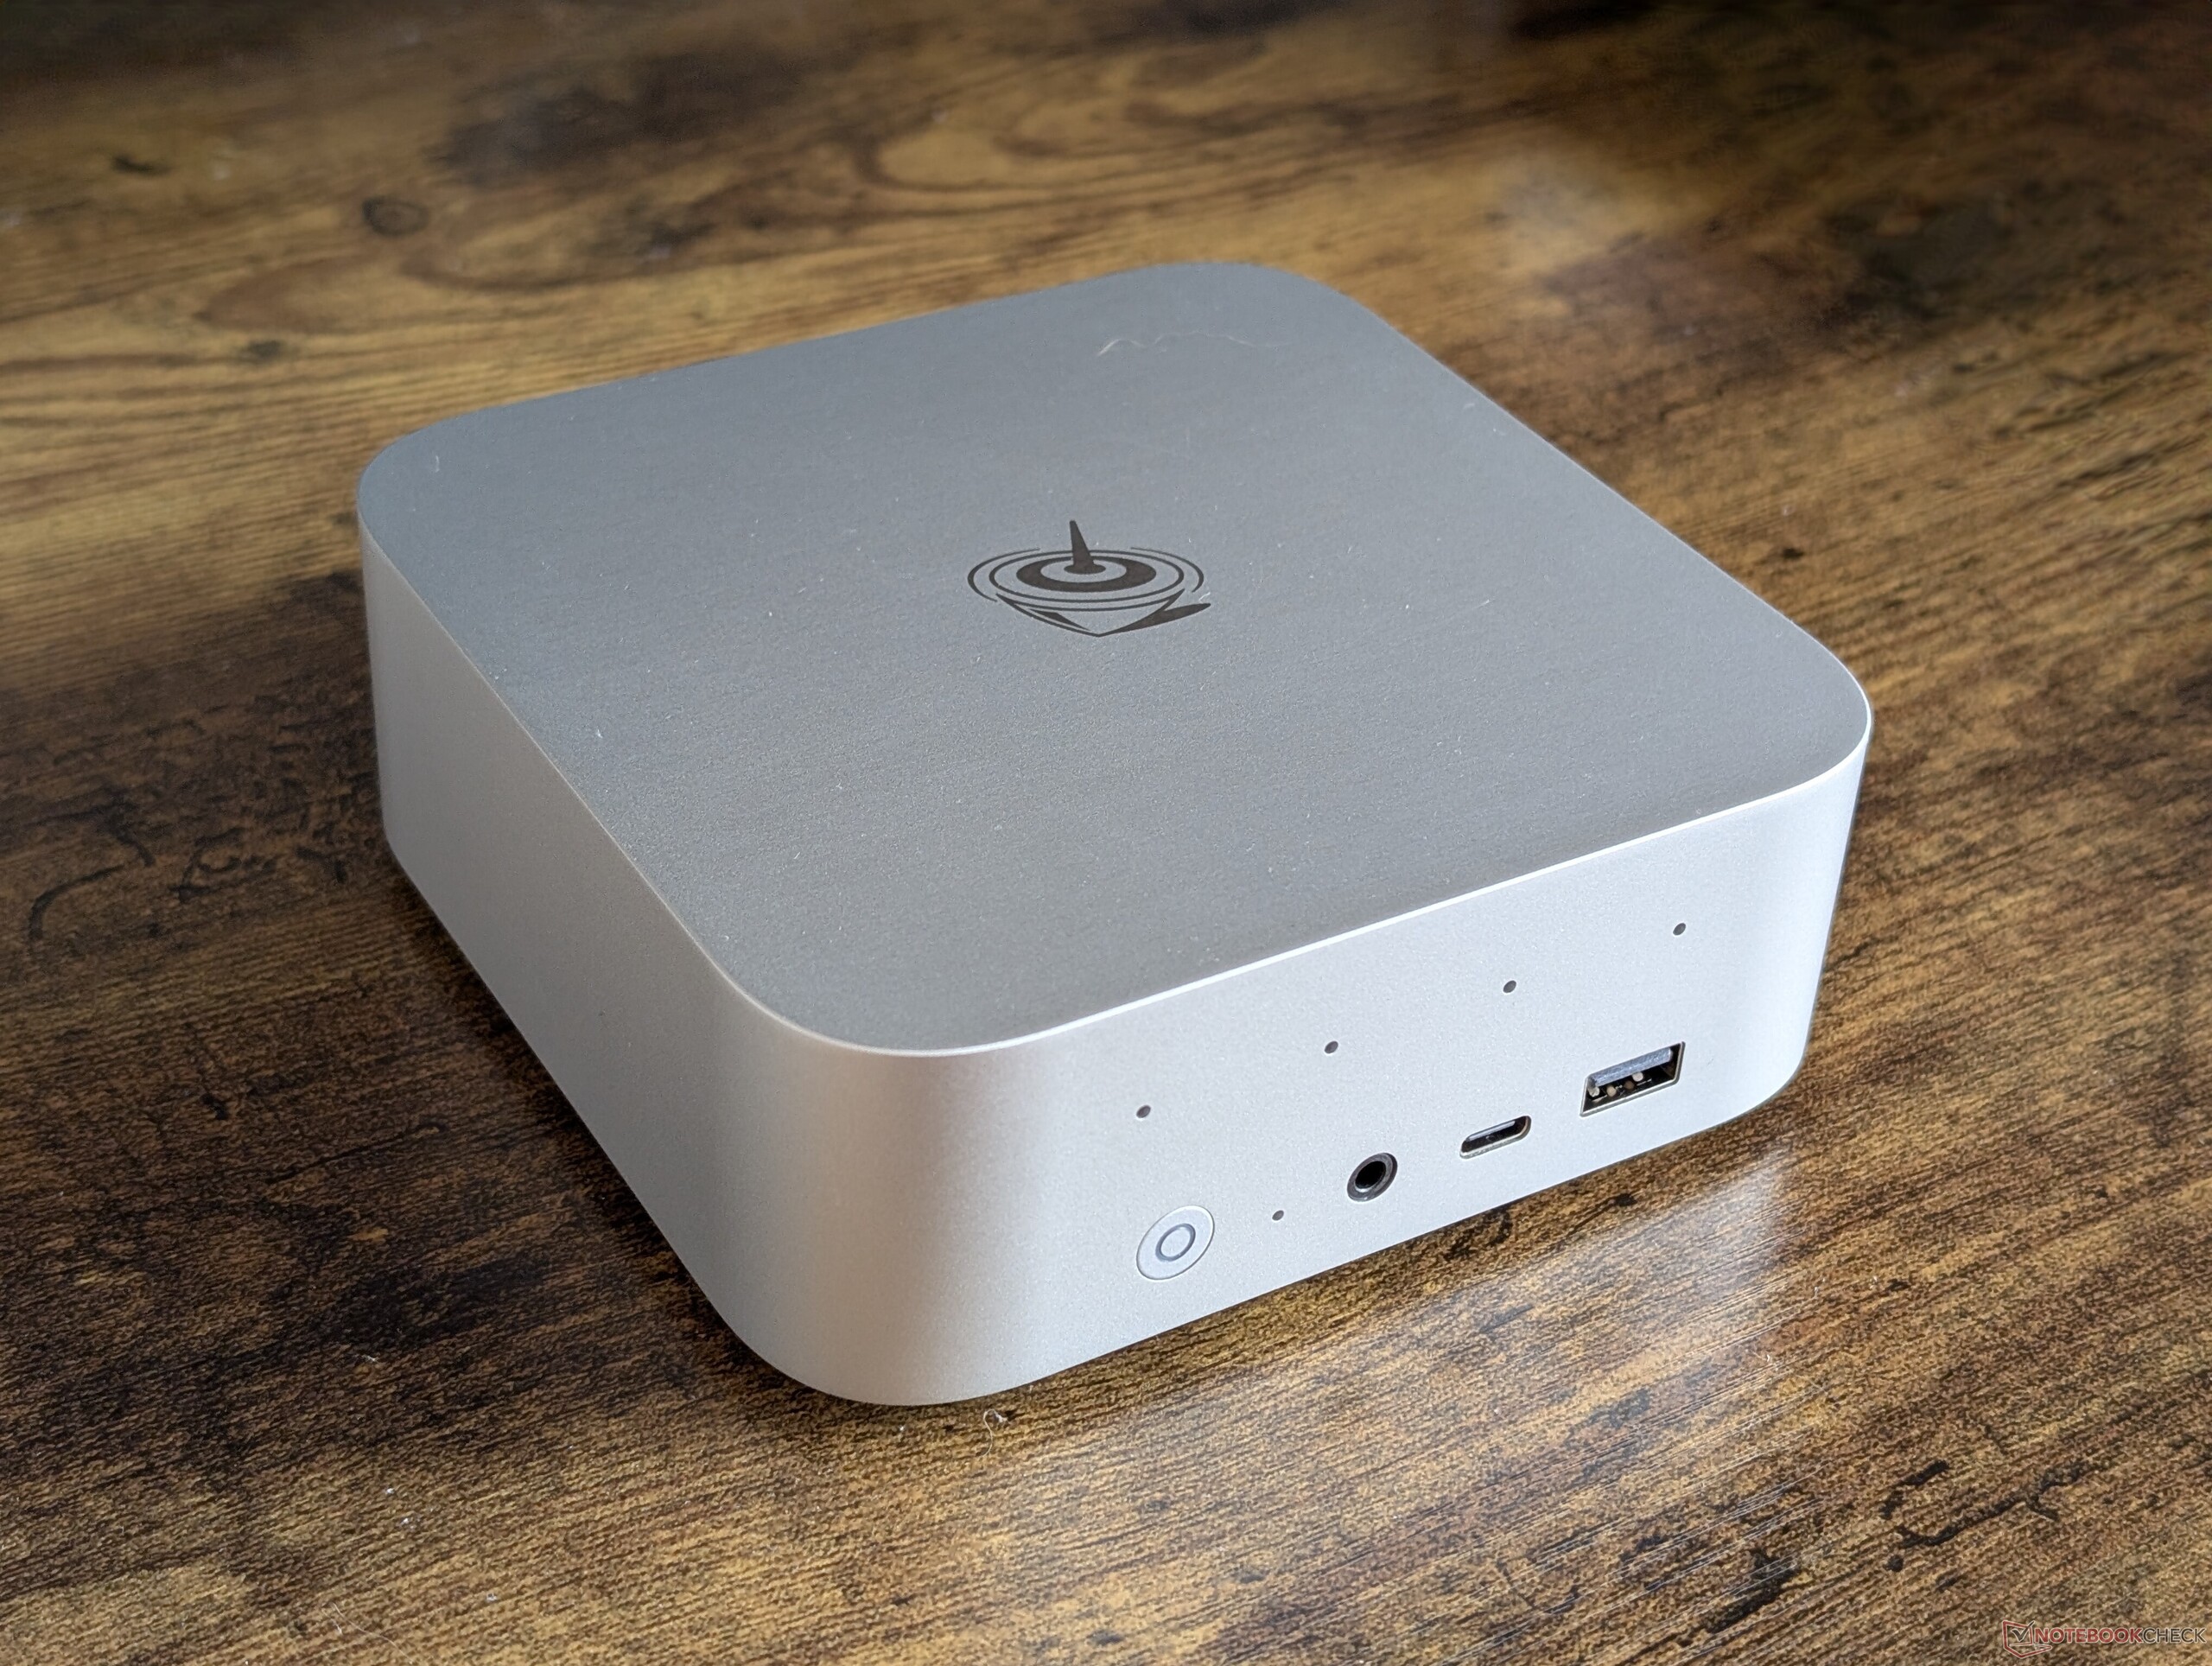
O SEi13 Pro é um mini PC multimídia inspirado no Apple Mac Mini para uso doméstico ou em escritórios. Ele se destaca pelos alto-falantes estéreo integrados e pelo resfriamento por câmara de vapor, que não são comuns em outros minicomputadores da mesma faixa de preço.
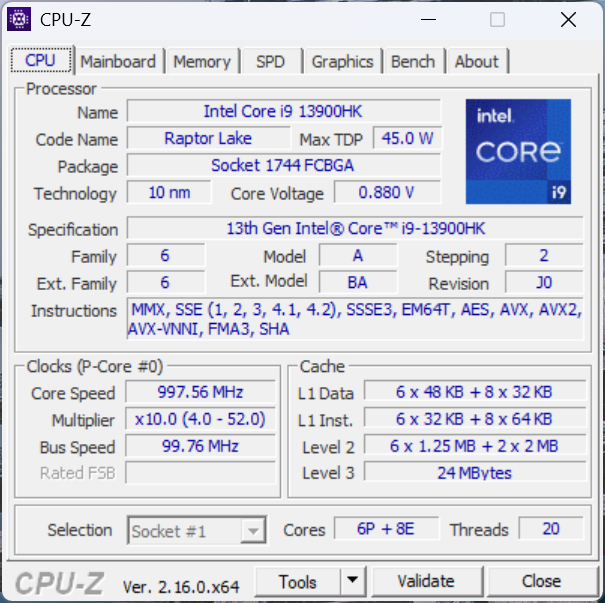
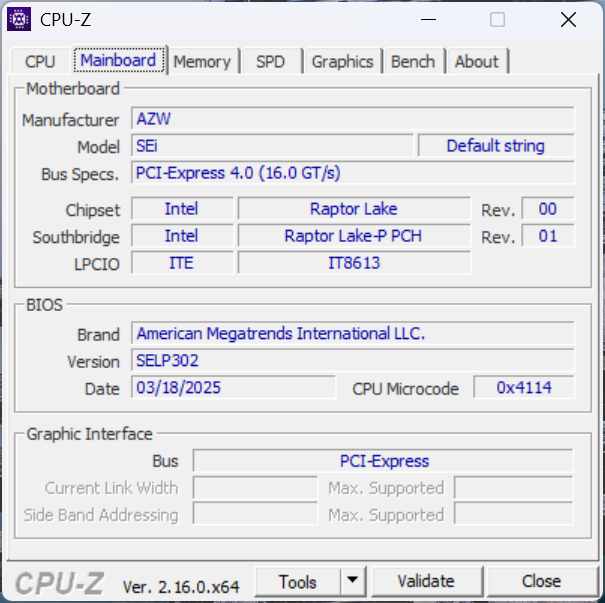
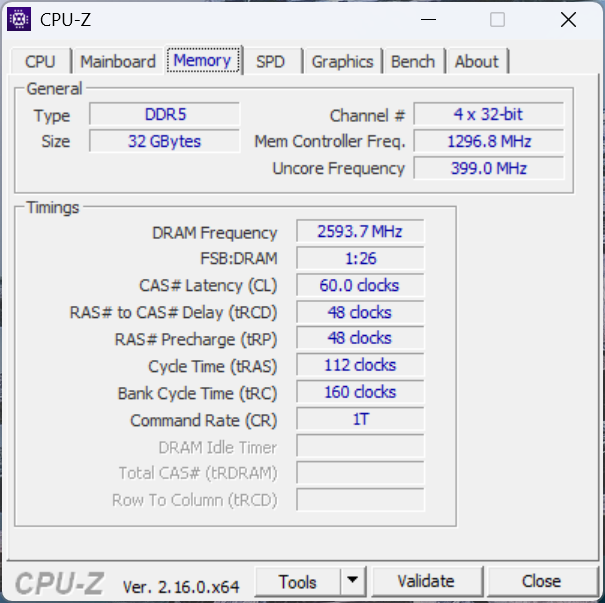
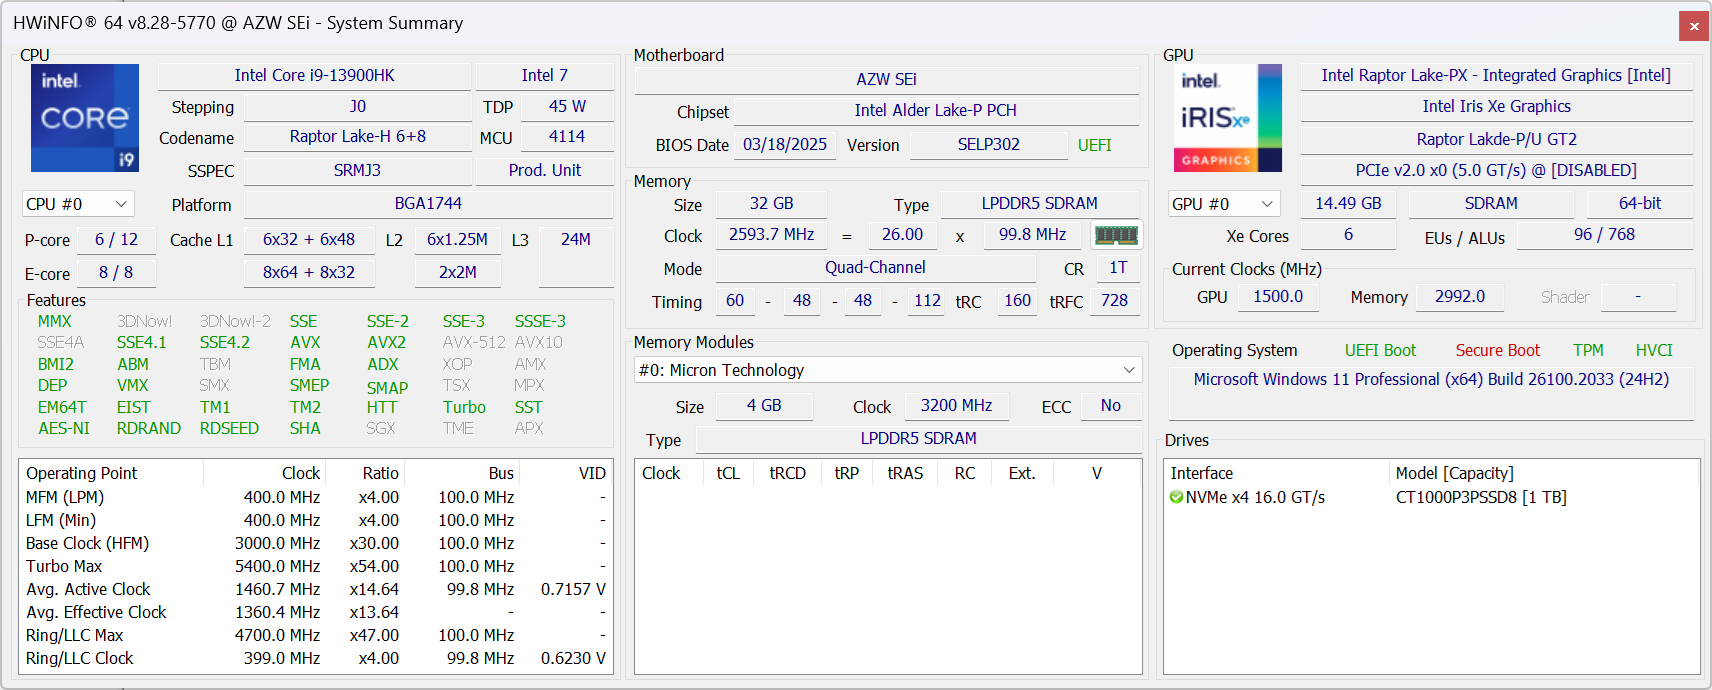
Nossa unidade de teste é fornecida com a CPU Raptor Lake Core i9-13900HK, 32 GB de RAM e SSD de 1 TB por US$ 540. As opções de cores cinza e prata estão disponíveis.
Mais análises da Beelink:
Especificações
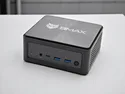
Caso
O SEi13 Pro é essencialmente uma versão menor e mais leve do GTi13 Ultra. O material da caixa metálica permanece o mesmo para impressões semelhantes às do Mac Mini.
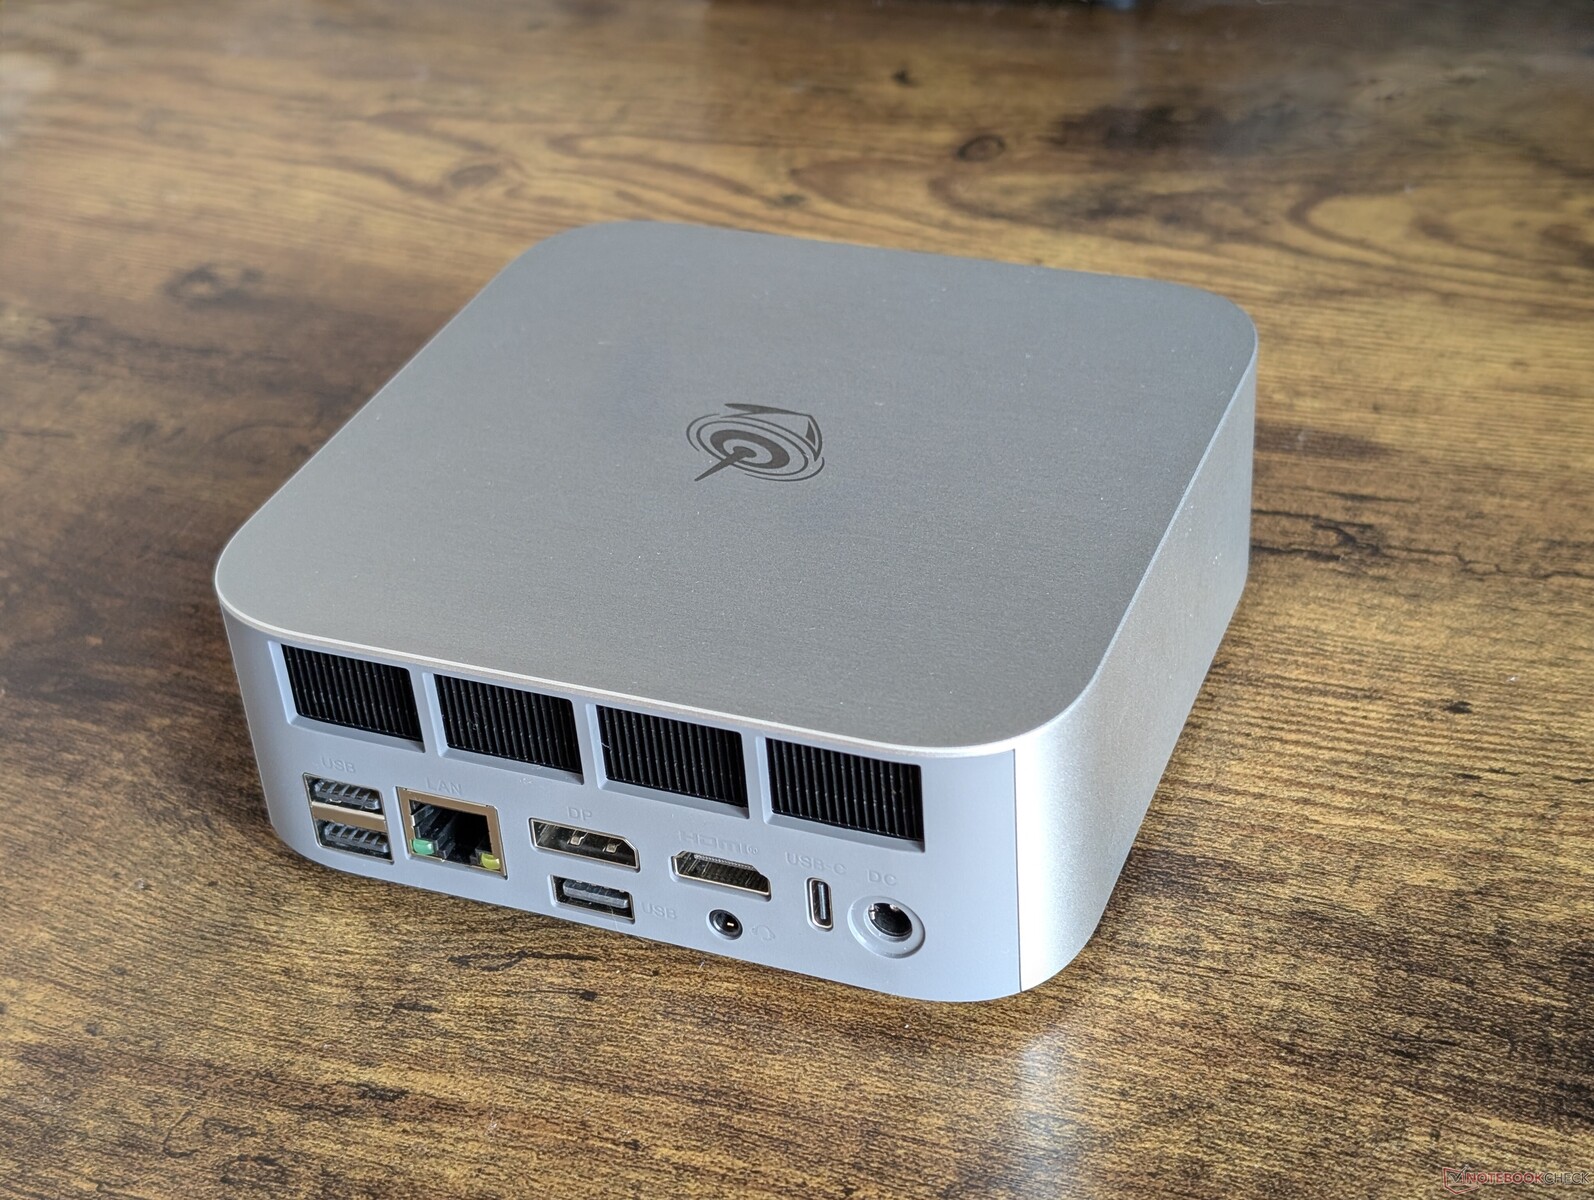
Conectividade
As portas integradas são quase todas encontradas no SEi13 Ultra, exceto pela porta diferente do adaptador CA e menos portas USB-A e RJ-45 na parte traseira. O leitor de cartão SD também foi retirado.
Observe que o sistema pode ser ligado por meio de adaptadores CA USB-C genéricos, caso o senhor perca o adaptador CA de barril de 100 W que acompanha a unidade.
Comunicação
| Networking | |
| iperf3 transmit AXE11000 | |
| BOSGAME M4 Neo | |
| Beelink SEi12 Core i5-1235U | |
| HP Z2 Mini G1a | |
| Beelink GTI13 Ultra | |
| Beelink SEi13 Pro | |
| iperf3 receive AXE11000 | |
| BOSGAME M4 Neo | |
| Beelink SEi12 Core i5-1235U | |
| HP Z2 Mini G1a | |
| Beelink GTI13 Ultra | |
| Beelink SEi13 Pro | |
| iperf3 transmit AXE11000 6GHz | |
| HP Z2 Mini G1a | |
| BOSGAME M4 Neo | |
| iperf3 receive AXE11000 6GHz | |
| HP Z2 Mini G1a | |
| BOSGAME M4 Neo | |
Manutenção
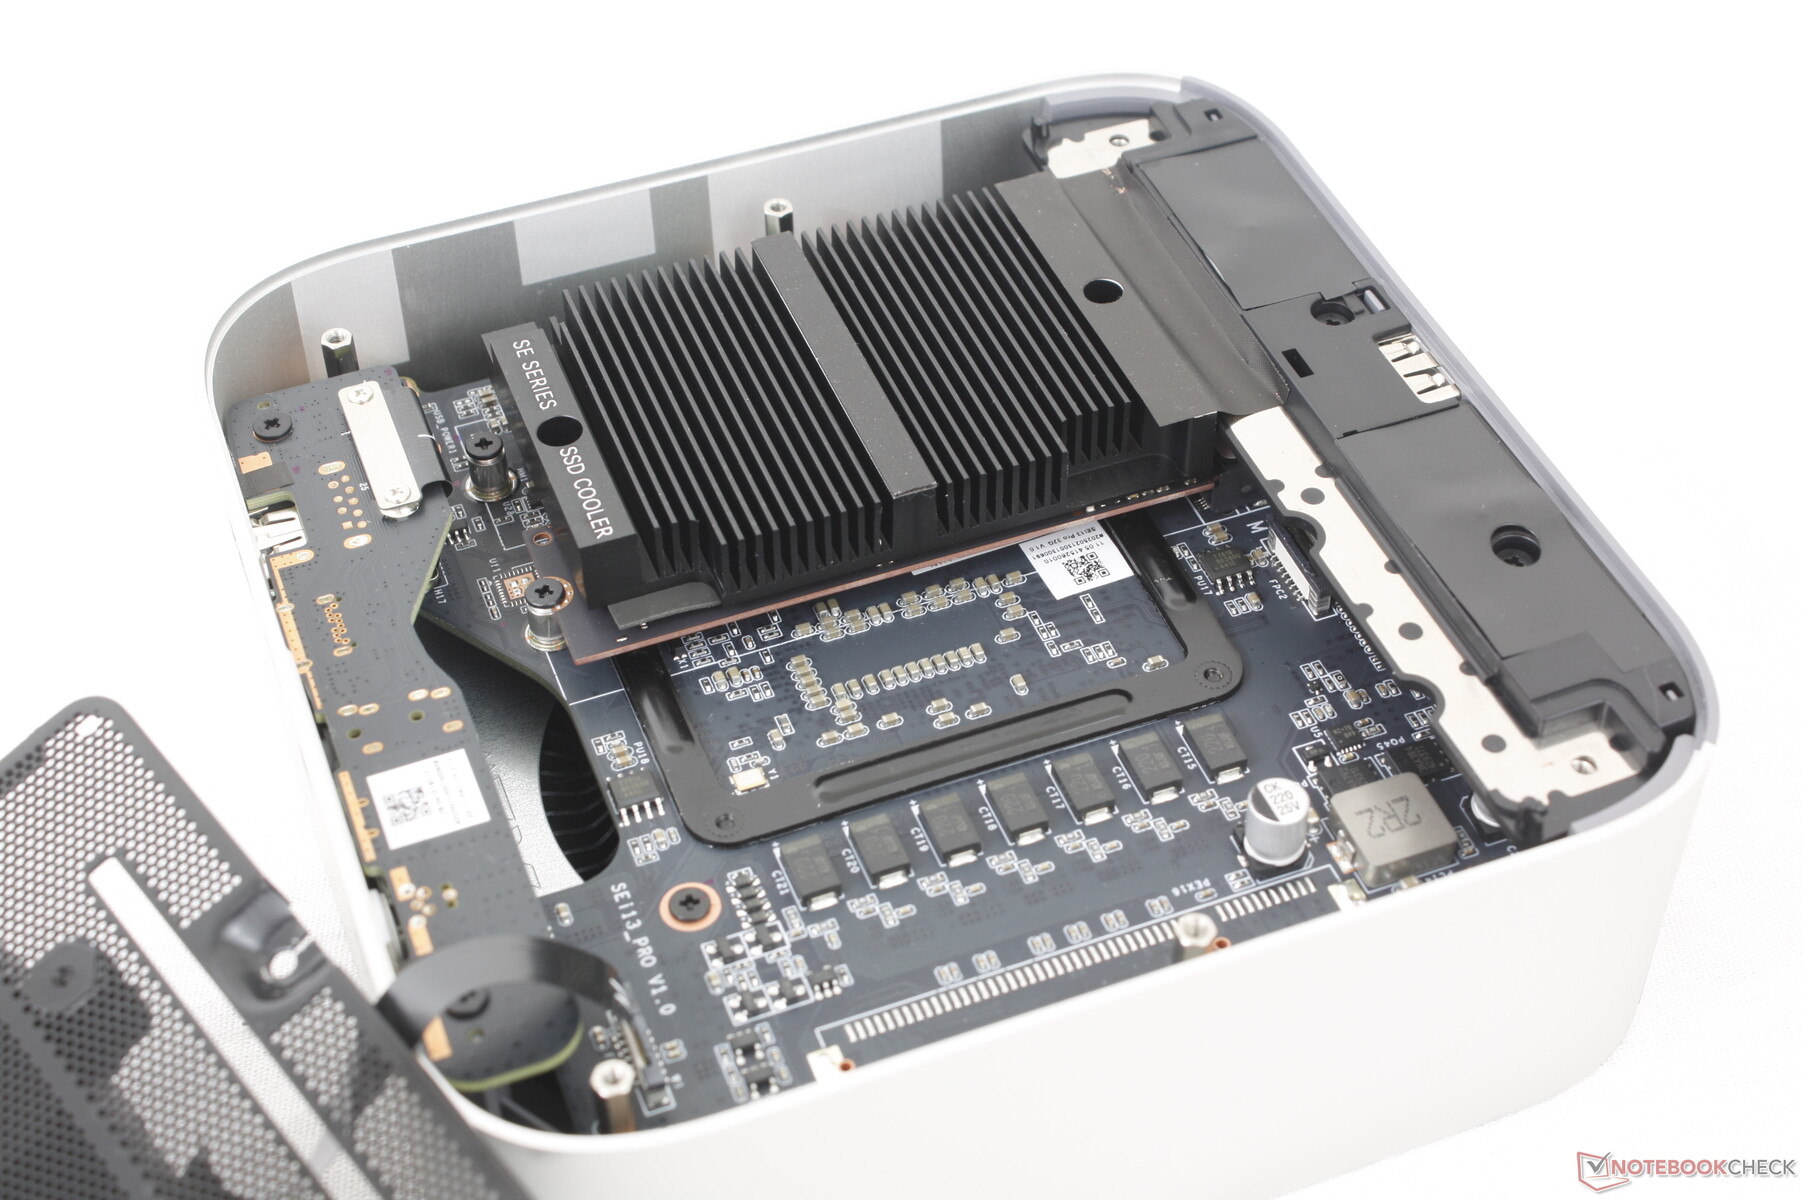
As atualizações são mais fáceis do que no GTi13 Ultra, pois o design do SEi13 não tem uma PSU integrada sobre a placa-mãe. No entanto, os upgrades são limitados a apenas dois SSDs M.2, pois a RAM é soldada, ao contrário do GTi13 Ultra mencionado anteriormente.
Sustentabilidade
O fabricante não faz nenhuma menção aos materiais reciclados usados durante a fabricação. A embalagem em si é toda de papelão e papel com invólucro de plástico.
Acessórios e garantia
A caixa de varejo inclui um cabo HDMI e um adaptador CA com manual. A garantia limitada de um ano do fabricante se aplica se o produto for comprado nos EUA.
Desempenho
Condições de teste
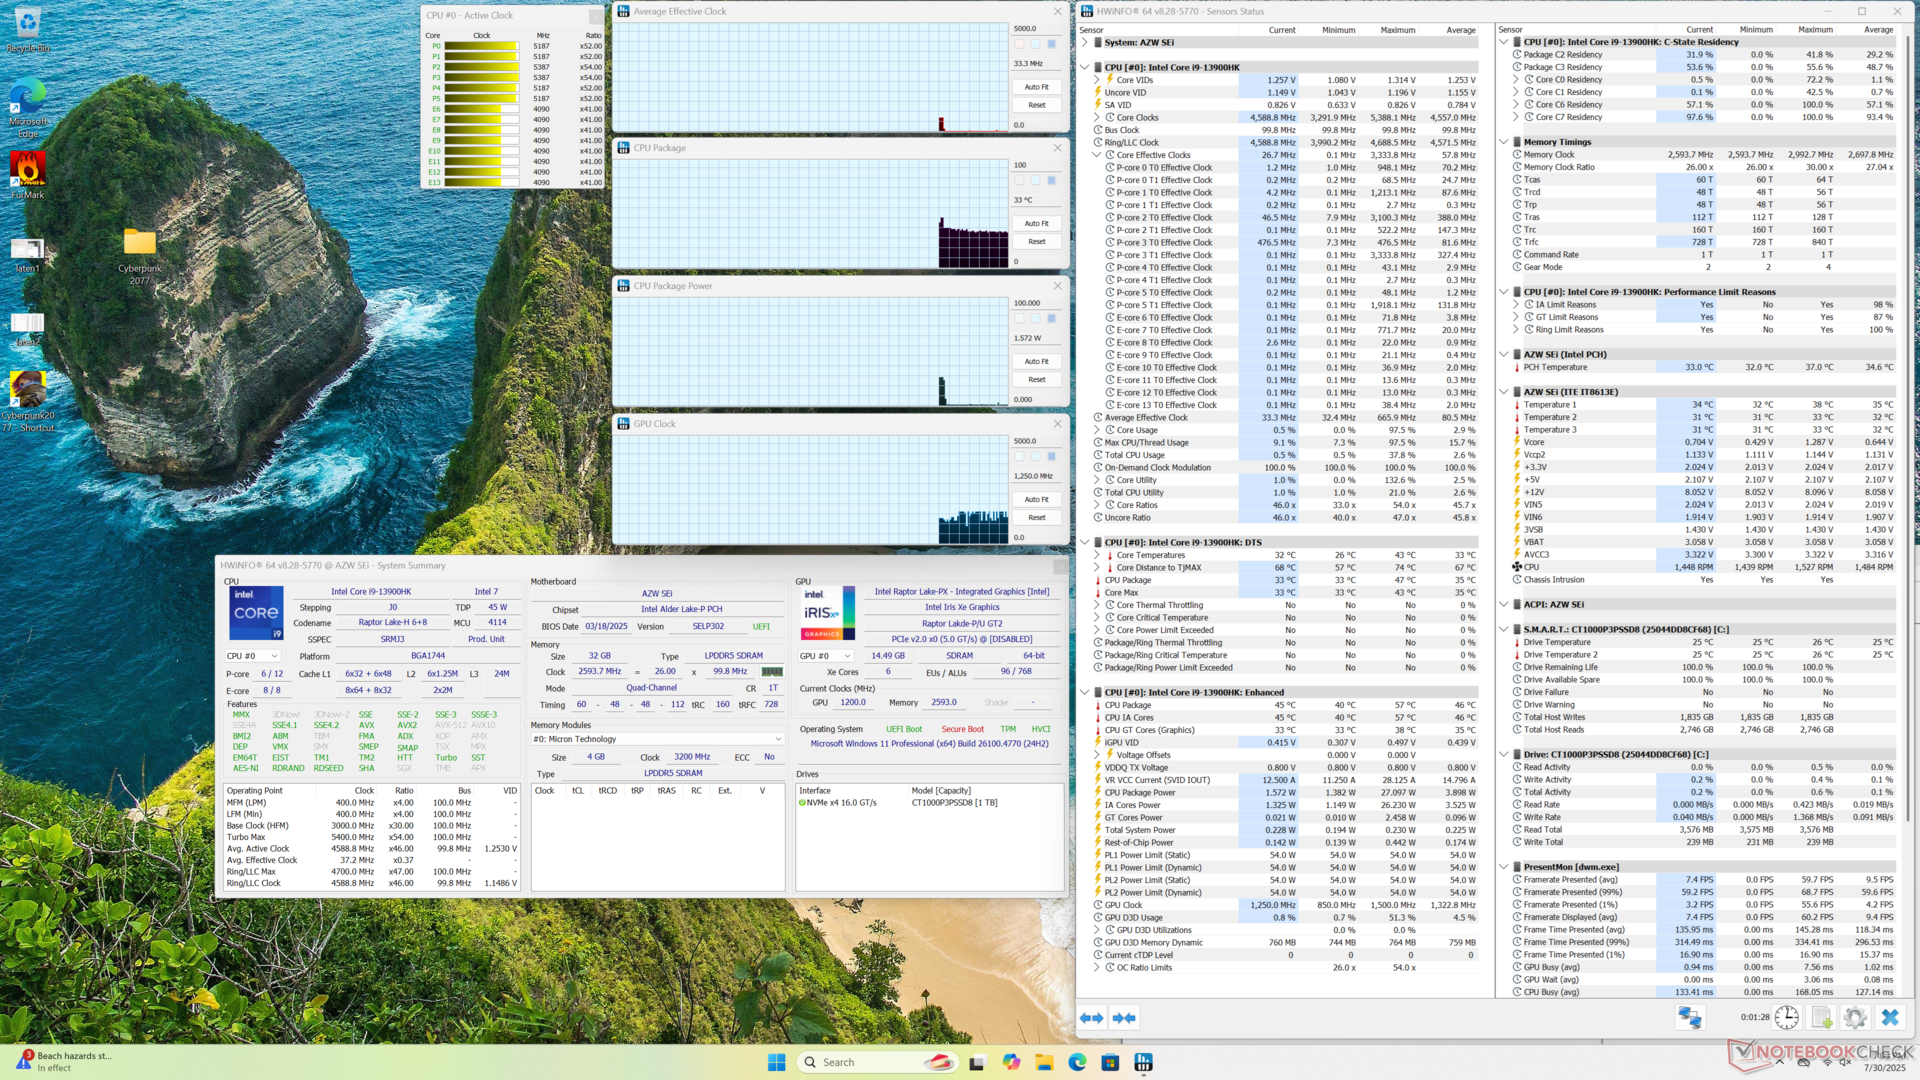
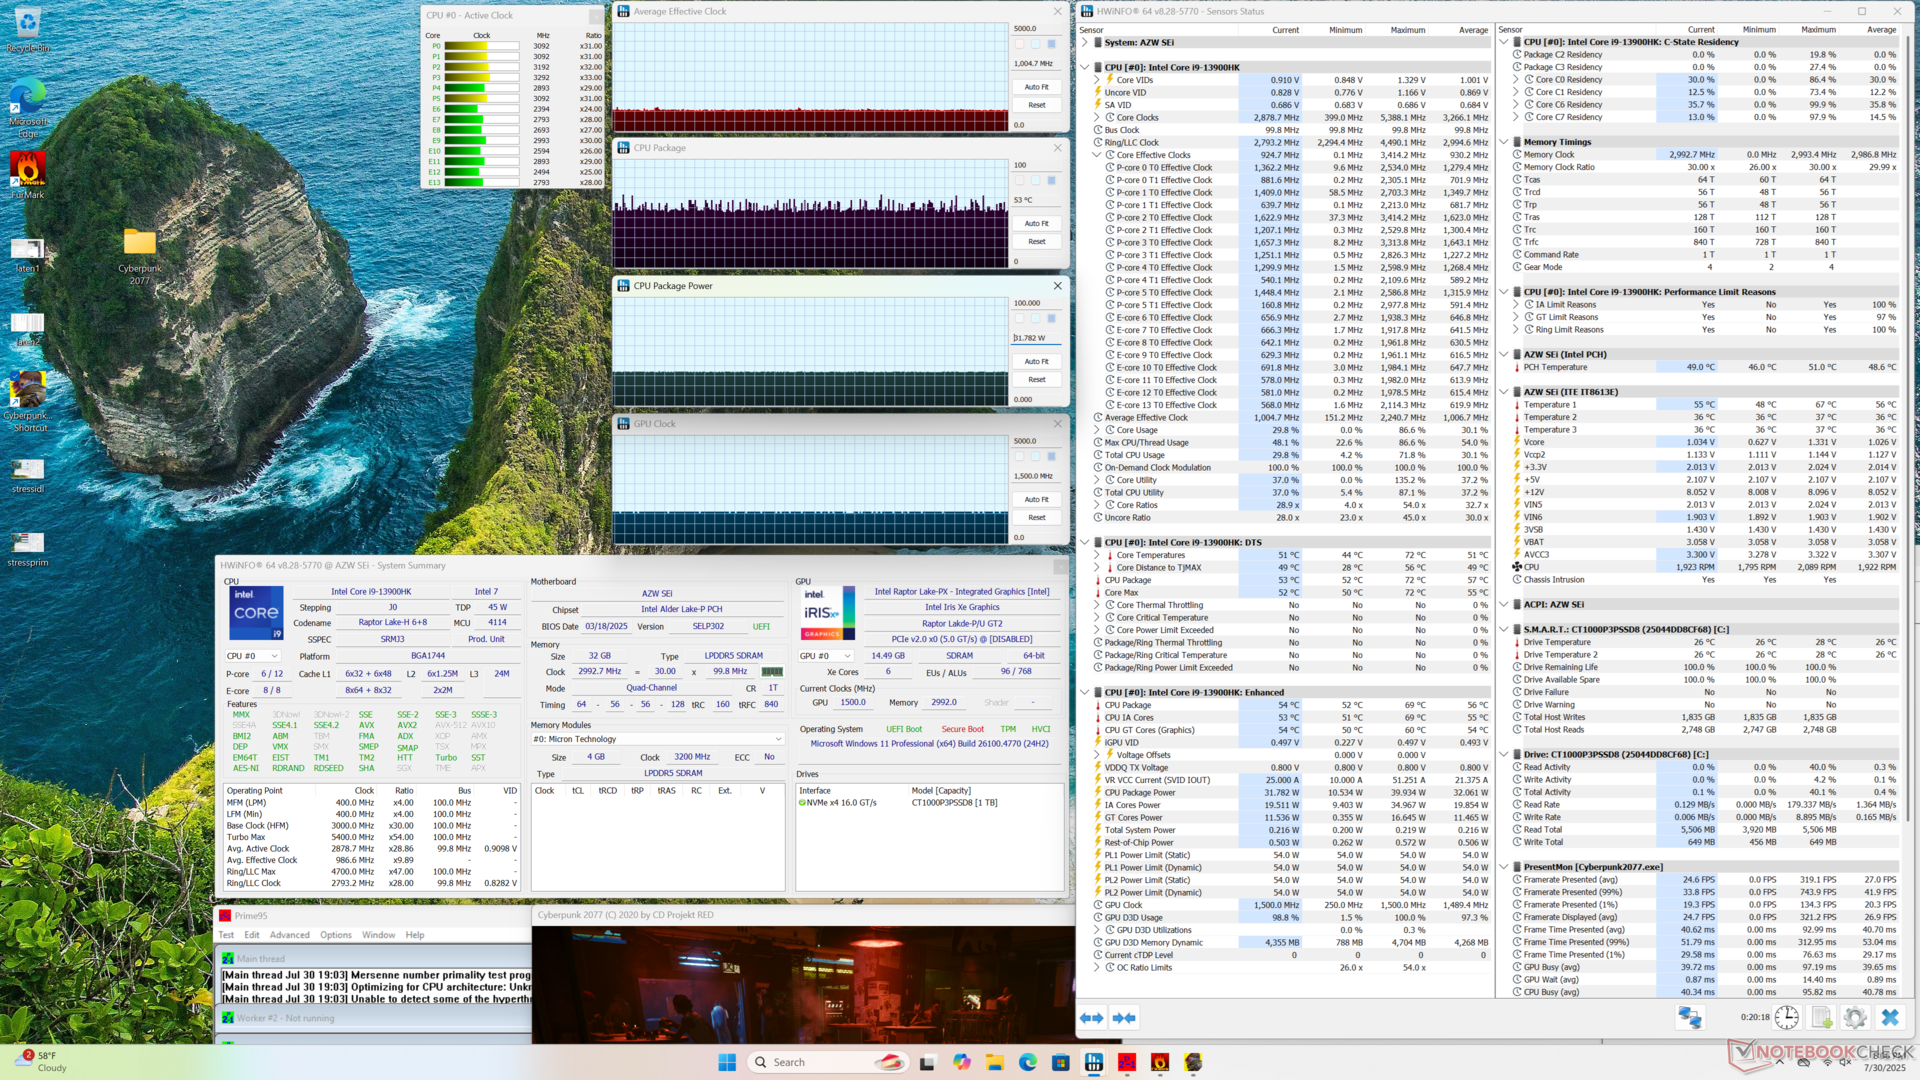
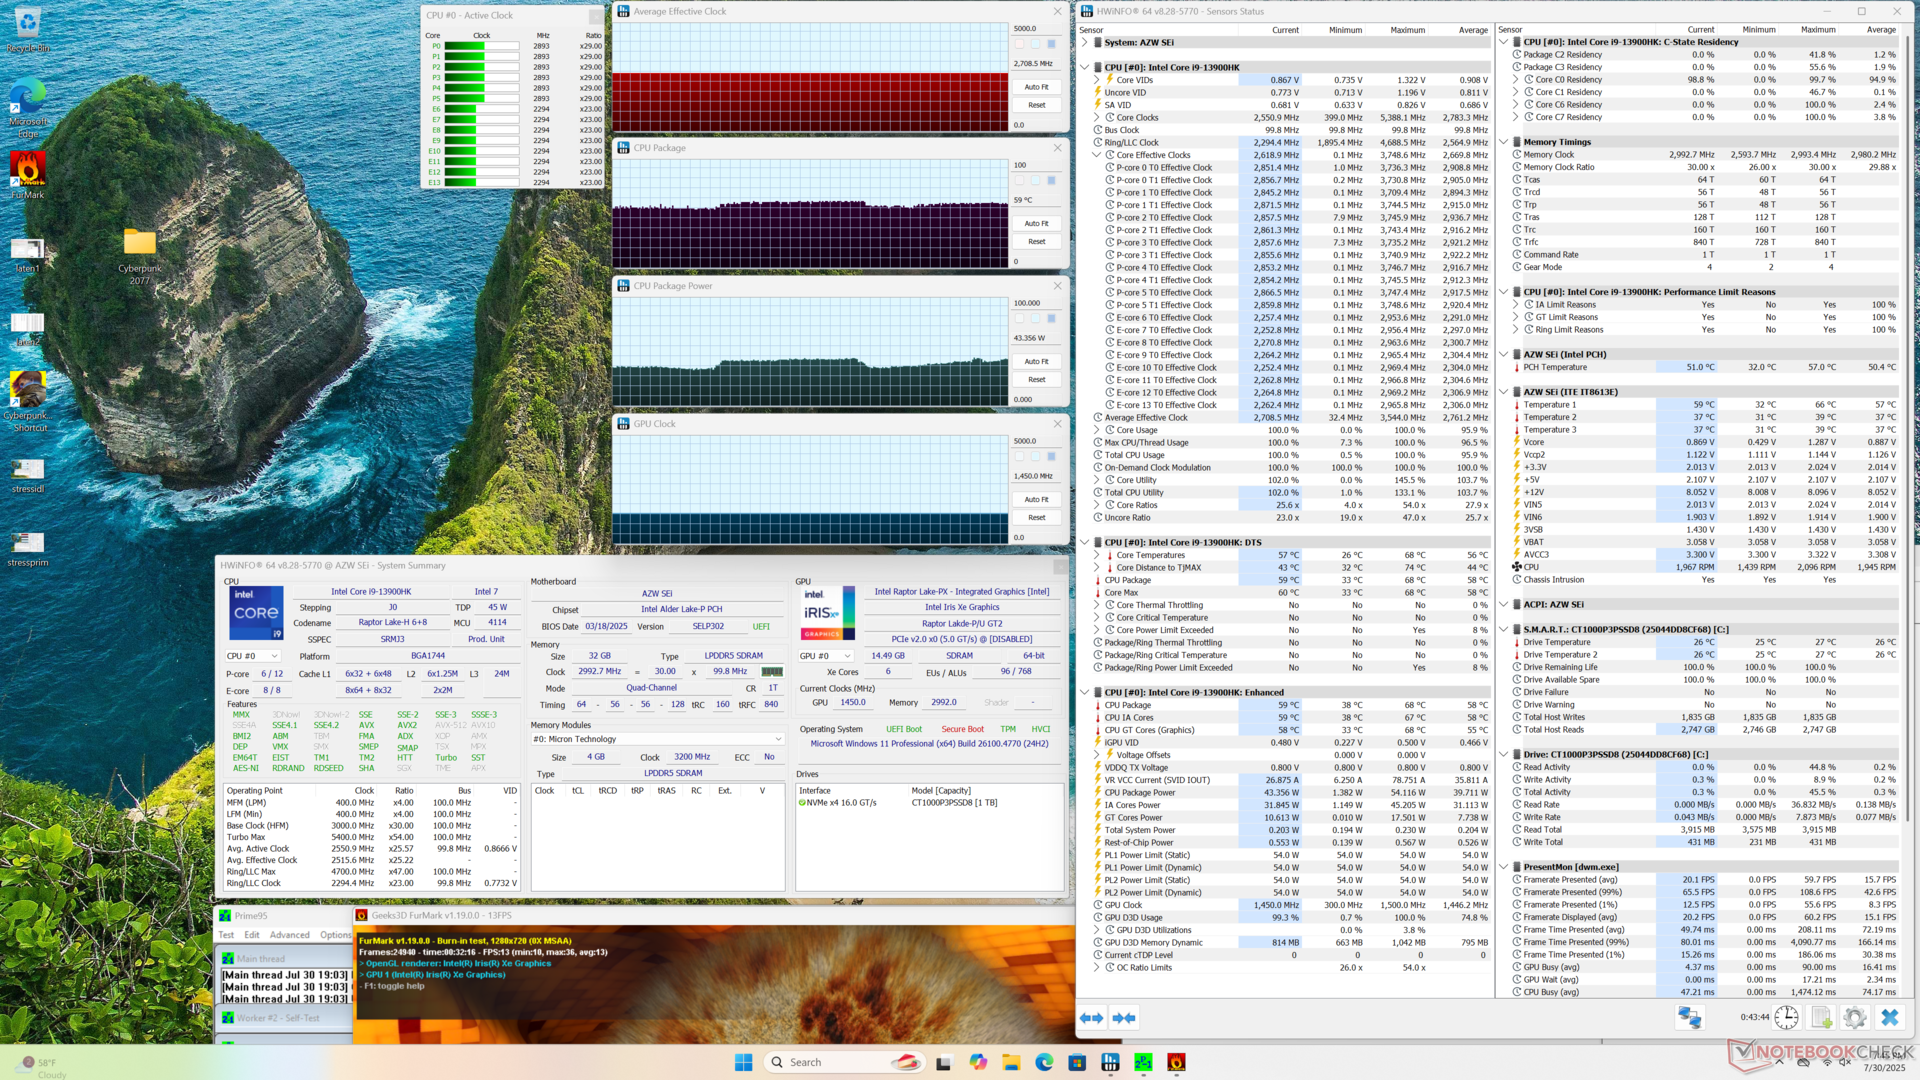
Colocamos o Windows no modo Desempenho antes de executar os benchmarks abaixo.
Processador
Embora ainda seja bastante rápido para o preço, o Core i9-13900HK não possui uma NPU integrada para aceleração de IA.
Cinebench R15 Multi Loop
Cinebench R23: Multi Core | Single Core
Cinebench R20: CPU (Multi Core) | CPU (Single Core)
Cinebench R15: CPU Multi 64Bit | CPU Single 64Bit
Blender: v2.79 BMW27 CPU
7-Zip 18.03: 7z b 4 | 7z b 4 -mmt1
Geekbench 6.7: Multi-Core | Single-Core
Geekbench 5.5: Multi-Core | Single-Core
HWBOT x265 Benchmark v2.2: 4k Preset
LibreOffice : 20 Documents To PDF
R Benchmark 2.5: Overall mean
| CPU Performance rating | |
| Minisforum MS-A2 | |
| HP Z2 Mini G1a | |
| Acemagic F3A | |
| Geekom Mini IT15, Ultra 9 285H | |
| Khadas Mind 2s | |
| Beelink GTI13 Ultra | |
| BOSGAME M4 Neo | |
| Média Intel Core i9-13900HK | |
| Geekom Mini IT13 | |
| Beelink SEi13 Pro | |
| Minix Elite EU512-AI -2! | |
| BMAX B9 Power | |
| Beelink SEi12 Core i5-1235U -2! | |
| NiPoGi AM06 Pro | |
| Cinebench R20 / CPU (Multi Core) | |
| HP Z2 Mini G1a | |
| Minisforum MS-A2 | |
| Acemagic F3A | |
| Geekom Mini IT15, Ultra 9 285H | |
| Khadas Mind 2s | |
| BOSGAME M4 Neo | |
| Beelink GTI13 Ultra | |
| Média Intel Core i9-13900HK (4968 - 7542, n=4) | |
| Beelink SEi13 Pro | |
| Minix Elite EU512-AI | |
| BMAX B9 Power | |
| Geekom Mini IT13 | |
| Beelink SEi12 Core i5-1235U | |
| NiPoGi AM06 Pro | |
| Cinebench R20 / CPU (Single Core) | |
| Minisforum MS-A2 | |
| Geekom Mini IT15, Ultra 9 285H | |
| Khadas Mind 2s | |
| Acemagic F3A | |
| Beelink GTI13 Ultra | |
| HP Z2 Mini G1a | |
| Média Intel Core i9-13900HK (549 - 798, n=4) | |
| BOSGAME M4 Neo | |
| Geekom Mini IT13 | |
| Minix Elite EU512-AI | |
| Beelink SEi12 Core i5-1235U | |
| Beelink SEi13 Pro | |
| BMAX B9 Power | |
| NiPoGi AM06 Pro | |
| Cinebench R15 / CPU Multi 64Bit | |
| HP Z2 Mini G1a | |
| Minisforum MS-A2 | |
| Acemagic F3A | |
| Geekom Mini IT15, Ultra 9 285H | |
| Khadas Mind 2s | |
| BOSGAME M4 Neo | |
| Média Intel Core i9-13900HK (2004 - 2950, n=4) | |
| Beelink GTI13 Ultra | |
| Beelink SEi13 Pro | |
| BMAX B9 Power | |
| Minix Elite EU512-AI | |
| Geekom Mini IT13 | |
| Beelink SEi12 Core i5-1235U | |
| NiPoGi AM06 Pro | |
| Cinebench R15 / CPU Single 64Bit | |
| Minisforum MS-A2 | |
| Acemagic F3A | |
| Khadas Mind 2s | |
| Geekom Mini IT15, Ultra 9 285H | |
| HP Z2 Mini G1a | |
| Beelink GTI13 Ultra | |
| BOSGAME M4 Neo | |
| Média Intel Core i9-13900HK (204 - 296, n=4) | |
| Geekom Mini IT13 | |
| Minix Elite EU512-AI | |
| Beelink SEi12 Core i5-1235U | |
| Beelink SEi13 Pro | |
| BMAX B9 Power | |
| NiPoGi AM06 Pro | |
| Geekbench 6.7 / Multi-Core | |
| Minisforum MS-A2 | |
| HP Z2 Mini G1a | |
| Geekom Mini IT15, Ultra 9 285H | |
| Khadas Mind 2s | |
| Beelink GTI13 Ultra | |
| BOSGAME M4 Neo | |
| Acemagic F3A | |
| Geekom Mini IT13 | |
| Média Intel Core i9-13900HK (7103 - 13309, n=4) | |
| BMAX B9 Power | |
| Beelink SEi13 Pro | |
| NiPoGi AM06 Pro | |
| Geekbench 6.7 / Single-Core | |
| Minisforum MS-A2 | |
| Geekom Mini IT15, Ultra 9 285H | |
| Acemagic F3A | |
| Khadas Mind 2s | |
| HP Z2 Mini G1a | |
| Beelink GTI13 Ultra | |
| BOSGAME M4 Neo | |
| Geekom Mini IT13 | |
| Média Intel Core i9-13900HK (1849 - 2883, n=4) | |
| Beelink SEi13 Pro | |
| BMAX B9 Power | |
| NiPoGi AM06 Pro | |
| HWBOT x265 Benchmark v2.2 / 4k Preset | |
| Minisforum MS-A2 | |
| HP Z2 Mini G1a | |
| Acemagic F3A | |
| Geekom Mini IT15, Ultra 9 285H | |
| BOSGAME M4 Neo | |
| Khadas Mind 2s | |
| Beelink GTI13 Ultra | |
| Média Intel Core i9-13900HK (14.2 - 21.9, n=4) | |
| Beelink SEi13 Pro | |
| BMAX B9 Power | |
| Minix Elite EU512-AI | |
| Geekom Mini IT13 | |
| Beelink SEi12 Core i5-1235U | |
| NiPoGi AM06 Pro | |
| LibreOffice / 20 Documents To PDF | |
| NiPoGi AM06 Pro | |
| Minix Elite EU512-AI | |
| Acemagic F3A | |
| BMAX B9 Power | |
| HP Z2 Mini G1a | |
| Beelink SEi13 Pro | |
| Geekom Mini IT13 | |
| Beelink SEi12 Core i5-1235U | |
| BOSGAME M4 Neo | |
| Média Intel Core i9-13900HK (37.3 - 56, n=4) | |
| Khadas Mind 2s | |
| Minisforum MS-A2 | |
| Geekom Mini IT15, Ultra 9 285H | |
| Beelink GTI13 Ultra | |
Cinebench R23: Multi Core | Single Core
Cinebench R20: CPU (Multi Core) | CPU (Single Core)
Cinebench R15: CPU Multi 64Bit | CPU Single 64Bit
Blender: v2.79 BMW27 CPU
7-Zip 18.03: 7z b 4 | 7z b 4 -mmt1
Geekbench 6.7: Multi-Core | Single-Core
Geekbench 5.5: Multi-Core | Single-Core
HWBOT x265 Benchmark v2.2: 4k Preset
LibreOffice : 20 Documents To PDF
R Benchmark 2.5: Overall mean
* ... menor é melhor
AIDA64: FP32 Ray-Trace | FPU Julia | CPU SHA3 | CPU Queen | FPU SinJulia | FPU Mandel | CPU AES | CPU ZLib | FP64 Ray-Trace | CPU PhotoWorxx
| Performance rating | |
| HP Z2 Mini G1a | |
| BOSGAME M4 Neo | |
| Beelink GTI13 Ultra | |
| Média Intel Core i9-13900HK | |
| BMAX B9 Power | |
| Beelink SEi13 Pro | |
| Beelink SEi12 Core i5-1235U | |
| AIDA64 / FP32 Ray-Trace | |
| HP Z2 Mini G1a | |
| BOSGAME M4 Neo | |
| Beelink SEi13 Pro | |
| Média Intel Core i9-13900HK (12351 - 18326, n=4) | |
| Beelink GTI13 Ultra | |
| BMAX B9 Power | |
| Beelink SEi12 Core i5-1235U | |
| AIDA64 / FPU Julia | |
| HP Z2 Mini G1a | |
| BOSGAME M4 Neo | |
| Beelink GTI13 Ultra | |
| Média Intel Core i9-13900HK (61409 - 92925, n=4) | |
| Beelink SEi13 Pro | |
| BMAX B9 Power | |
| Beelink SEi12 Core i5-1235U | |
| AIDA64 / CPU SHA3 | |
| HP Z2 Mini G1a | |
| BOSGAME M4 Neo | |
| Média Intel Core i9-13900HK (2923 - 4190, n=4) | |
| Beelink GTI13 Ultra | |
| Beelink SEi13 Pro | |
| BMAX B9 Power | |
| Beelink SEi12 Core i5-1235U | |
| AIDA64 / CPU Queen | |
| HP Z2 Mini G1a | |
| BOSGAME M4 Neo | |
| Beelink GTI13 Ultra | |
| Média Intel Core i9-13900HK (75615 - 118166, n=4) | |
| Beelink SEi13 Pro | |
| BMAX B9 Power | |
| Beelink SEi12 Core i5-1235U | |
| AIDA64 / FPU SinJulia | |
| HP Z2 Mini G1a | |
| BOSGAME M4 Neo | |
| Beelink GTI13 Ultra | |
| Média Intel Core i9-13900HK (7427 - 11249, n=4) | |
| Beelink SEi13 Pro | |
| BMAX B9 Power | |
| Beelink SEi12 Core i5-1235U | |
| AIDA64 / FPU Mandel | |
| HP Z2 Mini G1a | |
| BOSGAME M4 Neo | |
| Beelink SEi13 Pro | |
| Beelink GTI13 Ultra | |
| Média Intel Core i9-13900HK (30549 - 45616, n=4) | |
| BMAX B9 Power | |
| Beelink SEi12 Core i5-1235U | |
| AIDA64 / CPU AES | |
| HP Z2 Mini G1a | |
| BMAX B9 Power | |
| BOSGAME M4 Neo | |
| Média Intel Core i9-13900HK (68508 - 100891, n=4) | |
| Beelink GTI13 Ultra | |
| Beelink SEi13 Pro | |
| Beelink SEi12 Core i5-1235U | |
| AIDA64 / CPU ZLib | |
| HP Z2 Mini G1a | |
| Beelink GTI13 Ultra | |
| Média Intel Core i9-13900HK (797 - 1249, n=4) | |
| BOSGAME M4 Neo | |
| Beelink SEi13 Pro | |
| BMAX B9 Power | |
| Beelink SEi12 Core i5-1235U | |
| AIDA64 / FP64 Ray-Trace | |
| HP Z2 Mini G1a | |
| BOSGAME M4 Neo | |
| Média Intel Core i9-13900HK (6839 - 10018, n=4) | |
| Beelink SEi13 Pro | |
| Beelink GTI13 Ultra | |
| BMAX B9 Power | |
| Beelink SEi12 Core i5-1235U | |
| AIDA64 / CPU PhotoWorxx | |
| HP Z2 Mini G1a | |
| Beelink GTI13 Ultra | |
| BOSGAME M4 Neo | |
| Média Intel Core i9-13900HK (15421 - 49539, n=4) | |
| Beelink SEi12 Core i5-1235U | |
| BMAX B9 Power | |
| Beelink SEi13 Pro | |
Desempenho do sistema
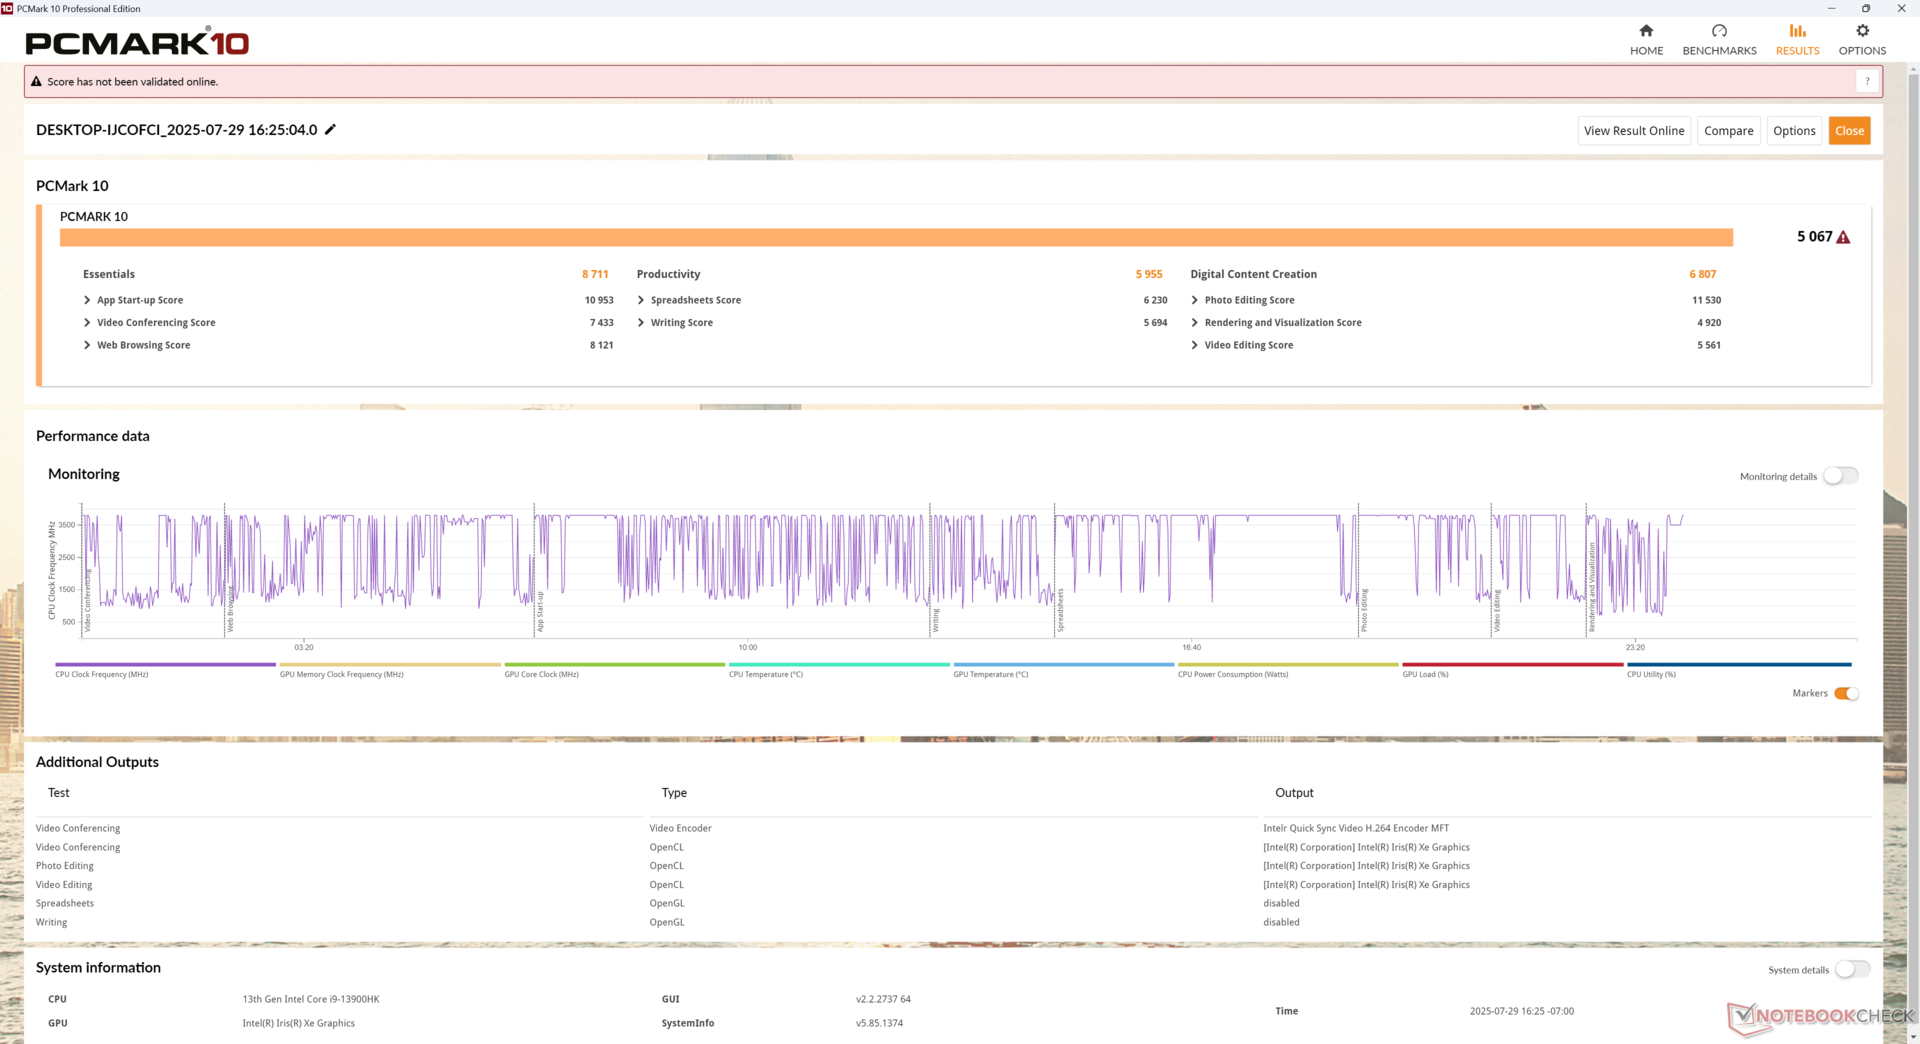
PCMark 10: Score | Essentials | Productivity | Digital Content Creation
CrossMark: Overall | Productivity | Creativity | Responsiveness
WebXPRT 3: Overall
WebXPRT 4: Overall
Mozilla Kraken 1.1: Total
| Performance rating | |
| HP Z2 Mini G1a | |
| Beelink GTI13 Ultra | |
| BOSGAME M4 Neo | |
| Beelink SEi12 Core i5-1235U | |
| Beelink SEi13 Pro -4! | |
| BMAX B9 Power -4! | |
| PCMark 10 / Score | |
| HP Z2 Mini G1a | |
| BOSGAME M4 Neo | |
| Beelink GTI13 Ultra | |
| Beelink SEi12 Core i5-1235U | |
| PCMark 10 / Essentials | |
| Beelink GTI13 Ultra | |
| Beelink SEi12 Core i5-1235U | |
| HP Z2 Mini G1a | |
| BOSGAME M4 Neo | |
| PCMark 10 / Productivity | |
| HP Z2 Mini G1a | |
| BOSGAME M4 Neo | |
| Beelink GTI13 Ultra | |
| Beelink SEi12 Core i5-1235U | |
| PCMark 10 / Digital Content Creation | |
| HP Z2 Mini G1a | |
| BOSGAME M4 Neo | |
| Beelink GTI13 Ultra | |
| Beelink SEi12 Core i5-1235U | |
| CrossMark / Overall | |
| Beelink GTI13 Ultra | |
| HP Z2 Mini G1a | |
| BOSGAME M4 Neo | |
| Beelink SEi12 Core i5-1235U | |
| Beelink SEi13 Pro | |
| BMAX B9 Power | |
| CrossMark / Productivity | |
| Beelink GTI13 Ultra | |
| BOSGAME M4 Neo | |
| Beelink SEi12 Core i5-1235U | |
| HP Z2 Mini G1a | |
| Beelink SEi13 Pro | |
| BMAX B9 Power | |
| CrossMark / Creativity | |
| HP Z2 Mini G1a | |
| Beelink GTI13 Ultra | |
| BOSGAME M4 Neo | |
| Beelink SEi12 Core i5-1235U | |
| BMAX B9 Power | |
| Beelink SEi13 Pro | |
| CrossMark / Responsiveness | |
| Beelink GTI13 Ultra | |
| Beelink SEi12 Core i5-1235U | |
| BOSGAME M4 Neo | |
| Beelink SEi13 Pro | |
| HP Z2 Mini G1a | |
| BMAX B9 Power | |
| WebXPRT 3 / Overall | |
| Beelink GTI13 Ultra | |
| HP Z2 Mini G1a | |
| BOSGAME M4 Neo | |
| Beelink SEi12 Core i5-1235U | |
| BMAX B9 Power | |
| Beelink SEi13 Pro | |
| WebXPRT 4 / Overall | |
| Beelink GTI13 Ultra | |
| HP Z2 Mini G1a | |
| BOSGAME M4 Neo | |
| Beelink SEi12 Core i5-1235U | |
| Beelink SEi13 Pro | |
| BMAX B9 Power | |
| Mozilla Kraken 1.1 / Total | |
| BMAX B9 Power | |
| Beelink SEi13 Pro | |
| Beelink SEi12 Core i5-1235U | |
| BOSGAME M4 Neo | |
| Beelink GTI13 Ultra | |
| HP Z2 Mini G1a | |
* ... menor é melhor
» No benchmarks for this notebook found!
| AIDA64 / Memory Copy | |
| HP Z2 Mini G1a | |
| Beelink GTI13 Ultra | |
| BOSGAME M4 Neo | |
| Beelink SEi13 Pro | |
| Média Intel Core i9-13900HK (45935 - 74460, n=4) | |
| Beelink SEi12 Core i5-1235U | |
| BMAX B9 Power | |
| AIDA64 / Memory Read | |
| HP Z2 Mini G1a | |
| Beelink GTI13 Ultra | |
| BOSGAME M4 Neo | |
| Média Intel Core i9-13900HK (34298 - 74896, n=4) | |
| Beelink SEi12 Core i5-1235U | |
| BMAX B9 Power | |
| Beelink SEi13 Pro | |
| AIDA64 / Memory Write | |
| HP Z2 Mini G1a | |
| BOSGAME M4 Neo | |
| Beelink SEi13 Pro | |
| Beelink GTI13 Ultra | |
| Média Intel Core i9-13900HK (47347 - 85917, n=4) | |
| Beelink SEi12 Core i5-1235U | |
| BMAX B9 Power | |
| AIDA64 / Memory Latency | |
| HP Z2 Mini G1a | |
| Beelink SEi13 Pro | |
| BMAX B9 Power | |
| Média Intel Core i9-13900HK (83 - 115.3, n=4) | |
| Beelink SEi12 Core i5-1235U | |
| BOSGAME M4 Neo | |
| Beelink GTI13 Ultra | |
* ... menor é melhor
Latência DPC
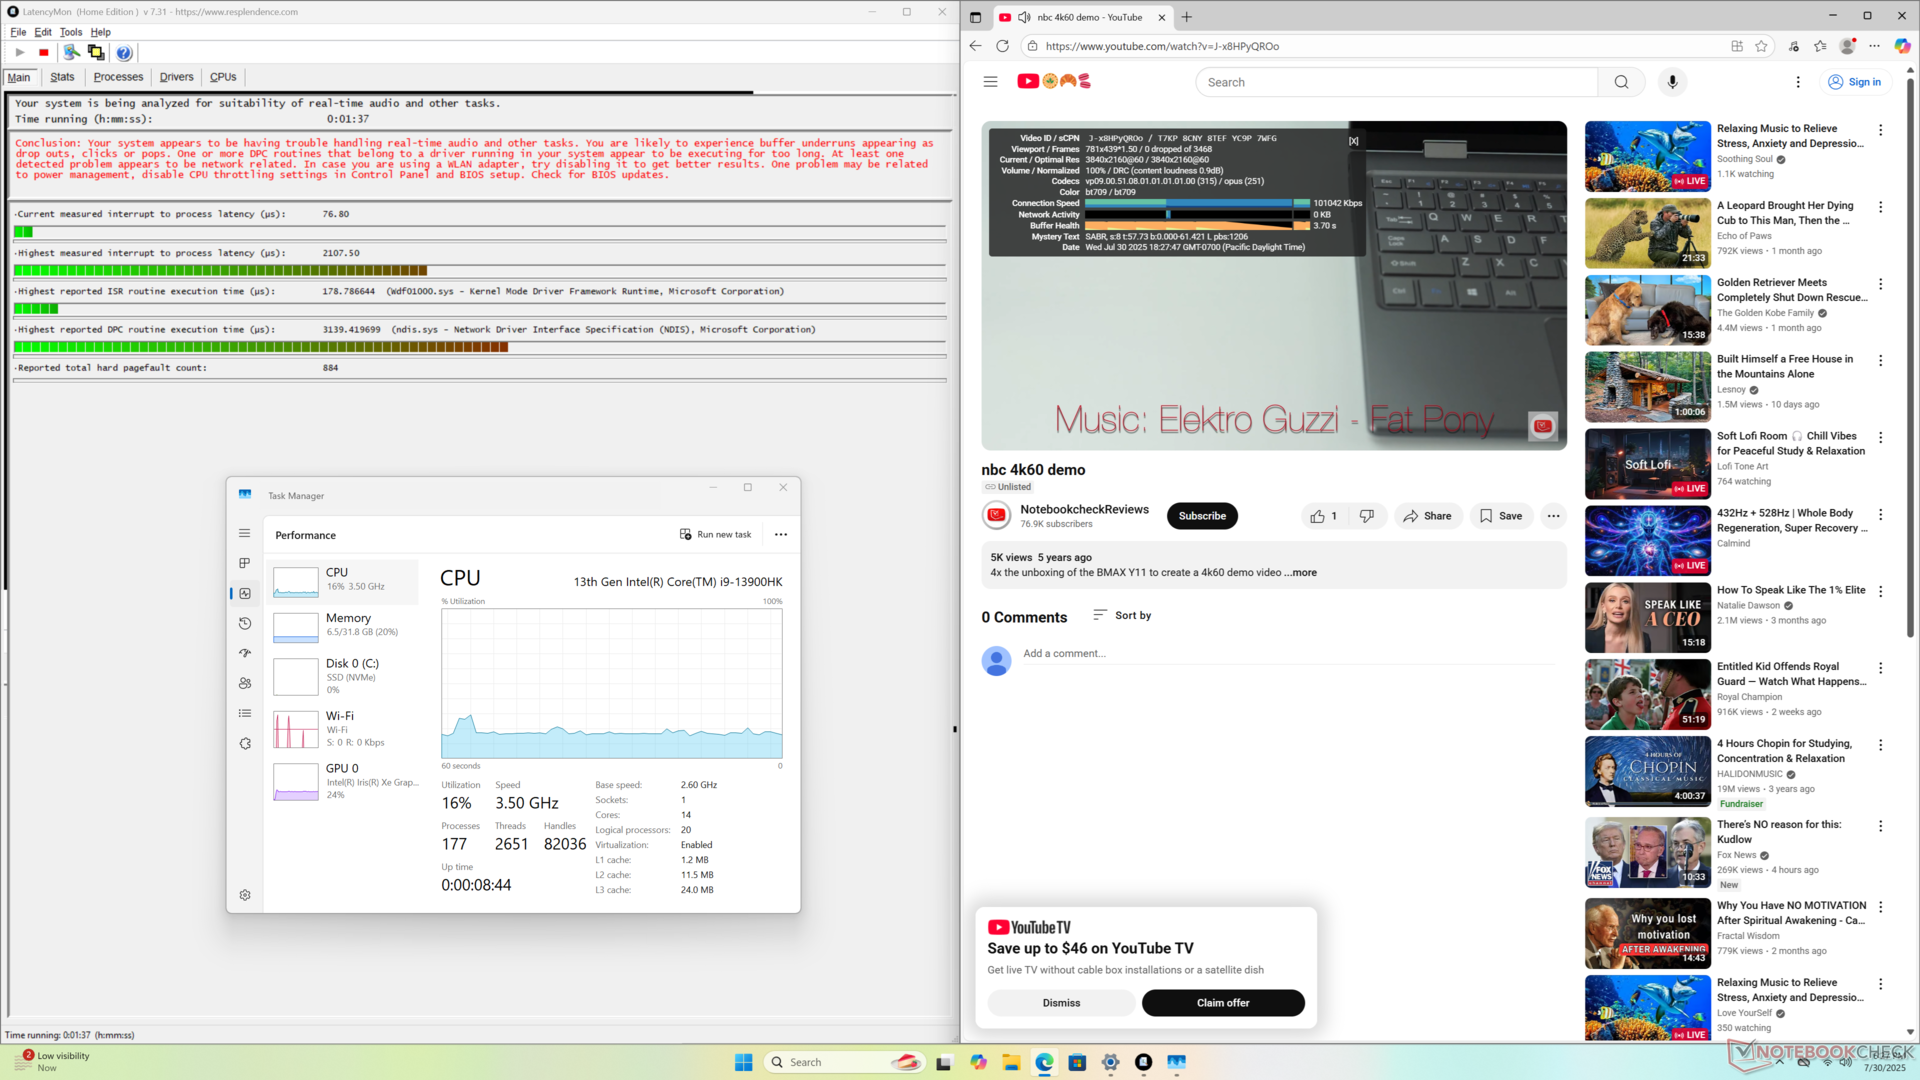
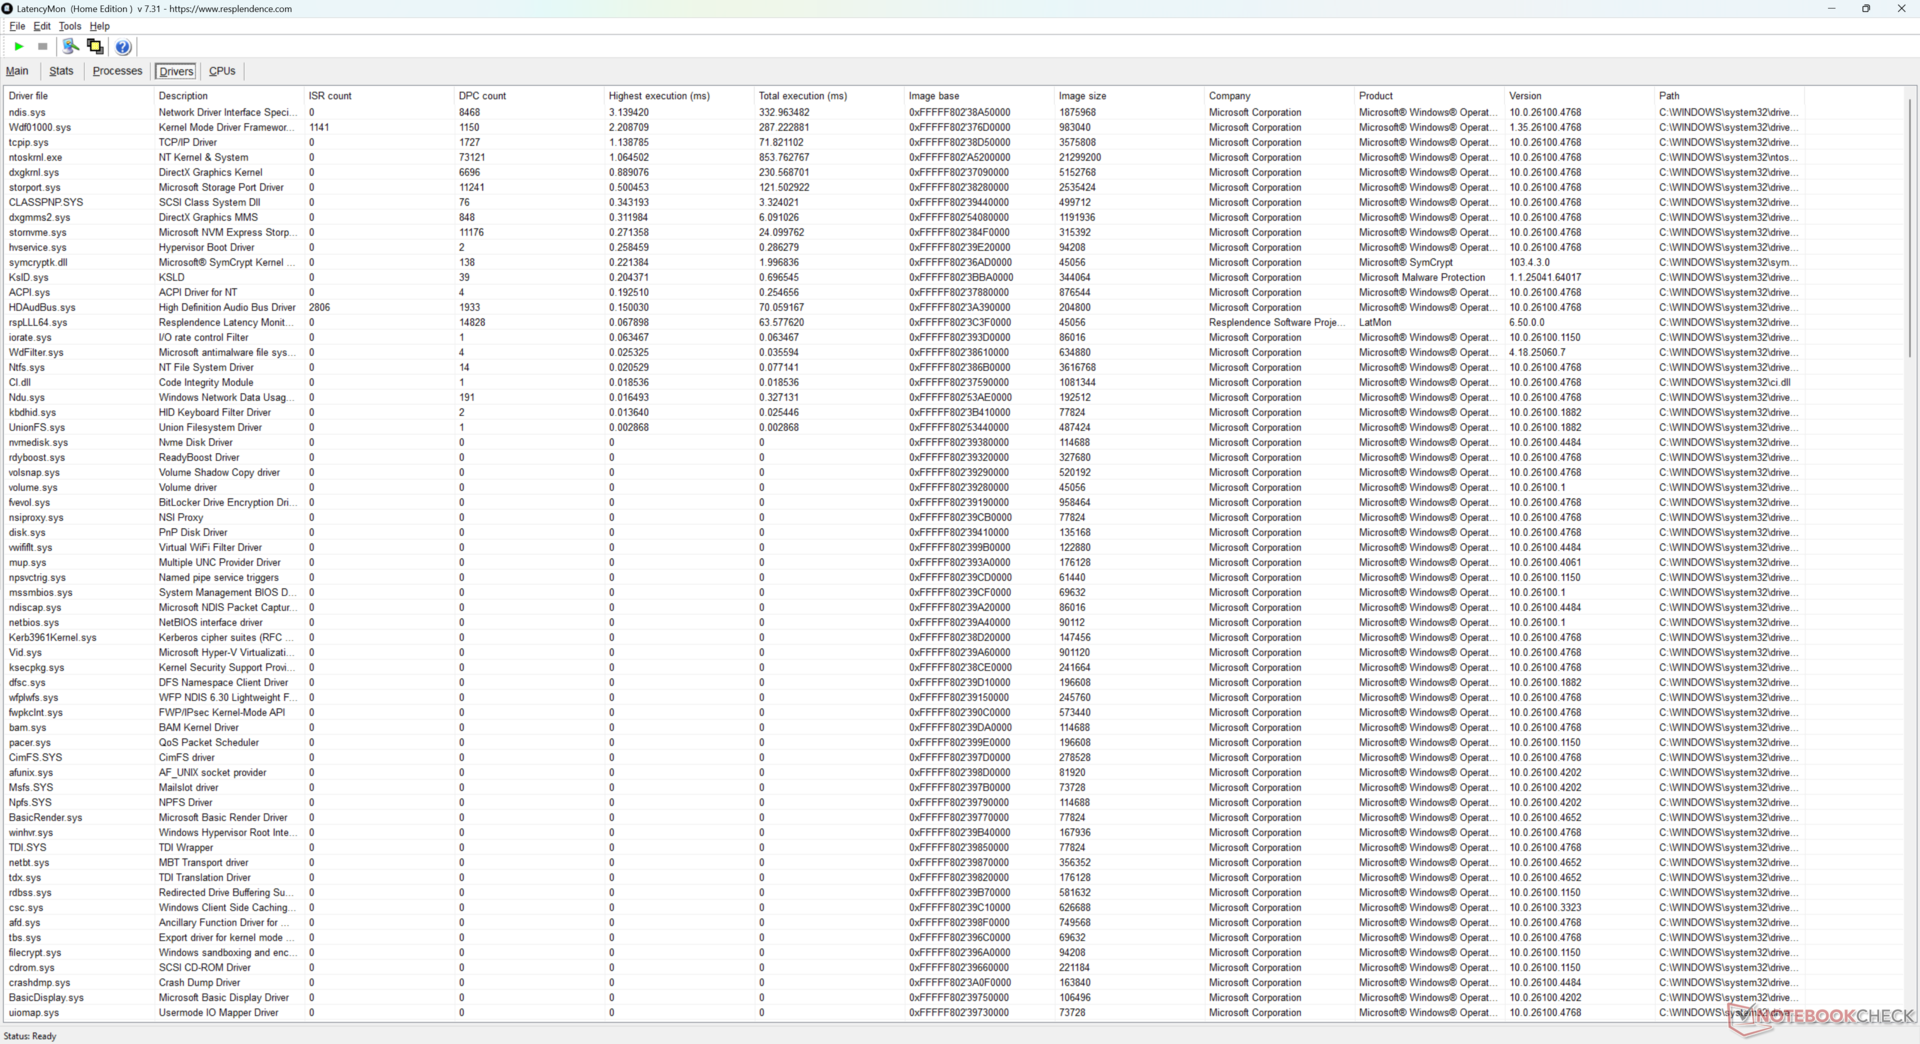
| DPC Latencies / LatencyMon - interrupt to process latency (max), Web, Youtube, Prime95 | |
| HP Z2 Mini G1a | |
| Beelink SEi13 Pro | |
| Beelink GTI13 Ultra | |
| Beelink SEi12 Core i5-1235U | |
| BOSGAME M4 Neo | |
* ... menor é melhor
Dispositivos de armazenamento
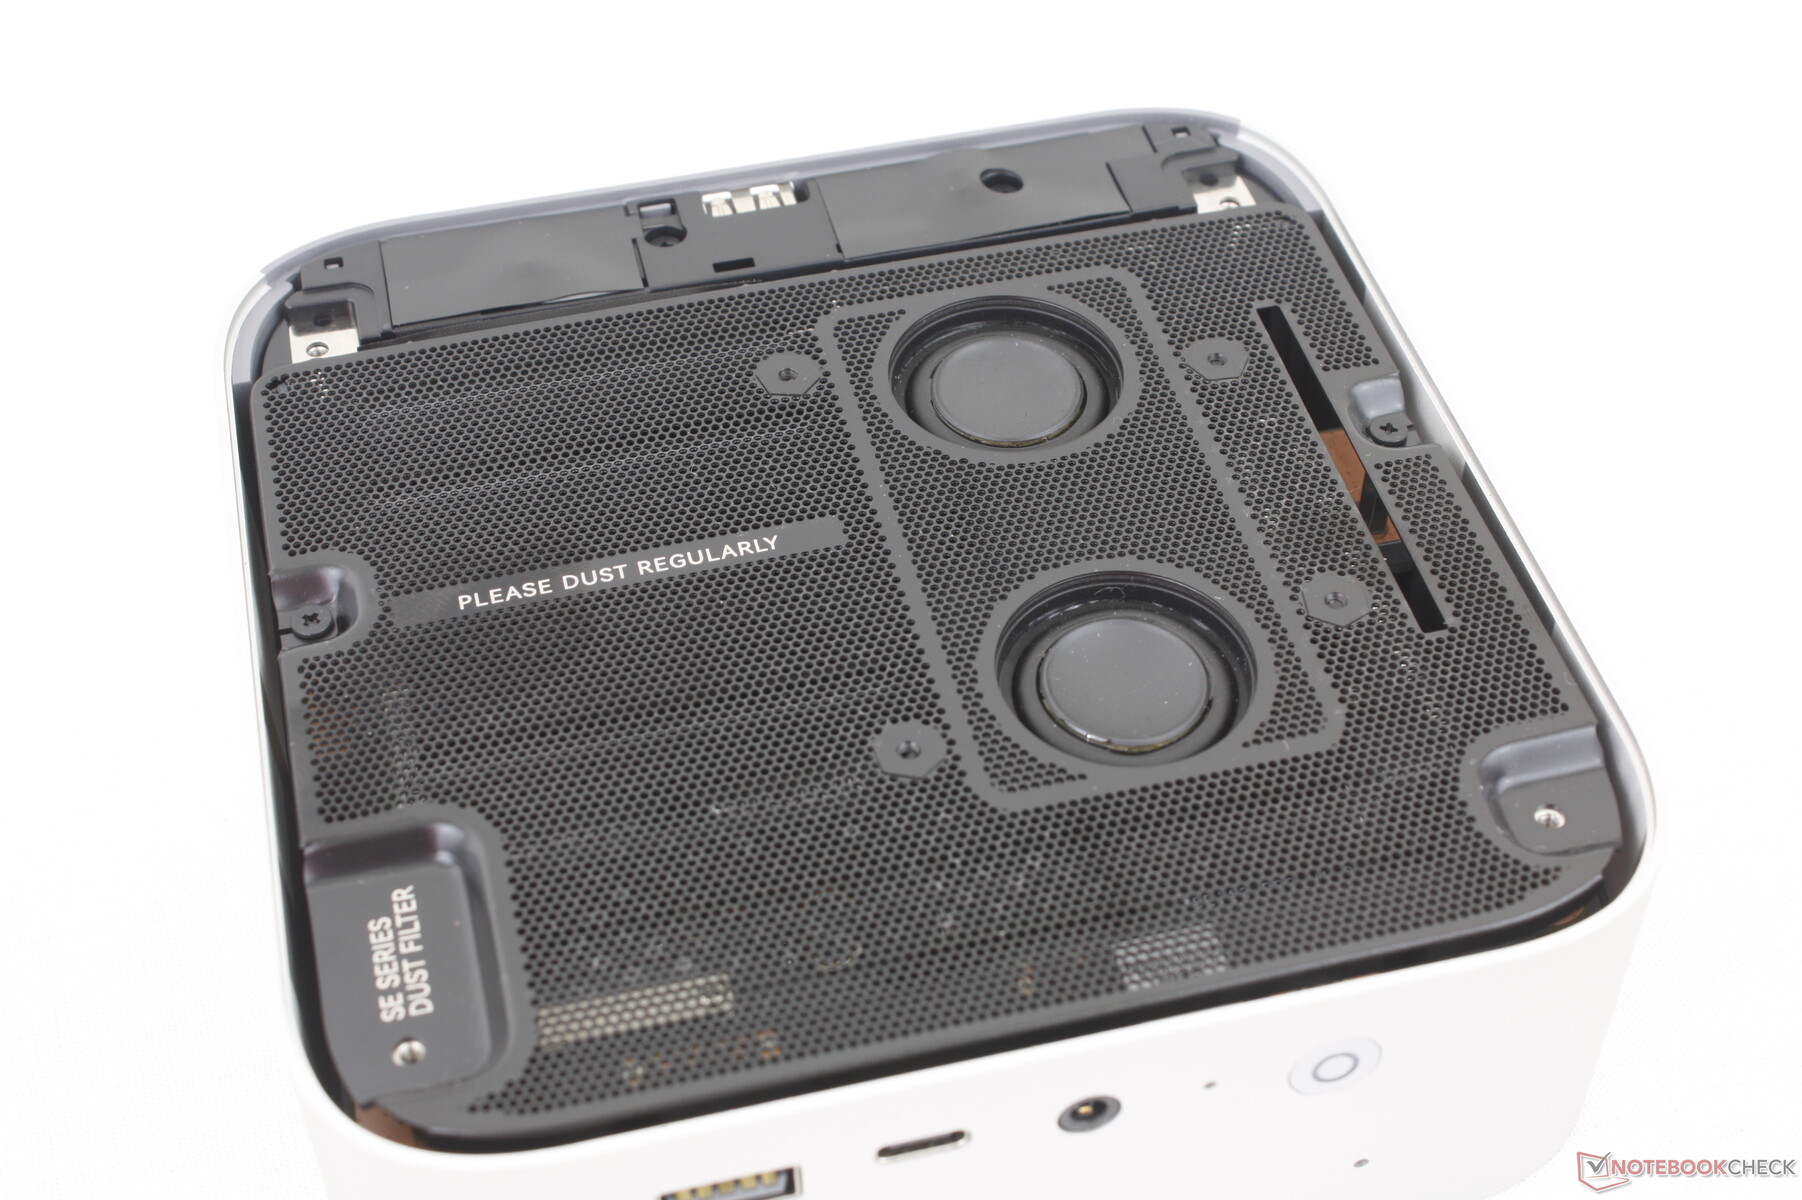
Um grande dissipador de calor está incluído para resfriar os dois slots de SSD.
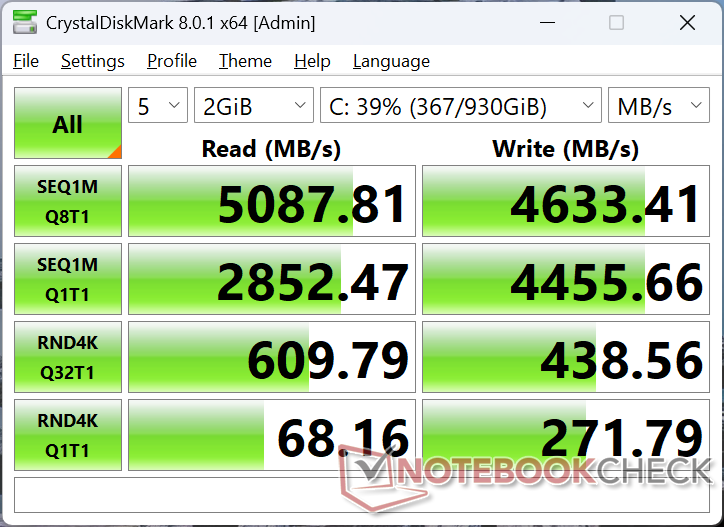
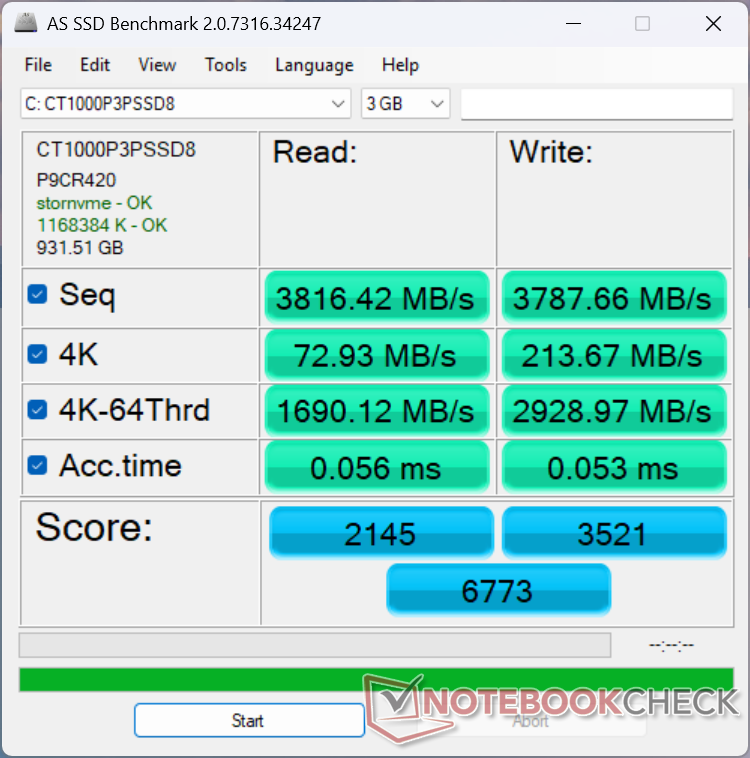

| Drive Performance rating - Percent | |
| Beelink GTI13 Ultra | |
| Beelink SEi13 Pro | |
| HP Z2 Mini G1a | |
| BOSGAME M4 Neo | |
| Beelink SEi12 Core i5-1235U | |
| BMAX B9 Power | |
* ... menor é melhor
Disk Throttling: DiskSpd Read Loop, Queue Depth 8
Desempenho da GPU
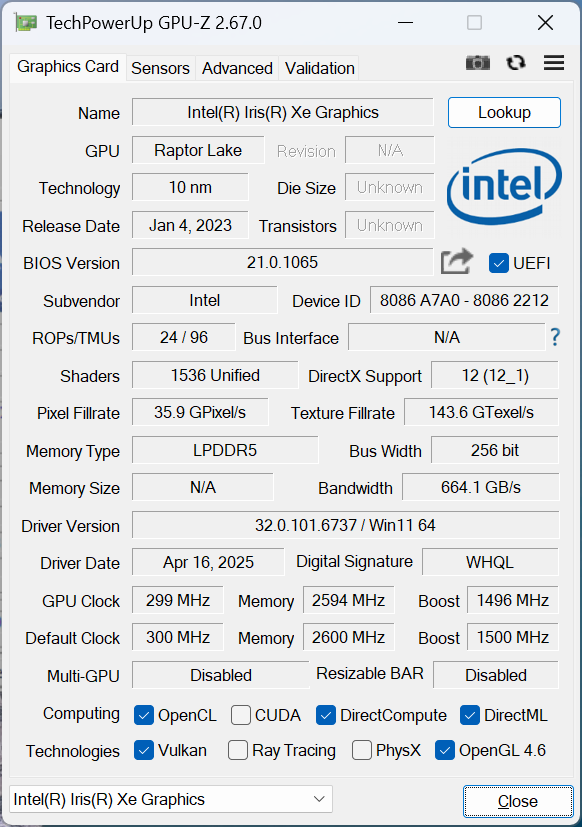
A Gráficos Iris Xe G7 96 EUs está agora algumas gerações atrás da atual série Arc para ser uma das GPUs integradas mais lentas disponíveis. Embora não seja para jogos, ela ainda é suficientemente potente para fins de streaming 4K sem problemas.
Vale a pena mencionar que tanto o X-Plane 11.11 quanto o benchmark Cyberpunk 2077 sempre travavam, mesmo depois de várias tentativas e reinicializações.
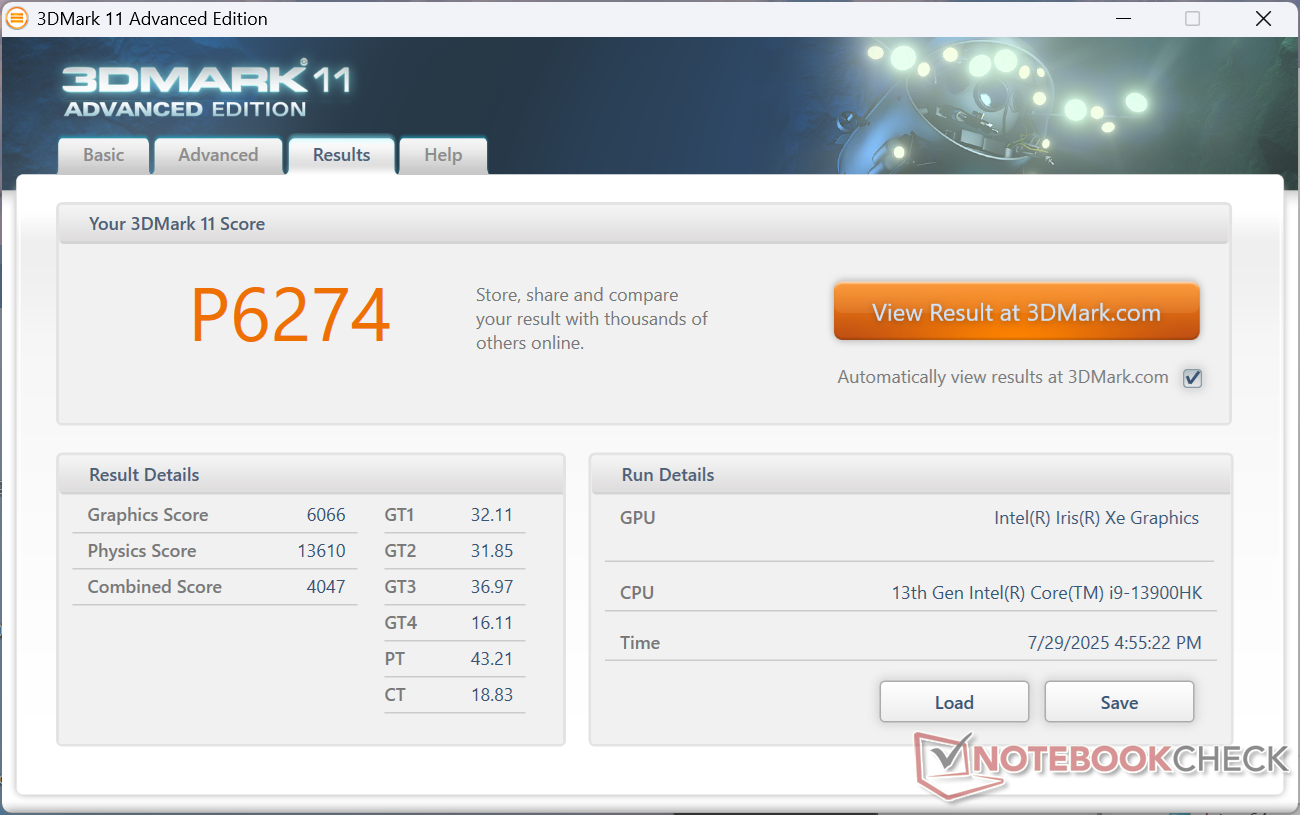
| 3DMark 11 Performance | 6274 pontos | |
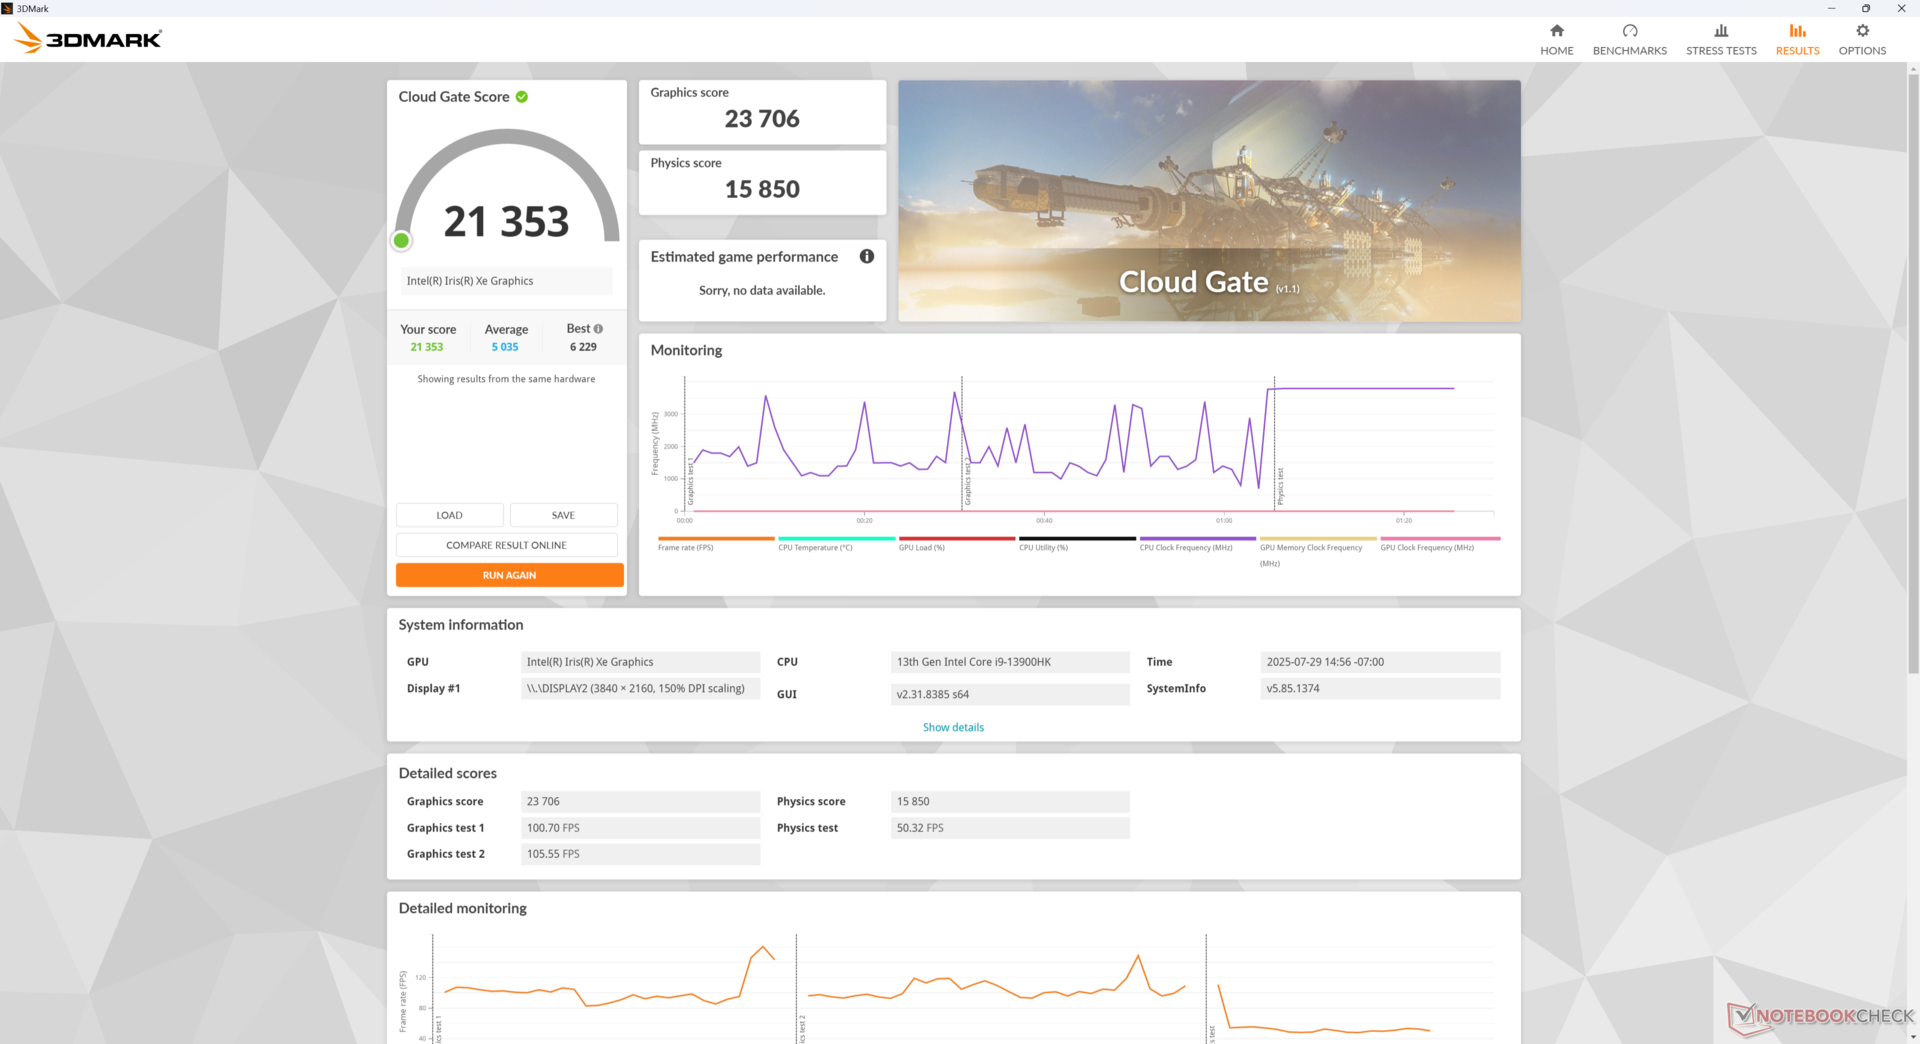
| 3DMark Cloud Gate Standard Score | 21353 pontos | |
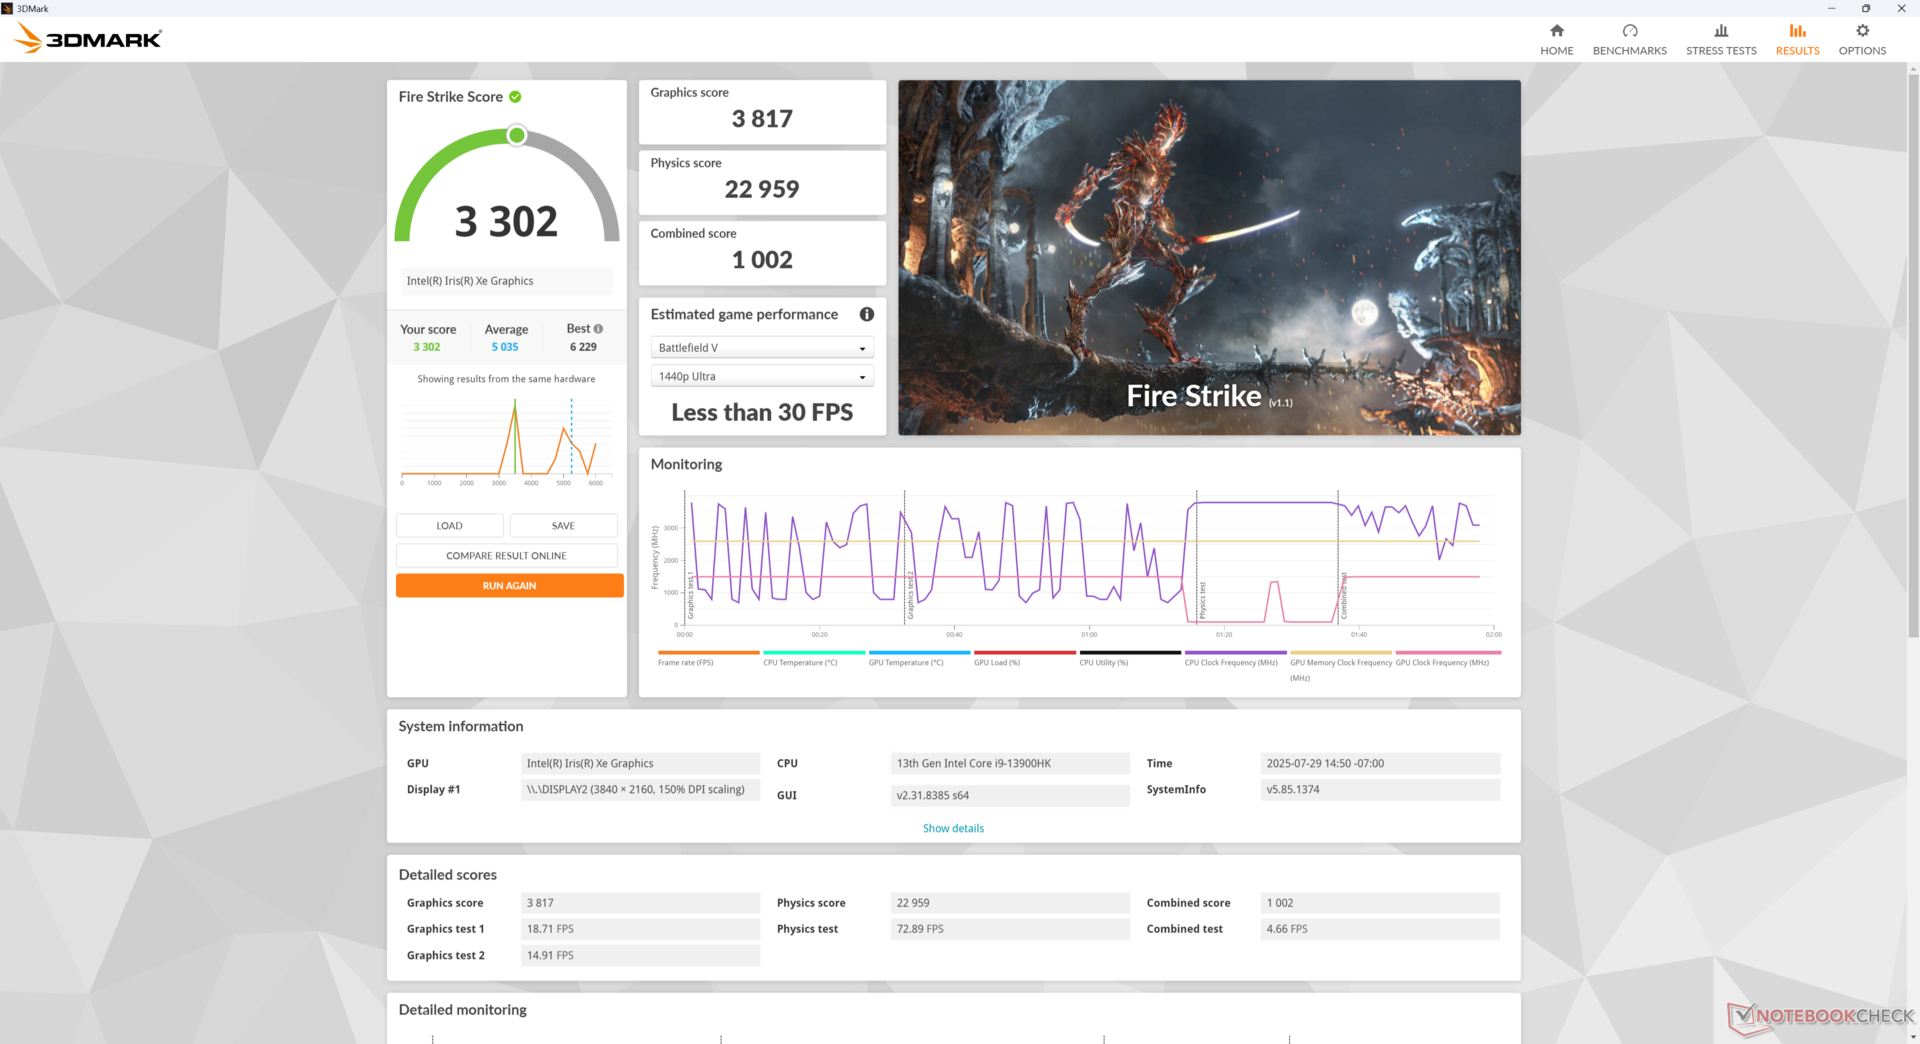
| 3DMark Fire Strike Score | 3302 pontos | |
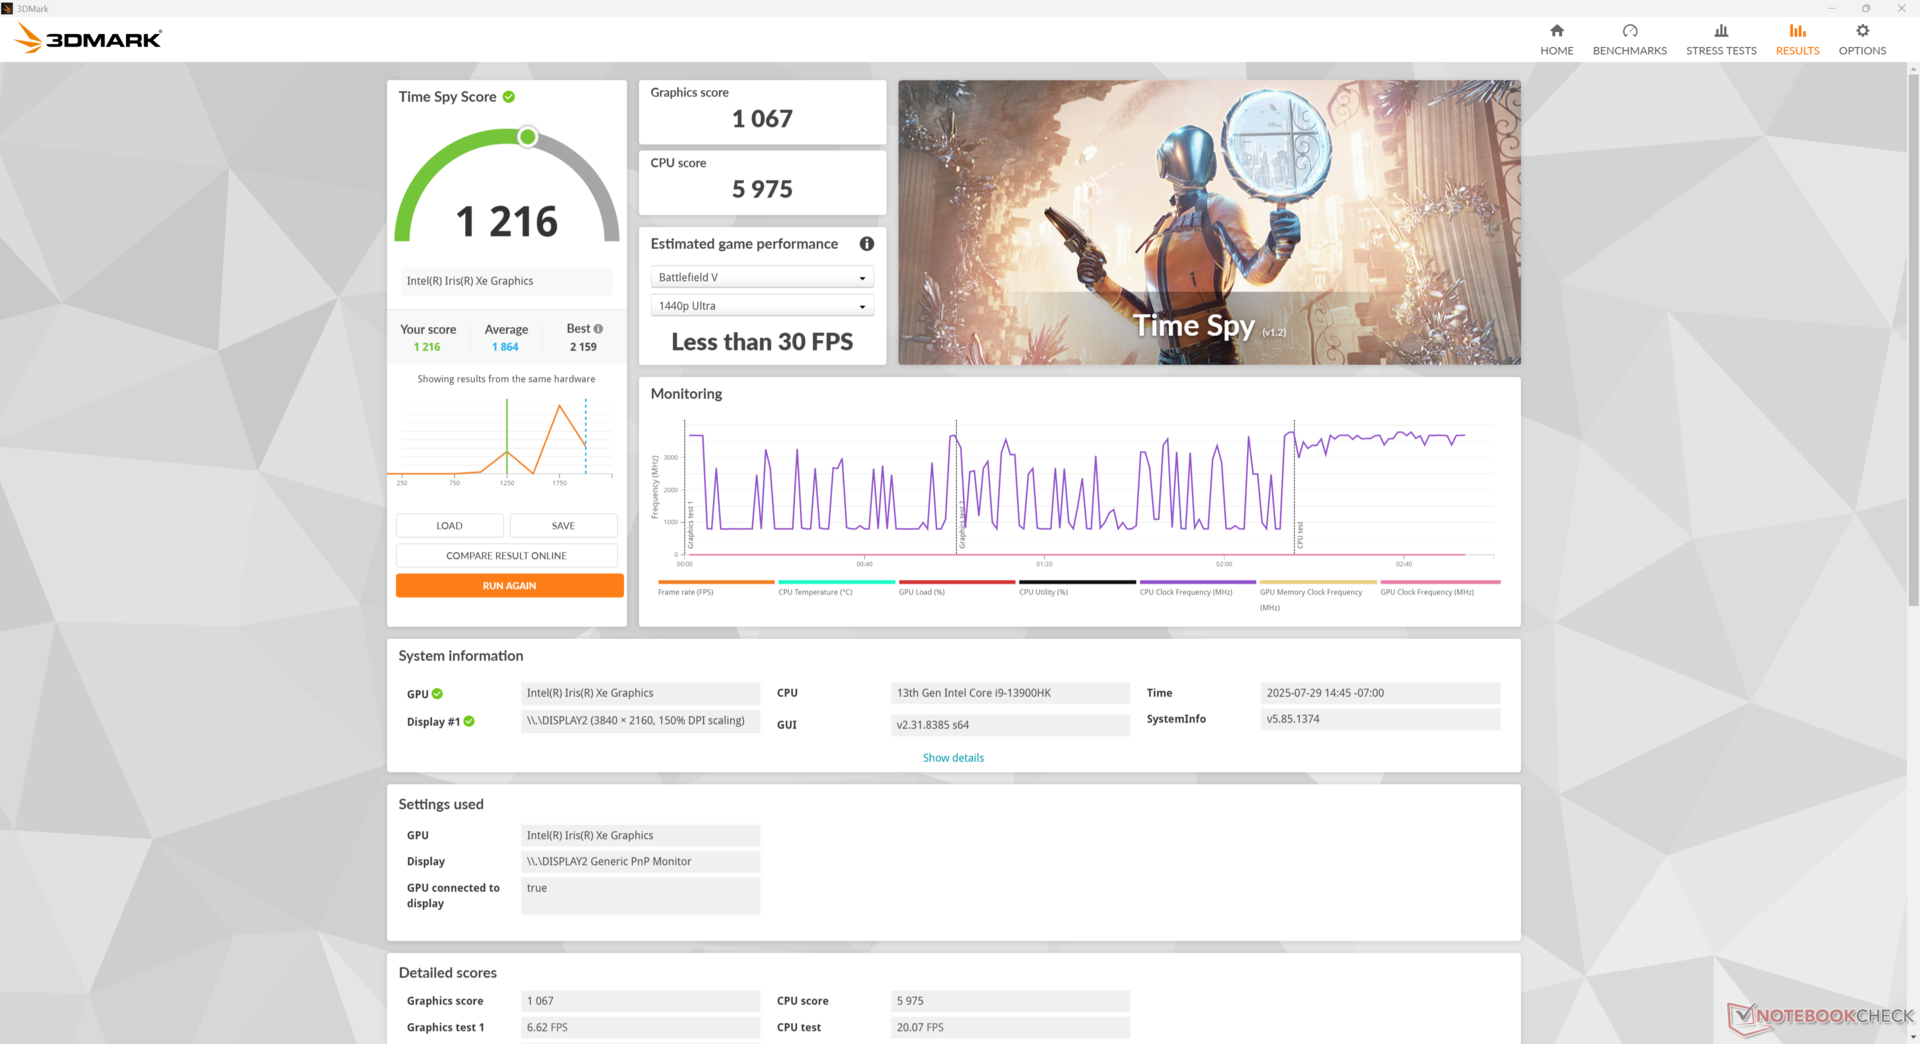
| 3DMark Time Spy Score | 1216 pontos | |
Ajuda | ||
* ... menor é melhor
Cyberpunk 2077 ultra FPS Chart
| baixo | média | alto | ultra | |
|---|---|---|---|---|
| GTA V (2015) | 67.2 | 56.2 | 11.7 | 4.79 |
| Dota 2 Reborn (2015) | 84.4 | 68 | 46.1 | 44 |
| Final Fantasy XV Benchmark (2018) | 30.2 | 14.9 | 10.7 | |
| Strange Brigade (2018) | 67 | 23.4 | 20.1 | 17 |
| Baldur's Gate 3 (2023) | 12.9 | 10.7 | 9.2 | 9.2 |
| Cyberpunk 2077 (2023) | ||||
| F1 24 (2024) | 25.7 | 23.8 | 18 | 14.8 |
Emissões
Ruído do sistema
Os níveis de ruído do ventilador são um pouco mais altos do que no GTi13 Ultra maior. Mesmo assim, o teto é visivelmente mais baixo do que em alternativas como o BOSGAME M4 Neo ou o SEi12, mais antigo e mais lento.
Barulho
| Ocioso |
| 28 / 28 / 28 dB |
| Carga |
| 32.6 / 36.3 dB |
 | ||
30 dB silencioso 40 dB(A) audível 50 dB(A) ruidosamente alto |
||
min: | ||
| Beelink SEi13 Pro Iris Xe G7 96EUs, i9-13900HK, Crucial P3 Plus CT1000P3PSSD8 | Beelink GTI13 Ultra Iris Xe G7 96EUs, i9-13900HK, Crucial P5 Plus 1TB CT1000P5PSSD8 | Beelink SEi12 Core i5-1235U Iris Xe G7 80EUs, i5-1235U, Kingston NV1 SNVS/500GCN | HP Z2 Mini G1a Radeon 8060S, Ryzen AI Max+ PRO 395, Samsung PM9A1 MZVL22T0HBLB | BOSGAME M4 Neo Radeon 780M, R7 7840HS, Kingston OM8PGP41024N-A0 | |
|---|---|---|---|---|---|
| Noise | 5% | -1% | -37% | -23% | |
| desligado / ambiente * (dB) | 23.1 | 23.4 -1% | 23.3 -1% | 24.9 -8% | 24.3 -5% |
| Idle Minimum * (dB) | 28 | 26.5 5% | 27.8 1% | 32.1 -15% | 37.6 -34% |
| Idle Average * (dB) | 28 | 26.7 5% | 27.8 1% | 32.4 -16% | 37.9 -35% |
| Idle Maximum * (dB) | 28 | 28.5 -2% | 27.8 1% | 32.6 -16% | 38 -36% |
| Load Average * (dB) | 32.6 | 30.6 6% | 32 2% | 41.1 -26% | 40.8 -25% |
| Cyberpunk 2077 ultra * (dB) | 34.3 | 32.5 5% | 67 -95% | 40.18 -17% | |
| Load Maximum * (dB) | 36.3 | 30.8 15% | 39.2 -8% | 67.3 -85% | 40.2 -11% |
| Witcher 3 ultra * (dB) | 34.1 | 70 |
* ... menor é melhor
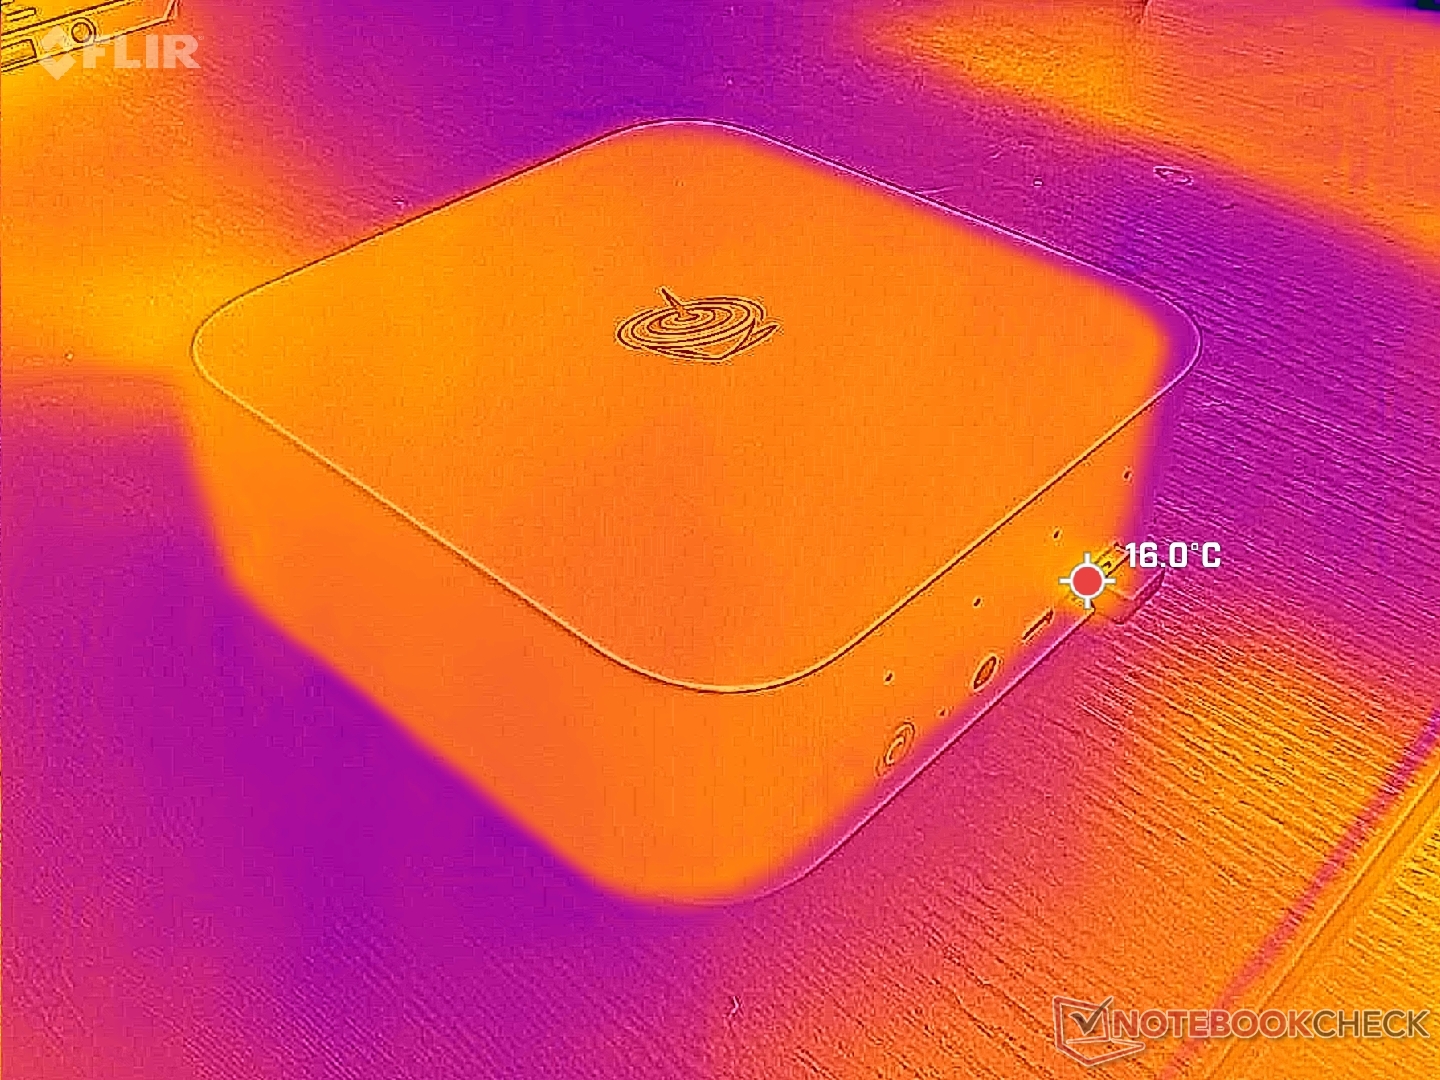
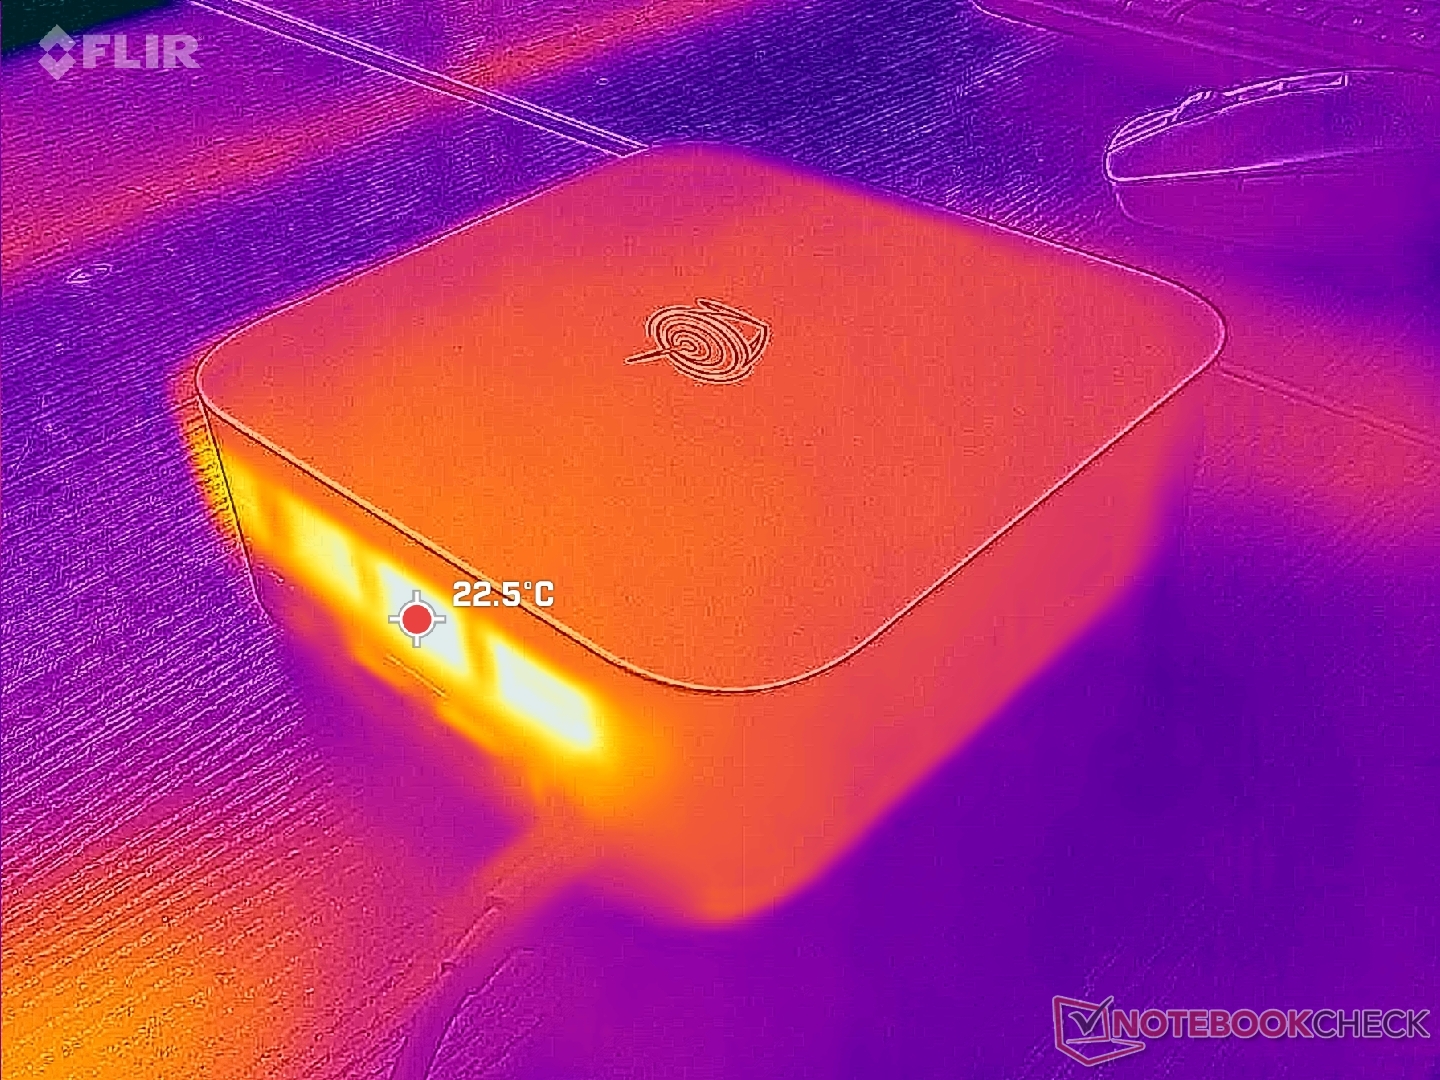
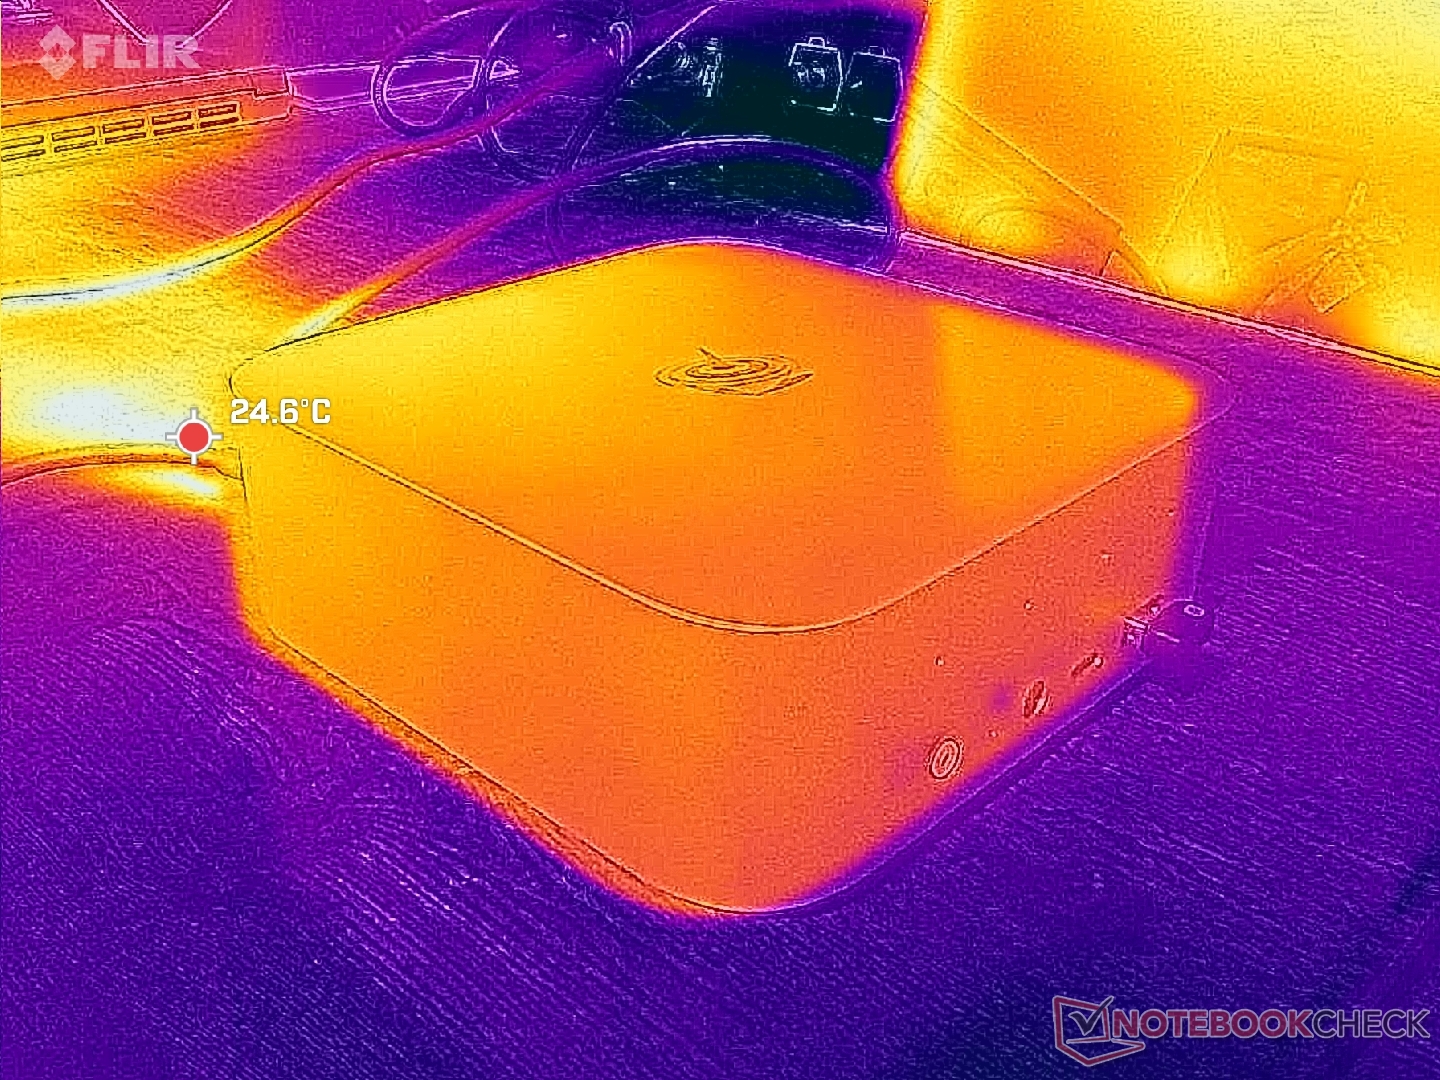
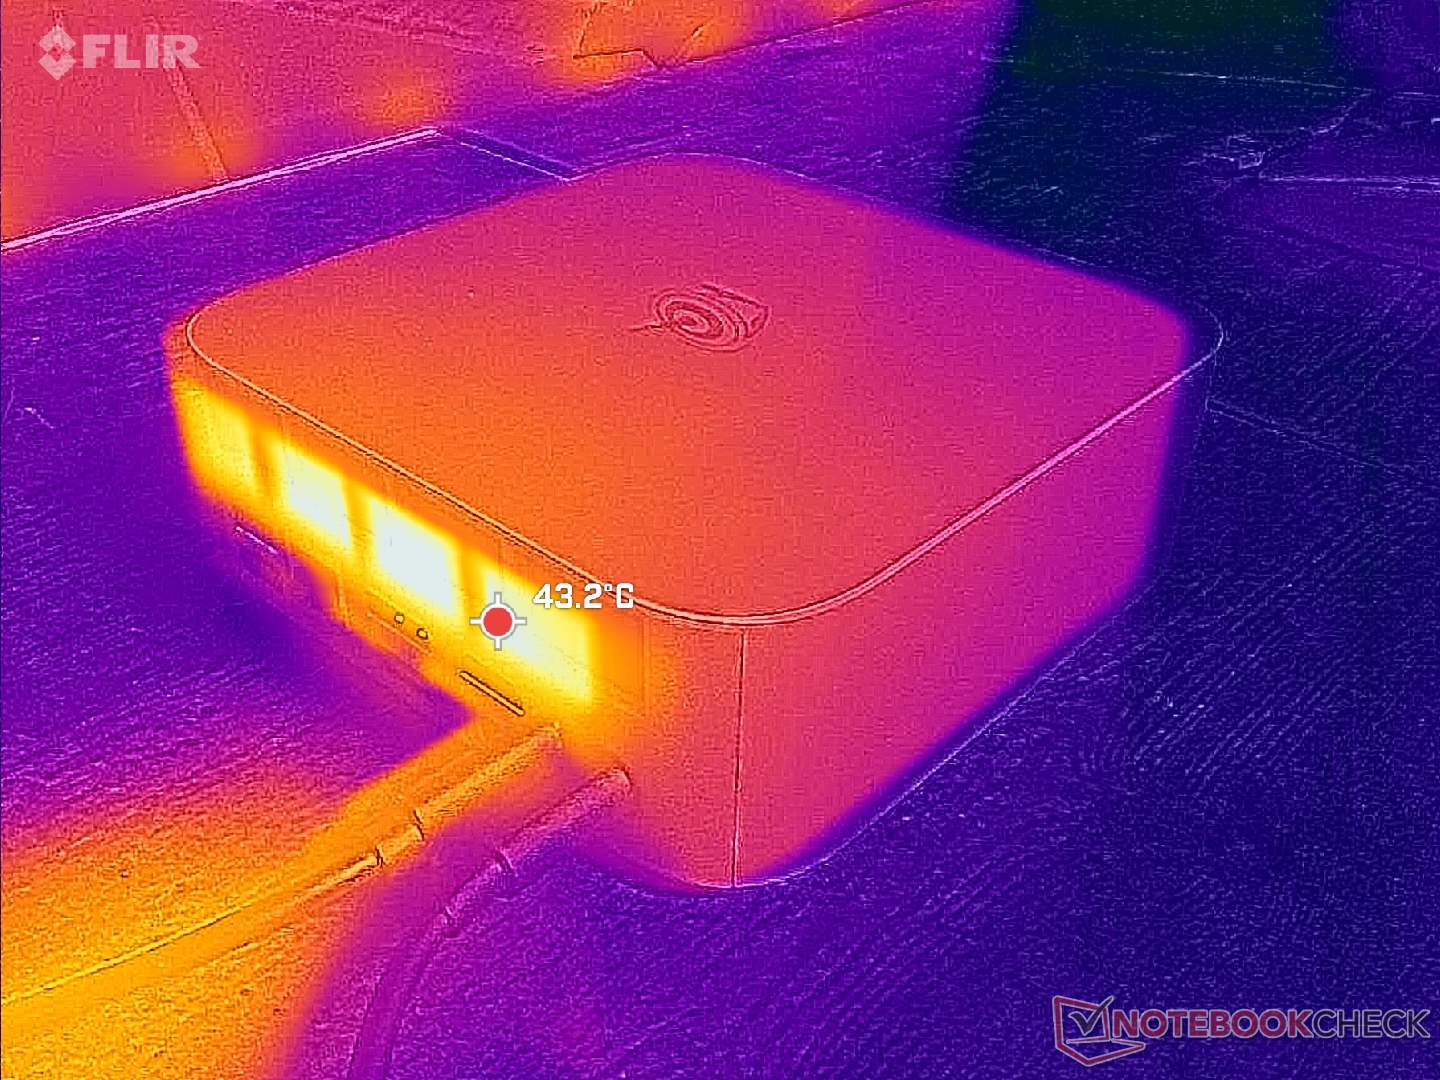
Temperatura
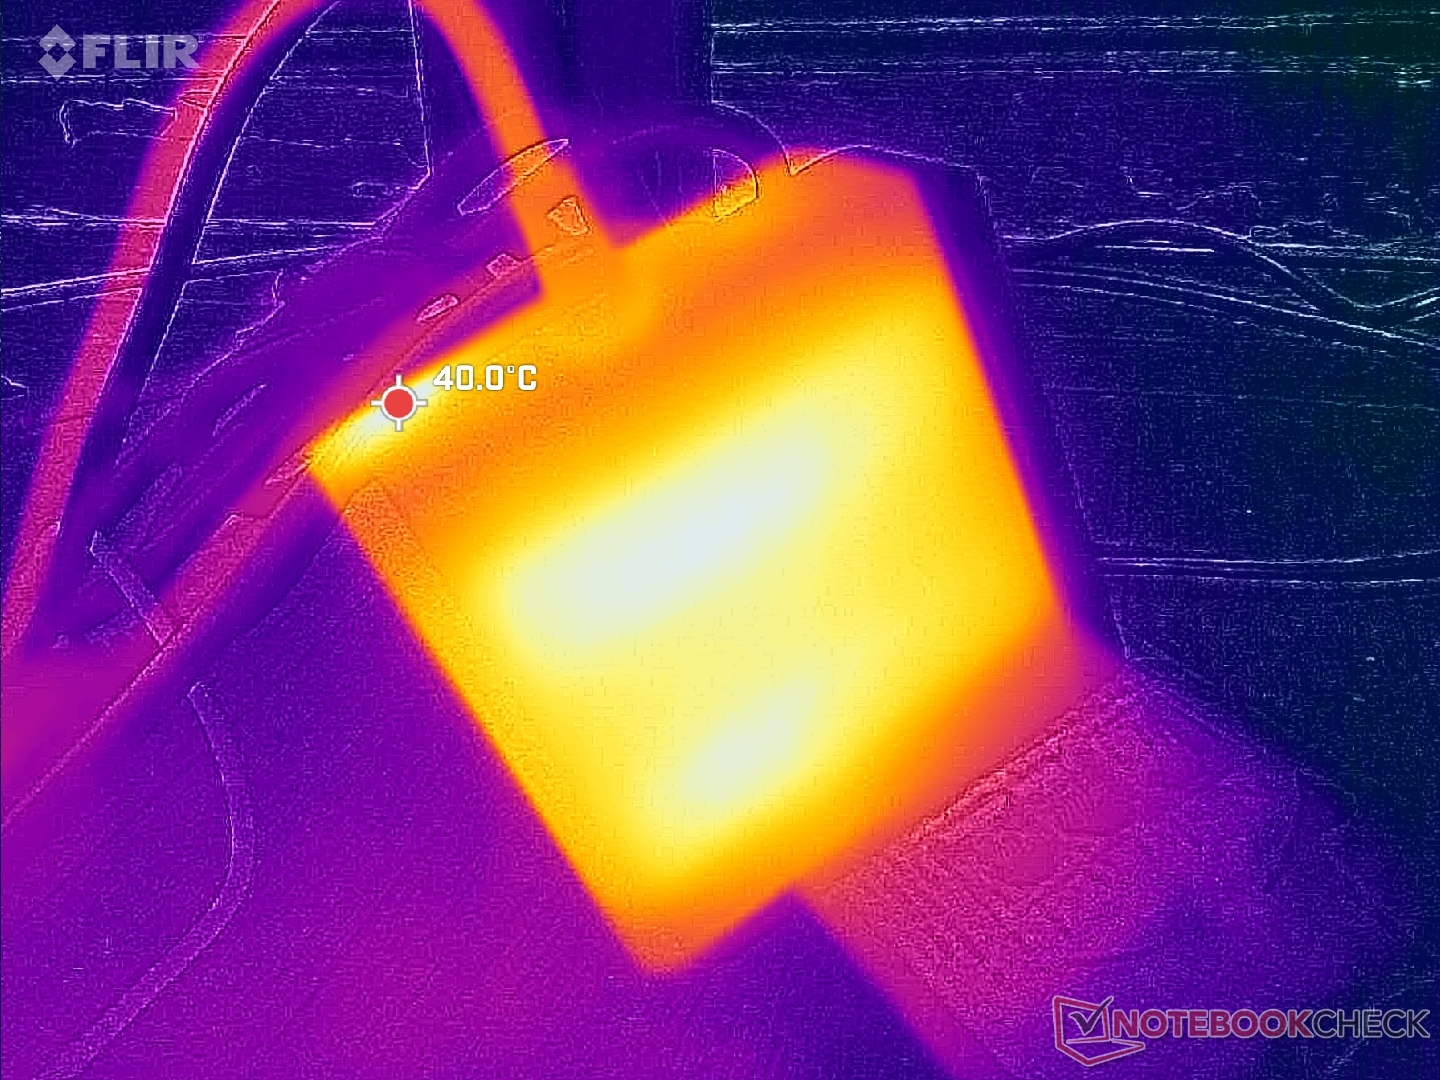
O calor residual escapa pela parte traseira, enquanto o ar fresco entra pela parte inferior. A superfície superior fica quente, mas nunca desconfortavelmente quente, apesar de haver poucas grades de ventilação.
Teste de estresse
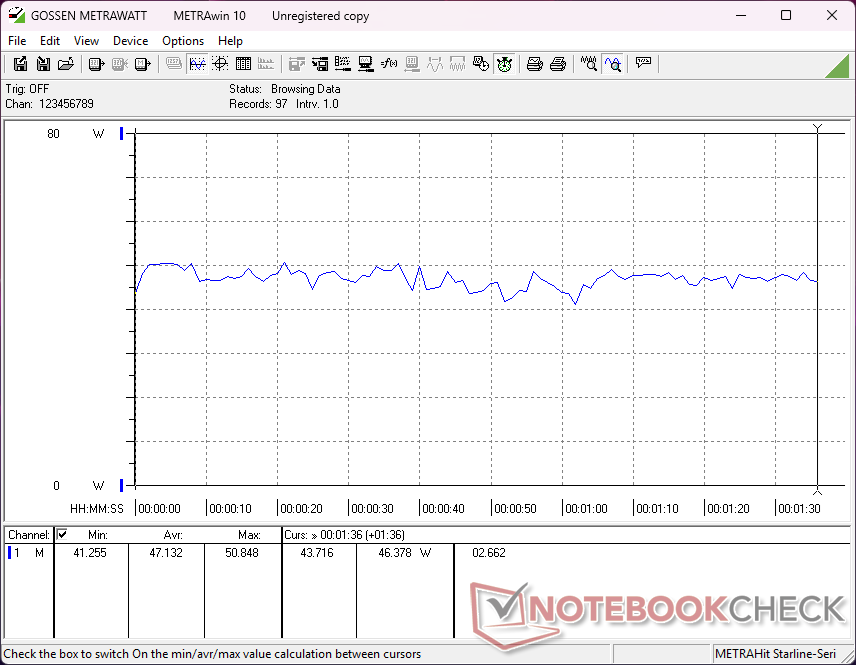
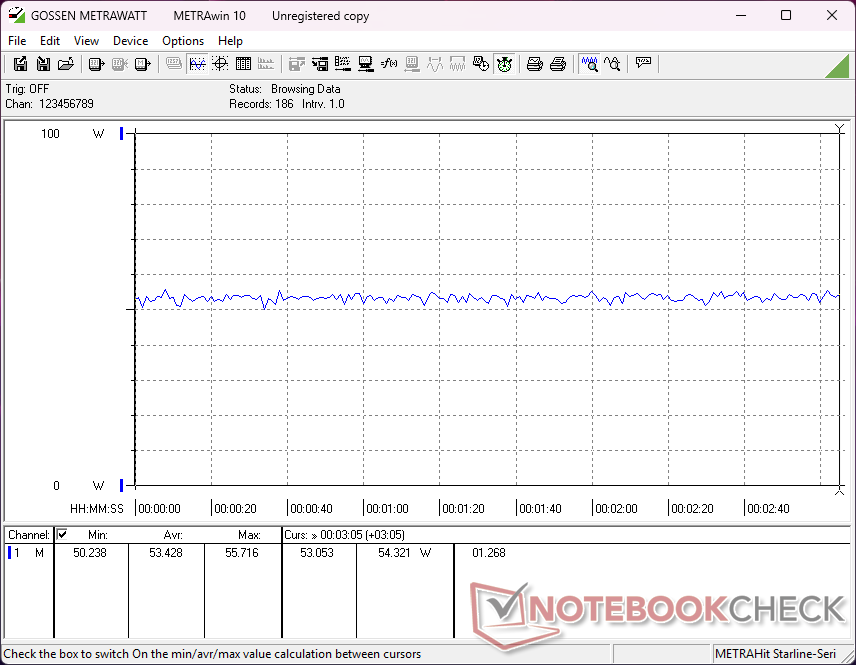
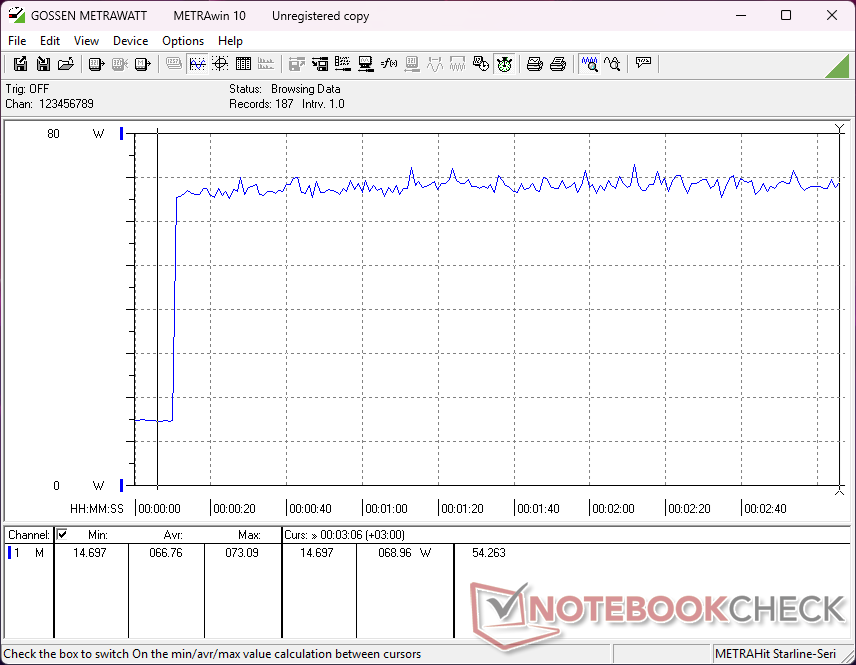
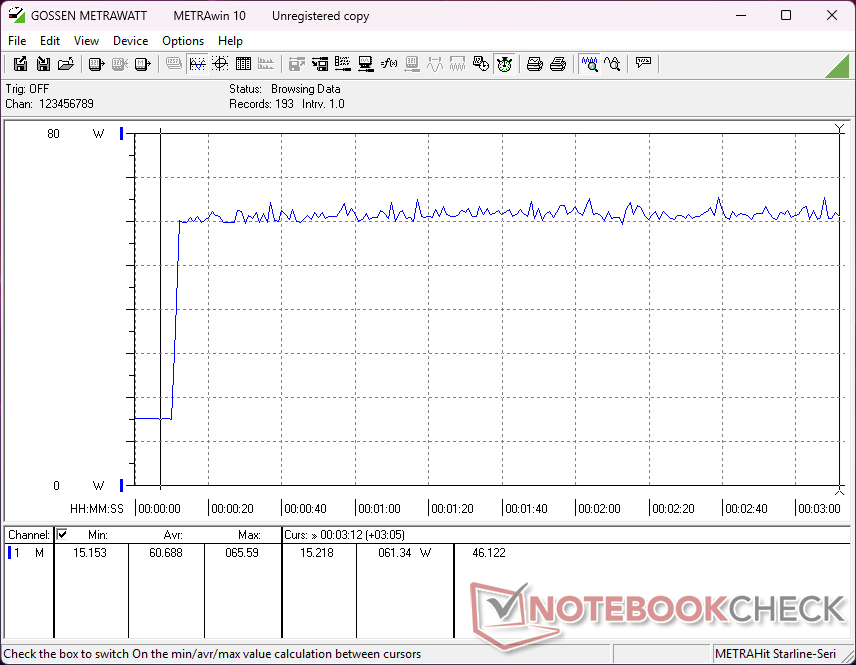
A CPU se estabiliza em 3,5 GHz, 44 W e 60 C ao executar o estresse do Prime95, o que, na verdade, é mais frio do que o que observamos no GTI13 Ultra em alguns graus.

| Clock médio da CPU (GHz) | Clock da GPU (MHz) | Temperatura média da CPU (°C) | |
| Sistema ocioso | -- | -- | 33 |
| Estresse do Prime95 | 3.5 | -- | 60 |
| Prime95 + FurMark Stress | 2.7 | 1450 | 59 |
| Cyberpunk 2077 Stress | 1.0 | 1500 | 53 |
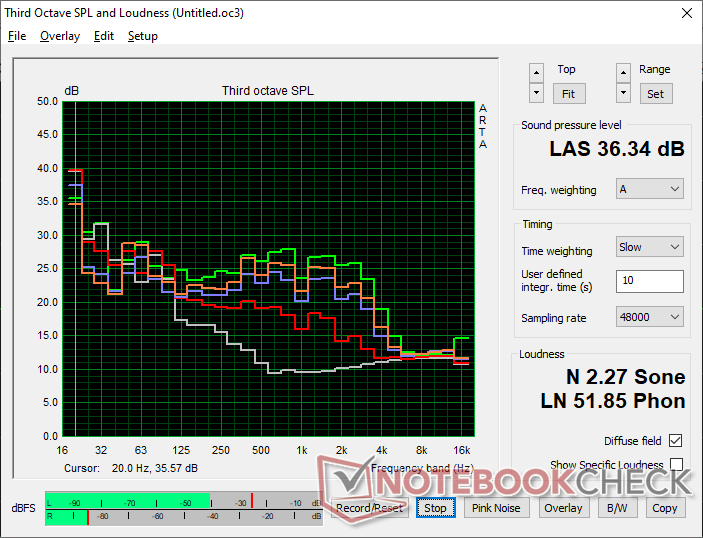
Alto-falantes
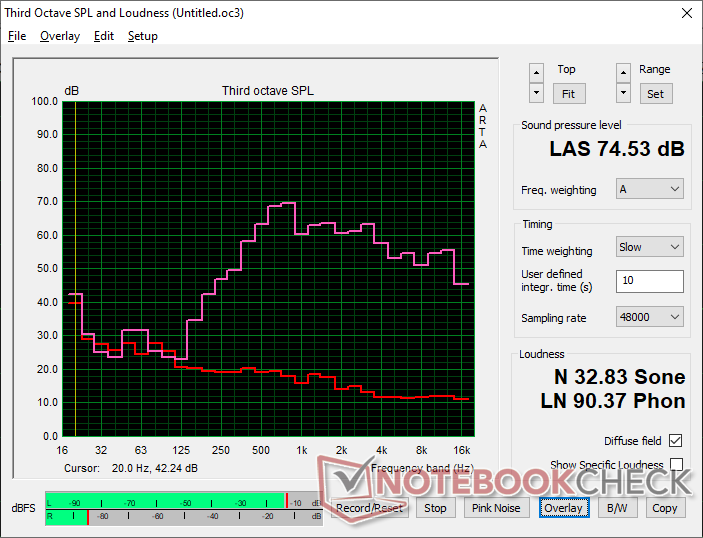
Beelink SEi13 Pro análise de áudio
(±) | o volume do alto-falante é médio, mas bom (###valor### dB)
Graves 100 - 315Hz
(-) | quase nenhum baixo - em média 18.9% menor que a mediana
(±) | a linearidade dos graves é média (12.7% delta para a frequência anterior)
Médios 400 - 2.000 Hz
(±) | médios mais altos - em média 7.9% maior que a mediana
(±) | a linearidade dos médios é média (11.9% delta para frequência anterior)
Altos 2 - 16 kHz
(+) | agudos equilibrados - apenas 3.5% longe da mediana
(±) | a linearidade dos máximos é média (8.1% delta para frequência anterior)
Geral 100 - 16.000 Hz
(±) | a linearidade do som geral é média (26.7% diferença em relação à mediana)
Comparado com a mesma classe
» 71% de todos os dispositivos testados nesta classe foram melhores, 4% semelhantes, 25% piores
» O melhor teve um delta de 13%, a média foi 24%, o pior foi 64%
Comparado com todos os dispositivos testados
» 82% de todos os dispositivos testados foram melhores, 4% semelhantes, 14% piores
» O melhor teve um delta de 4%, a média foi 24%, o pior foi 134%
Apple MacBook Pro 16 2021 M1 Pro análise de áudio
(+) | os alto-falantes podem tocar relativamente alto (###valor### dB)
Graves 100 - 315Hz
(+) | bons graves - apenas 3.8% longe da mediana
(+) | o baixo é linear (5.2% delta para a frequência anterior)
Médios 400 - 2.000 Hz
(+) | médios equilibrados - apenas 1.3% longe da mediana
(+) | médios são lineares (2.1% delta para frequência anterior)
Altos 2 - 16 kHz
(+) | agudos equilibrados - apenas 1.9% longe da mediana
(+) | os máximos são lineares (2.7% delta da frequência anterior)
Geral 100 - 16.000 Hz
(+) | o som geral é linear (4.6% diferença em relação à mediana)
Comparado com a mesma classe
» 0% de todos os dispositivos testados nesta classe foram melhores, 0% semelhantes, 100% piores
» O melhor teve um delta de 5%, a média foi 17%, o pior foi 45%
Comparado com todos os dispositivos testados
» 0% de todos os dispositivos testados foram melhores, 0% semelhantes, 100% piores
» O melhor teve um delta de 4%, a média foi 24%, o pior foi 134%
Gerenciamento de energia
Consumo de energia
O sistema exige menos energia do que o GTi13 Ultra quando sob carga, já que a CPU atinge o máximo de 44 W por padrão, em comparação com 55 W na GTi13 Ultra. O consumo também é menor do que no BOSGAME M4mas este último oferece desempenho gráfico mais rápido para compensar.
| desligado | |
| Ocioso | |
| Carga |
|
Key:
min: | |
| Beelink SEi13 Pro i9-13900HK, Iris Xe G7 96EUs, Crucial P3 Plus CT1000P3PSSD8, , x, | Beelink GTI13 Ultra i9-13900HK, Iris Xe G7 96EUs, Crucial P5 Plus 1TB CT1000P5PSSD8, , x, | Beelink SEi12 Core i5-1235U i5-1235U, Iris Xe G7 80EUs, Kingston NV1 SNVS/500GCN, , x, | HP Z2 Mini G1a Ryzen AI Max+ PRO 395, Radeon 8060S, Samsung PM9A1 MZVL22T0HBLB, , x, | BOSGAME M4 Neo R7 7840HS, Radeon 780M, Kingston OM8PGP41024N-A0, , x, | |
|---|---|---|---|---|---|
| Power Consumption | -31% | -17% | -69% | 1% | |
| Idle Minimum * (Watt) | 14.5 | 15.7 -8% | 15.8 -9% | 7.1 51% | 7.6 48% |
| Idle Average * (Watt) | 14.9 | 16.5 -11% | 16.8 -13% | 9.5 36% | 9.1 39% |
| Idle Maximum * (Watt) | 15.8 | 16.5 -4% | 17 -8% | 13.8 13% | 11.1 30% |
| Load Average * (Watt) | 47.1 | 77.3 -64% | 54.4 -15% | 76.7 -63% | 67.2 -43% |
| Cyberpunk 2077 ultra external monitor * (Watt) | 53.4 | 91.9 -72% | 195.1 -265% | 81.3 -52% | |
| Load Maximum * (Watt) | 85.7 | 106 -24% | 119.1 -39% | 245.4 -186% | 98.4 -15% |
| Witcher 3 ultra * (Watt) | 50.7 |
* ... menor é melhor
Power Consumption Cyberpunk / Stress Test
Power Consumption external Monitor
Classificação do Notebookcheck
Beelink SEi13 Pro
- 08/01/2025 v8
Allen Ngo
 Total Sustainability Score:
 Concorrentes potenciais em comparação
Imagem | Modelo / Análises | Preço | Peso | Altura | Tela |
|---|---|---|---|---|---|
1. 71%  | Beelink SEi13 Pro Intel Core i9-13900HK ⎘ Intel Iris Xe Graphics G7 96EUs ⎘ 32 GB Memória, 1024 GB SSD | Amazon: 1. Beelink SEi13 Pro Mini PC, I... 2. $699.00 Beelink SEi13 Pro Mini PC, I... 3. $799.00 Beelink SEi13 Pro Mini PC W-... Preço de tabela: 540 USD | 808 g | 44.7 mm | x |
2. 79.9%  | Beelink GTI13 Ultra Intel Core i9-13900HK ⎘ Intel Iris Xe Graphics G7 96EUs ⎘ 32 GB Memória, 1024 GB SSD | Amazon: Preço de tabela: 600 USD | 1.3 kg | 55.8 mm | x |
3.  | Beelink SEi12 Core i5-1235U Intel Core i5-1235U ⎘ Intel Iris Xe Graphics G7 80EUs ⎘ 16 GB Memória, 500 GB SSD | Amazon: 1. $559.00 Beelink EQi12 Mini PC, Intel... 2. $439.00 Beelink EQi12 Mini PC, Intel... 3. $469.00 Beelink EQi12 Mini PC, Intel... Preço de tabela: 460 USD | 465 g | 42 mm | x |
4. 78.7% 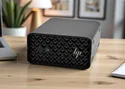 | HP Z2 Mini G1a AMD Ryzen AI Max+ PRO 395 ⎘ AMD Radeon 8060S ⎘ 64 GB Memória, 2048 GB SSD | Amazon: 1. $2,738.57 HP Z2 Mini G1a Workstation -... 2. $3,299.99 GMKtec AI Mini PC Ryzen Al M... 3. $2,599.99 HP Z2 Mini G1a Workstation B... Preço de tabela: 3175 EUR | 2.6 kg | 85.5 mm | x |
5. 74% 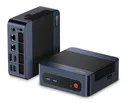 | BOSGAME M4 Neo AMD Ryzen 7 7840HS ⎘ AMD Radeon 780M ⎘ 32 GB Memória, 1024 GB SSD | Amazon: Preço de tabela: 389 EUR | 560 g | 42 mm | x |
6.  | BMAX B9 Power Intel Core i9-12900HK ⎘ Intel Iris Xe Graphics G7 96EUs ⎘ 32 GB Memória, 1024 GB SSD | Amazon: Preço de tabela: 540 EUR | 427 g | 52 mm | x |
Transparência
A seleção dos dispositivos a serem analisados é feita pela nossa equipe editorial. A amostra de teste foi fornecida ao autor como empréstimo pelo fabricante ou varejista para fins desta revisão. O credor não teve influência nesta revisão, nem o fabricante recebeu uma cópia desta revisão antes da publicação. Não houve obrigação de publicar esta revisão. Como empresa de mídia independente, a Notebookcheck não está sujeita à autoridade de fabricantes, varejistas ou editores.
É assim que o Notebookcheck está testando
Todos os anos, o Notebookcheck analisa de forma independente centenas de laptops e smartphones usando procedimentos padronizados para garantir que todos os resultados sejam comparáveis. Desenvolvemos continuamente nossos métodos de teste há cerca de 20 anos e definimos padrões da indústria no processo. Em nossos laboratórios de teste, equipamentos de medição de alta qualidade são utilizados por técnicos e editores experientes. Esses testes envolvem um processo de validação em vários estágios. Nosso complexo sistema de classificação é baseado em centenas de medições e benchmarks bem fundamentados, o que mantém a objetividade.
