Revisão do Beelink SEi8: Uncommon Core i3-8109U para um novo mini PC
A Beelink está se tornando uma alternativa importante para a série Intel NUC com sua crescente gama de mini PCs. O recente SER4, por exemplo, provou ser tão rápido quanto muitos modelos Intel NUC com CPUs da série 11ª geração Core U enquanto custava centenas de dólares a menos
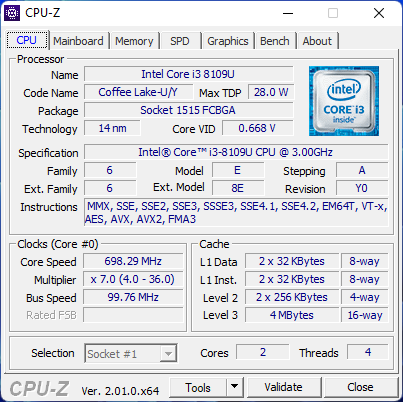
O SEi8 vem com um Core i3-8109U ou Core i5-8259U mais antigo do 8º gênero, enquanto que o SEi10 do ano passado vem com opções do 10º gênero Core U-series. O Core i3 mais antigo torna o modelo ainda mais acessível e uma alternativa atraente para os NUCs Intel i3
A Beelink está enviando atualmente o SEi8 começando em US$ 320 com 8 GB de RAM ou US$ 380 com 16 GB de RAM. Se configurado com o Core i5-8279U, o preço aumenta para a faixa de $400 USD
Mais análises do Beelink:
Possíveis concorrentes em comparação
Avaliação | Data | Modelo | Peso | Altura | Size | Resolução | Preço |
|---|---|---|---|---|---|---|---|
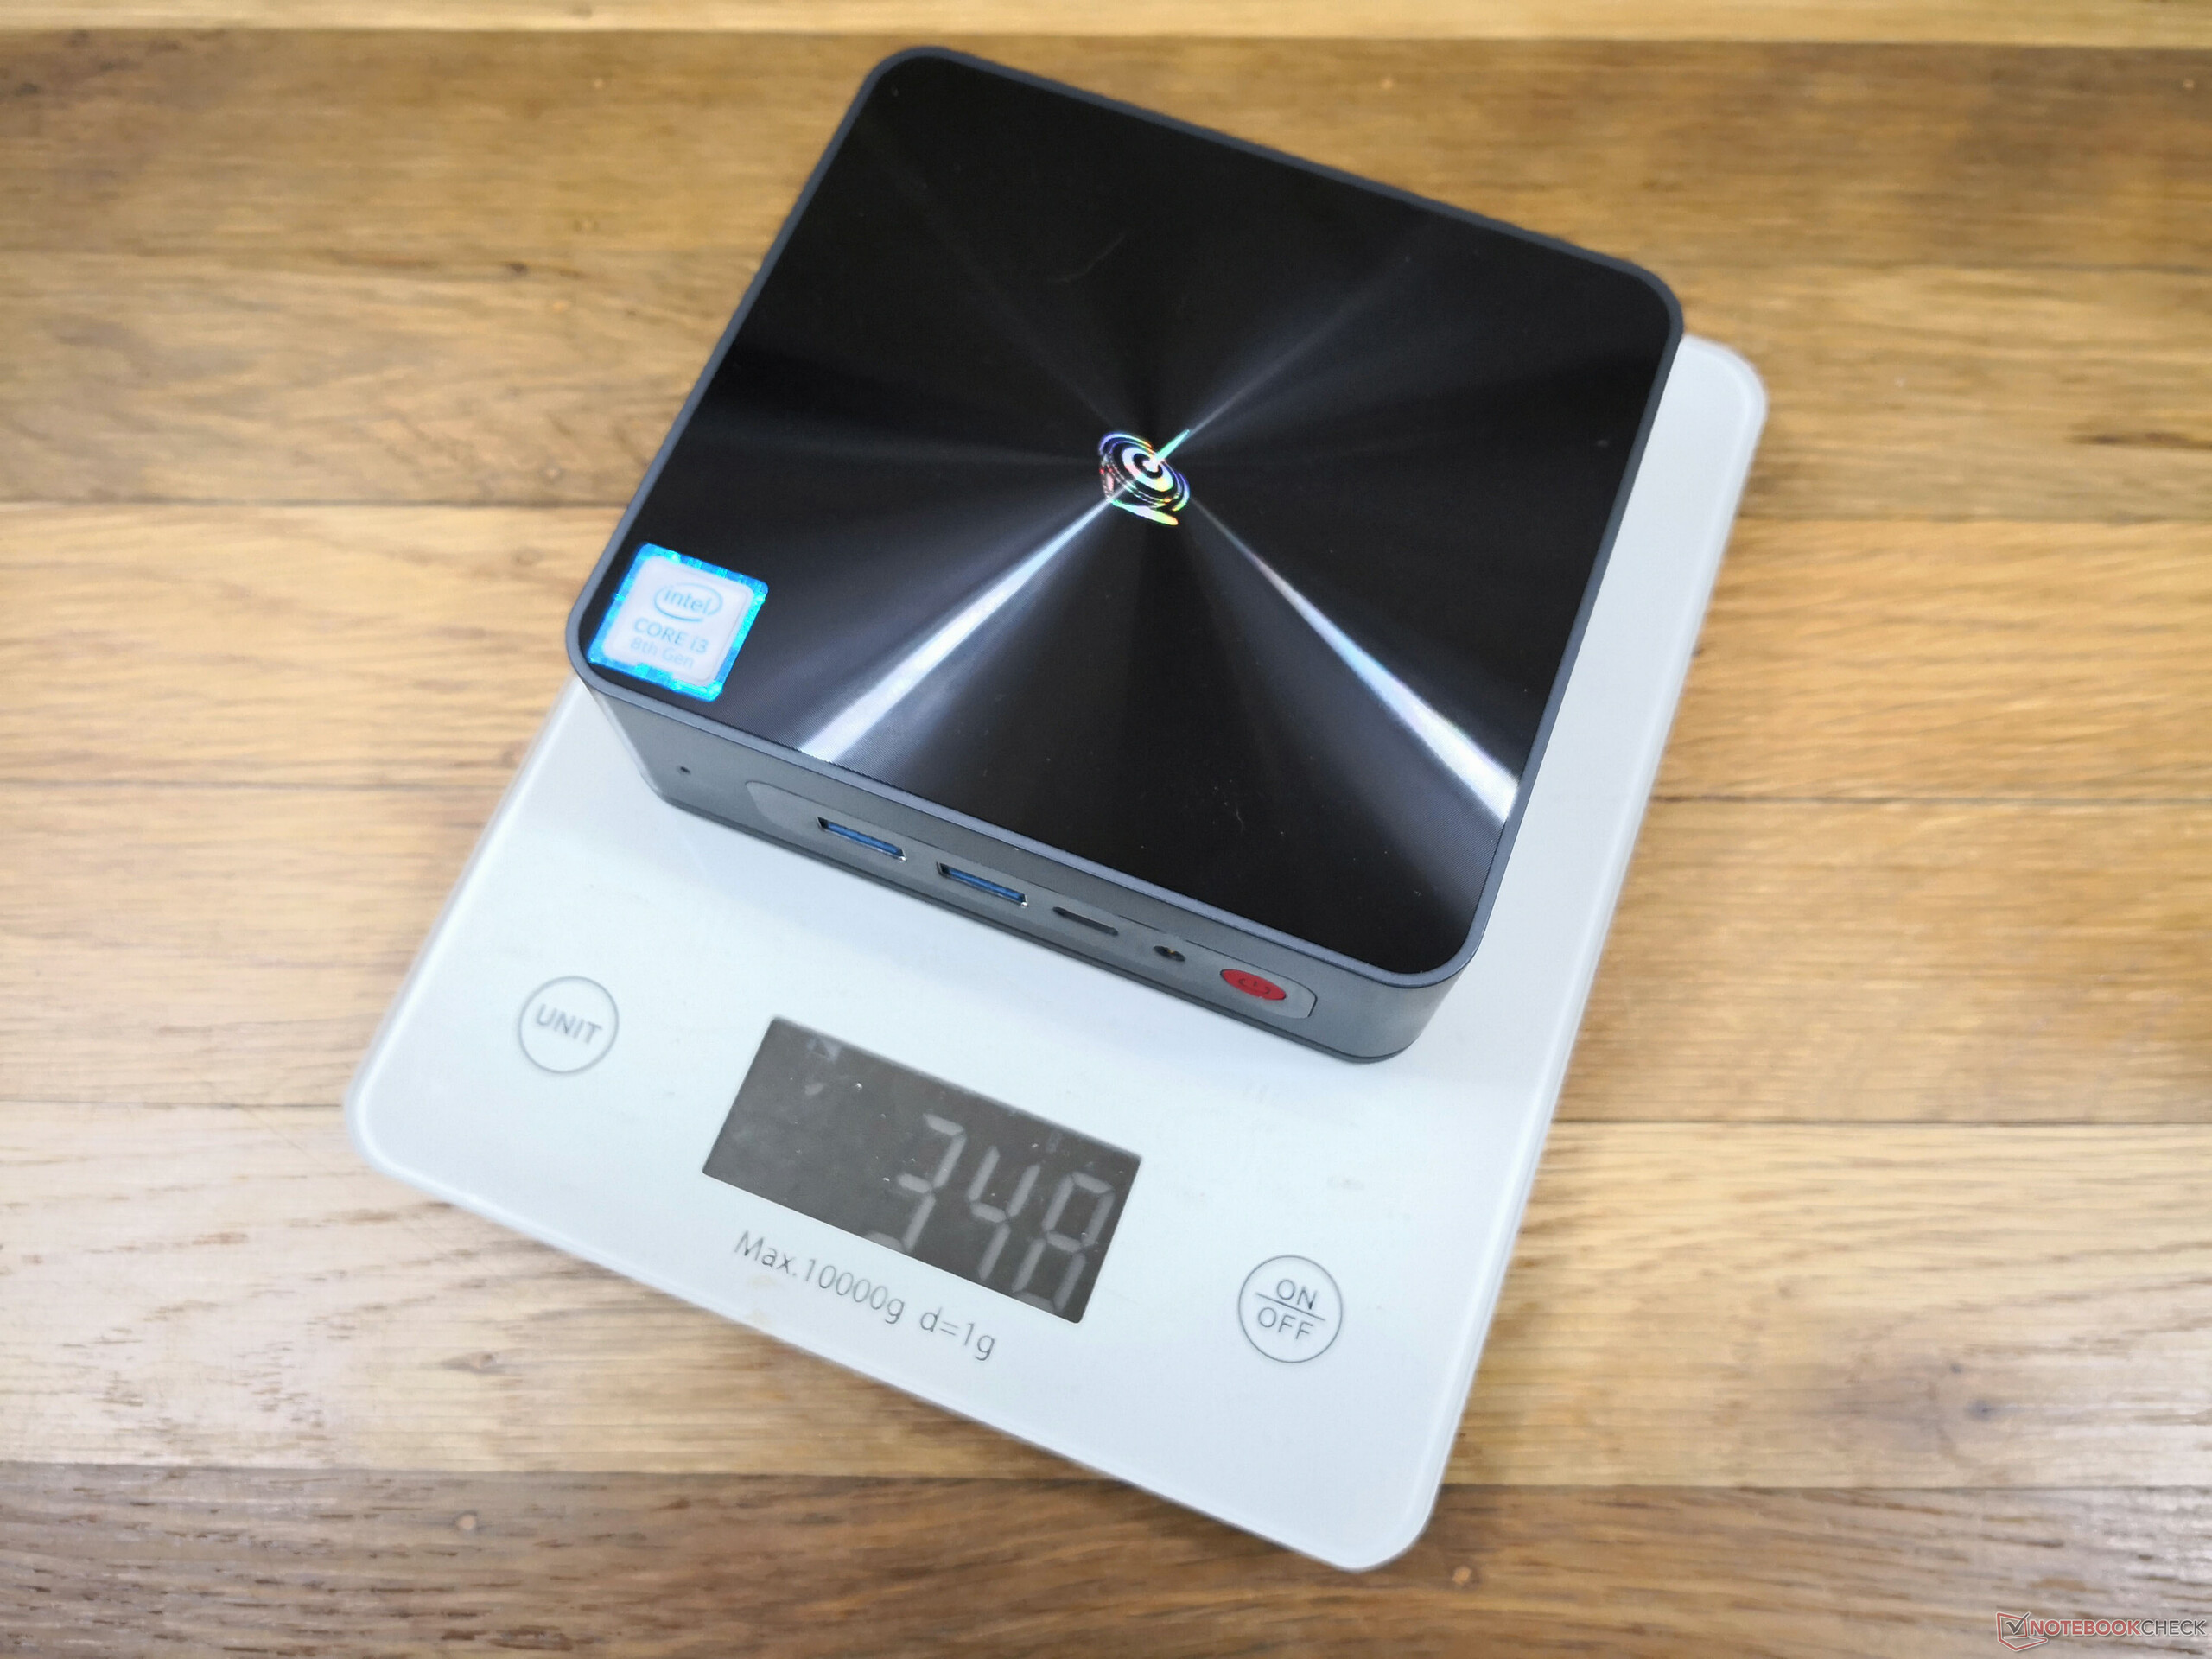
v (old) | 04/2022 | Beelink SEi8 i3-8109U, Iris Plus Graphics 655 | 346 g | 41 mm | x | ||
v (old) | Beelink SEi10 i3-1005G1, UHD Graphics G1 (Ice Lake 32 EU) | 350 g | 41 mm | x | |||
v (old) | 04/2022 | Beelink SER4 R7 4800U, Vega 8 | 494 g | 40 mm | x | ||
v (old) | 04/2021 | Intel NUC11TNKi5 i5-1135G7, Iris Xe G7 80EUs | 504 g | 37 mm | x | ||
v (old) | 11/2018 | Intel NUC8i7BE i7-8559U, Iris Plus Graphics 655 | 683 g | 51 mm | x | ||
v (old) | 03/2021 | GMK NucBox 2 i5-8259U, Iris Plus Graphics 655 | 430 g | 50 mm | x |
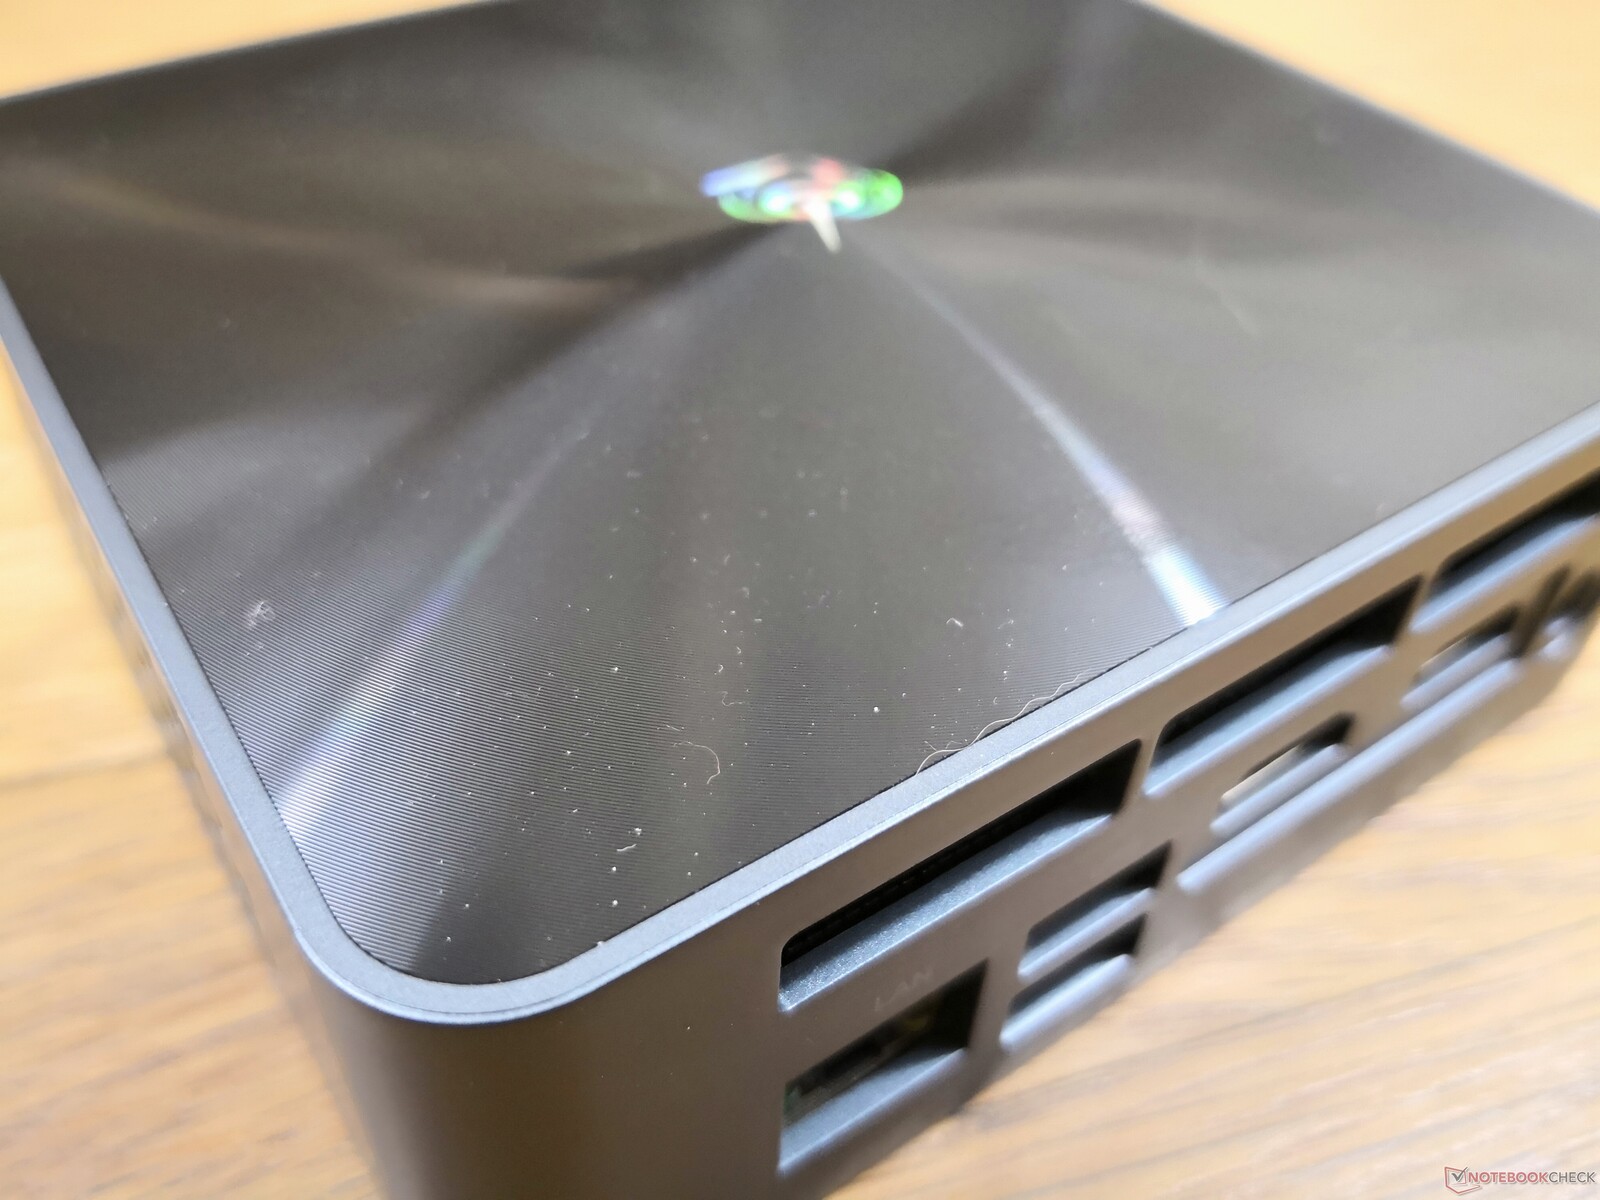
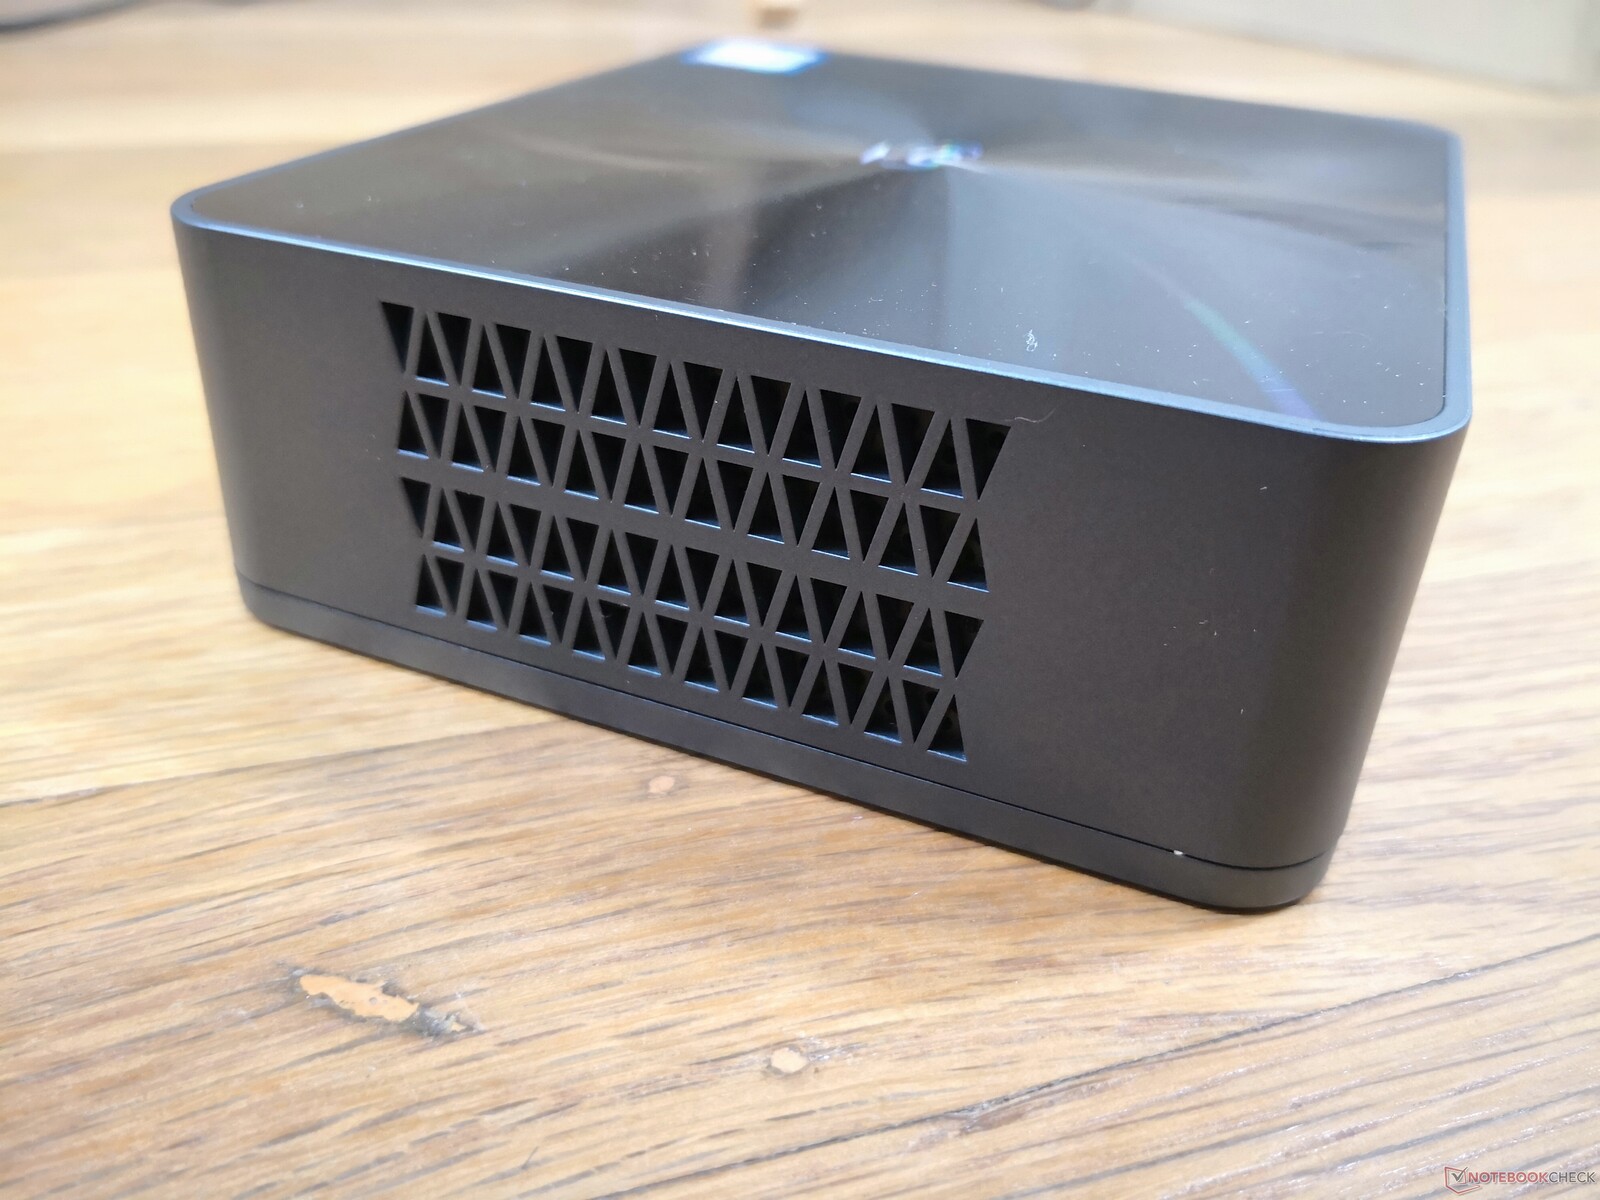
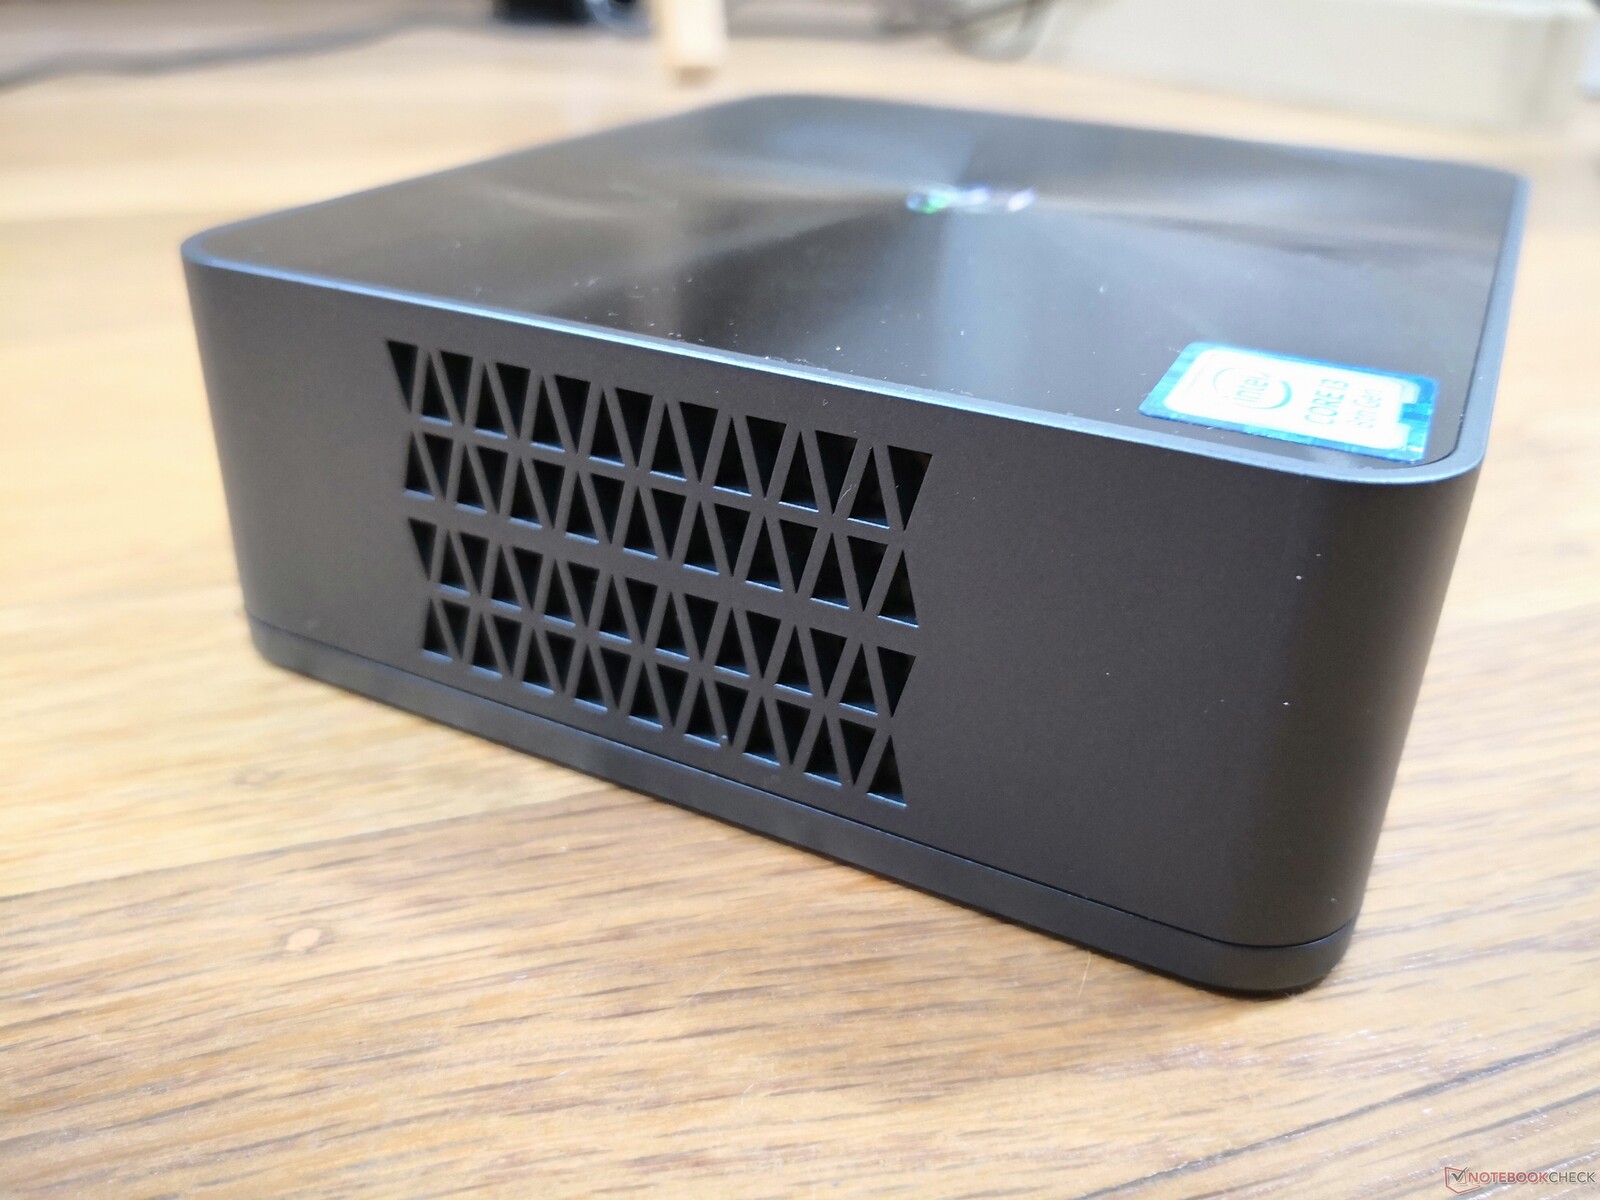
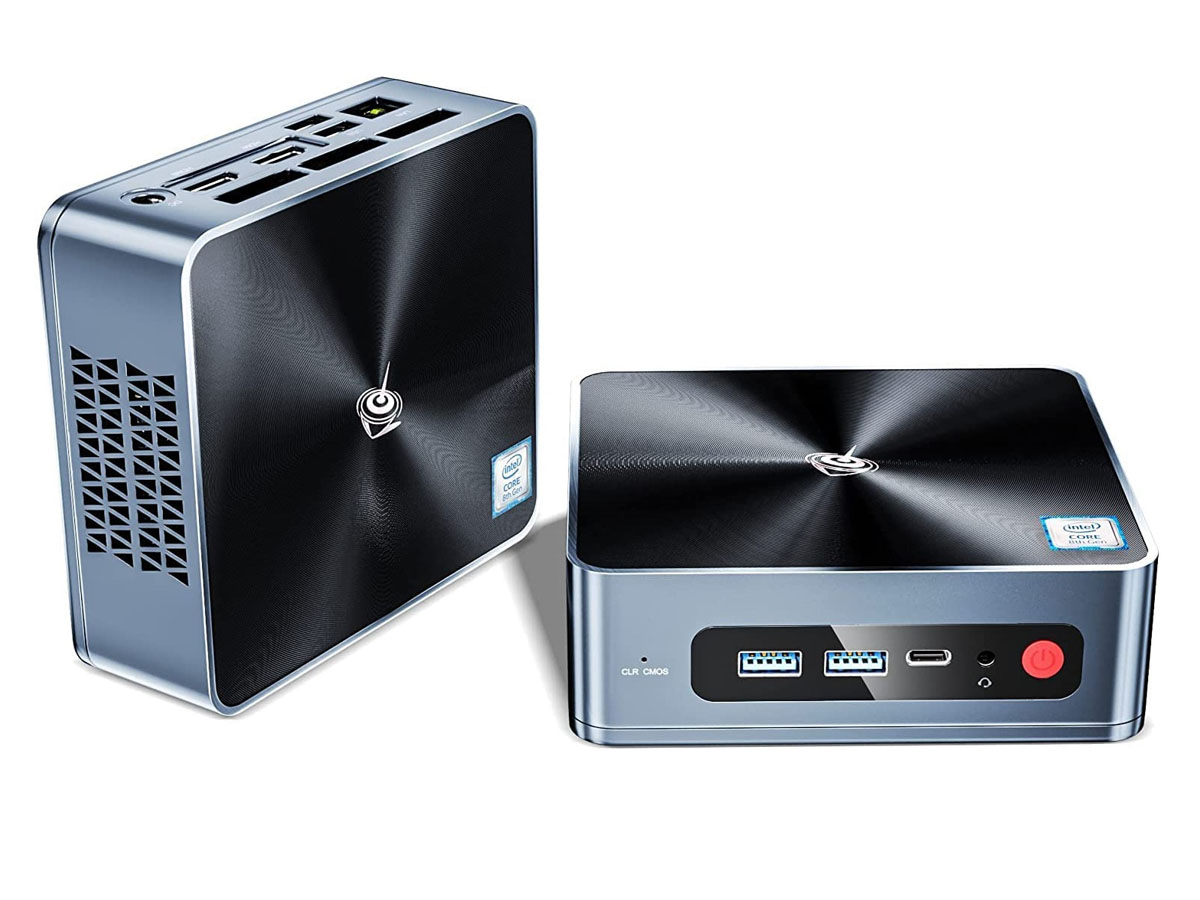
Caso
O chassi externo é idêntico ao da SEi10. Seu design é notável por ser aproximadamente do mesmo tamanho que um NUC da Intel, enquanto pesa 30 por cento mais leve. O material do chassi, embora ainda rígido, não é quase tão grosso ou robusto quanto um NUC.
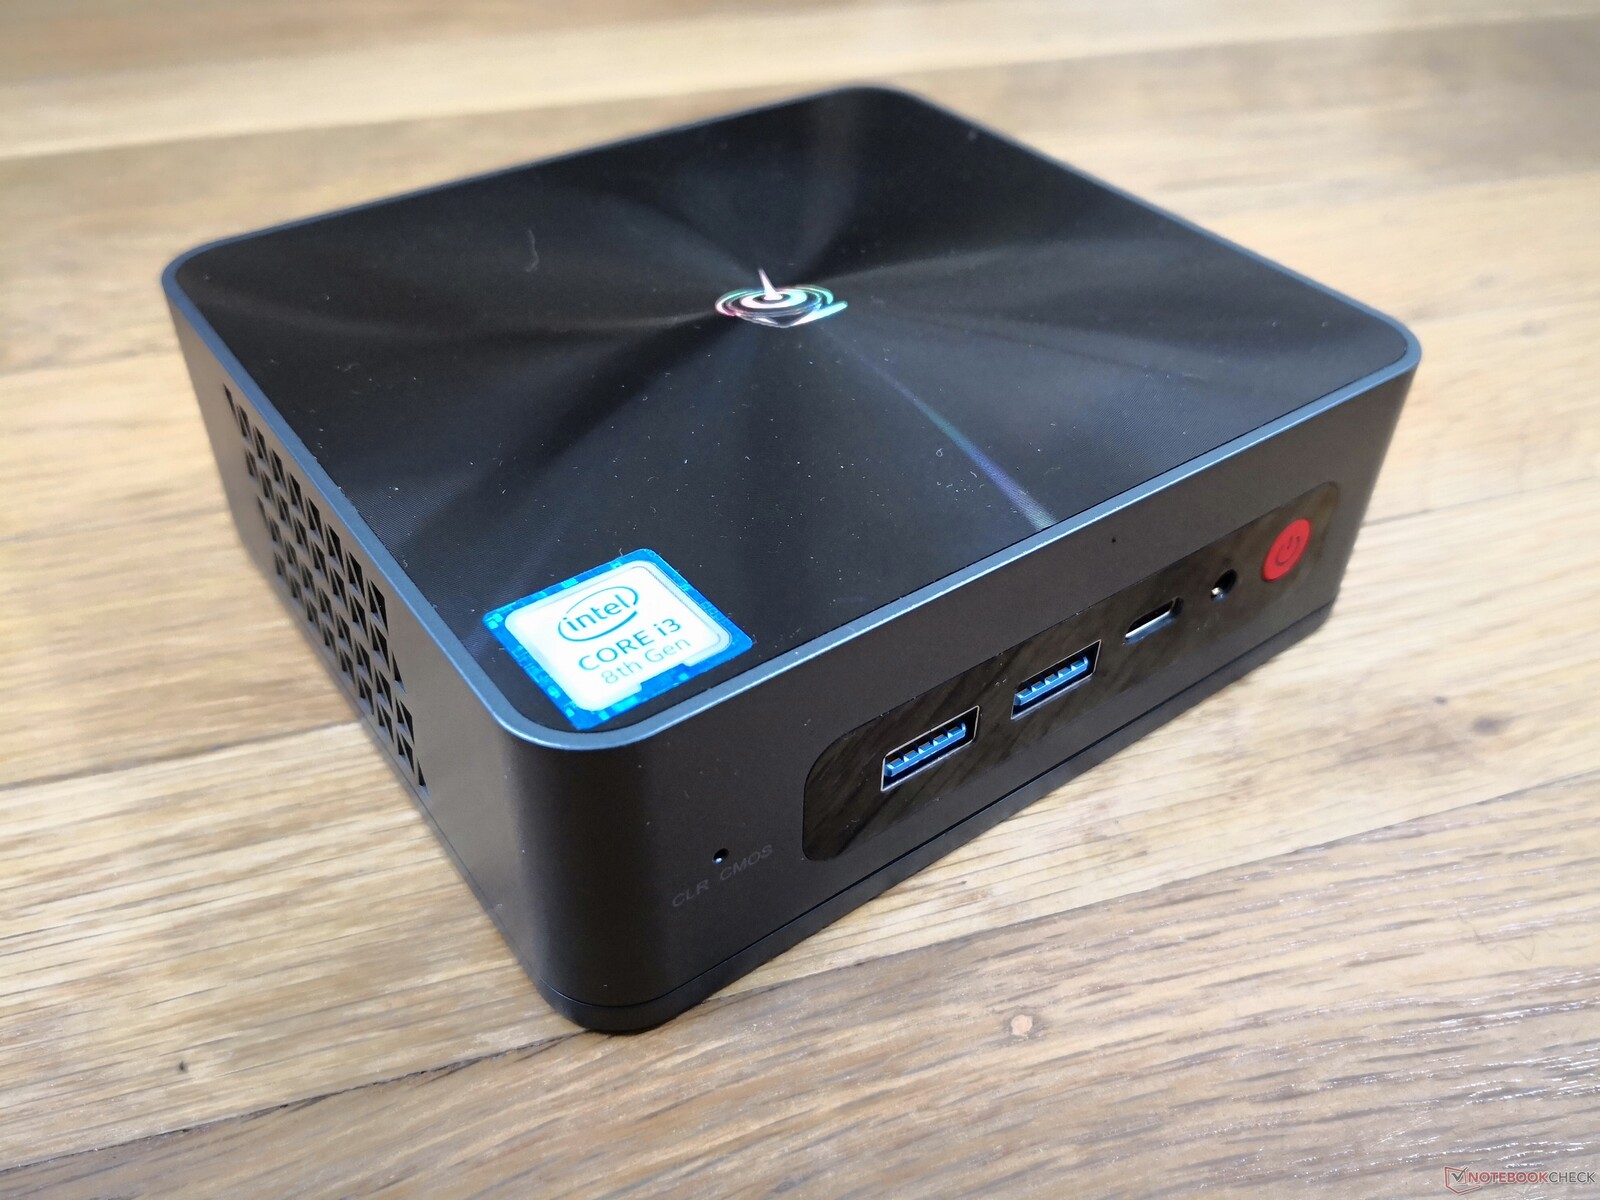
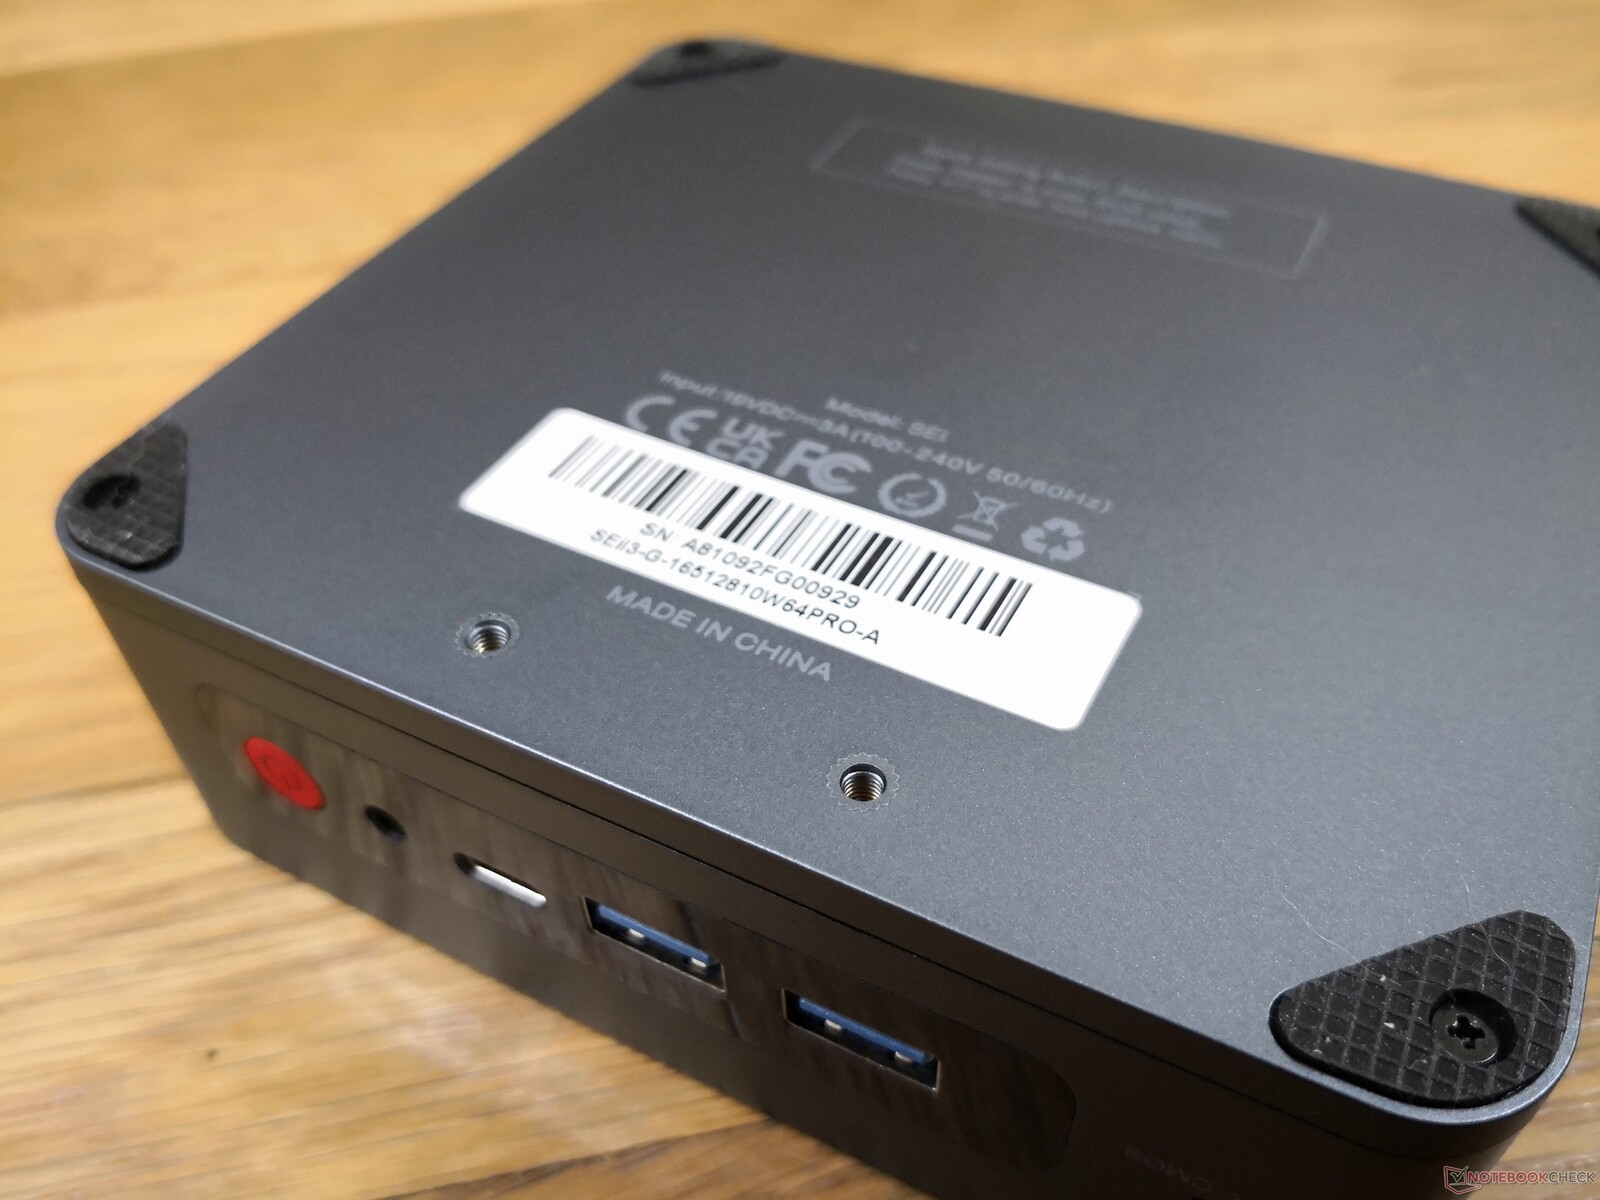
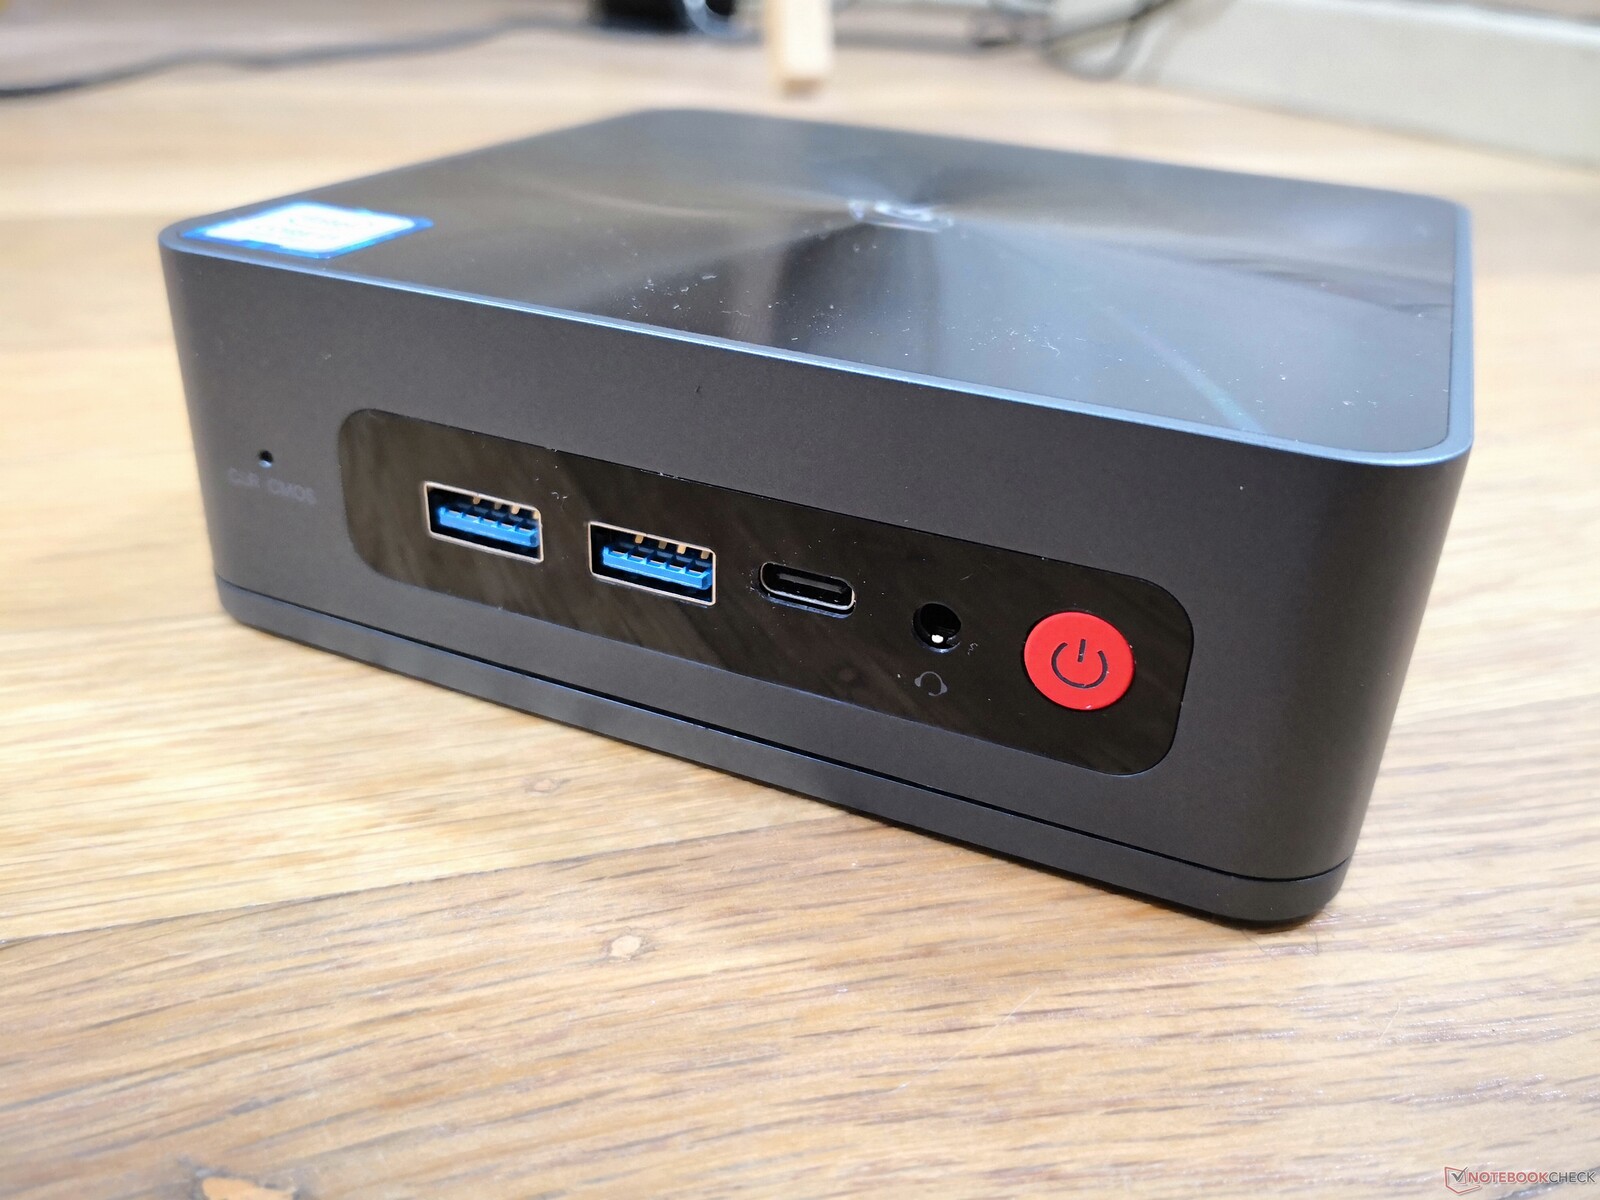
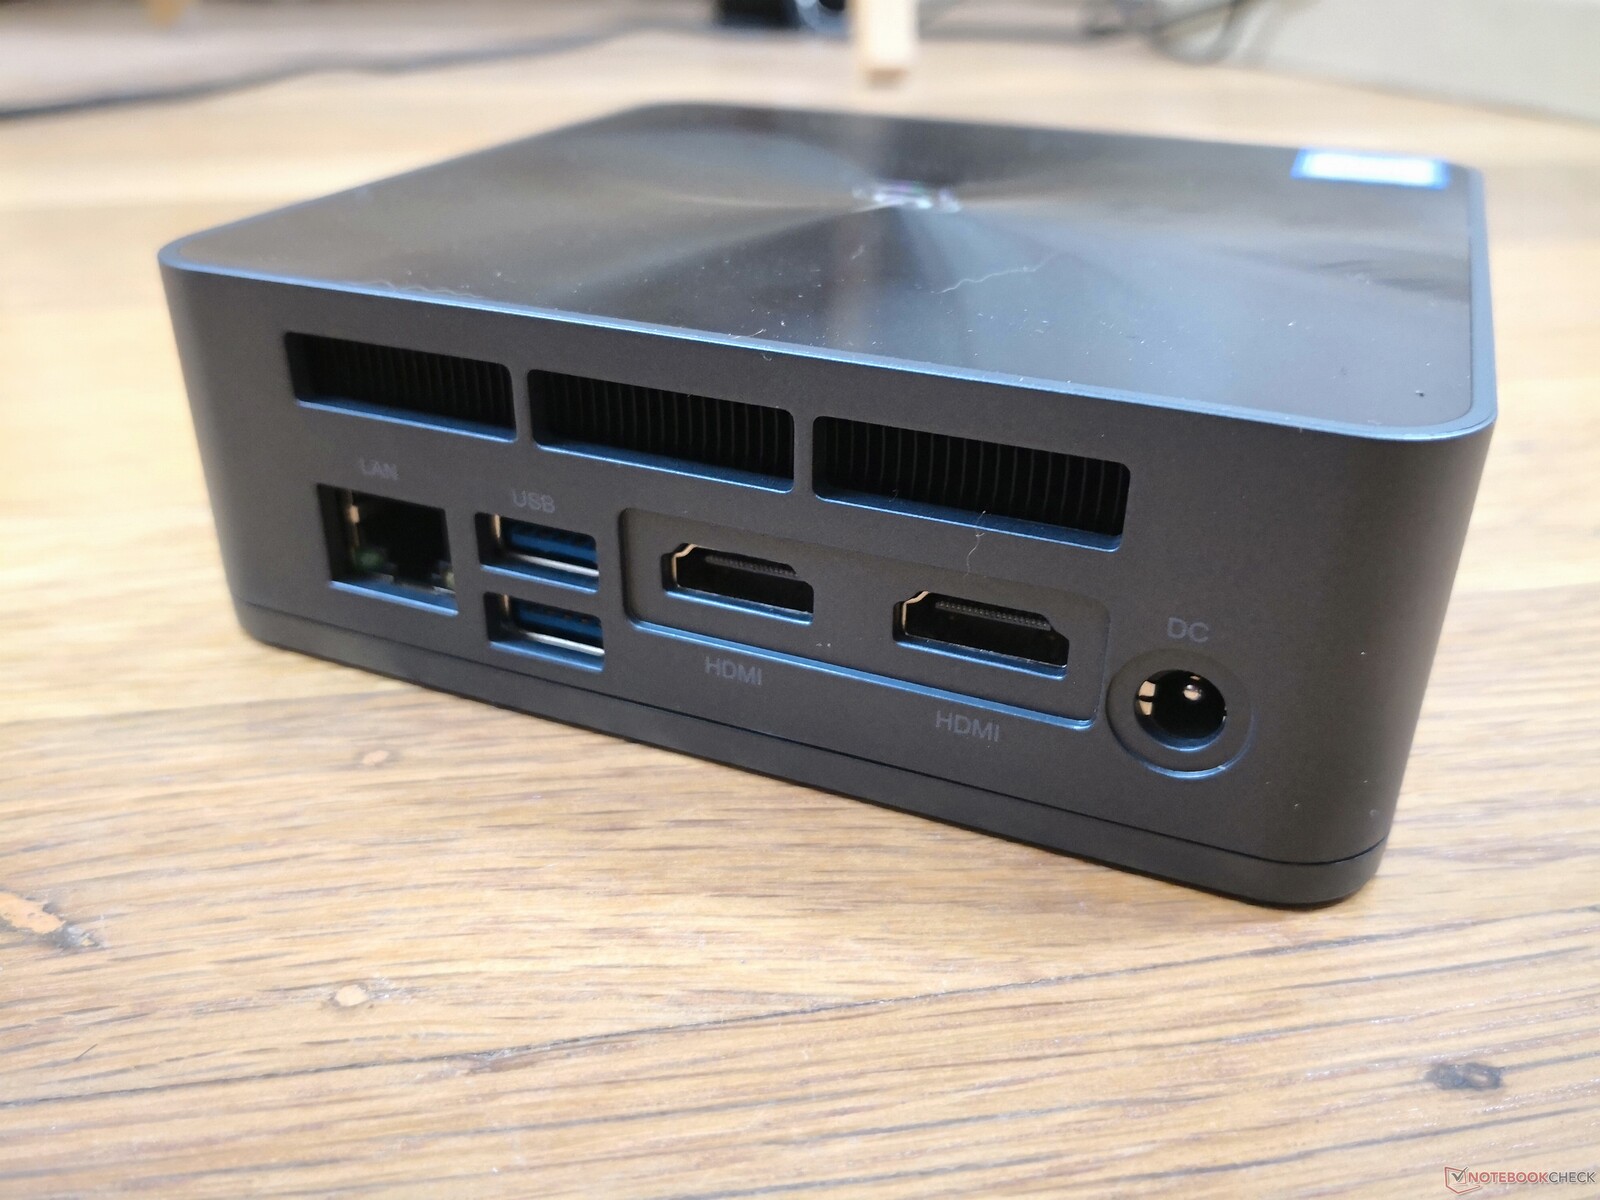
Conectividade
As opções de porta são idênticas às do SEi10, exceto que o Thunderbolt não é suportado e que não há mais um leitor de cartões SD integrado. Podemos confirmar que a porta USB-C ainda suporta DisplayPort, mas não pode ser usada para alimentar o mini PC, ao contrário do SER4.
Comunicação
Módulos embutidos de comunicação com e sem fio, comparação de dados de teste de rede com a concorrência, soluções alternativas disponíveis (5G/LTE)?, Irregularidades (recepção de rádio)?
| Networking | |
| iperf3 transmit AX12 | |
| Intel NUC11TNKi5 | |
| Beelink SER4 | |
| Beelink SEi10 | |
| Intel NUC8i7BE | |
| GMK NucBox 2 | |
| Beelink SEi8 | |
| iperf3 receive AX12 | |
| Intel NUC11TNKi5 | |
| Beelink SEi10 | |
| Beelink SER4 | |
| GMK NucBox 2 | |
| Intel NUC8i7BE | |
| Beelink SEi8 | |
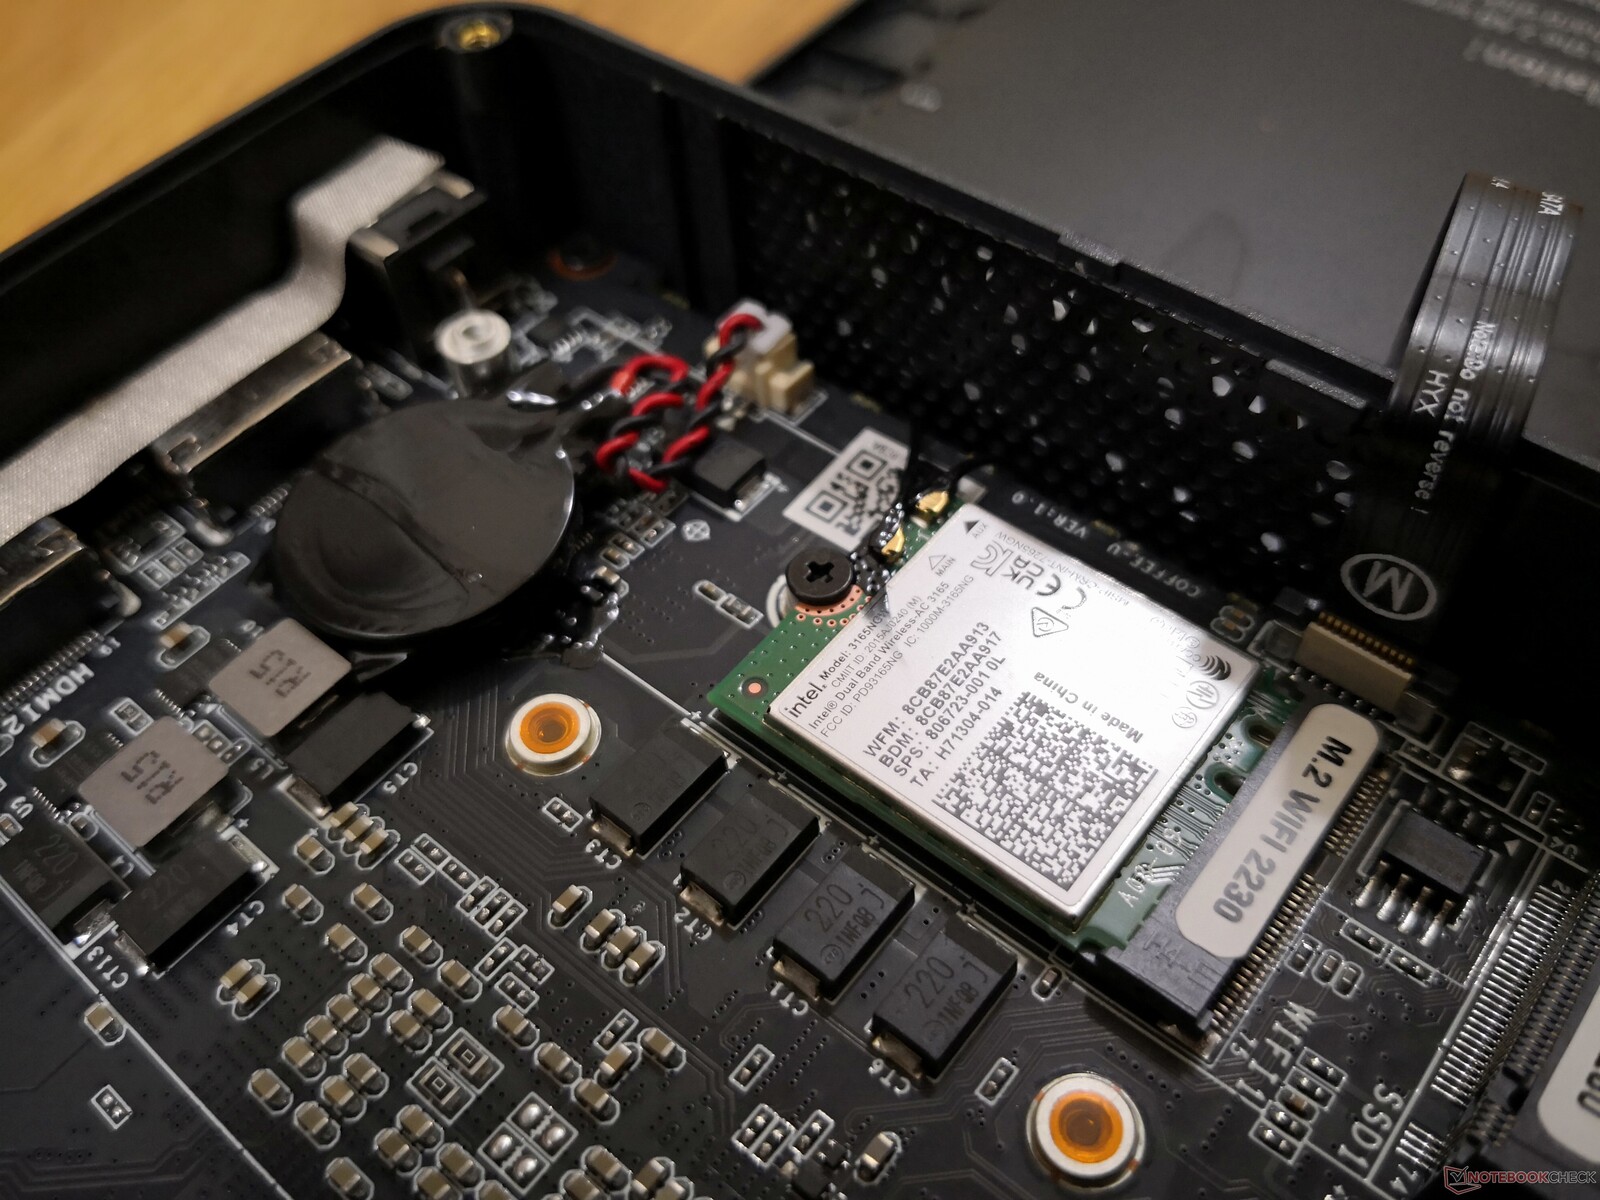
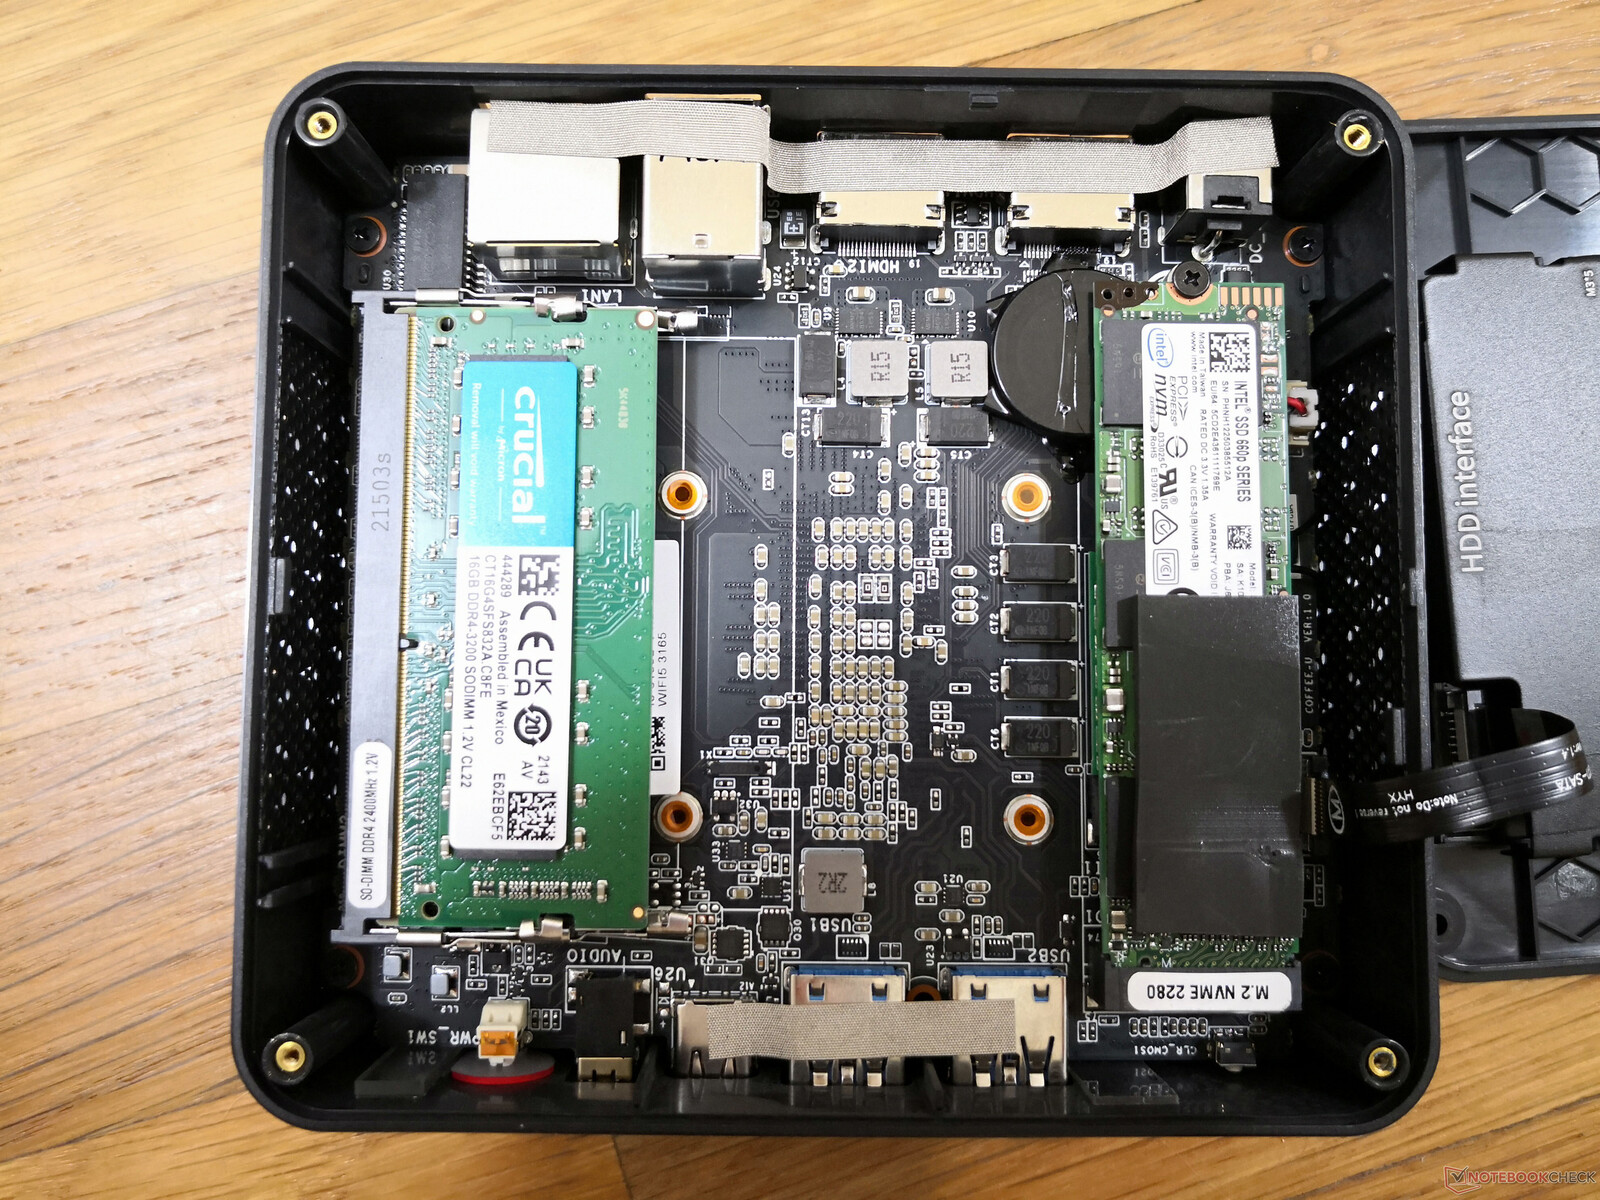
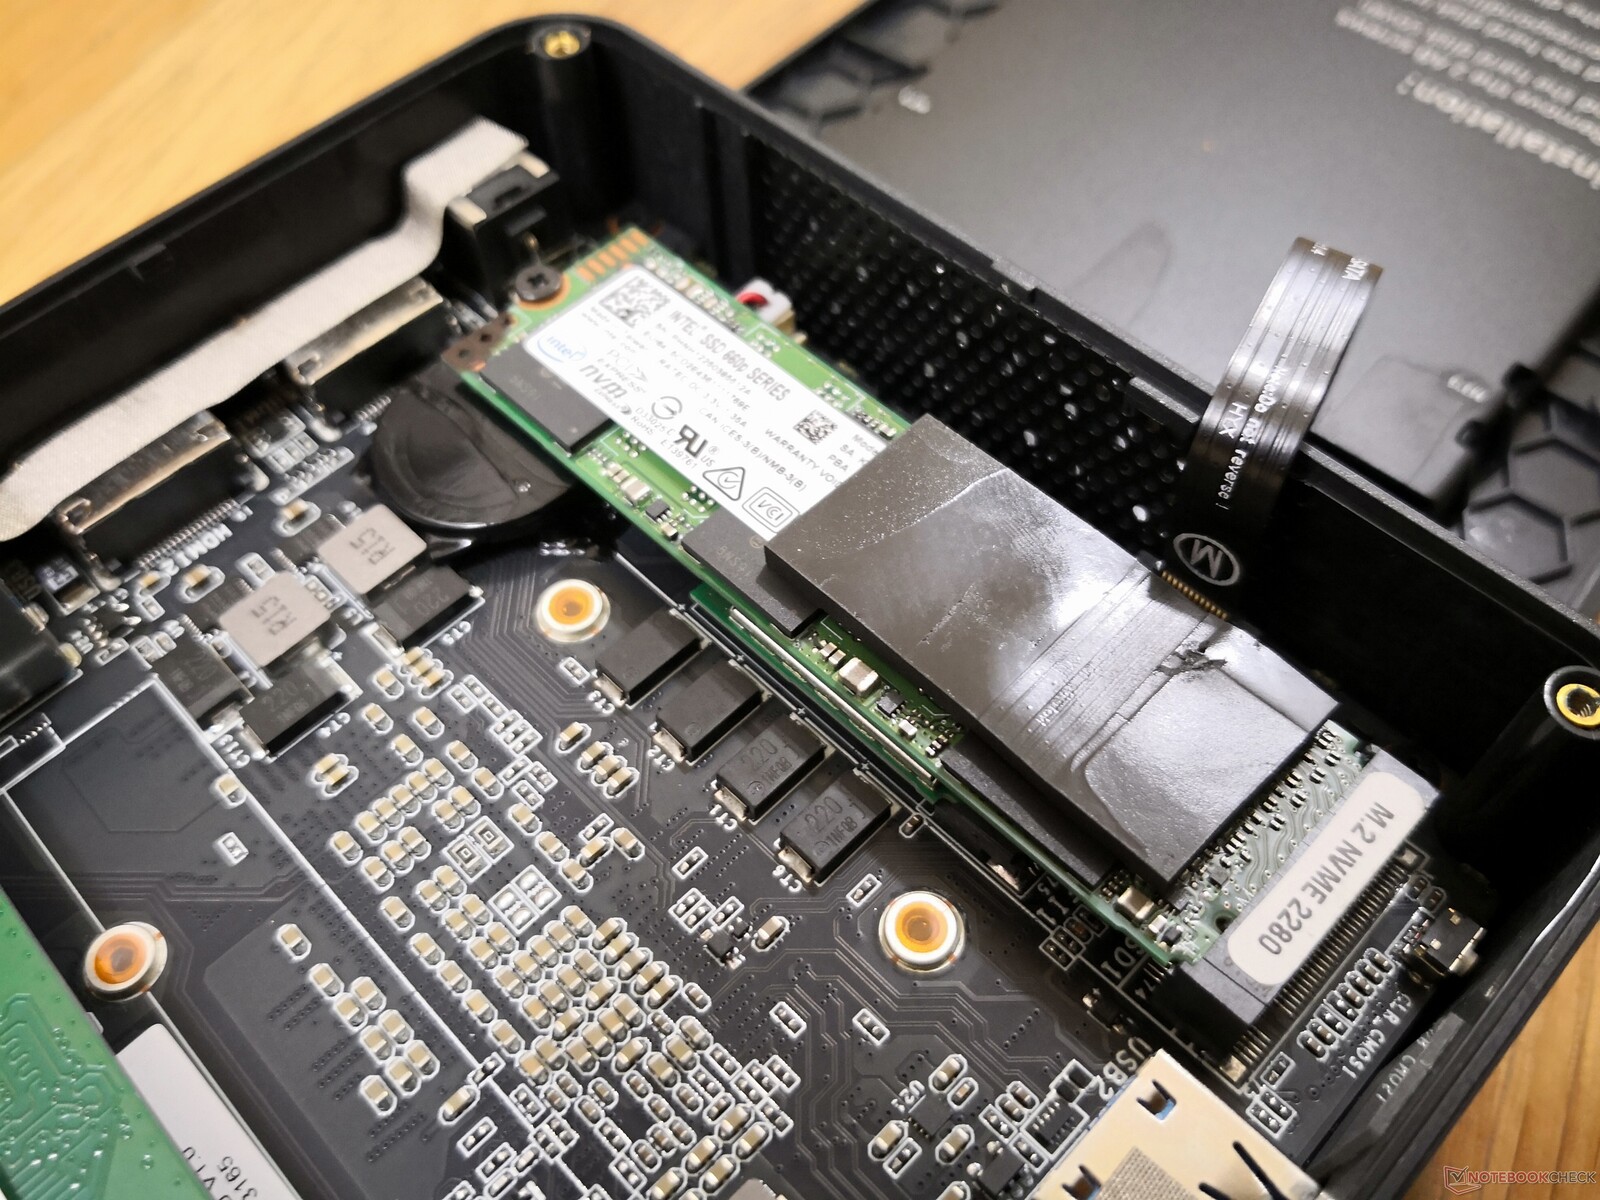
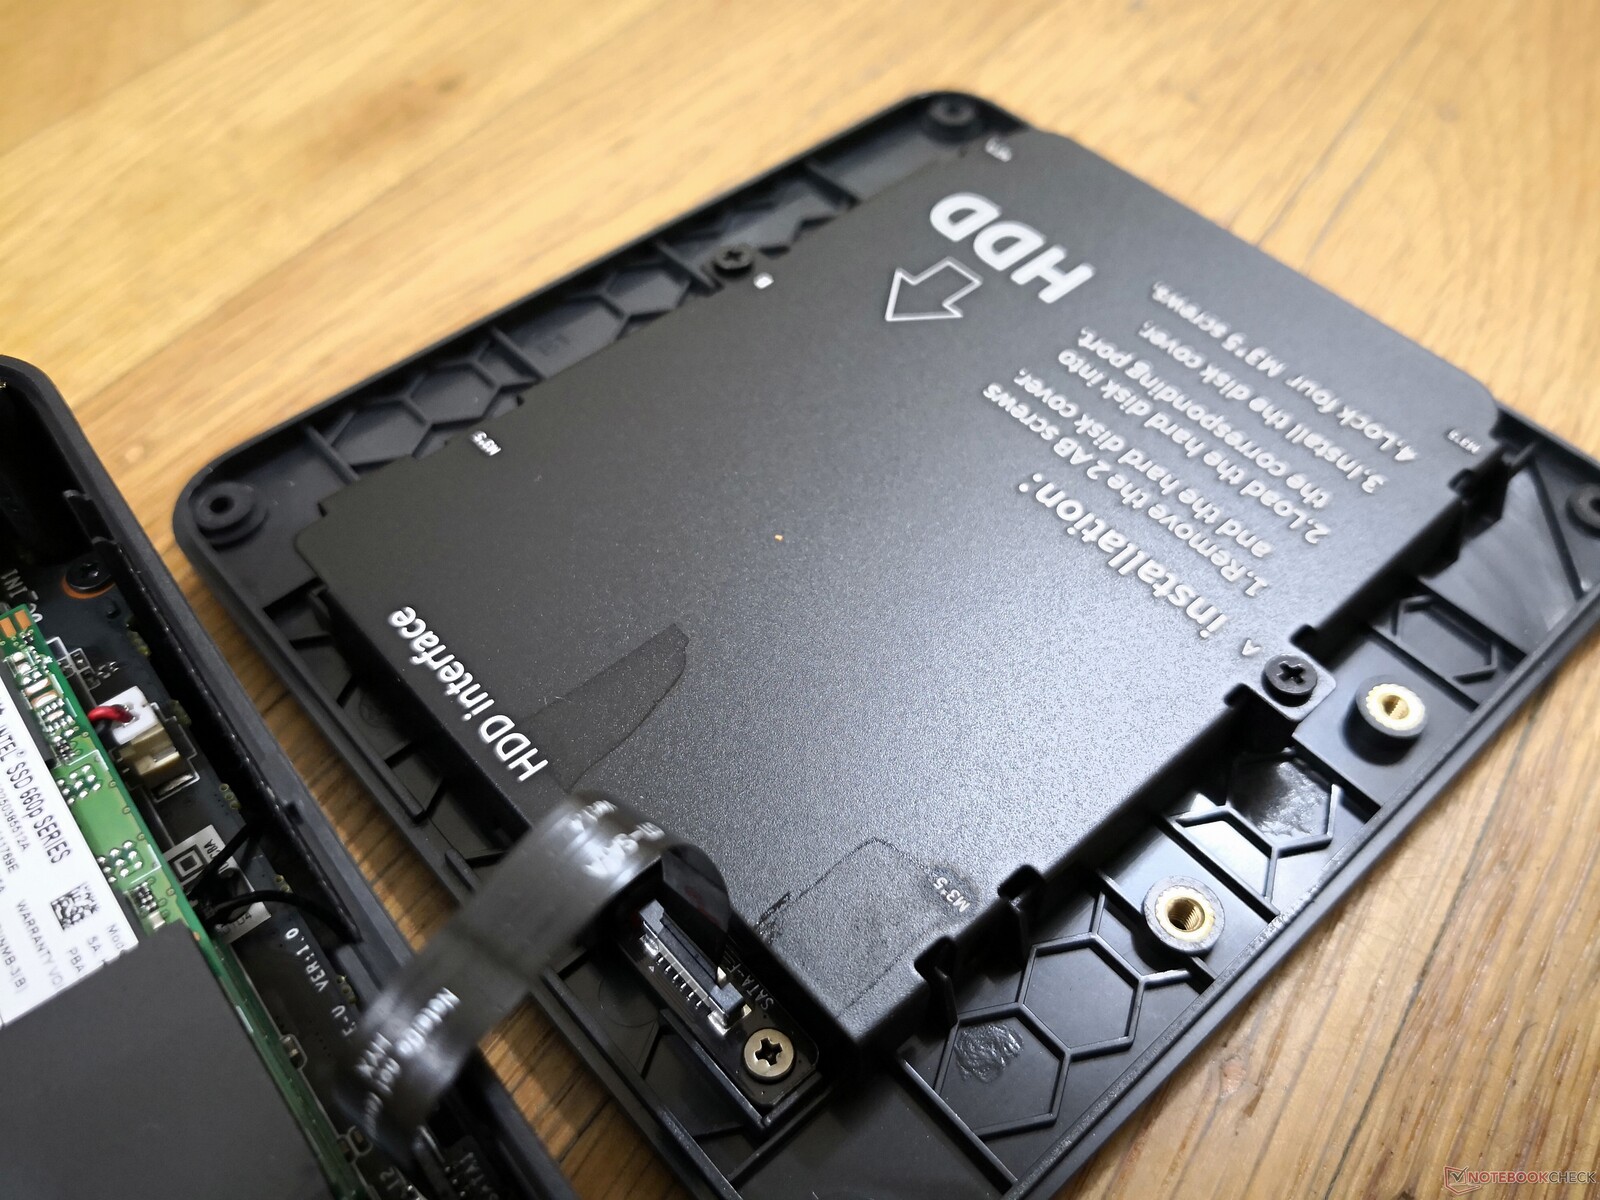
Manutenção
A placa-mãe no SEi8 é ligeiramente diferente da placa-mãe no SEi10. O slot M.2 SSD, por exemplo, está agora voltado para a direção oposta, enquanto a bateria da BIOS está agora mais facilmente acessível.
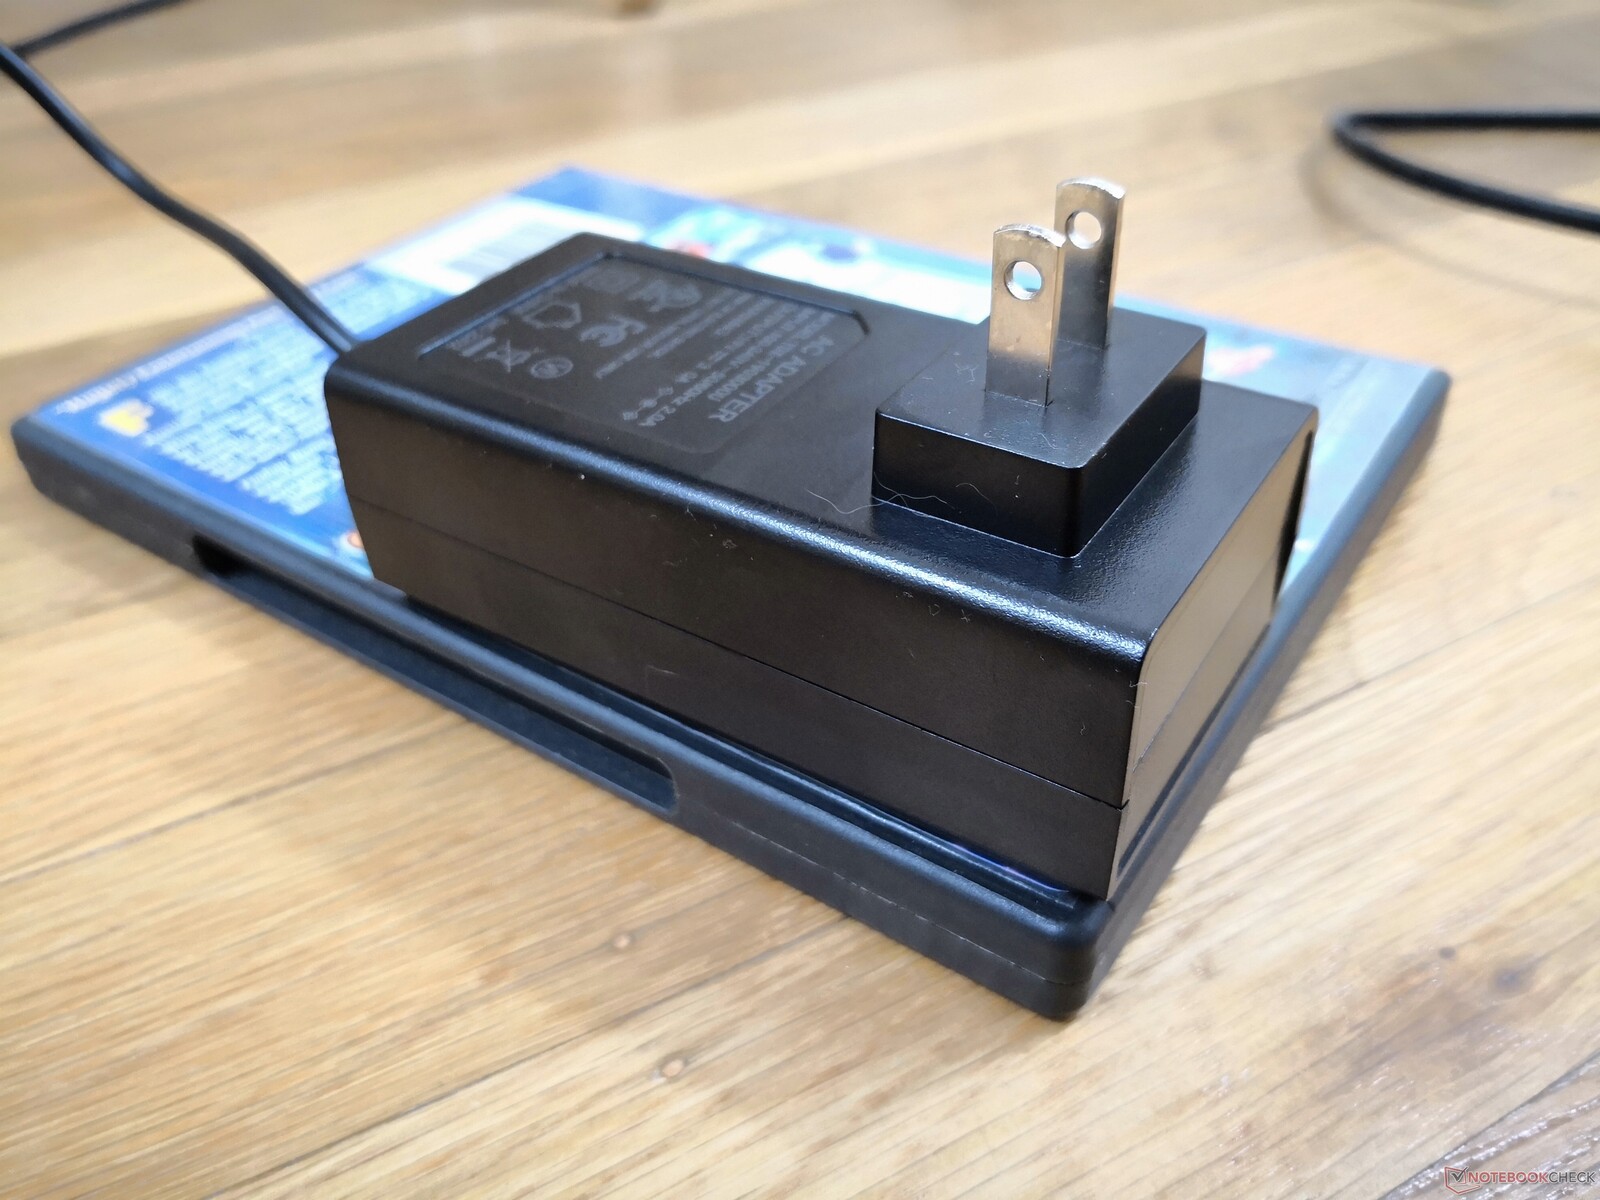
Acessórios e Garantia
A caixa de varejo inclui parafusos adicionais, manual, e um suporte VESA removível. Reclamar a garantia pode ser difícil, pois pode envolver o envio para o exterior. Apenas uma garantia básica de um ano é fornecida ao contrário dos três anos na maioria dos NUCs da Intel.
Desempenho
Condições de teste
Nossa unidade foi configurada para o modo Windows Performance antes de executar quaisquer benchmarks abaixo.
Processador
O desempenho bruto da CPU fica entre a série Celeron e Atom e a série Core i5 U mais avançada. Talvez mais notadamente, é visivelmente mais rápido do que os concorrentes Ryzen 3 3200U e resfriado passivamente Núcleo i3-10100Y como encontrado no Microsoft Surface Go 3. O processador Surface Go 3 foi altamente criticado por seu desempenho de slow-as-molasses em relação ao Surface Pro
A Beelink oferece o SEi8 com Núcleo i5-8279U como uma atualização que proporcionaria um desempenho de uma única linha cerca de 20% mais rápido e mais de 2x o desempenho de múltiplas linhas sobre nosso Core i3-8109U.
Cinebench R15 Multi Loop
Cinebench R23: Multi Core | Single Core
Cinebench R15: CPU Multi 64Bit | CPU Single 64Bit
Blender: v2.79 BMW27 CPU
7-Zip 18.03: 7z b 4 | 7z b 4 -mmt1
Geekbench 5.5: Multi-Core | Single-Core
HWBOT x265 Benchmark v2.2: 4k Preset
LibreOffice : 20 Documents To PDF
R Benchmark 2.5: Overall mean
| Cinebench R20 / CPU (Multi Core) | |
| Beelink SER4 | |
| Intel NUC11TNKi5 | |
| Apple MacBook Pro 13 2019 i5 4TB3 | |
| Intel NUC8i7BE | |
| Acer Swift 3 SF314-42-R27B | |
| GMK NucBox 2 | |
| Beelink SEi10 | |
| Beelink U59 | |
| Beelink SEi8 | |
| Média Intel Core i3-8109U (n=1) | |
| Microsoft Surface Go 3 Core i3 | |
| HP 255 G7 159P1EA | |
| GMK NucBox 3 | |
| Chuwi LapBook Plus | |
| Teclast Tbook 16 Power | |
| Cinebench R20 / CPU (Single Core) | |
| Intel NUC11TNKi5 | |
| Beelink SER4 | |
| Intel NUC8i7BE | |
| Acer Swift 3 SF314-42-R27B | |
| Apple MacBook Pro 13 2019 i5 4TB3 | |
| Beelink SEi10 | |
| GMK NucBox 2 | |
| Beelink SEi8 | |
| Média Intel Core i3-8109U (n=1) | |
| Microsoft Surface Go 3 Core i3 | |
| HP 255 G7 159P1EA | |
| Beelink U59 | |
| GMK NucBox 3 | |
| Chuwi LapBook Plus | |
| Teclast Tbook 16 Power | |
| Cinebench R23 / Multi Core | |
| Beelink SER4 | |
| Intel NUC11TNKi5 | |
| GMK NucBox 2 | |
| Beelink U59 | |
| Beelink SEi8 | |
| Média Intel Core i3-8109U (n=1) | |
| HP 255 G7 159P1EA | |
| Microsoft Surface Go 3 Core i3 | |
| GMK NucBox 3 | |
| Teclast Tbook 16 Power | |
| Cinebench R23 / Single Core | |
| Intel NUC11TNKi5 | |
| Beelink SER4 | |
| GMK NucBox 2 | |
| Beelink SEi8 | |
| Média Intel Core i3-8109U (n=1) | |
| Microsoft Surface Go 3 Core i3 | |
| HP 255 G7 159P1EA | |
| Beelink U59 | |
| GMK NucBox 3 | |
| Teclast Tbook 16 Power | |
| Cinebench R15 / CPU Multi 64Bit | |
| Beelink SER4 | |
| Intel NUC8i7BE | |
| Intel NUC11TNKi5 | |
| Apple MacBook Pro 13 2019 i5 4TB3 | |
| Apple MacBook Pro 13 2019 i5 4TB3 | |
| GMK NucBox 2 | |
| Acer Swift 3 SF314-42-R27B | |
| Beelink SEi10 | |
| Beelink U59 | |
| HP 255 G7 159P1EA | |
| Média Intel Core i3-8109U (324 - 381, n=2) | |
| Beelink SEi8 | |
| Microsoft Surface Go 3 Core i3 | |
| GMK NucBox 3 | |
| Teclast Tbook 16 Power | |
| Chuwi LapBook Plus | |
| Cinebench R15 / CPU Single 64Bit | |
| Intel NUC11TNKi5 | |
| Intel NUC8i7BE | |
| Beelink SER4 | |
| Apple MacBook Pro 13 2019 i5 4TB3 | |
| Apple MacBook Pro 13 2019 i5 4TB3 | |
| Acer Swift 3 SF314-42-R27B | |
| Beelink SEi10 | |
| GMK NucBox 2 | |
| Média Intel Core i3-8109U (124.3 - 153, n=2) | |
| HP 255 G7 159P1EA | |
| Beelink SEi8 | |
| Microsoft Surface Go 3 Core i3 | |
| Beelink U59 | |
| GMK NucBox 3 | |
| Chuwi LapBook Plus | |
| Teclast Tbook 16 Power | |
| Blender / v2.79 BMW27 CPU | |
| Teclast Tbook 16 Power | |
| Chuwi LapBook Plus | |
| GMK NucBox 3 | |
| Microsoft Surface Go 3 Core i3 | |
| Beelink U59 | |
| HP 255 G7 159P1EA | |
| Beelink SEi8 | |
| Média Intel Core i3-8109U (n=1) | |
| Beelink SEi10 | |
| Acer Swift 3 SF314-42-R27B | |
| GMK NucBox 2 | |
| Intel NUC8i7BE | |
| Intel NUC8i7BE | |
| Apple MacBook Pro 13 2019 i5 4TB3 | |
| Intel NUC11TNKi5 | |
| Beelink SER4 | |
| 7-Zip 18.03 / 7z b 4 | |
| Beelink SER4 | |
| Intel NUC8i7BE | |
| Intel NUC8i7BE | |
| Intel NUC11TNKi5 | |
| Apple MacBook Pro 13 2019 i5 4TB3 | |
| GMK NucBox 2 | |
| Acer Swift 3 SF314-42-R27B | |
| Beelink U59 | |
| Beelink SEi10 | |
| Beelink SEi8 | |
| Média Intel Core i3-8109U (n=1) | |
| HP 255 G7 159P1EA | |
| Microsoft Surface Go 3 Core i3 | |
| GMK NucBox 3 | |
| Chuwi LapBook Plus | |
| 7-Zip 18.03 / 7z b 4 -mmt1 | |
| Intel NUC8i7BE | |
| Intel NUC8i7BE | |
| Intel NUC11TNKi5 | |
| Beelink SER4 | |
| Apple MacBook Pro 13 2019 i5 4TB3 | |
| Beelink SEi10 | |
| Acer Swift 3 SF314-42-R27B | |
| GMK NucBox 2 | |
| Beelink SEi8 | |
| Média Intel Core i3-8109U (n=1) | |
| Microsoft Surface Go 3 Core i3 | |
| HP 255 G7 159P1EA | |
| Beelink U59 | |
| GMK NucBox 3 | |
| Chuwi LapBook Plus | |
| Geekbench 5.5 / Multi-Core | |
| Beelink SER4 | |
| Intel NUC11TNKi5 | |
| Intel NUC8i7BE | |
| GMK NucBox 2 | |
| Acer Swift 3 SF314-42-R27B | |
| Beelink SEi10 | |
| Microsoft Surface Go 3 Core i3 | |
| Beelink SEi8 | |
| Média Intel Core i3-8109U (n=1) | |
| HP 255 G7 159P1EA | |
| GMK NucBox 3 | |
| Teclast Tbook 16 Power | |
| Geekbench 5.5 / Single-Core | |
| Intel NUC11TNKi5 | |
| Beelink SER4 | |
| Beelink SEi10 | |
| Acer Swift 3 SF314-42-R27B | |
| Microsoft Surface Go 3 Core i3 | |
| GMK NucBox 2 | |
| Beelink SEi8 | |
| Média Intel Core i3-8109U (n=1) | |
| HP 255 G7 159P1EA | |
| Intel NUC8i7BE | |
| GMK NucBox 3 | |
| Teclast Tbook 16 Power | |
| HWBOT x265 Benchmark v2.2 / 4k Preset | |
| Beelink SER4 | |
| Intel NUC11TNKi5 | |
| Apple MacBook Pro 13 2019 i5 4TB3 | |
| Intel NUC8i7BE | |
| Intel NUC8i7BE | |
| GMK NucBox 2 | |
| Acer Swift 3 SF314-42-R27B | |
| Beelink SEi10 | |
| Beelink SEi8 | |
| Média Intel Core i3-8109U (n=1) | |
| Beelink U59 | |
| Microsoft Surface Go 3 Core i3 | |
| HP 255 G7 159P1EA | |
| GMK NucBox 3 | |
| Chuwi LapBook Plus | |
| Teclast Tbook 16 Power | |
| LibreOffice / 20 Documents To PDF | |
| Teclast Tbook 16 Power | |
| GMK NucBox 3 | |
| Microsoft Surface Go 3 Core i3 | |
| Beelink U59 | |
| HP 255 G7 159P1EA | |
| Beelink SEi8 | |
| Média Intel Core i3-8109U (n=1) | |
| GMK NucBox 2 | |
| Beelink SER4 | |
| Acer Swift 3 SF314-42-R27B | |
| Beelink SEi10 | |
| Intel NUC11TNKi5 | |
| R Benchmark 2.5 / Overall mean | |
| Teclast Tbook 16 Power | |
| GMK NucBox 3 | |
| Beelink U59 | |
| Microsoft Surface Go 3 Core i3 | |
| Beelink SEi8 | |
| Média Intel Core i3-8109U (n=1) | |
| HP 255 G7 159P1EA | |
| GMK NucBox 2 | |
| Beelink SEi10 | |
| Acer Swift 3 SF314-42-R27B | |
| Intel NUC8i7BE | |
| Intel NUC11TNKi5 | |
| Beelink SER4 | |
Cinebench R23: Multi Core | Single Core
Cinebench R15: CPU Multi 64Bit | CPU Single 64Bit
Blender: v2.79 BMW27 CPU
7-Zip 18.03: 7z b 4 | 7z b 4 -mmt1
Geekbench 5.5: Multi-Core | Single-Core
HWBOT x265 Benchmark v2.2: 4k Preset
LibreOffice : 20 Documents To PDF
R Benchmark 2.5: Overall mean
* ... menor é melhor
AIDA64: FP32 Ray-Trace | FPU Julia | CPU SHA3 | CPU Queen | FPU SinJulia | FPU Mandel | CPU AES | CPU ZLib | FP64 Ray-Trace | CPU PhotoWorxx
| Performance rating | |
| Beelink SER4 | |
| Intel NUC11TNKi5 | |
| Intel NUC8i7BE -1! | |
| GMK NucBox 2 | |
| Beelink SEi8 | |
| AIDA64 / FP32 Ray-Trace | |
| Beelink SER4 | |
| Intel NUC11TNKi5 | |
| Intel NUC8i7BE | |
| GMK NucBox 2 | |
| Beelink SEi8 | |
| AIDA64 / FPU Julia | |
| Beelink SER4 | |
| Intel NUC11TNKi5 | |
| Intel NUC8i7BE | |
| GMK NucBox 2 | |
| Beelink SEi8 | |
| AIDA64 / CPU SHA3 | |
| Intel NUC11TNKi5 | |
| Beelink SER4 | |
| GMK NucBox 2 | |
| Beelink SEi8 | |
| AIDA64 / CPU Queen | |
| Beelink SER4 | |
| Intel NUC8i7BE | |
| Intel NUC11TNKi5 | |
| GMK NucBox 2 | |
| Beelink SEi8 | |
| AIDA64 / FPU SinJulia | |
| Beelink SER4 | |
| Intel NUC8i7BE | |
| Intel NUC11TNKi5 | |
| GMK NucBox 2 | |
| Beelink SEi8 | |
| AIDA64 / FPU Mandel | |
| Beelink SER4 | |
| Intel NUC11TNKi5 | |
| Intel NUC8i7BE | |
| GMK NucBox 2 | |
| Beelink SEi8 | |
| AIDA64 / CPU AES | |
| Intel NUC11TNKi5 | |
| Beelink SER4 | |
| Intel NUC8i7BE | |
| GMK NucBox 2 | |
| Beelink SEi8 | |
| AIDA64 / CPU ZLib | |
| Beelink SER4 | |
| Intel NUC11TNKi5 | |
| Intel NUC8i7BE | |
| GMK NucBox 2 | |
| Beelink SEi8 | |
| AIDA64 / FP64 Ray-Trace | |
| Beelink SER4 | |
| Intel NUC11TNKi5 | |
| Intel NUC8i7BE | |
| GMK NucBox 2 | |
| Beelink SEi8 | |
| AIDA64 / CPU PhotoWorxx | |
| Beelink SER4 | |
| Intel NUC8i7BE | |
| Intel NUC11TNKi5 | |
| Beelink SEi8 | |
| GMK NucBox 2 | |
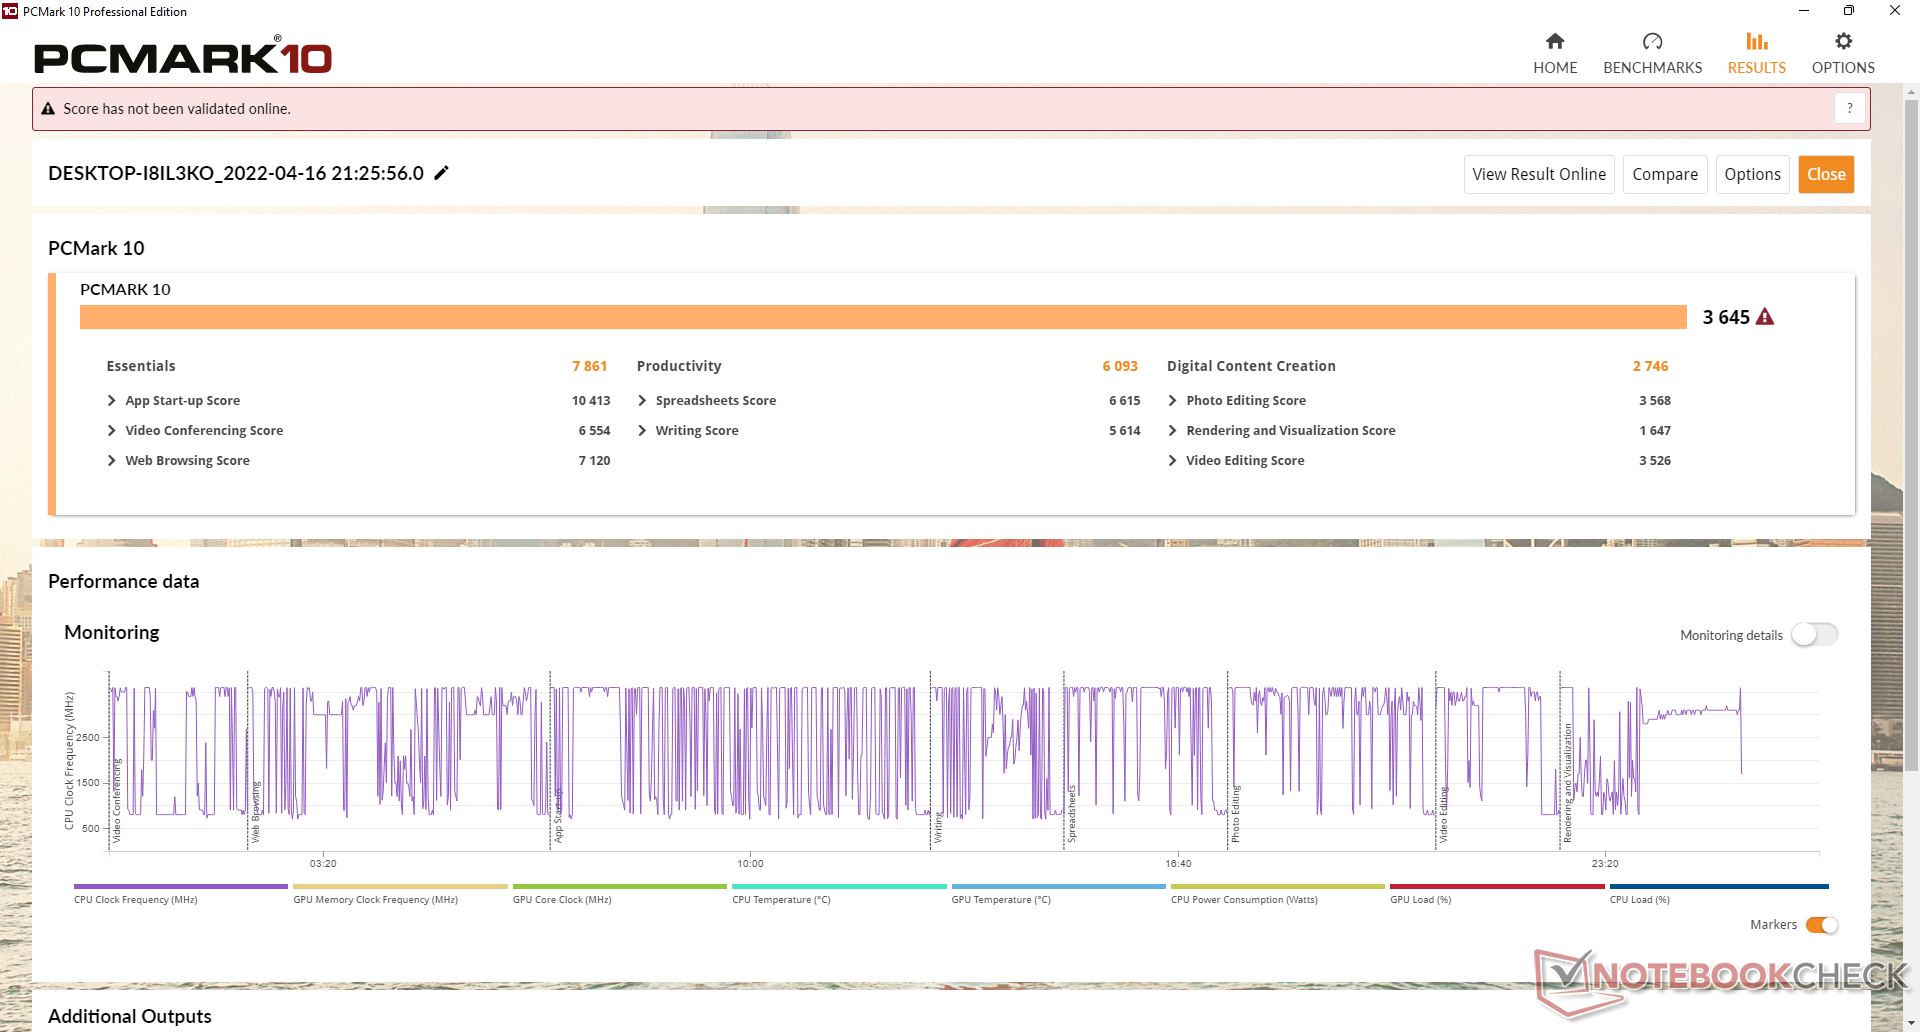
Desempenho do sistema
Os resultados da PCMark estão ligeiramente à frente do SEi10 provavelmente devido à integração mais rápida dos gráficos Iris de nosso SEi8. Não tivemos nenhum problema rodando Windows 11 Pro em nossa unidade de teste, além da ocasional desaceleração ao lançar aplicações ou durante o multitarefa moderado.
| PCMark 10 / Score | |
| Beelink SER4 | |
| Intel NUC8i7BE | |
| Intel NUC11TNKi5 | |
| GMK NucBox 2 | |
| Beelink SEi8 | |
| Beelink SEi10 | |
| PCMark 10 / Essentials | |
| Beelink SER4 | |
| Intel NUC11TNKi5 | |
| Intel NUC8i7BE | |
| GMK NucBox 2 | |
| Beelink SEi8 | |
| Beelink SEi10 | |
| PCMark 10 / Productivity | |
| Beelink SER4 | |
| Intel NUC8i7BE | |
| GMK NucBox 2 | |
| Intel NUC11TNKi5 | |
| Beelink SEi8 | |
| Beelink SEi10 | |
| PCMark 10 / Digital Content Creation | |
| Beelink SER4 | |
| Intel NUC11TNKi5 | |
| Intel NUC8i7BE | |
| GMK NucBox 2 | |
| Beelink SEi8 | |
| Beelink SEi10 | |
| PCMark 10 Score | 3645 pontos | |
Ajuda | ||
| AIDA64 / Memory Copy | |
| Intel NUC8i7BE | |
| GMK NucBox 2 | |
| Beelink SER4 | |
| Beelink SEi8 | |
| Intel NUC11TNKi5 | |
| AIDA64 / Memory Read | |
| Intel NUC8i7BE | |
| Beelink SER4 | |
| GMK NucBox 2 | |
| Beelink SEi8 | |
| Intel NUC11TNKi5 | |
| AIDA64 / Memory Write | |
| Intel NUC8i7BE | |
| GMK NucBox 2 | |
| Beelink SER4 | |
| Intel NUC11TNKi5 | |
| Beelink SEi8 | |
| AIDA64 / Memory Latency | |
| Beelink SER4 | |
| Intel NUC11TNKi5 | |
| Beelink SEi8 | |
| GMK NucBox 2 | |
| Intel NUC8i7BE | |
* ... menor é melhor
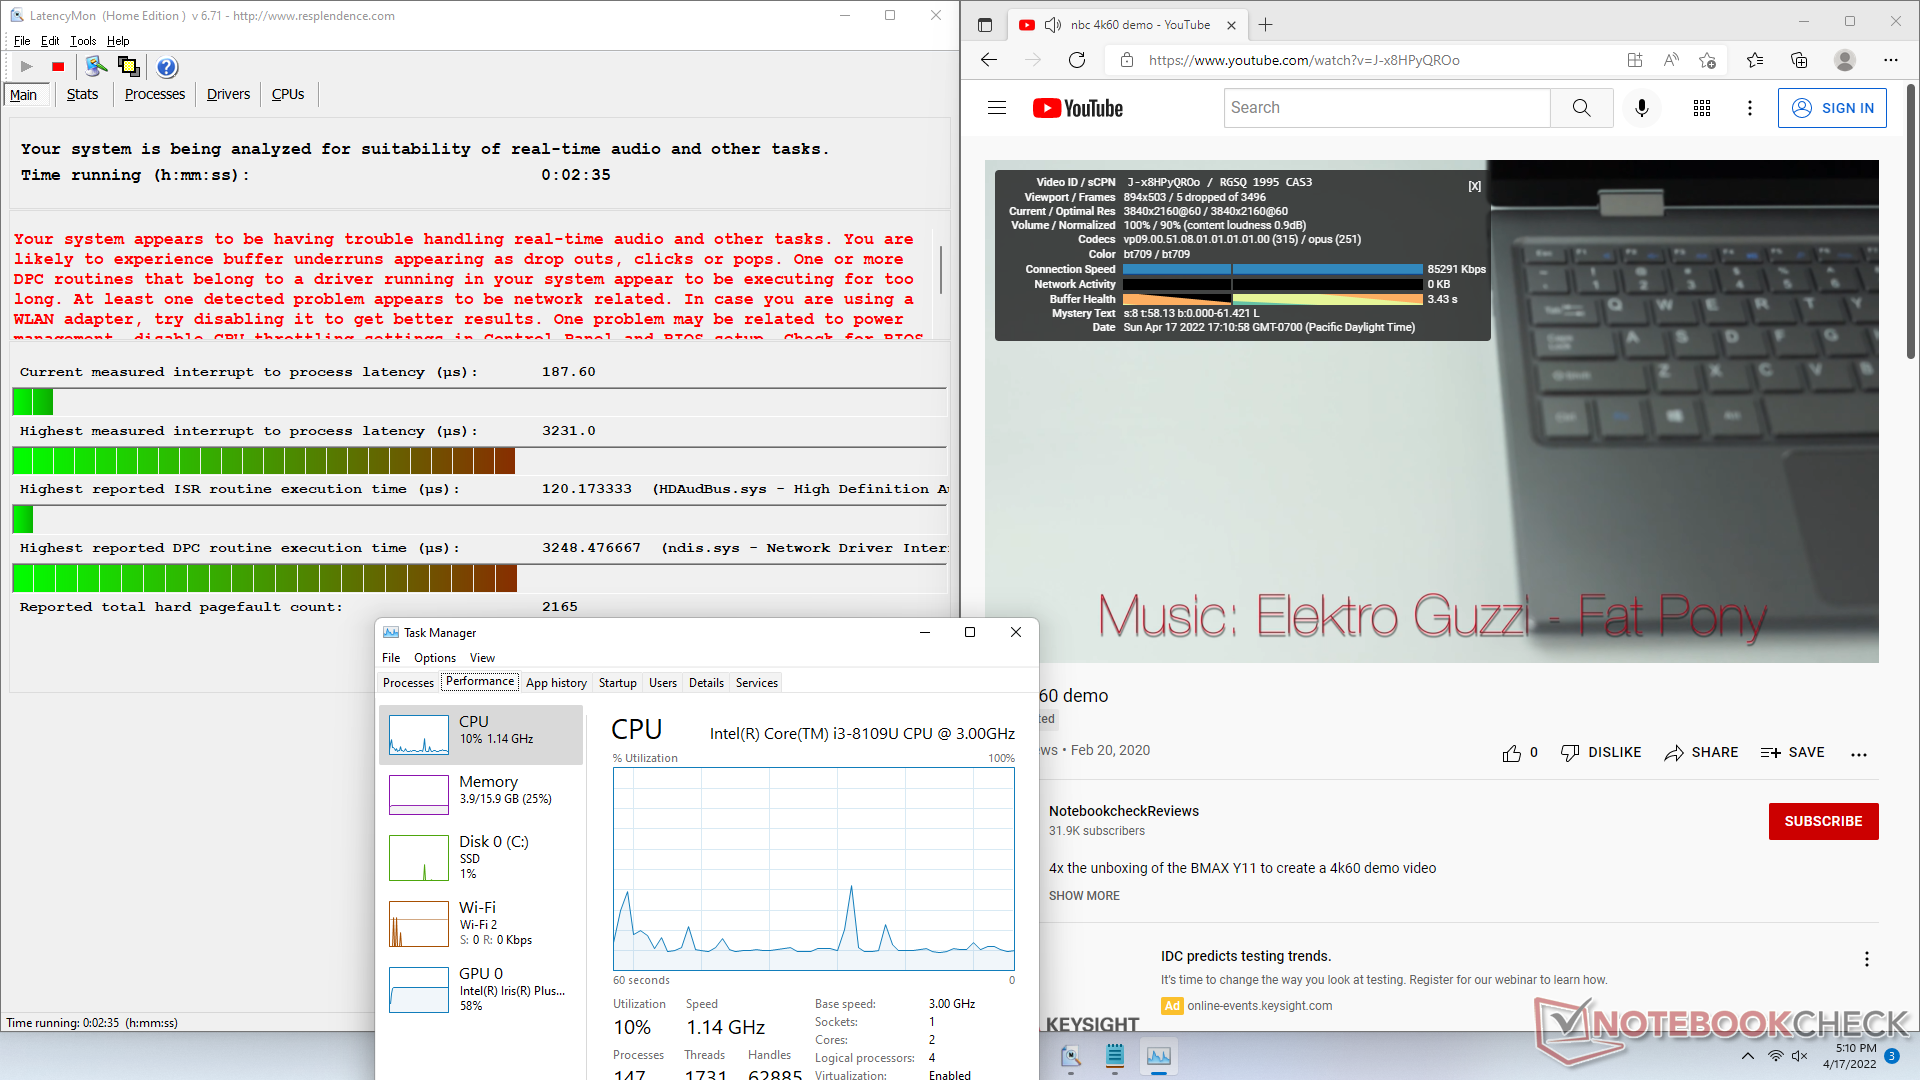
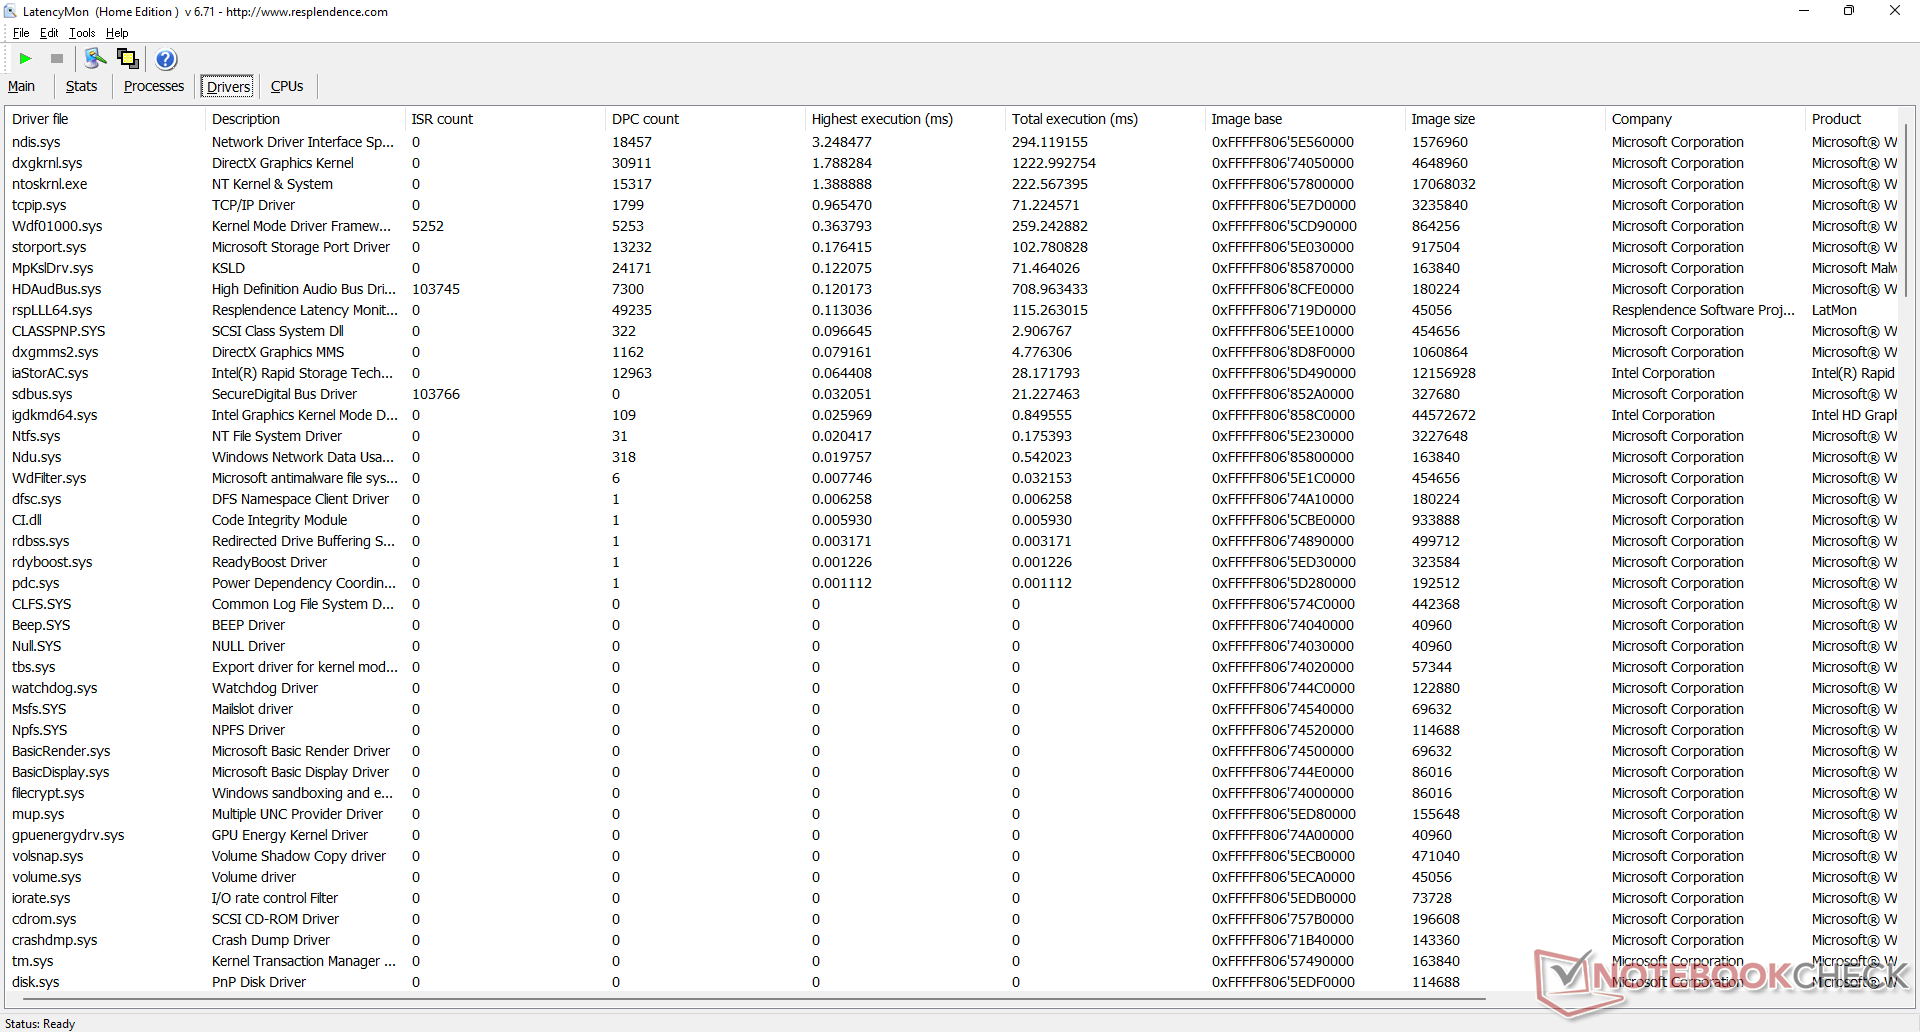
Latência do DPC
LatencyMon revela problemas de DPC ao abrir várias abas do navegador em nossa página inicial. a reprodução do vídeo de 4K é, em sua maioria, suave, com apenas 5 quadros descartados durante nosso teste de vídeo de minutos.
| DPC Latencies / LatencyMon - interrupt to process latency (max), Web, Youtube, Prime95 | |
| Beelink SEi8 | |
| Beelink SEi10 | |
| GMK NucBox 2 | |
| Intel NUC11TNKi5 | |
| Beelink SER4 | |
* ... menor é melhor
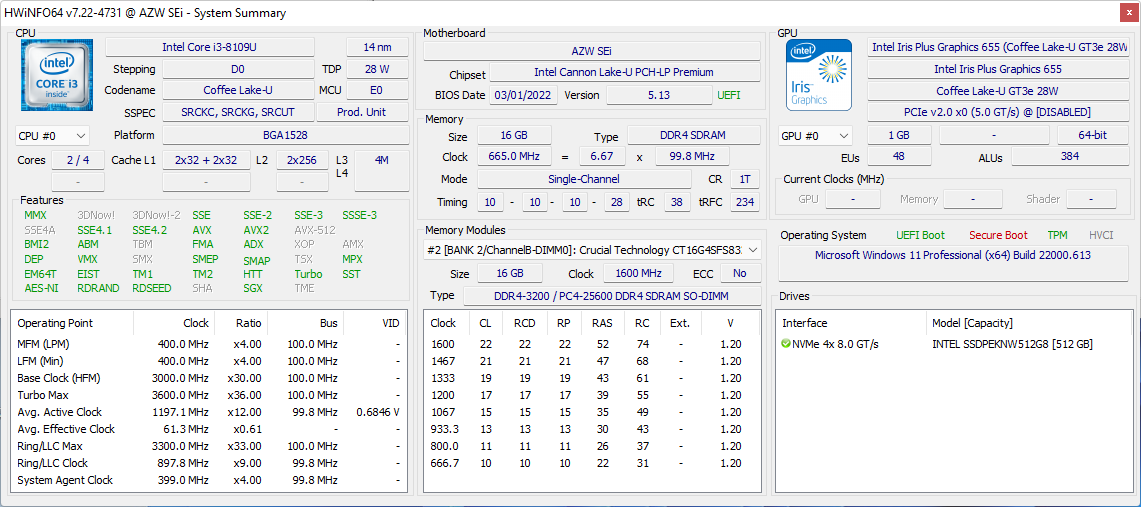
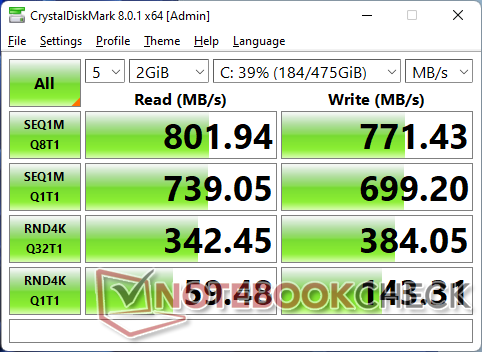
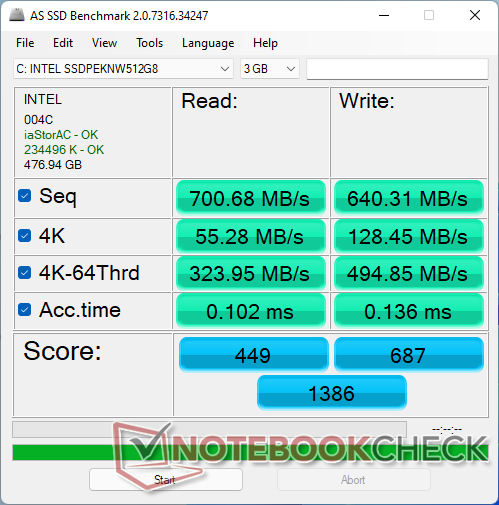
Dispositivos de armazenamento
Nossa unidade vem configurada com um orçamento de 512 GB Intel 660p NVMe SSD. Embora a unidade em si seja capaz de taxas seqüenciais de leitura e escrita de até 1500 MB/s e 1000 MB/s, respectivamente, só somos capazes de registrar um máximo de 800 MB/s em nosso SEi8.

| Drive Performance rating - Percent | |
| Beelink SER4 | |
| GMK NucBox 2 | |
| Beelink SEi8 | |
| Beelink SEi10 | |
| Intel NUC11TNKi5 | |
| DiskSpd | |
| seq read | |
| GMK NucBox 2 | |
| Beelink SER4 | |
| Beelink SEi10 | |
| Beelink SEi8 | |
| Intel NUC11TNKi5 | |
| seq write | |
| GMK NucBox 2 | |
| Beelink SER4 | |
| Beelink SEi10 | |
| Beelink SEi8 | |
| Intel NUC11TNKi5 | |
| seq q8 t1 read | |
| GMK NucBox 2 | |
| Beelink SEi10 | |
| Beelink SER4 | |
| Beelink SEi8 | |
| Intel NUC11TNKi5 | |
| seq q8 t1 write | |
| GMK NucBox 2 | |
| Beelink SER4 | |
| Beelink SEi10 | |
| Beelink SEi8 | |
| Intel NUC11TNKi5 | |
| 4k q1 t1 read | |
| Beelink SER4 | |
| Beelink SEi8 | |
| Beelink SEi10 | |
| GMK NucBox 2 | |
| Intel NUC11TNKi5 | |
| 4k q1 t1 write | |
| Beelink SER4 | |
| Beelink SEi10 | |
| GMK NucBox 2 | |
| Beelink SEi8 | |
| Intel NUC11TNKi5 | |
| 4k q32 t16 read | |
| Beelink SEi10 | |
| Beelink SEi8 | |
| Beelink SER4 | |
| GMK NucBox 2 | |
| Intel NUC11TNKi5 | |
| 4k q32 t16 write | |
| Beelink SER4 | |
| GMK NucBox 2 | |
| Beelink SEi8 | |
| Beelink SEi10 | |
| Intel NUC11TNKi5 | |
| AS SSD | |
| Score Total | |
| Beelink SER4 | |
| GMK NucBox 2 | |
| Beelink SEi8 | |
| Beelink SEi10 | |
| Intel NUC11TNKi5 | |
| Score Read | |
| GMK NucBox 2 | |
| Beelink SER4 | |
| Beelink SEi10 | |
| Beelink SEi8 | |
| Intel NUC11TNKi5 | |
| Score Write | |
| Beelink SER4 | |
| Beelink SEi8 | |
| GMK NucBox 2 | |
| Intel NUC11TNKi5 | |
| Beelink SEi10 | |
| Seq Read | |
| GMK NucBox 2 | |
| Beelink SER4 | |
| Beelink SEi10 | |
| Beelink SEi8 | |
| Intel NUC11TNKi5 | |
| Seq Write | |
| GMK NucBox 2 | |
| Beelink SER4 | |
| Beelink SEi8 | |
| Intel NUC11TNKi5 | |
| Beelink SEi10 | |
| 4K Read | |
| Beelink SER4 | |
| Beelink SEi8 | |
| GMK NucBox 2 | |
| Beelink SEi10 | |
| Intel NUC11TNKi5 | |
| 4K Write | |
| Beelink SER4 | |
| GMK NucBox 2 | |
| Beelink SEi8 | |
| Beelink SEi10 | |
| Intel NUC11TNKi5 | |
| 4K-64 Read | |
| GMK NucBox 2 | |
| Beelink SEi10 | |
| Beelink SEi8 | |
| Beelink SER4 | |
| Intel NUC11TNKi5 | |
| 4K-64 Write | |
| Beelink SER4 | |
| Beelink SEi8 | |
| GMK NucBox 2 | |
| Intel NUC11TNKi5 | |
| Beelink SEi10 | |
| Access Time Read | |
| Intel NUC11TNKi5 | |
| Beelink SEi8 | |
| Beelink SER4 | |
| Beelink SEi10 | |
| GMK NucBox 2 | |
| Access Time Write | |
| Beelink SEi10 | |
| GMK NucBox 2 | |
| Intel NUC11TNKi5 | |
| Beelink SER4 | |
| Beelink SEi8 | |
* ... menor é melhor
Disk Throttling: DiskSpd Read Loop, Queue Depth 8
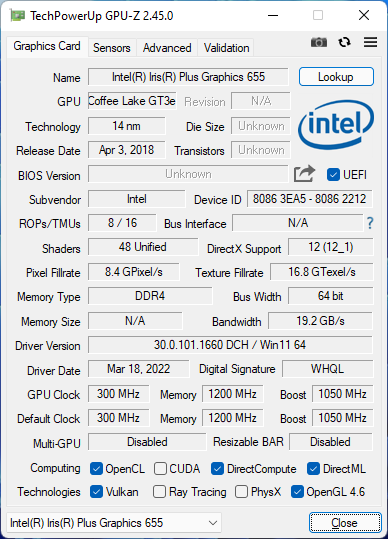
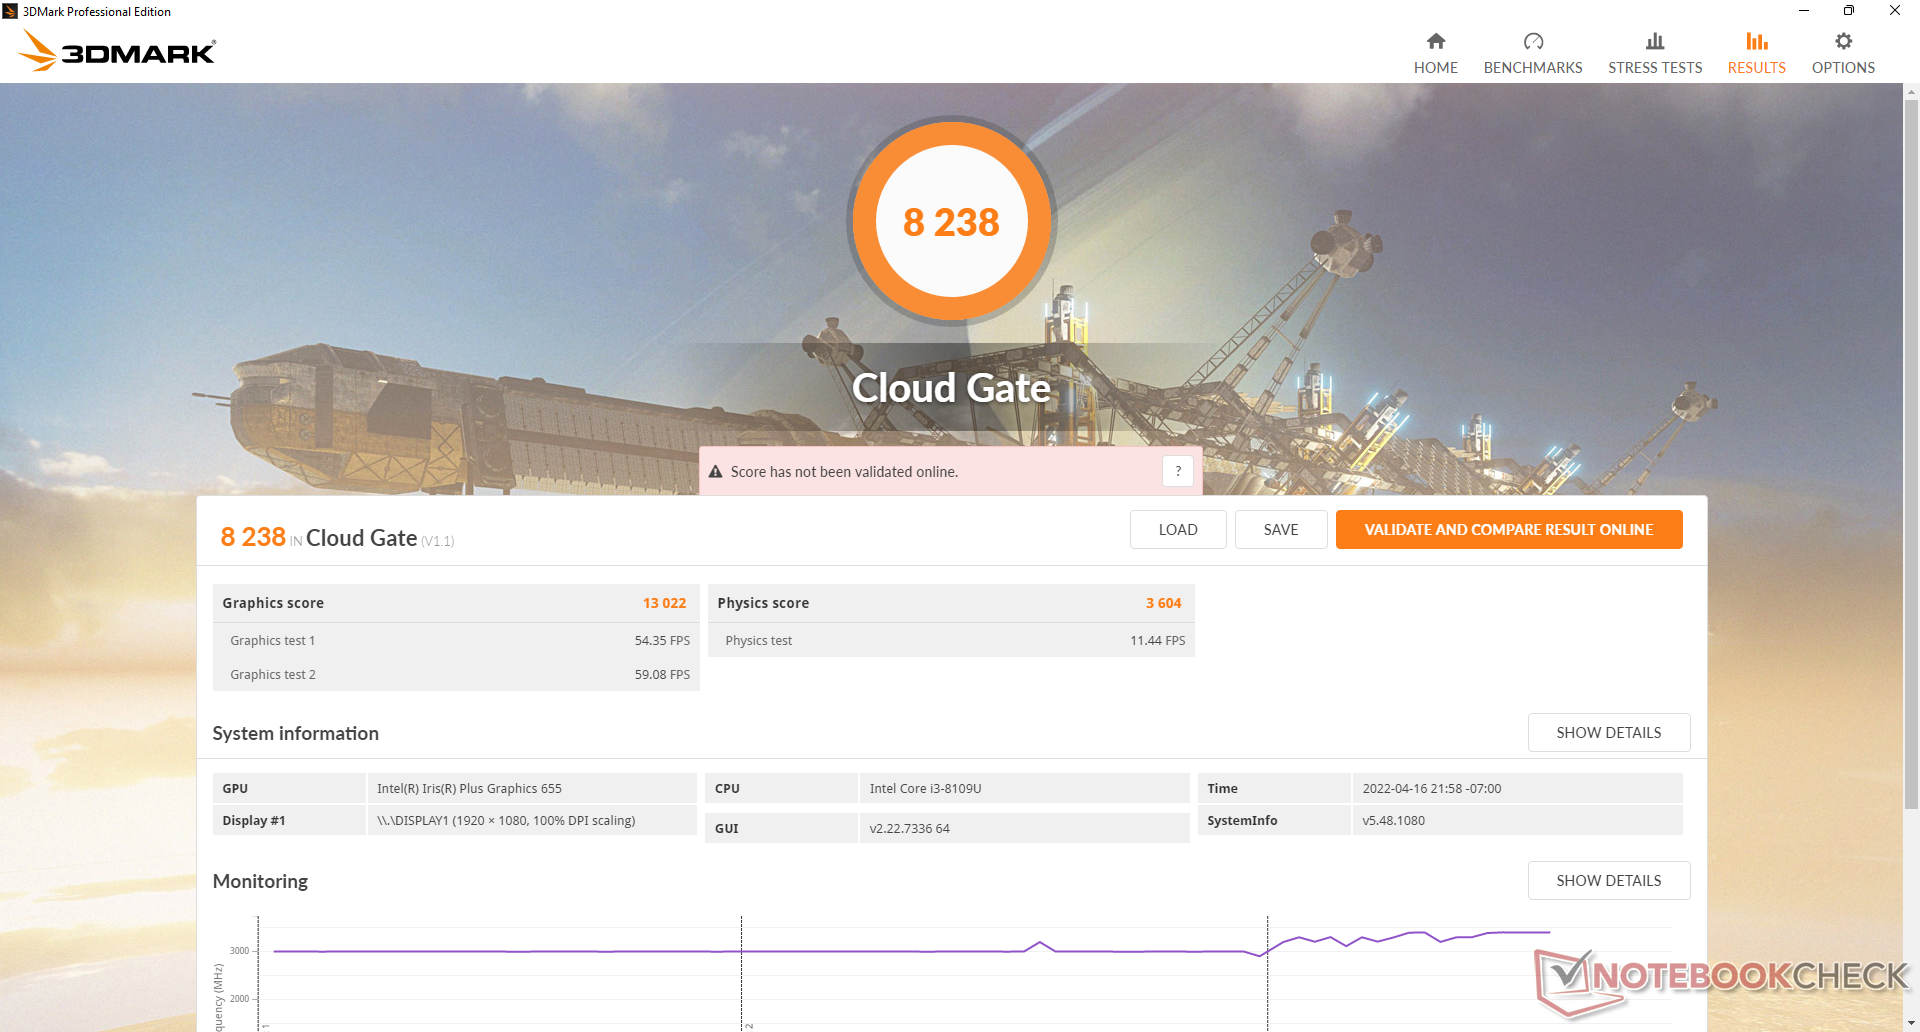
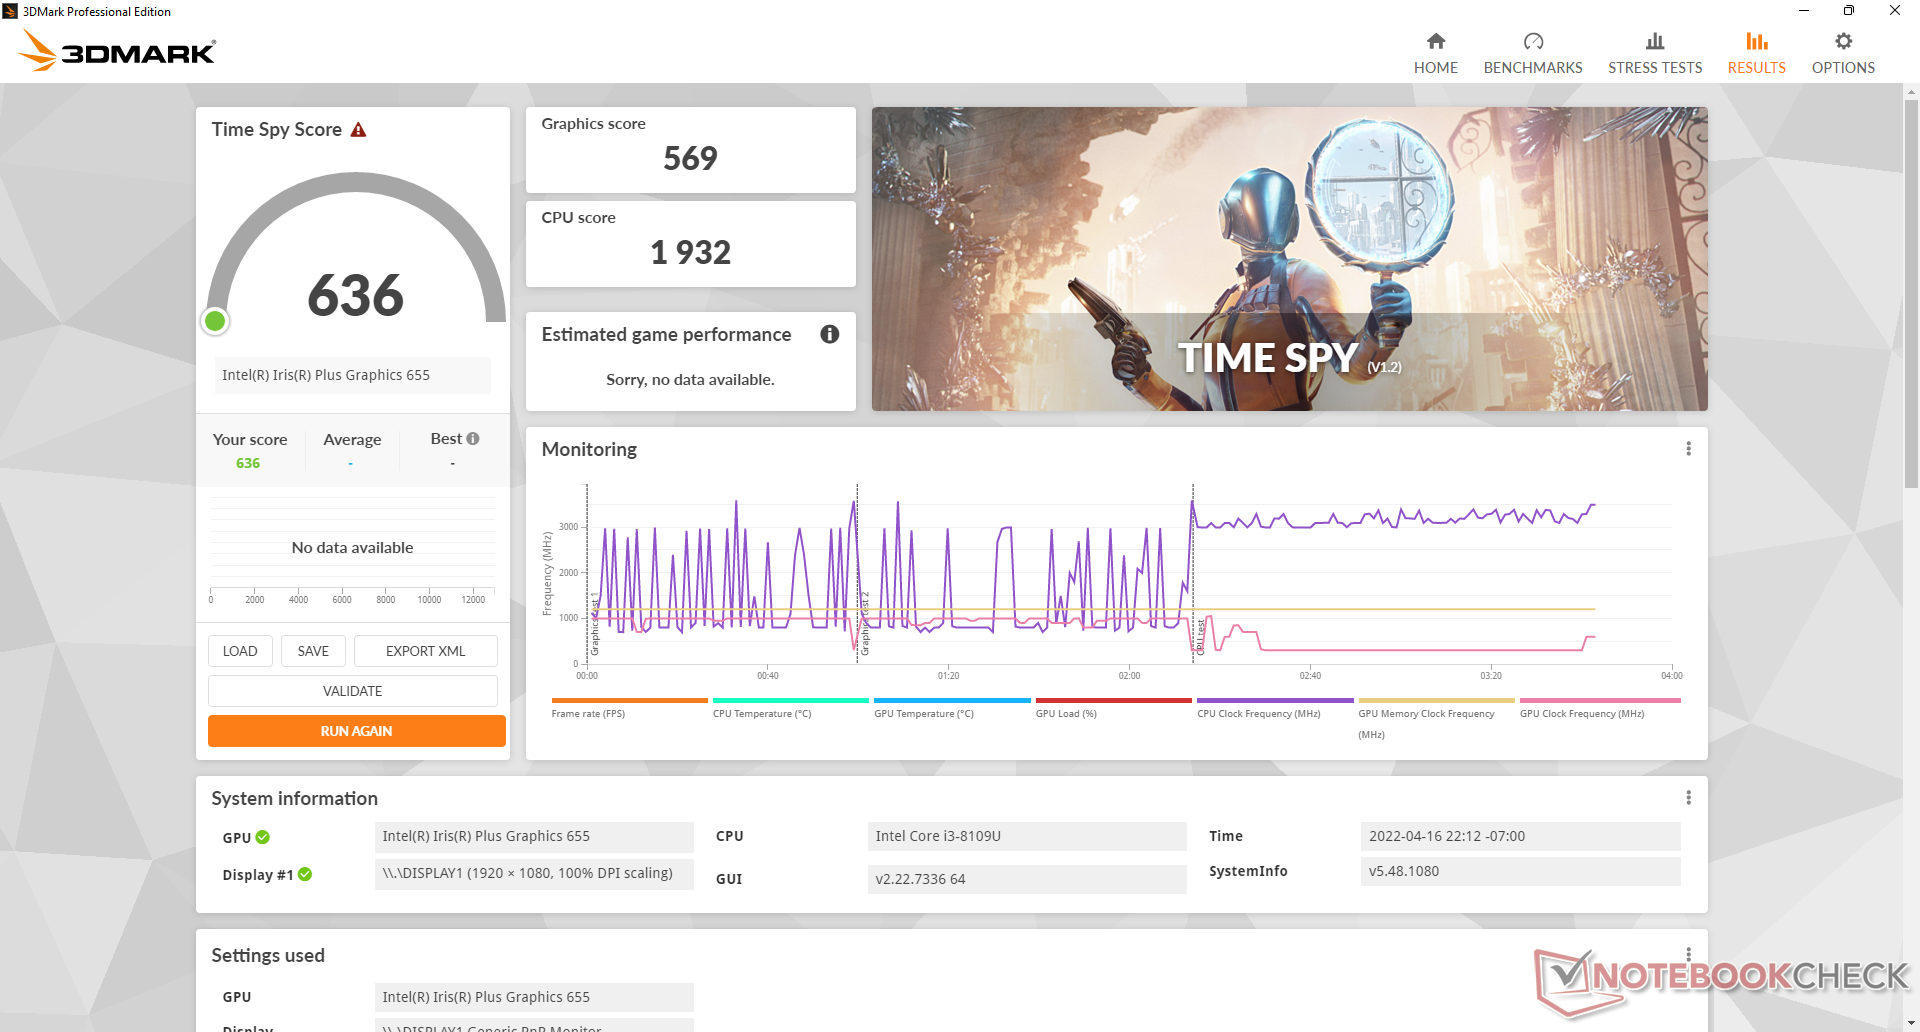
Desempenho da GPU
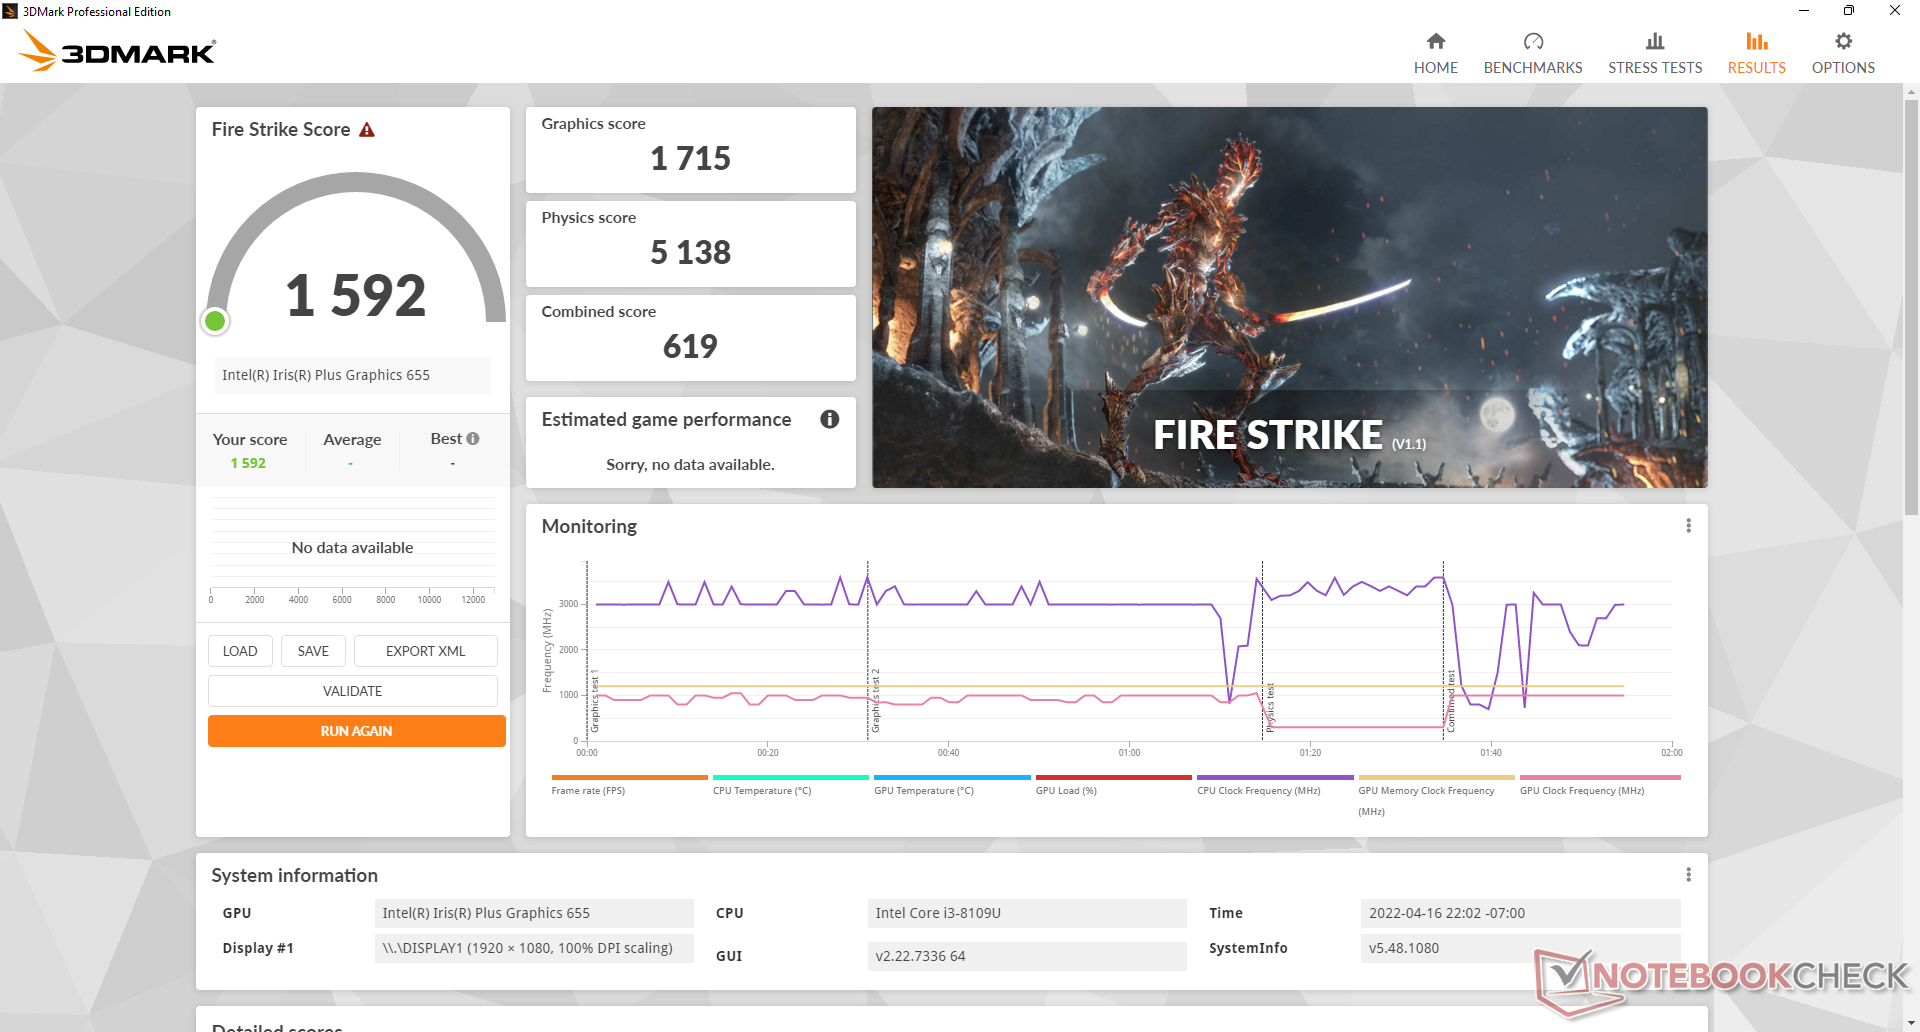
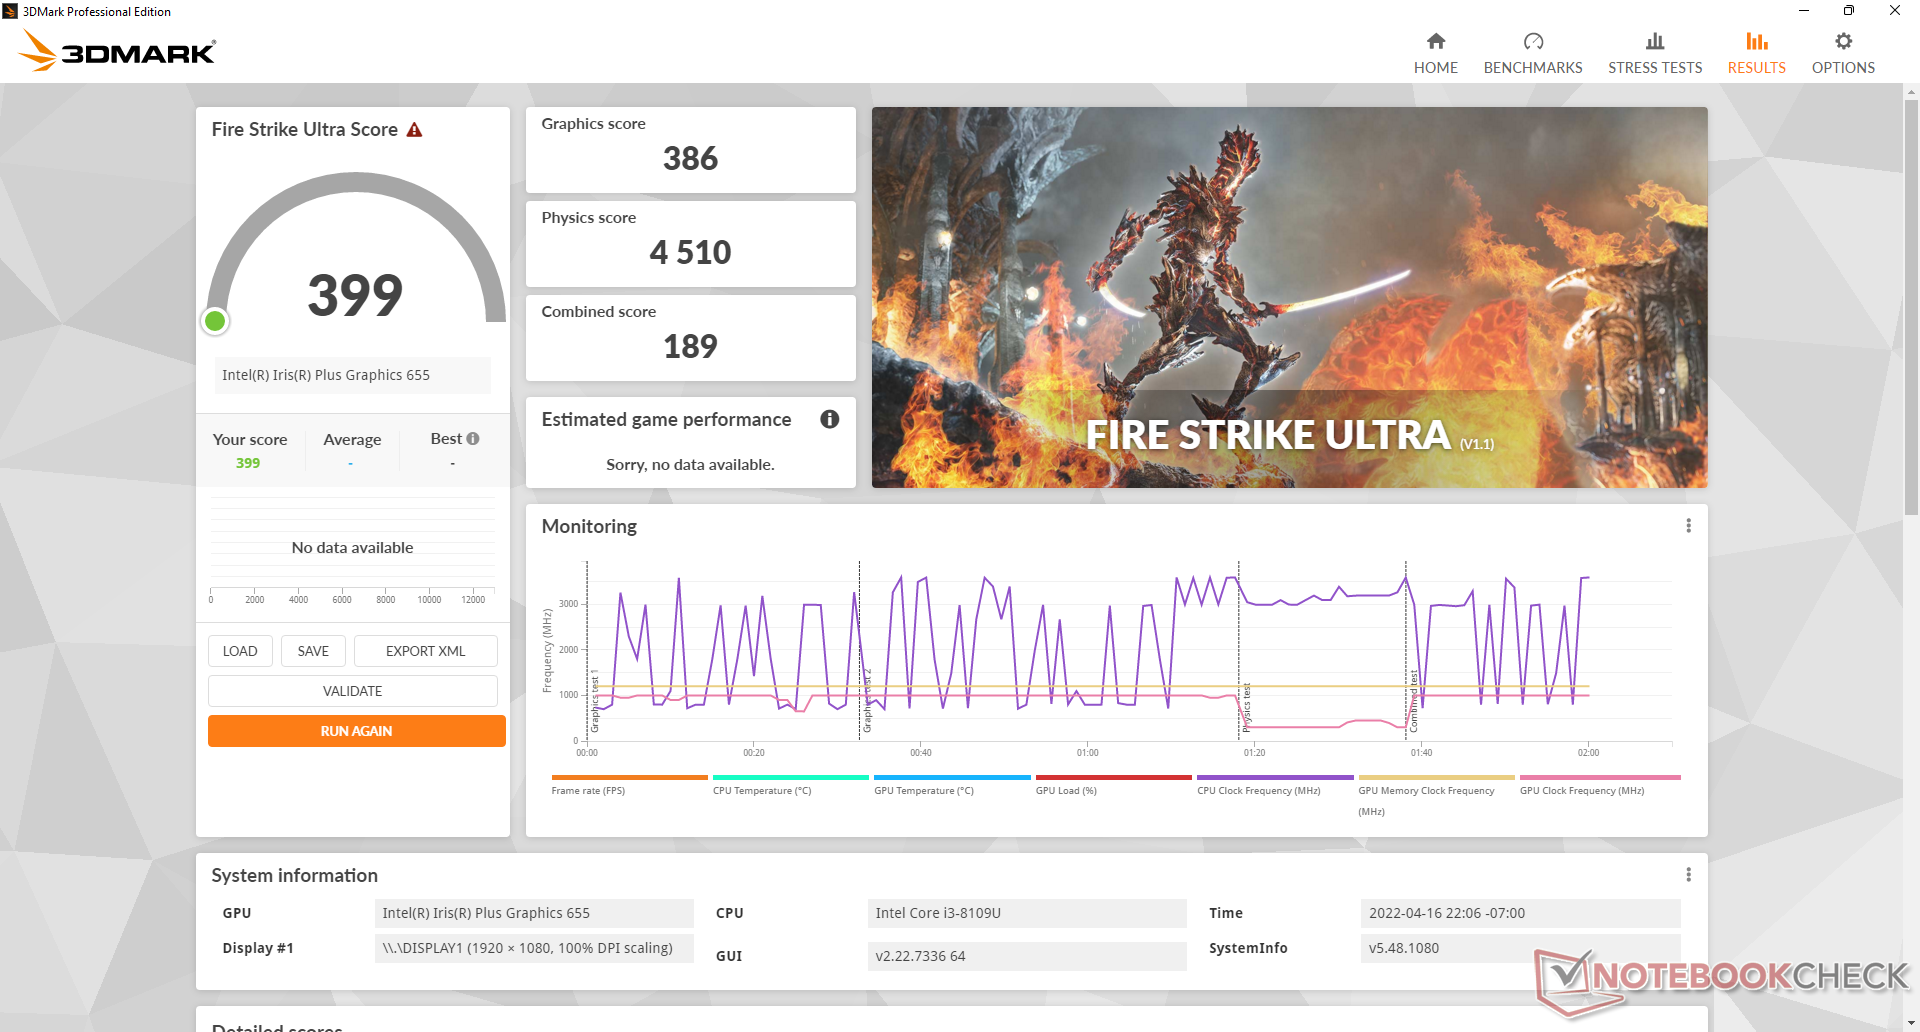
Desempenho gráfico bruto do Iris Plus 655 é aproximadamente 40 a 50 por cento mais rápido do que a média UHD Graphics 620 como encontrado em muitos mini PCs antigos da Intel antes da 10ª geração Ice Lake. O aumento no desempenho é respeitável para tarefas como streaming e reprodução de vídeo de 4K, mas não é suficiente para fins de jogos Witcher 3por exemplo, teria problemas de lançamento em nossa unidade de teste, mesmo depois de atualizar todos os drivers gráficos e Windows
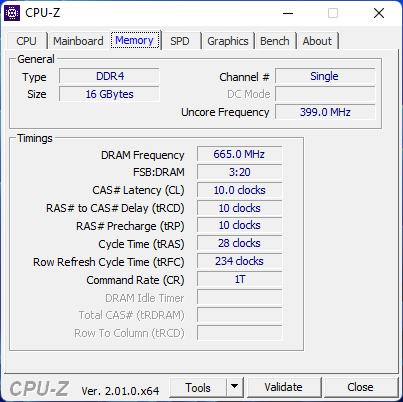
Uma vez que nossa unidade de teste é fornecida apenas com memória de um canal, os resultados provavelmente serão mais rápidos do que o que gravamos abaixo se configurada com memória de dois canais.
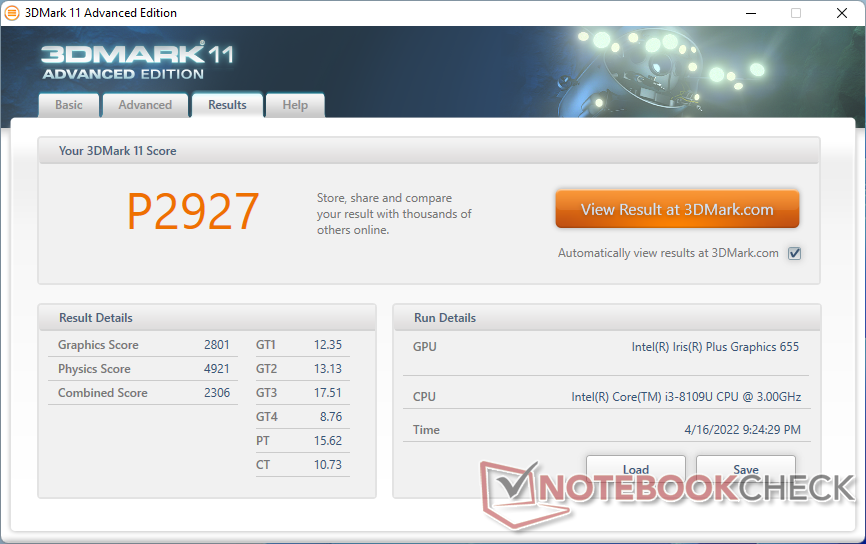
| 3DMark 11 Performance | 2927 pontos | |
| 3DMark Cloud Gate Standard Score | 8238 pontos | |
| 3DMark Fire Strike Score | 1592 pontos | |
| 3DMark Time Spy Score | 636 pontos | |
Ajuda | ||
| Final Fantasy XV Benchmark | |
| 1280x720 Lite Quality | |
| Beelink SER4 | |
| Intel NUC11TNKi5 | |
| GMK NucBox 2 | |
| Intel NUC8i7BE | |
| Beelink SEi8 | |
| Média Intel Iris Plus Graphics 655 (9.11 - 18.1, n=8) | |
| Beelink U59 | |
| GMK NucBox 3 | |
| 1920x1080 Standard Quality | |
| Beelink SER4 | |
| Intel NUC11TNKi5 | |
| GMK NucBox 2 | |
| Média Intel Iris Plus Graphics 655 (7.88 - 9.73, n=4) | |
| Beelink SEi8 | |
| 1920x1080 High Quality | |
| Beelink SER4 | |
| Intel NUC11TNKi5 | |
| Beelink SEi8 | |
| GMK NucBox 2 | |
| Média Intel Iris Plus Graphics 655 (5.25 - 6.55, n=4) | |
| baixo | média | alto | ultra | |
|---|---|---|---|---|
| Dota 2 Reborn (2015) | 94.4 | 34.6 | 25.3 | 22.7 |
| Final Fantasy XV Benchmark (2018) | 16.6 | 8.8 | 6.08 | |
| X-Plane 11.11 (2018) | 22.4 | 15 | 12.3 |
Emissões
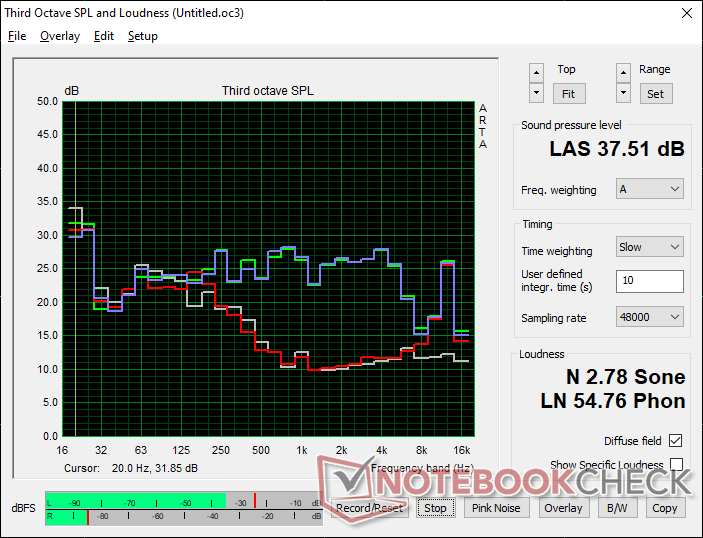
Ruído do sistema
O ruído do ventilador é em grande parte binário no sentido de que as RPMs tendem a flutuar entre o mínimo e o máximo com muito poucos passos no meio. Em outras palavras, espera-se que o ventilador passe de silencioso a ruidoso com bastante freqüência quando as aplicações multi-tarefas ou de lançamento. Não é tão ruim quanto na série Beelink GTi11 ou SER4 mais potente, mas as mudanças de ruído dos ventiladores são, no entanto, mais notáveis e freqüentes quando comparadas a um NUC.
Barulho
| Ocioso |
| 26.5 / 26.5 / 31.1 dB |
| Carga |
| 37.7 / 37.5 dB |
 | ||
30 dB silencioso 40 dB(A) audível 50 dB(A) ruidosamente alto |
||
min: | ||
| Beelink SEi8 Iris Plus Graphics 655, i3-8109U, Intel SSD 660p SSDPEKNW512G8 | Beelink SEi10 UHD Graphics G1 (Ice Lake 32 EU), i3-1005G1, Silicon Motion AZW 256G M.2280 NVMe 4X 200725 D | Beelink SER4 Vega 8, R7 4800U, Intel SSD 660p SSDPEKNW512G8 | Intel NUC11TNKi5 Iris Xe G7 80EUs, i5-1135G7, Transcend M.2 SSD 430S TS512GMTS430S | Intel NUC8i7BE Iris Plus Graphics 655, i7-8559U | GMK NucBox 2 Iris Plus Graphics 655, i5-8259U, Netac S930E8/256GPN | |
|---|---|---|---|---|---|---|
| Noise | -17% | -11% | -18% | -9% | 5% | |
| desligado / ambiente * (dB) | 24.5 | 27.5 -12% | 23.4 4% | 24.8 -1% | 28.7 -17% | 25.6 -4% |
| Idle Minimum * (dB) | 26.5 | 30.9 -17% | 33.2 -25% | 35.6 -34% | 28.7 -8% | 25.7 3% |
| Idle Average * (dB) | 26.5 | 33.5 -26% | 33.2 -25% | 35.6 -34% | 29.3 -11% | 25.7 3% |
| Idle Maximum * (dB) | 31.1 | 33.5 -8% | 33.2 -7% | 35.6 -14% | 31.8 -2% | 25.7 17% |
| Load Average * (dB) | 37.7 | 38.5 -2% | 38.6 -2% | 36.2 4% | 39 -3% | 35.3 6% |
| Load Maximum * (dB) | 37.5 | 51.6 -38% | 40.8 -9% | 47.6 -27% | 41.4 -10% | 35.1 6% |
| Witcher 3 ultra * (dB) | 39.2 | 38 | 39 |
* ... menor é melhor
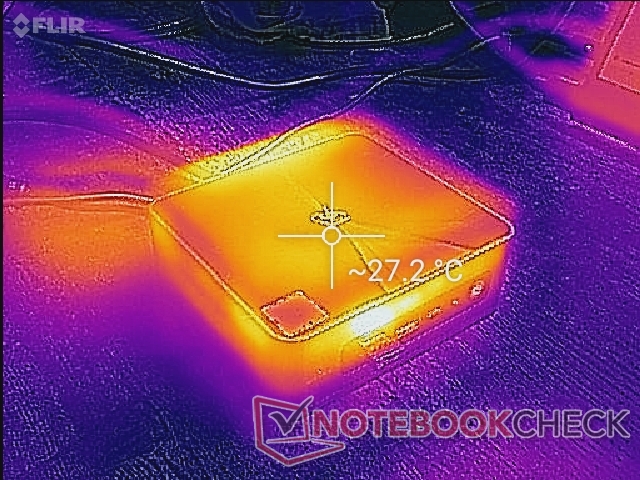
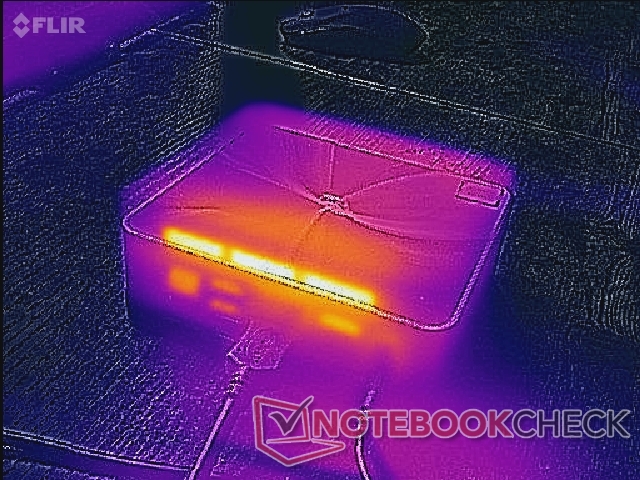
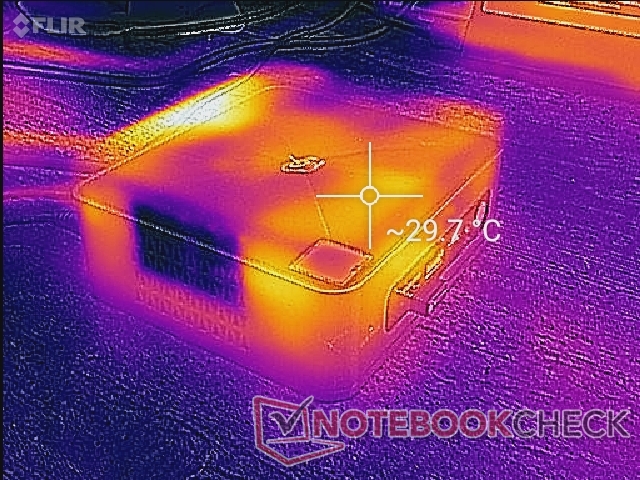
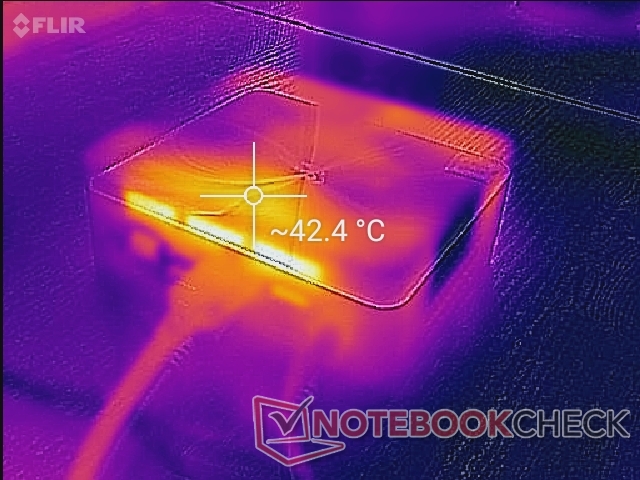
Temperatura
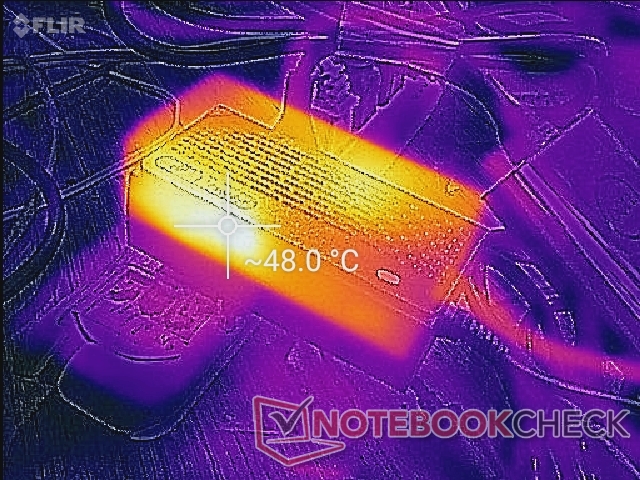
Ao contrário do mais potente SER4, o SEi8 não possui grelhas de ventilação na superfície superior e, portanto, os usuários podem colocar com segurança papéis e outros objetos em cima sem impacto no resfriamento. As aberturas de entrada de ar estão apenas ao longo dos dois lados do chassi. O ponto quente pode chegar a mais de 42 C na parte superior mais próxima à traseira e ao lado das grelhas de exaustão.
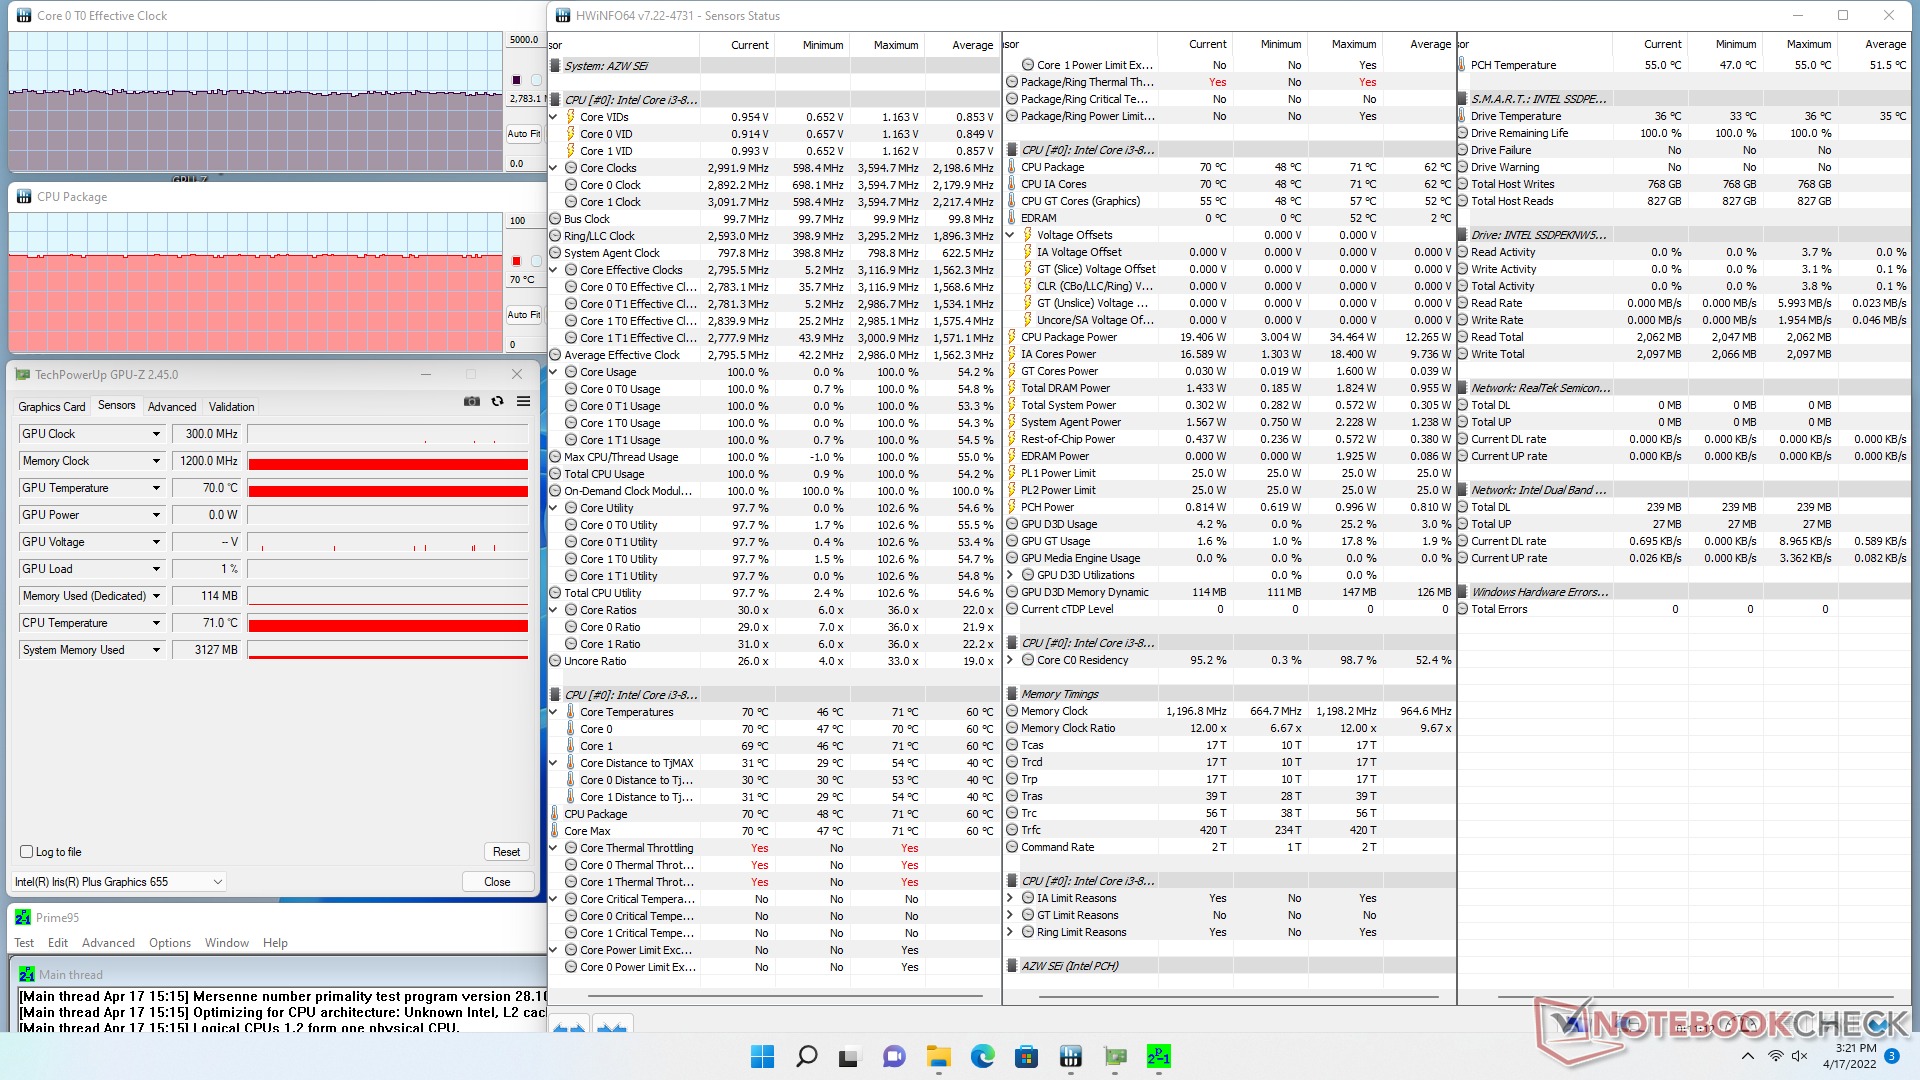
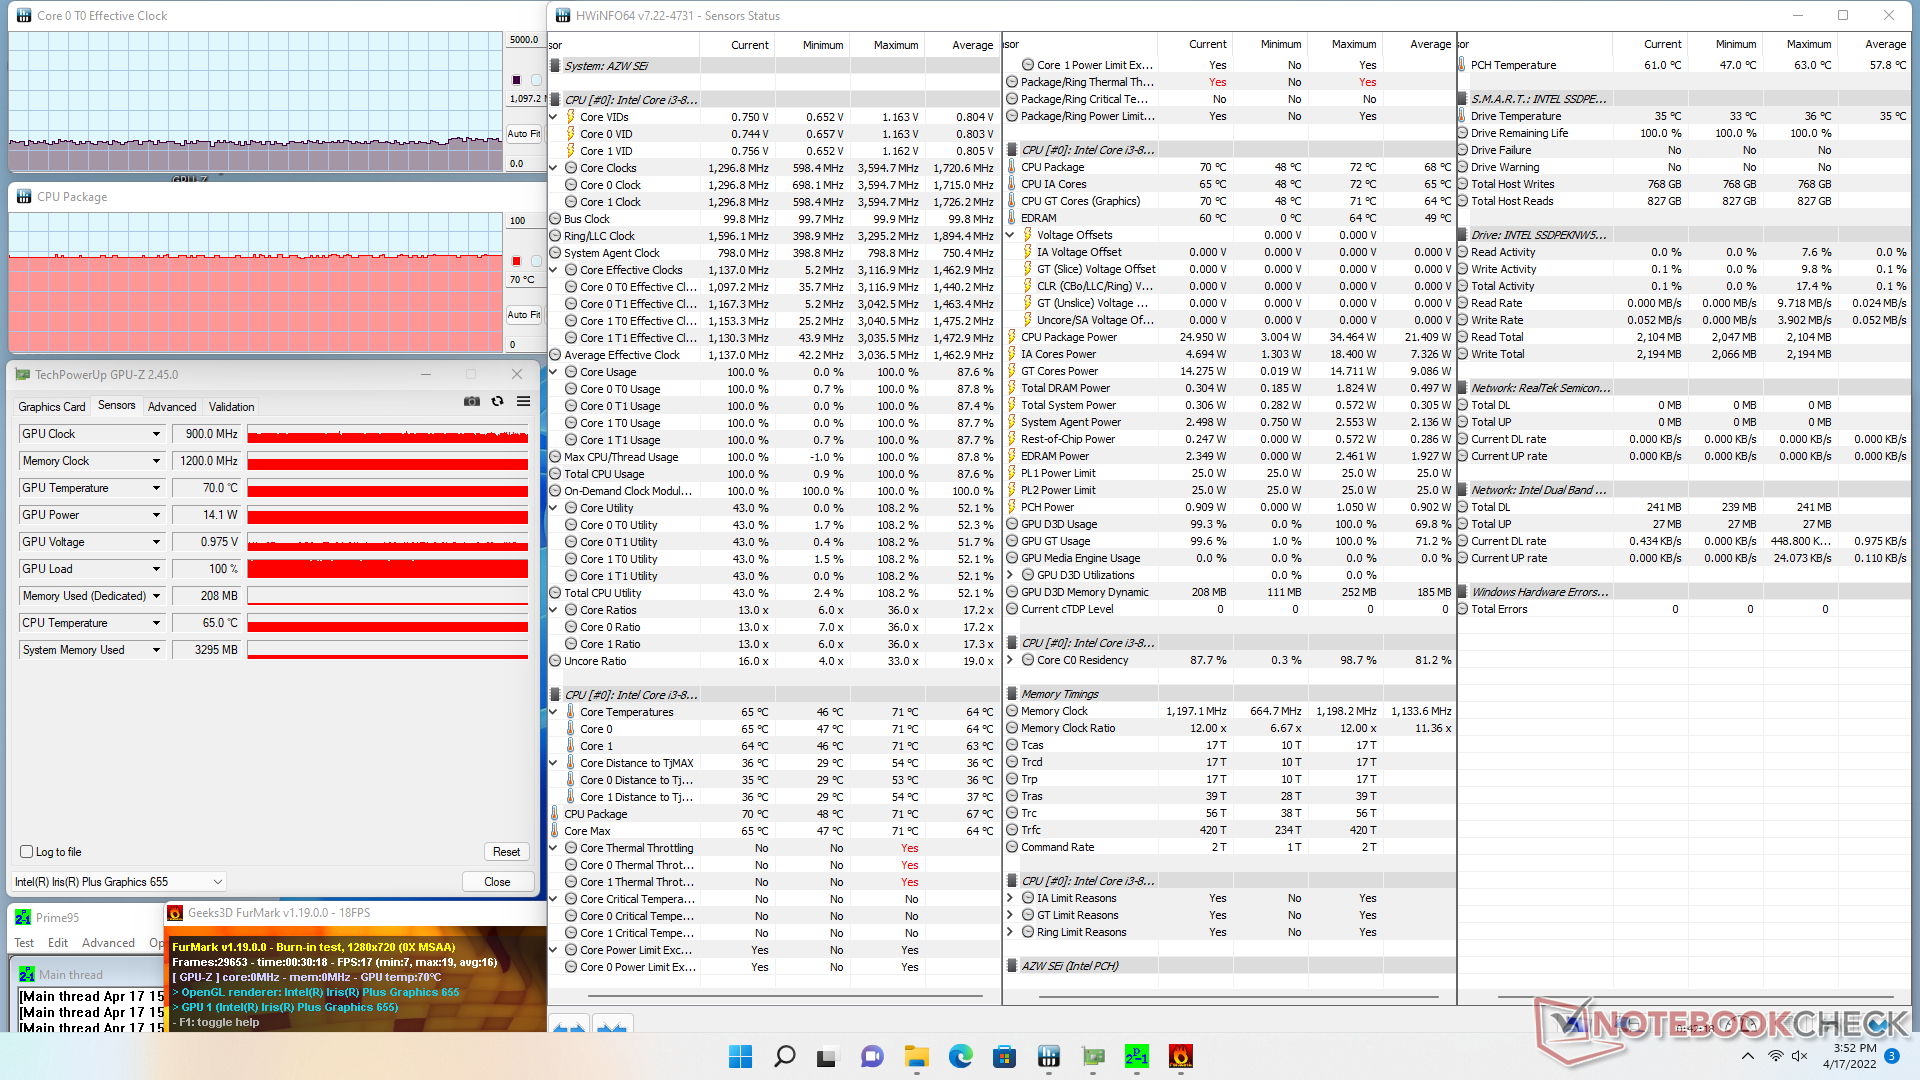
Teste de estresse
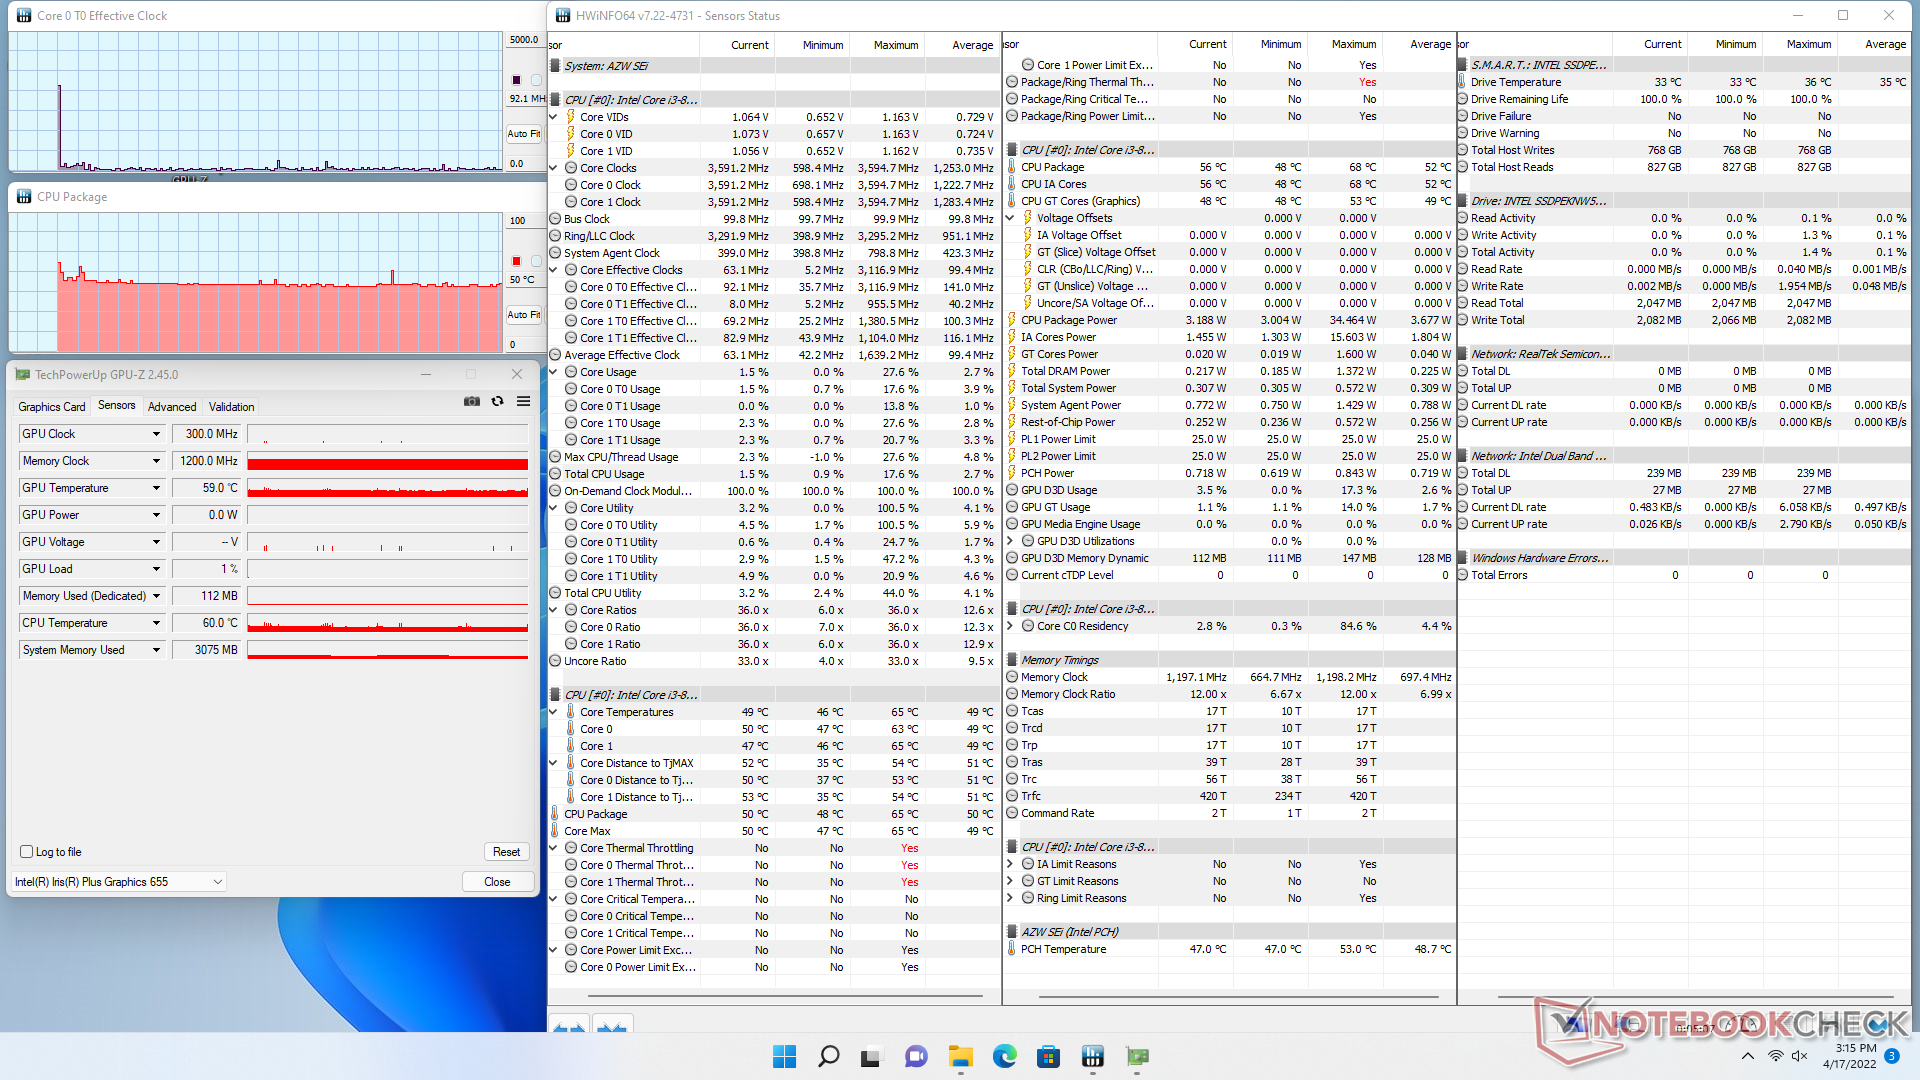
Ao executar Prime95, a CPU aumentaria para 2,9 GHz antes de estabilizar em 2,8 GHz e 70 C. A potência do pacote de CPU também seria de 34,4 W durante o início do teste antes de cair e se estabilizar em 19,4 W. Executando este mesmo teste no SEi10 com o mais novo 10º gênero Núcleo i3-1005G1 veria tanto taxas de relógio mais altas quanto temperaturas centrais de 3,4 GHz e 90 C, respectivamente.
| Relógio CPU (GHz) | Relógio GPU (MHz) | Temperatura média da CPU (°C) | |
| System Idle | -- | -- | 50 |
| Prime95 Stress | 2.8 | -- | 70 |
| Prime95 + FurMark Stress | 1.1 | 900 | 70 |
Gestão de energia
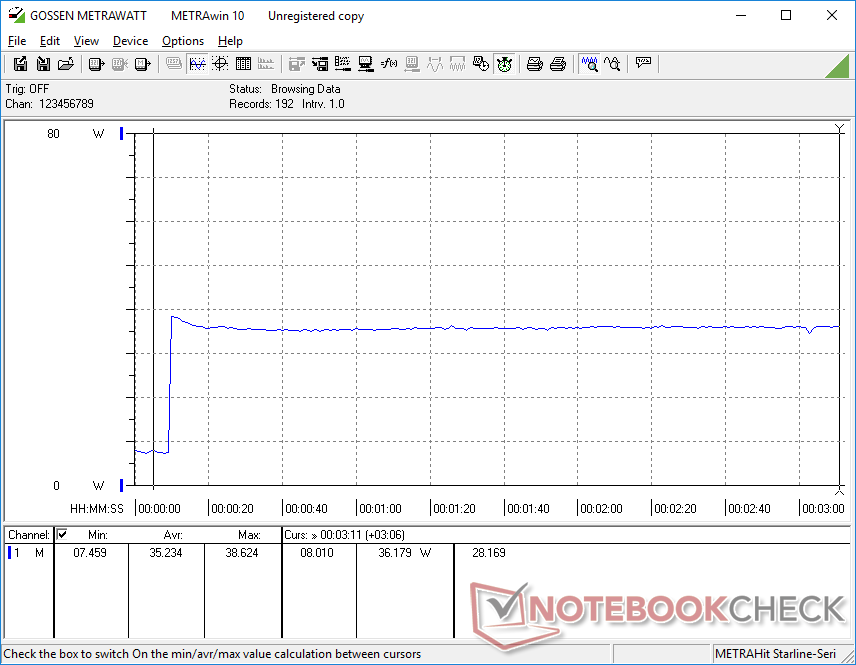
Consumo de energia
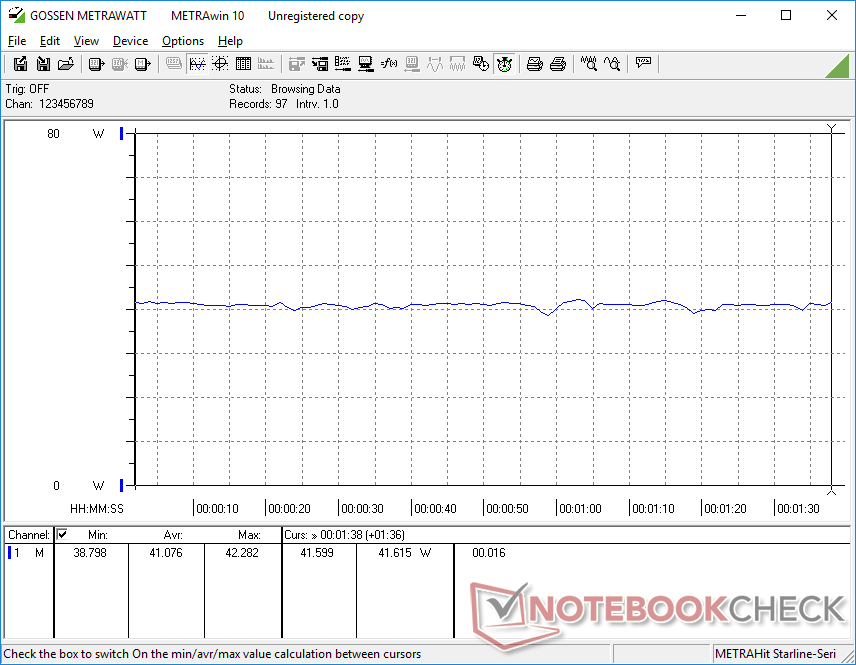
O SEi8 consome cerca de tanta energia quanto a NUC 11 com as CPUs do 11º gênero, apesar das vantagens de desempenho da série de CPUs do 11º gênero. Isto se deve ao fato de a série do 8º gênero ser muito menos otimizada, especialmente em termos de desempenho gráfico integrado. Para um desempenho maior por watt, os usuários vão querer considerar o SEi8 com o Core i5-8279U ou a série SEi10.
Espere que o sistema consuma pouco mais de 40 W quando estiver rodando cargas exigentes.

| desligado | |
| Ocioso | |
| Carga |
|
Key:
min: | |
| Beelink SEi8 i3-8109U, Iris Plus Graphics 655, Intel SSD 660p SSDPEKNW512G8, , x, | Beelink SEi10 i3-1005G1, UHD Graphics G1 (Ice Lake 32 EU), Silicon Motion AZW 256G M.2280 NVMe 4X 200725 D, , x, | Beelink SER4 R7 4800U, Vega 8, Intel SSD 660p SSDPEKNW512G8, , x, | Intel NUC11TNKi5 i5-1135G7, Iris Xe G7 80EUs, Transcend M.2 SSD 430S TS512GMTS430S, , x, | Intel NUC8i7BE i7-8559U, Iris Plus Graphics 655, , , x, | GMK NucBox 2 i5-8259U, Iris Plus Graphics 655, Netac S930E8/256GPN, , x, | |
|---|---|---|---|---|---|---|
| Power Consumption | 16% | 32% | -47% | 4% | 3% | |
| Idle Minimum * (Watt) | 7.5 | 6.3 16% | 4.1 45% | 11.5 -53% | 2.7 64% | 6.1 19% |
| Idle Average * (Watt) | 7.6 | 6.6 13% | 4.1 46% | 12.4 -63% | 3.1 59% | 6.8 11% |
| Idle Maximum * (Watt) | 9.2 | 6.7 27% | 4.6 50% | 12.9 -40% | 6.3 32% | 7.3 21% |
| Load Average * (Watt) | 41.1 | 25.9 37% | 35.6 13% | 40.7 1% | 59.7 -45% | 46.3 -13% |
| Load Maximum * (Watt) | 41.4 | 46.7 -13% | 39.9 4% | 73.5 -78% | 78 -88% | 50.7 -22% |
| Witcher 3 ultra * (Watt) | 35.6 | 43.9 | 47.2 |
* ... menor é melhor
Power Consumption Witcher 3 / Stresstest
Pro
Contra
Veredicto
Muito como a maioria dos outros mini PCs Beelink, o baixo preço do SEi8 é sua maior vantagem em comparação com a concorrência. Um SEi8 totalmente carregado com a CPU Core i3-3109U, 16 GB de RAM, Windows 11 Pro licenciado e SSD NVMe de 256 GB por cerca de $380 USD enquanto um barebone Intel NUC8I3BEK com exatamente o mesmo processador, mas em uma configuração barebone pode ser encontrado online por $350 USD.
Para um processador de quatro anos de idade, o Core i3-8109U é rápido o suficiente para aplicações HTPC básicas como navegação, streaming, navegação de SO e multi-tarefas leves sem as constantes lentidões normalmente experimentadas em soluções mais fracas baseadas em Celeron ou em Atom. Se você estiver tentando ir o mais barato possível enquanto minimiza o impacto na experiência UI, então o SEi8 Core i3 deve estar perto do topo de sua lista. A mudança para o SEi8 Core i5 aumentará significativamente o desempenho sem aumentar muito o preço para os usuários que precisam de um processador mais rápido, com pernas mais longas e mais potencial multi-tarefa.
Os inconvenientes notáveis para a Intel NUC incluem os materiais de chassis mais finos, módulo WLAN mais lento, garantia mais curta, pulsação mais freqüente do ventilador, sem leitor de cartão SD e opções de BIOS mais limitadas. Felizmente, os cantos cortados não são suficientes para ser um divisor de negócios para o orçamento alvo de configuração HTPC.
Preço e Disponibilidade
Beelink está agora enviando o SEi8 em múltiplas configurações a partir de $319 USD. Alternativamente, os usuários podem encomendar a partir da Amazon por $359 USD.
Price comparison

