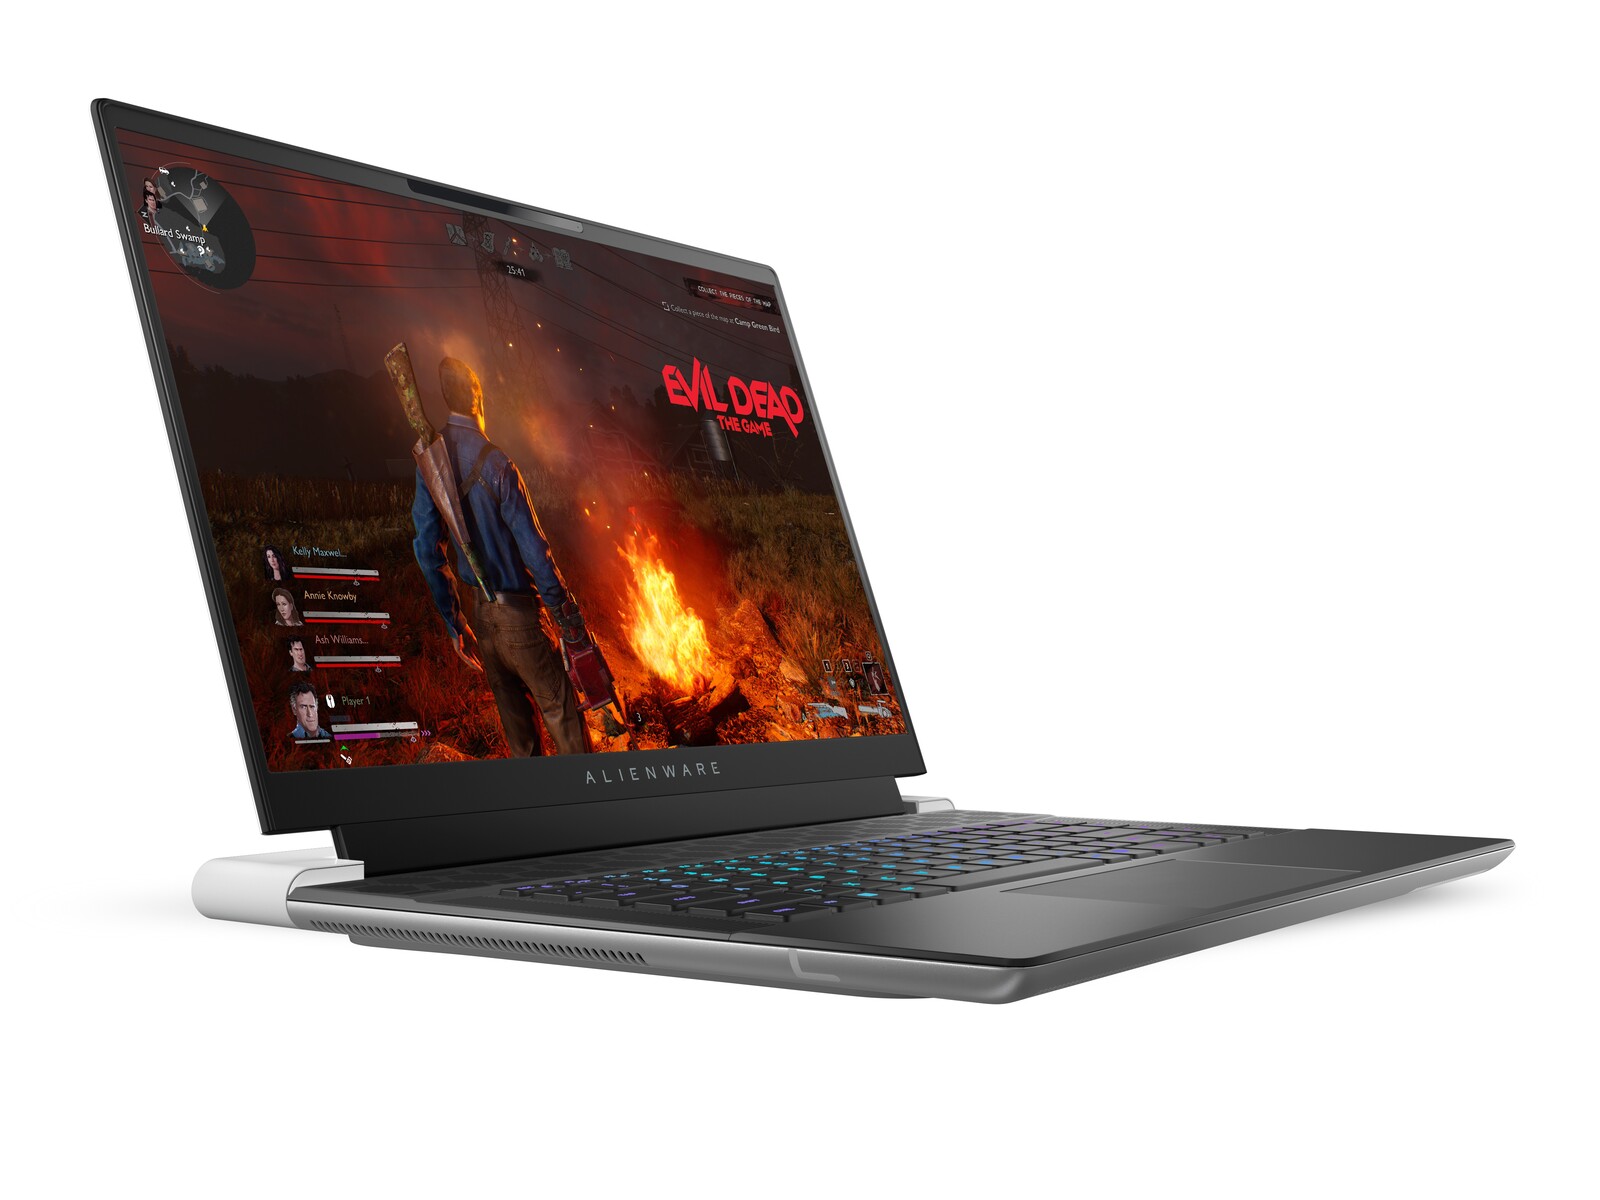
Estreia do desempenho do Intel Core i9-13900HK: Análise do laptop Alienware x16 R1

Revelado na CES 2023o Alienware x16 R1 é o segundo modelo de 16 polegadas da família, depois do Alienware m16, mais espesso e mais potente, que ainda não analisamos. Os dois modelos complementam o modelo 14 polegadas, 15 polegadas, 17 polegadas e 18 polegadas Opções Alienware já existentes no mercado.
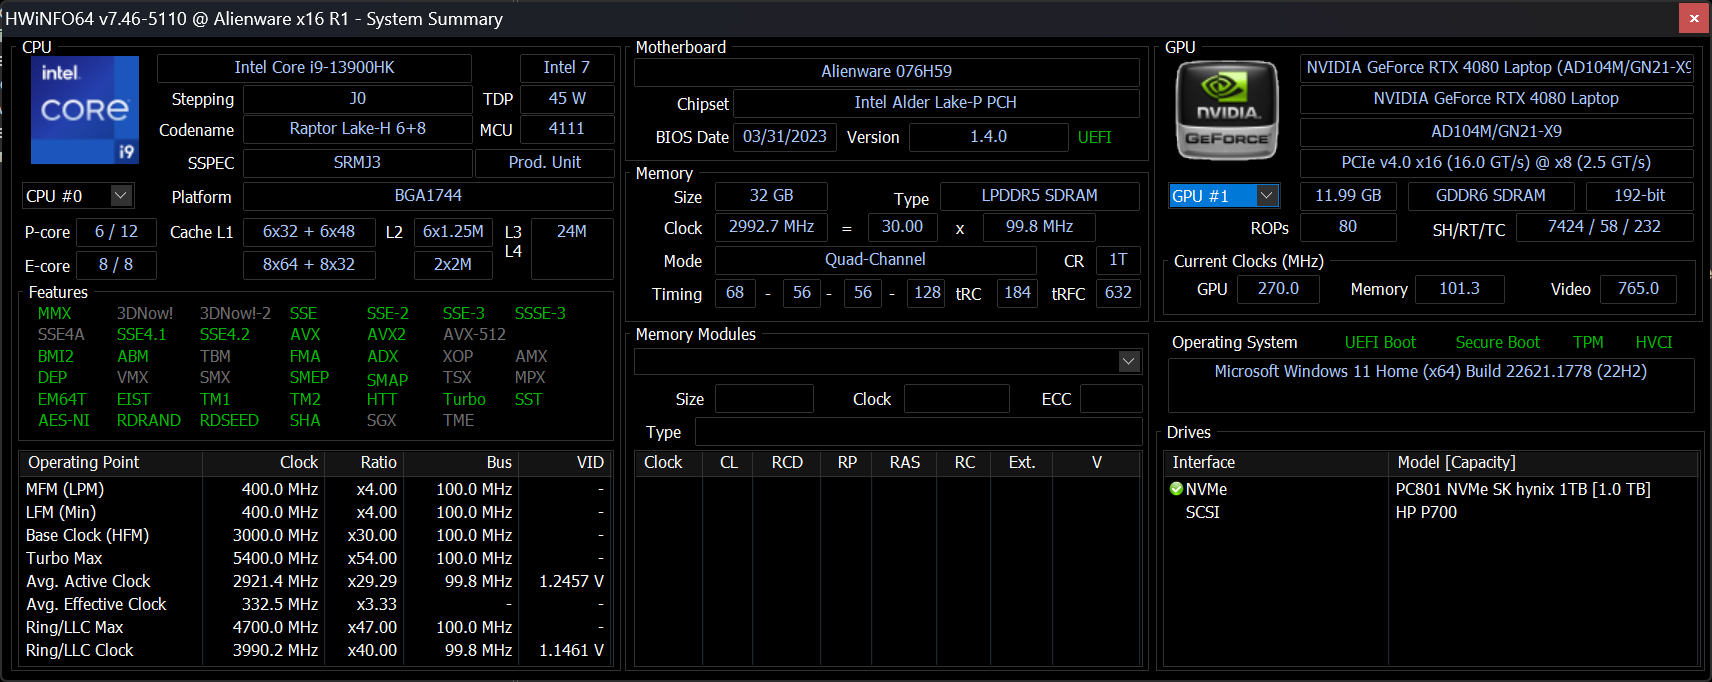
Nossa unidade de teste é uma configuração de ponta com a CPU Core i9-13900HK Raptor Lake de 13ª geração, GPU GeForce RTX 4080 e tela IPS de 16,0 polegadas 2560 x 1600 240 Hz por aproximadamente US$ 3350. Configurações mais baratas ou mais caras estão disponíveis, variando do Core i7-13620H, tela de 1200p e GPU RTX 4050 até a RTX 4090 por US$ 2.200 a mais de US$ 4.000.
As alternativas ao Alienware x16 R1 incluem outros laptops para jogos de 16 polegadas, como o Lenovo Legion Pro 7, Asus ROG Zephyrus M16, Razer Blade 16, ou o HP Omen 16. Essa categoria de tamanho específico vem crescendo em popularidade nos últimos dois anos.
Mais análises da Dell:
Possíveis concorrentes em comparação
Avaliação | Data | Modelo | Peso | Altura | Size | Resolução | Preço |
|---|---|---|---|---|---|---|---|
| 88.4 % v7 (old) | 06/2023 | Alienware x16 R1 i9-13900HK, GeForce RTX 4080 Laptop GPU | 2.6 kg | 18.57 mm | 16.00" | 2560x1600 | |
| 88.8 % v7 (old) | 06/2023 | Lenovo Legion Pro 7 RTX4090 i9-13900HX, GeForce RTX 4090 Laptop GPU | 2.7 kg | 26 mm | 16.00" | 2560x1600 | |
| 89.4 % v7 (old) | 03/2023 | Asus ROG Zephyrus M16 GU604VY-NM042X i9-13900H, GeForce RTX 4090 Laptop GPU | 2.3 kg | 22.9 mm | 16.00" | 2560x1600 | |
| 91.2 % v7 (old) | 02/2023 | Razer Blade 16 Early 2023 i9-13950HX, GeForce RTX 4080 Laptop GPU | 2.4 kg | 21.99 mm | 16.00" | 2560x1600 | |
| 86.1 % v7 (old) | 10/2022 | Dell G16 7620 i7-12700H, GeForce RTX 3060 Laptop GPU | 2.6 kg | 26.9 mm | 16.00" | 2560x1600 | |
| 86.1 % v7 (old) | 01/2023 | Alienware m17 R5 (R9 6900HX, RX 6850M XT) R9 6900HX, Radeon RX 6850M XT | 3.4 kg | 26.7 mm | 17.00" | 3840x2160 |
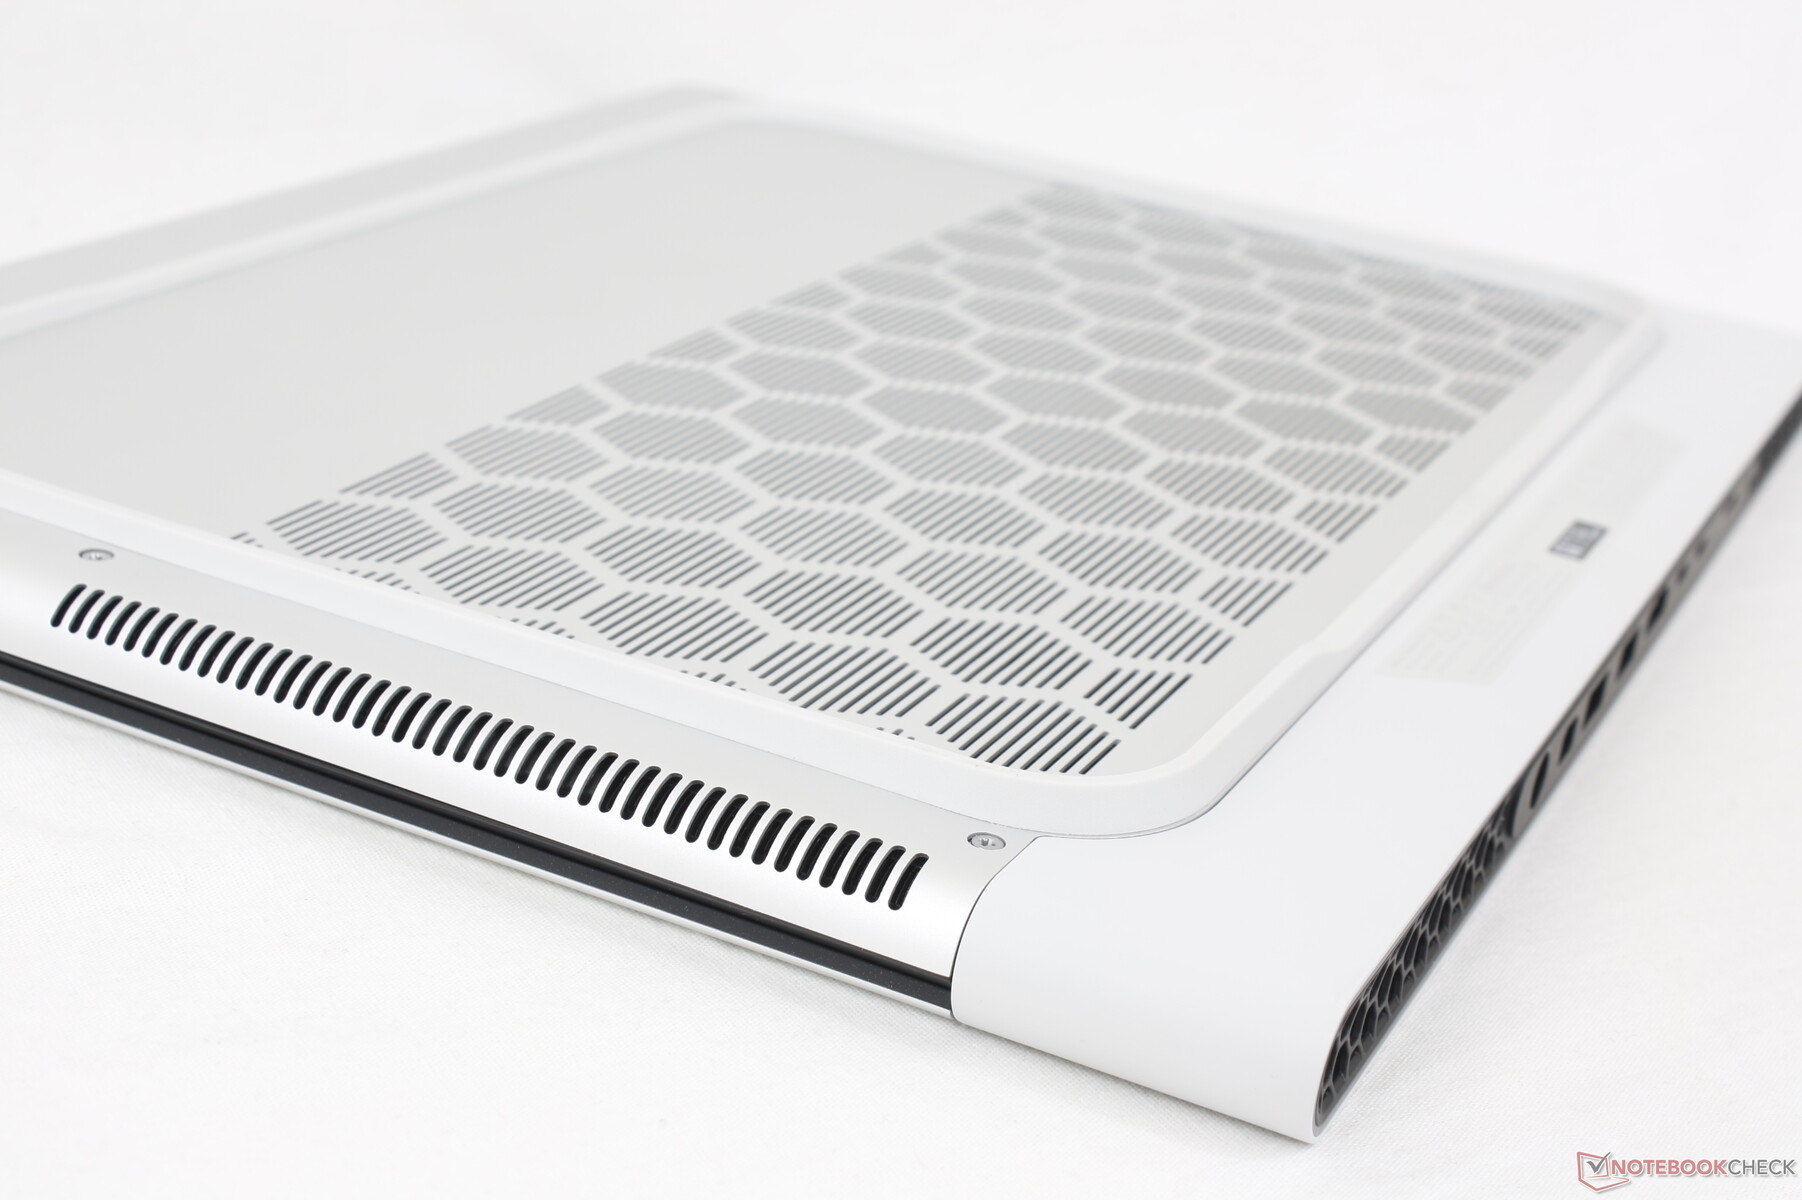
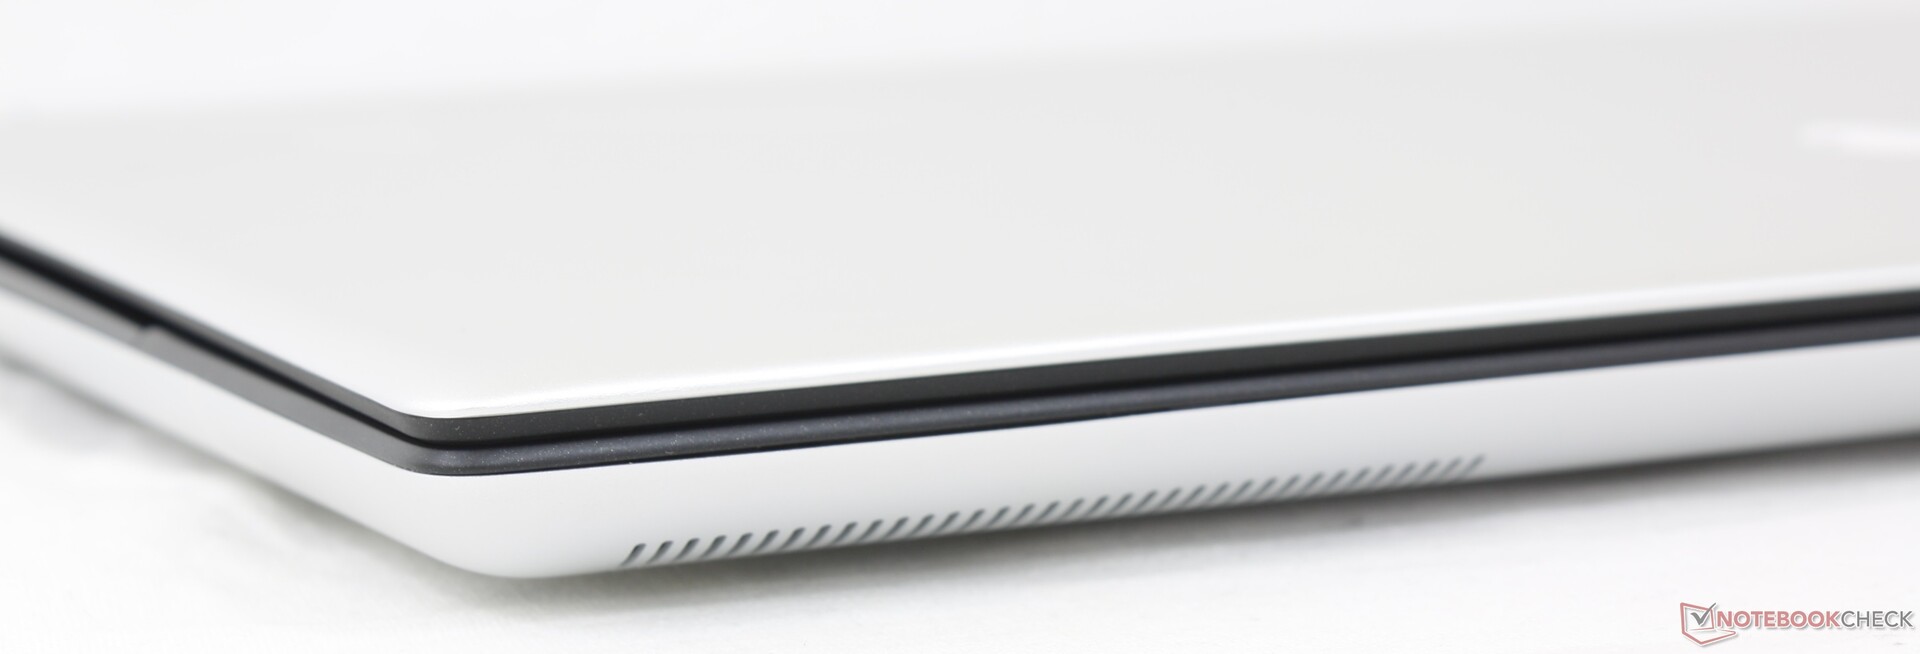
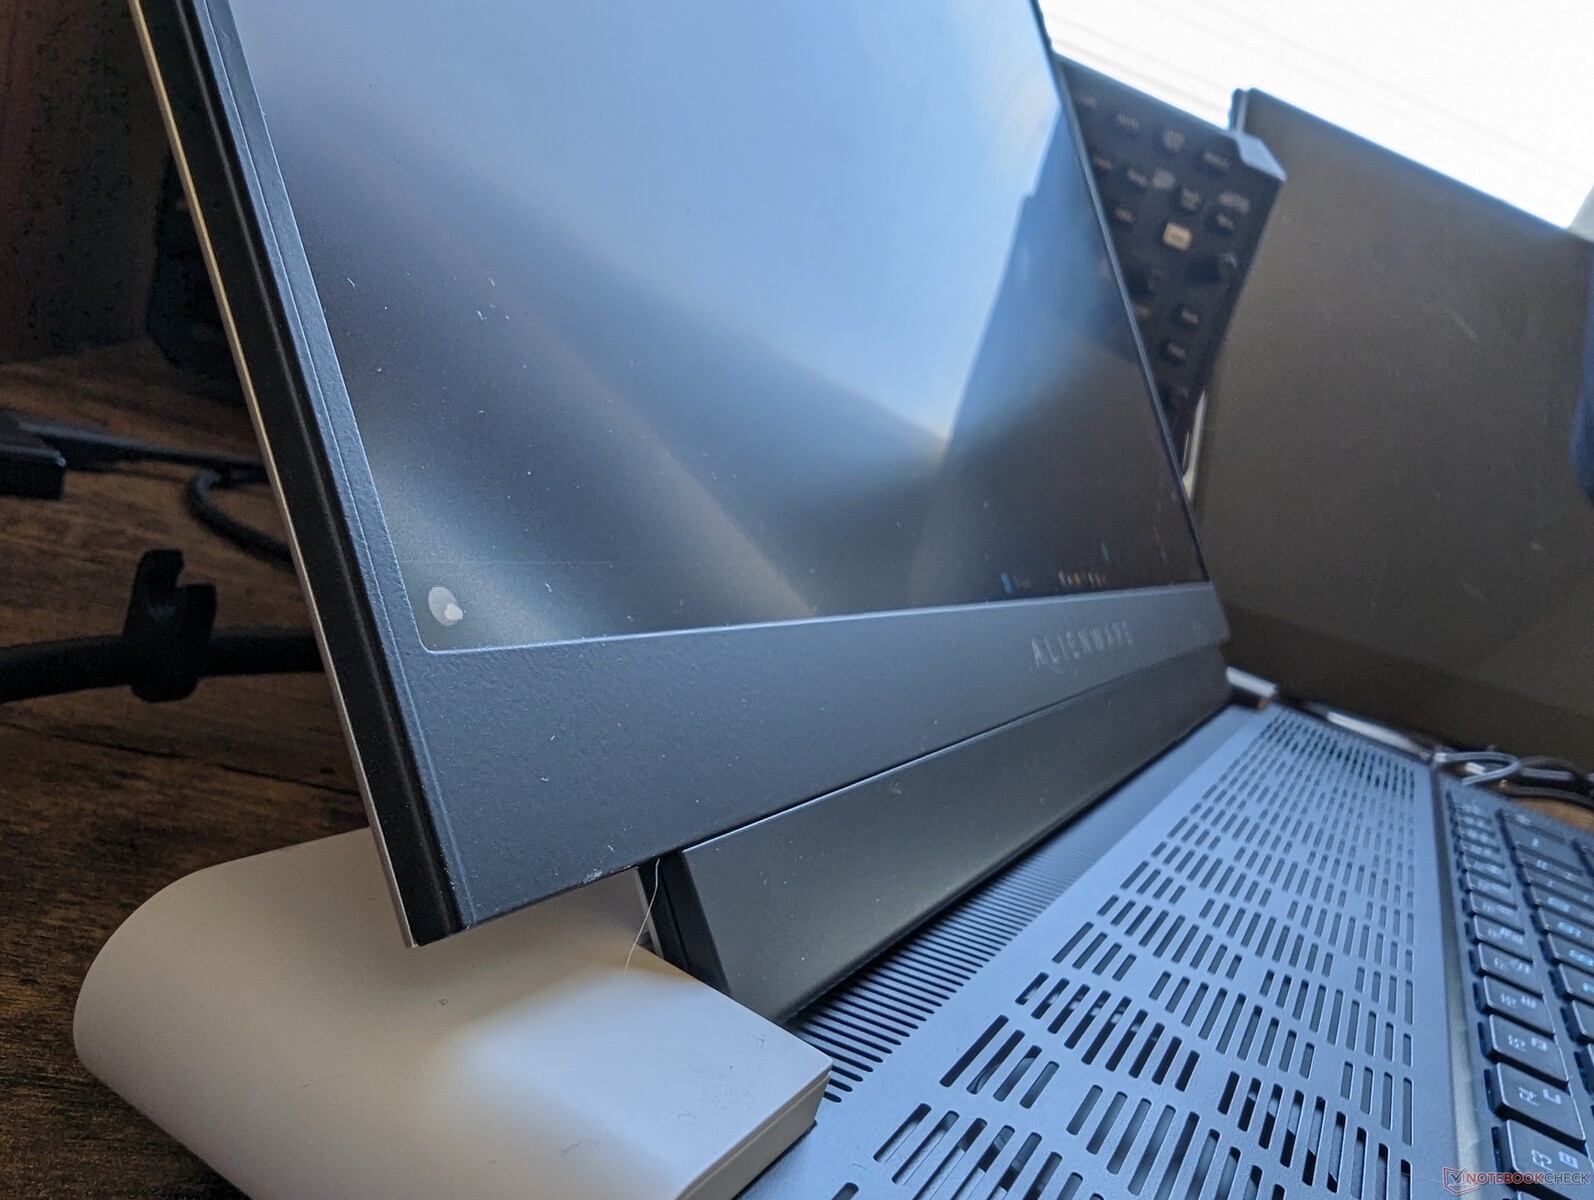
Case - Distinctly Alienware
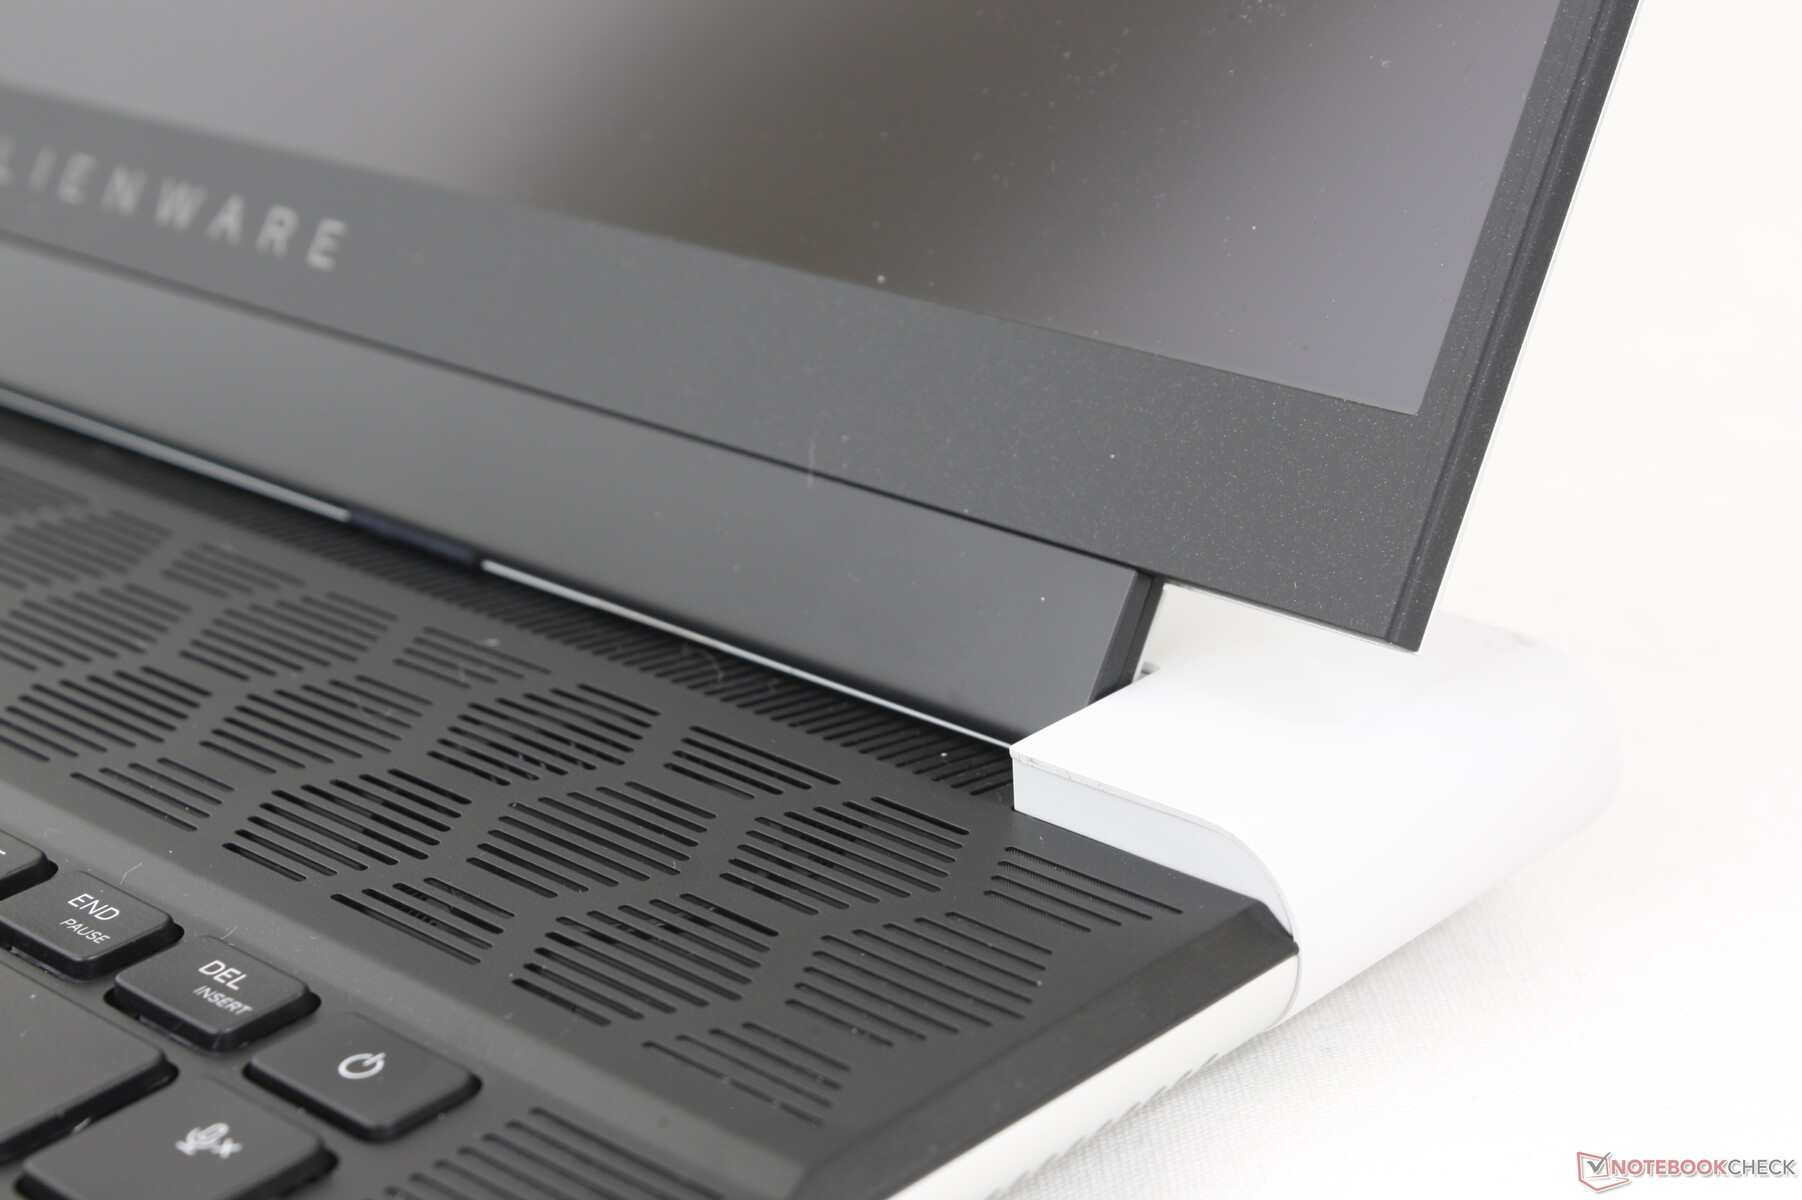
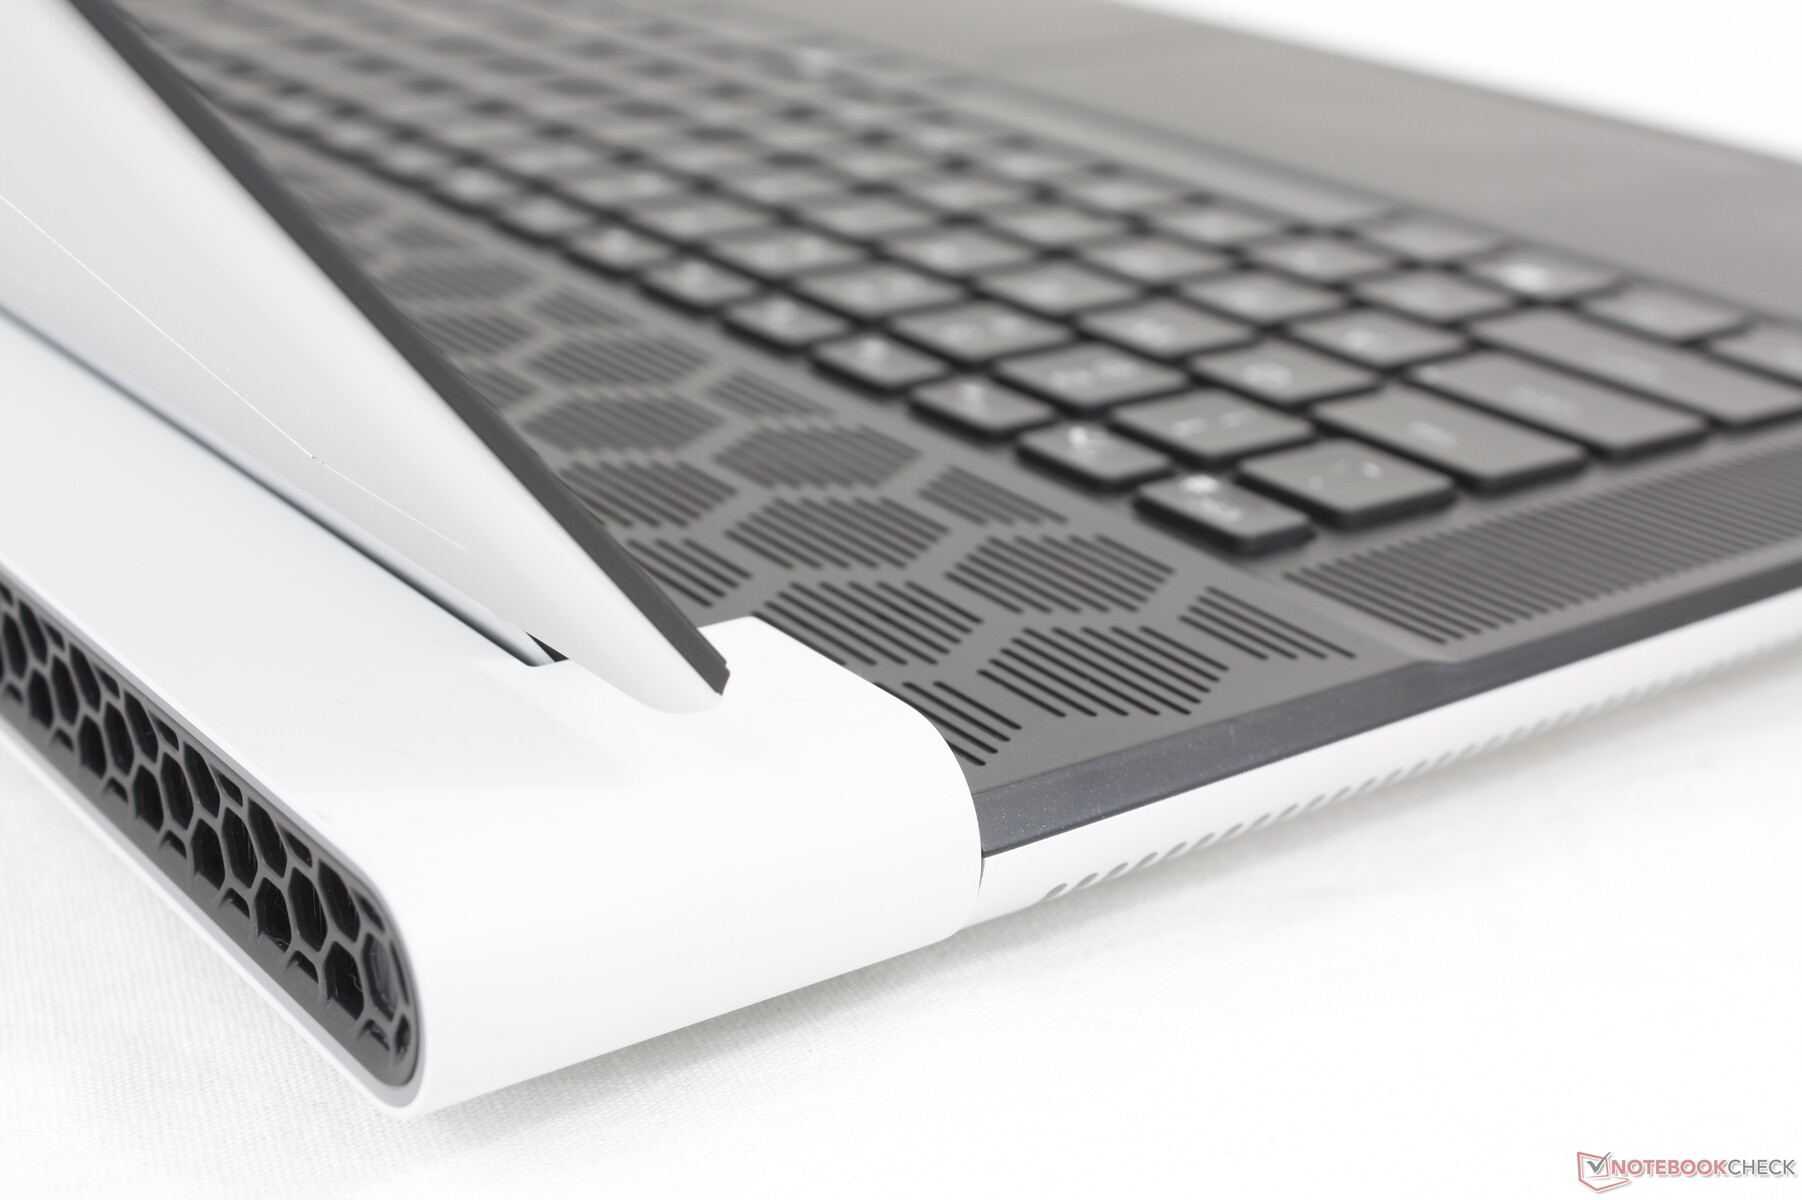
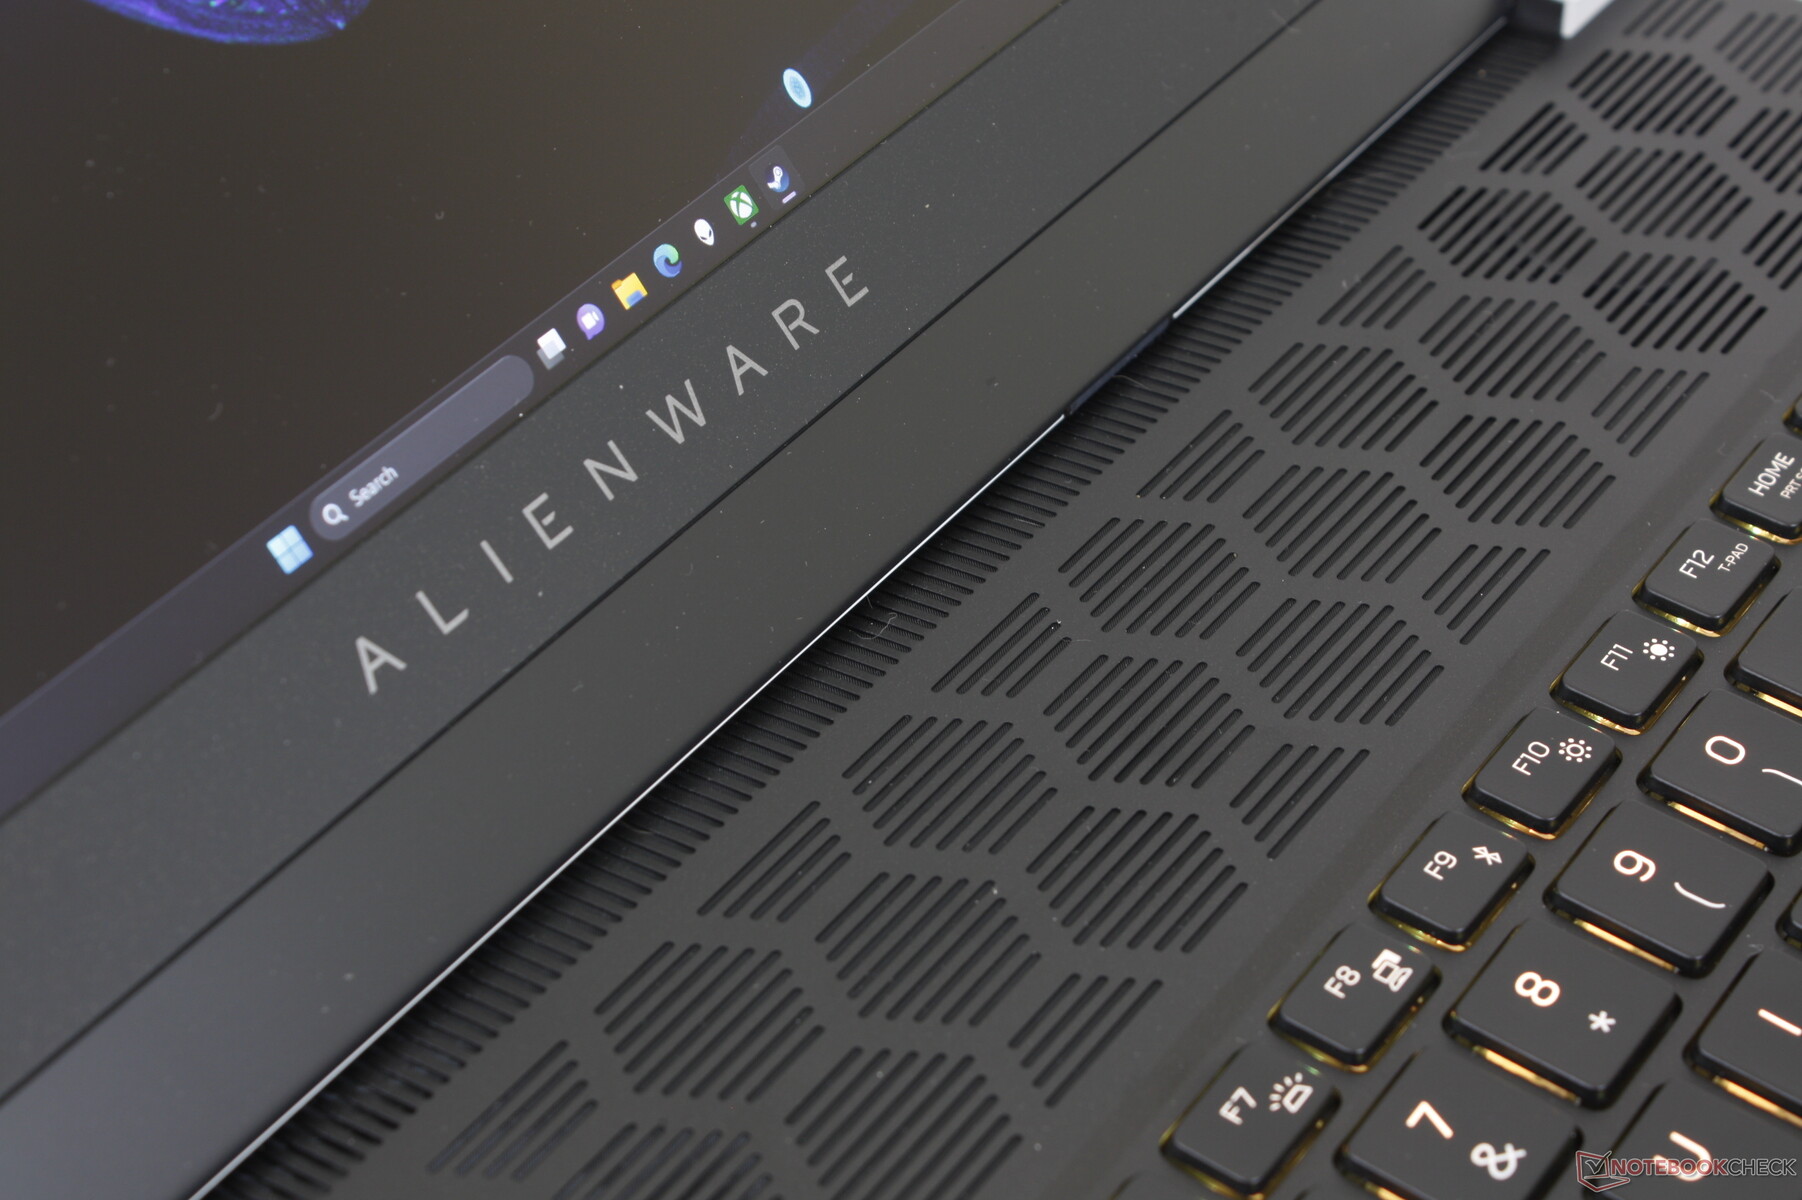
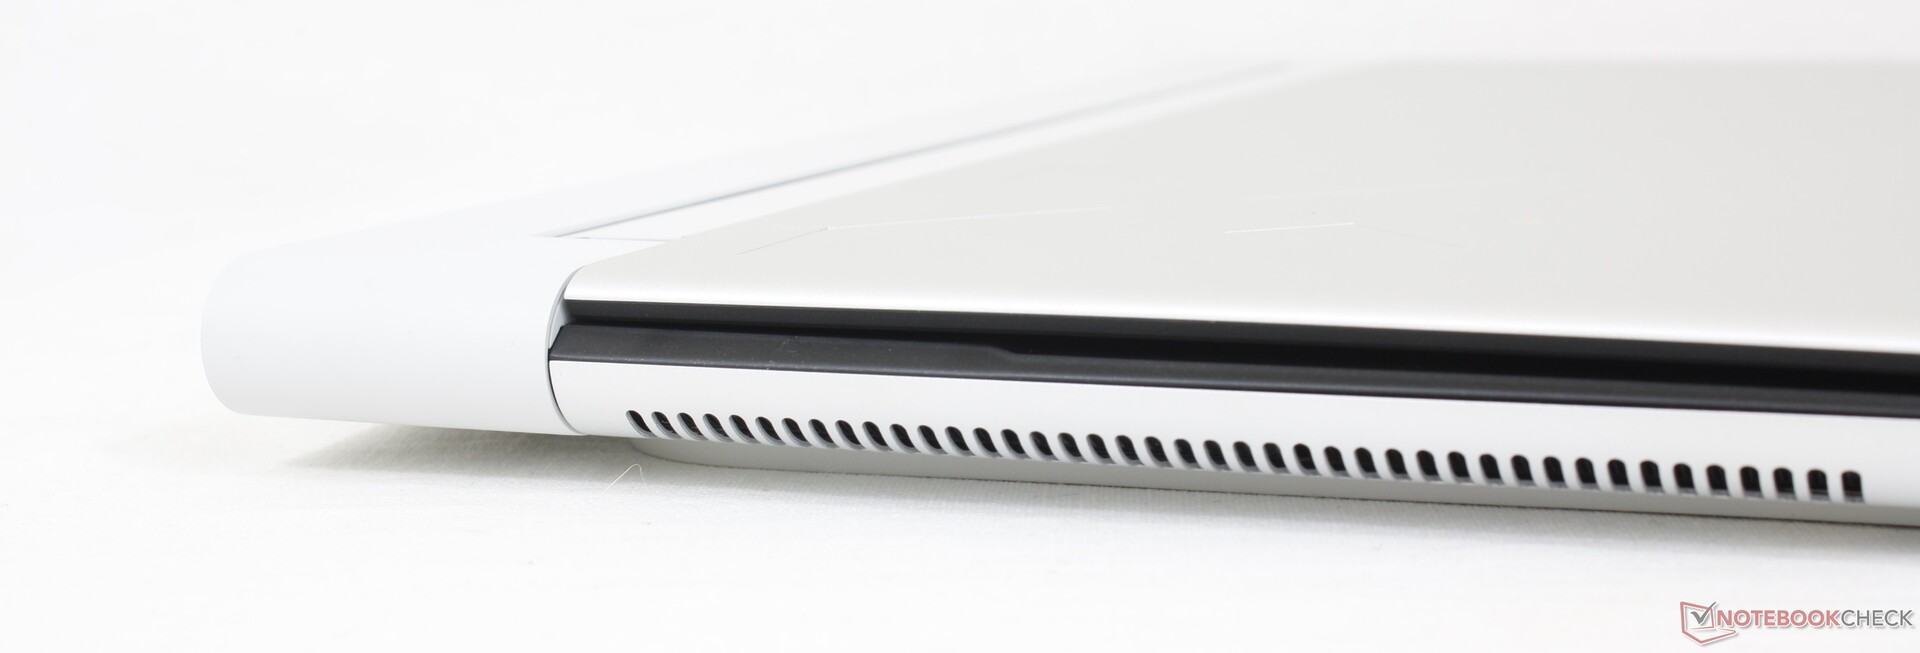
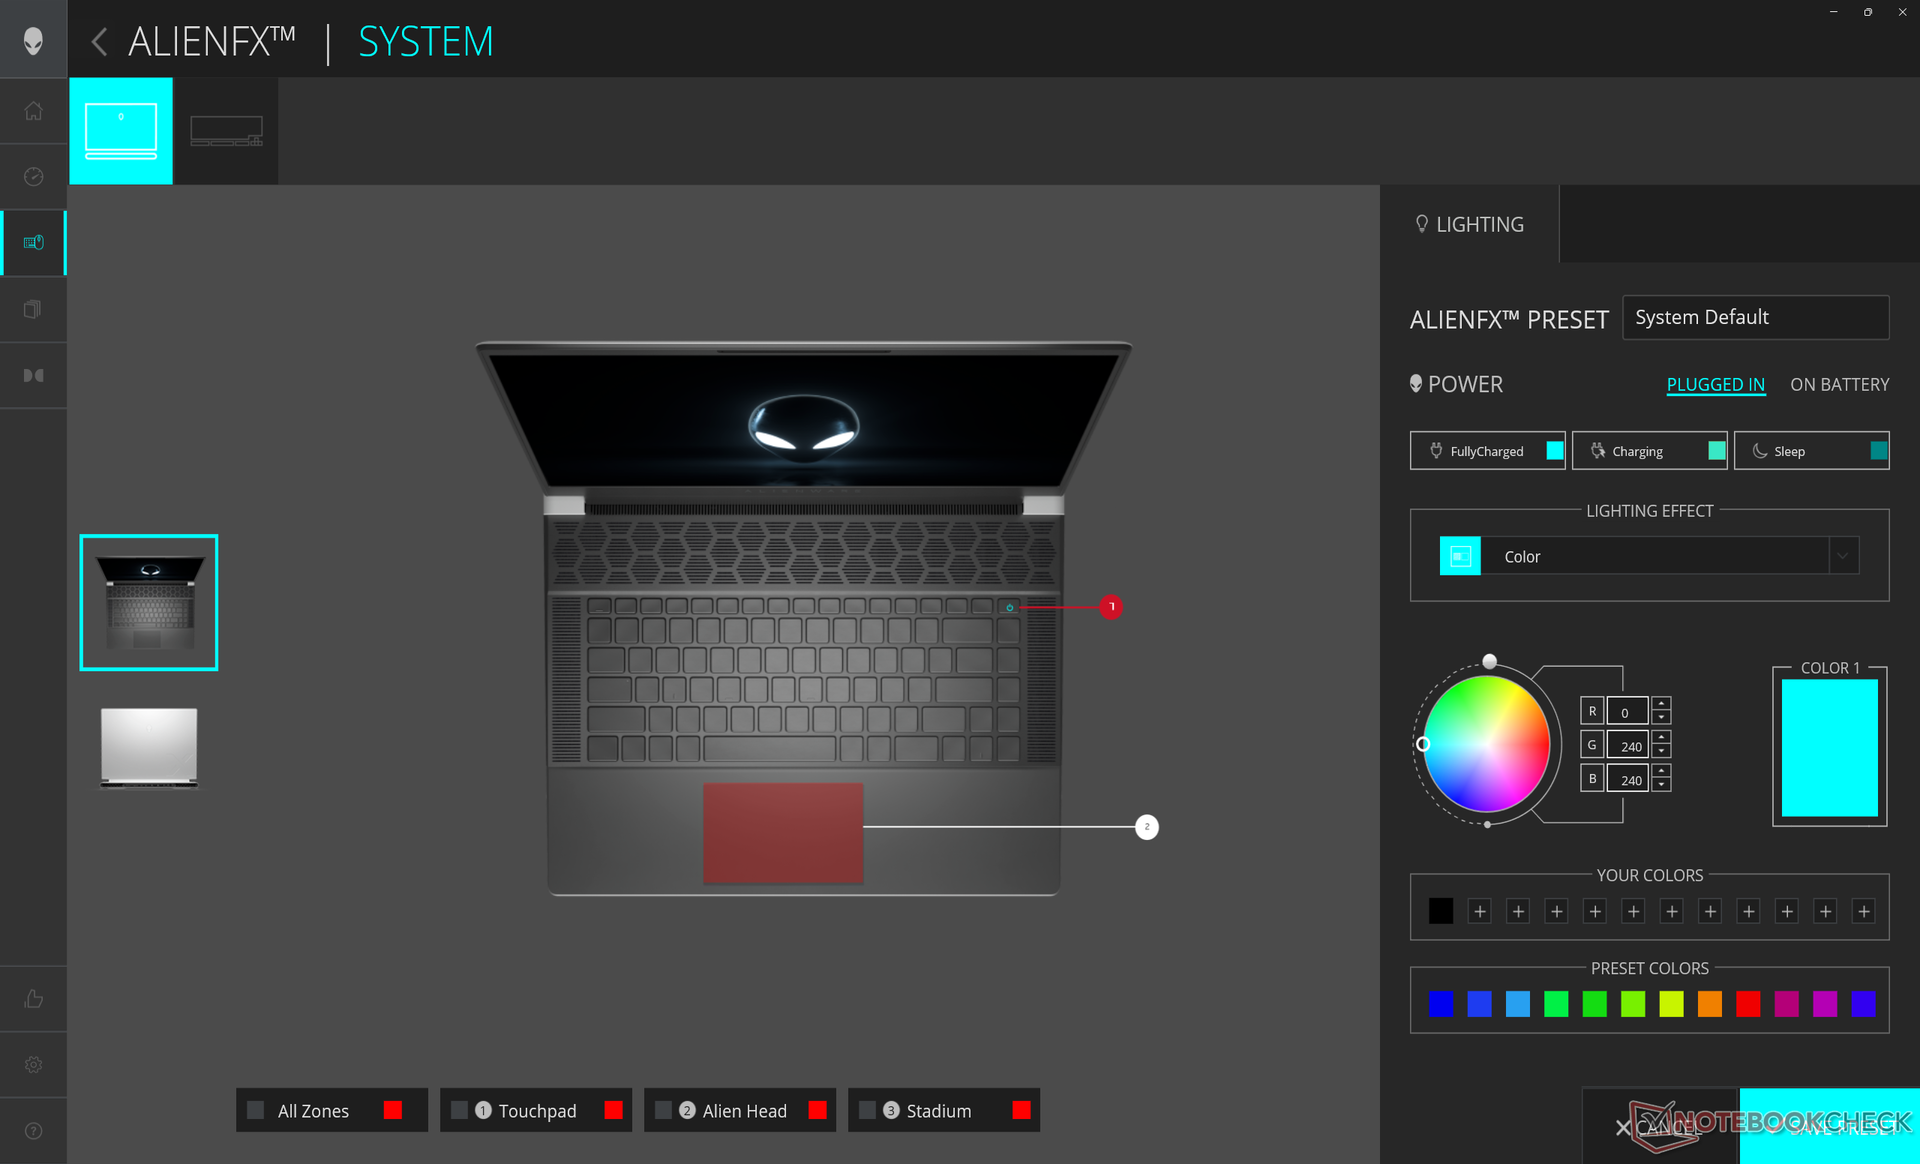
O chassi tem muito em comum com o Alienware x15 R2 e X17 R2, pois todos compartilham a linguagem de design Legend 3. Os dois tons de preto e branco, alumínio anodizado e liga de magnésio, e o anel RGB na parte traseira ajudam a distinguir visualmente a série Alienware do oceano de outros laptops para jogos. Se ele é mais atraente ou desejável do que os modelos concorrentes, depende da preferência do usuário.
A rigidez do chassi é excelente, especialmente em torno da base, onde a torção e a deformação são mínimas. A tampa e as dobradiças, no entanto, não são tão rígidas quanto gostaríamos quando comparadas com as telas mais rígidas da Série Asus Strix Scar ou do Blade 16.
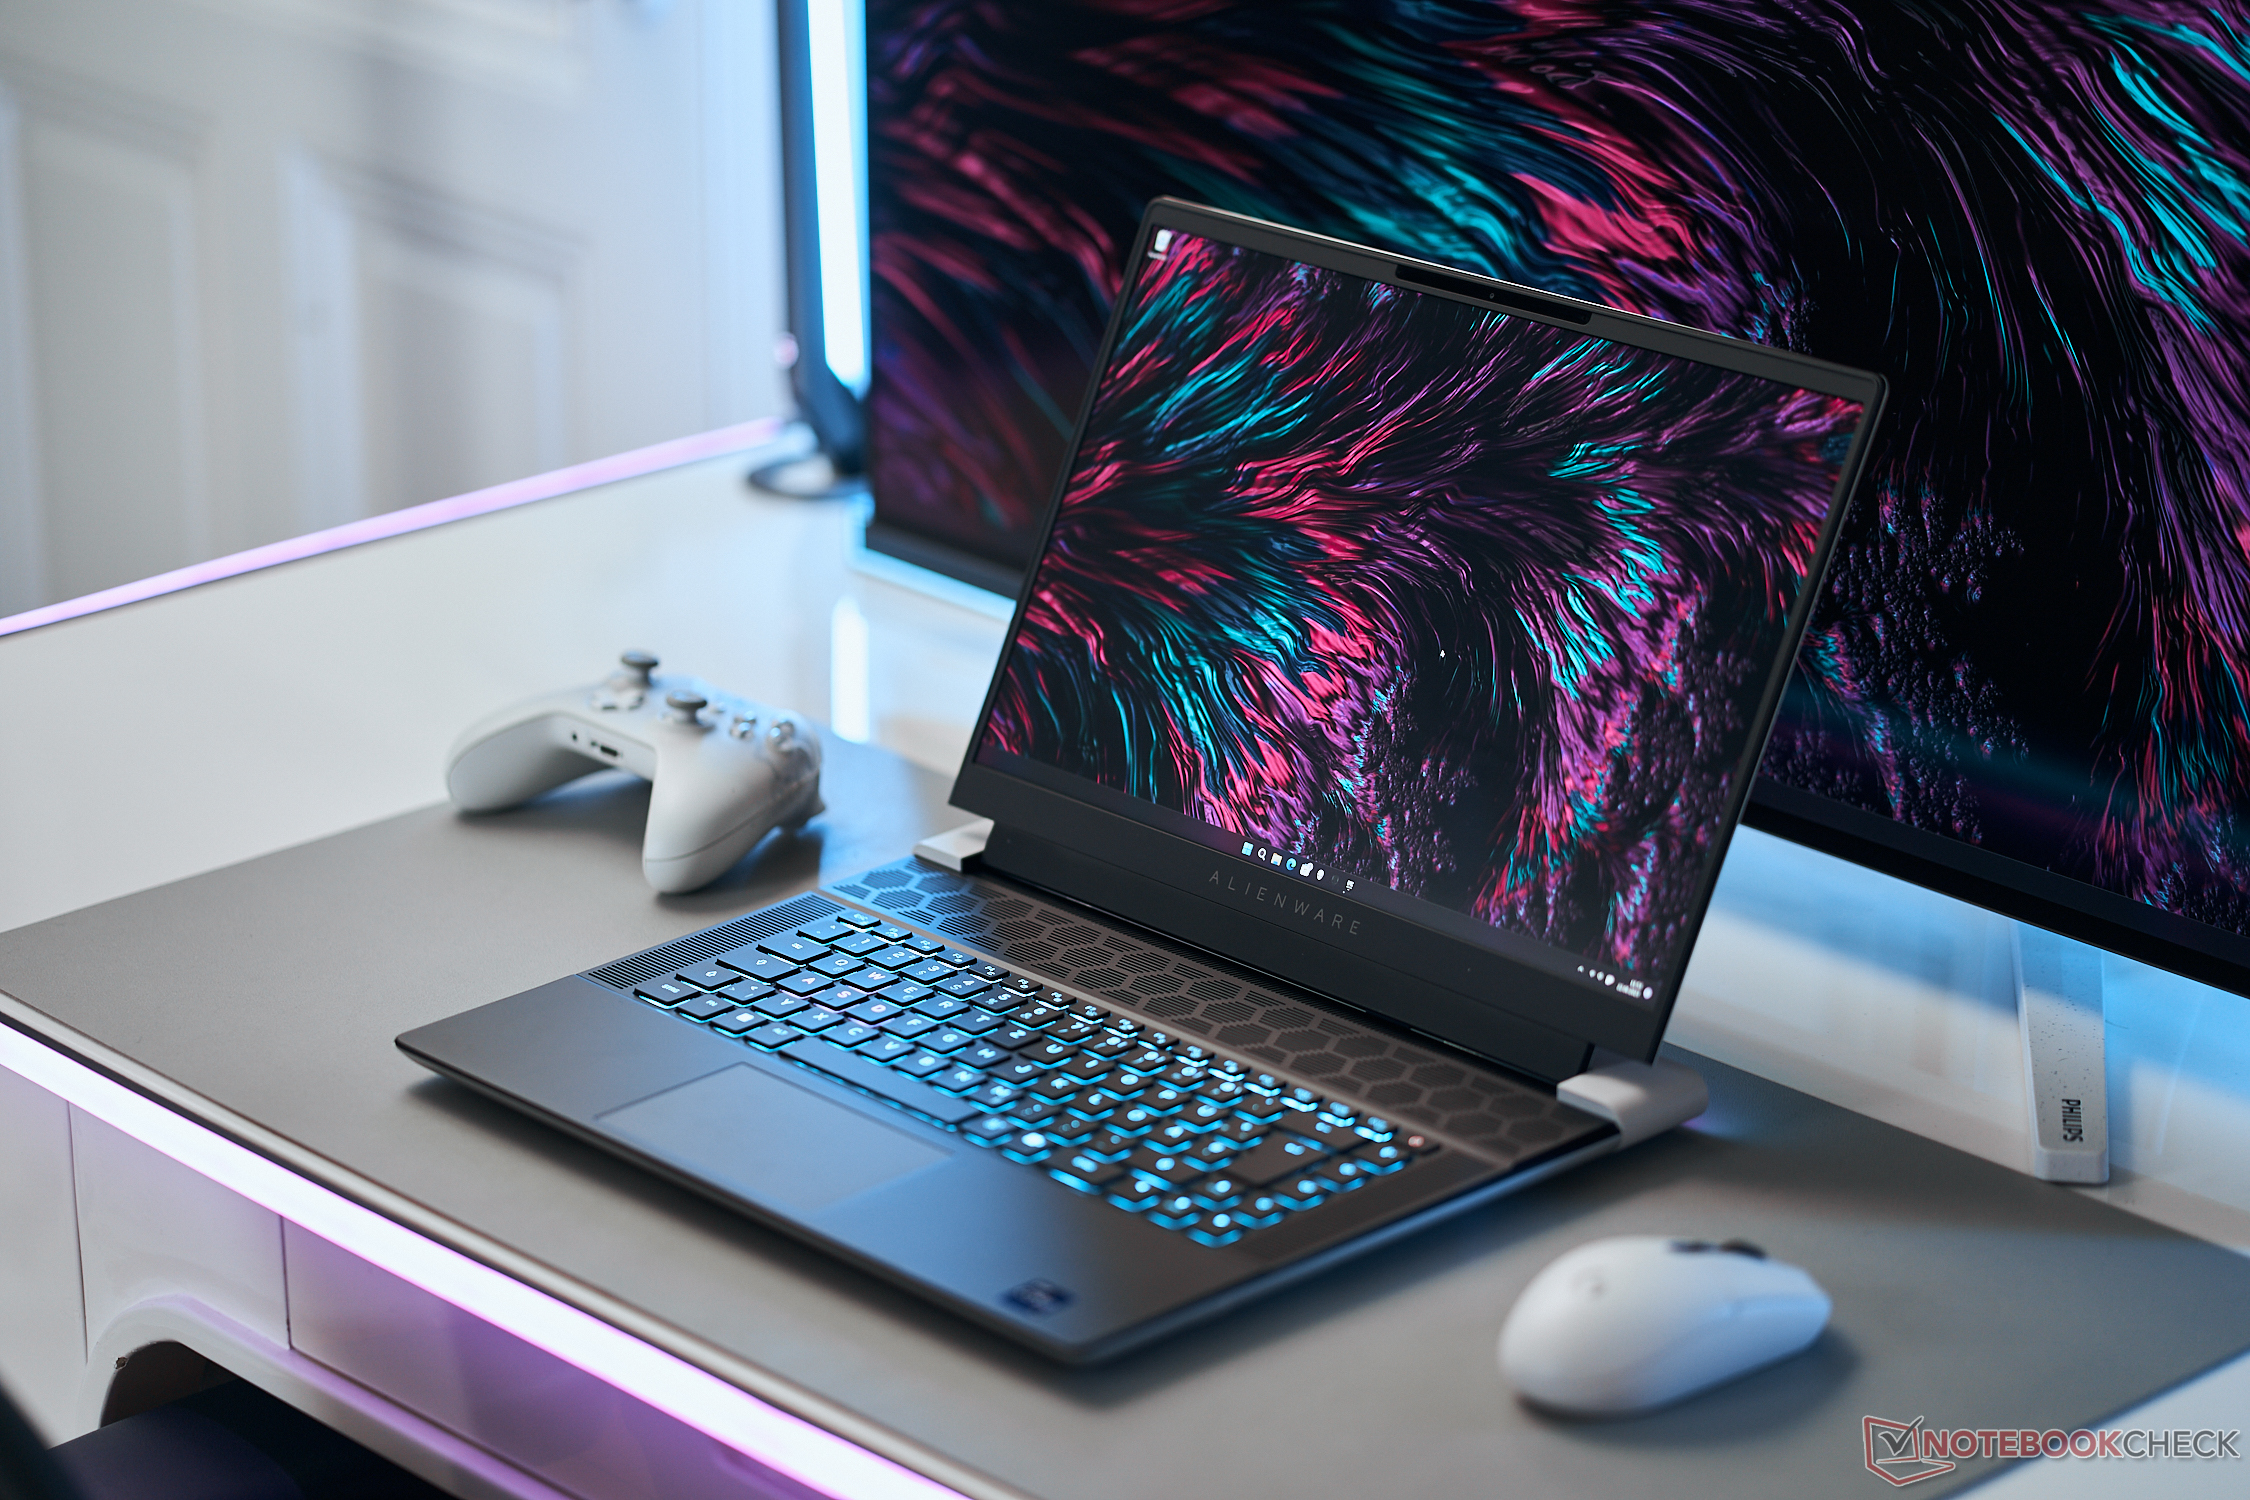
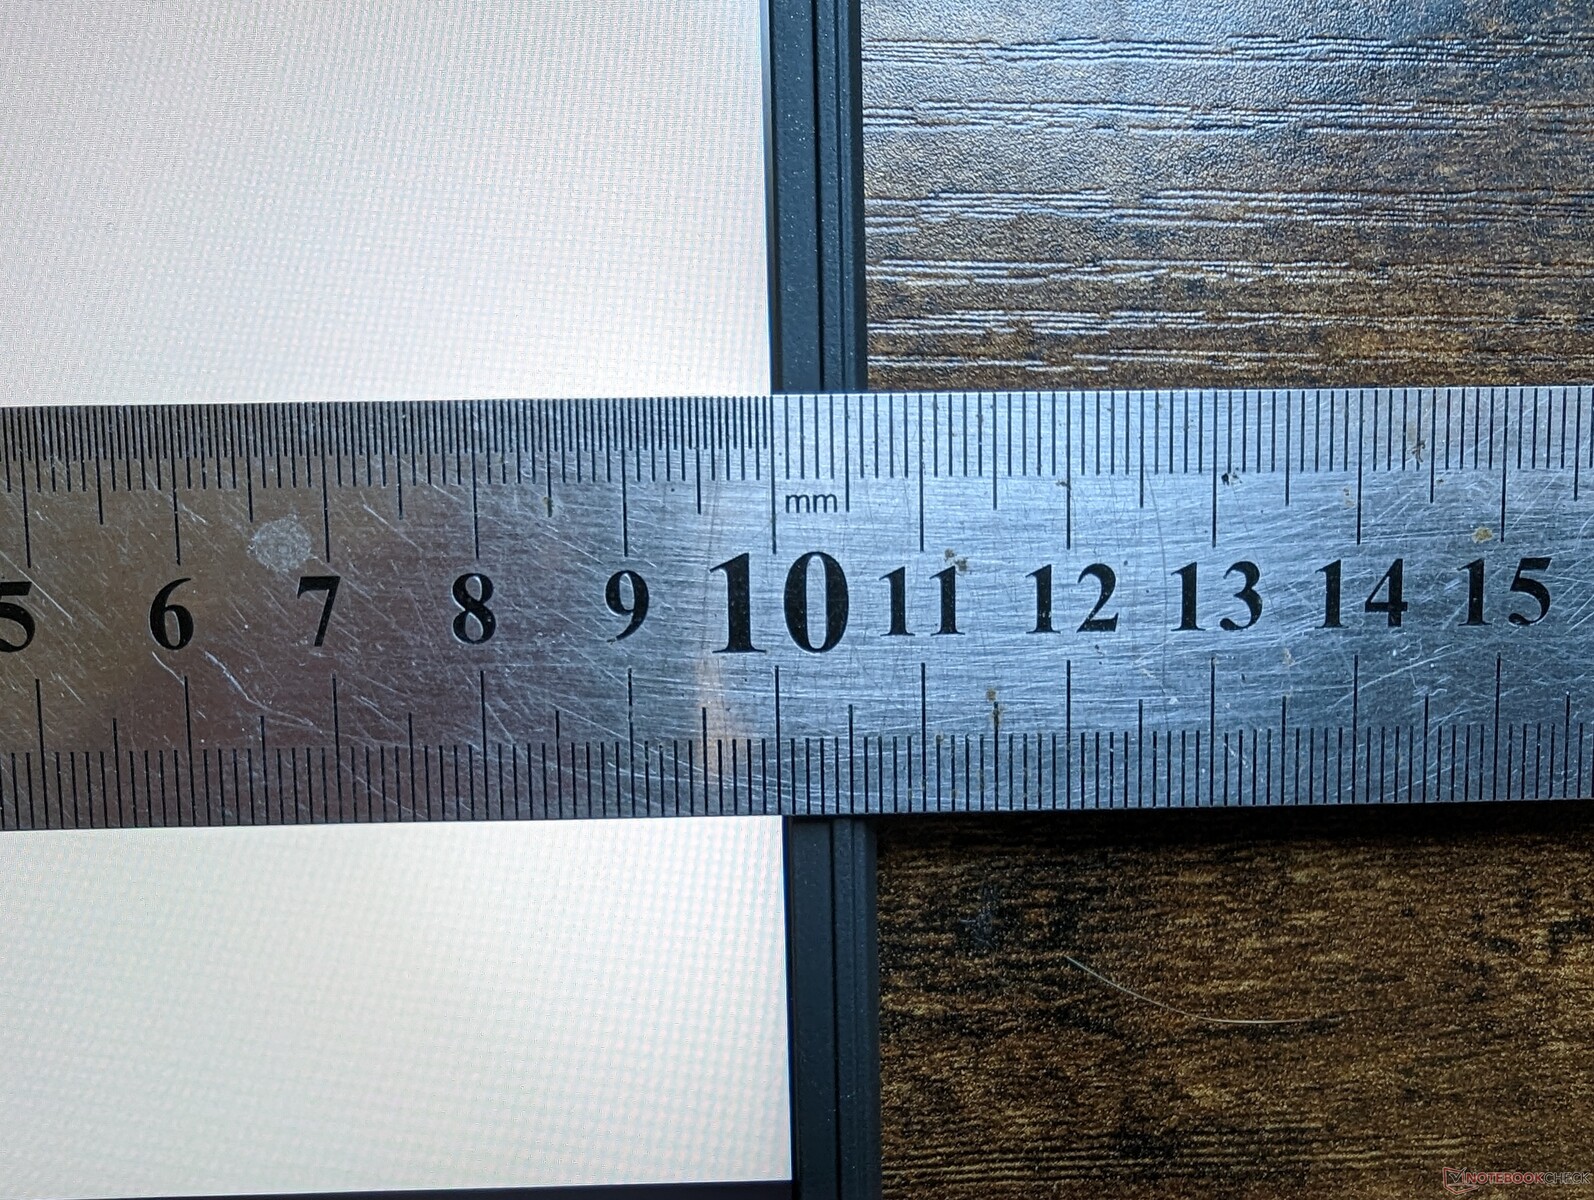
Com menos de 19 mm, o Alienware x16 é um dos laptops para jogos de 16 polegadas mais finos do mercado, mais fino até mesmo que o Razer Blade 16. Infelizmente, o sistema é mais largo e mais longo, ocupando um espaço muito maior e, portanto, seu volume geral não é menor do que o de muitos concorrentes. Por exemplo, o Alienware é quase 4 mm mais fino que o Blade 16, mas é mais longo em mais de 40 mm e, consequentemente, mais pesado em cerca de 200 gramas.
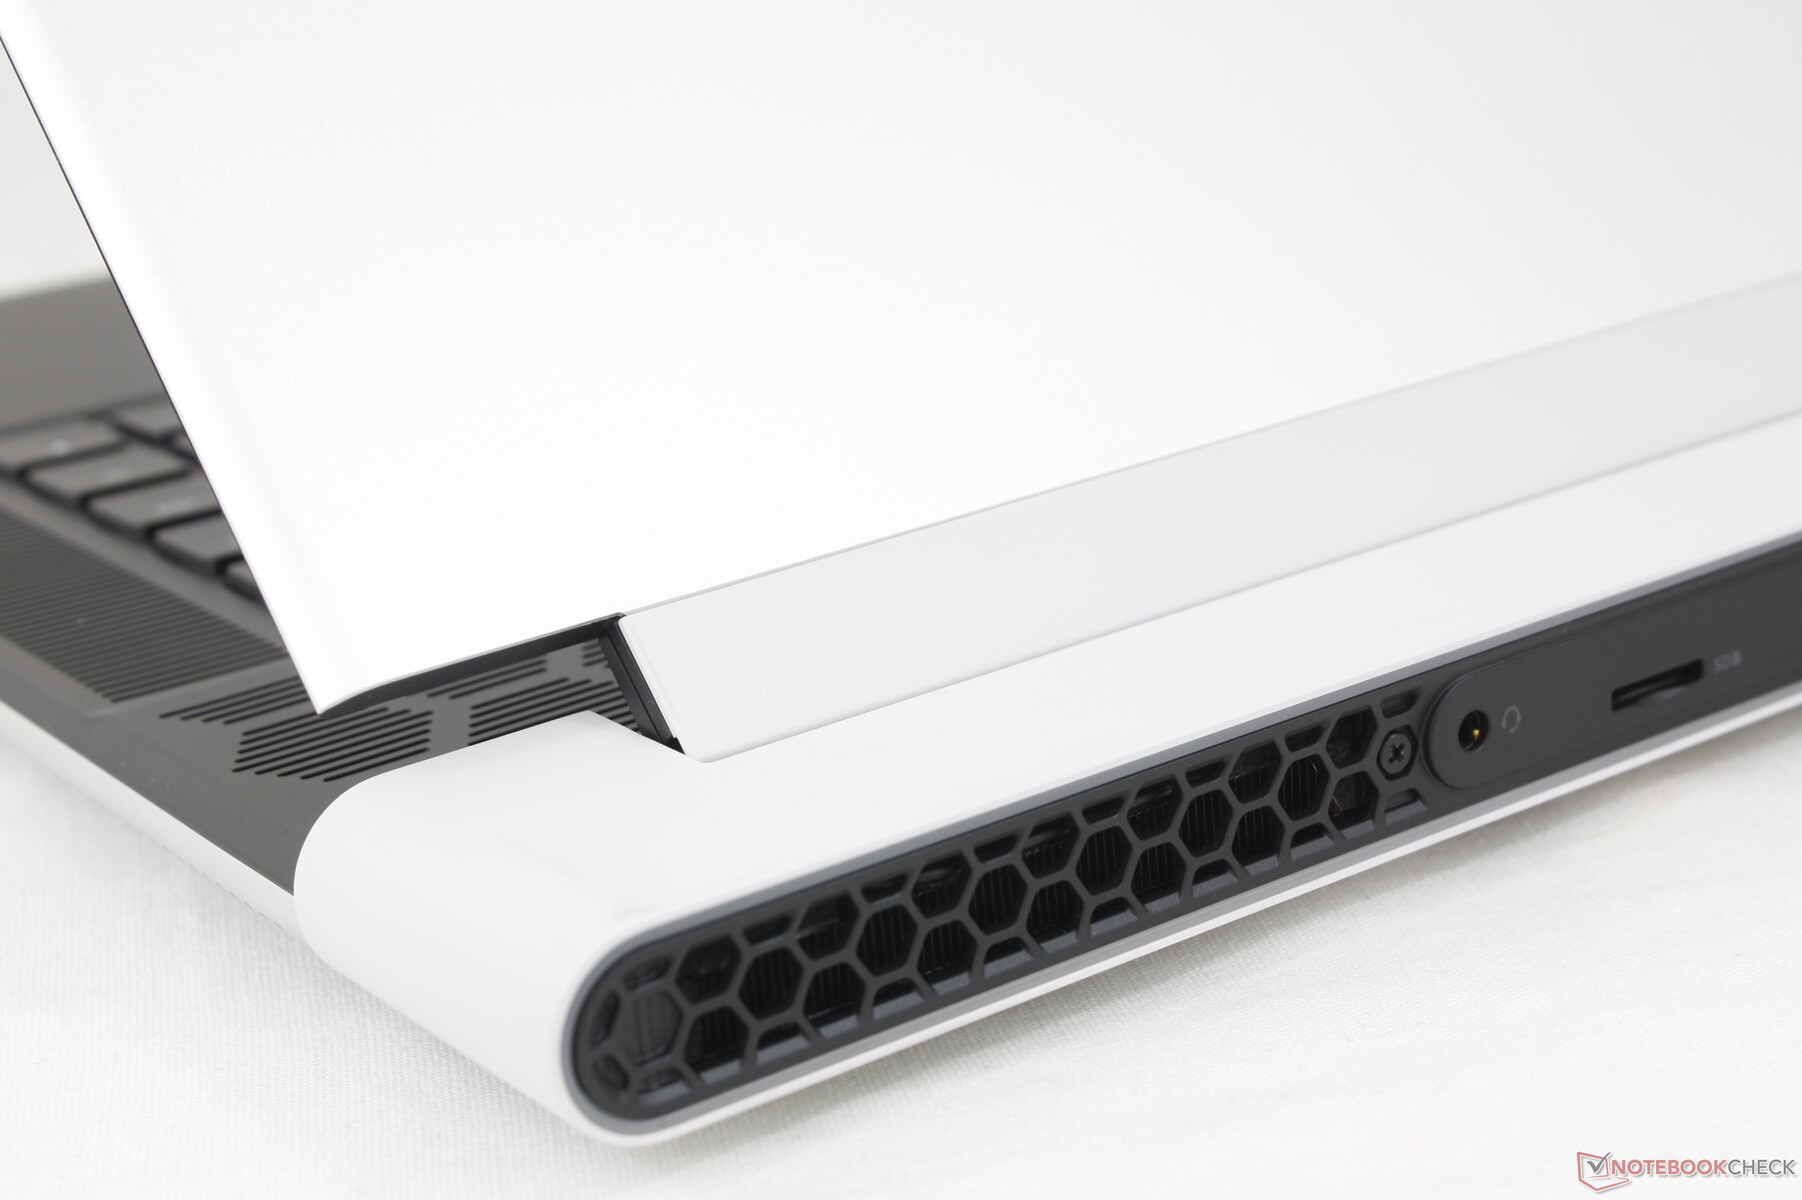
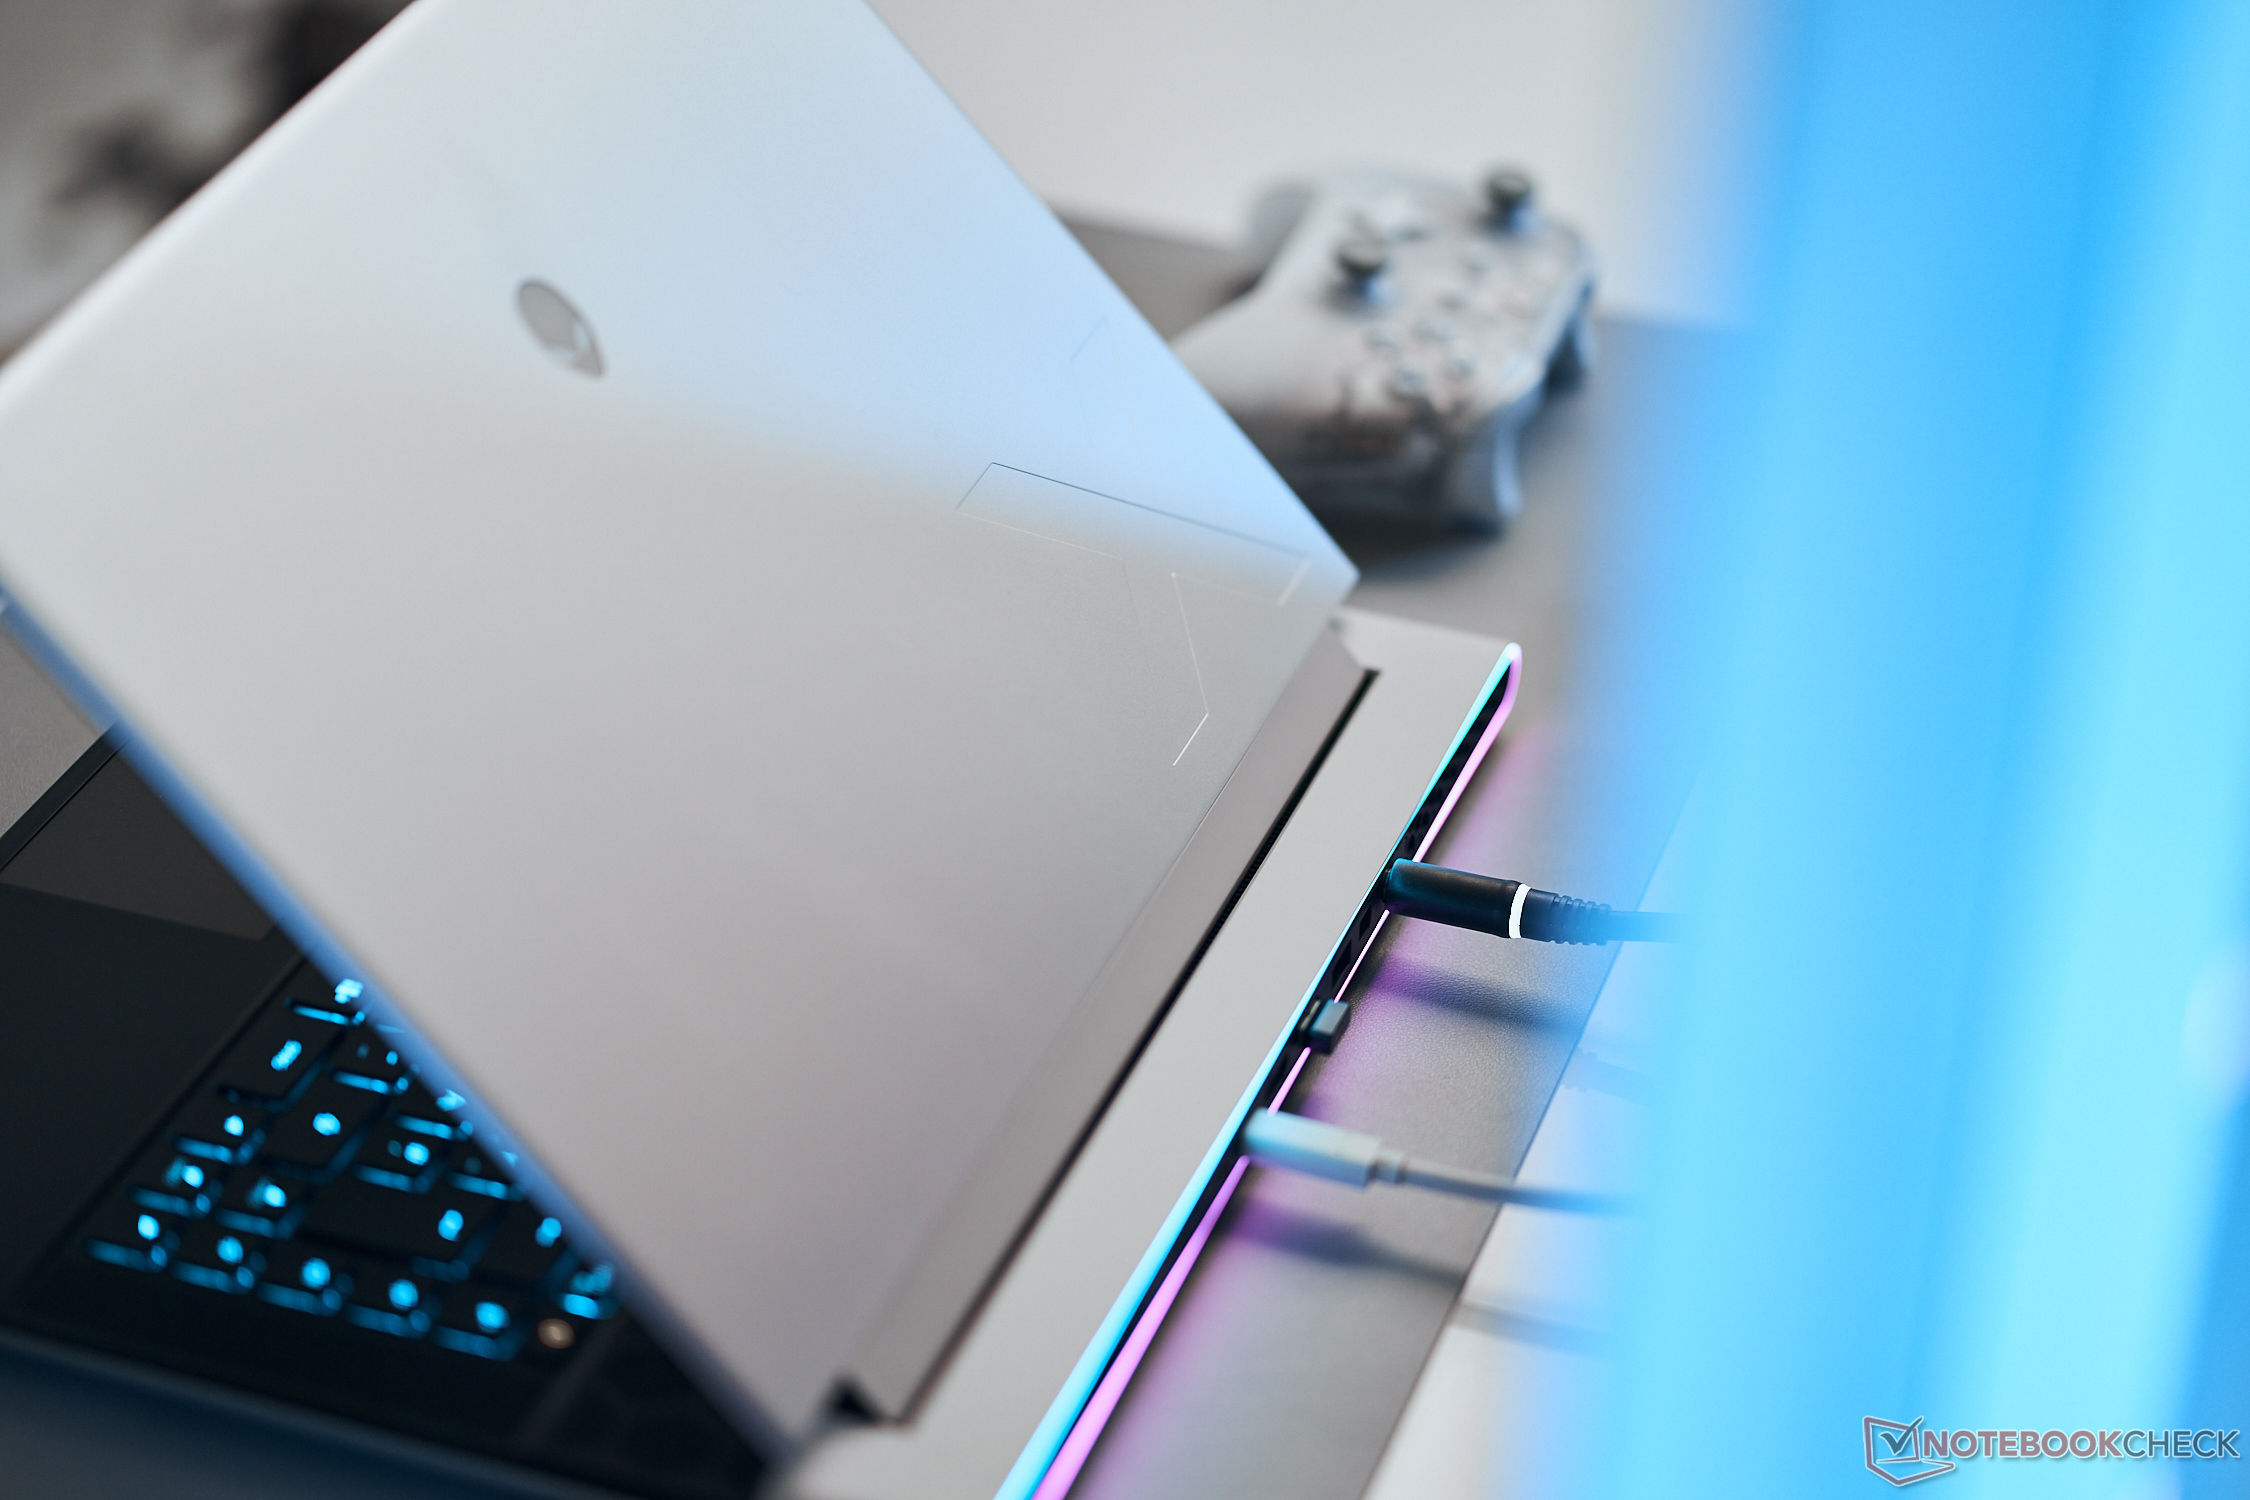
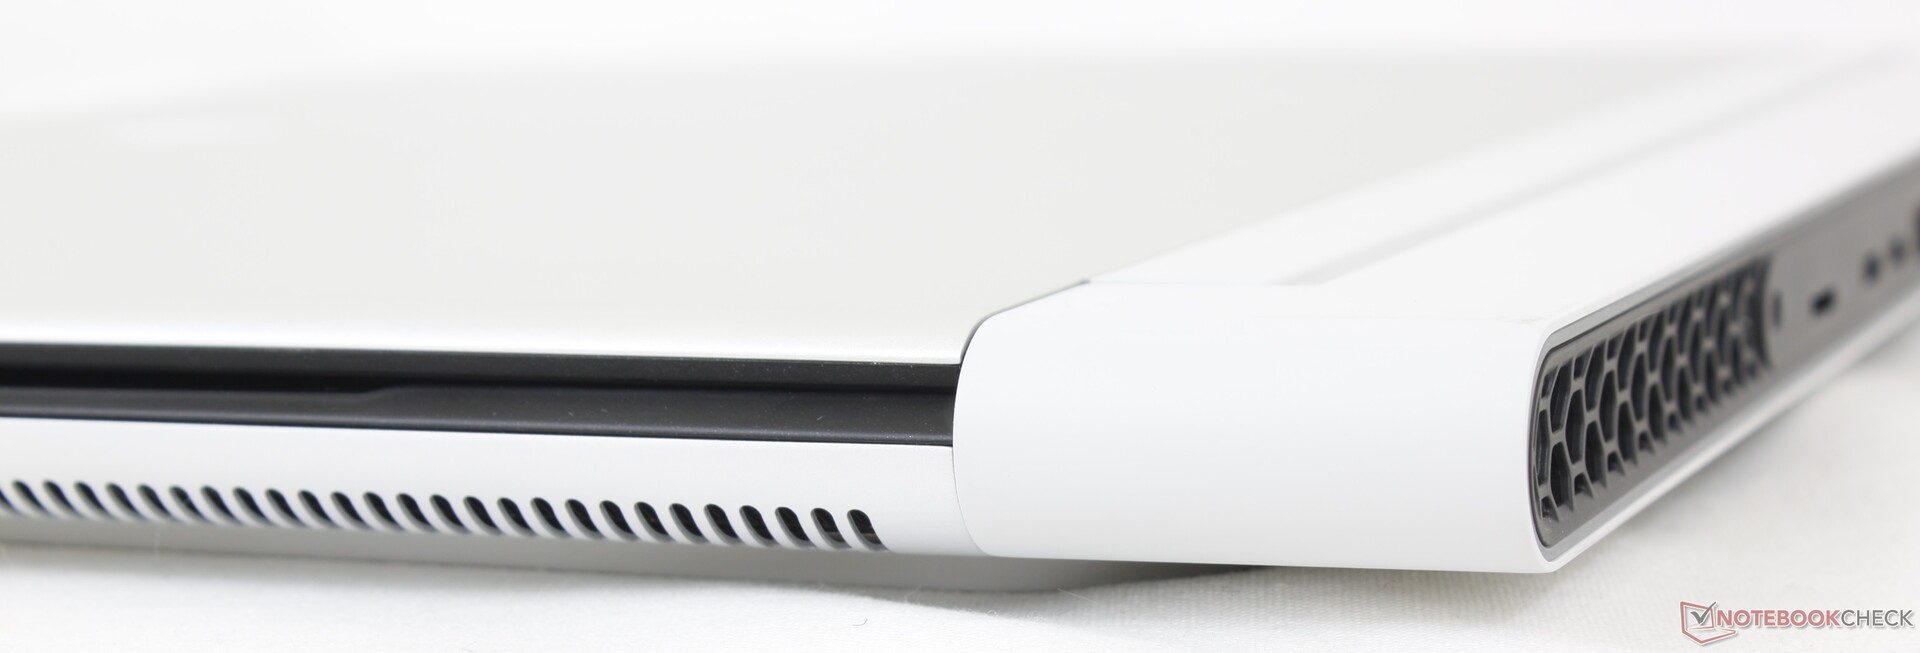
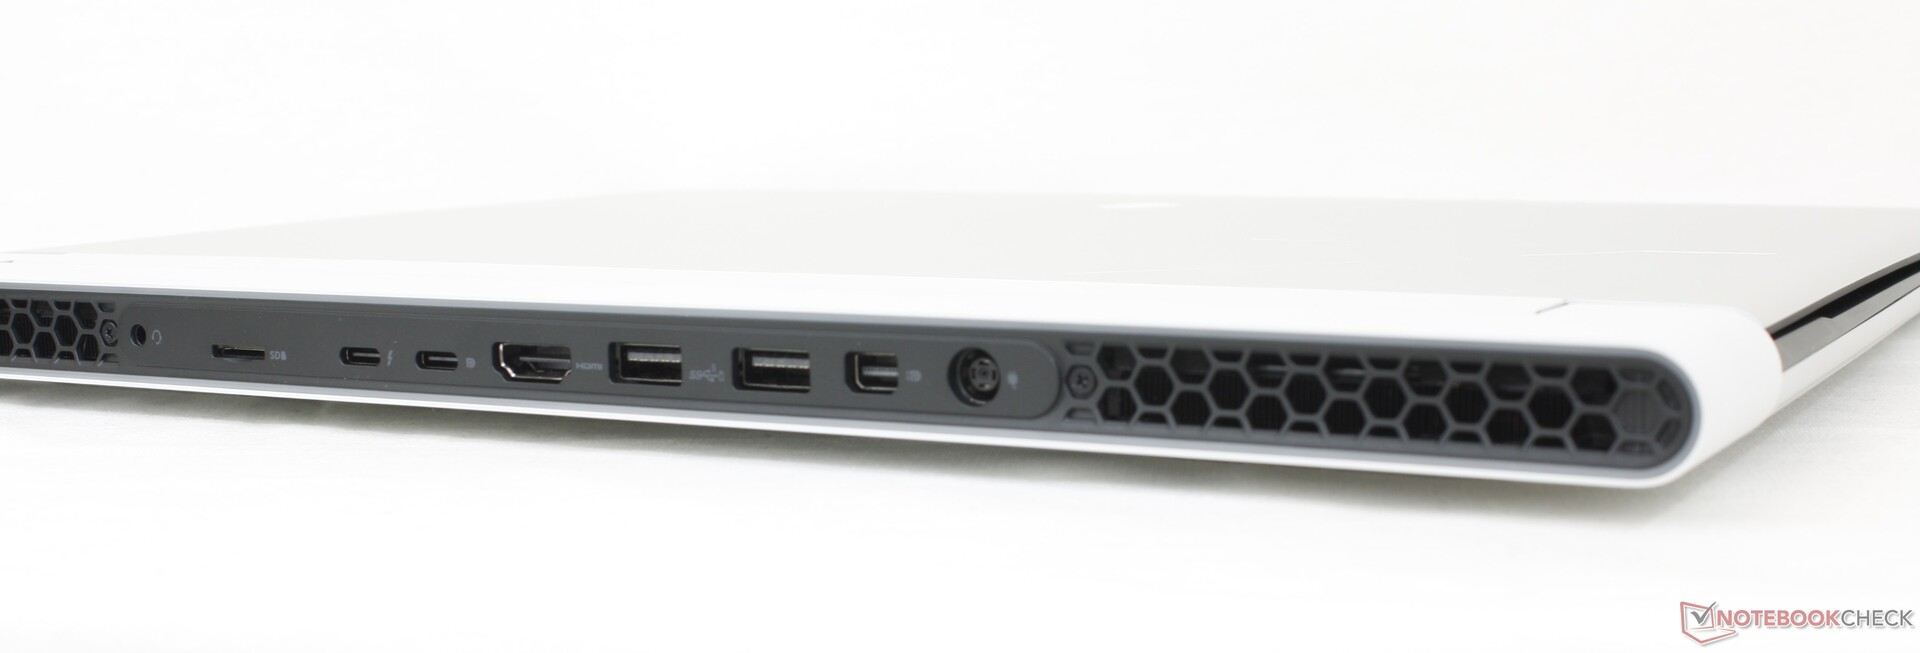
Conectividade - Nada nas laterais
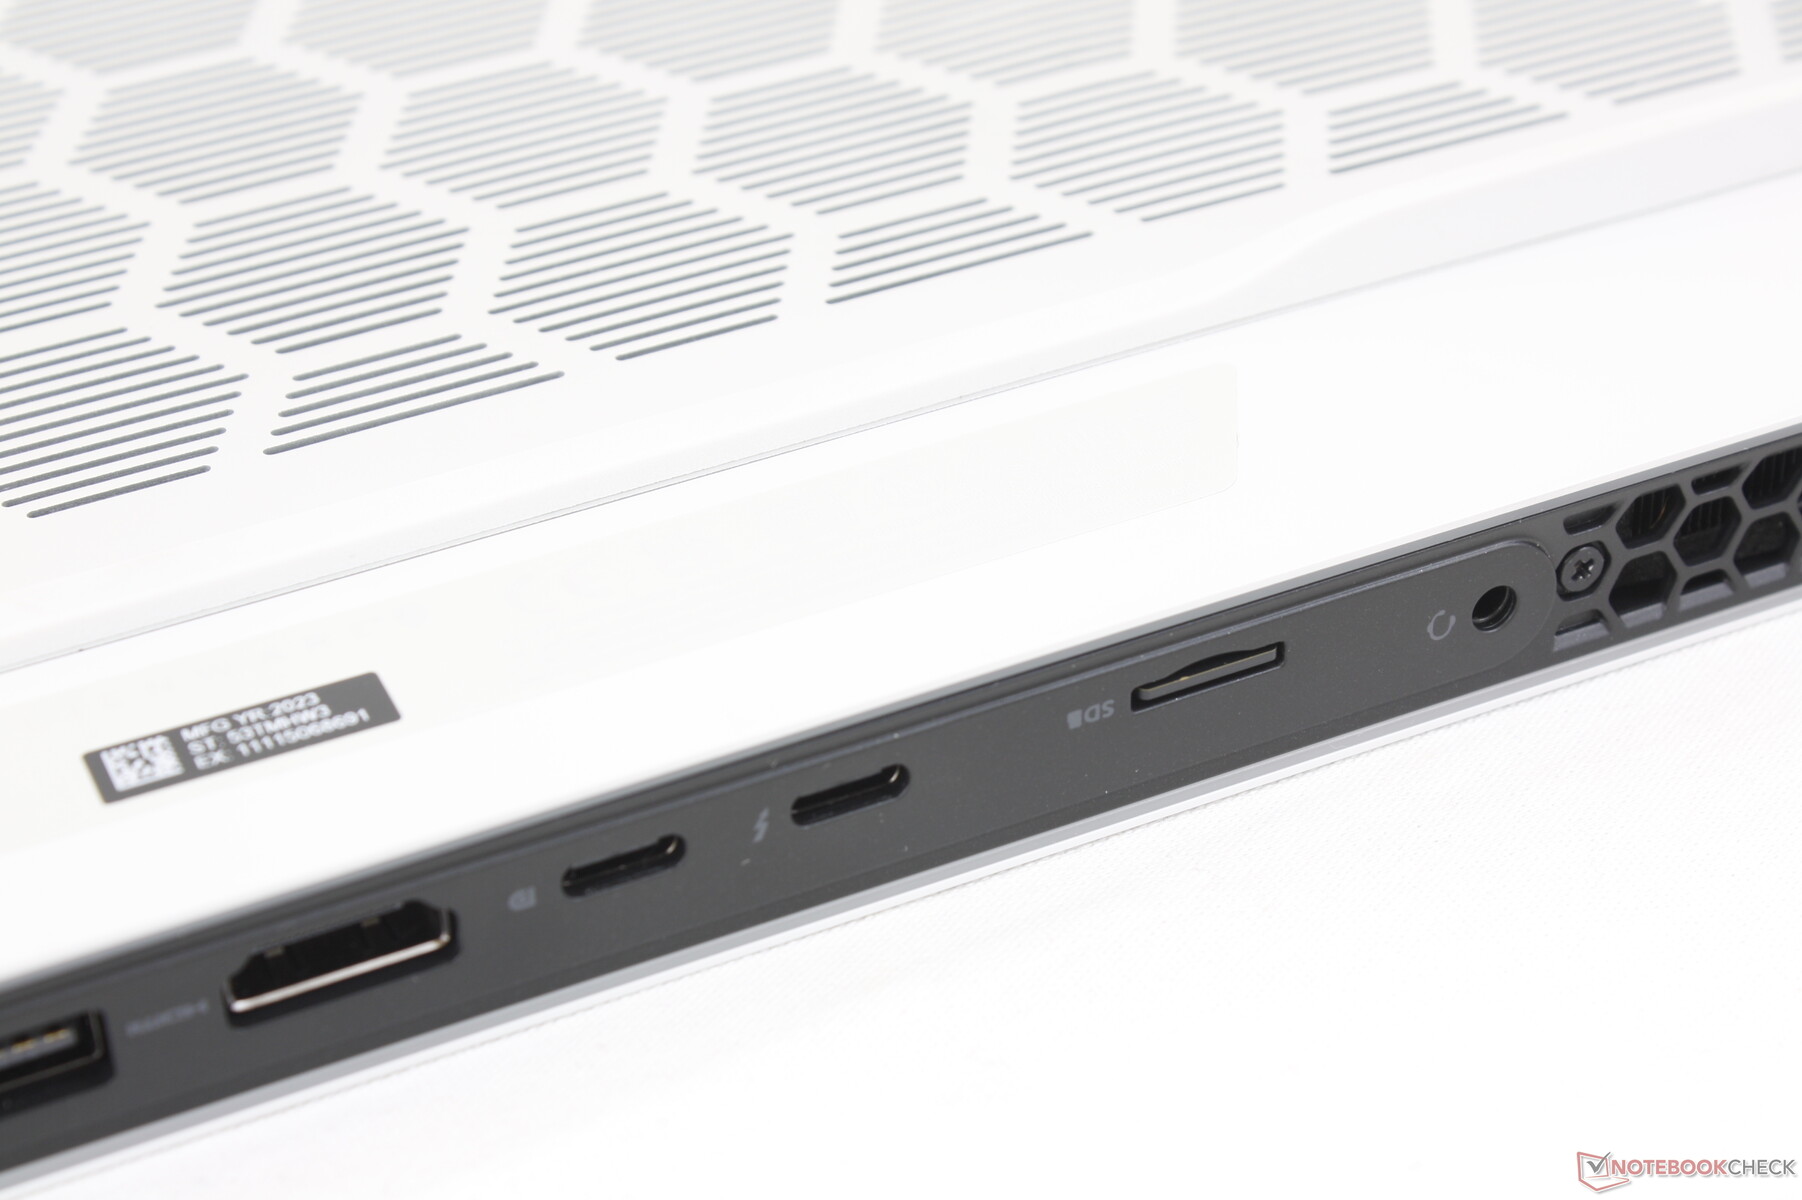
Todas as portas estão localizadas na parte traseira, o que pode ser tanto uma bênção quanto um incômodo. Por um lado, a ausência de portas laterais significa que não há cabos desagradáveis ou que causem distração. Por outro lado, o posicionamento das portas não é ideal, especialmente para as portas USB comumente usadas.
Lembre-se de que o Thunderbolt 4 é compatível com apenas uma das duas portas USB-C.
Leitor de cartão SD
A SSD AS informa uma taxa de leitura sequencial de 256,1 MB/s, enquanto um teste real de transferência de 1 GB de fotos seria muito mais lento, com apenas 57 MB/s com nosso cartão de teste MicroSD UHS-II, mesmo após várias tentativas.
Diferentemente da maioria dos outros notebooks, o leitor de MicroSD está localizado na parte traseira do chassi e não nas laterais.
| SD Card Reader | |
| average JPG Copy Test (av. of 3 runs) | |
| Asus ROG Zephyrus M16 GU604VY-NM042X | |
| Razer Blade 16 Early 2023 (AV PRO microSD 128 GB V60) | |
| Alienware x16 R1 (AV PRO microSD 128 GB V60) | |
| maximum AS SSD Seq Read Test (1GB) | |
| Alienware x16 R1 (AV PRO microSD 128 GB V60) | |
| Razer Blade 16 Early 2023 (AV PRO microSD 128 GB V60) | |
| Asus ROG Zephyrus M16 GU604VY-NM042X | |
Comunicação
| Networking | |
| iperf3 transmit AXE11000 | |
| Lenovo Legion Pro 7 16IRX8H | |
| Razer Blade 16 Early 2023 | |
| Alienware x16 R1 | |
| Alienware m17 R5 (R9 6900HX, RX 6850M XT) | |
| Dell G16 7620 | |
| iperf3 receive AXE11000 | |
| Lenovo Legion Pro 7 16IRX8H | |
| Razer Blade 16 Early 2023 | |
| Alienware x16 R1 | |
| Dell G16 7620 | |
| Alienware m17 R5 (R9 6900HX, RX 6850M XT) | |
| iperf3 transmit AXE11000 6GHz | |
| Asus ROG Zephyrus M16 GU604VY-NM042X | |
| Razer Blade 16 Early 2023 | |
| Alienware x16 R1 | |
| iperf3 receive AXE11000 6GHz | |
| Asus ROG Zephyrus M16 GU604VY-NM042X | |
| Razer Blade 16 Early 2023 | |
| Alienware x16 R1 | |
Webcam
Uma webcam de 2 MP é padrão, juntamente com suporte para IR for Hello. No entanto, não há obturador de privacidade.


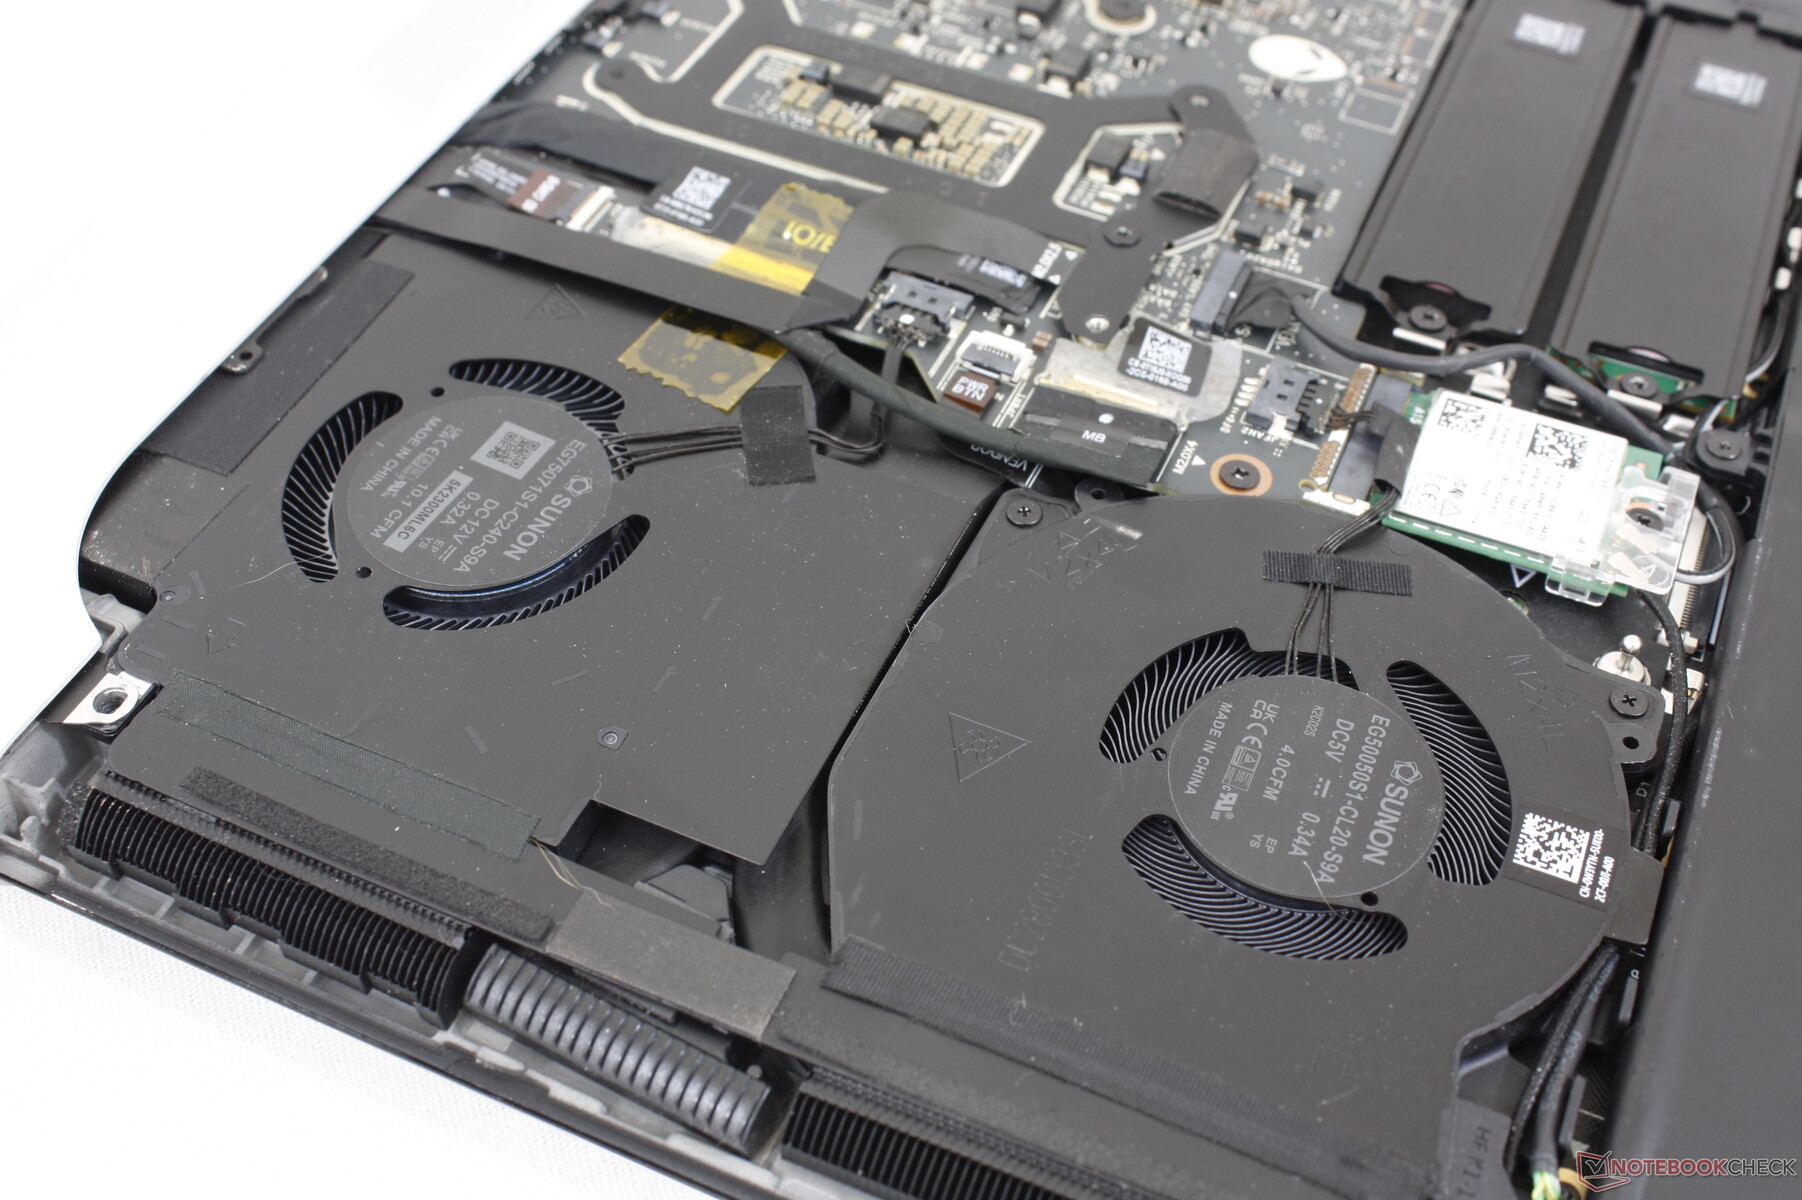
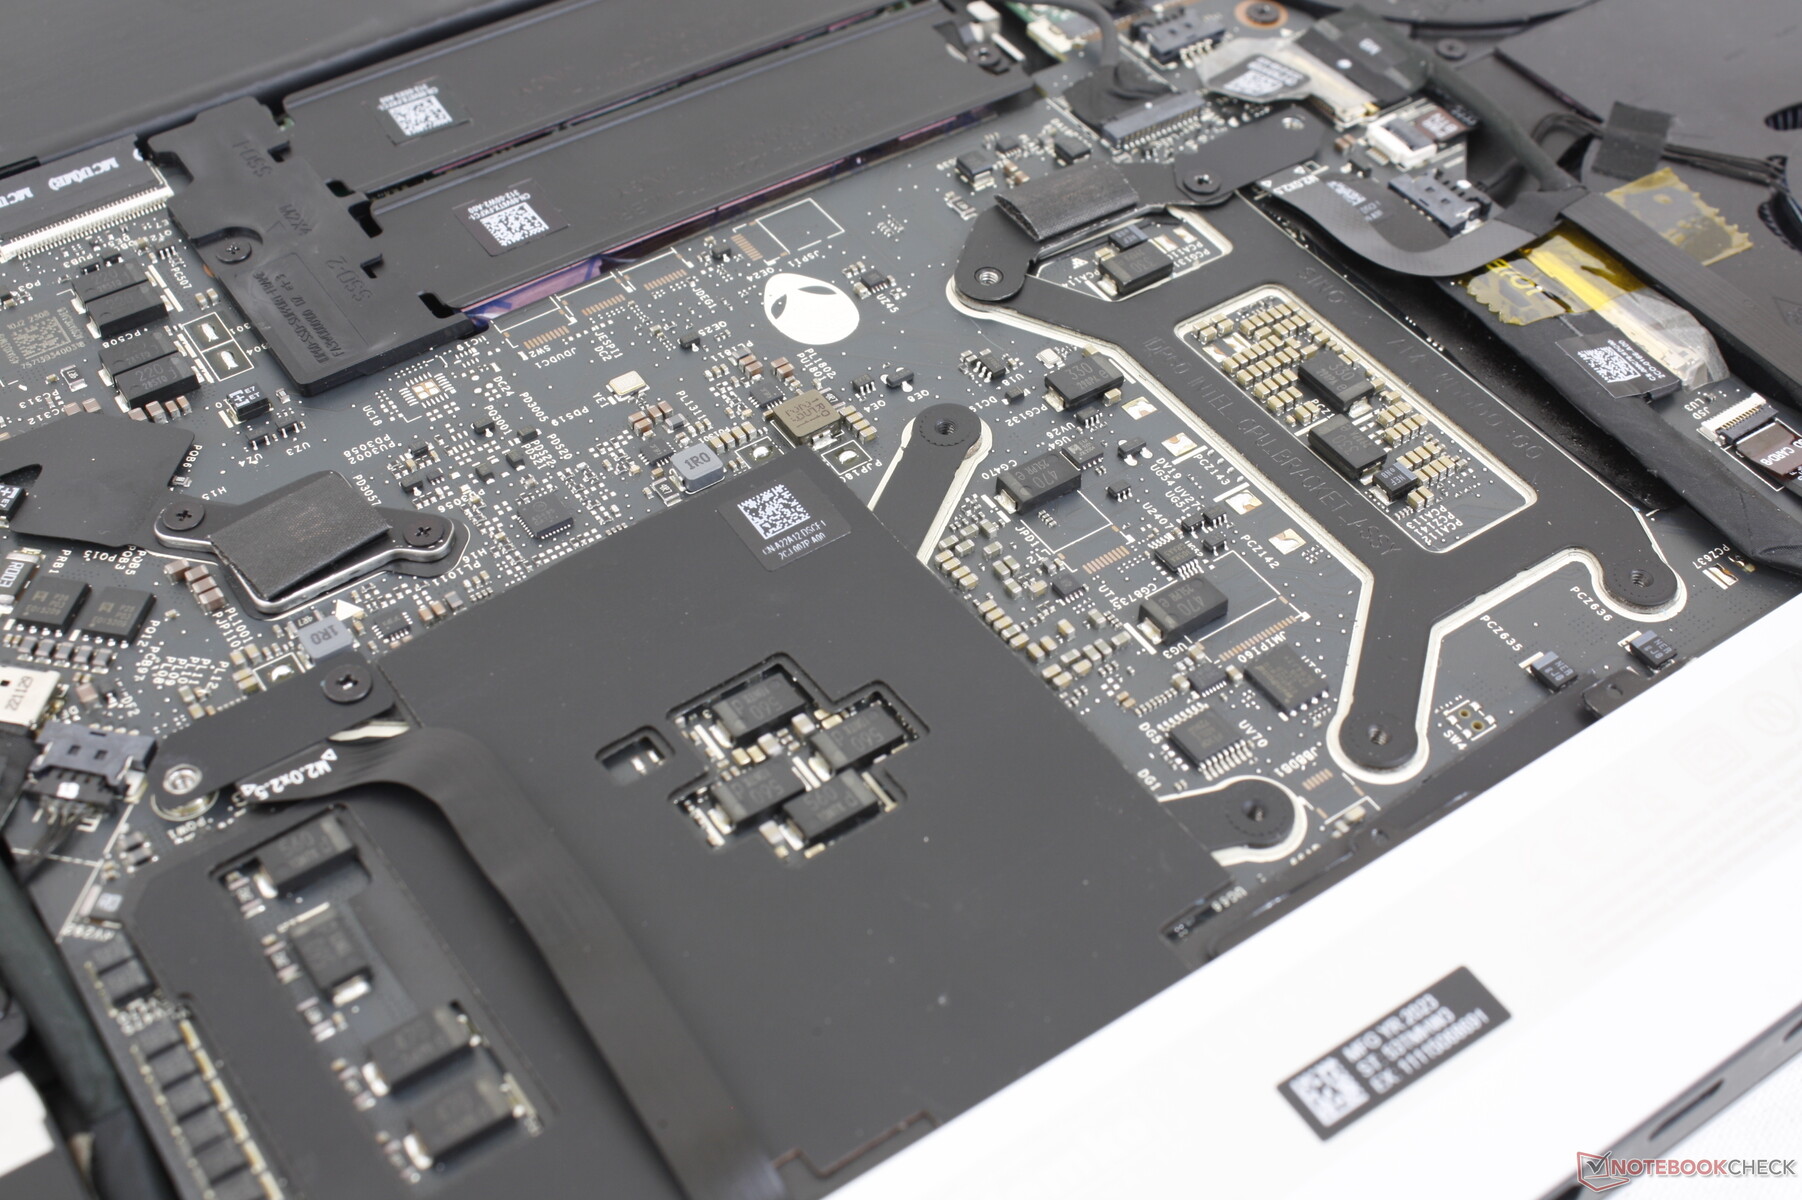
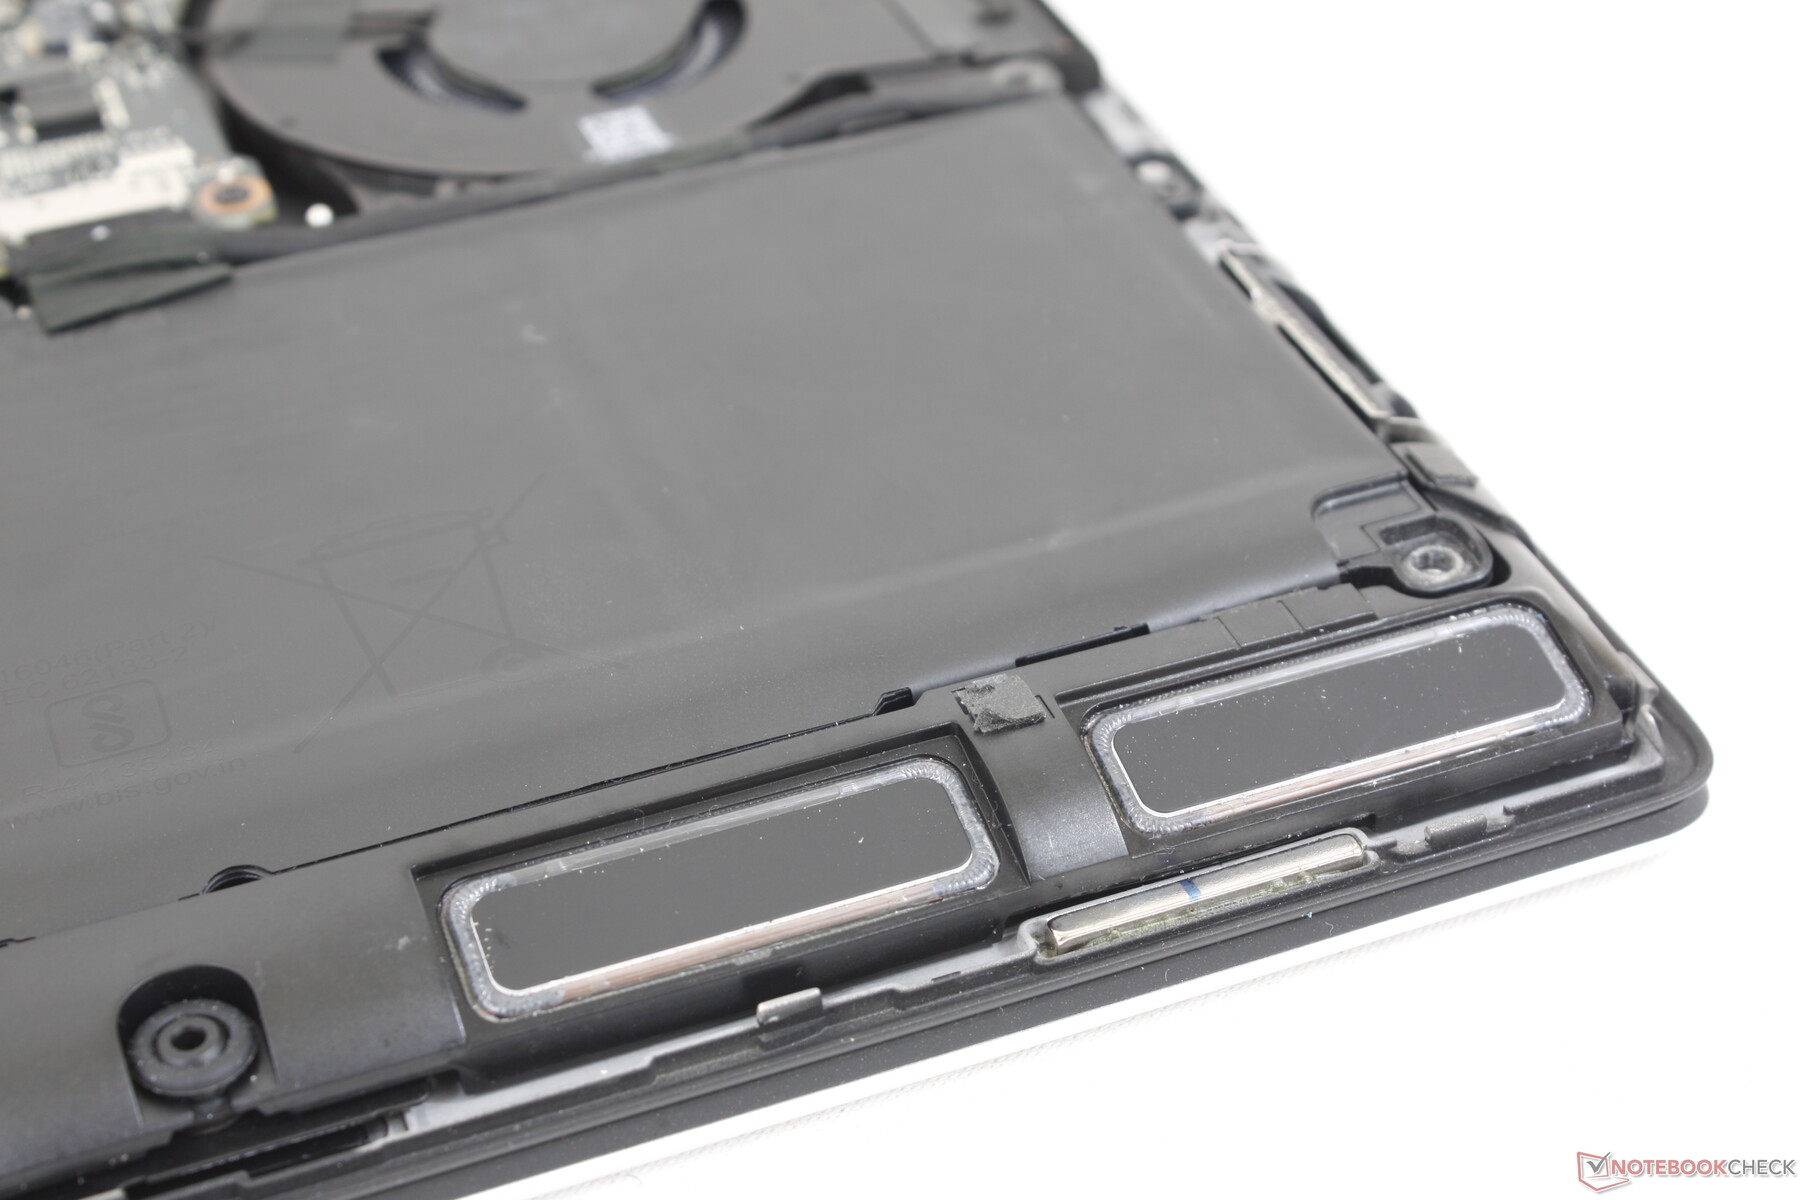
Manutenção
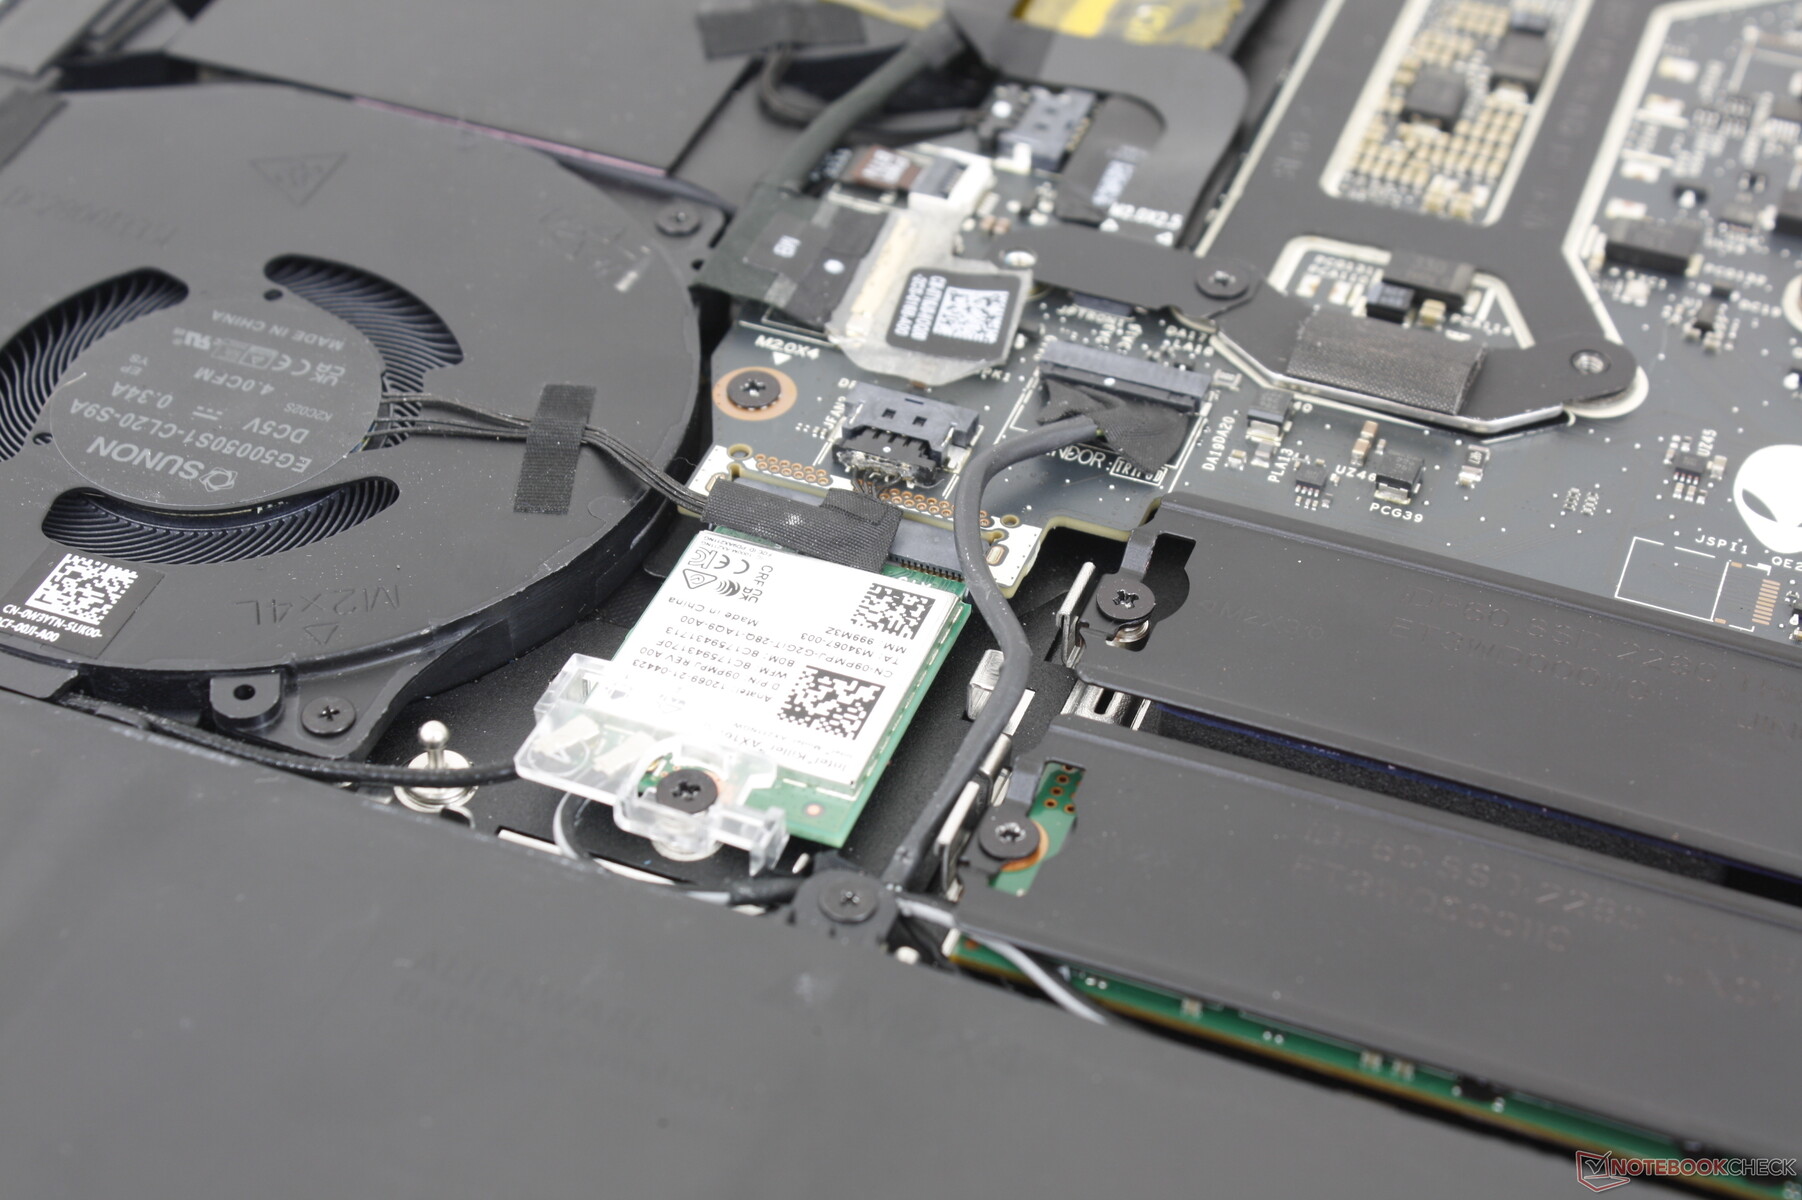
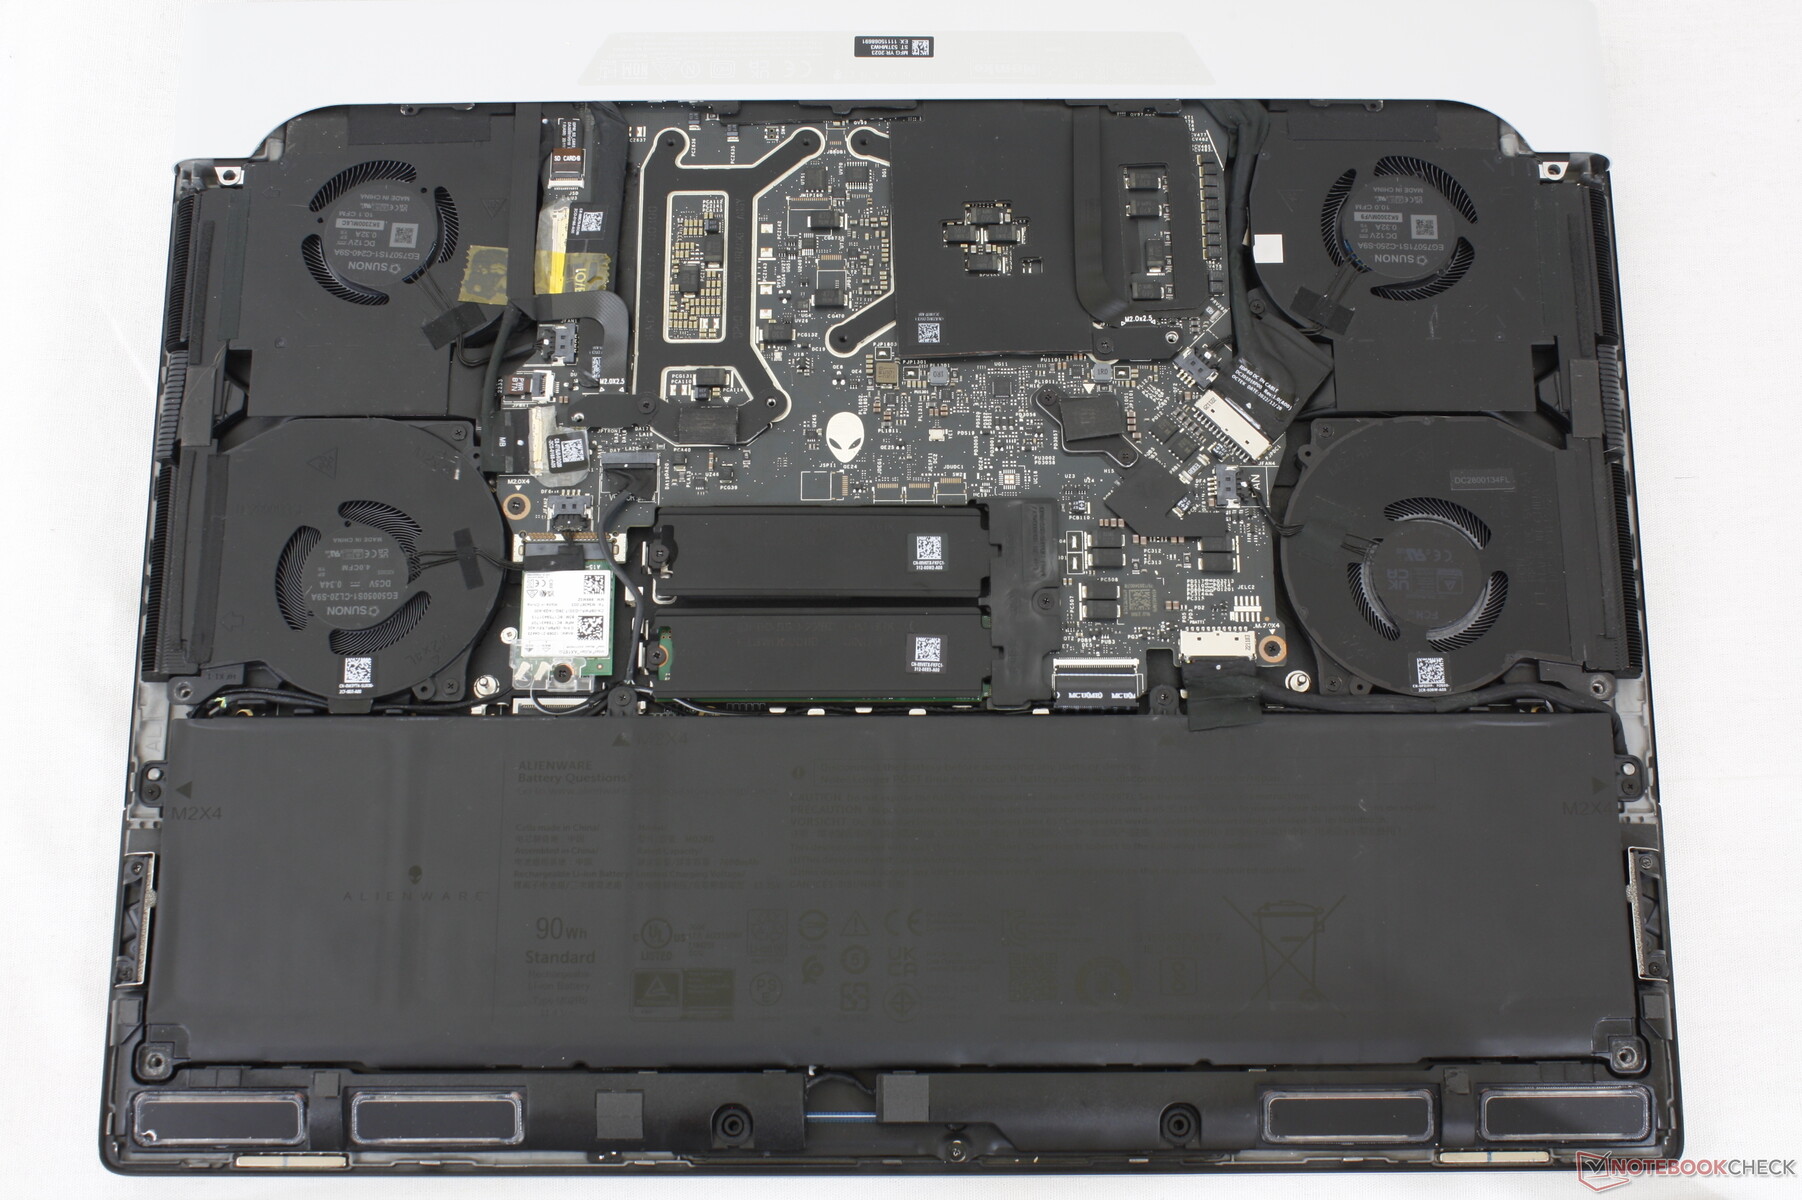
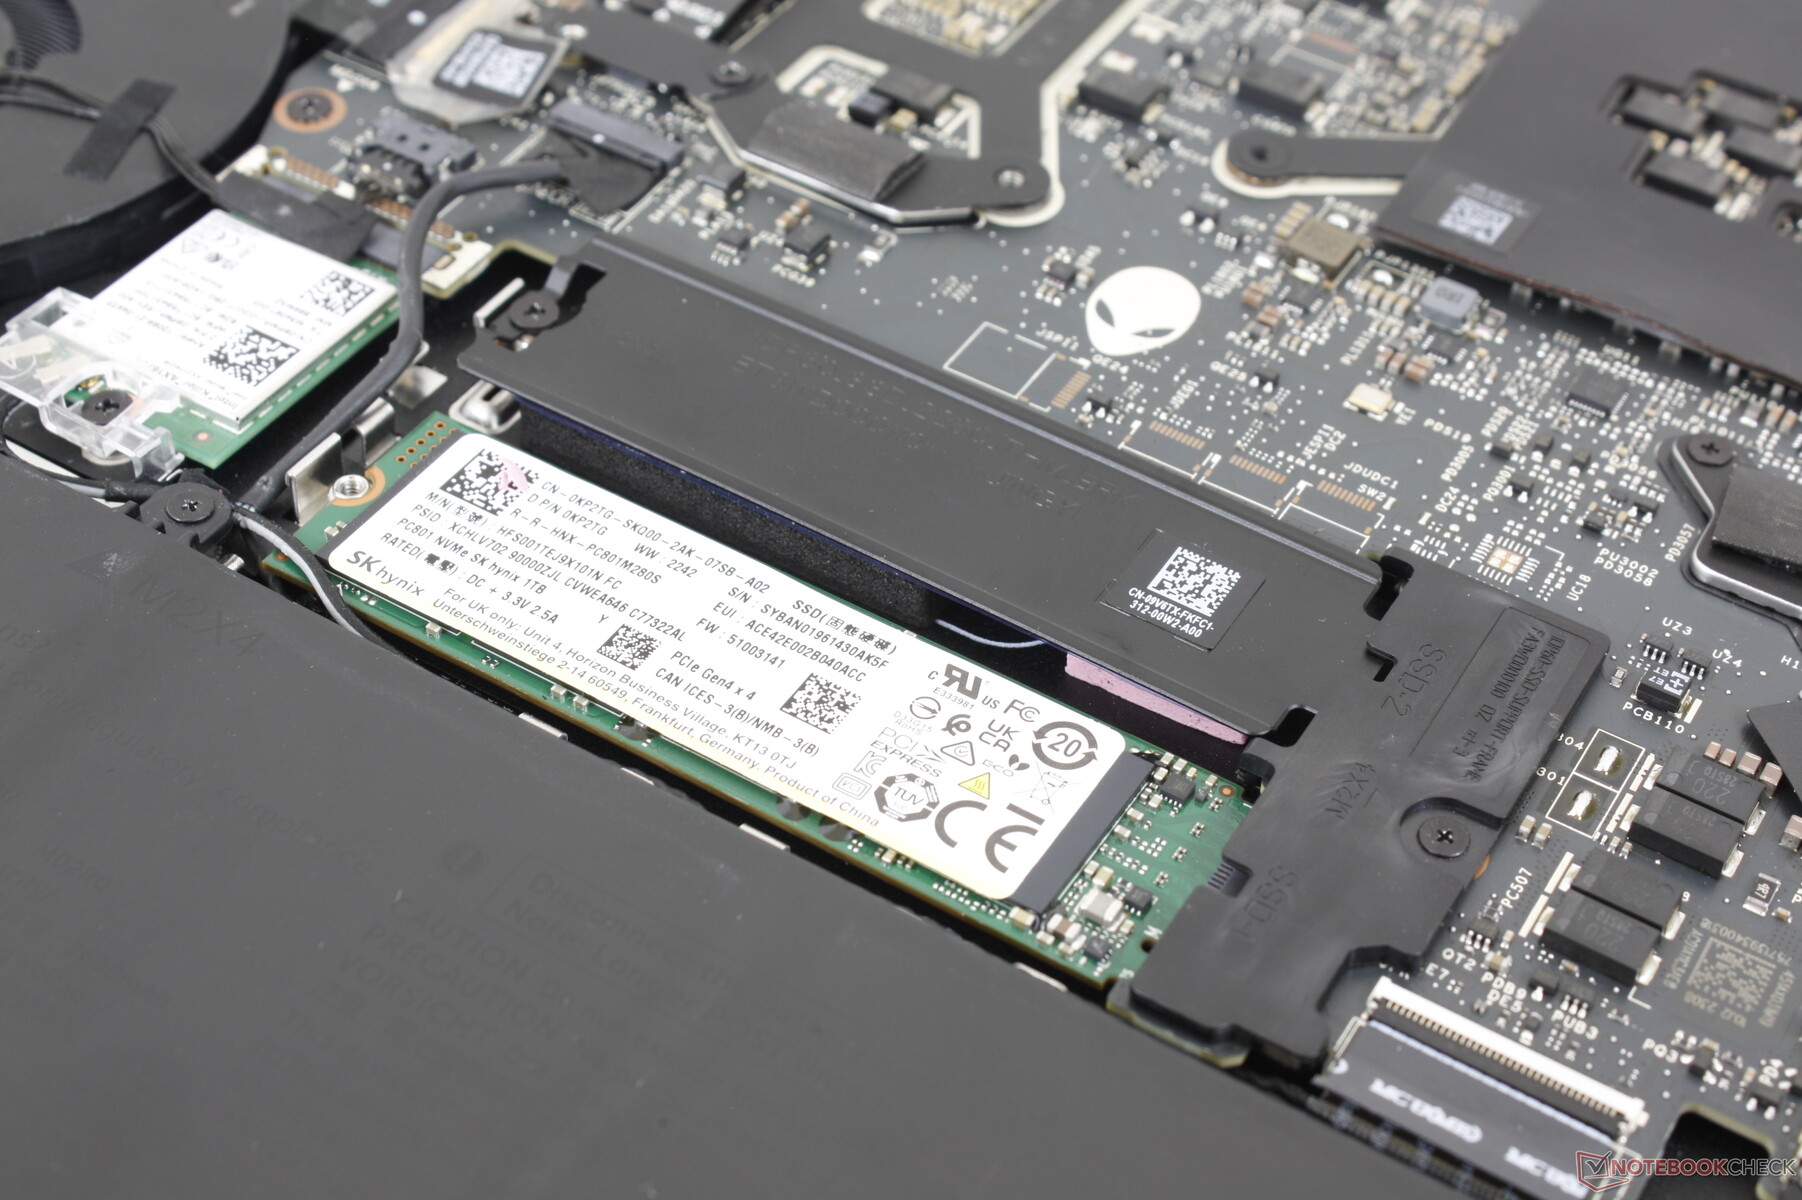
O painel inferior é fixado por apenas seis parafusos Phillips para facilitar a remoção. Os proprietários têm acesso direto aos dois slots de SSD M.2 2280, à bateria e ao módulo WLAN removível.
Acessórios e garantia
Não há extras na caixa além do adaptador CA e da documentação. A garantia limitada de um ano do fabricante se aplica se for comprado nos EUA.
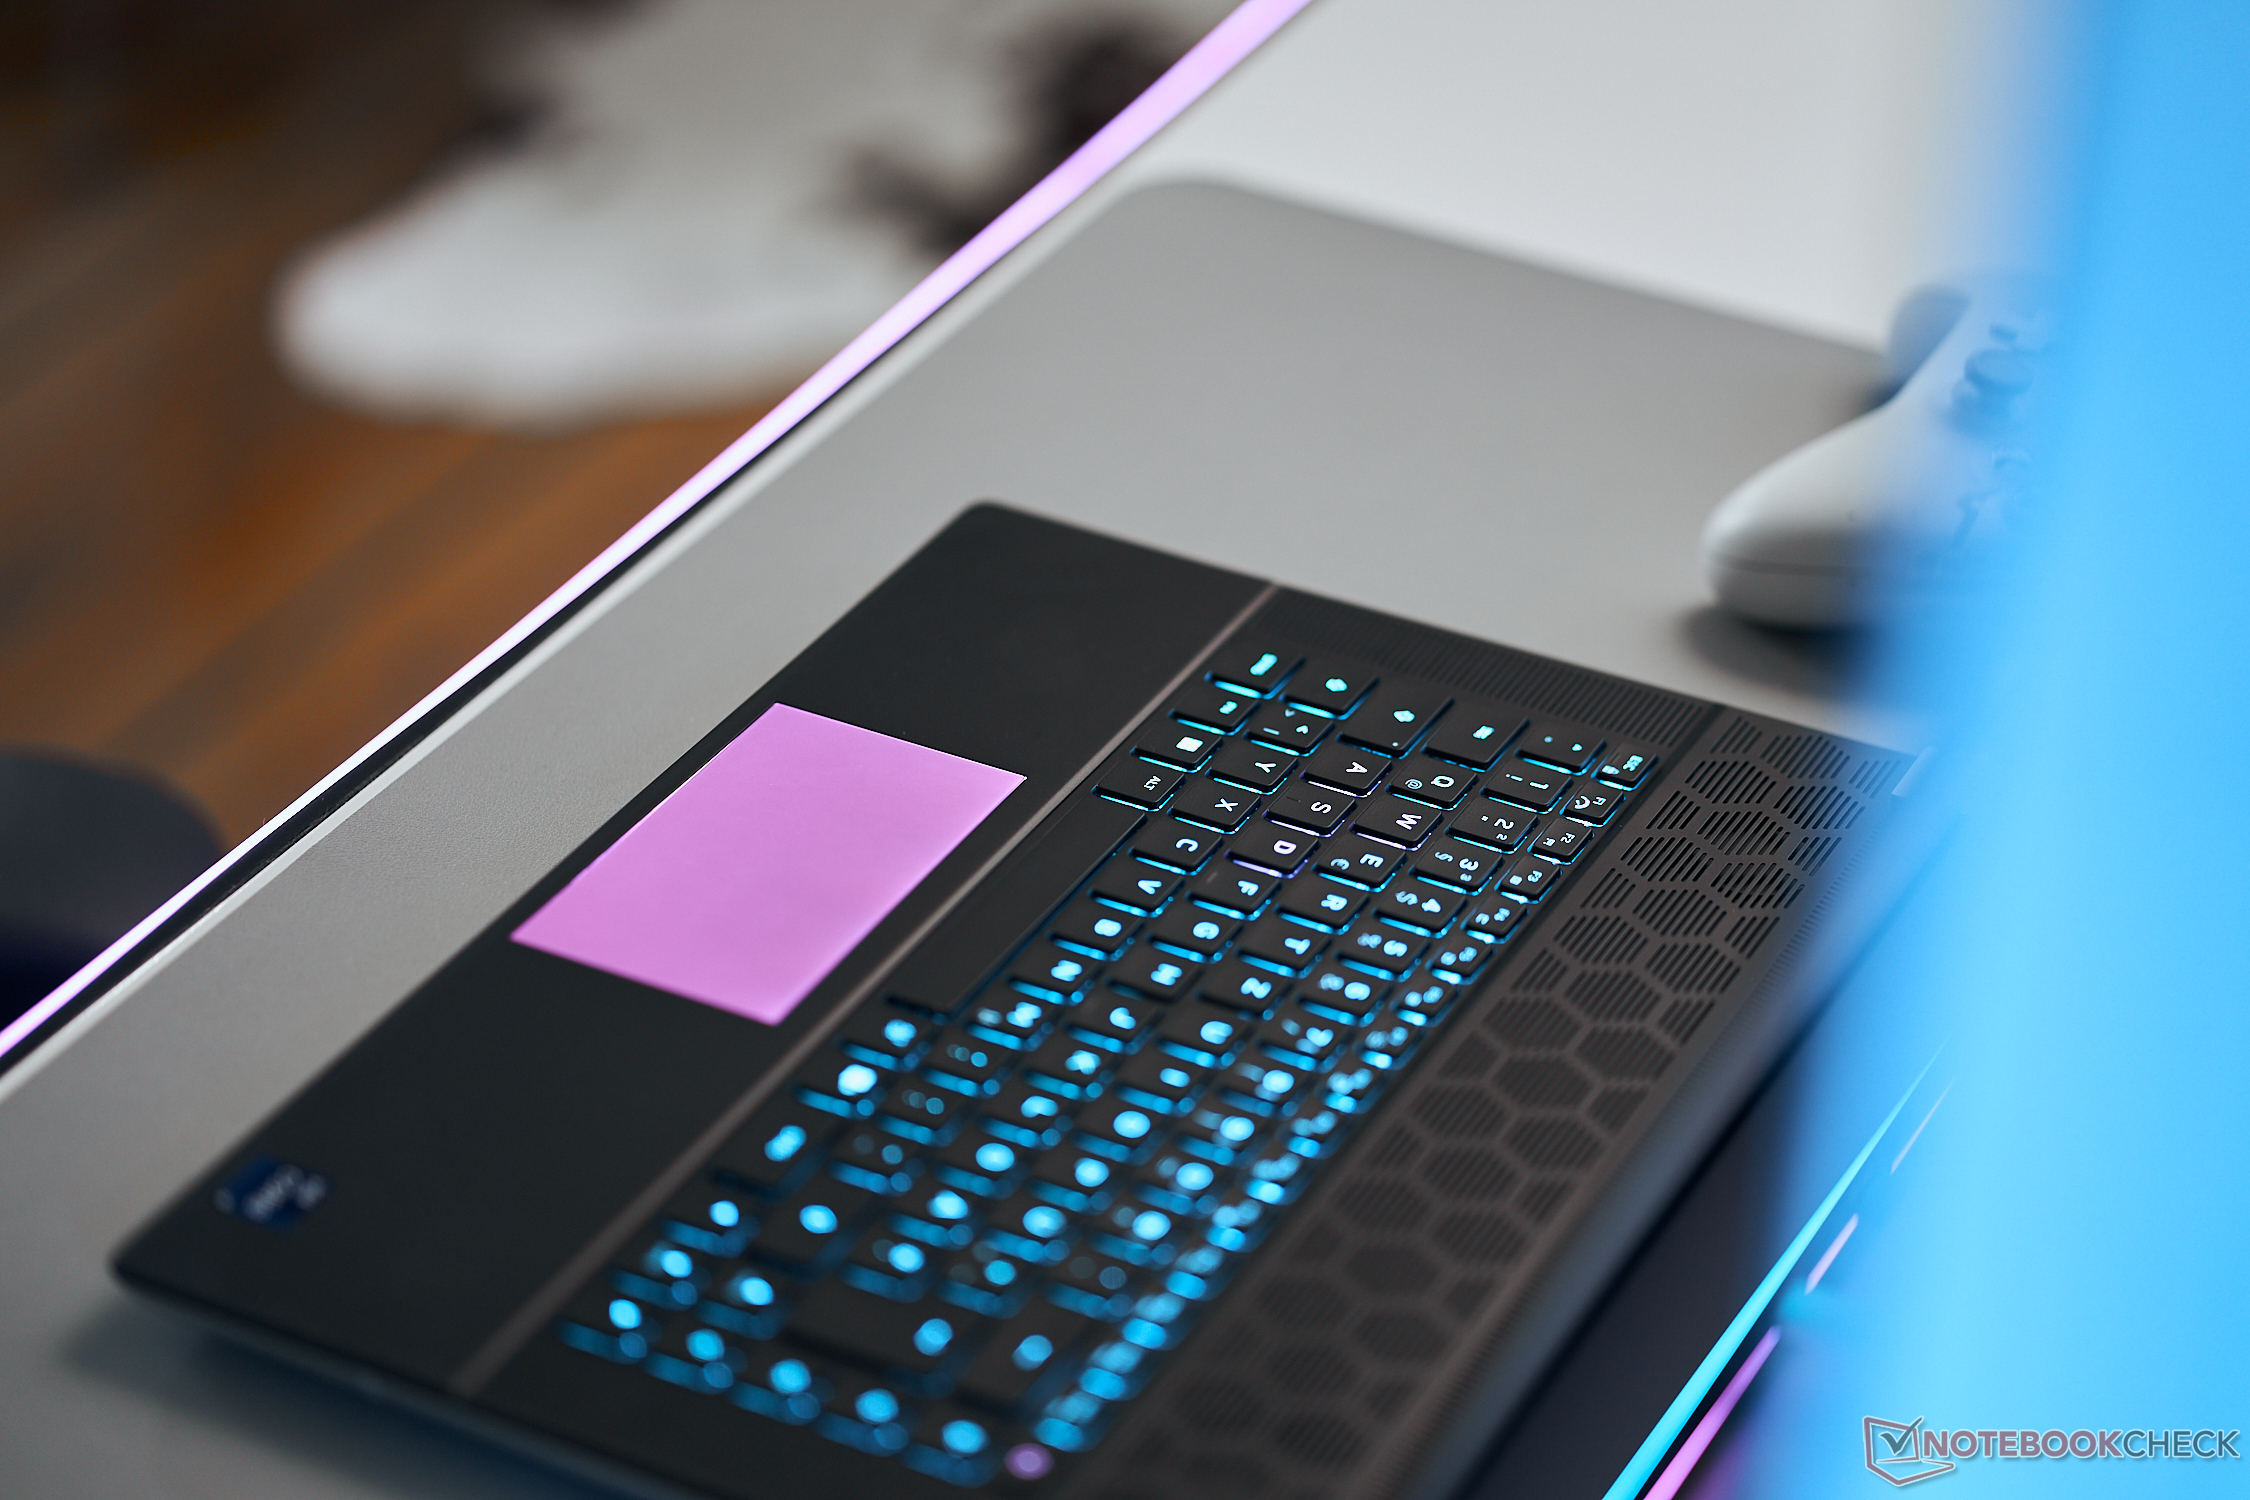
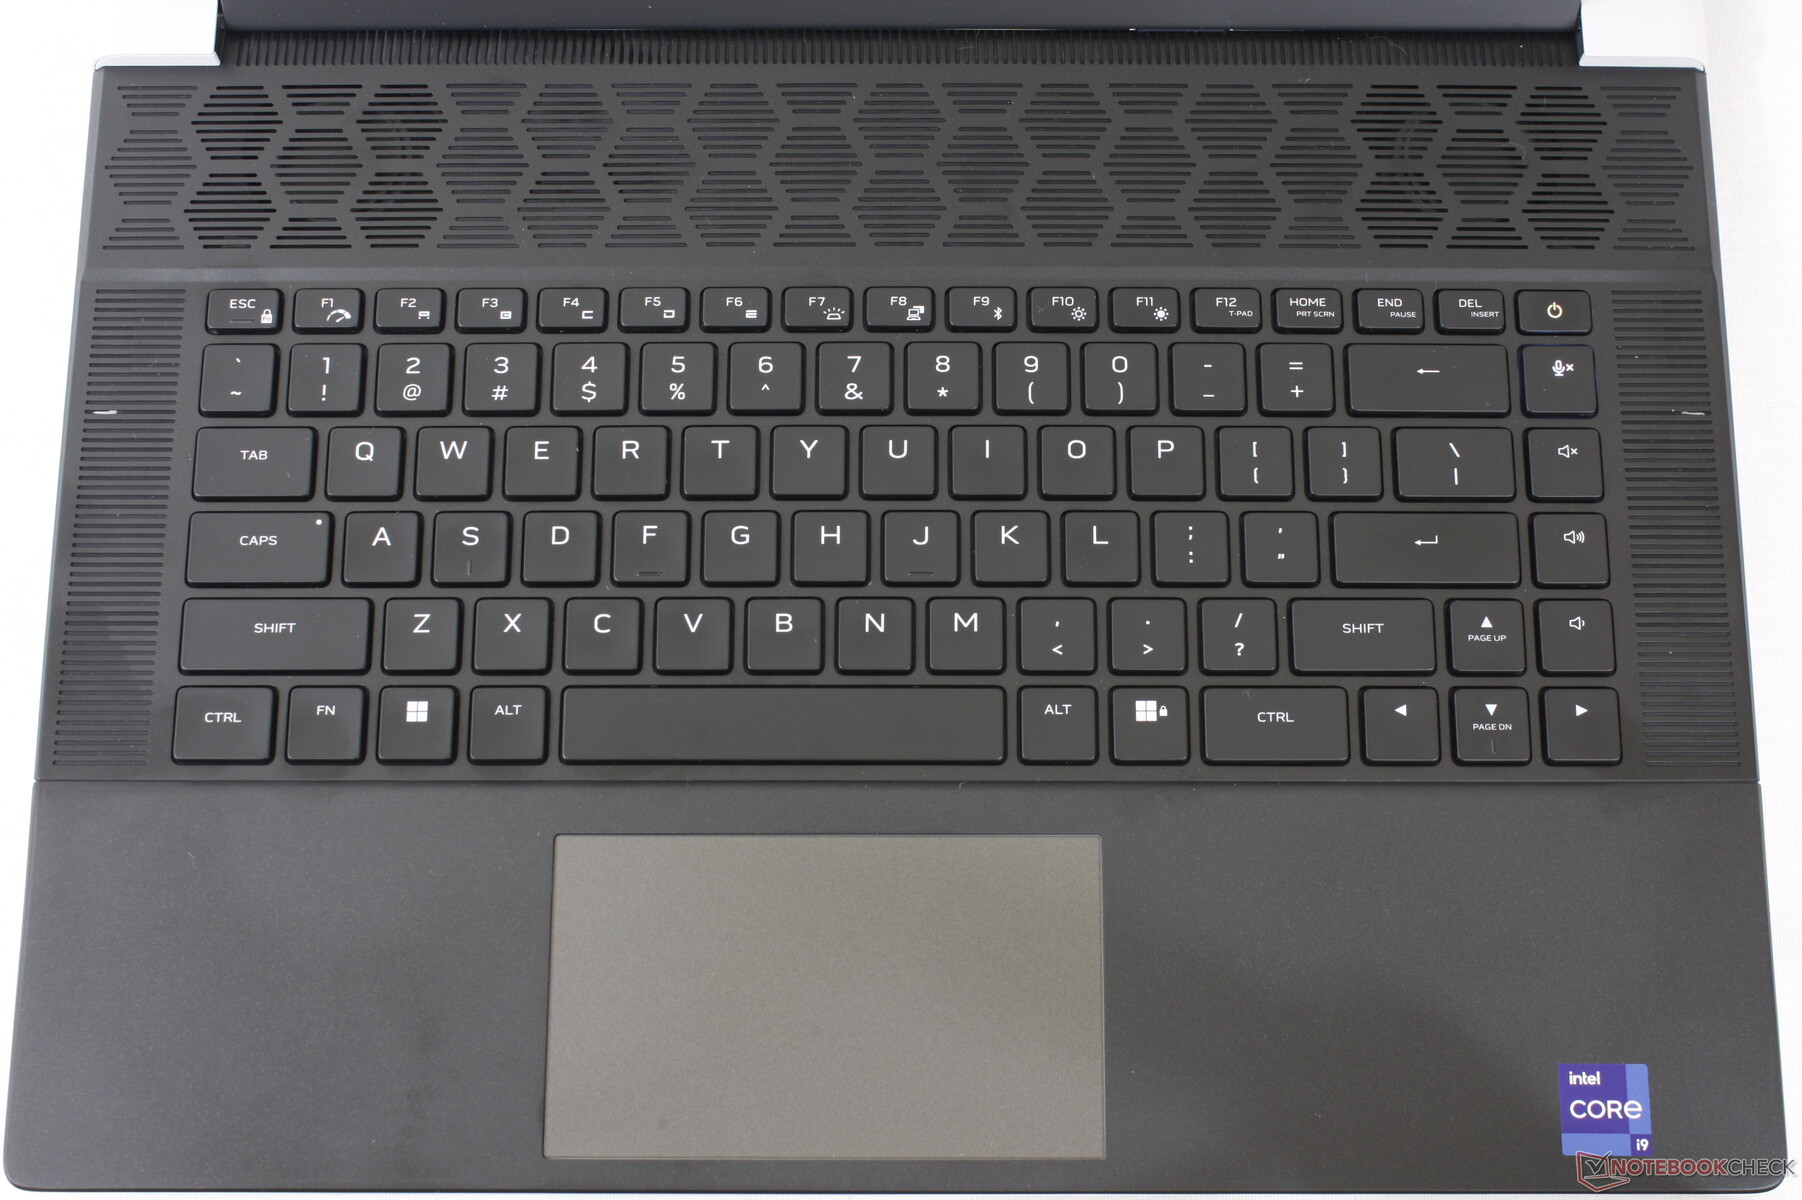
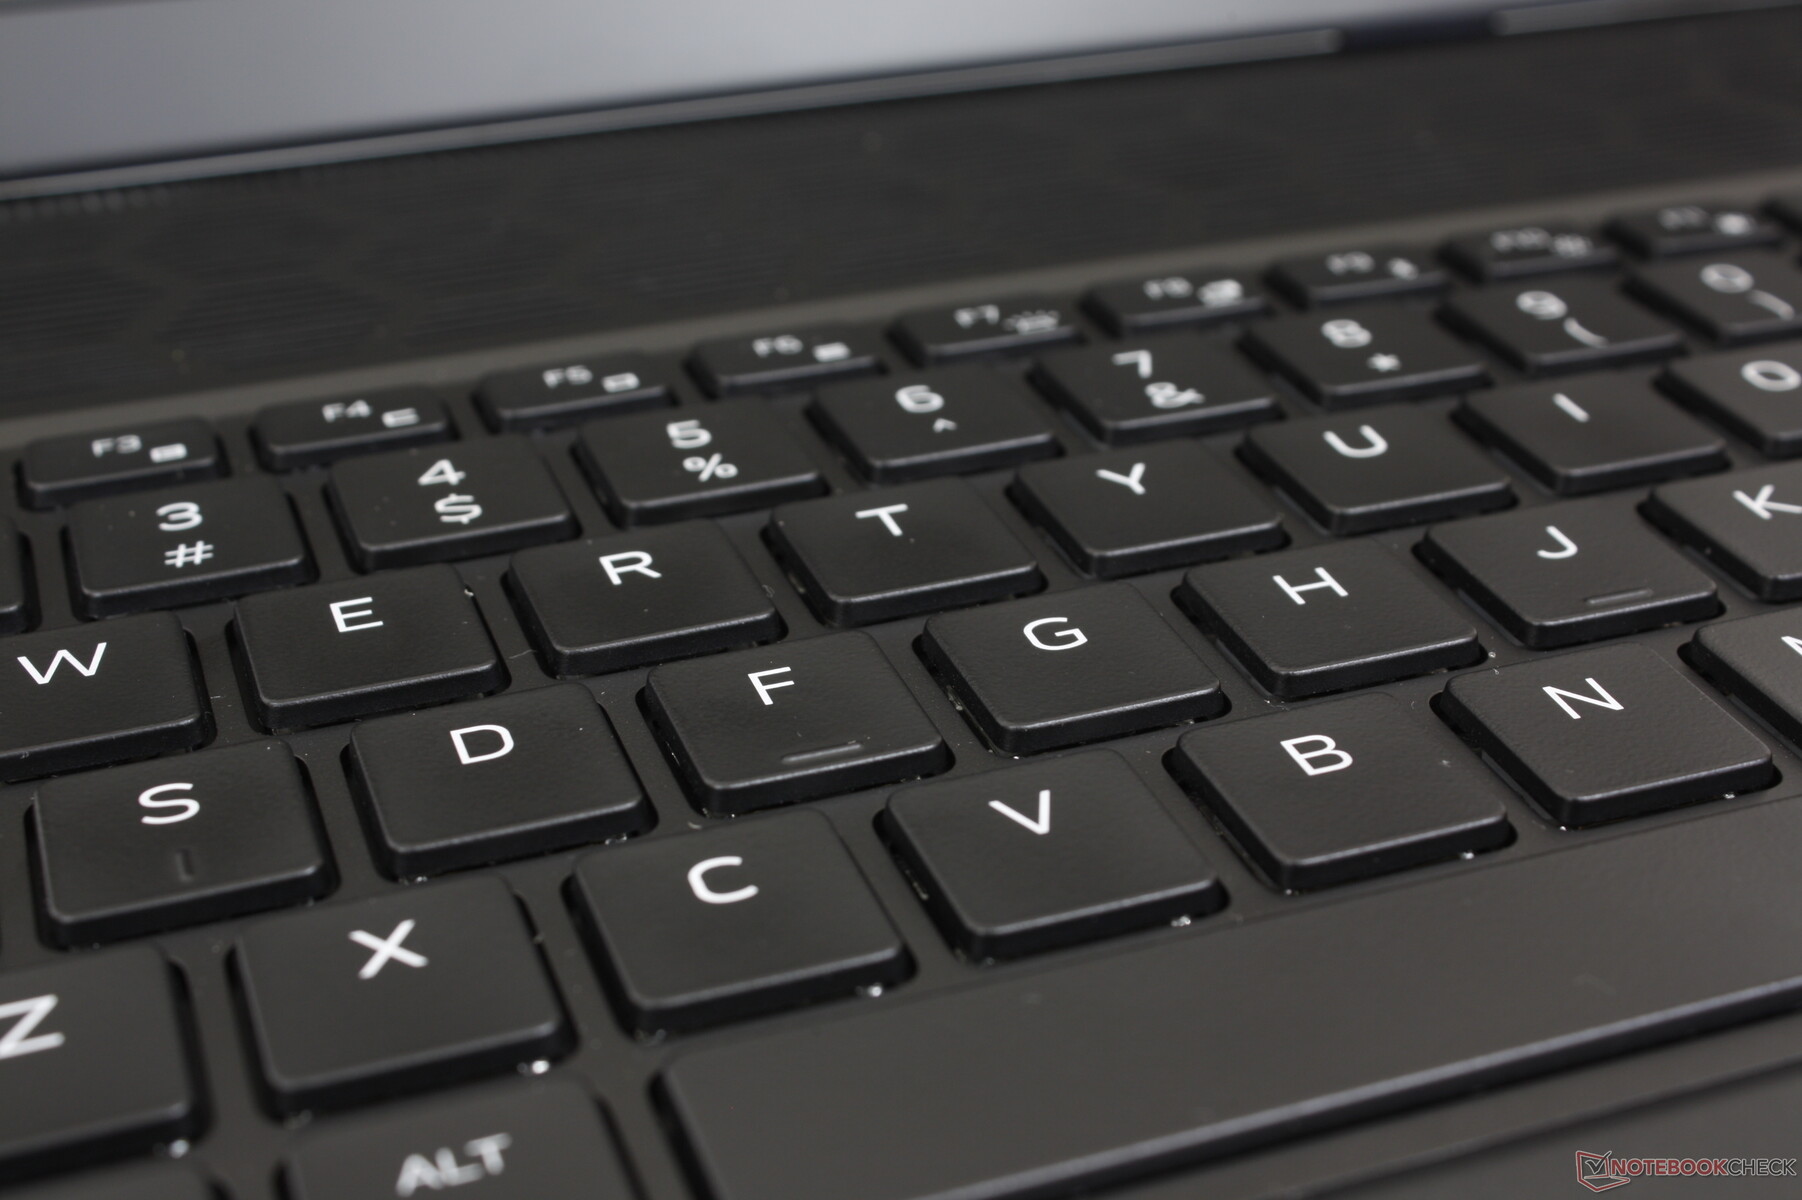
Dispositivos de entrada - As teclas mecânicas estão em alta e com orgulho
Teclado
A Dell oferece duas opções de teclado: teclas de membrana padrão e teclas de perfil ultrabaixo CherryMX, cada uma com iluminação RGB por tecla. Nossa unidade de teste vem equipada com a última opção e a experiência de digitação é noite e dia quando comparada com as teclas de membrana da maioria dos outros notebooks para jogos. O curso das teclas de 1,8 mm é mais profundo do que o típico 1,5 mm, e o feedback é muito mais firme e mais fácil de clicar, proporcionando uma sensação mais satisfatória. É difícil voltar a digitar em algo como o Razer Blade 16 depois de estar acostumado com as teclas CherryMX do Alienware x16.
A principal desvantagem, é claro, é o barulho significativamente mais alto das teclas mecânicas. Portanto, talvez seja melhor considerar a opção padrão não mecânica se você pretende usar o laptop em ambientes sensíveis a ruídos, como salas de aula ou dormitórios apertados.
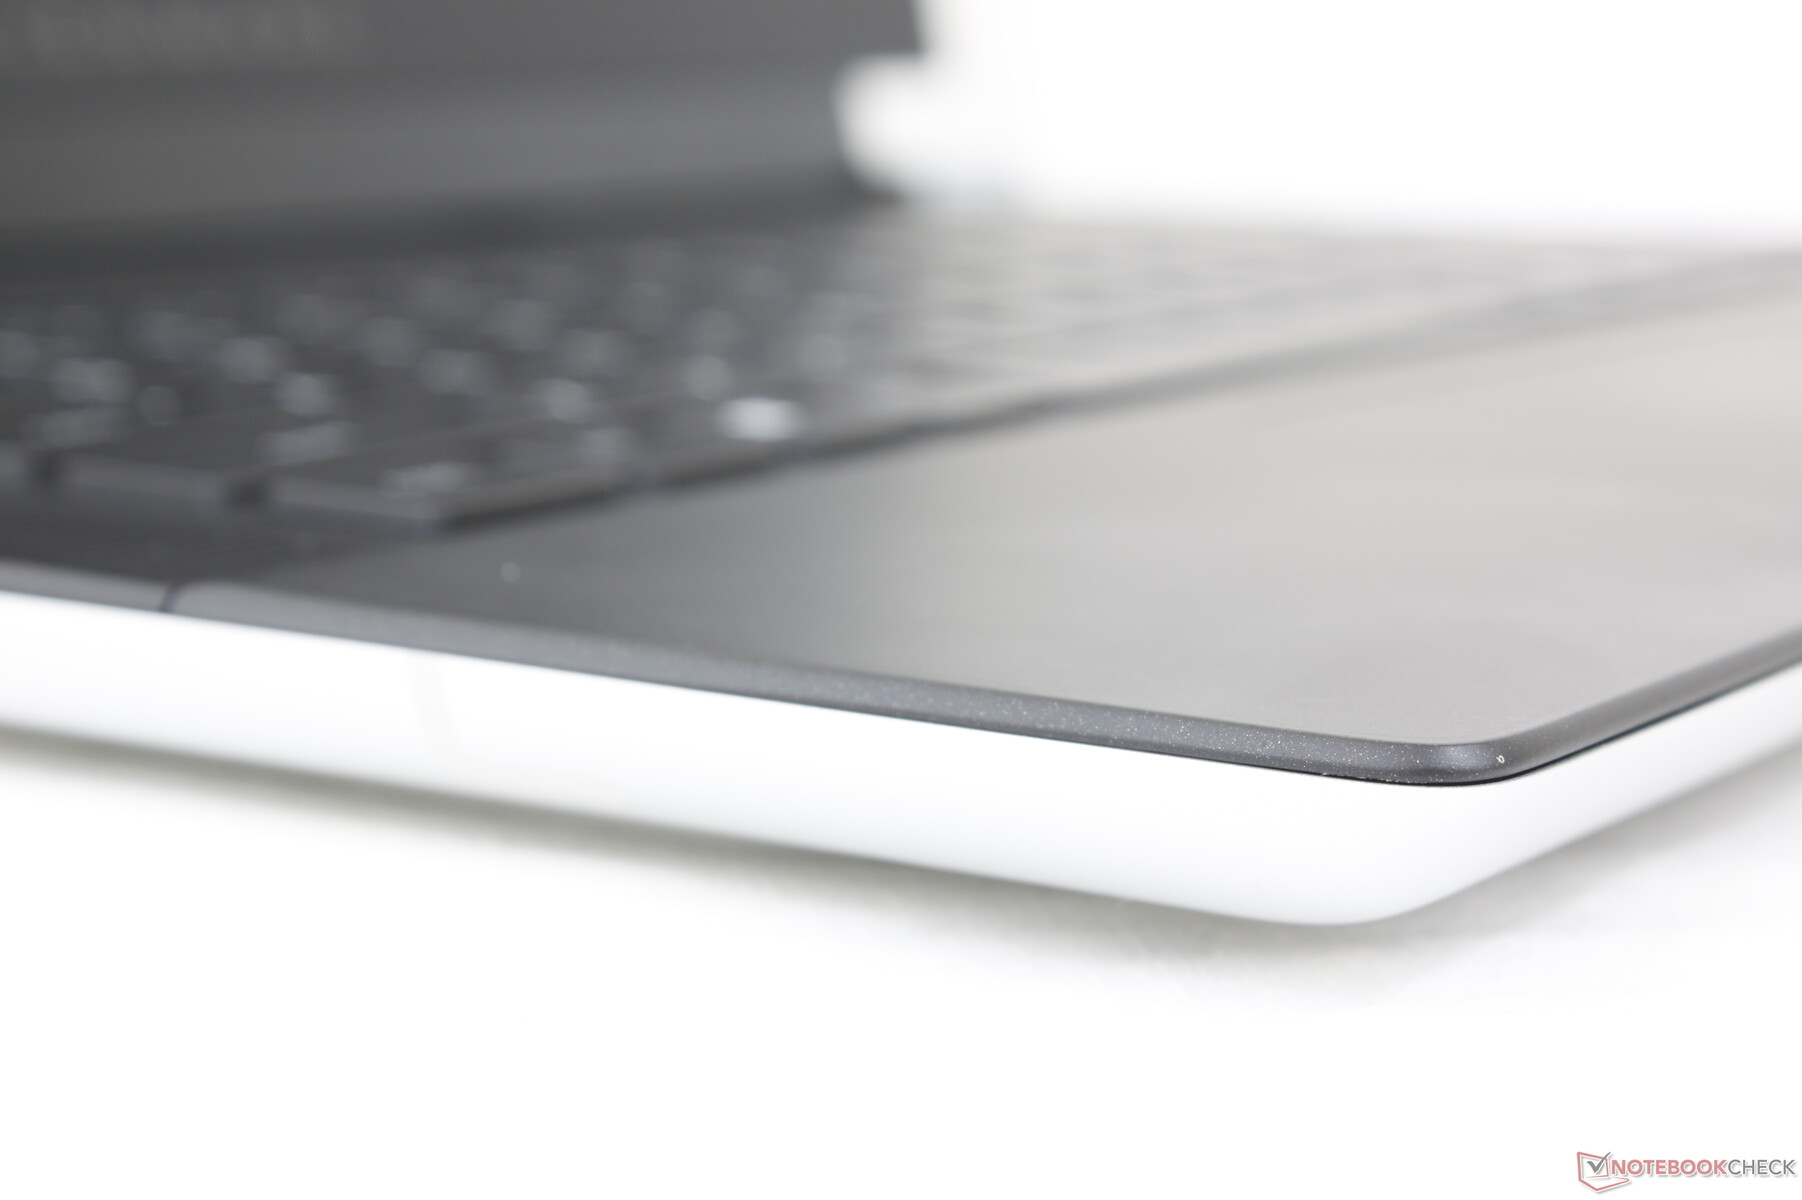
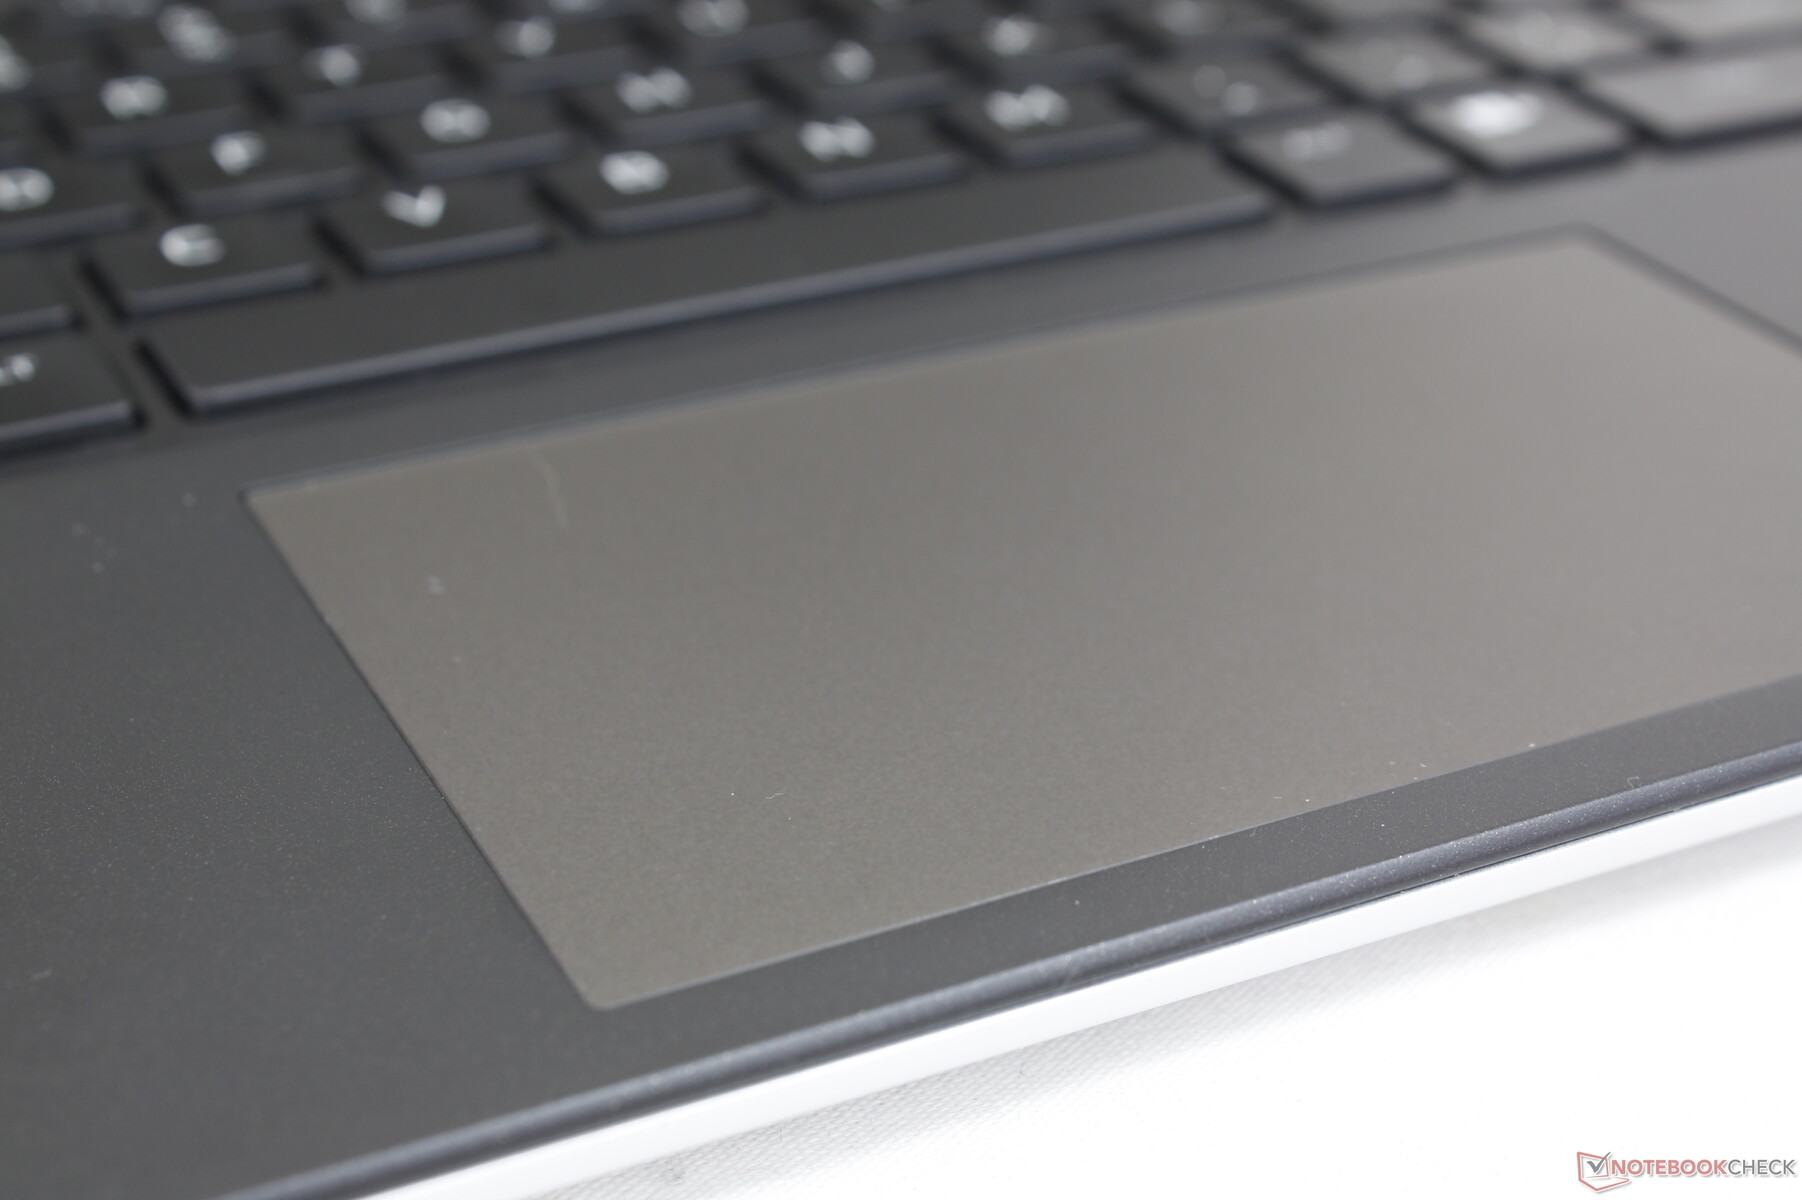
Touchpad
O clickpad é um dos menores para um laptop para jogos de 16 polegadas, com apenas 11,2 x 6,5 cm, em comparação com 17 x 9,7 cm e 12 x 7,5 cm no Blade 16 e no Legion Pro 5 16respectivamente. O tamanho menor se deve à grande solução de resfriamento e às grades de ventilação que ocupam mais espaço na parte traseira do sistema. O deslizamento é suave, com apenas uma leve aderência ao se mover em velocidades mais lentas para obter cliques mais precisos.
O feedback ao clicar é leve e muito superficial, causando uma sensação insatisfatória. Com base nisso e na pequena área de superfície, fica claro que a Dell espera que a maioria dos usuários tenha um mouse USB pronto para uso.

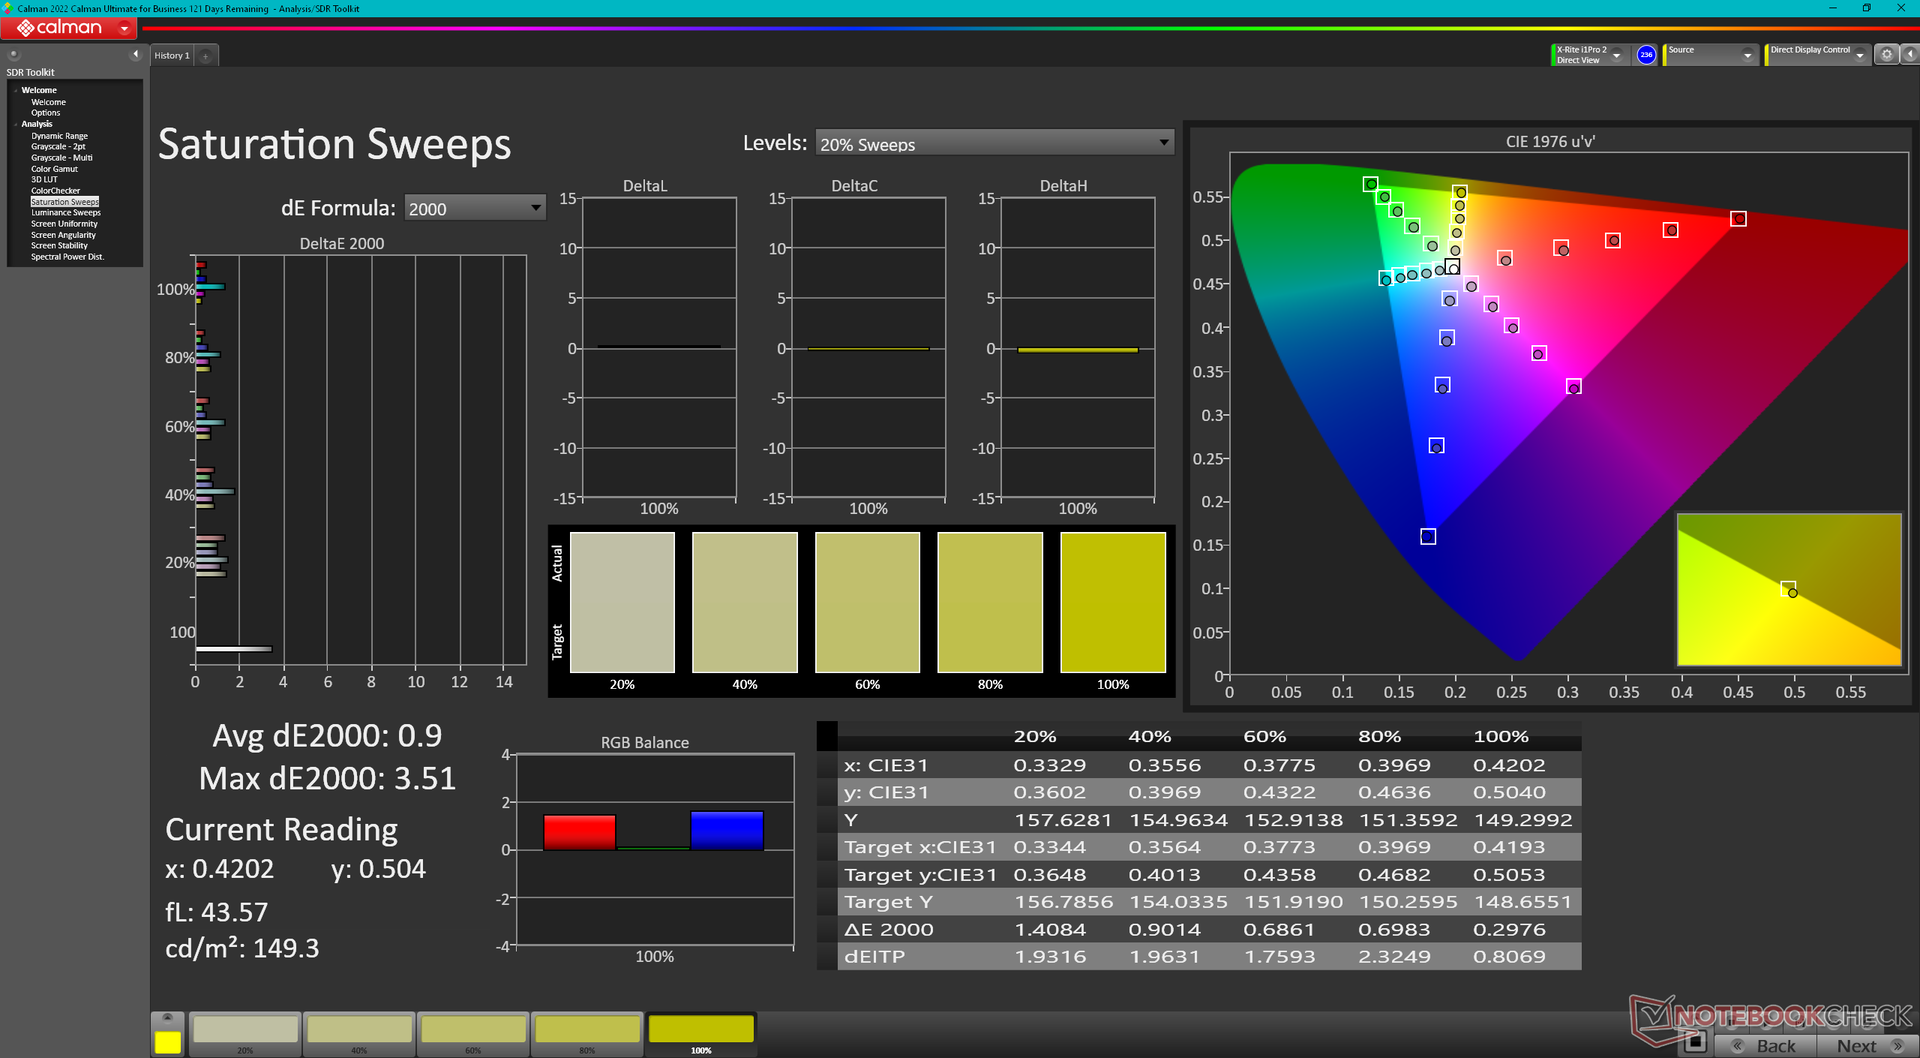
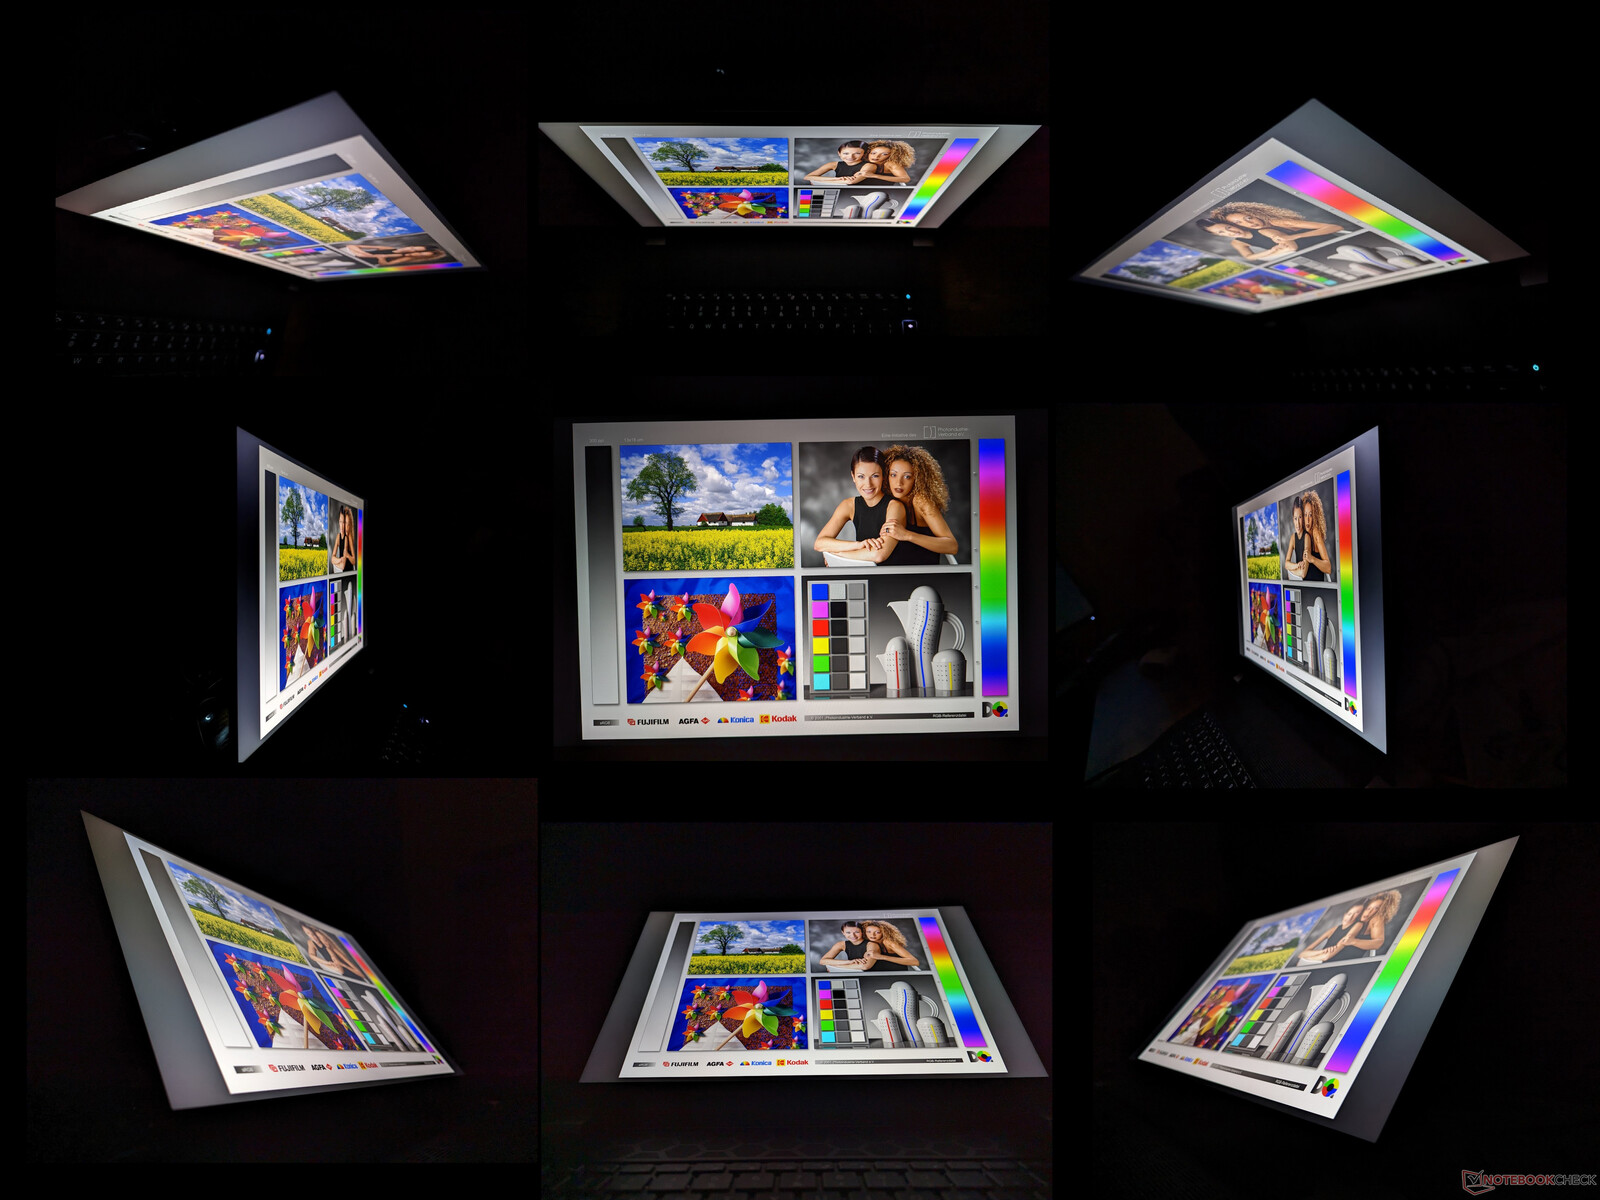
Tela - Nenhuma opção ruim
Três opções de exibição estão disponíveis e nossas medidas refletem apenas a opção em negrito:
- 2560 x 1600, 165 Hz, 3 ms, 100% sRGB, G-Sync
- 1920 x 1200, 480 Hz, 3 ms, 100% DCI-P3, G-Sync
- 2560 x 1600, 240 Hz, 3 ms, 100% DCI-P3, G-Sync
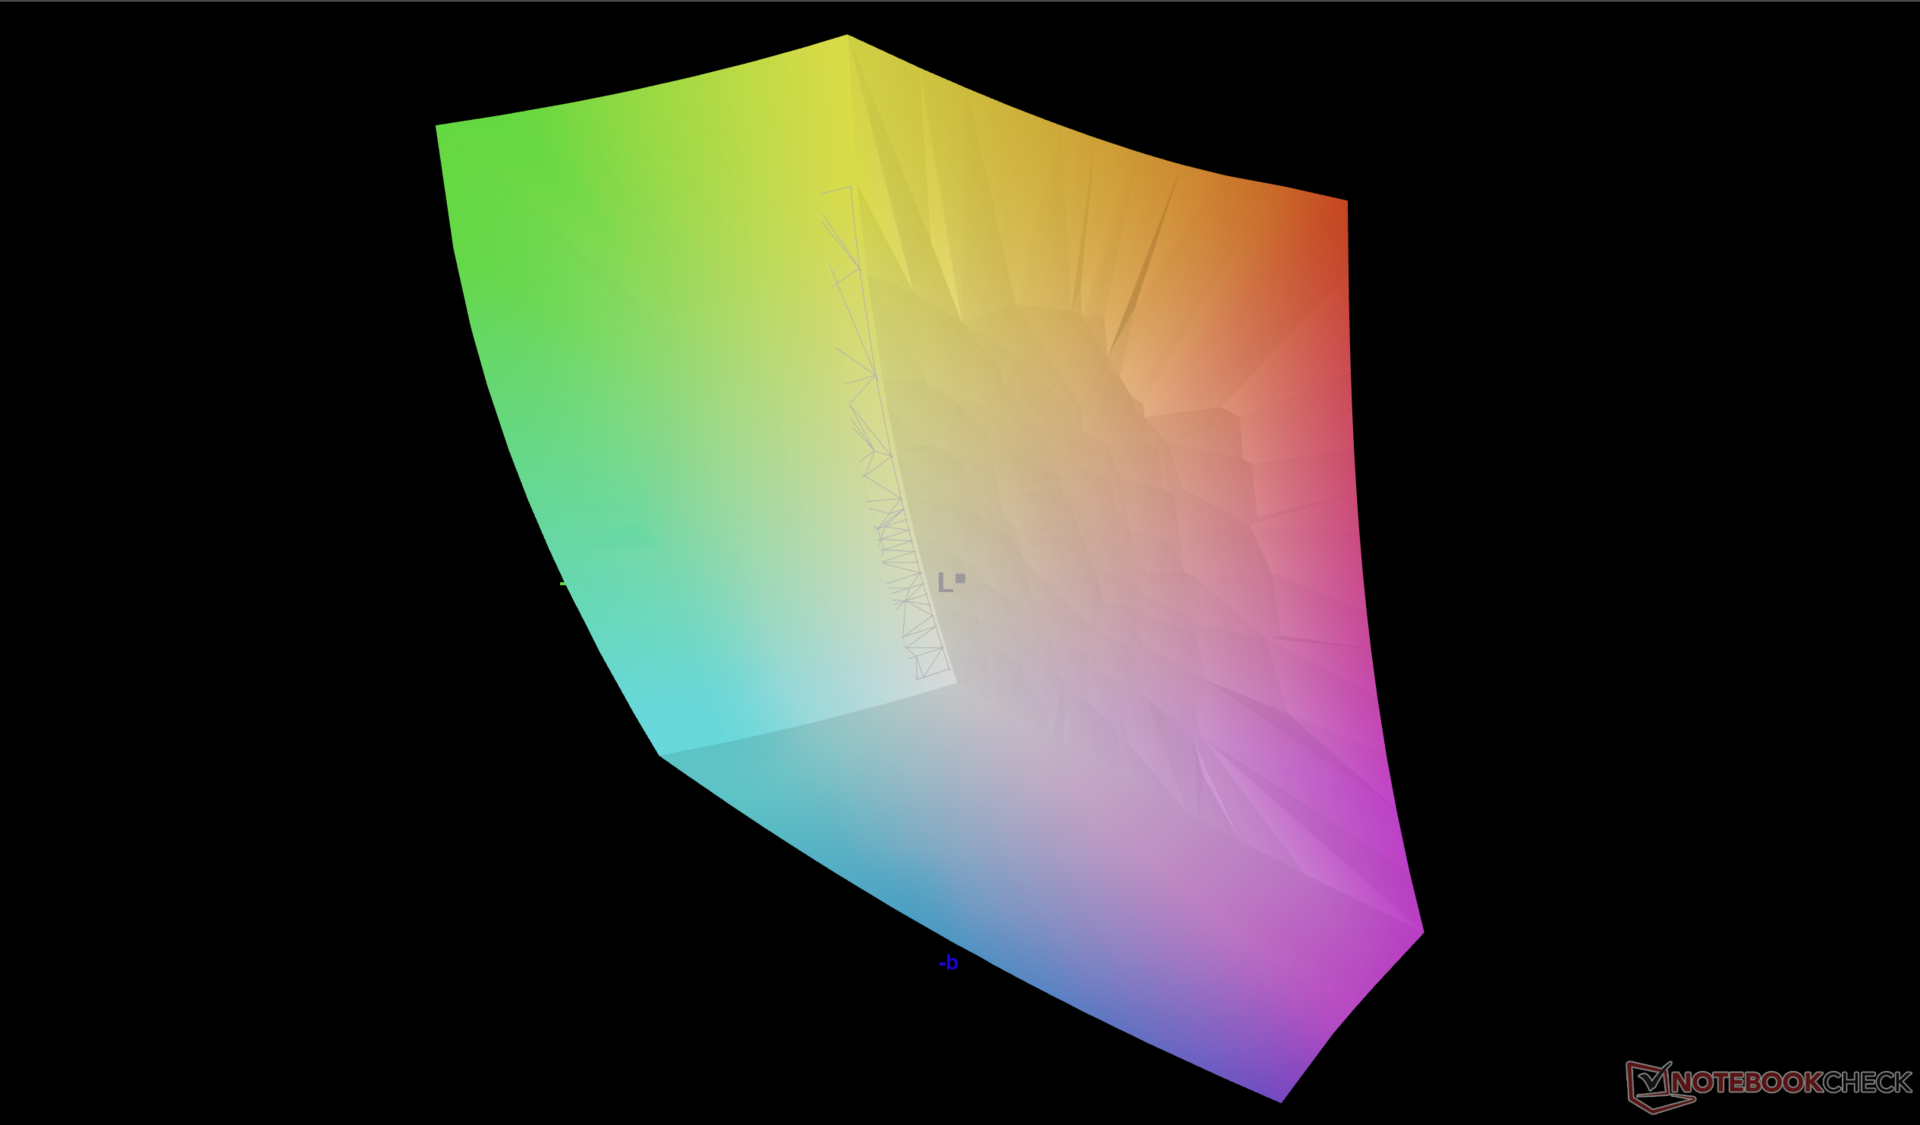
Certamente não há um painel ruim ou "errado", pois todos os painéis são adequados para fins de jogos com suas taxas de atualização e tempos de resposta rápidos. Dito isso, nosso painel 1600p240 configurado é o ideal para a maioria dos usuários, pois a opção 1200p480 sacrifica a resolução e a opção 1600p165 tem cores mais rasas. A experiência de visualização é comparável à do Blade 16 e, ao mesmo tempo, melhor do que a do Dell G16 e do Lenovo Legion Pro 7 16 em termos de gama de cores.
| |||||||||||||||||||||||||
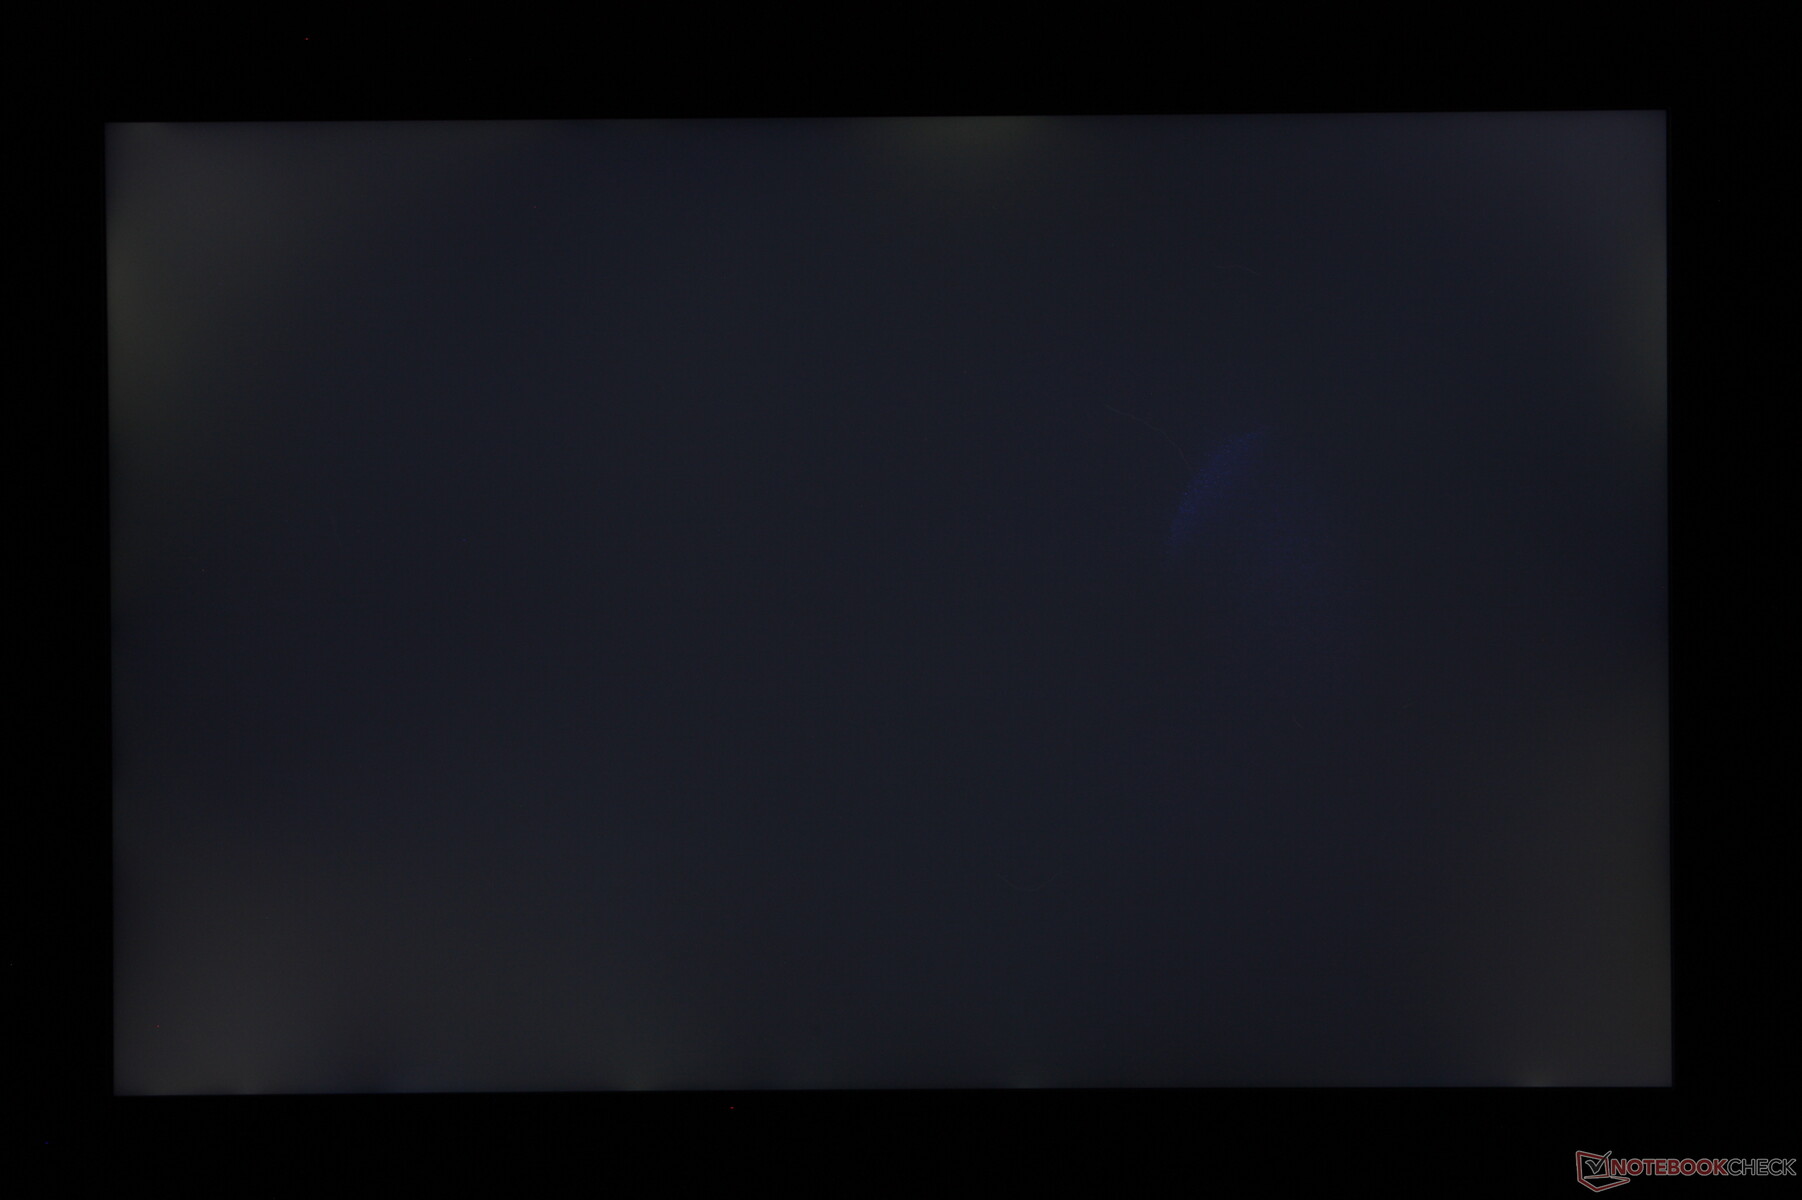
iluminação: 89 %
iluminação com acumulador: 302.2 cd/m²
Contraste: 1162:1 (Preto: 0.26 cd/m²)
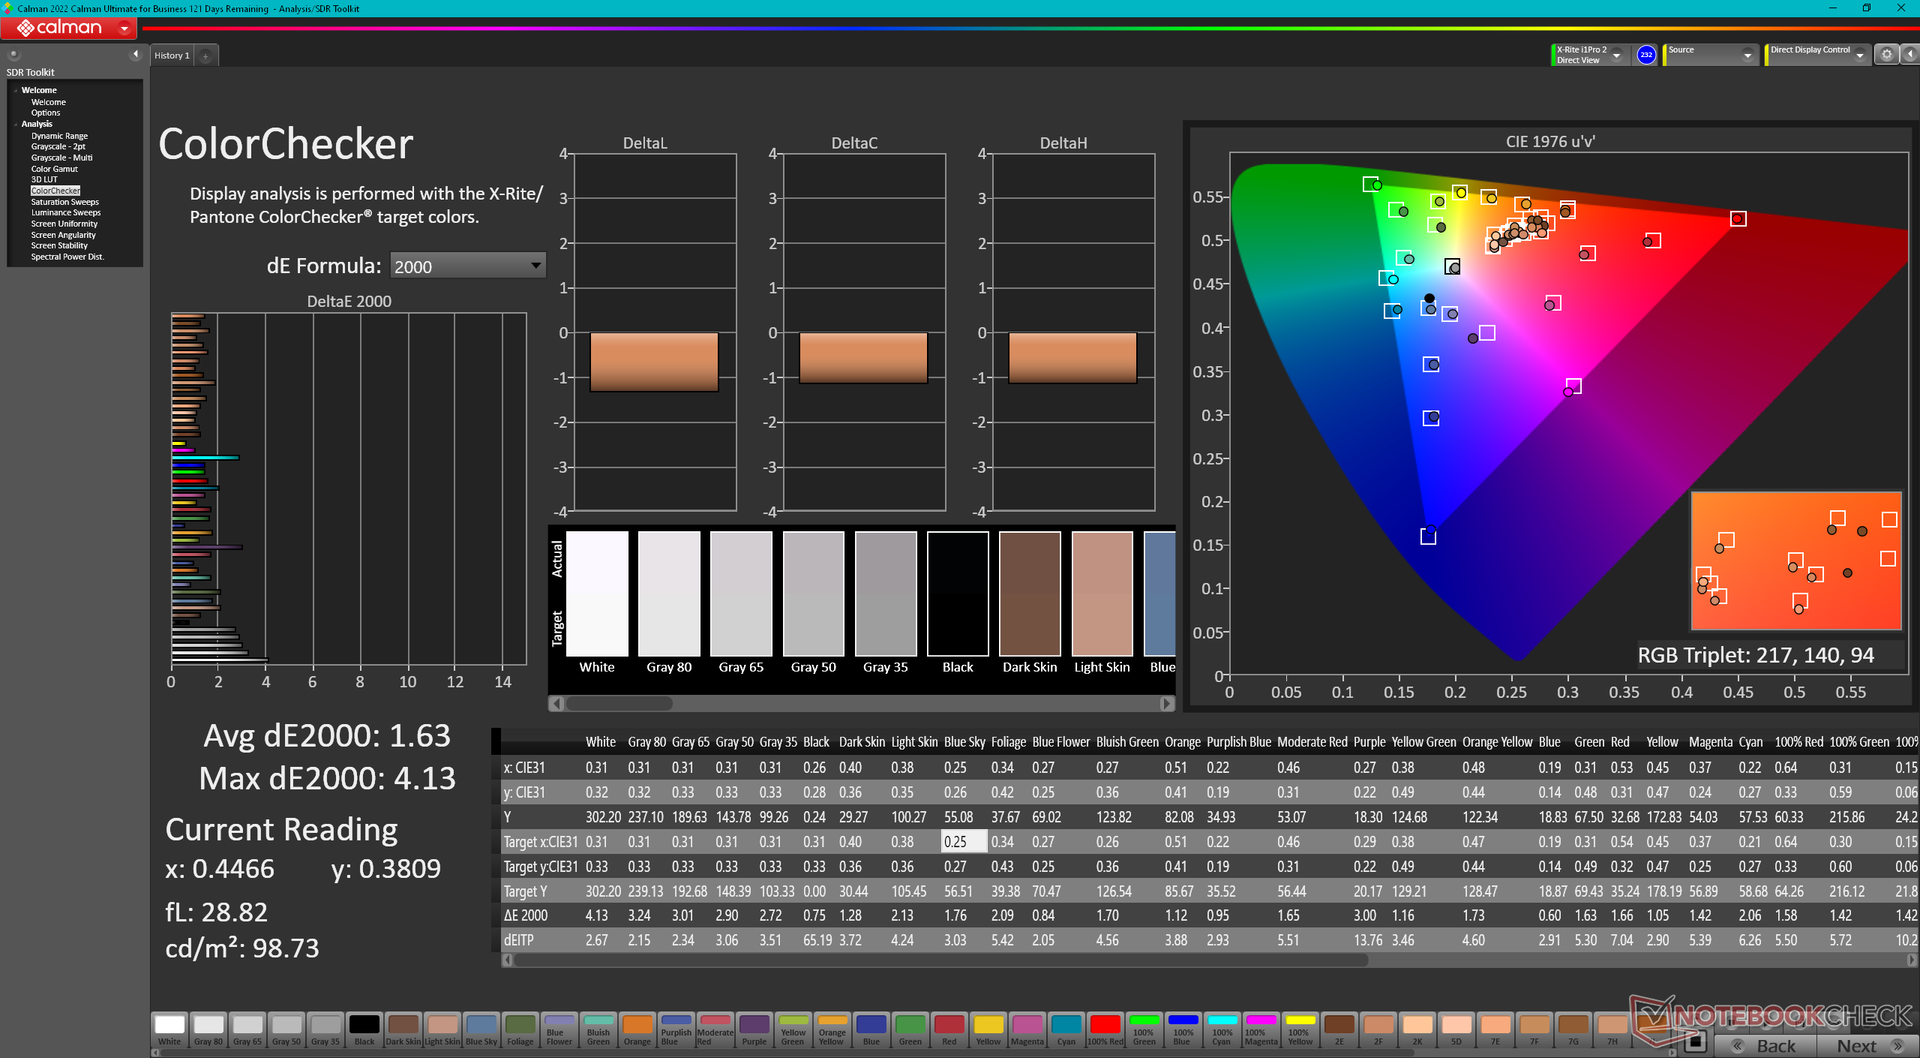
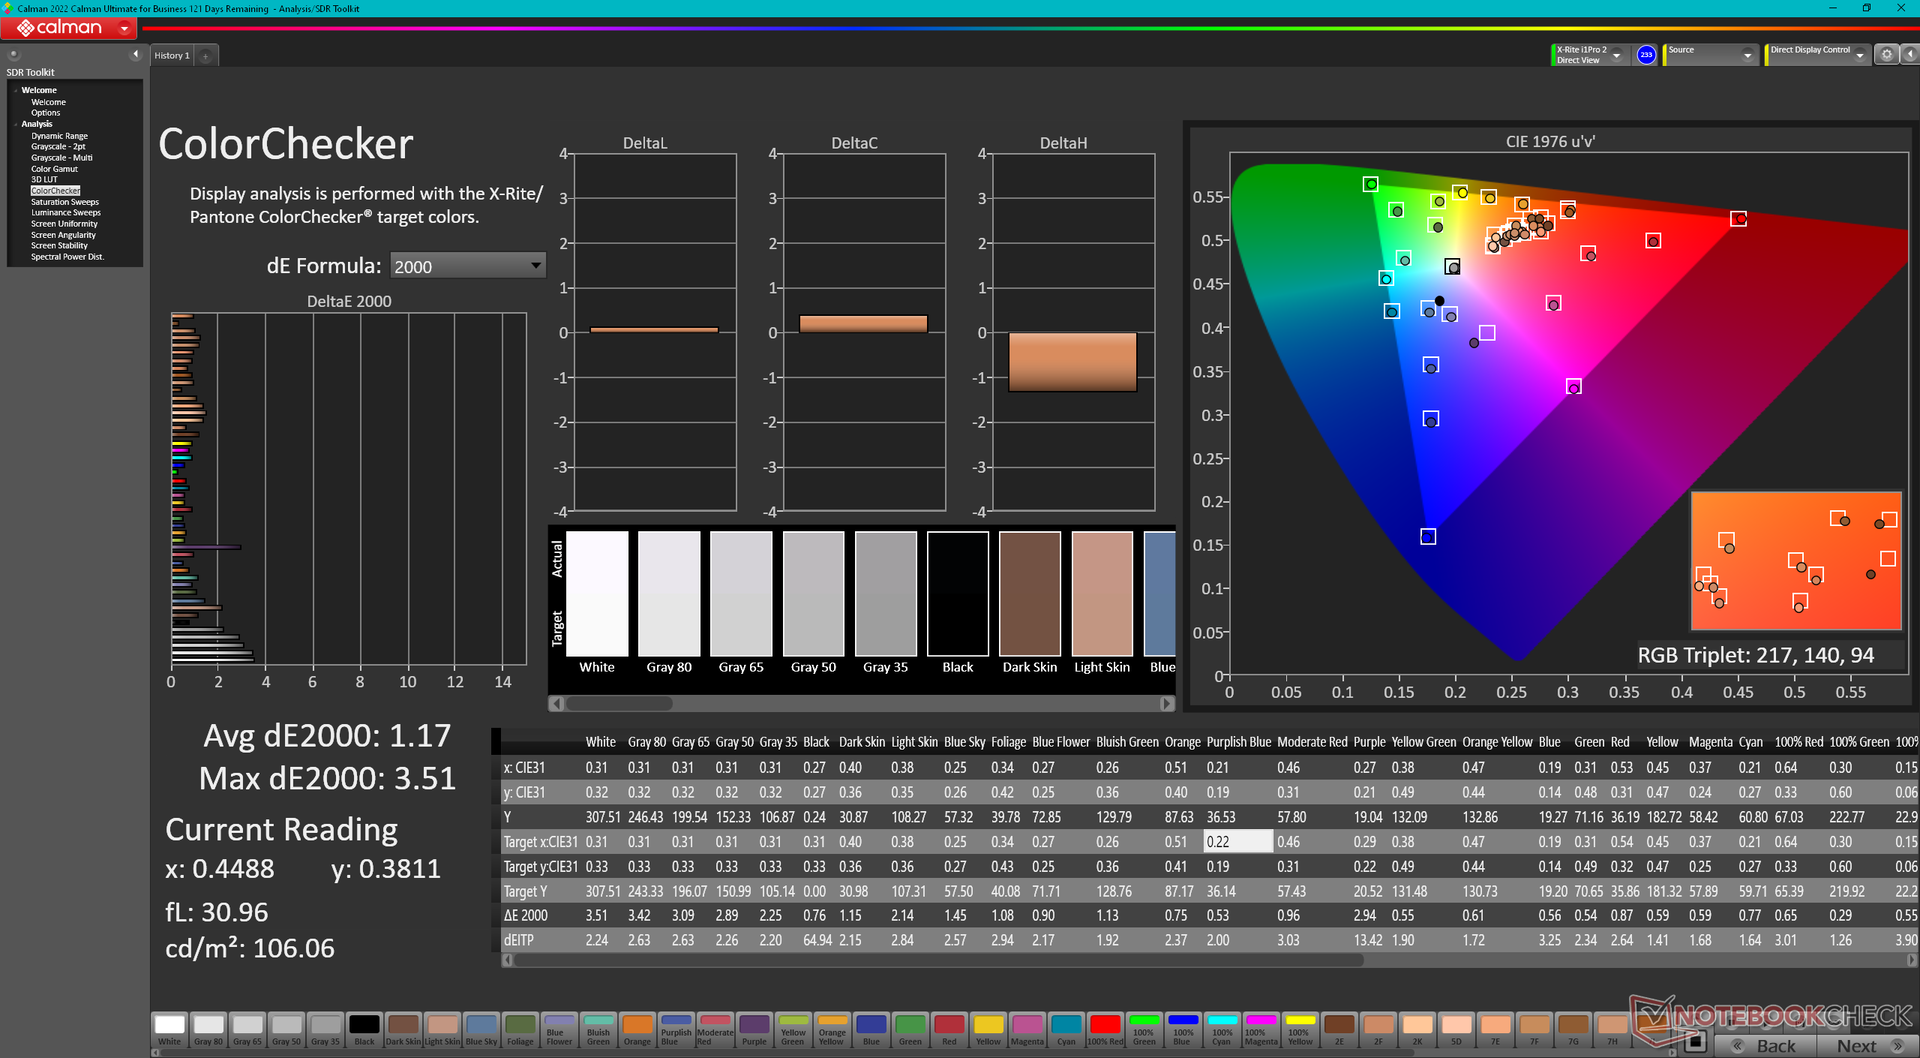
ΔE ColorChecker Calman: 1.63 | ∀{0.5-29.43 Ø4.71}
calibrated: 1.17
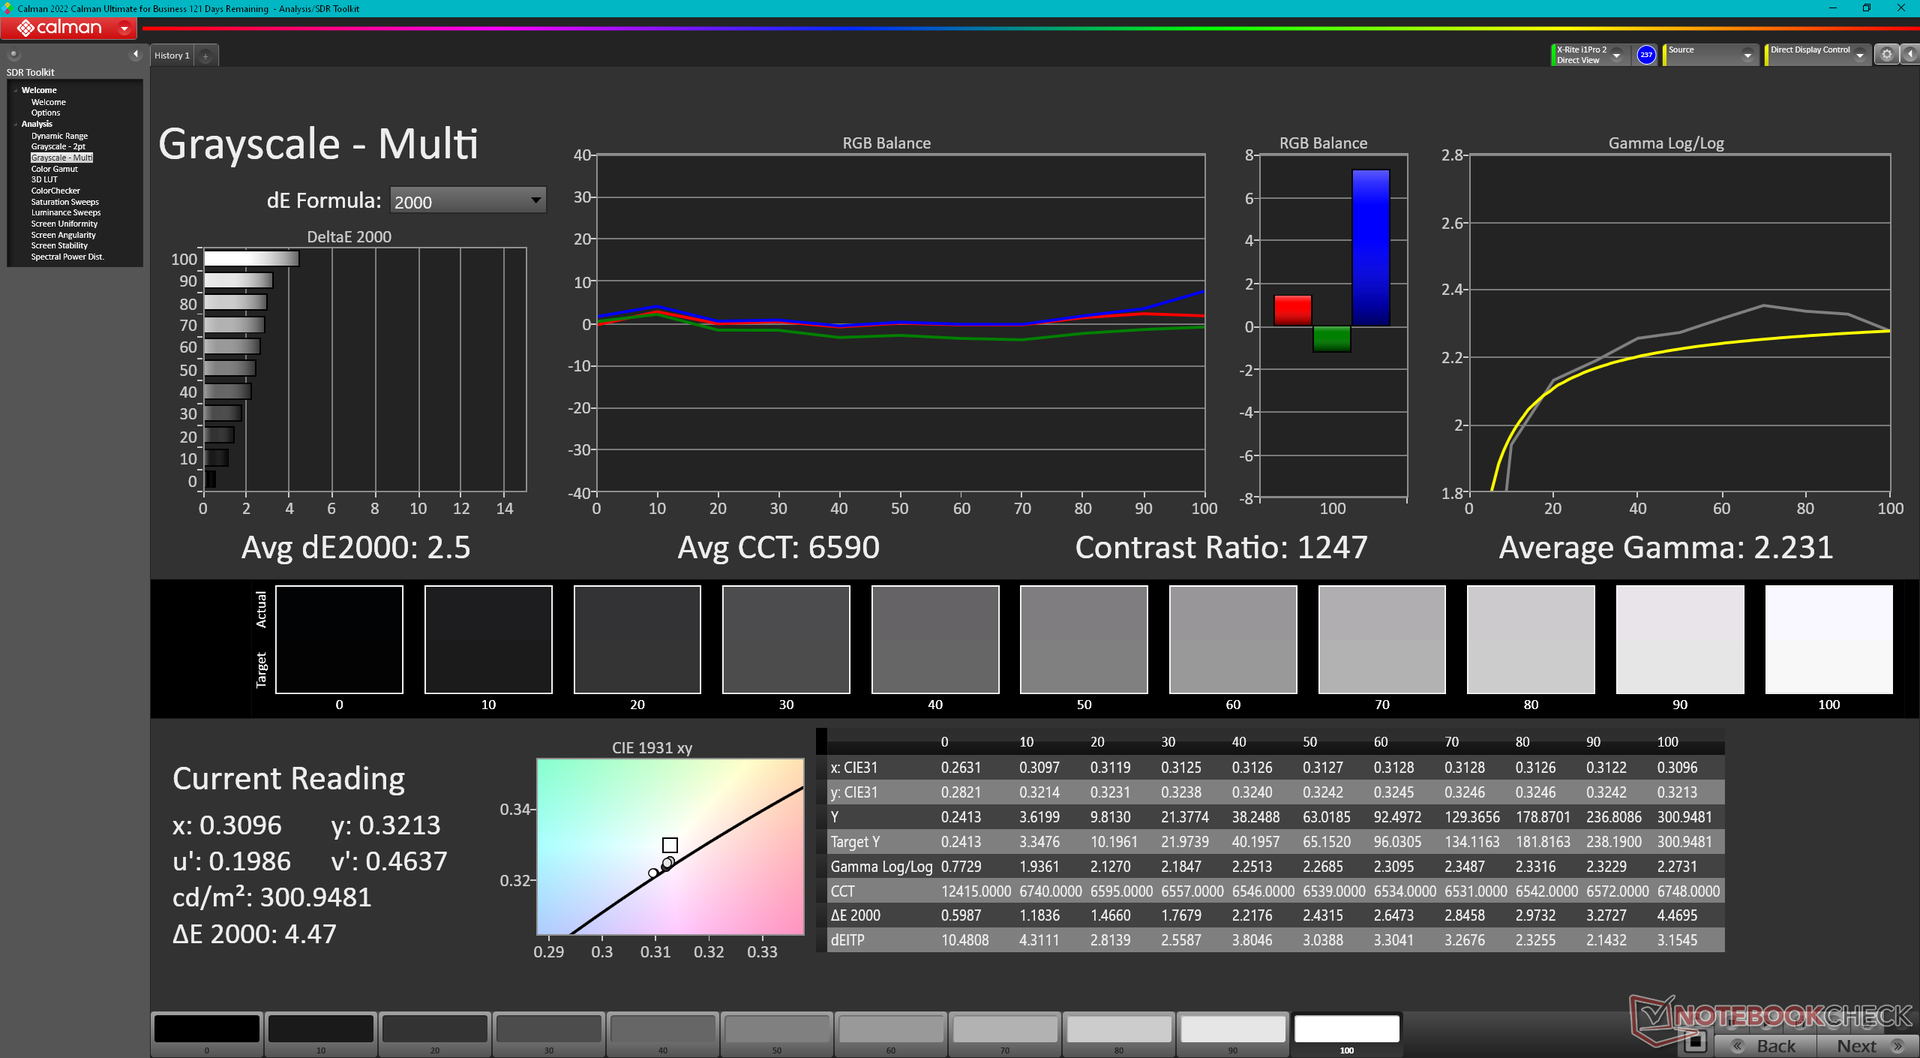
ΔE Greyscale Calman: 2.5 | ∀{0.09-98 Ø4.96}
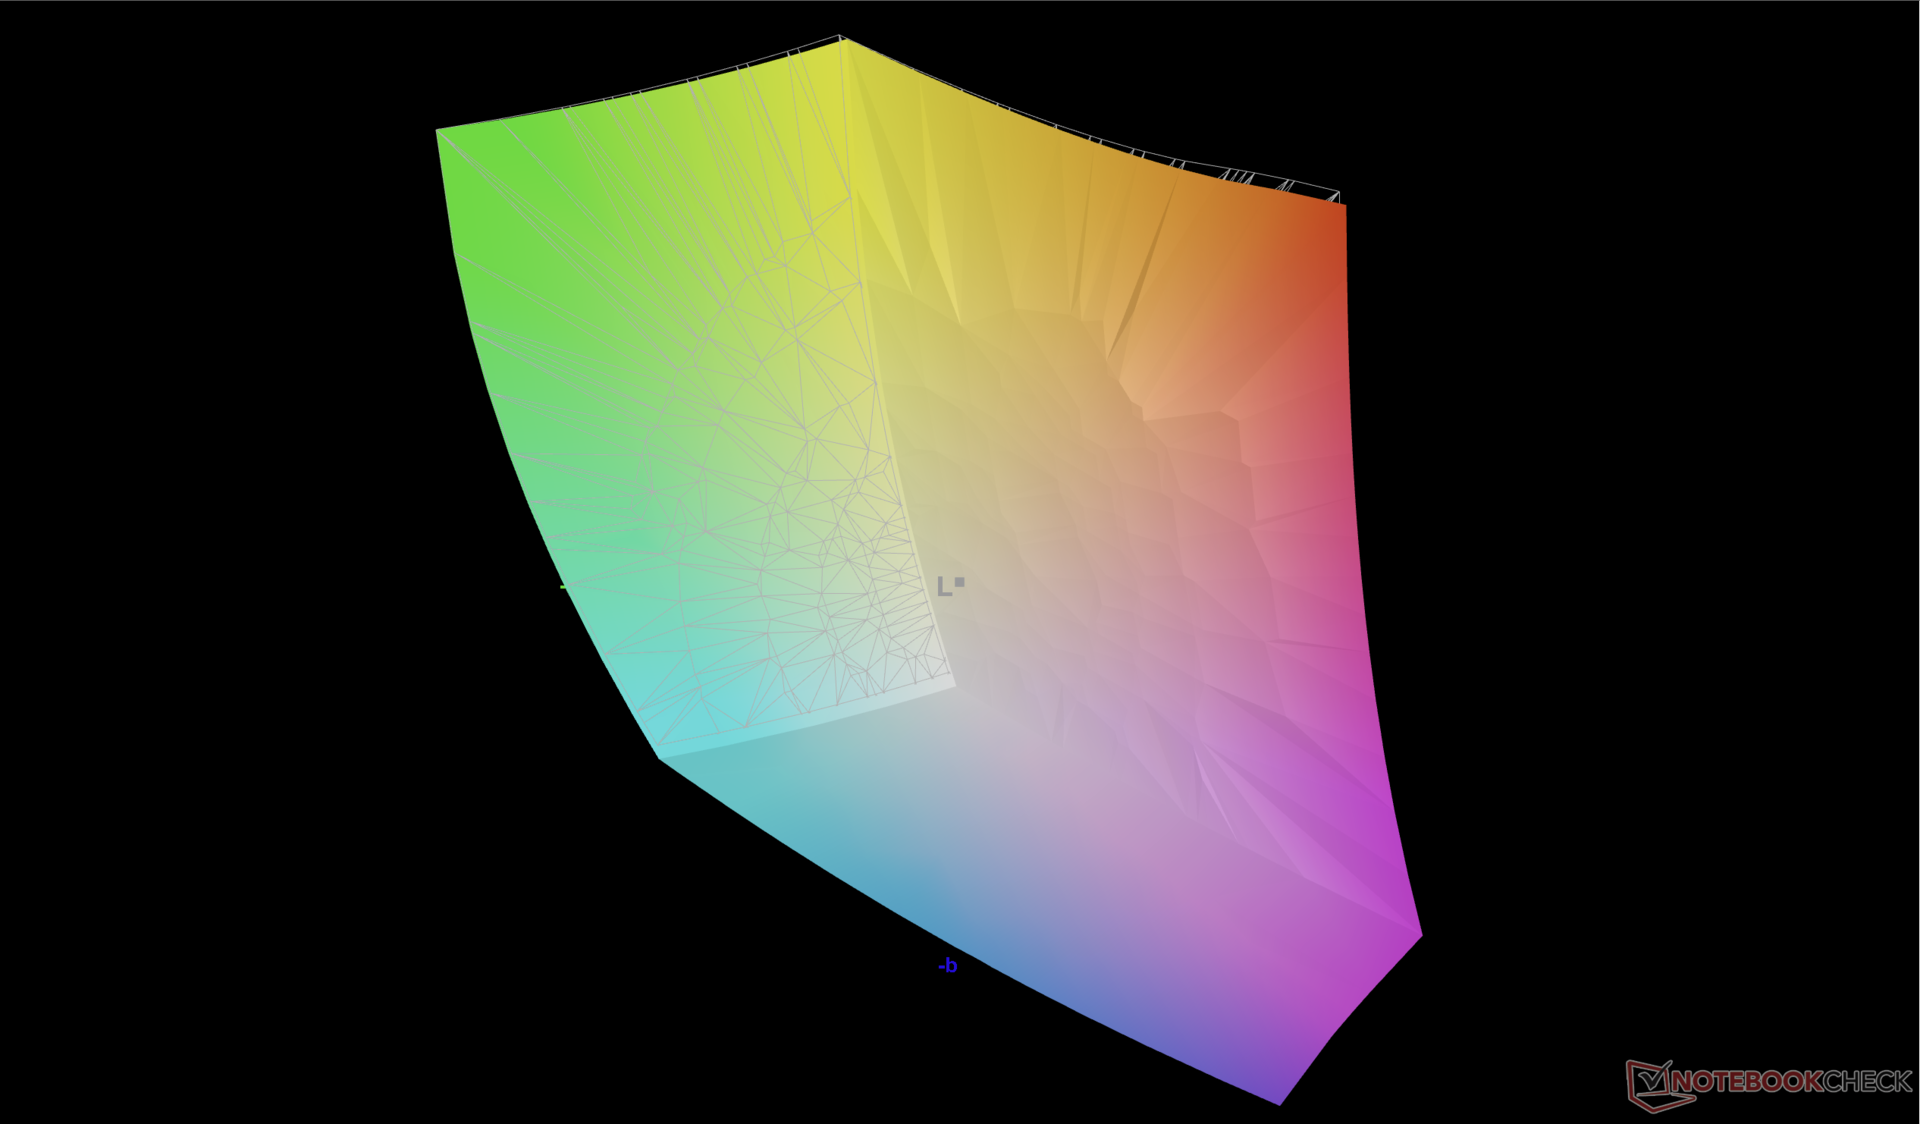
88.6% AdobeRGB 1998 (Argyll 3D)
100% sRGB (Argyll 3D)
99.2% Display P3 (Argyll 3D)
Gamma: 2.23
CCT: 6590 K
| Alienware x16 R1 BOE NE16NZ4, IPS, 2560x1600, 16" | Asus ROG Zephyrus M16 GU604VY-NM042X BOE0B74 (NE160QDM-NM4, IPS, 2560x1600, 16" | Razer Blade 16 Early 2023 CSOT T3 MNG007DA4-1, IPS, 2560x1600, 16" | Dell G16 7620 BOE NE16QDM, IPS, 2560x1600, 16" | Alienware m17 R5 (R9 6900HX, RX 6850M XT) AU Optronics AUODBA3, IPS, 3840x2160, 17" | Lenovo Legion Pro 7 16IRX8H MNG007DA2-3 (CSO1628), IPS, 2560x1600, 16" | |
|---|---|---|---|---|---|---|
| Display | 1% | 0% | -18% | -1% | -17% | |
| Display P3 Coverage (%) | 99.2 | 99.33 0% | 98.5 -1% | 68.3 -31% | 97.2 -2% | 69.1 -30% |
| sRGB Coverage (%) | 100 | 99.9 0% | 100 0% | 98 -2% | 99.6 0% | 99.7 0% |
| AdobeRGB 1998 Coverage (%) | 88.6 | 90.01 2% | 89.7 1% | 70.5 -20% | 88.4 0% | 71.2 -20% |
| Response Times | -542% | -23% | -35% | -118% | -49% | |
| Response Time Grey 50% / Grey 80% * (ms) | 5.1 ? | 50.8 ? -896% | 6.6 ? -29% | 8.6 ? -69% | 16.4 ? -222% | 12.3 ? -141% |
| Response Time Black / White * (ms) | 10.3 ? | 29.6 ? -187% | 12 ? -17% | 10.4 ? -1% | 11.6 ? -13% | 5.9 ? 43% |
| PWM Frequency (Hz) | 12000 | |||||
| Screen | 247% | -8% | -4% | -80% | 31% | |
| Brightness middle (cd/m²) | 302.2 | 634 110% | 456.8 51% | 369.4 22% | 484 60% | 511 69% |
| Brightness (cd/m²) | 285 | 627 120% | 437 53% | 348 22% | 449 58% | 469 65% |
| Brightness Distribution (%) | 89 | 92 3% | 83 -7% | 83 -7% | 87 -2% | 86 -3% |
| Black Level * (cd/m²) | 0.26 | 0.03 88% | 0.35 -35% | 0.32 -23% | 0.55 -112% | 0.4 -54% |
| Contrast (:1) | 1162 | 21133 1719% | 1305 12% | 1154 -1% | 880 -24% | 1278 10% |
| Colorchecker dE 2000 * | 1.63 | 0.89 45% | 3.7 -127% | 1.78 -9% | 4.8 -194% | 0.95 42% |
| Colorchecker dE 2000 max. * | 4.13 | 1.79 57% | 6.42 -55% | 4.41 -7% | 7.48 -81% | 2.07 50% |
| Colorchecker dE 2000 calibrated * | 1.17 | 0.91 22% | 0.66 44% | 1.22 -4% | 4.74 -305% | 0.91 22% |
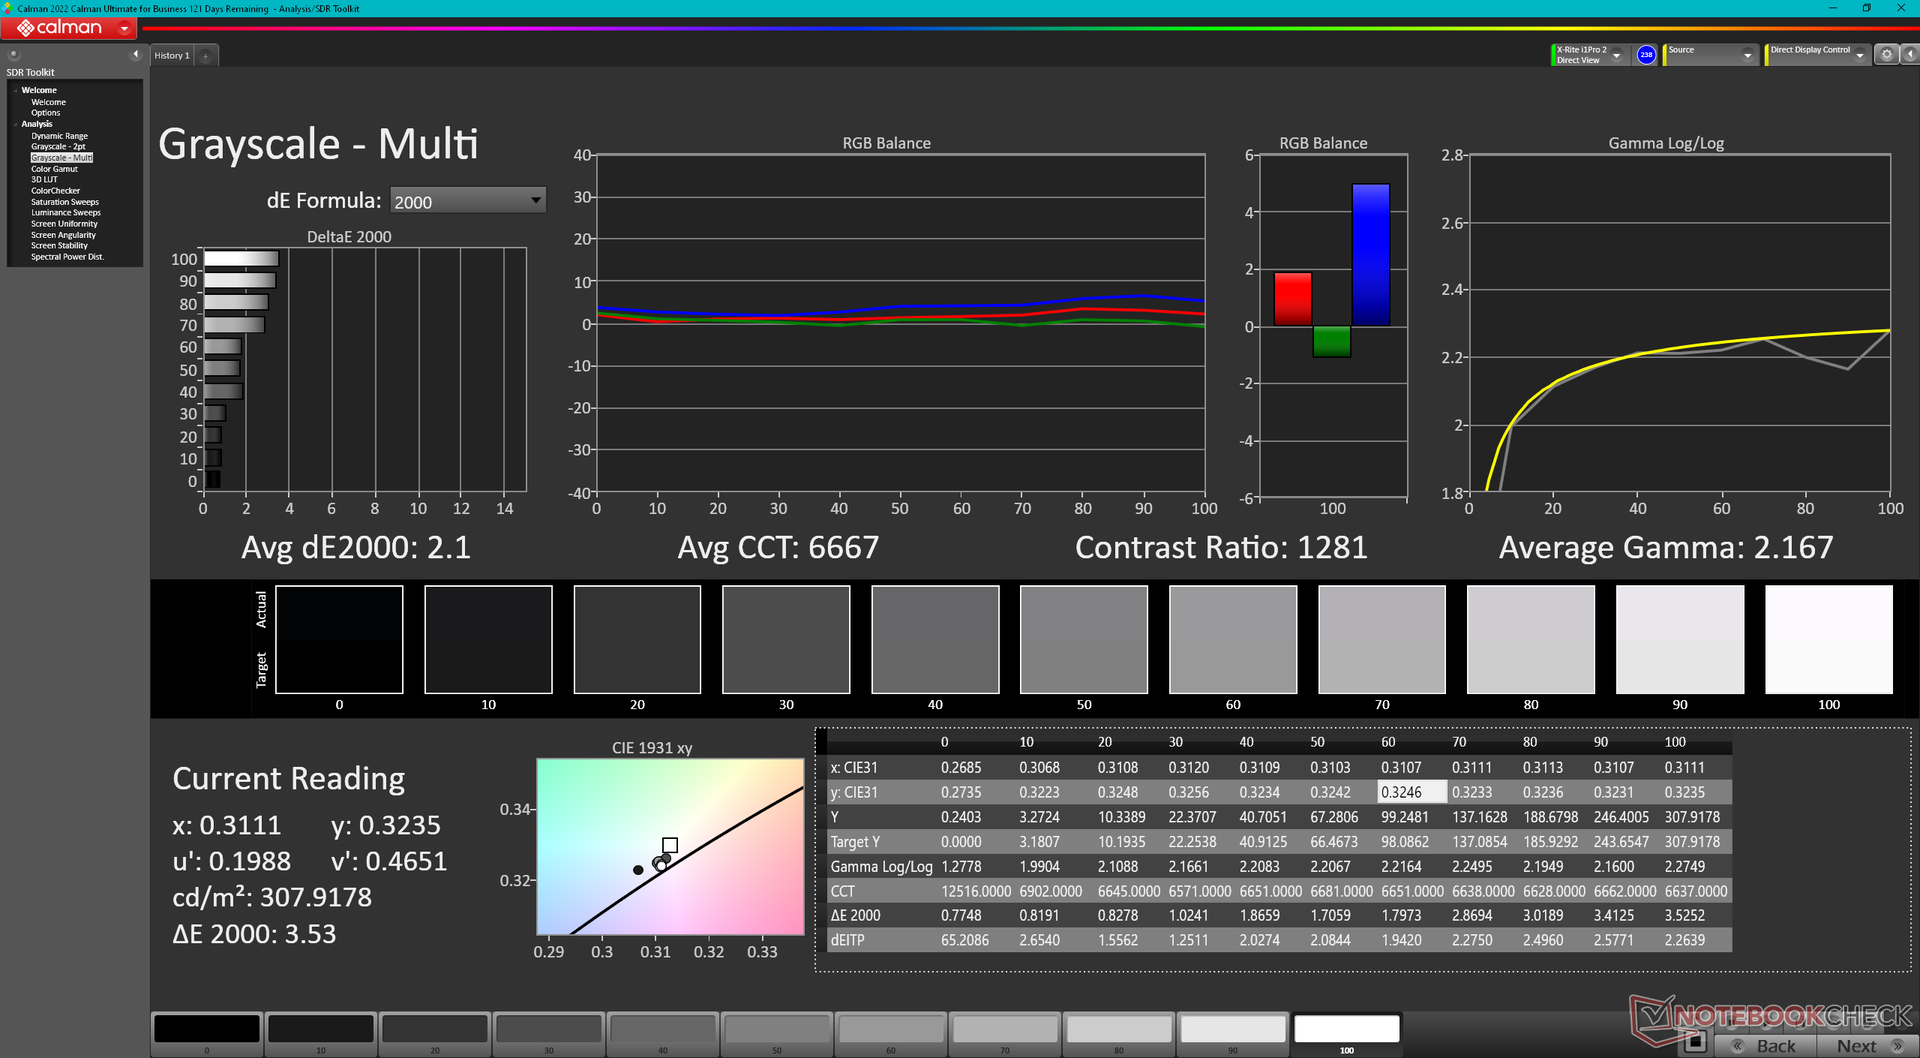
| Greyscale dE 2000 * | 2.5 | 1.13 55% | 2.6 -4% | 3.2 -28% | 5.5 -120% | 0.6 76% |
| Gamma | 2.23 99% | 2.47 89% | 2.3 96% | 2.2 100% | 2.42 91% | 2.176 101% |
| CCT | 6590 99% | 6497 100% | 6108 106% | 6750 96% | 6148 106% | 6545 99% |
| Média Total (Programa/Configurações) | -98% /
81% | -10% /
-8% | -19% /
-11% | -66% /
-68% | -12% /
9% |
* ... menor é melhor
A tela já vem bem calibrada, com valores médios de deltaE de escala de cinza e cor de apenas 2,5 e 1,63, respectivamente. A tentativa de calibrar ainda mais a tela com o nosso colorímetro X-Rite resultaria em ganhos muito pequenos e, portanto, não é necessária uma calibração para o usuário final.

Exibir tempos de resposta
| ↔ Tempo de resposta preto para branco | ||
|---|---|---|
| 10.3 ms ... ascensão ↗ e queda ↘ combinadas | ↗ 5.4 ms ascensão | 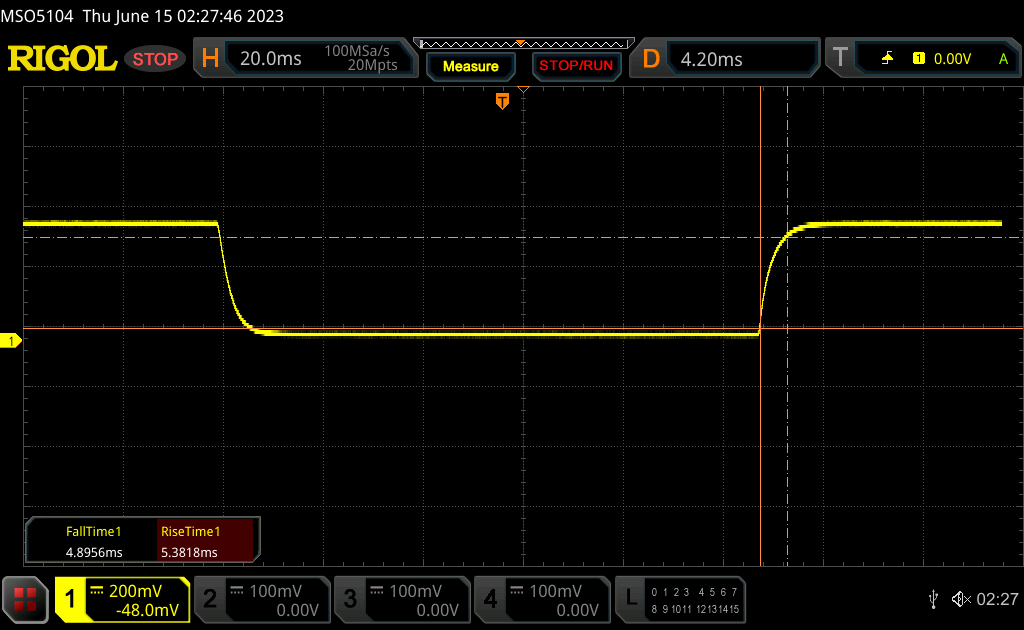 |
| ↘ 4.9 ms queda | ||
| A tela mostra boas taxas de resposta em nossos testes, mas pode ser muito lenta para jogadores competitivos. Em comparação, todos os dispositivos testados variam de 0.1 (mínimo) a 240 (máximo) ms. » 28 % de todos os dispositivos são melhores. Isso significa que o tempo de resposta medido é melhor que a média de todos os dispositivos testados (19.8 ms). | ||
| ↔ Tempo de resposta 50% cinza a 80% cinza | ||
| 5.1 ms ... ascensão ↗ e queda ↘ combinadas | ↗ 2.4 ms ascensão | 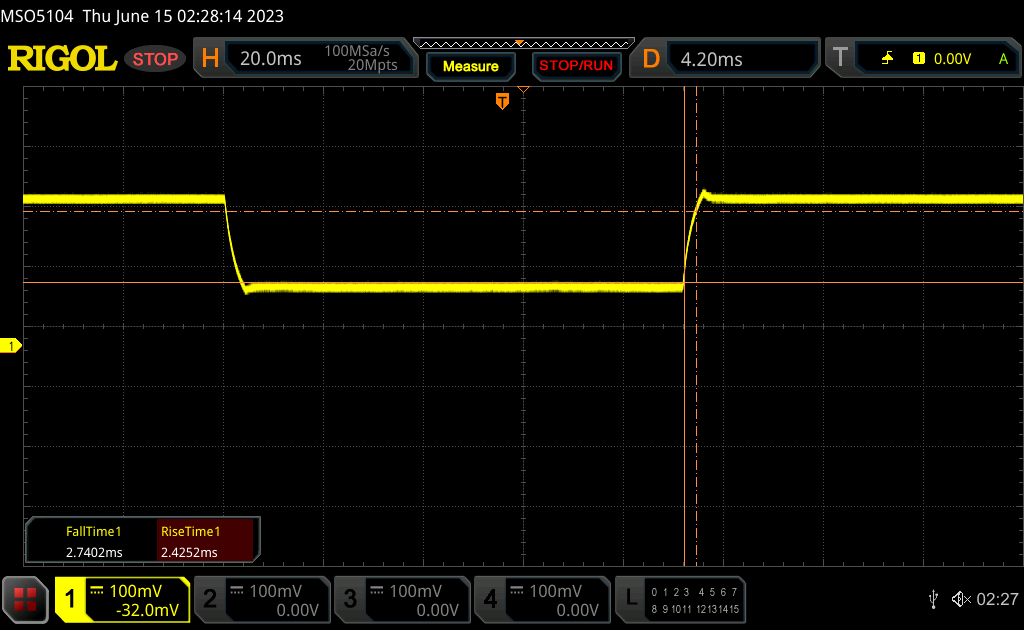 |
| ↘ 2.7 ms queda | ||
| A tela mostra taxas de resposta muito rápidas em nossos testes e deve ser muito adequada para jogos em ritmo acelerado. Em comparação, todos os dispositivos testados variam de 0.165 (mínimo) a 636 (máximo) ms. » 17 % de todos os dispositivos são melhores. Isso significa que o tempo de resposta medido é melhor que a média de todos os dispositivos testados (31 ms). | ||
Cintilação da tela / PWM (modulação por largura de pulso)
| Tela tremeluzindo / PWM não detectado | 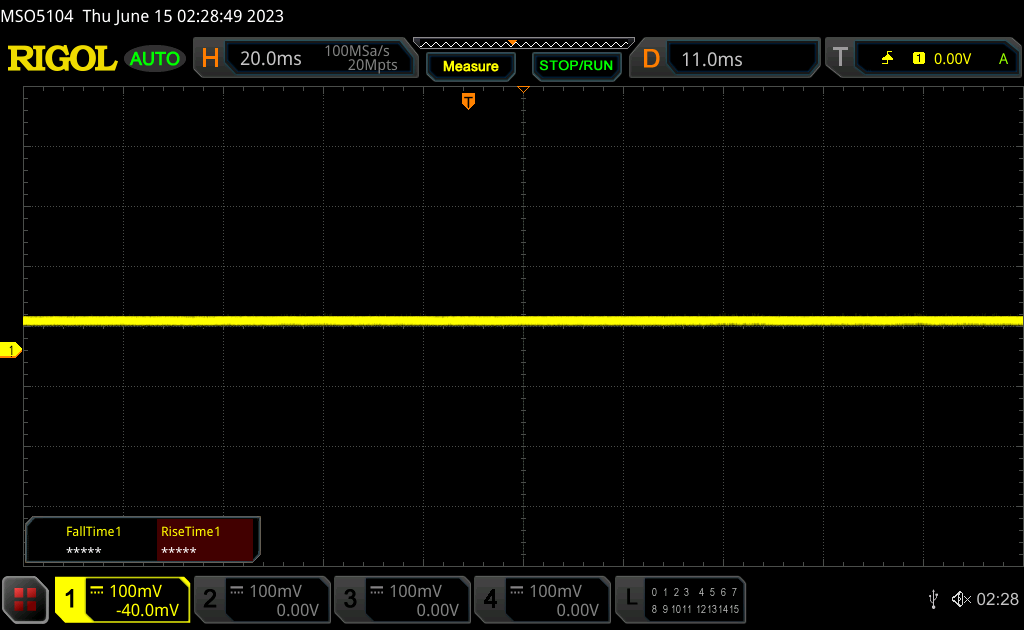 | ||
[pwm_comparison] Em comparação: 52 % de todos os dispositivos testados não usam PWM para escurecer a tela. Se PWM foi detectado, uma média de 7754 (mínimo: 5 - máximo: 343500) Hz foi medida. | |||
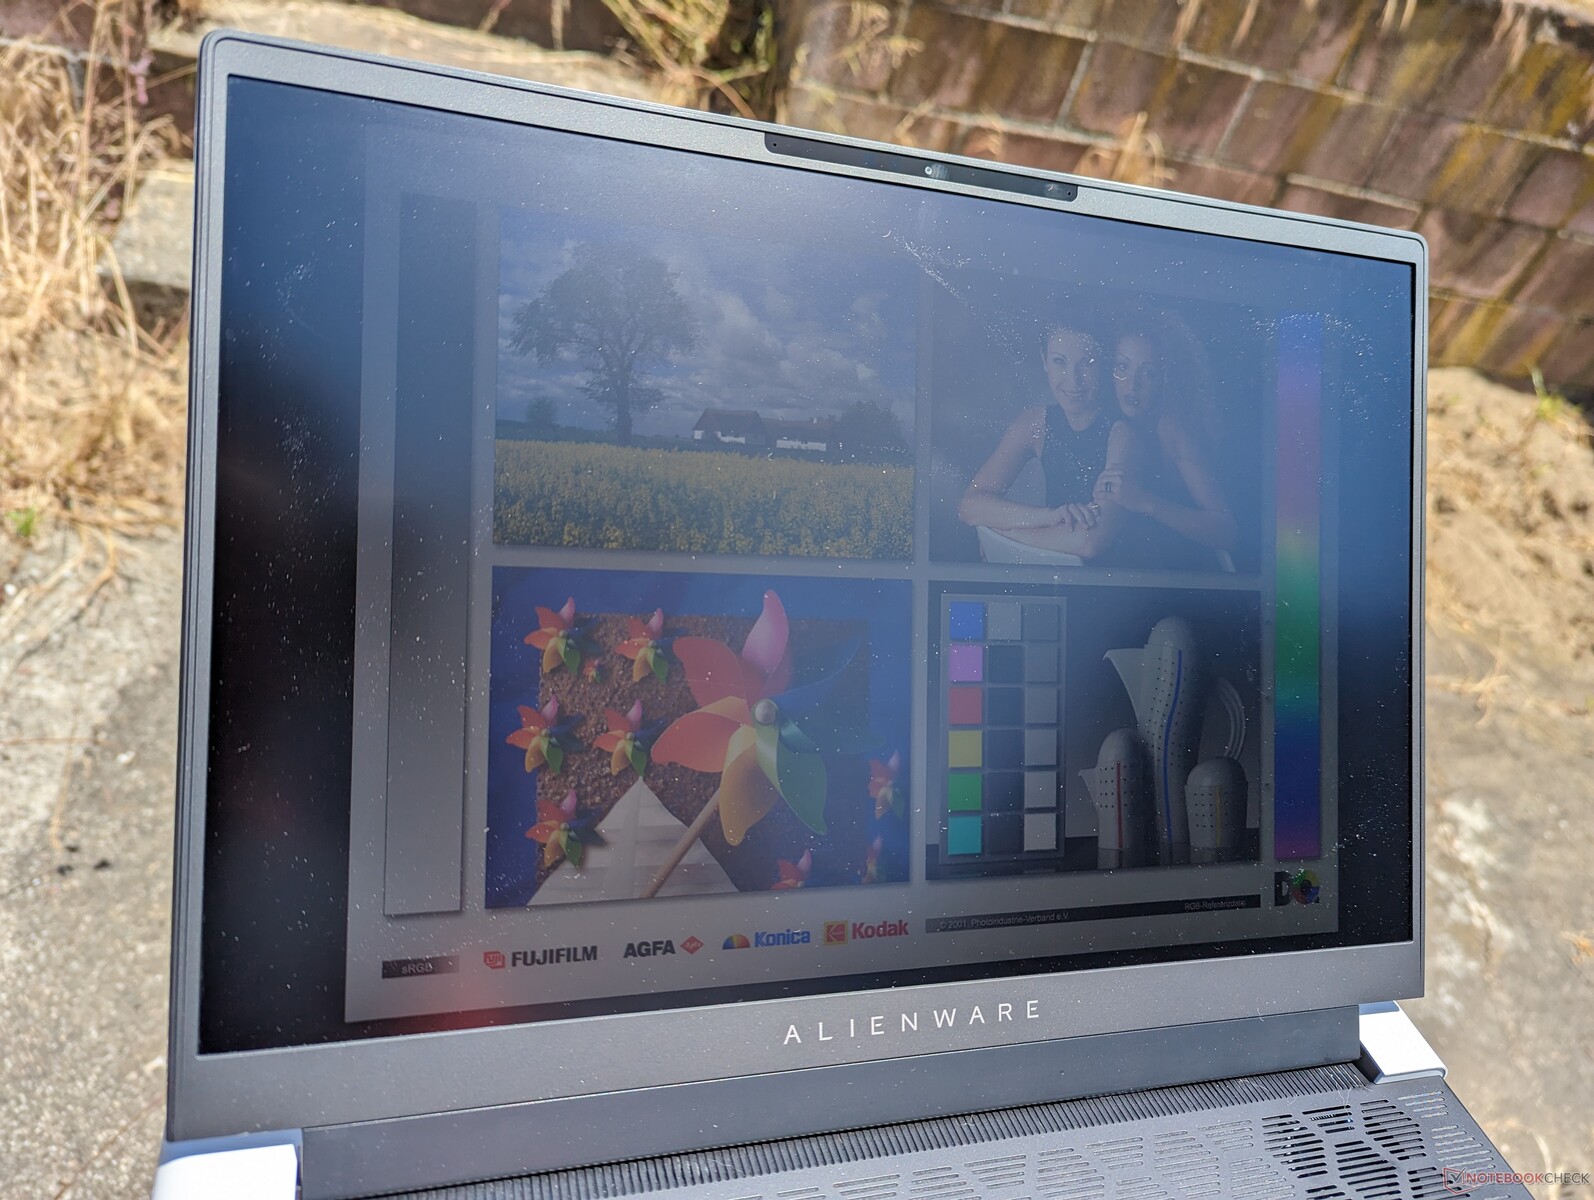
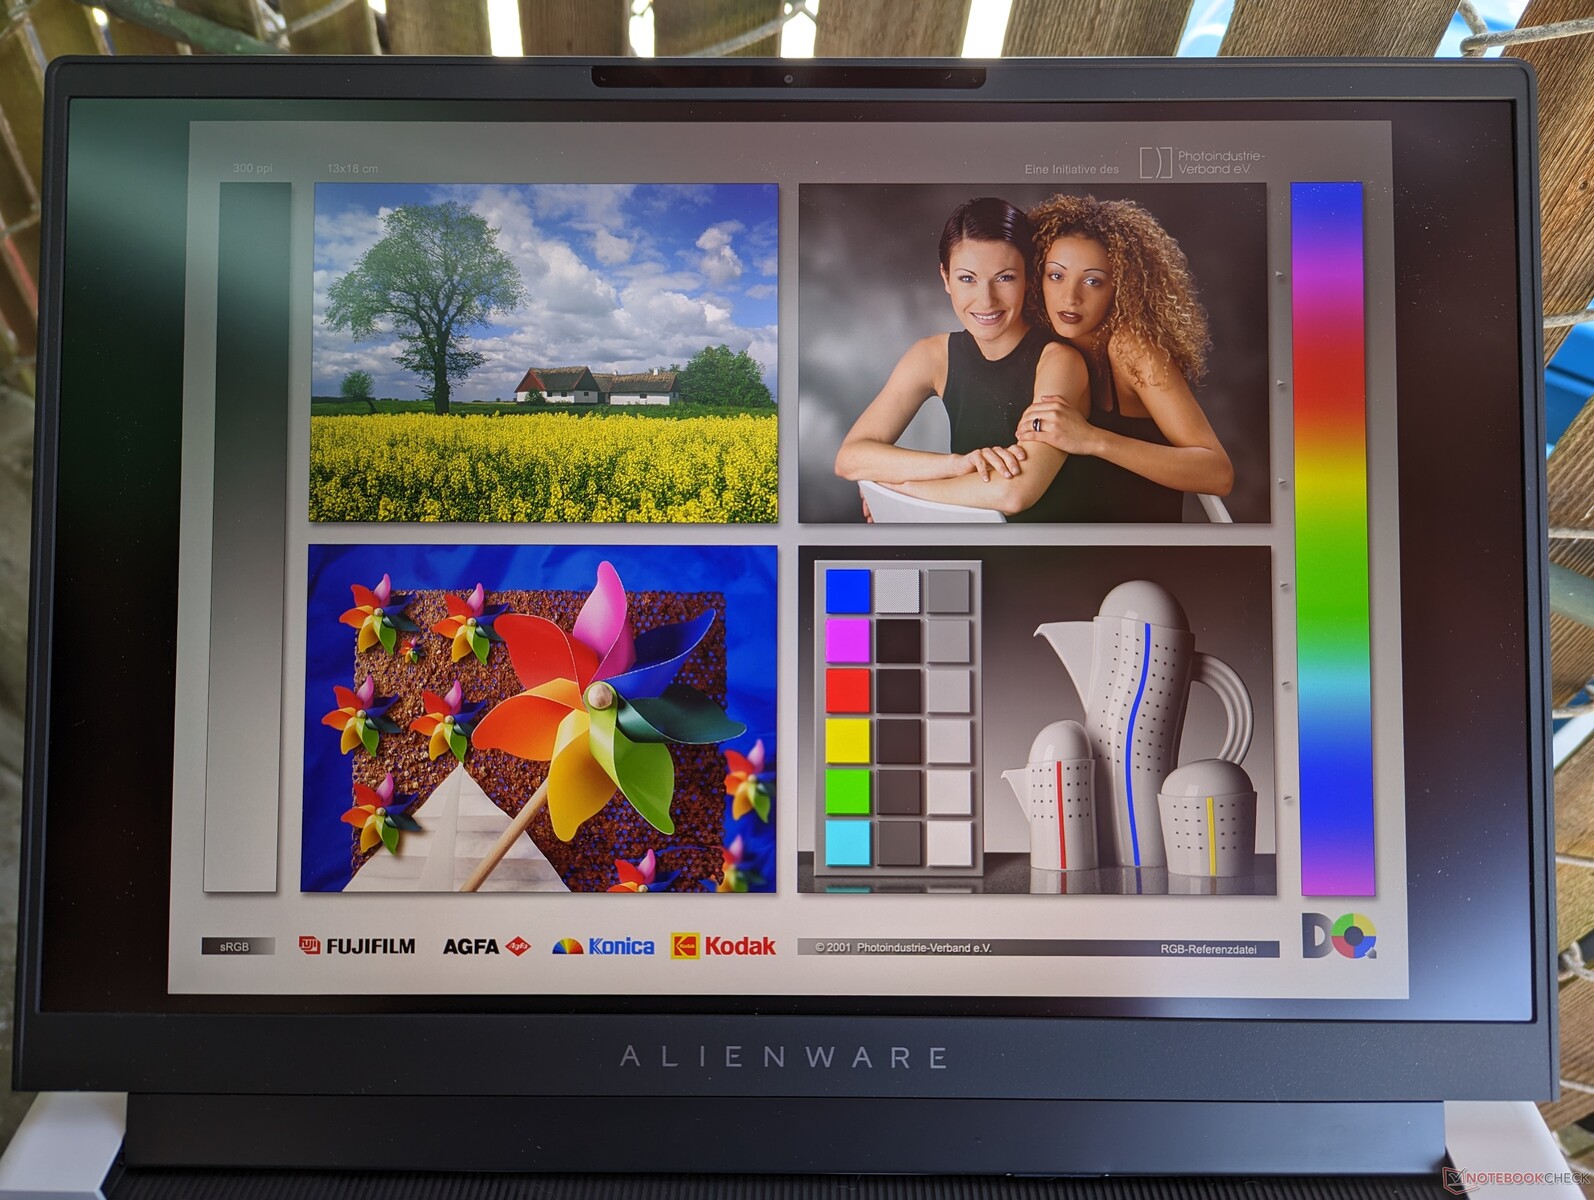
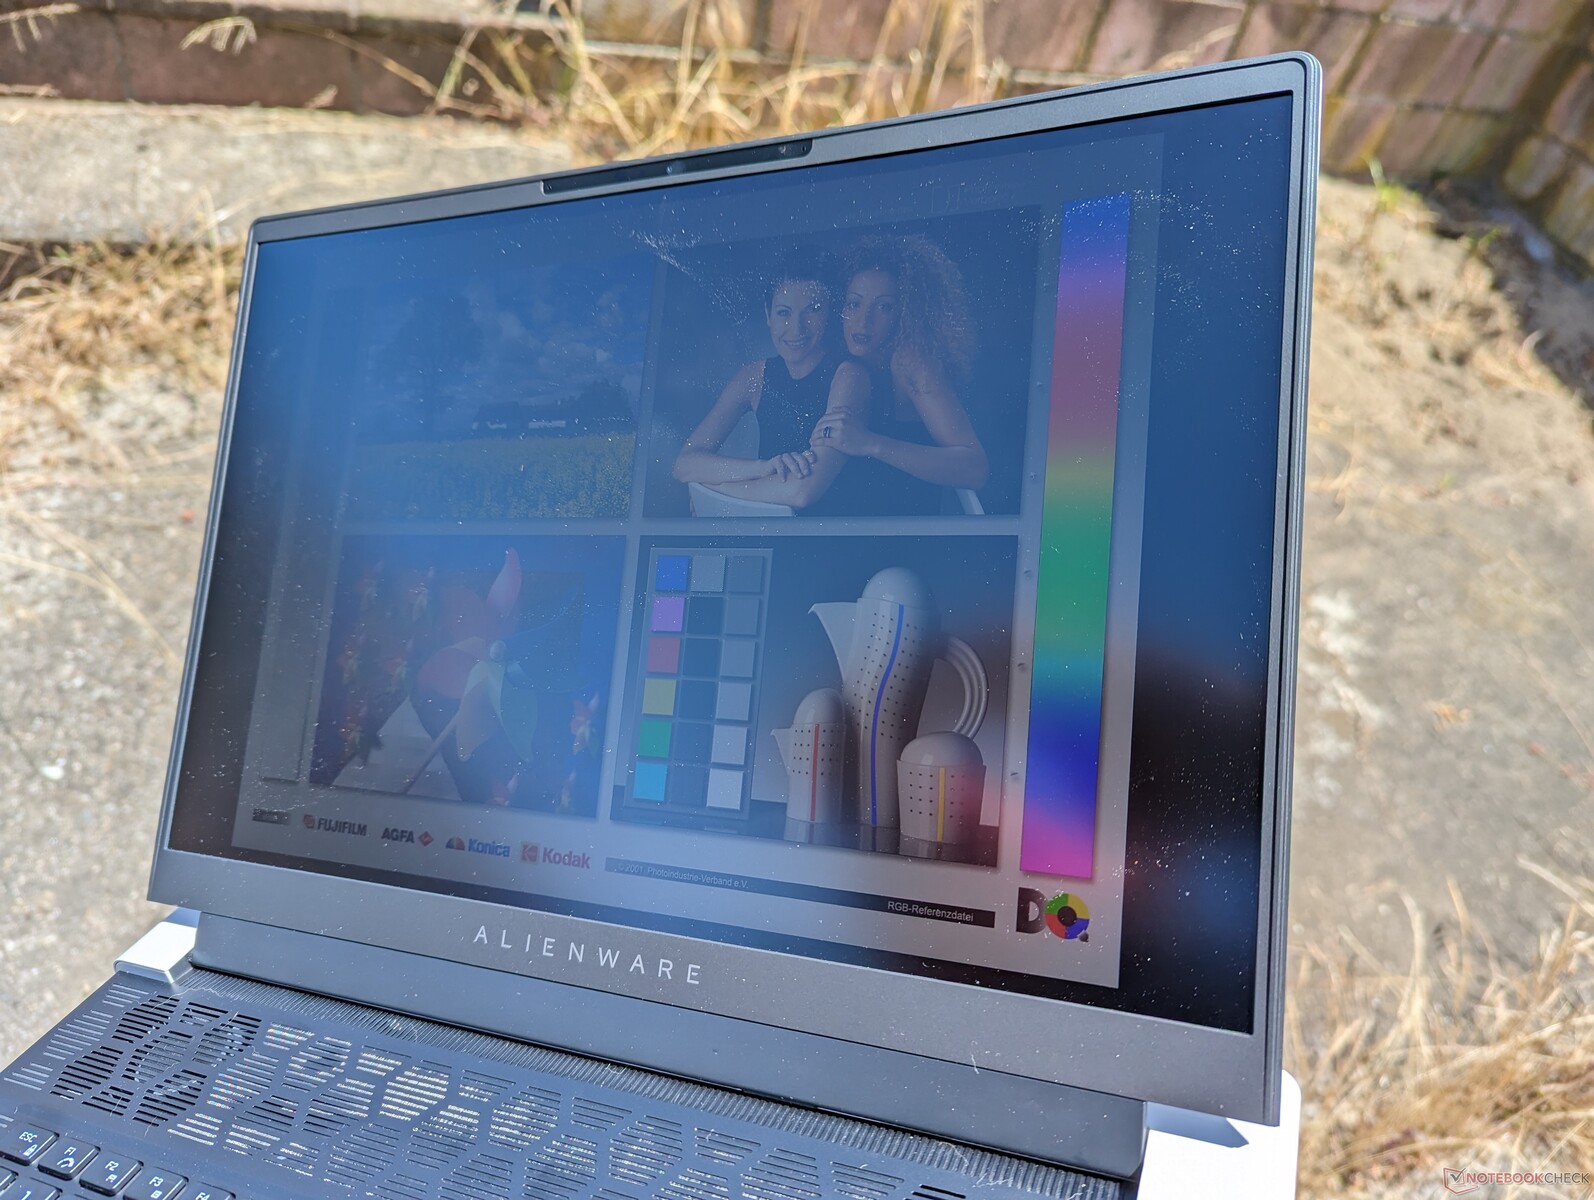
A visibilidade externa não é tão boa quanto a de outros laptops para jogos de 16 polegadas, como oZephyrus M16blade 16 ou Legion Pro 7 16, pois a tela do Alienware é visivelmente mais fraca. Combine isso com a área ocupada relativamente grande e o Alienware x16 R1 definitivamente não é um laptop adequado para ambientes externos, apesar do design fino do chassi.
Desempenho - CPU de alta qualidade, GPU impressionante

Condições de teste
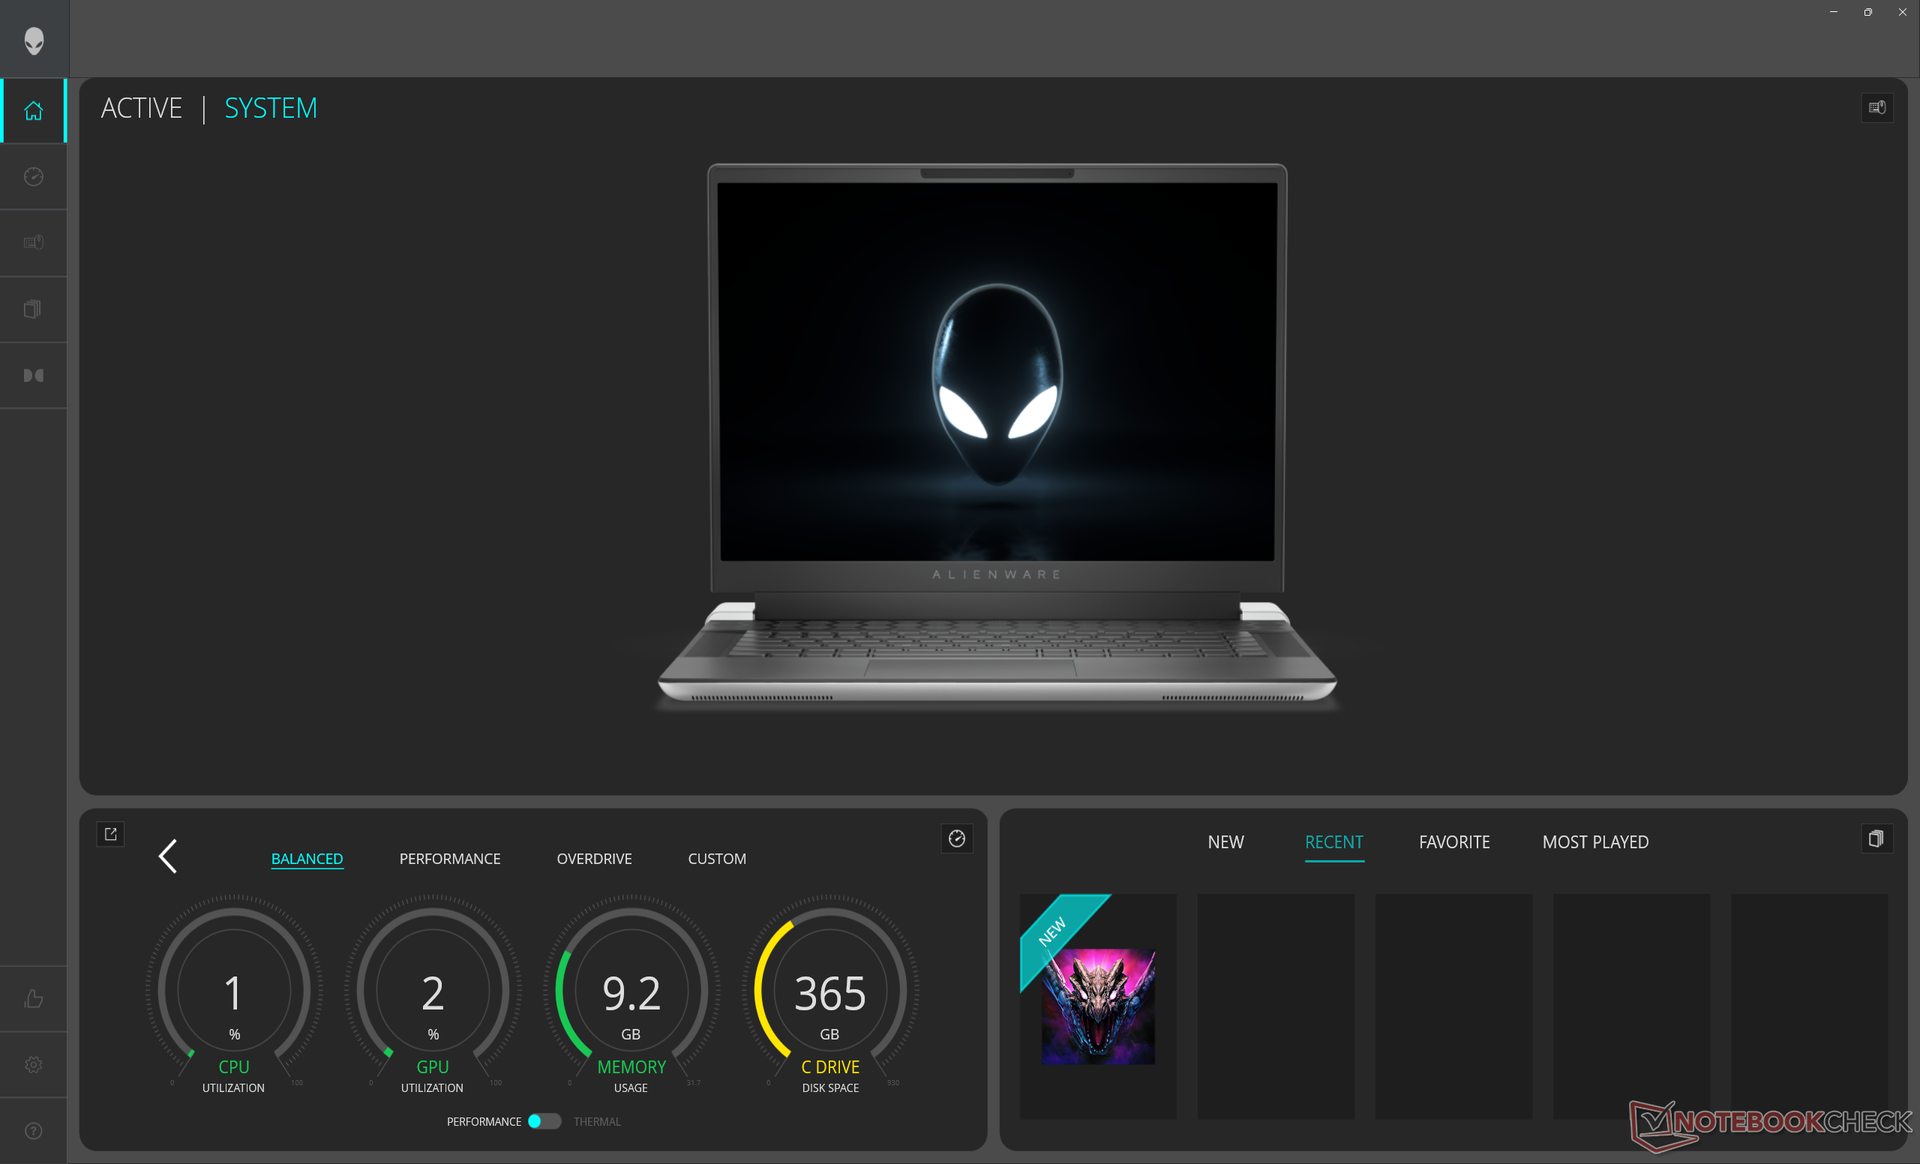
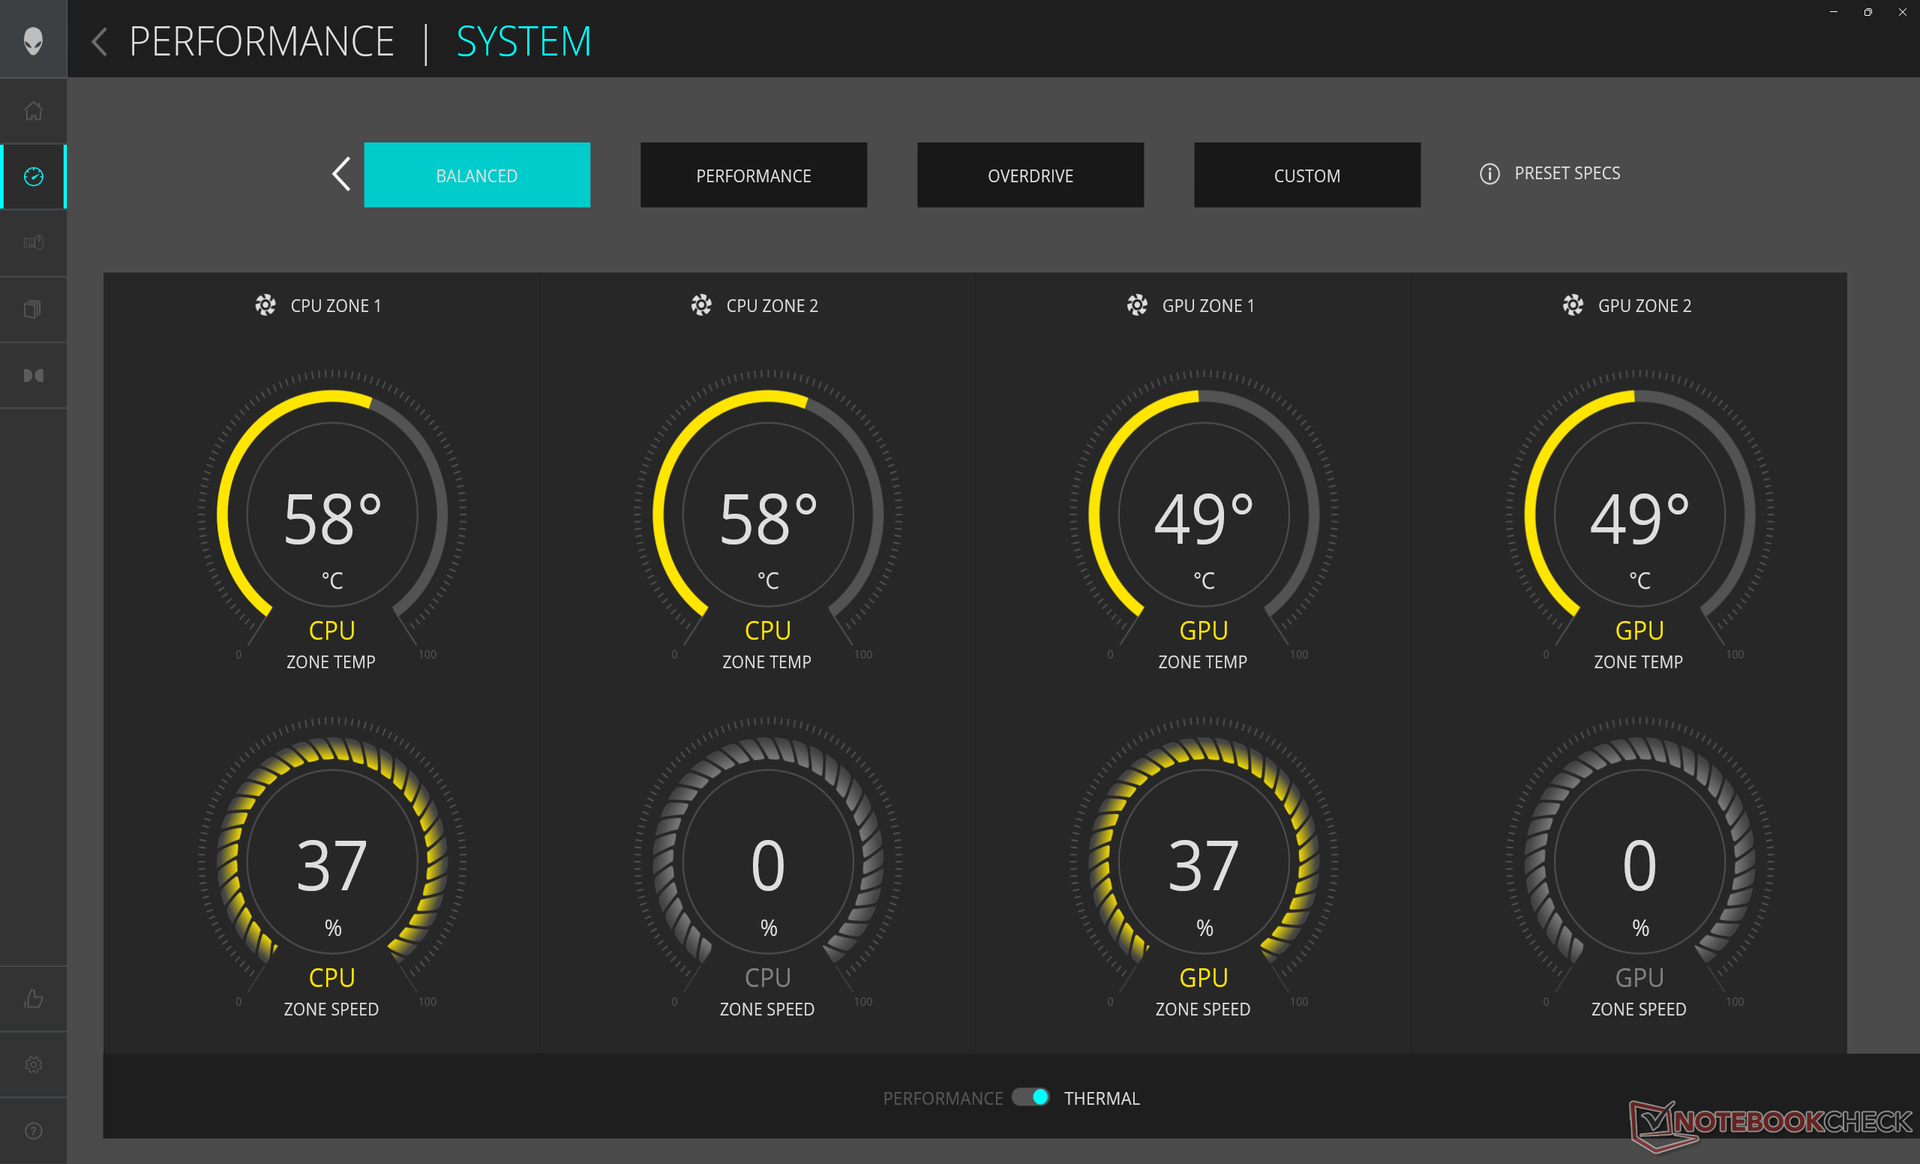
Configuramos nossa unidade para o modo Overdrive via Alienware Command Center (ACC) e para o modo High Performance via Windows antes de executar os benchmarks abaixo. Também nos certificamos de definir os gráficos apenas para o modo dGPU, em vez de Optimus, por meio do Painel de Controle da Nvidia. O que é irritante é que os perfis de energia do ACC não são sincronizados com o Windows e, portanto, é possível ter perfis conflitantes ativos (ou seja, um definido para Economia de energia e o outro para Desempenho).
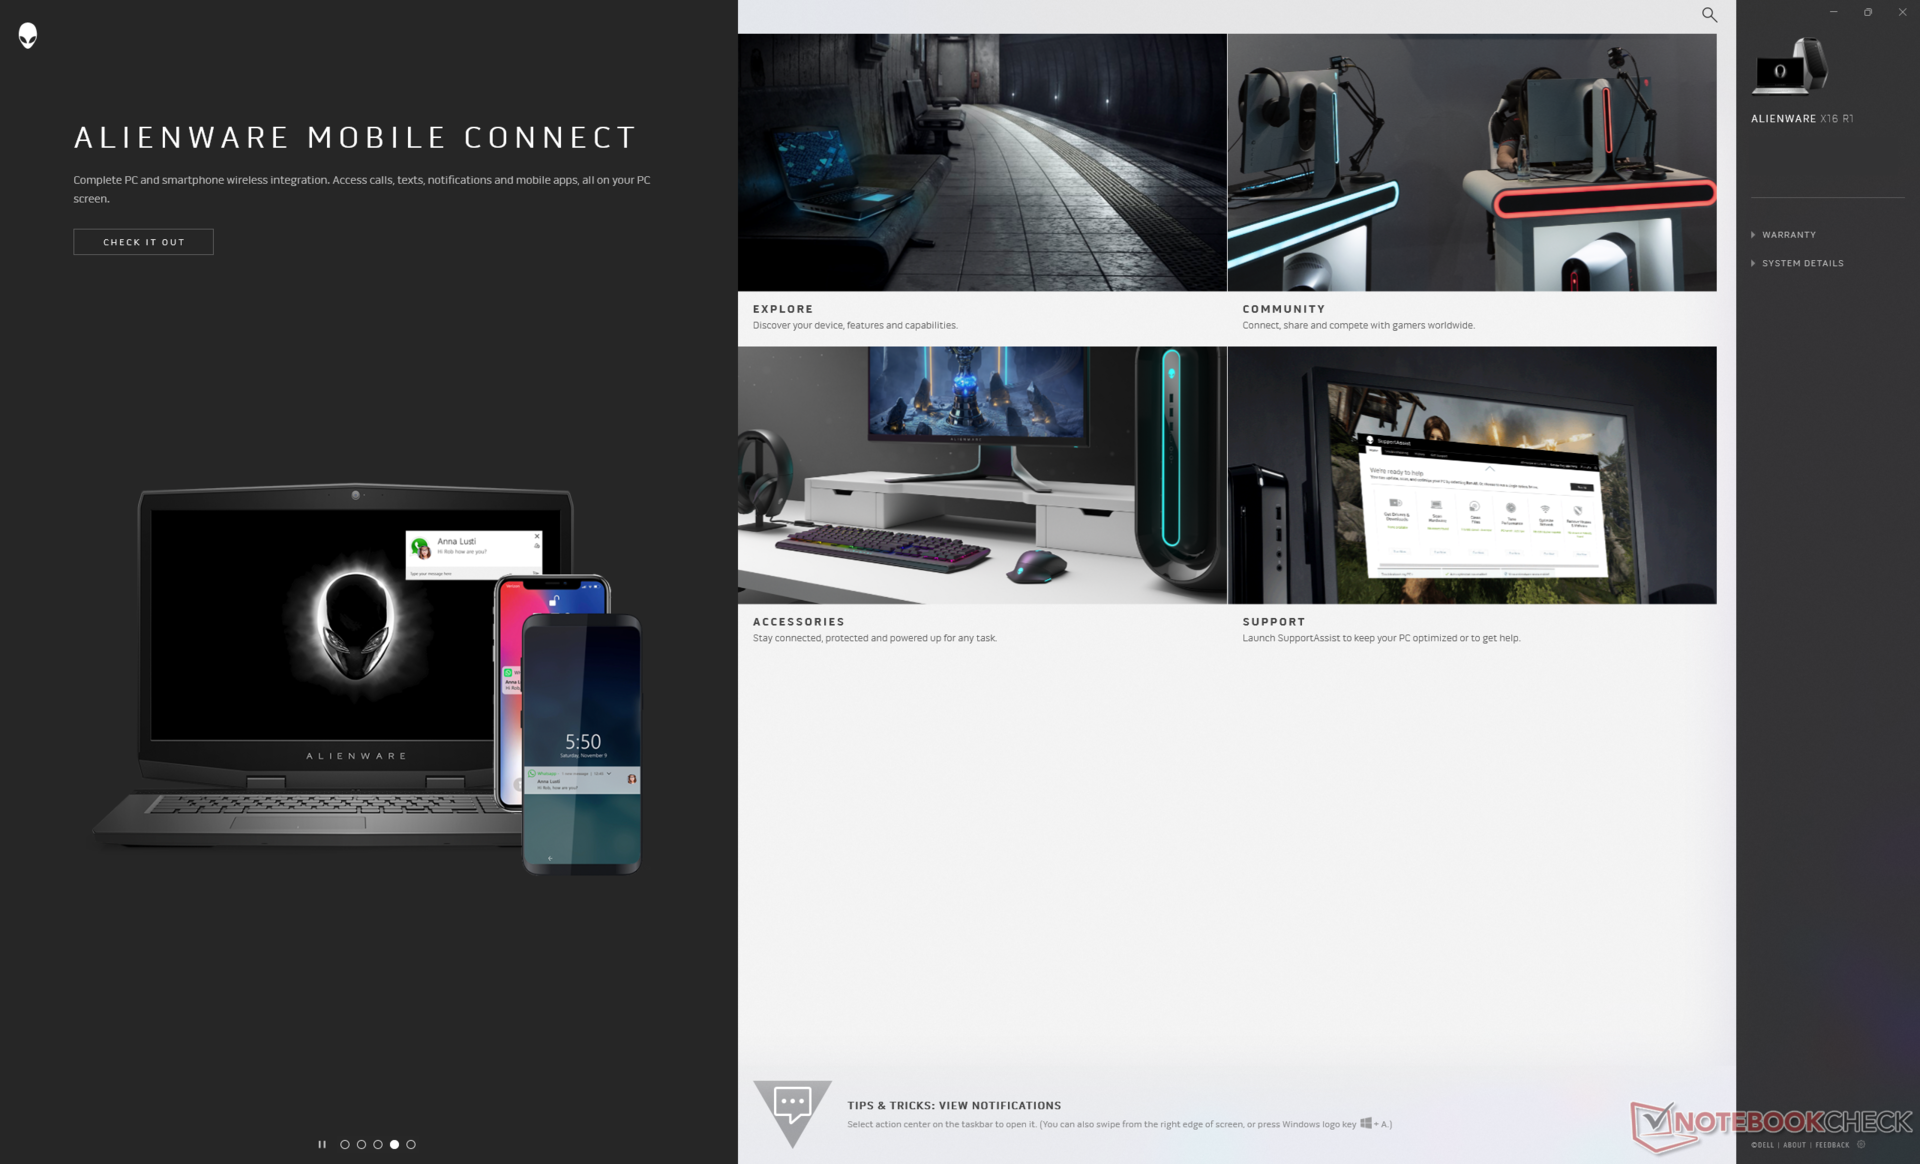
O ACC não deve ser confundido com o My Alienware. O primeiro é um hub de controle para informações vitais do sistema, configurações RGB, perfis de energia e configurações de jogos, enquanto o segundo é um nexo para o suporte da Dell, conexão móvel e acessórios opcionais.
O Advanced Optimus ou MUX é suportado em todos os SKUs. Lembre-se de que o G-Sync está ativo para o monitor interno se for definido apenas para o modo dGPU.
Processador
É importante observar que o modelo atinge o máximo com o Core i9-13900HK e não o Core i9-13900HX sendo que este último pode oferecer um desempenho multi-thread 50 a 60% mais rápido. Portanto, o desempenho geral do nosso Core i7-13900HK é praticamente idêntico ao do Core i9-13900H e comparável ao concorrente Ryzen 7 7745HX. Para obter um desempenho mais rápido, os gamers talvez queiram considerar o Alienware m16 ou o Lenovo Legion Pro 7 mais espesso, pois eles podem ser configurados com o Core i7-13900HX.
O downgrade para o Core i7-13620H ou i7-13700H menos caras, deverá afetar o desempenho do processador em cerca de 15 a 20%, com base em nosso tempo com oMSI Katana 17 e o Dell XPS 17 9730.
Cinebench R15 Multi Loop
Cinebench R20: CPU (Multi Core) | CPU (Single Core)
Cinebench R23: Multi Core | Single Core
Cinebench R15: CPU Multi 64Bit | CPU Single 64Bit
Blender: v2.79 BMW27 CPU
7-Zip 18.03: 7z b 4 | 7z b 4 -mmt1
Geekbench 5.5: Multi-Core | Single-Core
HWBOT x265 Benchmark v2.2: 4k Preset
LibreOffice : 20 Documents To PDF
R Benchmark 2.5: Overall mean
* ... menor é melhor
AIDA64: FP32 Ray-Trace | FPU Julia | CPU SHA3 | CPU Queen | FPU SinJulia | FPU Mandel | CPU AES | CPU ZLib | FP64 Ray-Trace | CPU PhotoWorxx
| Performance rating | |
| Lenovo Legion Pro 7 RTX4090 | |
| Razer Blade 16 Early 2023 | |
| Asus ROG Zephyrus M16 GU604VY-NM042X | |
| Alienware x16 R1 | |
| Alienware m17 R5 (R9 6900HX, RX 6850M XT) | |
| Dell G16 7620 | |
| Média Intel Core i9-13900HK | |
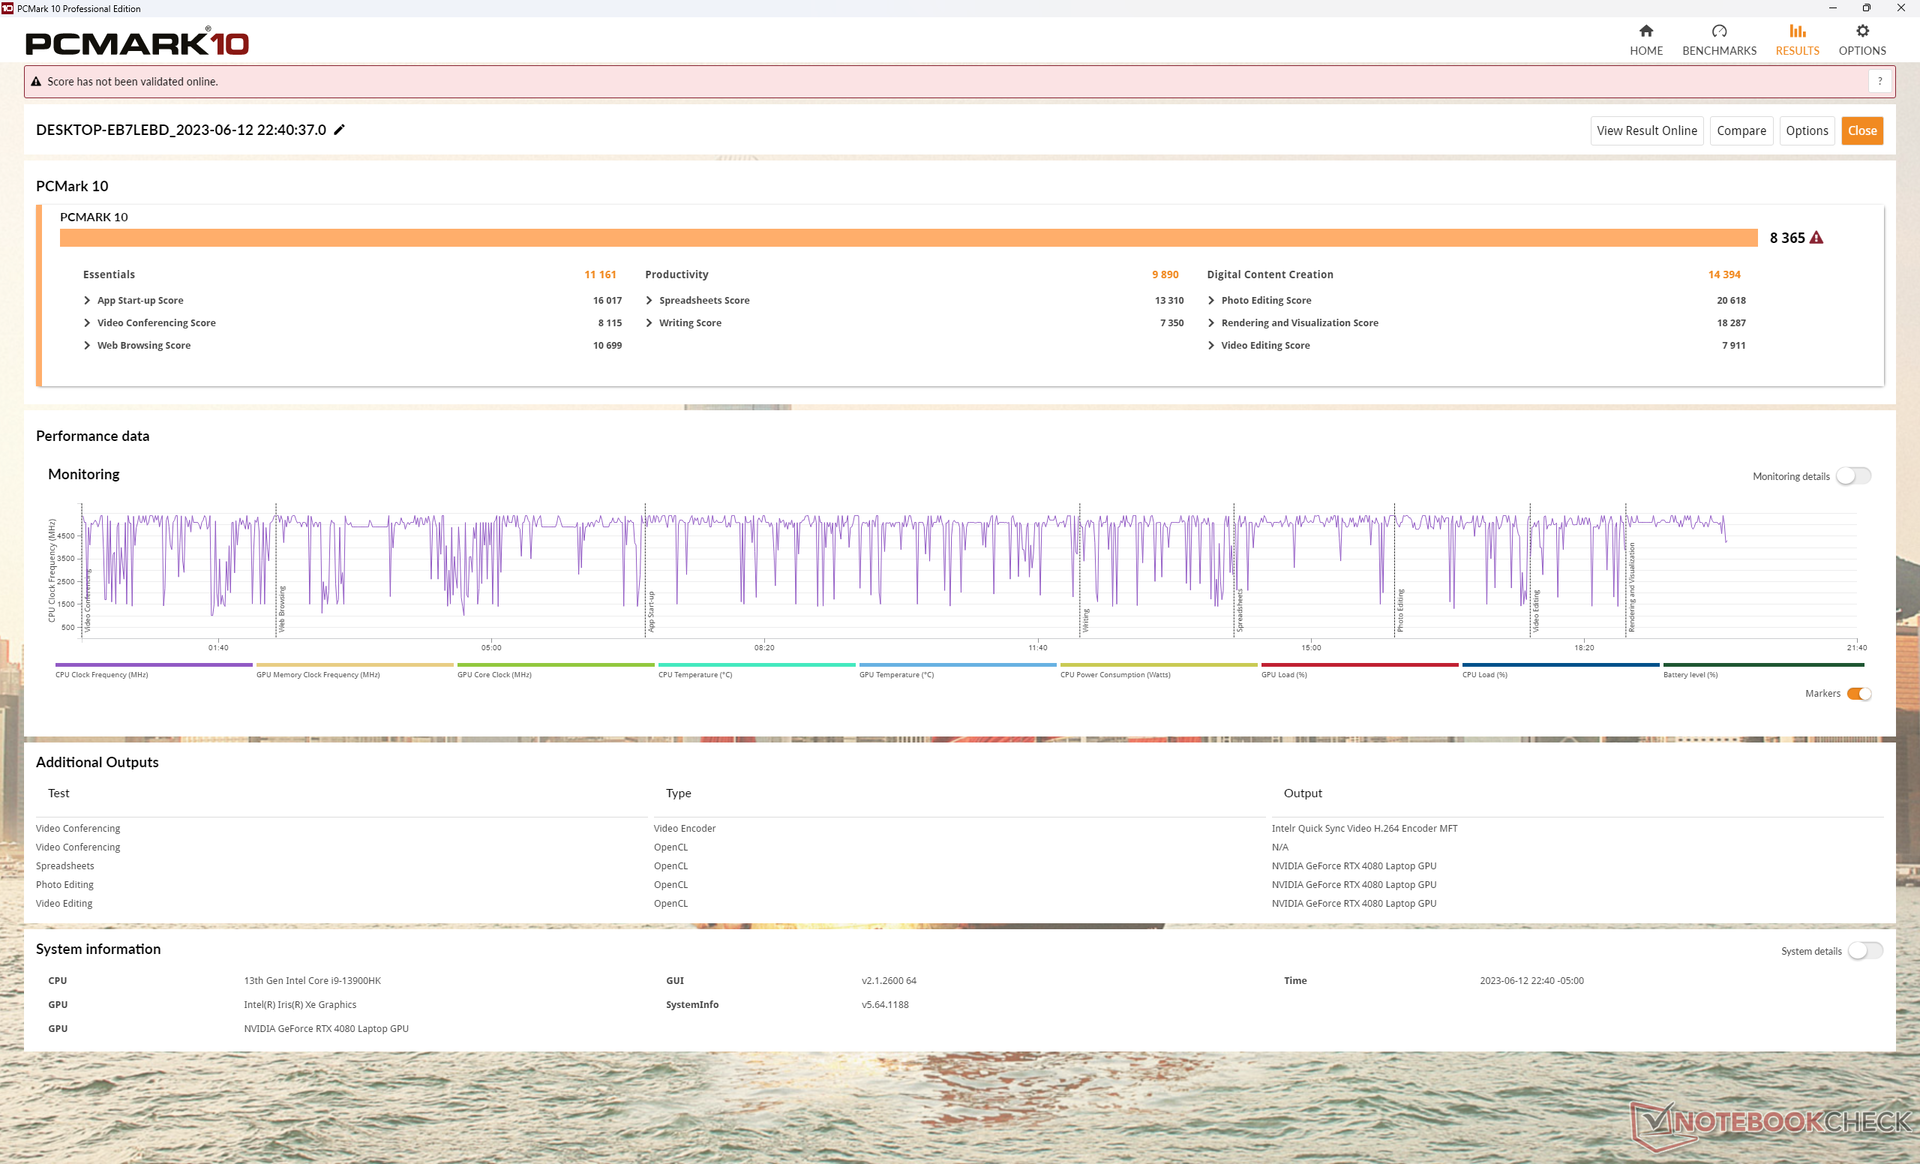
Desempenho do sistema
CrossMark: Overall | Productivity | Creativity | Responsiveness
| PCMark 10 / Score | |
| Alienware x16 R1 | |
| Média Intel Core i9-13900HK, NVIDIA GeForce RTX 4080 Laptop GPU (n=1) | |
| Asus ROG Zephyrus M16 GU604VY-NM042X | |
| Lenovo Legion Pro 7 RTX4090 | |
| Razer Blade 16 Early 2023 | |
| Alienware m17 R5 (R9 6900HX, RX 6850M XT) | |
| Dell G16 7620 | |
| PCMark 10 / Essentials | |
| Asus ROG Zephyrus M16 GU604VY-NM042X | |
| Alienware x16 R1 | |
| Média Intel Core i9-13900HK, NVIDIA GeForce RTX 4080 Laptop GPU (n=1) | |
| Lenovo Legion Pro 7 RTX4090 | |
| Razer Blade 16 Early 2023 | |
| Dell G16 7620 | |
| Alienware m17 R5 (R9 6900HX, RX 6850M XT) | |
| PCMark 10 / Productivity | |
| Asus ROG Zephyrus M16 GU604VY-NM042X | |
| Alienware x16 R1 | |
| Média Intel Core i9-13900HK, NVIDIA GeForce RTX 4080 Laptop GPU (n=1) | |
| Alienware m17 R5 (R9 6900HX, RX 6850M XT) | |
| Lenovo Legion Pro 7 RTX4090 | |
| Dell G16 7620 | |
| Razer Blade 16 Early 2023 | |
| PCMark 10 / Digital Content Creation | |
| Lenovo Legion Pro 7 RTX4090 | |
| Razer Blade 16 Early 2023 | |
| Alienware x16 R1 | |
| Média Intel Core i9-13900HK, NVIDIA GeForce RTX 4080 Laptop GPU (n=1) | |
| Asus ROG Zephyrus M16 GU604VY-NM042X | |
| Alienware m17 R5 (R9 6900HX, RX 6850M XT) | |
| Dell G16 7620 | |
| CrossMark / Overall | |
| Asus ROG Zephyrus M16 GU604VY-NM042X | |
| Alienware x16 R1 | |
| Média Intel Core i9-13900HK, NVIDIA GeForce RTX 4080 Laptop GPU (n=1) | |
| Dell G16 7620 | |
| Alienware m17 R5 (R9 6900HX, RX 6850M XT) | |
| Razer Blade 16 Early 2023 | |
| CrossMark / Productivity | |
| Asus ROG Zephyrus M16 GU604VY-NM042X | |
| Alienware x16 R1 | |
| Média Intel Core i9-13900HK, NVIDIA GeForce RTX 4080 Laptop GPU (n=1) | |
| Dell G16 7620 | |
| Alienware m17 R5 (R9 6900HX, RX 6850M XT) | |
| Razer Blade 16 Early 2023 | |
| CrossMark / Creativity | |
| Asus ROG Zephyrus M16 GU604VY-NM042X | |
| Alienware x16 R1 | |
| Média Intel Core i9-13900HK, NVIDIA GeForce RTX 4080 Laptop GPU (n=1) | |
| Dell G16 7620 | |
| Razer Blade 16 Early 2023 | |
| Alienware m17 R5 (R9 6900HX, RX 6850M XT) | |
| CrossMark / Responsiveness | |
| Alienware x16 R1 | |
| Média Intel Core i9-13900HK, NVIDIA GeForce RTX 4080 Laptop GPU (n=1) | |
| Asus ROG Zephyrus M16 GU604VY-NM042X | |
| Dell G16 7620 | |
| Razer Blade 16 Early 2023 | |
| Alienware m17 R5 (R9 6900HX, RX 6850M XT) | |
| PCMark 10 Score | 8365 pontos | |
Ajuda | ||
* ... menor é melhor
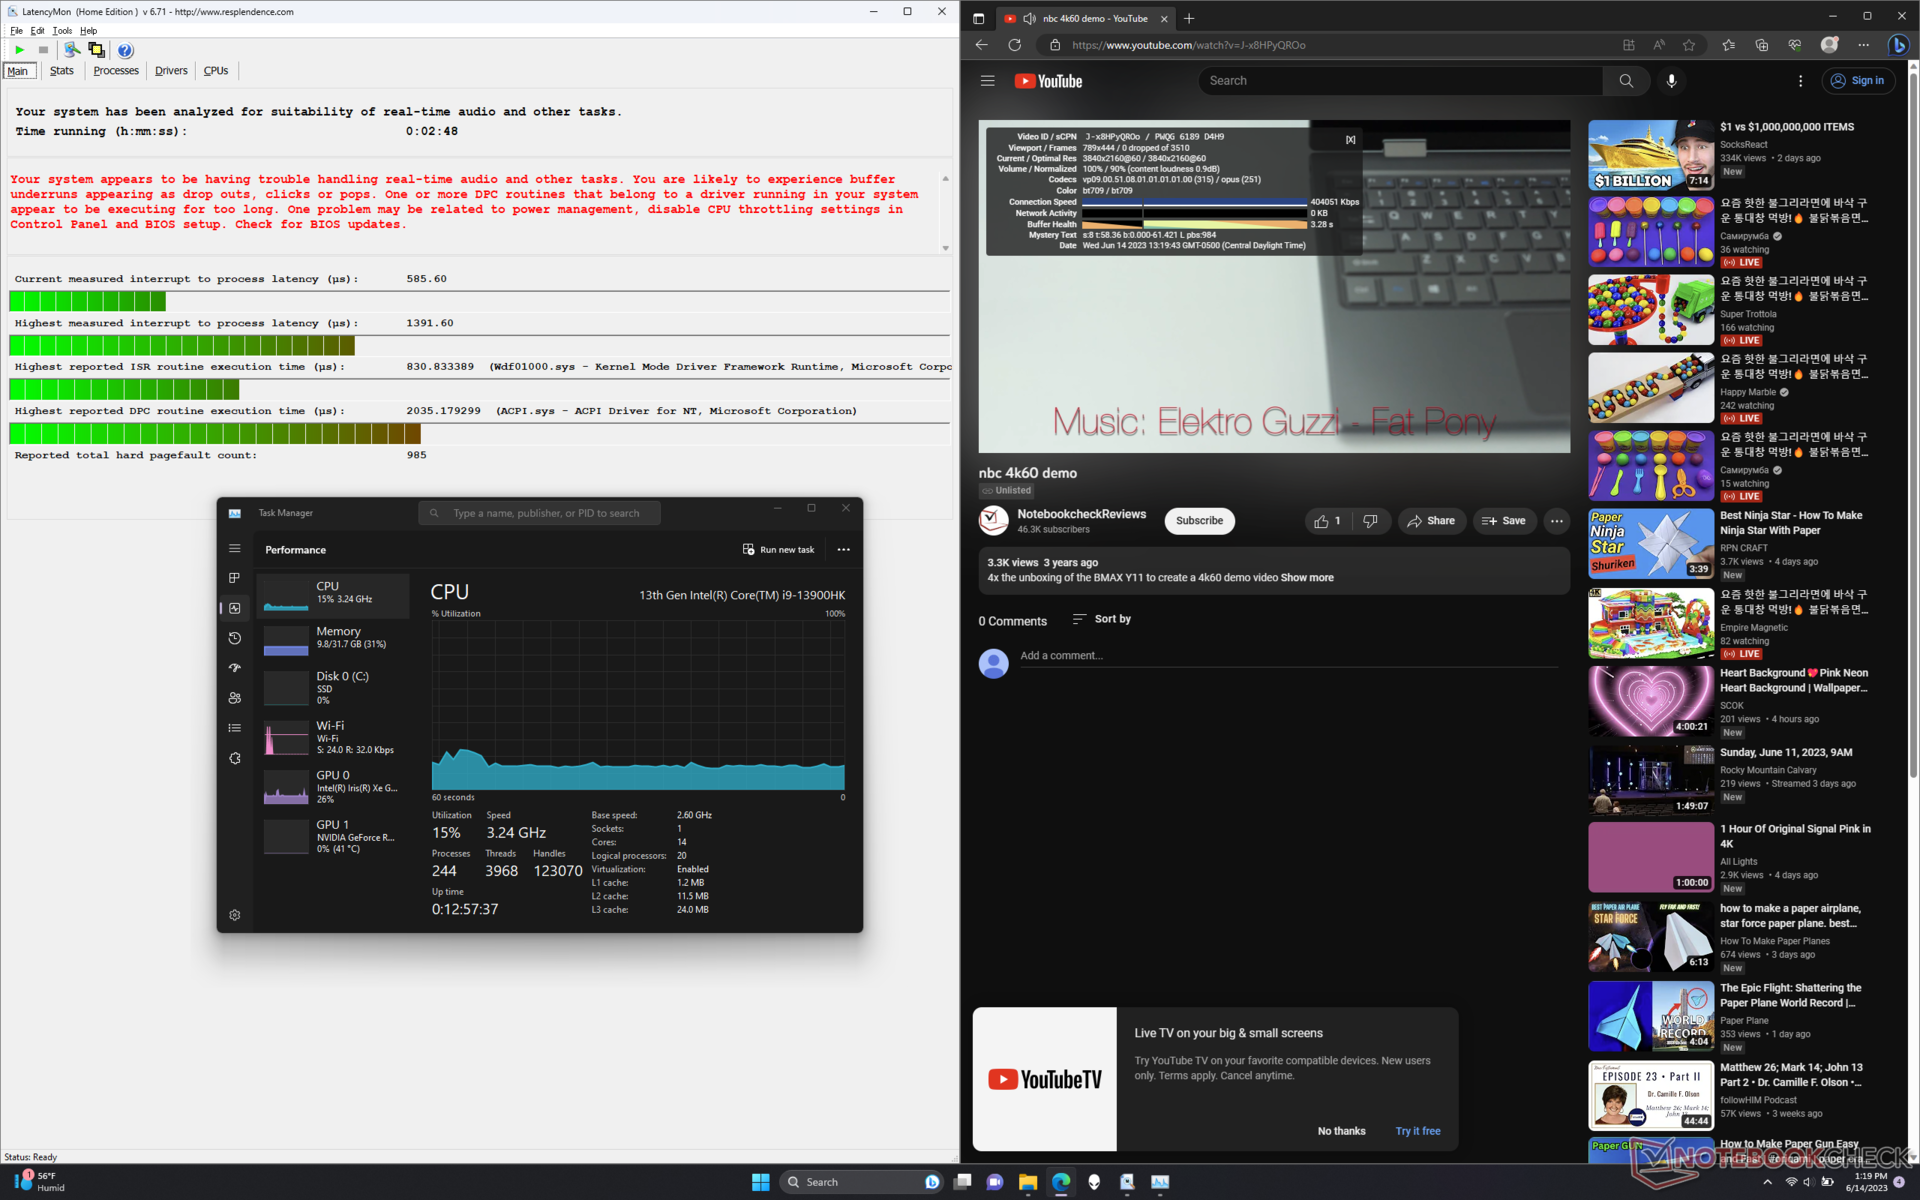
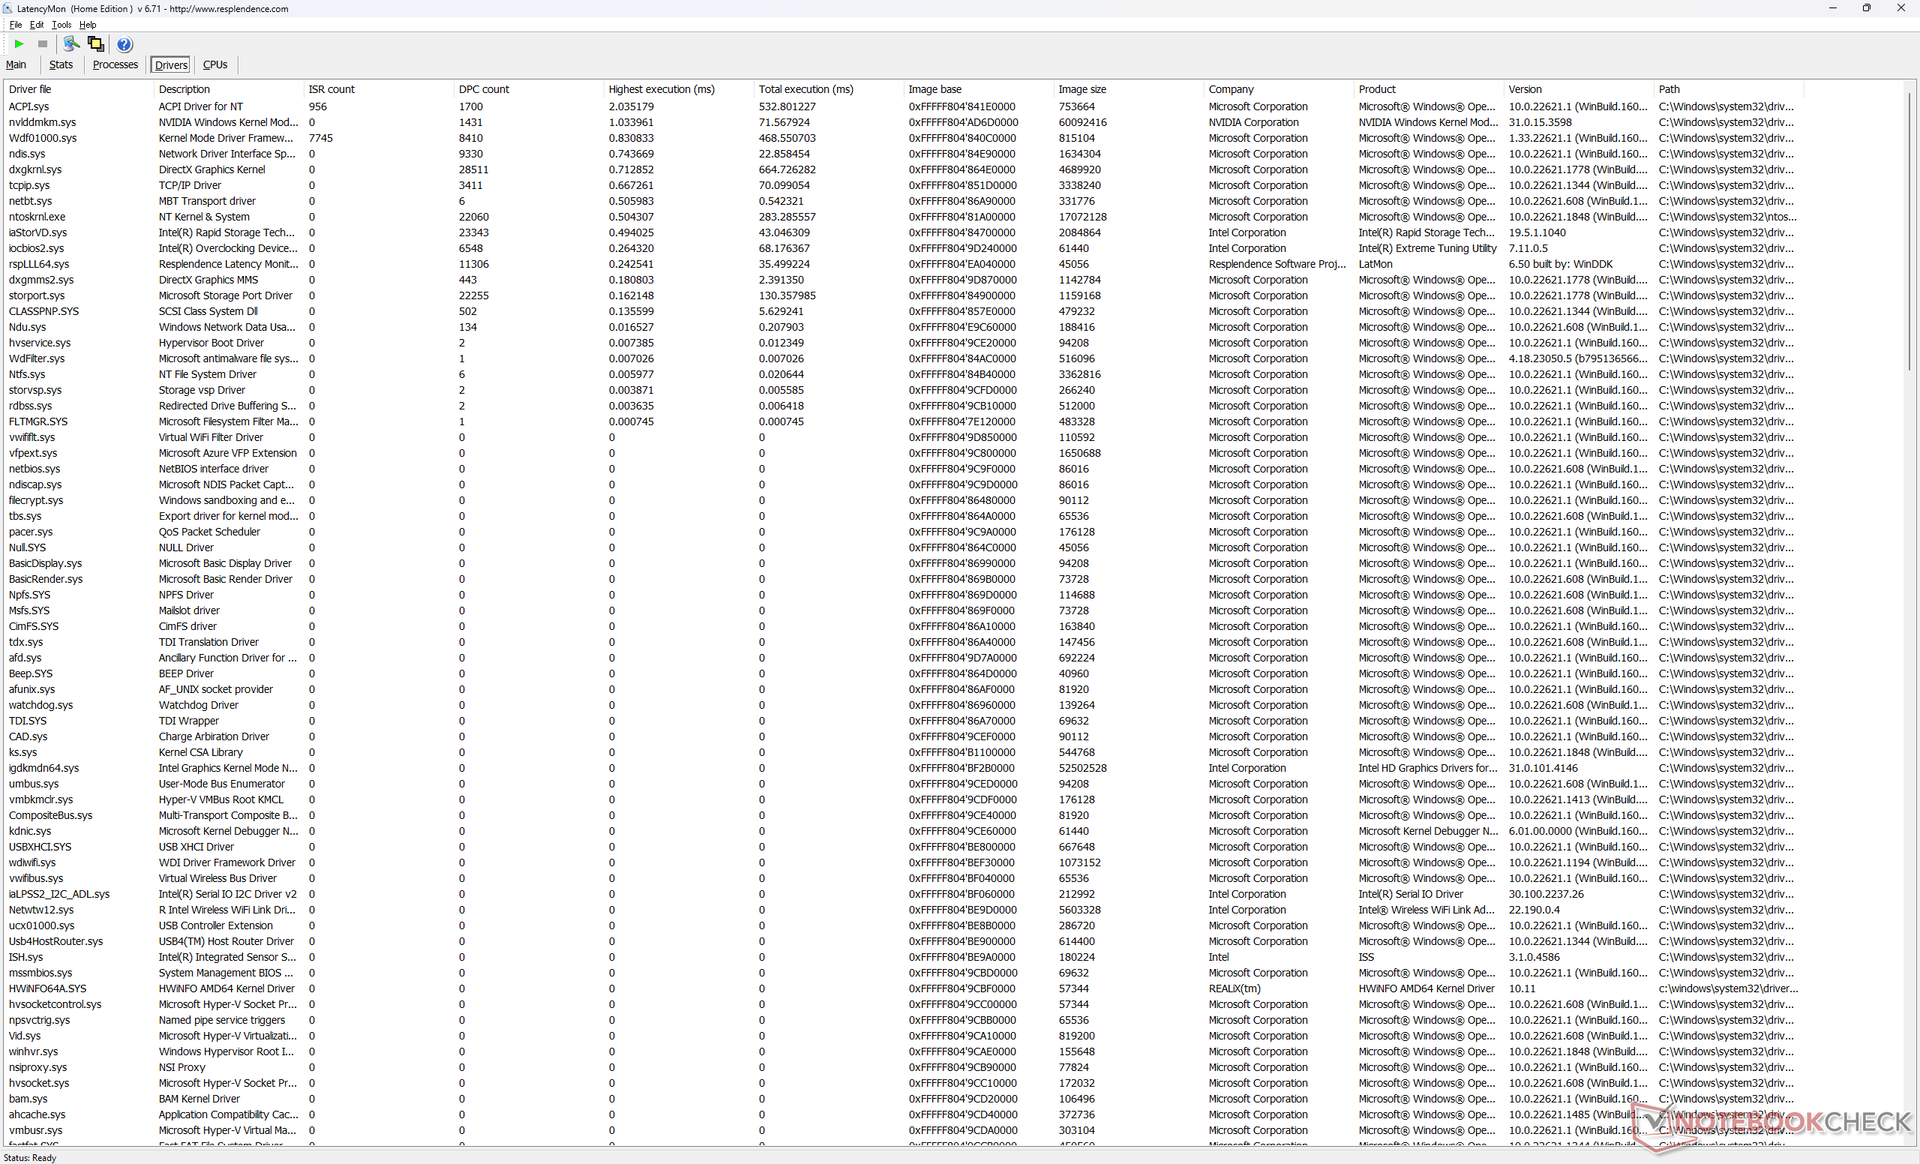
Latência DPC
O LatencyMon revela problemas de DPC ao abrir várias guias do navegador em nossa página inicial. a reprodução de vídeo 4K a 60 FPS é perfeita, sem perda de quadros.
| DPC Latencies / LatencyMon - interrupt to process latency (max), Web, Youtube, Prime95 | |
| Lenovo Legion Pro 7 RTX4090 | |
| Asus ROG Zephyrus M16 GU604VY-NM042X | |
| Razer Blade 16 Early 2023 | |
| Alienware x16 R1 | |
| Alienware m17 R5 (R9 6900HX, RX 6850M XT) | |
| Dell G16 7620 | |
* ... menor é melhor
Dispositivos de armazenamento
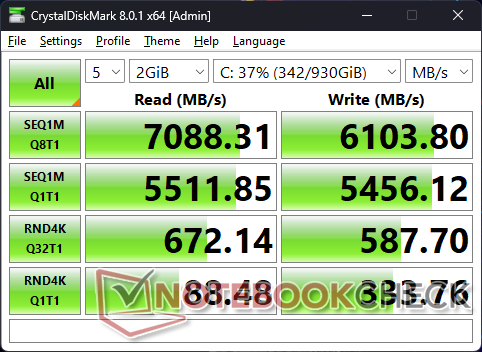
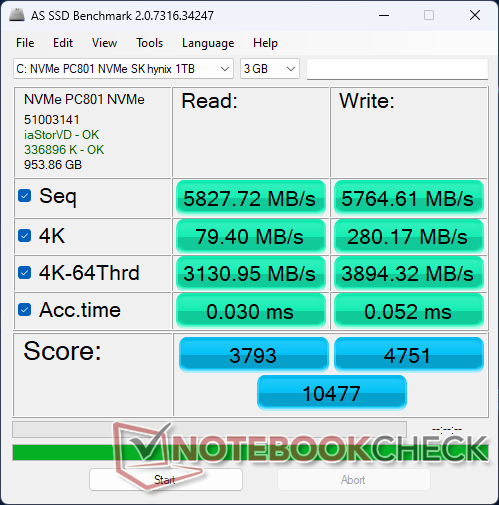
O PCIe4 x4 SK Hynix PC801 em nossa unidade pode atingir taxas de leitura de até 7100 MB/s para ser comparável ao popular Samsung PM9A1. Infelizmente, a unidade tem problemas para manter sua taxa de transferência máxima por períodos prolongados, provavelmente devido ao resfriamento insuficiente. Ao executar o DiskSpd em um loop, por exemplo, as taxas de leitura caíam para até 3.400 MB/s depois de apenas alguns minutos de teste de estresse, conforme mostrado no gráfico abaixo. Os resultados não melhoravam após a repetição do teste.

| Drive Performance rating - Percent | |
| Alienware x16 R1 | |
| Lenovo Legion Pro 7 RTX4090 | |
| Dell G16 7620 | |
| Asus ROG Zephyrus M16 GU604VY-NM042X | |
| Razer Blade 16 Early 2023 | |
| Alienware m17 R5 (R9 6900HX, RX 6850M XT) | |
* ... menor é melhor
Disk Throttling: DiskSpd Read Loop, Queue Depth 8
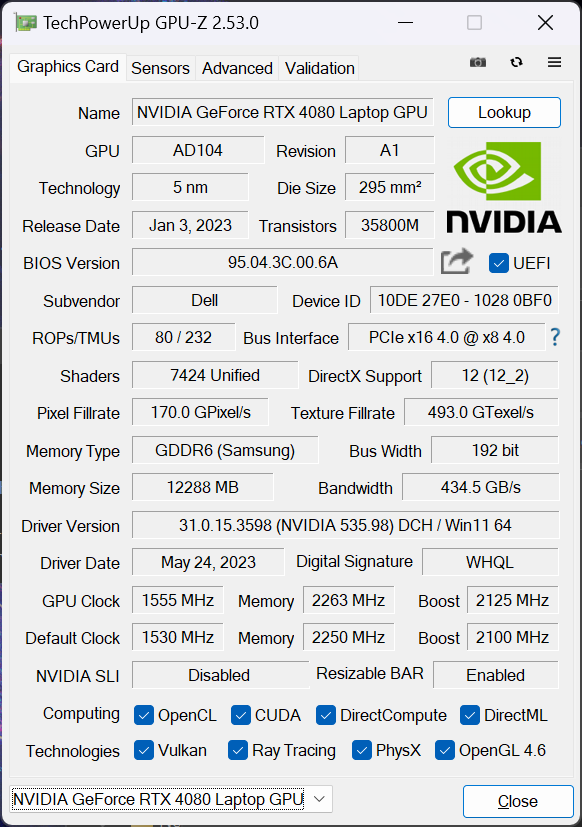
Desempenho da GPU - 175 W GeForce RTX 4080
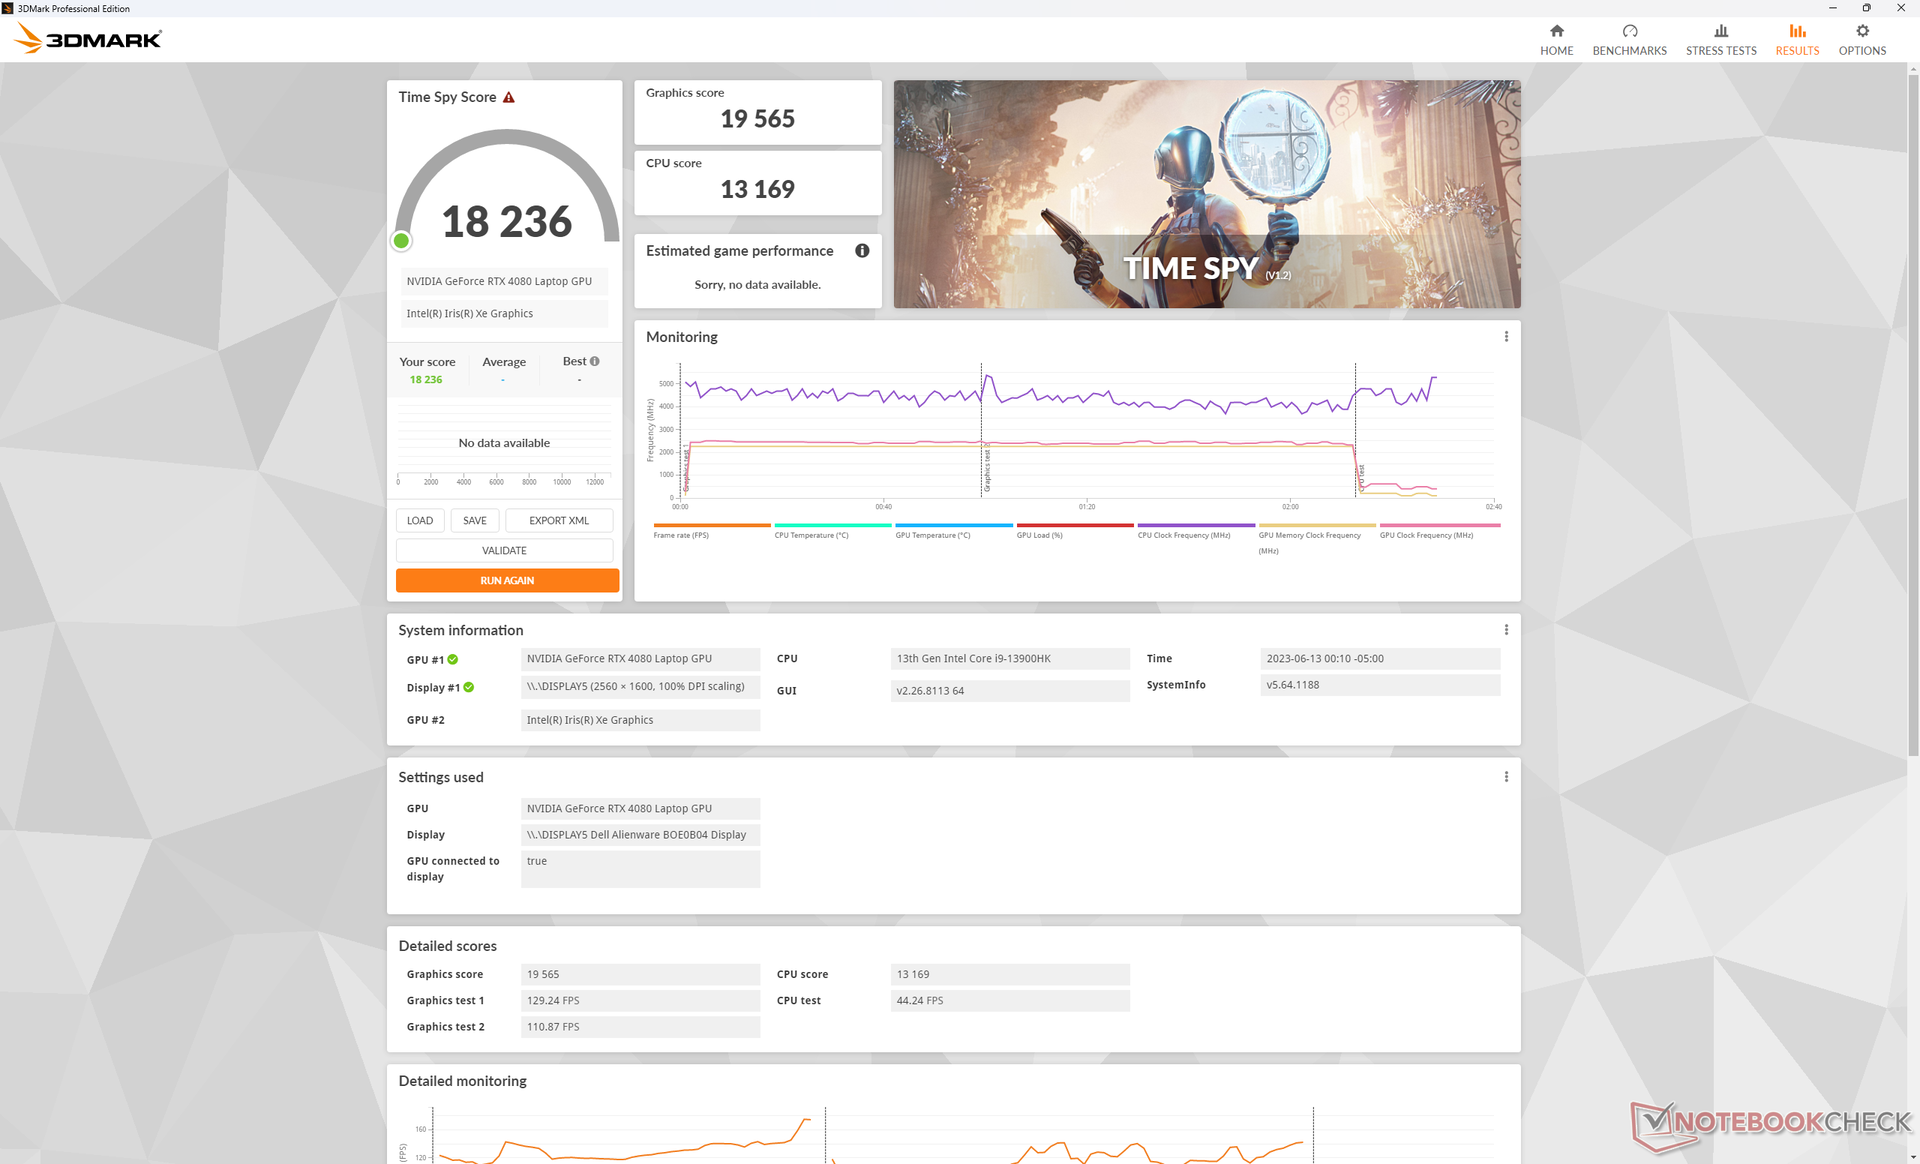
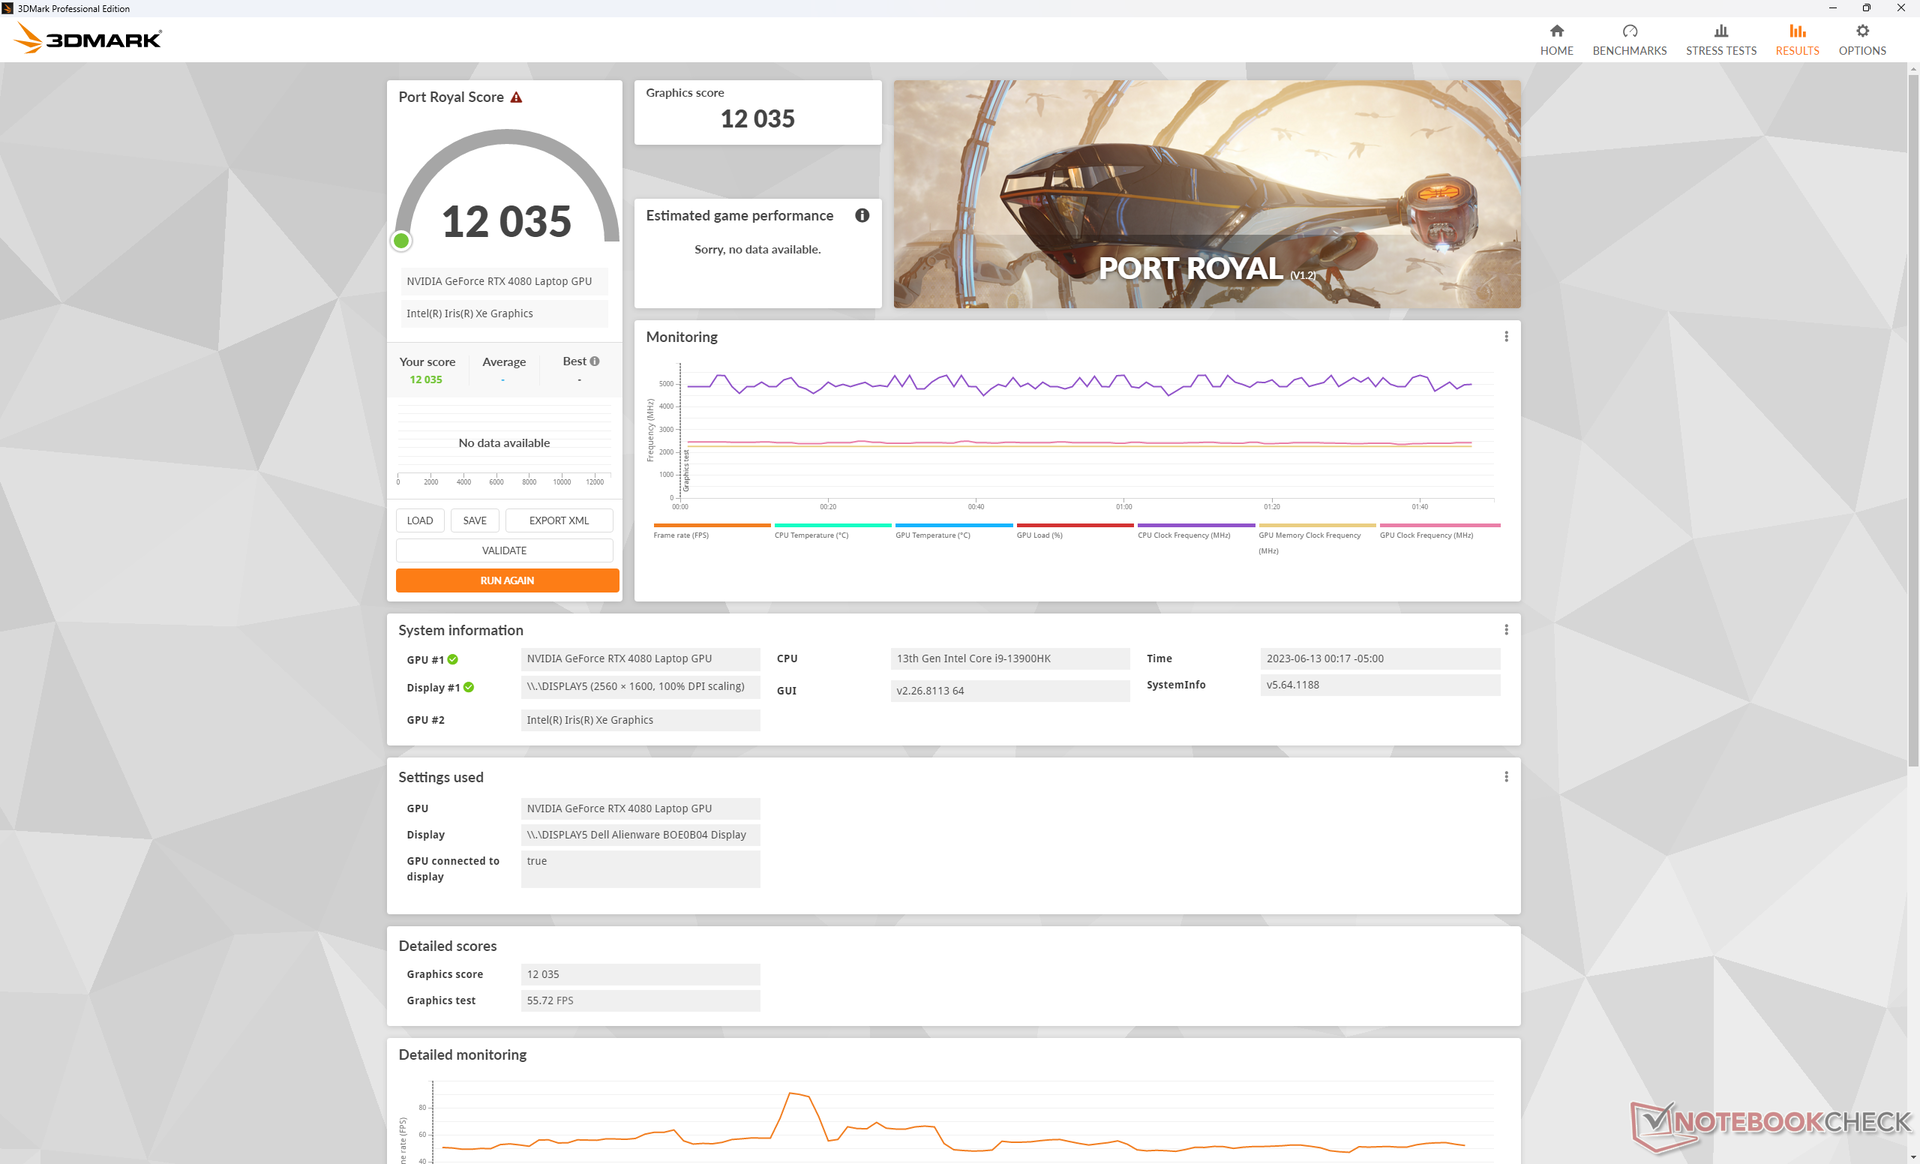
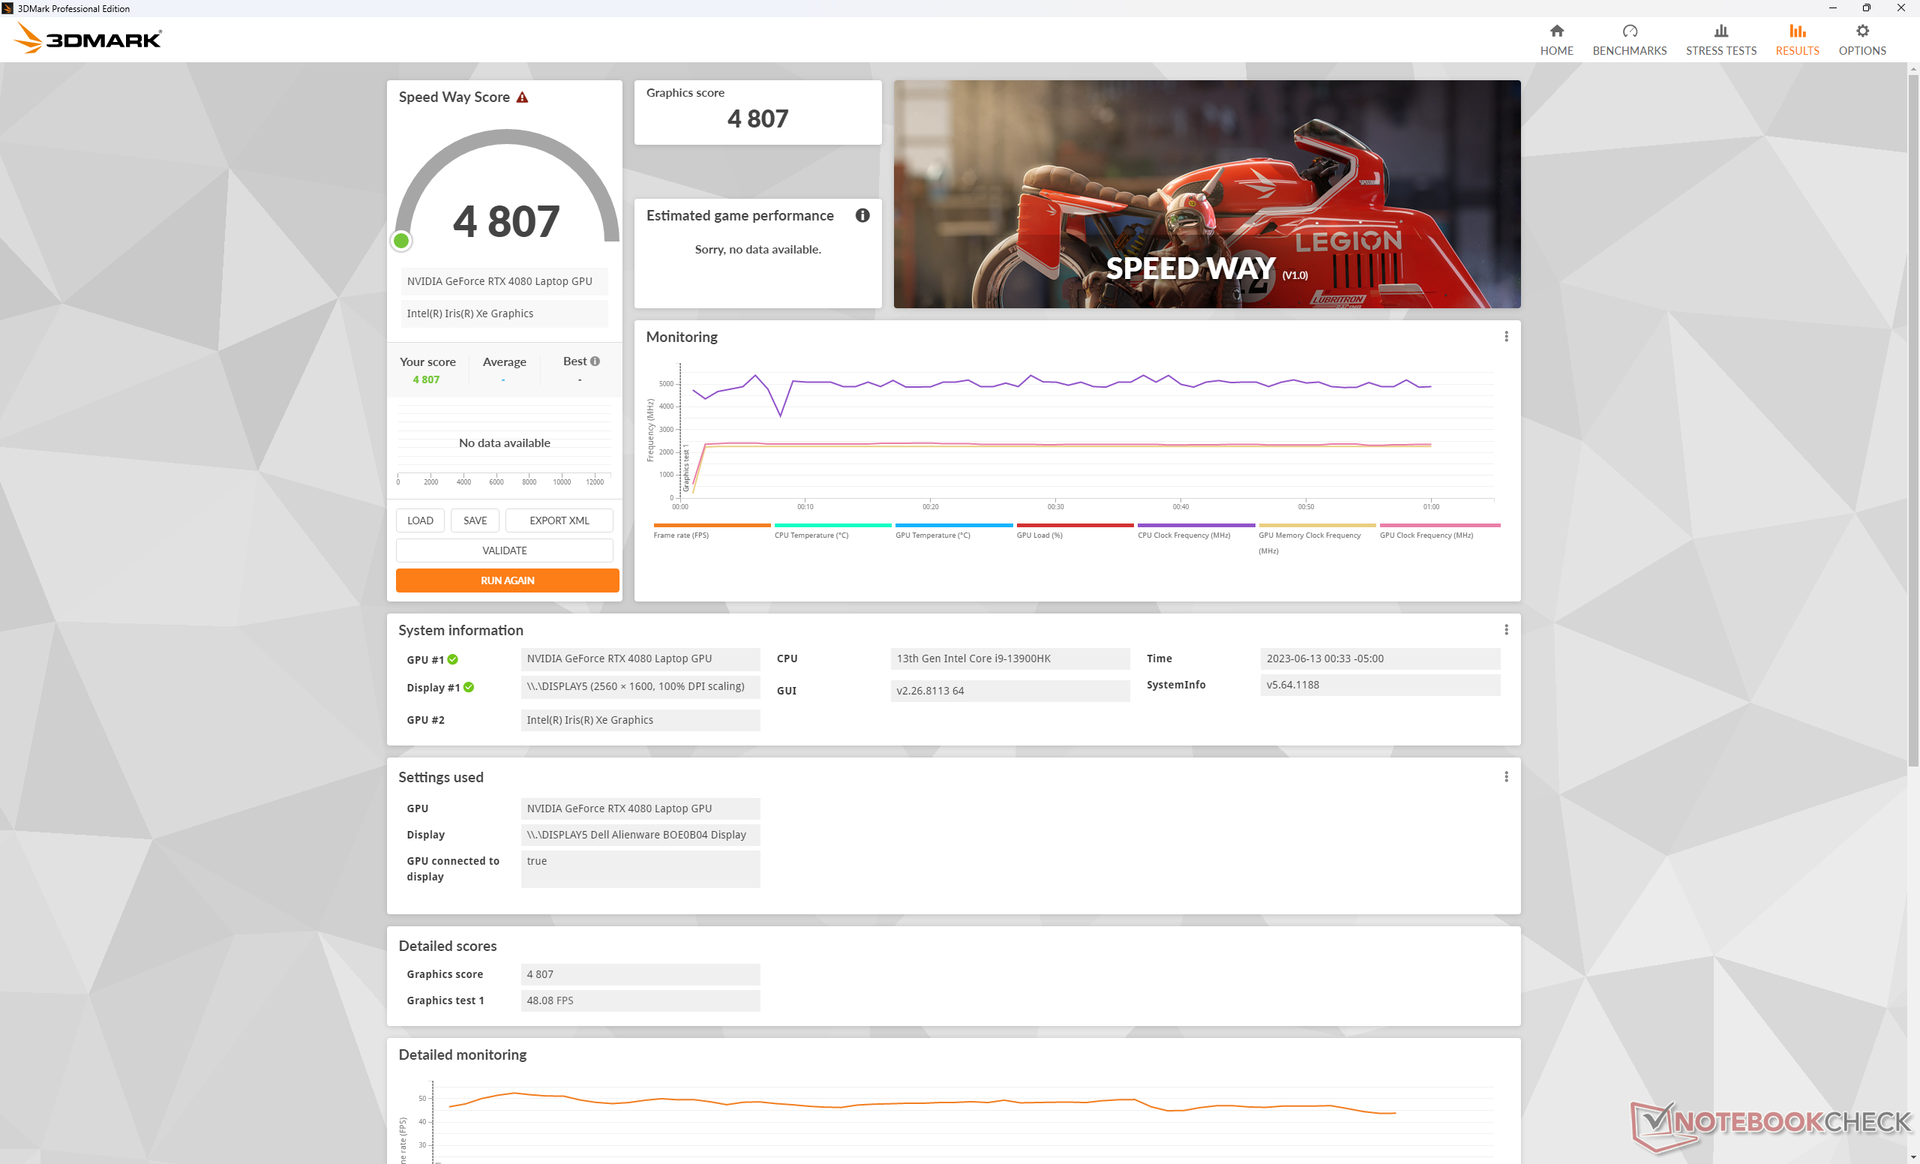
A GeForce RTX 4080 em nosso Alienware x16 é cerca de 5 a 10% mais rápida do que a média dos notebooks em nosso banco de dados equipados com a mesma GPU RTX 4080. A vantagem pode não parecer muito grande, mas é suficiente para impulsionar o sistema a ser um dos laptops para jogos RTX 4080 mais rápidos que você pode comprar. os resultados do 3DMark estão a apenas 10 por cento da RTX 4090 no notebookasus Zephyrus Duo 16por exemplo.
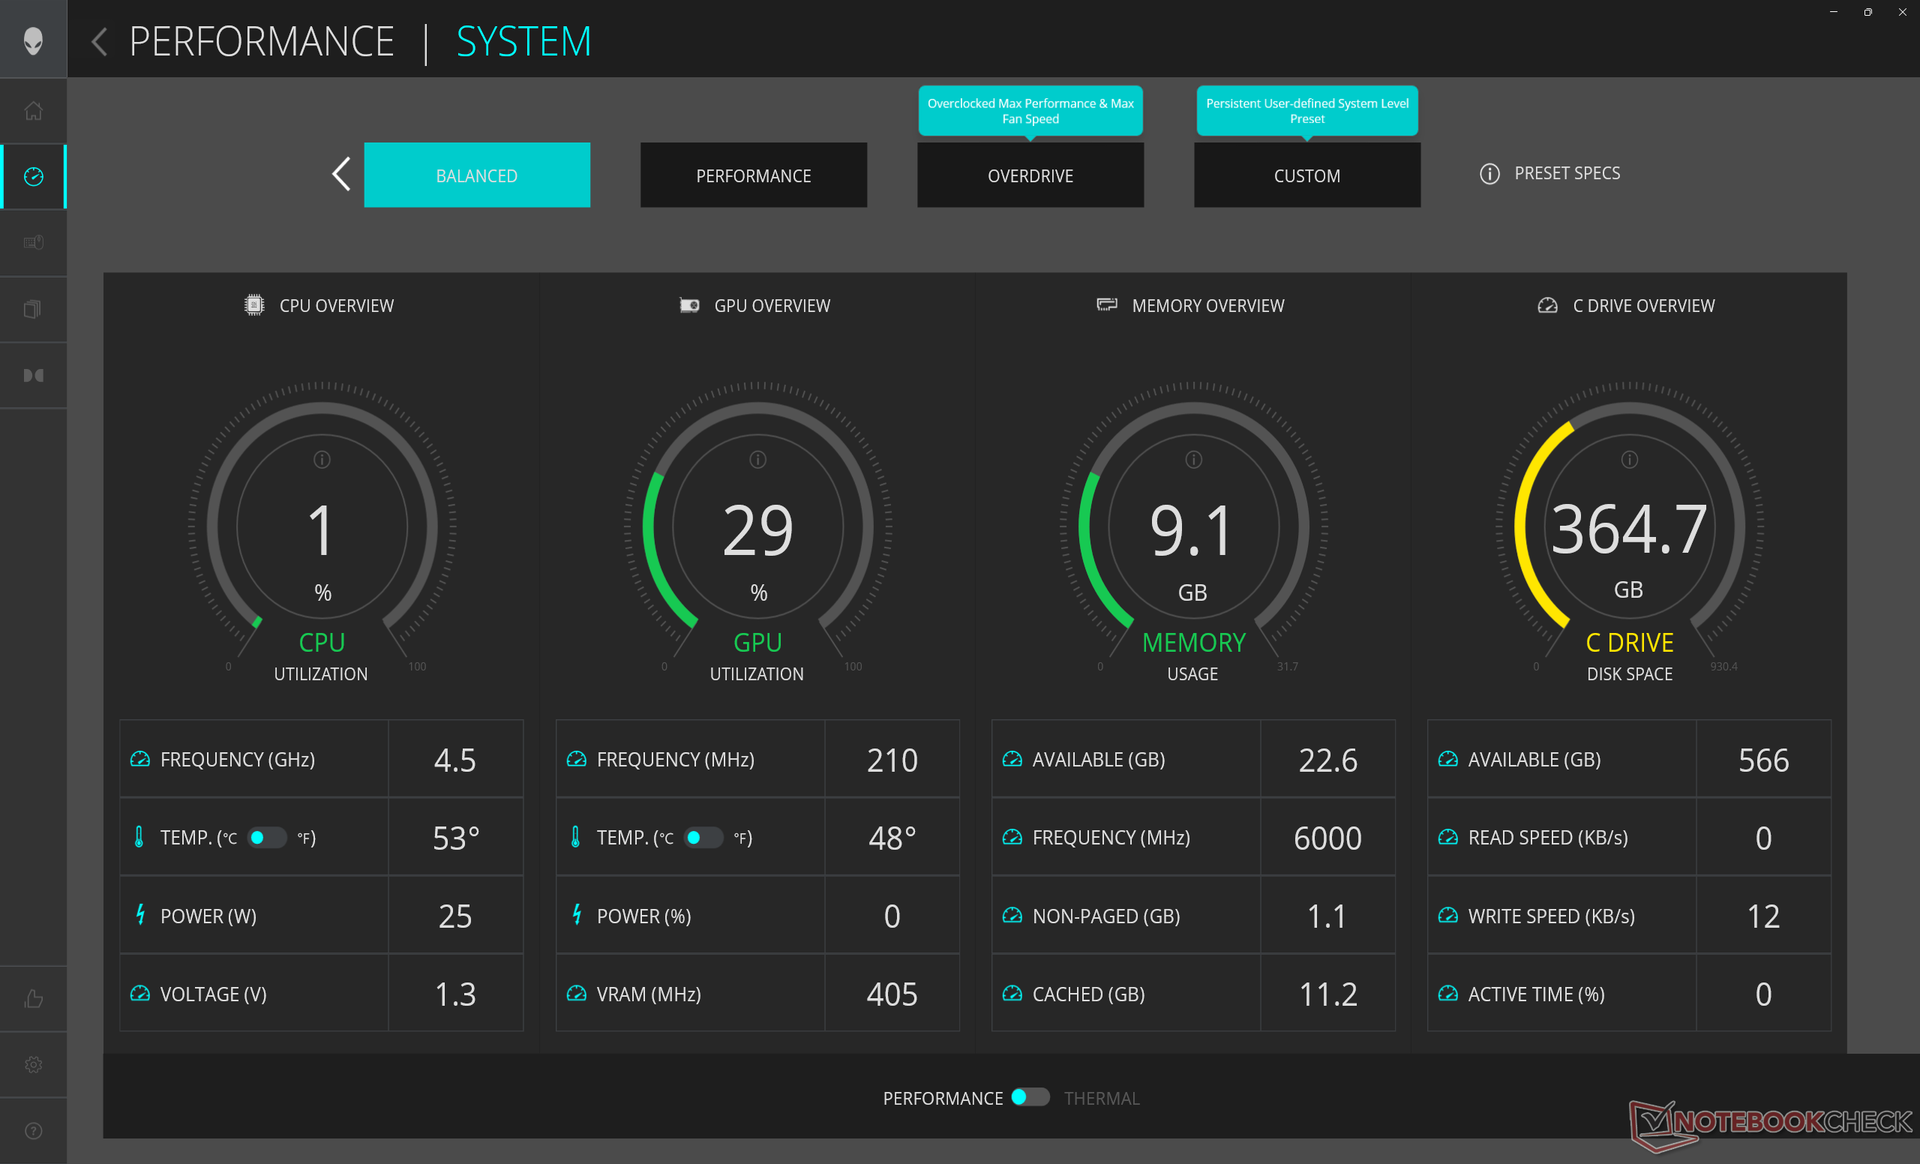
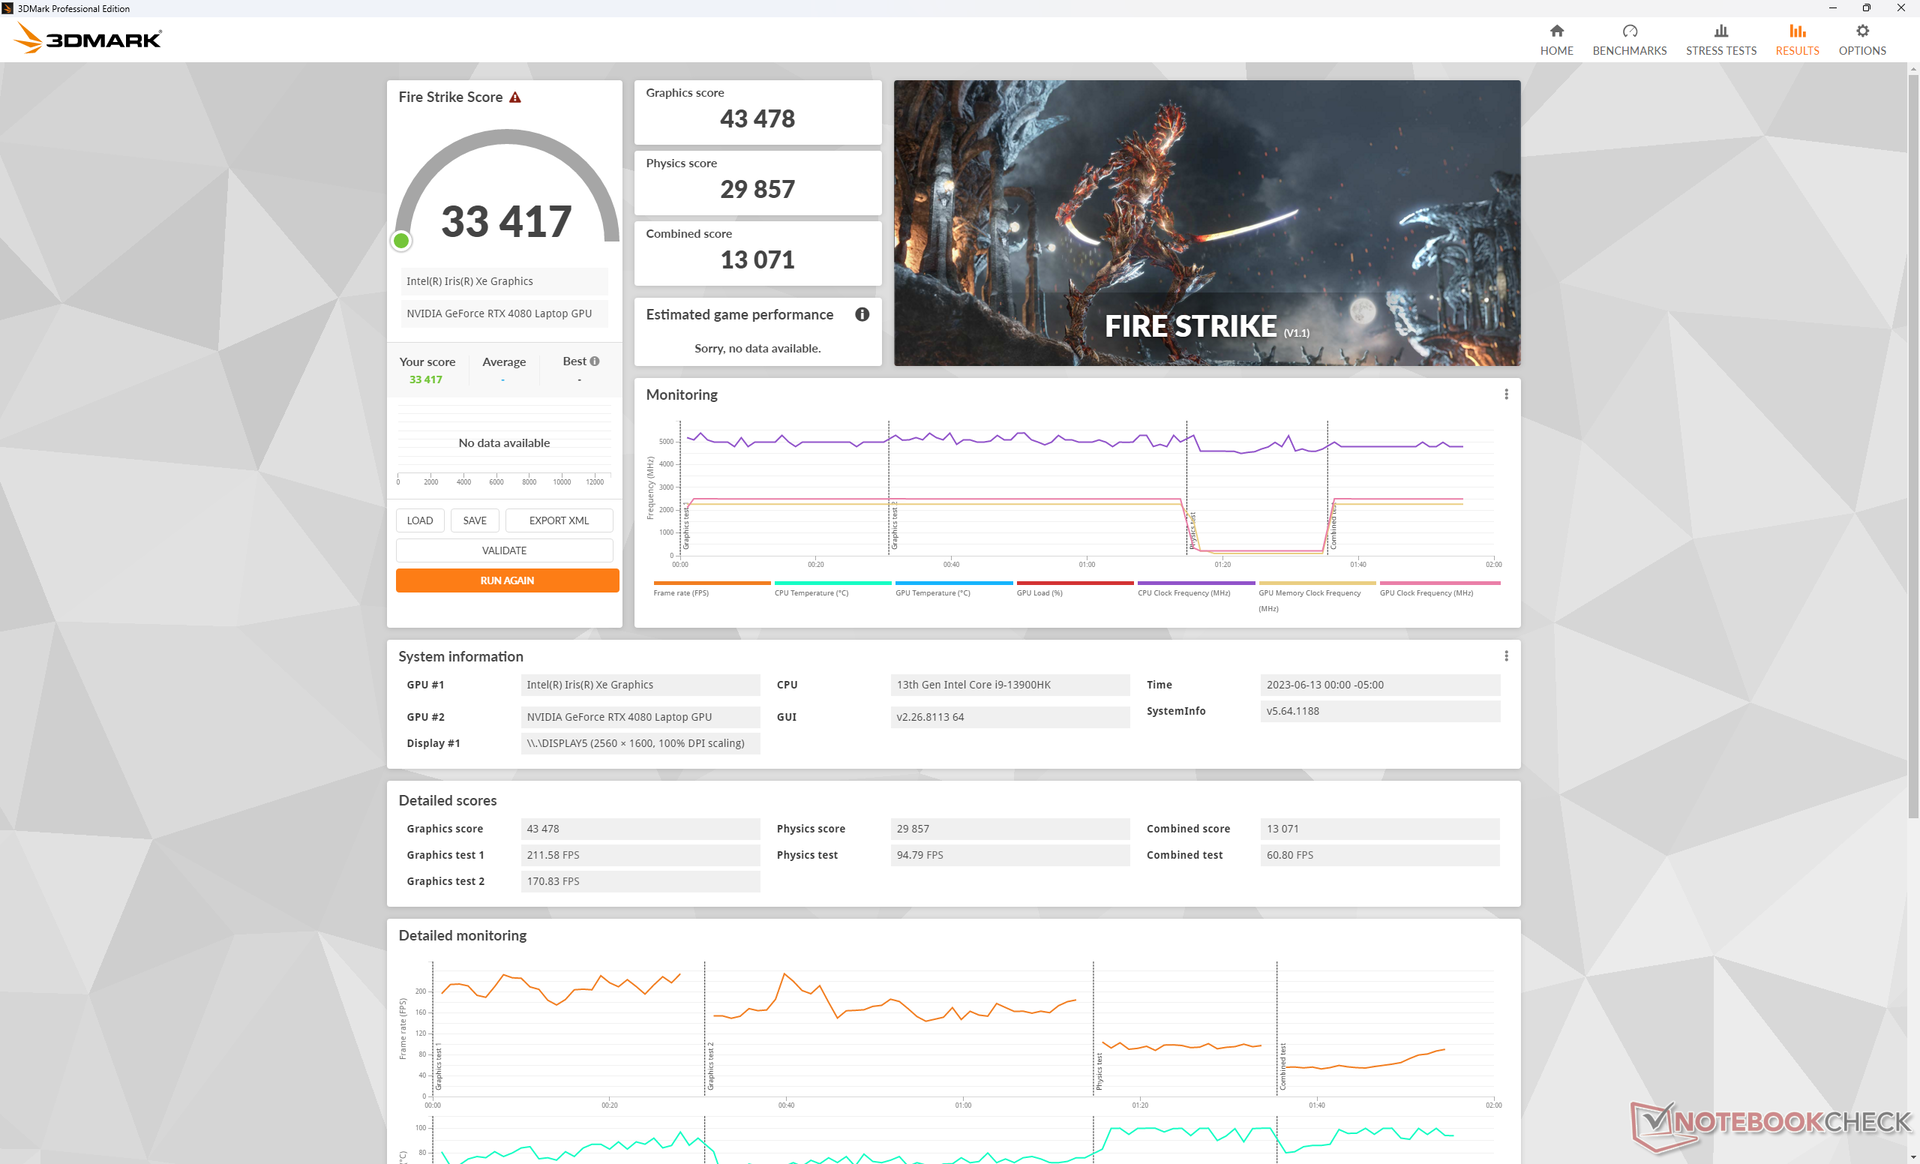
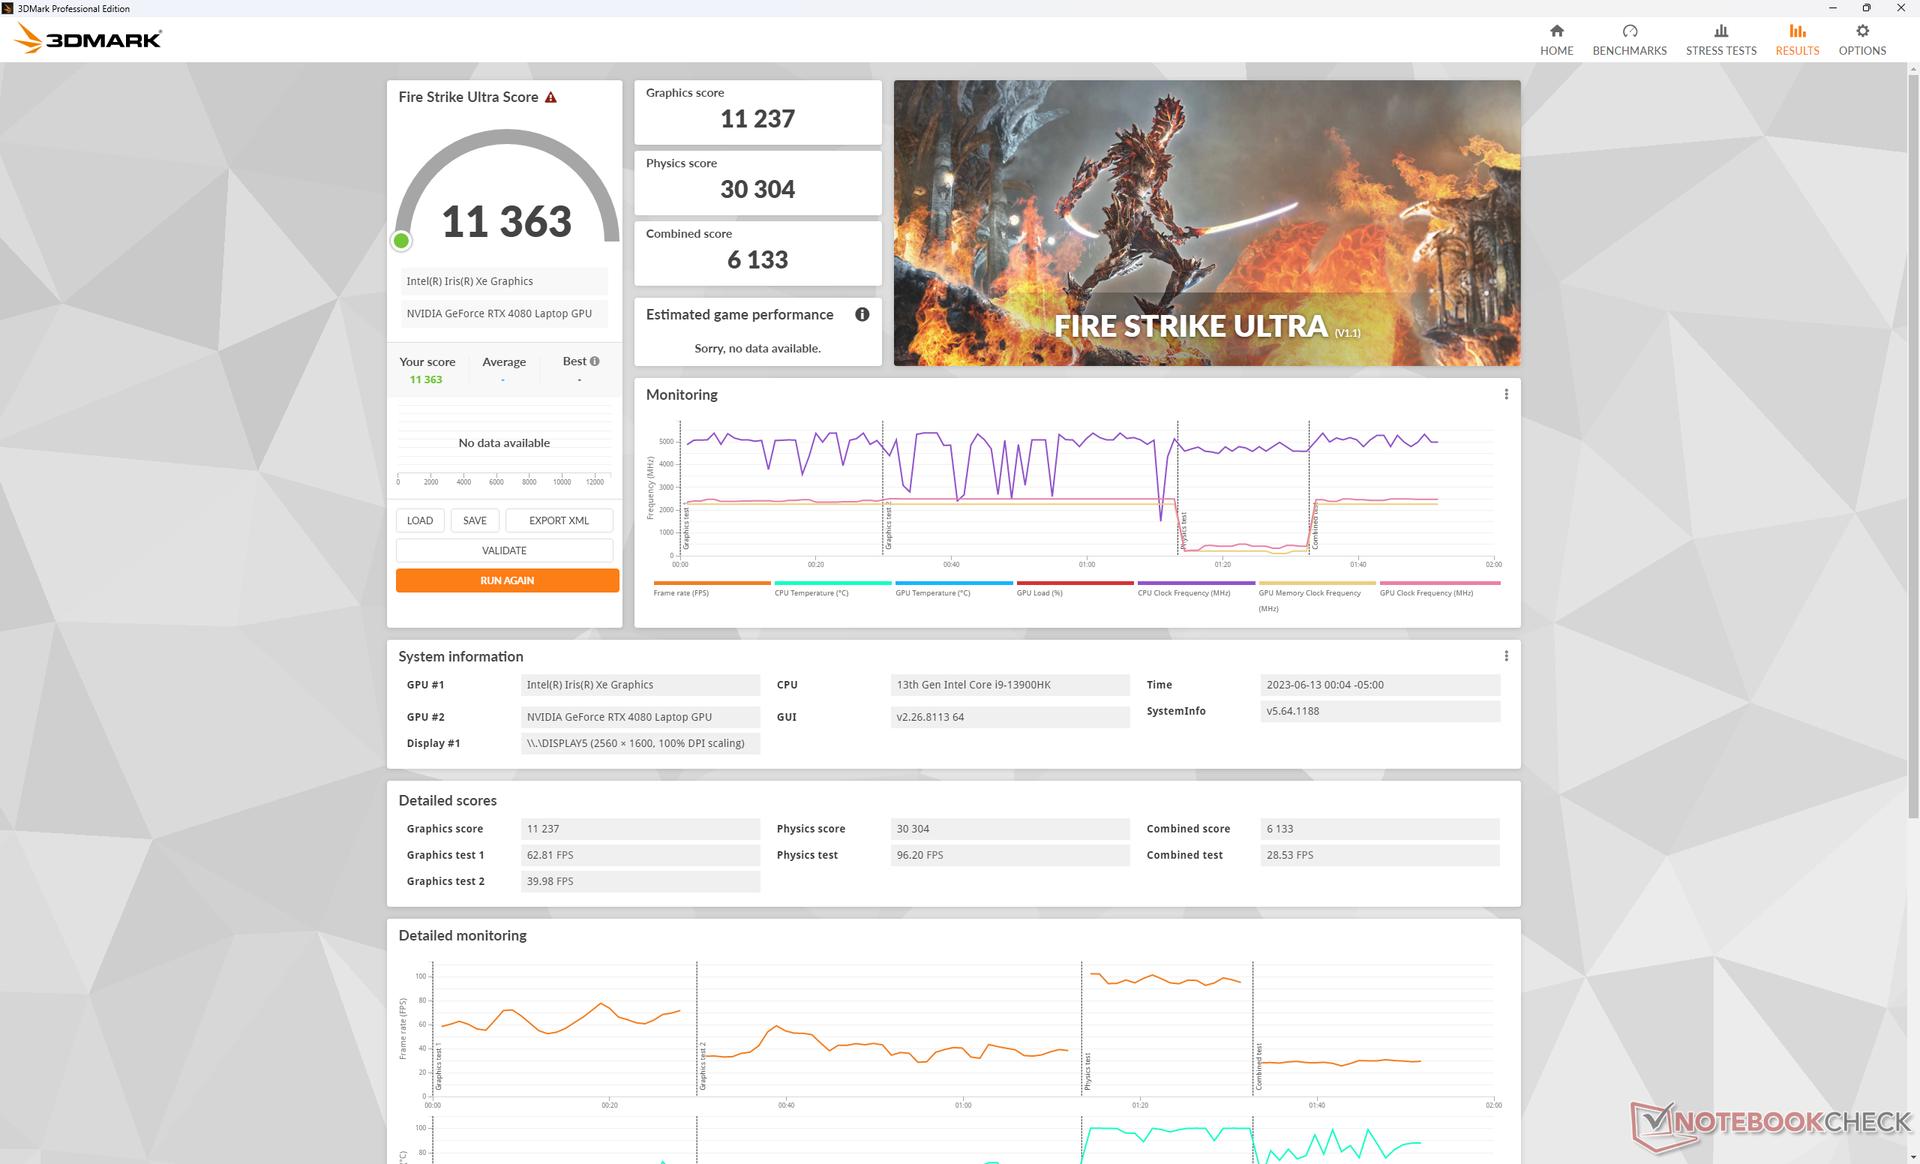
É interessante notar que as pontuações do 3DMark caíram apenas alguns pontos percentuais ao serem executadas nos modos Performance e Balanced, mais silenciosos, em vez de no modo Overdrive, mais alto, como mostra a tabela abaixo. É importante ter isso em mente nas seções Teste de estresse e Ruído do sistema a seguir.
Fazendo downgrade para a RTX 4070 deverá afetar o desempenho em até 30 a 35%, enquanto o upgrade para o RTX 4090 deverá aumentar o desempenho em cerca de 10%.
| Configuração do perfil de energia | Fire Strike Pontuação de física | Fire Strike Pontuação da GPU | Fire Strike Pontuação combinada |
| Overdrive | 29857 | 43478 | 13071 |
| Desempenho | 27890 (-7%) | 43605 (-0%) | 12961 (-1%) |
| Equilibrado | 28704 (-4%) | 41909 (-4%) | 12476 (-5%) |
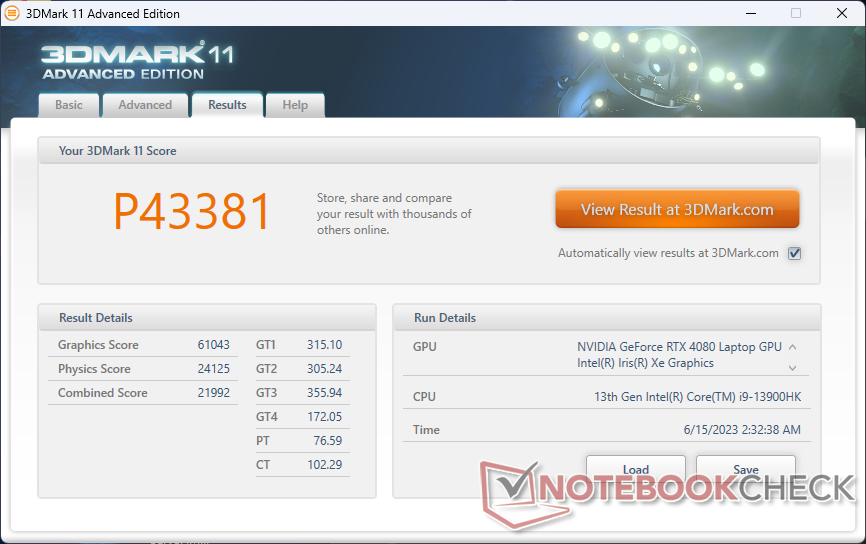
| 3DMark 11 Performance | 43381 pontos | |
| 3DMark Fire Strike Score | 33417 pontos | |
| 3DMark Time Spy Score | 18236 pontos | |
Ajuda | ||
* ... menor é melhor
Desempenho em jogos
Todos os jogos podem ser jogados na resolução QHD+ nativa com taxas de quadros estáveis de 60 FPS ou mais. Até mesmo jogos em 4K são possíveis em um monitor externo com a maioria das configurações no máximo, incluindo Returnal e F122. Para obter taxas de quadros de três dígitos, no entanto, você deverá ativar o DLSS 2 ou DLSS 3, quando disponível, para explorar melhor a alta taxa de atualização do monitor.
Witcher 3 FPS Chart
| baixo | média | alto | ultra | QHD | 4K | |
|---|---|---|---|---|---|---|
| GTA V (2015) | 185.8 | 180.4 | 176.4 | 120.3 | 115.4 | 142.9 |
| The Witcher 3 (2015) | 425.6 | 352.7 | 306.5 | 160.2 | 115 | |
| Dota 2 Reborn (2015) | 178.8 | 164 | 159.7 | 146.8 | 129.4 | |
| Final Fantasy XV Benchmark (2018) | 211 | 195.5 | 164.2 | 132.4 | 76.2 | |
| X-Plane 11.11 (2018) | 145.3 | 134.5 | 104.2 | 90.5 | ||
| Strange Brigade (2018) | 469 | 373 | 350 | 325 | 237 | 120.5 |
| Shadow of the Tomb Raider (2018) | 165 | 143 | 84 | |||
| Far Cry 6 (2021) | 121 | 112 | 73 | |||
| Cyberpunk 2077 1.6 (2022) | 158 | 150.9 | 141.2 | 133.6 | 84.4 | 38.5 |
| Tiny Tina's Wonderlands (2022) | 256.6 | 217.3 | 183.3 | 156.4 | 111.1 | 58.6 |
| F1 22 (2022) | 265 | 259 | 244 | 110 | 79 | 39 |
| Call of Duty Modern Warfare 2 2022 (2022) | 139 | 110 | 67 | |||
| Returnal (2023) | 116 | 117 | 114 | 109 | 79 | 43 |
Emissões
Ruído do sistema - muitas opções de perfil de energia
O ruído do ventilador está diretamente ligado às configurações do perfil de energia do ACC. Se não estiver jogando, é recomendável que o ACC seja configurado no modo Balanced ou Quiet, pois os ventiladores tendem a pulsar com muito mais frequência quando estão no modo Performance ou no modo Overdrive.
Execução Witcher 3 no modo Performance e no modo Overdrive resultaria em um ruído de ventilador de 50 dB(A) e 55 dB(A), respectivamente. Como a perda de taxa de quadros é mínima entre os modos Performance e Overdrive, conforme mencionado na seção Desempenho da GPU acima, você pode ter uma experiência de jogo visivelmente mais silenciosa quando definido para o modo Performance. O ruído do ventilador seria ainda mais silencioso no modo Balanced sem afetar significativamente as taxas de quadros. mais de 50 dB(A) ainda é muito alto, é claro, mas essa é uma faixa comum em modelos concorrentes, como o Lenovo Legion Pro 7 ou o Razer Blade 16.
Barulho
| Ocioso |
| 23.1 / 25.8 / 25.8 dB |
| Carga |
| 39.3 / 54.8 dB |
 | ||
30 dB silencioso 40 dB(A) audível 50 dB(A) ruidosamente alto |
||
min: | ||
| Alienware x16 R1 GeForce RTX 4080 Laptop GPU, i9-13900HK, SK hynix PC801 HFS001TEJ9X101N | Lenovo Legion Pro 7 RTX4090 GeForce RTX 4090 Laptop GPU, i9-13900HX, Samsung PM9A1 MZVL21T0HCLR | Asus ROG Zephyrus M16 GU604VY-NM042X GeForce RTX 4090 Laptop GPU, i9-13900H, Samsung PM9A1 MZVL22T0HBLB | Razer Blade 16 Early 2023 GeForce RTX 4080 Laptop GPU, i9-13950HX, SSSTC CA6-8D1024 | Dell G16 7620 GeForce RTX 3060 Laptop GPU, i7-12700H, WDC PC SN810 512GB | Alienware m17 R5 (R9 6900HX, RX 6850M XT) Radeon RX 6850M XT, R9 6900HX, SSSTC CA6-8D1024 | |
|---|---|---|---|---|---|---|
| Noise | -17% | -10% | 3% | -2% | 2% | |
| desligado / ambiente * (dB) | 22.7 | 25 -10% | 24 -6% | 23 -1% | 23.2 -2% | 23 -1% |
| Idle Minimum * (dB) | 23.1 | 28 -21% | 24 -4% | 23 -0% | 28.3 -23% | 23 -0% |
| Idle Average * (dB) | 25.8 | 30 -16% | 29.96 -16% | 23 11% | 28.8 -12% | 28.11 -9% |
| Idle Maximum * (dB) | 25.8 | 38 -47% | 34.27 -33% | 23.6 9% | 28.9 -12% | 28.11 -9% |
| Load Average * (dB) | 39.3 | 48 -22% | 35.89 9% | 39 1% | 32.4 18% | 30.62 22% |
| Witcher 3 ultra * (dB) | 49.9 | 53 -6% | 57.5 -15% | 51.6 -3% | 48.3 3% | 49.75 -0% |
| Load Maximum * (dB) | 54.8 | 55 -0% | 57.54 -5% | 51.3 6% | 48.1 12% | 50.17 8% |
* ... menor é melhor
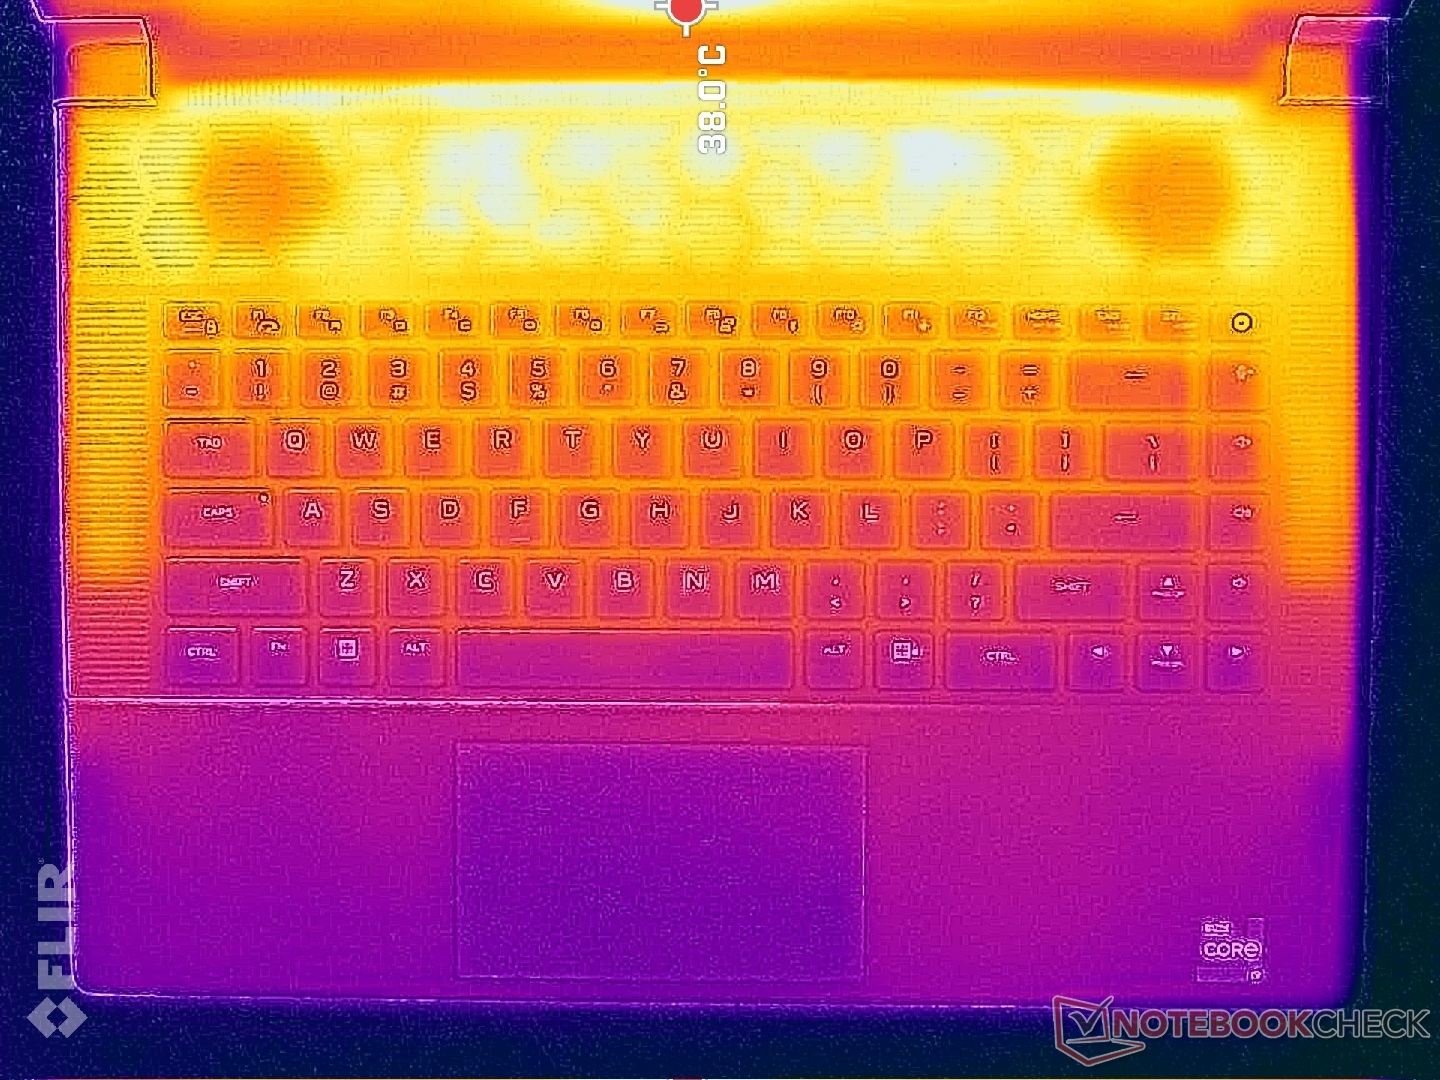
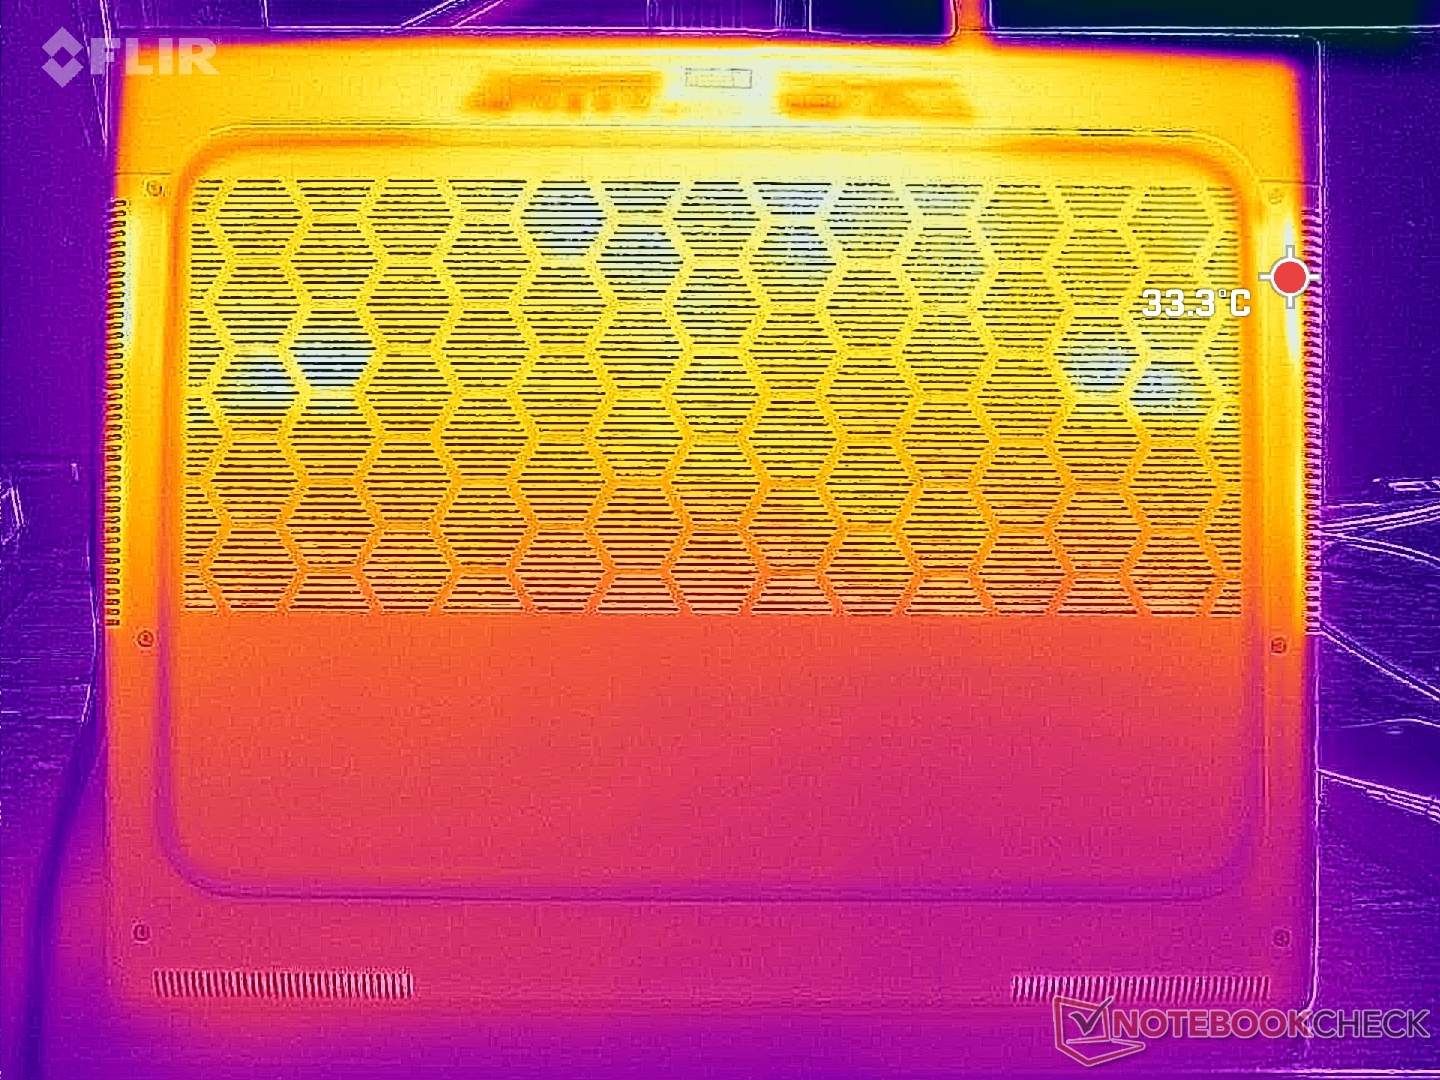
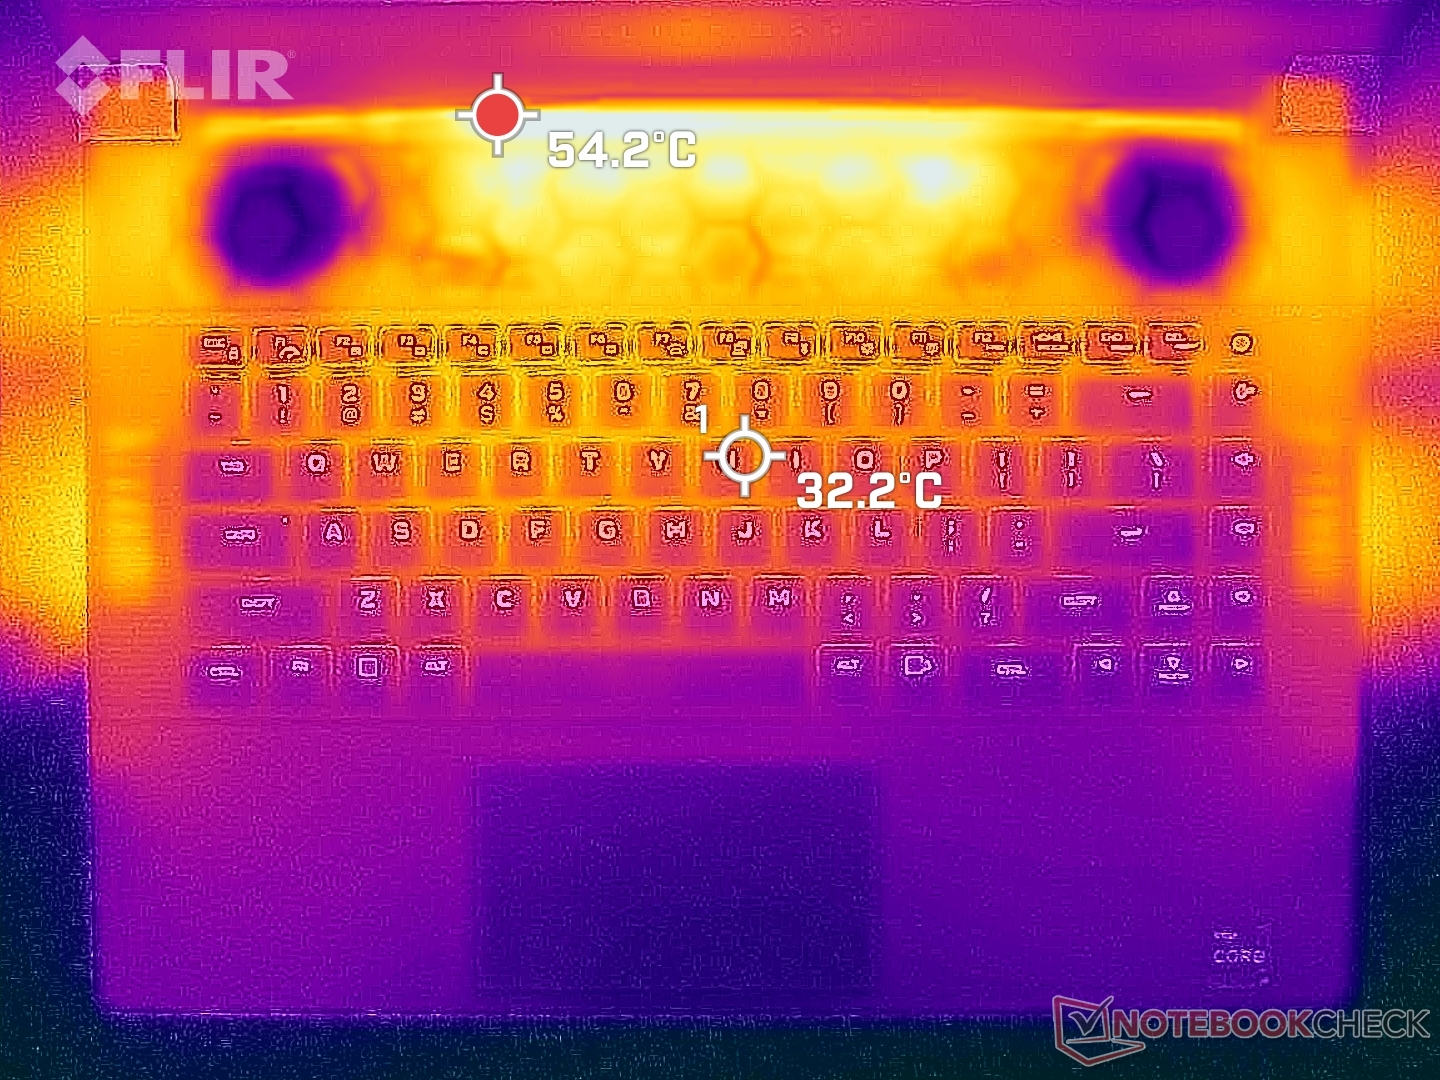
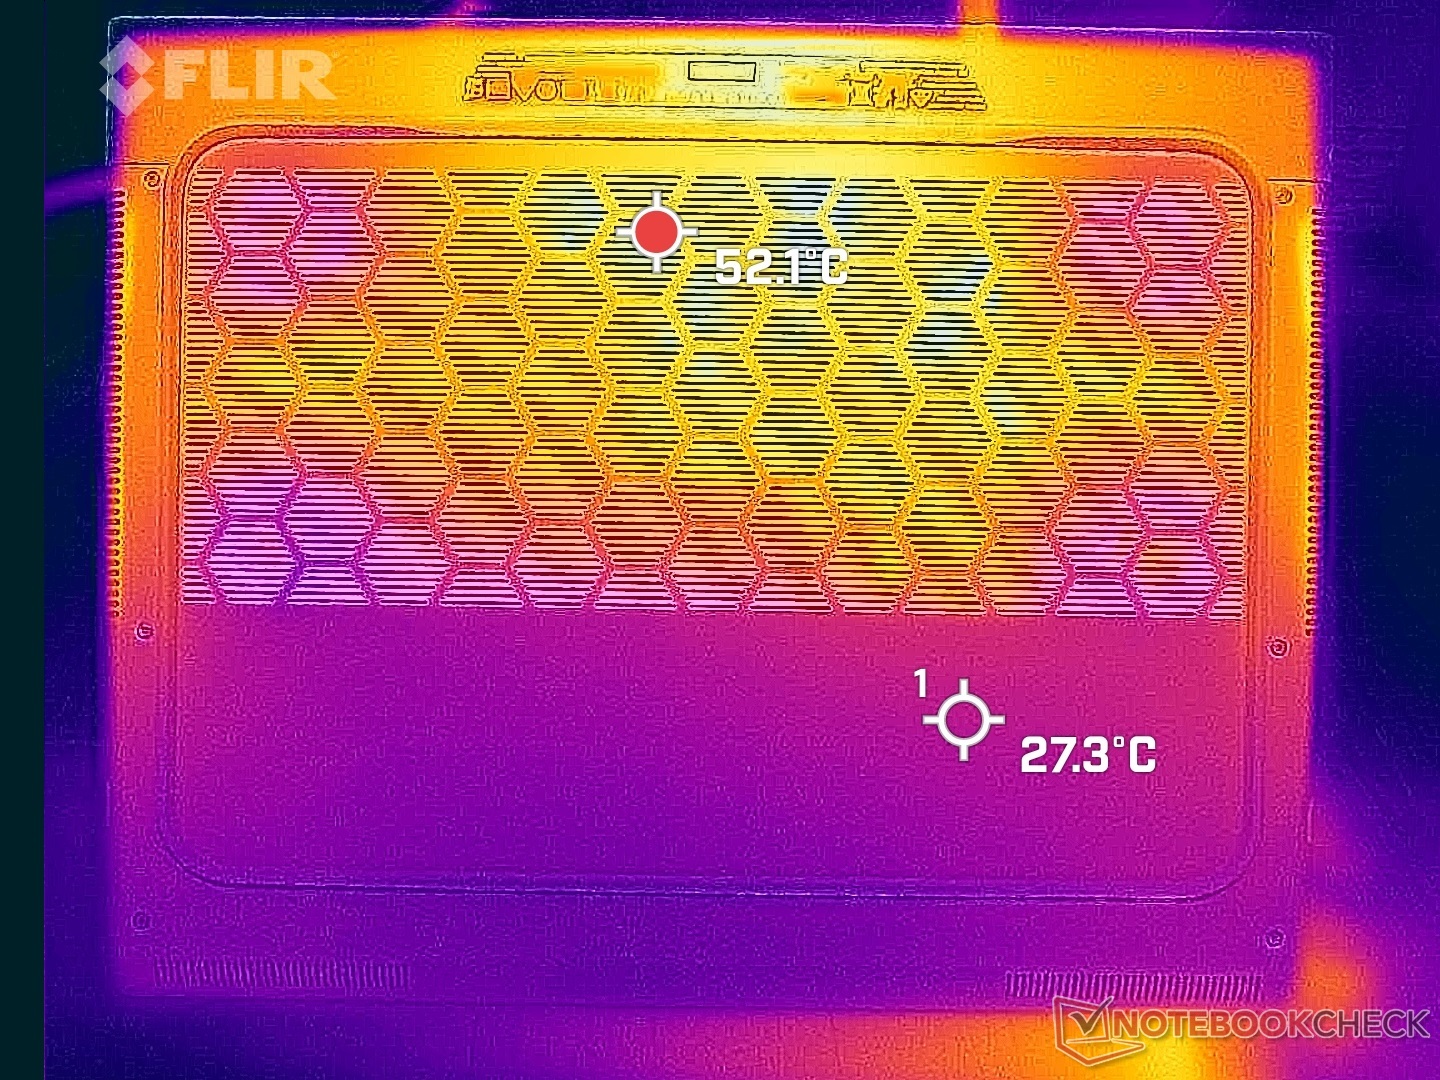
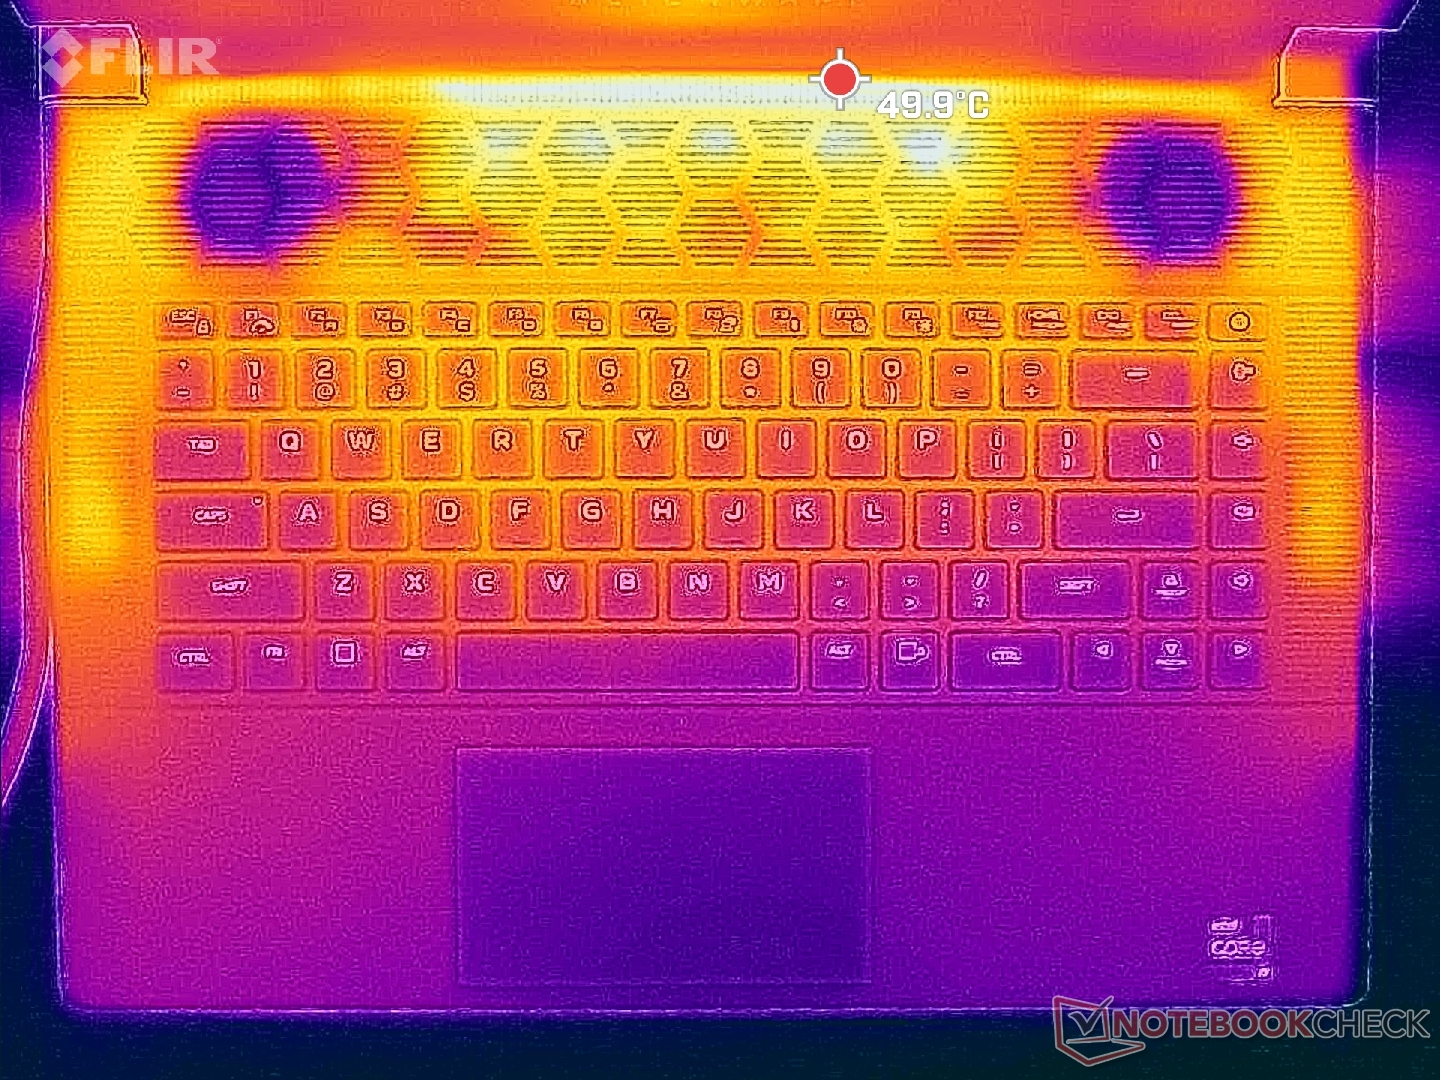
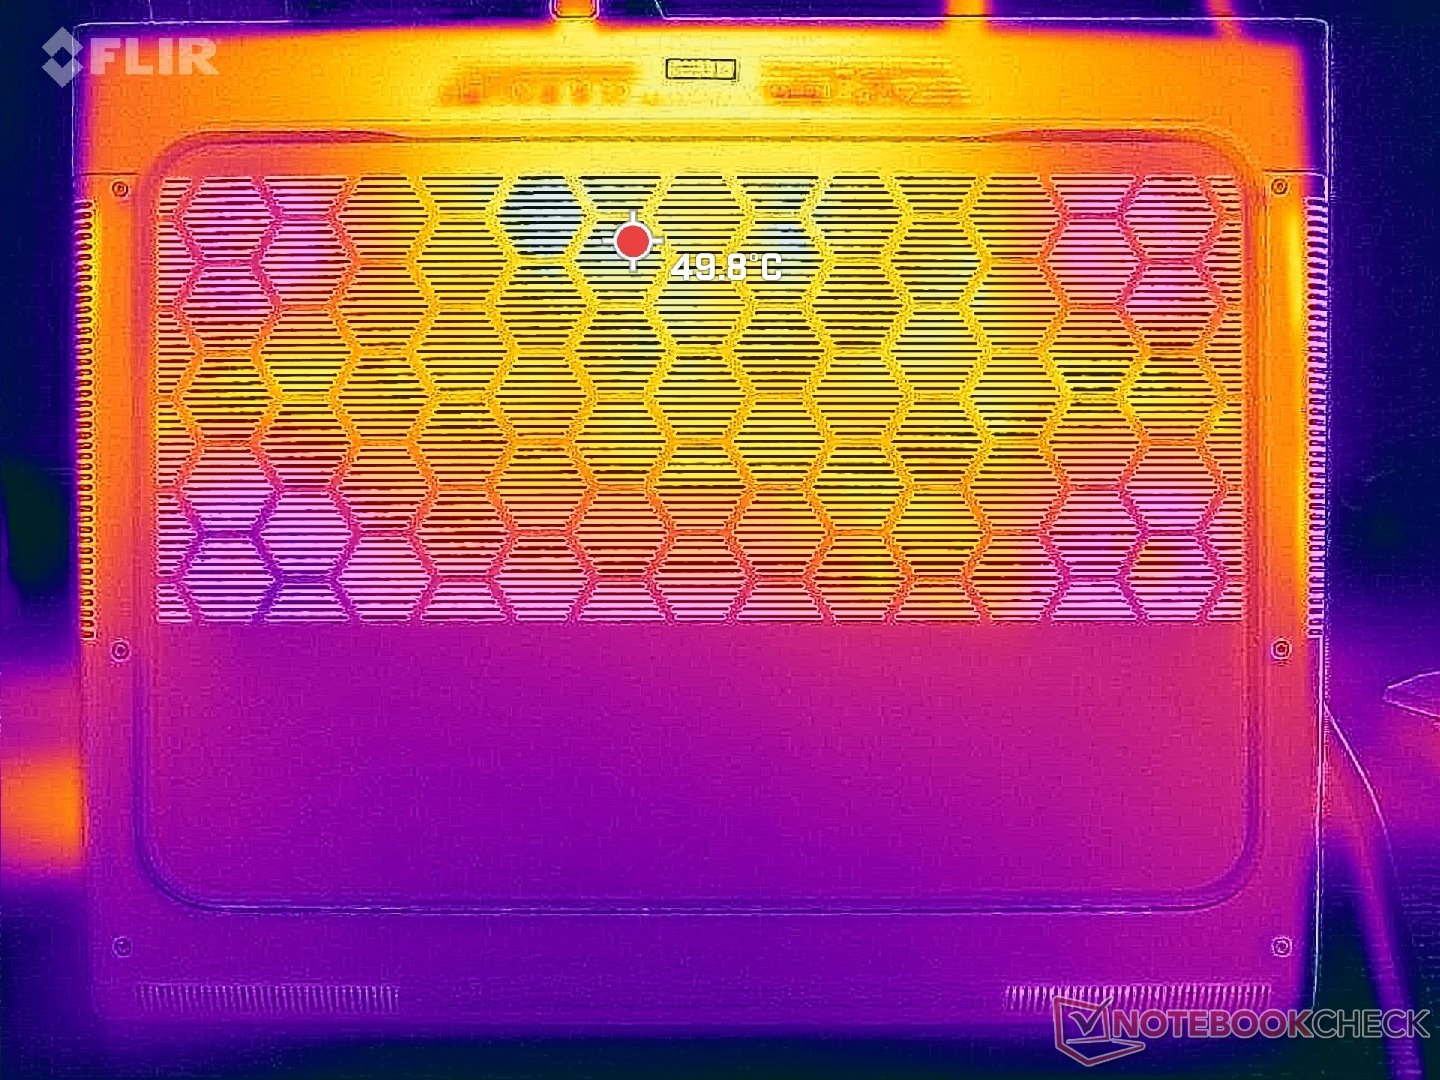
Temperatura
As temperaturas da superfície podem ser muito altas devido ao design de perfil fino. Os pontos quentes podem atingir cerca de 50 °C na parte superior e inferior, em comparação com apenas 40 °C no Blade 16. Felizmente, esses pontos quentes ficam na parte traseira e longe dos apoios para as mãos.
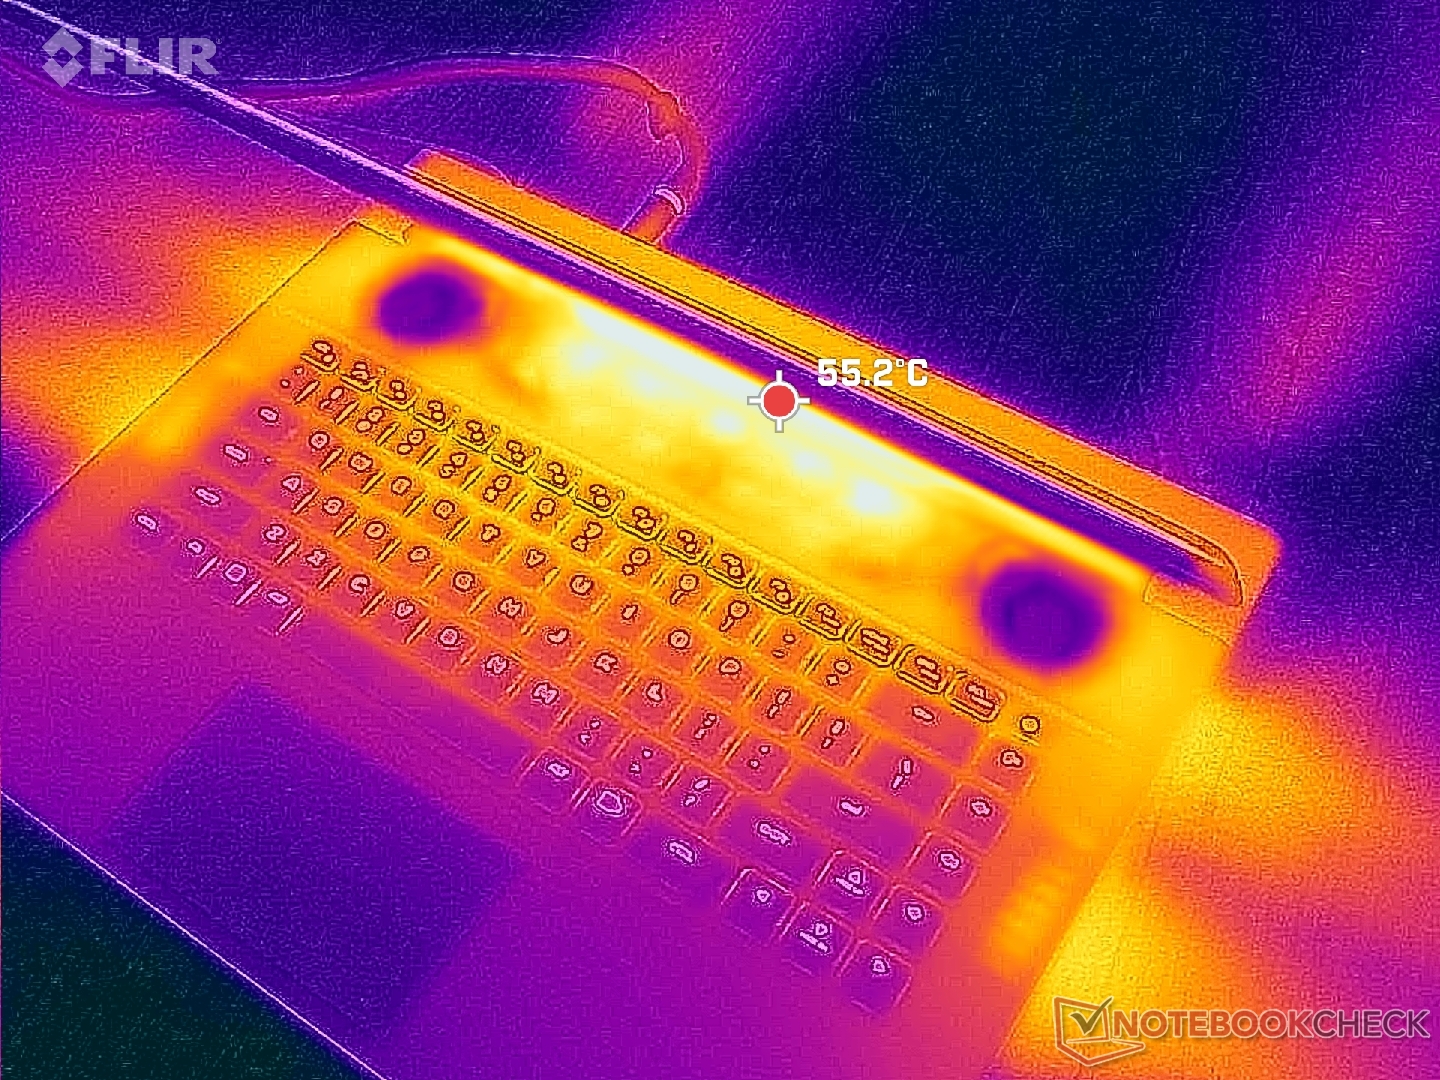
(-) A temperatura máxima no lado superior é 47.2 °C / 117 F, em comparação com a média de 40.4 °C / 105 F , variando de 21.2 a 68.8 °C para a classe Gaming.
(-) A parte inferior aquece até um máximo de 47.8 °C / 118 F, em comparação com a média de 43.2 °C / 110 F
(+) Em uso inativo, a temperatura média para o lado superior é 30.8 °C / 87 F, em comparação com a média do dispositivo de 33.9 °C / ### class_avg_f### F.
(±) Jogando The Witcher 3, a temperatura média para o lado superior é 38 °C / 100 F, em comparação com a média do dispositivo de 33.9 °C / ## #class_avg_f### F.
(+) Os apoios para as mãos e o touchpad são mais frios que a temperatura da pele, com um máximo de 30.6 °C / 87.1 F e, portanto, são frios ao toque.
(±) A temperatura média da área do apoio para as mãos de dispositivos semelhantes foi 28.8 °C / 83.8 F (-1.8 °C / -3.3 F).
| Alienware x16 R1 Intel Core i9-13900HK, NVIDIA GeForce RTX 4080 Laptop GPU | Lenovo Legion Pro 7 RTX4090 Intel Core i9-13900HX, NVIDIA GeForce RTX 4090 Laptop GPU | Asus ROG Zephyrus M16 GU604VY-NM042X Intel Core i9-13900H, NVIDIA GeForce RTX 4090 Laptop GPU | Razer Blade 16 Early 2023 Intel Core i9-13950HX, NVIDIA GeForce RTX 4080 Laptop GPU | Dell G16 7620 Intel Core i7-12700H, NVIDIA GeForce RTX 3060 Laptop GPU | Alienware m17 R5 (R9 6900HX, RX 6850M XT) AMD Ryzen 9 6900HX, AMD Radeon RX 6850M XT | |
|---|---|---|---|---|---|---|
| Heat | -4% | 6% | 15% | 14% | 2% | |
| Maximum Upper Side * (°C) | 47.2 | 53 -12% | 50 -6% | 40 15% | 47.6 -1% | 53 -12% |
| Maximum Bottom * (°C) | 47.8 | 59 -23% | 58 -21% | 37.6 21% | 54 -13% | 56 -17% |
| Idle Upper Side * (°C) | 36.8 | 34 8% | 26 29% | 32.4 12% | 23 37% | 30 18% |
| Idle Bottom * (°C) | 35.8 | 32 11% | 28 22% | 31.4 12% | 24.6 31% | 29 19% |
* ... menor é melhor
Teste de estresse
A taxa de clock da CPU, o consumo de energia da placa e a temperatura do núcleo aumentavam para 4,5 GHz, 178 W e 99 °C, respectivamente, ao iniciar o estresse do Prime95. A CPU acabava se estabilizando em 3,8 GHz, 123 W e 99 C depois de apenas alguns minutos. Com temperaturas de núcleo tão altas, fica claro que o processador está levando a solução de resfriamento ao limite para sustentar as taxas de clock mais altas possíveis do Turbo Boost. Repetir esse mesmo teste no Blade 16, por exemplo, resultaria em uma temperatura de núcleo estável mais fria de 82 C.
Ao executar o site Witcher 3 no modo Overdrive para representar cargas típicas de jogos, a GPU se estabilizaria em torno de 166 W contra uma meta de 175 W. Curiosamente, o consumo de energia da placa cairia para apenas 161 W no modo Balanced, conforme mostrado nas capturas de tela abaixo, representando um déficit de desempenho muito marginal em relação ao ruído do ventilador significativamente mais silencioso quando comparado ao modo Overdrive. Portanto, os proprietários podem considerar jogar no modo Balanced em vez dos modos Performance ou Overdrive, que são mais barulhentos.
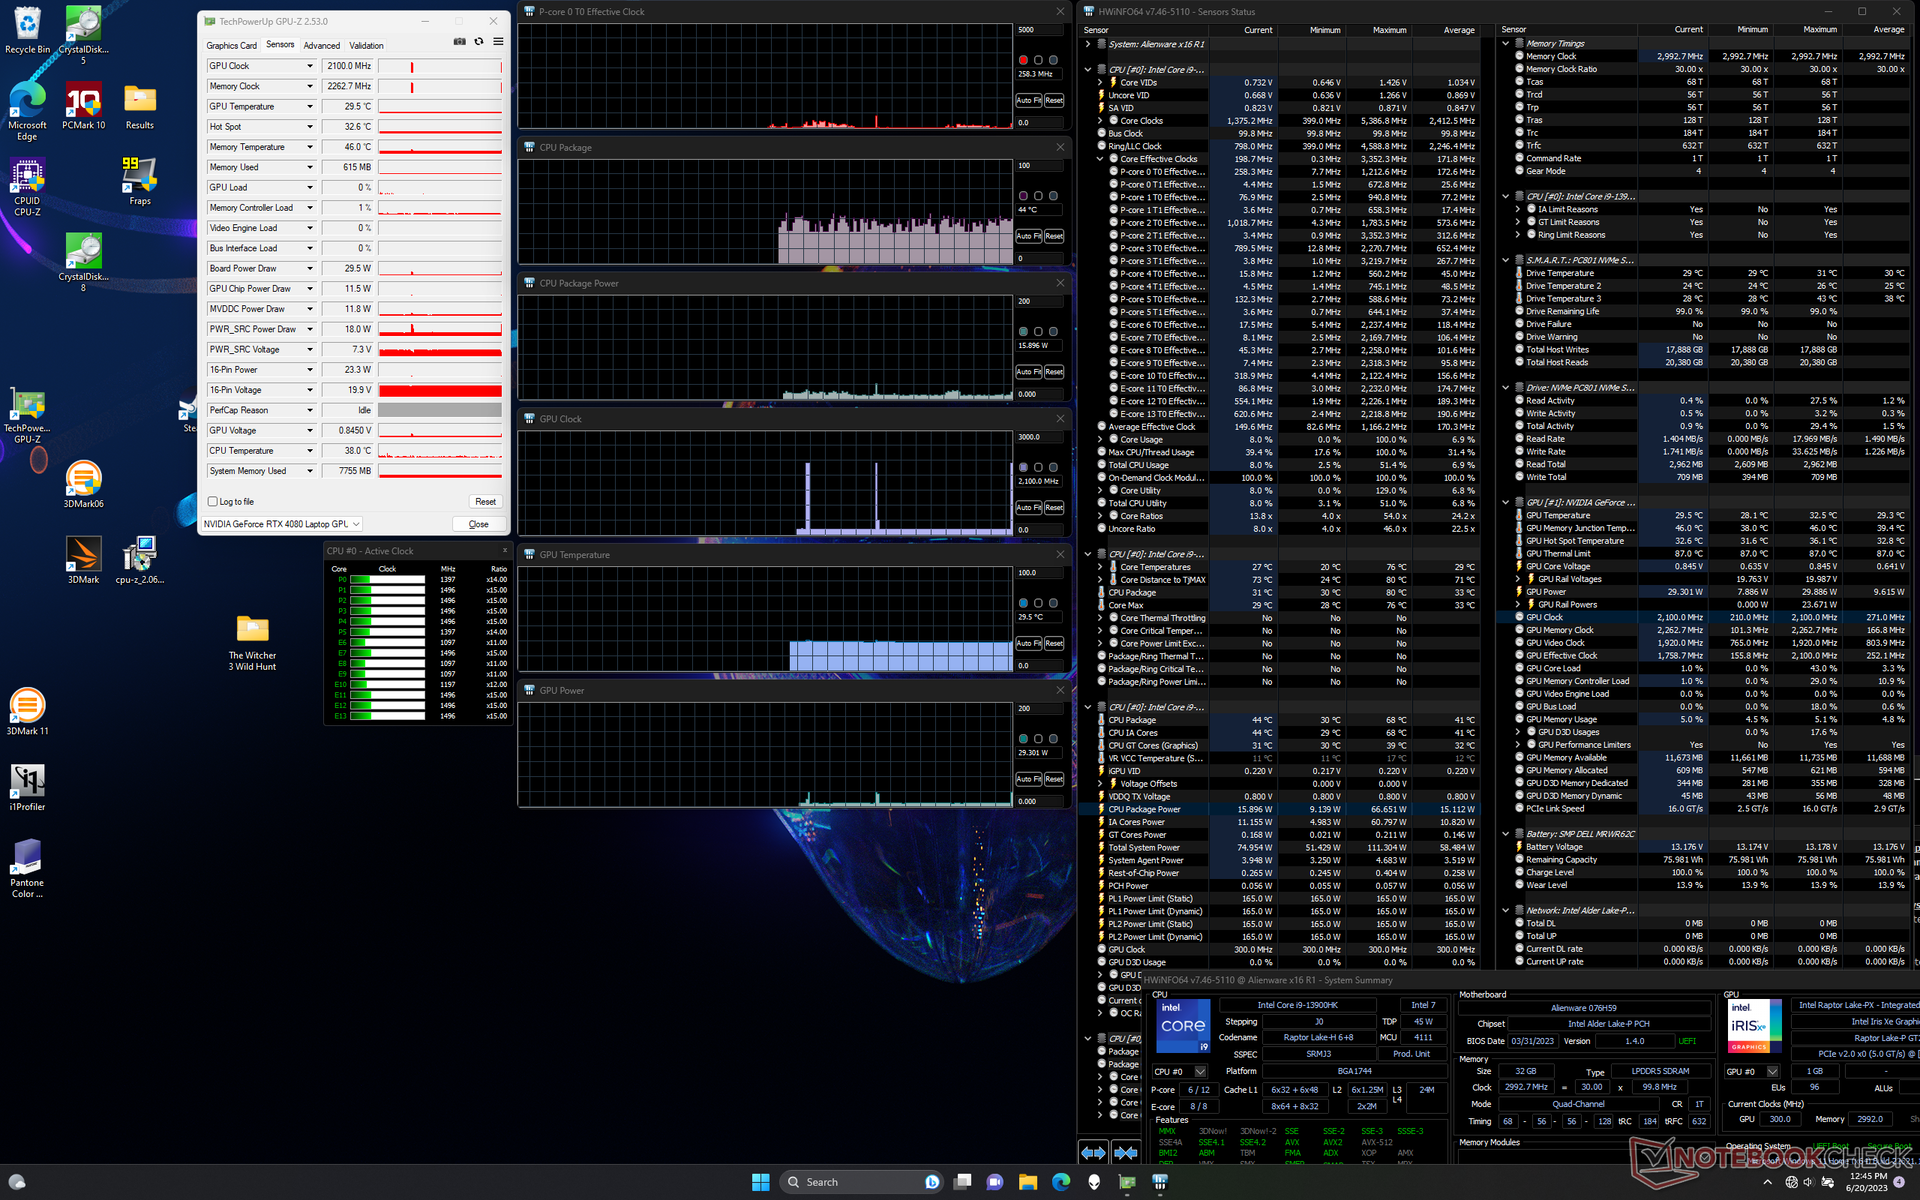

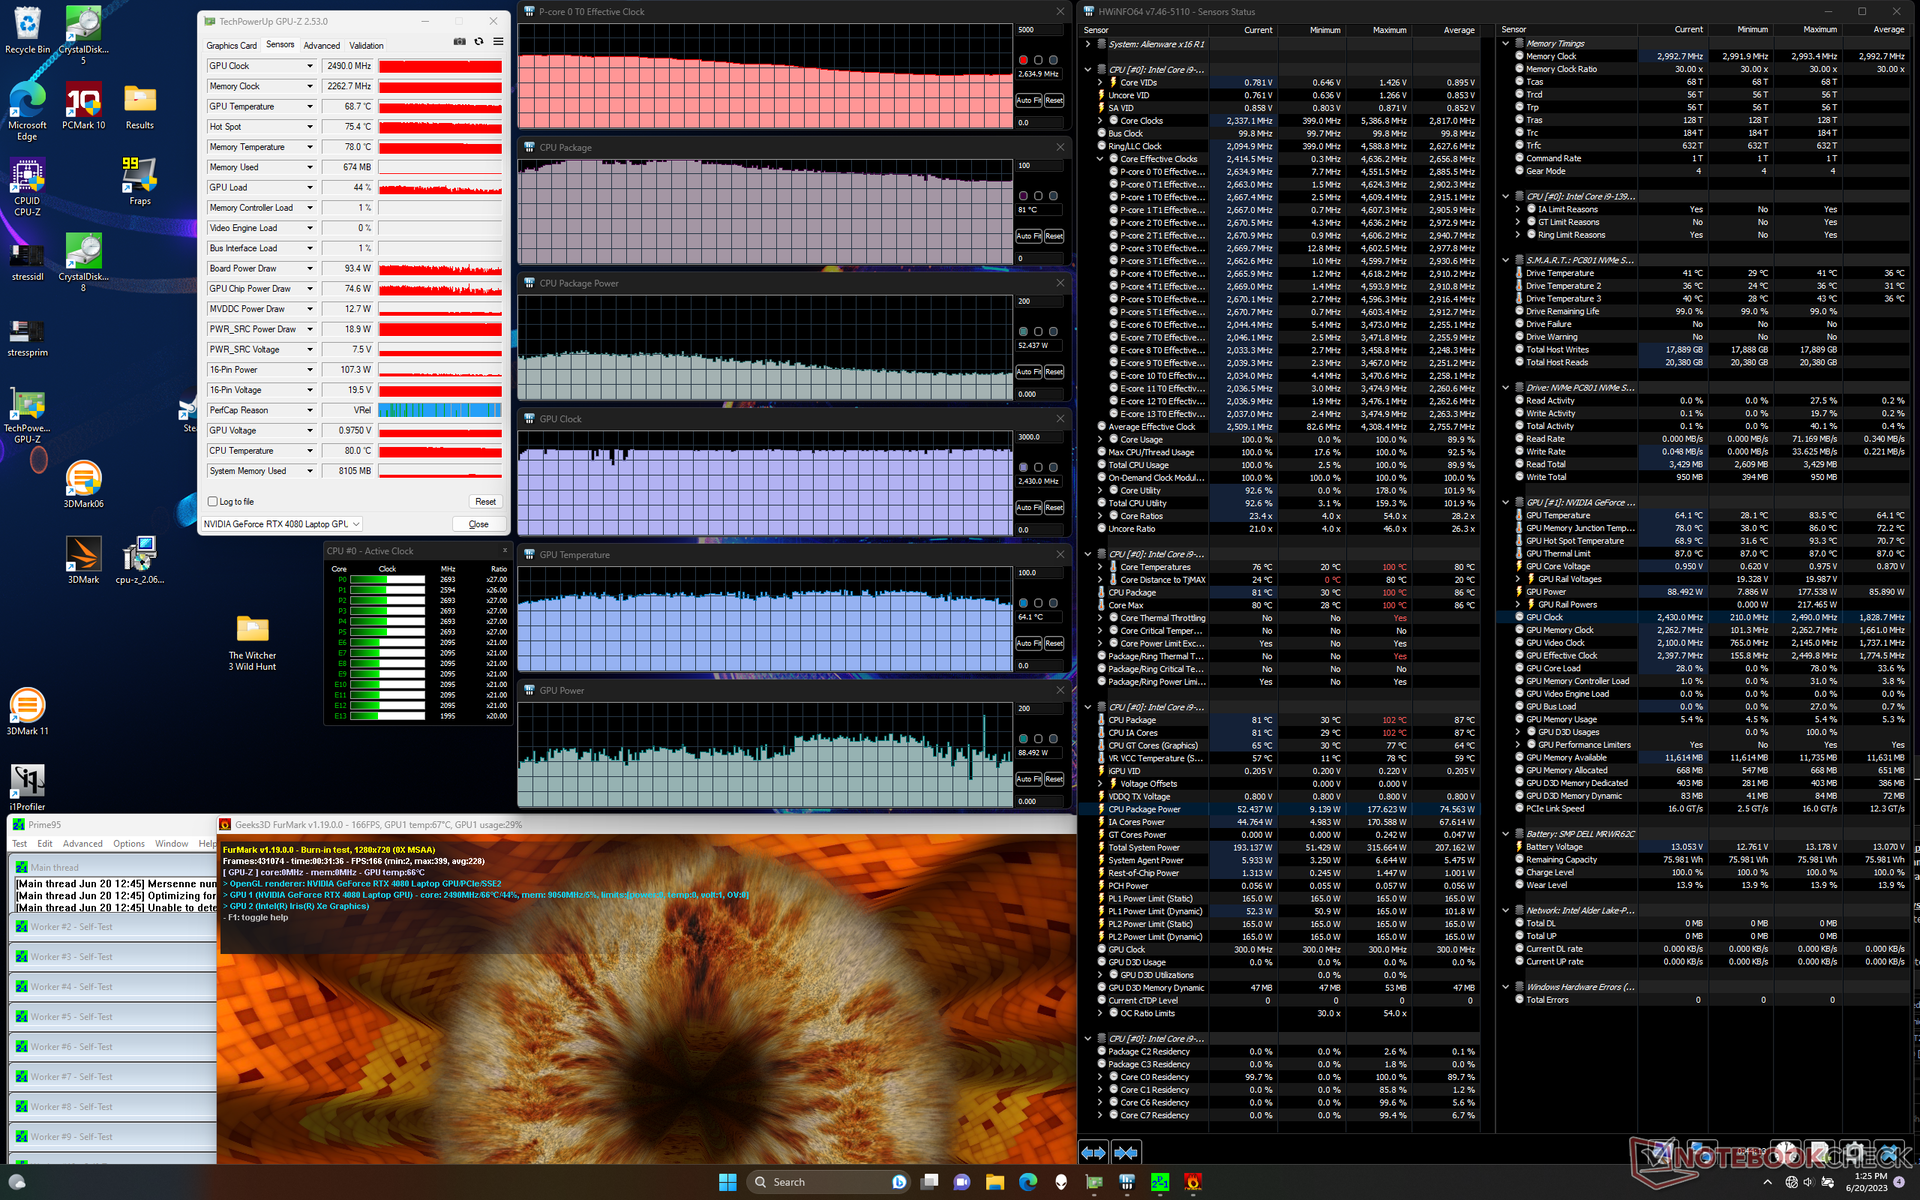

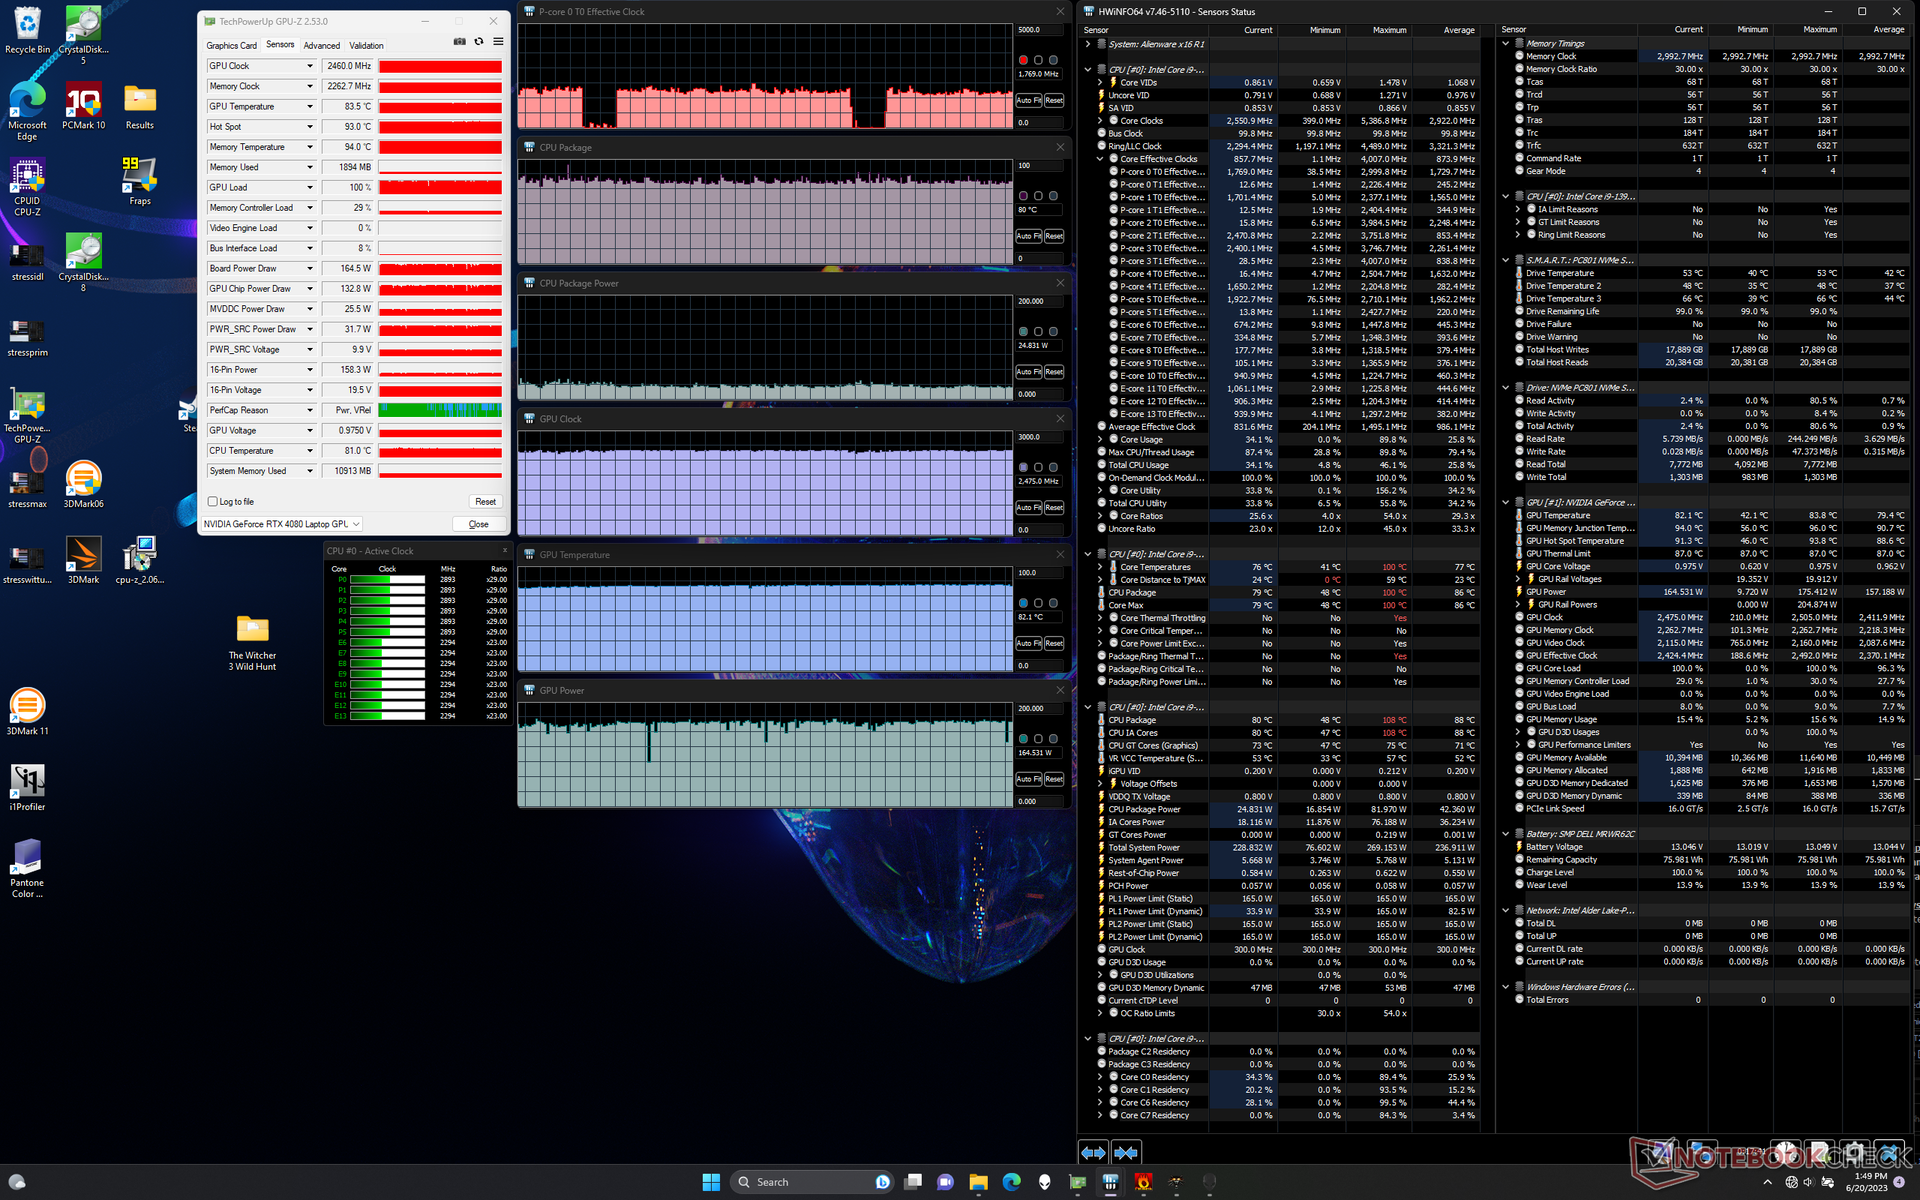
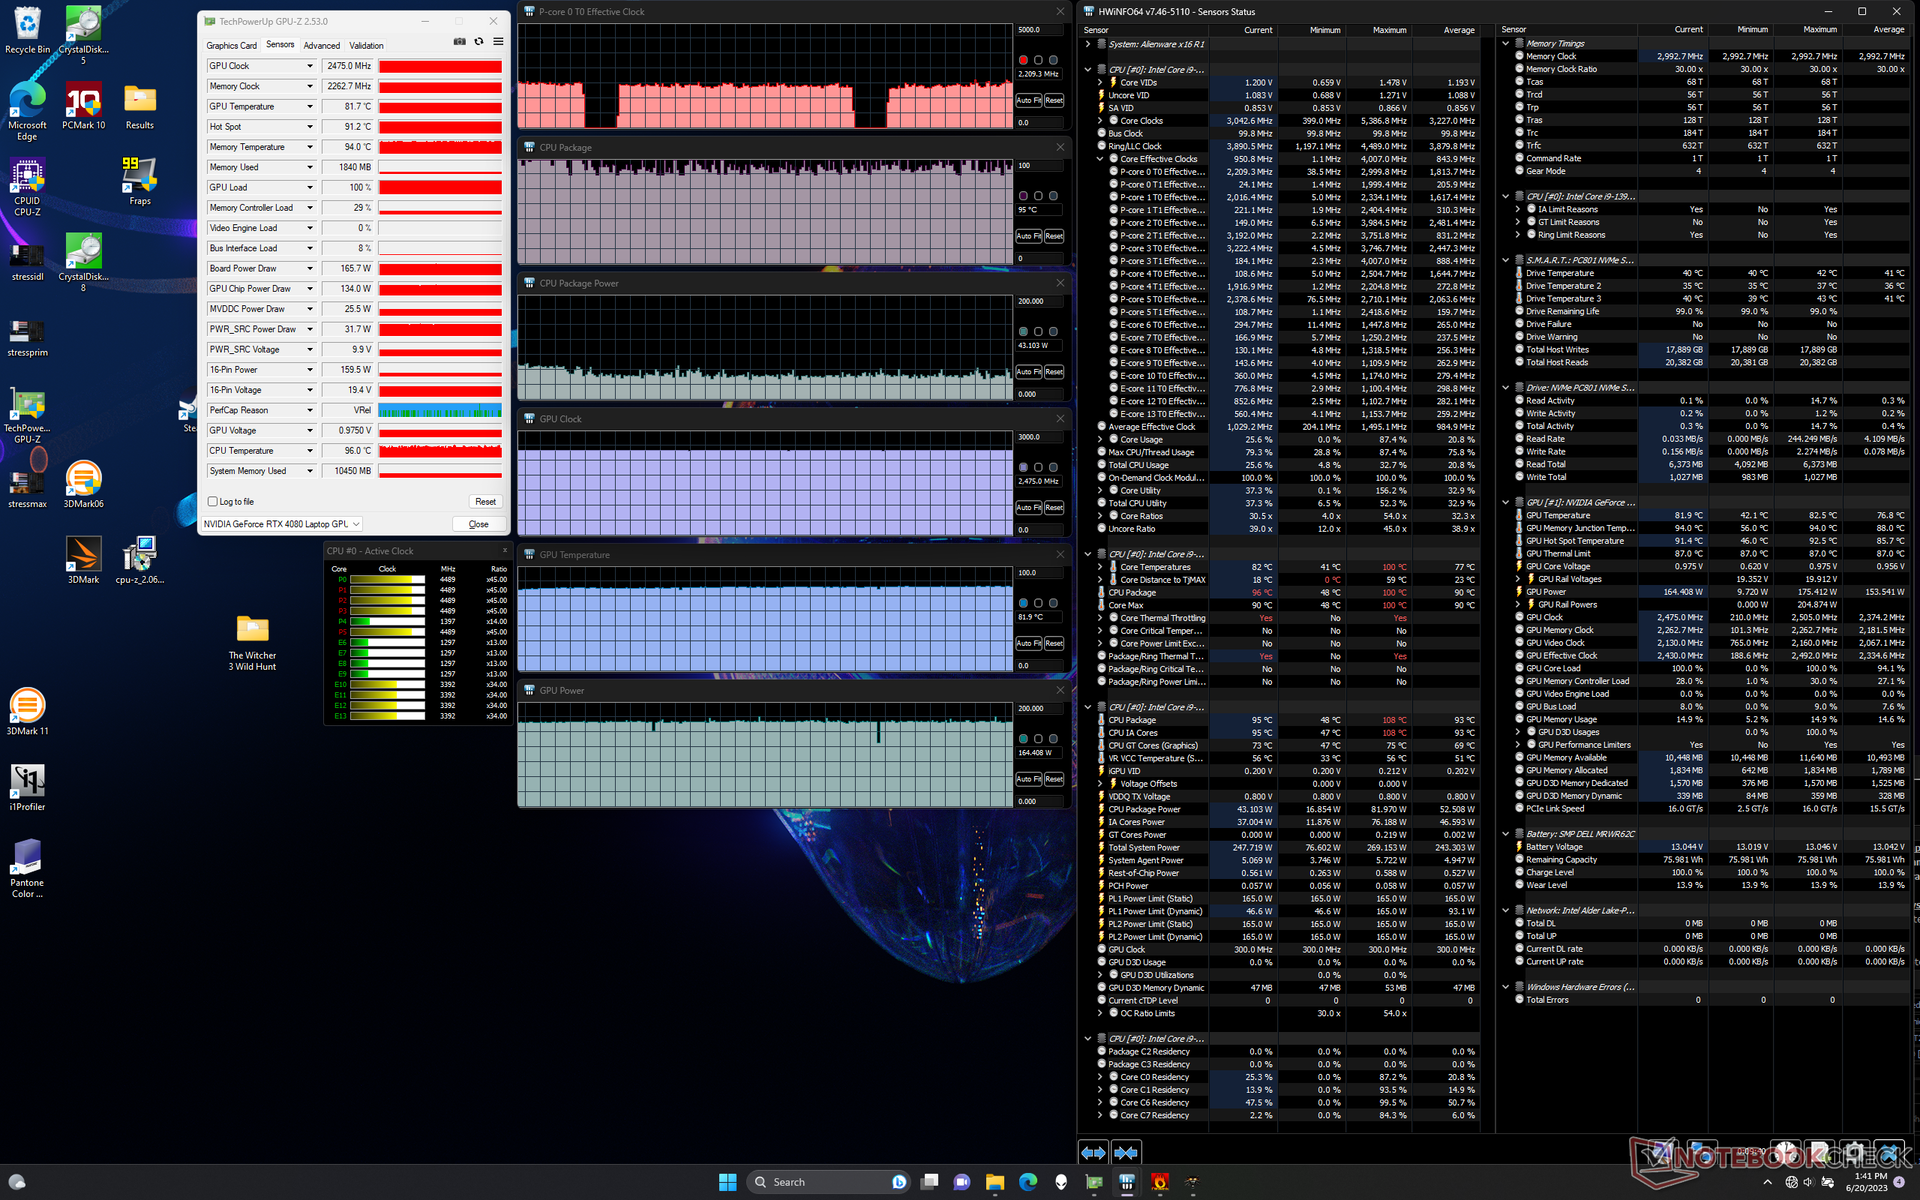
| Clock da CPU (GHz) | Clock da GPU (MHz) | Temperatura média da CPU (°C) | Temperatura média da GPU (°C) | |
| Sistema ocioso | -- | -- | 44 | 30 |
| Estresse doPrime95 | 3.8 | -- | 99 | 51 |
| Estresse doPrime95 + FurMark | 2,5 - 3,6 | 2475 | 82 - 100 | 72 - 77 |
| Witcher 3 Estresse(modo balanceado) | ~1,8 | 2460 | 81 | 85 |
| Witcher 3 Estresse(modo de desempenho) | ~1,8 | 2460 | 80 | 82 |
| Witcher 3 Estresse (modo Overdrive) | ~2,2 | 2475 | 95 | 82 |
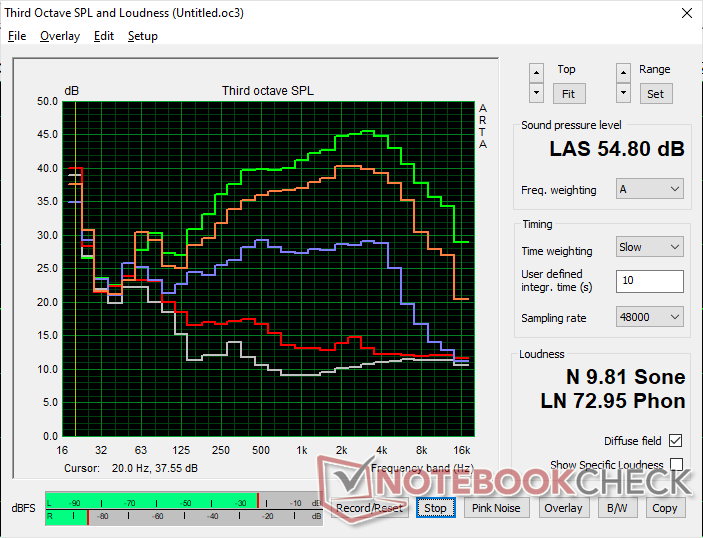
Alto-falantes
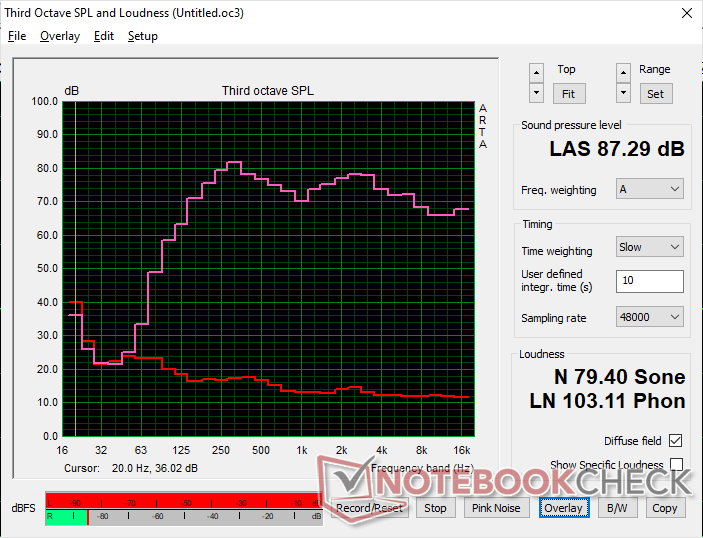
Alienware x16 R1 análise de áudio
(+) | os alto-falantes podem tocar relativamente alto (###valor### dB)
Graves 100 - 315Hz
(±) | graves reduzidos - em média 7.3% menor que a mediana
(±) | a linearidade dos graves é média (9.1% delta para a frequência anterior)
Médios 400 - 2.000 Hz
(+) | médios equilibrados - apenas 2.2% longe da mediana
(+) | médios são lineares (3.8% delta para frequência anterior)
Altos 2 - 16 kHz
(+) | agudos equilibrados - apenas 3.6% longe da mediana
(+) | os máximos são lineares (3.3% delta da frequência anterior)
Geral 100 - 16.000 Hz
(+) | o som geral é linear (7.9% diferença em relação à mediana)
Comparado com a mesma classe
» 1% de todos os dispositivos testados nesta classe foram melhores, 1% semelhantes, 98% piores
» O melhor teve um delta de 6%, a média foi 18%, o pior foi 132%
Comparado com todos os dispositivos testados
» 2% de todos os dispositivos testados foram melhores, 1% semelhantes, 98% piores
» O melhor teve um delta de 4%, a média foi 23%, o pior foi 134%
Apple MacBook Pro 16 2021 M1 Pro análise de áudio
(+) | os alto-falantes podem tocar relativamente alto (###valor### dB)
Graves 100 - 315Hz
(+) | bons graves - apenas 3.8% longe da mediana
(+) | o baixo é linear (5.2% delta para a frequência anterior)
Médios 400 - 2.000 Hz
(+) | médios equilibrados - apenas 1.3% longe da mediana
(+) | médios são lineares (2.1% delta para frequência anterior)
Altos 2 - 16 kHz
(+) | agudos equilibrados - apenas 1.9% longe da mediana
(+) | os máximos são lineares (2.7% delta da frequência anterior)
Geral 100 - 16.000 Hz
(+) | o som geral é linear (4.6% diferença em relação à mediana)
Comparado com a mesma classe
» 0% de todos os dispositivos testados nesta classe foram melhores, 0% semelhantes, 100% piores
» O melhor teve um delta de 5%, a média foi 17%, o pior foi 45%
Comparado com todos os dispositivos testados
» 0% de todos os dispositivos testados foram melhores, 0% semelhantes, 100% piores
» O melhor teve um delta de 4%, a média foi 23%, o pior foi 134%
Gerenciamento de energia
Consumo de energia - alto como esperado
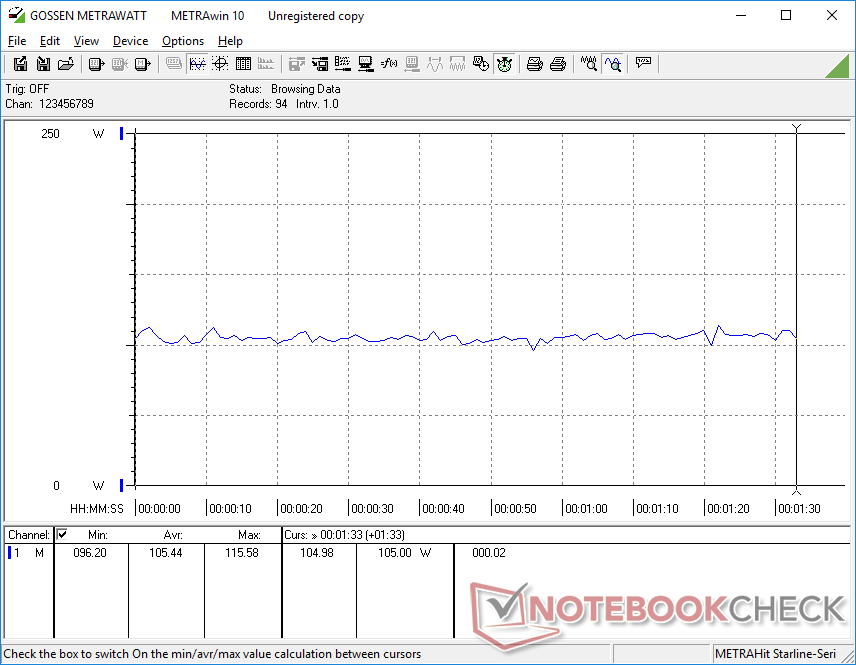
O consumo de energia varia entre 25 W e 50 W quando em modo inativo na área de trabalho, dependendo do perfil de energia, da GPU e das configurações de brilho. Essa faixa é alta até mesmo para a categoria, pois outros modelos de 16 polegadas, como o Razer Blade 16 ou o Alienware m17 podem atingir até 15 W com configurações de energia mínima semelhantes.
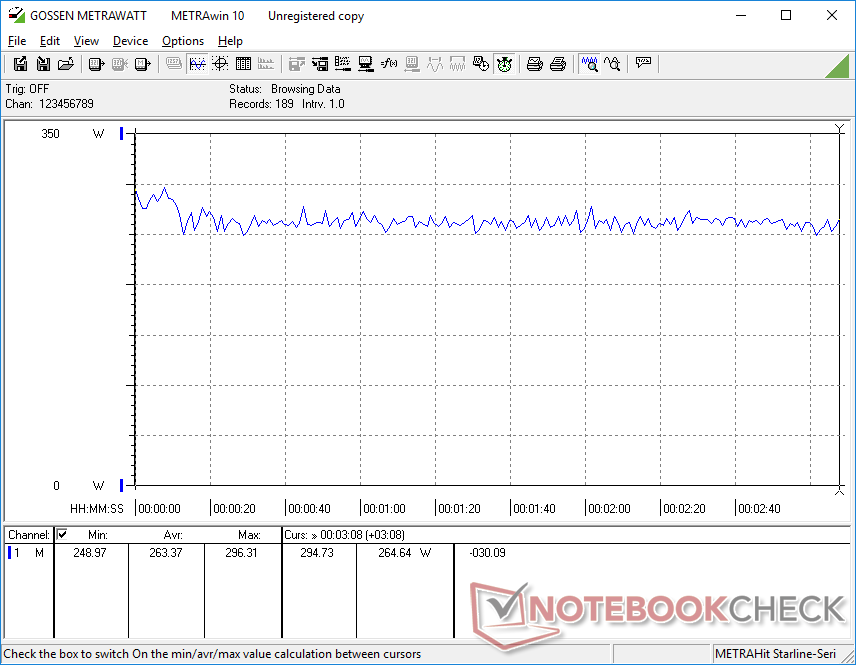
Os jogos exigem cerca de 263 W, o que está entre o Asus ROG Strix G16 e o MSI GE78 HX cada um com a mesma GPU RTX 4080. Talvez mais notavelmente, a Asus ROG Zephyrus M16 consome 20% menos energia e oferece praticamente o mesmo desempenho gráfico que o nosso Alienware com RTX 4080.
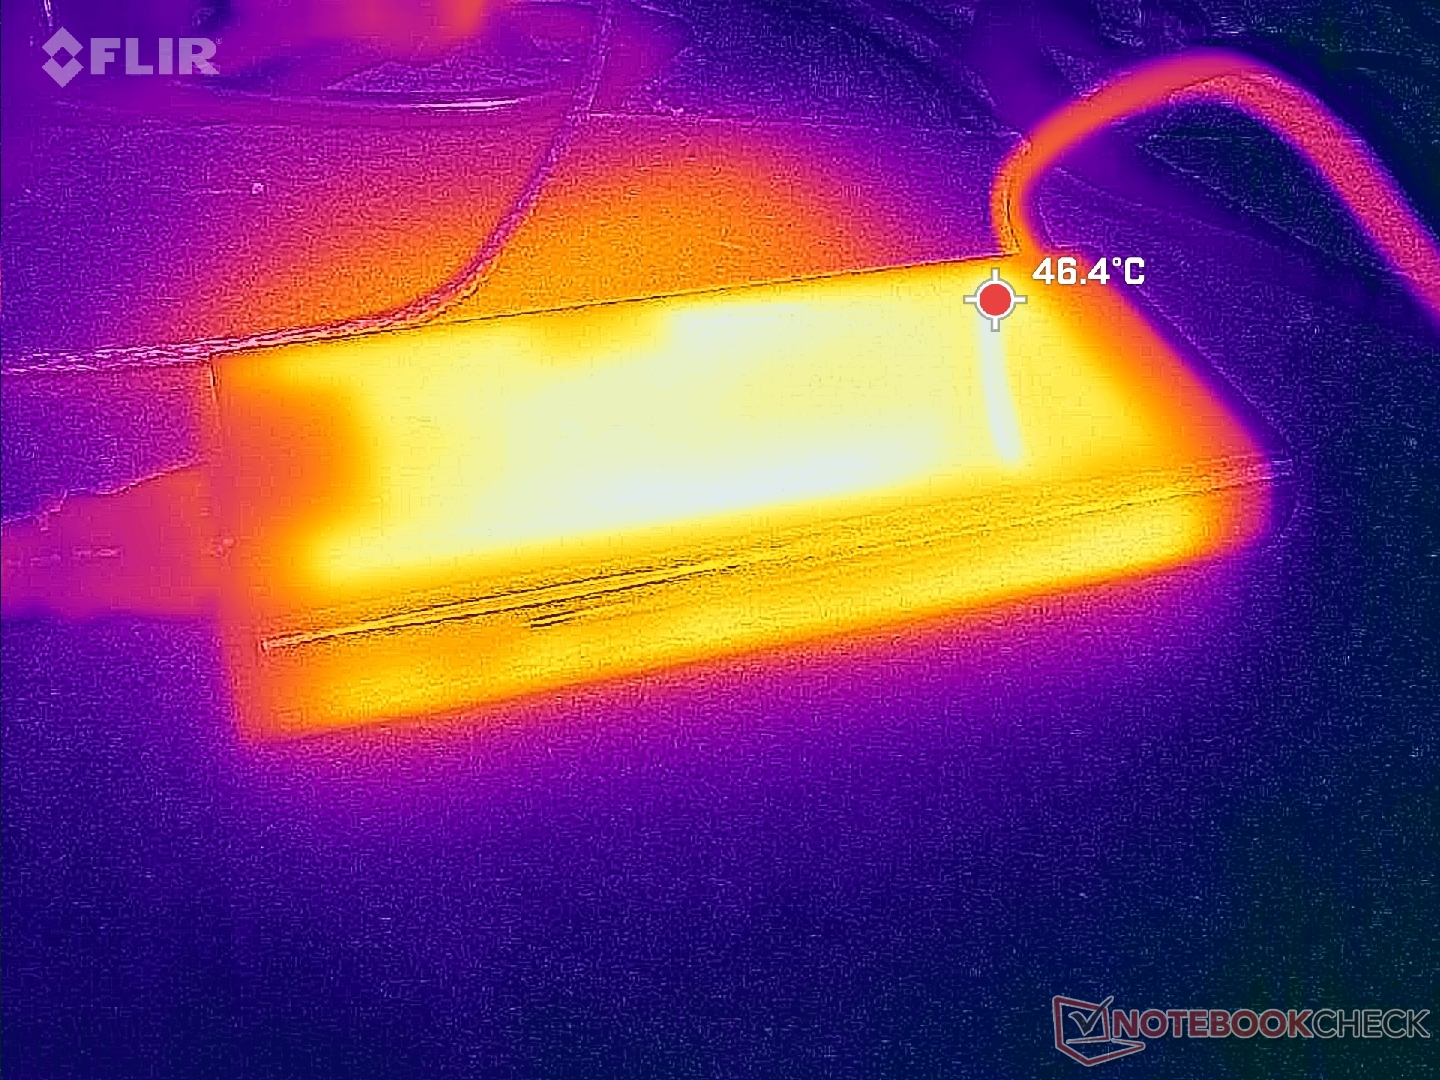
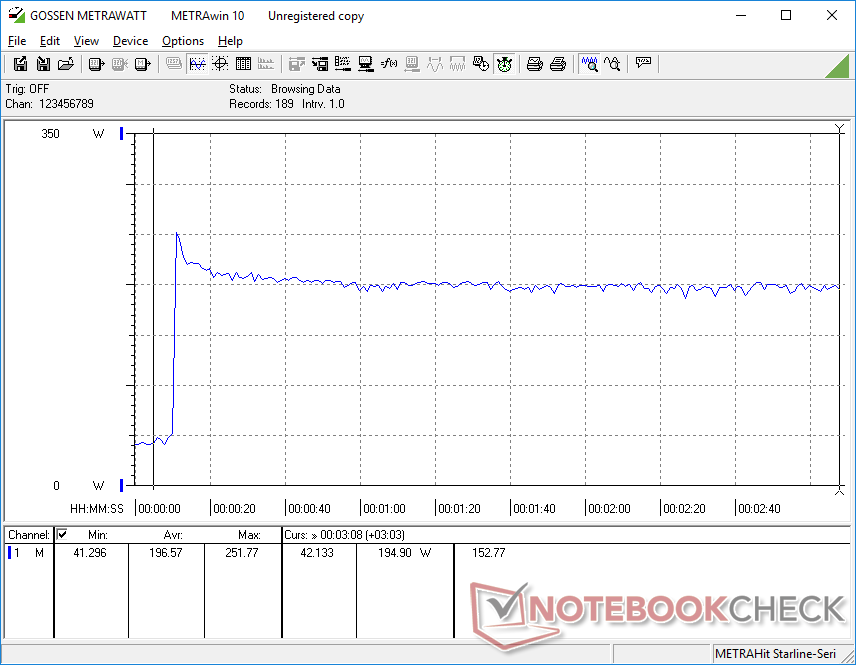
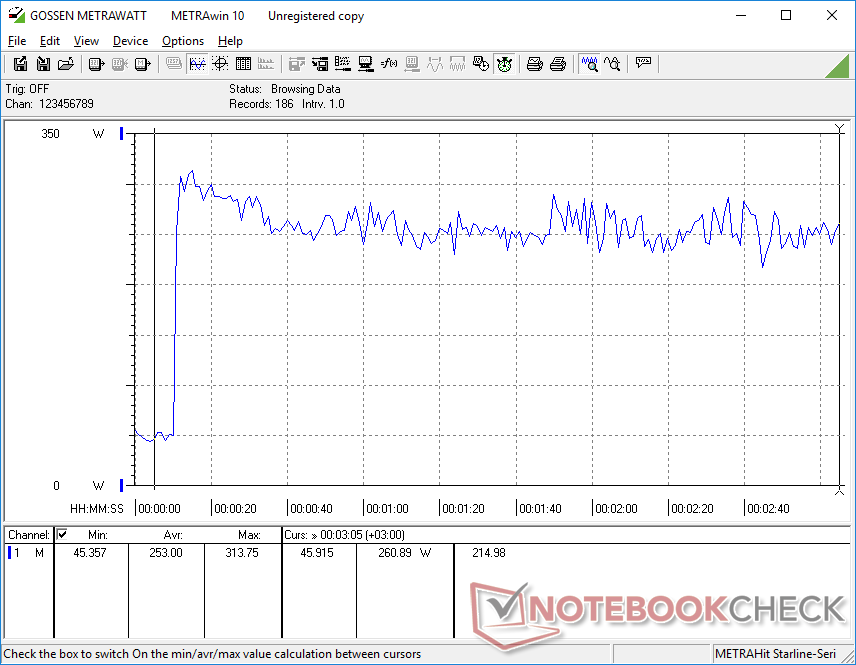
Conseguimos medir um consumo temporário máximo de 313 W com o adaptador CA de 330 W de tamanho médio (~18,3 x 8,6 x 2,6 cm) quando a CPU e a GPU estão sendo utilizadas em 100%. A taxa de carregamento fica mais lenta durante a execução de cargas tão exigentes.
| desligado | |
| Ocioso | |
| Carga |
|
Key:
min: | |
| Alienware x16 R1 i9-13900HK, GeForce RTX 4080 Laptop GPU, SK hynix PC801 HFS001TEJ9X101N, IPS, 2560x1600, 16" | Lenovo Legion Pro 7 RTX4090 i9-13900HX, GeForce RTX 4090 Laptop GPU, Samsung PM9A1 MZVL21T0HCLR, IPS, 2560x1600, 16" | Asus ROG Zephyrus M16 GU604VY-NM042X i9-13900H, GeForce RTX 4090 Laptop GPU, Samsung PM9A1 MZVL22T0HBLB, IPS, 2560x1600, 16" | Razer Blade 16 Early 2023 i9-13950HX, GeForce RTX 4080 Laptop GPU, SSSTC CA6-8D1024, IPS, 2560x1600, 16" | Dell G16 7620 i7-12700H, GeForce RTX 3060 Laptop GPU, WDC PC SN810 512GB, IPS, 2560x1600, 16" | Alienware m17 R5 (R9 6900HX, RX 6850M XT) R9 6900HX, Radeon RX 6850M XT, SSSTC CA6-8D1024, IPS, 3840x2160, 17" | |
|---|---|---|---|---|---|---|
| Power Consumption | 5% | 21% | 12% | 30% | 33% | |
| Idle Minimum * (Watt) | 25.2 | 20 21% | 20 21% | 15.2 40% | 14.4 43% | 13 48% |
| Idle Average * (Watt) | 29.9 | 25 16% | 24 20% | 22.8 24% | 17.8 40% | 16.5 45% |
| Idle Maximum * (Watt) | 49.8 | 35 30% | 25 50% | 49.8 -0% | 31.5 37% | 17 66% |
| Load Average * (Watt) | 105.4 | 136 -29% | 107 -2% | 121.2 -15% | 101.2 4% | 93 12% |
| Witcher 3 ultra * (Watt) | 263 | 282 -7% | 208 21% | 242 8% | 176.9 33% | 239 9% |
| Load Maximum * (Watt) | 313.8 | 320 -2% | 267 15% | 273.7 13% | 242.9 23% | 251 20% |
* ... menor é melhor
Power Consumption Witcher 3 / Stresstest
Power Consumption external Monitor
Duração da bateria
Só conseguimos registrar 2,5 horas de tempo de execução durante nosso teste de navegação WLAN, mesmo com o ACC definido para o modo Bateria e o sistema no modo iGPU Optimus. A repetição do teste resultaria em números semelhantes. Não esperamos tempos de execução longos de notebooks para jogos, mas esse tempo ainda é muito menor quando comparado às plataformas concorrentes. A Dell alega um tempo de execução de navegação de mais de 7 horas, o que só conseguimos obter quando ocioso na área de trabalho com a configuração de brilho mais baixa. Os resultados são incomuns, pois nossoAlienware x17 duraria o dobro do tempo que o Alienware x16 quando submetido ao mesmo teste de WLAN.
O carregamento de vazio para cheio leva cerca de duas horas com o adaptador CA incluído. O sistema também pode ser recarregado por meio de adaptadores USB-C, incluindo os adaptadores de 130 W fornecidos com os modelos XPS.
| Alienware x16 R1 i9-13900HK, GeForce RTX 4080 Laptop GPU, 90 Wh | Asus ROG Zephyrus M16 GU604VY-NM042X i9-13900H, GeForce RTX 4090 Laptop GPU, 90 Wh | Razer Blade 16 Early 2023 i9-13950HX, GeForce RTX 4080 Laptop GPU, 95.2 Wh | Dell G16 7620 i7-12700H, GeForce RTX 3060 Laptop GPU, 84 Wh | Alienware m17 R5 (R9 6900HX, RX 6850M XT) R9 6900HX, Radeon RX 6850M XT, 97 Wh | Lenovo Legion Pro 7 16IRX8H i9-13900HX, GeForce RTX 4080 Laptop GPU, 99.9 Wh | |
|---|---|---|---|---|---|---|
| Duração da bateria | 193% | 89% | 32% | 125% | 97% | |
| Reader / Idle (h) | 7.3 | 8.9 22% | 7.1 -3% | 6.4 -12% | ||
| WiFi v1.3 (h) | 2.5 | 4.3 72% | 6.1 144% | 5 100% | 4.8 92% | 5.1 104% |
| Load (h) | 0.7 | 2.9 314% | 1.4 100% | 0.7 0% | 1.8 157% | 2.1 200% |
| H.264 (h) | 4.8 | 4.9 |
Pro
Contra
Veredicto - É bem-sucedido em sua busca por espessura e gráficos
É comum entender que o desempenho do laptop é inversamente proporcional à espessura. O Alienware x16 desafia isso por ser um dos mais finos em sua categoria de tamanho e ainda assim superar os principais concorrentes, como o Razer Blade 16, Asus ROG Strix G16ou HP Omen 17 em termos de desempenho gráfico. É impressionante o fato de o modelo ser capaz de incluir uma GPU RTX GeForce de 175 W devido ao perfil ultrafino.
Se você deseja maximizar o desempenho da GPU e, ao mesmo tempo, minimizar a espessura, o Alienware x16 deve estar no topo da sua lista.
No entanto, há várias desvantagens, algumas das quais são exclusivas do Alienware x16. Em primeiro lugar, o fato de ser superfino não significa que seja superpequeno ou leve, pois o sistema é muito grande em termos de comprimento e largura para compensar a altura Z mais fina. Em segundo lugar, a falta de portas nas laterais pode dificultar um pouco a conexão de monitores ou acessórios. E, por fim, o processador Core i9-13900HK oferece apenas melhorias marginais em relação à última geração doCore i9-12900H da última geração, já que ele não é nem de longe tão potente quanto oCore i9-13900HX que está disponível no Alienware m16 mais espesso e não no Alienware x16. Provavelmente, foram necessárias concessões no espaço ocupado, no posicionamento das portas e no desempenho da CPU para maximizar a potência da GPU.
Preço e disponibilidade
A Dell agora está enviando o Alienware x16 para os consumidores a partir de US$ 2.200 para a configuração básica e US$ 3.350 para a nossa configuração analisada.
Alienware x16 R1
- 06/22/2023 v7 (old)
Allen Ngo
Transparência
A seleção dos dispositivos a serem analisados é feita pela nossa equipe editorial. A amostra de teste foi fornecida ao autor como empréstimo pelo fabricante ou varejista para fins desta revisão. O credor não teve influência nesta revisão, nem o fabricante recebeu uma cópia desta revisão antes da publicação. Não houve obrigação de publicar esta revisão. Como empresa de mídia independente, a Notebookcheck não está sujeita à autoridade de fabricantes, varejistas ou editores.
É assim que o Notebookcheck está testando
Todos os anos, o Notebookcheck analisa de forma independente centenas de laptops e smartphones usando procedimentos padronizados para garantir que todos os resultados sejam comparáveis. Desenvolvemos continuamente nossos métodos de teste há cerca de 20 anos e definimos padrões da indústria no processo. Em nossos laboratórios de teste, equipamentos de medição de alta qualidade são utilizados por técnicos e editores experientes. Esses testes envolvem um processo de validação em vários estágios. Nosso complexo sistema de classificação é baseado em centenas de medições e benchmarks bem fundamentados, o que mantém a objetividade.Price comparison

