Análise do Gigabyte G6X 9KG (2024): Notebook para jogos acessível com RTX 4060

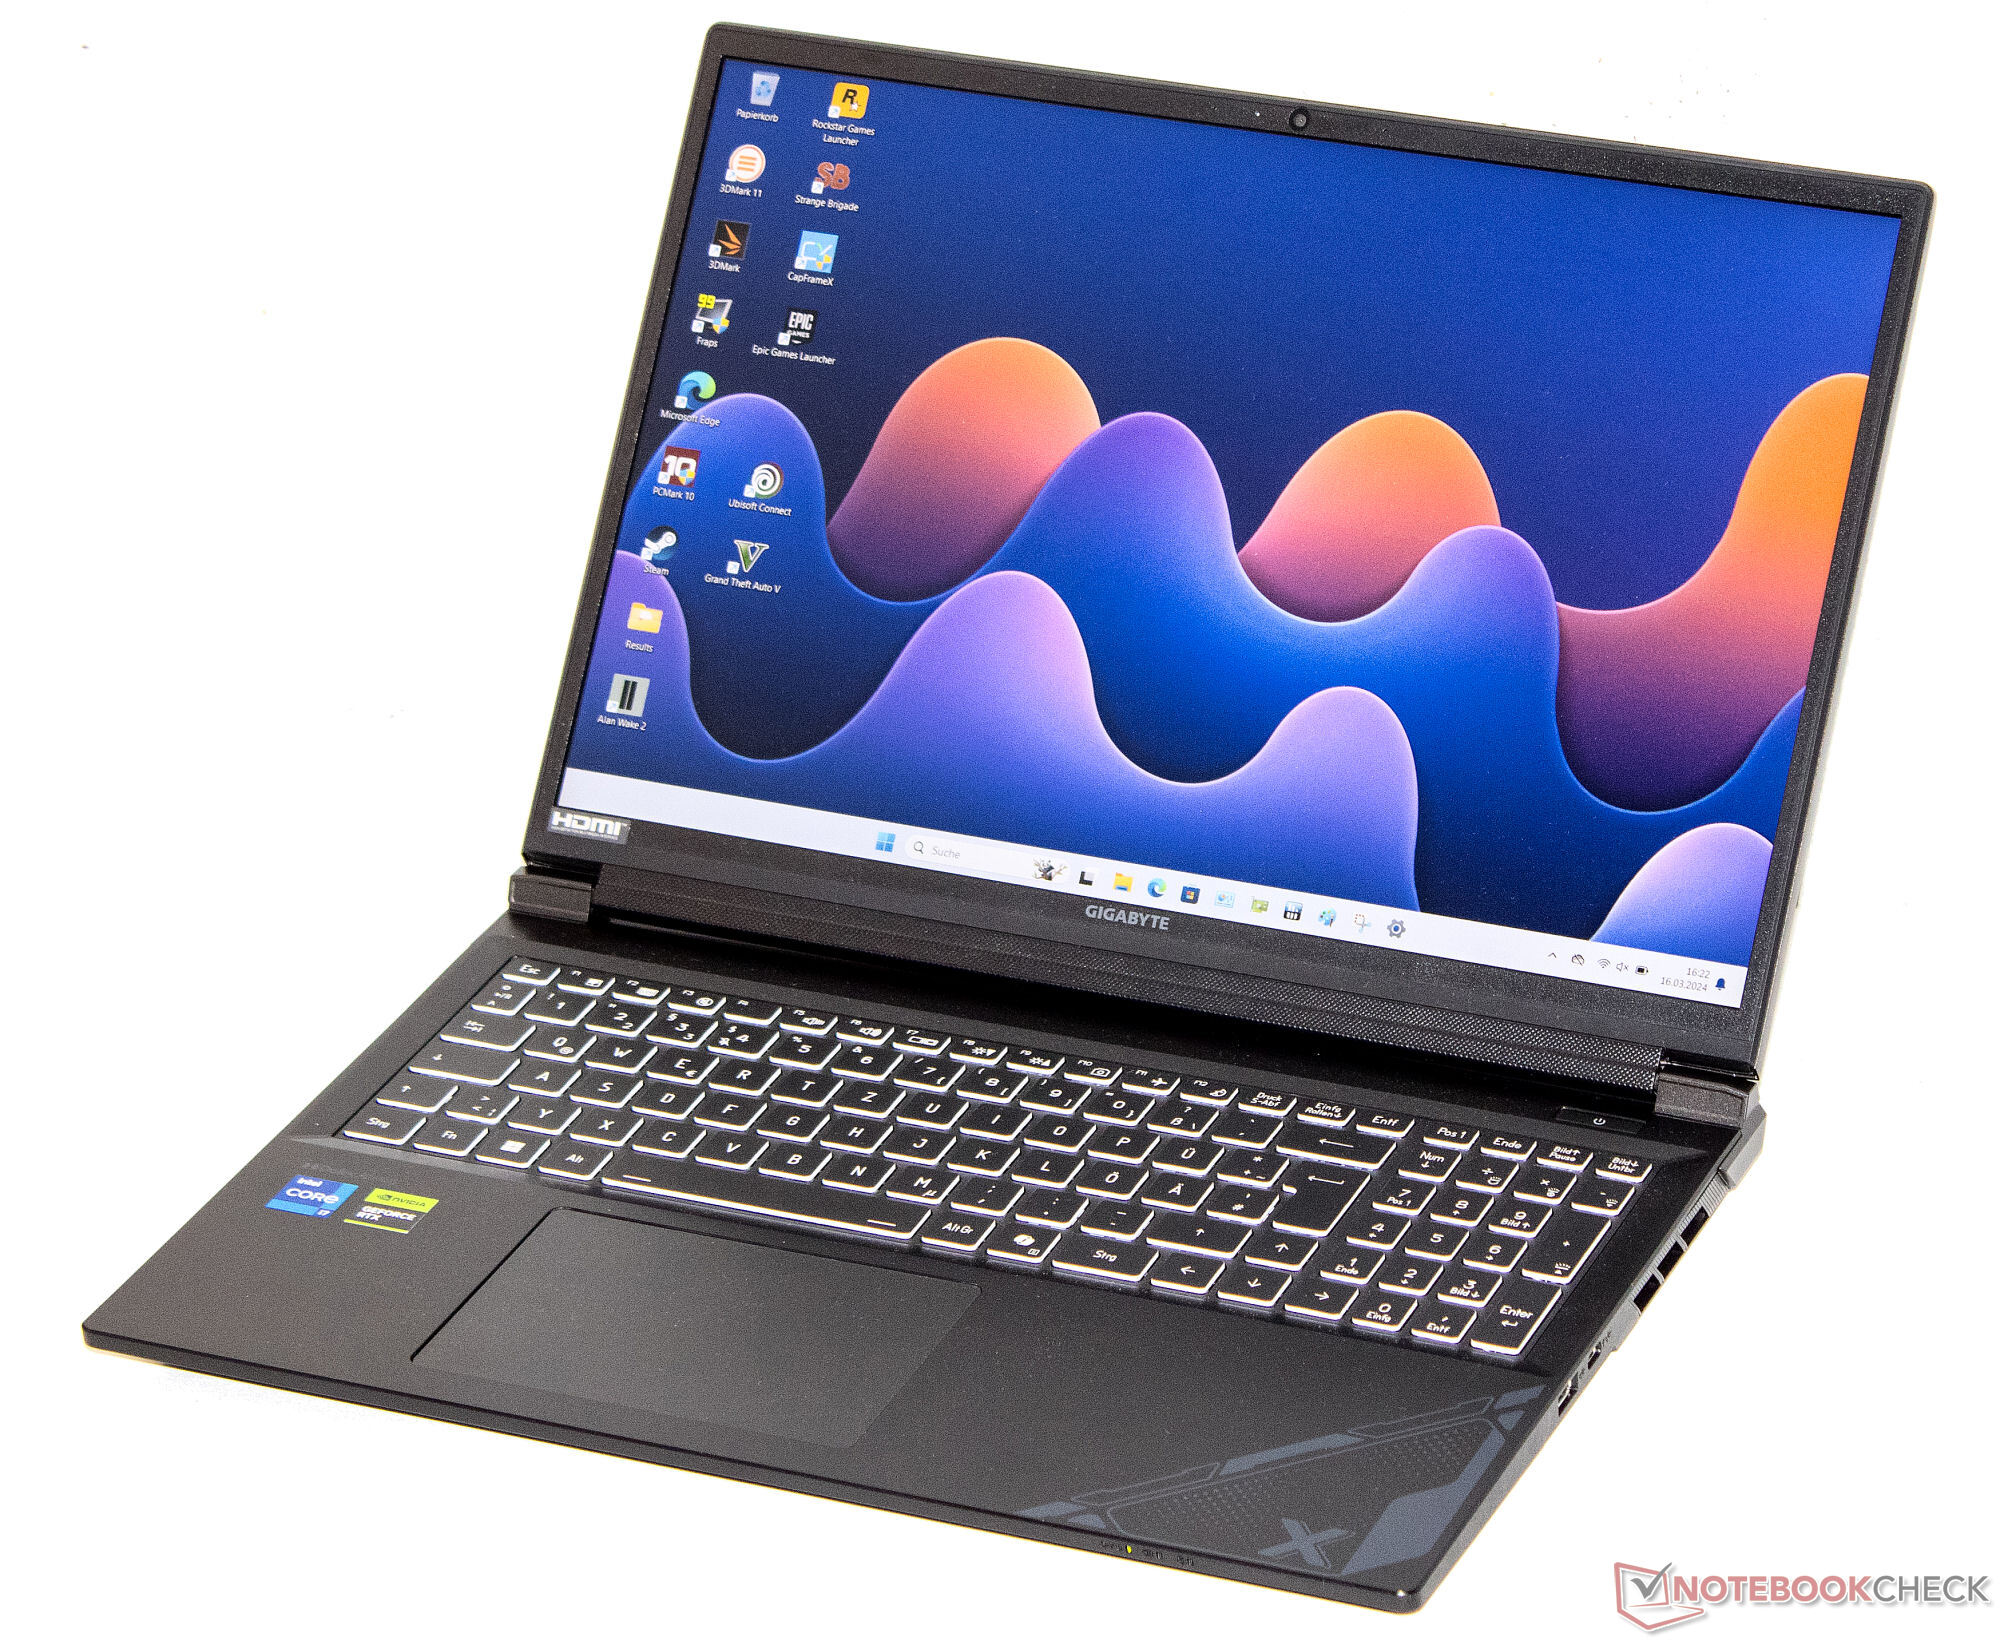
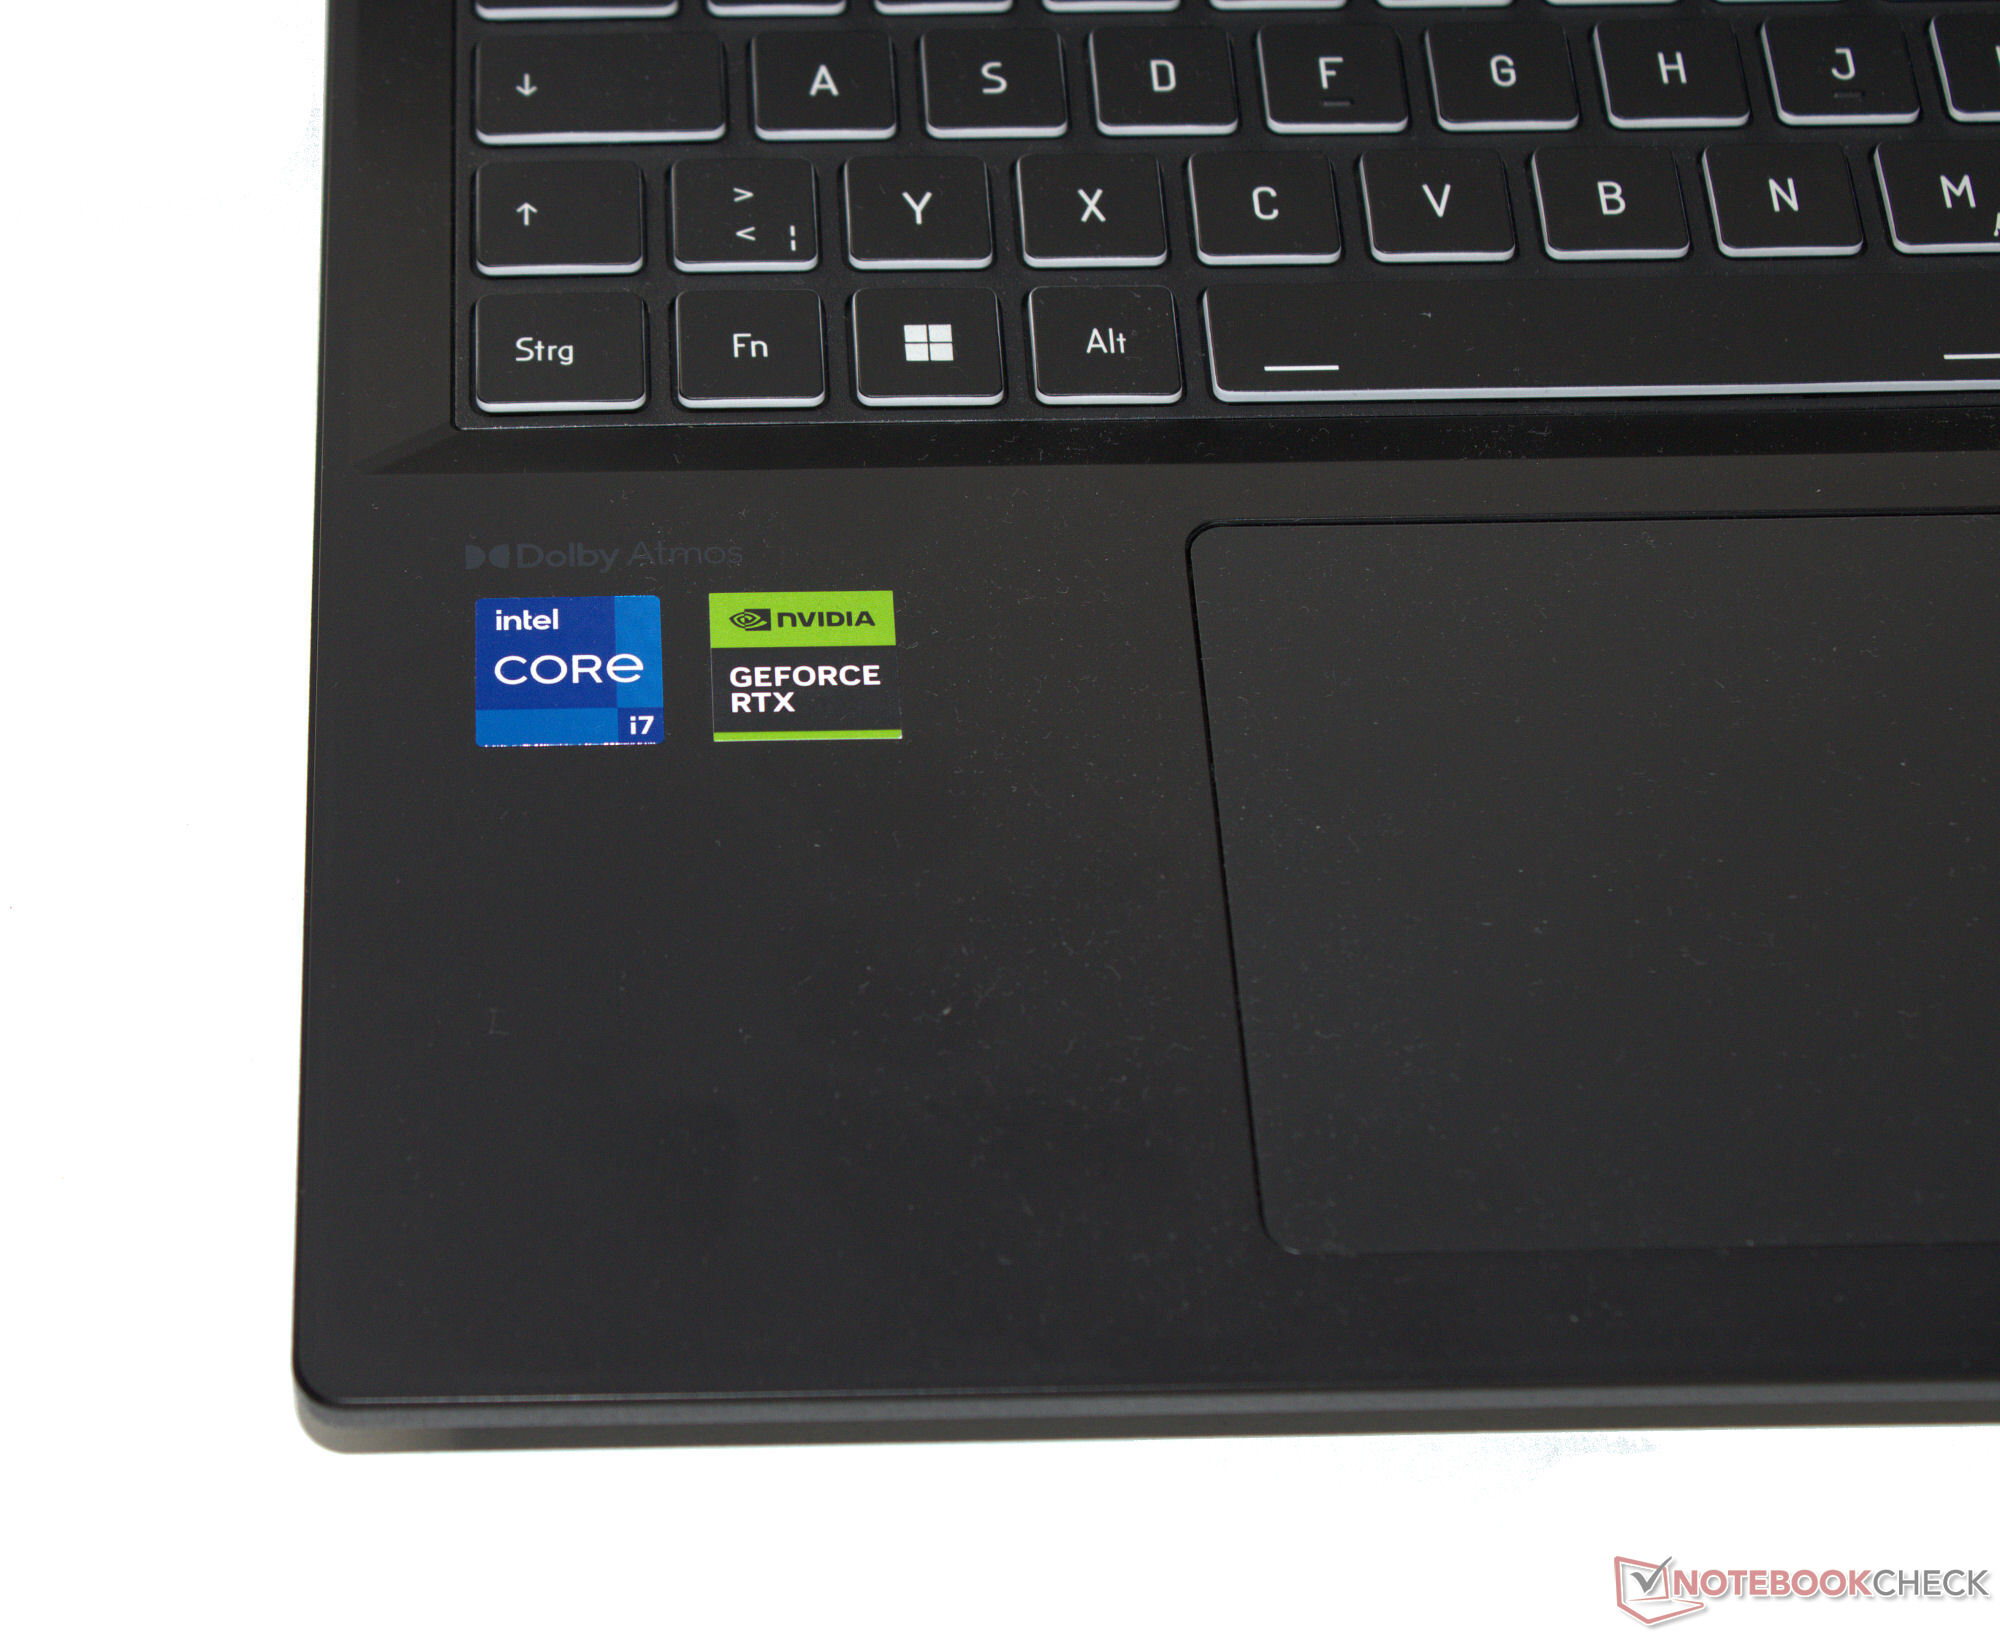
O Gigabyte G6X 9KG está entre os notebooks para jogos acessíveis com um preço de pouco menos de 1.350 euros. O laptop é equipado com o Intel Core i7-13650HX Raptor Lake-HX e um processador Nvidia GeForce RTX 4060 Ada Lovelace Laptop GPU.
A concorrência inclui laptops como o Dell G16, Lenovo Legion 5 16IRX G9, MSI Raider GE68HX 13VFe Asus TUF Gaming A16 FA617XS.
Possíveis concorrentes em comparação
Avaliação | Data | Modelo | Peso | Altura | Size | Resolução | Preço |
|---|---|---|---|---|---|---|---|
| 83.2 % v7 (old) | 03/2024 | Gigabyte G6X 9KG (2024) i7-13650HX, GeForce RTX 4060 Laptop GPU | 2.6 kg | 25.1 mm | 16.00" | 1920x1200 | |
| 85.5 % v7 (old) | 02/2024 | Dell G16, i7-13650HX, RTX 4060 i7-13650HX, GeForce RTX 4060 Laptop GPU | 2.8 kg | 25.65 mm | 16.00" | 2560x1600 | |
| 89.1 % v7 (old) | 02/2024 | Lenovo Legion 5 16IRX G9 i7-14650HX, GeForce RTX 4060 Laptop GPU | 2.4 kg | 25.2 mm | 16.00" | 2560x1600 | |
| 86.9 % v7 (old) | 10/2023 | MSI Raider GE68HX 13VF i9-13950HX, GeForce RTX 4060 Laptop GPU | 2.7 kg | 27.9 mm | 16.00" | 1900x1200 | |
| 86.9 % v7 (old) | 06/2023 | Asus TUF Gaming A16 FA617XS R9 7940HS, Radeon RX 7600S | 2.2 kg | 22.1 mm | 16.00" | 1920x1200 |
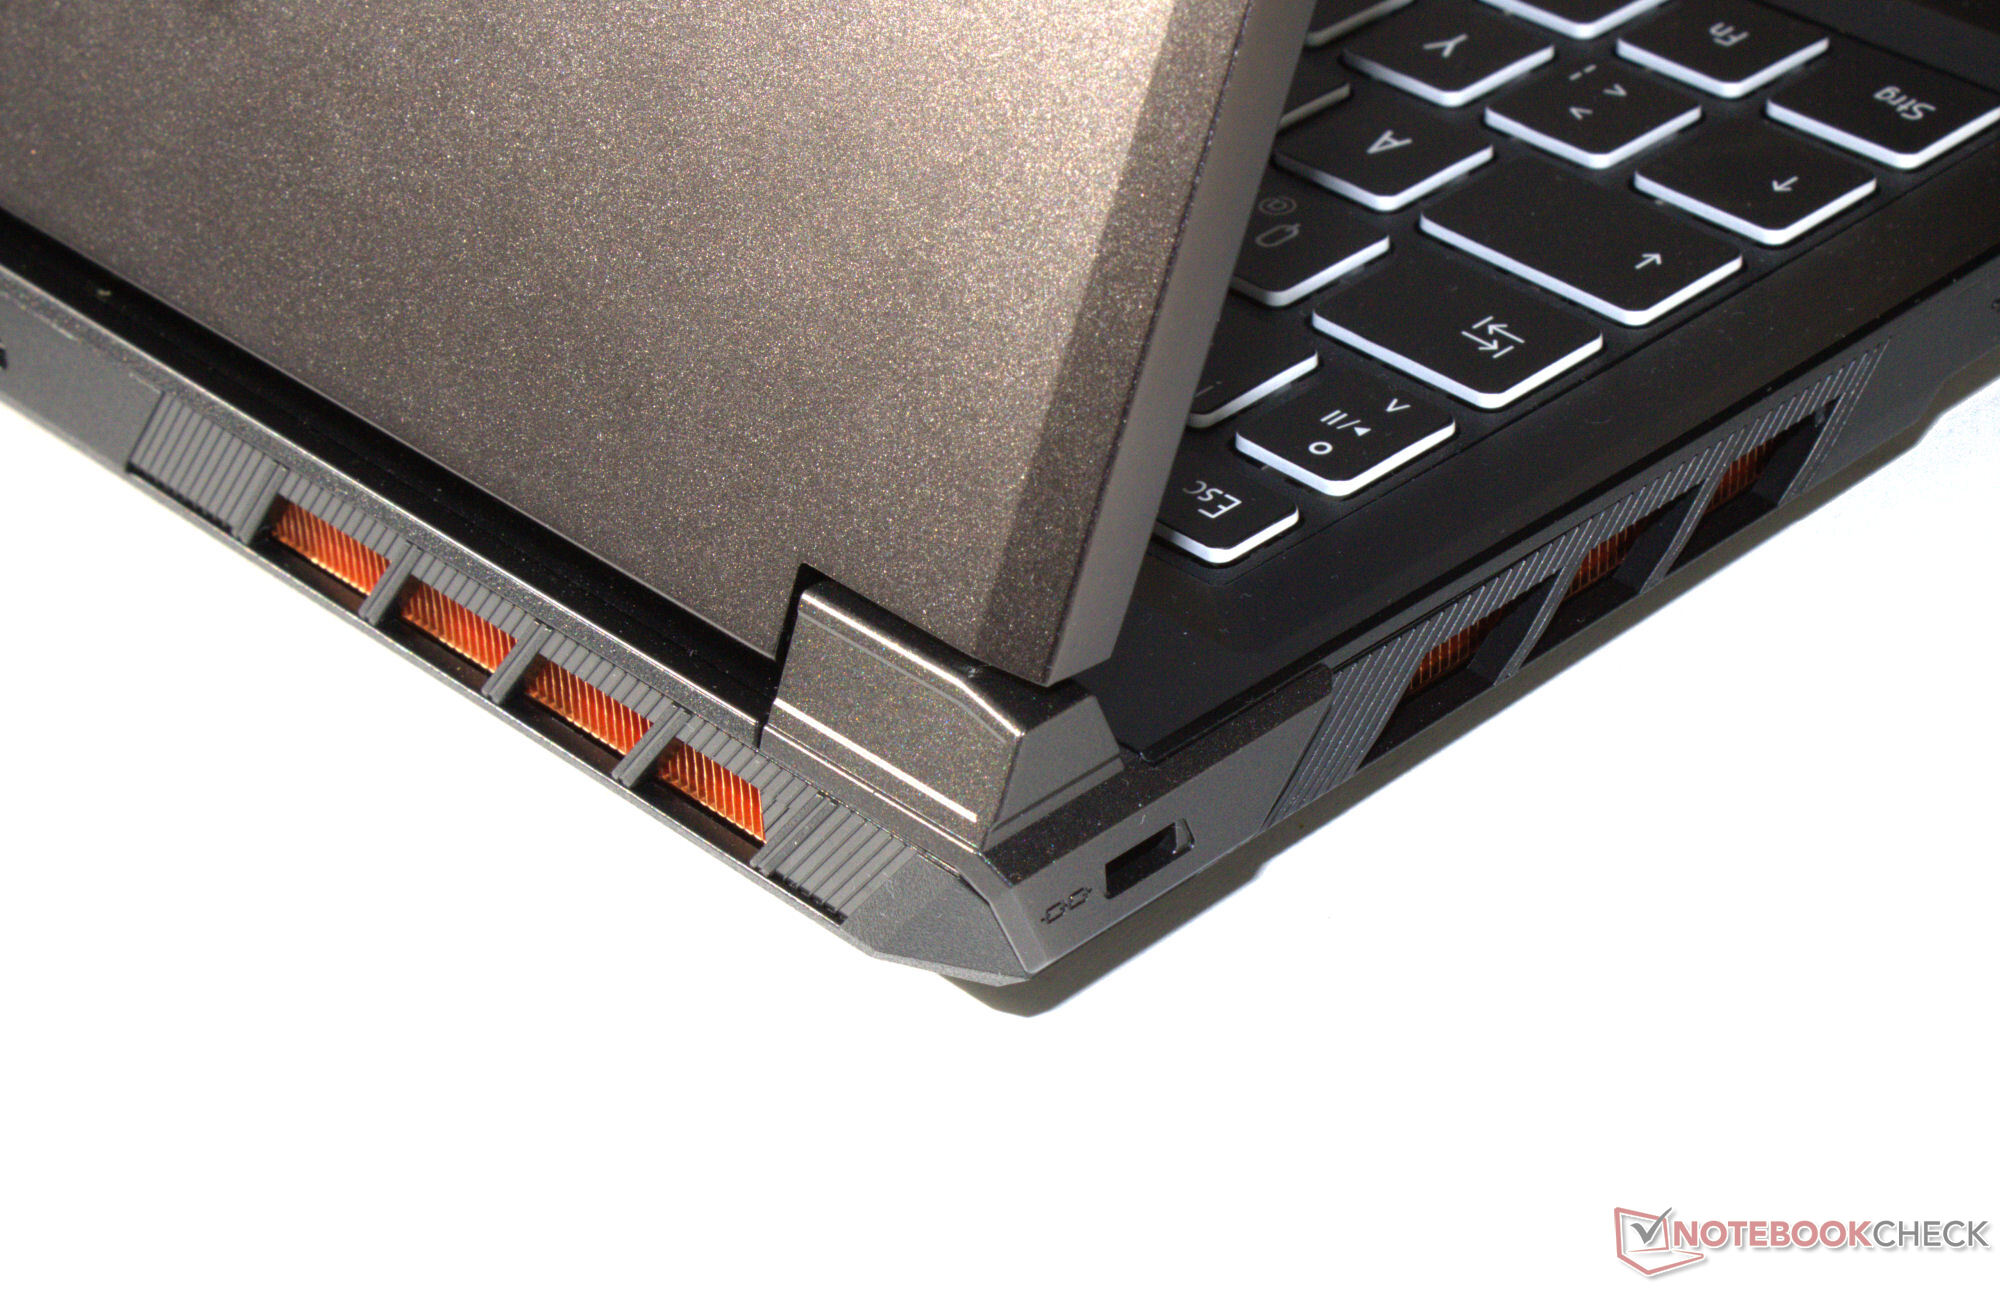
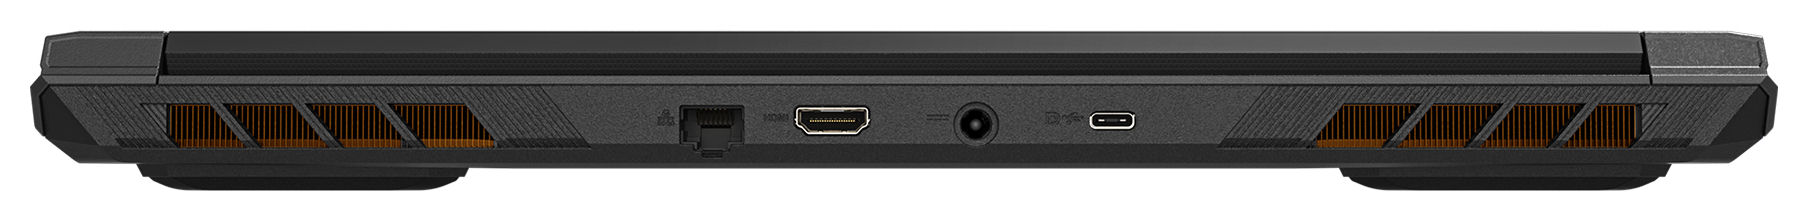
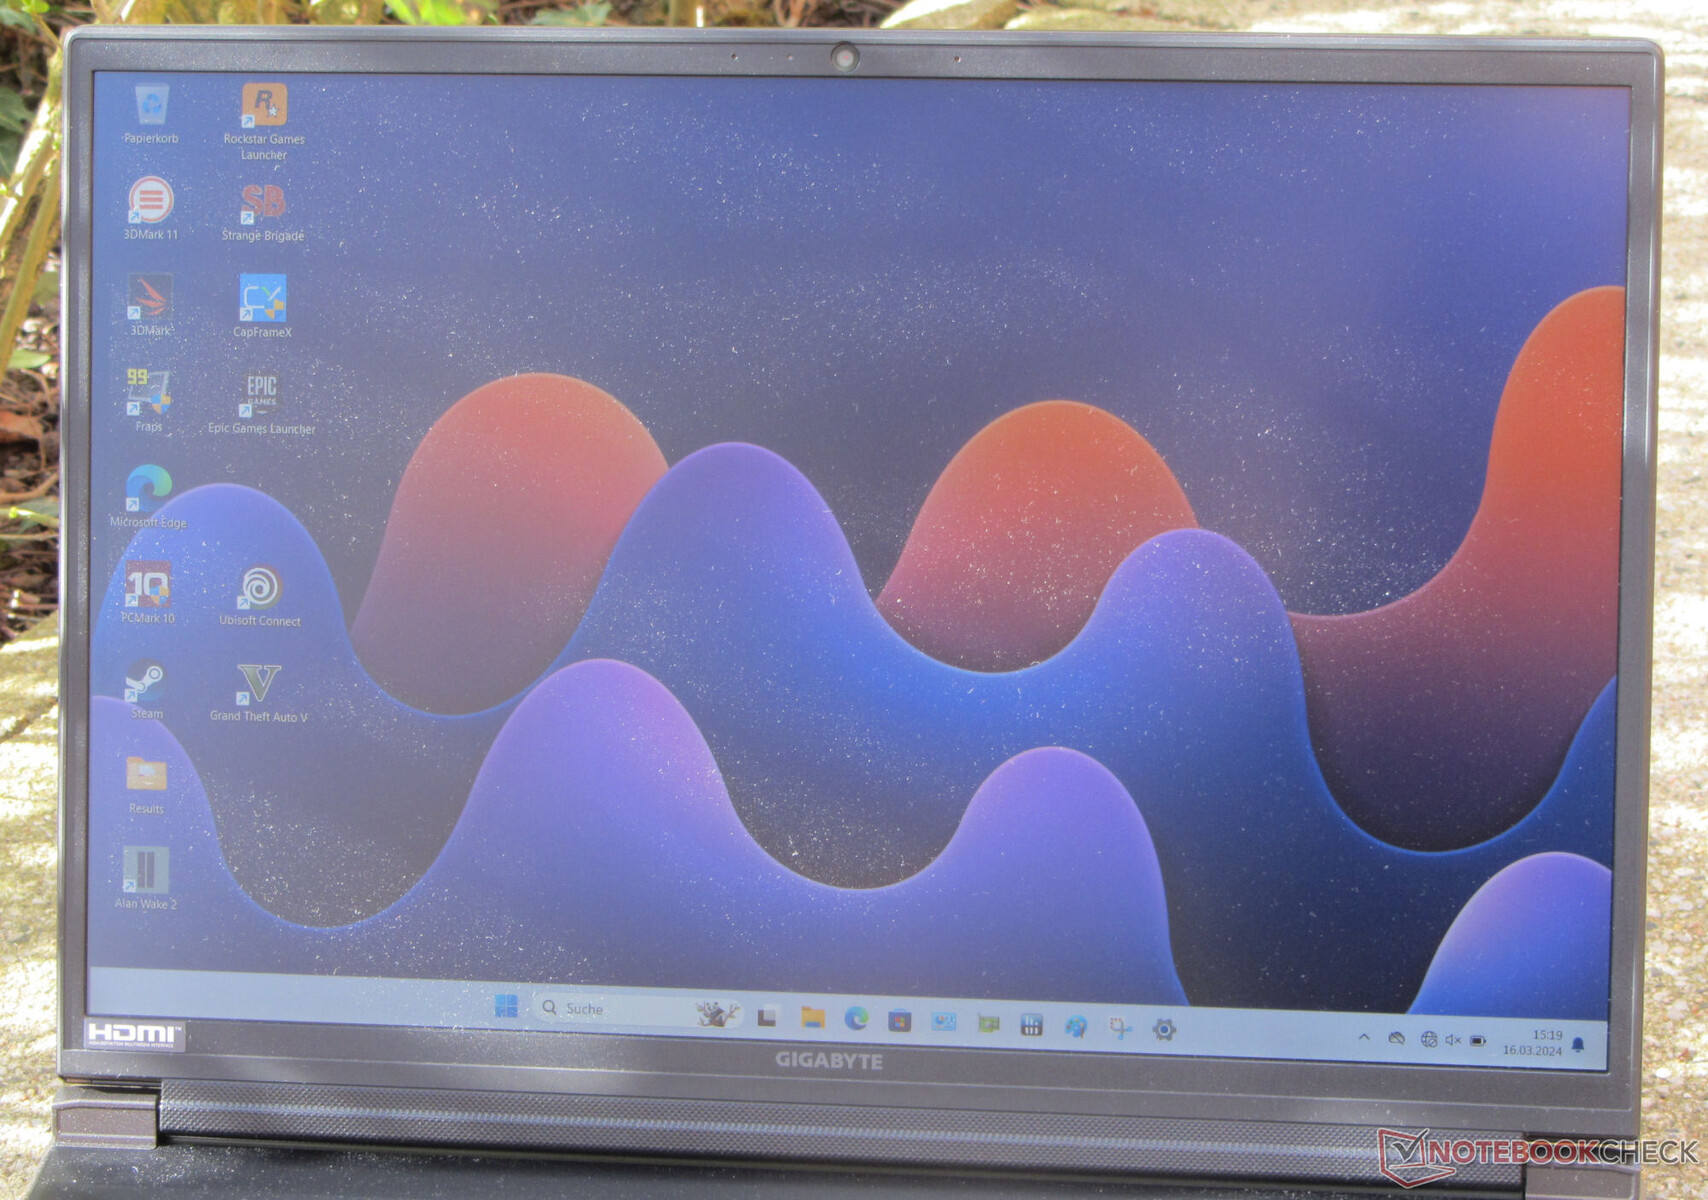
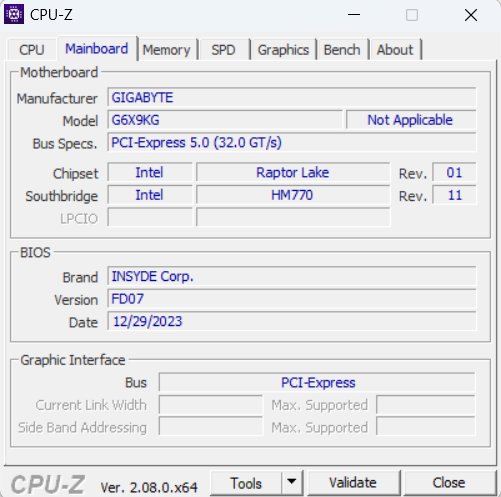
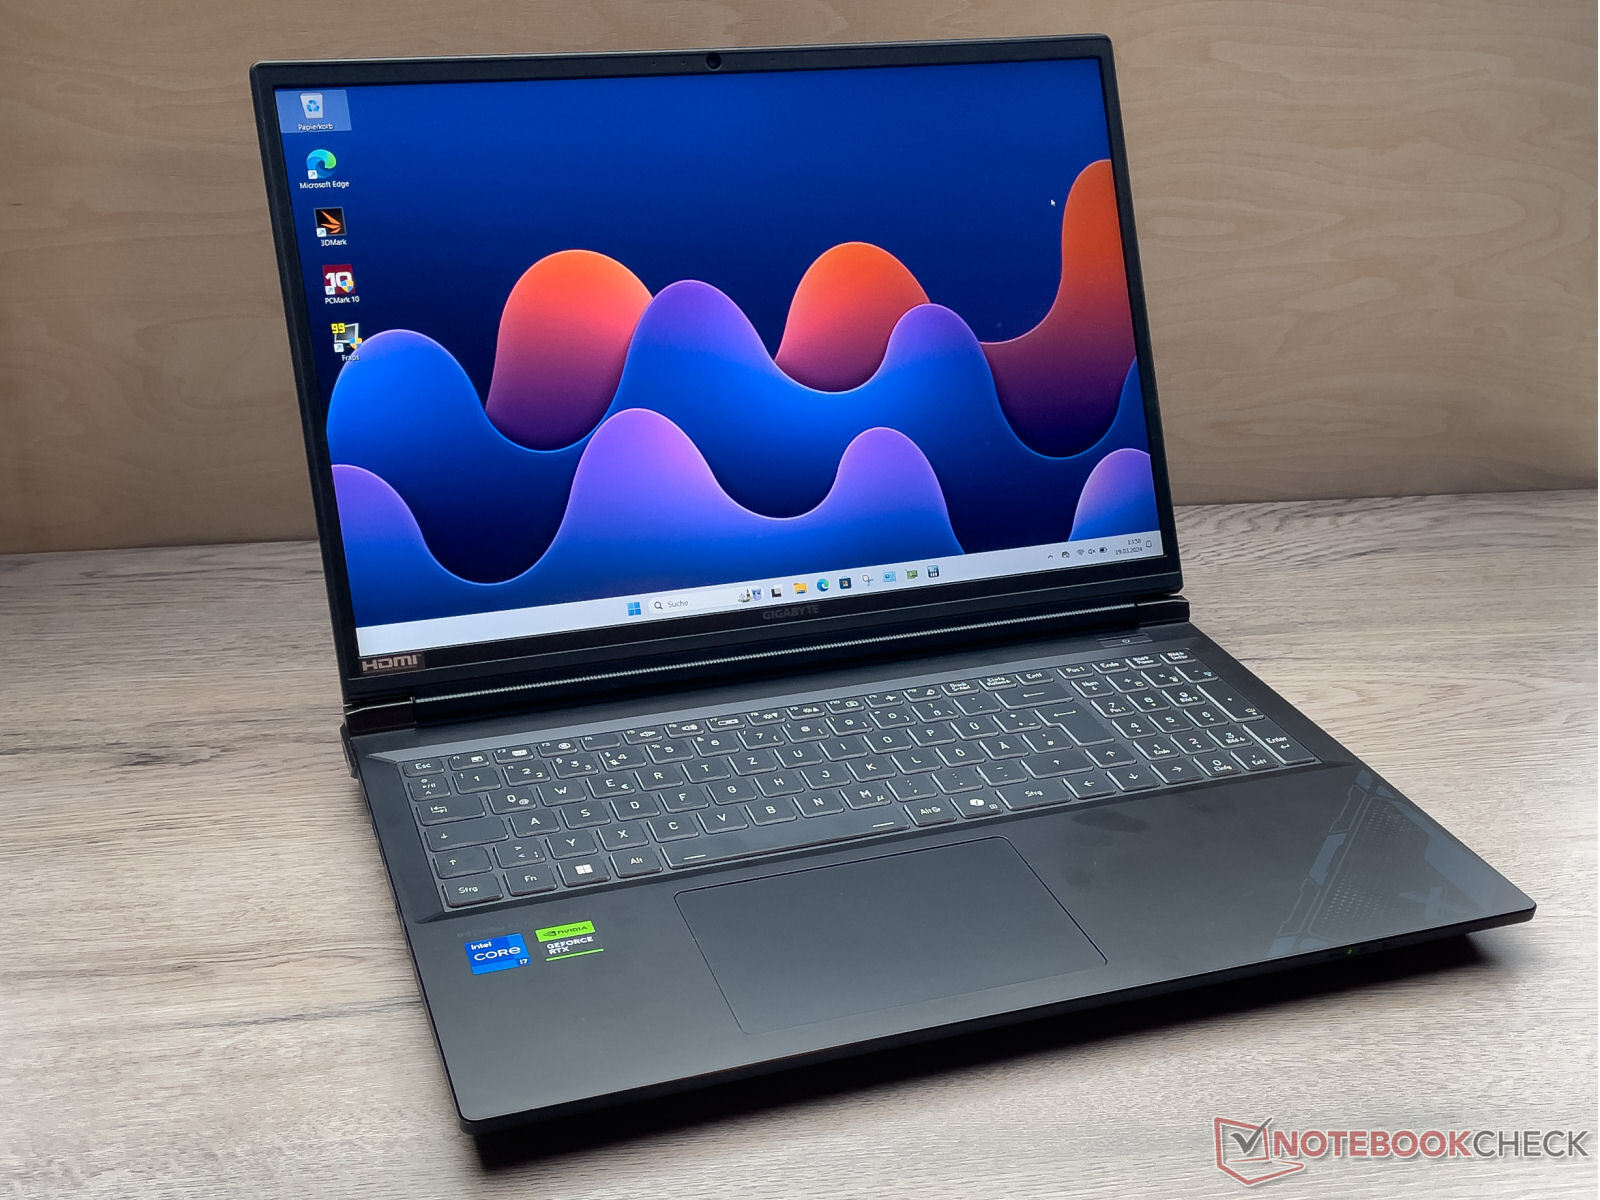
Gabinete e recursos: O G6X não possui Thunderbolt 4
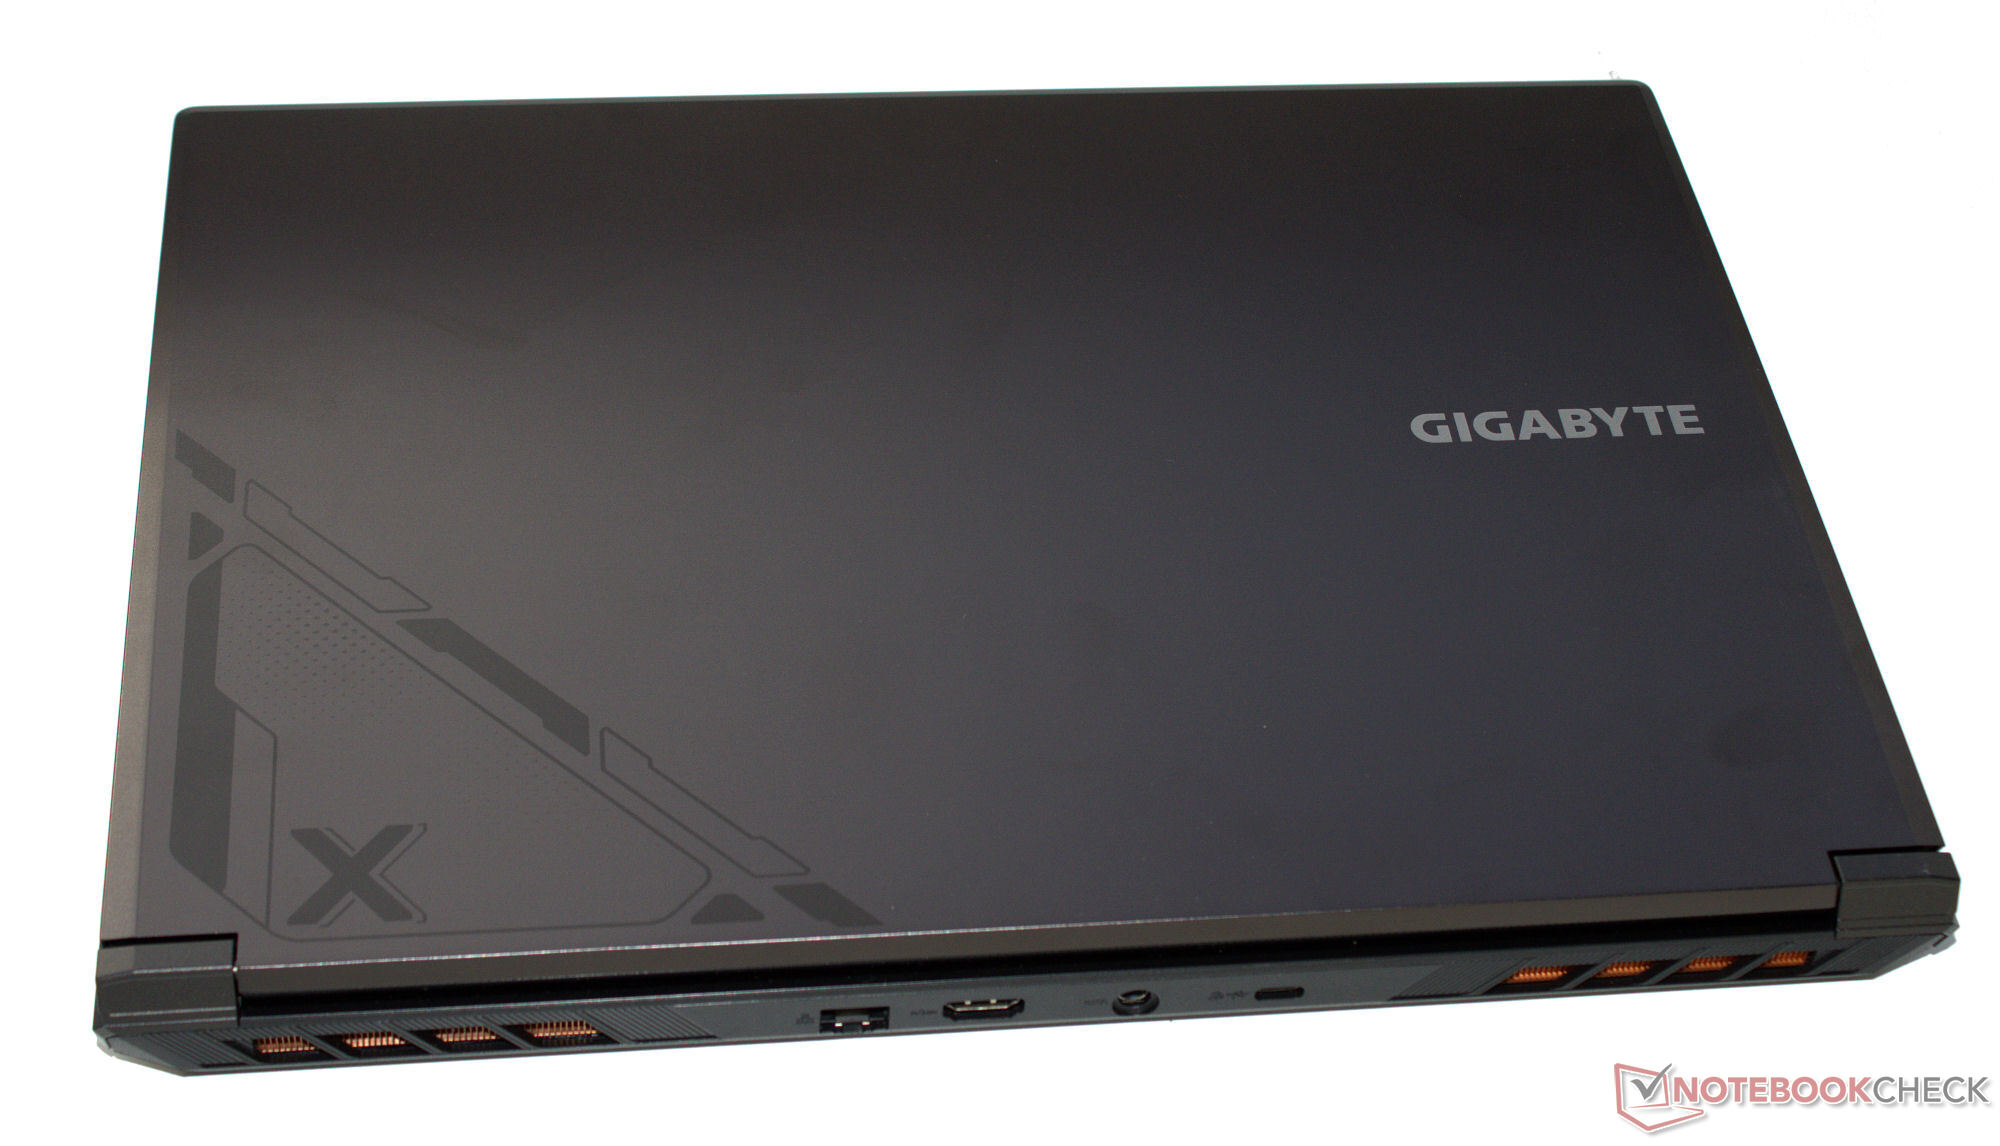
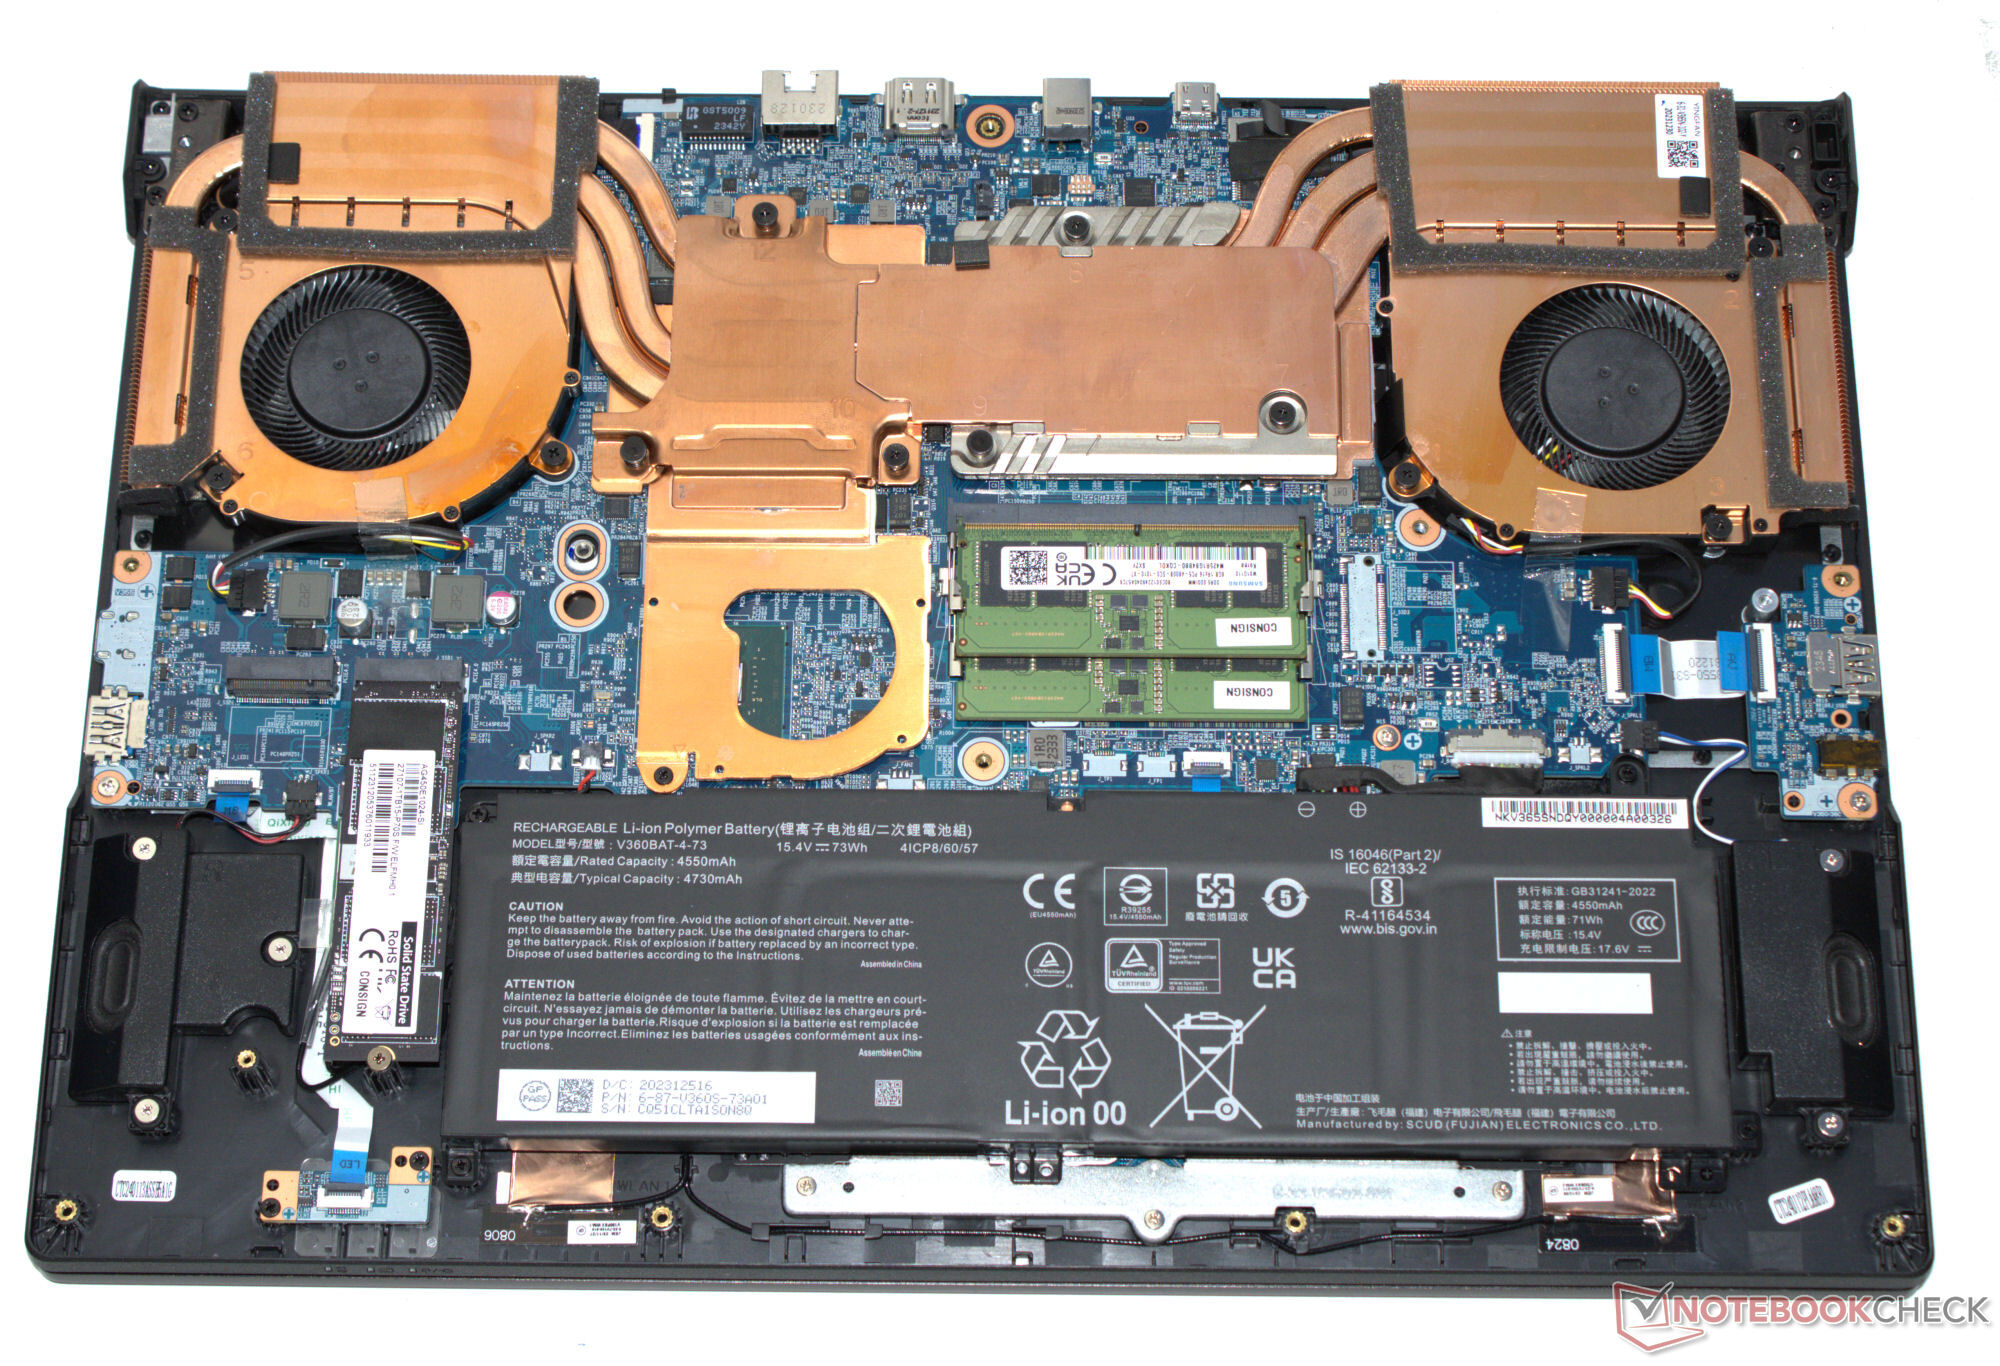
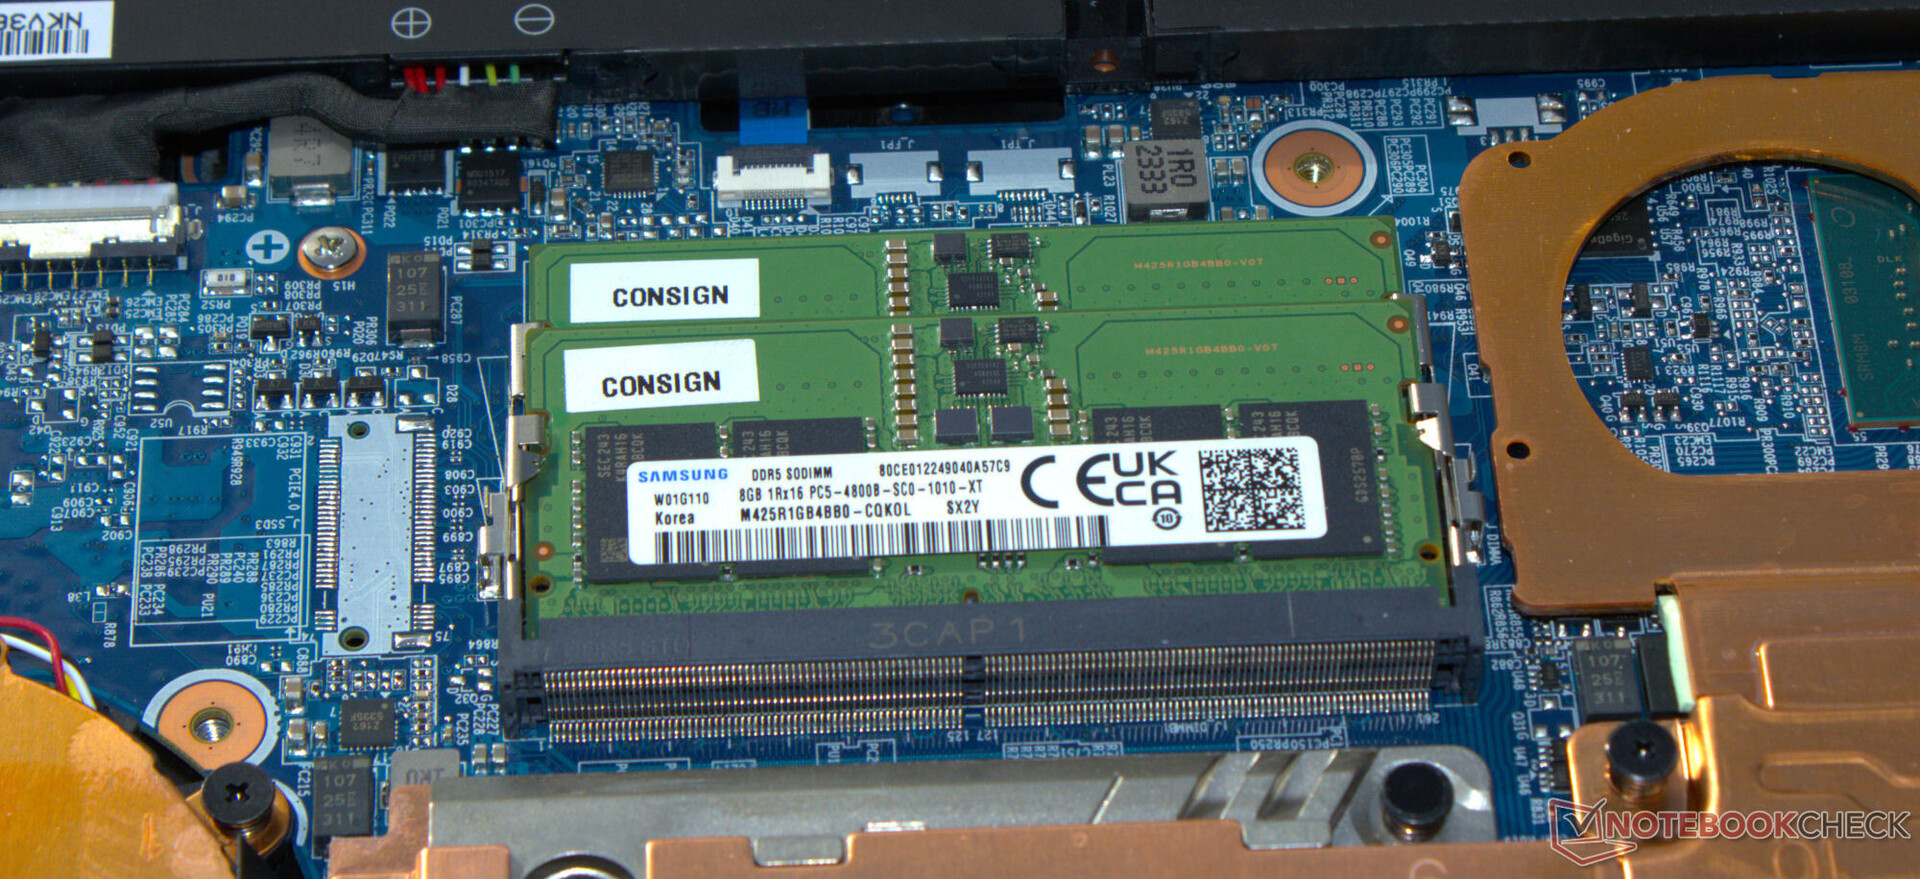
A unidade de base do chassi cinza fosco ("Gunmetal Grey") do G6X é feita de plástico, enquanto o alumínio é usado na parte traseira da tampa. Não há defeitos de fabricação perceptíveis; a estabilidade e a rigidez parecem boas. A bateria e os outros componentes internos podem ser acessados após a remoção da base.
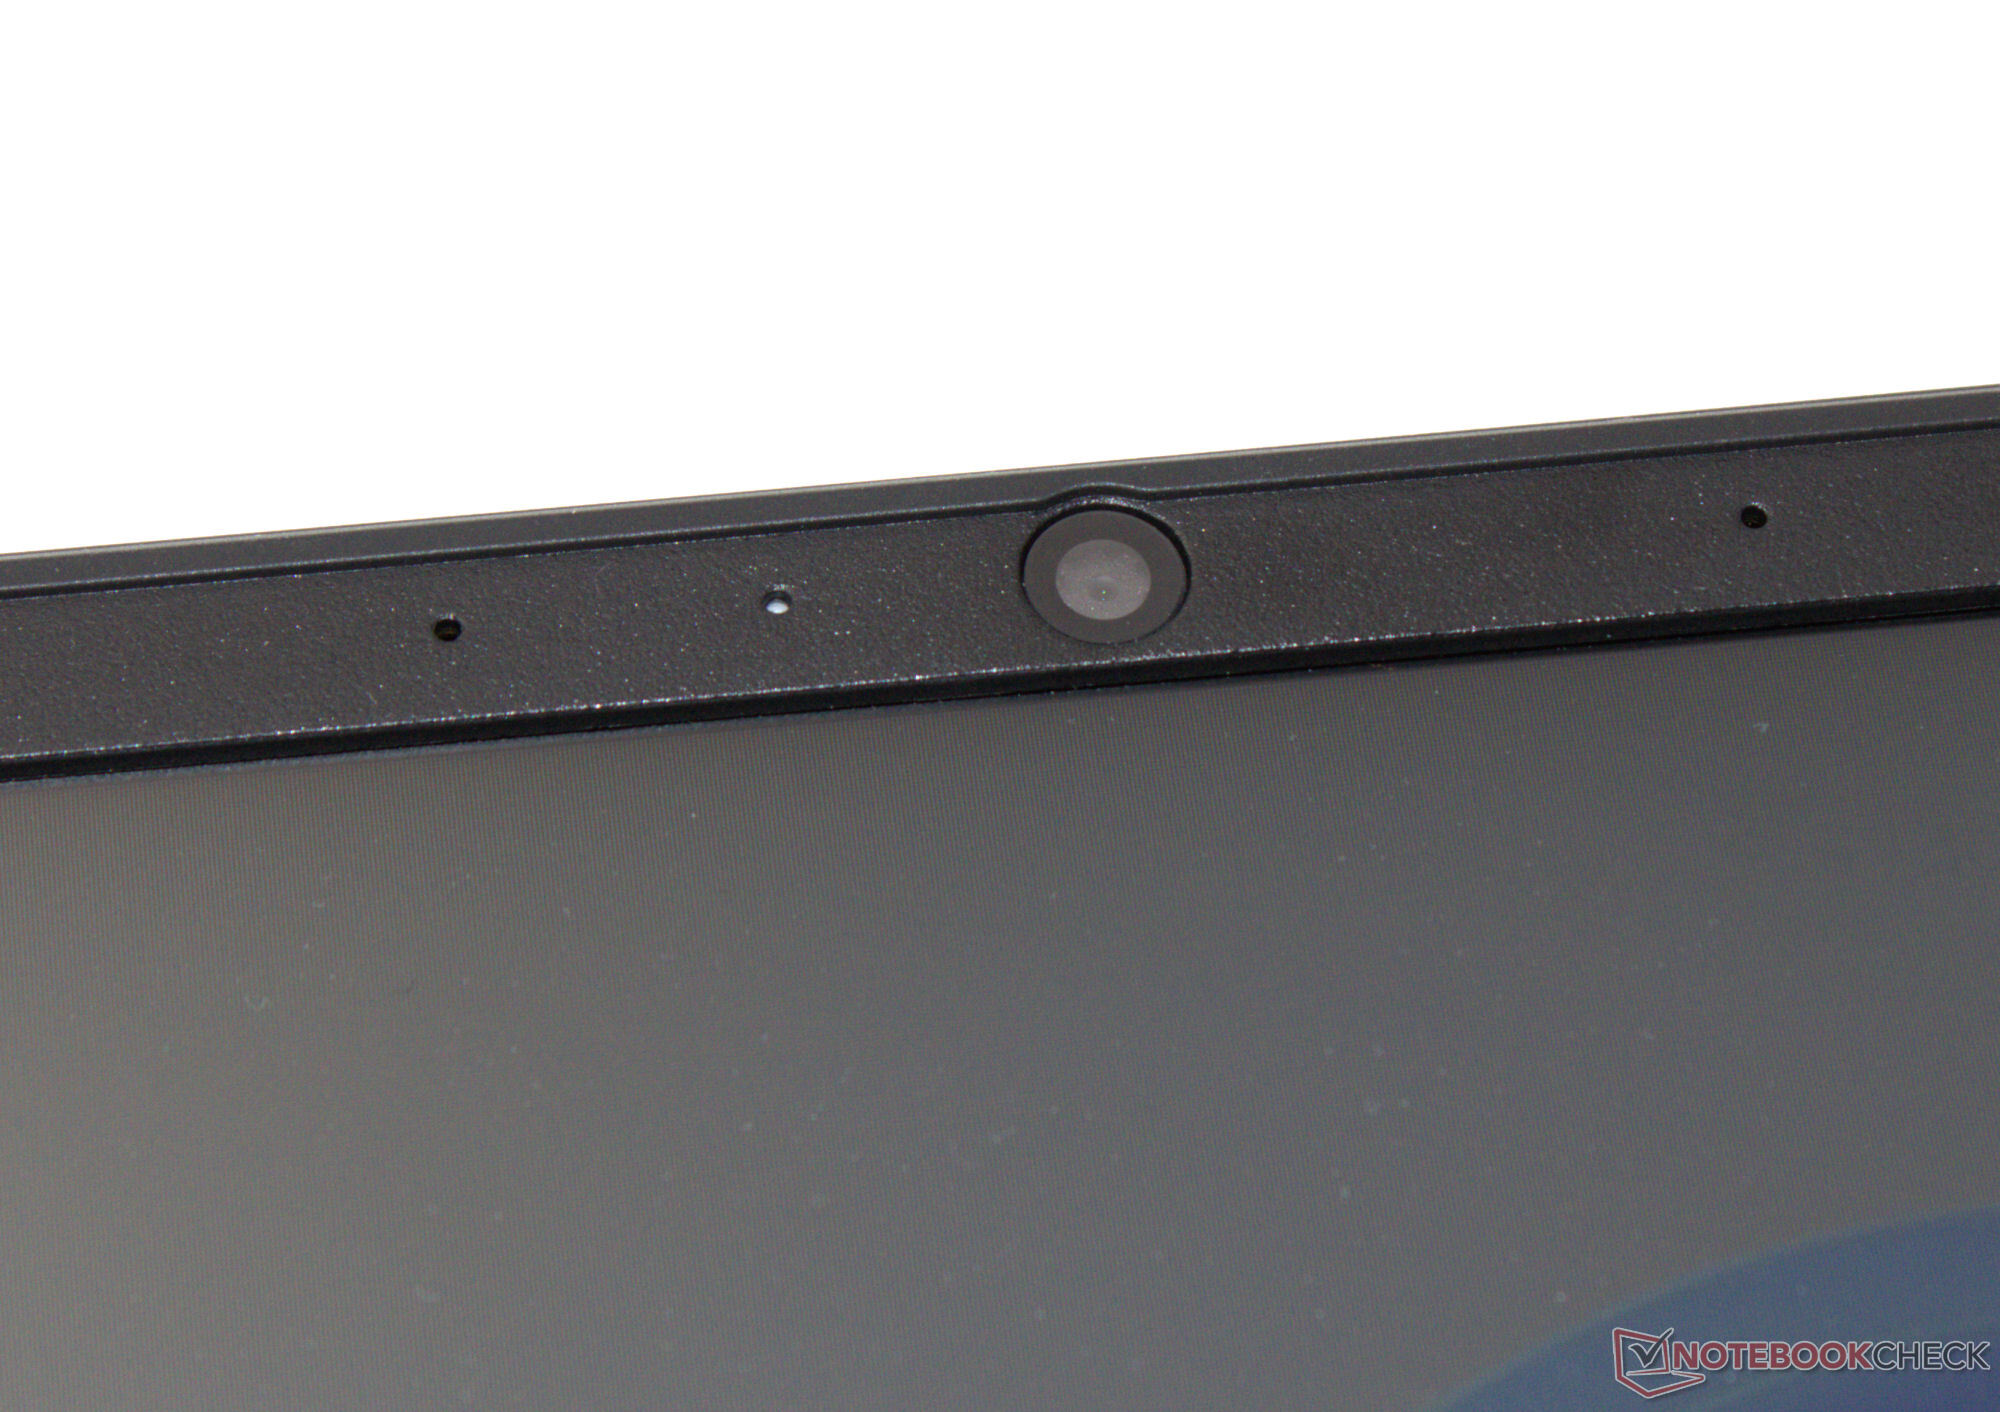
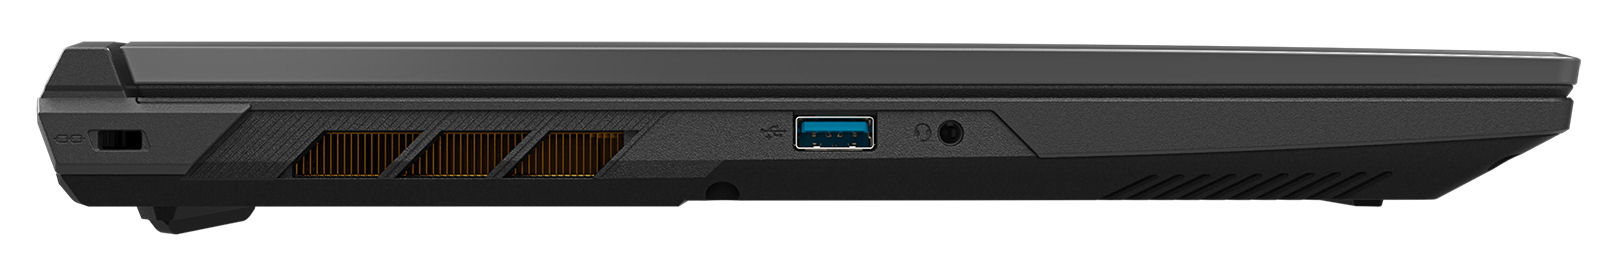
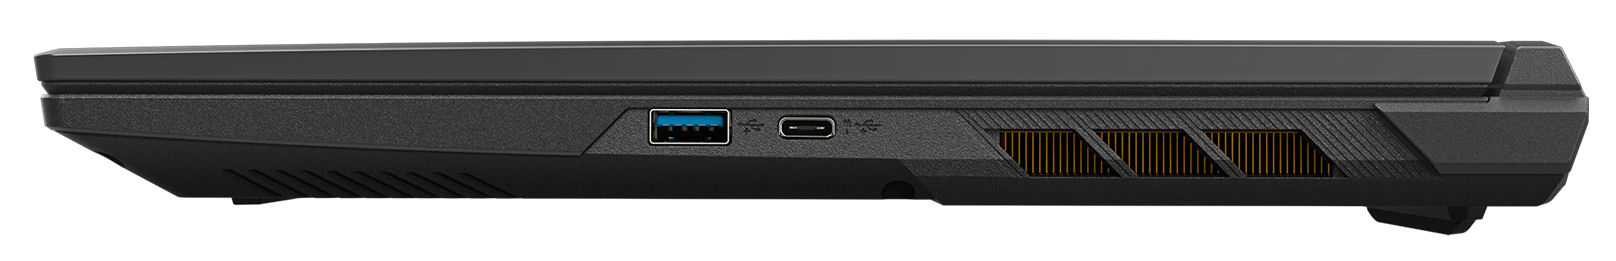
O Gigabyte G6X 9KG tem uma porta USB 3.2 Gen 1 e 1x USB 3.2 Gen 2 Tipo A e duas portas USB 3.2 Gen 2 Tipo C que oferecem individualmente Power Delivery e DisplayPort-out. No total, o G6X tem duas saídas de vídeo (1x HDMI, 1x DP). Não há leitor de cartão de memória. A webcam de 1280 x 720 e 0,9 MP oferece o padrão.
Obtivemos uma excelente taxa de transferência de dados Wi-Fi em condições ideais de teste, em que não há dispositivos Wi-Fi nas proximidades e a uma distância curta de 1 m entre o notebook e o PC servidor. O notebook usa um chip Intel AX211 Wi-Fi 6E. As conexões com fio são gerenciadas por um controlador Realtek RTL8168/8111.

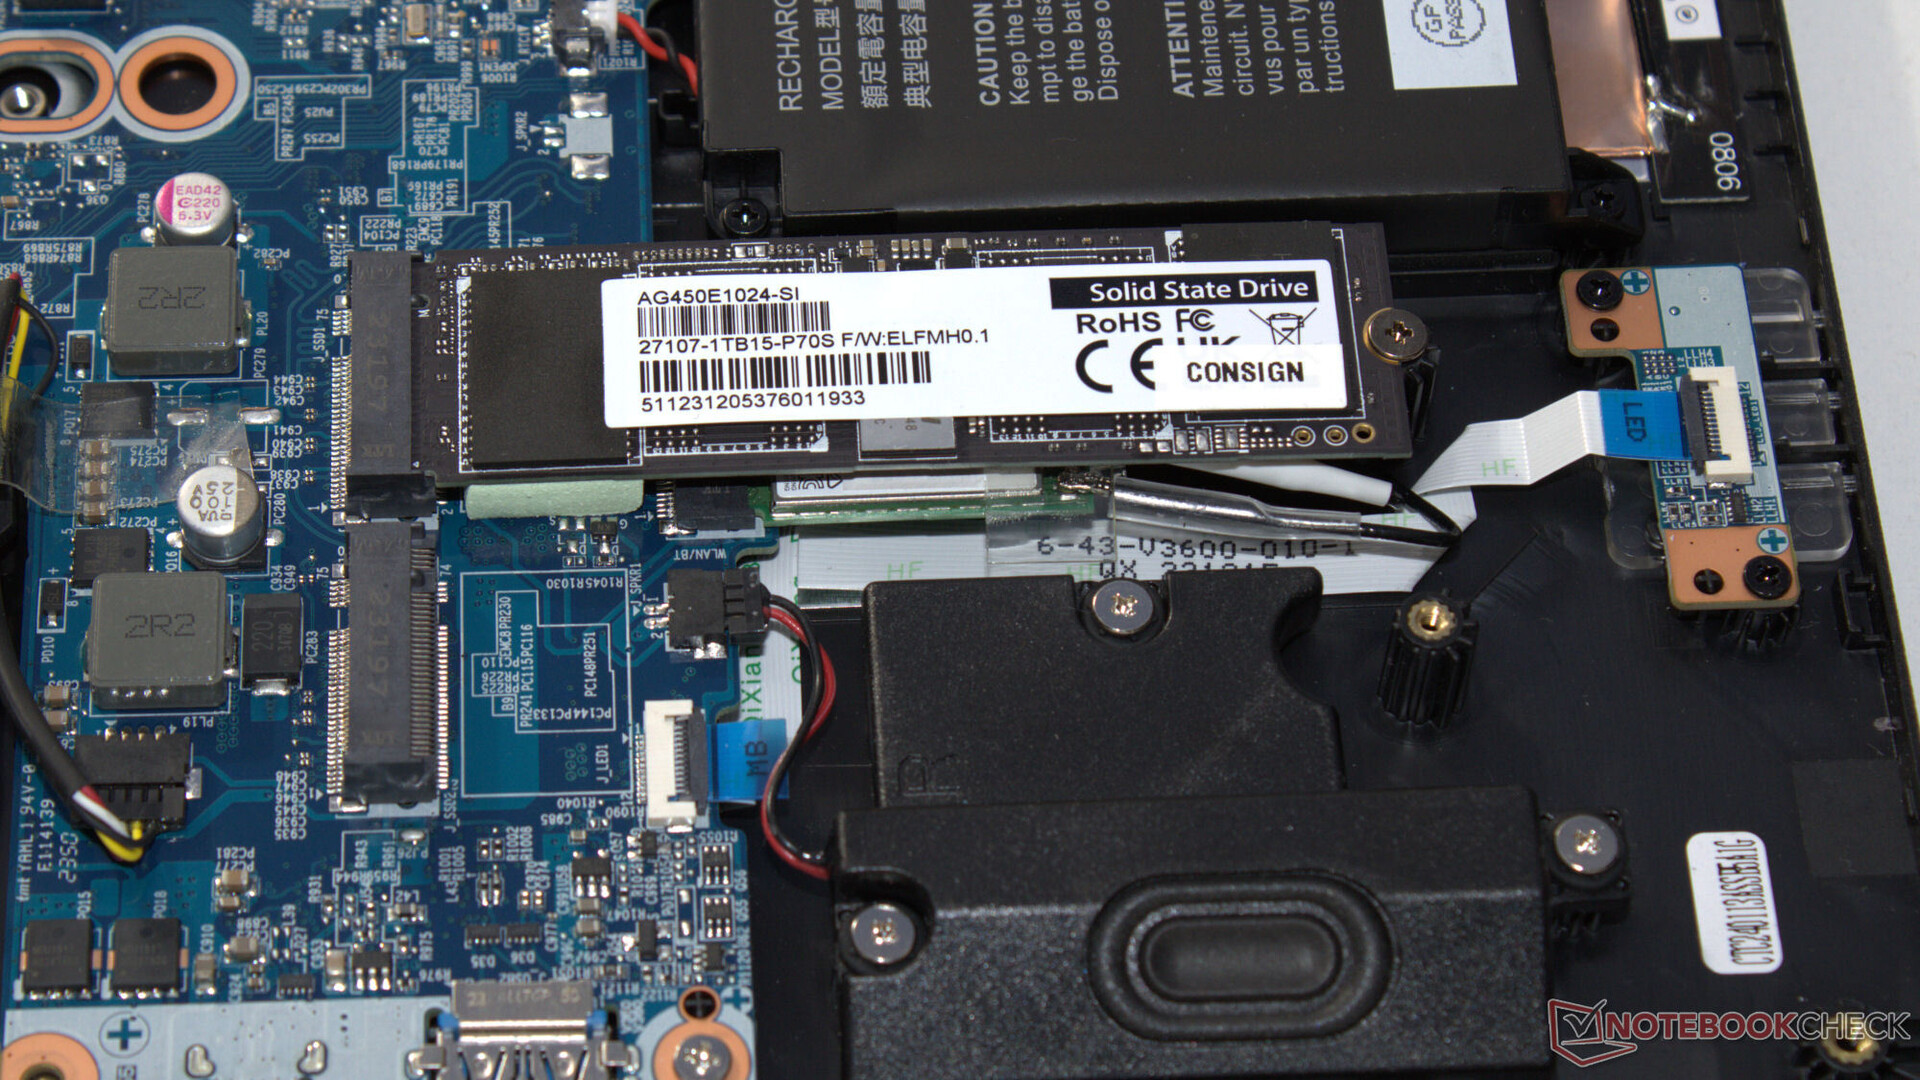
 GeForce RTX 4060 Laptop GPU, i7-13650HX, Gigabyte AG450E1024-SI")
 GeForce RTX 4060 Laptop GPU, i7-13650HX, Gigabyte AG450E1024-SI")
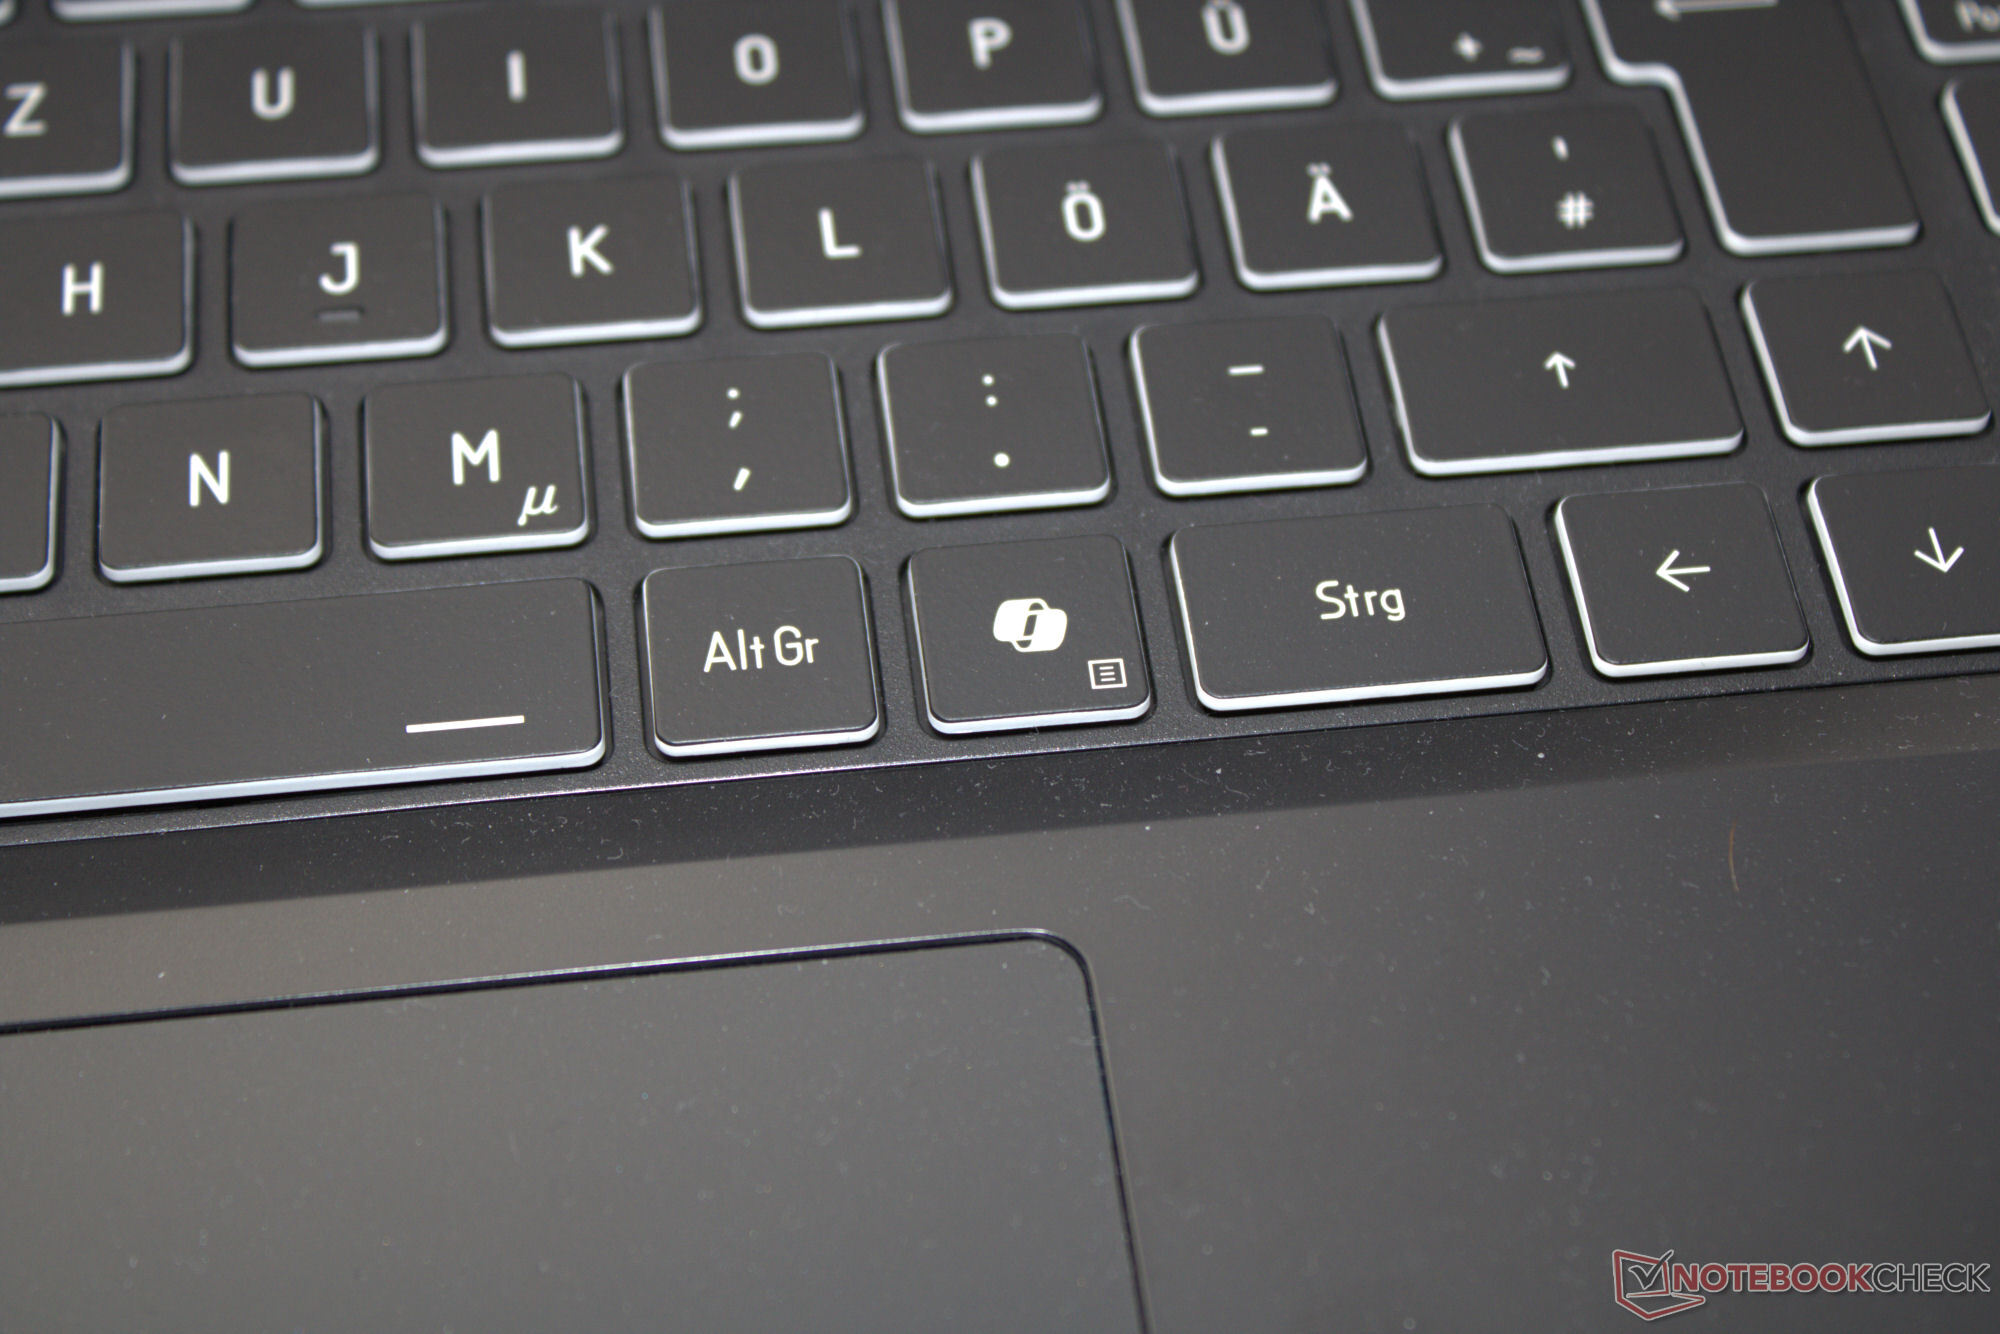
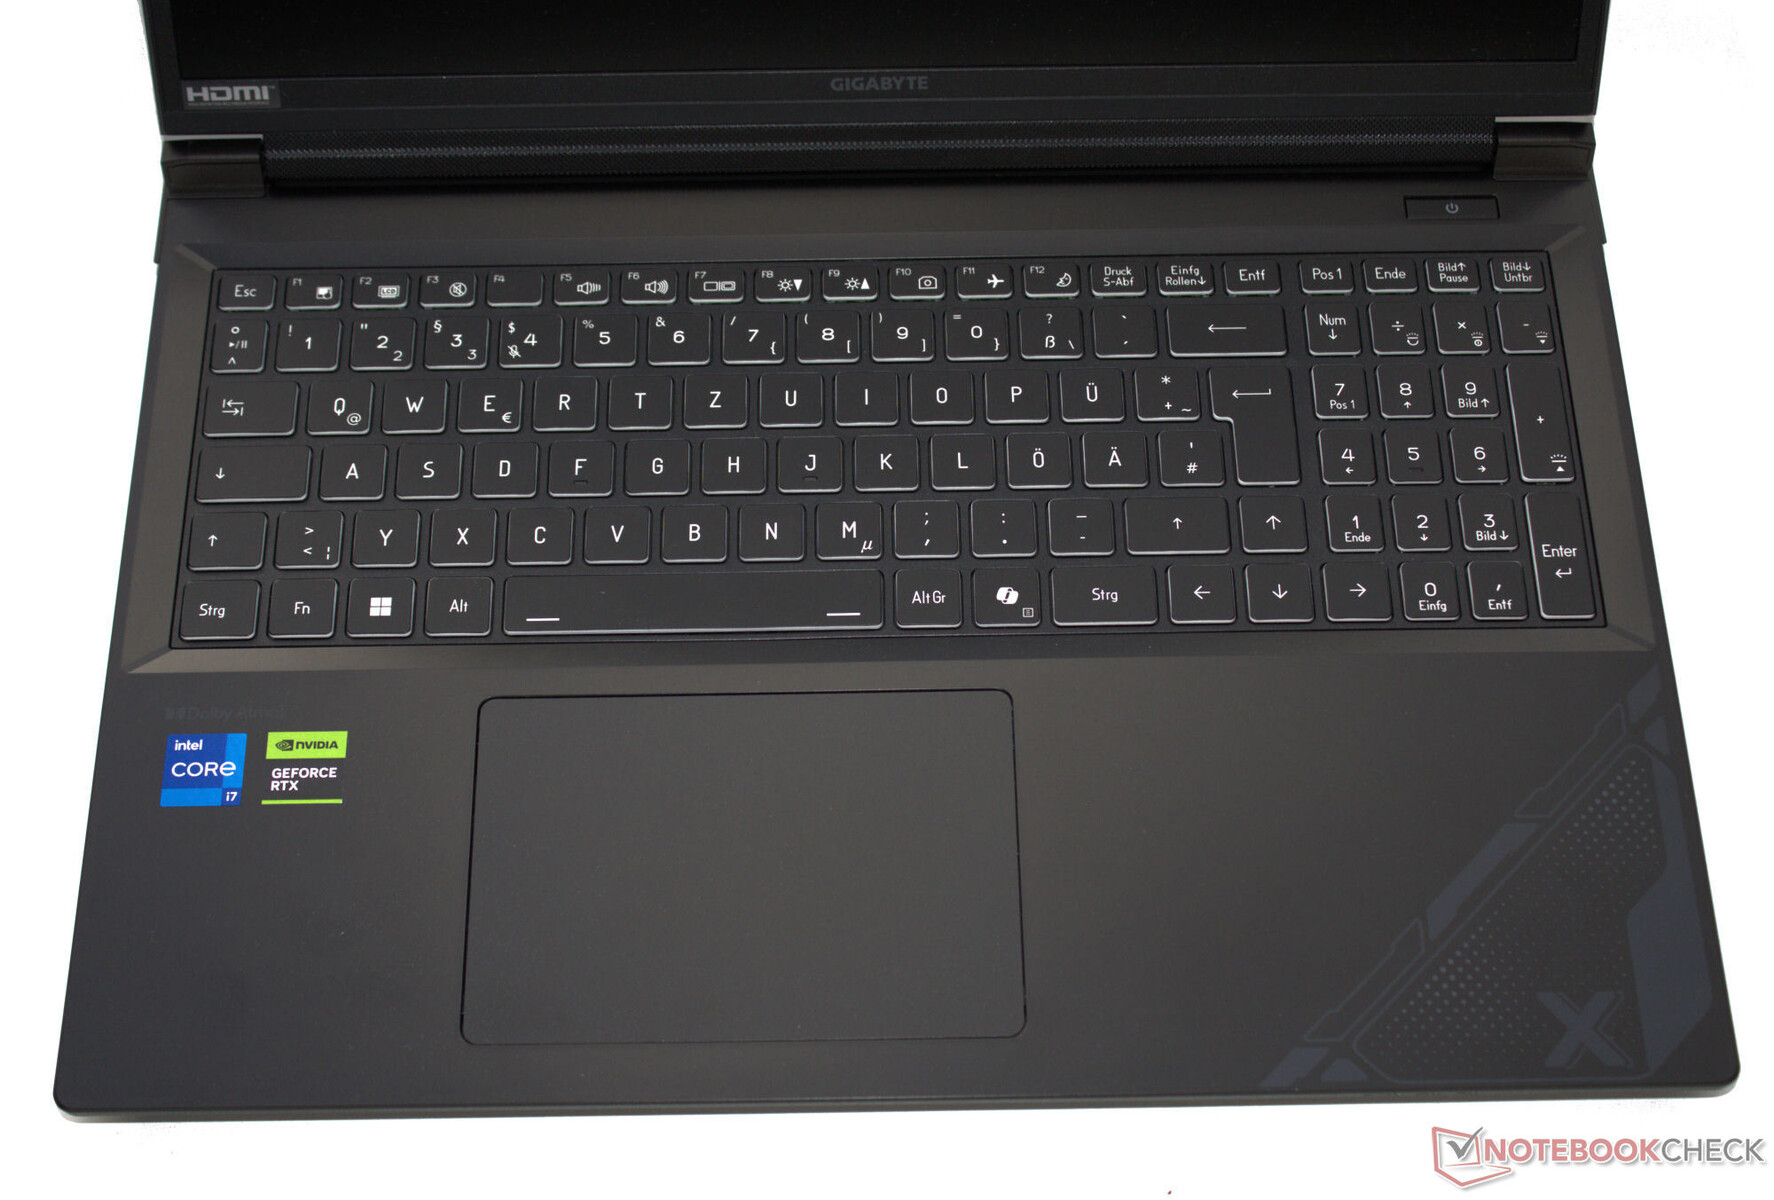
Dispositivos de entrada: Teclado retroiluminado adequado para uso diário
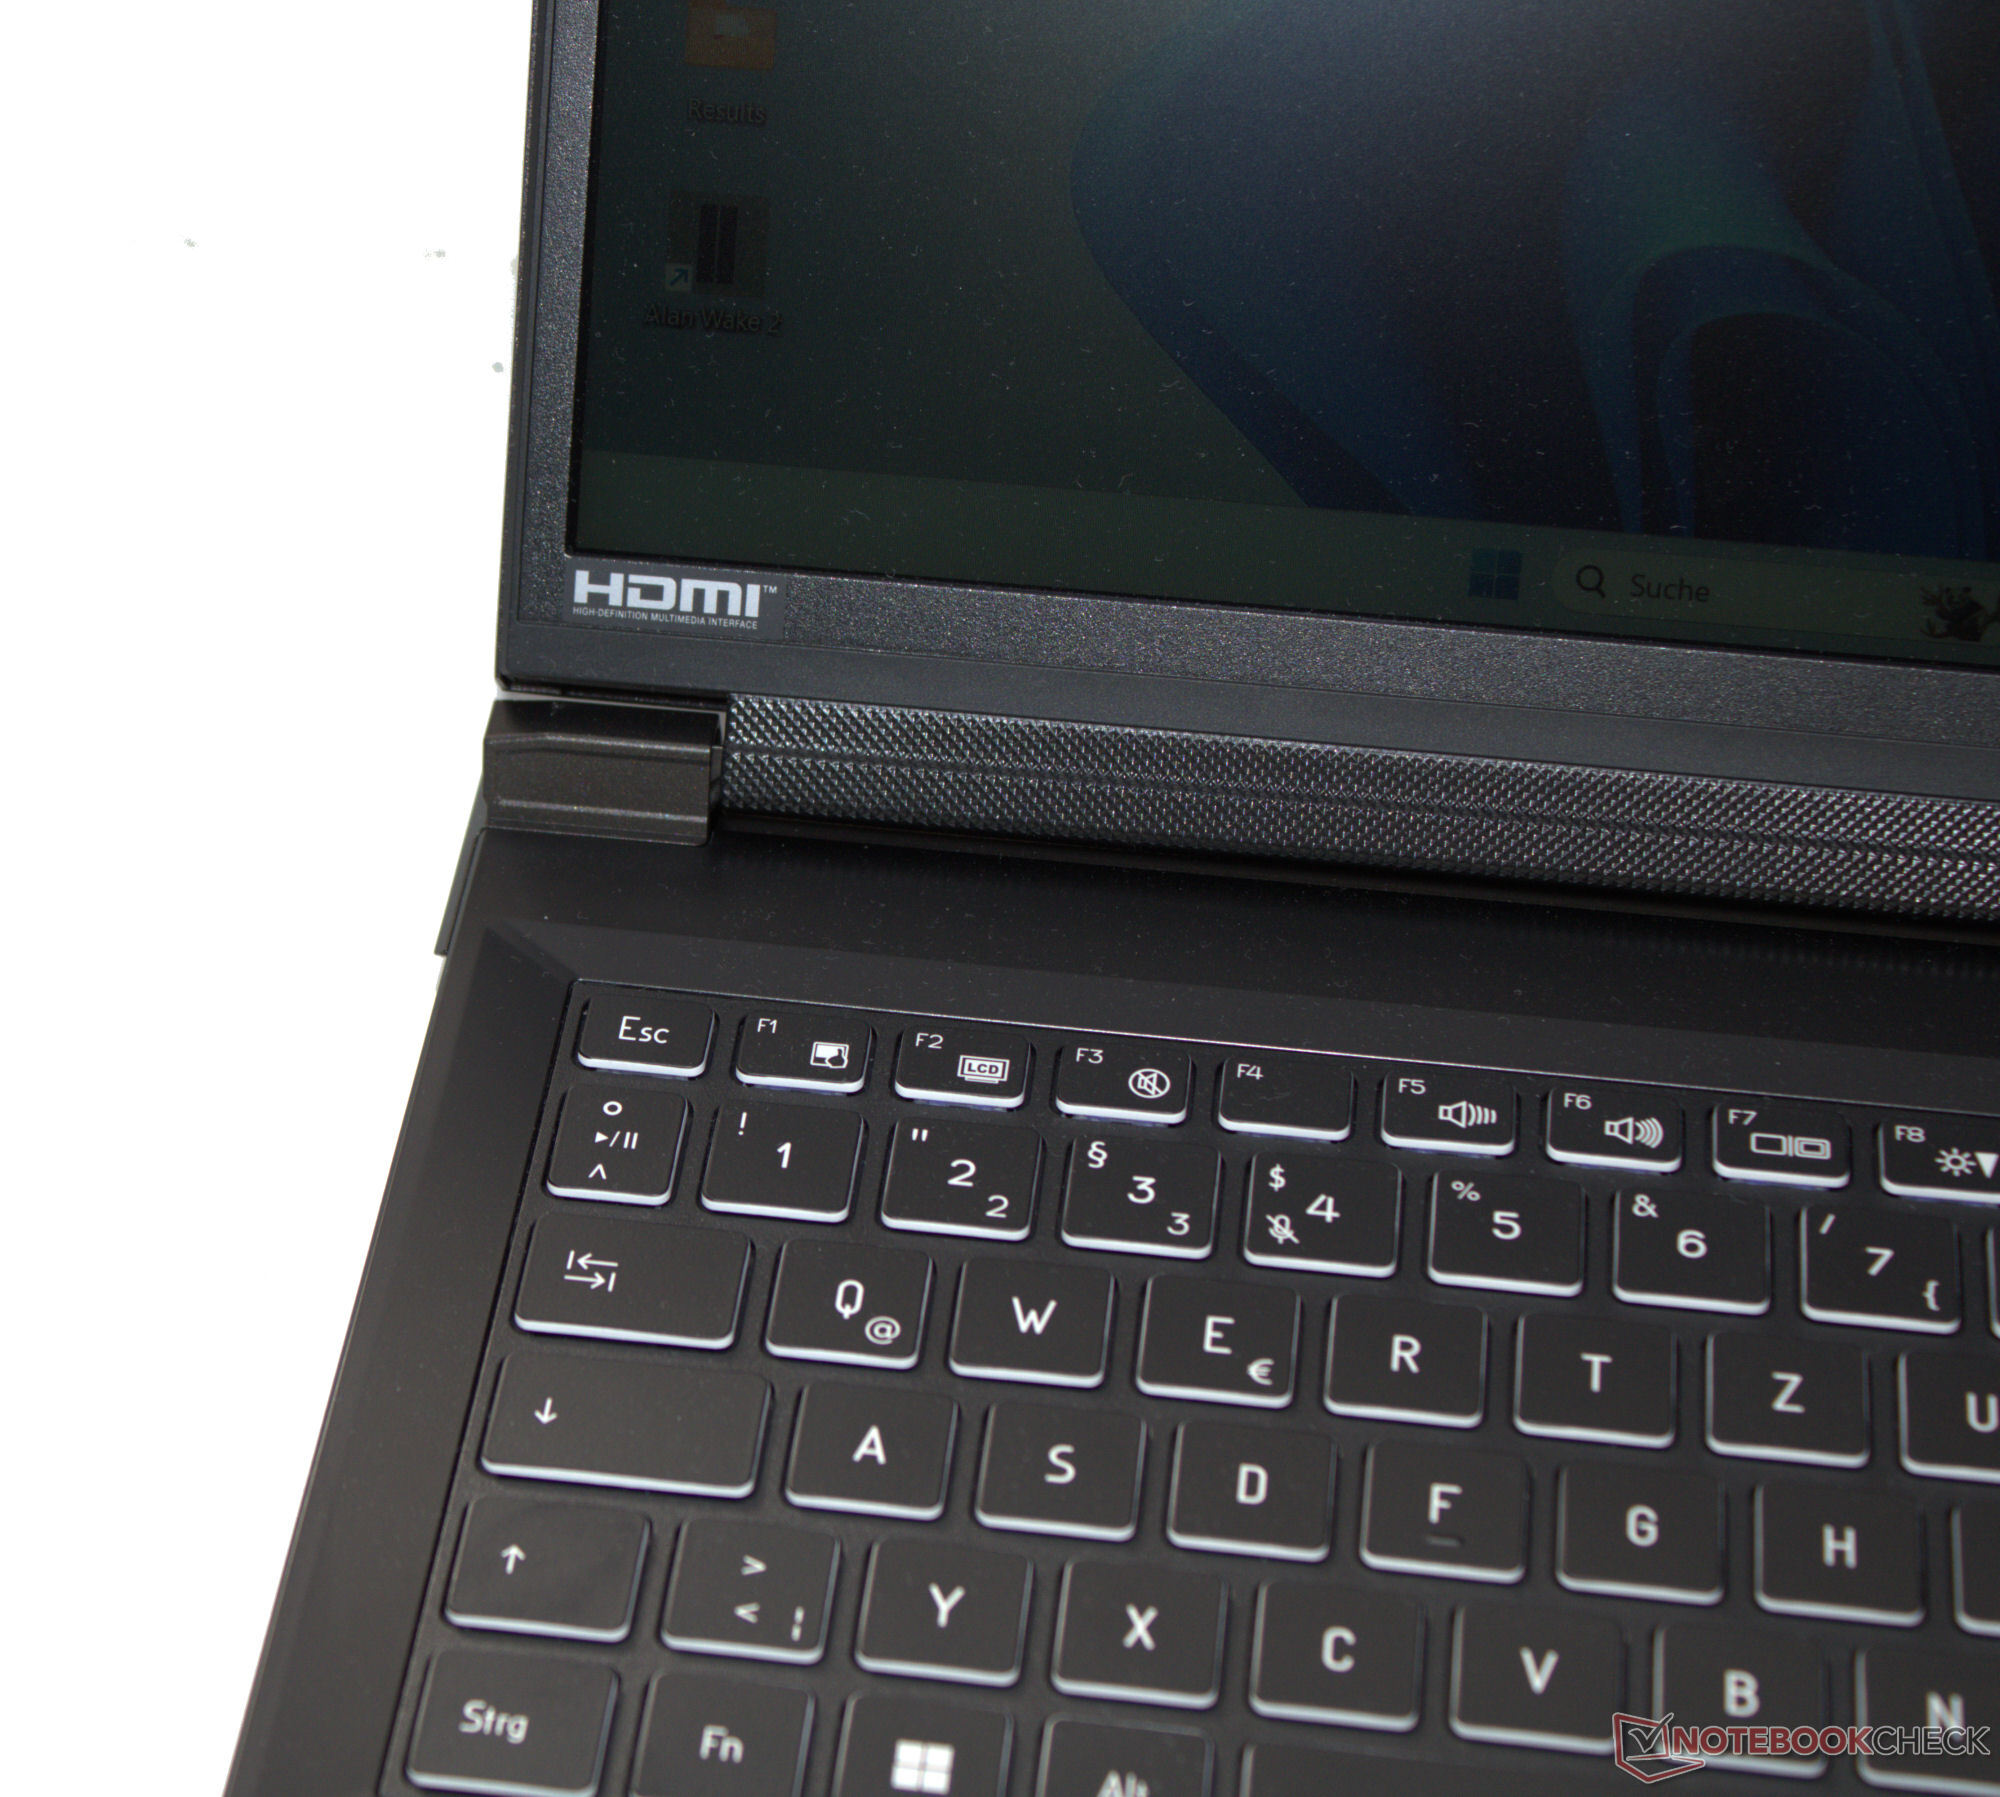
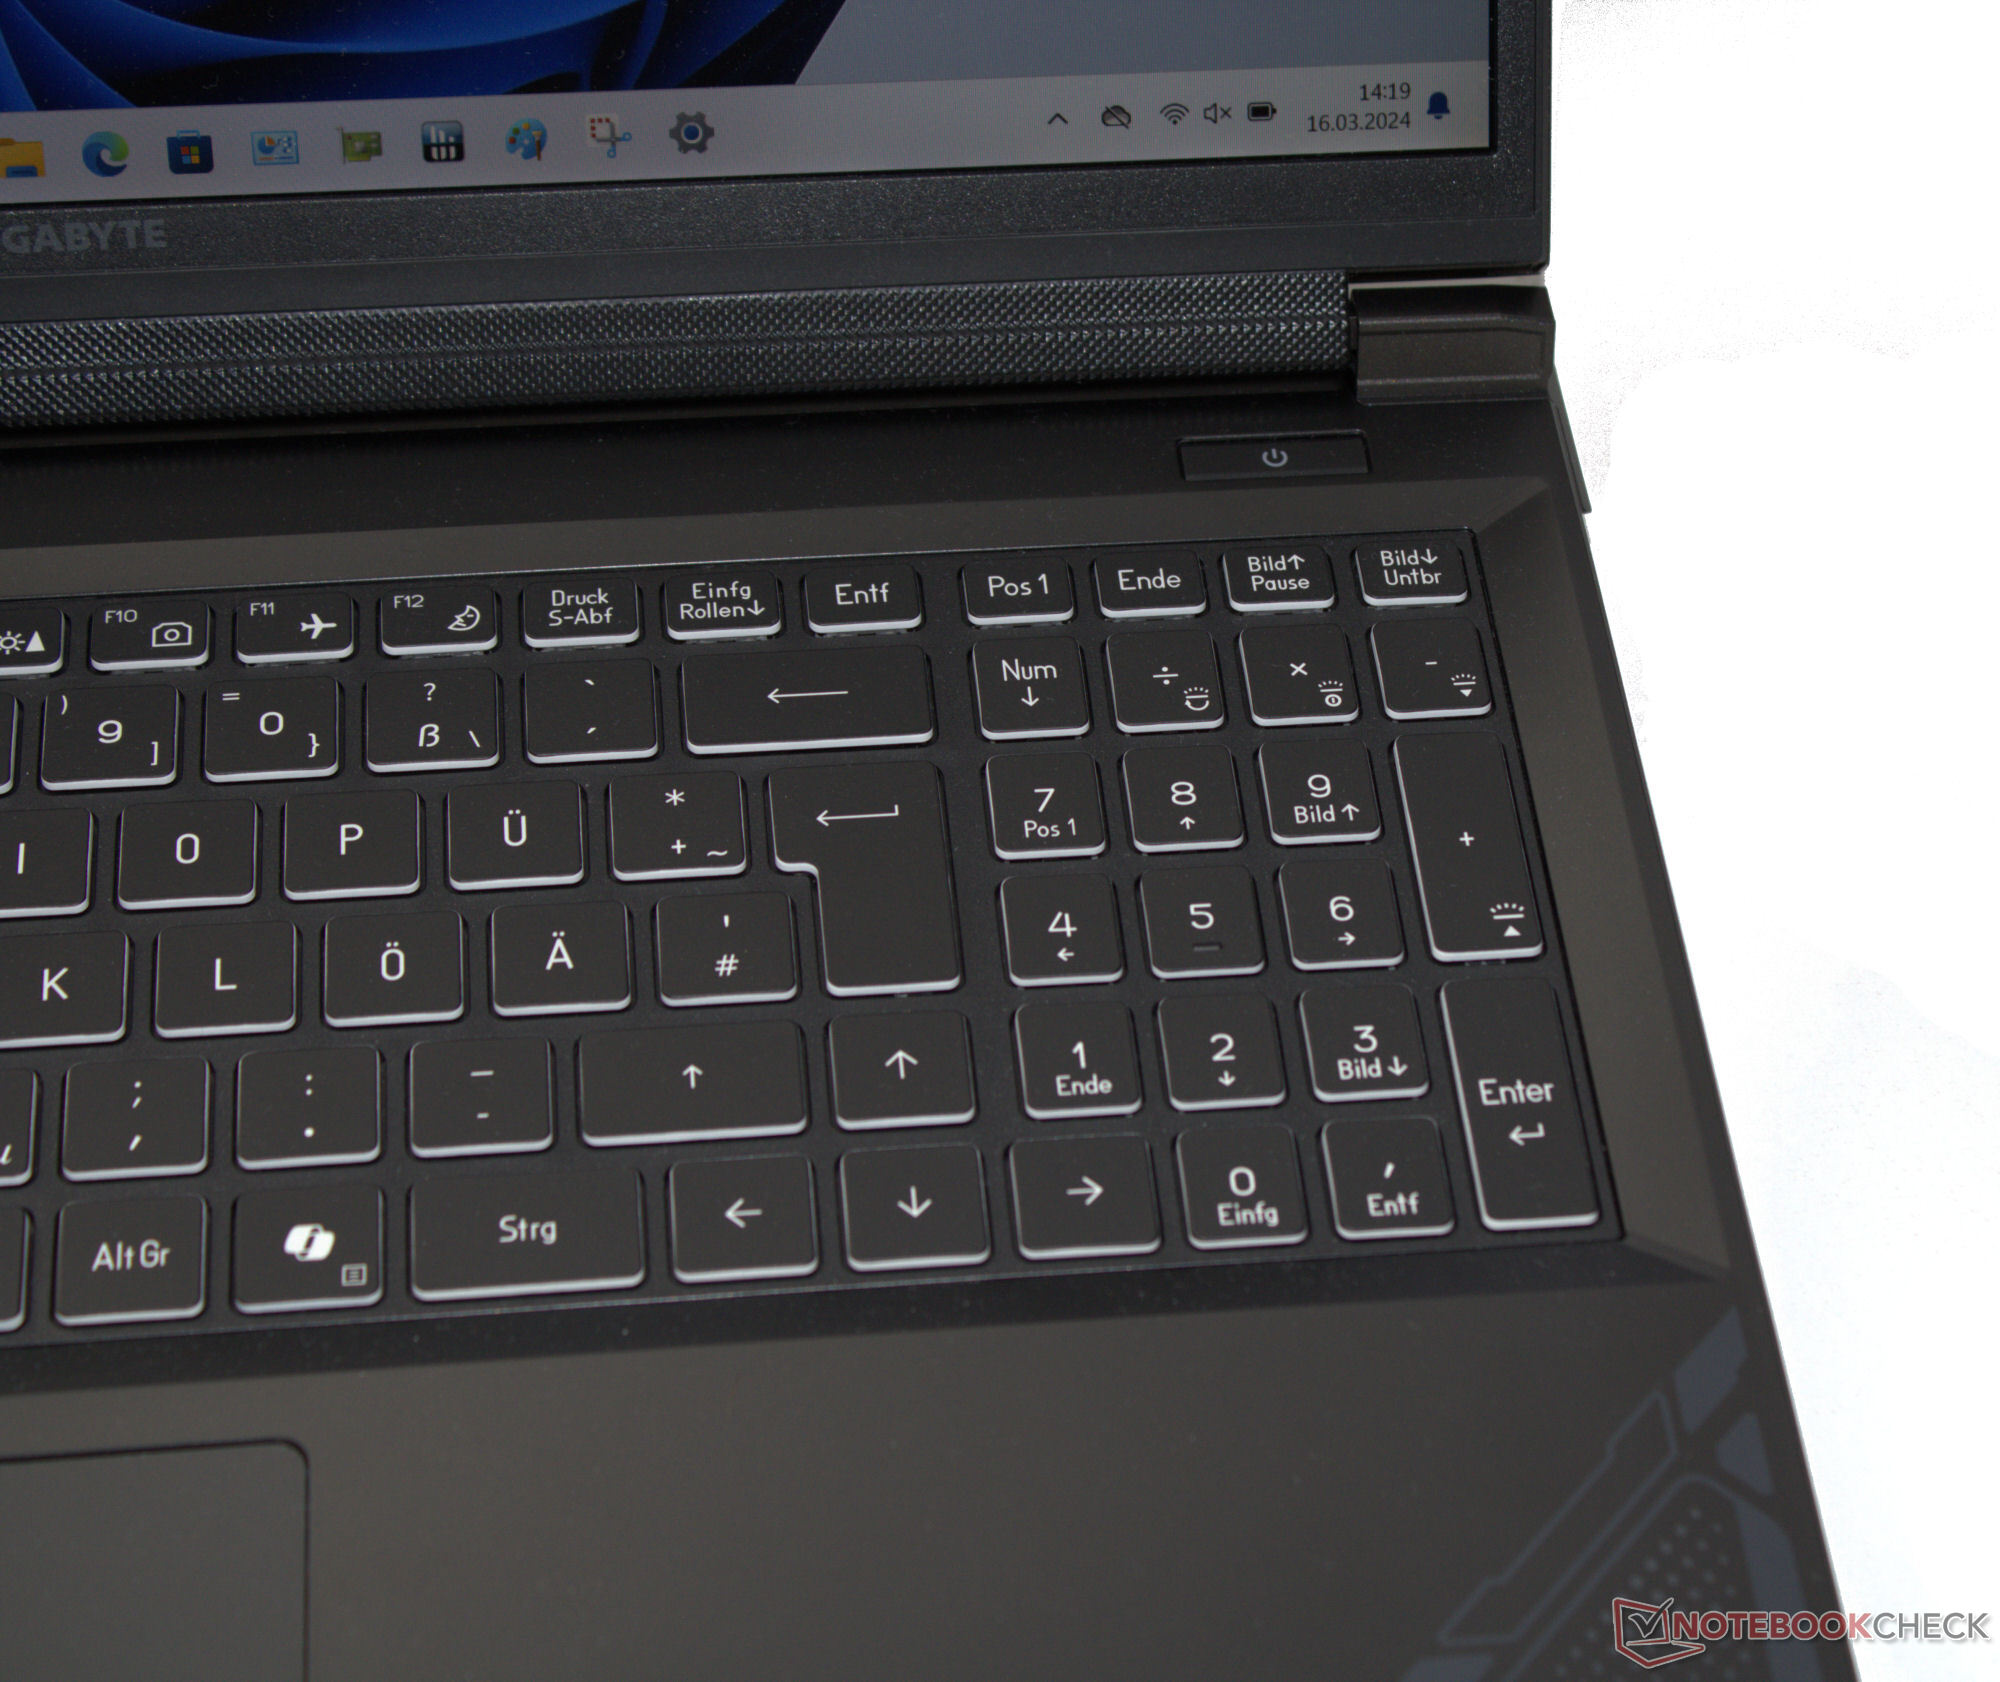
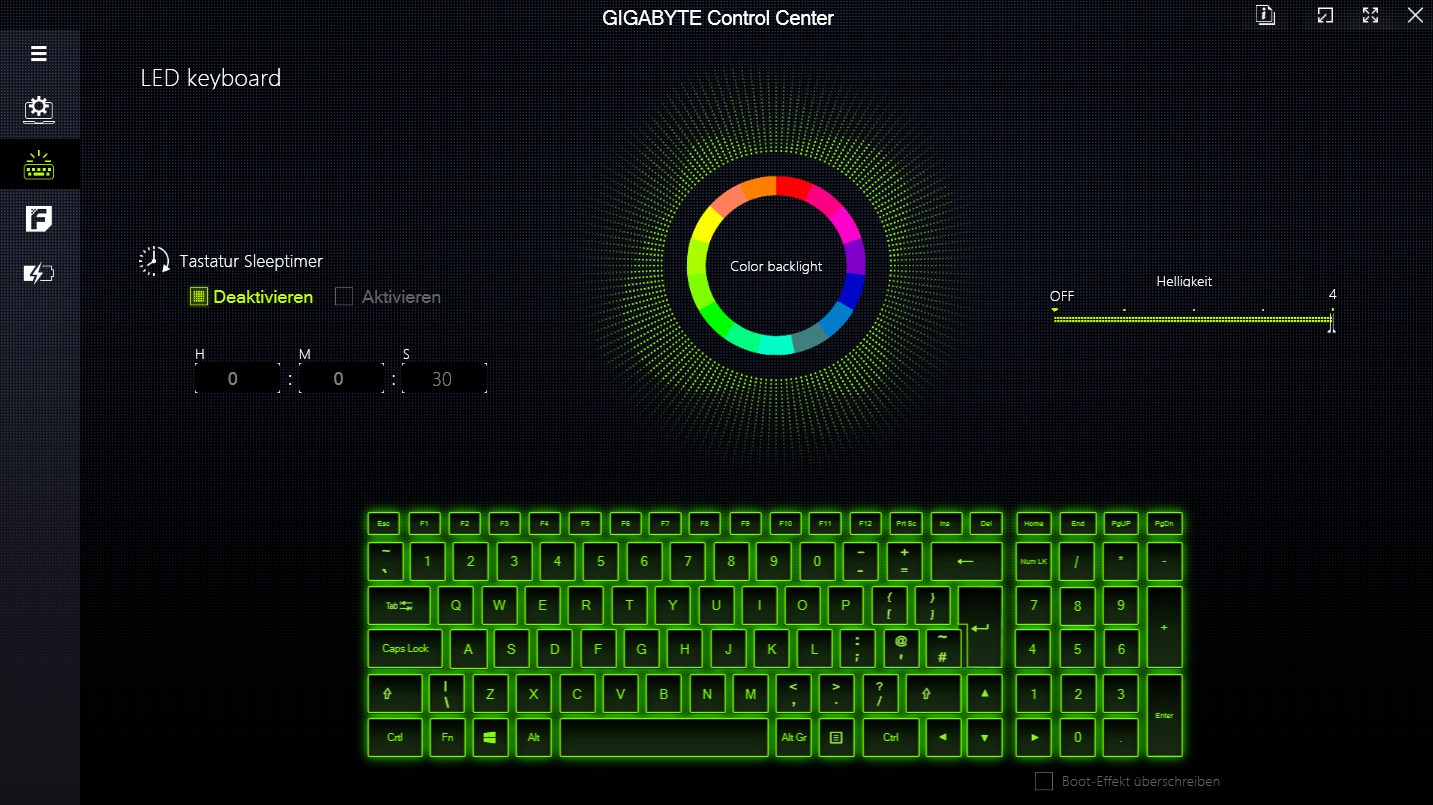
O G6X tem um teclado chiclet com um teclado numérico, iluminação RGB e teclas planas e suaves que são adequadas para as necessidades diárias de digitação. O teclado cede um pouco ao digitar, mas isso não é um problema.
A resistência das teclas é nítida. Um aspecto positivo é que as teclas de seta são de tamanho normal.
Um touchpad multitoque (12,1 cm x 8,5 cm) com um curso curto e um ponto de pressão claro serve como substituto do mouse.
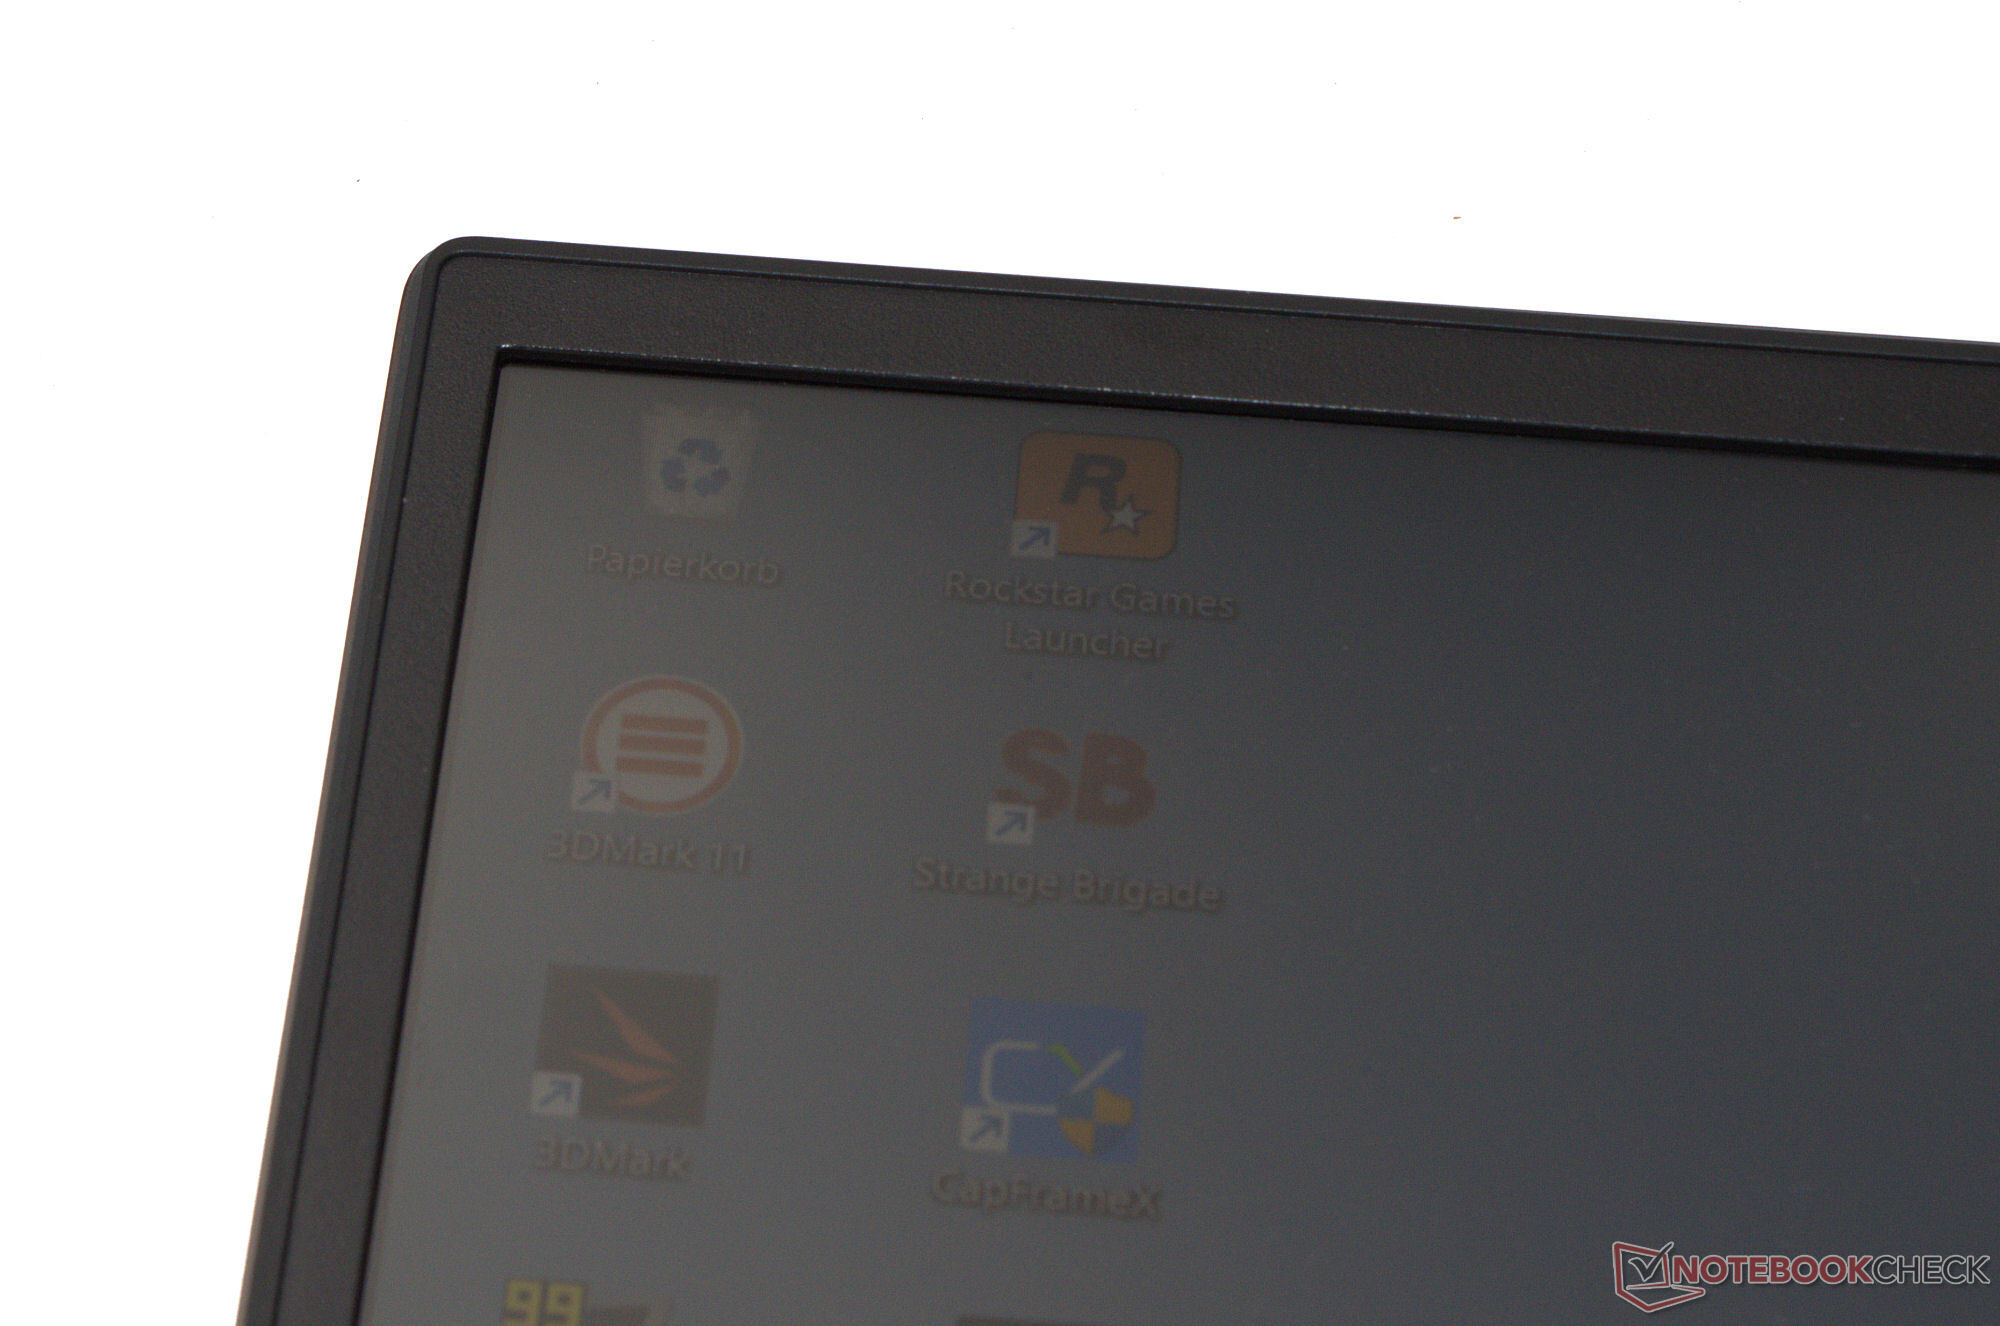
Tela: FHD+ 165 Hz sem PWM
O painel responsivo 16:10 de 165 Hz com resolução de 1920 x 1200 não apresenta oscilação de PWM em nenhuma configuração de brilho.
O brilho e o contraste da tela fosca de 16 polegadas cumprem os respectivos objetivos anunciados (> 300 cd/m² e 1.000:1). A Gigabyte não oferece outras opções de tela para o G6X.
| |||||||||||||||||||||||||
iluminação: 81 %
iluminação com acumulador: 353 cd/m²
Contraste: 1681:1 (Preto: 0.21 cd/m²)
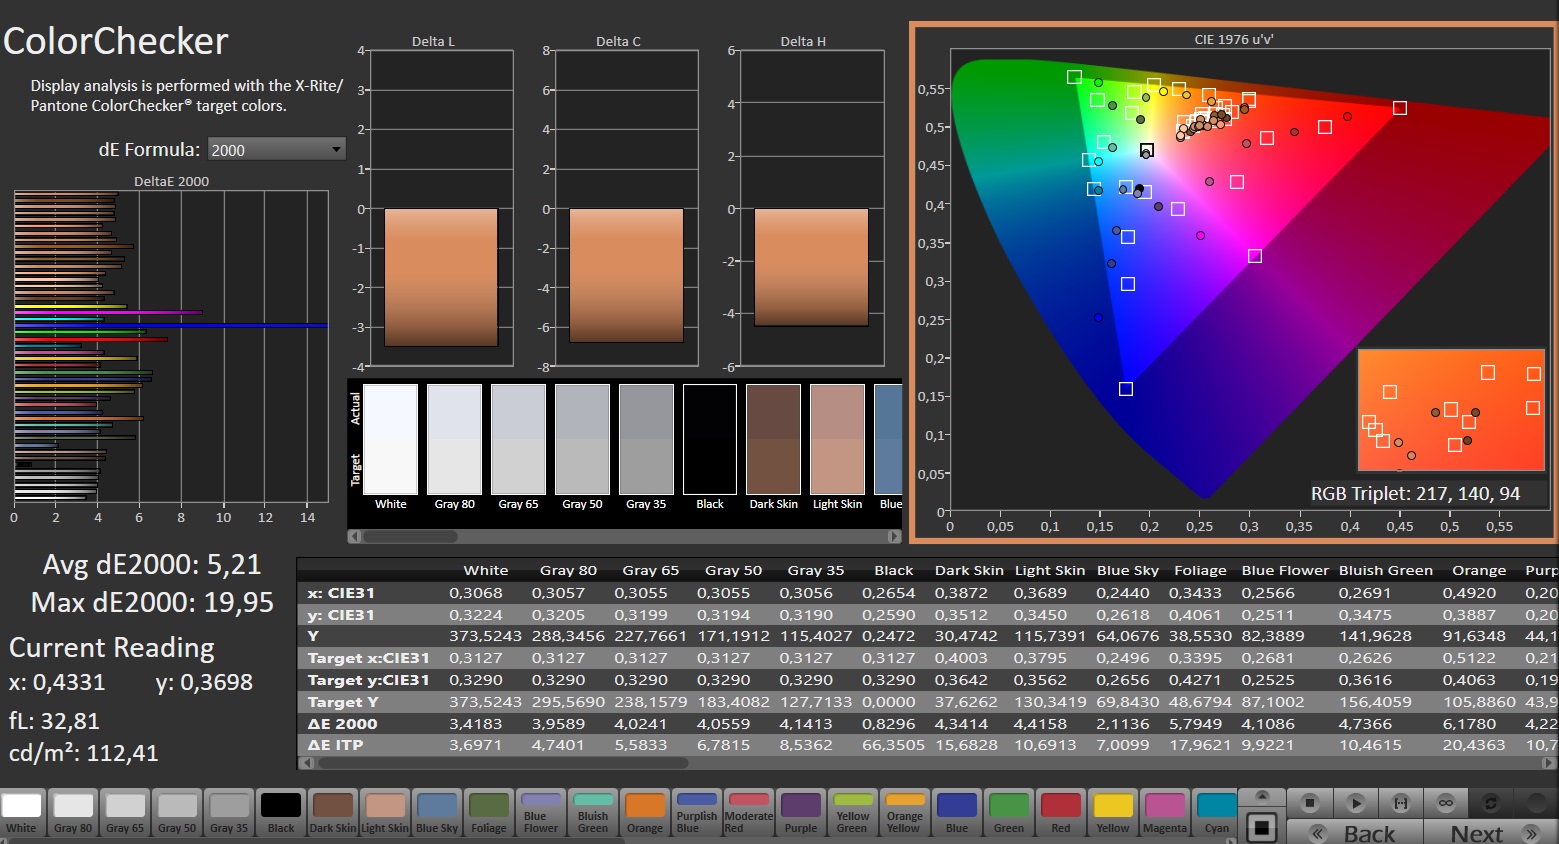
ΔE ColorChecker Calman: 5.21 | ∀{0.5-29.43 Ø4.72}
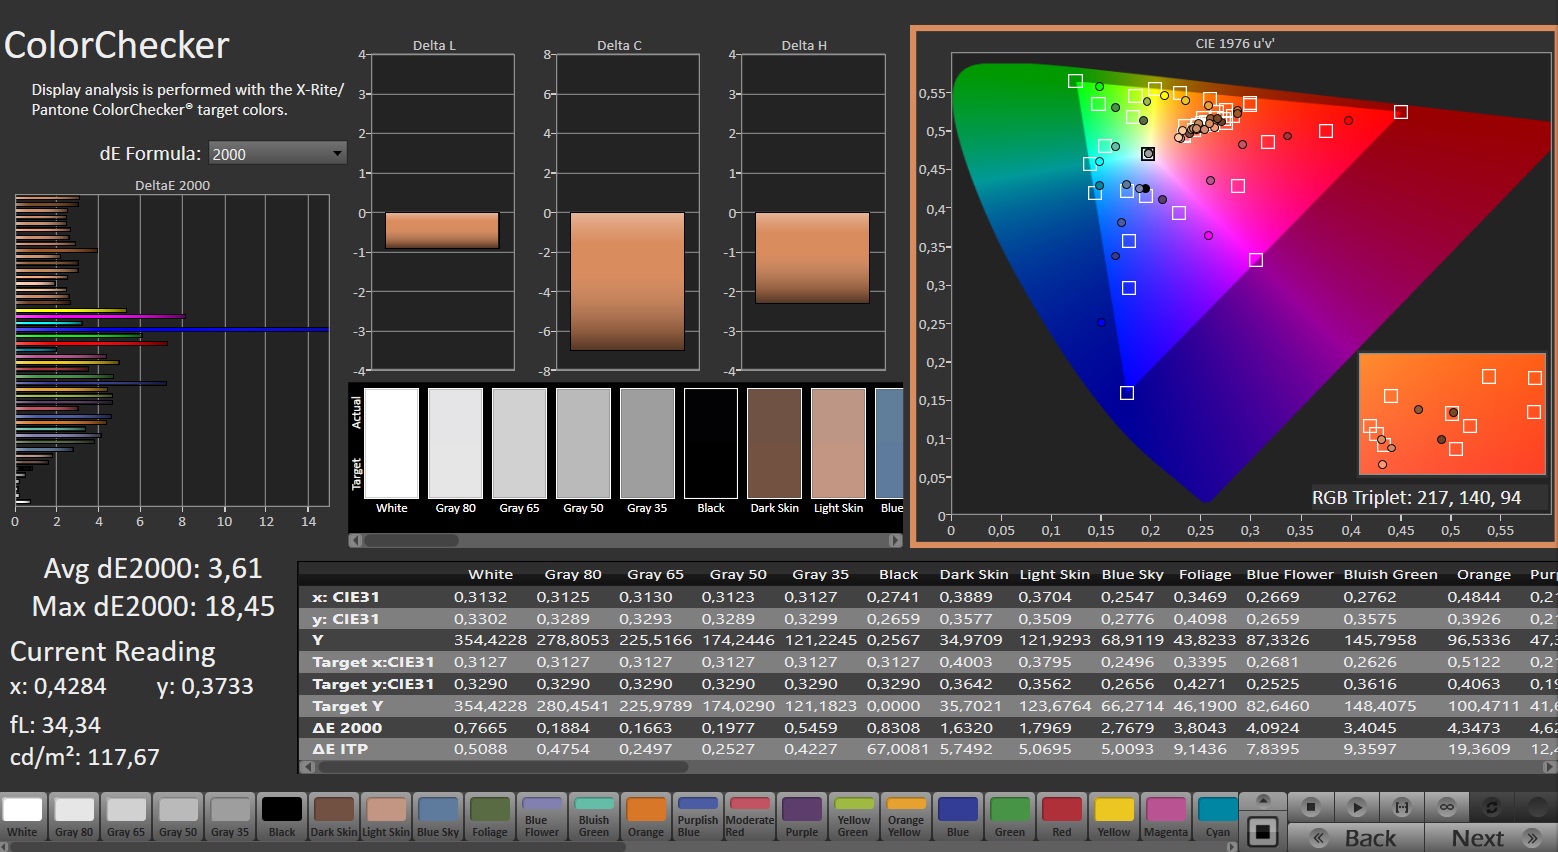
calibrated: 3.61
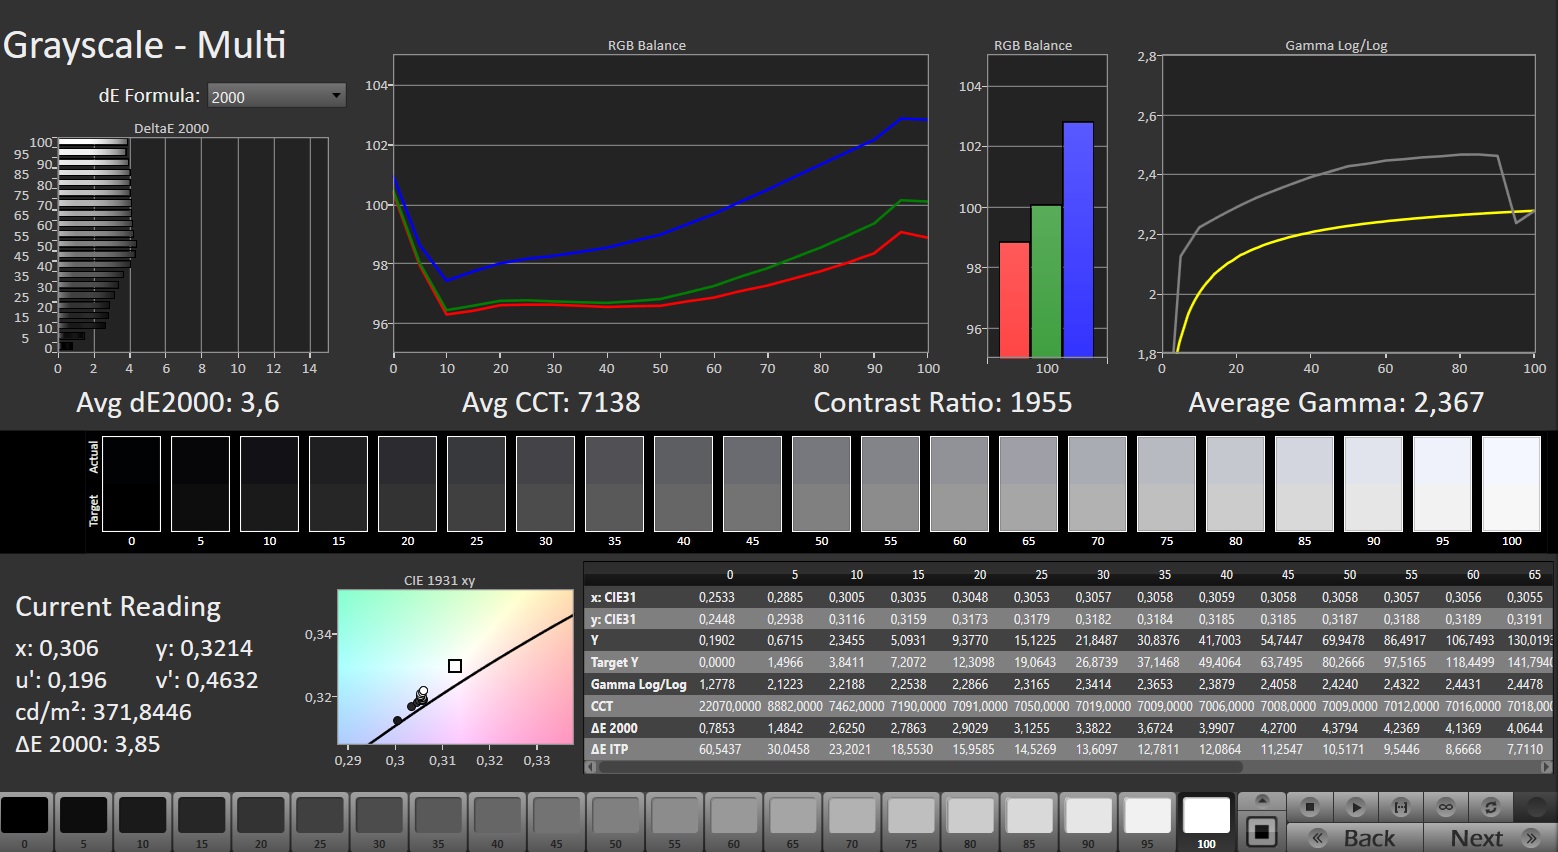
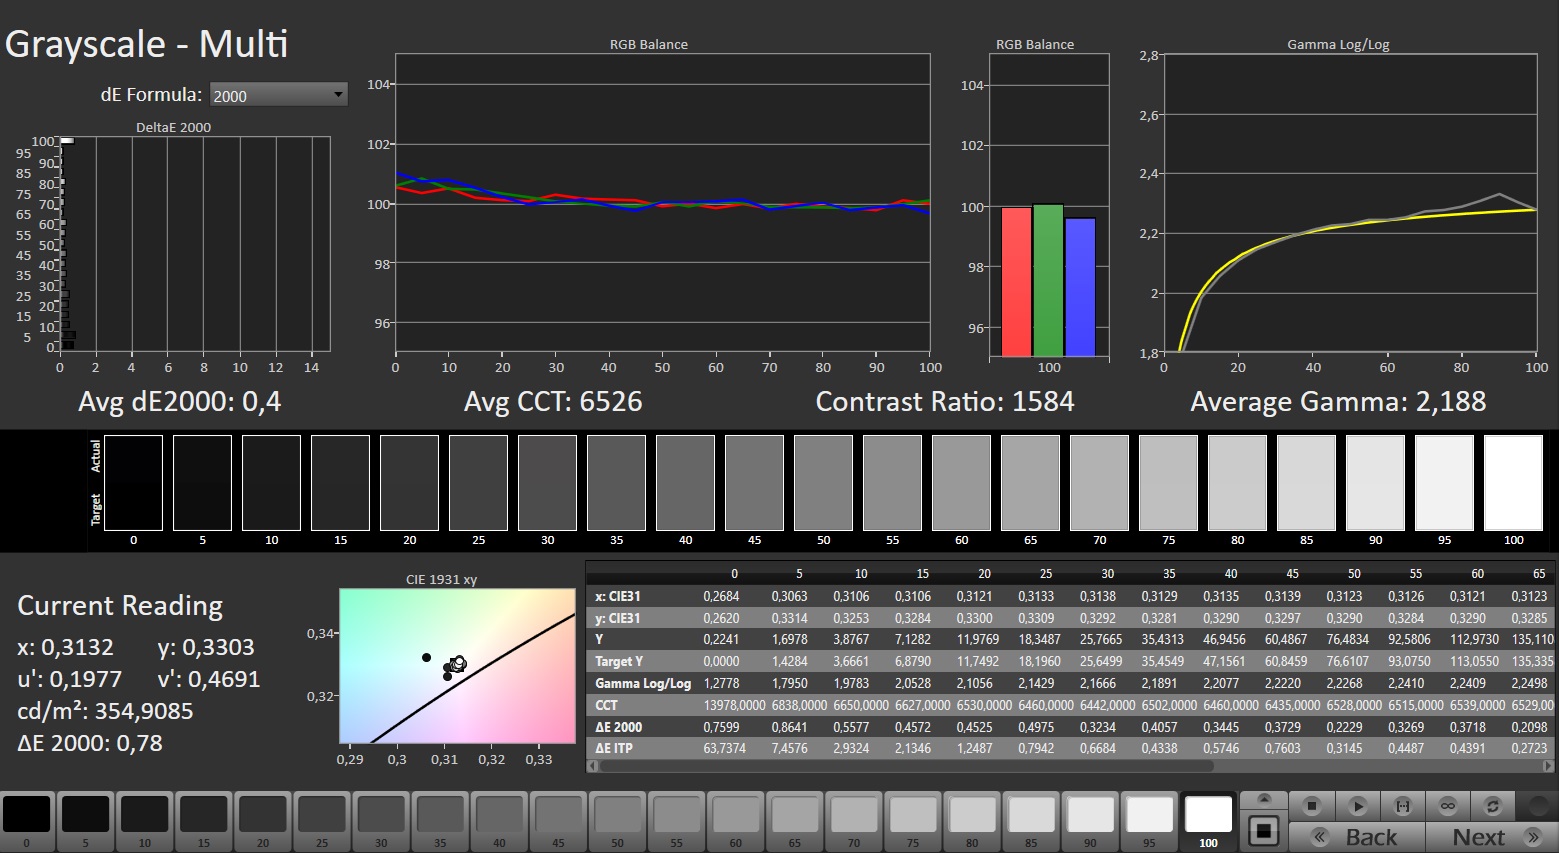
ΔE Greyscale Calman: 3.6 | ∀{0.09-98 Ø4.97}
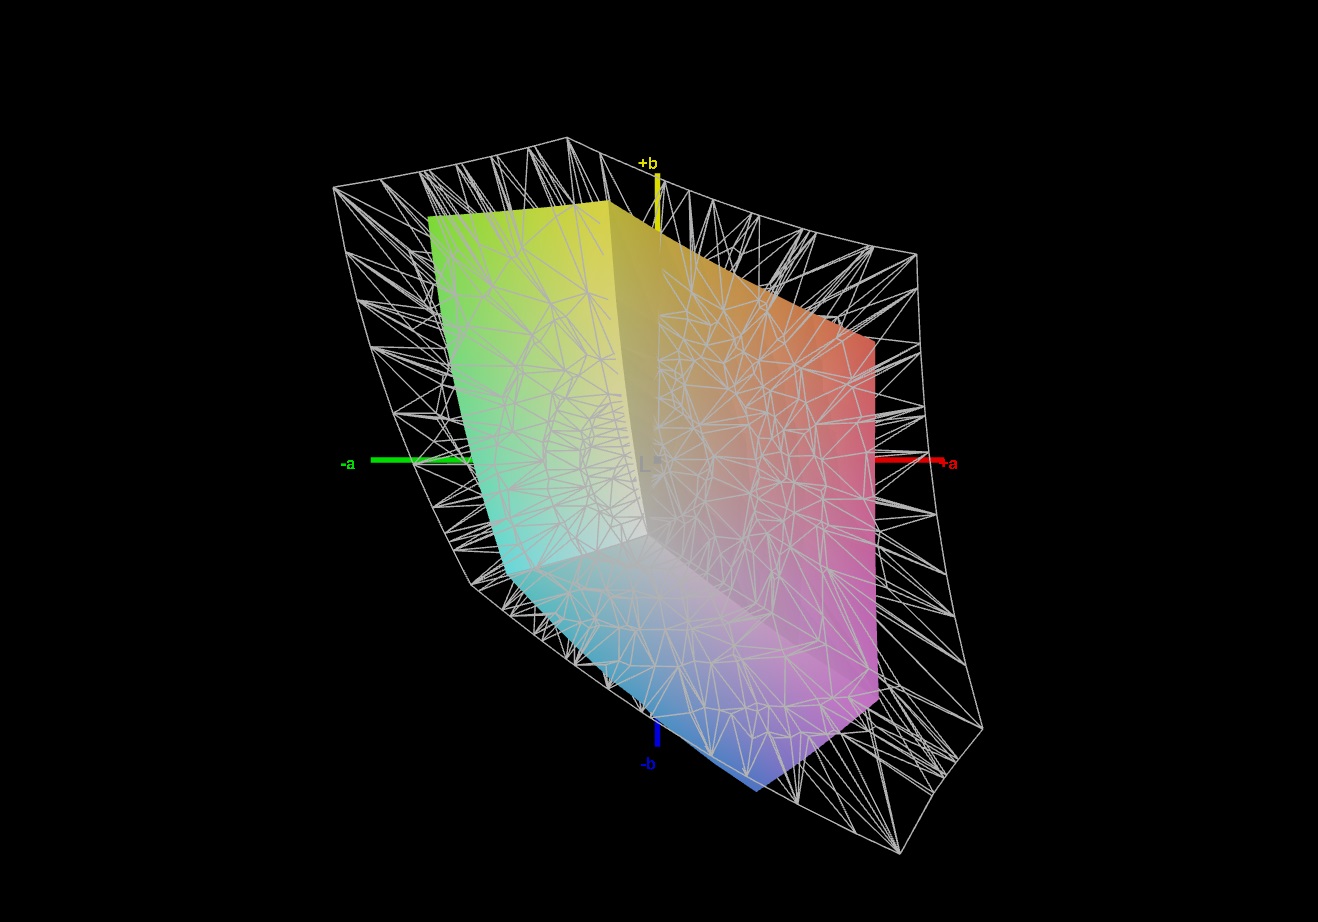
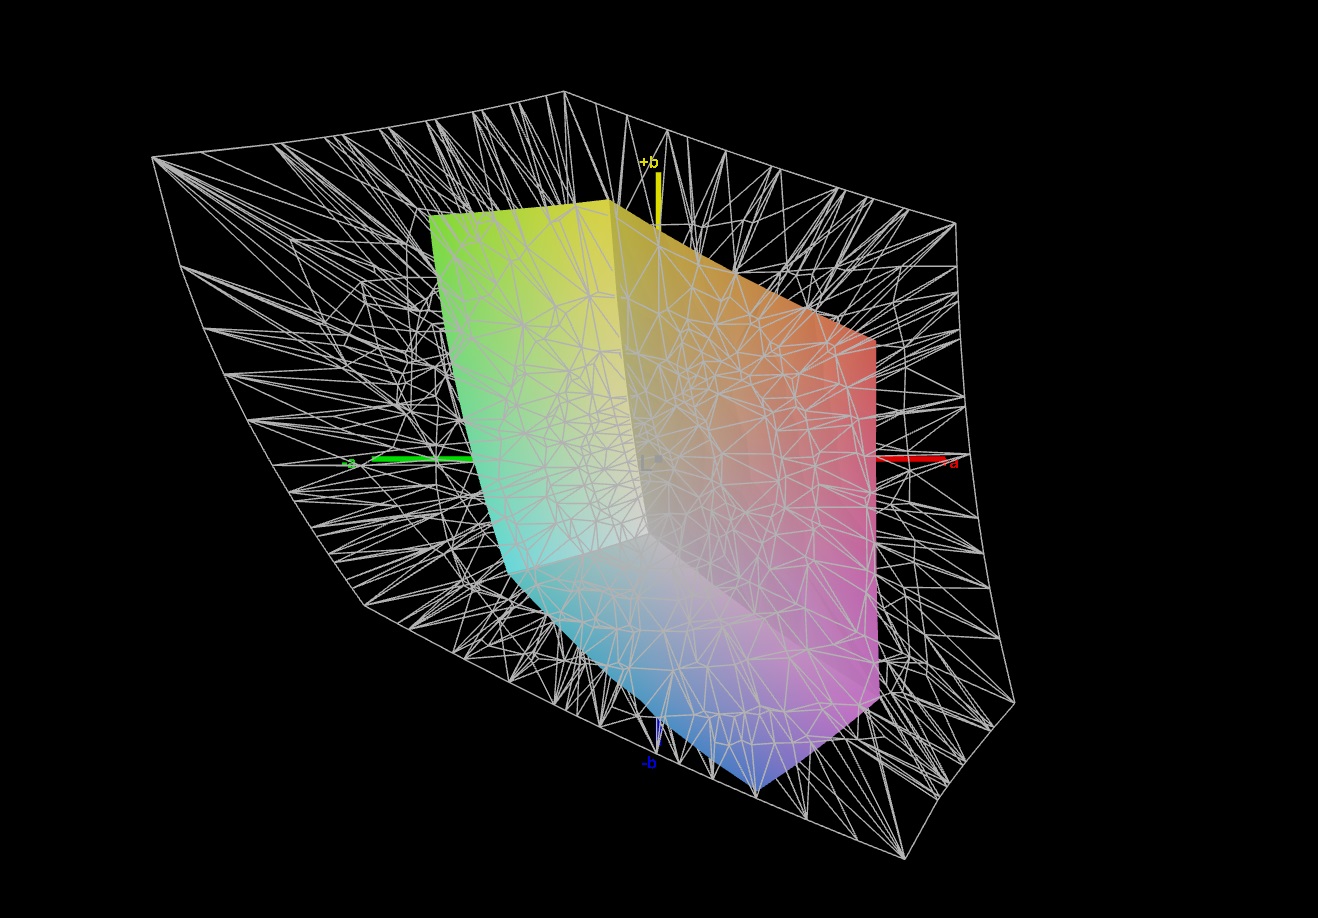
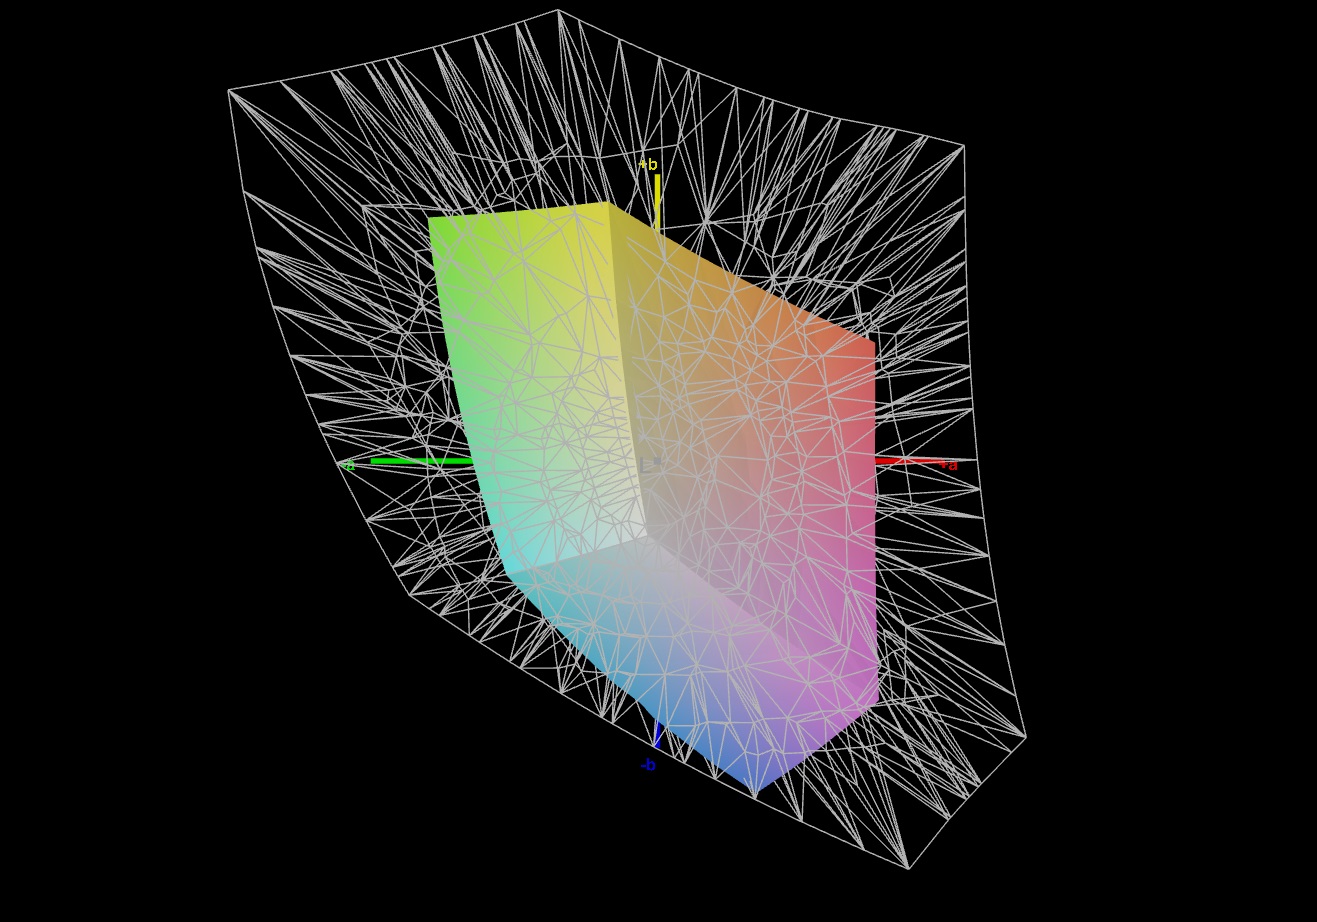
43.3% AdobeRGB 1998 (Argyll 3D)
62.4% sRGB (Argyll 3D)
41.8% Display P3 (Argyll 3D)
Gamma: 2.367
CCT: 7138 K
| Gigabyte G6X 9KG (2024) BOE NE160WUM-NX6, IPS, 1920x1200, 16" | Dell G16, i7-13650HX, RTX 4060 Chi Mei CMN161D (160GME), IPS, 2560x1600, 16" | Lenovo Legion 5 16IRX G9 NE160QDM-NZ3, IPS, 2560x1600, 16" | MSI Raider GE68HX 13VF Chi Mei N160JME-GTK, IPS, 1900x1200, 16" | Asus TUF Gaming A16 FA617XS BOE NE160WUM-NX2, IPS, 1920x1200, 16" | |
|---|---|---|---|---|---|
| Display | 60% | 68% | -0% | 62% | |
| Display P3 Coverage (%) | 41.8 | 67.5 61% | 72.4 73% | 41.6 0% | 69.3 66% |
| sRGB Coverage (%) | 62.4 | 98.5 58% | 100 60% | 62.2 0% | 97.3 56% |
| AdobeRGB 1998 Coverage (%) | 43.3 | 69.3 60% | 74.1 71% | 43 -1% | 70.7 63% |
| Response Times | 67% | 65% | 23% | 58% | |
| Response Time Grey 50% / Grey 80% * (ms) | 40.5 ? | 7.6 ? 81% | 12.5 ? 69% | 17.3 ? 57% | 15.6 ? 61% |
| Response Time Black / White * (ms) | 21.6 ? | 10.4 ? 52% | 8.7 ? 60% | 24.2 ? -12% | 10 ? 54% |
| PWM Frequency (Hz) | |||||
| Screen | 15% | 39% | -2% | 25% | |
| Brightness middle (cd/m²) | 353 | 369 5% | 526 49% | 300.9 -15% | 301 -15% |
| Brightness (cd/m²) | 318 | 344 8% | 500 57% | 302 -5% | 294 -8% |
| Brightness Distribution (%) | 81 | 89 10% | 87 7% | 93 15% | 94 16% |
| Black Level * (cd/m²) | 0.21 | 0.26 -24% | 0.33 -57% | 0.31 -48% | 0.21 -0% |
| Contrast (:1) | 1681 | 1419 -16% | 1594 -5% | 971 -42% | 1433 -15% |
| Colorchecker dE 2000 * | 5.21 | 3.04 42% | 1.2 77% | 4.6 12% | 1.79 66% |
| Colorchecker dE 2000 max. * | 19.95 | 5.56 72% | 2.1 89% | 17.6 12% | 3.48 83% |
| Colorchecker dE 2000 calibrated * | 3.61 | 2.35 35% | 1 72% | 2.04 43% | 1.2 67% |
| Greyscale dE 2000 * | 3.6 | 3.38 6% | 1.3 64% | 3.3 8% | 2.5 31% |
| Gamma | 2.367 93% | 2.47 89% | 2.23 99% | 2.09 105% | 2.265 97% |
| CCT | 7138 91% | 6040 108% | 6391 102% | 7151 91% | 6157 106% |
| Média Total (Programa/Configurações) | 47% /
32% | 57% /
49% | 7% /
2% | 48% /
38% |
* ... menor é melhor
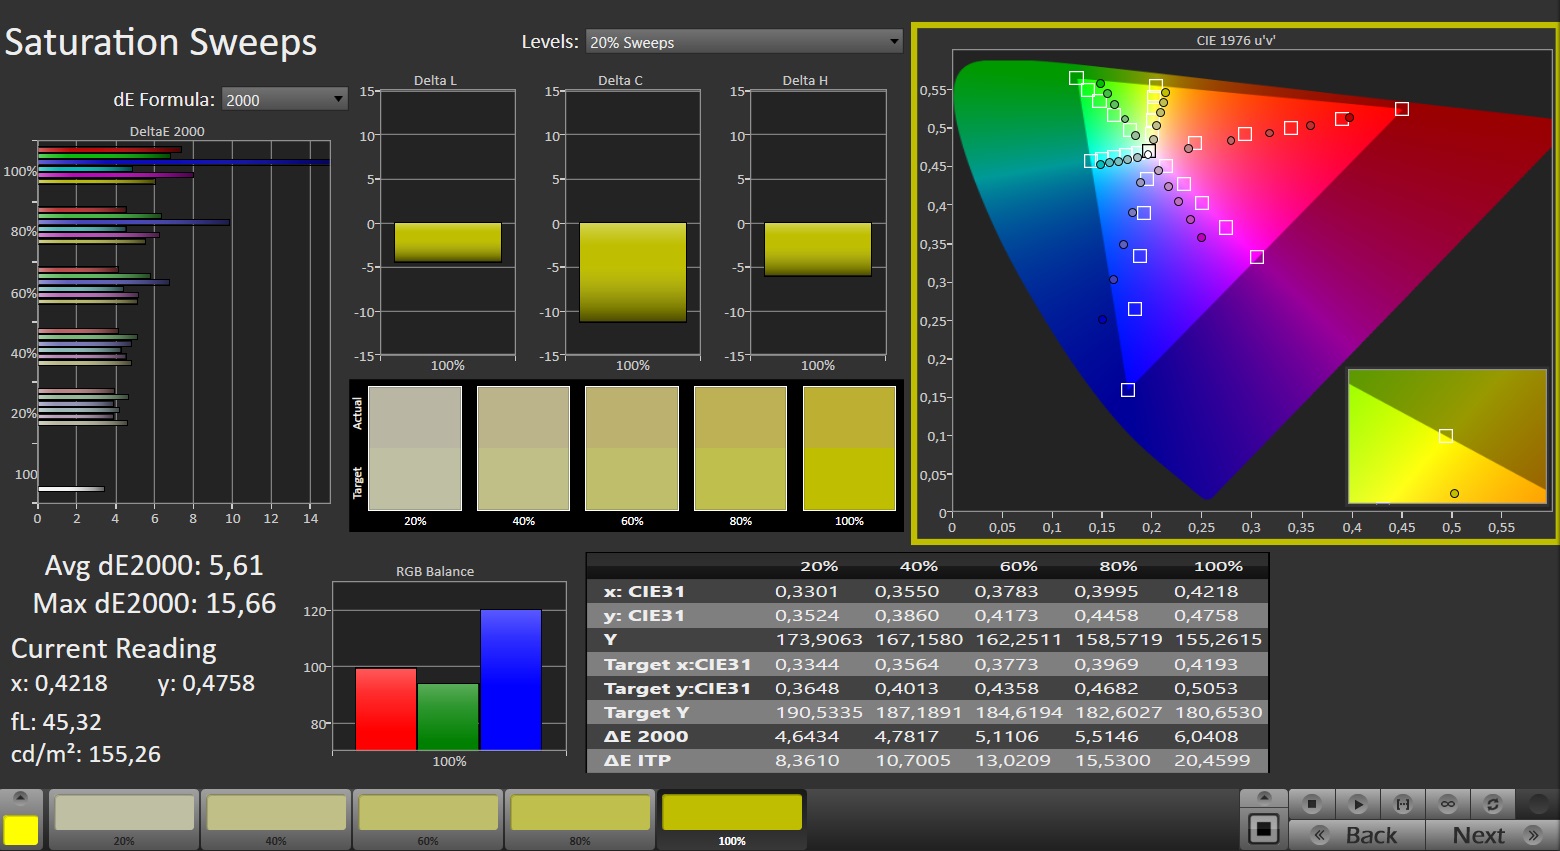
A tela mostra uma reprodução de cores medíocre e funciona: Com um desvio de cerca de 5,2, a meta deltaE 2000 de < 3 não é atingida. A calibração reduz o desvio para 3,6 e garante tons de cinza mais equilibrados.
O painel não pode reproduzir totalmente os espaços de cores AdobeRGB, sRGB e DCI-P3. Nesse aspecto, os concorrentes do G6X oferecem telas melhores.

Exibir tempos de resposta
| ↔ Tempo de resposta preto para branco | ||
|---|---|---|
| 21.6 ms ... ascensão ↗ e queda ↘ combinadas | ↗ 11.1 ms ascensão | 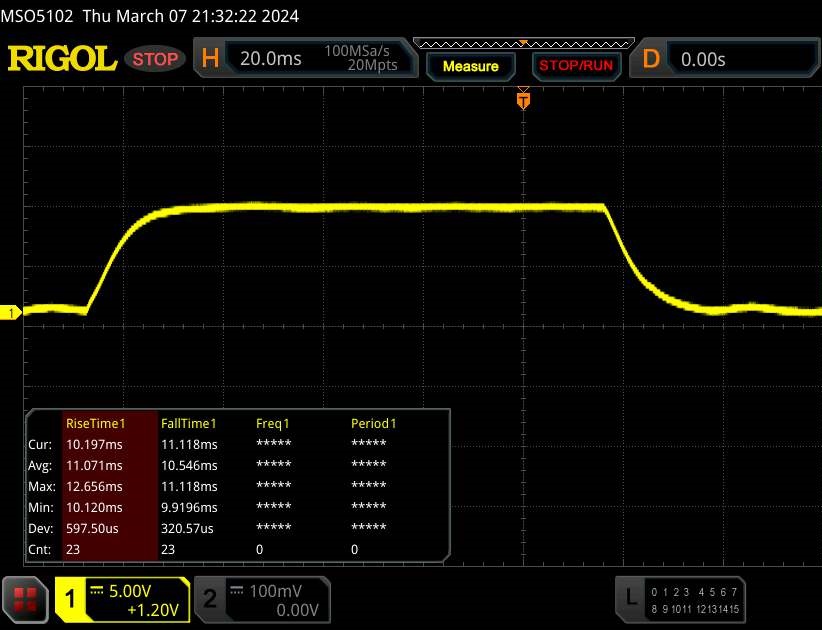 |
| ↘ 10.5 ms queda | ||
| A tela mostra boas taxas de resposta em nossos testes, mas pode ser muito lenta para jogadores competitivos. Em comparação, todos os dispositivos testados variam de 0.1 (mínimo) a 240 (máximo) ms. » 48 % de todos os dispositivos são melhores. Isso significa que o tempo de resposta medido é semelhante à média de todos os dispositivos testados (19.8 ms). | ||
| ↔ Tempo de resposta 50% cinza a 80% cinza | ||
| 40.5 ms ... ascensão ↗ e queda ↘ combinadas | ↗ 19 ms ascensão | 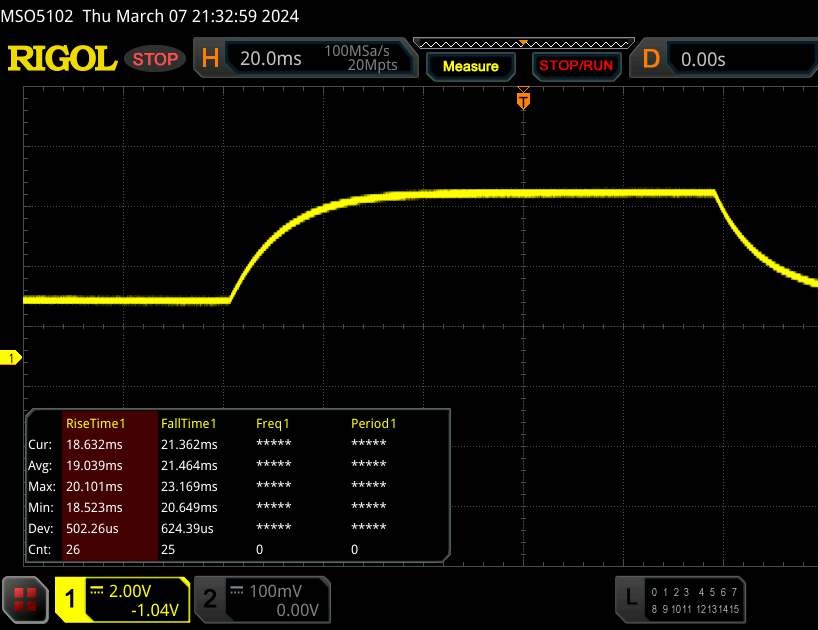 |
| ↘ 21.5 ms queda | ||
| A tela mostra taxas de resposta lentas em nossos testes e será insatisfatória para os jogadores. Em comparação, todos os dispositivos testados variam de 0.165 (mínimo) a 636 (máximo) ms. » 64 % de todos os dispositivos são melhores. Isso significa que o tempo de resposta medido é pior que a média de todos os dispositivos testados (31 ms). | ||
Cintilação da tela / PWM (modulação por largura de pulso)
| Tela tremeluzindo / PWM não detectado |  | ||
[pwm_comparison] Em comparação: 52 % de todos os dispositivos testados não usam PWM para escurecer a tela. Se PWM foi detectado, uma média de 7753 (mínimo: 5 - máximo: 343500) Hz foi medida. | |||
O painel IPS oferece ângulos de visão relativamente estáveis que podem ser lidos em posições extremas. É possível usar a tela em ambientes externos se o sol não estiver muito forte.
Desempenho: Raptor Lake e Ada Lovelace alimentam o computador de 16 polegadas
A Gigabyte oferece um notebook para jogos de médio porte com o G6X 9KG. O Raptor Lake-HX e a Ada Lovelace fornecem o poder de computação necessário.
Condições de teste
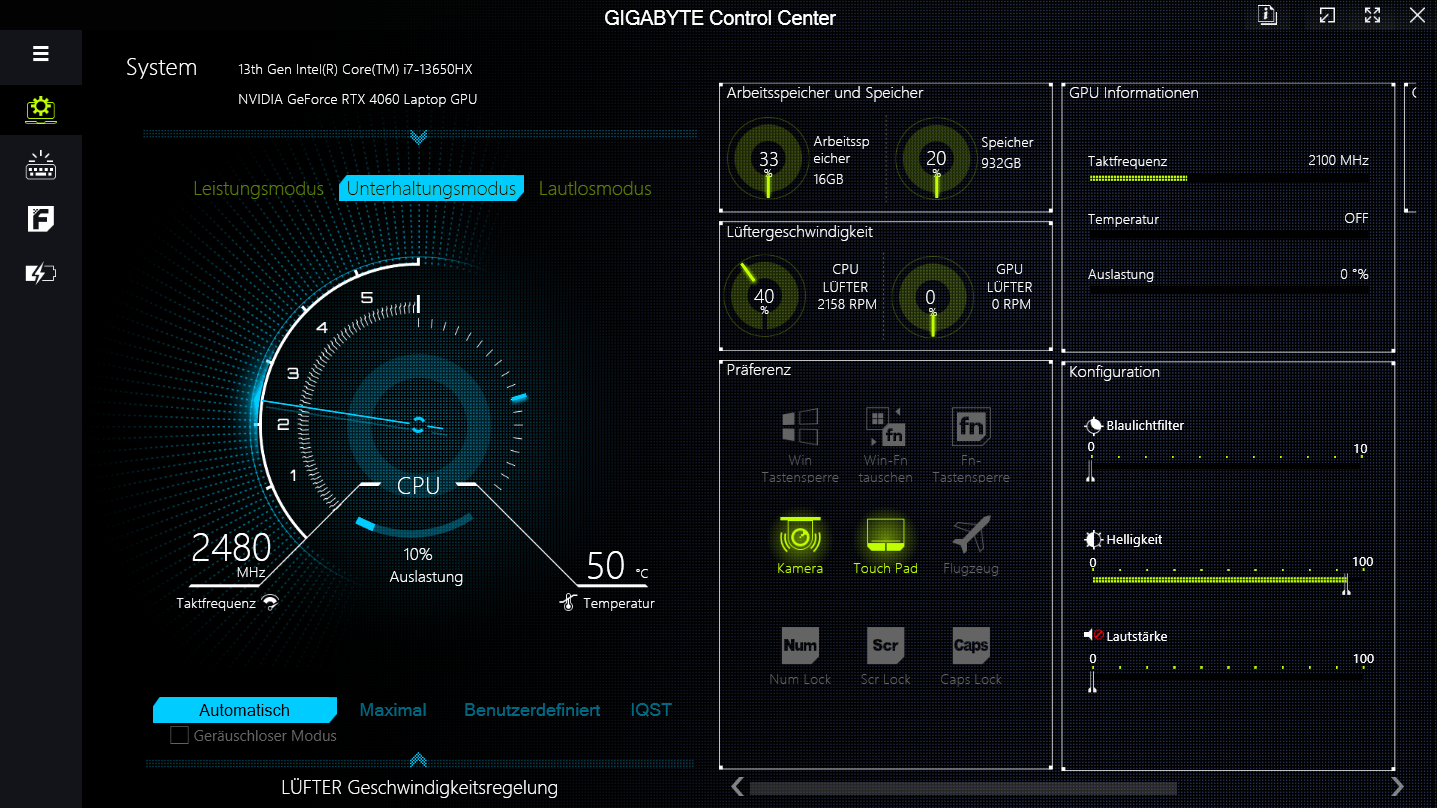
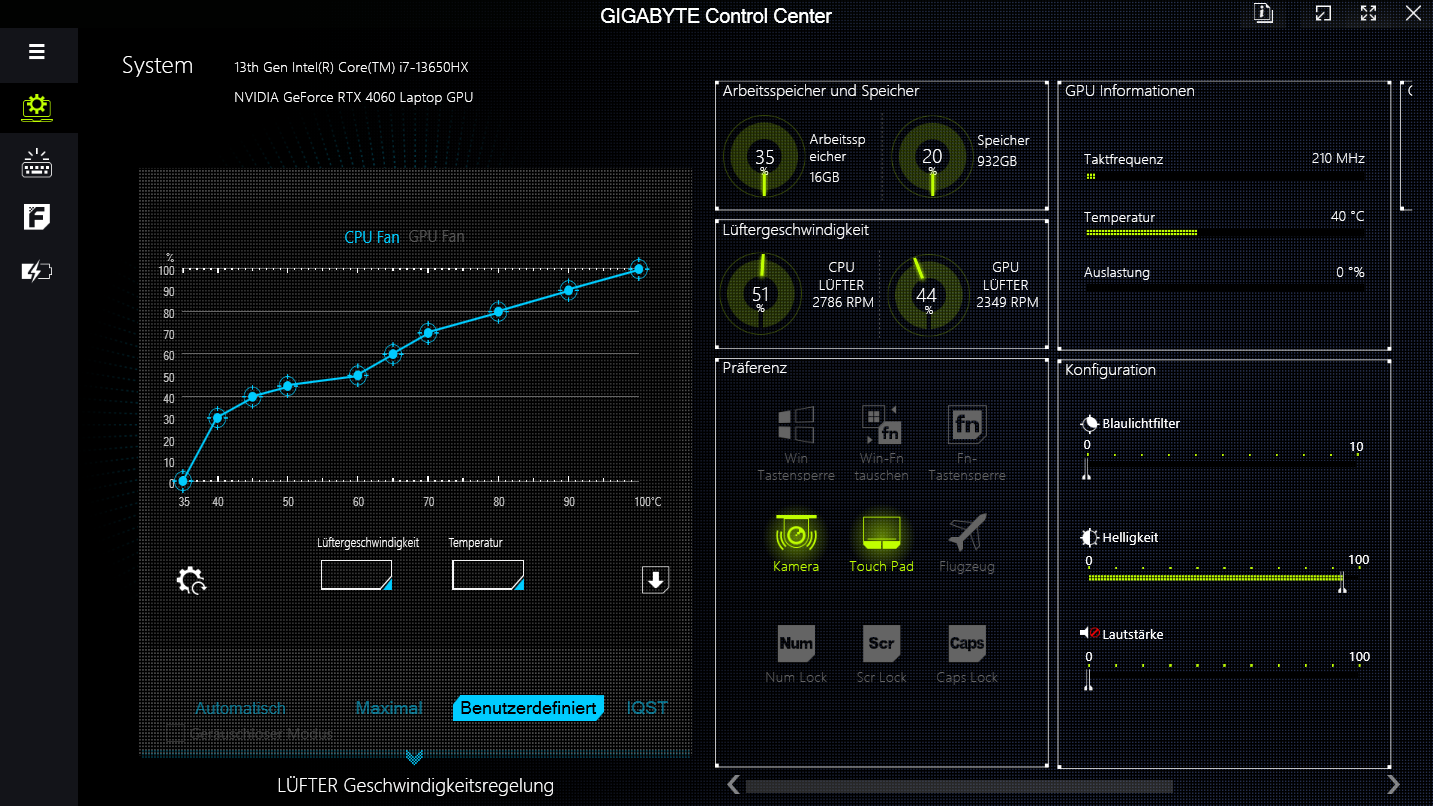
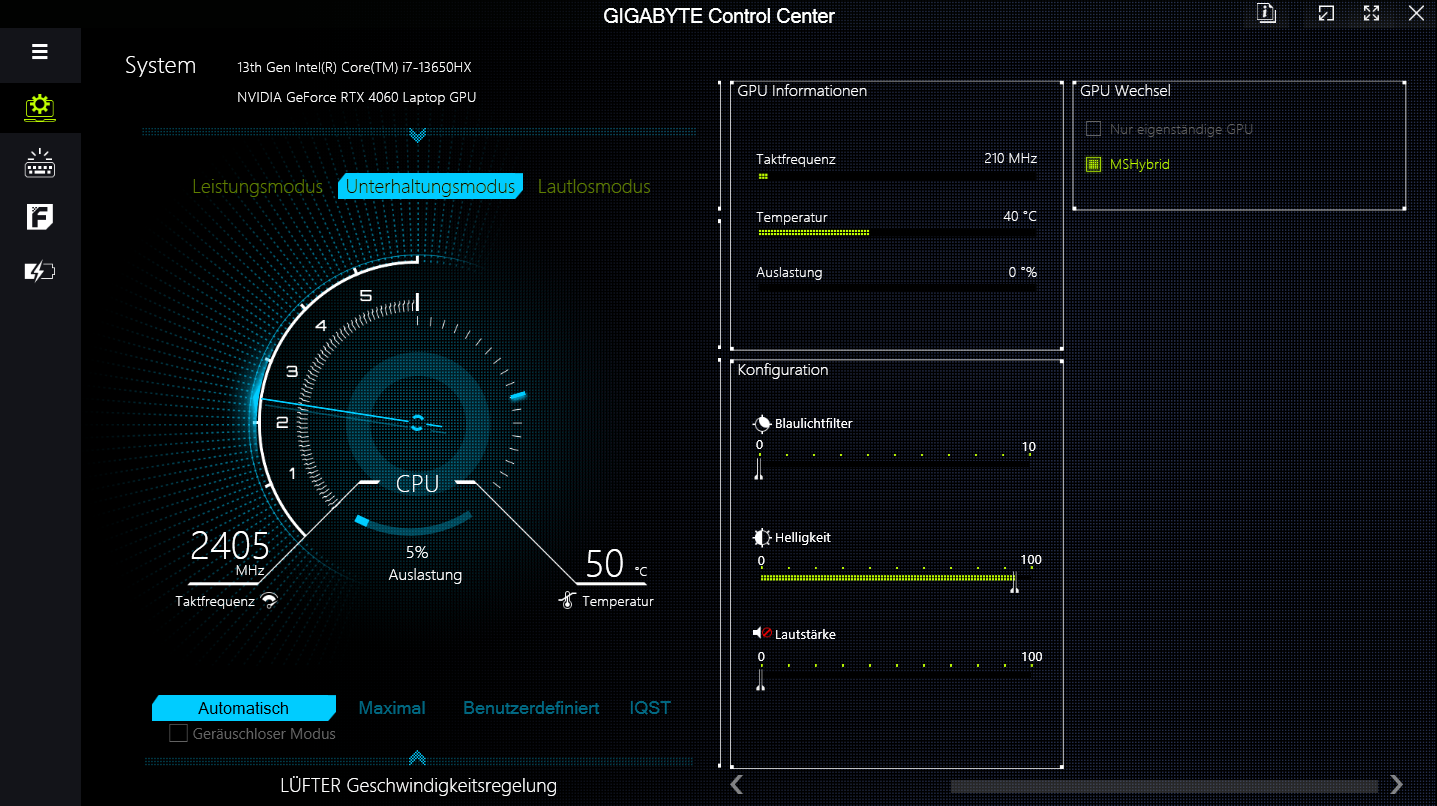
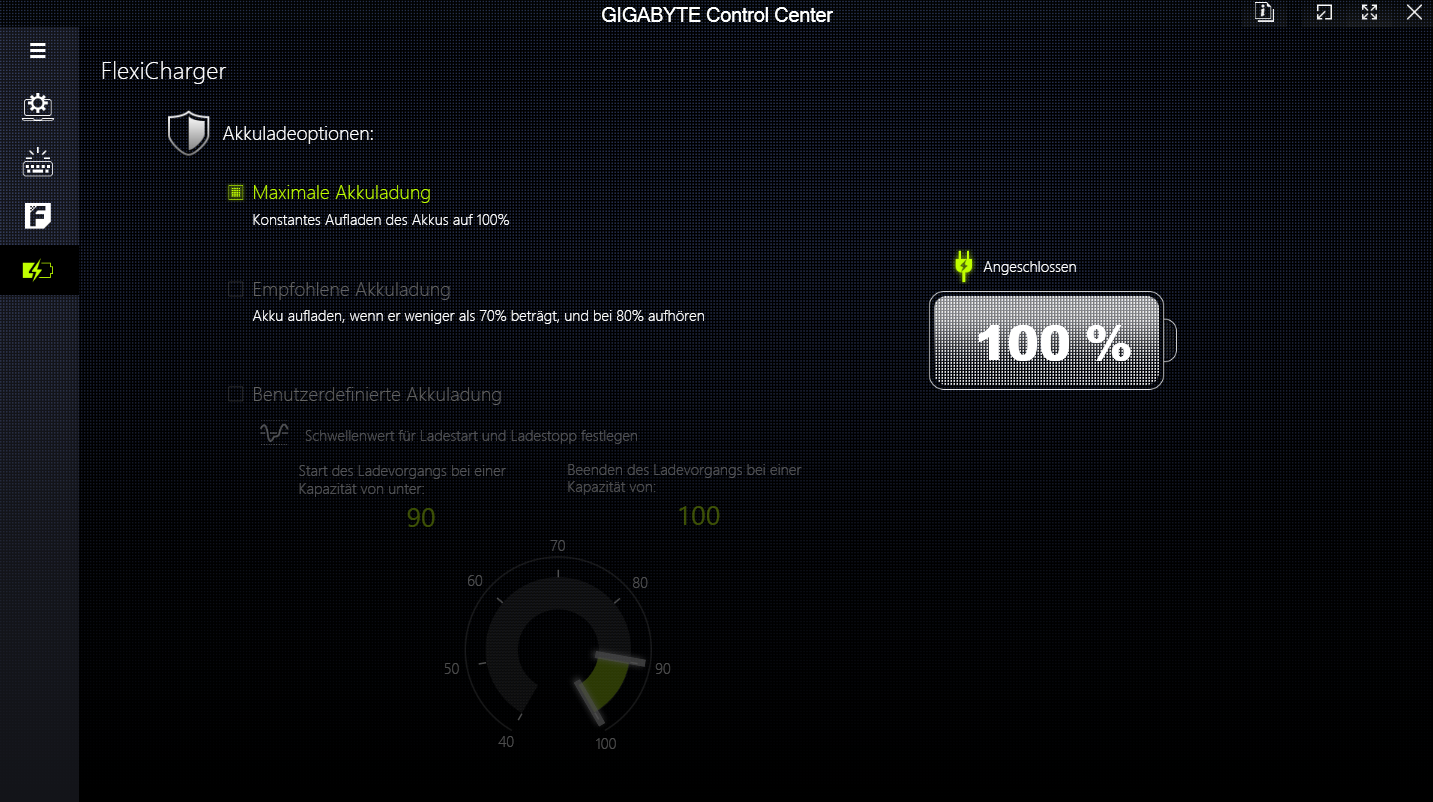
O G6X oferece três modos de desempenho específicos do fabricante (consulte a tabela abaixo), que podem ser alternados por meio do aplicativo Control Center. O "Modo de entretenimento" foi usado para benchmarks, enquanto o "Modo silencioso" foi empregado para os testes de bateria. Ambos os modos oferecem controle automático da ventoinha.
| Modo de desempenho | Modo de entretenimento | Modo silencioso (= dGPU desligada) | |
|---|---|---|---|
| Limite de energia 1 (HWInfo) | 135 W | 55 W | 25 W |
| Limite de energia 2 (HWInfo) | 155 W | 115 W | 30 W |
| Ruído (o Witcher 3 1080p Ultra) | 55 dB(A) | 51 dB(A) | 33 dB(A) |
| Desempenho ( Witcher 3 1080p Ultra) | ~102 fps | ~100 fps | 4 fps |
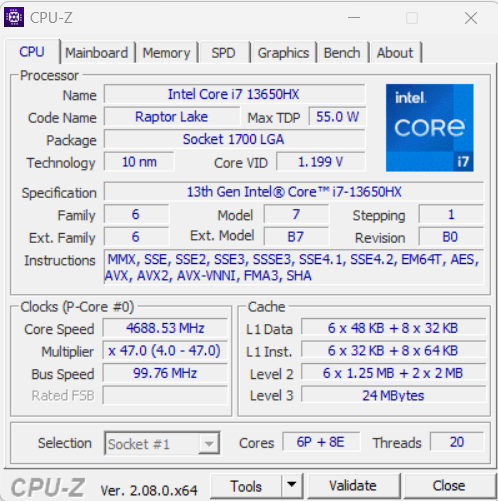
Processador
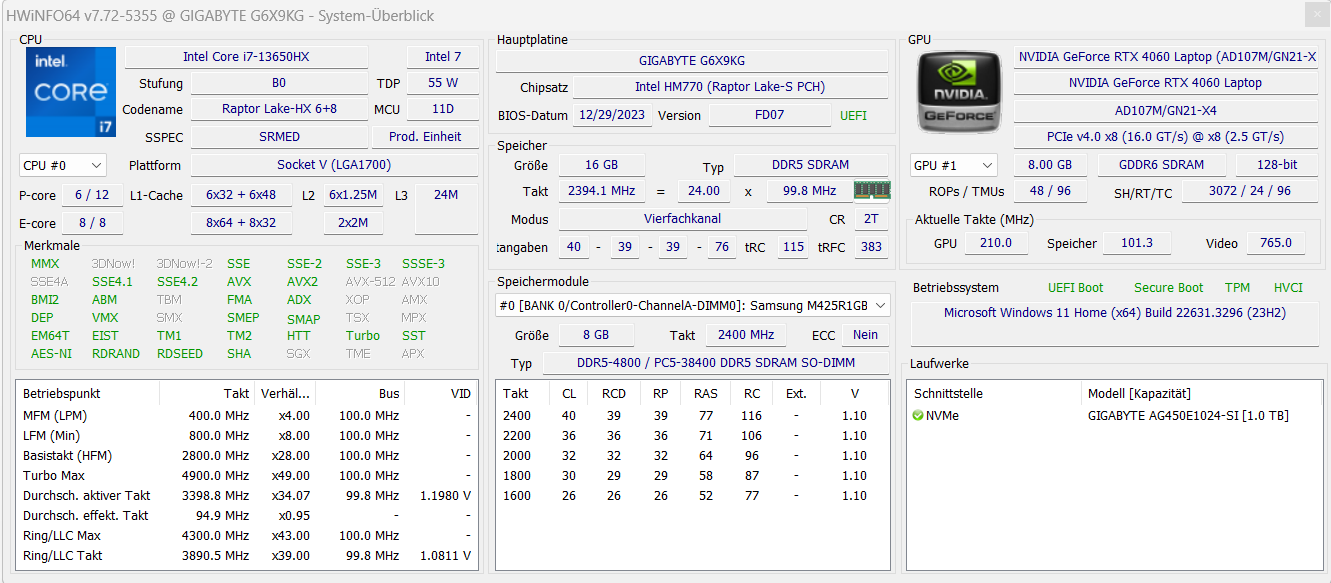
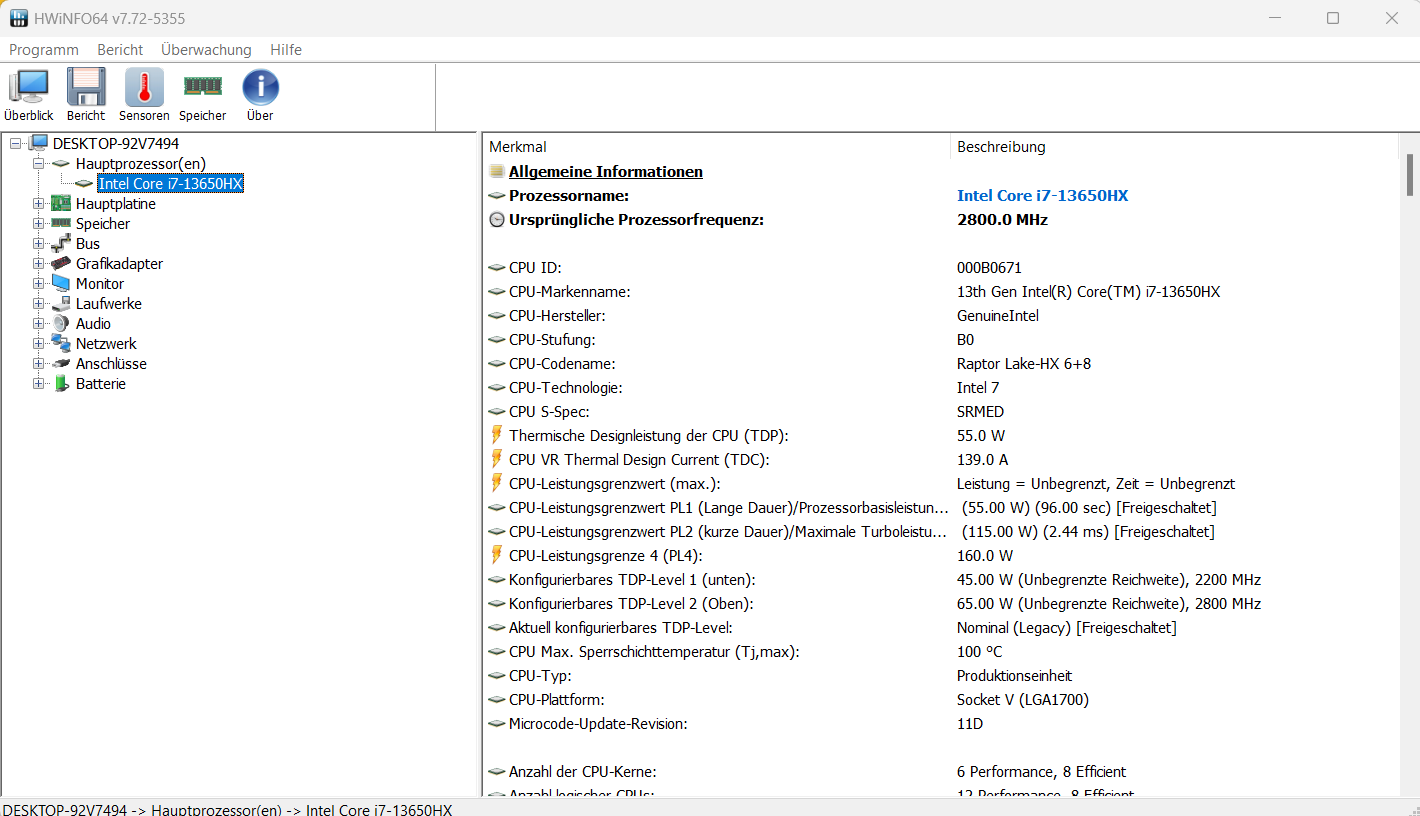
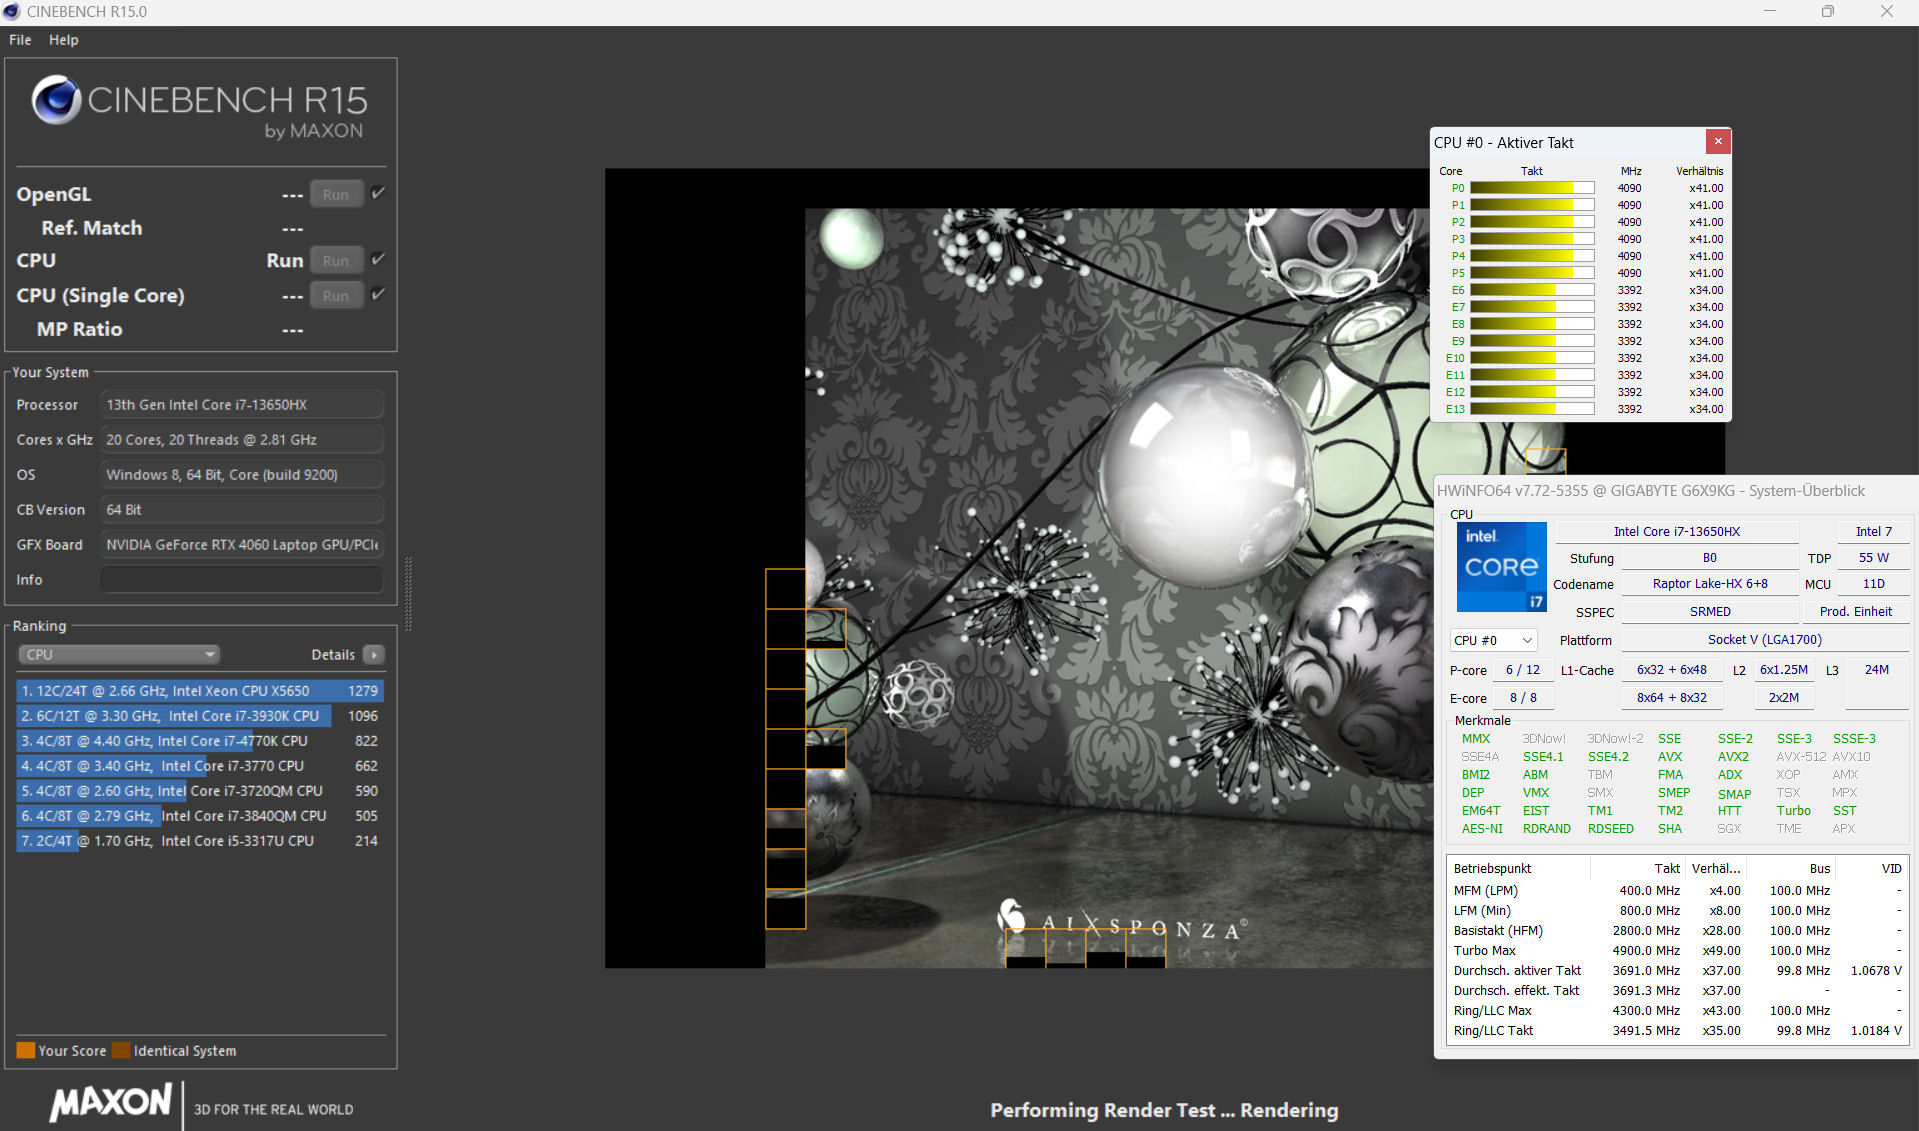
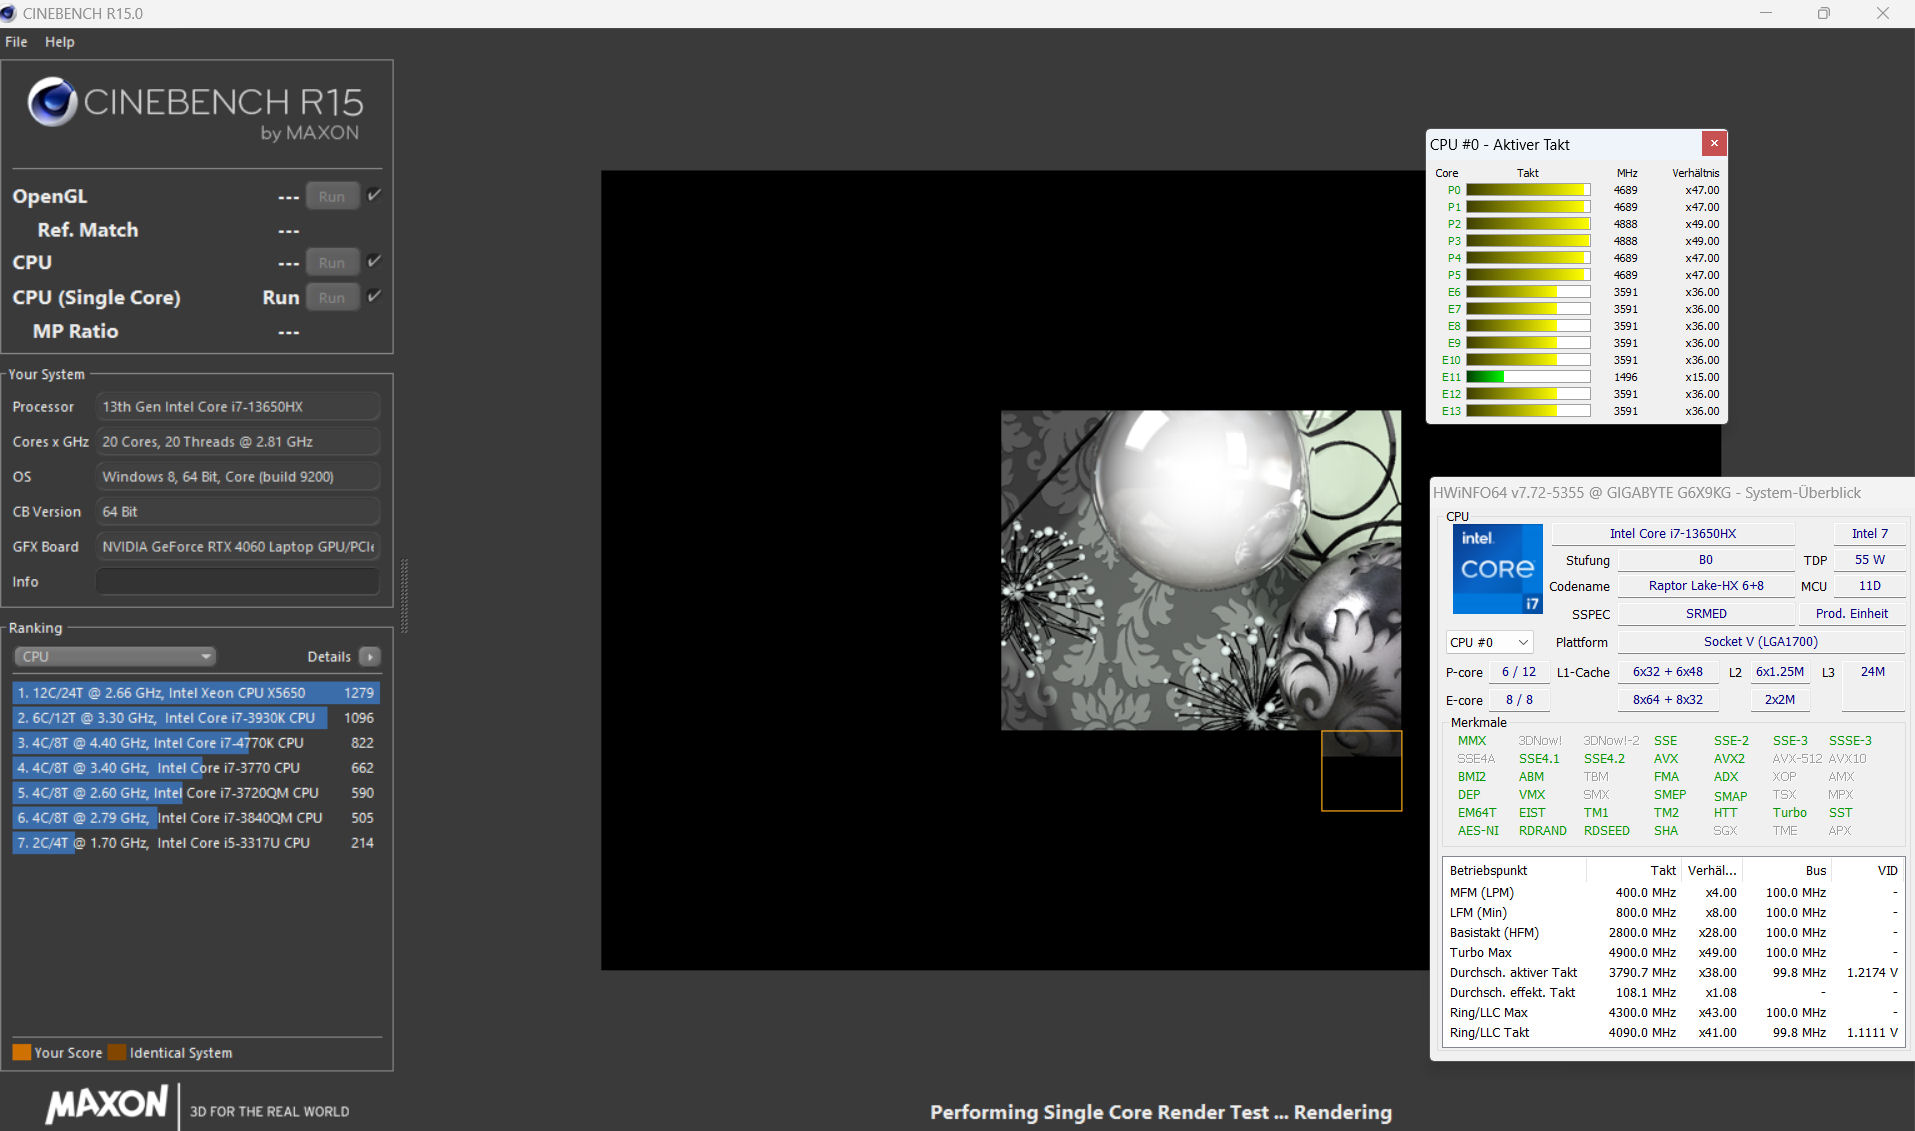
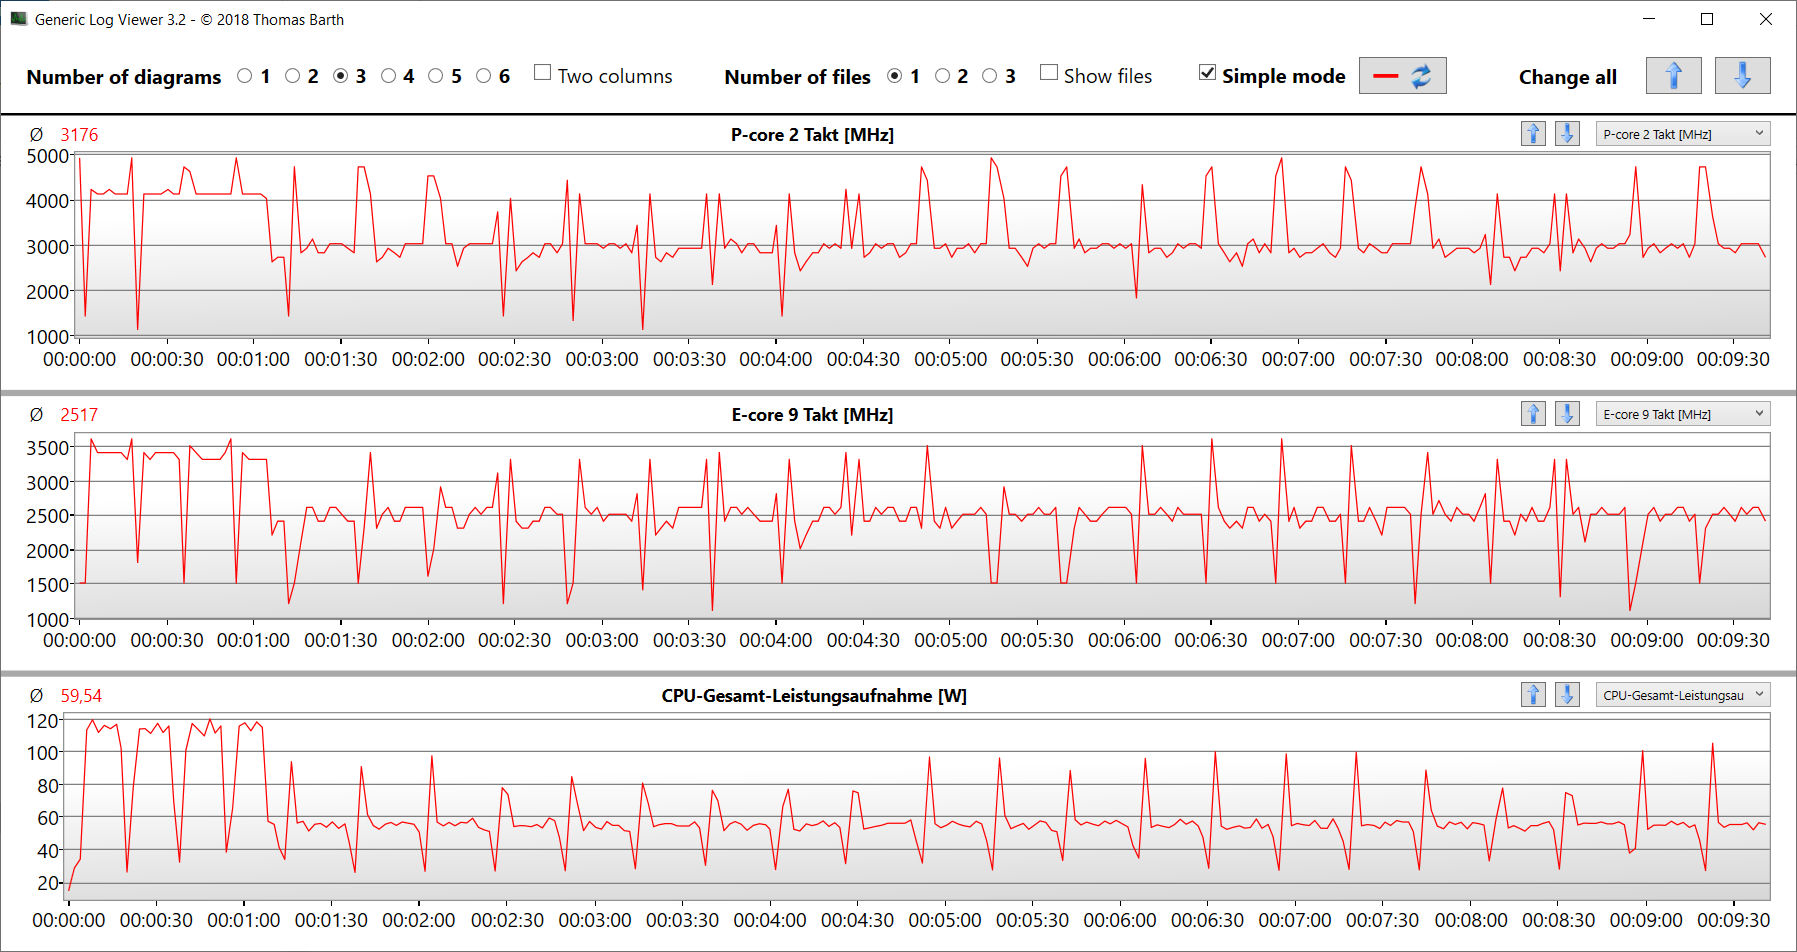
Os 14 núcleos de CPU do Core i7-13650HX (6P+8E) atingem taxas de clock máximas de 4,9 GHz (P) e 3,6 GHz (E). A carga contínua de vários threads (loop de vários núcleos do Cinebench R15) faz com que a taxa de clock caia da quarta para a quinta execução. Depois disso, é mantido um nível razoavelmente constante. O modo Desempenho garante valores permanentemente mais altos.
Os valores de benchmark estão ligeiramente abaixo da média da CPU, mas o modo Desempenho resulta em pequenos ganhos. No modo de bateria, o desempenho single-thread mais relevante no Cinebench R15 cai menos (168 pontos) do que o desempenho multi-thread (1.225 pontos).
Cinebench R15 Multi-core loop test
| LibreOffice - 20 Documents To PDF | |
| Dell G16, i7-13650HX, RTX 4060 (6.3.4.2) | |
| Média da turma Gaming (33.2 - 88.8, n=106, últimos 2 anos) | |
| Média Intel Core i7-13650HX (38.9 - 58.8, n=5) | |
| Lenovo Legion 5 16IRX G9 (6.3.4.2) | |
| Asus TUF Gaming A16 FA617XS | |
| Gigabyte G6X 9KG (2024) (6.3.4.2) | |
| MSI Raider GE68HX 13VF | |
* ... menor é melhor
AIDA64: FP32 Ray-Trace | FPU Julia | CPU SHA3 | CPU Queen | FPU SinJulia | FPU Mandel | CPU AES | CPU ZLib | FP64 Ray-Trace | CPU PhotoWorxx
| Performance rating | |
| MSI Raider GE68HX 13VF | |
| Média da turma Gaming | |
| Asus TUF Gaming A16 FA617XS | |
| Lenovo Legion 5 16IRX G9 | |
| Dell G16, i7-13650HX, RTX 4060 | |
| Média Intel Core i7-13650HX | |
| Gigabyte G6X 9KG (2024) | |
| AIDA64 / FP32 Ray-Trace | |
| Média da turma Gaming (10227 - 85542, n=105, últimos 2 anos) | |
| Asus TUF Gaming A16 FA617XS (v6.75.6100) | |
| MSI Raider GE68HX 13VF (v6.85.6300) | |
| Lenovo Legion 5 16IRX G9 (v6.92.6600) | |
| Dell G16, i7-13650HX, RTX 4060 (v6.92.6600) | |
| Média Intel Core i7-13650HX (13404 - 20012, n=5) | |
| Gigabyte G6X 9KG (2024) (v6.92.6600) | |
| AIDA64 / FPU Julia | |
| Média da turma Gaming (51376 - 238426, n=105, últimos 2 anos) | |
| MSI Raider GE68HX 13VF (v6.85.6300) | |
| Asus TUF Gaming A16 FA617XS (v6.75.6100) | |
| Lenovo Legion 5 16IRX G9 (v6.92.6600) | |
| Dell G16, i7-13650HX, RTX 4060 (v6.92.6600) | |
| Média Intel Core i7-13650HX (68241 - 97317, n=5) | |
| Gigabyte G6X 9KG (2024) (v6.92.6600) | |
| AIDA64 / CPU SHA3 | |
| MSI Raider GE68HX 13VF (v6.85.6300) | |
| Média da turma Gaming (2180 - 9817, n=105, últimos 2 anos) | |
| Asus TUF Gaming A16 FA617XS (v6.75.6100) | |
| Dell G16, i7-13650HX, RTX 4060 (v6.92.6600) | |
| Lenovo Legion 5 16IRX G9 (v6.92.6600) | |
| Média Intel Core i7-13650HX (3127 - 4487, n=5) | |
| Gigabyte G6X 9KG (2024) (v6.92.6600) | |
| AIDA64 / CPU Queen | |
| MSI Raider GE68HX 13VF (v6.85.6300) | |
| Asus TUF Gaming A16 FA617XS (v6.75.6100) | |
| Média da turma Gaming (49785 - 173351, n=92, últimos 2 anos) | |
| Gigabyte G6X 9KG (2024) (v6.92.6600) | |
| Média Intel Core i7-13650HX (108627 - 110589, n=5) | |
| Dell G16, i7-13650HX, RTX 4060 (v6.92.6600) | |
| Lenovo Legion 5 16IRX G9 (v6.92.6600) | |
| AIDA64 / FPU SinJulia | |
| MSI Raider GE68HX 13VF (v6.85.6300) | |
| Asus TUF Gaming A16 FA617XS (v6.75.6100) | |
| Média da turma Gaming (4424 - 33636, n=105, últimos 2 anos) | |
| Lenovo Legion 5 16IRX G9 (v6.92.6600) | |
| Dell G16, i7-13650HX, RTX 4060 (v6.92.6600) | |
| Média Intel Core i7-13650HX (9134 - 10887, n=5) | |
| Gigabyte G6X 9KG (2024) (v6.92.6600) | |
| AIDA64 / FPU Mandel | |
| Média da turma Gaming (25115 - 128721, n=105, últimos 2 anos) | |
| MSI Raider GE68HX 13VF (v6.85.6300) | |
| Asus TUF Gaming A16 FA617XS (v6.75.6100) | |
| Lenovo Legion 5 16IRX G9 (v6.92.6600) | |
| Dell G16, i7-13650HX, RTX 4060 (v6.92.6600) | |
| Média Intel Core i7-13650HX (33391 - 48323, n=5) | |
| Gigabyte G6X 9KG (2024) (v6.92.6600) | |
| AIDA64 / CPU AES | |
| MSI Raider GE68HX 13VF (v6.85.6300) | |
| Média da turma Gaming (39258 - 247074, n=105, últimos 2 anos) | |
| Lenovo Legion 5 16IRX G9 (v6.92.6600) | |
| Asus TUF Gaming A16 FA617XS (v6.75.6100) | |
| Dell G16, i7-13650HX, RTX 4060 (v6.92.6600) | |
| Média Intel Core i7-13650HX (64436 - 85343, n=5) | |
| Gigabyte G6X 9KG (2024) (v6.92.6600) | |
| AIDA64 / CPU ZLib | |
| MSI Raider GE68HX 13VF (v6.85.6300) | |
| Média da turma Gaming (574 - 2531, n=105, últimos 2 anos) | |
| Lenovo Legion 5 16IRX G9 (v6.92.6600) | |
| Dell G16, i7-13650HX, RTX 4060 (v6.92.6600) | |
| Média Intel Core i7-13650HX (1136 - 1285, n=5) | |
| Gigabyte G6X 9KG (2024) (v6.92.6600) | |
| Asus TUF Gaming A16 FA617XS (v6.75.6100) | |
| AIDA64 / FP64 Ray-Trace | |
| Média da turma Gaming (5509 - 45446, n=105, últimos 2 anos) | |
| Asus TUF Gaming A16 FA617XS (v6.75.6100) | |
| MSI Raider GE68HX 13VF (v6.85.6300) | |
| Dell G16, i7-13650HX, RTX 4060 (v6.92.6600) | |
| Lenovo Legion 5 16IRX G9 (v6.92.6600) | |
| Média Intel Core i7-13650HX (7270 - 10900, n=5) | |
| Gigabyte G6X 9KG (2024) (v6.92.6600) | |
| AIDA64 / CPU PhotoWorxx | |
| MSI Raider GE68HX 13VF (v6.85.6300) | |
| Média da turma Gaming (12271 - 89891, n=105, últimos 2 anos) | |
| Média Intel Core i7-13650HX (36170 - 43289, n=5) | |
| Gigabyte G6X 9KG (2024) (v6.92.6600) | |
| Dell G16, i7-13650HX, RTX 4060 (v6.92.6600) | |
| Lenovo Legion 5 16IRX G9 (v6.92.6600) | |
| Asus TUF Gaming A16 FA617XS (v6.75.6100) | |
Desempenho do sistema
O Gigabyte G6X funciona sem problemas e não tem falta de potência de computação. O notebook lida com jogos, streaming e renderização sem nenhum problema.
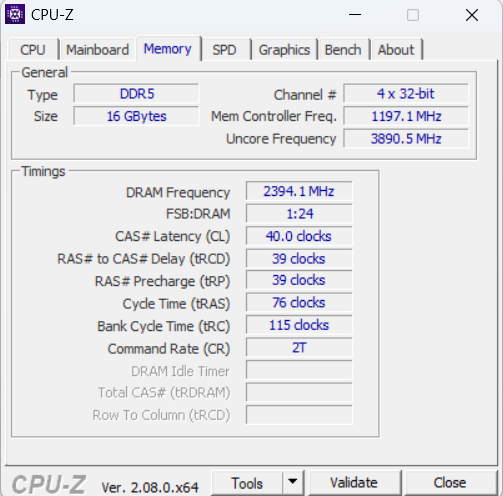
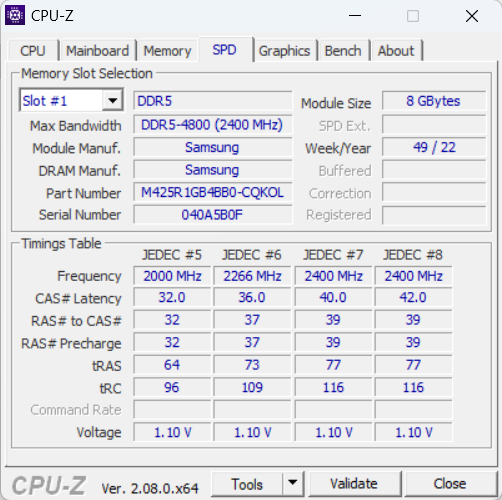
As taxas de transferência da RAM estão em um nível normal para a RAM DDR5-4800.
CrossMark: Overall | Productivity | Creativity | Responsiveness
WebXPRT 3: Overall
WebXPRT 4: Overall
Mozilla Kraken 1.1: Total
| PCMark 10 / Score | |
| Média da turma Gaming (5828 - 11574, n=94, últimos 2 anos) | |
| MSI Raider GE68HX 13VF | |
| Asus TUF Gaming A16 FA617XS | |
| Lenovo Legion 5 16IRX G9 | |
| Gigabyte G6X 9KG (2024) | |
| Dell G16, i7-13650HX, RTX 4060 | |
| Média Intel Core i7-13650HX, NVIDIA GeForce RTX 4060 Laptop GPU (6984 - 7613, n=3) | |
| PCMark 10 / Essentials | |
| MSI Raider GE68HX 13VF | |
| Asus TUF Gaming A16 FA617XS | |
| Lenovo Legion 5 16IRX G9 | |
| Média da turma Gaming (8810 - 11935, n=98, últimos 2 anos) | |
| Média Intel Core i7-13650HX, NVIDIA GeForce RTX 4060 Laptop GPU (9532 - 11151, n=3) | |
| Gigabyte G6X 9KG (2024) | |
| Dell G16, i7-13650HX, RTX 4060 | |
| PCMark 10 / Productivity | |
| Média da turma Gaming (6845 - 21327, n=96, últimos 2 anos) | |
| Asus TUF Gaming A16 FA617XS | |
| Gigabyte G6X 9KG (2024) | |
| Média Intel Core i7-13650HX, NVIDIA GeForce RTX 4060 Laptop GPU (9961 - 10204, n=3) | |
| Dell G16, i7-13650HX, RTX 4060 | |
| MSI Raider GE68HX 13VF | |
| Lenovo Legion 5 16IRX G9 | |
| PCMark 10 / Digital Content Creation | |
| Média da turma Gaming (7602 - 19657, n=96, últimos 2 anos) | |
| MSI Raider GE68HX 13VF | |
| Lenovo Legion 5 16IRX G9 | |
| Asus TUF Gaming A16 FA617XS | |
| Dell G16, i7-13650HX, RTX 4060 | |
| Gigabyte G6X 9KG (2024) | |
| Média Intel Core i7-13650HX, NVIDIA GeForce RTX 4060 Laptop GPU (8323 - 11686, n=3) | |
| CrossMark / Overall | |
| Lenovo Legion 5 16IRX G9 | |
| Média da turma Gaming (1366 - 2409, n=94, últimos 2 anos) | |
| MSI Raider GE68HX 13VF | |
| Gigabyte G6X 9KG (2024) | |
| Média Intel Core i7-13650HX, NVIDIA GeForce RTX 4060 Laptop GPU (1839 - 1951, n=3) | |
| Dell G16, i7-13650HX, RTX 4060 | |
| Asus TUF Gaming A16 FA617XS | |
| CrossMark / Productivity | |
| Lenovo Legion 5 16IRX G9 | |
| Gigabyte G6X 9KG (2024) | |
| Média da turma Gaming (1386 - 2254, n=94, últimos 2 anos) | |
| MSI Raider GE68HX 13VF | |
| Média Intel Core i7-13650HX, NVIDIA GeForce RTX 4060 Laptop GPU (1730 - 1864, n=3) | |
| Dell G16, i7-13650HX, RTX 4060 | |
| Asus TUF Gaming A16 FA617XS | |
| CrossMark / Creativity | |
| Lenovo Legion 5 16IRX G9 | |
| MSI Raider GE68HX 13VF | |
| Média da turma Gaming (1343 - 2729, n=94, últimos 2 anos) | |
| Gigabyte G6X 9KG (2024) | |
| Média Intel Core i7-13650HX, NVIDIA GeForce RTX 4060 Laptop GPU (2020 - 2063, n=3) | |
| Dell G16, i7-13650HX, RTX 4060 | |
| Asus TUF Gaming A16 FA617XS | |
| CrossMark / Responsiveness | |
| Gigabyte G6X 9KG (2024) | |
| Lenovo Legion 5 16IRX G9 | |
| Média Intel Core i7-13650HX, NVIDIA GeForce RTX 4060 Laptop GPU (1544 - 1907, n=3) | |
| Média da turma Gaming (1226 - 2334, n=94, últimos 2 anos) | |
| Dell G16, i7-13650HX, RTX 4060 | |
| MSI Raider GE68HX 13VF | |
| Asus TUF Gaming A16 FA617XS | |
| WebXPRT 3 / Overall | |
| MSI Raider GE68HX 13VF | |
| Média da turma Gaming (220 - 532, n=98, últimos 2 anos) | |
| Lenovo Legion 5 16IRX G9 | |
| Gigabyte G6X 9KG (2024) | |
| Média Intel Core i7-13650HX, NVIDIA GeForce RTX 4060 Laptop GPU (268 - 302, n=3) | |
| Dell G16, i7-13650HX, RTX 4060 | |
| WebXPRT 4 / Overall | |
| MSI Raider GE68HX 13VF | |
| Lenovo Legion 5 16IRX G9 | |
| Média da turma Gaming (165 - 354, n=99, últimos 2 anos) | |
| Média Intel Core i7-13650HX, NVIDIA GeForce RTX 4060 Laptop GPU (260 - 276, n=2) | |
| Asus TUF Gaming A16 FA617XS | |
| Gigabyte G6X 9KG (2024) | |
| Mozilla Kraken 1.1 / Total | |
| Gigabyte G6X 9KG (2024) | |
| Média Intel Core i7-13650HX, NVIDIA GeForce RTX 4060 Laptop GPU (507 - 511, n=3) | |
| Dell G16, i7-13650HX, RTX 4060 | |
| Asus TUF Gaming A16 FA617XS | |
| Lenovo Legion 5 16IRX G9 | |
| Média da turma Gaming (391 - 590, n=102, últimos 2 anos) | |
| MSI Raider GE68HX 13VF | |
* ... menor é melhor
| PCMark 10 Score | 7613 pontos | |
Ajuda | ||
| AIDA64 / Memory Copy | |
| MSI Raider GE68HX 13VF | |
| Média da turma Gaming (21750 - 129946, n=105, últimos 2 anos) | |
| Média Intel Core i7-13650HX (59266 - 66372, n=5) | |
| Gigabyte G6X 9KG (2024) | |
| Lenovo Legion 5 16IRX G9 | |
| Asus TUF Gaming A16 FA617XS | |
| Dell G16, i7-13650HX, RTX 4060 | |
| AIDA64 / Memory Read | |
| MSI Raider GE68HX 13VF | |
| Média da turma Gaming (22956 - 118858, n=105, últimos 2 anos) | |
| Lenovo Legion 5 16IRX G9 | |
| Média Intel Core i7-13650HX (67305 - 71022, n=5) | |
| Gigabyte G6X 9KG (2024) | |
| Dell G16, i7-13650HX, RTX 4060 | |
| Asus TUF Gaming A16 FA617XS | |
| AIDA64 / Memory Write | |
| MSI Raider GE68HX 13VF | |
| Média da turma Gaming (22297 - 135096, n=105, últimos 2 anos) | |
| Asus TUF Gaming A16 FA617XS | |
| Média Intel Core i7-13650HX (58028 - 68225, n=5) | |
| Gigabyte G6X 9KG (2024) | |
| Dell G16, i7-13650HX, RTX 4060 | |
| Lenovo Legion 5 16IRX G9 | |
| AIDA64 / Memory Latency | |
| Média da turma Gaming (75.3 - 259, n=105, últimos 2 anos) | |
| Dell G16, i7-13650HX, RTX 4060 | |
| Asus TUF Gaming A16 FA617XS | |
| Gigabyte G6X 9KG (2024) | |
| Lenovo Legion 5 16IRX G9 | |
| Média Intel Core i7-13650HX (83.7 - 90.8, n=5) | |
| MSI Raider GE68HX 13VF | |
* ... menor é melhor
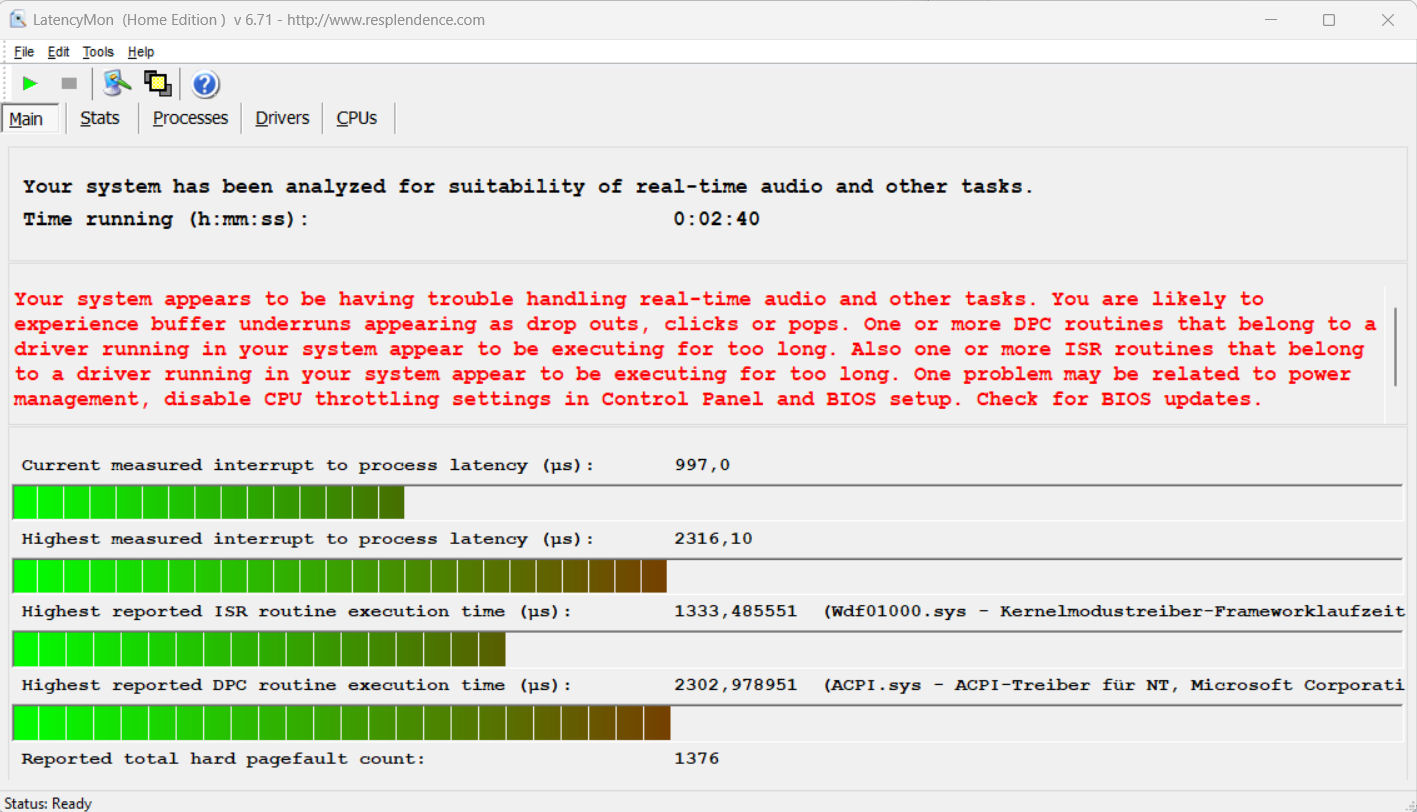
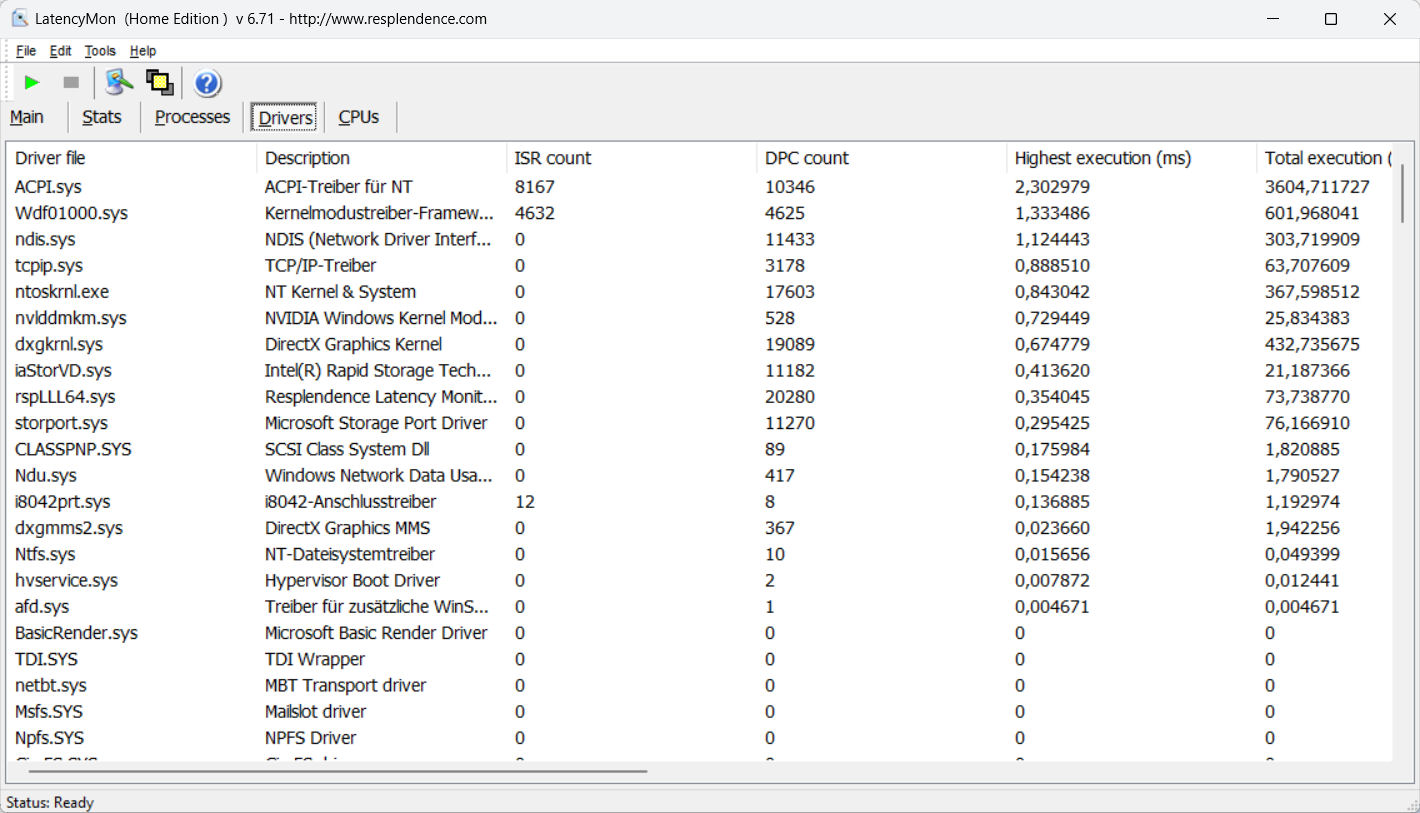
Latência DPC
O teste padronizado LatencyMon (navegação na Web, reprodução de vídeo 4k, Prime95 High-Load) revelou anomalias. O sistema não parece ser adequado para edição de vídeo e áudio em tempo real. Futuras atualizações de software podem levar a melhorias ou até mesmo a deteriorações.
| DPC Latencies / LatencyMon - interrupt to process latency (max), Web, Youtube, Prime95 | |
| MSI Raider GE68HX 13VF | |
| Gigabyte G6X 9KG (2024) | |
| Lenovo Legion 5 16IRX G9 | |
| Asus TUF Gaming A16 FA617XS | |
| Dell G16, i7-13650HX, RTX 4060 | |
* ... menor é melhor
Armazenamento em massa
O G6X pode acomodar um total de dois SSDs M.2 2280 PCIe Gen 4. Não há suporte para RAID. O SSD Gigabyte de 1 TB em nosso dispositivo de teste oferece taxas de dados muito boas.
Não observamos nenhum problema de estrangulamento térmico, o que é bom.

* ... menor é melhor
Disk Throttling: DiskSpd Read Loop, Queue Depth 8
Placa de vídeo
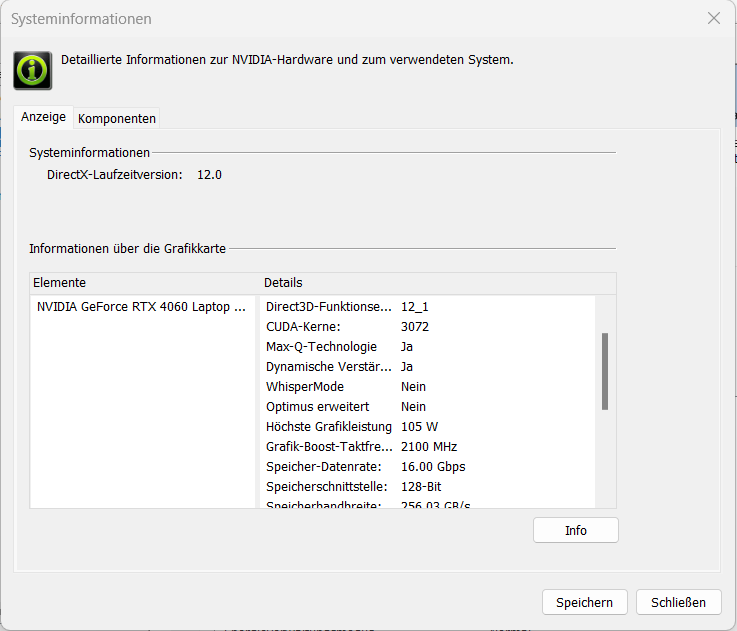
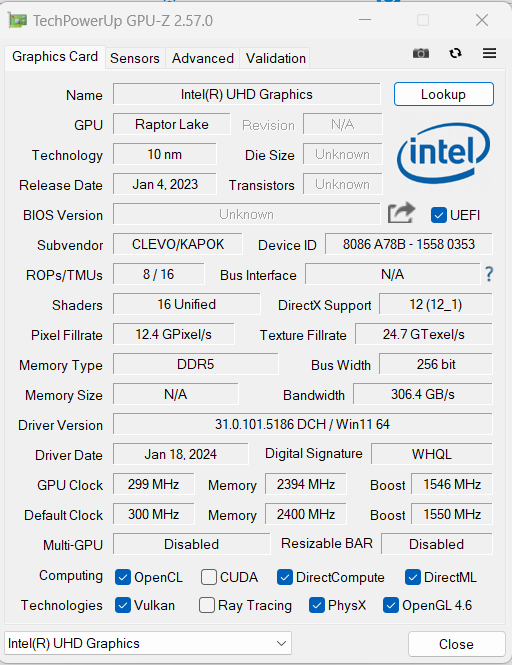
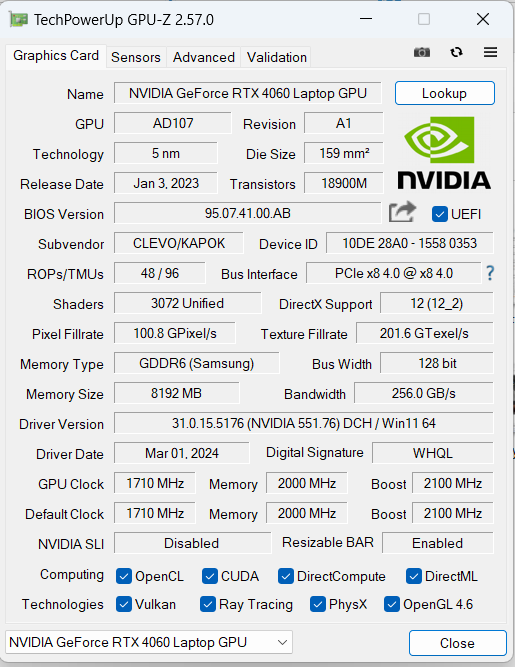
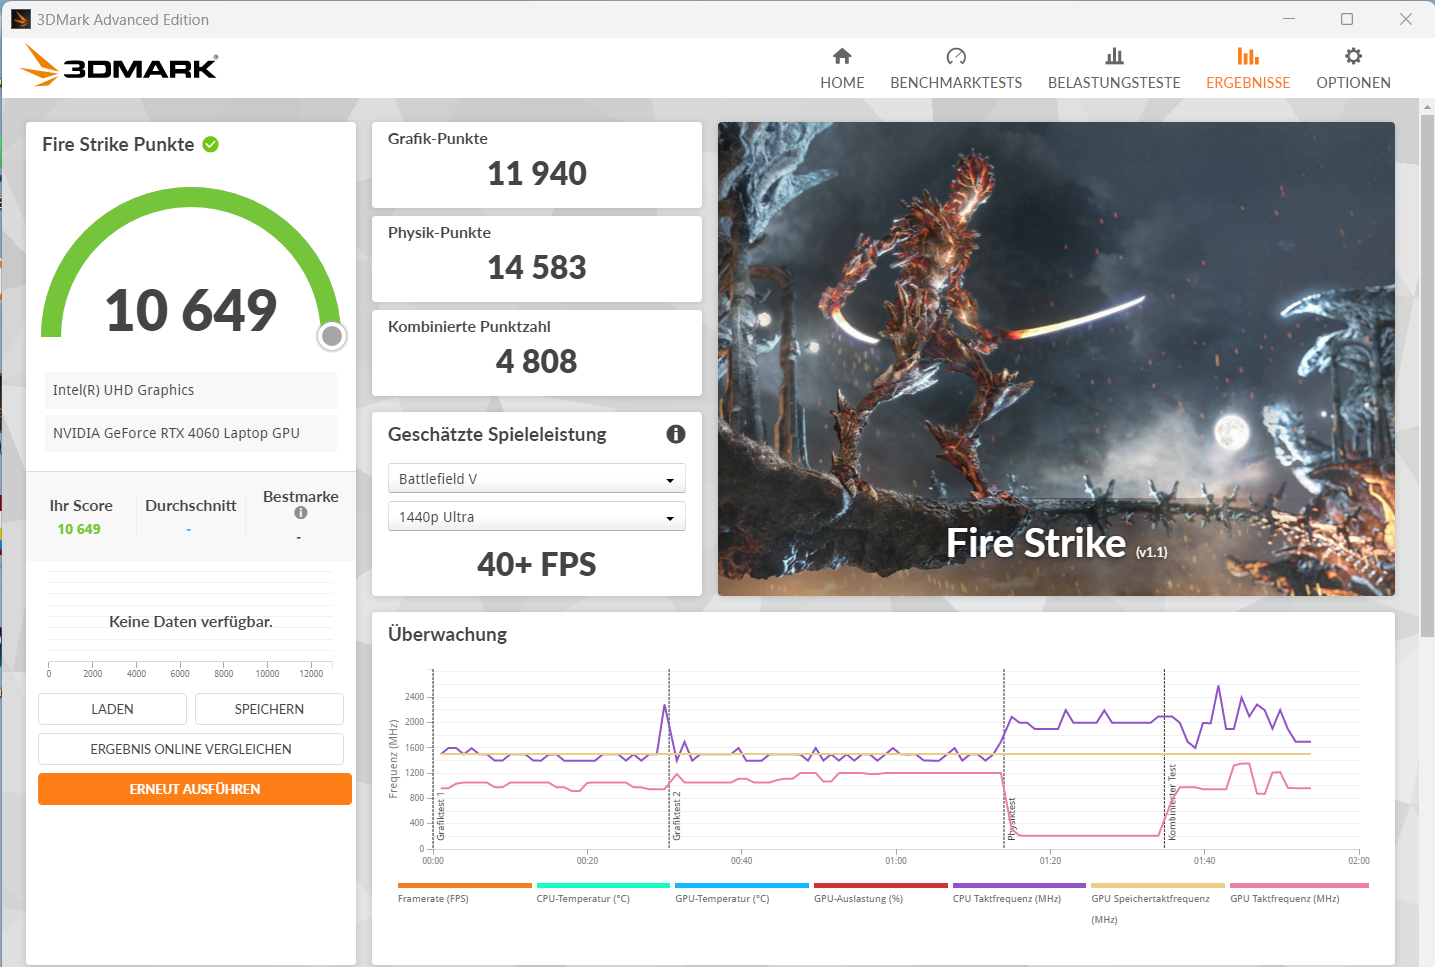
A Gigabyte instala uma GPU para laptop RTX 4060 de 105 W GeForce GPU para laptop RTX 4060 de 105 W (3.424 shaders, barramento de 128 bits, 8 GB GDDR6) no G6X 9KG. A RTX 4060 é um modelo de médio porte da atual linha de GPUs da Nvidia.
Os valores de benchmark e as taxas de quadros estão acima da média da RTX 4060. O modo de desempenho oferece uma pequena vantagem, na melhor das hipóteses. A alternância entre os modos dGPU e Optimus requer uma reinicialização, pois não há suporte para o Advanced Optimus.
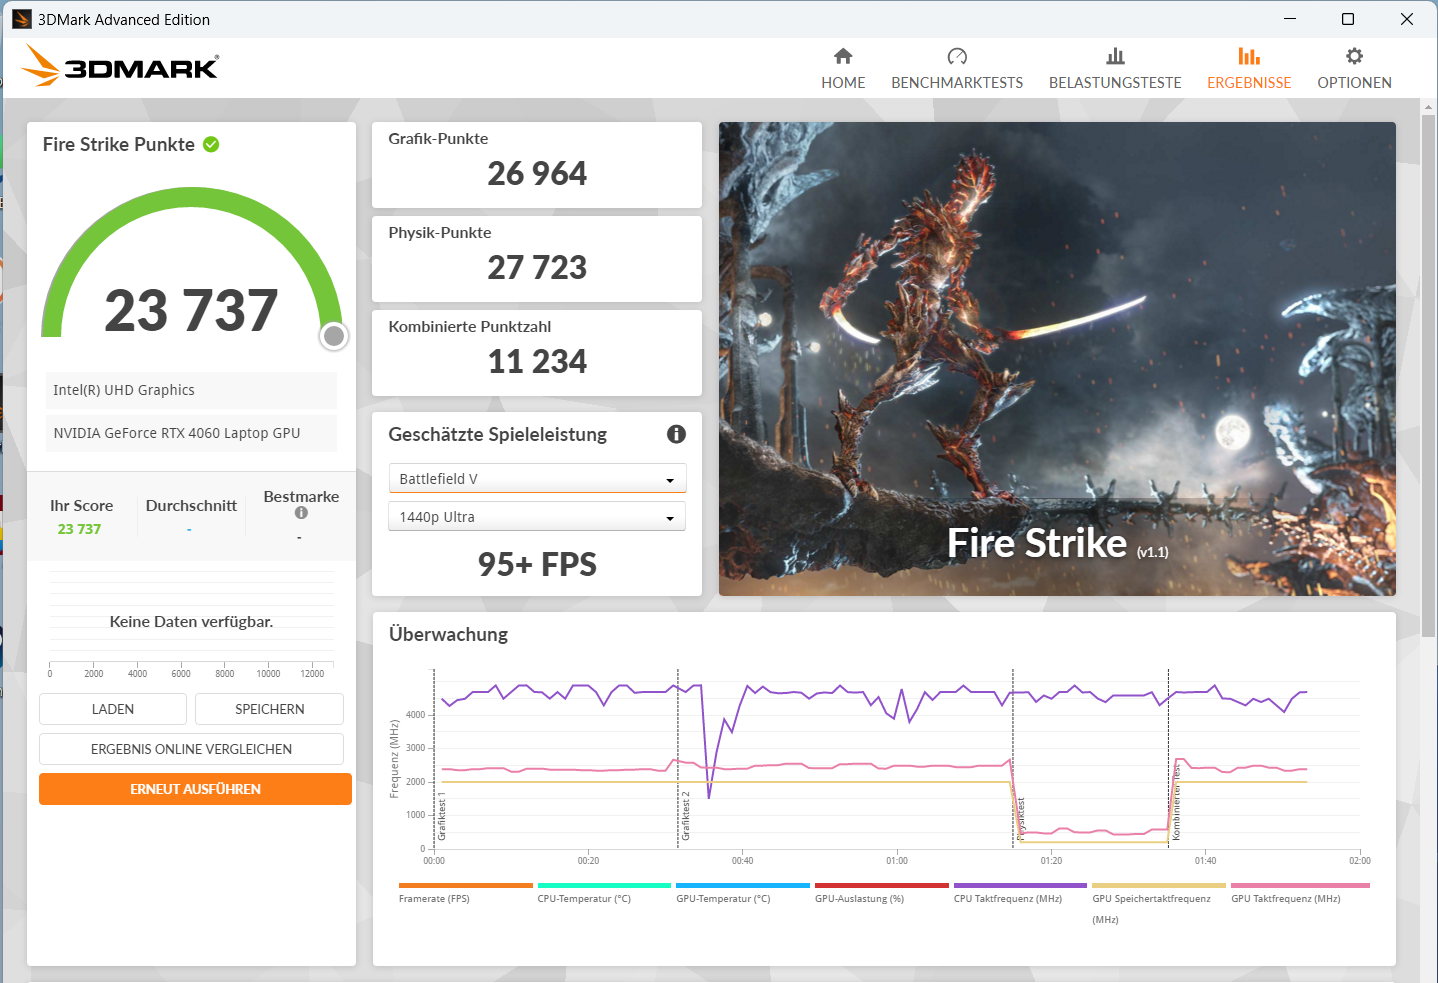
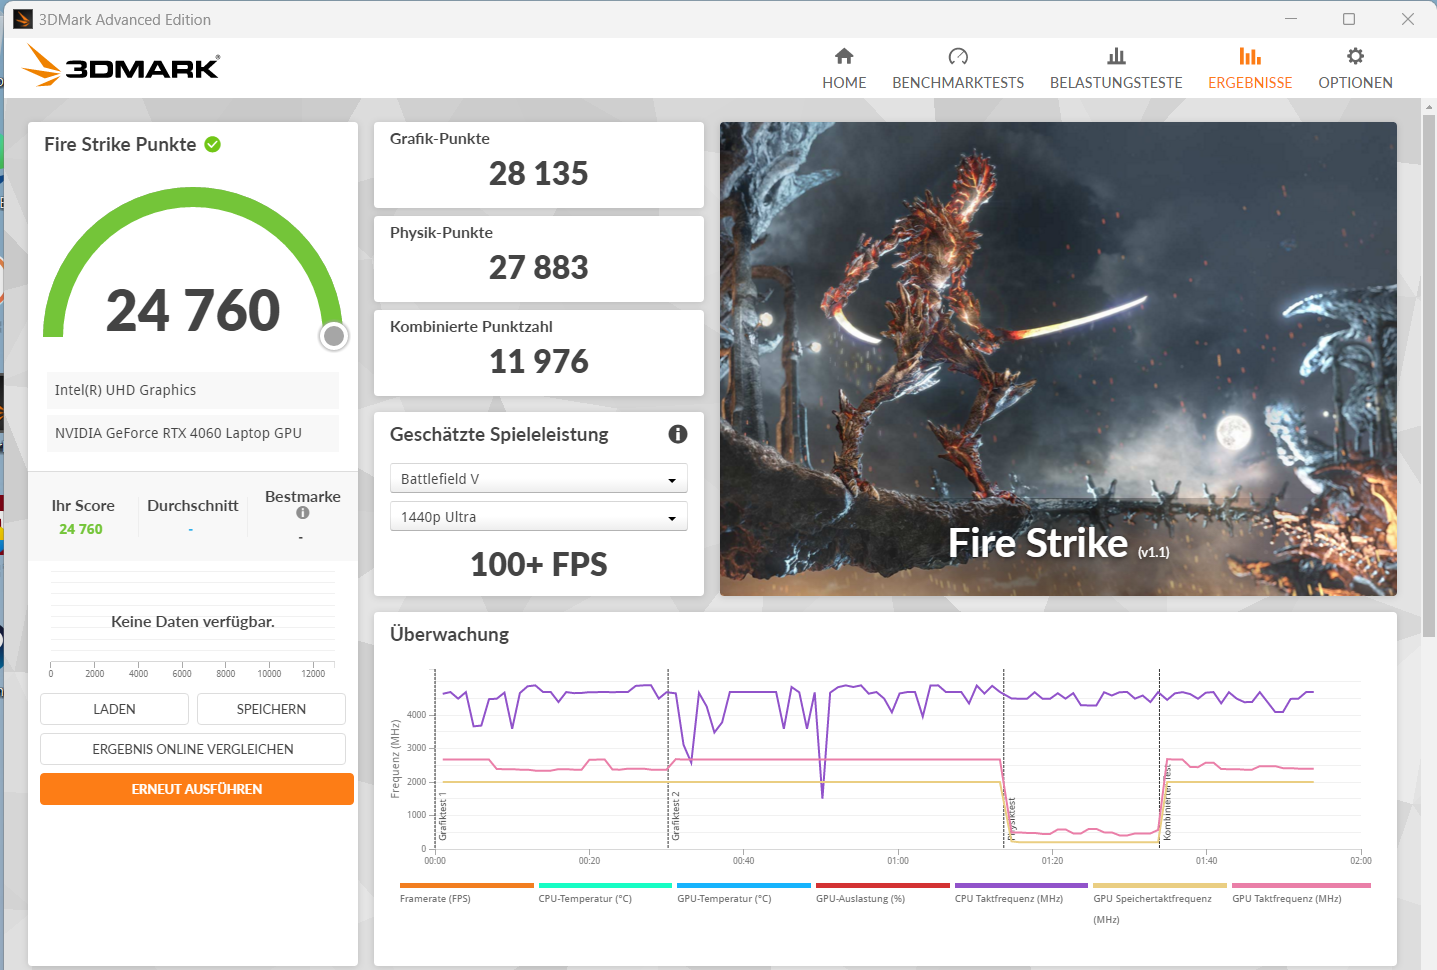
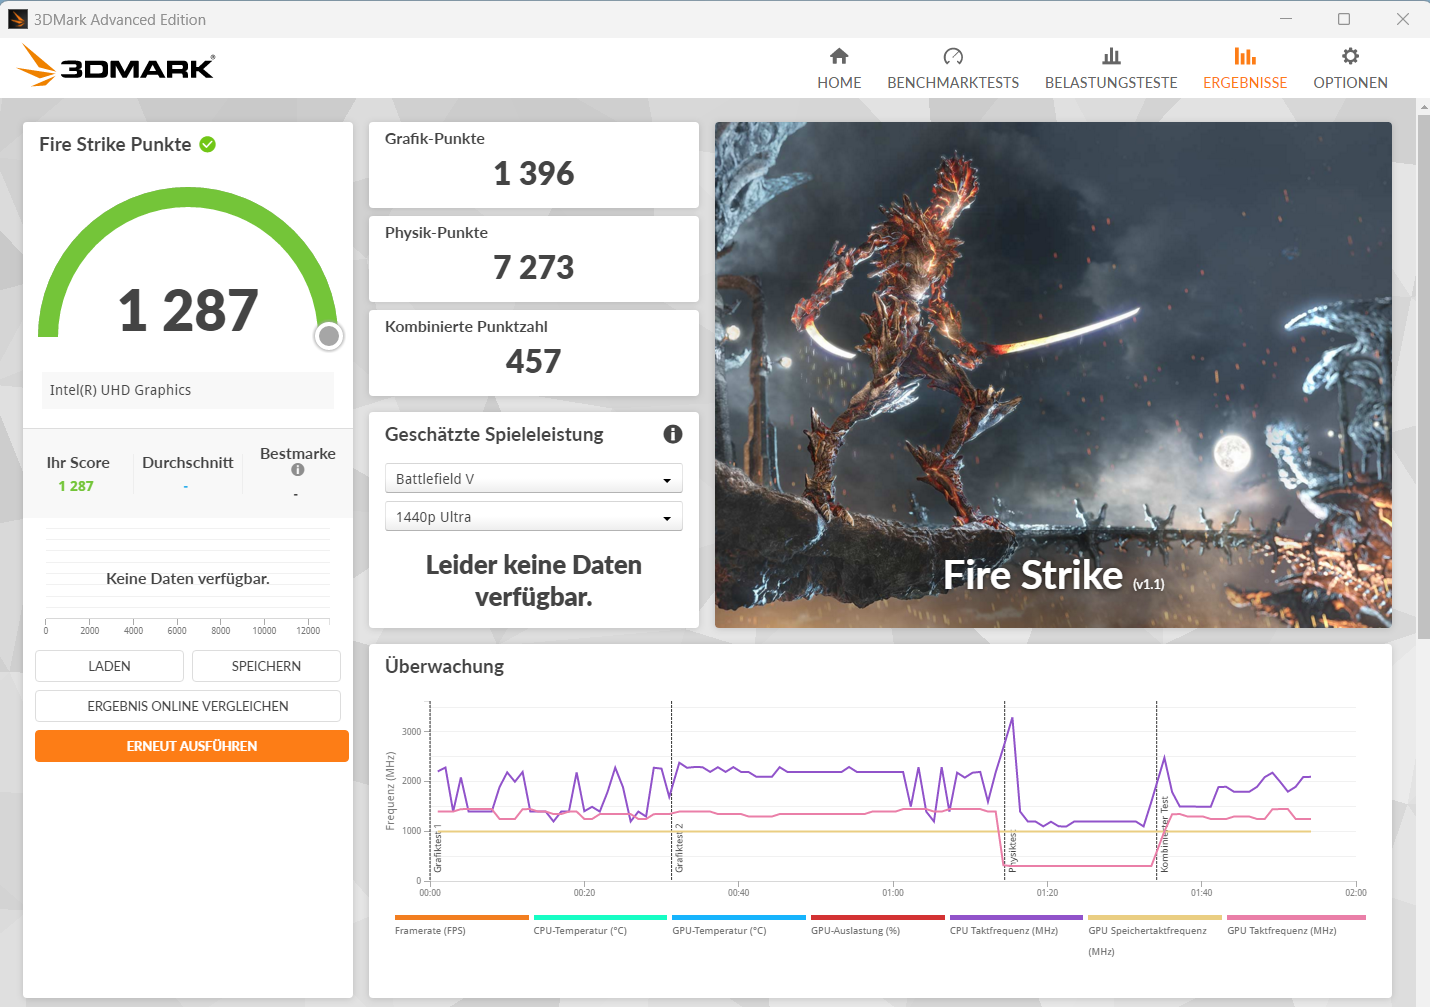
| 3DMark 11 Performance | 30293 pontos | |
| 3DMark Fire Strike Score | 23737 pontos | |
| 3DMark Time Spy Score | 10260 pontos | |
Ajuda | ||
* ... menor é melhor
| The Witcher 3 - 1920x1080 Ultra Graphics & Postprocessing (HBAO+) | |
| Média da turma Gaming (95 - 240, n=7, últimos 2 anos) | |
| Dell G16, i7-13650HX, RTX 4060 | |
| MSI Raider GE68HX 13VF | |
| Média NVIDIA GeForce RTX 4060 Laptop GPU (77 - 159.7, n=42) | |
| Gigabyte G6X 9KG (2024) | |
| Asus TUF Gaming A16 FA617XS (neu) | |
| Lenovo Legion 5 16IRX G9 | |
| Final Fantasy XV Benchmark - 1920x1080 High Quality | |
| Média da turma Gaming (41 - 215, n=96, últimos 2 anos) | |
| Lenovo Legion 5 16IRX G9 (1.3) | |
| Dell G16, i7-13650HX, RTX 4060 (1.3) | |
| MSI Raider GE68HX 13VF (1.3) | |
| Gigabyte G6X 9KG (2024) (1.3) | |
| Média NVIDIA GeForce RTX 4060 Laptop GPU (75.1 - 109.8, n=51) | |
| Asus TUF Gaming A16 FA617XS (1.3) | |
| Strange Brigade - 1920x1080 ultra AA:ultra AF:16 | |
| Média da turma Gaming (76.3 - 456, n=86, últimos 2 anos) | |
| Lenovo Legion 5 16IRX G9 | |
| Dell G16, i7-13650HX, RTX 4060 (1.47.22.14 D3D12) | |
| MSI Raider GE68HX 13VF (1.47.22.14 D3D12) | |
| Gigabyte G6X 9KG (2024) (1.47.22.14 D3D12) | |
| Média NVIDIA GeForce RTX 4060 Laptop GPU (135.3 - 210, n=50) | |
| Asus TUF Gaming A16 FA617XS (1.47.22.14 D3D12) | |
| Cyberpunk 2077 | |
| 1920x1080 Ultra Preset (FSR off) | |
| Média da turma Gaming (17.7 - 169.9, n=116, últimos 2 anos) | |
| Lenovo Legion 5 16IRX G9 | |
| Média NVIDIA GeForce RTX 4060 Laptop GPU (56.4 - 93.1, n=31) | |
| Dell G16, i7-13650HX, RTX 4060 | |
| Gigabyte G6X 9KG (2024) | |
| 1920x1080 Ray Tracing Ultra Preset (DLSS off) | |
| Média da turma Gaming (19.1 - 84.9, n=36, últimos 2 anos) | |
| Média NVIDIA GeForce RTX 4060 Laptop GPU (23.6 - 37.4, n=21) | |
| Gigabyte G6X 9KG (2024) | |
| 1920x1080 Ultra Preset (FSR2 on) | |
| Média da turma Gaming (58 - 173.1, n=7, últimos 2 anos) | |
| Gigabyte G6X 9KG (2024) | |
| Média NVIDIA GeForce RTX 4060 Laptop GPU (68.5 - 92.4, n=4) | |
| Skull & Bones - 1920x1080 Ultra High Preset AA:T | |
| Gigabyte G6X 9KG (2024) | |
| Média NVIDIA GeForce RTX 4060 Laptop GPU (65 - 73, n=5) | |
| Last Epoch - 1920x1080 Ultra Preset AA:T | |
| Gigabyte G6X 9KG (2024) | |
| Média NVIDIA GeForce RTX 4060 Laptop GPU (120.4 - 122.8, n=2) | |
| Média da turma Gaming (n=1últimos 2 anos) | |
| Helldivers 2 - 1920x1080 Ultra Preset | |
| Média da turma Gaming (18.4 - 153.8, n=5, últimos 2 anos) | |
| Gigabyte G6X 9KG (2024) | |
| Média NVIDIA GeForce RTX 4060 Laptop GPU (82.3 - 85.6, n=2) | |
| Ready or Not - 1920x1080 Epic Preset | |
| Média NVIDIA GeForce RTX 4060 Laptop GPU (131.5 - 133.7, n=2) | |
| Gigabyte G6X 9KG (2024) | |
The Witcher 3 FPS chart
| baixo | média | alto | ultra | |
|---|---|---|---|---|
| GTA V (2015) | 183.6 | 180.4 | 174.6 | 115.2 |
| The Witcher 3 (2015) | 400.9 | 306.6 | 186.5 | 100 |
| Dota 2 Reborn (2015) | 183.7 | 164.4 | 157.6 | 142.4 |
| Final Fantasy XV Benchmark (2018) | 186.5 | 139.3 | 101.5 | |
| X-Plane 11.11 (2018) | 155.1 | 132.7 | 107.1 | |
| Strange Brigade (2018) | 473 | 263 | 209 | 182.2 |
| Cyberpunk 2077 (2023) | 118.3 | 94.8 | 81.1 | 69.7 |
| Ready or Not (2023) | 218 | 152.4 | 147.6 | 131.5 |
| Helldivers 2 (2024) | 123.9 | 97.6 | 88.5 | 85.6 |
| Skull & Bones (2024) | 125 | 111 | 97 | 73 |
| Last Epoch (2024) | 195.5 | 184.6 | 164.1 | 122.8 |
Emissões e energia: O G6X oferece bons tempos de operação
Emissões de ruído
O nível de pressão sonora (SPL) aumenta para até 54 dB(A) com carga total (modo Entretenimento). O SPL pode ser mais alto no modo Performance. É possível obter uma operação significativamente mais silenciosa com o modo Silent.
No entanto, isso prejudica sensivelmente o desempenho, pois não é assim que a dGPU funciona. Em geral, o modo Entretenimento é recomendado para o uso diário. Além da carga total, o desenvolvimento de ruído permanece em um nível moderado.
Barulho
| Ocioso |
| 30 / 32 / 35 dB |
| Carga |
| 51 / 54 dB |
 | ||
30 dB silencioso 40 dB(A) audível 50 dB(A) ruidosamente alto |
||
min: | ||
| Gigabyte G6X 9KG (2024) i7-13650HX, GeForce RTX 4060 Laptop GPU | Dell G16, i7-13650HX, RTX 4060 i7-13650HX, GeForce RTX 4060 Laptop GPU | Lenovo Legion 5 16IRX G9 i7-14650HX, GeForce RTX 4060 Laptop GPU | MSI Raider GE68HX 13VF i9-13950HX, GeForce RTX 4060 Laptop GPU | Asus TUF Gaming A16 FA617XS R9 7940HS, Radeon RX 7600S | |
|---|---|---|---|---|---|
| Noise | 21% | 7% | 2% | 11% | |
| desligado / ambiente * (dB) | 26 | 23 12% | 24 8% | 23.3 10% | 25 4% |
| Idle Minimum * (dB) | 30 | 23 23% | 24 20% | 25 17% | 25 17% |
| Idle Average * (dB) | 32 | 23 28% | 28.8 10% | 31.3 2% | 26 19% |
| Idle Maximum * (dB) | 35 | 27.96 20% | 32 9% | 37.5 -7% | 28 20% |
| Load Average * (dB) | 51 | 27.96 45% | 45.5 11% | 44 14% | 43 16% |
| Witcher 3 ultra * (dB) | 51 | 47.89 6% | 53.1 -4% | 57 -12% | 51 -0% |
| Load Maximum * (dB) | 54 | 47.89 11% | 55.7 -3% | 60.1 -11% | 53 2% |
* ... menor é melhor
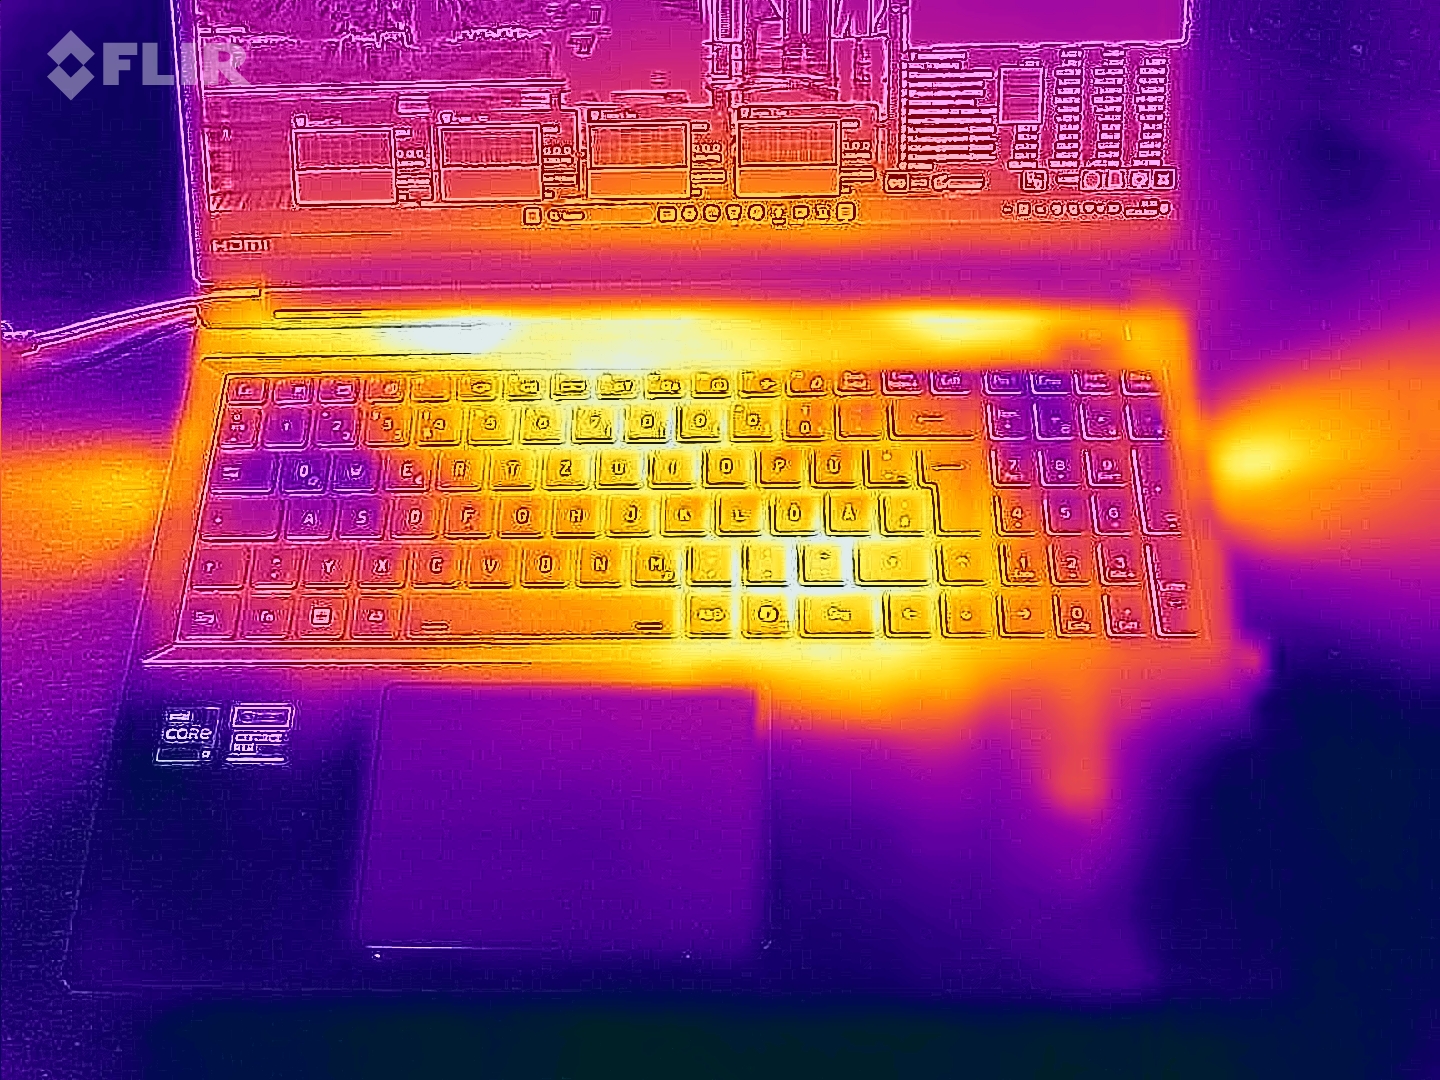
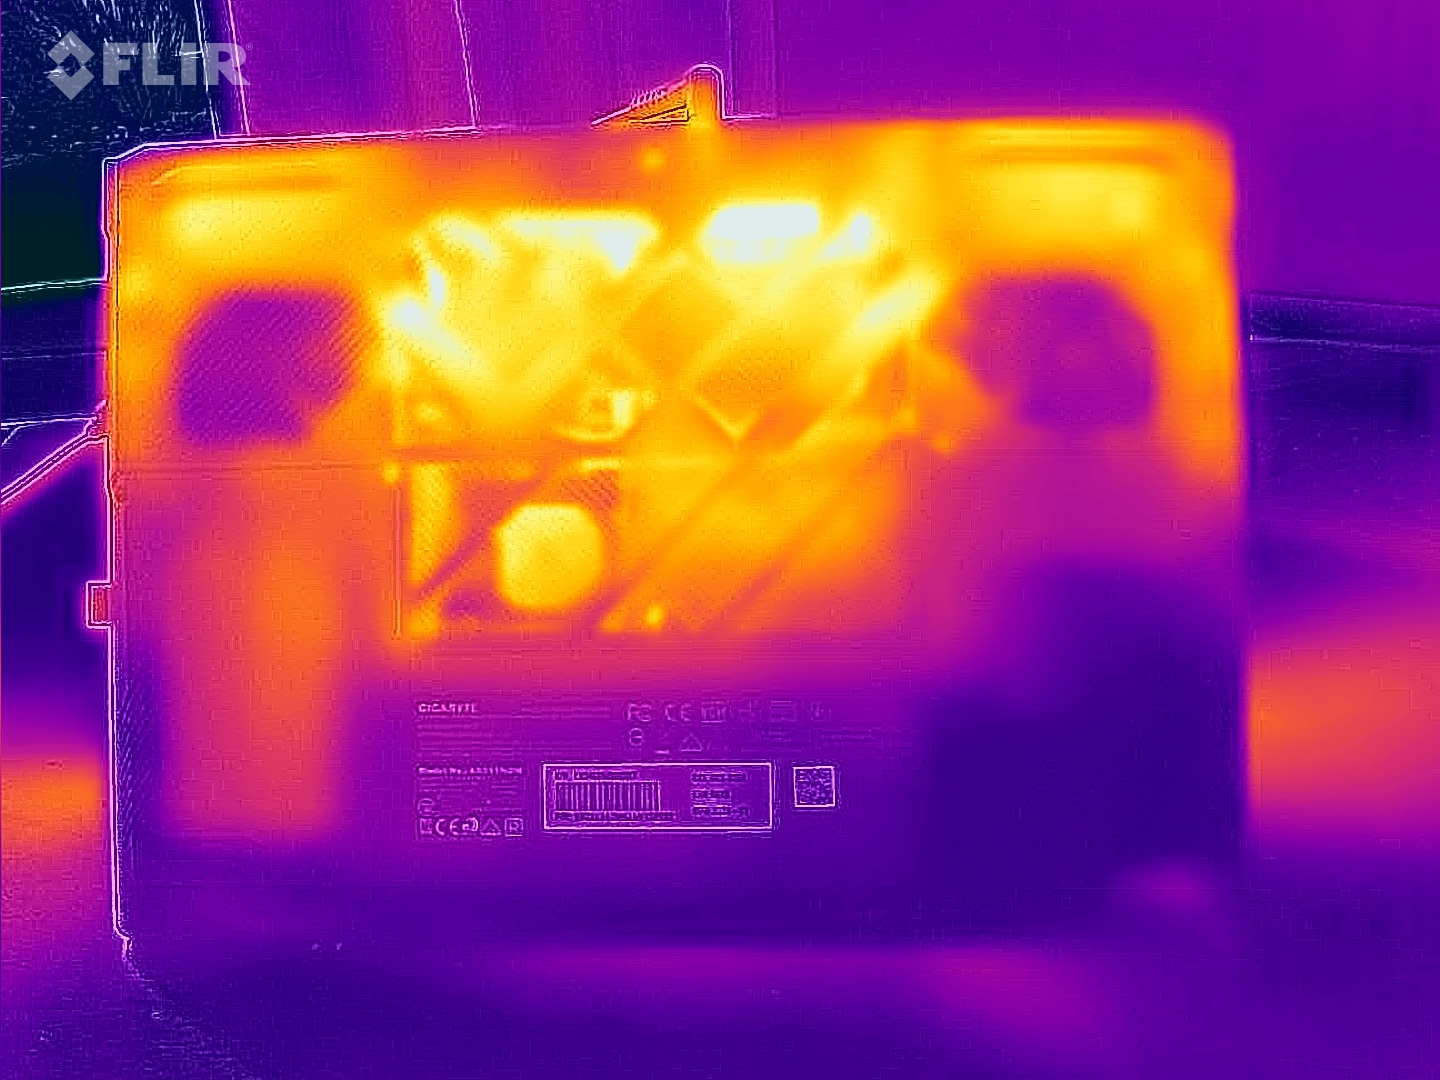
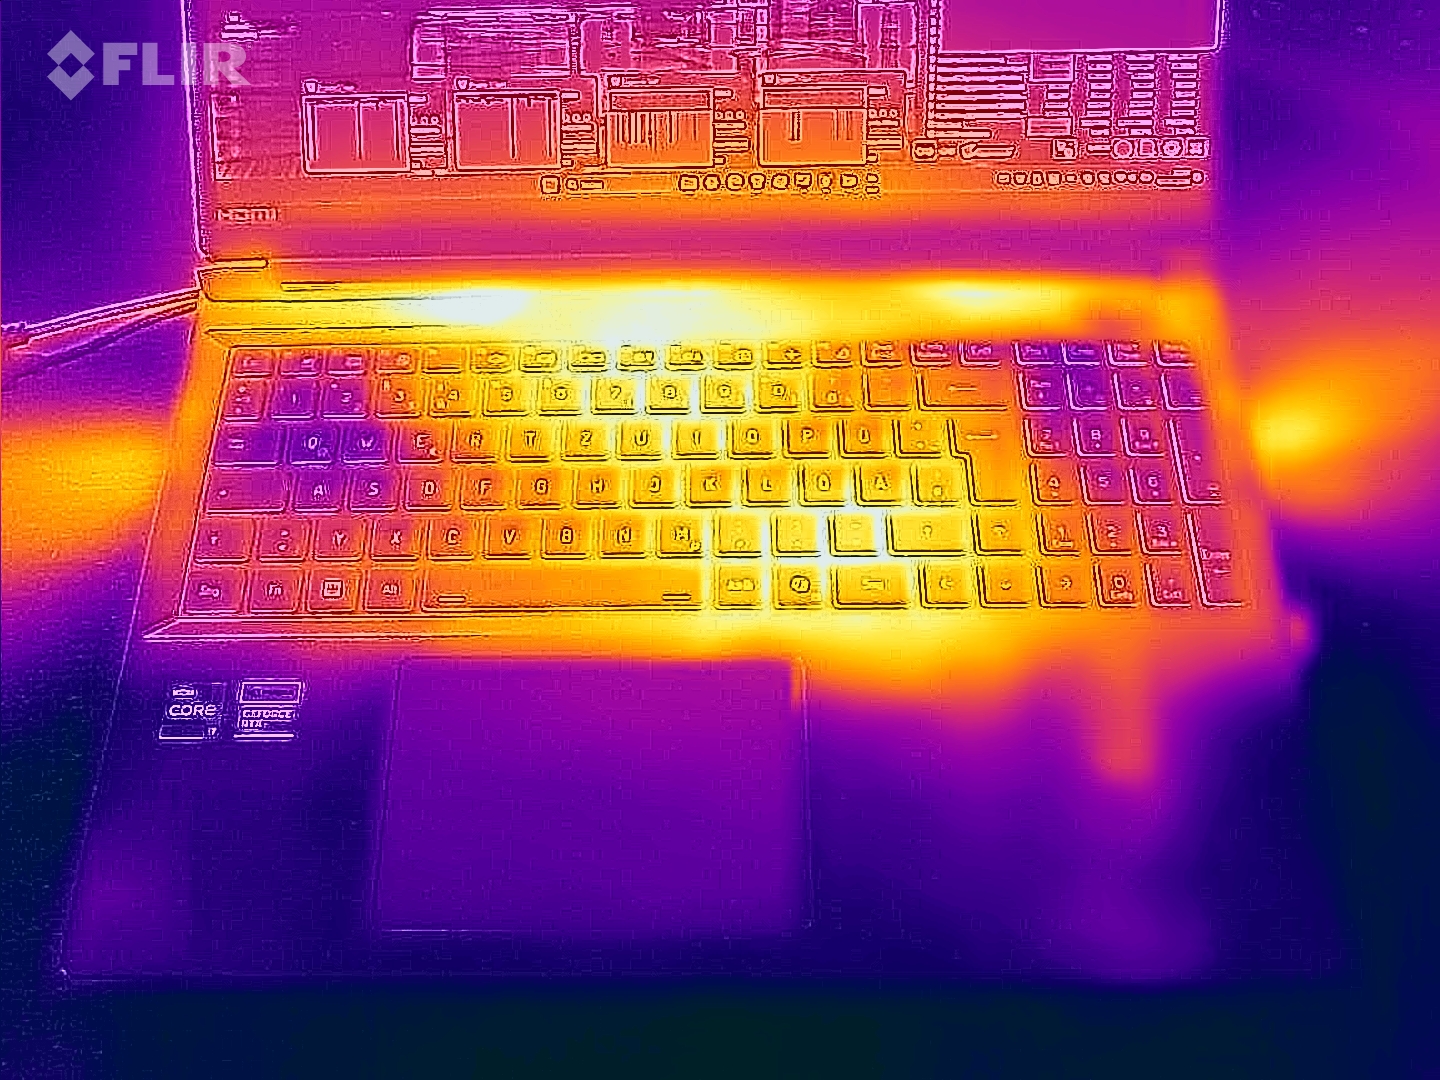
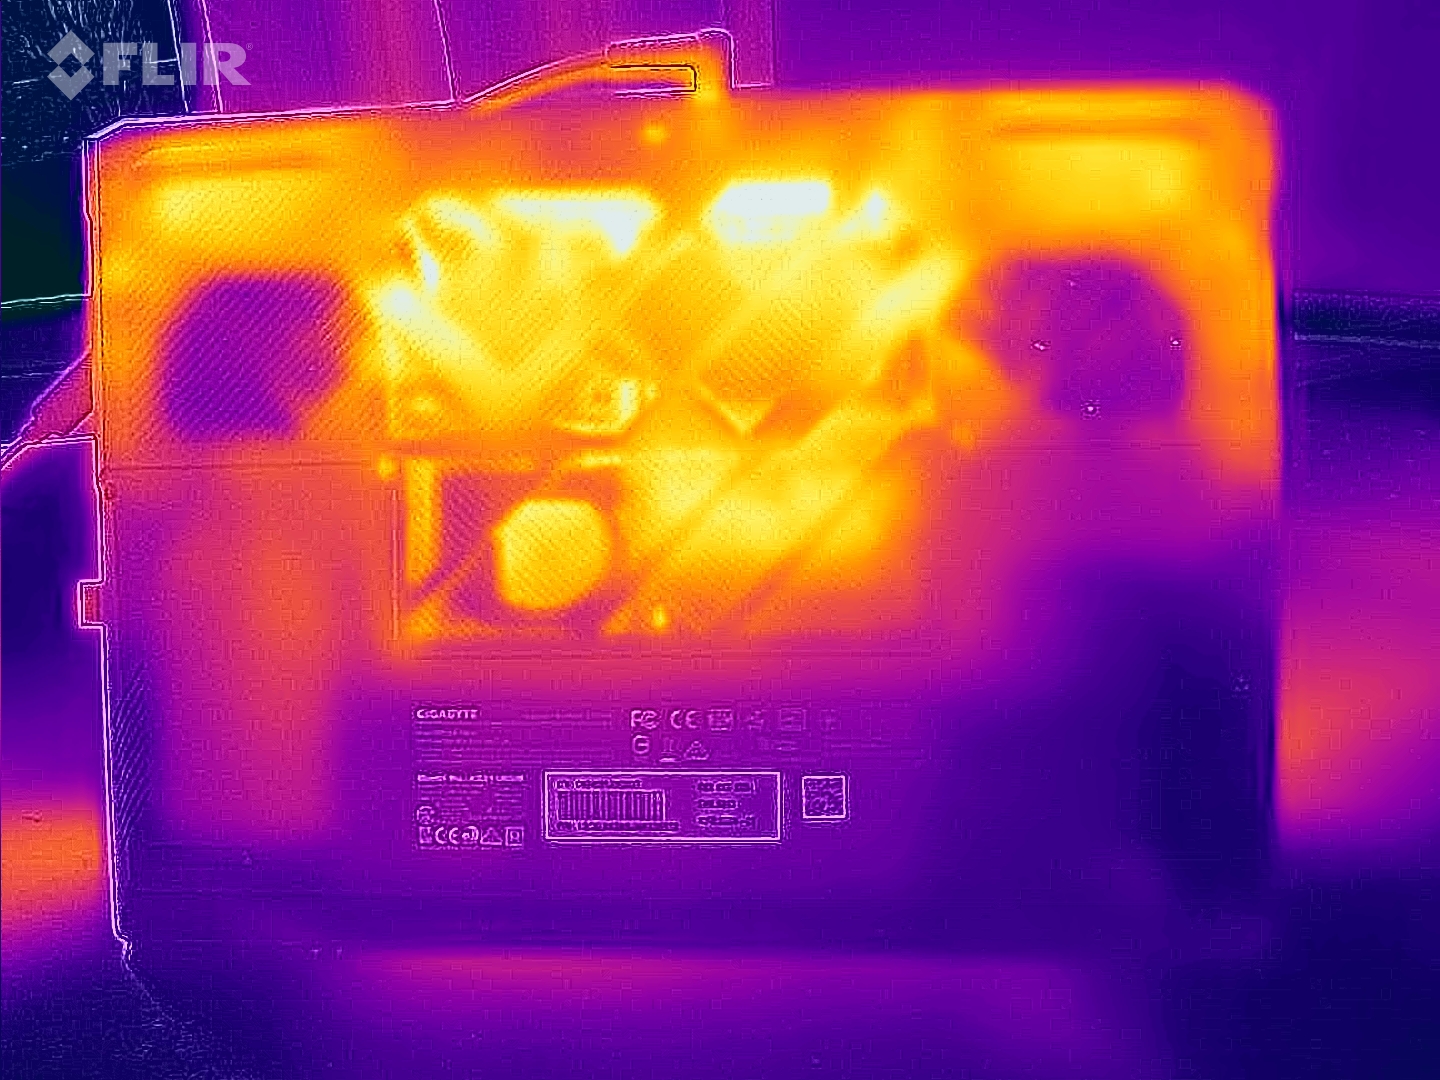
Temperatura
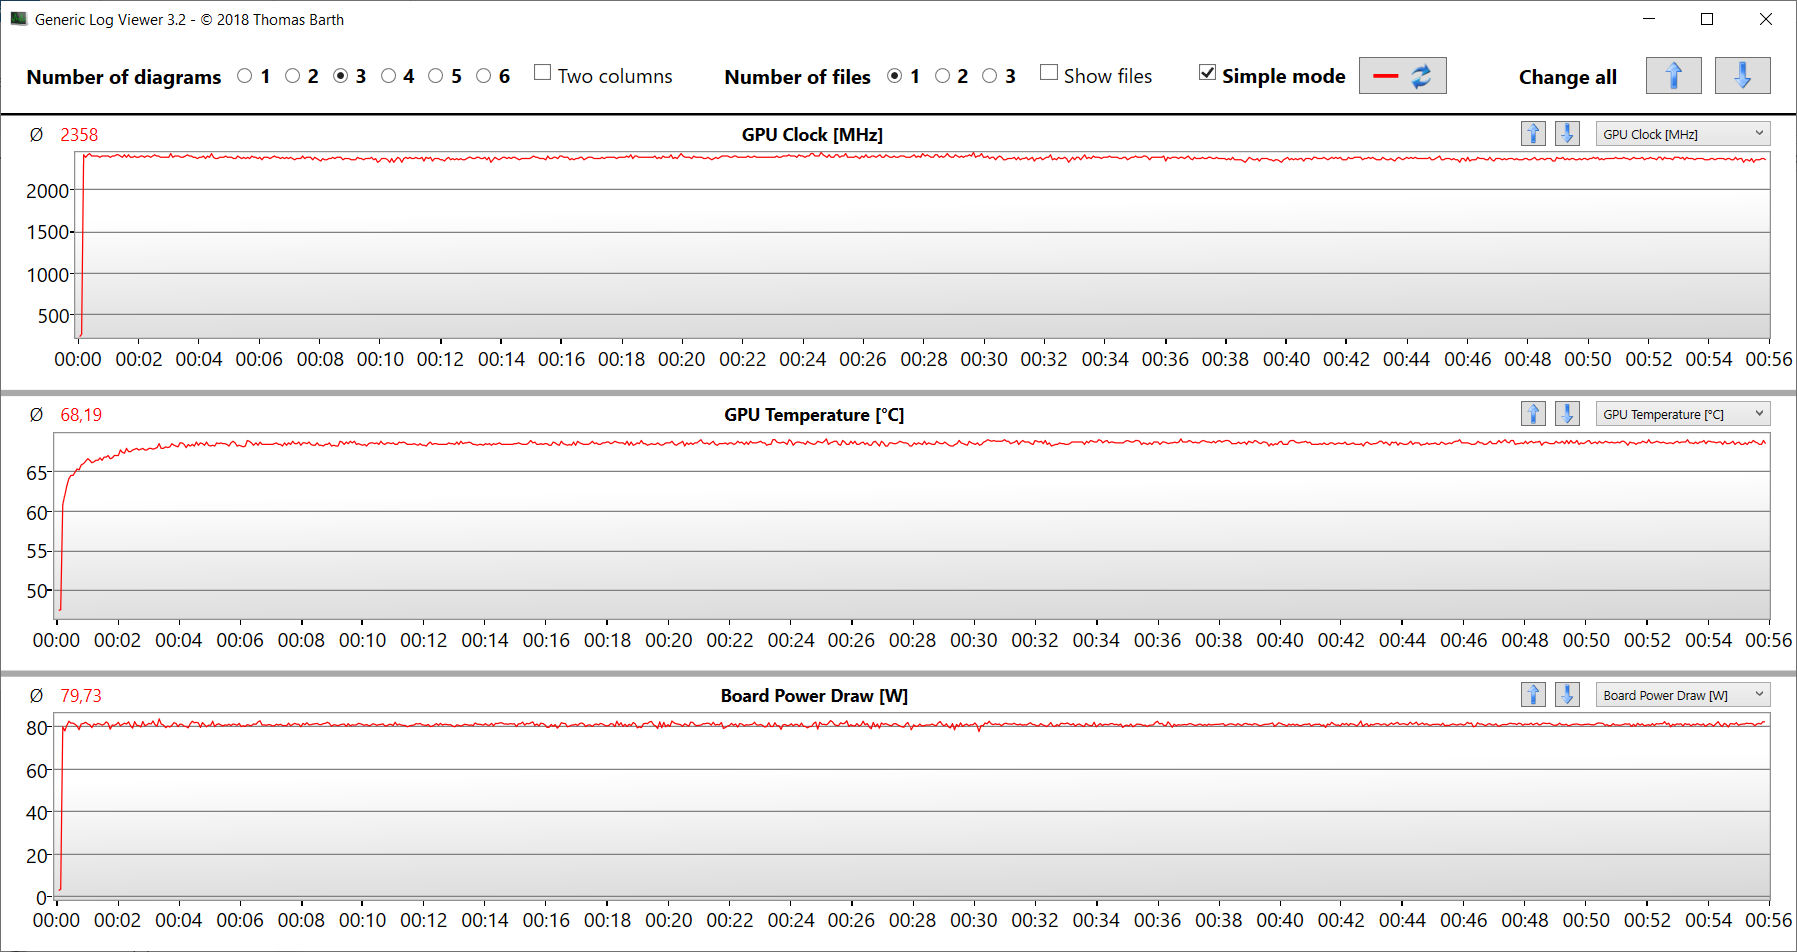
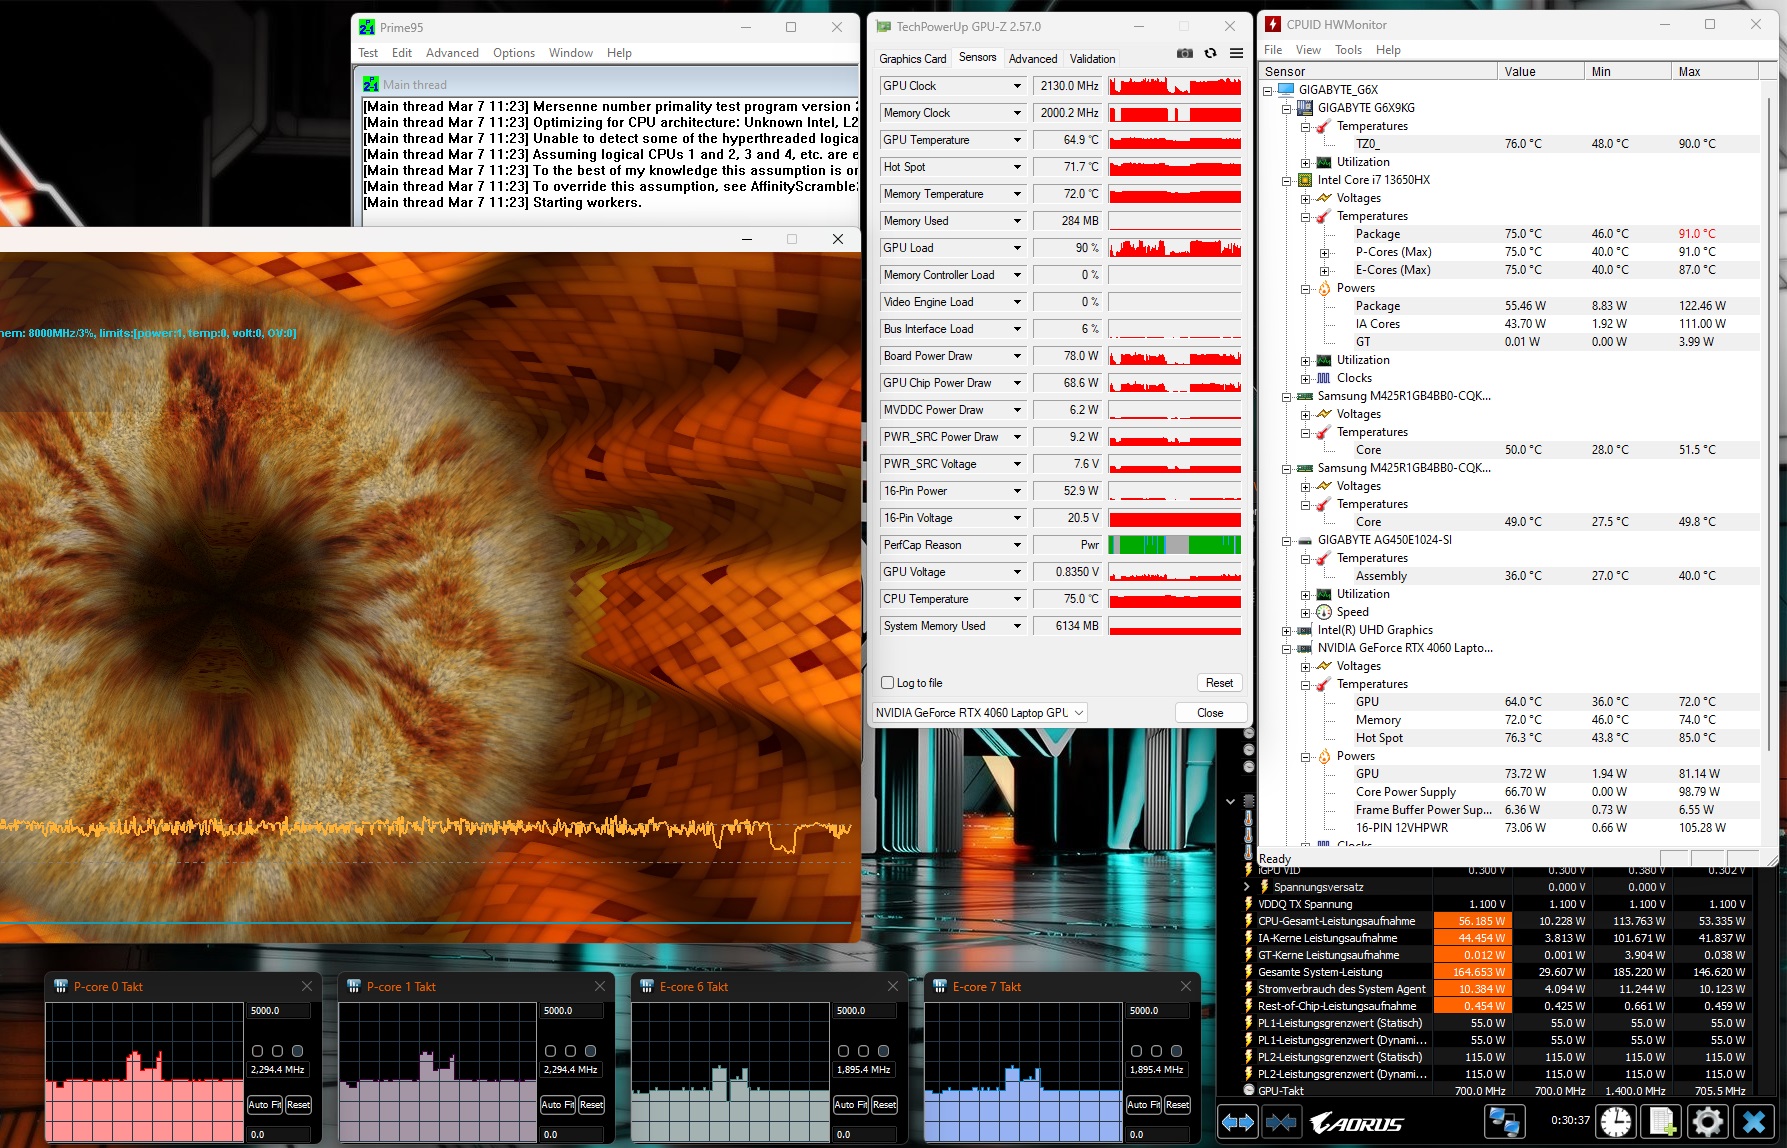
Os testes de estresse e Witcher 3 garantem, na melhor das hipóteses, o aquecimento moderado do laptop. Ocasionalmente, são atingidos valores na faixa inferior de 40 °C. No uso diário (Office, navegação na Internet), os valores permanecem na faixa verde.
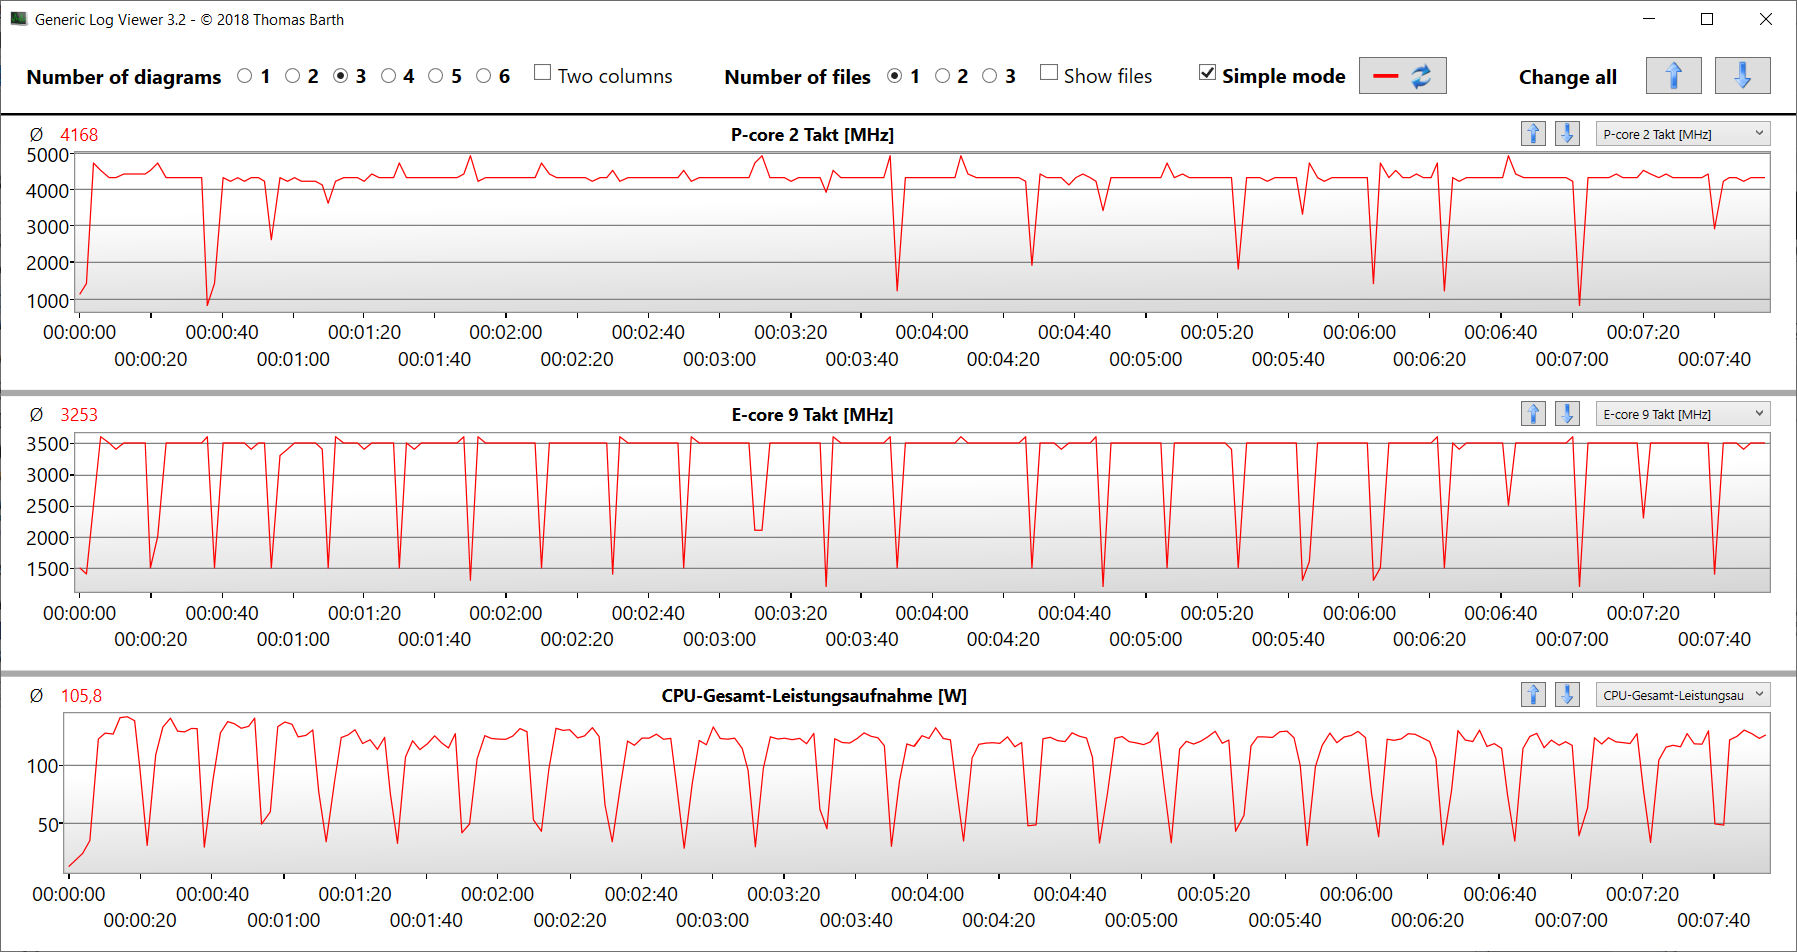
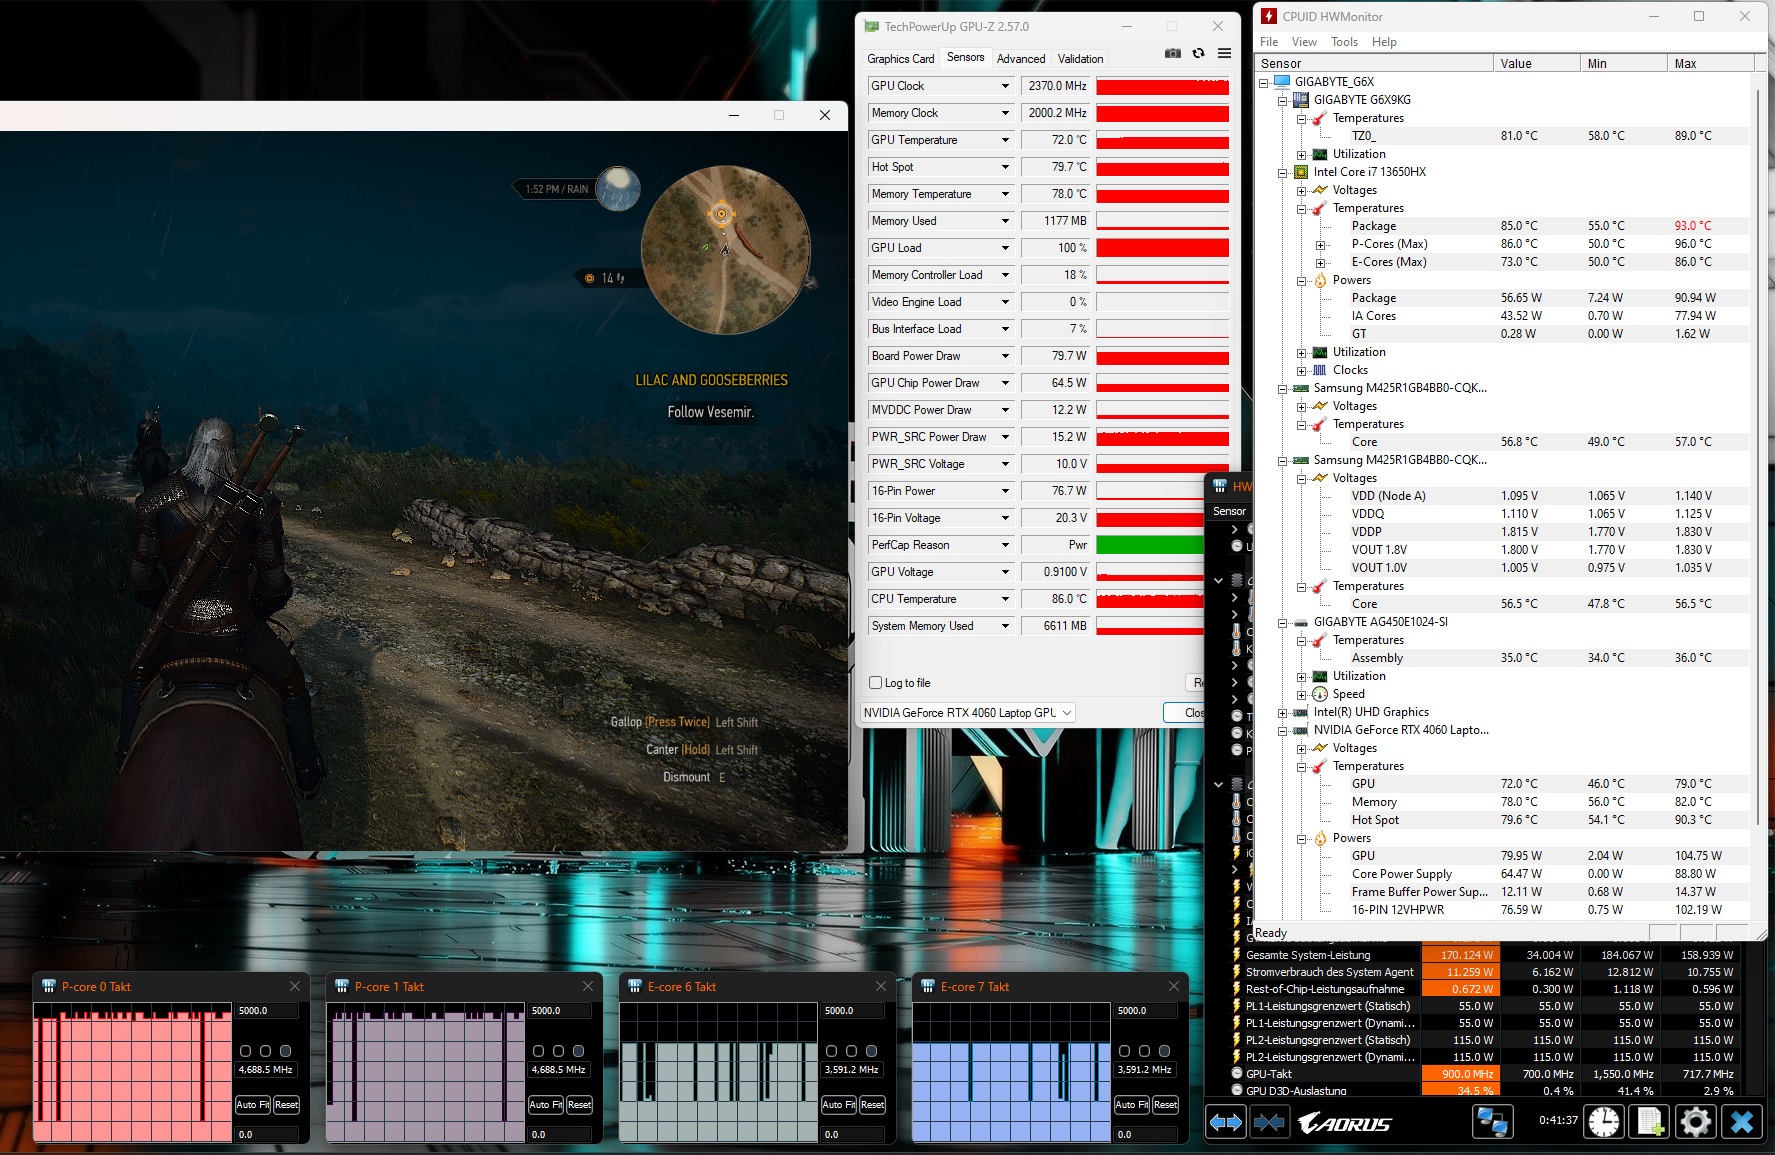
O cenário de teste de estresse extremo (Prime95 e FurMark em operação contínua) verifica a estabilidade do sistema sob carga total. A CPU do G6X funciona inicialmente com potência máxima, mas reduz rapidamente a taxa de clock para o nível de clock básico. A taxa de clock da GPU cai de 2,3 GHz-2,6 GHz para 1,9-2,1 GHz.
(±) A temperatura máxima no lado superior é 41 °C / 106 F, em comparação com a média de 40.4 °C / 105 F , variando de 21.2 a 68.8 °C para a classe Gaming.
(±) A parte inferior aquece até um máximo de 43 °C / 109 F, em comparação com a média de 43.2 °C / 110 F
(+) Em uso inativo, a temperatura média para o lado superior é 29.6 °C / 85 F, em comparação com a média do dispositivo de 33.9 °C / ### class_avg_f### F.
(±) Jogando The Witcher 3, a temperatura média para o lado superior é 34.9 °C / 95 F, em comparação com a média do dispositivo de 33.9 °C / ## #class_avg_f### F.
(+) Os apoios para as mãos e o touchpad são mais frios que a temperatura da pele, com um máximo de 28 °C / 82.4 F e, portanto, são frios ao toque.
(±) A temperatura média da área do apoio para as mãos de dispositivos semelhantes foi 28.8 °C / 83.8 F (+0.8 °C / 1.4 F).
| Gigabyte G6X 9KG (2024) i7-13650HX, GeForce RTX 4060 Laptop GPU | Dell G16, i7-13650HX, RTX 4060 i7-13650HX, GeForce RTX 4060 Laptop GPU | Lenovo Legion 5 16IRX G9 i7-14650HX, GeForce RTX 4060 Laptop GPU | MSI Raider GE68HX 13VF i9-13950HX, GeForce RTX 4060 Laptop GPU | Asus TUF Gaming A16 FA617XS R9 7940HS, Radeon RX 7600S | |
|---|---|---|---|---|---|
| Heat | -15% | 2% | 4% | -4% | |
| Maximum Upper Side * (°C) | 41 | 49 -20% | 40.4 1% | 41.4 -1% | 53 -29% |
| Maximum Bottom * (°C) | 43 | 58 -35% | 43.8 -2% | 45.4 -6% | 48 -12% |
| Idle Upper Side * (°C) | 32 | 35 -9% | 30.3 5% | 29.8 7% | 30 6% |
| Idle Bottom * (°C) | 37 | 35 5% | 35.3 5% | 31.4 15% | 30 19% |
* ... menor é melhor
Alto-falante
Os alto-falantes estéreo produzem um som decente em geral. No entanto, há falta de graves.
Gigabyte G6X 9KG (2024) análise de áudio
(+) | os alto-falantes podem tocar relativamente alto (###valor### dB)
Graves 100 - 315Hz
(-) | quase nenhum baixo - em média 24.9% menor que a mediana
(±) | a linearidade dos graves é média (13.7% delta para a frequência anterior)
Médios 400 - 2.000 Hz
(+) | médios equilibrados - apenas 4.1% longe da mediana
(+) | médios são lineares (5.4% delta para frequência anterior)
Altos 2 - 16 kHz
(+) | agudos equilibrados - apenas 2.2% longe da mediana
(±) | a linearidade dos máximos é média (7.4% delta para frequência anterior)
Geral 100 - 16.000 Hz
(±) | a linearidade do som geral é média (17.2% diferença em relação à mediana)
Comparado com a mesma classe
» 46% de todos os dispositivos testados nesta classe foram melhores, 11% semelhantes, 42% piores
» O melhor teve um delta de 6%, a média foi 18%, o pior foi 132%
Comparado com todos os dispositivos testados
» 32% de todos os dispositivos testados foram melhores, 8% semelhantes, 60% piores
» O melhor teve um delta de 4%, a média foi 23%, o pior foi 134%
Dell G16, i7-13650HX, RTX 4060 análise de áudio
(±) | o volume do alto-falante é médio, mas bom (###valor### dB)
Graves 100 - 315Hz
(-) | quase nenhum baixo - em média 25.1% menor que a mediana
(-) | graves não são lineares (18.9% delta para frequência anterior)
Médios 400 - 2.000 Hz
(±) | médios mais altos - em média 8% maior que a mediana
(+) | médios são lineares (5.9% delta para frequência anterior)
Altos 2 - 16 kHz
(+) | agudos equilibrados - apenas 3.5% longe da mediana
(±) | a linearidade dos máximos é média (8.6% delta para frequência anterior)
Geral 100 - 16.000 Hz
(±) | a linearidade do som geral é média (23.4% diferença em relação à mediana)
Comparado com a mesma classe
» 85% de todos os dispositivos testados nesta classe foram melhores, 5% semelhantes, 11% piores
» O melhor teve um delta de 6%, a média foi 18%, o pior foi 132%
Comparado com todos os dispositivos testados
» 70% de todos os dispositivos testados foram melhores, 6% semelhantes, 24% piores
» O melhor teve um delta de 4%, a média foi 23%, o pior foi 134%
Consumo de energia
O consumo de energia está em um nível normal para o hardware instalado. Embora o teste Witcher 3 seja executado com um consumo de energia constante, a demanda flutua ligeiramente durante o teste de estresse.
A saída de energia da fonte de alimentação fica acima da potência nominal (180 W) por alguns minutos, mas depois é reduzida ao nível de potência nominal.
| desligado | |
| Ocioso | |
| Carga |
|
Key:
min: | |
Energieaufnahme Witcher 3 / Stresstest
Power consumption: External monitor
Duração da bateria
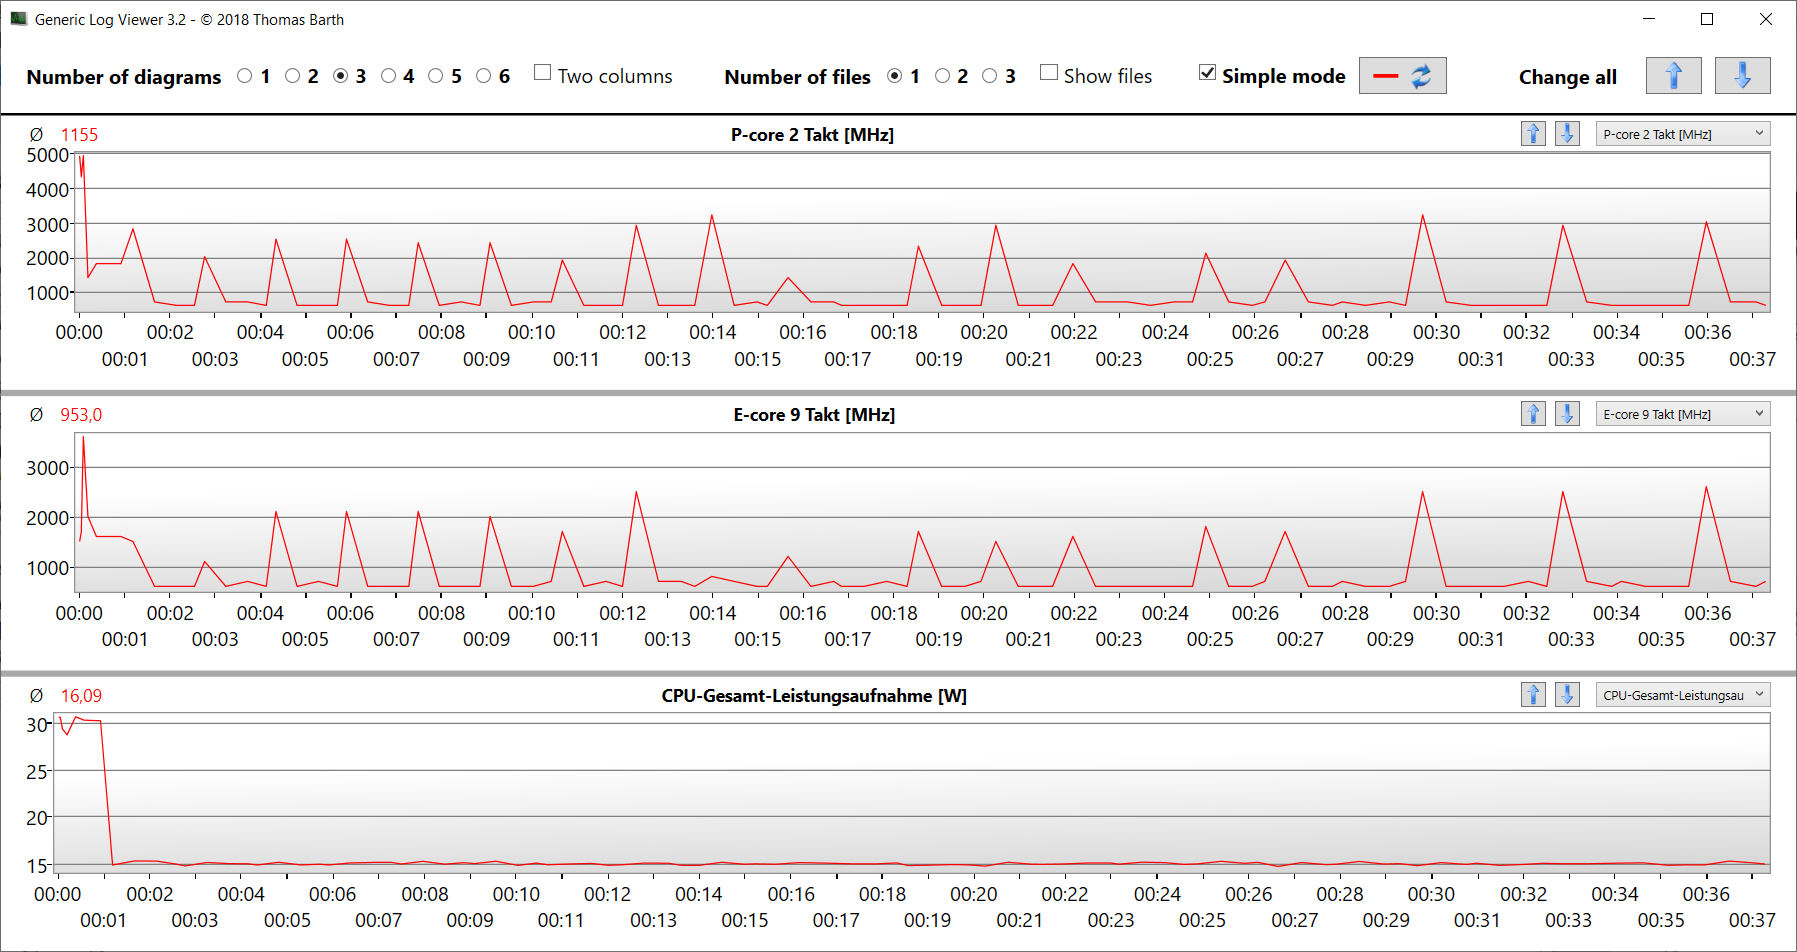
O Gigabyte G6X atinge um tempo de execução de 7:54 h no teste prático de WLAN (mapeamento da carga ao acessar sites usando um script), o que é um bom valor e é o segundo melhor tempo de execução na comparação.
Pro
Contra
Veredicto: Pacote geral bem completo
A Gigabyte G6X 9KG foi projetada para jogos FHD em configurações altas ou máximas, mas seu Core i7-13650HX e GeForce RTX 4060 também deve ser capaz de oferecer resultados em outras áreas, como edição e renderização de vídeo. Um rápido SSD PCIe Gen 4 de 1 TB garante tempos de carregamento curtos.
A Gigabyte oferece um notebook para jogos coerente de médio porte com o G6X 9KG (2024)."
O notebook não aquece muito sob carga, mas pode produzir muito ruído. O perfil de energia silenciosa pode neutralizar esse problema, mas isso faz com que a dGPU seja desligada. O bom tempo de execução do Wi-Fi de pouco menos de 8 horas, portanto, não é nenhuma surpresa.
O G6X não apresenta nenhuma porta Thunderbolt ou USB4 moderna. Com uma das portas USB Type-C compatível com Power Delivery, a unidade de fonte de alimentação proprietária pode ficar em casa para o trabalho regular. As duas portas USB 3.2 Gen 2 Type-C também permitem a fácil integração com as configurações de estações de trabalho existentes.
A tela fosca IPS WUXGA 165 Hz de 16 polegadas causa uma boa impressão geral, mas oferece cobertura insuficiente do espaço de cores.
Como alternativa, a tela Lenovo Legion 5 16IRX G9 pode ser considerado. Ele oferece mais desempenho de GPU e uma tela mais brilhante com melhor cobertura do espaço de cores.
Preço e disponibilidade
Nos EUA, o Gigabyte G6X 9KG (2024) está disponível na Amazon por cerca de US$ 1.350.
Gigabyte G6X 9KG (2024)
- 03/22/2024 v7 (old)
Sascha Mölck
Transparência
A seleção dos dispositivos a serem analisados é feita pela nossa equipe editorial. A amostra de teste foi fornecida ao autor como empréstimo pelo fabricante ou varejista para fins desta revisão. O credor não teve influência nesta revisão, nem o fabricante recebeu uma cópia desta revisão antes da publicação. Não houve obrigação de publicar esta revisão. Como empresa de mídia independente, a Notebookcheck não está sujeita à autoridade de fabricantes, varejistas ou editores.
É assim que o Notebookcheck está testando
Todos os anos, o Notebookcheck analisa de forma independente centenas de laptops e smartphones usando procedimentos padronizados para garantir que todos os resultados sejam comparáveis. Desenvolvemos continuamente nossos métodos de teste há cerca de 20 anos e definimos padrões da indústria no processo. Em nossos laboratórios de teste, equipamentos de medição de alta qualidade são utilizados por técnicos e editores experientes. Esses testes envolvem um processo de validação em vários estágios. Nosso complexo sistema de classificação é baseado em centenas de medições e benchmarks bem fundamentados, o que mantém a objetividade.Price comparison
