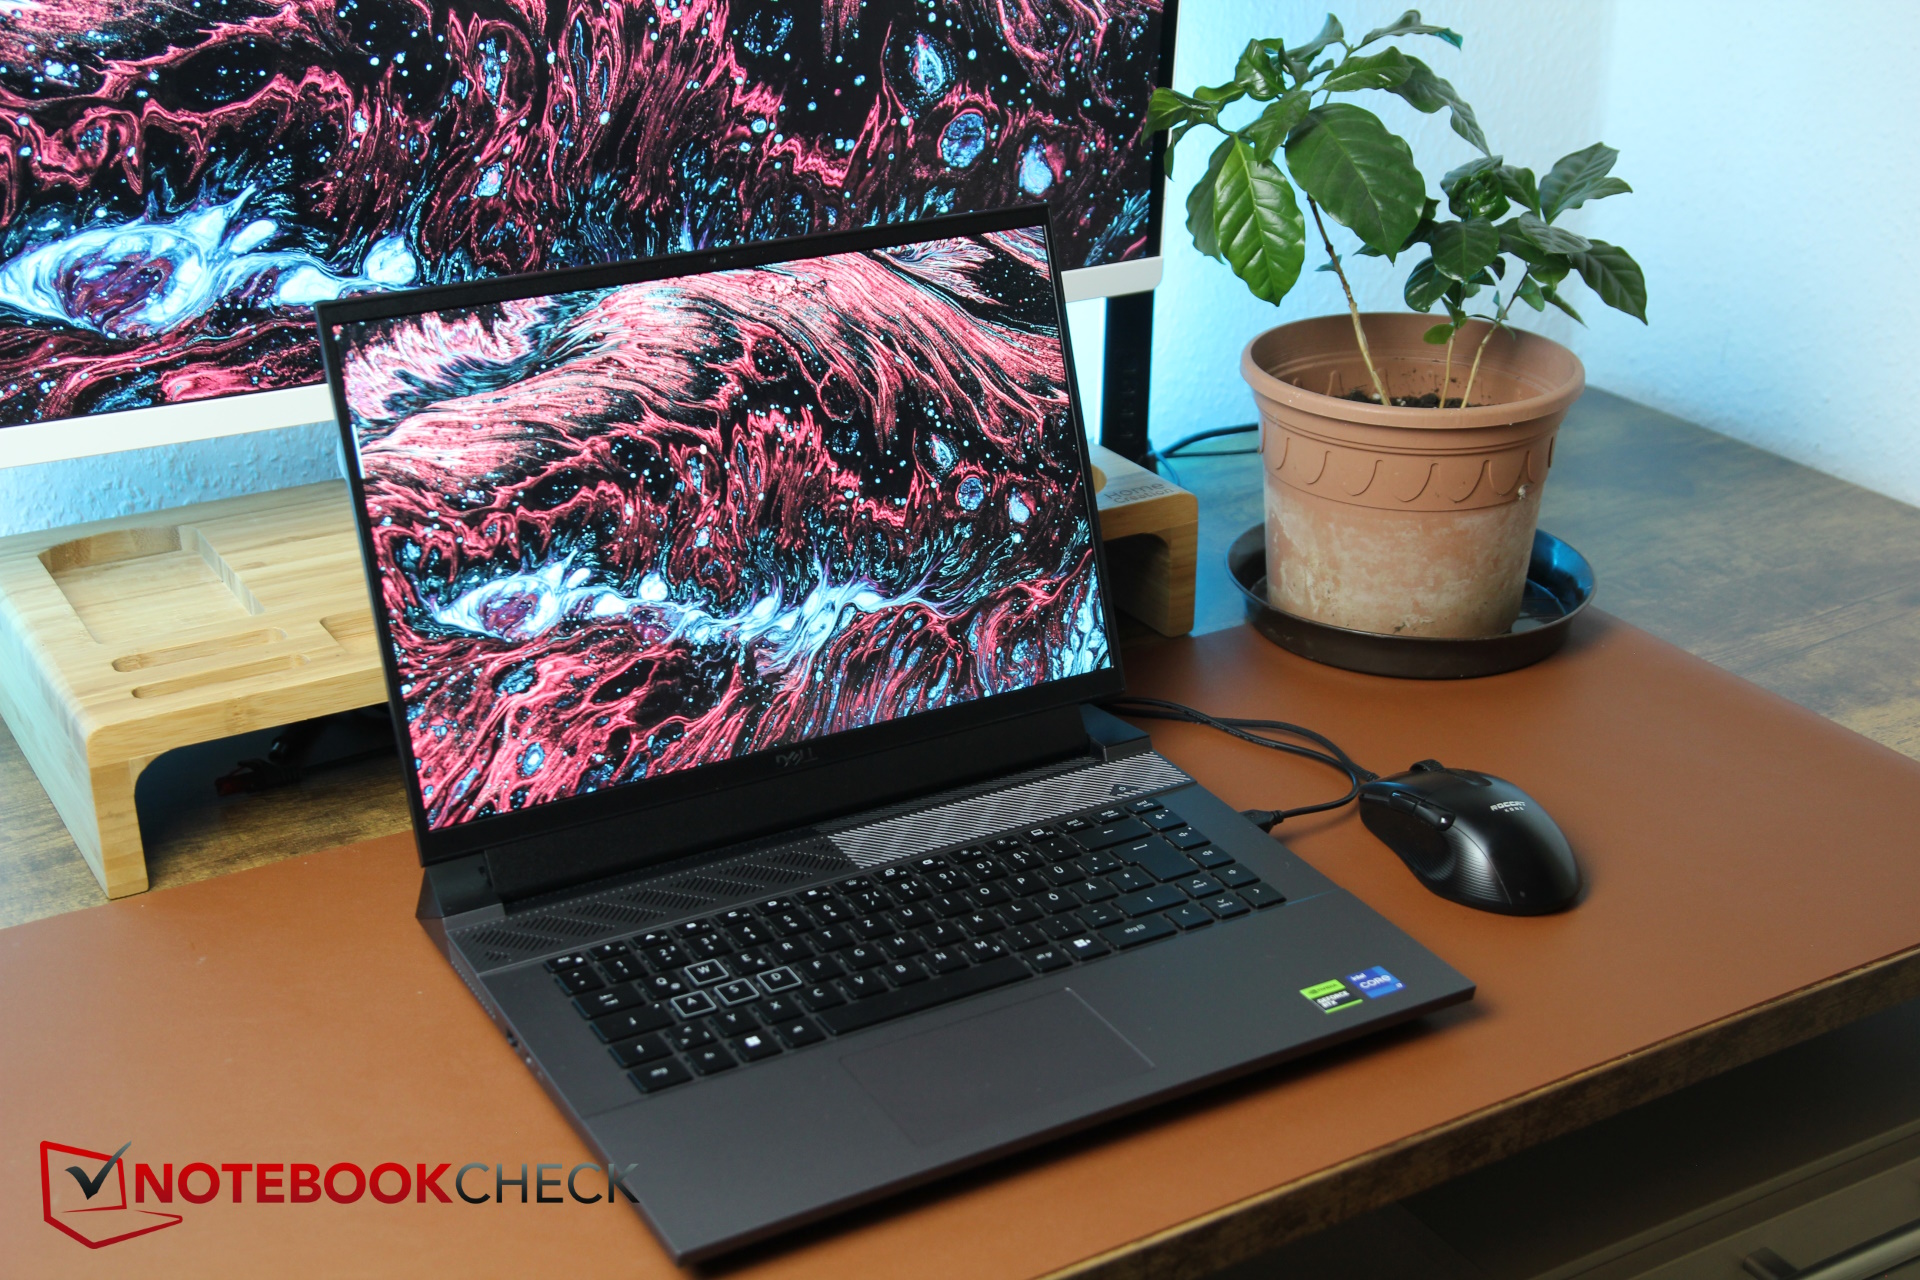
Análise do laptop Dell G16 (2024): Uma alternativa econômica ao Alienware do mesmo fabricante?
No final de 2022, demos uma olhada pela última vez (e, coincidentemente, pela primeira vez) no modelo de 16 polegadas da relativamente nova série G, os laptops para jogos de orçamento a médio prazo da Dell. Na época, o Dell G16 estava equipado com uma CPU Intel Gen-12 e a RTX 3060. No modelo 2024, o fabricante faz a mudança para a Intel Gen 13 e a RTX 4060 (há outras opções de GPU disponíveis). A tela recebeu uma variante um pouco mais potente como opção.
Também veremos se a Dell conseguiu reduzir ainda mais o gabinete relativamente espesso do laptop. Além disso, é claro que o G16 tem que competir com outros gamers econômicos e de médio porte, como o MSI Raider GE68 HX 13VF, o Lenovo Legion Slim 5 16APH8 e o Lenovo LOQ 16-Além disso, naturalmente o compararemos com seu antecessor, bem como com o ligeiramente mais caro Alienware m16 R1.
Possíveis concorrentes em comparação
Avaliação | Data | Modelo | Peso | Altura | Size | Resolução | Preço |
|---|---|---|---|---|---|---|---|
| 85.5 % v7 (old) | 02/2024 | Dell G16, i7-13650HX, RTX 4060 i7-13650HX, GeForce RTX 4060 Laptop GPU | 2.8 kg | 25.65 mm | 16.00" | 2560x1600 | |
| 86.1 % v7 (old) | 10/2022 | Dell G16 7620 i7-12700H, GeForce RTX 3060 Laptop GPU | 2.6 kg | 26.9 mm | 16.00" | 2560x1600 | |
| 86.9 % v7 (old) | 10/2023 | MSI Raider GE68HX 13VF i9-13950HX, GeForce RTX 4060 Laptop GPU | 2.7 kg | 27.9 mm | 16.00" | 1900x1200 | |
| 87.7 % v7 (old) | 08/2023 | Lenovo Legion Slim 5 16APH8 R7 7840HS, GeForce RTX 4060 Laptop GPU | 2.4 kg | 25.2 mm | 16.00" | 2560x1600 | |
| 88.3 % v7 (old) | 09/2023 | Alienware m16 R1 Intel i7-13700HX, GeForce RTX 4060 Laptop GPU | 3 kg | 25.4 mm | 16.00" | 2560x1600 | |
| 87.3 % v7 (old) | 09/2023 | Lenovo LOQ 16IRH8 i7-13620H, GeForce RTX 4060 Laptop GPU | 2.7 kg | 25.9 mm | 16.00" | 2560x1600 |
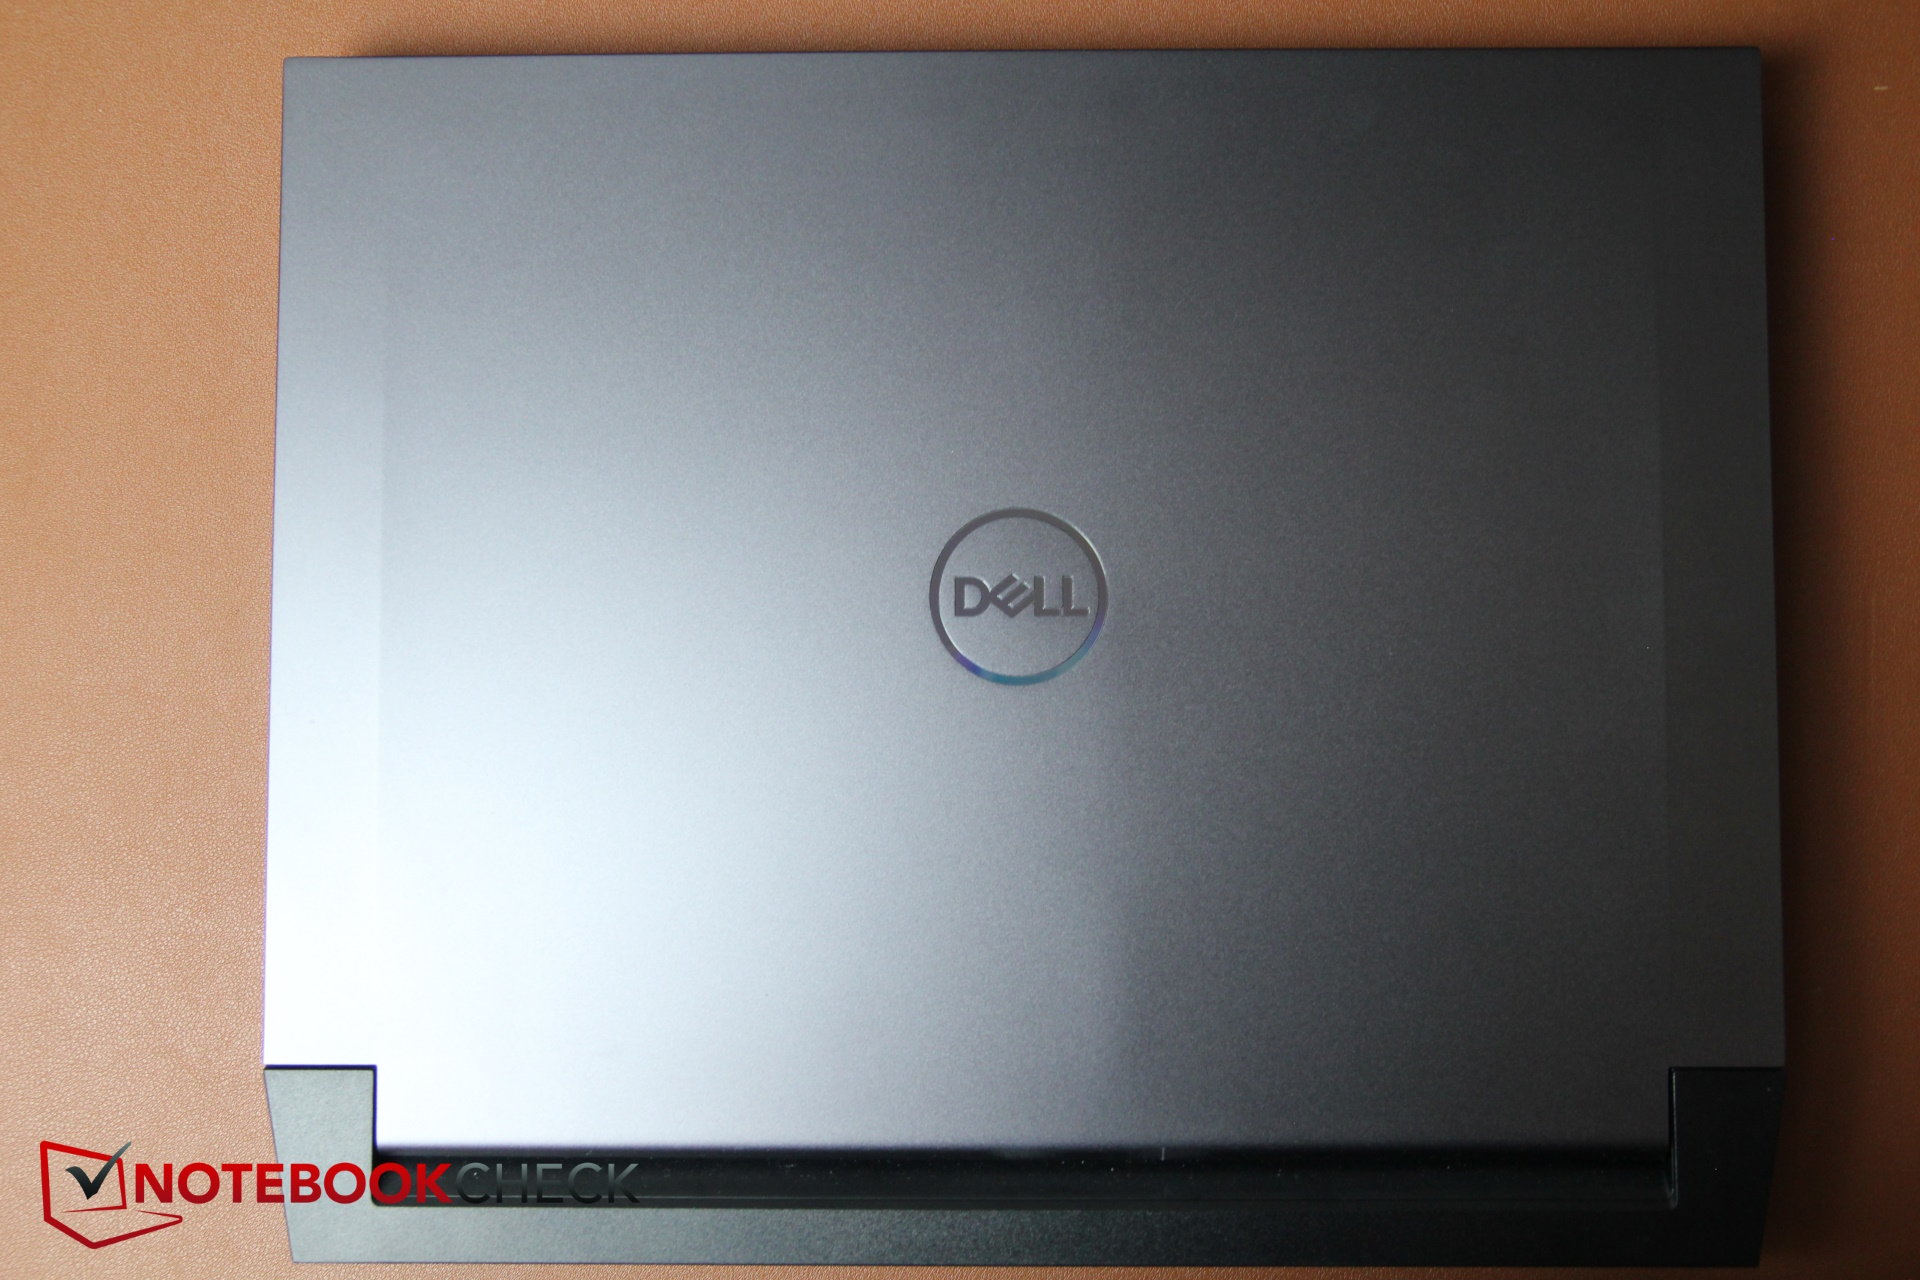
Caixa - Tampa de alumínio e o restante é de plástico cinza
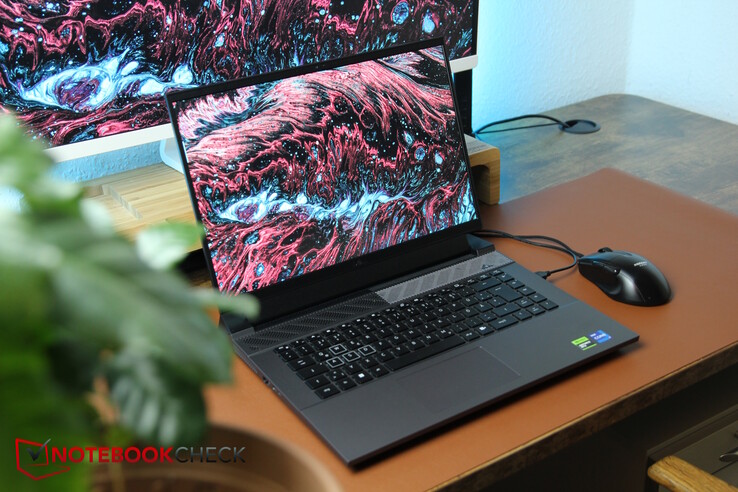
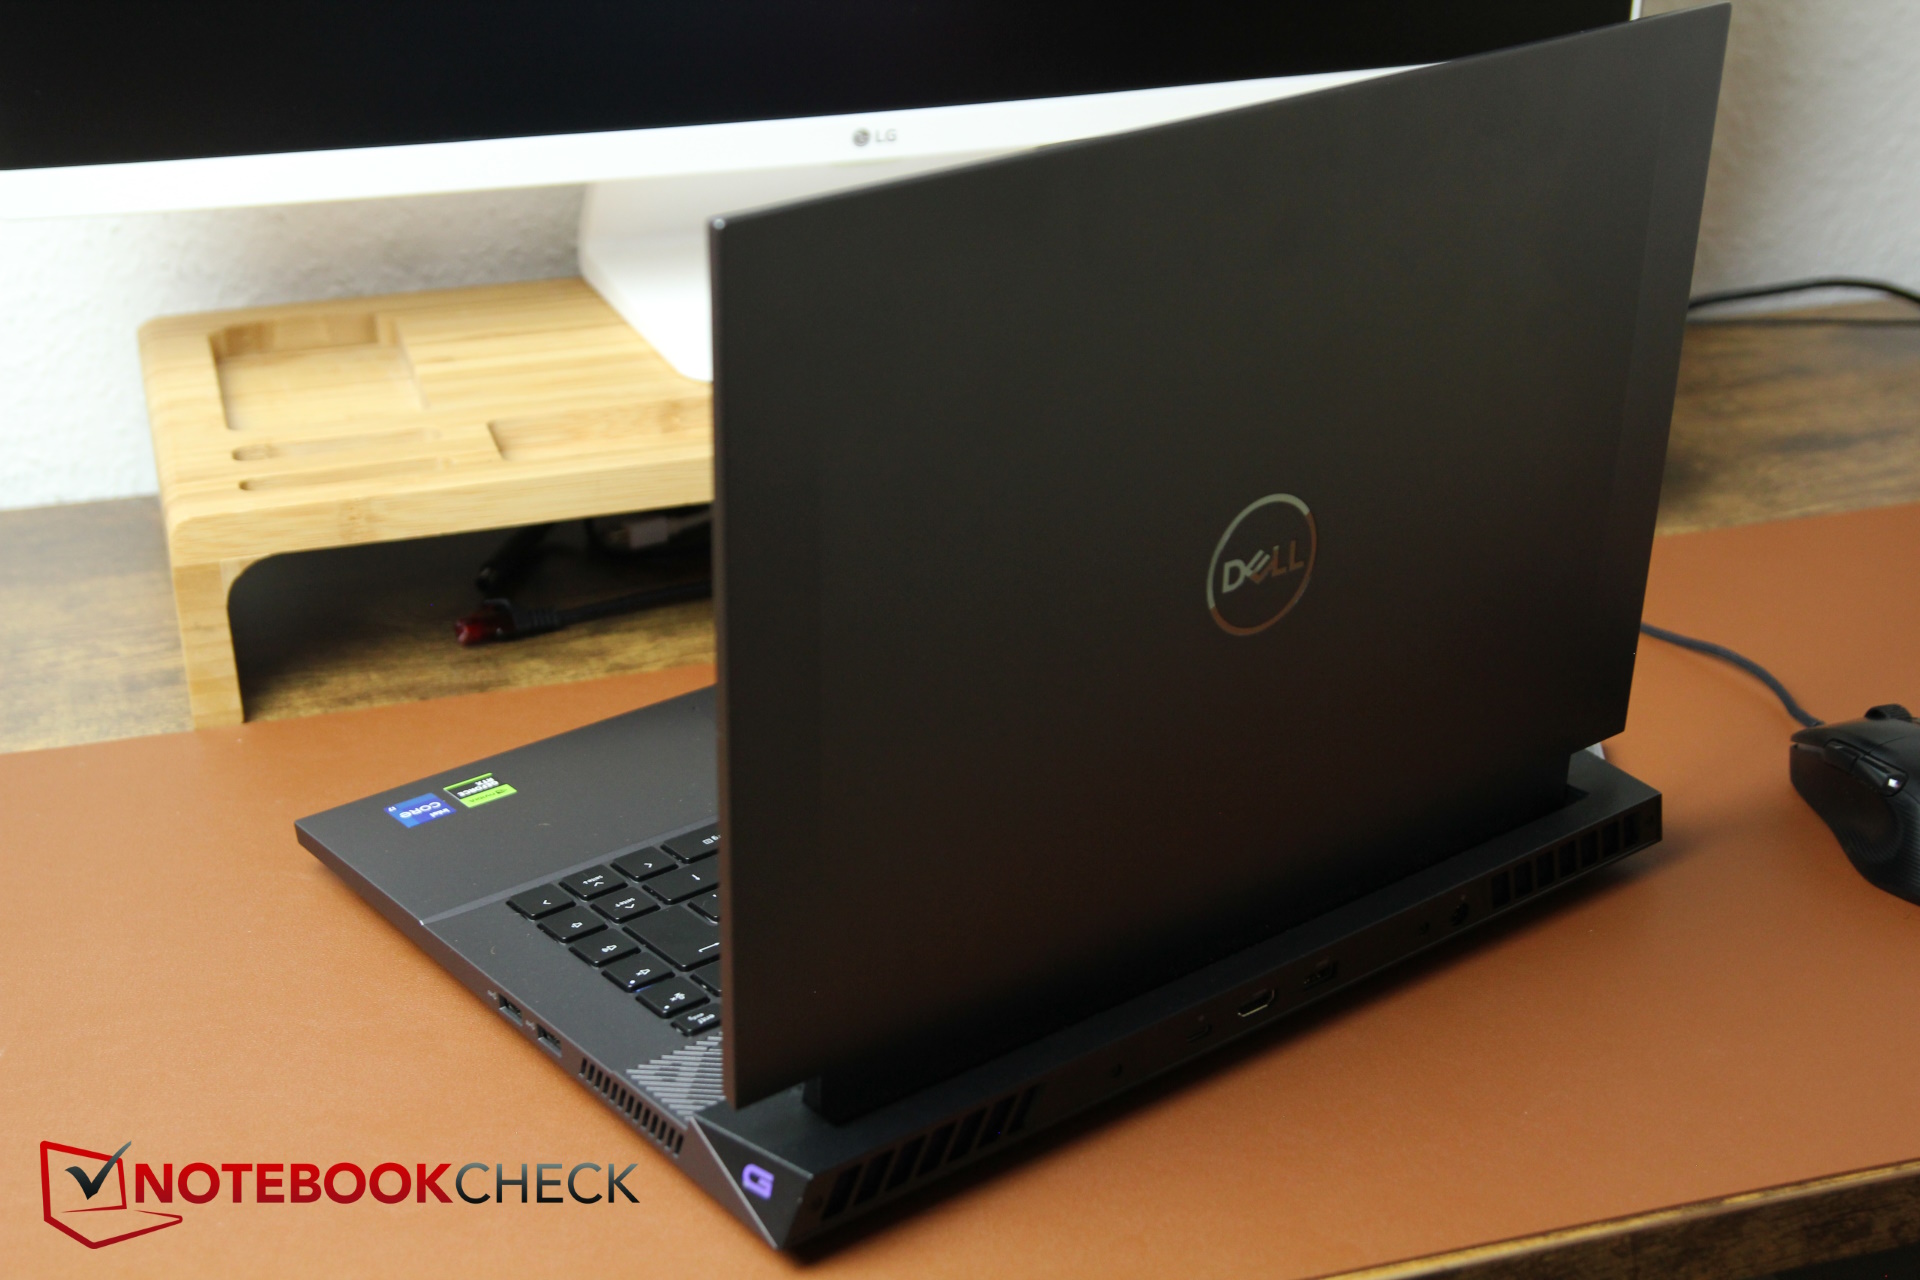
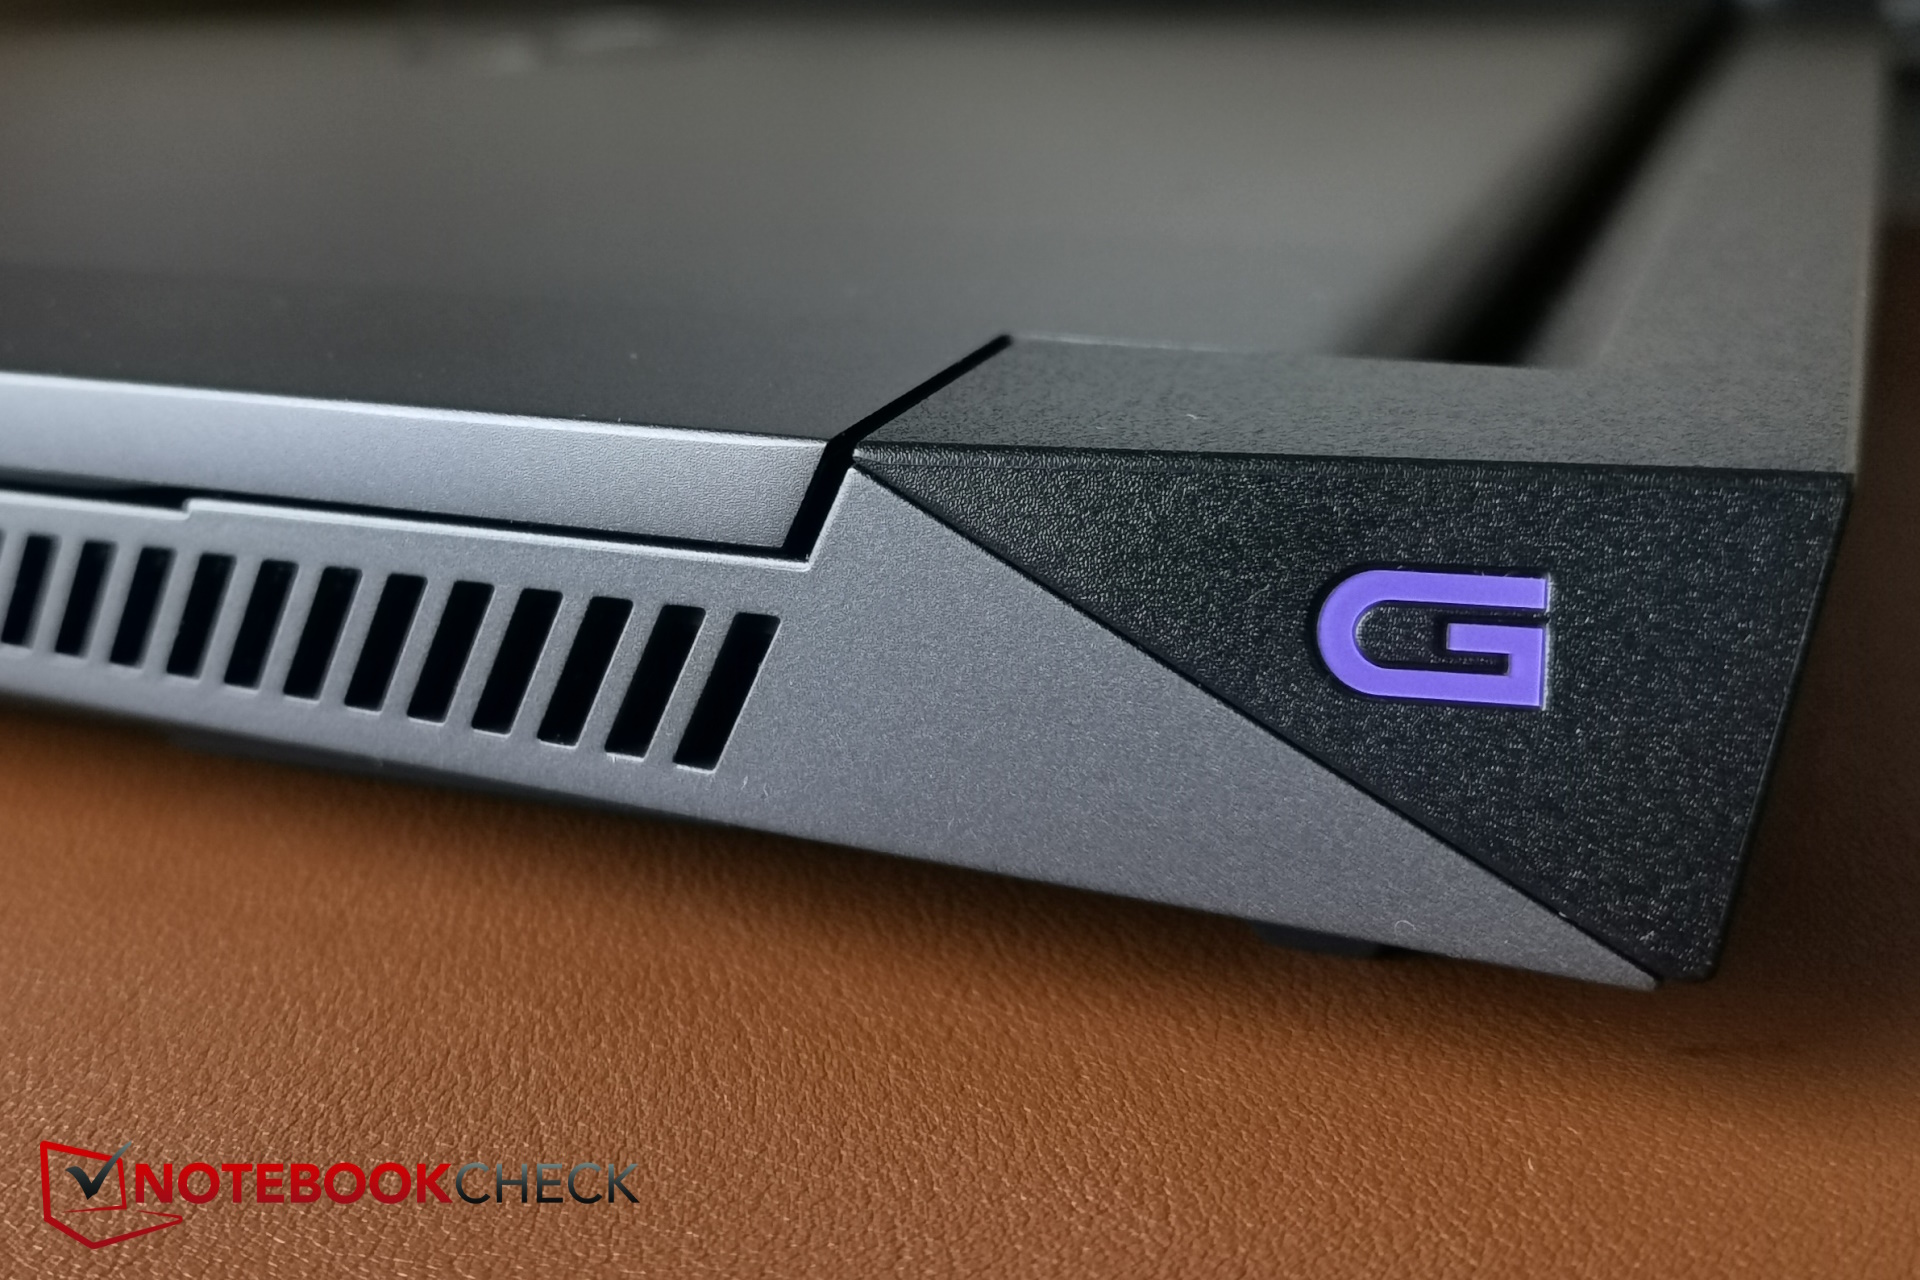
O gabinete do laptop, que é diferente do de seu antecessor, é feito principalmente de plástico cinza - somente a tampa usa alumínio, o que lhe confere boa estabilidade. A unidade de base também é estável e mal pode ser torcida. A dobradiça longa mantém a tela no lugar, mas notamos alguns ruídos de fricção e rangidos ao abrir e fechar. Esperamos que isso não afete a longevidade do dispositivo. Sua construção é decente, mas não parece ser de alta qualidade como os modelos mais caros da Dell e da Alienware.
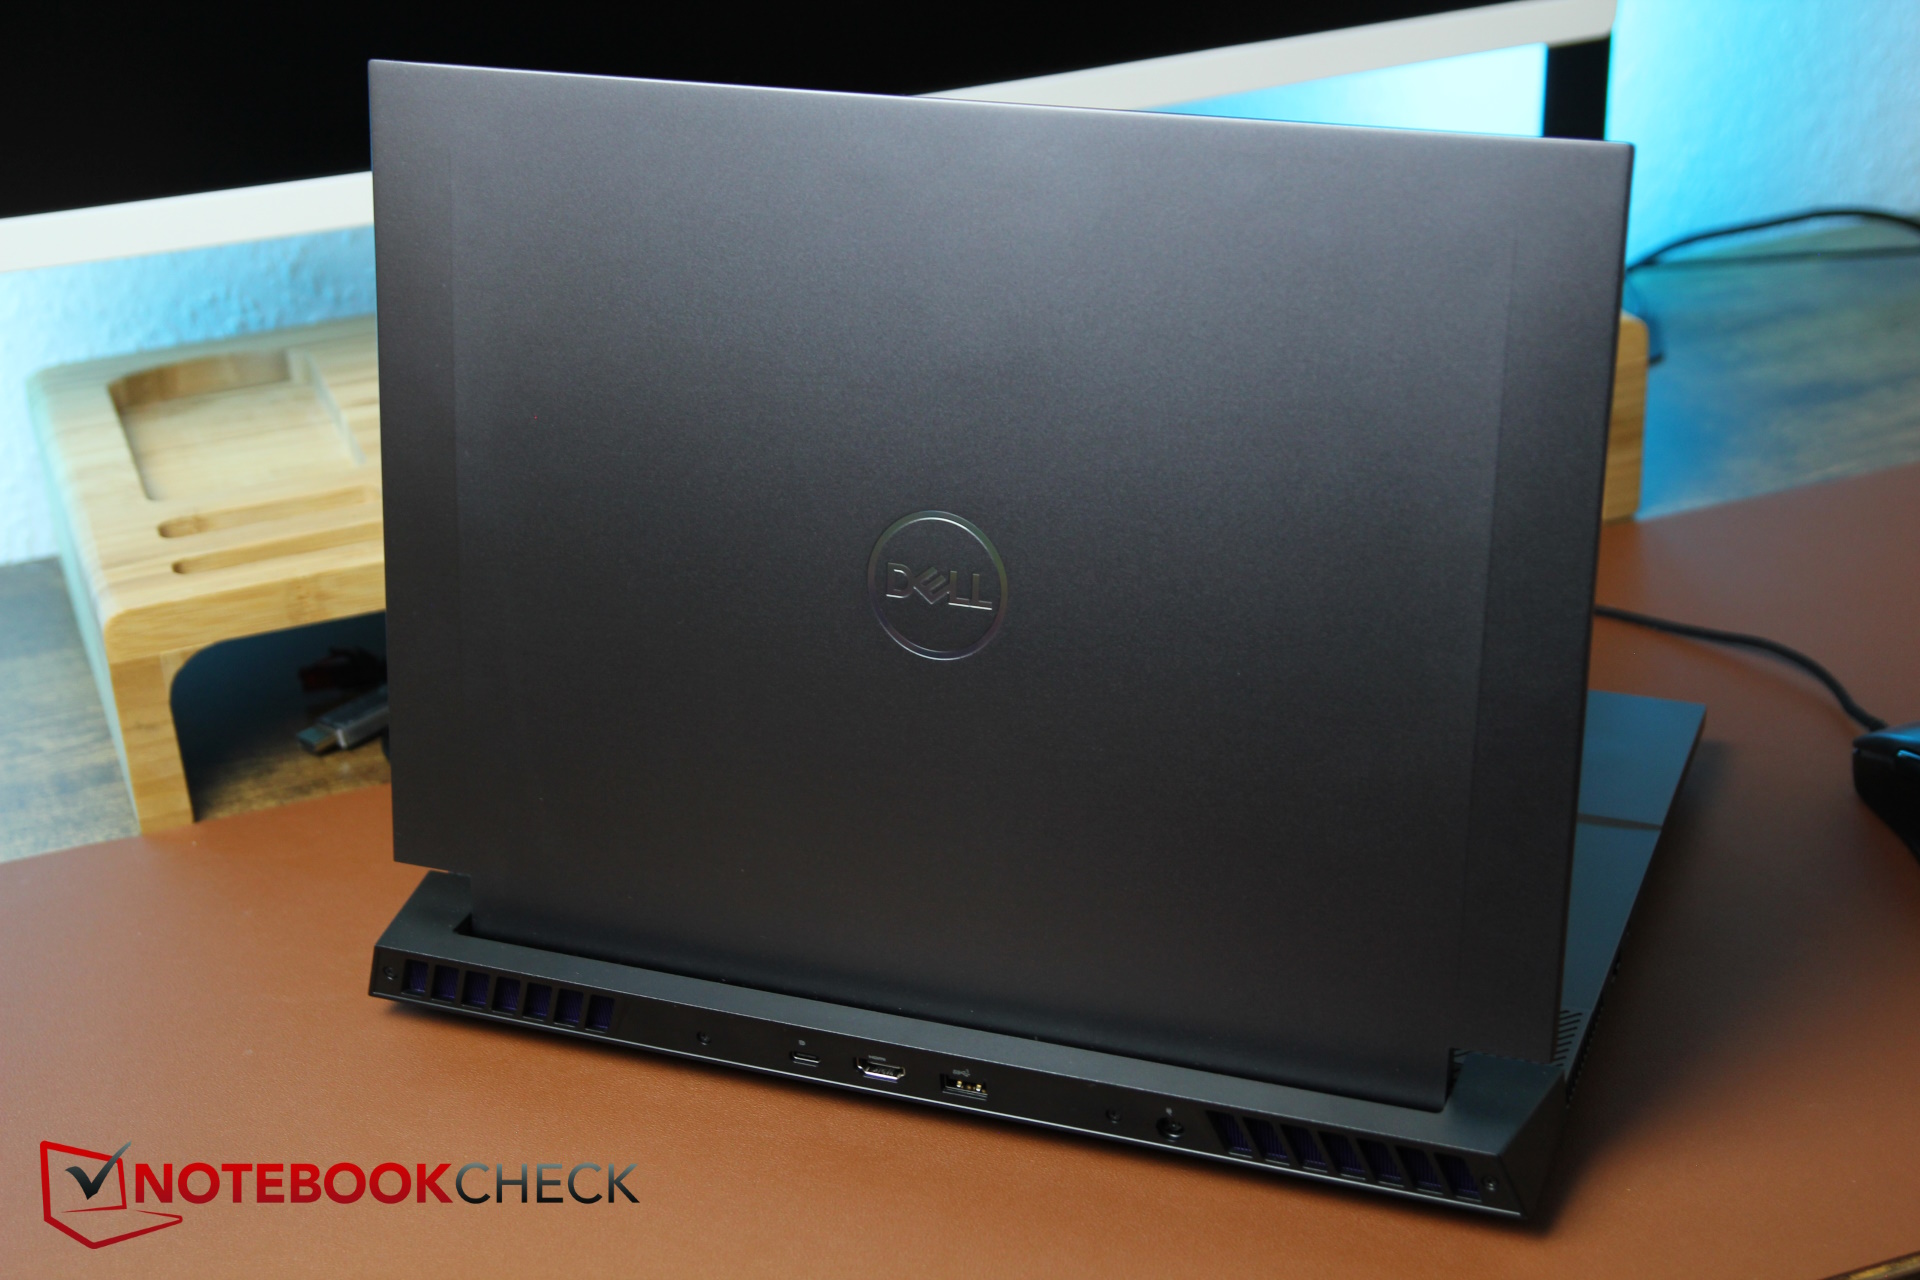
O logotipo da Dell se destaca na parte superior do laptop e, além disso, ele não apresenta nenhum destaque de cor adicional. No entanto, o jogador óbvio também não parece muito elegante, o que se deve principalmente à unidade de resfriamento que se projeta na parte traseira. No geral, o G16 não parece muito elegante, mas sim desajeitado e pesado.
O mais caro Alienware m16 R1 é, na verdade, um pouco mais largo do que o G16 e tem espessura semelhante. O MSI Raider GE68HX é ainda um pouco mais espesso, enquanto o restante de suas medidas é quase idêntico. Até mesmo o Lenovo Legion Slim 5 não é muito mais fino, embora o G16 pareça bastante espesso, mas o primeiro é um pouco menor.
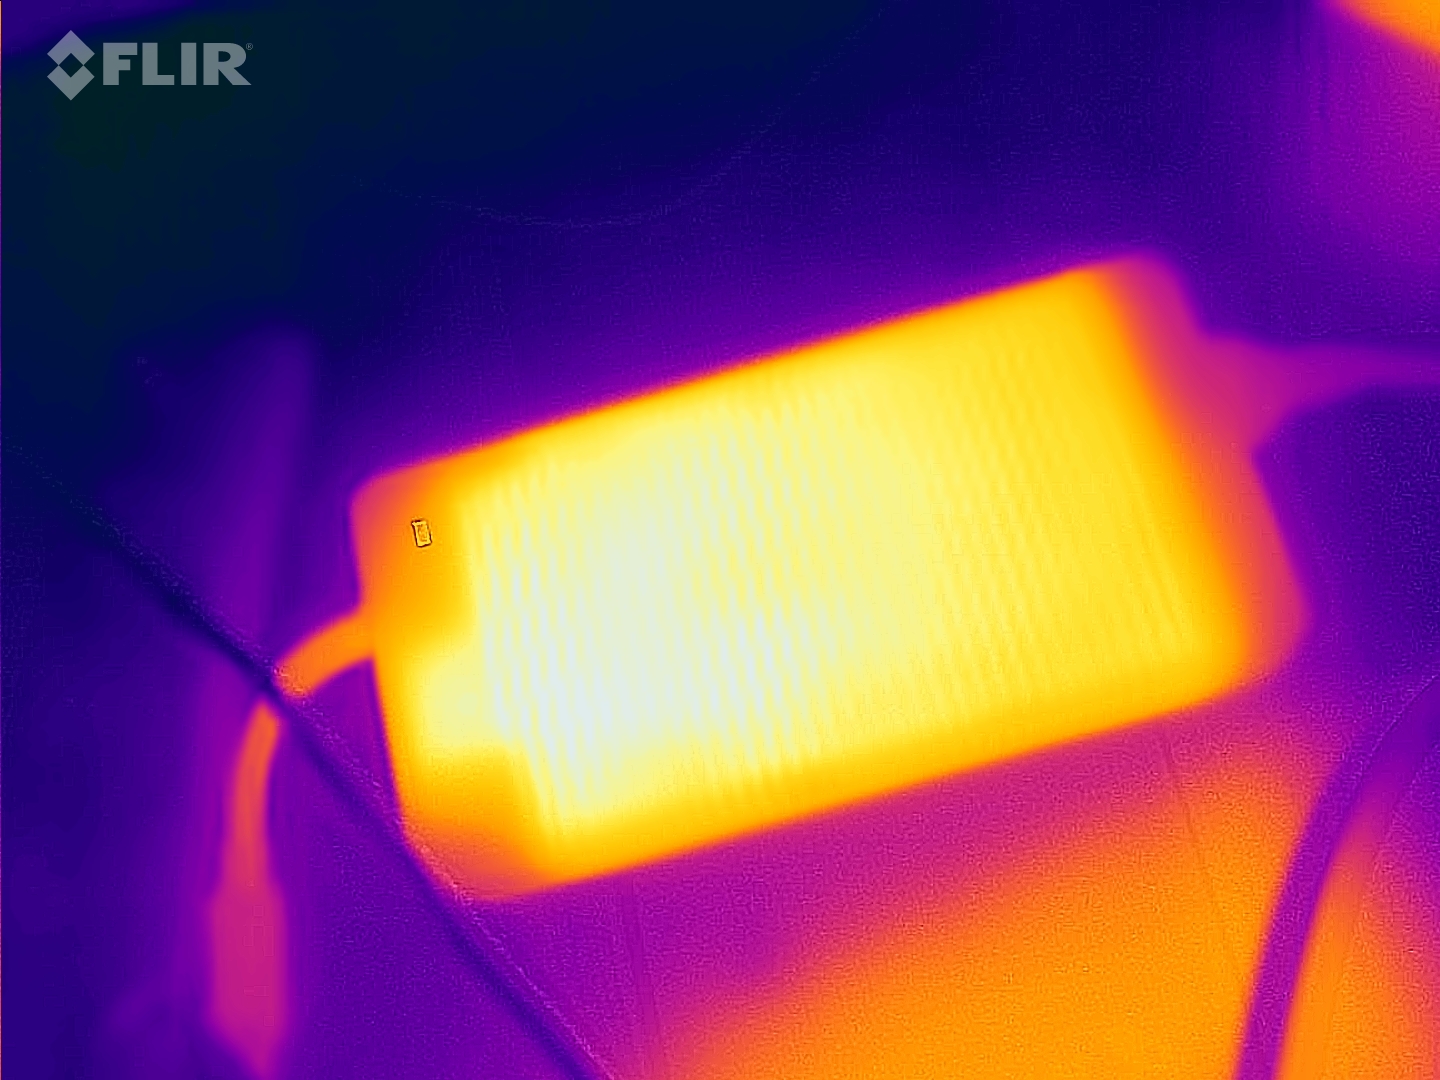
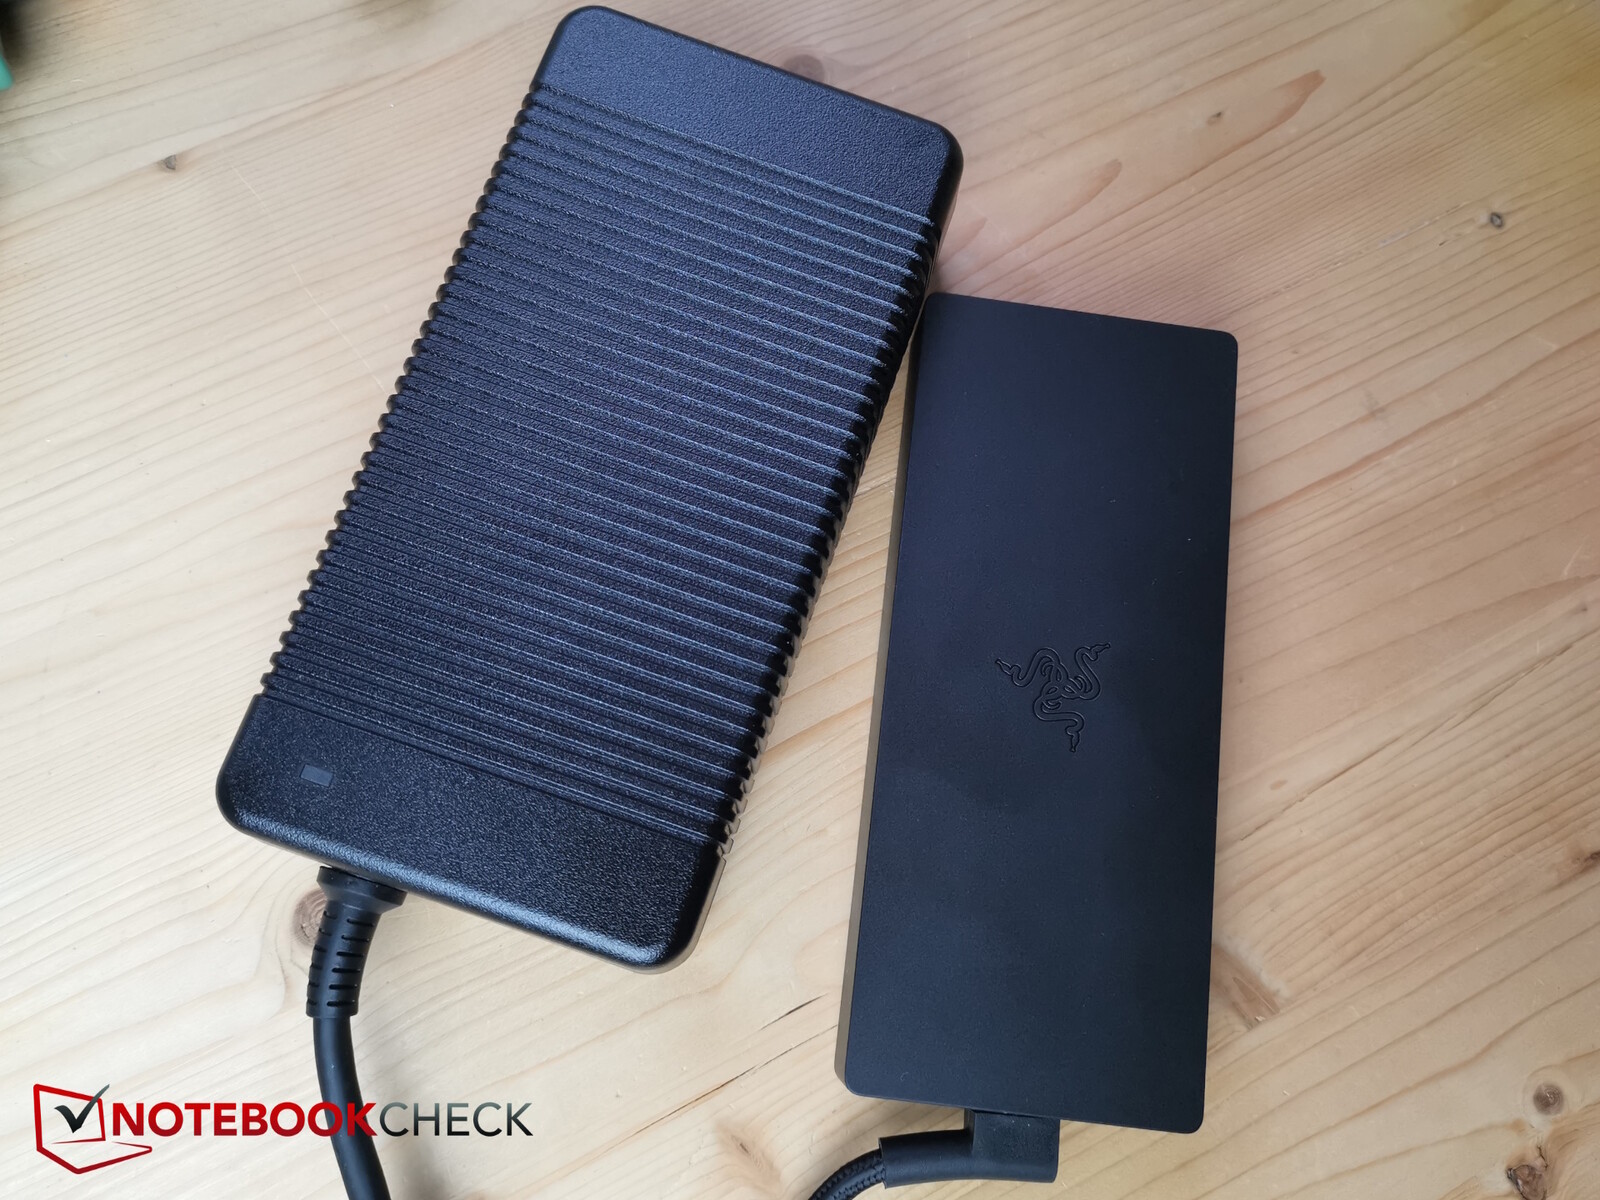
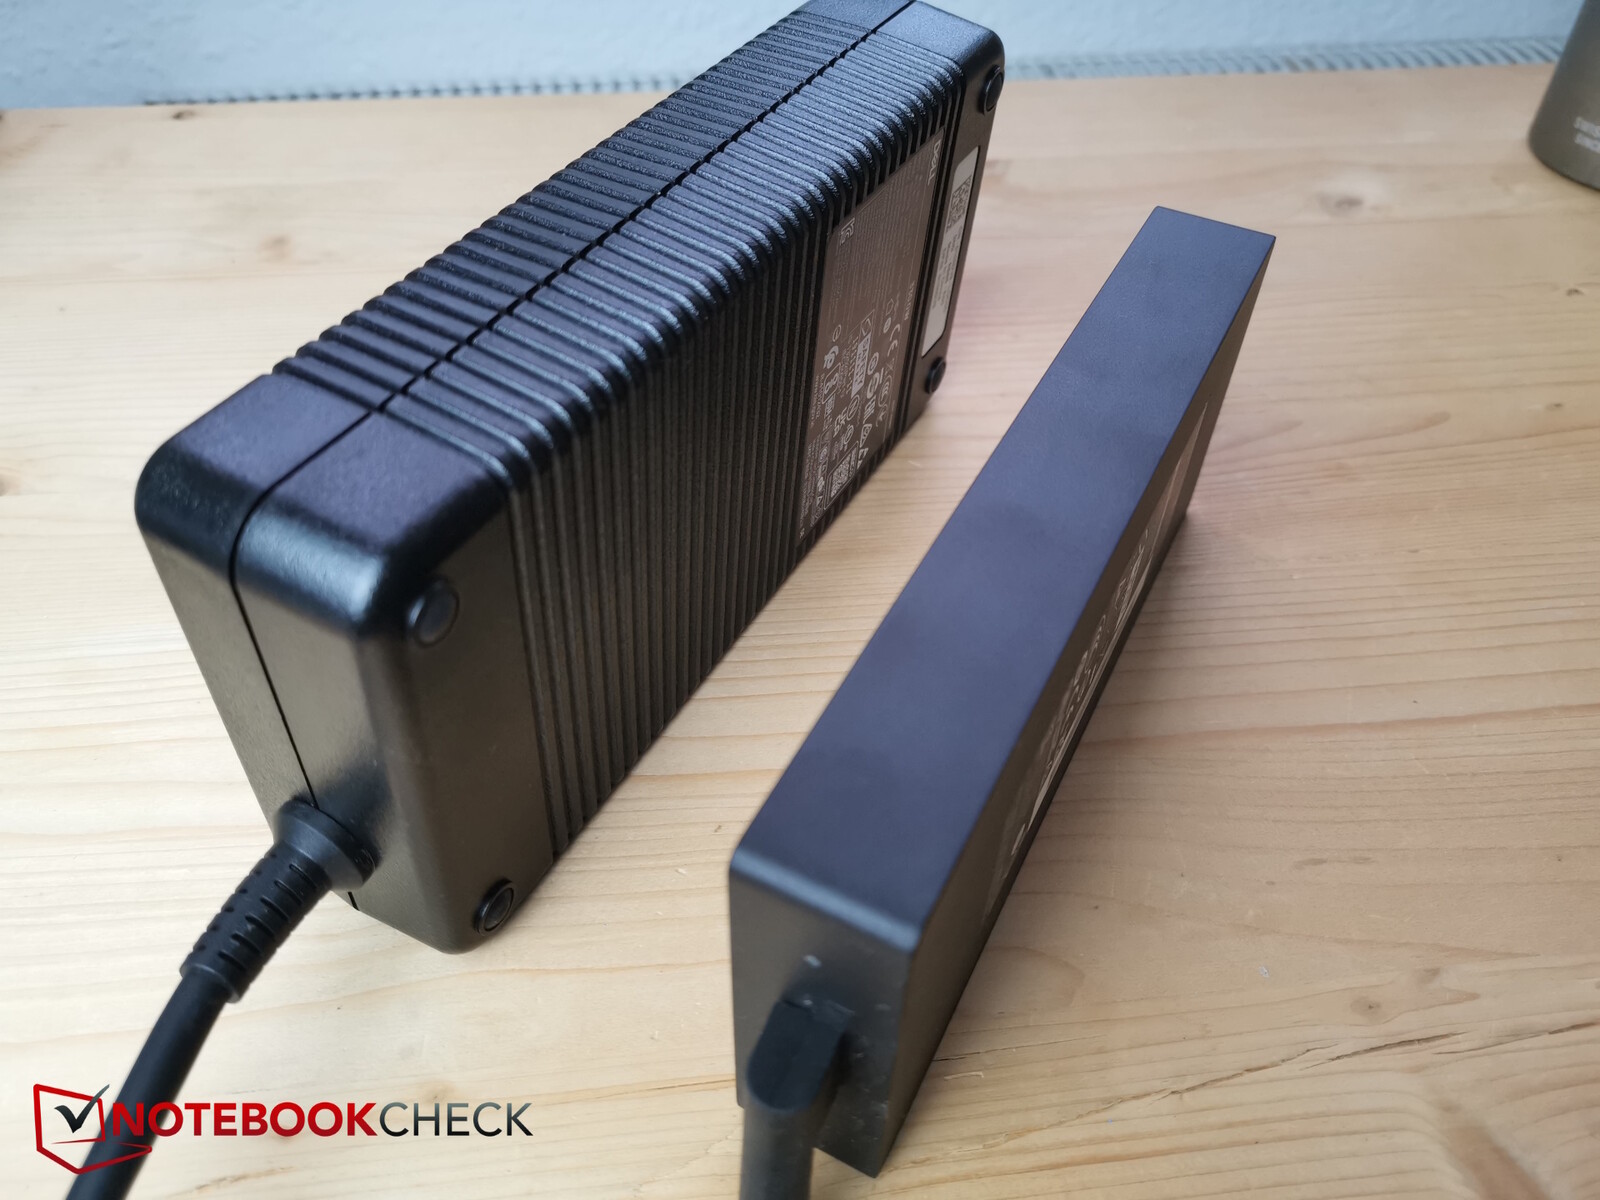
Em comparação com seu antecessor, esse modelo ficou, de fato, um pouco mais fino, mas, ao mesmo tempo, aumentou sua profundidade. Ele também é mais pesado (+ 200 g), o que significa que o G16 é agora o segundo gamer de 16 polegadas mais pesado com uma RTX 4060, depois do Alienware do mesmo fabricante. Além disso, a Dell ainda fornece a versão com uma RTX 4060 com uma enorme e pesada fonte de alimentação de 330 watts - só isso pesa mais de 1,5 kg.
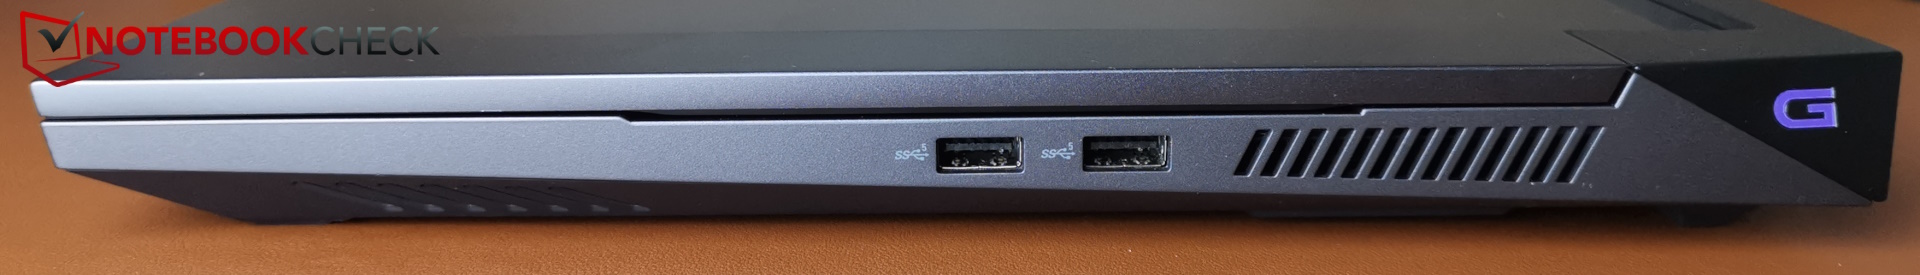
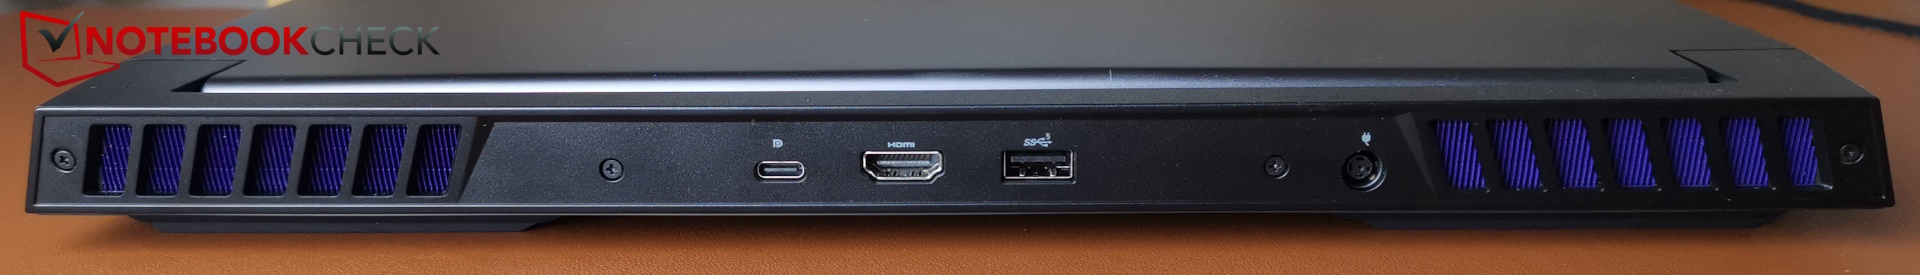
Conectividade - Thunderbolt não está disponível em todos os modelos G16
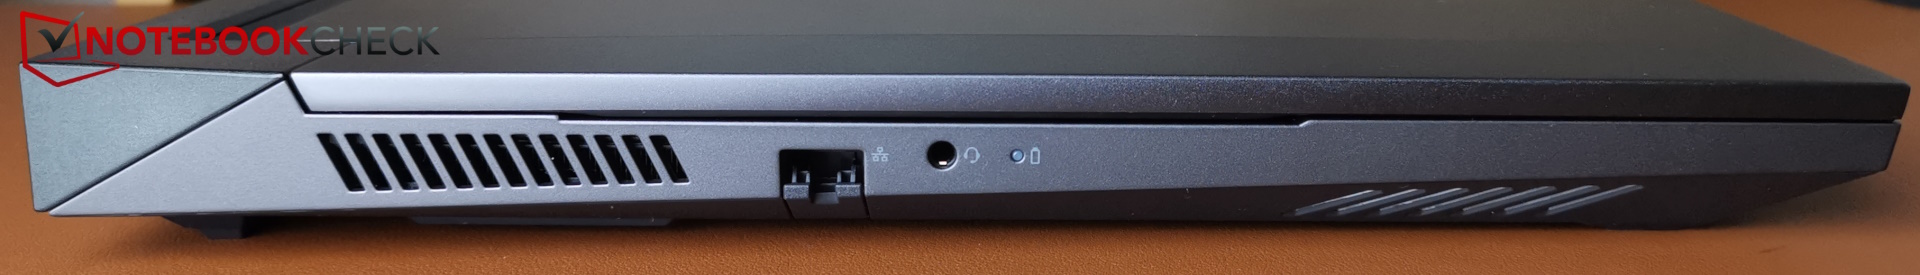
O layout das portas do laptop permaneceu o mesmo, com uma única exceção: Na parte traseira, as conexões foram um pouco embaralhadas. Embora a porta HDMI tivesse muito espaço no modelo anterior, agora ela fica bem entre a porta USB-A e a porta USB-C - a primeira pode causar alguns problemas de espaço quando usada com plugues maiores. Essa decisão da Dell é bastante questionável.
Cuidado: O plugue de alimentação não fica muito firme e, quando o laptop é movido, ele escorrega facilmente. A fonte de alimentação pesada contribui ainda mais para esse problema.
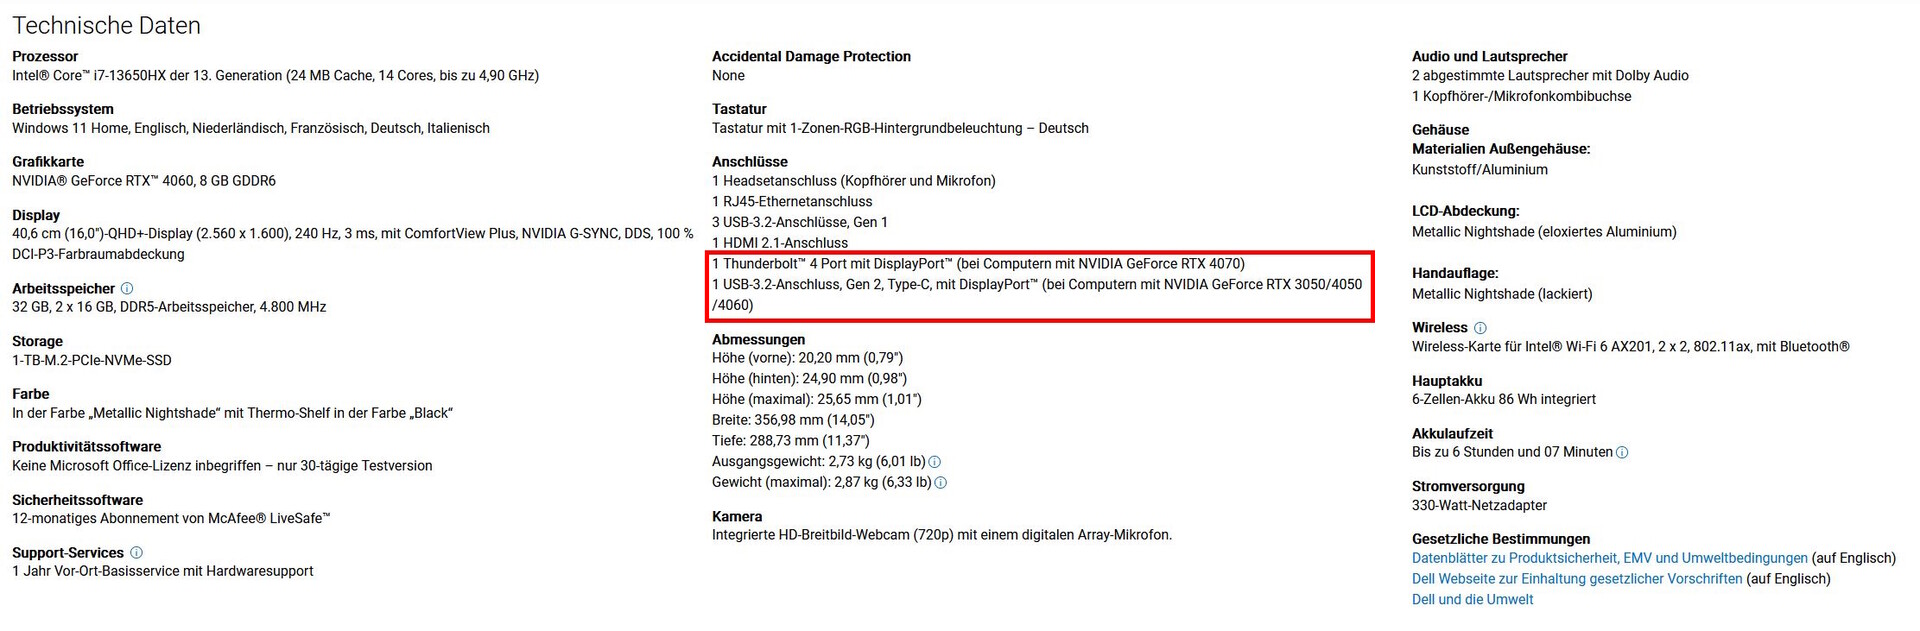
Igualmente questionável é o suporte Thunderbolt (4) do dispositivo, que foi incluído em seu antecessor. Agora, aparentemente depende da placa de vídeo instalada. De acordo com a Dell, o Thunderbolt não é suportado em modelos que usam até uma RTX 4060, enquanto uma RTX 4070 ou superior o possui. Isso é incomum e, para os clientes que compram as configurações menores, é frustrante. A porta não é compatível com o PowerDelivery.
Comunicação
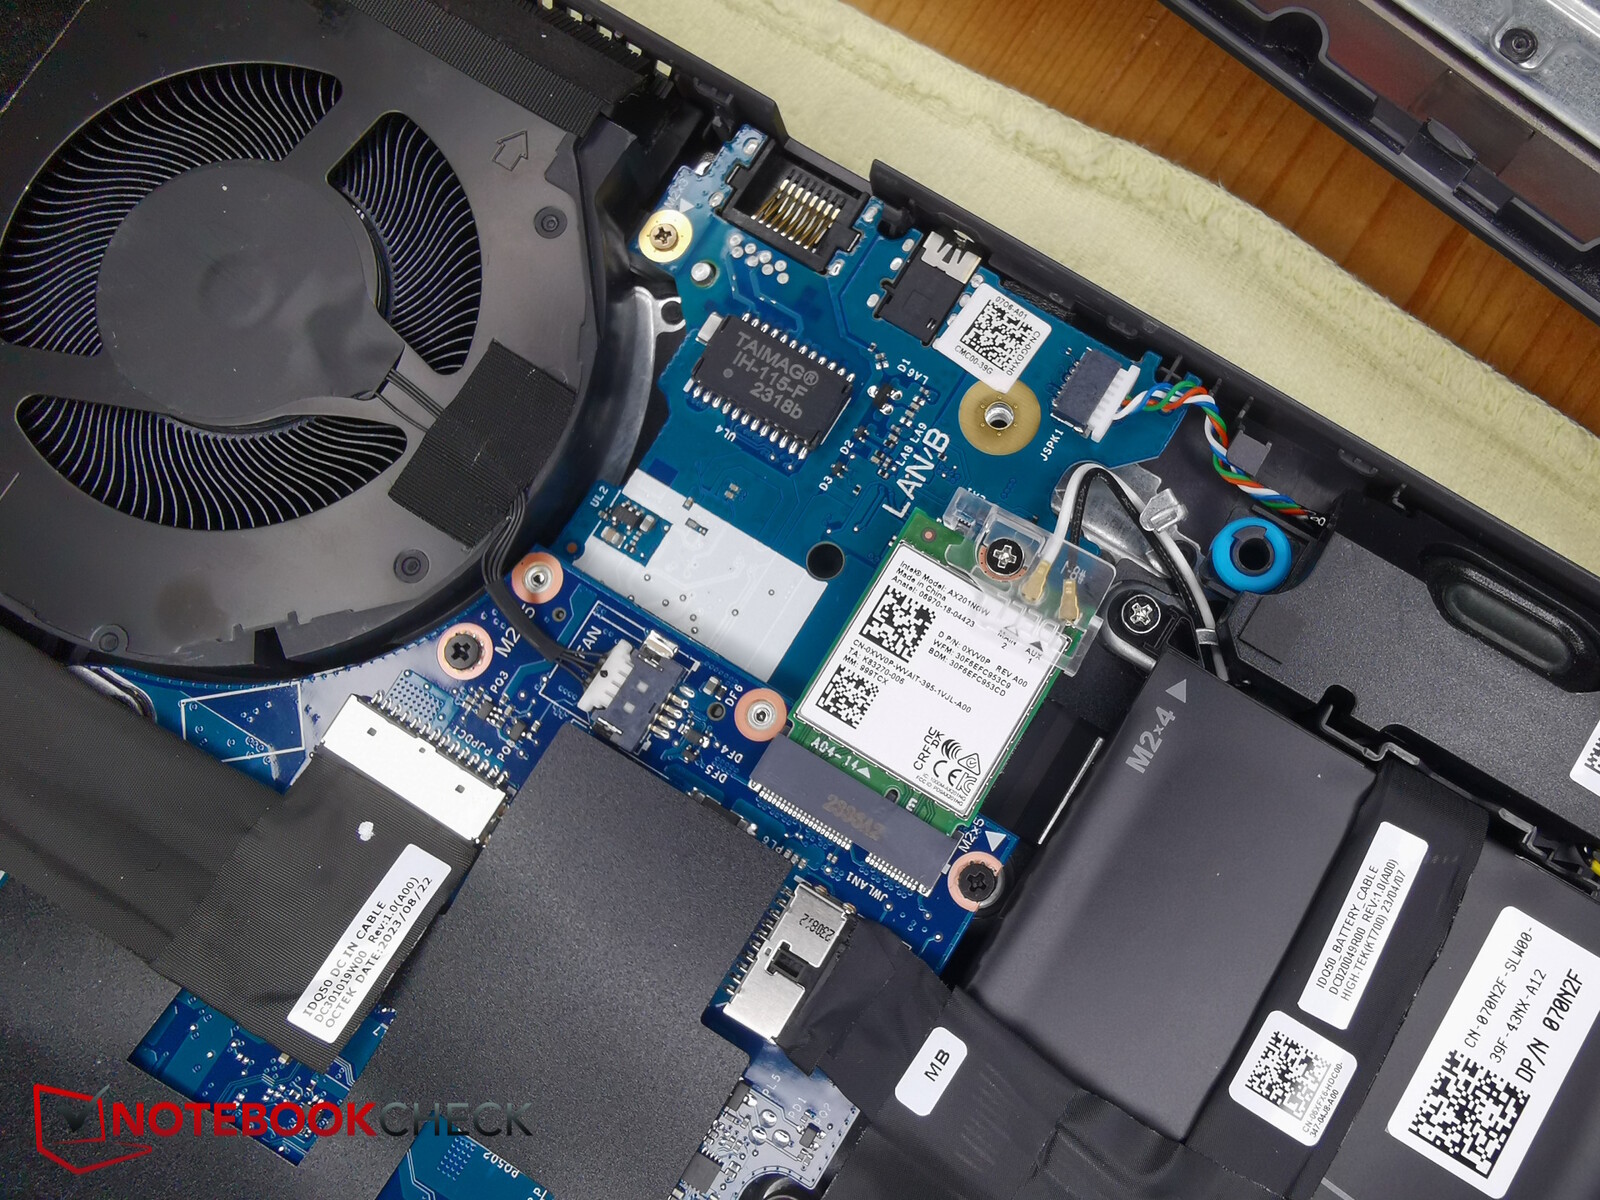
O módulo WiFi Intel AX201 suporta WiFi 6, mas ainda não WiFi 6E.
Suas taxas de transferência na banda de 5 GHz são excepcionais, enquanto suas taxas de 2,4 GHz de 210 Mb/s são decepcionantes.
Webcam
No mais tardar, sua escassa webcam de 720p mostra onde a Dell economizou. Muitos concorrentes já possuem uma câmera Full-HD ou melhor. Há modelos melhores no que diz respeito a desvios de cor e nitidez de imagem também.


Segurança
O G16 realmente não apresenta nenhuma função de segurança física, pois não tem um sensor de impressão digital nem uma trava Kensington. O TPM está, obviamente, integrado ao processador.
Acessórios e garantia
A embalagem não inclui nenhum extra. A Dell oferece a esse dispositivo uma garantia padrão de 12 meses com serviço básico no local e suporte de hardware, e as condições especiais podem ser vistas na captura de tela a seguir.

Manutenção
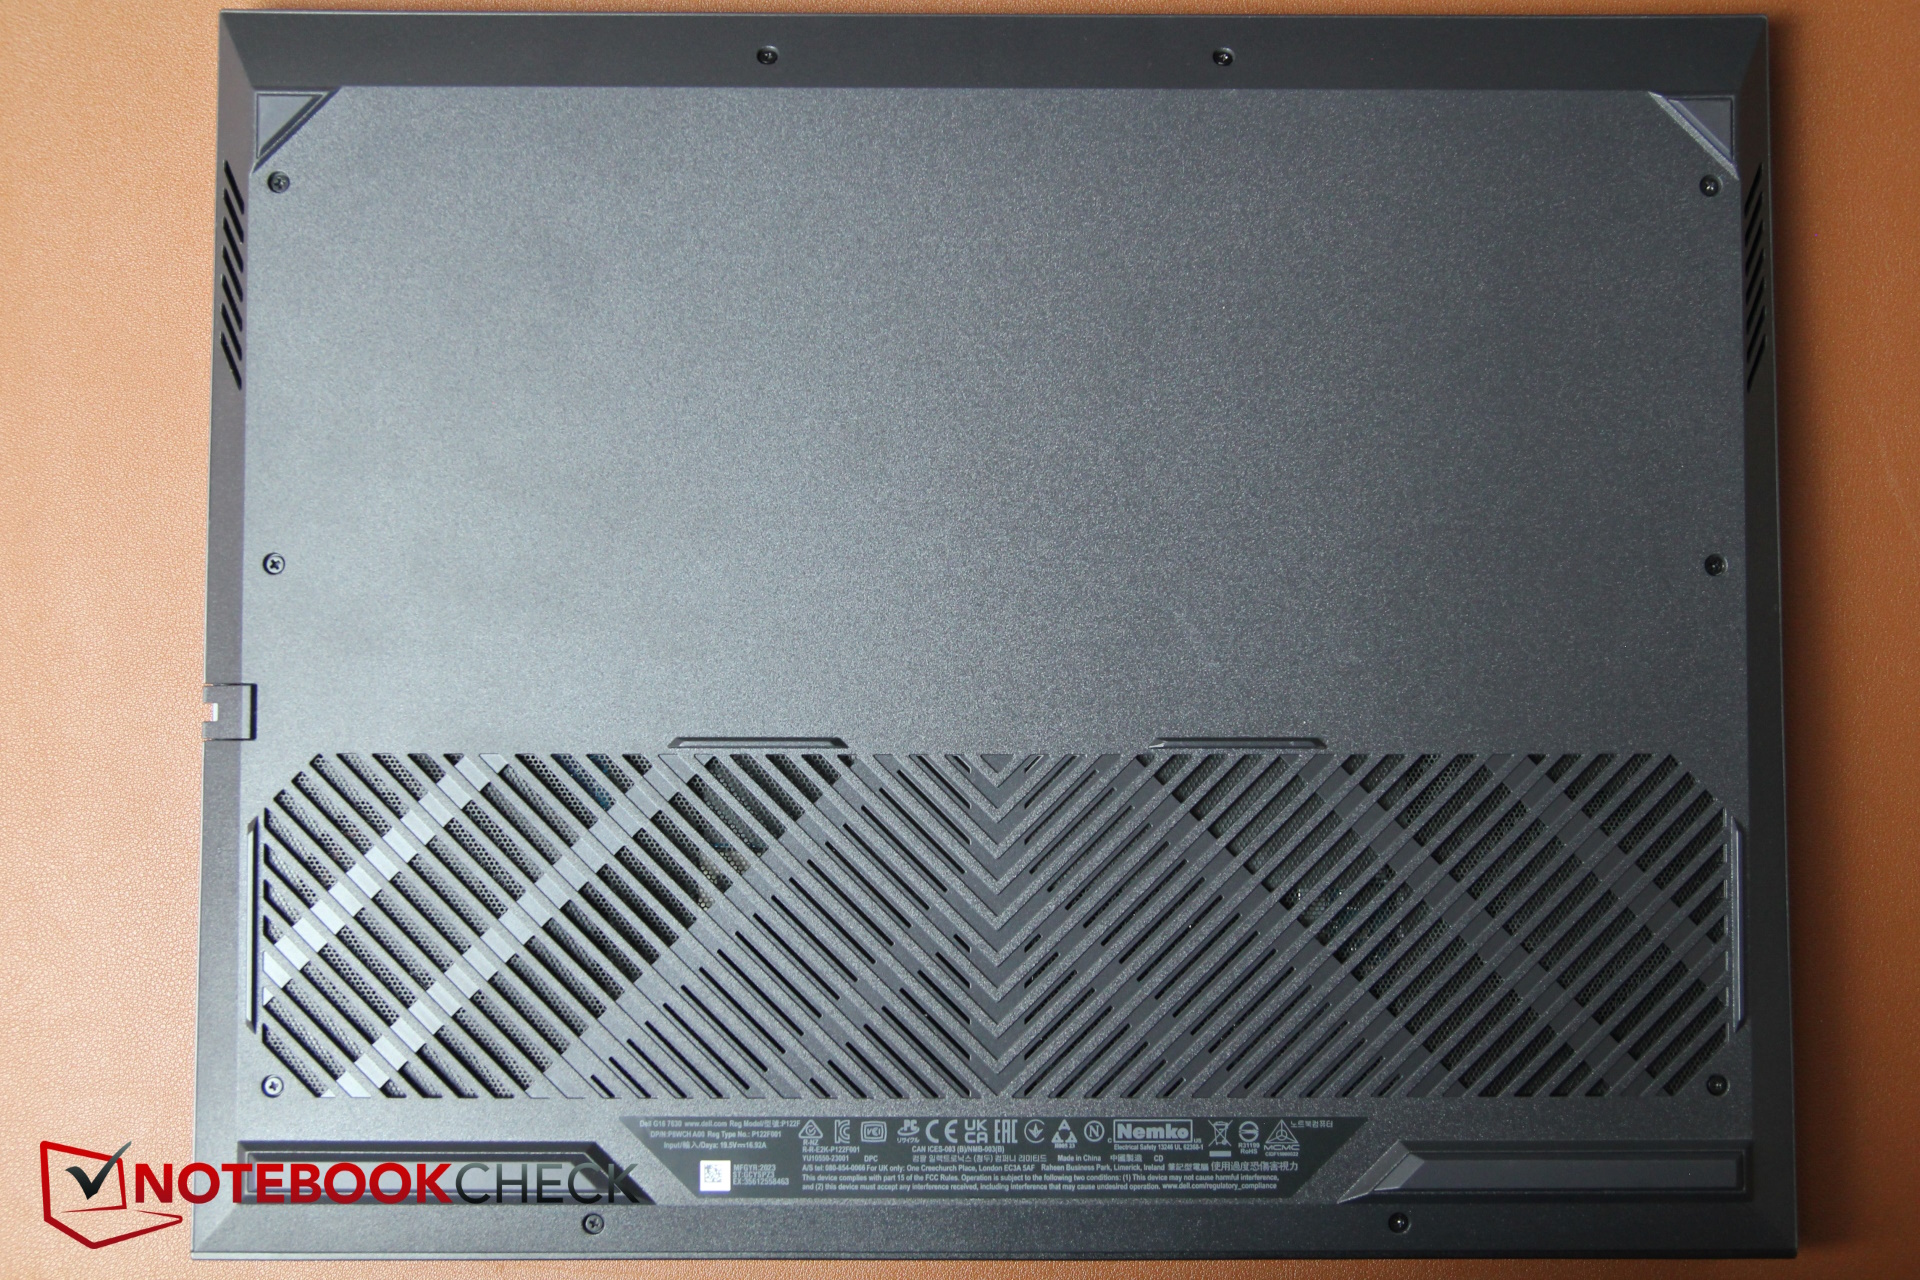
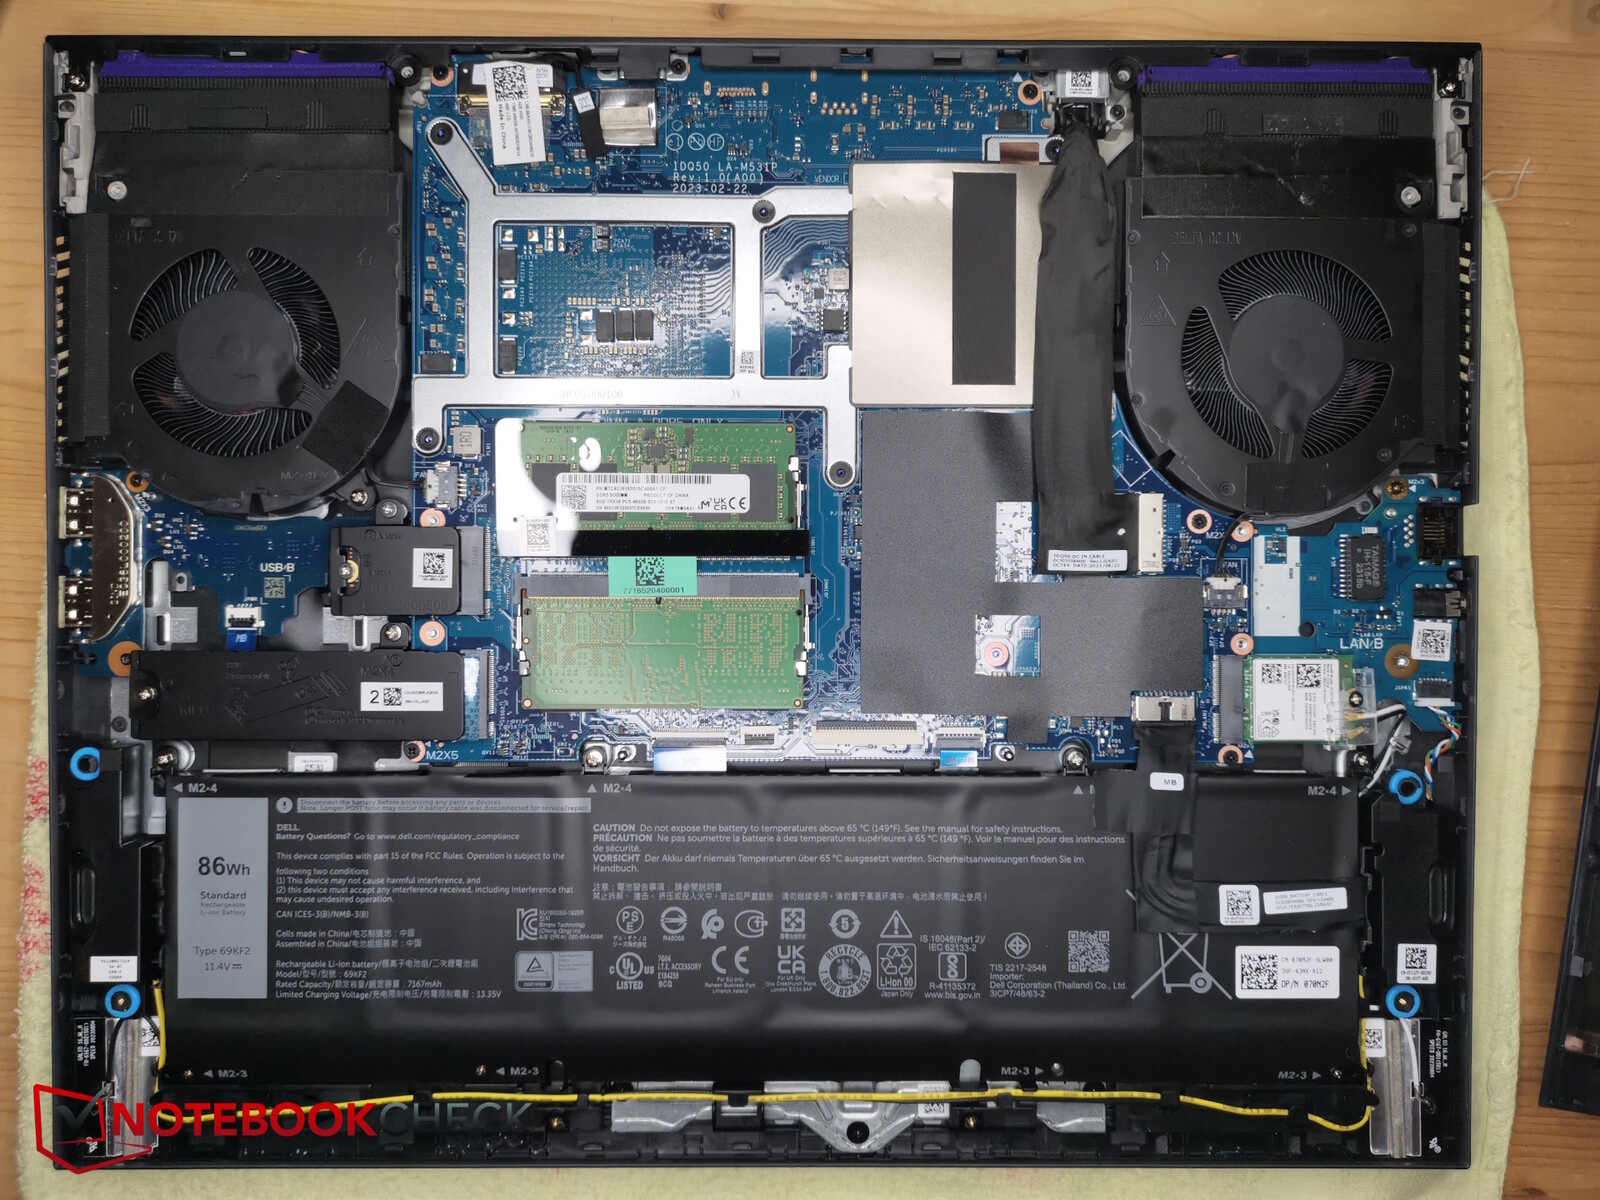
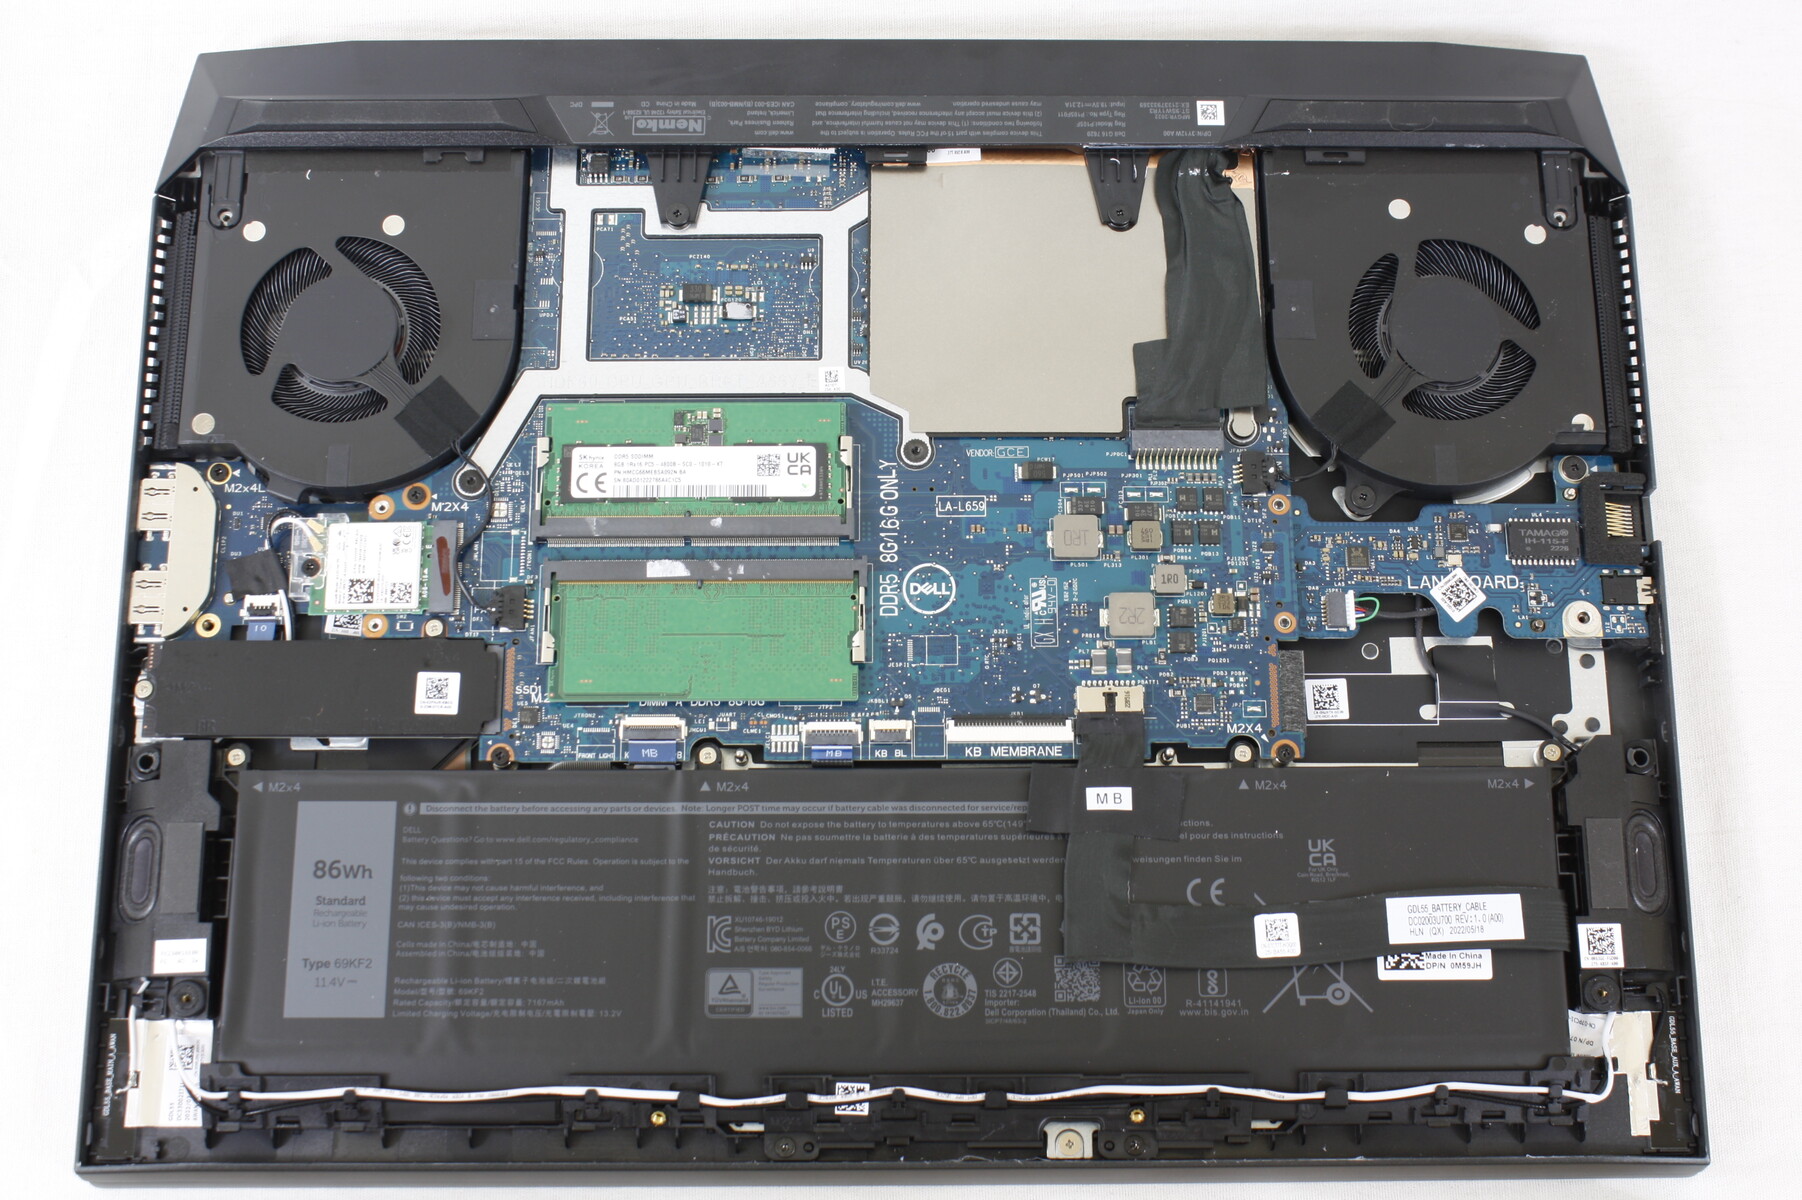
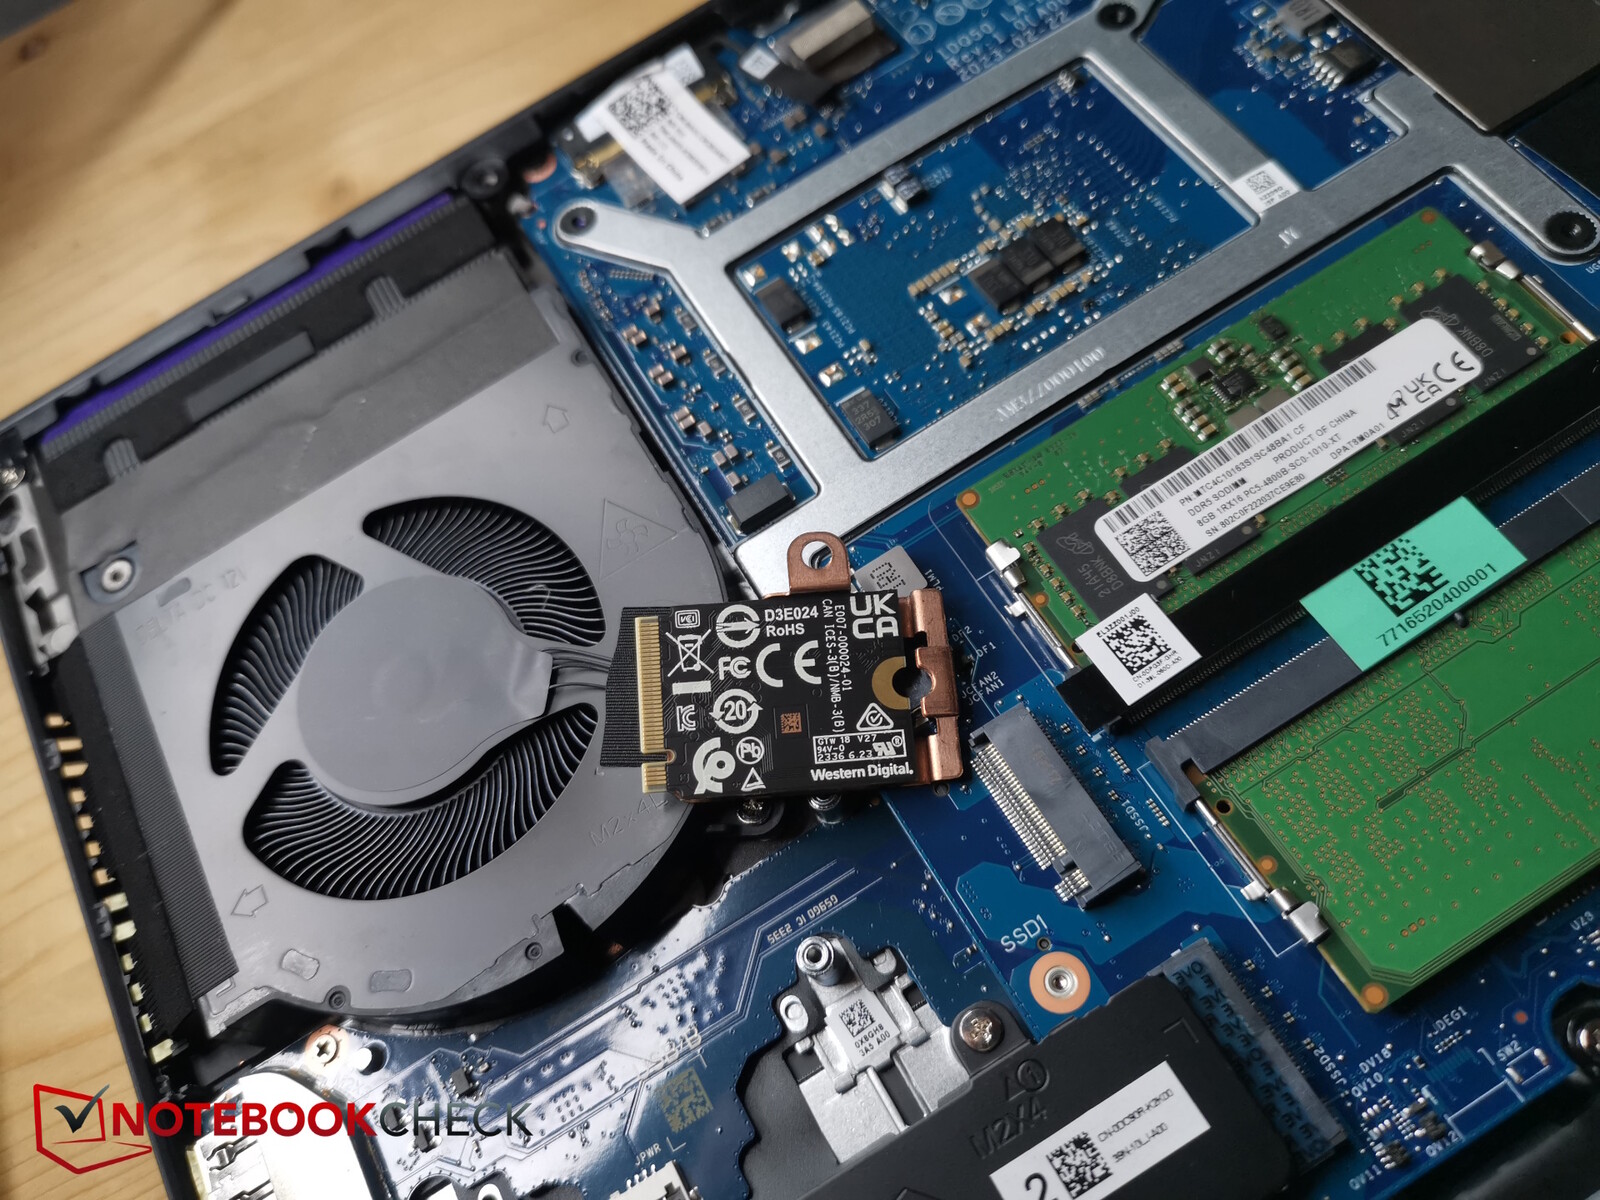
10 parafusos de cabeça cruzada mantêm a placa inferior no lugar. Quatro deles são mais longos do que os demais, mas não caem de seus orifícios, portanto, não há nenhuma preocupação de que se misturem. Se os parafusos forem removidos, a parte inferior do gabinete praticamente se solta sozinha, portanto, o senhor não precisará de nenhuma ferramenta adicional.
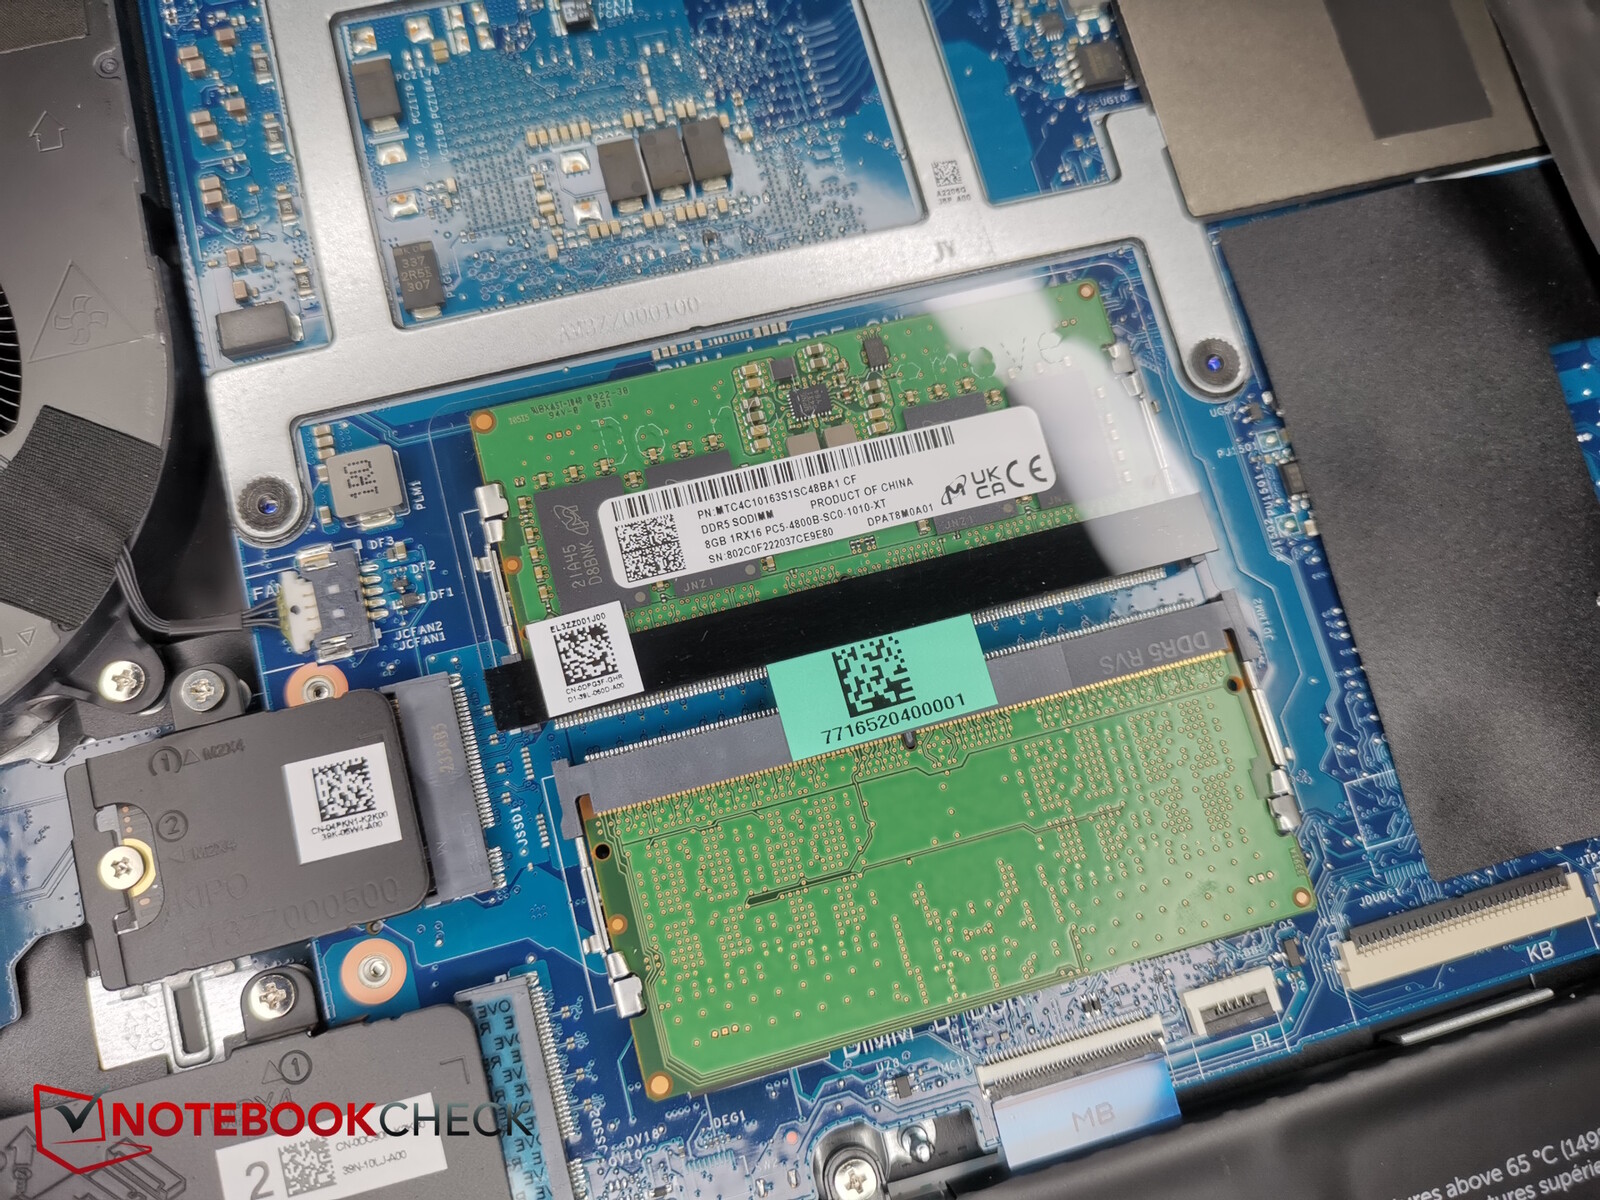
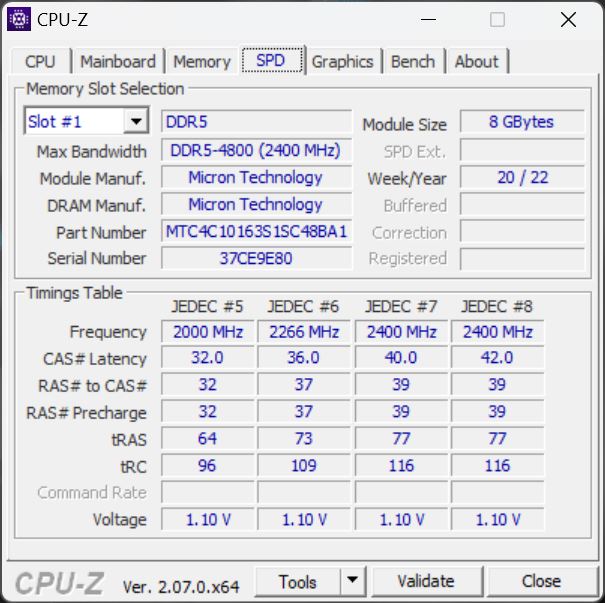
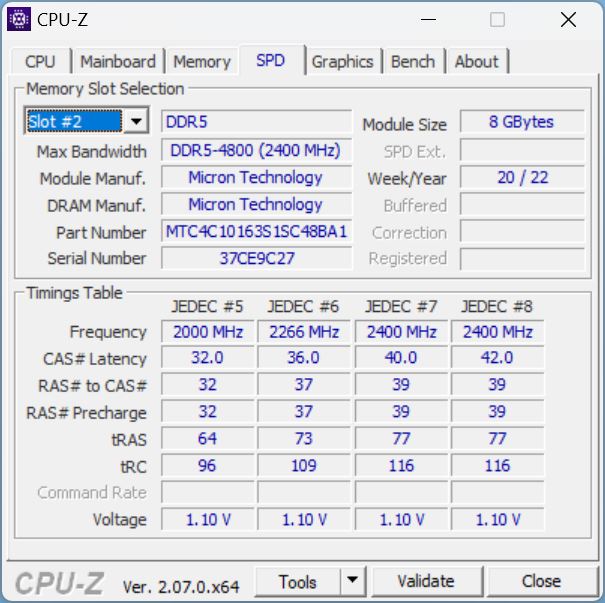
Na parte interna, não há tubos de calor de cobre perceptíveis, como se vê na maioria dos concorrentes para jogos. O senhor pode acessar as ventoinhas, os dois slots de RAM, o módulo WiFi, a bateria e os dois slots M.2-SSD, dos quais apenas o de formato menor, 2230, está ocupado.
Dispositivos de entrada - 5 teclas especiais configuráveis
Teclado
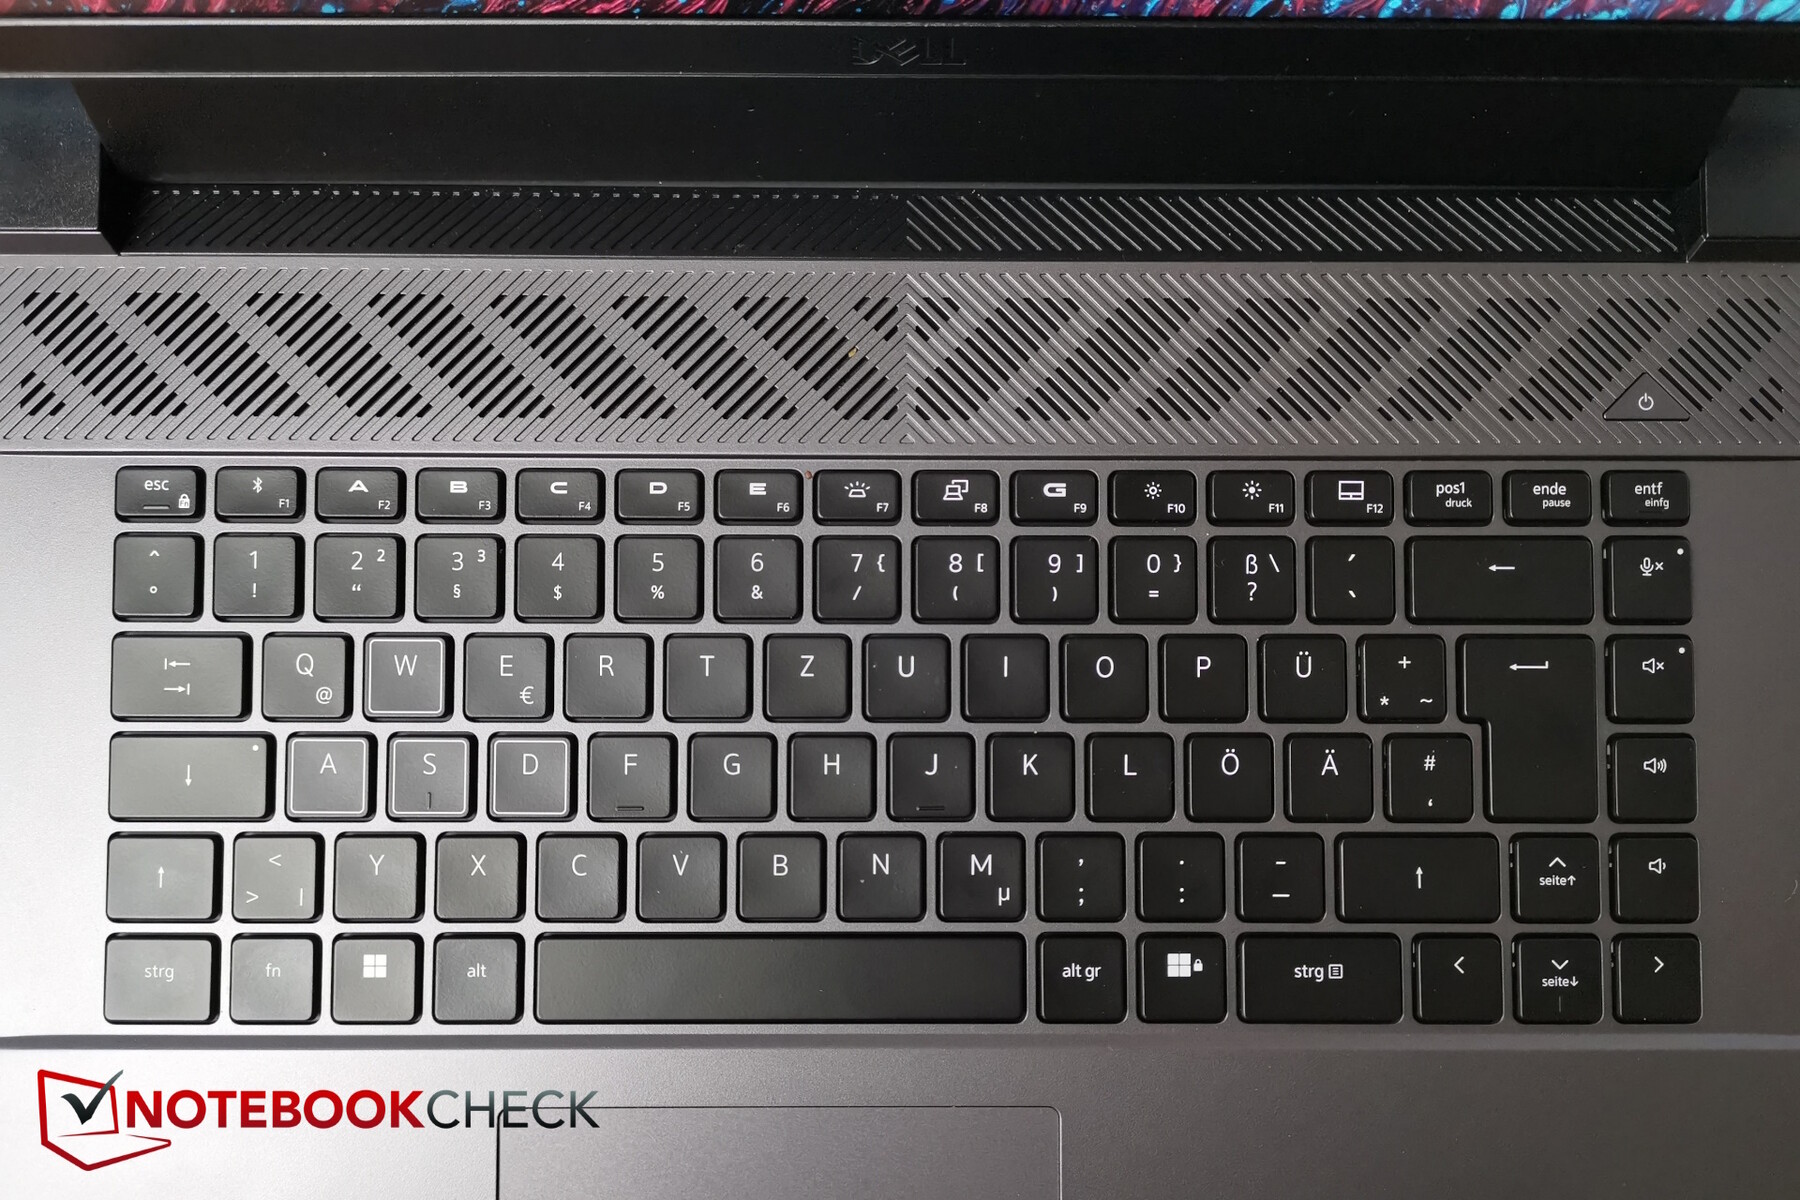
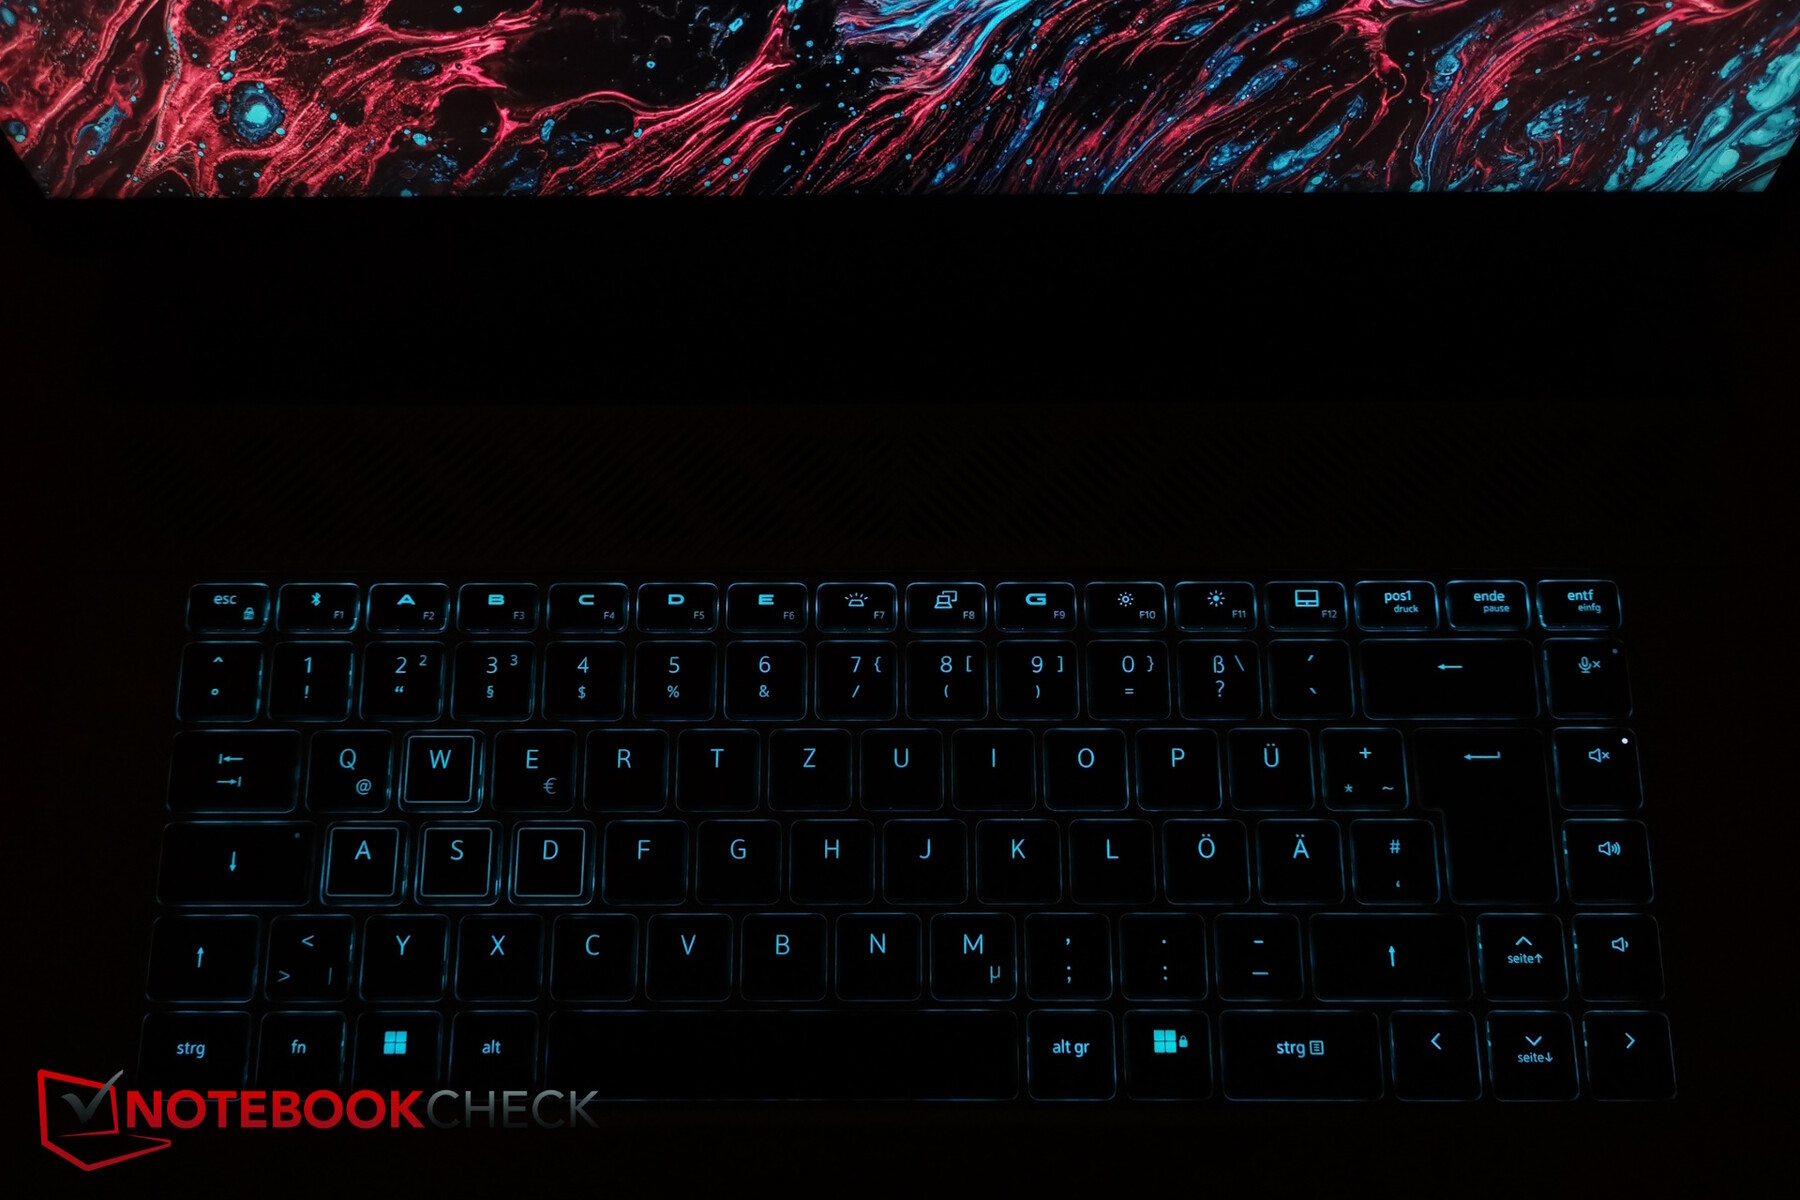
O G16 não apresenta um teclado numérico, mas isso significa que todas as teclas têm espaço suficiente, inclusive as teclas de seta de tamanho normal. No lado direito, há algumas teclas especiais (volume, botão de silenciar o microfone). As teclas normais têm cerca de 1,6 x 1,6 cm de tamanho e as teclas F têm metade da altura. As teclas WASD têm um contorno branco.
Como algumas teclas especiais estão localizadas à direita, as teclas F2 a F6 podem ser configuradas manualmente, por exemplo, com macros.
A elevação das teclas não é muito alta, mas o feedback é bom e o usuário pode digitar com conforto e rapidez nelas. Os ruídos resultantes são muito moderados. A tecla de seta para a esquerda em nosso dispositivo de teste soa um pouco diferente das outras teclas (de seta) - ligeiramente oca, como se algo estivesse ressoando no interior. Isso pode ser um erro de produção que, esperamos, afete apenas o nosso dispositivo.
O teclado apresenta uma iluminação de fundo com dois níveis de intensidade. Ele tem apenas uma zona, mas o senhor pode selecionar uma série de efeitos RGB por meio do Command Center (gota de chuva, pulsação etc.).


Touchpad
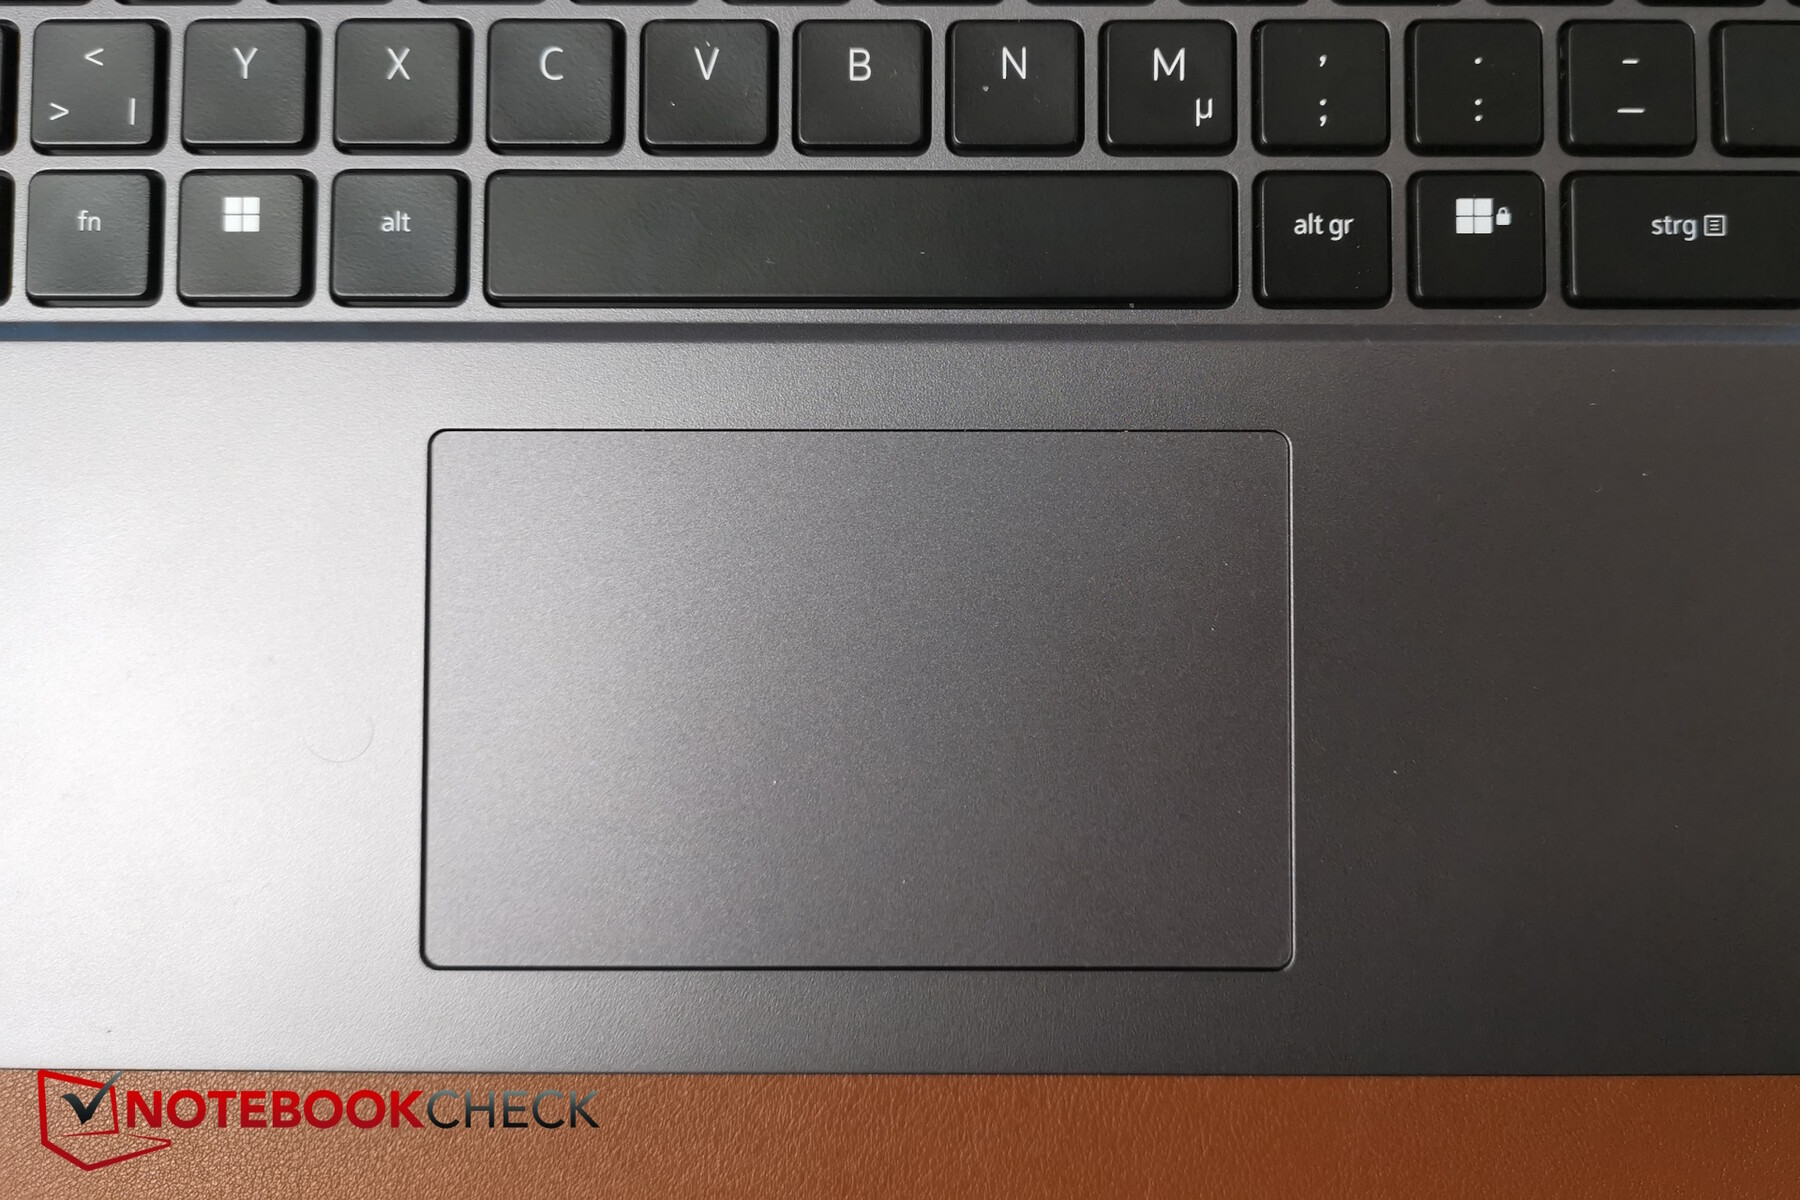
O touchpad é um pouco pequeno (cerca de 10,5 x 6,5 cm), mas a maioria dos jogadores provavelmente usará um mouse, como supõe a Dell. Sua superfície é agradável e suave, mas durante movimentos muito lentos ou se os dedos estiverem úmidos, ele pode grudar um pouco.
Os botões integrados são acionados de forma confiável - o ruído do clique é um pouco mais alto do que o dos botões, mas não chega a ser irritante.
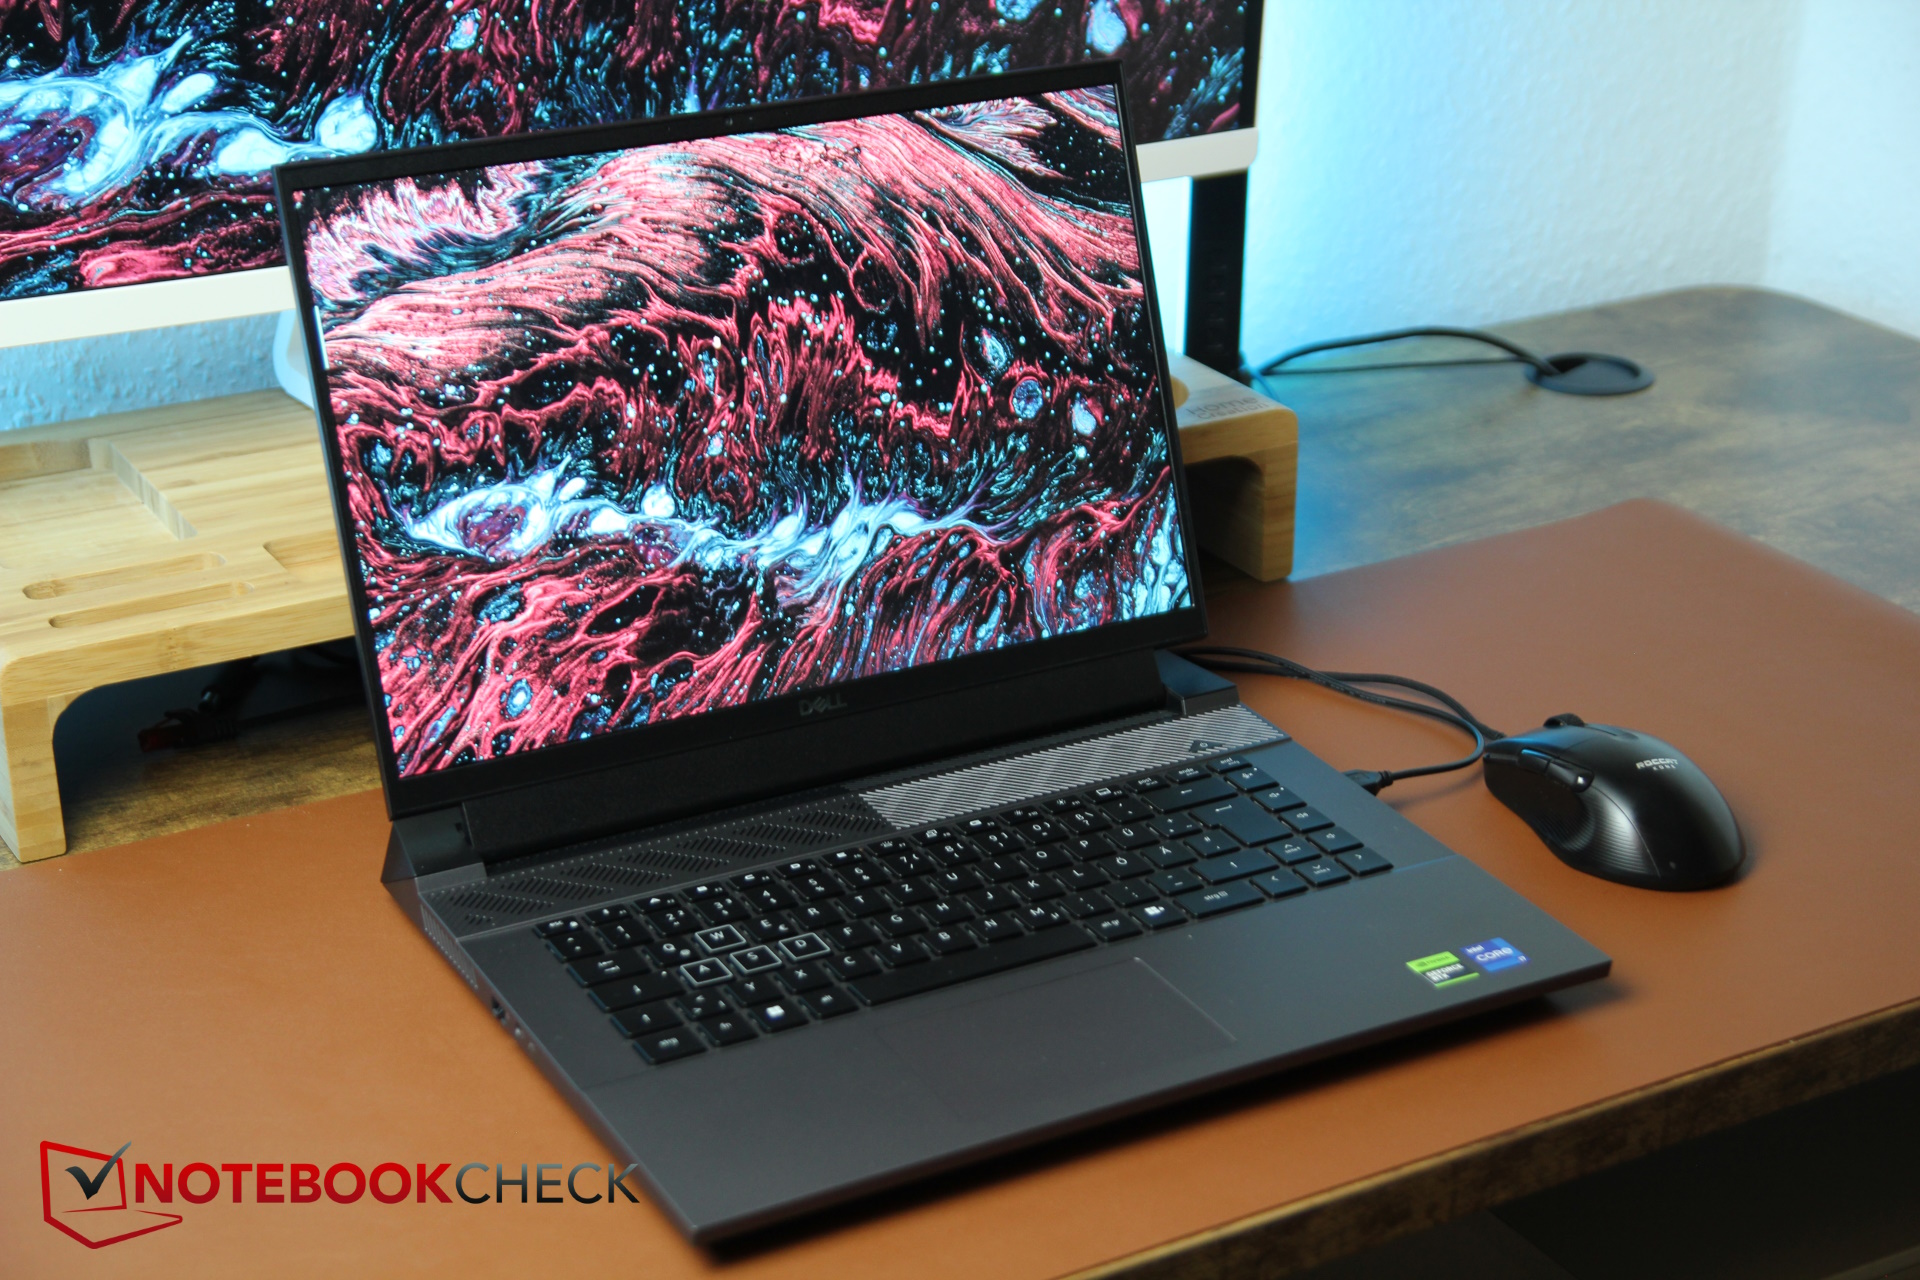
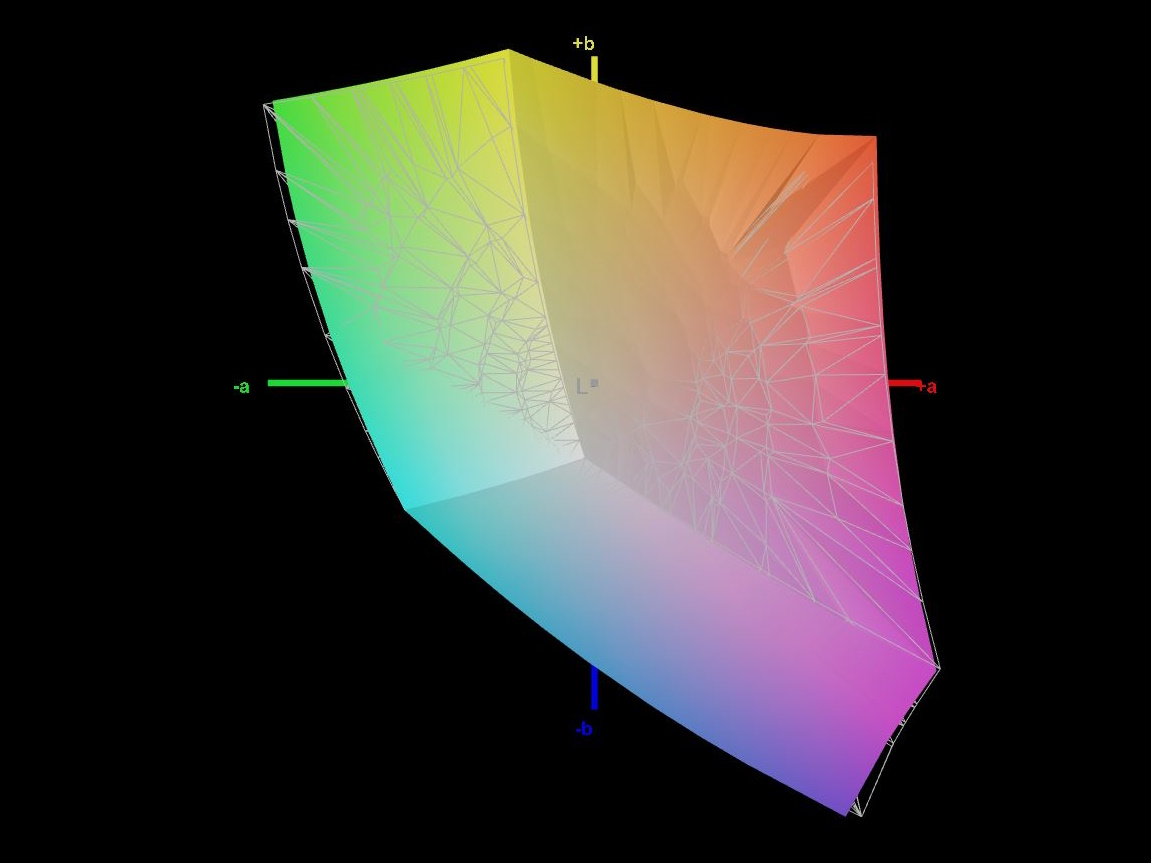
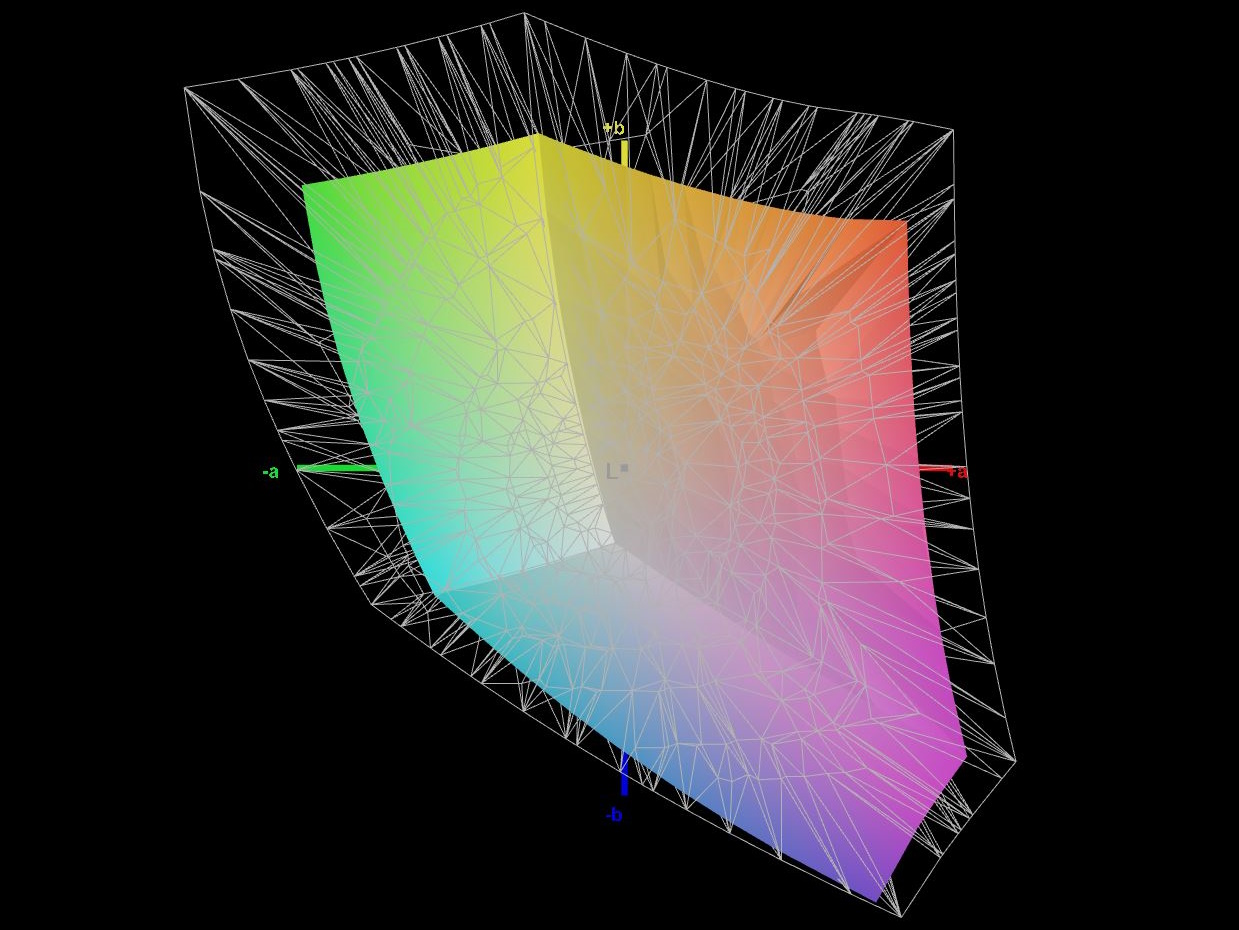
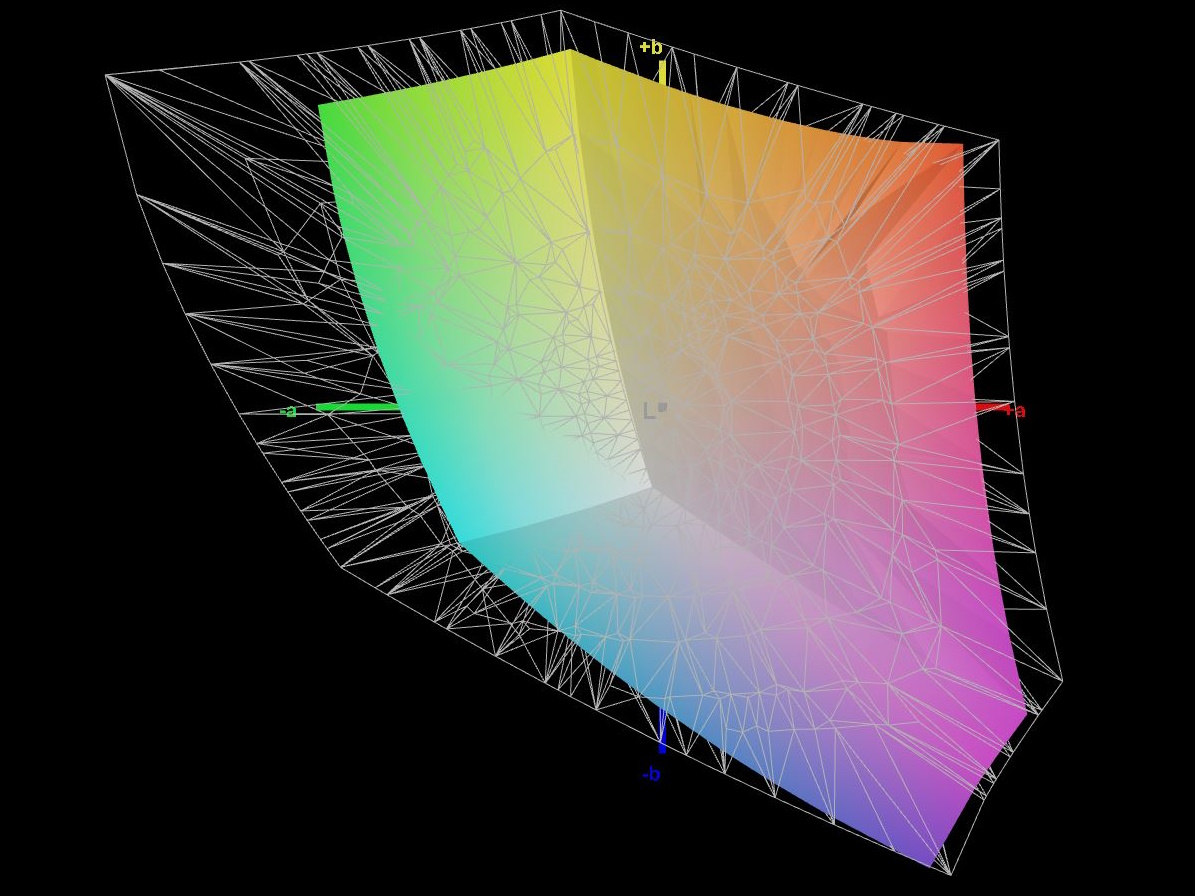
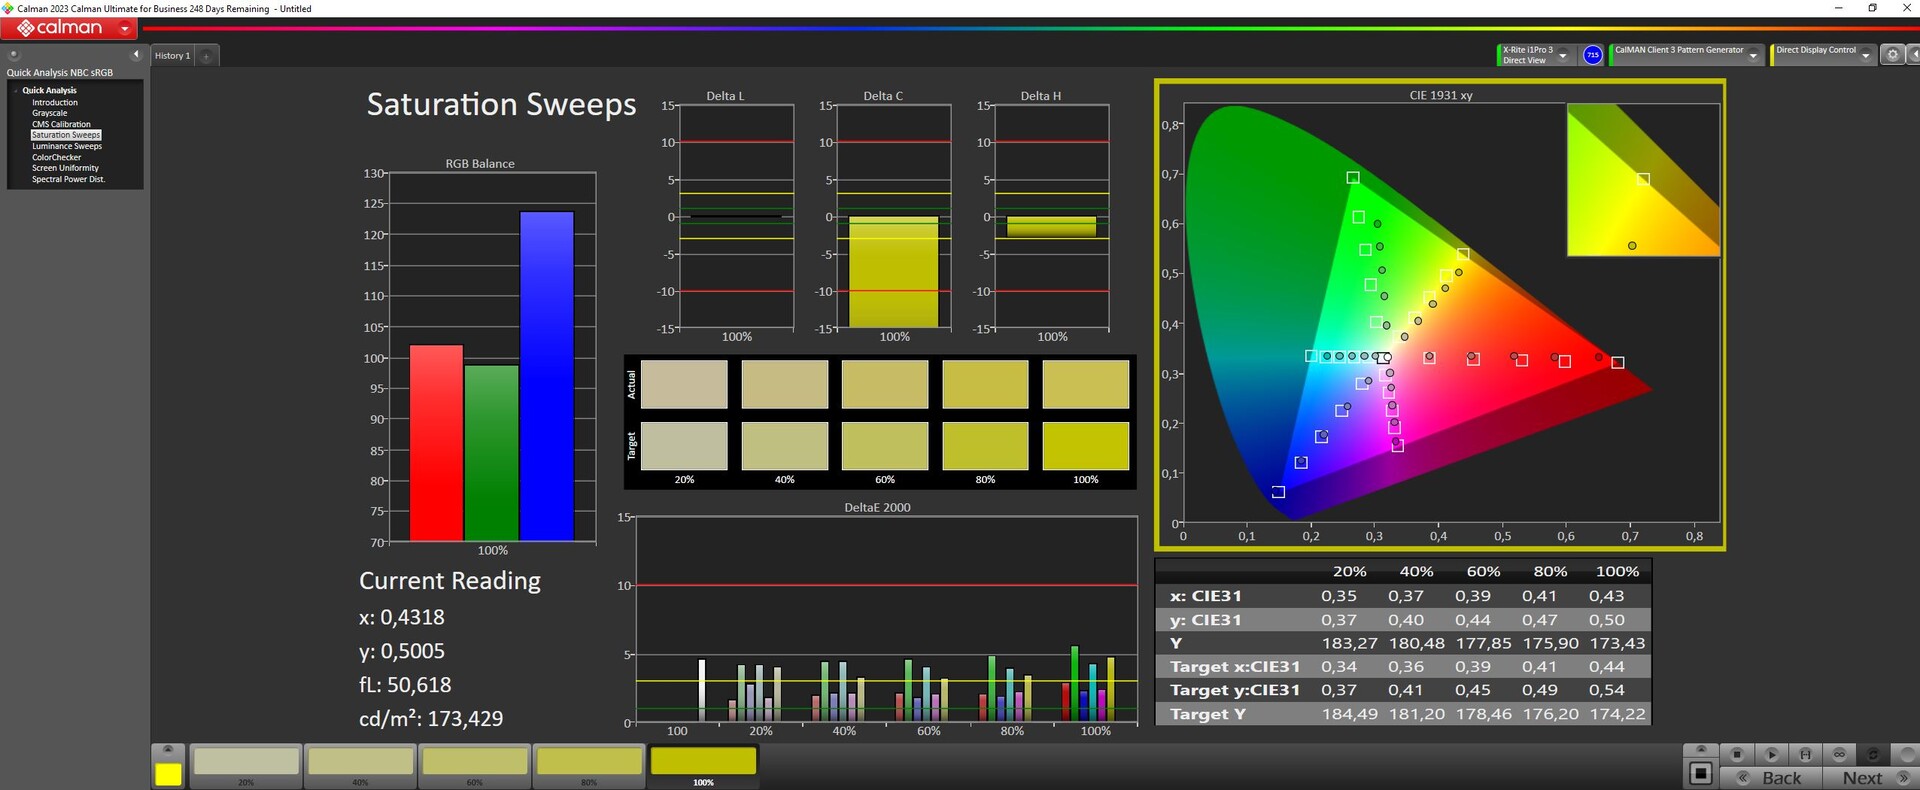
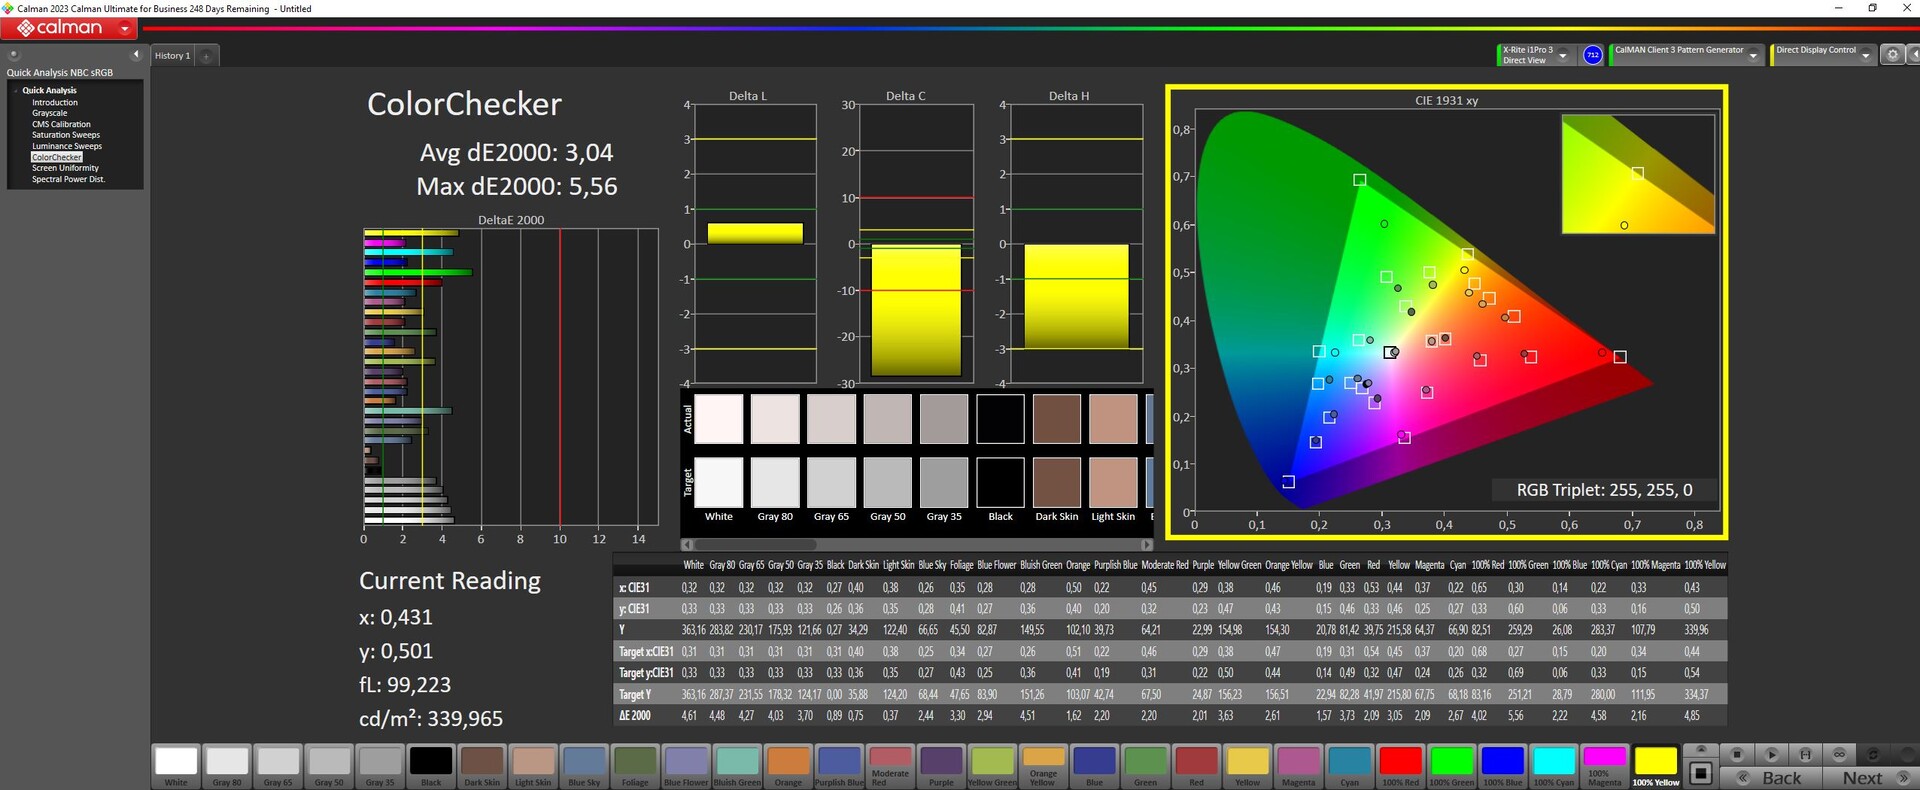
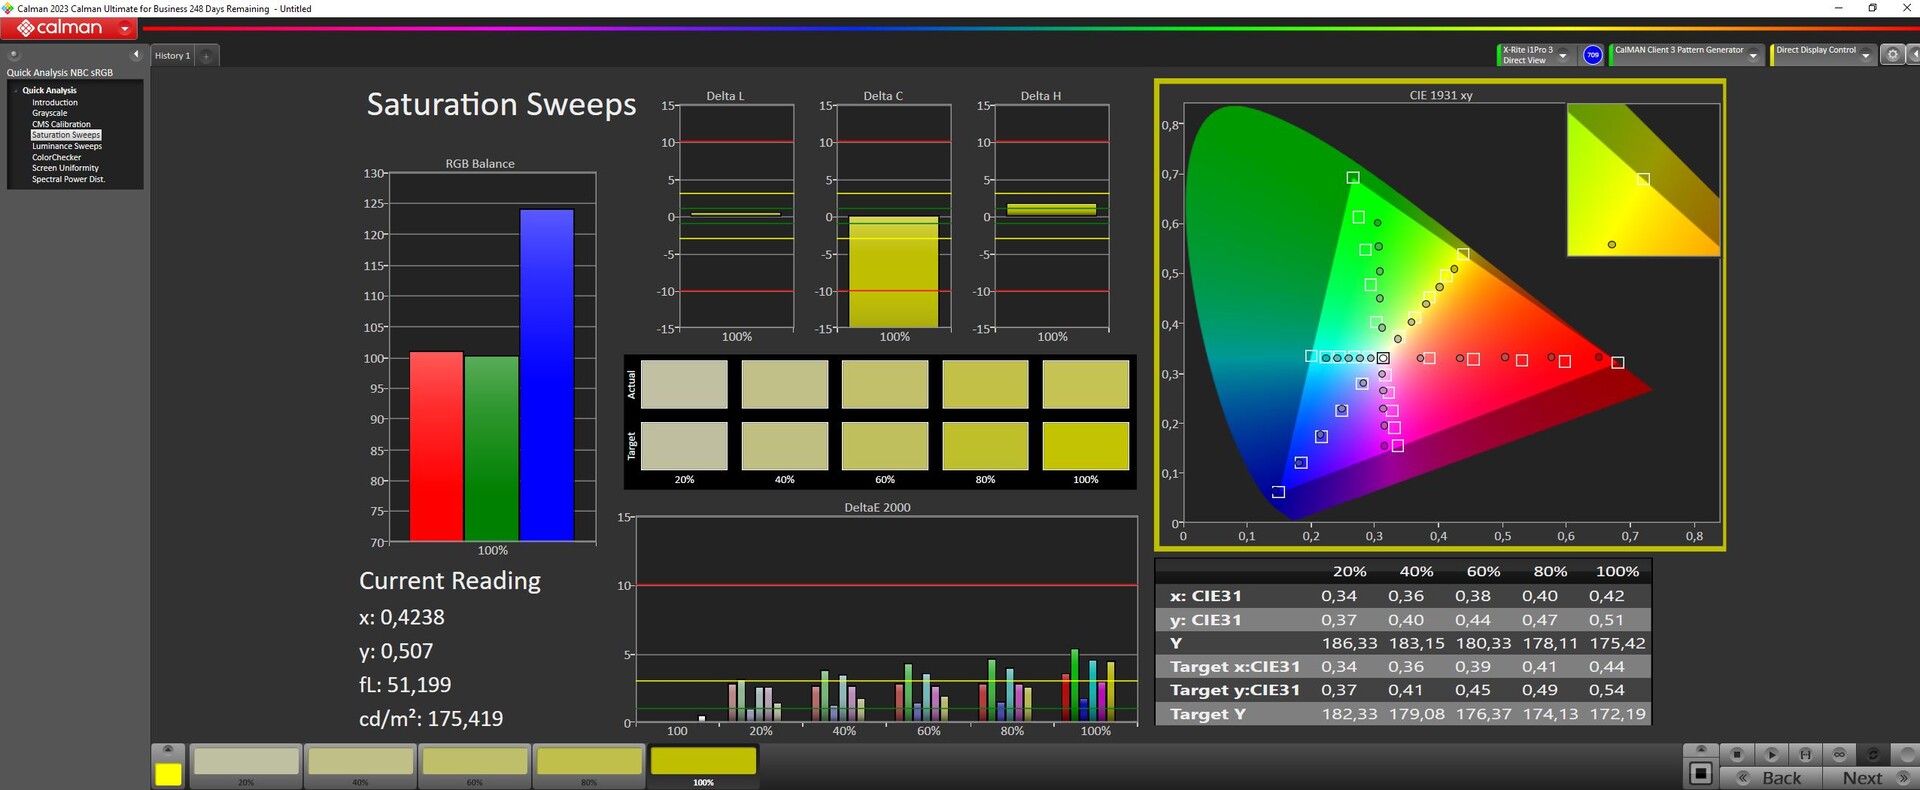
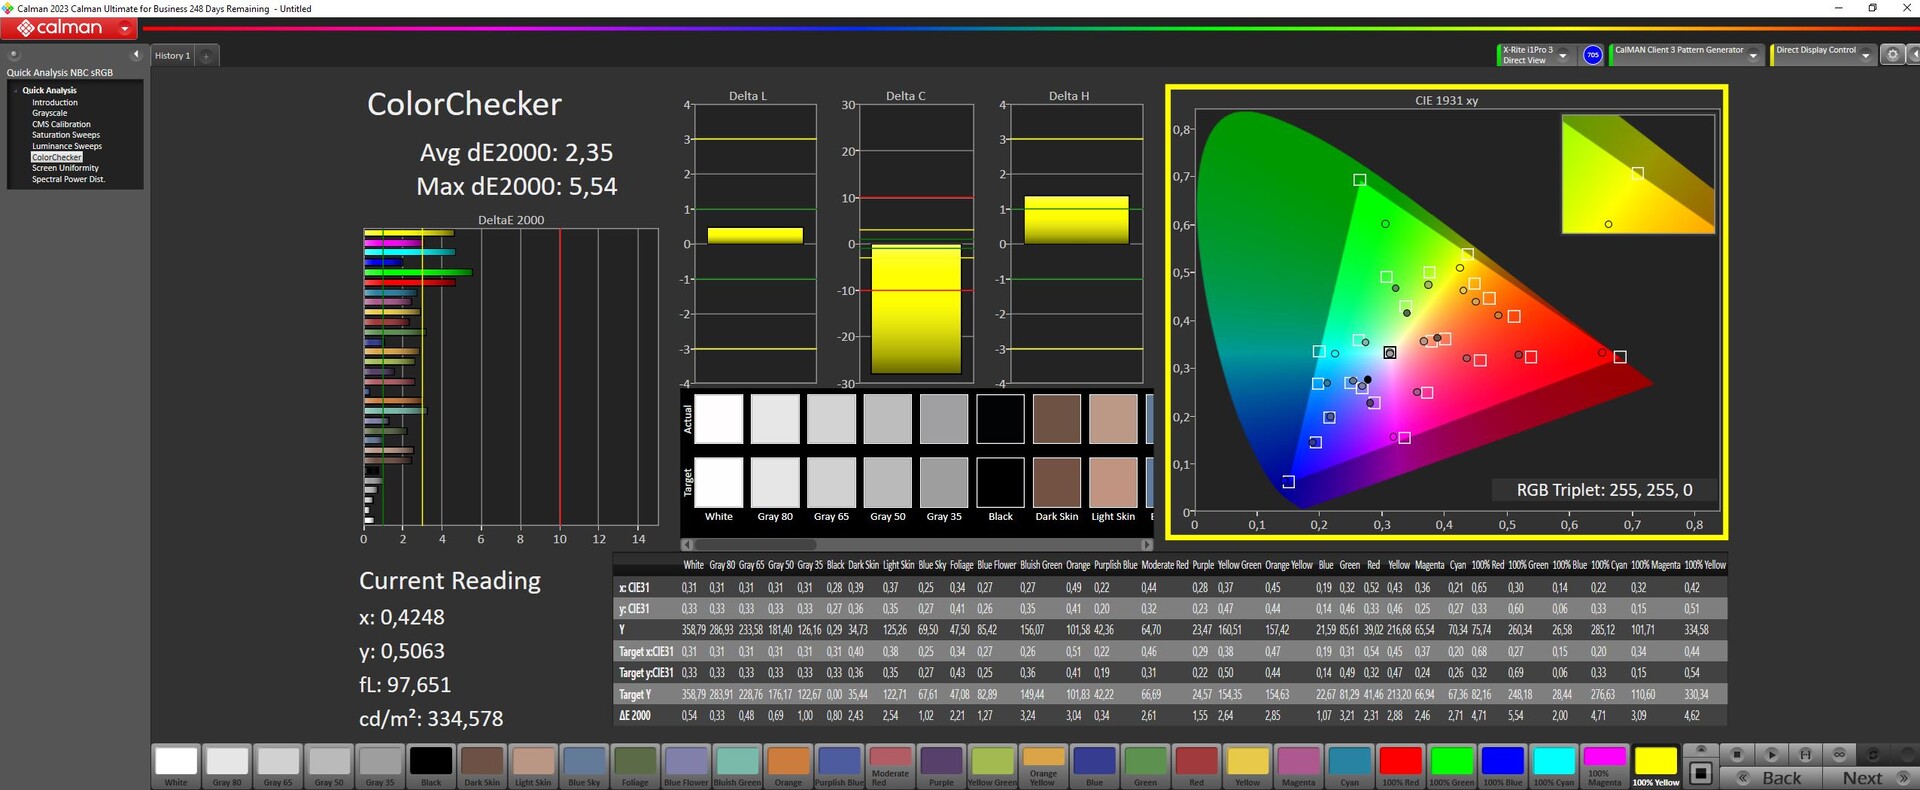
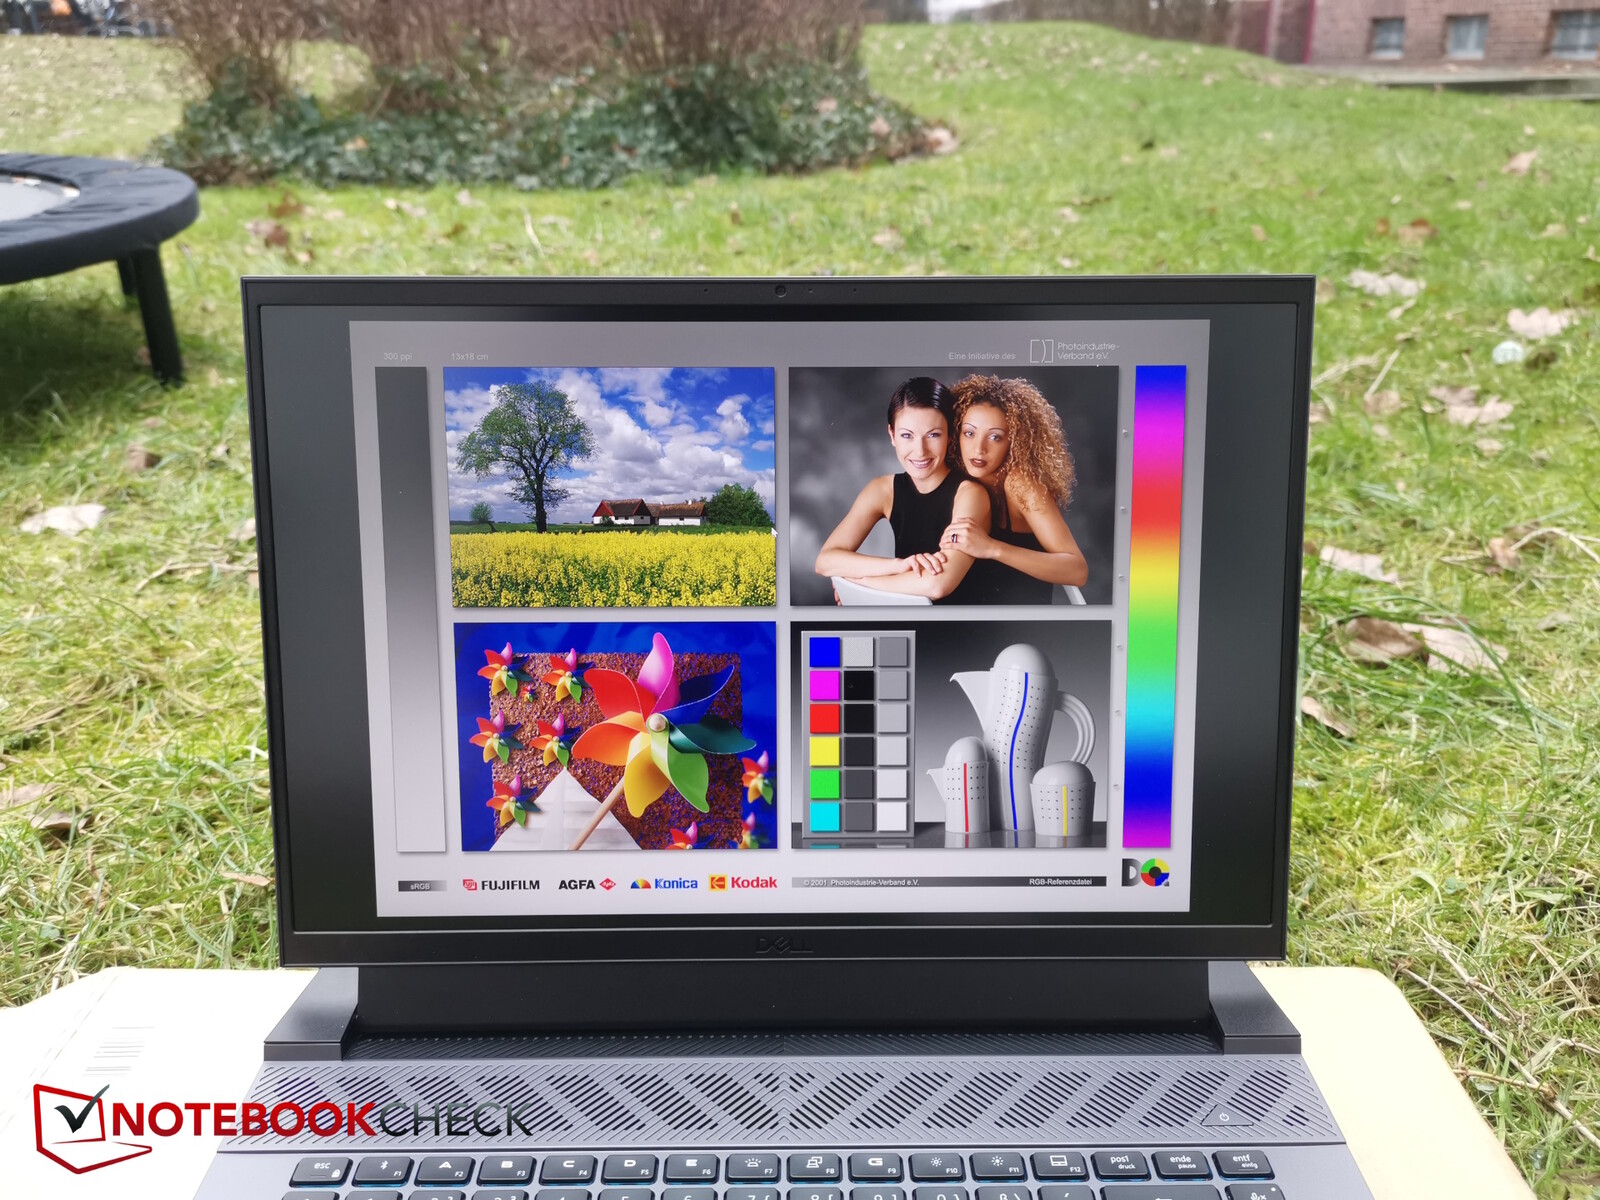
Tela - DCI-P3 ou apenas sRGB, afinal de contas?
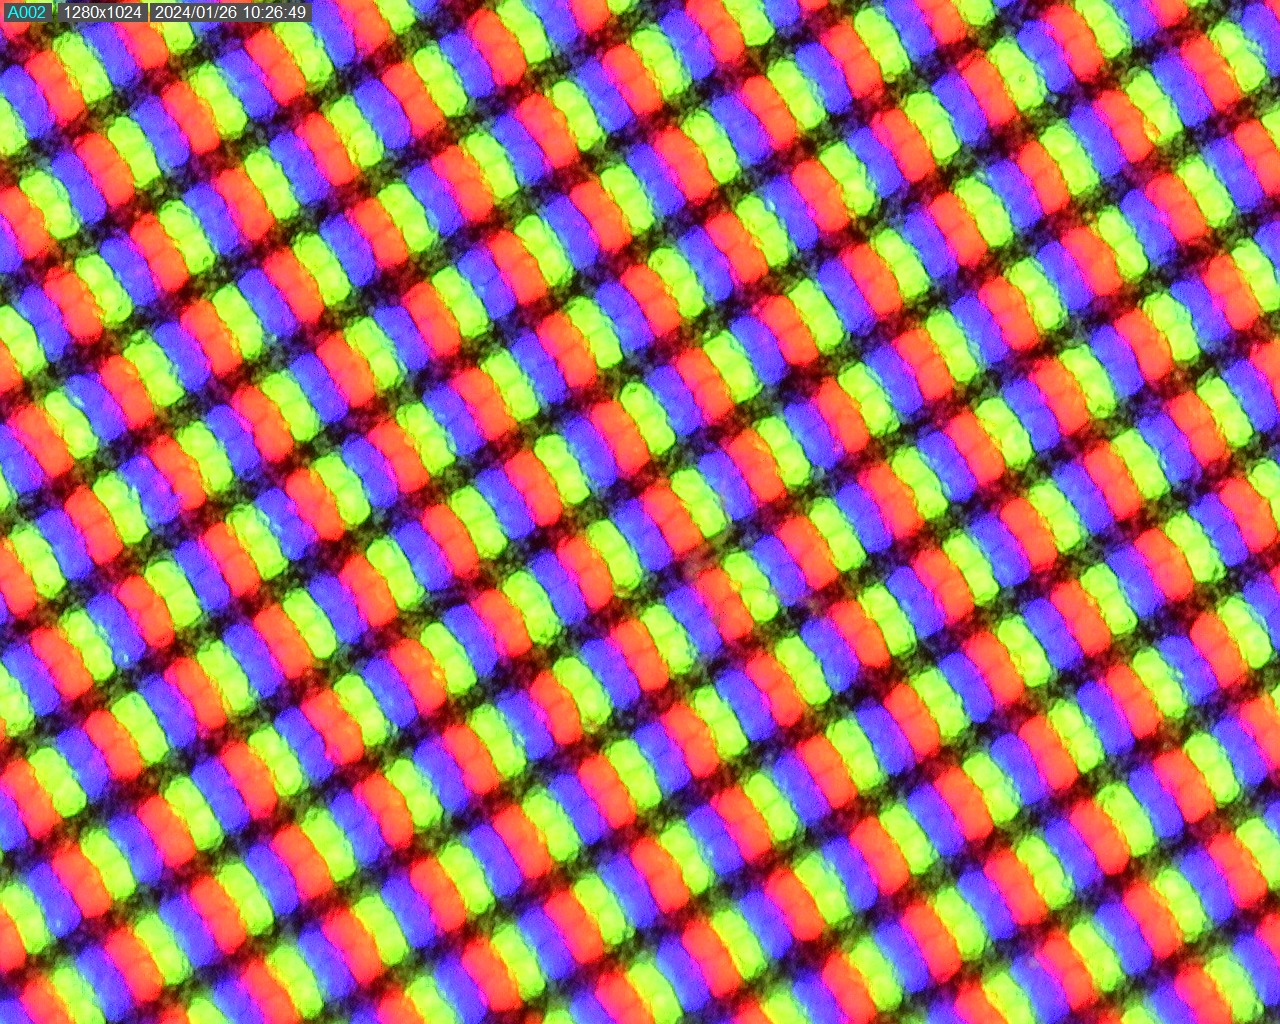

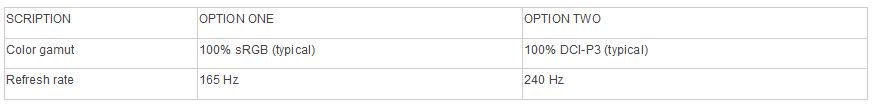
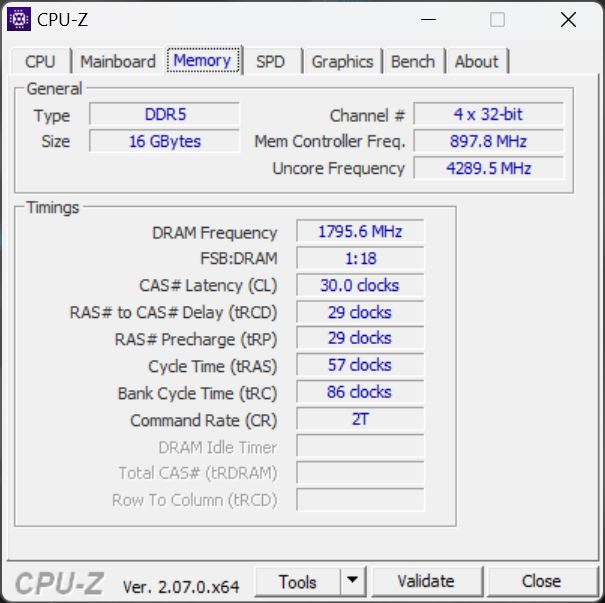
Apesar de apresentar a mesma resolução, a Dell mudou de BOE para Chi Mei. A tela IPS fosca tem uma resolução de 2.560 x 1.600 pixels. Mas cuidado: Embora o site ofereça atualmente apenas uma tela para o G16, ou seja, a tela QHD+ (2.560 x 1.600) com taxa de atualização de 240 Hz, 3 ms, NVIDIA G-SYNC e 100% de cobertura DCI-P3, nossa amostra de teste está equipada com um painel com a mesma resolução, mas com uma taxa de atualização de "apenas" 165 Hz e, mais importante, apenas cobertura sRGB e não DCI-P3! O senhor precisa consultar o manual do dispositivo em https://www.dell.com/support/manuals/de-de/g-series-16-7630-laptop/dell-g16-7630-owners-manual/display?guid=guid-2bdf1814-06d3-4b69-967b-c48432875f91&lang=en-us para descobrir as duas variantes.
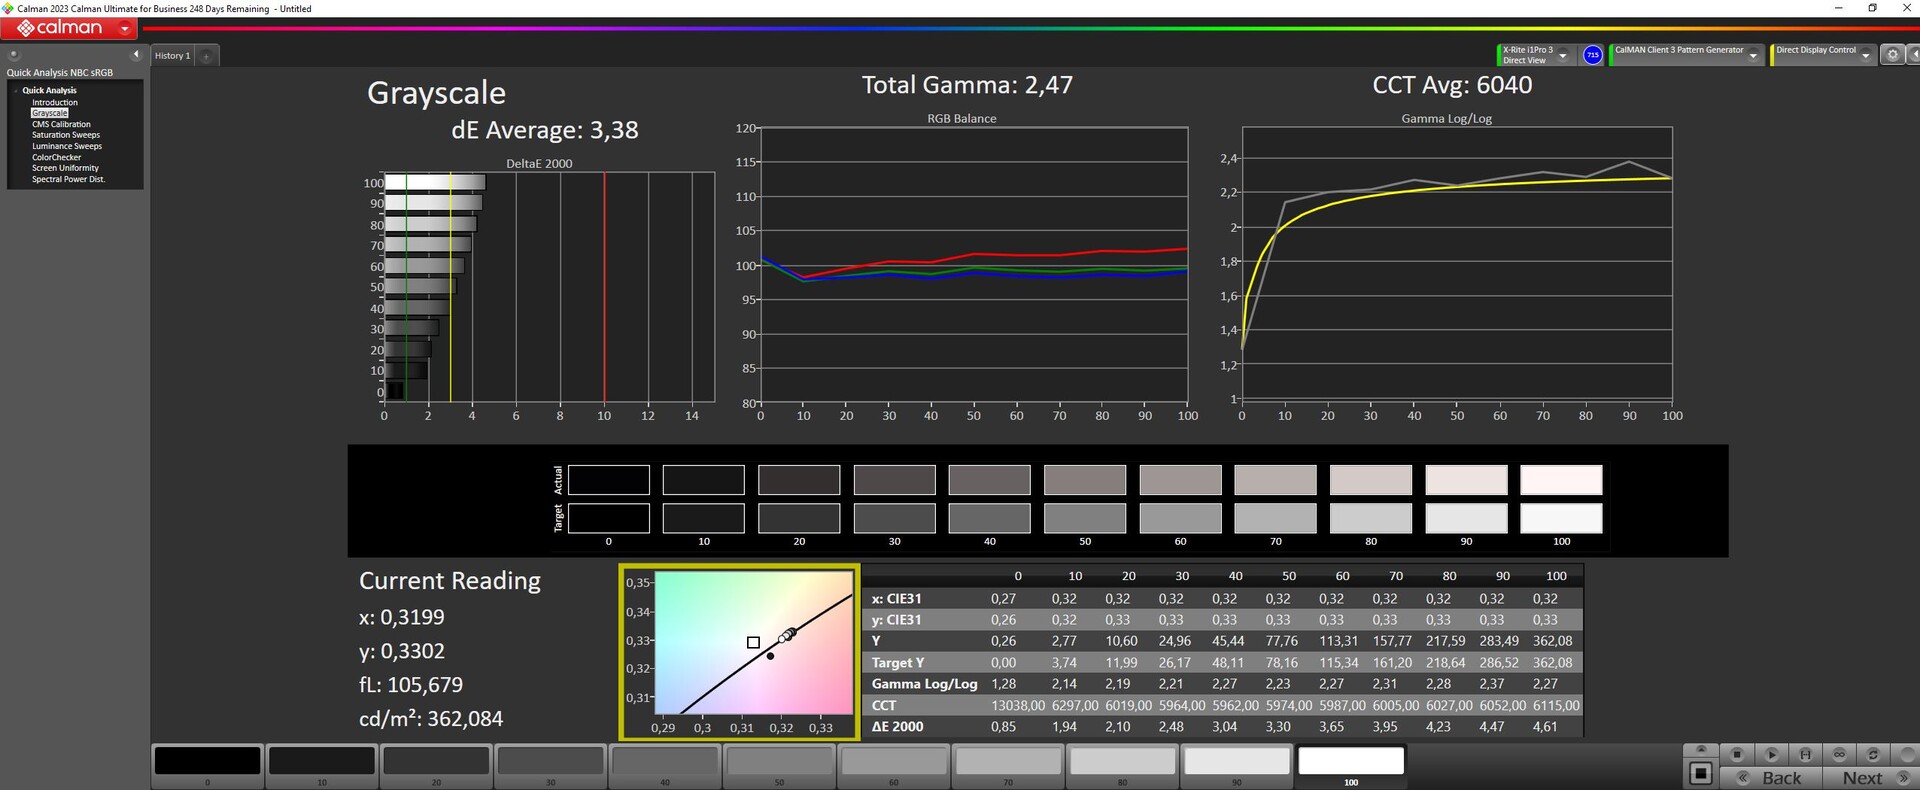
Medimos um brilho médio de 344 nits com uma boa iluminação de 89%. Entretanto, ao representar cenas escuras, notamos um sutil sangramento da luz de fundo em praticamente todas as bordas.
Apesar de ter o mesmo brilho, a tela apresenta um valor de preto melhorado, o que também beneficia o contraste. Em suma, é uma tela sRGB muito boa e seus tempos de resposta também são suficientemente rápidos.
| |||||||||||||||||||||||||
iluminação: 89 %
iluminação com acumulador: 369 cd/m²
Contraste: 1419:1 (Preto: 0.26 cd/m²)
ΔE ColorChecker Calman: 3.04 | ∀{0.5-29.43 Ø4.71}
calibrated: 2.35
ΔE Greyscale Calman: 3.38 | ∀{0.09-98 Ø4.96}
69.3% AdobeRGB 1998 (Argyll 3D)
98.5% sRGB (Argyll 3D)
67.5% Display P3 (Argyll 3D)
Gamma: 2.47
CCT: 6040 K
| Dell G16, i7-13650HX, RTX 4060 Chi Mei CMN161D (160GME), IPS, 2560x1600, 16" | Dell G16 7620 BOE NE16QDM, IPS, 2560x1600, 16" | MSI Raider GE68HX 13VF Chi Mei N160JME-GTK, IPS, 1900x1200, 16" | Lenovo Legion Slim 5 16APH8 BOE NJ NE160QDM-NYC, IPS, 2560x1600, 16" | Alienware m16 R1 Intel BOE NE16NYB, IPS, 2560x1600, 16" | Lenovo LOQ 16IRH8 AUOC1A5 (B160QAN03.L), IPS, 2560x1600, 16" | |
|---|---|---|---|---|---|---|
| Display | 1% | -38% | 2% | 0% | 3% | |
| Display P3 Coverage (%) | 67.5 | 68.3 1% | 41.6 -38% | 69.3 3% | 67.7 0% | 70.5 4% |
| sRGB Coverage (%) | 98.5 | 98 -1% | 62.2 -37% | 100 2% | 97.2 -1% | 98.9 0% |
| AdobeRGB 1998 Coverage (%) | 69.3 | 70.5 2% | 43 -38% | 70 1% | 70 1% | 72.6 5% |
| Response Times | -7% | -131% | -8% | 39% | 17% | |
| Response Time Grey 50% / Grey 80% * (ms) | 7.6 ? | 8.6 ? -13% | 17.3 ? -128% | 10.7 ? -41% | 4 ? 47% | 7.2 ? 5% |
| Response Time Black / White * (ms) | 10.4 ? | 10.4 ? -0% | 24.2 ? -133% | 7.8 ? 25% | 7.3 ? 30% | 7.4 ? 29% |
| PWM Frequency (Hz) | ||||||
| Screen | 7% | -37% | 15% | 4% | 13% | |
| Brightness middle (cd/m²) | 369 | 369.4 0% | 300.9 -18% | 371.6 1% | 306 -17% | 407 10% |
| Brightness (cd/m²) | 344 | 348 1% | 302 -12% | 343 0% | 302 -12% | 369 7% |
| Brightness Distribution (%) | 89 | 83 -7% | 93 4% | 84 -6% | 89 0% | 85 -4% |
| Black Level * (cd/m²) | 0.26 | 0.32 -23% | 0.31 -19% | 0.44 -69% | 0.3 -15% | 0.45 -73% |
| Contrast (:1) | 1419 | 1154 -19% | 971 -32% | 845 -40% | 1020 -28% | 904 -36% |
| Colorchecker dE 2000 * | 3.04 | 1.78 41% | 4.6 -51% | 1.52 50% | 2.57 15% | 1.43 53% |
| Colorchecker dE 2000 max. * | 5.56 | 4.41 21% | 17.6 -217% | 2.68 52% | 4.26 23% | 3.58 36% |
| Colorchecker dE 2000 calibrated * | 2.35 | 1.22 48% | 2.04 13% | 0.33 86% | 0.85 64% | 1.07 54% |
| Greyscale dE 2000 * | 3.38 | 3.2 5% | 3.3 2% | 1.2 64% | 3.3 2% | 1.13 67% |
| Gamma | 2.47 89% | 2.2 100% | 2.09 105% | 2.1 105% | 1.997 110% | 2.5 88% |
| CCT | 6040 108% | 6750 96% | 7151 91% | 6503 100% | 6895 94% | 6526 100% |
| Média Total (Programa/Configurações) | 0% /
4% | -69% /
-50% | 3% /
9% | 14% /
8% | 11% /
11% |
* ... menor é melhor
Medimos cerca de 70% de cobertura de DisplayP3 e AdobeRGB, enquanto o sRGB é quase totalmente coberto. O monitor antigo alcançou valores semelhantes; diz-se que a versão oferecida no site cobre 100% do DCI-P3.
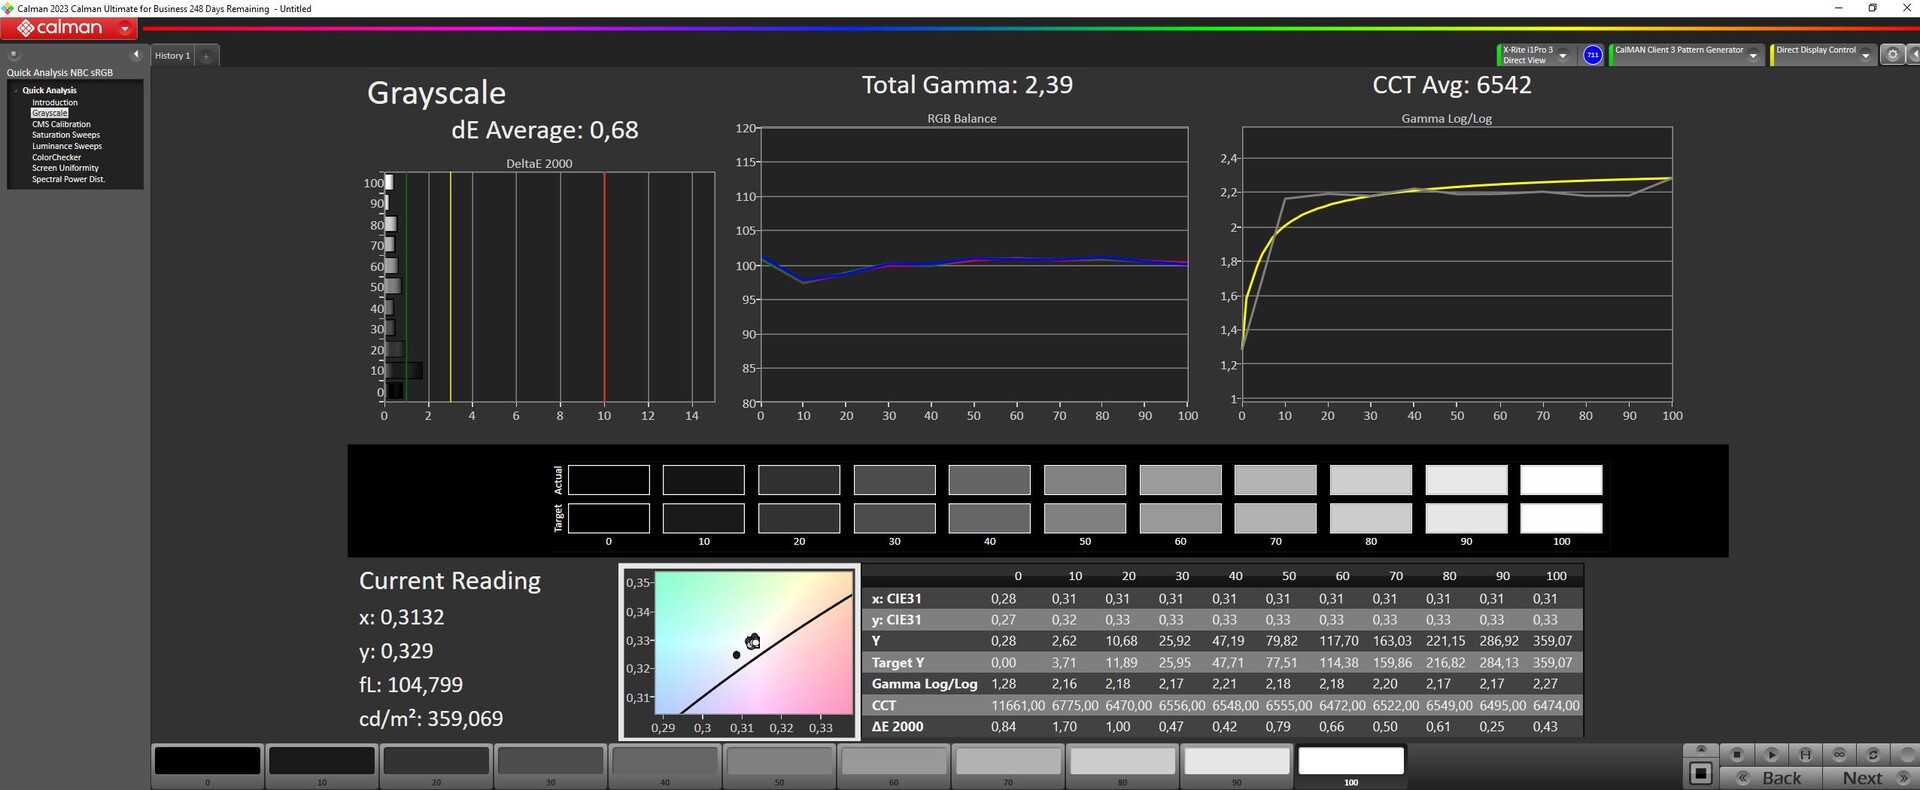
Logo que sai da caixa, o monitor não está calibrado de forma ideal. Nossa calibração, usando um dispositivo de medição X-Rite e o software Calman, melhorou muito os desvios da escala de cinza, mas as cores não foram tão bem aprimoradas.
Exibir tempos de resposta
| ↔ Tempo de resposta preto para branco | ||
|---|---|---|
| 10.4 ms ... ascensão ↗ e queda ↘ combinadas | ↗ 5.8 ms ascensão | 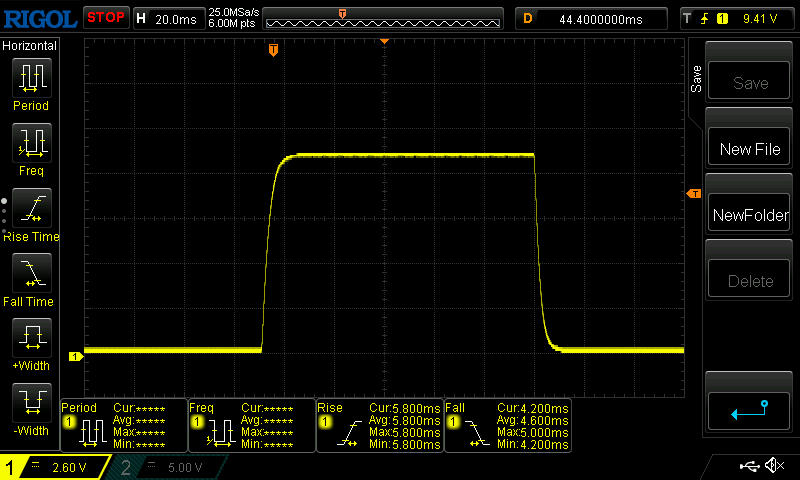 |
| ↘ 4.6 ms queda | ||
| A tela mostra boas taxas de resposta em nossos testes, mas pode ser muito lenta para jogadores competitivos. Em comparação, todos os dispositivos testados variam de 0.1 (mínimo) a 240 (máximo) ms. » 28 % de todos os dispositivos são melhores. Isso significa que o tempo de resposta medido é melhor que a média de todos os dispositivos testados (19.8 ms). | ||
| ↔ Tempo de resposta 50% cinza a 80% cinza | ||
| 7.6 ms ... ascensão ↗ e queda ↘ combinadas | ↗ 3.8 ms ascensão | 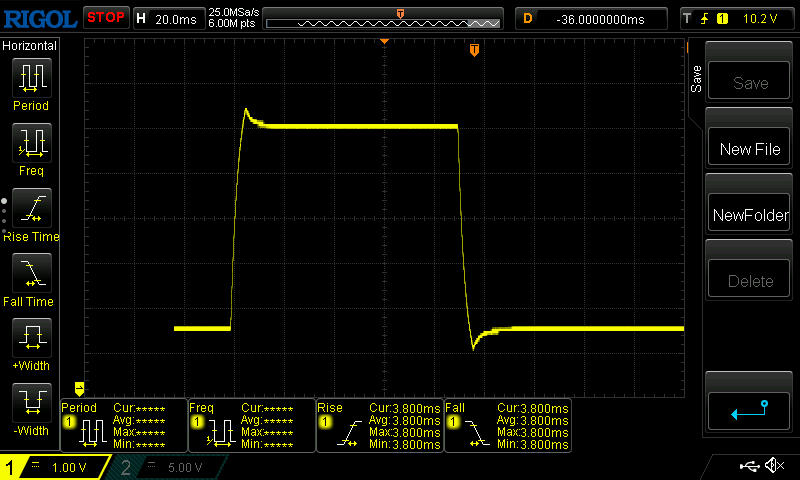 |
| ↘ 3.8 ms queda | ||
| A tela mostra taxas de resposta muito rápidas em nossos testes e deve ser muito adequada para jogos em ritmo acelerado. Em comparação, todos os dispositivos testados variam de 0.165 (mínimo) a 636 (máximo) ms. » 21 % de todos os dispositivos são melhores. Isso significa que o tempo de resposta medido é melhor que a média de todos os dispositivos testados (30.9 ms). | ||
Cintilação da tela / PWM (modulação por largura de pulso)
| Tela tremeluzindo / PWM não detectado | 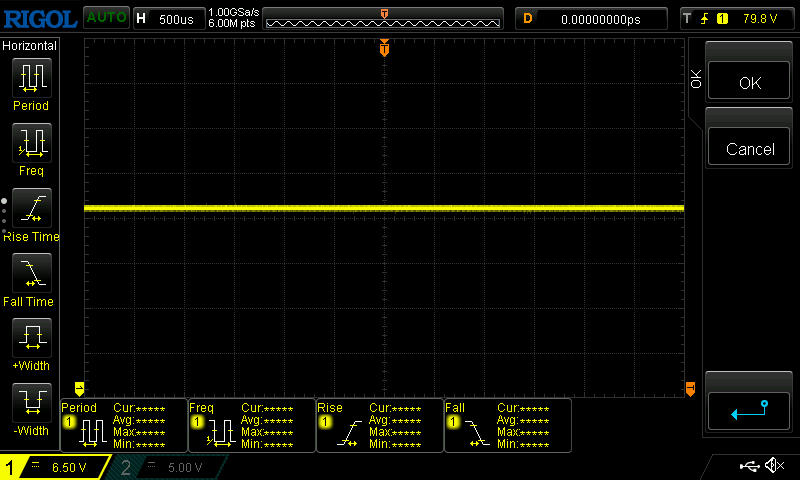 | ||
[pwm_comparison] Em comparação: 52 % de todos os dispositivos testados não usam PWM para escurecer a tela. Se PWM foi detectado, uma média de 7748 (mínimo: 5 - máximo: 343500) Hz foi medida. | |||
A tela é brilhante o suficiente para ser usada em ambientes externos - pelo menos em ambientes com sombra - além disso, sua superfície fosca elimina a maioria dos grandes reflexos.


Desempenho - O G16 é exatamente como o esperado
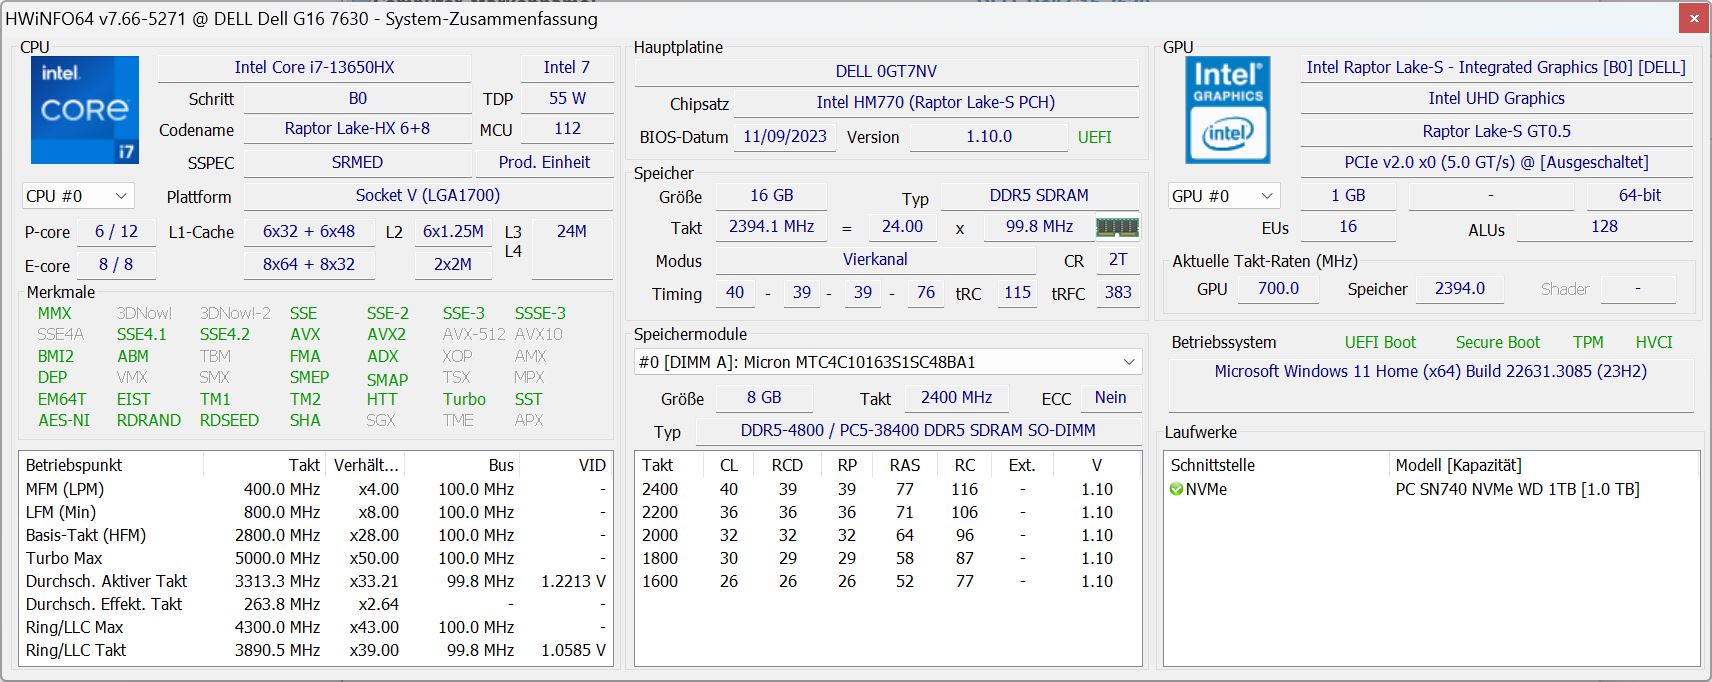
O Dell G16 é um laptop típico para jogos, de baixo custo a médio porte. Sua CPU é o Intel Core i7-13650HX e, além disso, há uma RTX 4060 com 140 watts, 16 GB de RAM e um SSD NVMe de 1 TB. Como resultado, a maioria dos jogos atuais deve poder ser reproduzida em Full HD. A tela 16:10 decente e boa complementa a configuração de hardware do notebook.
Condições de teste
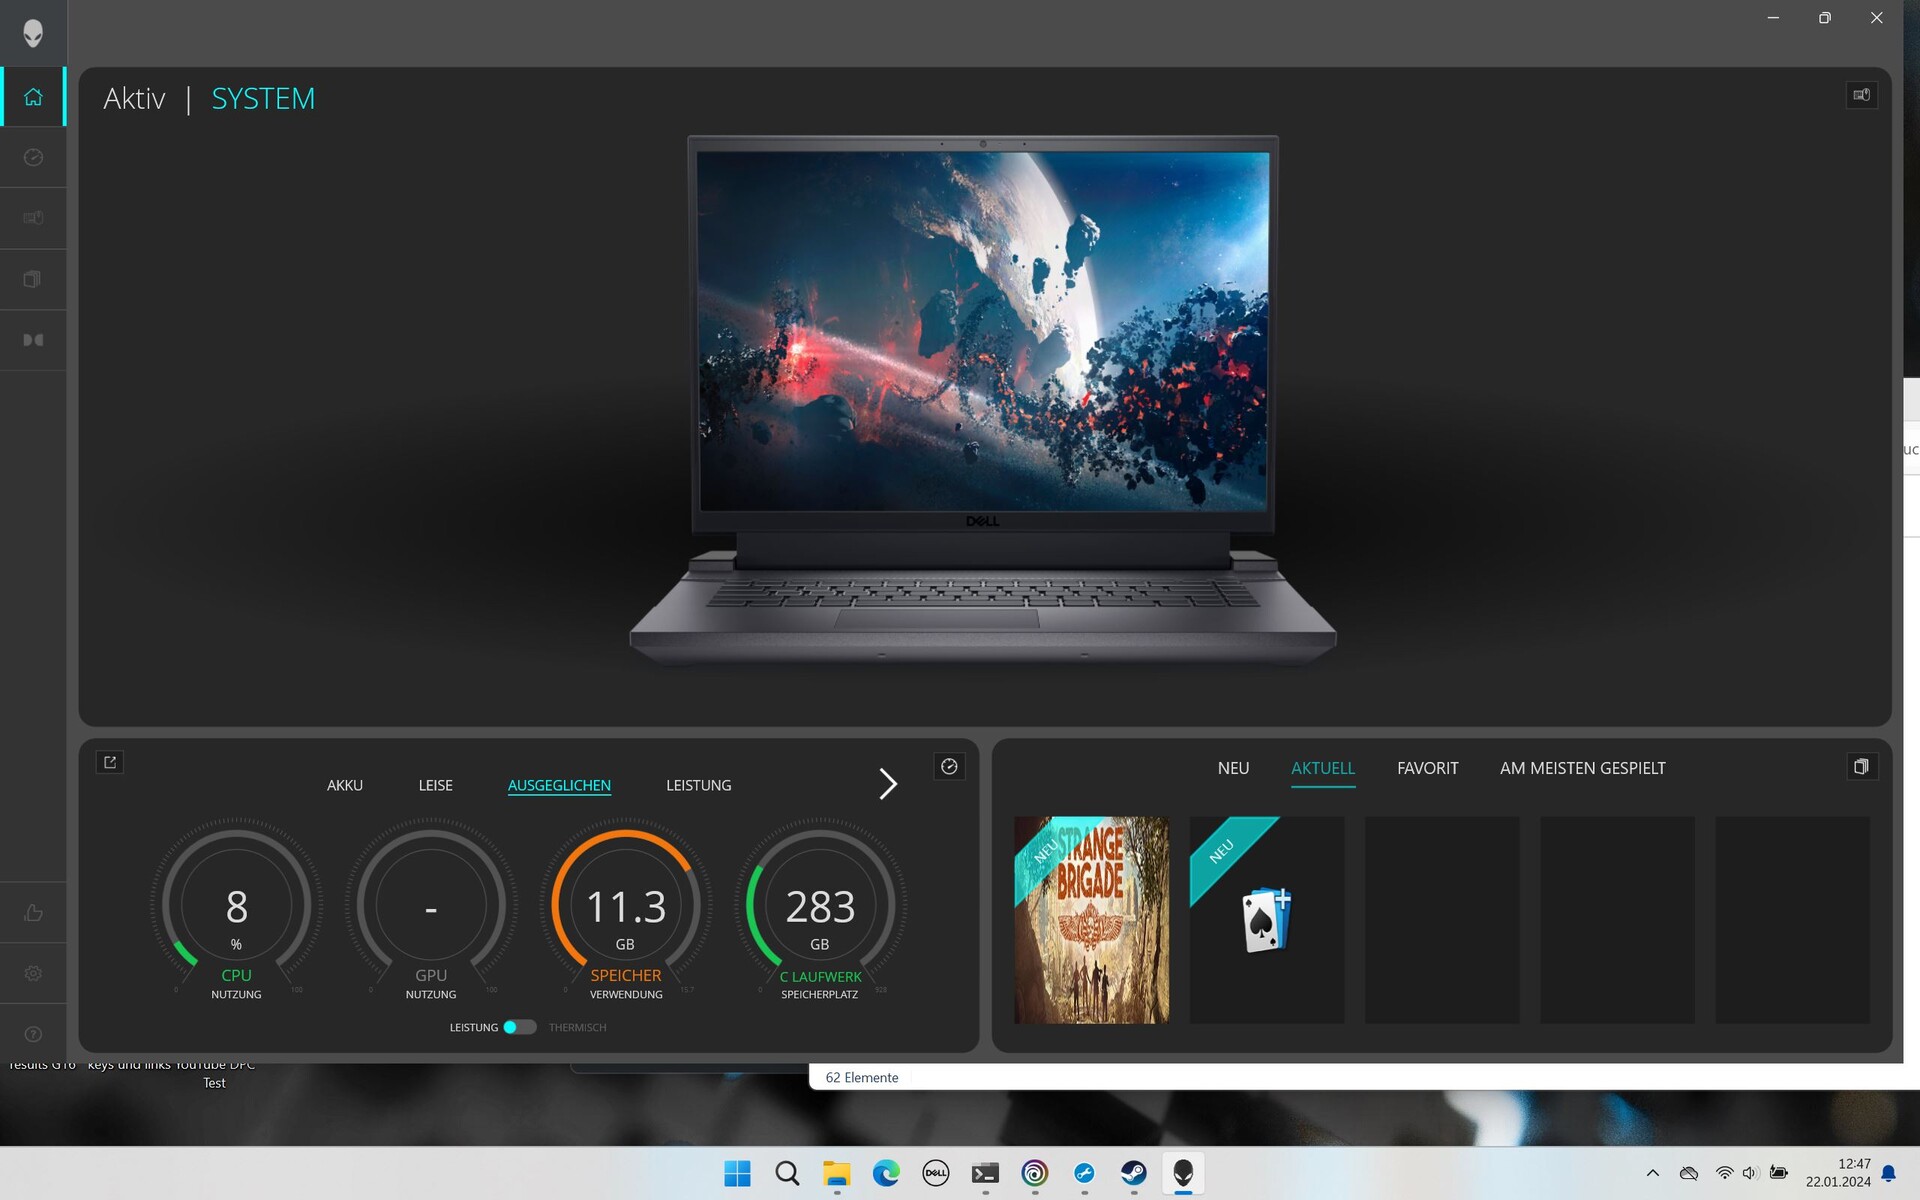
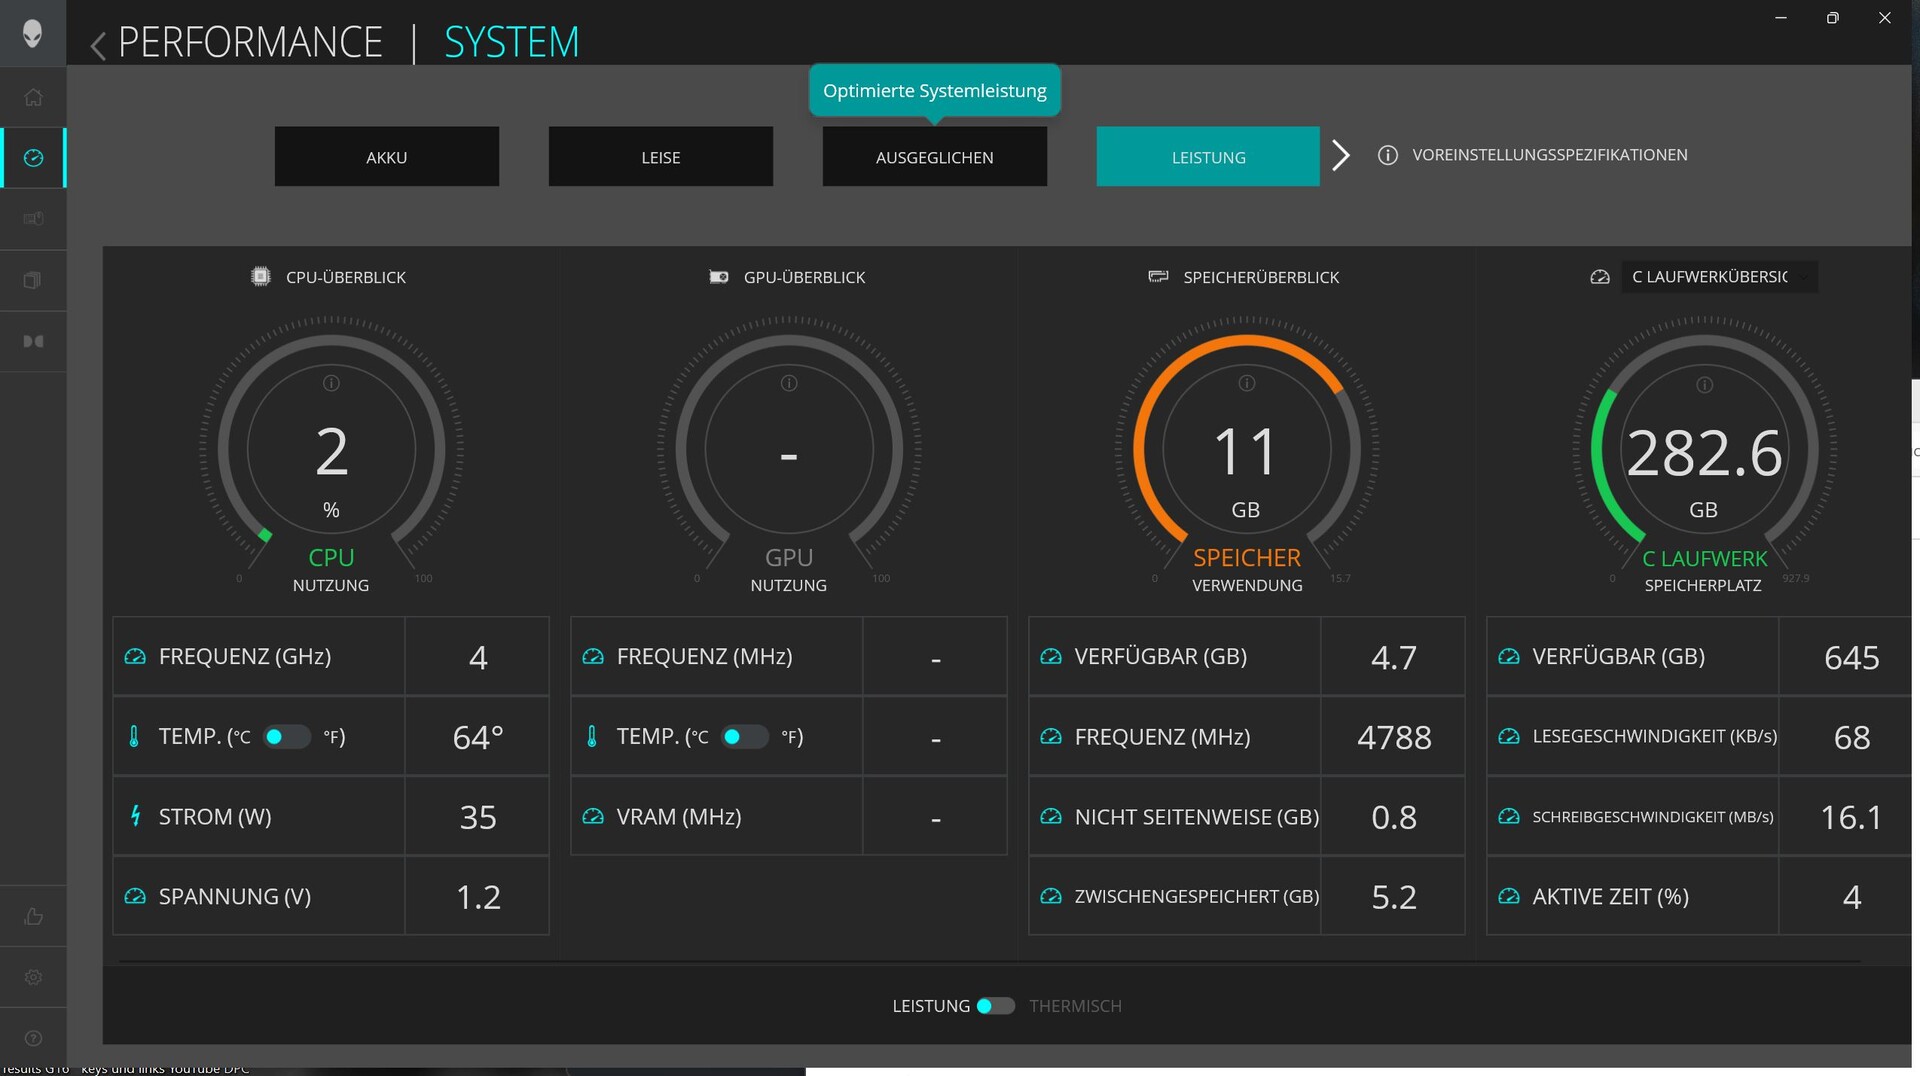
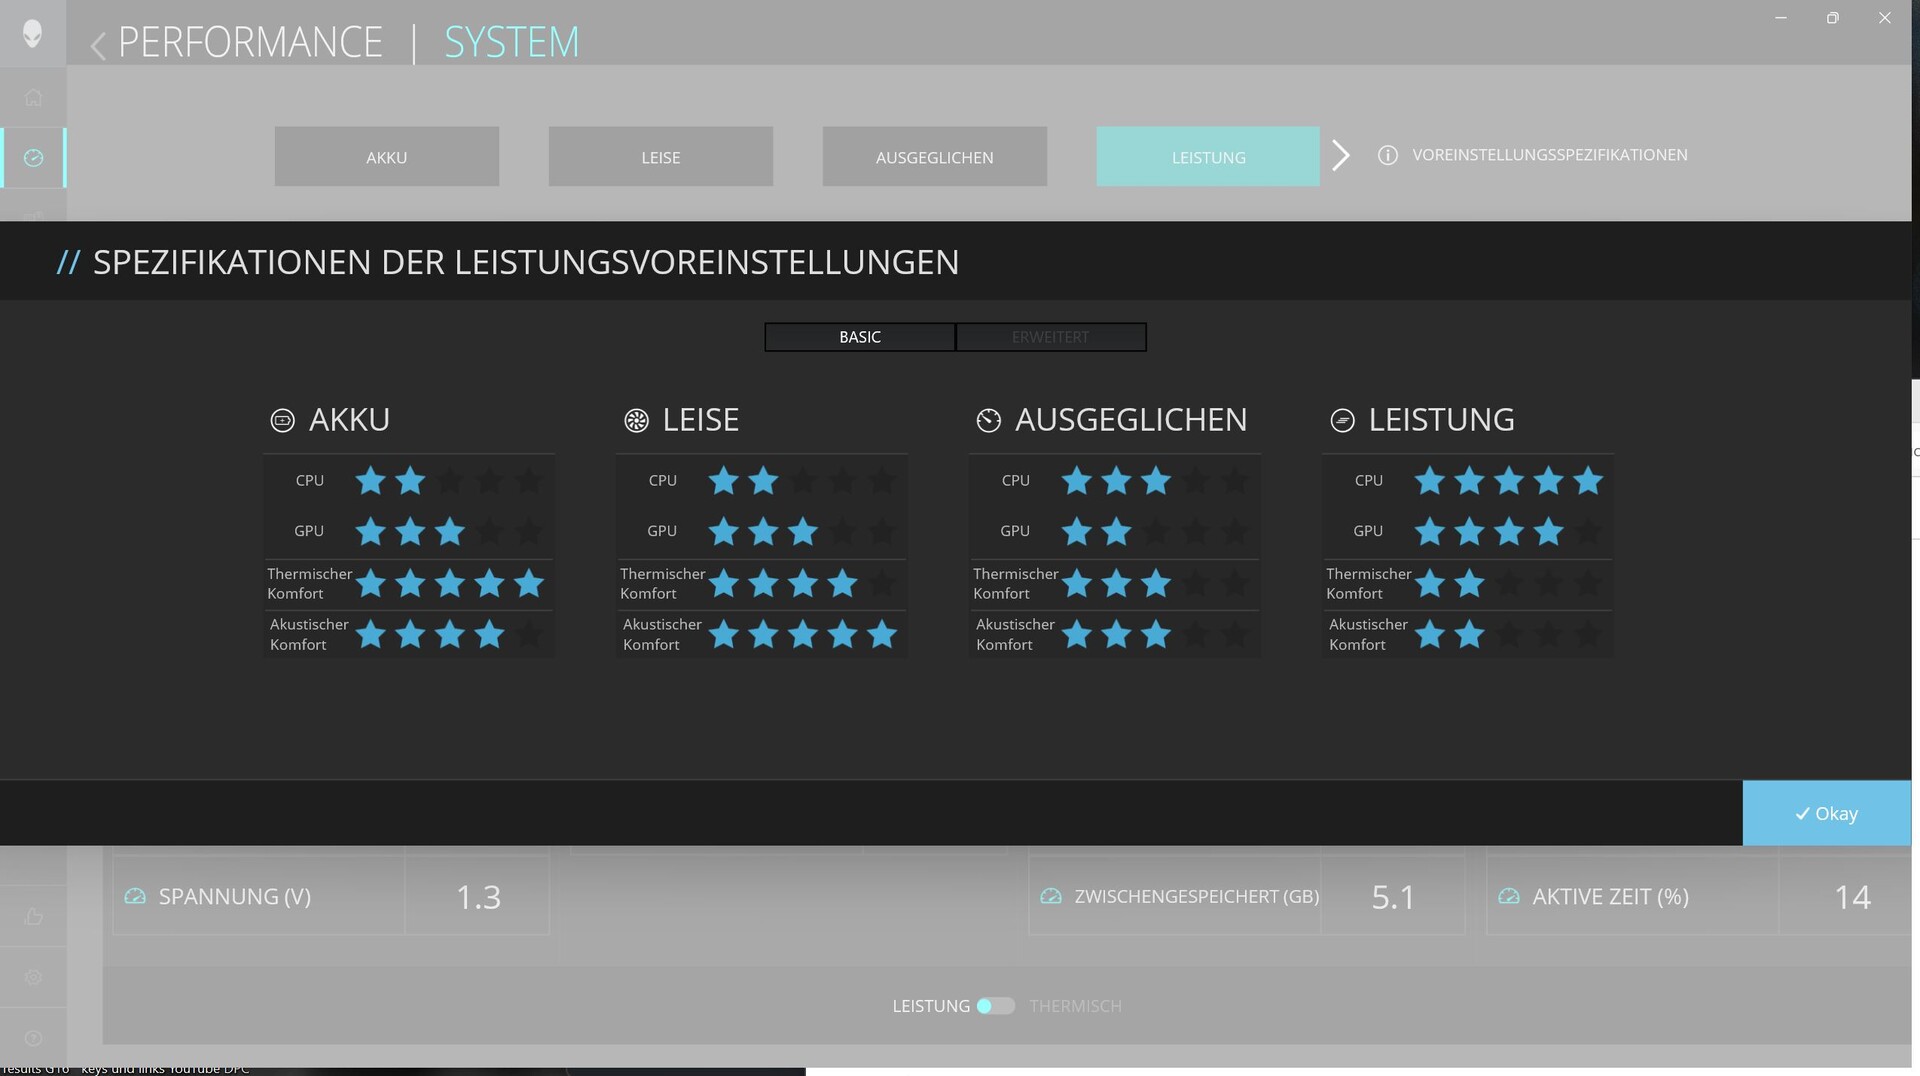
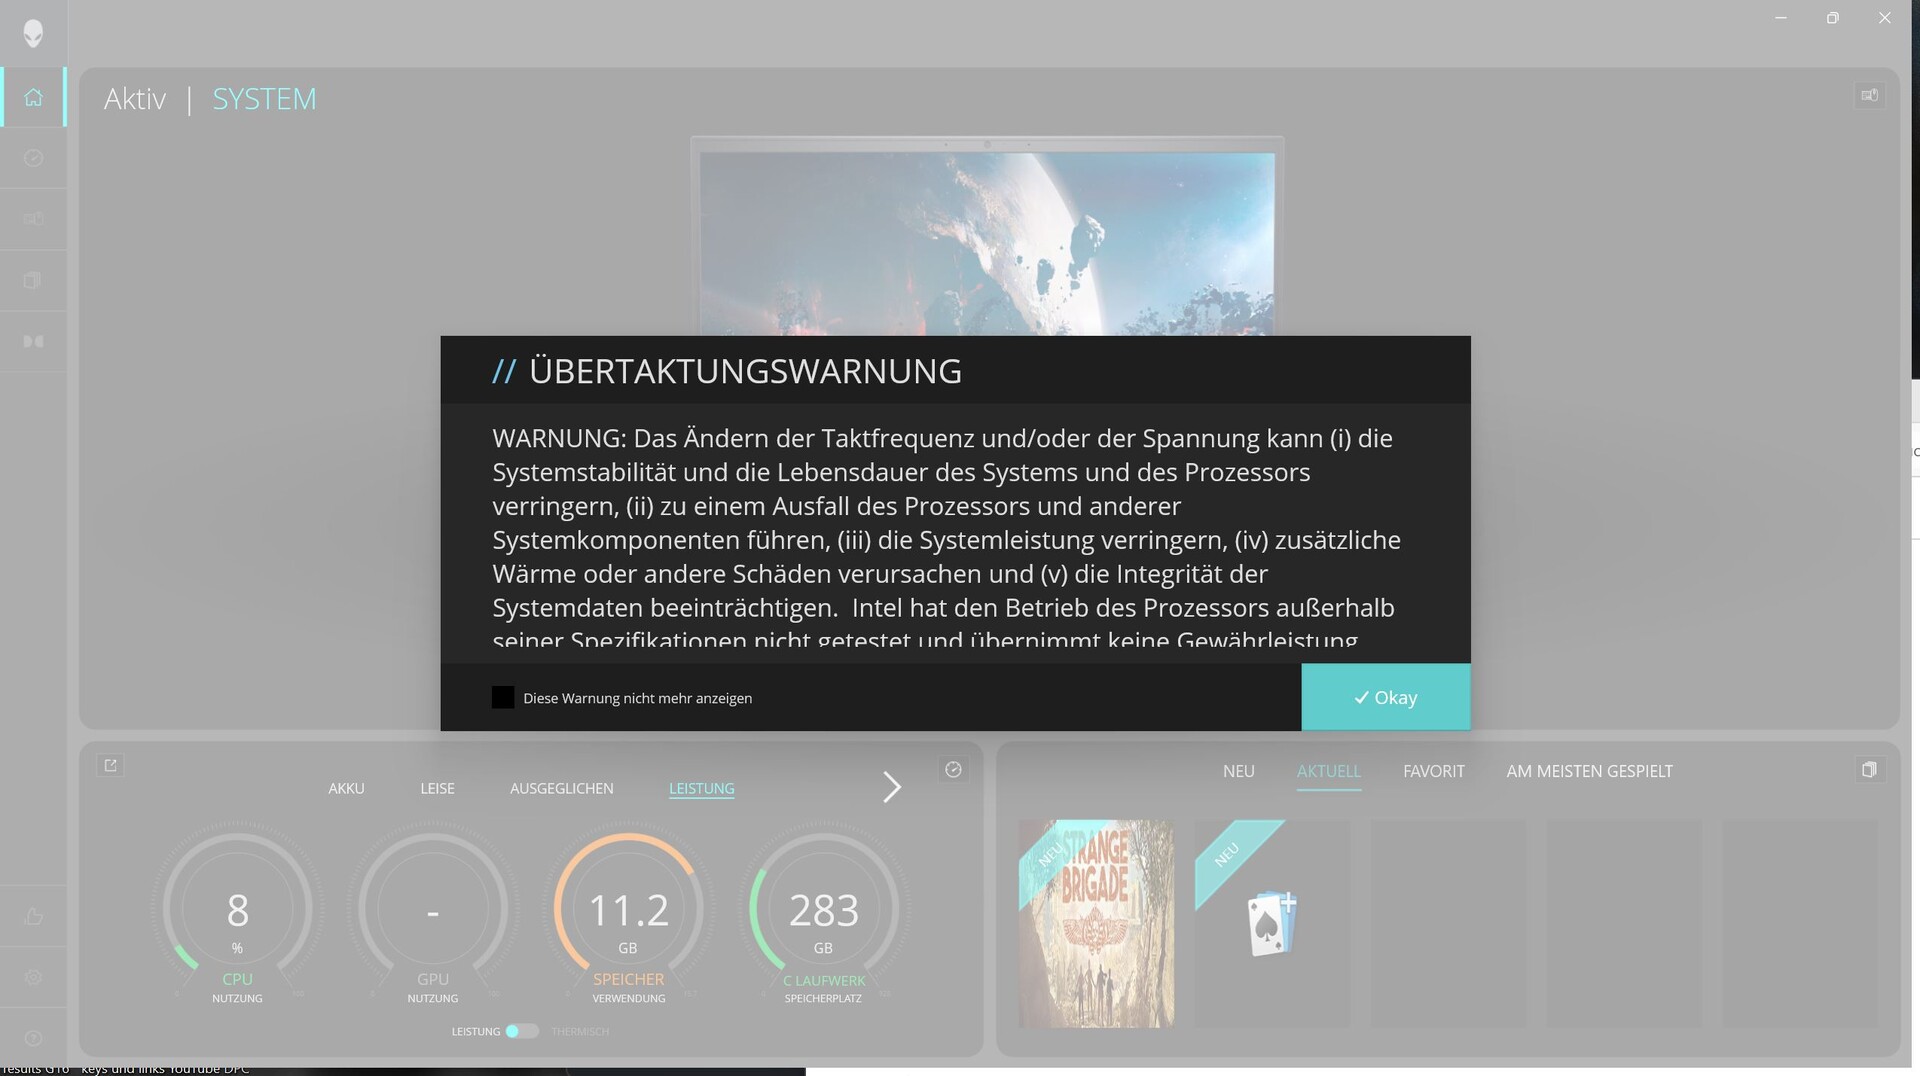
A Dell pré-instalou pelo menos dois aplicativos (veja McAffee) no G16. Um deles é o My Dell, que também vem pré-instalado em seus modelos não gamers, e o outro é o Alienware Command Center nos modelos Alienware. O My Dell inclui serviços, atualizações, etc., enquanto o Command Center permite que o senhor defina diferentes modos de desempenho(bateria, silencioso, equilibrado, desempenho, manual), iluminação das teclas e outras opções.
Apesar de muitos anos de desenvolvimento, o Command Center ainda não está totalmente desenvolvido. Por exemplo, a janela não pode ser maximizada corretamente; o senhor ainda pode ver a área de trabalho na parte inferior.
Provavelmente, outro bug é que recebemos um aviso assim que mudamos para o modo de desempenho. Isso é muito preocupante, pois sugere que a garantia pode ser anulada se o hardware for operado fora das especificações recomendadas. No entanto, suspeitamos que o aviso se refere ao modo manual, não ao modo de desempenho especificado pela própria Dell - muito confuso!
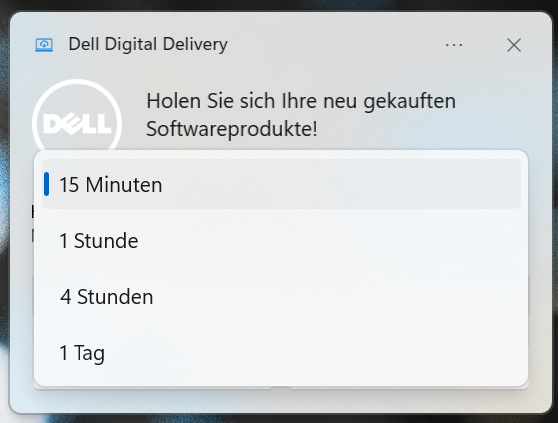
O que é irritante, no entanto, é que o McAffee não é apenas pré-instalado, mas a Dell também nos envia regularmente uma mensagem solicitando que usemos esse serviço (nós o desinstalamos) e essa mensagem continua voltando todos os dias, no máximo.

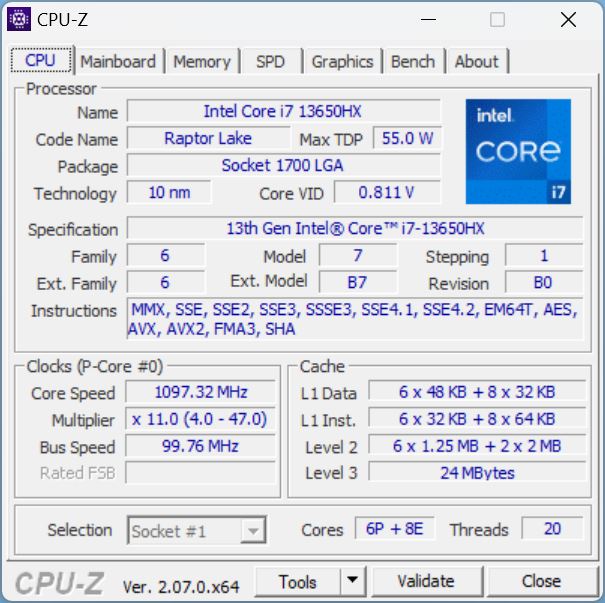
Processador
O laptop da Dell tem uma CPU Raptor-Lake, o Intel Core i7-13650HX com 14 núcleos (6 P, 8 E) e 20 threads. Os núcleos P podem atingir clock individual de até 4,9 GHz e a taxa de clock base dos núcleos de eficiência é de 1,9 GHz. O senhor só pode obter o mais potente i9-13900HX em combinação com a RTX 4070que custa um pouco mais.
Durante o loop do Cinebench-R15, o G16 funcionou em níveis de desempenho consistentemente altos, sem sofrer nenhuma perda de desempenho após as primeiras execuções.
Em todos os nossos benchmarks de CPU, o i7-13650HX teve um desempenho próximo ao nível esperado e cerca de 15 a 19% mais rápido do que o i7-12700H do antecessor do dispositivo.
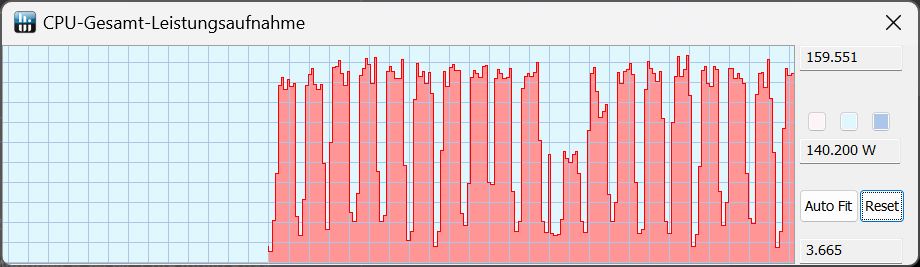
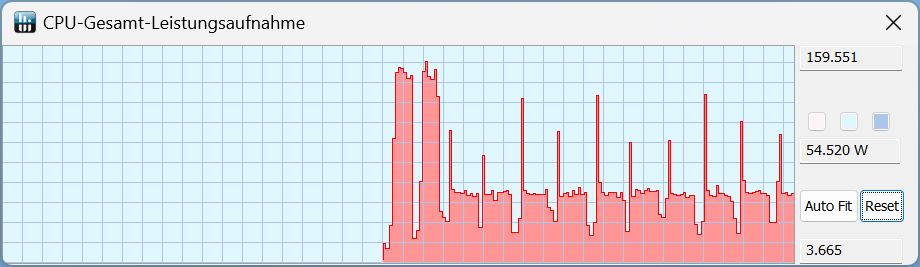
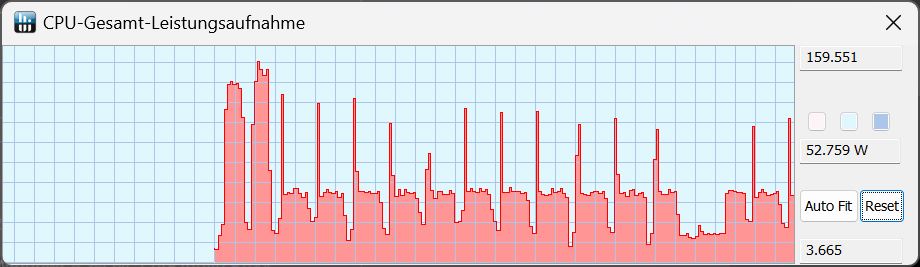
Usando os modos desempenho, equilibrado e silencioso, o laptop atingiu valores de consumo de energia de 159 watts no início de uma execução do Cinebench, resultando na mesma pontuação usando todos os modos quando medidos uma única vez. Durante o curso seguinte, esse TDP permaneceu constante apenas no modo desempenho. Em todos os outros modos, o TDP caiu para cerca de 50 watts a partir da segunda execução.
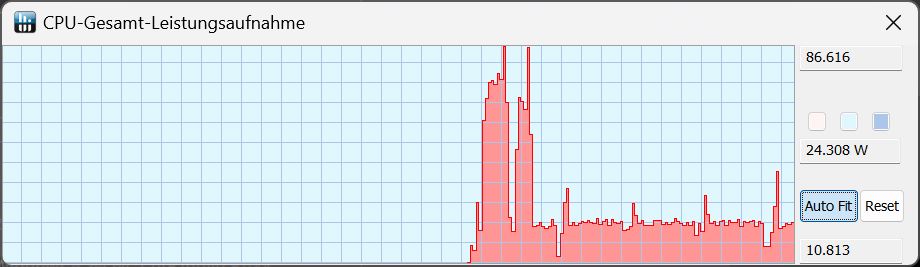
Se o senhor desconectar o laptop da energia, o sistema mudará automaticamente para o modo de bateria. Ele só atingiu um TDP de saída de 86 watts durante o Cinebench R15 Multi e, após a primeira execução, o TDP caiu para apenas 24 watts.
Cinebench R15 Multi continuous test
Cinebench R23: Multi Core | Single Core
Cinebench R20: CPU (Multi Core) | CPU (Single Core)
Cinebench R15: CPU Multi 64Bit | CPU Single 64Bit
Blender: v2.79 BMW27 CPU
7-Zip 18.03: 7z b 4 | 7z b 4 -mmt1
Geekbench 6.7: Multi-Core | Single-Core
Geekbench 5.5: Multi-Core | Single-Core
HWBOT x265 Benchmark v2.2: 4k Preset
LibreOffice : 20 Documents To PDF
R Benchmark 2.5: Overall mean
| CPU Performance rating | |
| MSI Raider GE68HX 13VF | |
| Média da turma Gaming | |
| Alienware m16 R1 Intel | |
| Média Intel Core i7-13650HX | |
| Dell G16, i7-13650HX, RTX 4060 | |
| Lenovo Legion Slim 5 16APH8 -2! | |
| Lenovo LOQ 16IRH8 | |
| Dell G16 7620 -2! | |
| Cinebench R23 / Multi Core | |
| MSI Raider GE68HX 13VF | |
| Média da turma Gaming (10488 - 42661, n=108, últimos 2 anos) | |
| Alienware m16 R1 Intel | |
| Dell G16, i7-13650HX, RTX 4060 | |
| Média Intel Core i7-13650HX (18744 - 21006, n=6) | |
| Dell G16 7620 | |
| Lenovo Legion Slim 5 16APH8 | |
| Lenovo LOQ 16IRH8 | |
| Cinebench R23 / Single Core | |
| MSI Raider GE68HX 13VF | |
| Média da turma Gaming (1166 - 2415, n=108, últimos 2 anos) | |
| Alienware m16 R1 Intel | |
| Dell G16, i7-13650HX, RTX 4060 | |
| Lenovo LOQ 16IRH8 | |
| Média Intel Core i7-13650HX (1693 - 1903, n=6) | |
| Lenovo Legion Slim 5 16APH8 | |
| Dell G16 7620 | |
| Cinebench R20 / CPU (Multi Core) | |
| MSI Raider GE68HX 13VF | |
| Média da turma Gaming (4029 - 16433, n=107, últimos 2 anos) | |
| Alienware m16 R1 Intel | |
| Dell G16, i7-13650HX, RTX 4060 | |
| Média Intel Core i7-13650HX (7197 - 8021, n=5) | |
| Lenovo Legion Slim 5 16APH8 | |
| Dell G16 7620 | |
| Lenovo LOQ 16IRH8 | |
| Cinebench R20 / CPU (Single Core) | |
| MSI Raider GE68HX 13VF | |
| Média da turma Gaming (442 - 913, n=107, últimos 2 anos) | |
| Alienware m16 R1 Intel | |
| Dell G16, i7-13650HX, RTX 4060 | |
| Média Intel Core i7-13650HX (700 - 728, n=5) | |
| Lenovo LOQ 16IRH8 | |
| Lenovo Legion Slim 5 16APH8 | |
| Dell G16 7620 | |
| Cinebench R15 / CPU Multi 64Bit | |
| MSI Raider GE68HX 13VF | |
| Média da turma Gaming (1578 - 6330, n=106, últimos 2 anos) | |
| Alienware m16 R1 Intel | |
| Média Intel Core i7-13650HX (2864 - 3147, n=5) | |
| Dell G16, i7-13650HX, RTX 4060 | |
| Lenovo Legion Slim 5 16APH8 | |
| Dell G16 7620 | |
| Lenovo LOQ 16IRH8 | |
| Cinebench R15 / CPU Single 64Bit | |
| MSI Raider GE68HX 13VF | |
| Média da turma Gaming (188.8 - 350, n=107, últimos 2 anos) | |
| Lenovo Legion Slim 5 16APH8 | |
| Alienware m16 R1 Intel | |
| Dell G16, i7-13650HX, RTX 4060 | |
| Média Intel Core i7-13650HX (256 - 275, n=5) | |
| Lenovo LOQ 16IRH8 | |
| Dell G16 7620 | |
| Blender / v2.79 BMW27 CPU | |
| Lenovo LOQ 16IRH8 | |
| Lenovo Legion Slim 5 16APH8 | |
| Dell G16 7620 | |
| Média Intel Core i7-13650HX (158 - 226, n=5) | |
| Dell G16, i7-13650HX, RTX 4060 | |
| Alienware m16 R1 Intel | |
| Média da turma Gaming (79 - 330, n=105, últimos 2 anos) | |
| MSI Raider GE68HX 13VF | |
| 7-Zip 18.03 / 7z b 4 | |
| MSI Raider GE68HX 13VF | |
| Média da turma Gaming (33491 - 148086, n=106, últimos 2 anos) | |
| Alienware m16 R1 Intel | |
| Média Intel Core i7-13650HX (73927 - 80057, n=5) | |
| Dell G16, i7-13650HX, RTX 4060 | |
| Lenovo Legion Slim 5 16APH8 | |
| Dell G16 7620 | |
| Lenovo LOQ 16IRH8 | |
| 7-Zip 18.03 / 7z b 4 -mmt1 | |
| MSI Raider GE68HX 13VF | |
| Lenovo Legion Slim 5 16APH8 | |
| Média da turma Gaming (4199 - 7436, n=106, últimos 2 anos) | |
| Alienware m16 R1 Intel | |
| Média Intel Core i7-13650HX (5828 - 6125, n=5) | |
| Dell G16, i7-13650HX, RTX 4060 | |
| Lenovo LOQ 16IRH8 | |
| Dell G16 7620 | |
| Geekbench 6.7 / Multi-Core | |
| MSI Raider GE68HX 13VF | |
| Média da turma Gaming (6625 - 22850, n=107, últimos 2 anos) | |
| Alienware m16 R1 Intel | |
| Média Intel Core i7-13650HX (13554 - 14378, n=3) | |
| Dell G16, i7-13650HX, RTX 4060 | |
| Lenovo LOQ 16IRH8 | |
| Geekbench 6.7 / Single-Core | |
| MSI Raider GE68HX 13VF | |
| Média da turma Gaming (1490 - 3259, n=107, últimos 2 anos) | |
| Alienware m16 R1 Intel | |
| Lenovo LOQ 16IRH8 | |
| Dell G16, i7-13650HX, RTX 4060 | |
| Média Intel Core i7-13650HX (2505 - 2595, n=3) | |
| Geekbench 5.5 / Multi-Core | |
| MSI Raider GE68HX 13VF | |
| Média da turma Gaming (6460 - 28263, n=106, últimos 2 anos) | |
| Alienware m16 R1 Intel | |
| Média Intel Core i7-13650HX (12509 - 14778, n=5) | |
| Dell G16, i7-13650HX, RTX 4060 | |
| Lenovo LOQ 16IRH8 | |
| Dell G16 7620 | |
| Lenovo Legion Slim 5 16APH8 | |
| Geekbench 5.5 / Single-Core | |
| Média da turma Gaming (986 - 2474, n=106, últimos 2 anos) | |
| MSI Raider GE68HX 13VF | |
| Lenovo Legion Slim 5 16APH8 | |
| Dell G16, i7-13650HX, RTX 4060 | |
| Alienware m16 R1 Intel | |
| Média Intel Core i7-13650HX (1810 - 1866, n=5) | |
| Lenovo LOQ 16IRH8 | |
| Dell G16 7620 | |
| HWBOT x265 Benchmark v2.2 / 4k Preset | |
| MSI Raider GE68HX 13VF | |
| Média da turma Gaming (11.5 - 44.4, n=106, últimos 2 anos) | |
| Alienware m16 R1 Intel | |
| Lenovo Legion Slim 5 16APH8 | |
| Média Intel Core i7-13650HX (18.9 - 23.6, n=5) | |
| Dell G16, i7-13650HX, RTX 4060 | |
| Dell G16 7620 | |
| Lenovo LOQ 16IRH8 | |
| LibreOffice / 20 Documents To PDF | |
| Dell G16 7620 | |
| Dell G16, i7-13650HX, RTX 4060 | |
| Média da turma Gaming (33.2 - 88.8, n=106, últimos 2 anos) | |
| Média Intel Core i7-13650HX (38.9 - 58.8, n=5) | |
| Lenovo LOQ 16IRH8 | |
| Alienware m16 R1 Intel | |
| Lenovo Legion Slim 5 16APH8 | |
| MSI Raider GE68HX 13VF | |
| R Benchmark 2.5 / Overall mean | |
| Dell G16 7620 | |
| Lenovo LOQ 16IRH8 | |
| Alienware m16 R1 Intel | |
| Lenovo Legion Slim 5 16APH8 | |
| Média Intel Core i7-13650HX (0.4217 - 0.4461, n=6) | |
| Média da turma Gaming (0.3439 - 0.759, n=107, últimos 2 anos) | |
| Dell G16, i7-13650HX, RTX 4060 | |
| Dell G16, i7-13650HX, RTX 4060 | |
| MSI Raider GE68HX 13VF | |
* ... menor é melhor
AIDA64: FP32 Ray-Trace | FPU Julia | CPU SHA3 | CPU Queen | FPU SinJulia | FPU Mandel | CPU AES | CPU ZLib | FP64 Ray-Trace | CPU PhotoWorxx
| Performance rating | |
| MSI Raider GE68HX 13VF | |
| Média da turma Gaming | |
| Lenovo Legion Slim 5 16APH8 | |
| Alienware m16 R1 Intel | |
| Dell G16, i7-13650HX, RTX 4060 | |
| Média Intel Core i7-13650HX | |
| Dell G16 7620 | |
| Lenovo LOQ 16IRH8 | |
| AIDA64 / FP32 Ray-Trace | |
| Média da turma Gaming (10227 - 85542, n=106, últimos 2 anos) | |
| Lenovo Legion Slim 5 16APH8 | |
| MSI Raider GE68HX 13VF | |
| Alienware m16 R1 Intel | |
| Dell G16, i7-13650HX, RTX 4060 | |
| Média Intel Core i7-13650HX (13404 - 20012, n=5) | |
| Dell G16 7620 | |
| Lenovo LOQ 16IRH8 | |
| AIDA64 / FPU Julia | |
| Média da turma Gaming (51376 - 372155, n=106, últimos 2 anos) | |
| MSI Raider GE68HX 13VF | |
| Lenovo Legion Slim 5 16APH8 | |
| Alienware m16 R1 Intel | |
| Dell G16, i7-13650HX, RTX 4060 | |
| Média Intel Core i7-13650HX (68241 - 97317, n=5) | |
| Dell G16 7620 | |
| Lenovo LOQ 16IRH8 | |
| AIDA64 / CPU SHA3 | |
| MSI Raider GE68HX 13VF | |
| Média da turma Gaming (2180 - 10115, n=106, últimos 2 anos) | |
| Lenovo Legion Slim 5 16APH8 | |
| Alienware m16 R1 Intel | |
| Dell G16, i7-13650HX, RTX 4060 | |
| Média Intel Core i7-13650HX (3127 - 4487, n=5) | |
| Dell G16 7620 | |
| Lenovo LOQ 16IRH8 | |
| AIDA64 / CPU Queen | |
| MSI Raider GE68HX 13VF | |
| Lenovo Legion Slim 5 16APH8 | |
| Média da turma Gaming (49785 - 173351, n=90, últimos 2 anos) | |
| Alienware m16 R1 Intel | |
| Média Intel Core i7-13650HX (108627 - 110589, n=5) | |
| Dell G16, i7-13650HX, RTX 4060 | |
| Dell G16 7620 | |
| Lenovo LOQ 16IRH8 | |
| AIDA64 / FPU SinJulia | |
| MSI Raider GE68HX 13VF | |
| Lenovo Legion Slim 5 16APH8 | |
| Média da turma Gaming (4424 - 33636, n=106, últimos 2 anos) | |
| Alienware m16 R1 Intel | |
| Dell G16, i7-13650HX, RTX 4060 | |
| Média Intel Core i7-13650HX (9134 - 10887, n=5) | |
| Dell G16 7620 | |
| Lenovo LOQ 16IRH8 | |
| AIDA64 / FPU Mandel | |
| Média da turma Gaming (25115 - 196829, n=106, últimos 2 anos) | |
| MSI Raider GE68HX 13VF | |
| Lenovo Legion Slim 5 16APH8 | |
| Alienware m16 R1 Intel | |
| Dell G16, i7-13650HX, RTX 4060 | |
| Média Intel Core i7-13650HX (33391 - 48323, n=5) | |
| Dell G16 7620 | |
| Lenovo LOQ 16IRH8 | |
| AIDA64 / CPU AES | |
| Alienware m16 R1 Intel | |
| MSI Raider GE68HX 13VF | |
| Média da turma Gaming (39258 - 247074, n=106, últimos 2 anos) | |
| Dell G16, i7-13650HX, RTX 4060 | |
| Média Intel Core i7-13650HX (64436 - 85343, n=5) | |
| Dell G16 7620 | |
| Lenovo Legion Slim 5 16APH8 | |
| Lenovo LOQ 16IRH8 | |
| AIDA64 / CPU ZLib | |
| MSI Raider GE68HX 13VF | |
| Média da turma Gaming (574 - 2531, n=106, últimos 2 anos) | |
| Alienware m16 R1 Intel | |
| Dell G16, i7-13650HX, RTX 4060 | |
| Média Intel Core i7-13650HX (1136 - 1285, n=5) | |
| Lenovo Legion Slim 5 16APH8 | |
| Dell G16 7620 | |
| Lenovo LOQ 16IRH8 | |
| AIDA64 / FP64 Ray-Trace | |
| Média da turma Gaming (5509 - 45446, n=106, últimos 2 anos) | |
| Lenovo Legion Slim 5 16APH8 | |
| MSI Raider GE68HX 13VF | |
| Alienware m16 R1 Intel | |
| Dell G16, i7-13650HX, RTX 4060 | |
| Média Intel Core i7-13650HX (7270 - 10900, n=5) | |
| Dell G16 7620 | |
| Lenovo LOQ 16IRH8 | |
| AIDA64 / CPU PhotoWorxx | |
| MSI Raider GE68HX 13VF | |
| Média da turma Gaming (12271 - 89891, n=106, últimos 2 anos) | |
| Média Intel Core i7-13650HX (36170 - 43289, n=5) | |
| Dell G16, i7-13650HX, RTX 4060 | |
| Alienware m16 R1 Intel | |
| Dell G16 7620 | |
| Lenovo LOQ 16IRH8 | |
| Lenovo Legion Slim 5 16APH8 | |
Desempenho do sistema
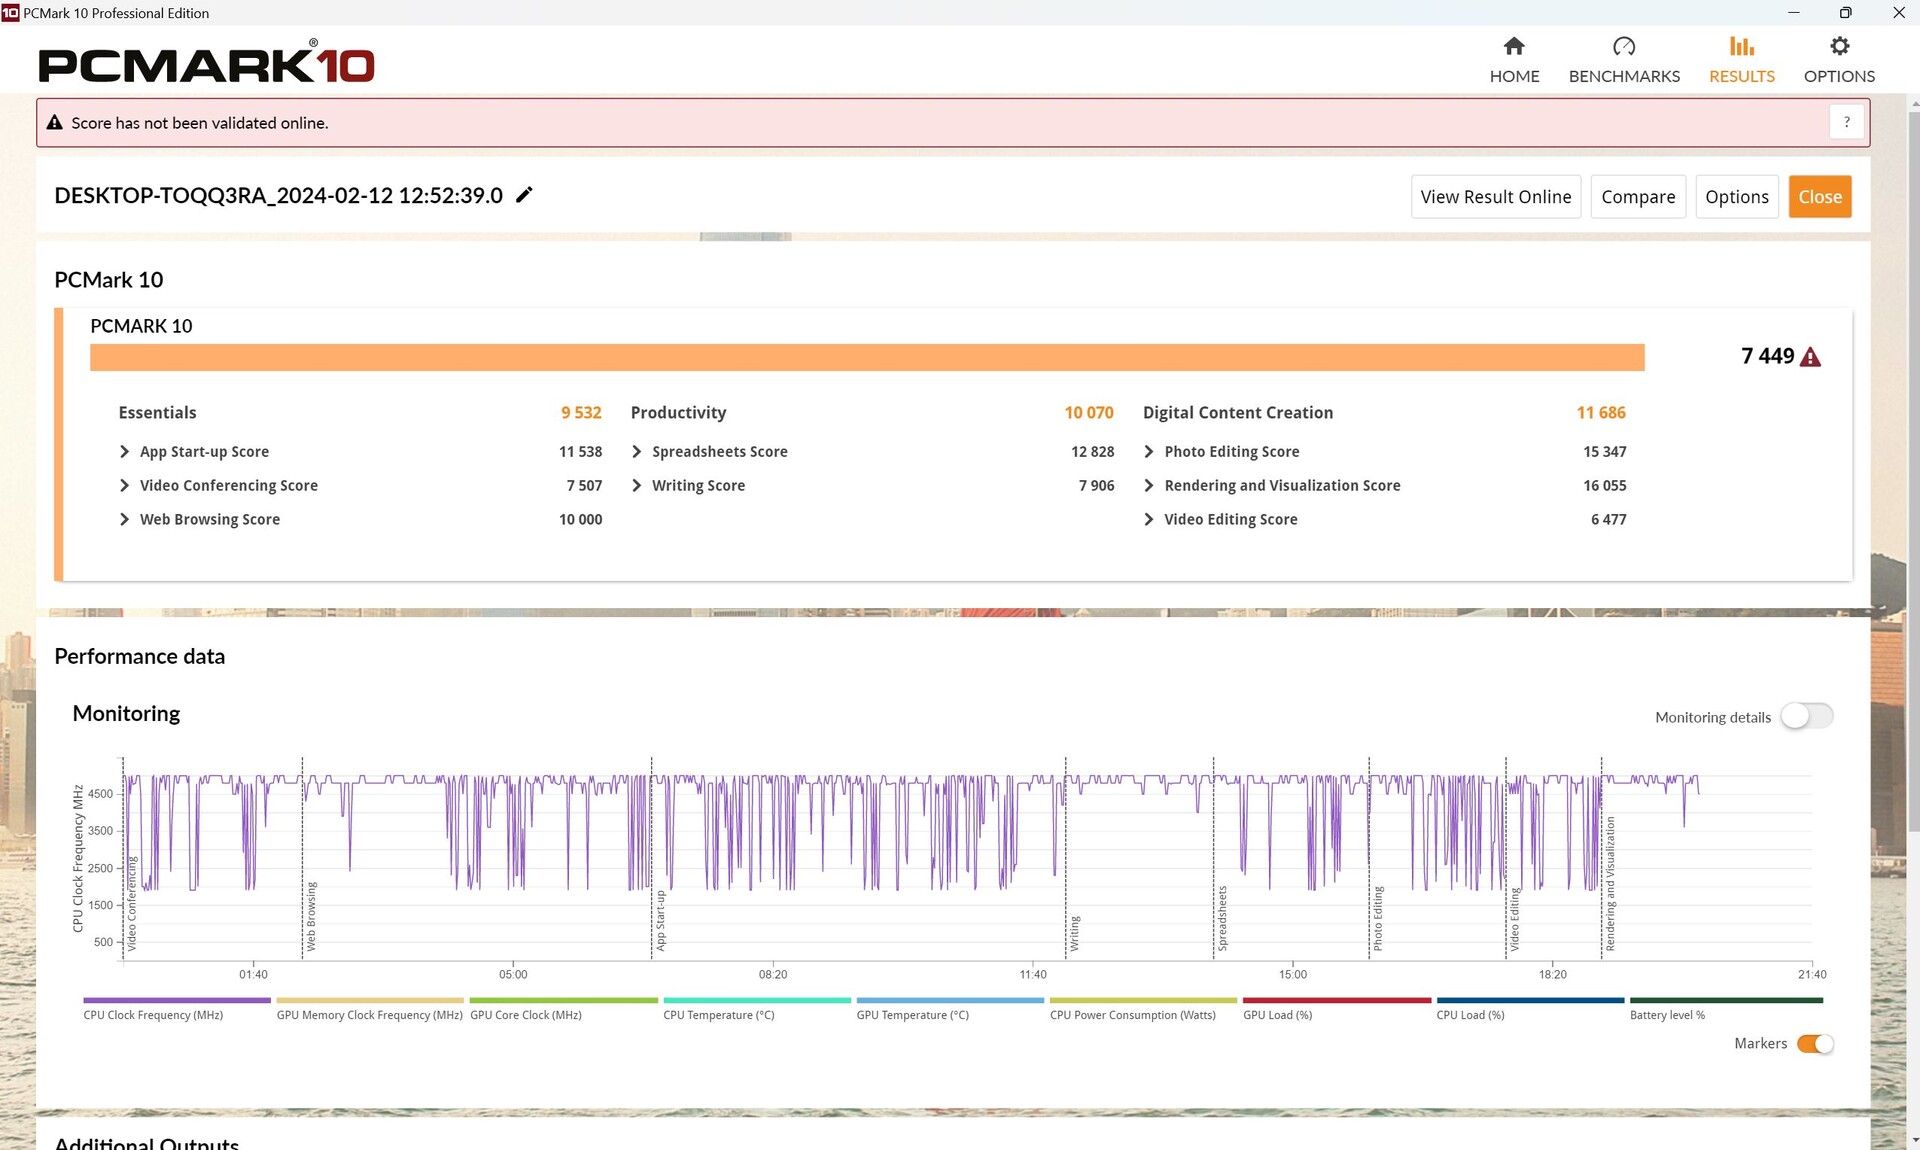
De modo geral, o G16 se saiu bem no PCMark 10, mas mostrou alguns pontos fracos no subteste Essentials. O mesmo pode ser dito sobre o teste de produtividade do CrossMark. Em todos os testes, nosso modelo de teste conseguiu ficar ligeiramente acima de todos os notebooks em nosso banco de dados que apresentam a mesma configuração de CPU/GPU, portanto, esses valores discrepantes não são muito significativos.
CrossMark: Overall | Productivity | Creativity | Responsiveness
WebXPRT 3: Overall
WebXPRT 4: Overall
Mozilla Kraken 1.1: Total
| PCMark 10 / Score | |
| Média da turma Gaming (5828 - 12414, n=94, últimos 2 anos) | |
| MSI Raider GE68HX 13VF | |
| Lenovo Legion Slim 5 16APH8 | |
| Dell G16, i7-13650HX, RTX 4060 | |
| Média Intel Core i7-13650HX, NVIDIA GeForce RTX 4060 Laptop GPU (6984 - 7613, n=3) | |
| Alienware m16 R1 Intel | |
| Dell G16 7620 | |
| Lenovo LOQ 16IRH8 | |
| PCMark 10 / Essentials | |
| MSI Raider GE68HX 13VF | |
| Lenovo Legion Slim 5 16APH8 | |
| Alienware m16 R1 Intel | |
| Média da turma Gaming (8810 - 11935, n=98, últimos 2 anos) | |
| Média Intel Core i7-13650HX, NVIDIA GeForce RTX 4060 Laptop GPU (9532 - 11151, n=3) | |
| Dell G16 7620 | |
| Lenovo LOQ 16IRH8 | |
| Dell G16, i7-13650HX, RTX 4060 | |
| PCMark 10 / Productivity | |
| Média da turma Gaming (6845 - 25323, n=96, últimos 2 anos) | |
| Lenovo Legion Slim 5 16APH8 | |
| Média Intel Core i7-13650HX, NVIDIA GeForce RTX 4060 Laptop GPU (9961 - 10204, n=3) | |
| Dell G16, i7-13650HX, RTX 4060 | |
| MSI Raider GE68HX 13VF | |
| Alienware m16 R1 Intel | |
| Dell G16 7620 | |
| Lenovo LOQ 16IRH8 | |
| PCMark 10 / Digital Content Creation | |
| Média da turma Gaming (7602 - 19954, n=96, últimos 2 anos) | |
| MSI Raider GE68HX 13VF | |
| Lenovo Legion Slim 5 16APH8 | |
| Dell G16, i7-13650HX, RTX 4060 | |
| Dell G16 7620 | |
| Média Intel Core i7-13650HX, NVIDIA GeForce RTX 4060 Laptop GPU (8323 - 11686, n=3) | |
| Alienware m16 R1 Intel | |
| Lenovo LOQ 16IRH8 | |
| CrossMark / Overall | |
| Alienware m16 R1 Intel | |
| Média da turma Gaming (1366 - 2409, n=95, últimos 2 anos) | |
| MSI Raider GE68HX 13VF | |
| Lenovo LOQ 16IRH8 | |
| Média Intel Core i7-13650HX, NVIDIA GeForce RTX 4060 Laptop GPU (1839 - 1951, n=3) | |
| Dell G16, i7-13650HX, RTX 4060 | |
| Lenovo Legion Slim 5 16APH8 | |
| Dell G16 7620 | |
| CrossMark / Productivity | |
| Alienware m16 R1 Intel | |
| Lenovo LOQ 16IRH8 | |
| Média da turma Gaming (1386 - 2254, n=95, últimos 2 anos) | |
| MSI Raider GE68HX 13VF | |
| Média Intel Core i7-13650HX, NVIDIA GeForce RTX 4060 Laptop GPU (1730 - 1864, n=3) | |
| Lenovo Legion Slim 5 16APH8 | |
| Dell G16, i7-13650HX, RTX 4060 | |
| Dell G16 7620 | |
| CrossMark / Creativity | |
| MSI Raider GE68HX 13VF | |
| Média da turma Gaming (1343 - 2786, n=95, últimos 2 anos) | |
| Alienware m16 R1 Intel | |
| Média Intel Core i7-13650HX, NVIDIA GeForce RTX 4060 Laptop GPU (2020 - 2063, n=3) | |
| Lenovo LOQ 16IRH8 | |
| Dell G16, i7-13650HX, RTX 4060 | |
| Lenovo Legion Slim 5 16APH8 | |
| Dell G16 7620 | |
| CrossMark / Responsiveness | |
| Alienware m16 R1 Intel | |
| Lenovo LOQ 16IRH8 | |
| Média Intel Core i7-13650HX, NVIDIA GeForce RTX 4060 Laptop GPU (1544 - 1907, n=3) | |
| Média da turma Gaming (1226 - 2334, n=95, últimos 2 anos) | |
| Dell G16, i7-13650HX, RTX 4060 | |
| MSI Raider GE68HX 13VF | |
| Dell G16 7620 | |
| Lenovo Legion Slim 5 16APH8 | |
| WebXPRT 3 / Overall | |
| MSI Raider GE68HX 13VF | |
| Lenovo Legion Slim 5 16APH8 | |
| Lenovo LOQ 16IRH8 | |
| Lenovo LOQ 16IRH8 | |
| Média da turma Gaming (220 - 532, n=99, últimos 2 anos) | |
| Alienware m16 R1 Intel | |
| Média Intel Core i7-13650HX, NVIDIA GeForce RTX 4060 Laptop GPU (268 - 302, n=3) | |
| Dell G16 7620 | |
| Dell G16, i7-13650HX, RTX 4060 | |
| WebXPRT 4 / Overall | |
| MSI Raider GE68HX 13VF | |
| Média da turma Gaming (165 - 354, n=99, últimos 2 anos) | |
| Alienware m16 R1 Intel | |
| Média Intel Core i7-13650HX, NVIDIA GeForce RTX 4060 Laptop GPU (260 - 276, n=2) | |
| Lenovo Legion Slim 5 16APH8 | |
| Dell G16 7620 | |
| Mozilla Kraken 1.1 / Total | |
| Dell G16 7620 | |
| Média Intel Core i7-13650HX, NVIDIA GeForce RTX 4060 Laptop GPU (507 - 511, n=3) | |
| Lenovo LOQ 16IRH8 | |
| Lenovo LOQ 16IRH8 | |
| Dell G16, i7-13650HX, RTX 4060 | |
| Alienware m16 R1 Intel | |
| Lenovo Legion Slim 5 16APH8 | |
| Média da turma Gaming (391 - 590, n=101, últimos 2 anos) | |
| MSI Raider GE68HX 13VF | |
* ... menor é melhor
| PCMark 10 Score | 7449 pontos | |
Ajuda | ||
| AIDA64 / Memory Copy | |
| MSI Raider GE68HX 13VF | |
| Média da turma Gaming (21750 - 129946, n=106, últimos 2 anos) | |
| Lenovo Legion Slim 5 16APH8 | |
| Média Intel Core i7-13650HX (59266 - 66372, n=5) | |
| Dell G16, i7-13650HX, RTX 4060 | |
| Alienware m16 R1 Intel | |
| Dell G16 7620 | |
| Lenovo LOQ 16IRH8 | |
| AIDA64 / Memory Read | |
| MSI Raider GE68HX 13VF | |
| Média da turma Gaming (22956 - 118858, n=106, últimos 2 anos) | |
| Média Intel Core i7-13650HX (67305 - 71022, n=5) | |
| Alienware m16 R1 Intel | |
| Dell G16, i7-13650HX, RTX 4060 | |
| Dell G16 7620 | |
| Lenovo LOQ 16IRH8 | |
| Lenovo Legion Slim 5 16APH8 | |
| AIDA64 / Memory Write | |
| Lenovo Legion Slim 5 16APH8 | |
| MSI Raider GE68HX 13VF | |
| Média da turma Gaming (22297 - 135096, n=106, últimos 2 anos) | |
| Média Intel Core i7-13650HX (58028 - 68225, n=5) | |
| Alienware m16 R1 Intel | |
| Dell G16, i7-13650HX, RTX 4060 | |
| Dell G16 7620 | |
| Lenovo LOQ 16IRH8 | |
| AIDA64 / Memory Latency | |
| Lenovo LOQ 16IRH8 | |
| Média da turma Gaming (75.3 - 259, n=106, últimos 2 anos) | |
| Dell G16 7620 | |
| Lenovo Legion Slim 5 16APH8 | |
| Dell G16, i7-13650HX, RTX 4060 | |
| Média Intel Core i7-13650HX (83.7 - 90.8, n=5) | |
| Alienware m16 R1 Intel | |
| MSI Raider GE68HX 13VF | |
* ... menor é melhor
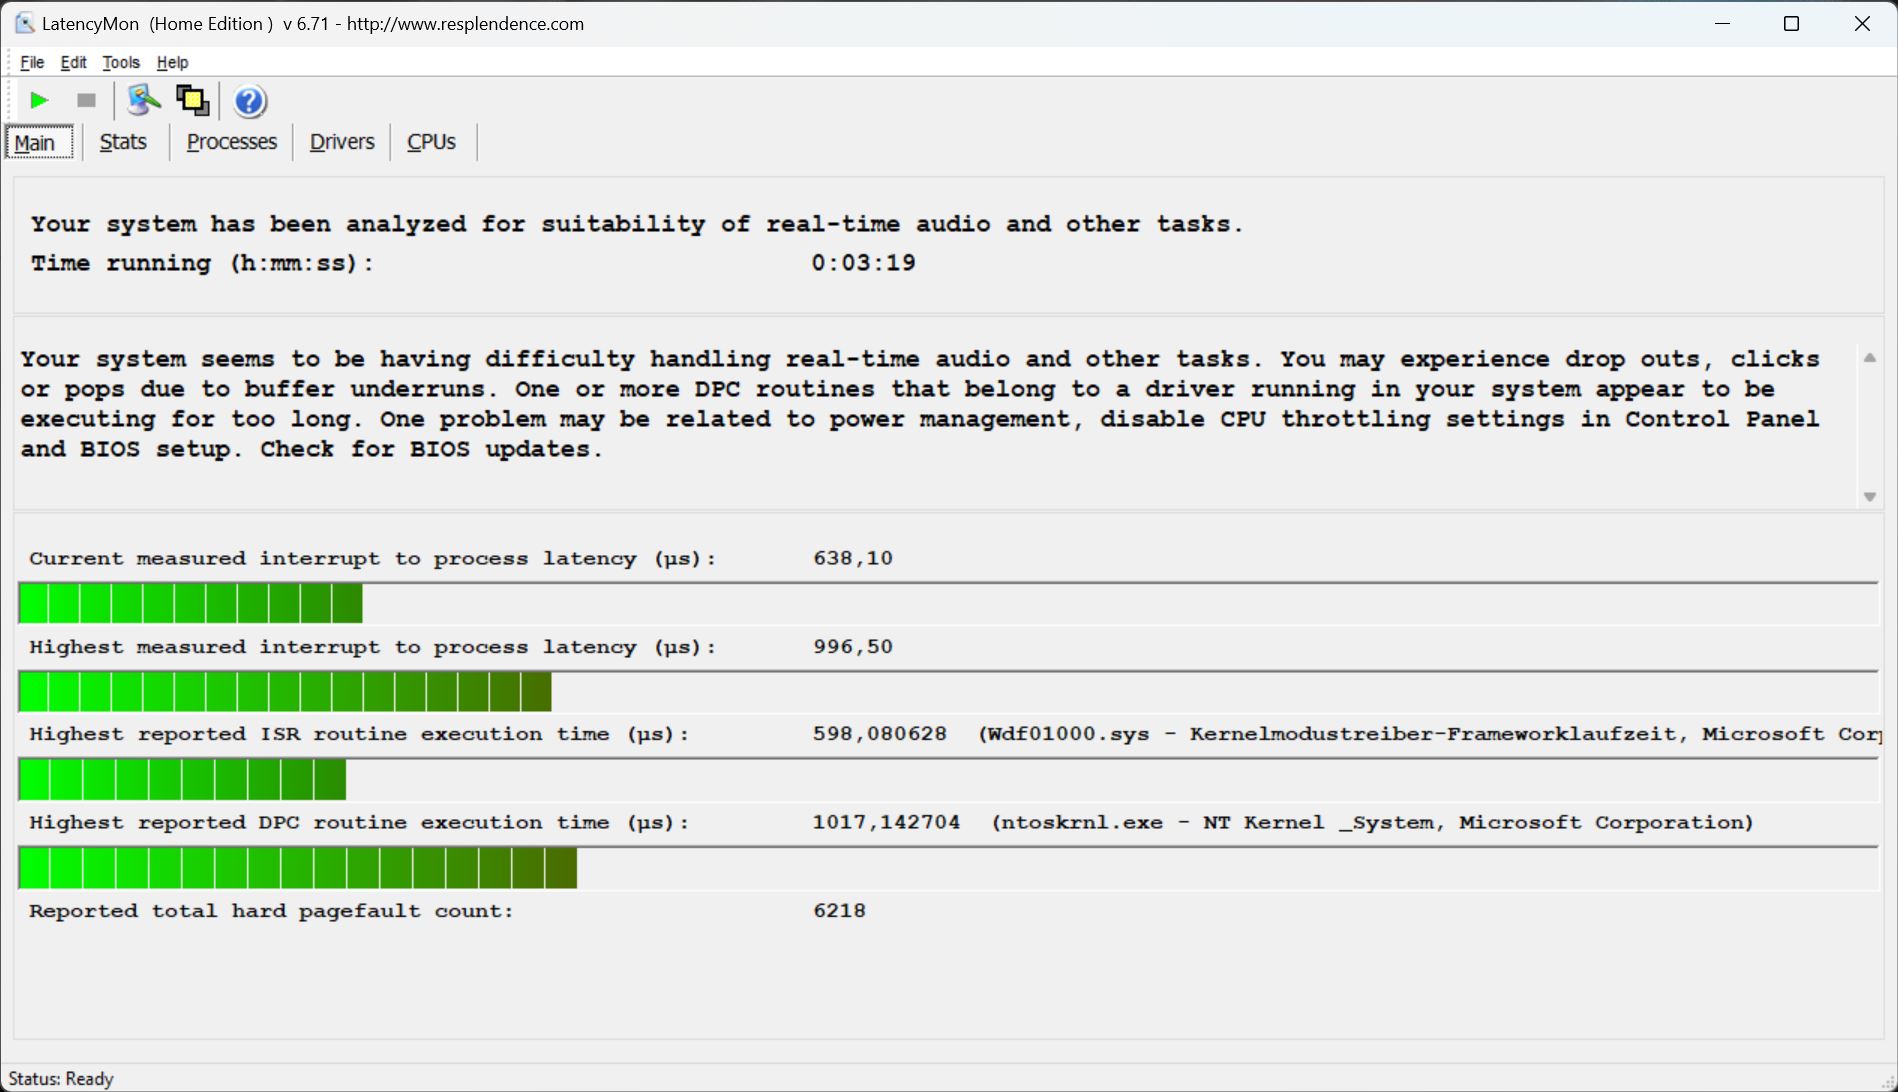
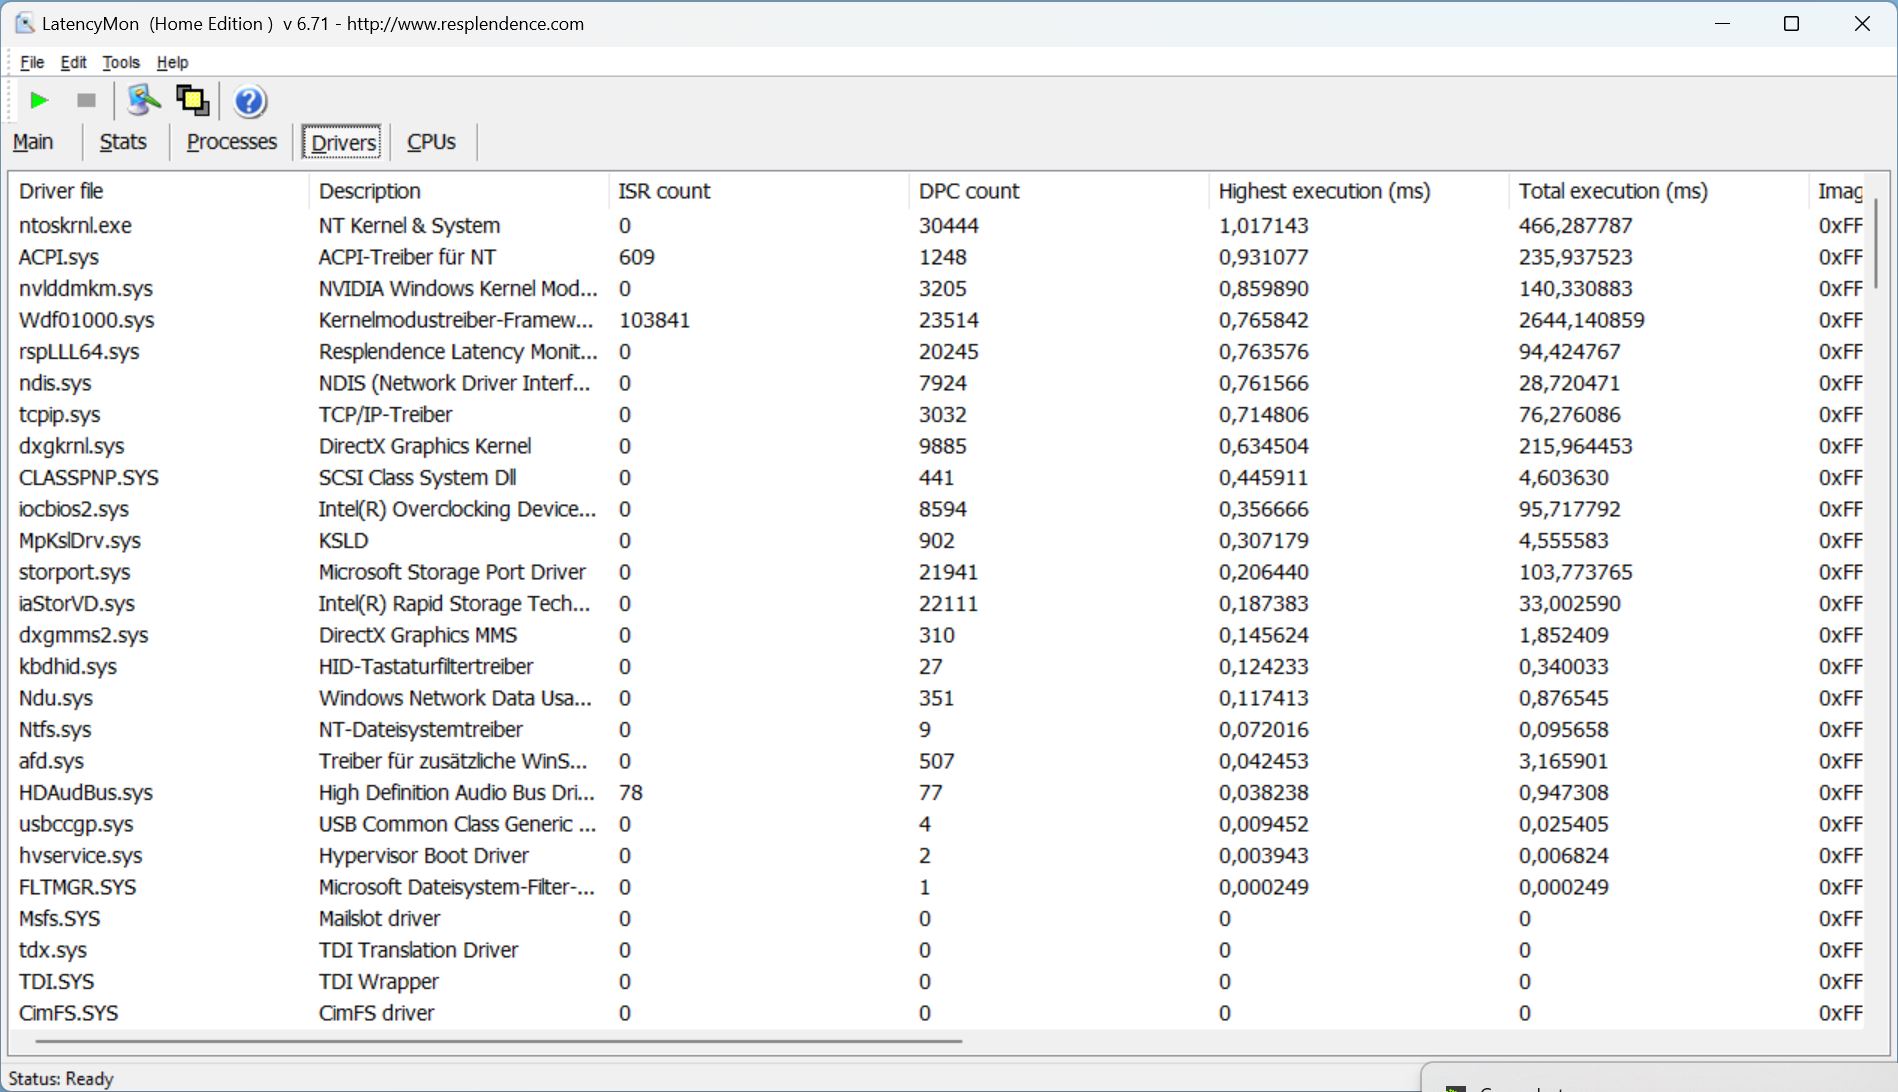
Latência DPC
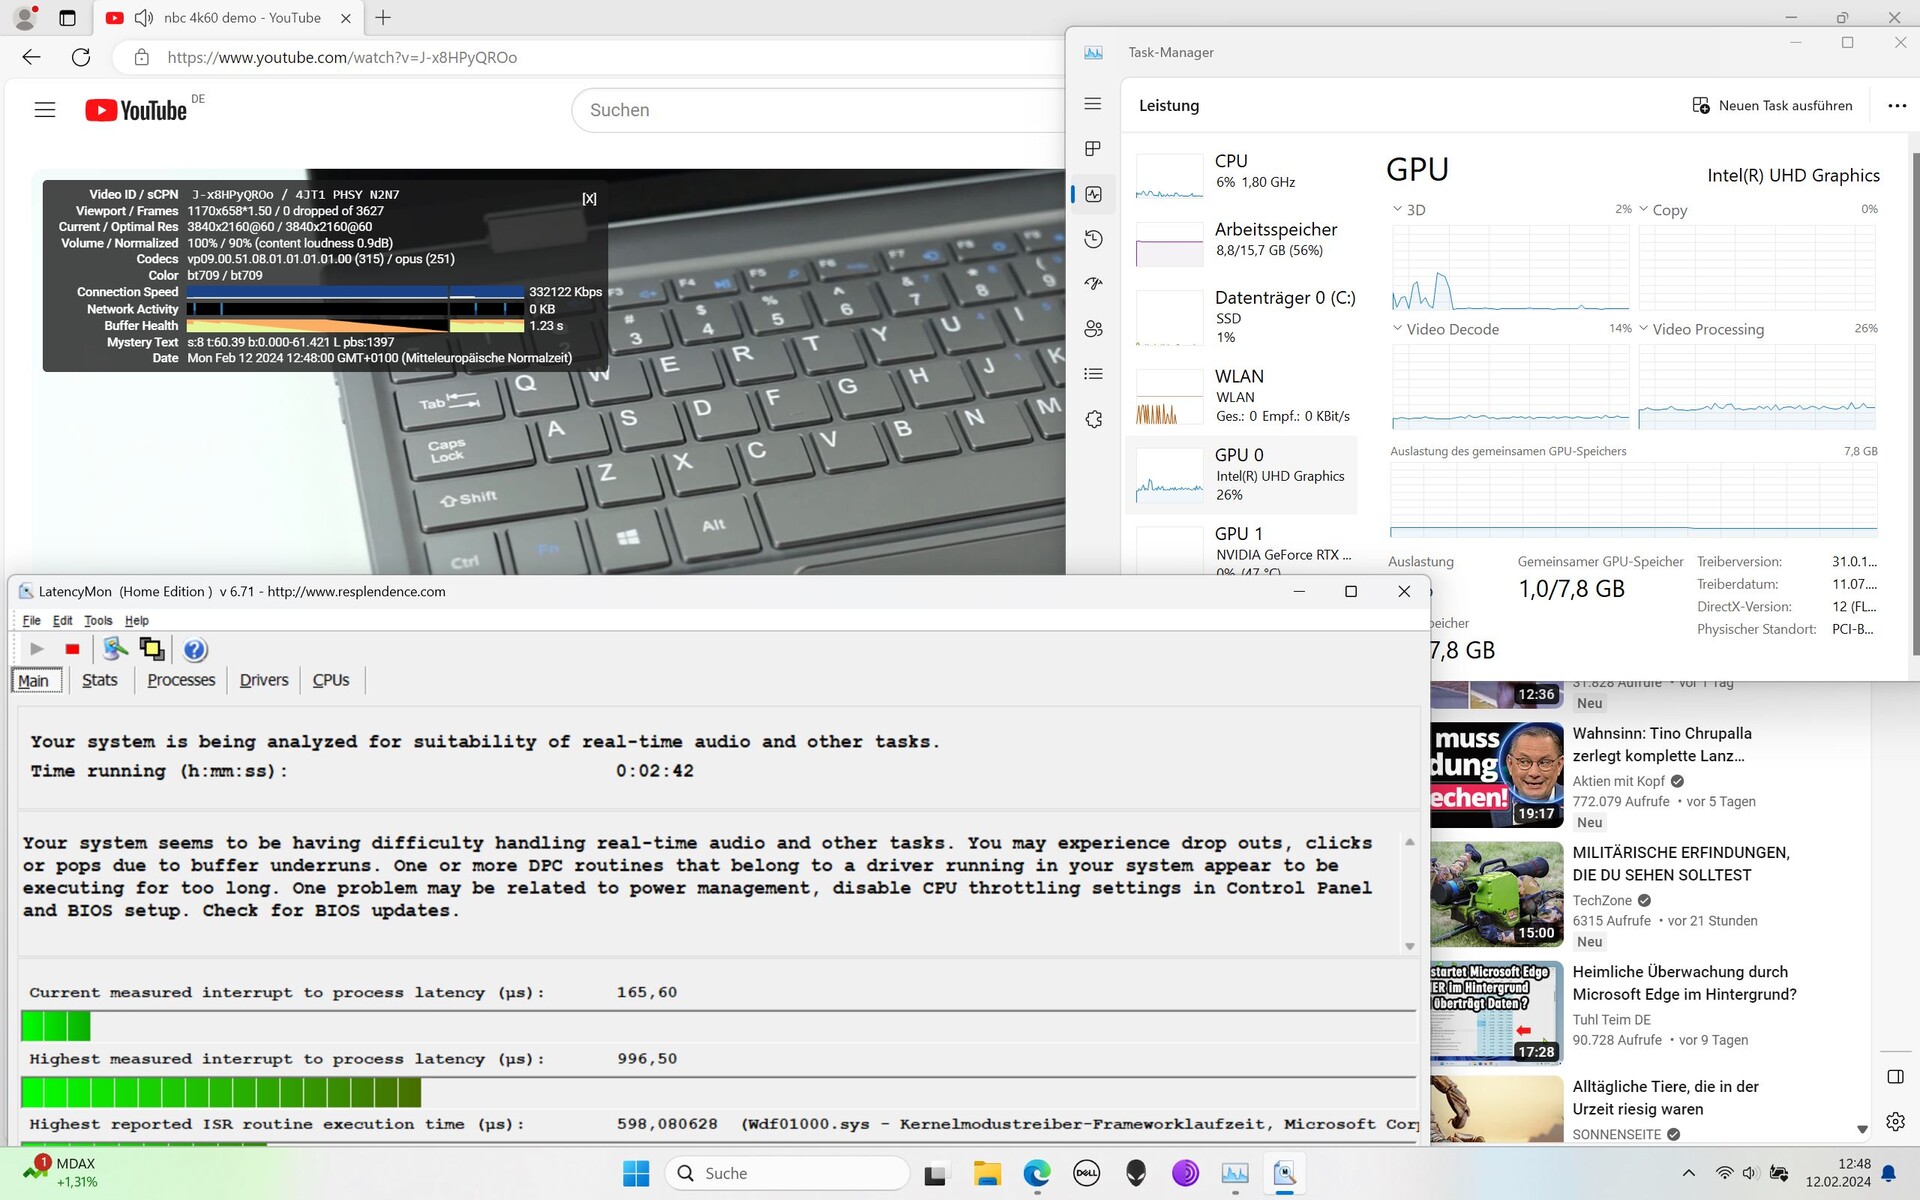
Ao abrir nosso site, o laptop apresentou algumas latências leves, mas o software LatencyMon não as sinalizou como críticas. Isso não mudou ao abrir várias guias. Suas latências aumentaram ligeiramente ao reproduzir nosso vídeo do YouTube em 4K/60 fps, levando nossa ferramenta de medição a indicar alguns problemas. No entanto, em comparação, essas latências são bastante baixas e o vídeo de teste foi reproduzido sem nenhuma queda de quadros.
| DPC Latencies / LatencyMon - interrupt to process latency (max), Web, Youtube, Prime95 | |
| Alienware m16 R1 Intel | |
| MSI Raider GE68HX 13VF | |
| Lenovo LOQ 16IRH8 | |
| Lenovo Legion Slim 5 16APH8 | |
| Dell G16, i7-13650HX, RTX 4060 | |
| Dell G16 7620 | |
* ... menor é melhor
Dispositivos de armazenamento
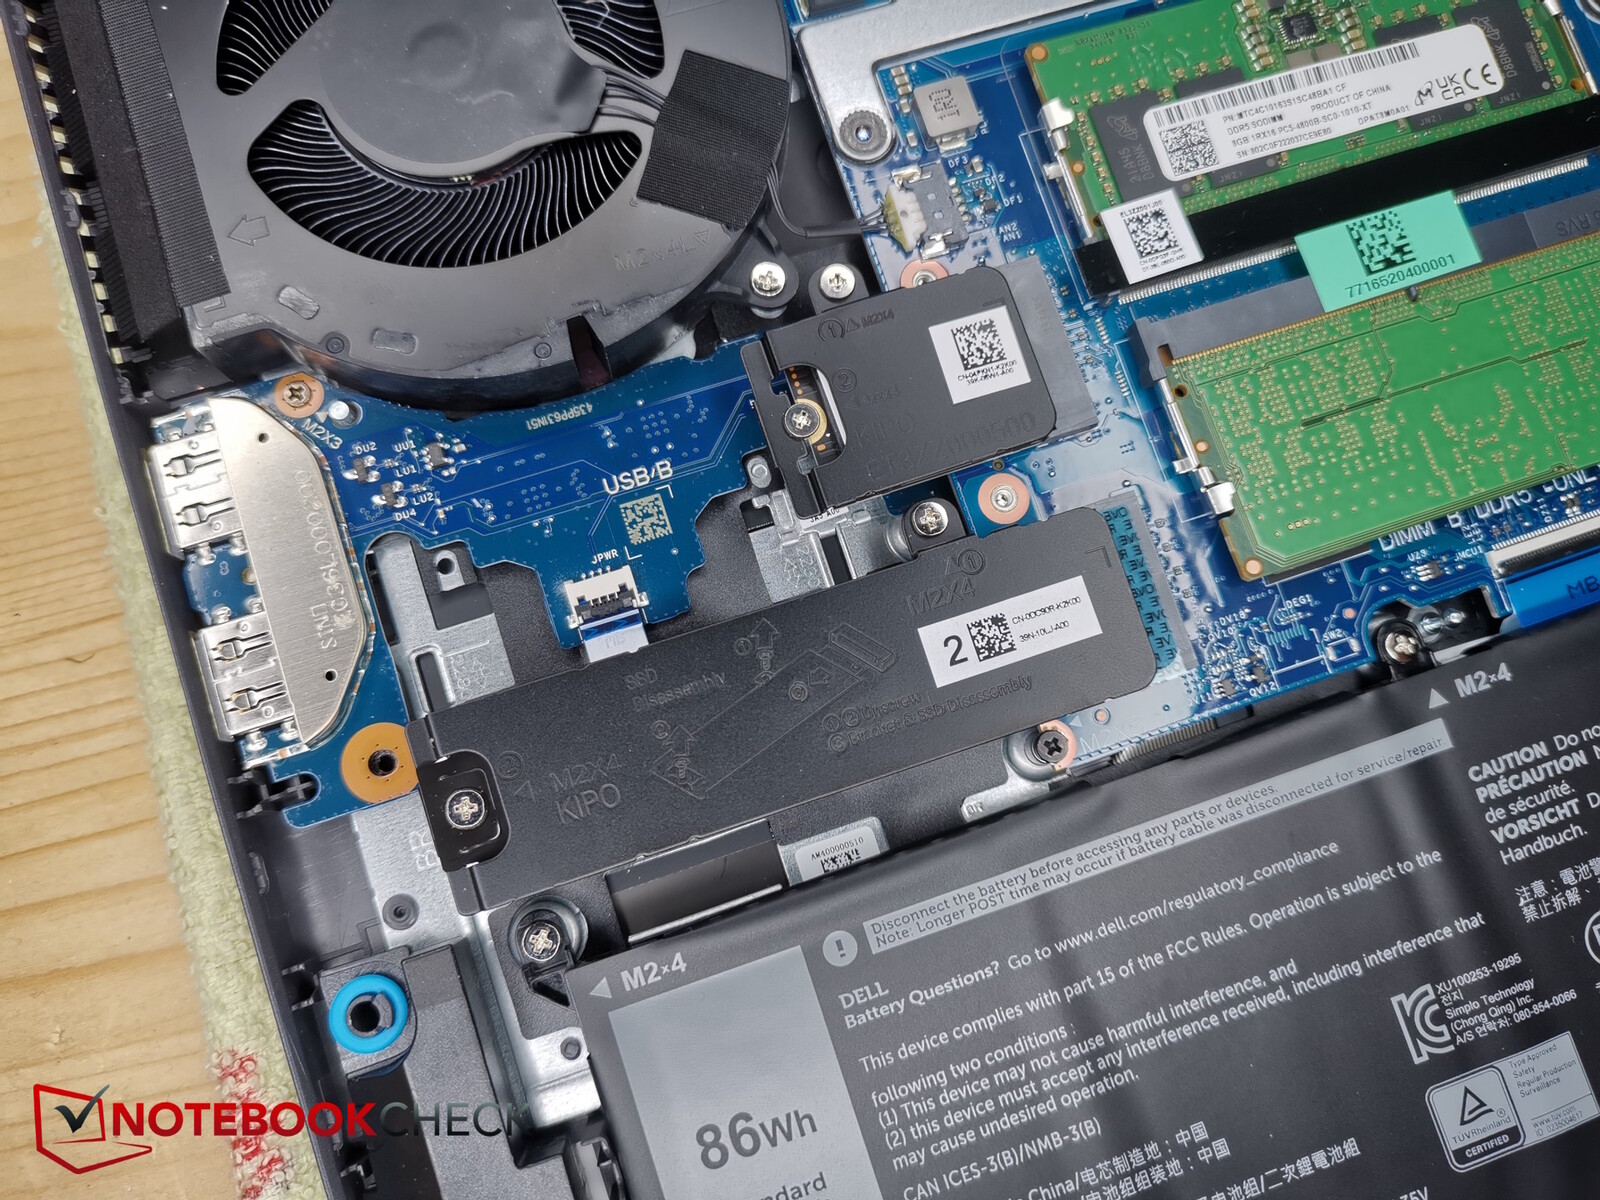
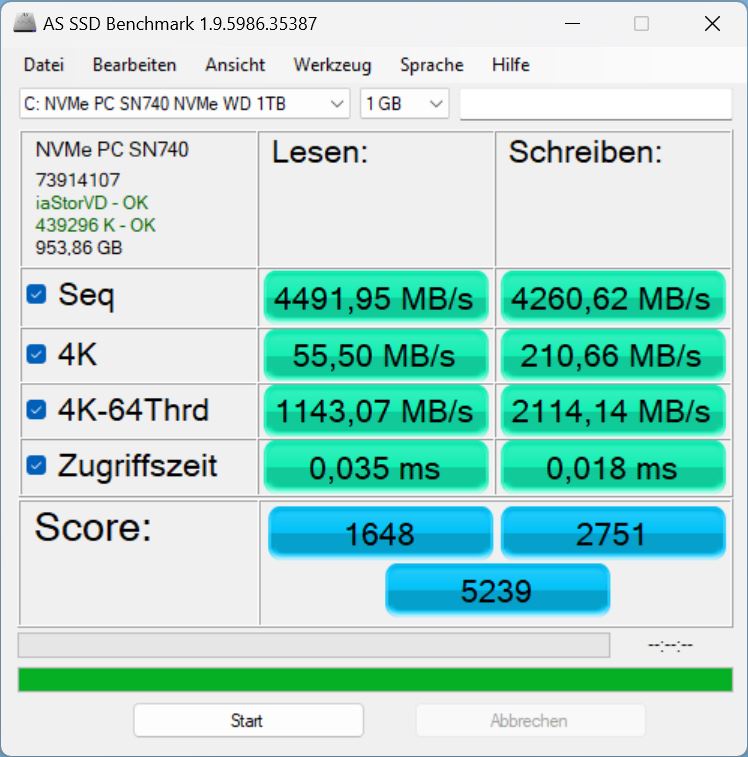
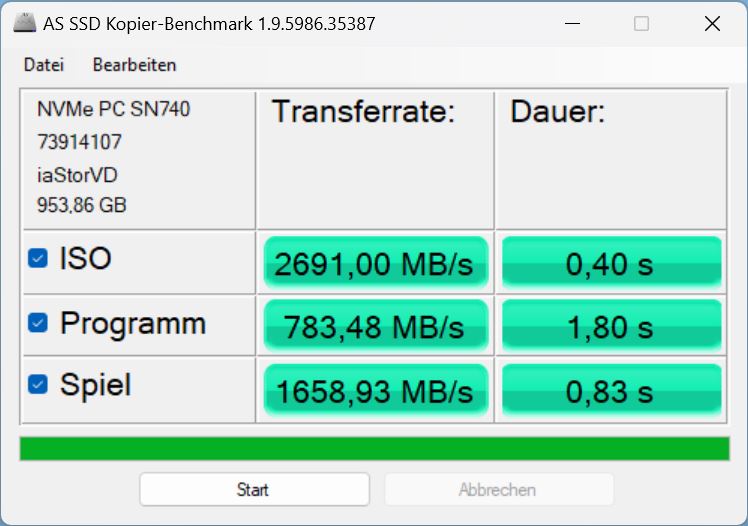
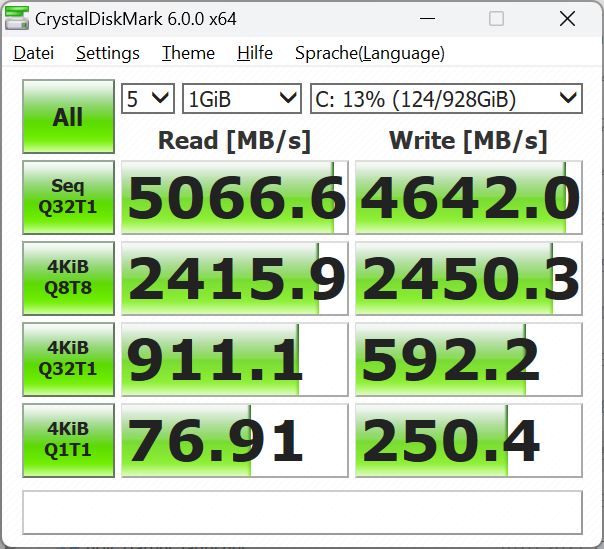
A Dell instalou um SN740 da Western Digital com o pequeno formato M.2 2230. Um segundo slot M.2-2280, maior, também está livre. O PCIe-4-NVMe ocupa a posição 142 em nossa Lista dos melhores SSDs. Seu desempenho de saída é, na verdade, melhor do que o dos SSDs no MSI Raider ou no Lenovo LOQ 16. Em contraste com esses e outros concorrentes, no entanto, o meio de armazenamento no G16 é termicamente estrangulado após um período muito curto.
Suas taxas de transferência caem em mais da metade. A propósito, seu antecessor tinha um modelo mais rápido instalado, mesmo que ele também tenha sido afetado por problemas de limitação. No entanto, esses problemas começaram muito mais tarde.


* ... menor é melhor
Reading continuous performance: DiskSpd Read Loop, Queue Depth 8
Placa de vídeo
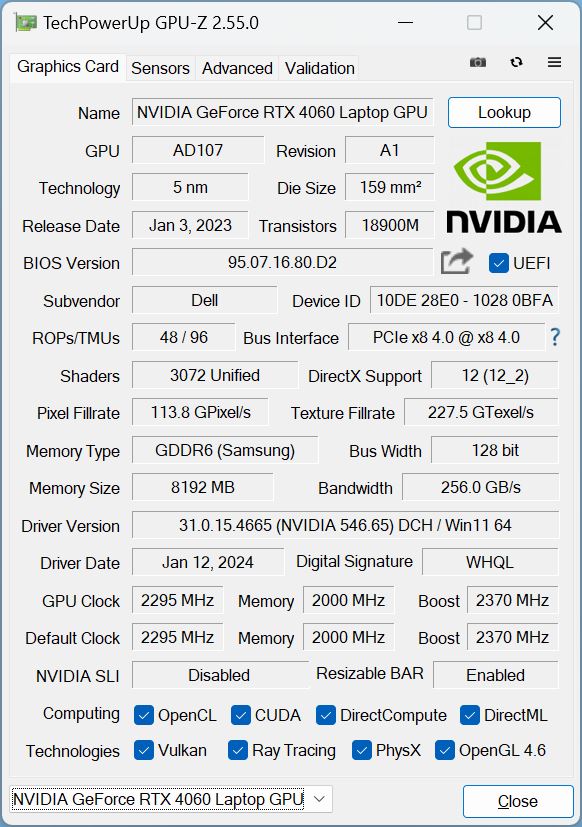
A Dell deu ao G16 uma RTX 4060 com 140 watts. O modo Whisper, Max-Q, Dynamic Boost e até mesmo o Advanced Optimus são suportados. No entanto, o último é irritante com bastante frequência, pois o processo de troca de gráficos leva alguns segundos durante cada aplicativo 3D (inicialização e fechamento), durante o qual a tela congela.
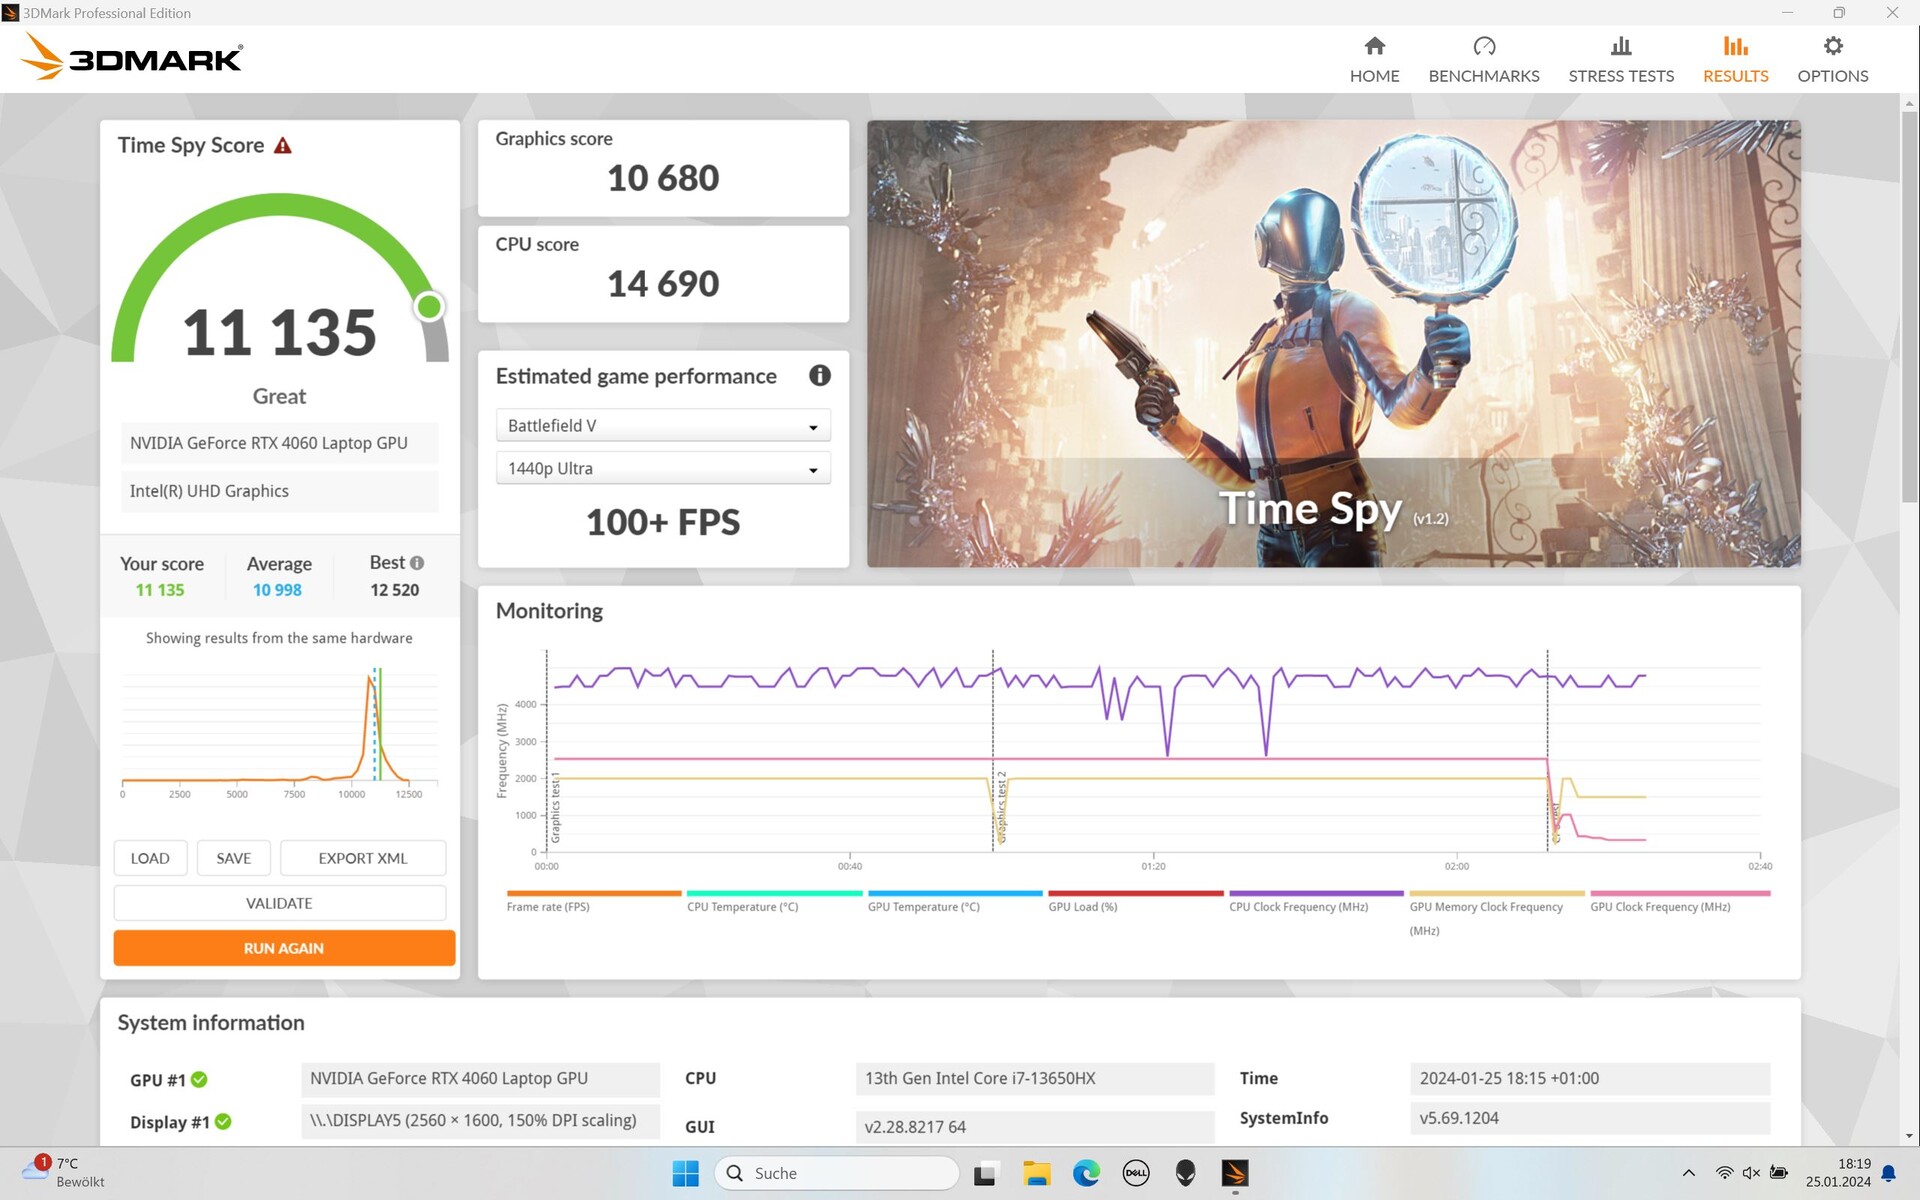
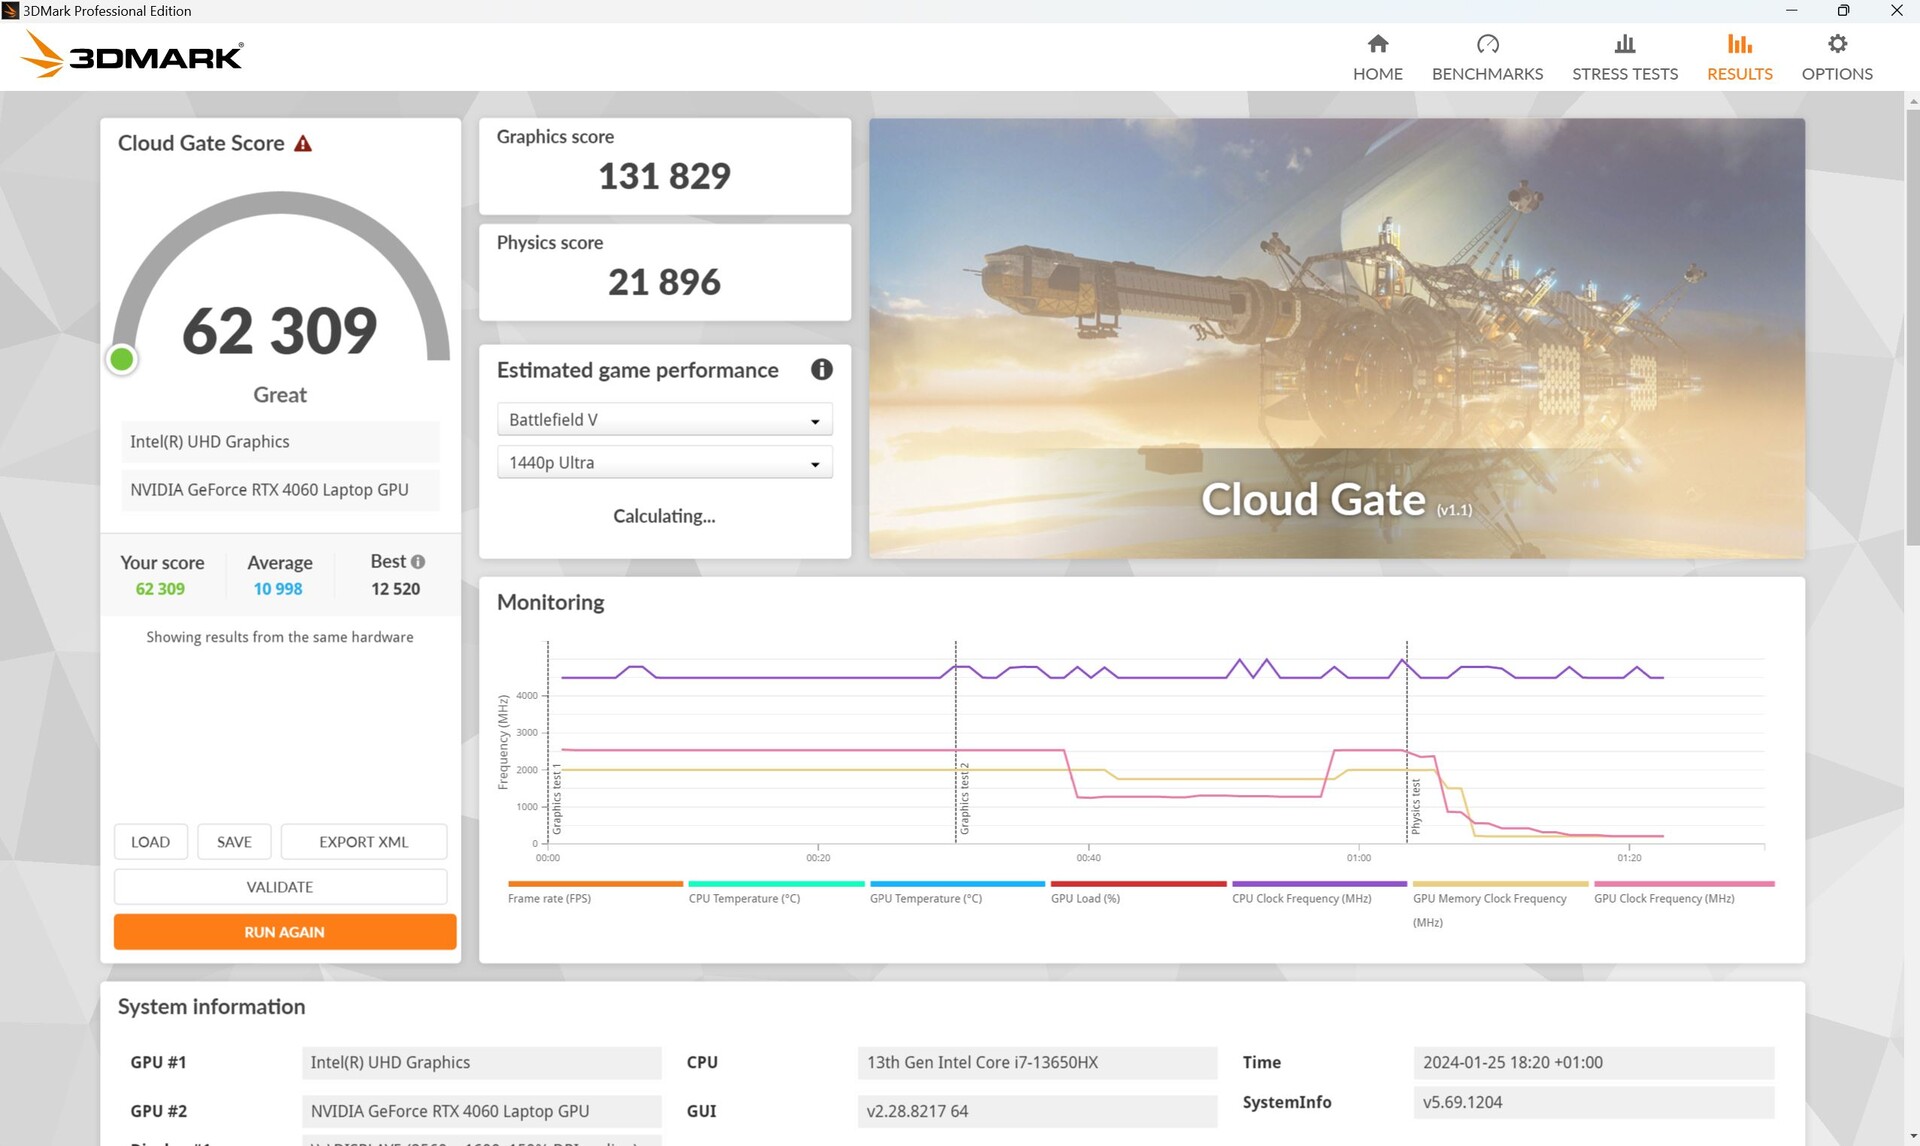
Ainda assim, seu desempenho durante o 3DMarks sintético foi como esperávamos, se não um pouco melhor. Sua vantagem sobre o antecessor do laptop com a RTX 3060 e o i7-12700H é de cerca de 22%.
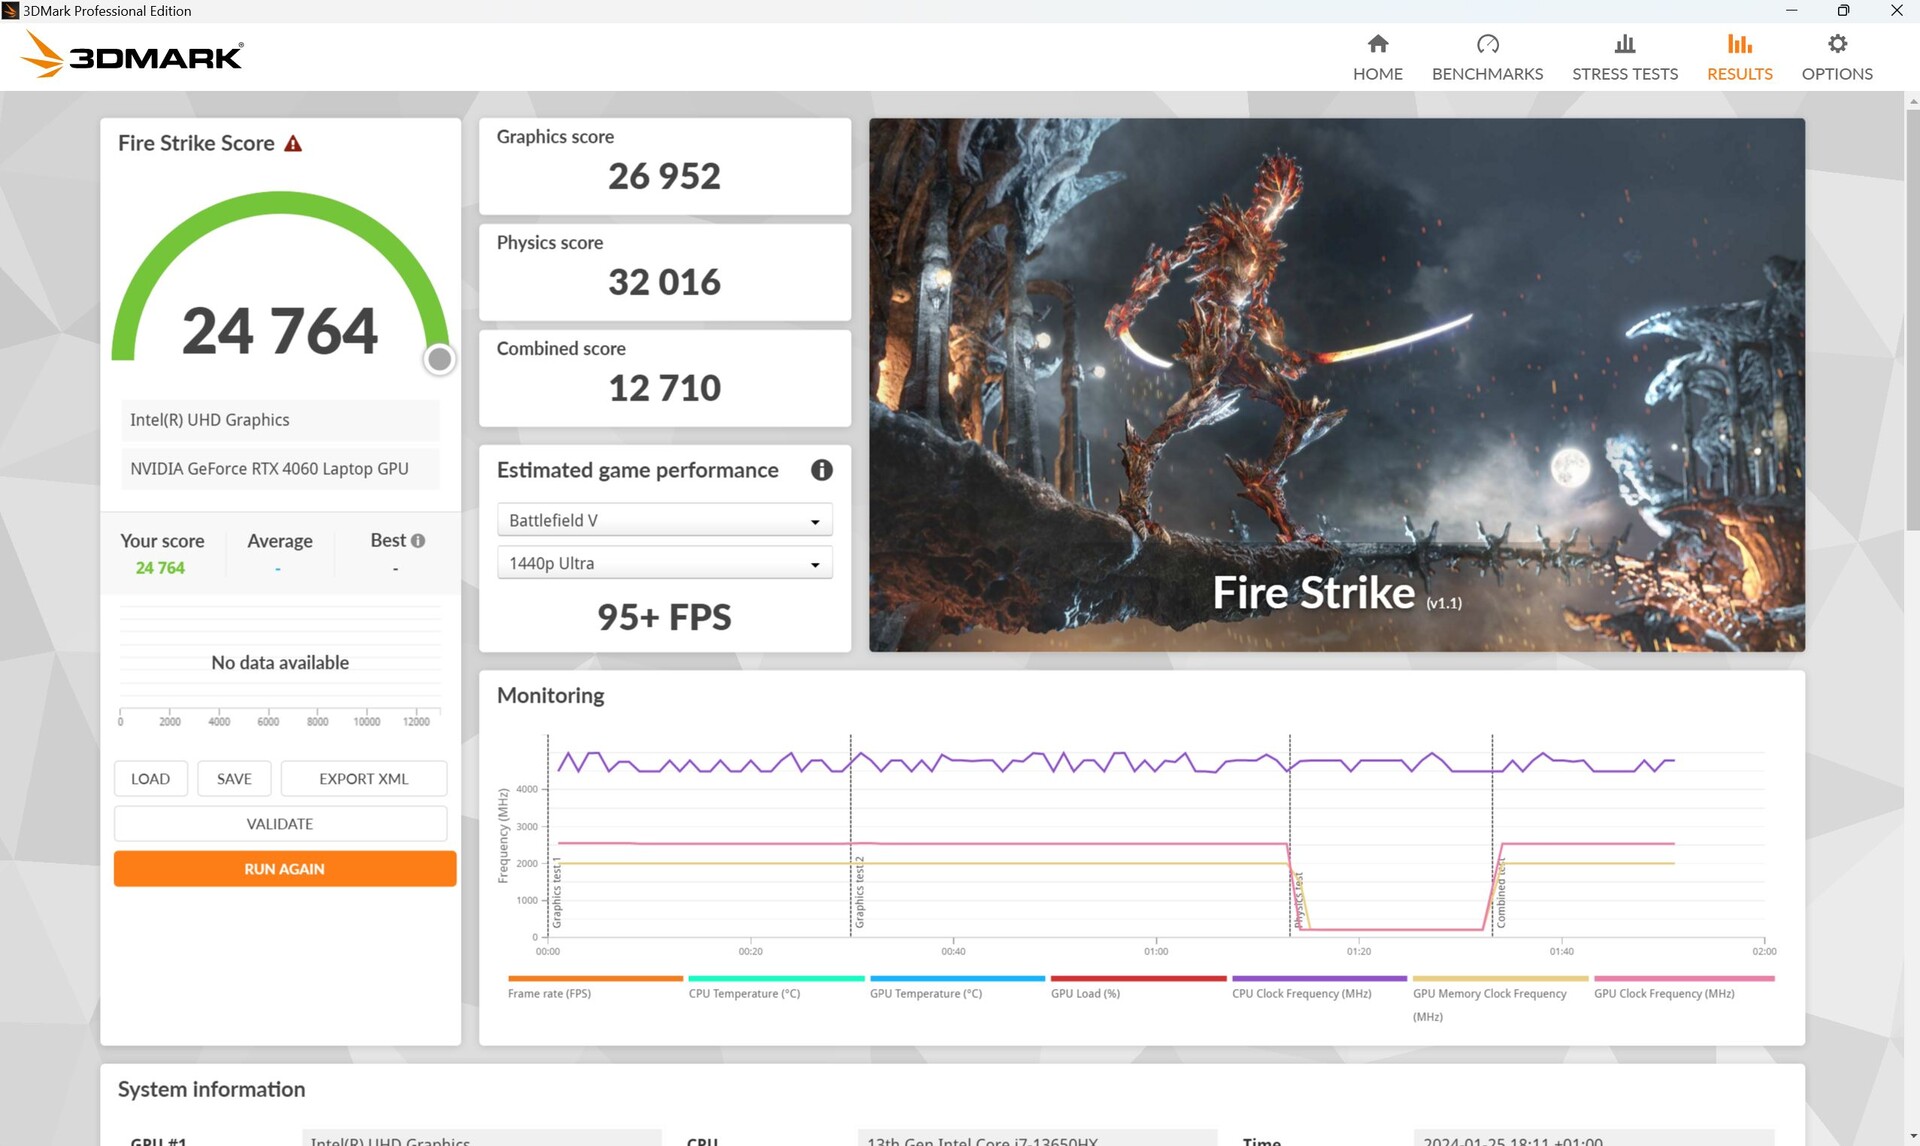
Desconectado da energia, seu desempenho 3D caiu menos drasticamente do que o esperado. Em outra execução do site Fire Strike, medimos uma queda de cerca de 20%.
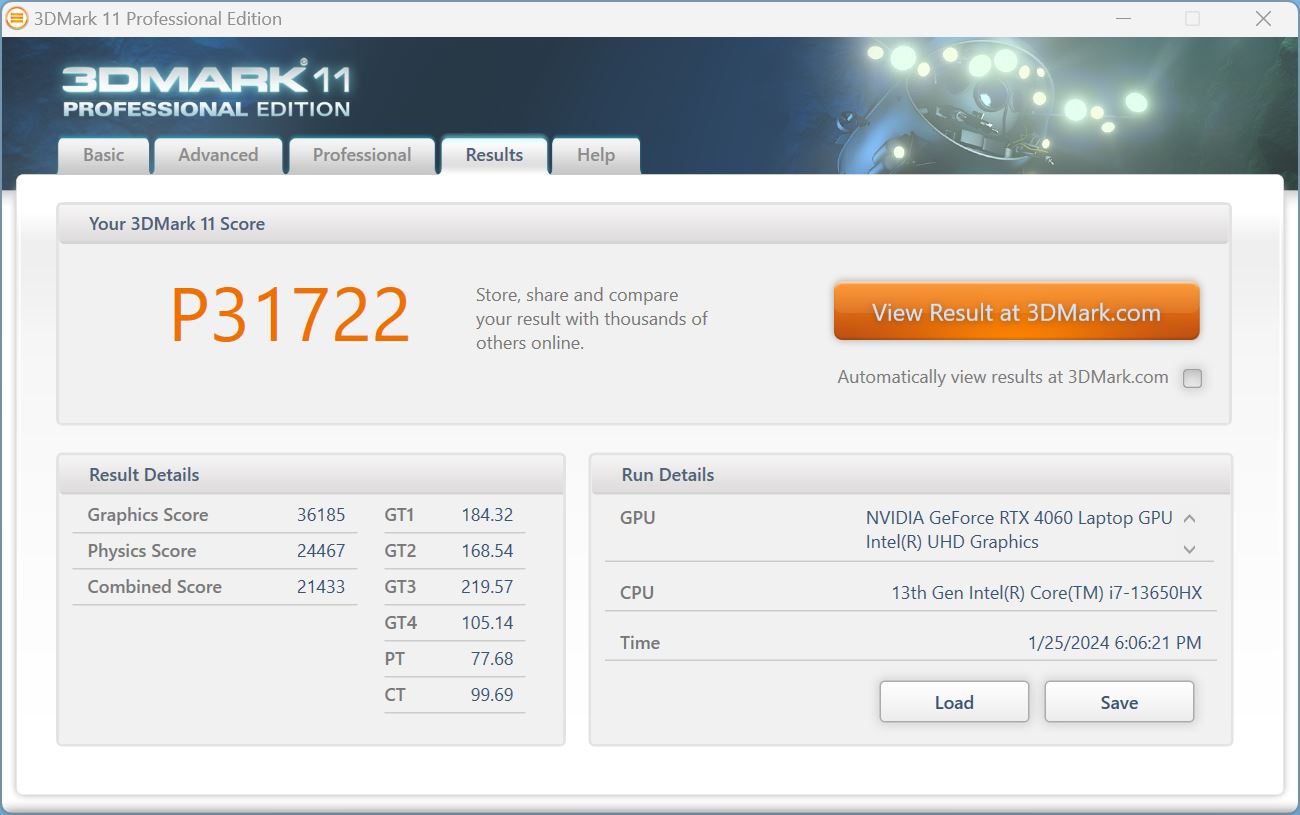
| 3DMark 11 Performance | 31722 pontos | |
| 3DMark Cloud Gate Standard Score | 62309 pontos | |
| 3DMark Fire Strike Score | 24764 pontos | |
| 3DMark Time Spy Score | 11135 pontos | |
Ajuda | ||
* ... menor é melhor
Desempenho em jogos
Quando ativamos o modo somente Nvidia-GPU para nossos benchmarks de jogos por meio do painel de controle, notamos que determinadas configurações (por exemplo, Full HD Ultra, Strange Brigade QHD) resultaram em taxas de quadros significativamente mais baixas do que no modo Optimus ou automático. Witcher 3 Full HD Ultra, Strange Brigade QHD) resultaram em taxas de quadros significativamente mais baixas do que no modo Optimus ou automático. Isso é bastante incomum e pode causar alguma frustração.
Por outro lado, não podemos nos queixar do desempenho do laptop em jogos. Em comparação, nosso G16 ficou cinco por cento atrás do MSI Raider com um i9-13950HX e uma RTX 4060mas o Alienware e Lenovo LOQ ficaram logo atrás.
Em última análise, todos os jogos atuais podem ser jogados em FHD usando as configurações Ultra a mais de 60 fps. Usando a resolução nativa de 1.600p, muitas vezes o senhor não conseguirá atingir nada acima de 60 fps, mas os jogos ainda são executados sem problemas a mais de 40 fps.
| Performance rating - Percent | |
| Média da turma Gaming | |
| MSI Raider GE68HX 13VF -1! | |
| Dell G16, i7-13650HX, RTX 4060 | |
| Lenovo LOQ 16IRH8 | |
| Alienware m16 R1 Intel -1! | |
| Dell G16 7620 | |
| Lenovo Legion Slim 5 16APH8 | |
| The Witcher 3 - 1920x1080 Ultra Graphics & Postprocessing (HBAO+) | |
| Média da turma Gaming (104.7 - 240, n=7, últimos 2 anos) | |
| Dell G16, i7-13650HX, RTX 4060 | |
| Alienware m16 R1 Intel | |
| Lenovo LOQ 16IRH8 | |
| MSI Raider GE68HX 13VF | |
| Lenovo Legion Slim 5 16APH8 | |
| Dell G16 7620 | |
| GTA V - 1920x1080 Highest AA:4xMSAA + FX AF:16x | |
| Média da turma Gaming (48.3 - 186.9, n=94, últimos 2 anos) | |
| Dell G16, i7-13650HX, RTX 4060 | |
| Lenovo LOQ 16IRH8 | |
| Dell G16 7620 | |
| Lenovo Legion Slim 5 16APH8 | |
| Final Fantasy XV Benchmark - 1920x1080 High Quality | |
| Média da turma Gaming (41 - 215, n=95, últimos 2 anos) | |
| Alienware m16 R1 Intel | |
| Dell G16, i7-13650HX, RTX 4060 | |
| MSI Raider GE68HX 13VF | |
| Lenovo LOQ 16IRH8 | |
| Lenovo Legion Slim 5 16APH8 | |
| Dell G16 7620 | |
| Strange Brigade - 1920x1080 ultra AA:ultra AF:16 | |
| Média da turma Gaming (76.3 - 458, n=87, últimos 2 anos) | |
| Dell G16, i7-13650HX, RTX 4060 | |
| MSI Raider GE68HX 13VF | |
| Alienware m16 R1 Intel | |
| Lenovo LOQ 16IRH8 | |
| Lenovo Legion Slim 5 16APH8 | |
| Dell G16 7620 | |
| Dota 2 Reborn - 1920x1080 ultra (3/3) best looking | |
| MSI Raider GE68HX 13VF | |
| Média da turma Gaming (84.8 - 252, n=108, últimos 2 anos) | |
| Alienware m16 R1 Intel | |
| Lenovo LOQ 16IRH8 | |
| Dell G16, i7-13650HX, RTX 4060 | |
| Dell G16 7620 | |
| Lenovo Legion Slim 5 16APH8 | |
| X-Plane 11.11 - 1920x1080 high (fps_test=3) | |
| MSI Raider GE68HX 13VF | |
| Alienware m16 R1 Intel | |
| Dell G16, i7-13650HX, RTX 4060 | |
| Lenovo LOQ 16IRH8 | |
| Dell G16 7620 | |
| Média da turma Gaming (55.5 - 148.5, n=110, últimos 2 anos) | |
| Lenovo Legion Slim 5 16APH8 | |
No Witcher 3 Ultra, nosso G16 apresentou seu melhor desempenho e superou as taxas de quadros da concorrência, de ligeiramente (Alienware) a consideravelmente (Legion Slim 5, GPU automática).
A tabela a seguir lista os valores de fps do Witcher 3 (FHD Ultra), bem como nossas medições de emissão de ruído e consumo, dependendo dos três modos de desempenho.
| Modo/valor de desempenho | fps inicial | fps médio | emissões de ruído | consumo |
|---|---|---|---|---|
| Desempenho | 108 | 105,6 | 47,89 dB | 185 watts |
| Equilibrado | 100 | 97,6 | 39 - 43 dB | 178 watts |
| Silencioso | 99 | 97,6 | 35,52 dB | 168 watts |
Witcher 3 FPS diagram
| baixo | média | alto | ultra | QHD | 4K | |
|---|---|---|---|---|---|---|
| GTA V (2015) | 185.8 | 183.2 | 176.2 | 117.4 | 50.8 | |
| The Witcher 3 (2015) | 340.4 | 193.1 | 110 | 108 | 42.4 | |
| Dota 2 Reborn (2015) | 177 | 168.7 | 160.8 | 149 | 126.2 | |
| Final Fantasy XV Benchmark (2018) | 219 | 150.1 | 103.7 | 75.9 | ||
| X-Plane 11.11 (2018) | 160.4 | 144.6 | 114.9 | 119.6 | ||
| Far Cry 5 (2018) | 176 | 148 | 141 | 135 | 105 | |
| Strange Brigade (2018) | 478 | 291 | 228 | 194.9 | 129 | |
| Cyberpunk 2077 (2023) | 131.1 | 75.6 | 69.8 | 45.6 |
Emissões - Bastante silencioso, mesmo em jogos
Emissões de ruído
No modo inativo, as ventoinhas estão desligadas ao usar todos os modos, exceto o desempenho. No 3DMark06, nosso cenário de carga média, o laptop tem as mesmas emissões de ruído que no modo inativo( modode desempenho, aprox. 28 dB), portanto as ventoinhas não giram mais rápido.
Mesmo em jogos e sob carga total, o Dell G16 permanece visivelmente mais silencioso do que a concorrência, bem abaixo de 50 dB, o que parece ser o ponto em que seu enorme sistema de resfriamento compensa.
Barulho
| Ocioso |
| 23 / 23 / 27.96 dB |
| Carga |
| 27.96 / 47.89 dB |
 | ||
30 dB silencioso 40 dB(A) audível 50 dB(A) ruidosamente alto |
||
min: | ||
| Dell G16, i7-13650HX, RTX 4060 GeForce RTX 4060 Laptop GPU, i7-13650HX, WD PC SN740 SDDPNQD-1T00 | Dell G16 7620 GeForce RTX 3060 Laptop GPU, i7-12700H, WDC PC SN810 512GB | MSI Raider GE68HX 13VF GeForce RTX 4060 Laptop GPU, i9-13950HX, Samsung PM9B1 1024GB MZVL41T0HBLB | Lenovo Legion Slim 5 16APH8 GeForce RTX 4060 Laptop GPU, R7 7840HS, SK hynix PC801 HFS512GEJ9X115N | Alienware m16 R1 Intel GeForce RTX 4060 Laptop GPU, i7-13700HX, Kioxia KXG70ZNV512G | Lenovo LOQ 16IRH8 GeForce RTX 4060 Laptop GPU, i7-13620H, Solidigm SSDPFINW512GZL | |
|---|---|---|---|---|---|---|
| Noise | -10% | -26% | -6% | -19% | -16% | |
| desligado / ambiente * (dB) | 23 | 23.2 -1% | 23.3 -1% | 22.9 -0% | 25 -9% | 23 -0% |
| Idle Minimum * (dB) | 23 | 28.3 -23% | 25 -9% | 23.1 -0% | 25 -9% | 23 -0% |
| Idle Average * (dB) | 23 | 28.8 -25% | 31.3 -36% | 23.1 -0% | 26 -13% | 23 -0% |
| Idle Maximum * (dB) | 27.96 | 28.9 -3% | 37.5 -34% | 27.7 1% | 27 3% | 27.66 1% |
| Load Average * (dB) | 27.96 | 32.4 -16% | 44 -57% | 33.3 -19% | 52 -86% | 53.62 -92% |
| Witcher 3 ultra * (dB) | 47.89 | 48.3 -1% | 57 -19% | 54 -13% | 51 -6% | 53.5 -12% |
| Load Maximum * (dB) | 47.89 | 48.1 -0% | 60.1 -25% | 54 -13% | 53 -11% | 53.5 -12% |
* ... menor é melhor
Temperatura
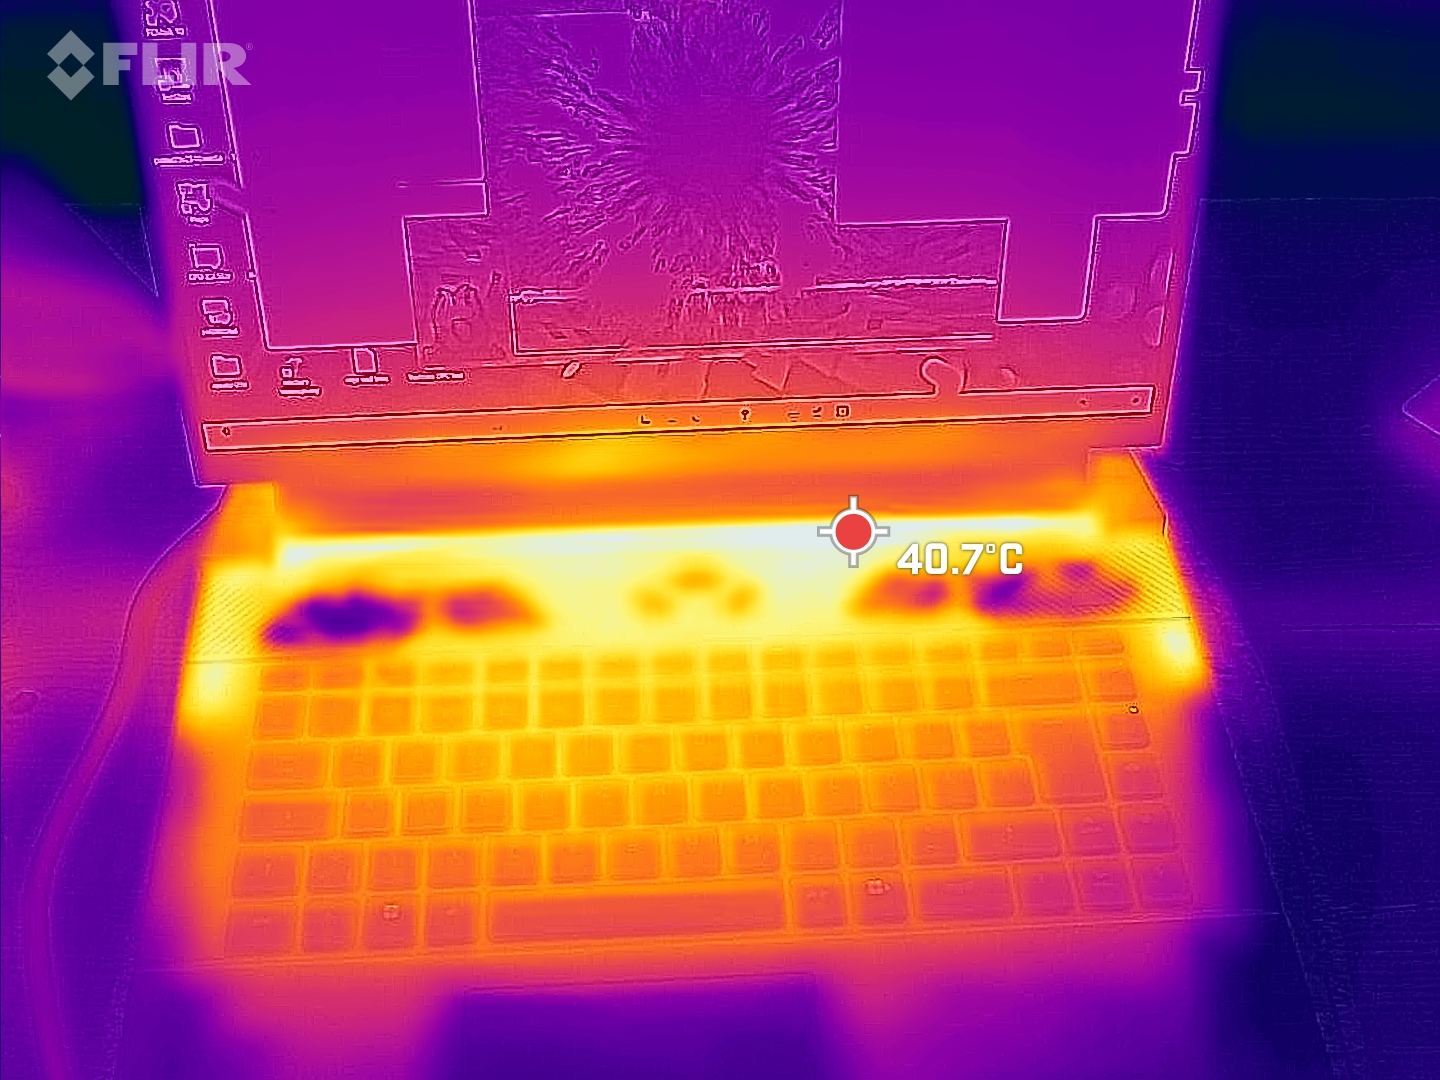
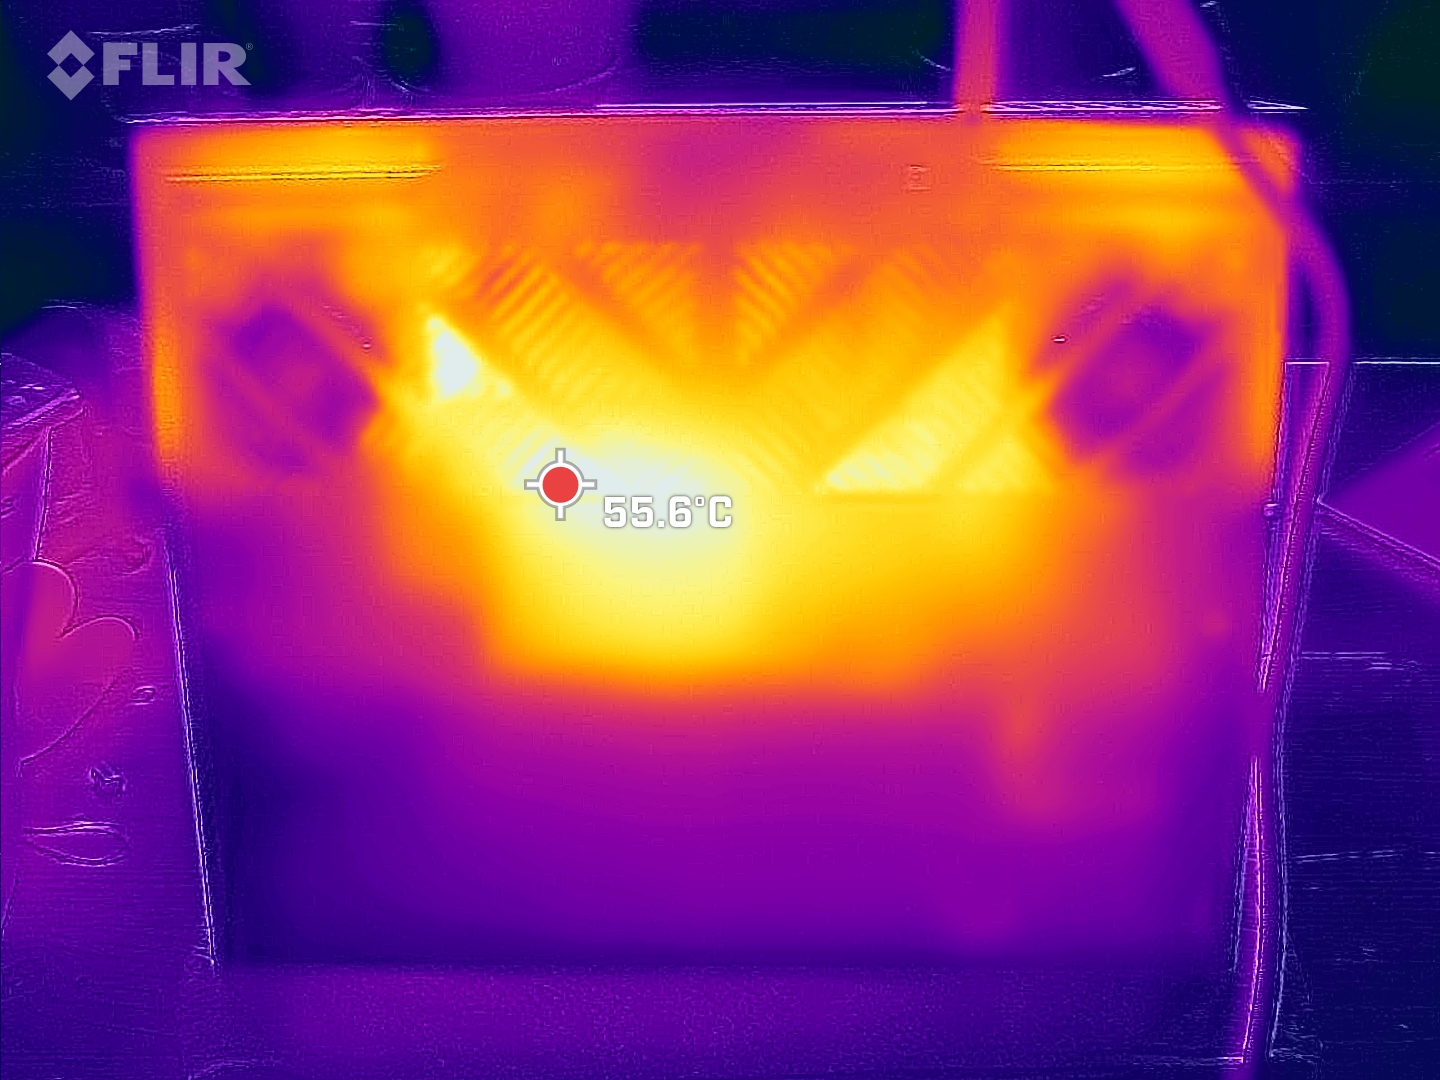
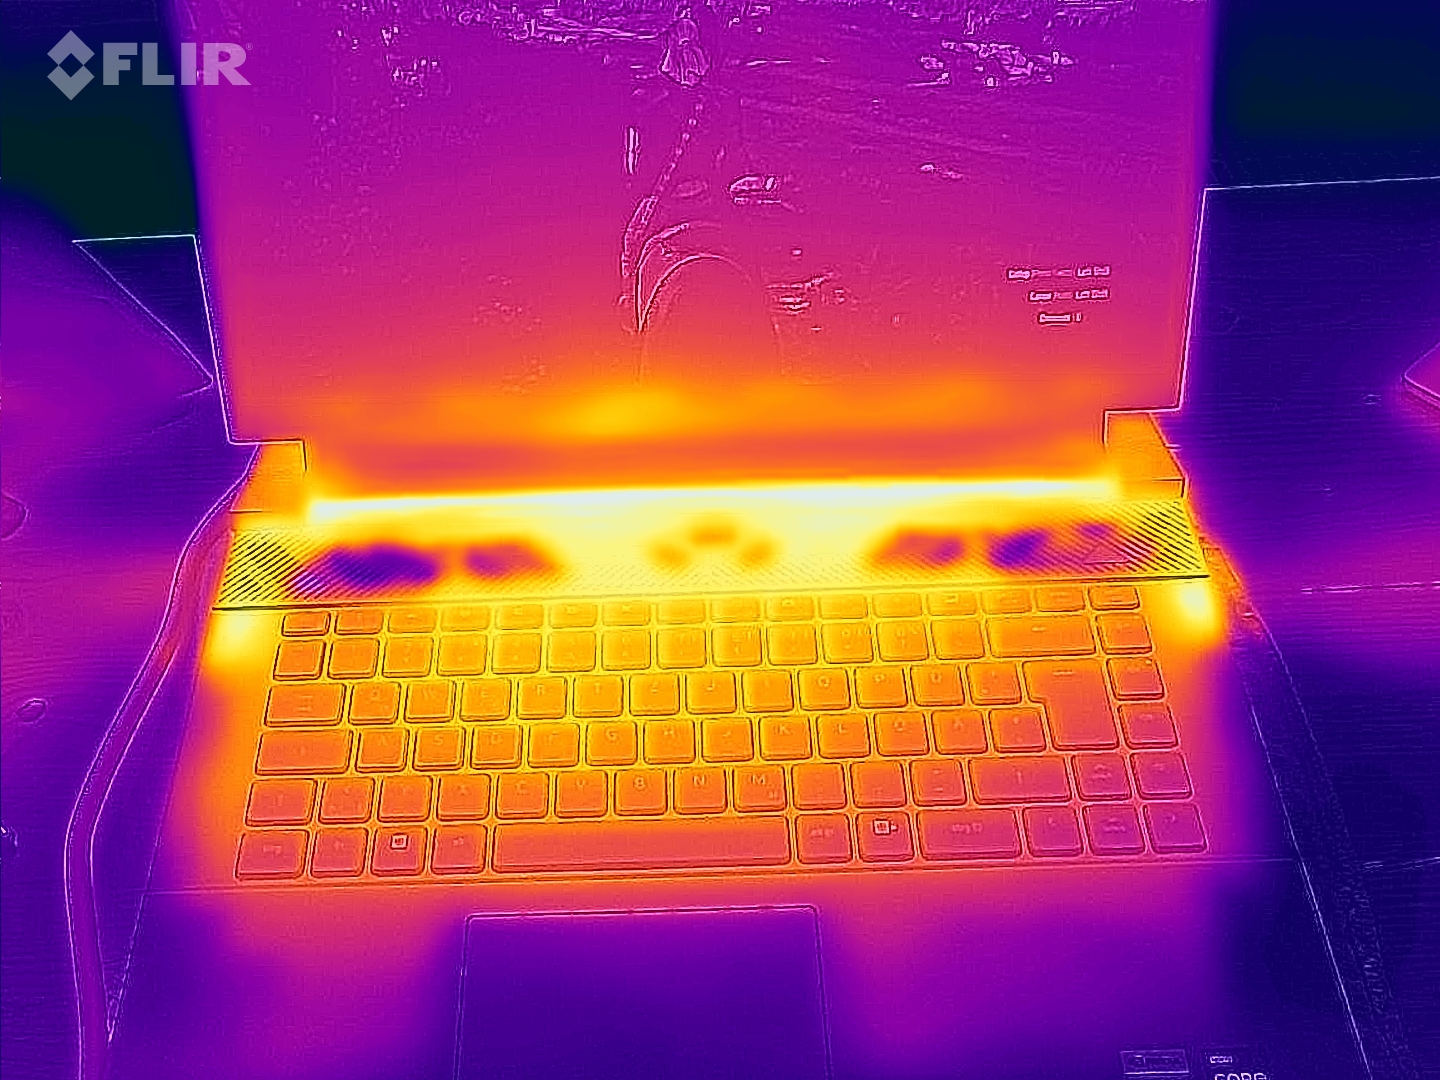
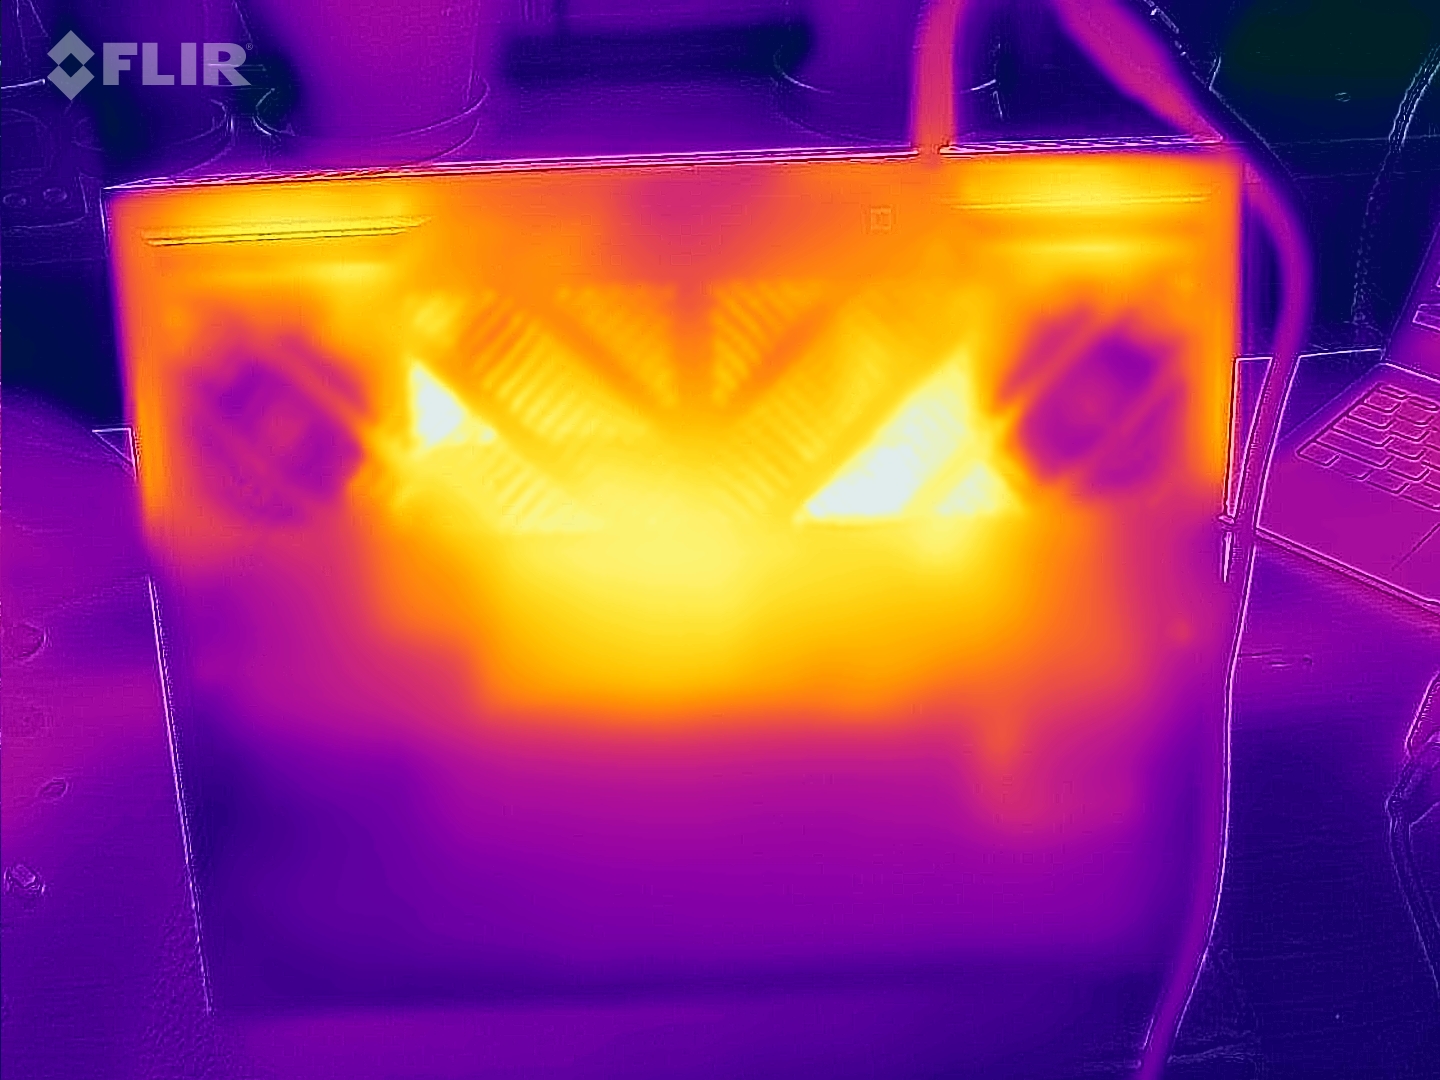
Entretanto, as emissões de ruído comparativamente baixas do dispositivo também apresentam algumas pequenas desvantagens. A superfície do G16 tende a se aquecer mais do que a de seus concorrentes. Medimos pontos quentes de até 58 °C na parte inferior sob carga máxima! Somente o Lenovo LOQ 16 e o antecessor do G16 ficam igualmente quentes, enquanto os outros dispositivos de comparação ficam logo abaixo de 50 °C. Pelo menos os apoios para as mãos estão sempre frios, e a área ao redor das teclas WASD também permanece dentro de uma faixa aceitável.
(-) A temperatura máxima no lado superior é 49 °C / 120 F, em comparação com a média de 40.4 °C / 105 F , variando de 21.2 a 68.8 °C para a classe Gaming.
(-) A parte inferior aquece até um máximo de 58 °C / 136 F, em comparação com a média de 43.2 °C / 110 F
(+) Em uso inativo, a temperatura média para o lado superior é 30 °C / 86 F, em comparação com a média do dispositivo de 33.9 °C / ### class_avg_f### F.
(±) Jogando The Witcher 3, a temperatura média para o lado superior é 34.4 °C / 94 F, em comparação com a média do dispositivo de 33.9 °C / ## #class_avg_f### F.
(+) Os apoios para as mãos e o touchpad são mais frios que a temperatura da pele, com um máximo de 25 °C / 77 F e, portanto, são frios ao toque.
(+) A temperatura média da área do apoio para as mãos de dispositivos semelhantes foi 28.8 °C / 83.8 F (+3.8 °C / 6.8 F).
| Dell G16, i7-13650HX, RTX 4060 Intel Core i7-13650HX, NVIDIA GeForce RTX 4060 Laptop GPU | Dell G16 7620 Intel Core i7-12700H, NVIDIA GeForce RTX 3060 Laptop GPU | MSI Raider GE68HX 13VF Intel Core i9-13950HX, NVIDIA GeForce RTX 4060 Laptop GPU | Lenovo Legion Slim 5 16APH8 AMD Ryzen 7 7840HS, NVIDIA GeForce RTX 4060 Laptop GPU | Alienware m16 R1 Intel Intel Core i7-13700HX, NVIDIA GeForce RTX 4060 Laptop GPU | Lenovo LOQ 16IRH8 Intel Core i7-13620H, NVIDIA GeForce RTX 4060 Laptop GPU | |
|---|---|---|---|---|---|---|
| Heat | 19% | 16% | 23% | -2% | 10% | |
| Maximum Upper Side * (°C) | 49 | 47.6 3% | 41.4 16% | 40.6 17% | 49 -0% | 48 2% |
| Maximum Bottom * (°C) | 58 | 54 7% | 45.4 22% | 42 28% | 48 17% | 59 -2% |
| Idle Upper Side * (°C) | 35 | 23 34% | 29.8 15% | 27.8 21% | 40 -14% | 28 20% |
| Idle Bottom * (°C) | 35 | 24.6 30% | 31.4 10% | 26.6 24% | 39 -11% | 28 20% |
* ... menor é melhor
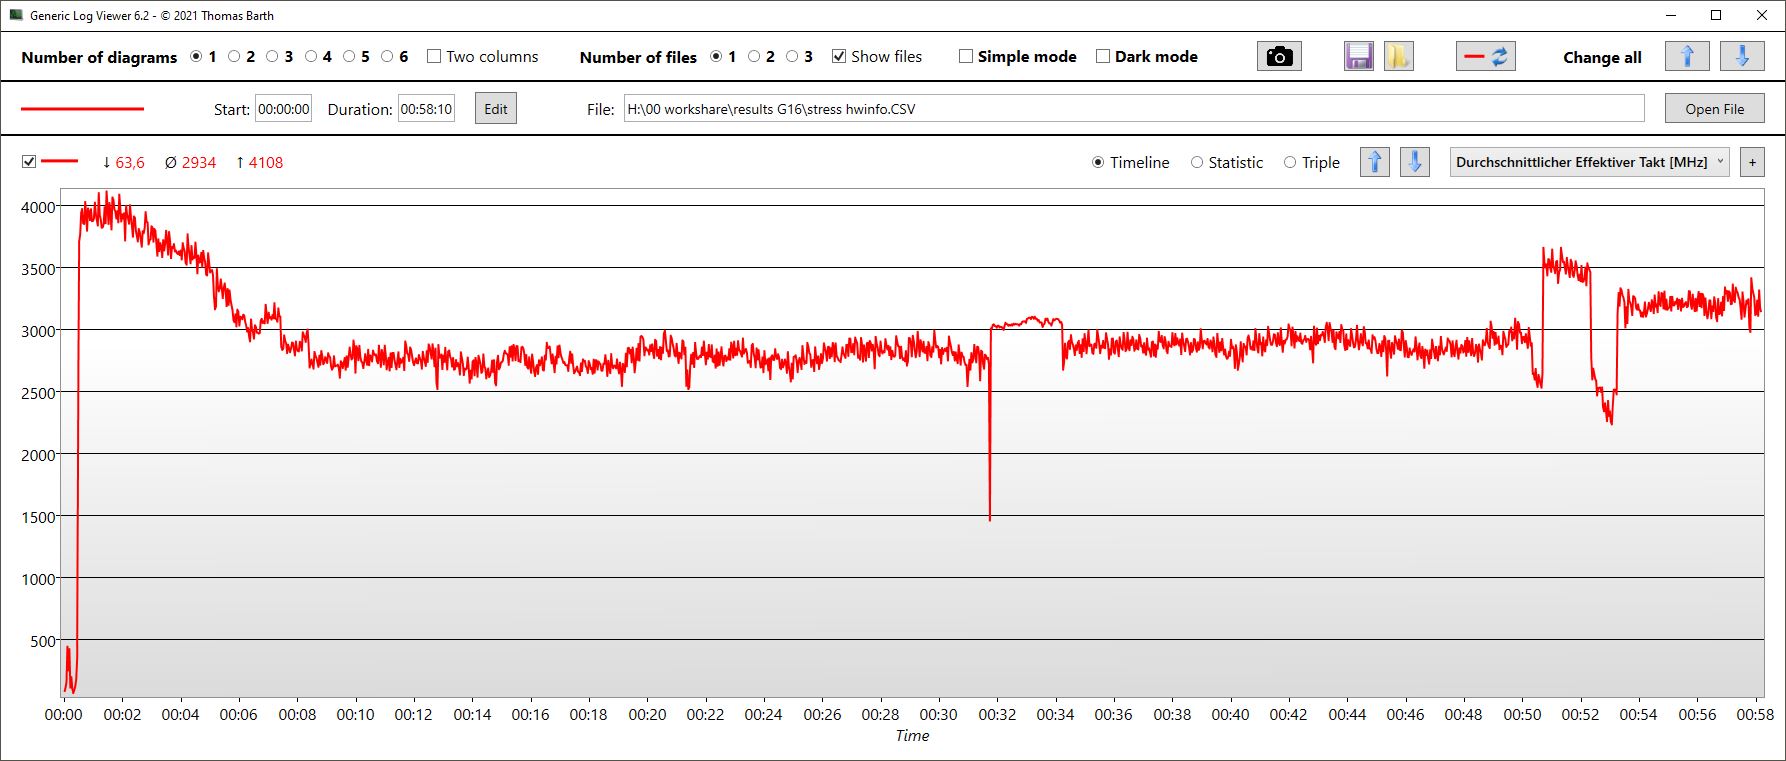
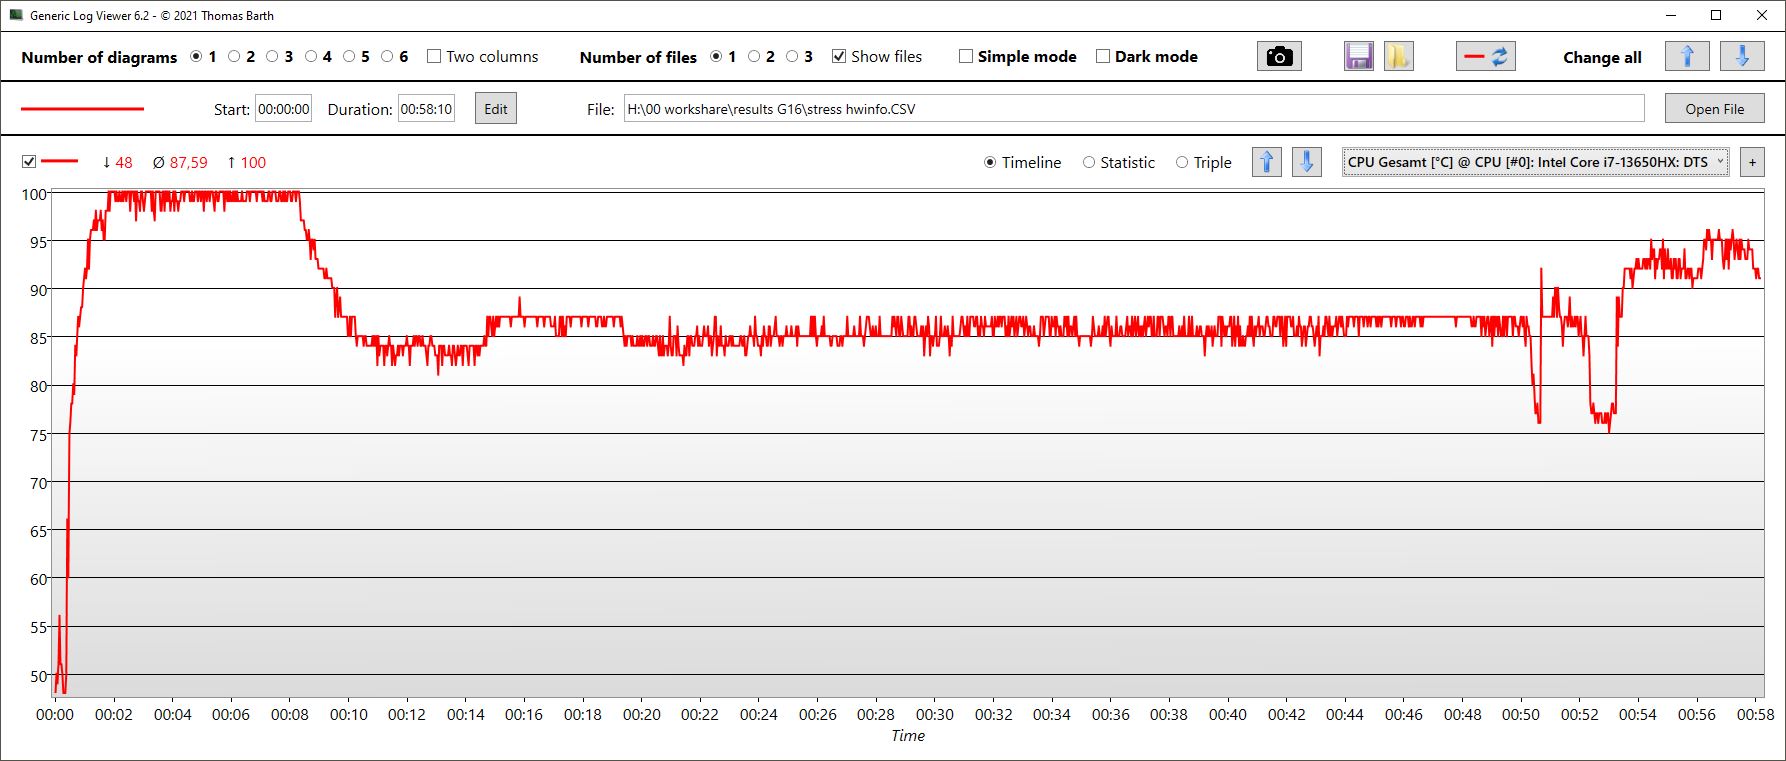
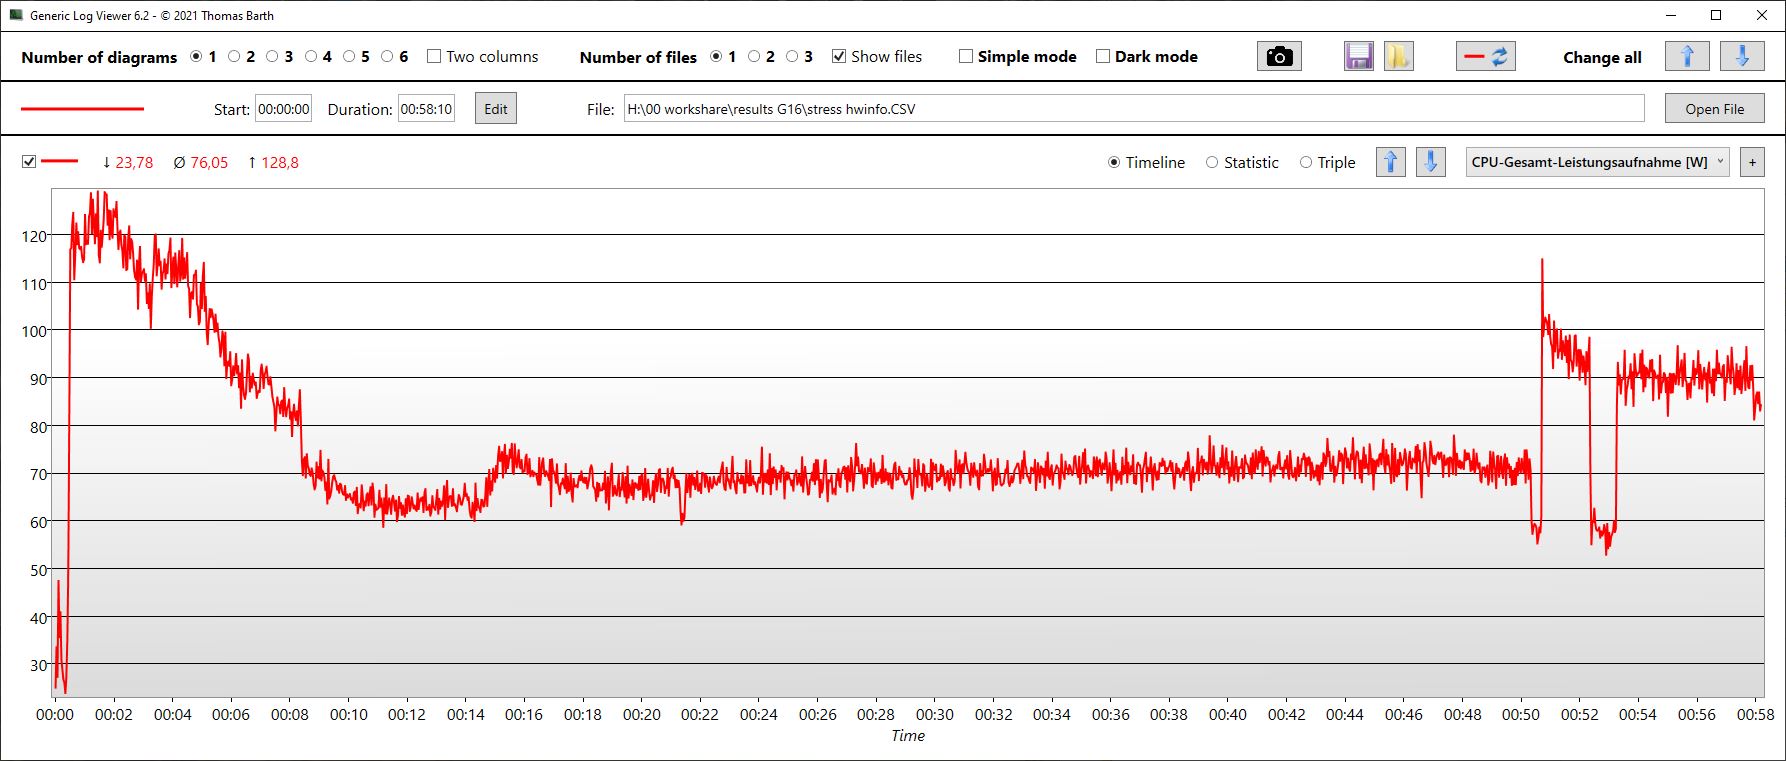
Teste de estresse
Durante o teste de estresse, os núcleos atingiram brevemente o clock de até 4,1 GHz. Infelizmente, isso fez com que a CPU esquentasse até 100 °C, o que fez com que o consumo de energia do dispositivo caísse dos 128 watts originais e se estabilizasse em cerca de 70 watts. A taxa de clock da CPU se estabilizou em cerca de 2,9 GHz e as temperaturas em cerca de 85 °C.
Em contrapartida, as taxas de clock da GPU permaneceram bastante estáveis em torno de 2,4 a 2,5 GHz durante todo o tempo de execução. O mesmo se aplica ao clock da memória (2 GHz). A temperatura do chip se estabilizou em cerca de 72 °C e o consumo médio de energia foi de 71 watts.
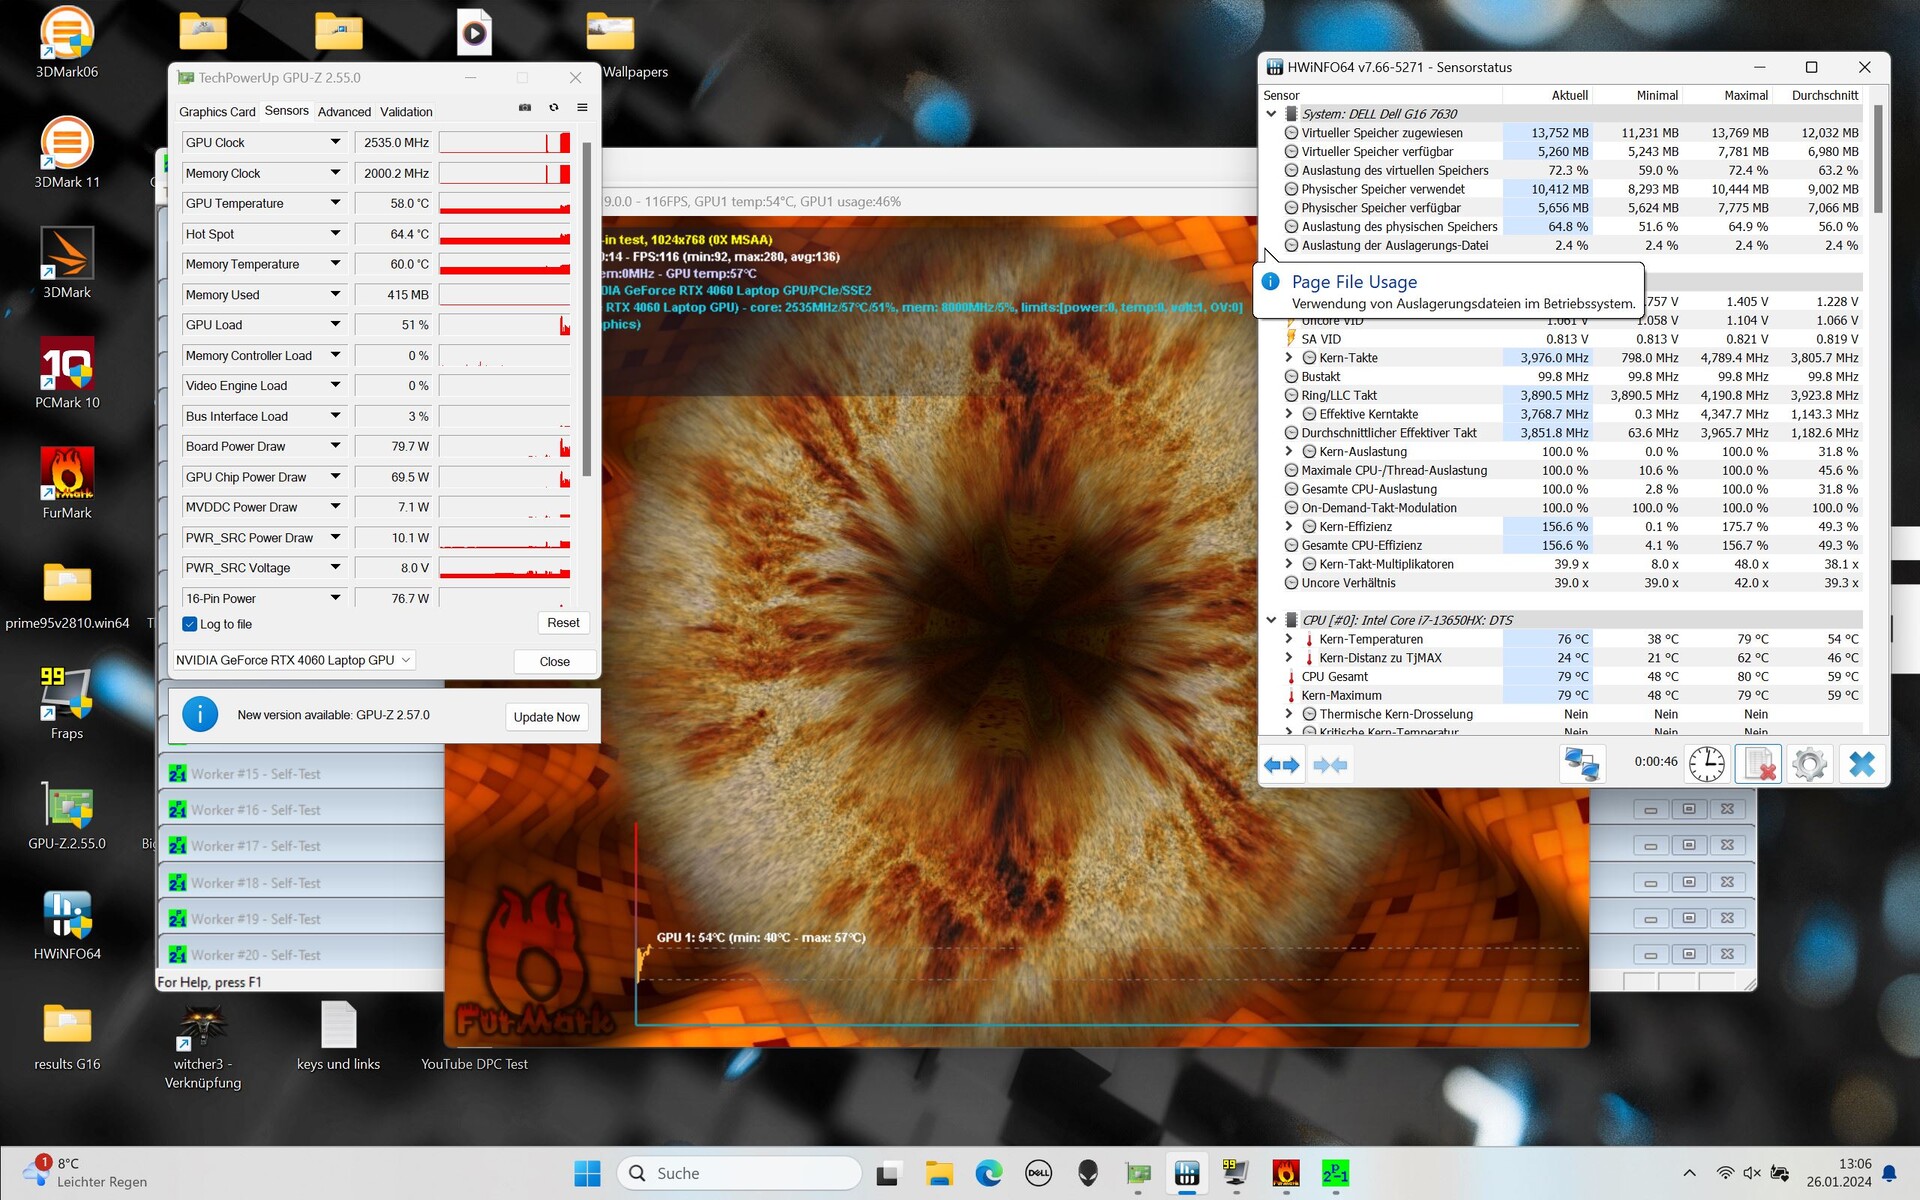
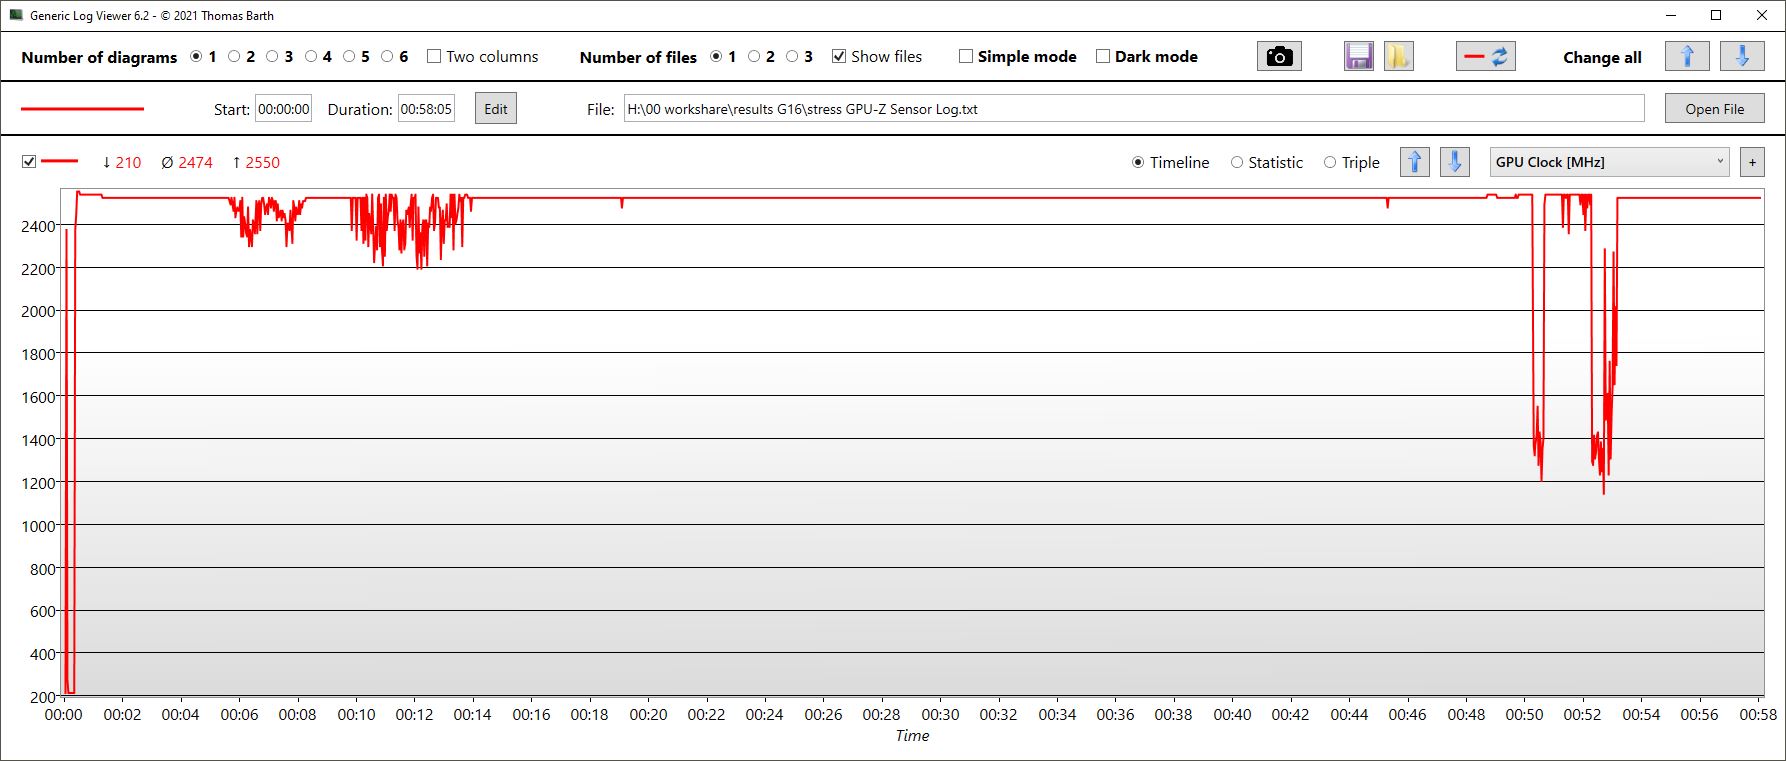
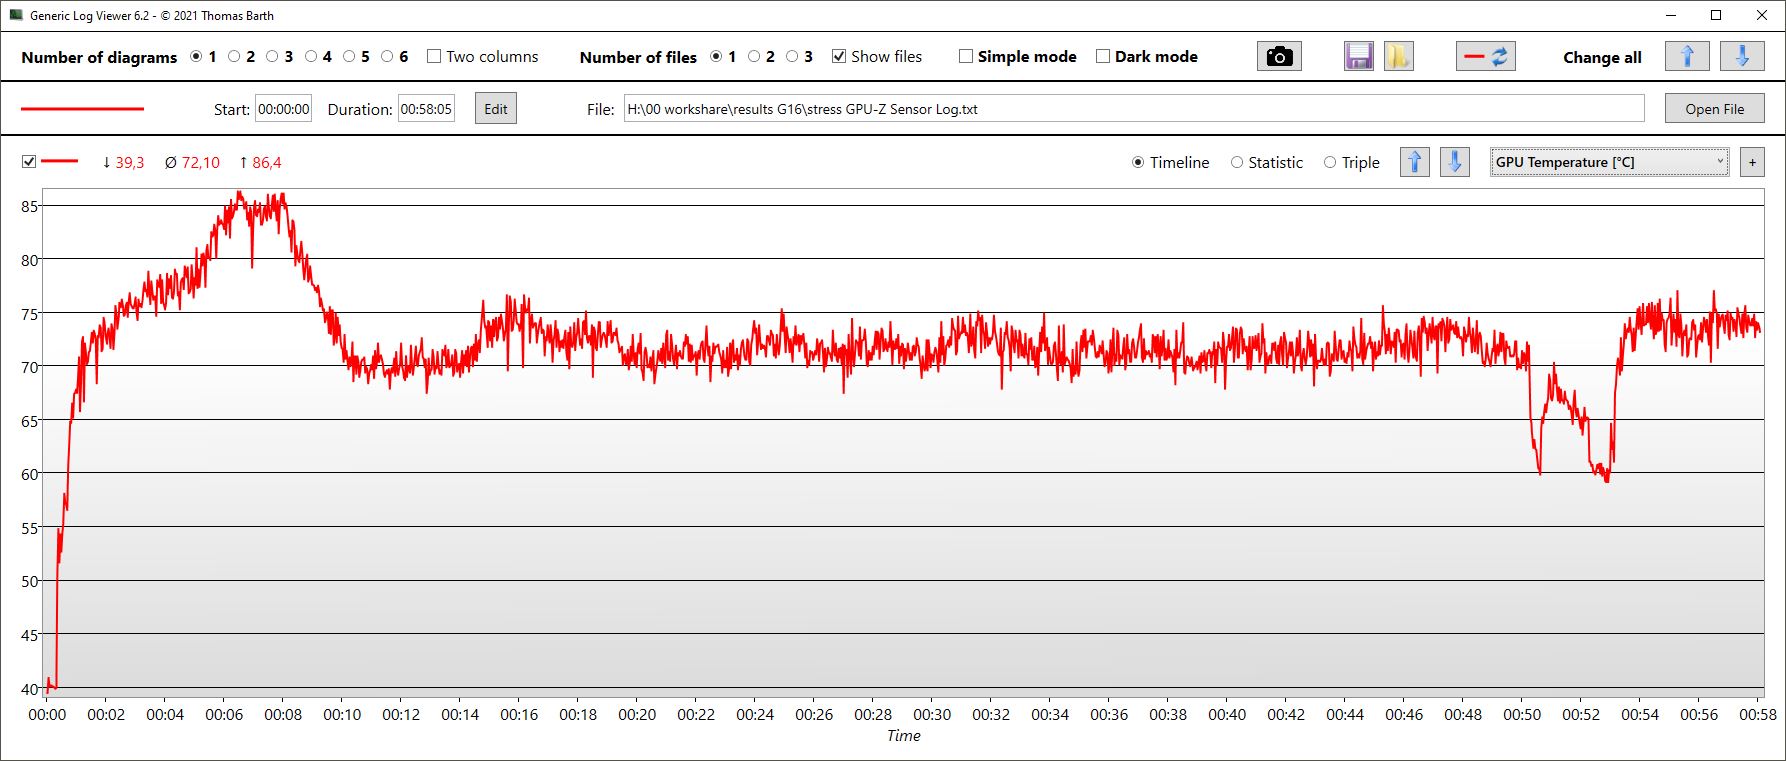
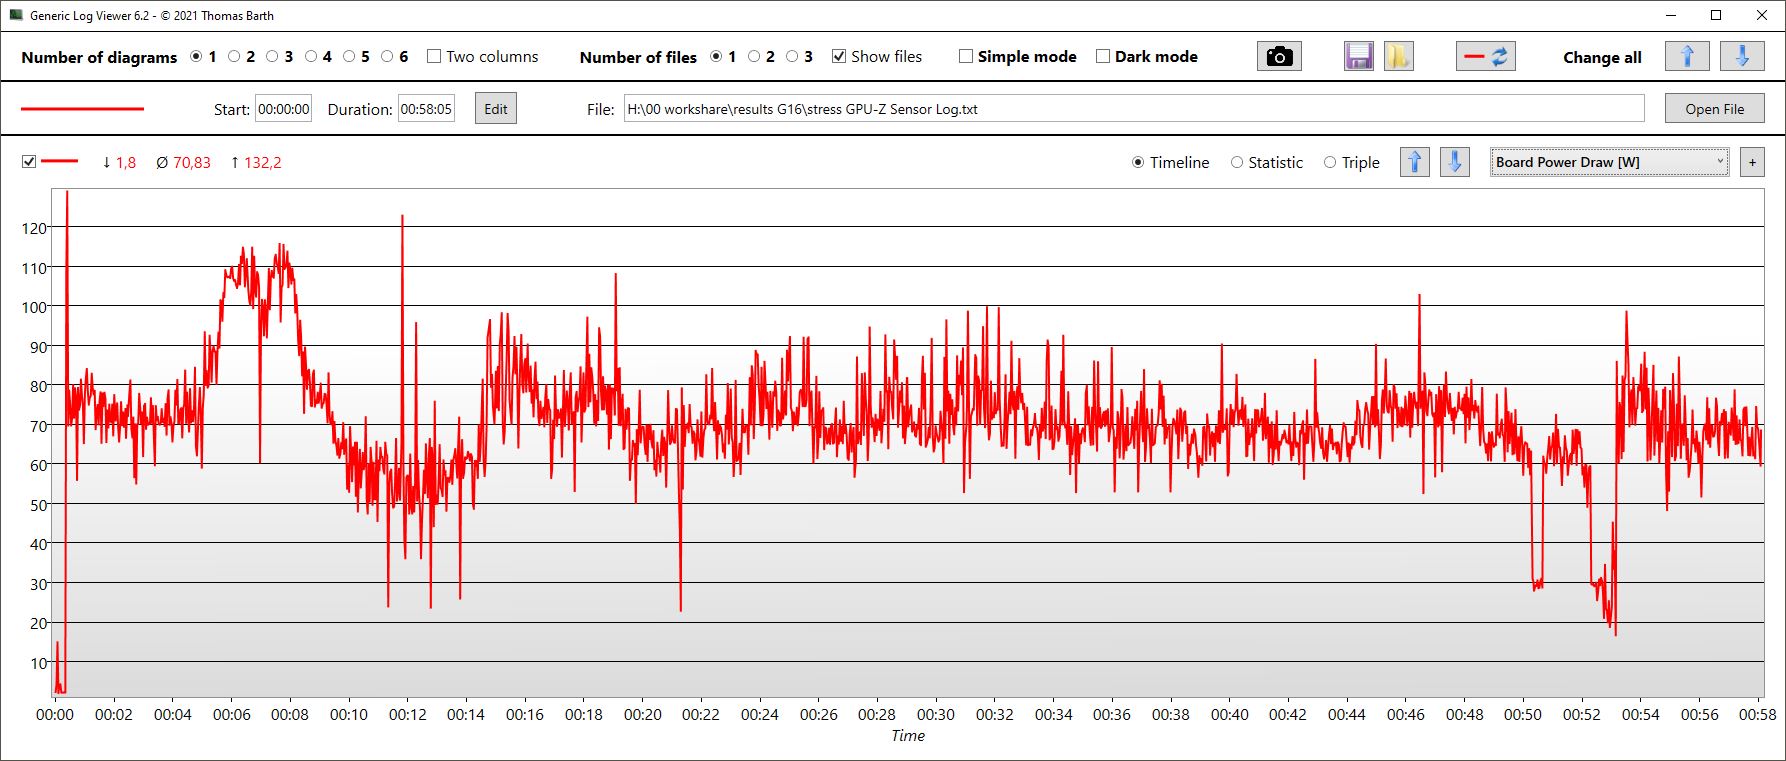
| Clock da CPU (GHz) | Clock da GPU (MHz) | Temperatura média da CPU (°C) | Temperatura média da GPU (°C) | |
| Prime95 + FurMark Stress | 2.9 | 2.490 | 85 | 72 |
| Witcher 3 Estresse | 0,538 | 2.500 | 81 | 73 |
Alto-falantes
Os alto-falantes estéreo do laptop não são os melhores: Quase não há graves, eles tendem a ser muito silenciosos e mesmo os médios e agudos não são muito equilibrados ou lineares. Apenas uma conexão de fone de ouvido de 3,5 mm está disponível como conexão de áudio analógica.
Dell G16, i7-13650HX, RTX 4060 análise de áudio
(±) | o volume do alto-falante é médio, mas bom (###valor### dB)
Graves 100 - 315Hz
(-) | quase nenhum baixo - em média 25.1% menor que a mediana
(-) | graves não são lineares (18.9% delta para frequência anterior)
Médios 400 - 2.000 Hz
(±) | médios mais altos - em média 8% maior que a mediana
(+) | médios são lineares (5.9% delta para frequência anterior)
Altos 2 - 16 kHz
(+) | agudos equilibrados - apenas 3.5% longe da mediana
(±) | a linearidade dos máximos é média (8.6% delta para frequência anterior)
Geral 100 - 16.000 Hz
(±) | a linearidade do som geral é média (23.4% diferença em relação à mediana)
Comparado com a mesma classe
» 85% de todos os dispositivos testados nesta classe foram melhores, 5% semelhantes, 11% piores
» O melhor teve um delta de 6%, a média foi 18%, o pior foi 132%
Comparado com todos os dispositivos testados
» 70% de todos os dispositivos testados foram melhores, 6% semelhantes, 24% piores
» O melhor teve um delta de 4%, a média foi 23%, o pior foi 134%
Apple MacBook Pro 16 2021 M1 Pro análise de áudio
(+) | os alto-falantes podem tocar relativamente alto (###valor### dB)
Graves 100 - 315Hz
(+) | bons graves - apenas 3.8% longe da mediana
(+) | o baixo é linear (5.2% delta para a frequência anterior)
Médios 400 - 2.000 Hz
(+) | médios equilibrados - apenas 1.3% longe da mediana
(+) | médios são lineares (2.1% delta para frequência anterior)
Altos 2 - 16 kHz
(+) | agudos equilibrados - apenas 1.9% longe da mediana
(+) | os máximos são lineares (2.7% delta da frequência anterior)
Geral 100 - 16.000 Hz
(+) | o som geral é linear (4.6% diferença em relação à mediana)
Comparado com a mesma classe
» 0% de todos os dispositivos testados nesta classe foram melhores, 0% semelhantes, 100% piores
» O melhor teve um delta de 5%, a média foi 17%, o pior foi 45%
Comparado com todos os dispositivos testados
» 0% de todos os dispositivos testados foram melhores, 0% semelhantes, 100% piores
» O melhor teve um delta de 4%, a média foi 23%, o pior foi 134%
Gerenciamento de energia - O Dell G16 alcança resultados médios na classe
Consumo de energia
Em comparação com seu desempenho, o consumo do G16 é mais do que aceitável. No geral, o dispositivo se tornou ainda mais eficiente. Agora ele consome menos do que seu antecessor, especialmente quando está ocioso. Ao jogar, ele consome apenas cerca de 5% a mais, com um aumento simultâneo no desempenho de cerca de 14%.
Nos jogos, o Alienware e o MSI Raider, igualmente rápidos, consomem quase a mesma quantidade, ou seja, uma média de 185 watts ao jogar The Witcher 3. Seu consumo máximo de curto prazo é de 255 watts.
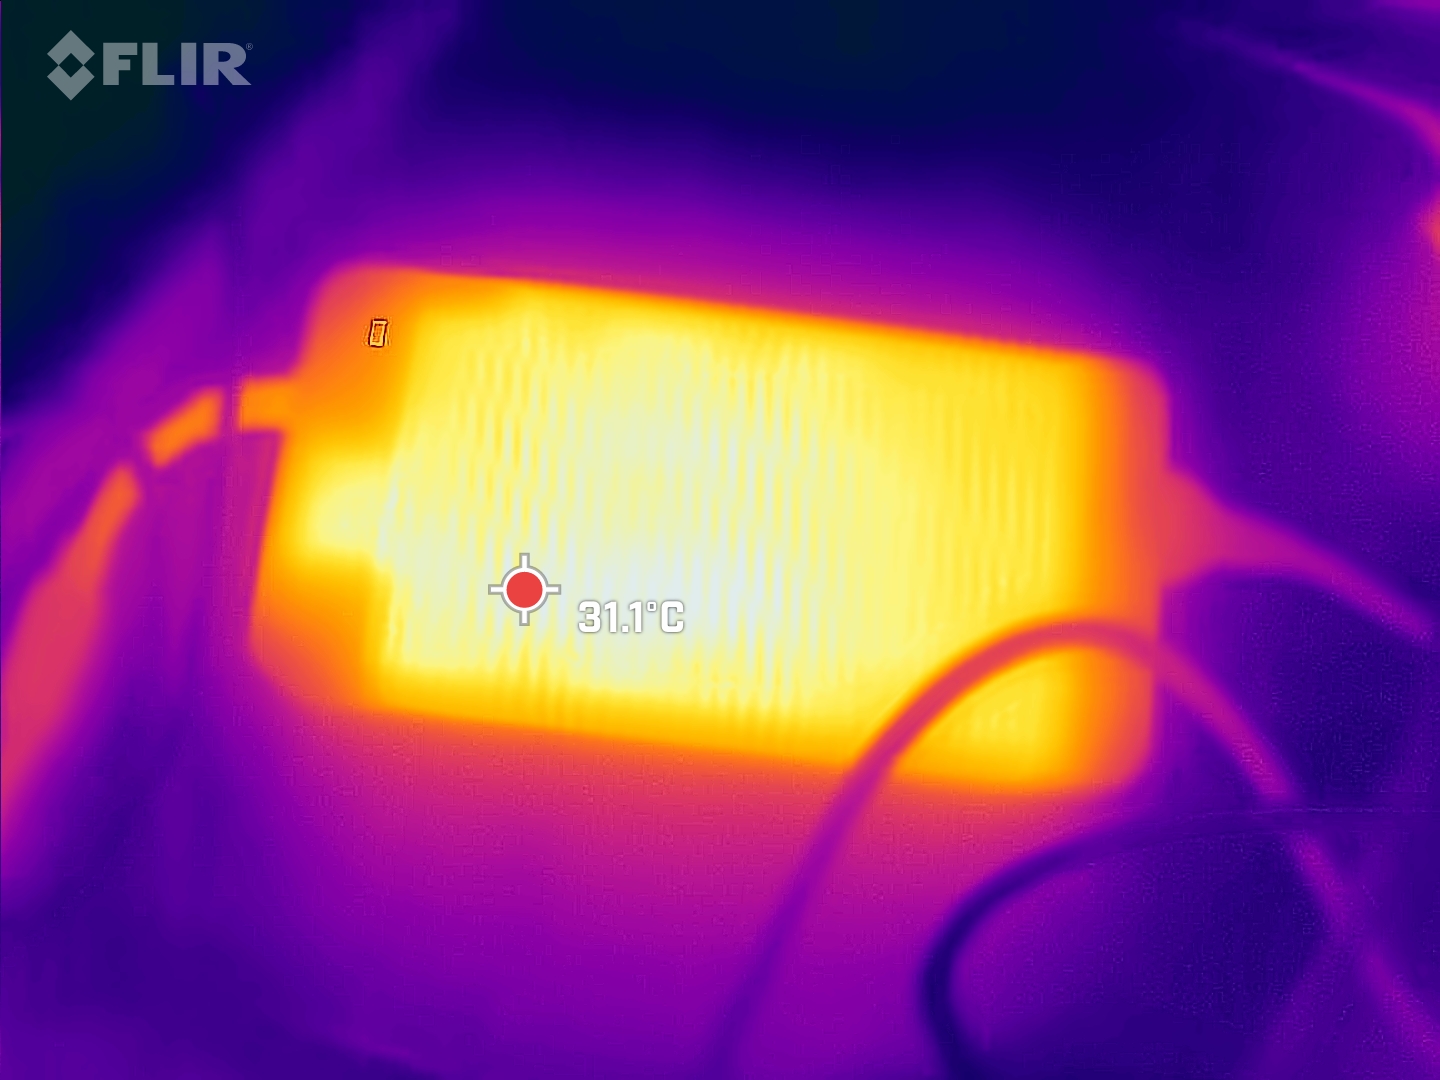
Com isso em mente, é muito surpreendente que a Dell tenha incluído uma fonte de alimentação enorme, desajeitada e pesada de 330 watts com o G16 com um RTX 4060. Isso é completamente superdimensionado para o hardware instalado. Presumivelmente, a Dell simplesmente envia a mesma fonte de alimentação com todas as configurações para que ela também seja equipada para o i9-13900HX e a RTX 4070. Uma fonte de alimentação menor e mais leve teria sido mais conveniente para os clientes que compraram esse modelo.
| desligado | |
| Ocioso | |
| Carga |
|
Key:
min: | |
| Dell G16, i7-13650HX, RTX 4060 i7-13650HX, GeForce RTX 4060 Laptop GPU, WD PC SN740 SDDPNQD-1T00, IPS, 2560x1600, 16" | Dell G16 7620 i7-12700H, GeForce RTX 3060 Laptop GPU, WDC PC SN810 512GB, IPS, 2560x1600, 16" | MSI Raider GE68HX 13VF i9-13950HX, GeForce RTX 4060 Laptop GPU, Samsung PM9B1 1024GB MZVL41T0HBLB, IPS, 1900x1200, 16" | Lenovo Legion Slim 5 16APH8 R7 7840HS, GeForce RTX 4060 Laptop GPU, SK hynix PC801 HFS512GEJ9X115N, IPS, 2560x1600, 16" | Alienware m16 R1 Intel i7-13700HX, GeForce RTX 4060 Laptop GPU, Kioxia KXG70ZNV512G, IPS, 2560x1600, 16" | Lenovo LOQ 16IRH8 i7-13620H, GeForce RTX 4060 Laptop GPU, Solidigm SSDPFINW512GZL, IPS, 2560x1600, 16" | Média NVIDIA GeForce RTX 4060 Laptop GPU | Média da turma Gaming | |
|---|---|---|---|---|---|---|---|---|
| Power Consumption | -21% | -32% | 9% | -9% | -12% | -1% | -20% | |
| Idle Minimum * (Watt) | 11 | 14.4 -31% | 15.8 -44% | 9.4 15% | 10 9% | 17.2 -56% | 11.5 ? -5% | 13 ? -18% |
| Idle Average * (Watt) | 14.8 | 17.8 -20% | 19.4 -31% | 15.5 -5% | 14 5% | 19.3 -30% | 16 ? -8% | 19 ? -28% |
| Idle Maximum * (Watt) | 16.8 | 31.5 -88% | 27.3 -63% | 24.4 -45% | 21 -25% | 21.2 -26% | 20.3 ? -21% | 24.5 ? -46% |
| Load Average * (Watt) | 103.7 | 101.2 2% | 114.7 -11% | 74.1 29% | 119 -15% | 90 13% | 92.9 ? 10% | 111.1 ? -7% |
| Witcher 3 ultra * (Watt) | 185 | 176.9 4% | 185.5 -0% | 112.9 39% | 186.7 -1% | 168 9% | ||
| Load Maximum * (Watt) | 255 | 242.9 5% | 364.2 -43% | 206.5 19% | 323 -27% | 211 17% | 210 ? 18% | 260 ? -2% |
* ... menor é melhor
Power consumption Witcher 3 / stress test
Power consumption with external monitor
Tempos de execução
A Dell instalou uma bateria de 86 Wh no laptop. A concorrência é equipada de forma semelhante. Isso é suficiente para que o G16 alcance tempos de execução de cerca de 5,5 horas (brilho máximo) a quase 6,5 horas (150 nits) ao navegar na web ou assistir a vídeos. Isso faz com que o Dell gamer esteja na média da categoria.
| Dell G16, i7-13650HX, RTX 4060 i7-13650HX, GeForce RTX 4060 Laptop GPU, 86 Wh | Dell G16 7620 i7-12700H, GeForce RTX 3060 Laptop GPU, 84 Wh | MSI Raider GE68HX 13VF i9-13950HX, GeForce RTX 4060 Laptop GPU, 99.9 Wh | Lenovo Legion Slim 5 16APH8 R7 7840HS, GeForce RTX 4060 Laptop GPU, 80 Wh | Alienware m16 R1 Intel i7-13700HX, GeForce RTX 4060 Laptop GPU, 86 Wh | Lenovo LOQ 16IRH8 i7-13620H, GeForce RTX 4060 Laptop GPU, 80 Wh | Média da turma Gaming | |
|---|---|---|---|---|---|---|---|
| Duração da bateria | -34% | 23% | 3% | -20% | 5% | 20% | |
| H.264 (h) | 6.4 | 5.6 -13% | 6.4 0% | 8.32 ? 30% | |||
| WiFi v1.3 (h) | 6.3 | 5 -21% | 6.8 8% | 7.1 13% | 4.8 -24% | 6.3 0% | 7.11 ? 13% |
| Load (h) | 1.3 | 0.7 -46% | 1.8 38% | 1.2 -8% | 1 -23% | 1.5 15% | 1.502 ? 16% |
| Reader / Idle (h) | 7.1 | 8.8 | 11.7 | 6.4 | 8.27 ? |
Pro
Contra
Veredicto - Alternativa acessível à Alienware com alguns pequenos problemas
O Dell G16 7630 parece um pouco mais elegante e mais econômico do que a série Alienware da Dell. Seu desempenho ainda é bom e um aspecto muito positivo é o silêncio que o jogador mantém enquanto joga, em comparação com muitos concorrentes.
A Dell fez algumas economias quando se trata da webcam e da construção em especial, o que provavelmente é suportável para os clientes com um orçamento apertado, mas ainda assim irritante às vezes: Os exemplos incluem a conexão de energia do laptop que escorrega pouco a pouco quando o dispositivo se move, sua fonte de alimentação volumosa e pesada ou o fato de que somente a versão com um processador i9-13900HX e uma RTX 4070 suporta Thunderbolt. Nossa amostra de teste com um i7-13650H e uma RTX 4060por outro lado, não oferece, e o último carece de tanta transparência para os clientes quanto os dois tipos diferentes de tela que estão listados apenas no manual e diferem apenas em espaços de cores e taxas de atualização.
O Dell G16 7630 é um laptop para jogos de médio porte, grande e pesado, que se beneficia do bom desempenho e da operação silenciosa. Quando se trata de conectividade e construção, a Dell poderia ser mais generosa.
Se o senhor gosta de coisas ainda mais elegantes e eficientes, talvez valha a pena dar uma olhada no Dell Inspiron 16 Plus 7630. Uma outra alternativa poderia ser o Lenovo Legion Slim 5 e, se o senhor não tiver um orçamento tão apertado, o Legion Pro 5 16.
Preço e disponibilidade
O Dell G16 7630 está atualmente em oferta na Amazon por US$ 1.401,84. Essa versão vem com um Intel Core i9-13900HX, uma RTX 4070, 16 GB de RAM e um SSD de 1 TB.
Dell G16, i7-13650HX, RTX 4060
- 02/13/2024 v7 (old)
Christian Hintze
Transparência
A seleção dos dispositivos a serem analisados é feita pela nossa equipe editorial. A amostra de teste foi fornecida ao autor como empréstimo pelo fabricante ou varejista para fins desta revisão. O credor não teve influência nesta revisão, nem o fabricante recebeu uma cópia desta revisão antes da publicação. Não houve obrigação de publicar esta revisão. Como empresa de mídia independente, a Notebookcheck não está sujeita à autoridade de fabricantes, varejistas ou editores.
É assim que o Notebookcheck está testando
Todos os anos, o Notebookcheck analisa de forma independente centenas de laptops e smartphones usando procedimentos padronizados para garantir que todos os resultados sejam comparáveis. Desenvolvemos continuamente nossos métodos de teste há cerca de 20 anos e definimos padrões da indústria no processo. Em nossos laboratórios de teste, equipamentos de medição de alta qualidade são utilizados por técnicos e editores experientes. Esses testes envolvem um processo de validação em vários estágios. Nosso complexo sistema de classificação é baseado em centenas de medições e benchmarks bem fundamentados, o que mantém a objetividade.Price comparison

