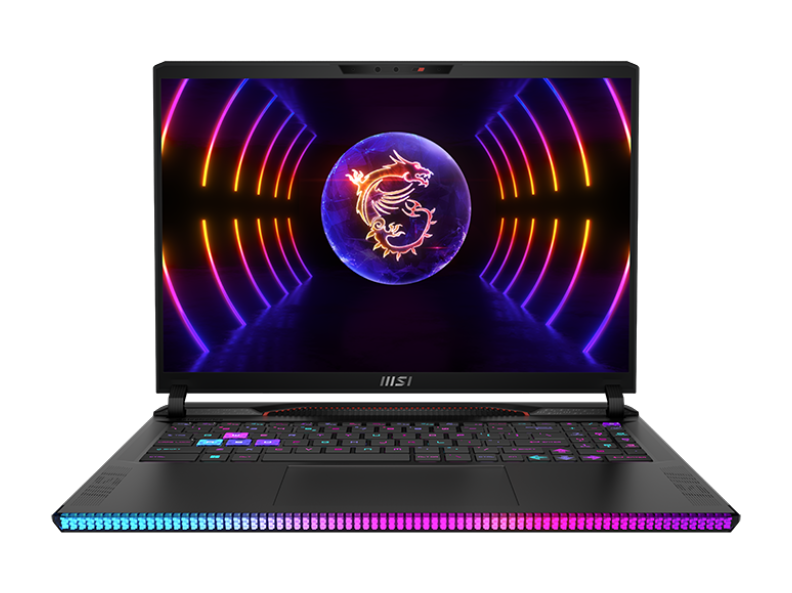
Análise do laptop MSI Raider GE68 HX 13VF: Uma mudança completa de design

O GE68HX é o sucessor direto do GE67HX do ano passado, com componentes internos atualizados e um novo design de chassi. Além das esperadas CPUs Raptor Lake-HX de 13ª geração e GPUs Nvidia Ada Lovelace para substituir as opções Alder Lake-HX e Ampere de 12ª geração, o modelo mais recente também oferece uma tela maior de 16:10 de 16 polegadas, em comparação com a proporção de 16:9 de 15,6 polegadas.
Nossa unidade em análise é a configuração básica com o Core i7-13950HX, 140 W GeForce RTX 4060 e tela IPS de 1080p 144 Hz, vendida no varejo por cerca de US$ 1.700 ou US$ 1.300 se estiver à venda. As SKUs mais avançadas incluem o Core i9-13980HX, RTX 4090 e tela IPS de 1440p 240 Hz por mais de US$ 3.500.
Os concorrentes do GE68HX incluem outros notebooks para jogos de 16 polegadas de alta qualidade, como o HP Omen 16,Alienware m16 R1, Lenovo Legion Slim 7i 16 Gen 8ou o Asus ROG Zephyrus M16.
Mais análises da MSI:
Possíveis concorrentes em comparação
Avaliação | Data | Modelo | Peso | Altura | Size | Resolução | Preço |
|---|---|---|---|---|---|---|---|
| 86.9 % v7 (old) | 10/2023 | MSI Raider GE68HX 13VF i9-13950HX, GeForce RTX 4060 Laptop GPU | 2.7 kg | 27.9 mm | 16.00" | 1900x1200 | |
| 87.7 % v7 (old) | 07/2022 | MSI GE67 HX 12UGS i7-12800HX, GeForce RTX 3070 Ti Laptop GPU | 2.5 kg | 23.4 mm | 15.60" | 1920x1080 | |
| 86.6 % v7 (old) | 09/2023 | HP Omen 16-xf0376ng R7 7840HS, GeForce RTX 4070 Laptop GPU | 2.4 kg | 23.5 mm | 16.10" | 1920x1080 | |
| 89.2 % v7 (old) | 08/2023 | Alienware m16 R1 AMD R9 7845HX, GeForce RTX 4080 Laptop GPU | 3.1 kg | 25.4 mm | 16.00" | 2560x1600 | |
| 90 % v7 (old) | 07/2023 | Lenovo Legion Slim 7i 16 Gen 8 i9-13900H, GeForce RTX 4070 Laptop GPU | 2.1 kg | 19.9 mm | 16.00" | 2560x1600 | |
| 89.4 % v7 (old) | 03/2023 | Asus ROG Zephyrus M16 GU604VY-NM042X i9-13900H, GeForce RTX 4090 Laptop GPU | 2.3 kg | 22.9 mm | 16.00" | 2560x1600 |
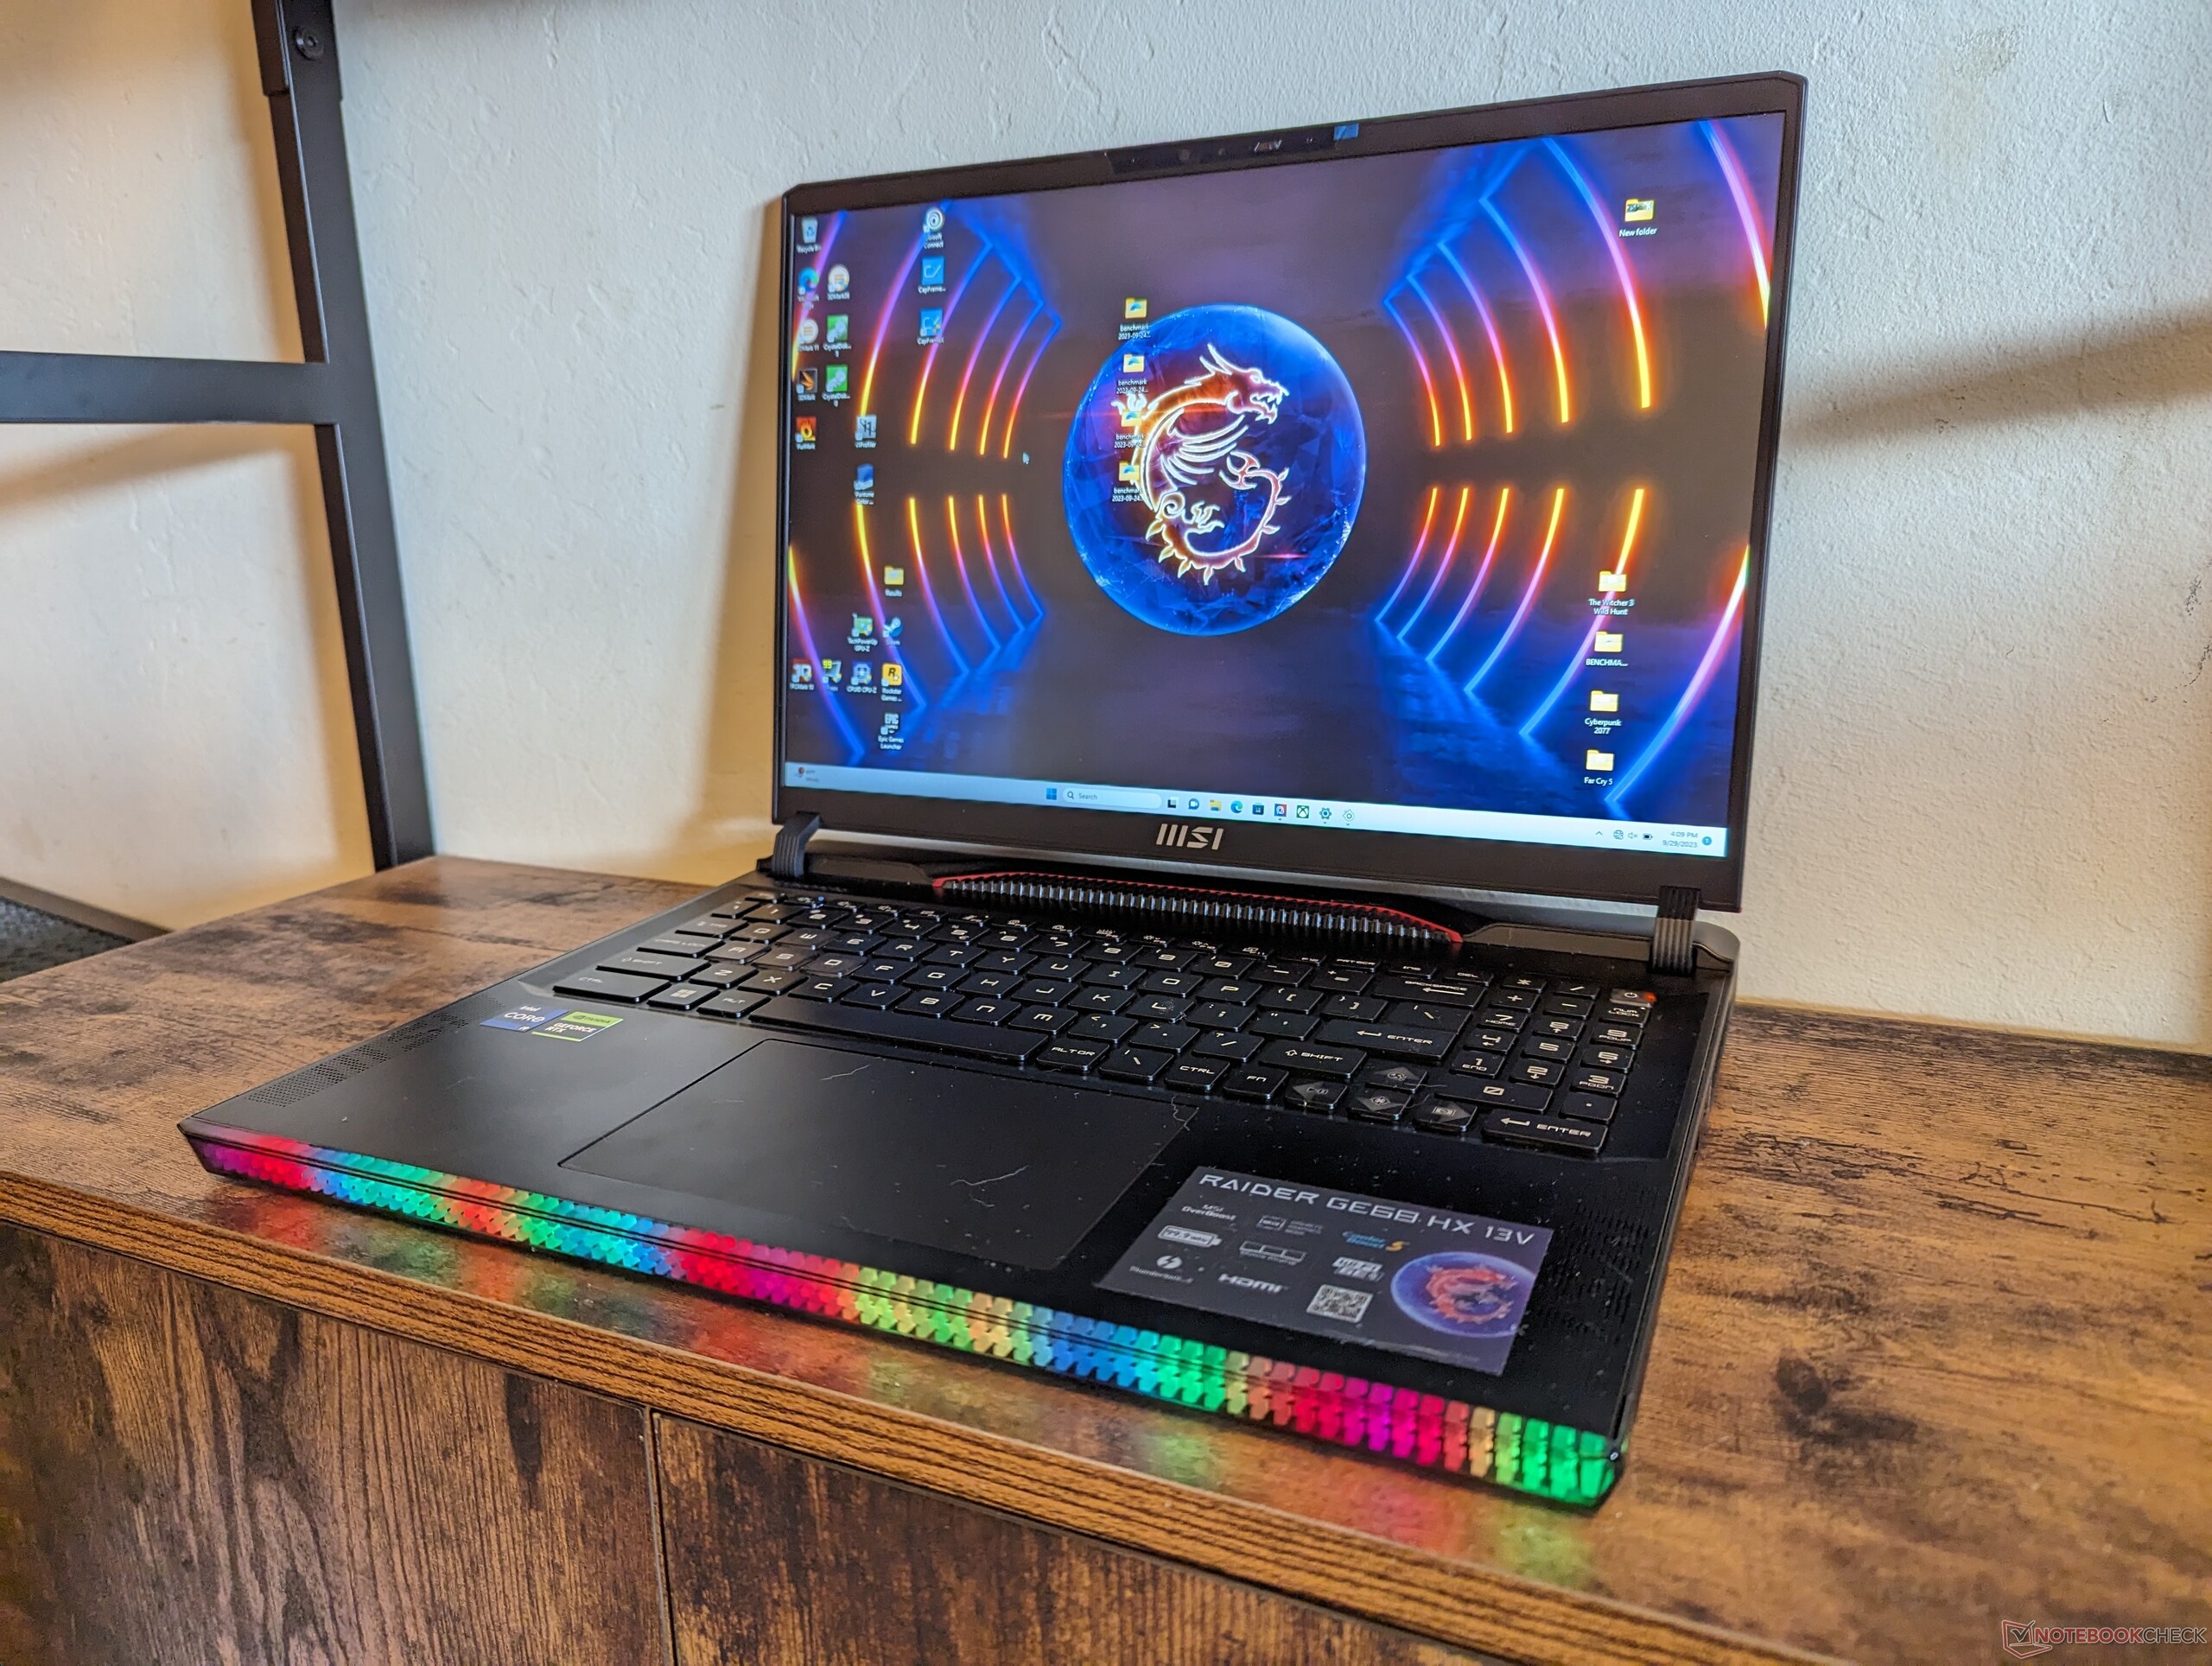
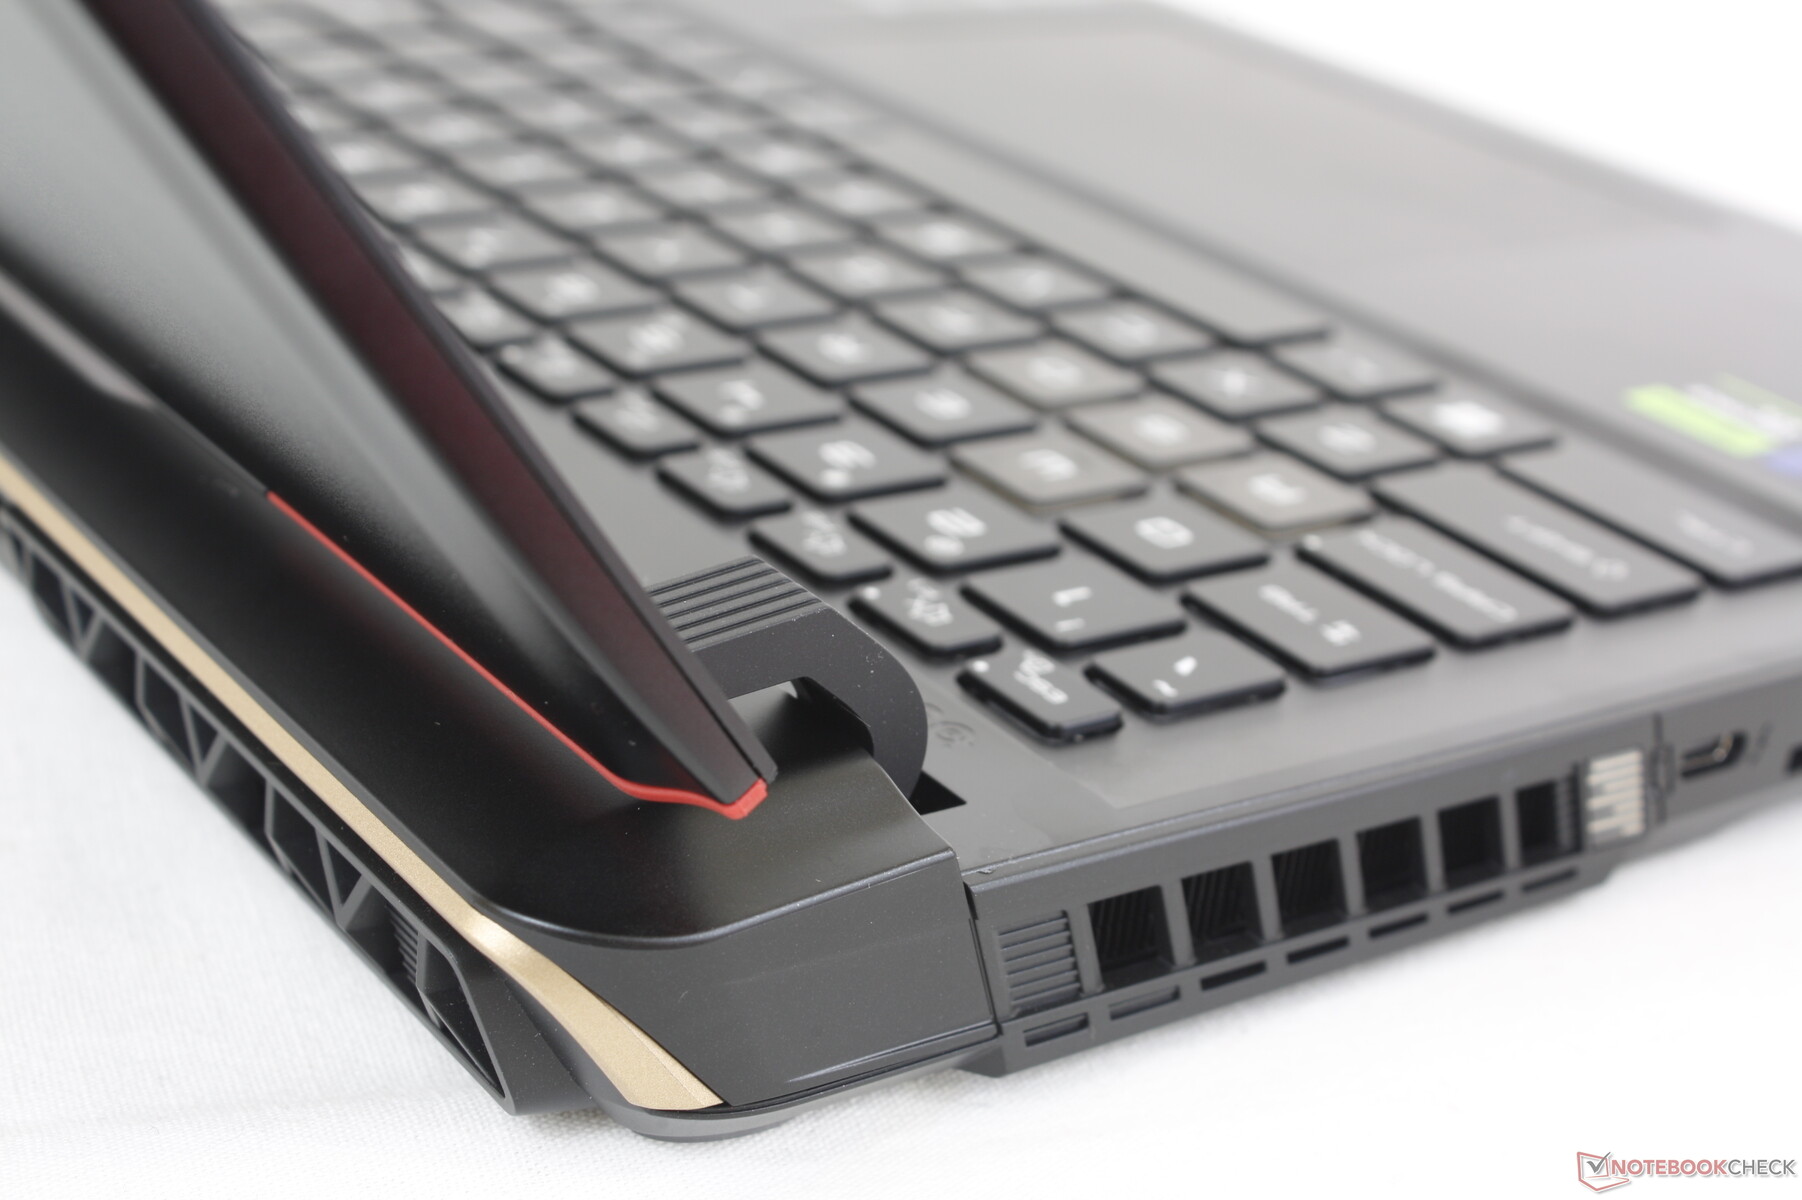
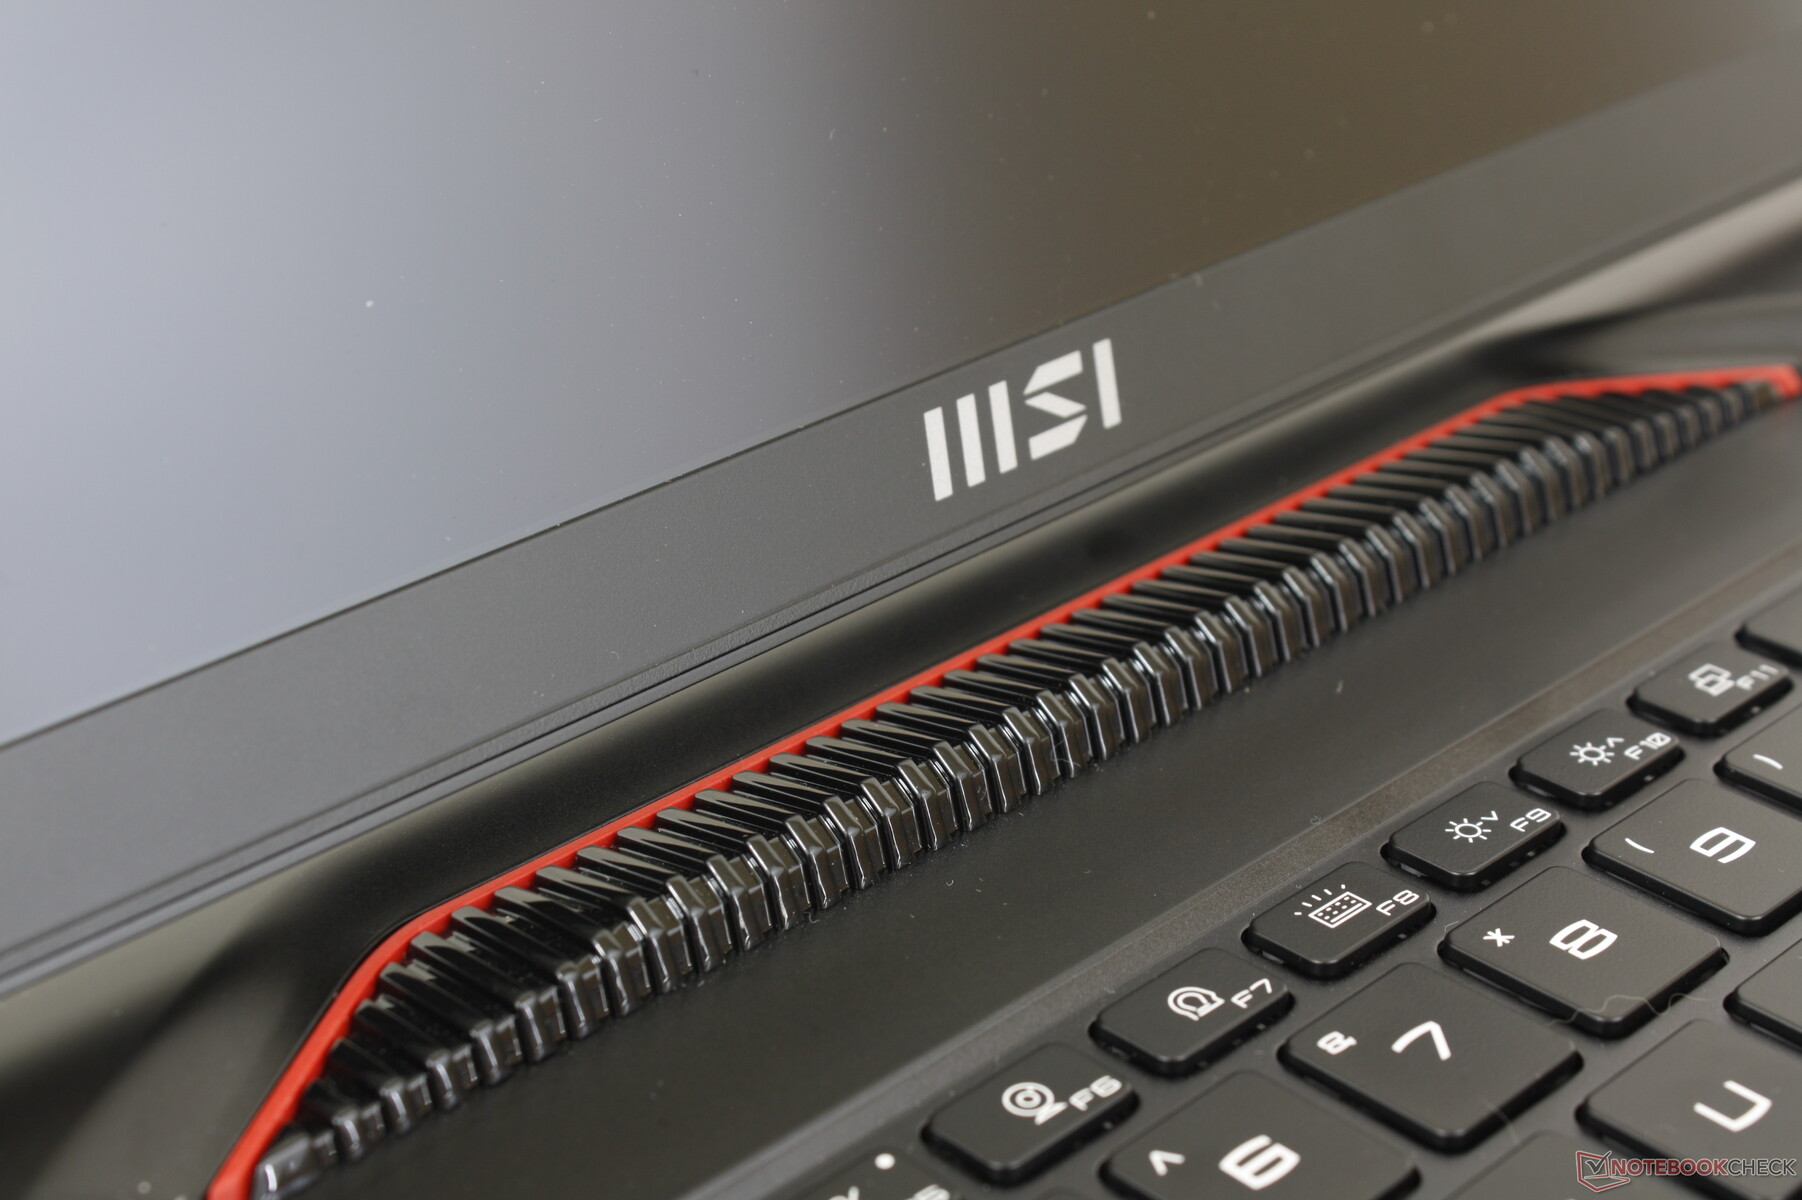
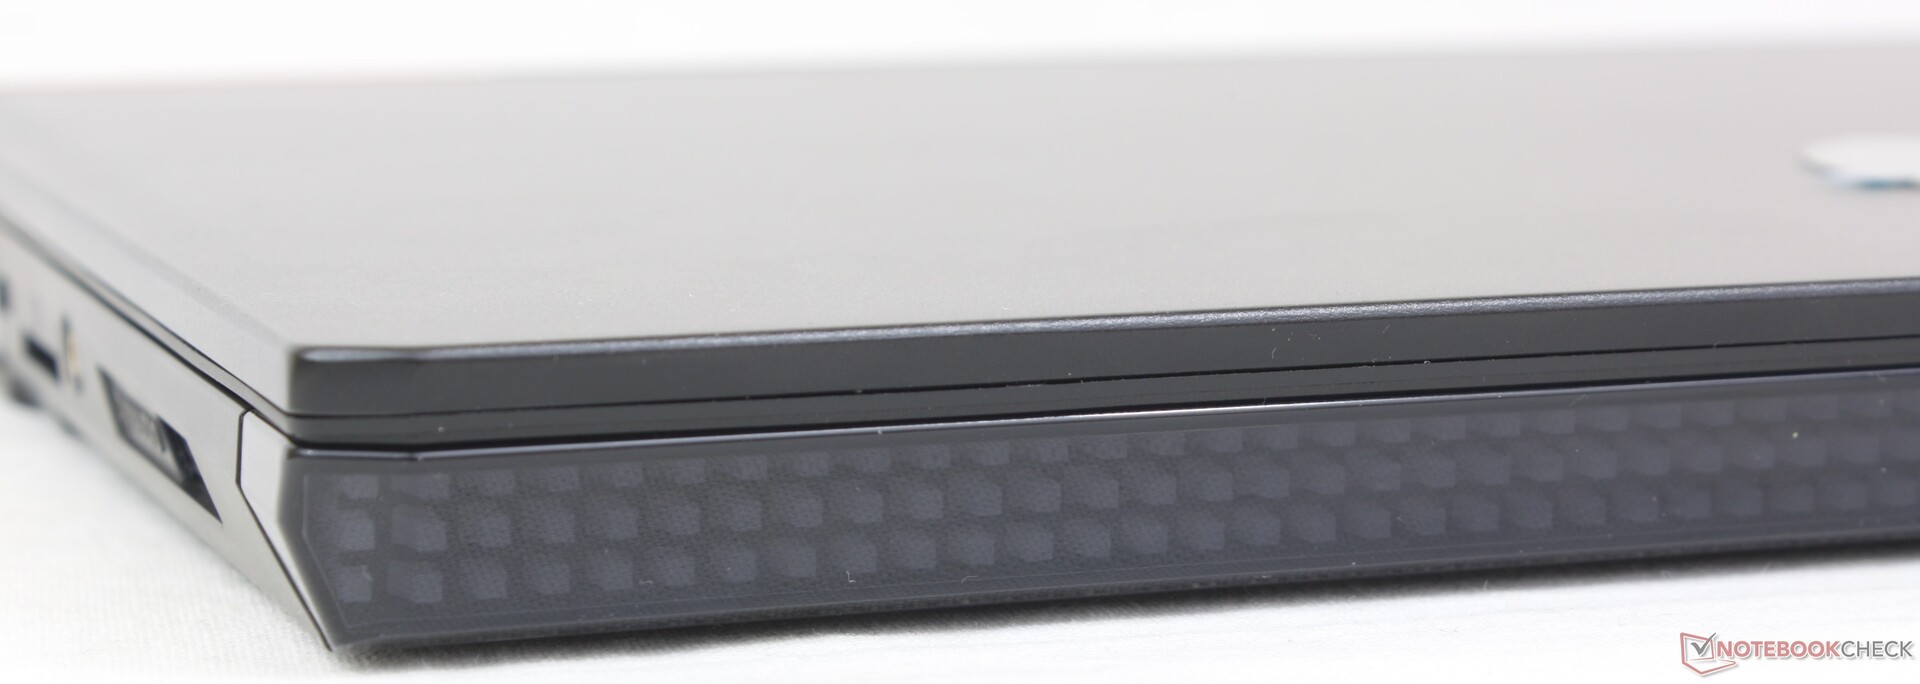
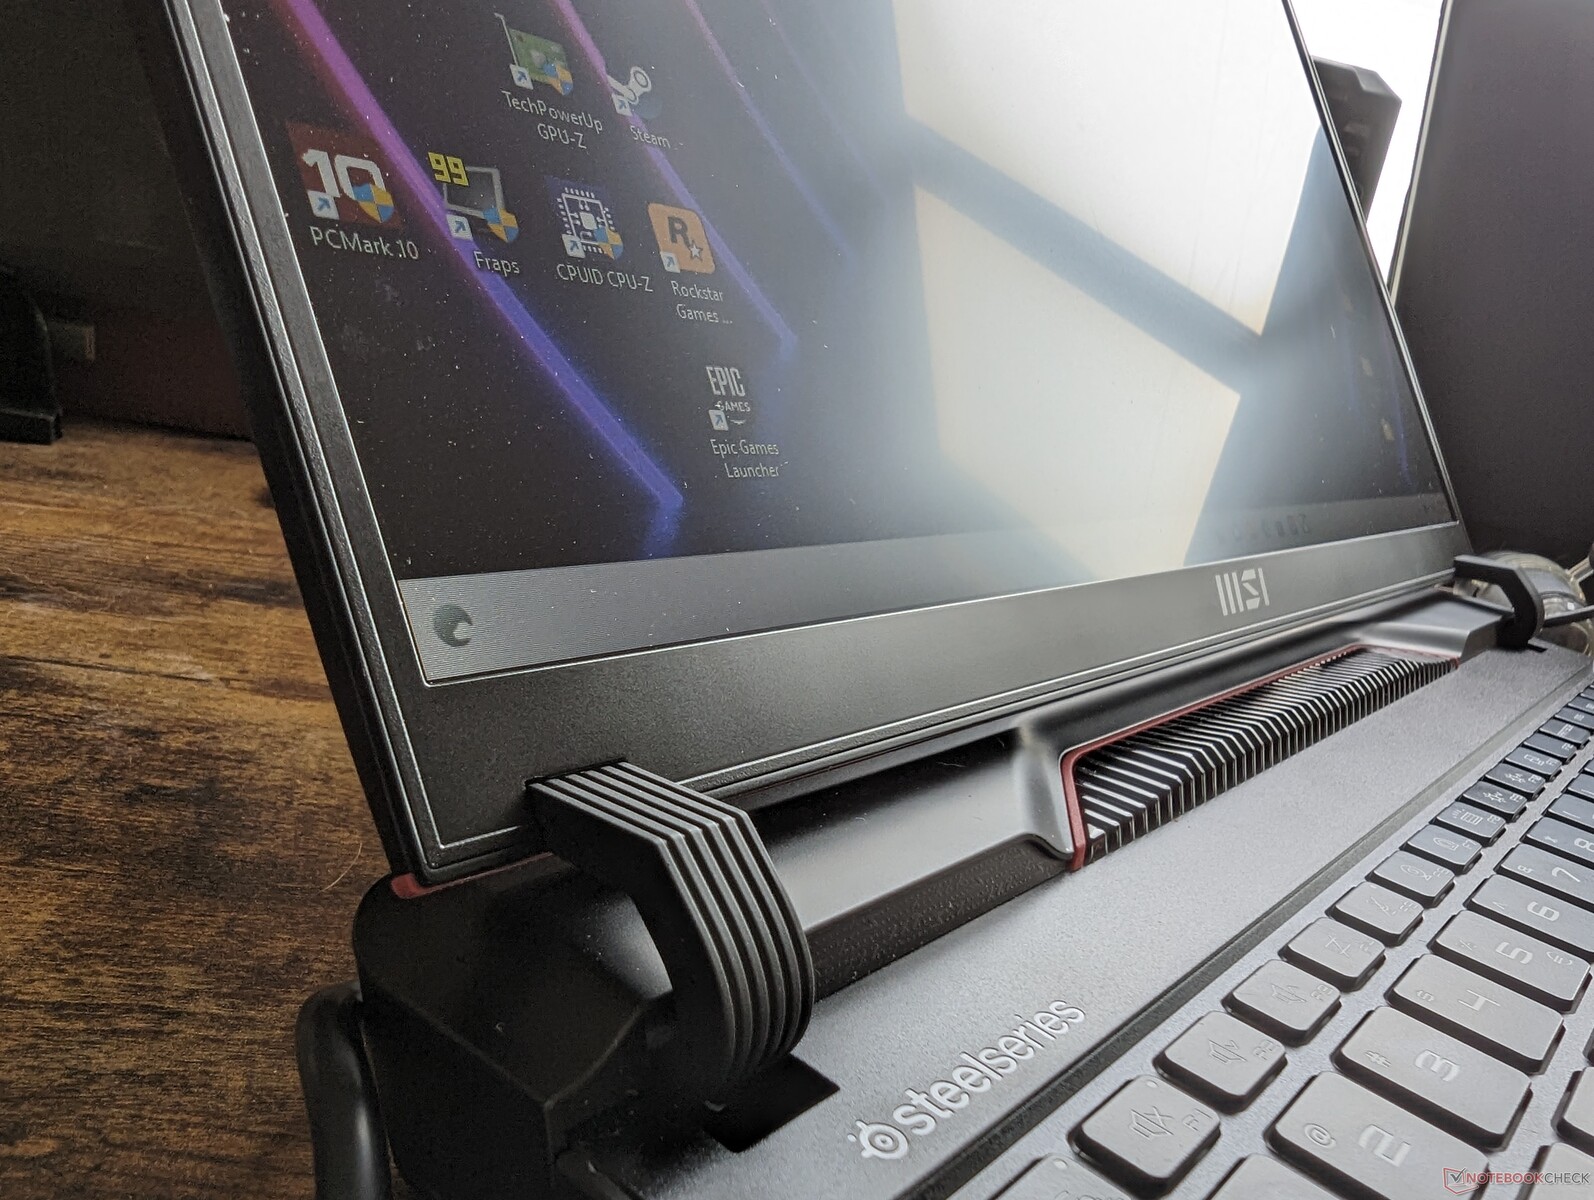
Caso - Maior do que antes
O chassi pode ser melhor descrito como uma versão menor do modelo de 17 polegadas Raider GE78HX. A barra de pixels de LED na parte frontal substitui a iluminação contínua do modelo do ano passado, enquanto a parte traseira agora é mais estilizada com acabamentos dourados, vermelhos e brilhantes. Um dos objetivos da MSI este ano era criar designs de laptop mais interessantes visualmente, em vez da estética minimalista e preta cada vez mais comum. O fabricante foi bem-sucedido nesse aspecto, pois o design do GE68HX é certamente inconfundível e muito diferente de outros laptops para jogos da concorrência.
A rigidez do chassi é excelente, apesar de todas as curvas e peças que compõem o esqueleto não monobloco. A aplicação de pressão no centro do teclado ou a tentativa de torcer os cantos resultaria em pouquíssima flexão e nenhum rangido audível. Apreciamos especialmente as dobradiças maiores e mais resistentes em comparação com o GE67HX do ano passado para uma melhor sensação de longevidade.
O novo modelo é maior e mais pesado do que o GE67HX, por margens notáveis, conforme mostrado em nosso gráfico de comparação de tamanhos abaixo. De fato, o GE68HX é um dos notebooks para jogos de 16 polegadas maiores e mais pesados disponíveis.
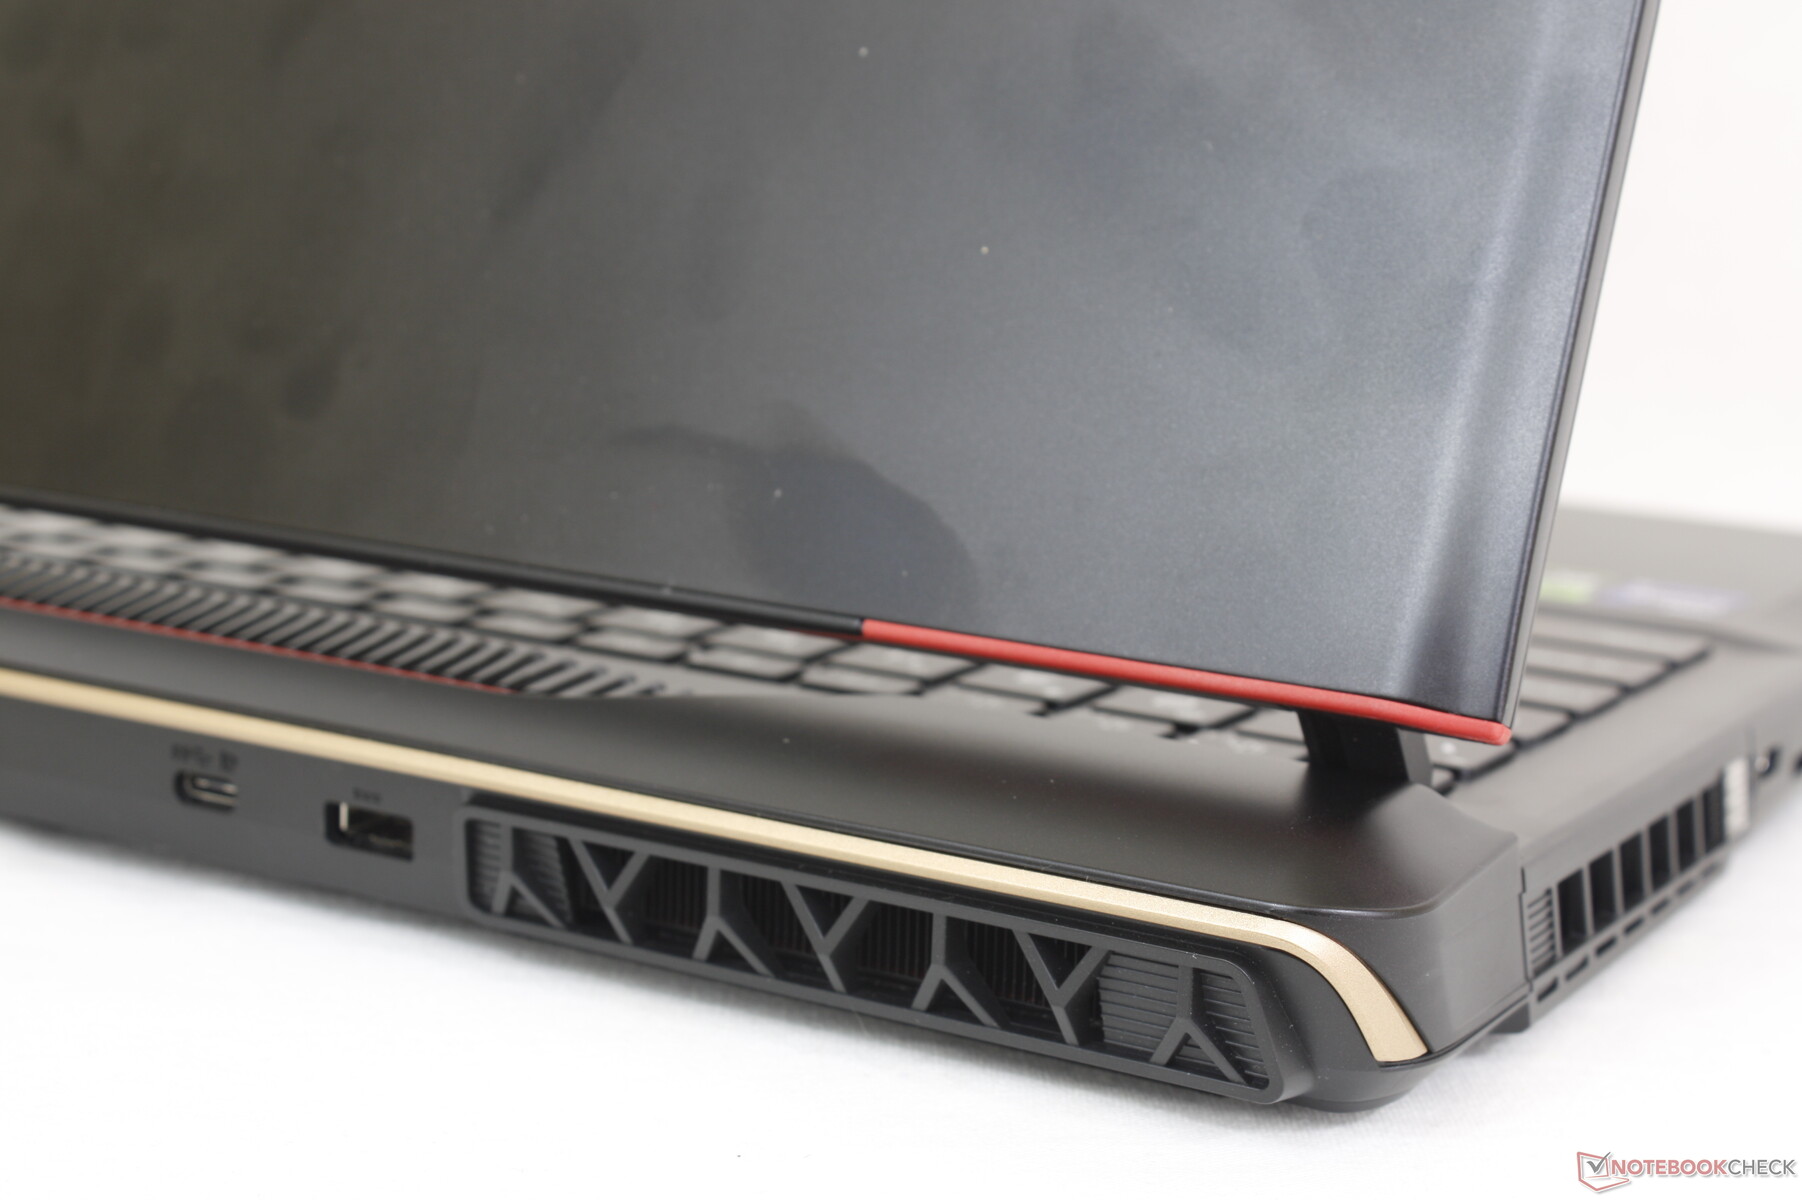
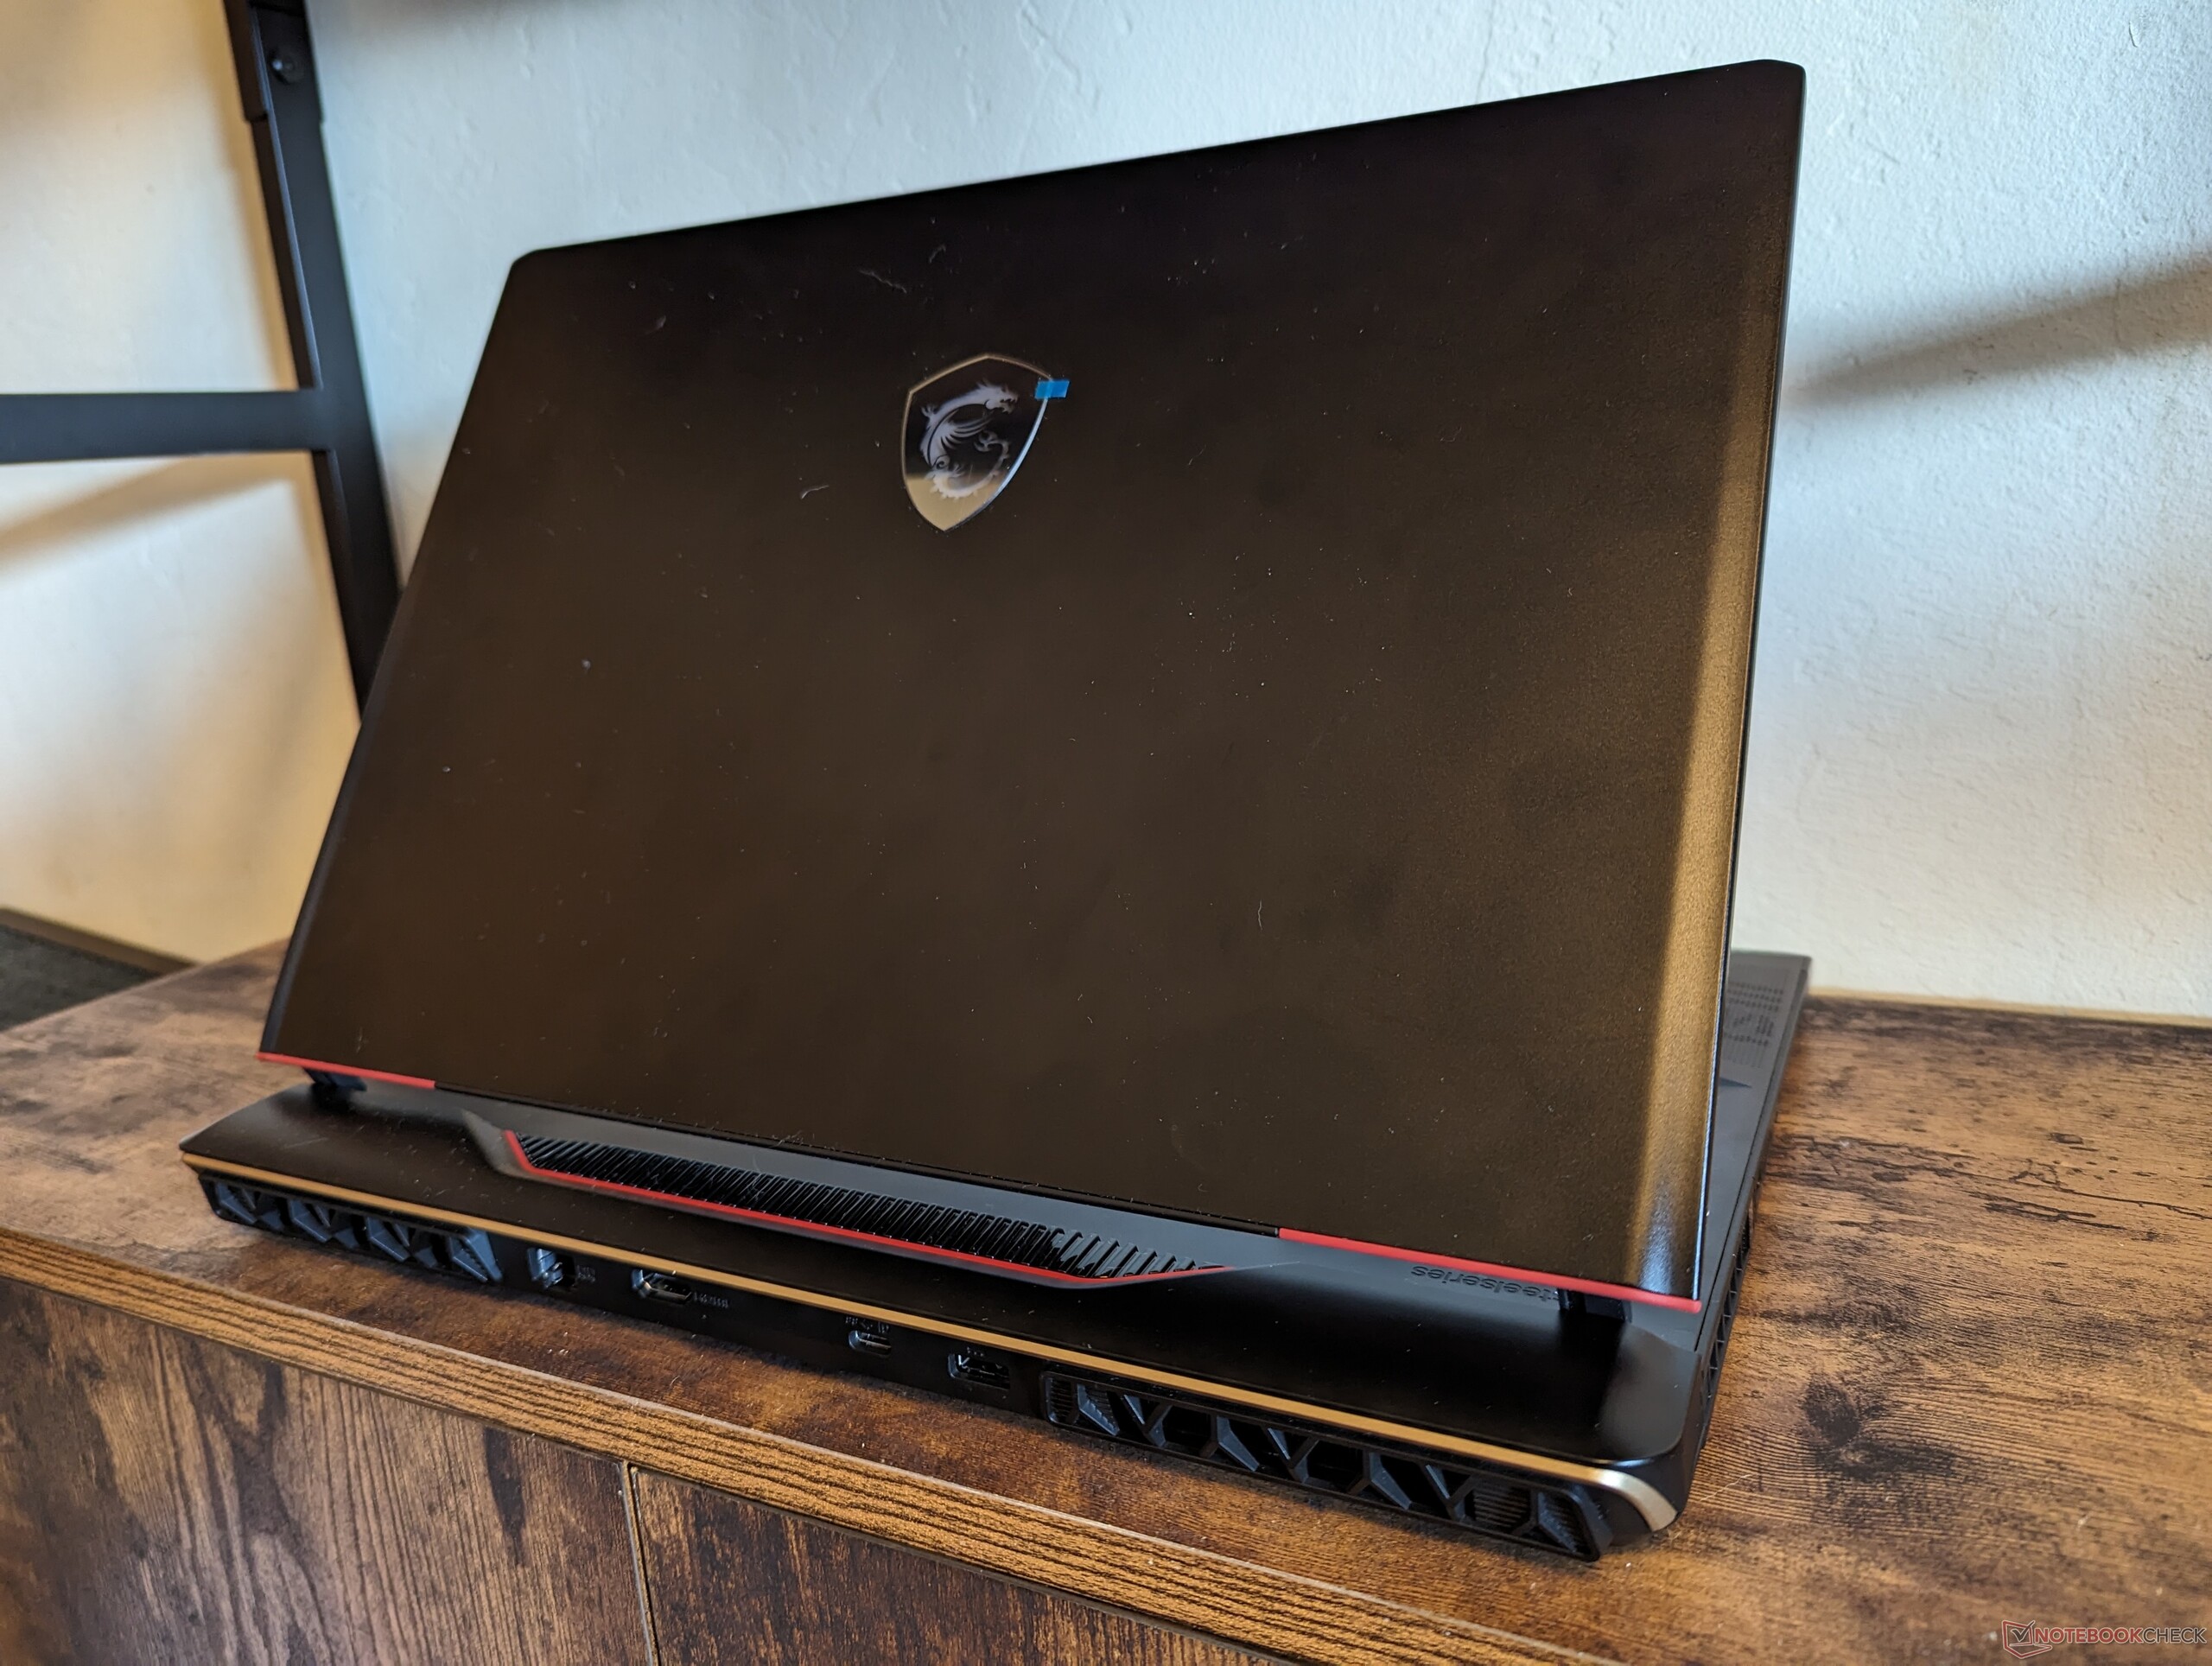
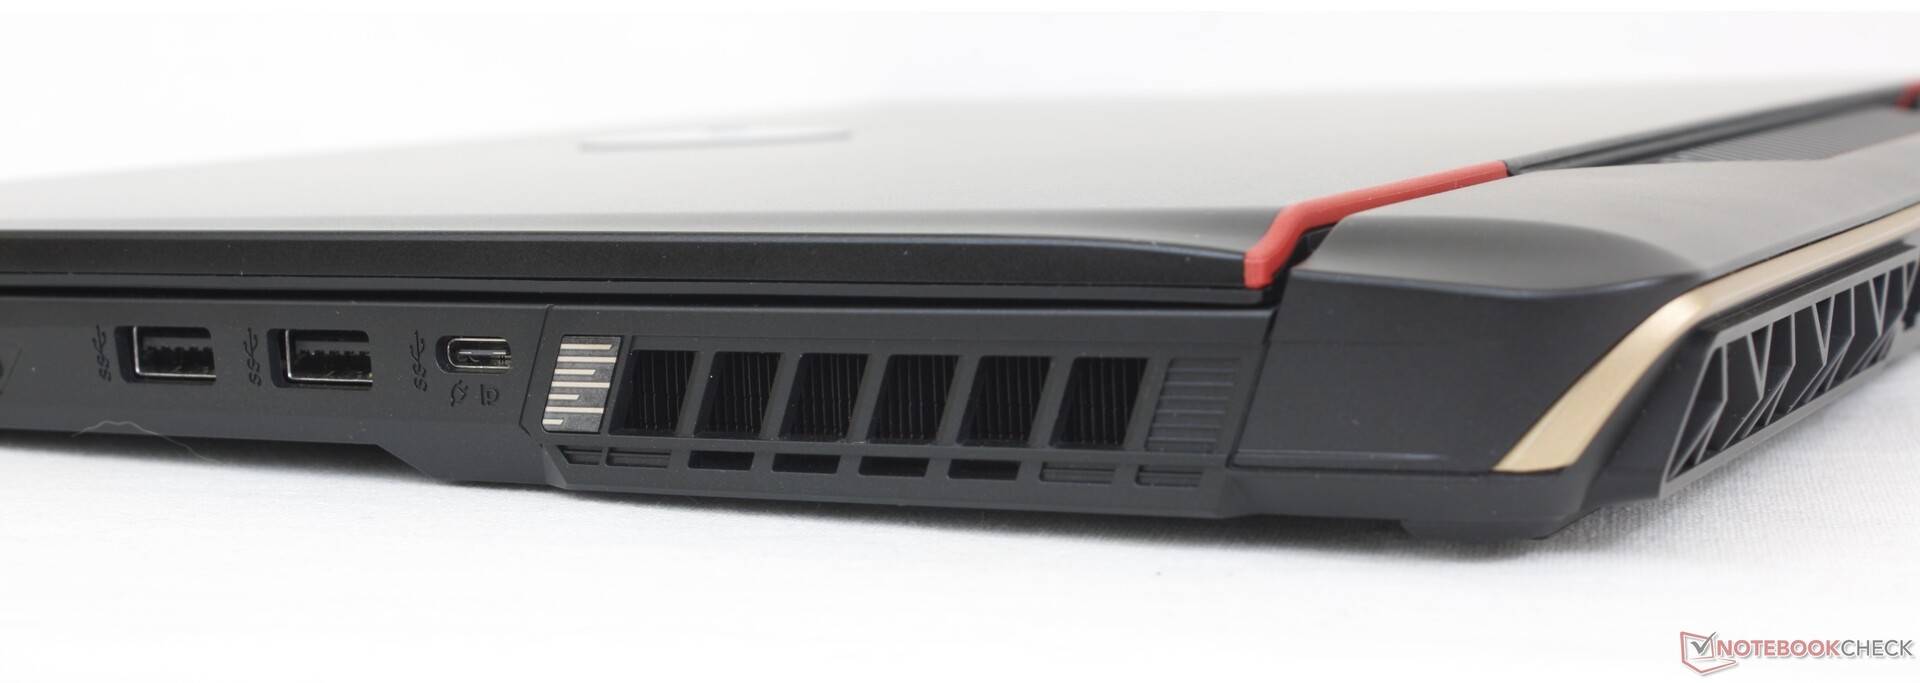
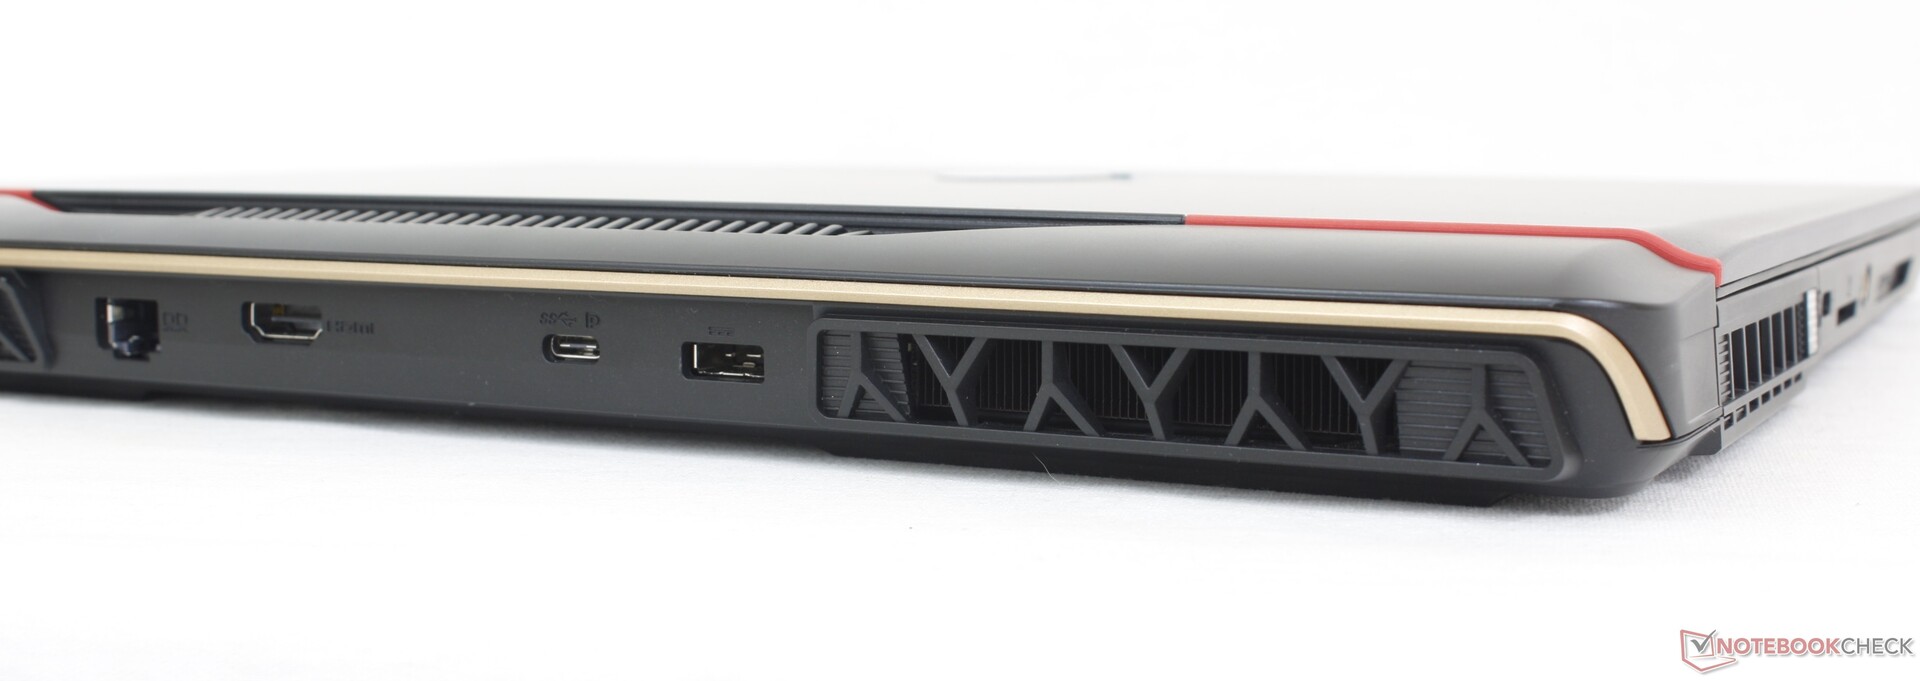
Conectividade
As opções de porta mudaram um pouco em relação à versão do ano passado GE67HX. Enquanto o GE67HX teria 3 portas USB-A e 2 portas USB-C, o GE68HX vem com 2 portas USB-A e 3 portas USB-C. Todas as três portas USB-C suportam Displayport, mas apenas a que fica na borda esquerda é compatível com Thunderbolt 4.
Estranhamente, a MSI optou por abandonar a trava Kensington no design deste ano. Também não há mini-DisplayPort, ao contrário doAlienware m16 R1.
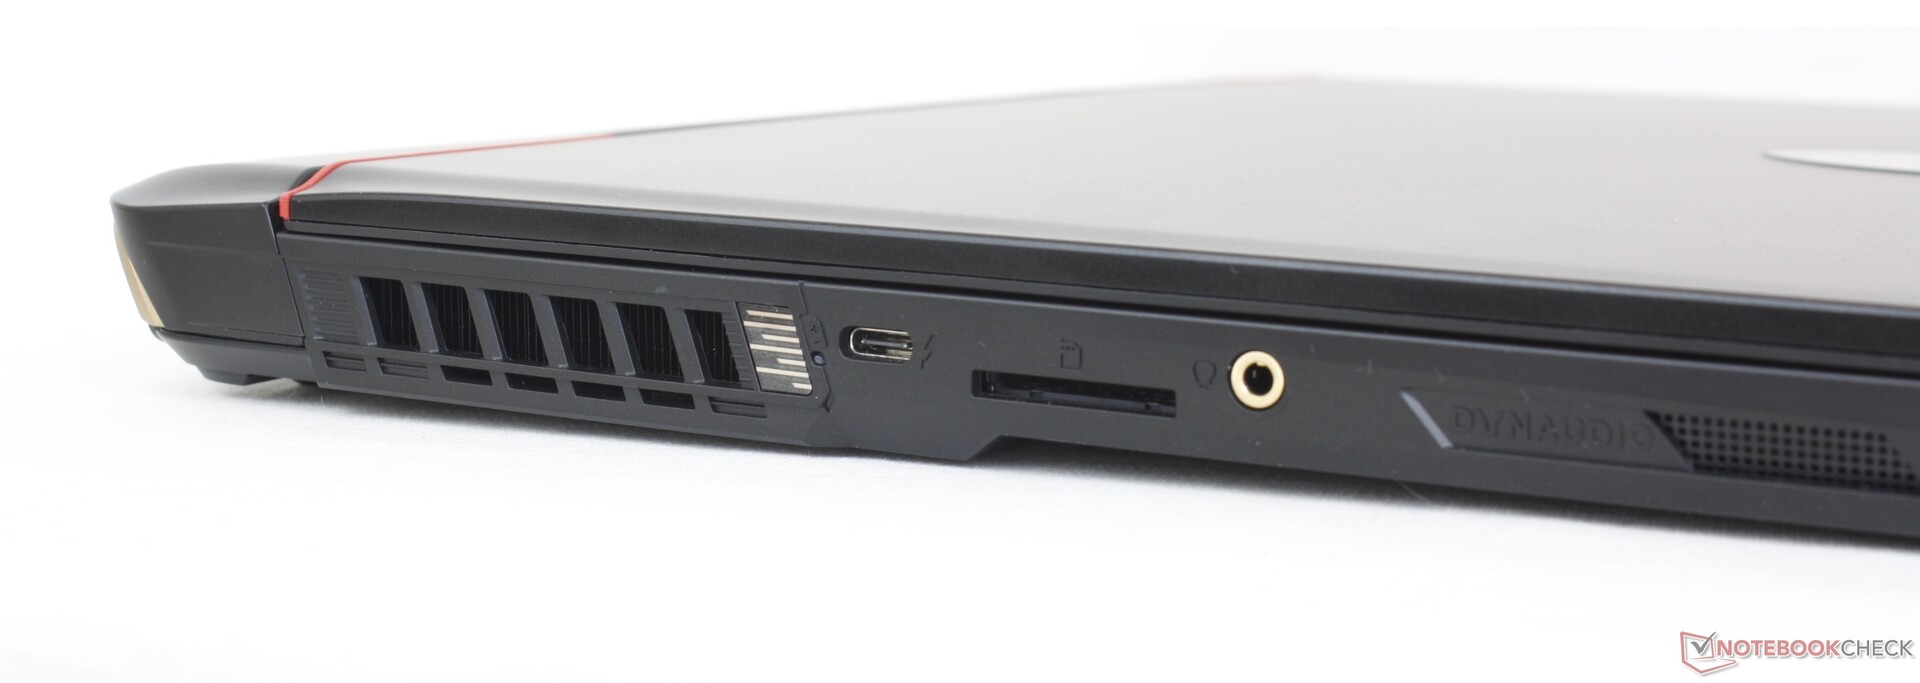
Leitor de cartão SD
O leitor de cartão SD integrado é um pouco lento para o que se supõe ser um modelo de gama média alta para jogos. A transferência de 1 GB de imagens do nosso cartão de teste UHS-II para o desktop levaria pouco mais de 12 segundos, enquanto o mesmo teste no Alienware m16 R1 seria duas vezes mais rápido.
| SD Card Reader | |
| average JPG Copy Test (av. of 3 runs) | |
| Alienware m16 R1 AMD (Toshiba Exceria Pro SDXC 64 GB UHS-II) | |
| Asus ROG Zephyrus M16 GU604VY-NM042X | |
| Lenovo Legion Slim 7i 16 Gen 8 (Toshiba Exceria Pro SDXC 64 GB UHS-II) | |
| MSI GE67 HX 12UGS (Toshiba Exceria Pro SDXC 64 GB UHS-II) | |
| MSI Raider GE68HX 13VF (Toshiba Exceria Pro SDXC 64 GB UHS-II) | |
| maximum AS SSD Seq Read Test (1GB) | |
| Alienware m16 R1 AMD (Toshiba Exceria Pro SDXC 64 GB UHS-II) | |
| Asus ROG Zephyrus M16 GU604VY-NM042X | |
| Lenovo Legion Slim 7i 16 Gen 8 (Toshiba Exceria Pro SDXC 64 GB UHS-II) | |
| MSI Raider GE68HX 13VF (Toshiba Exceria Pro SDXC 64 GB UHS-II) | |
| MSI GE67 HX 12UGS (Toshiba Exceria Pro SDXC 64 GB UHS-II) | |
Comunicação
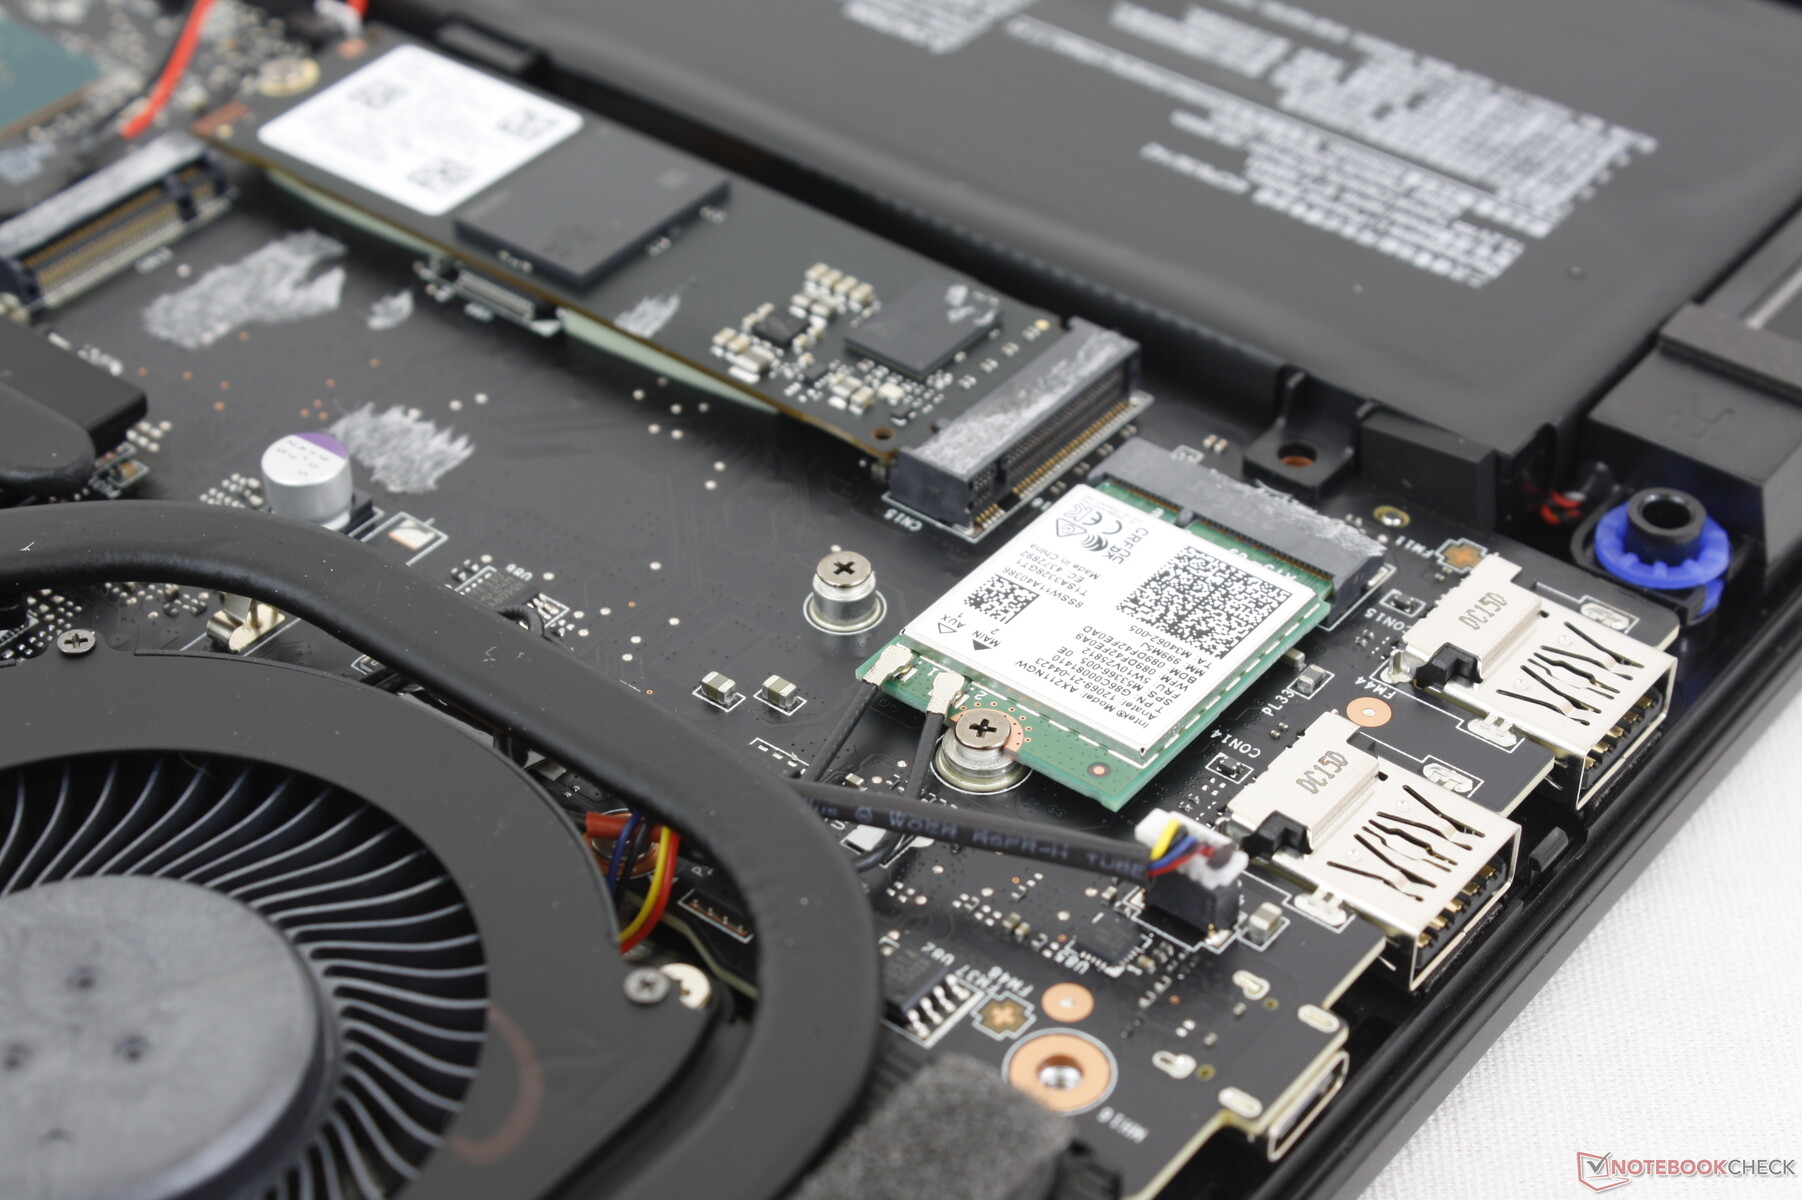
Um Intel AX211 vem como padrão para suporte a Wi-Fi 6E e Bluetooth 5.3. Não tivemos problemas de conectividade quando emparelhado com nossa rede de teste AXE11000 de 6 GHz.
| Networking | |
| iperf3 transmit AXE11000 | |
| Alienware m16 R1 AMD | |
| MSI Raider GE68HX 13VF | |
| HP Omen 16-xf0376ng | |
| Lenovo Legion Slim 7i 16 Gen 8 | |
| iperf3 receive AXE11000 | |
| HP Omen 16-xf0376ng | |
| Alienware m16 R1 AMD | |
| Lenovo Legion Slim 7i 16 Gen 8 | |
| MSI Raider GE68HX 13VF | |
| iperf3 transmit AXE11000 6GHz | |
| Alienware m16 R1 AMD | |
| Asus ROG Zephyrus M16 GU604VY-NM042X | |
| Lenovo Legion Slim 7i 16 Gen 8 | |
| MSI Raider GE68HX 13VF | |
| MSI GE67 HX 12UGS | |
| iperf3 receive AXE11000 6GHz | |
| Asus ROG Zephyrus M16 GU604VY-NM042X | |
| Alienware m16 R1 AMD | |
| Lenovo Legion Slim 7i 16 Gen 8 | |
| MSI Raider GE68HX 13VF | |
| MSI GE67 HX 12UGS | |
Webcam
Embora a qualidade de 2 MP não tenha mudado, ainda há algumas diferenças em relação à webcam. O obturador, por exemplo, agora é um controle deslizante físico próximo à lente, em vez de um interruptor eletrônico no teclado. E, em segundo lugar, um sensor de infravermelho agora está integrado para oferecer suporte ao Hello.


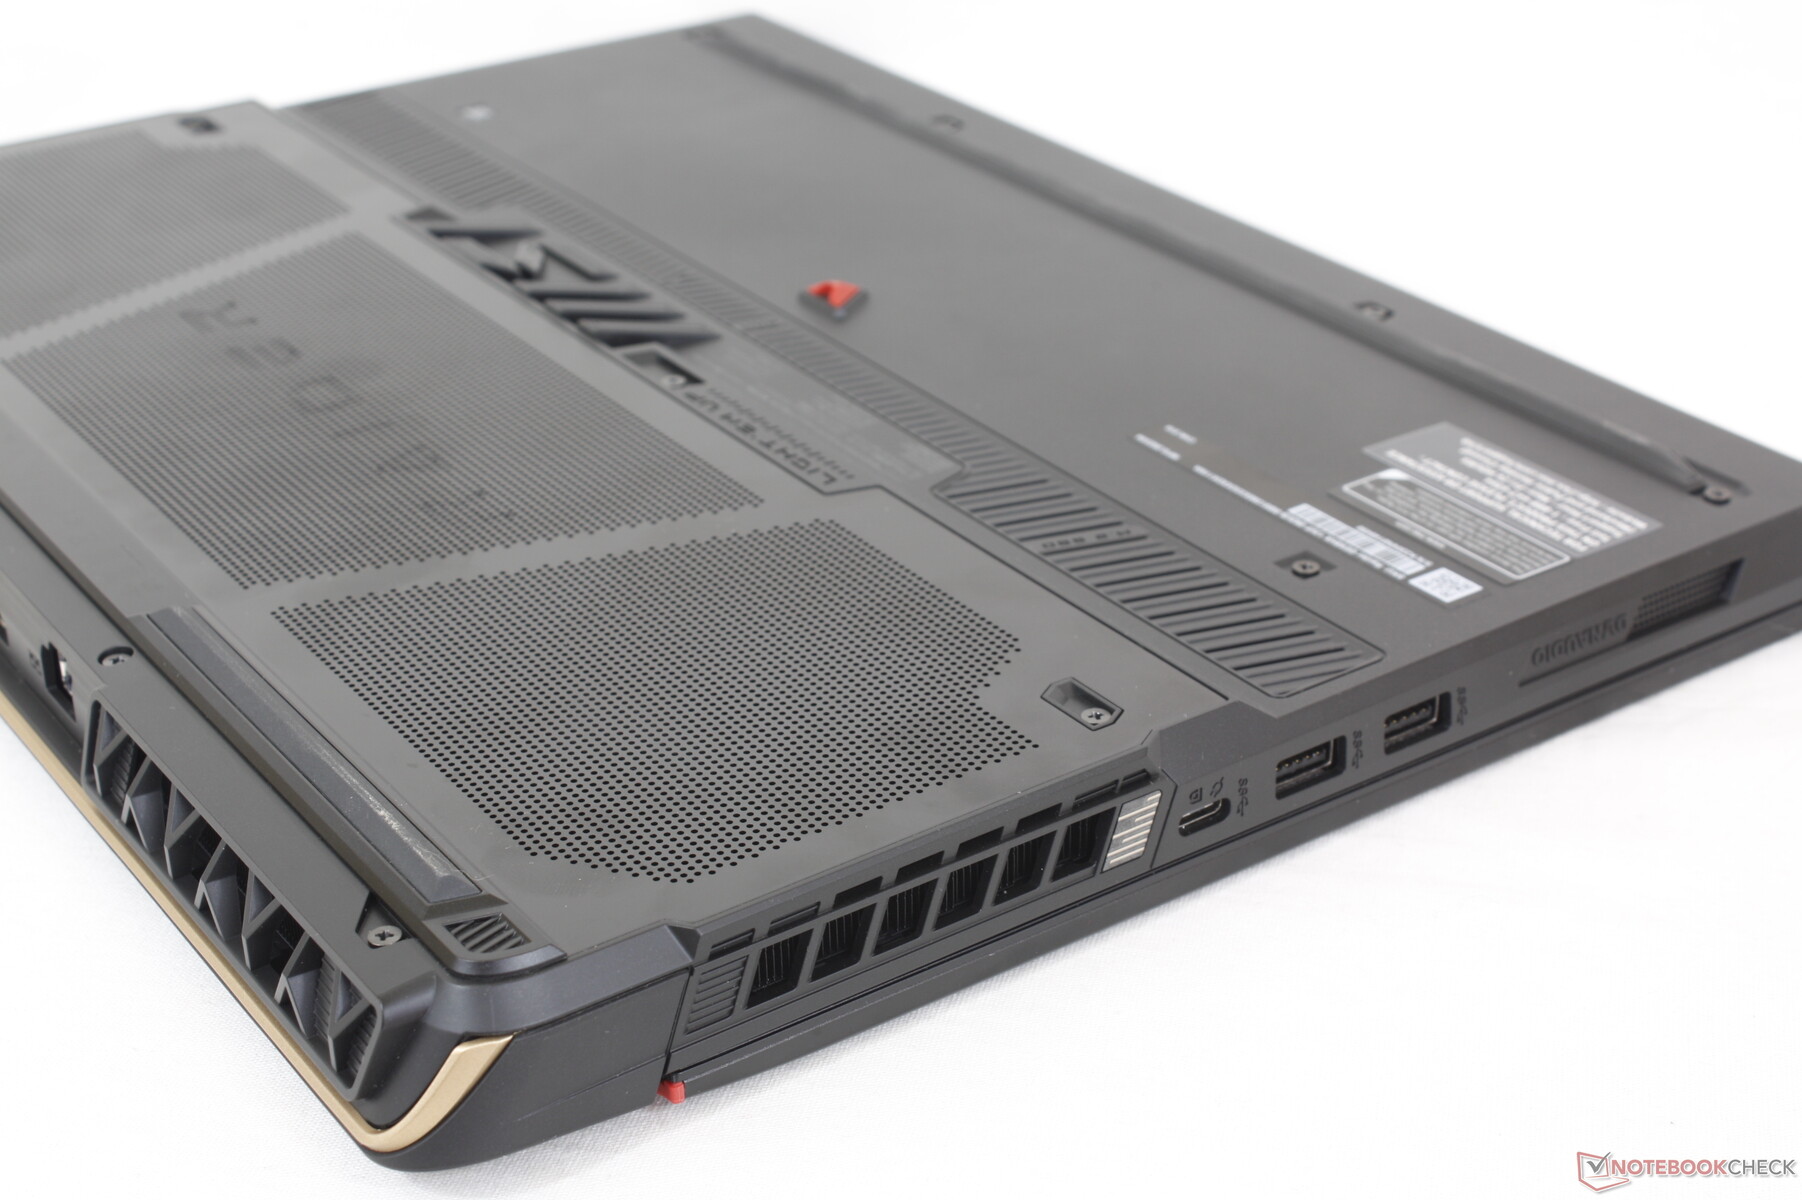
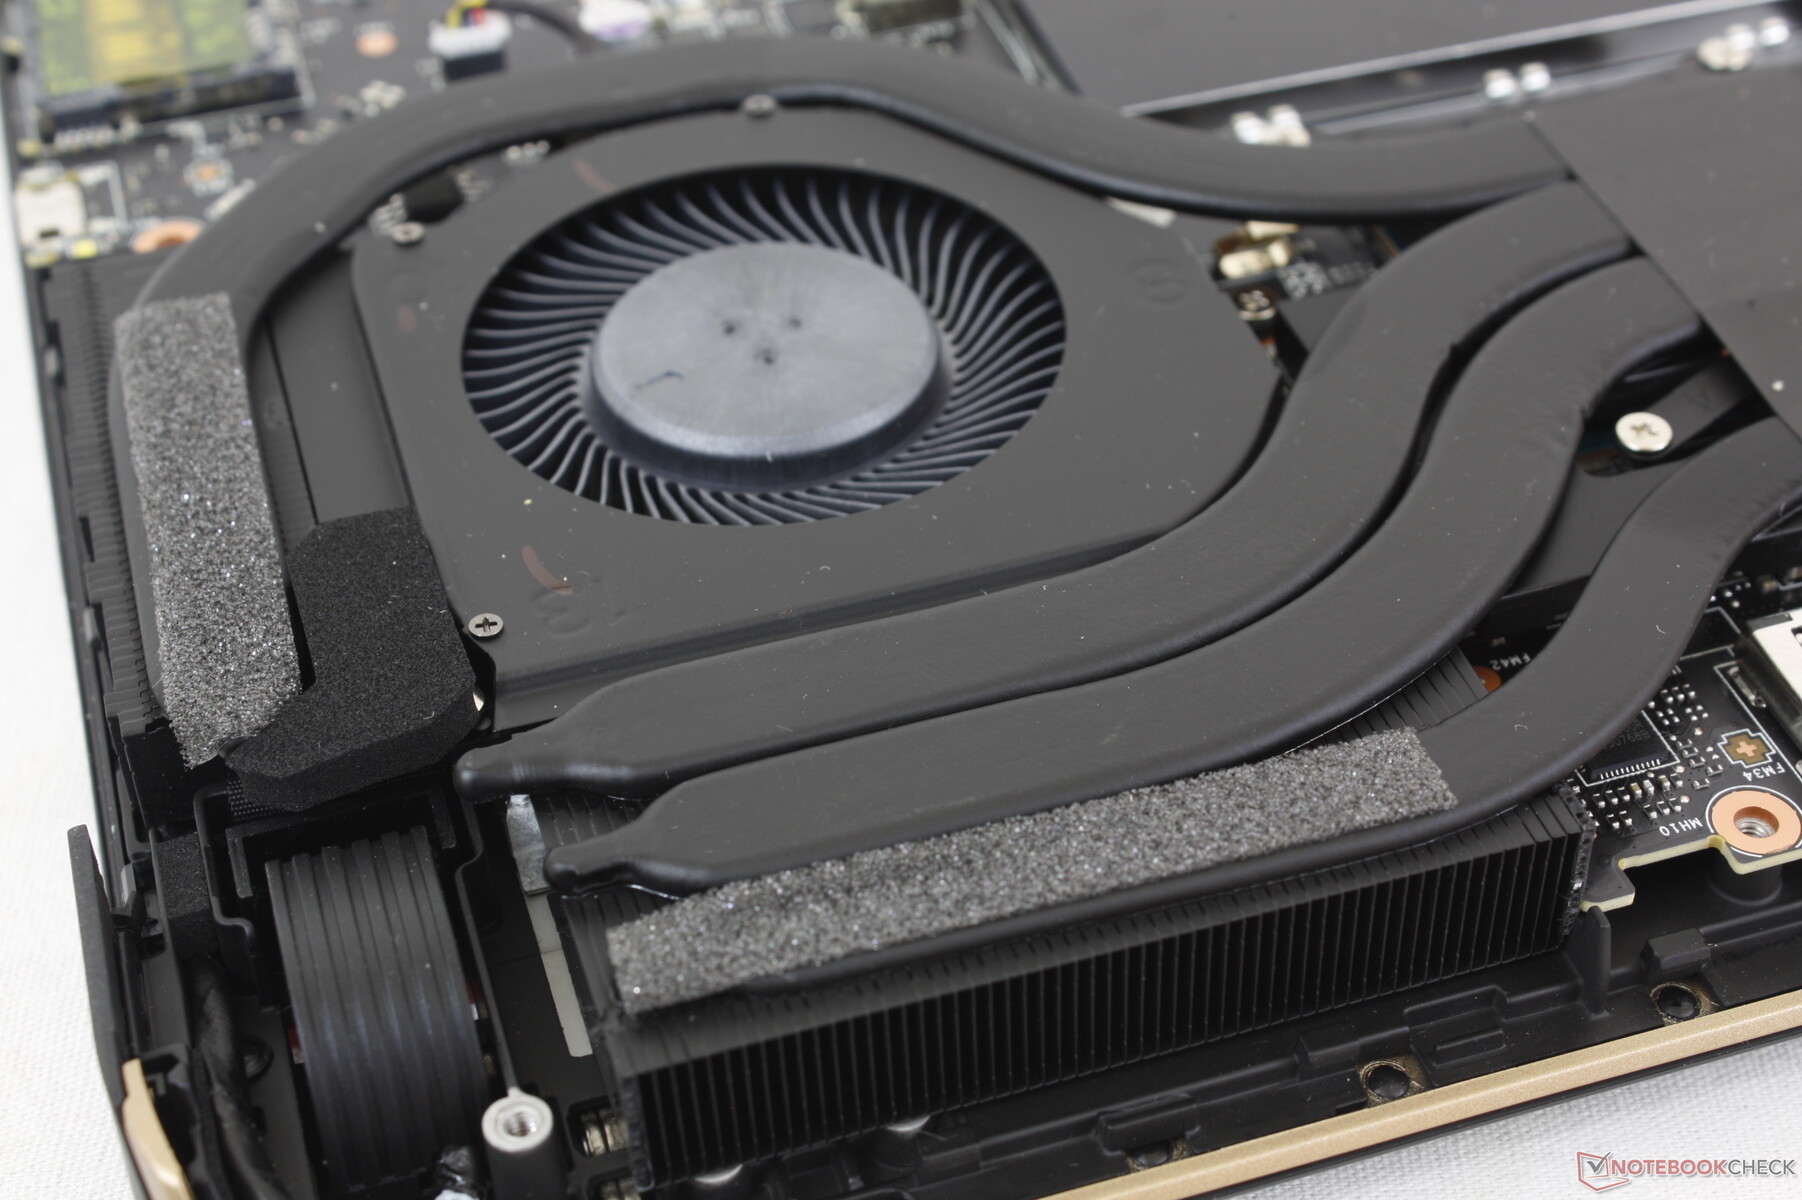
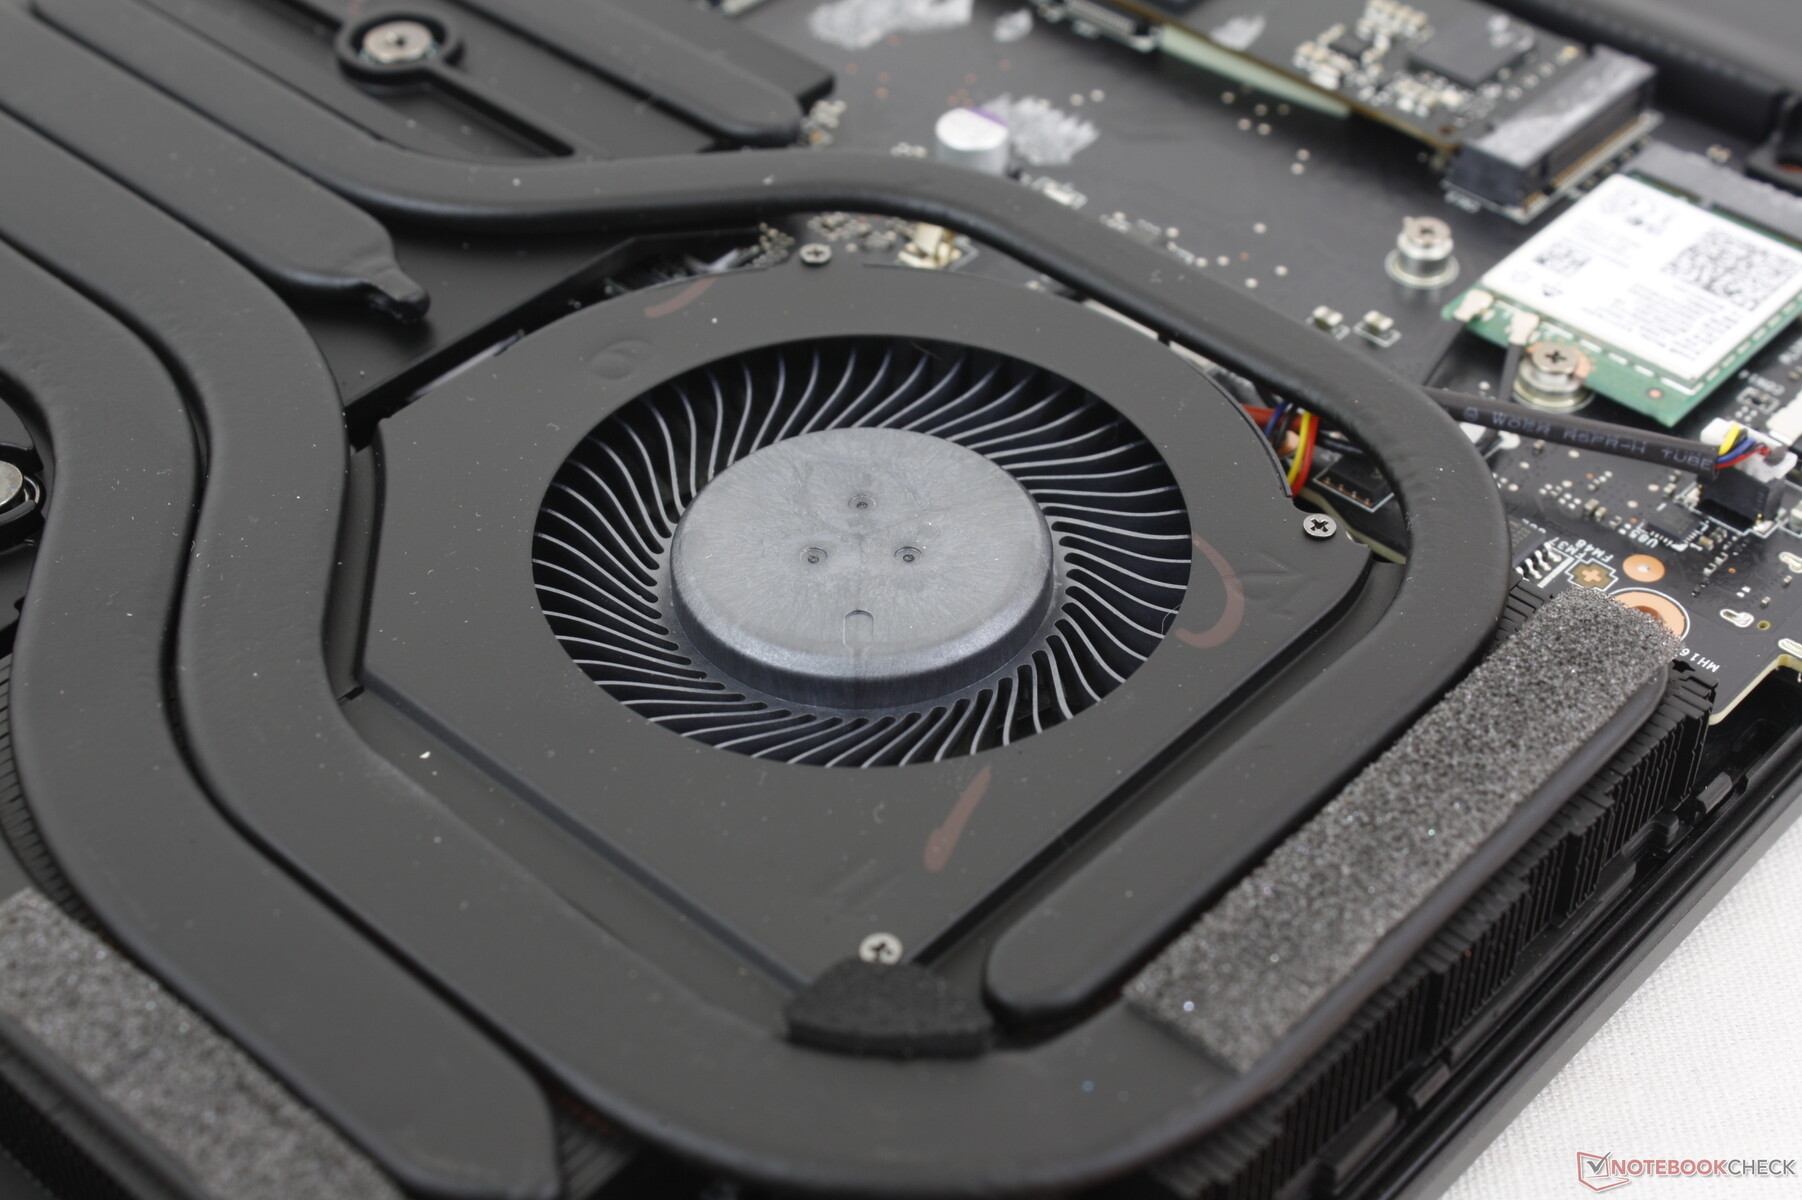
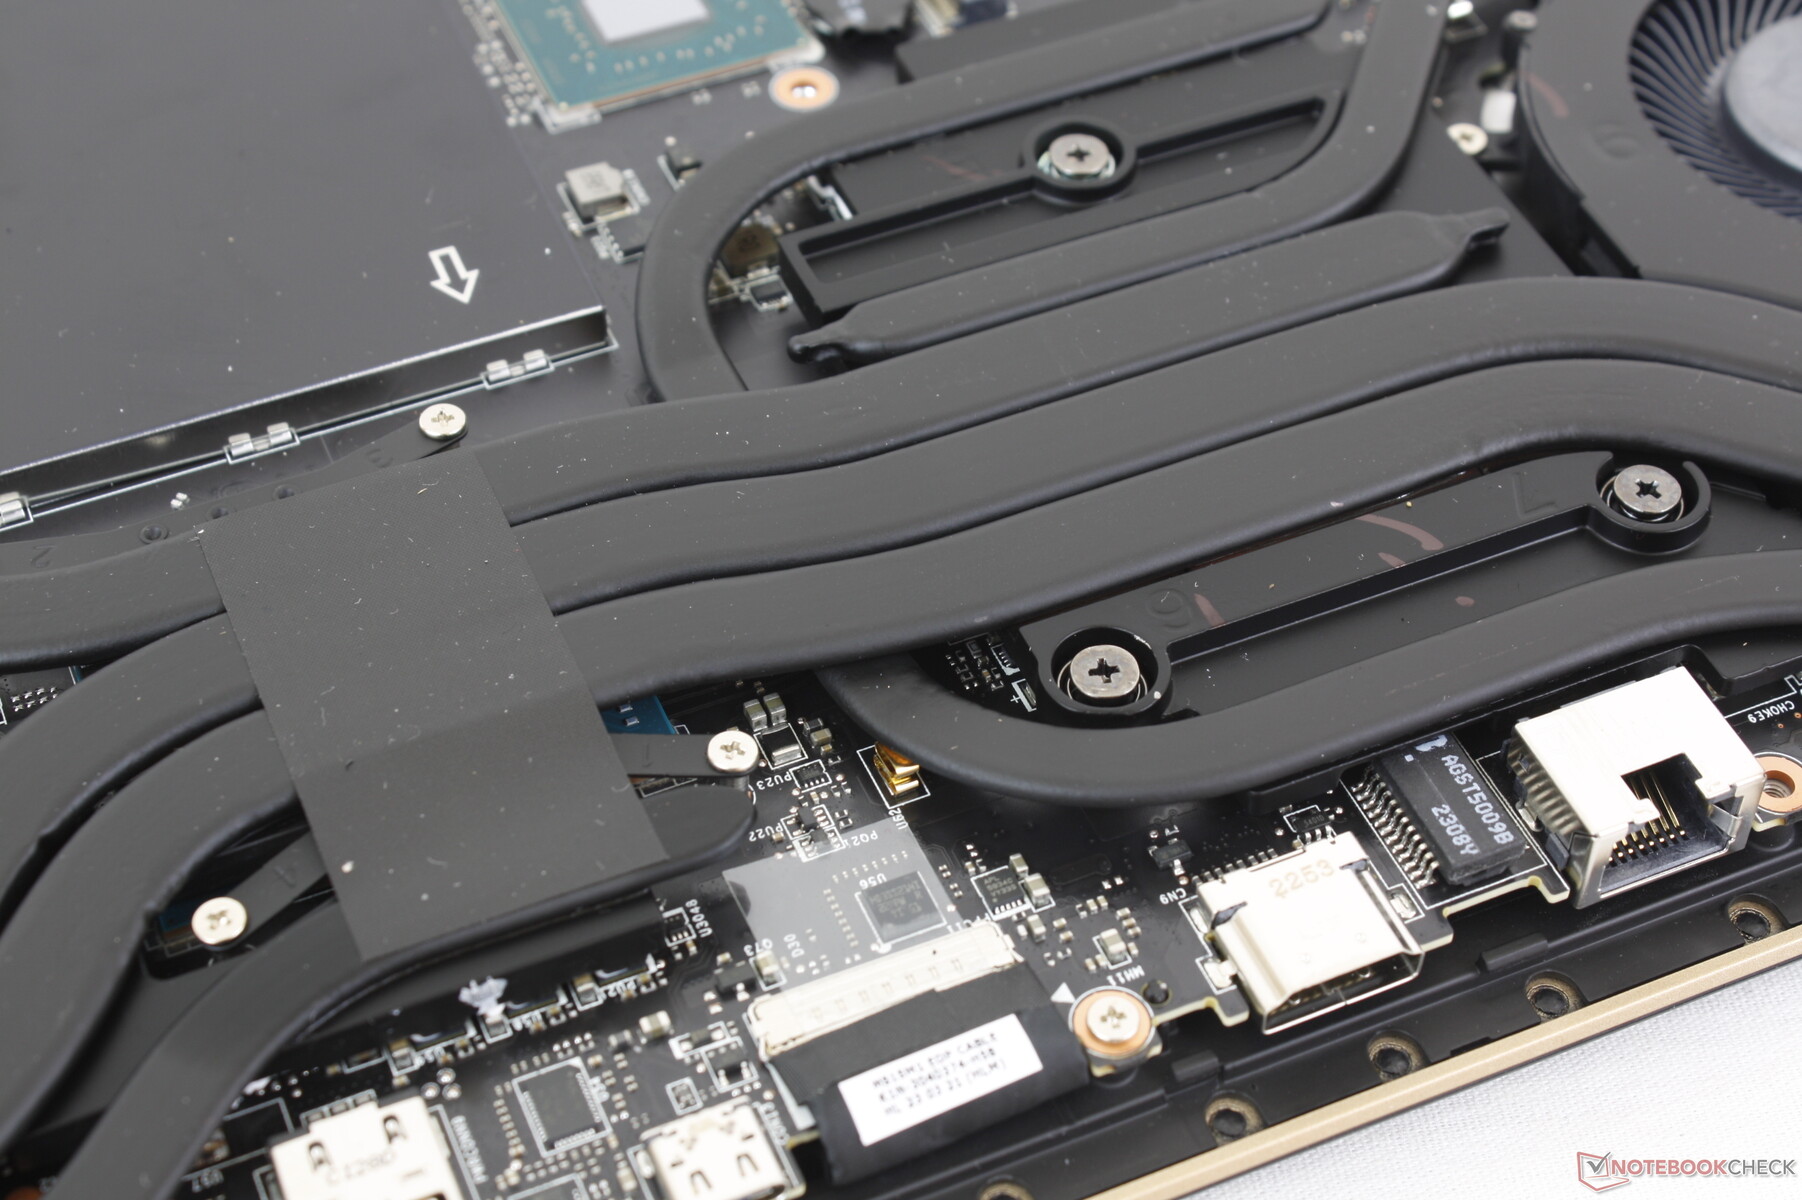
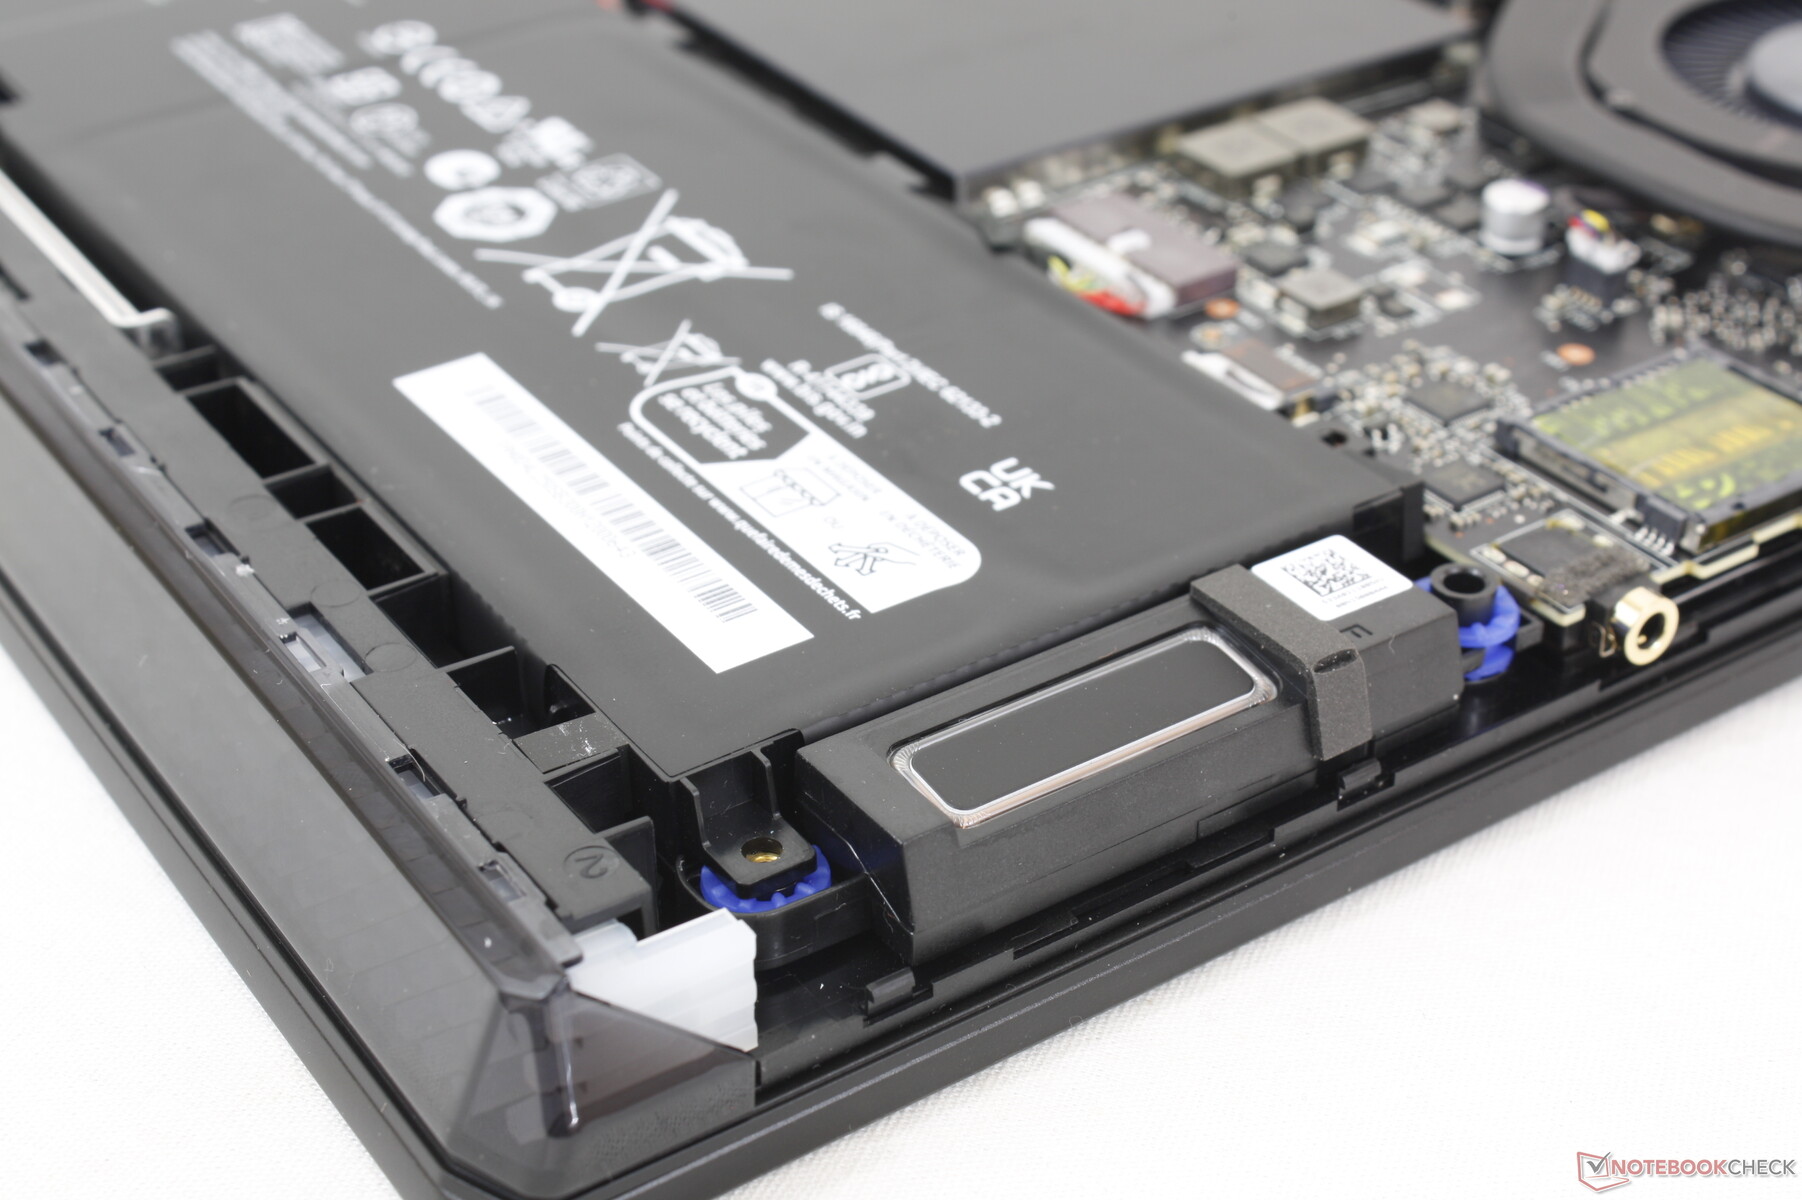
Manutenção
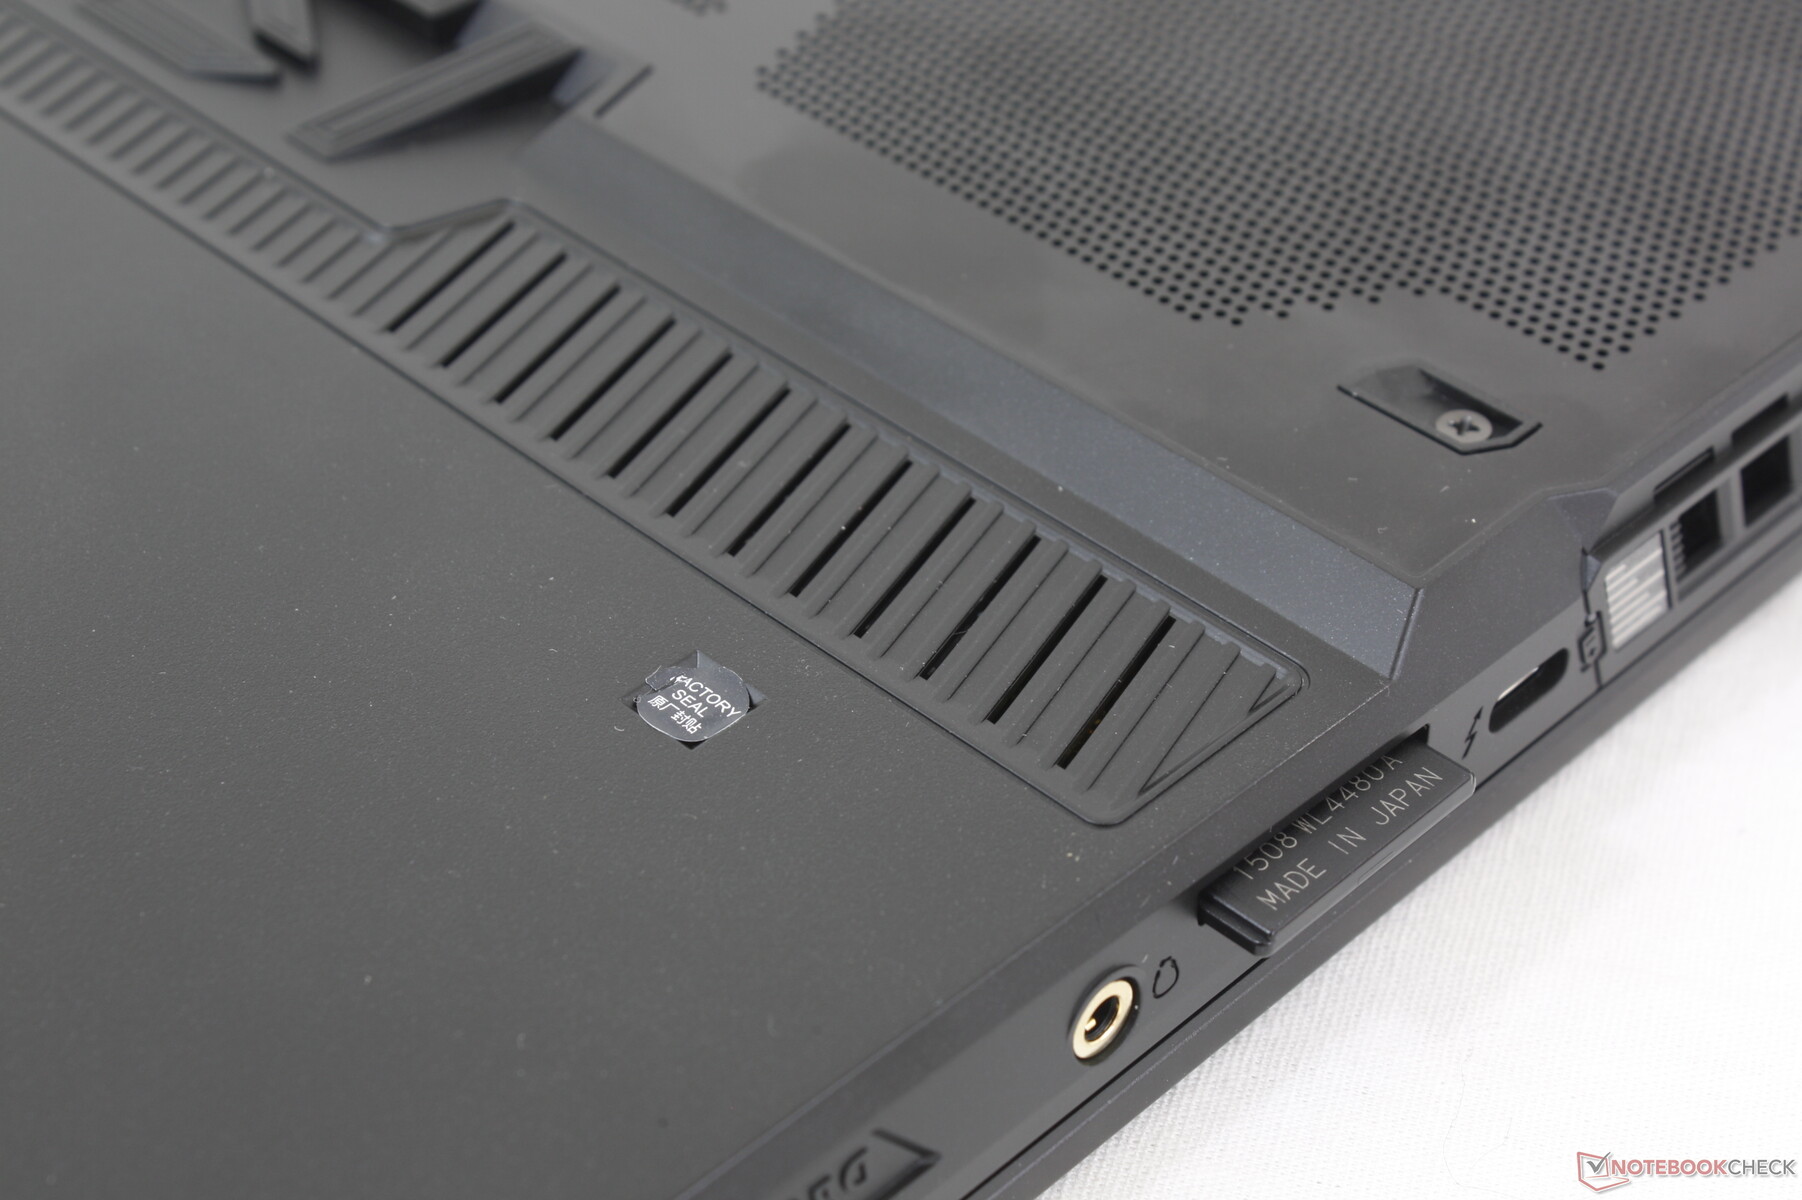
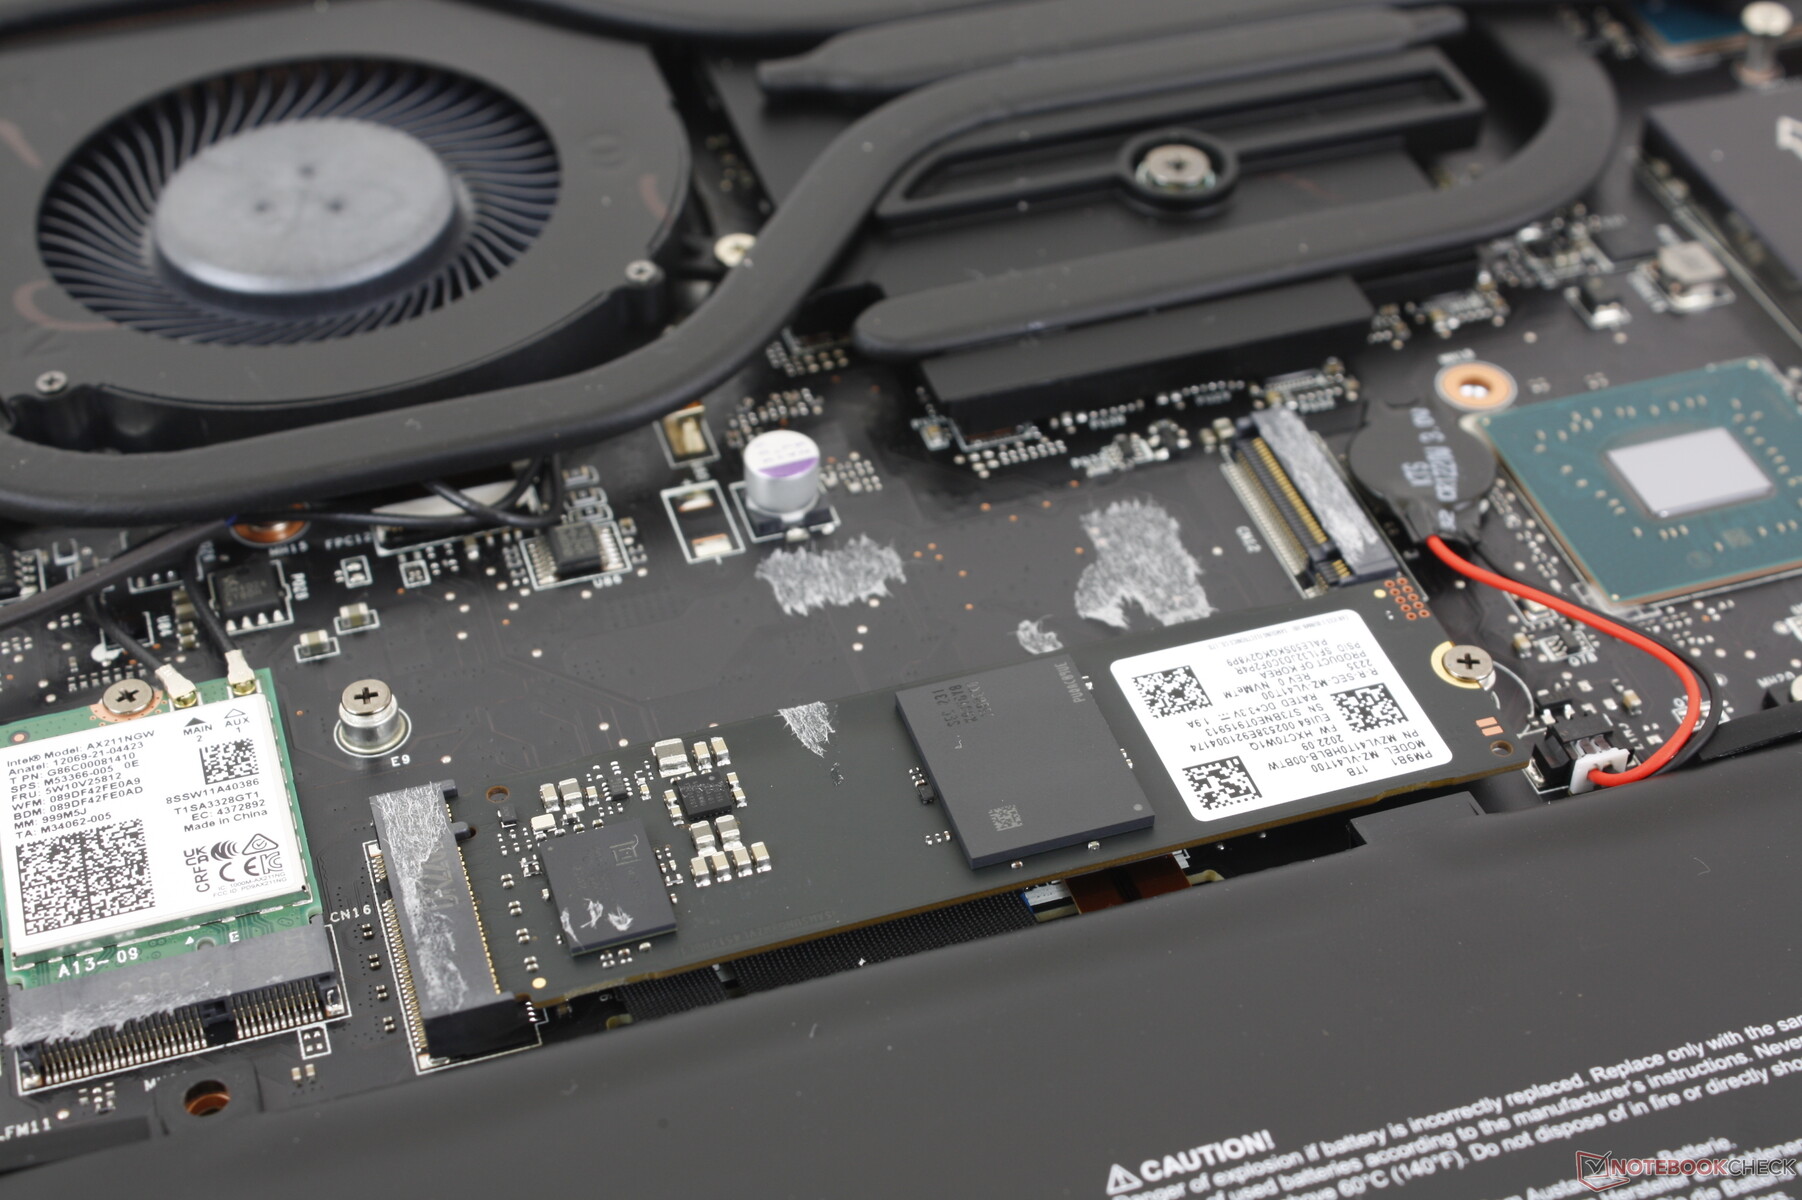
Infelizmente, os notebooks MSI estão se tornando mais difíceis de serem reparados atualmente. O painel inferior é fixado por 13 parafusos Phillips, um dos quais está atrás de um adesivo adesivo anti-violação para desencorajar a manutenção pelo usuário final. O principal problema é que os ganchos de plástico ao longo das bordas do painel são angulados e firmemente presos à base, especialmente na parte traseira. Esses ganchos são difíceis de serem removidos e ainda mais difíceis de serem reinstalados.
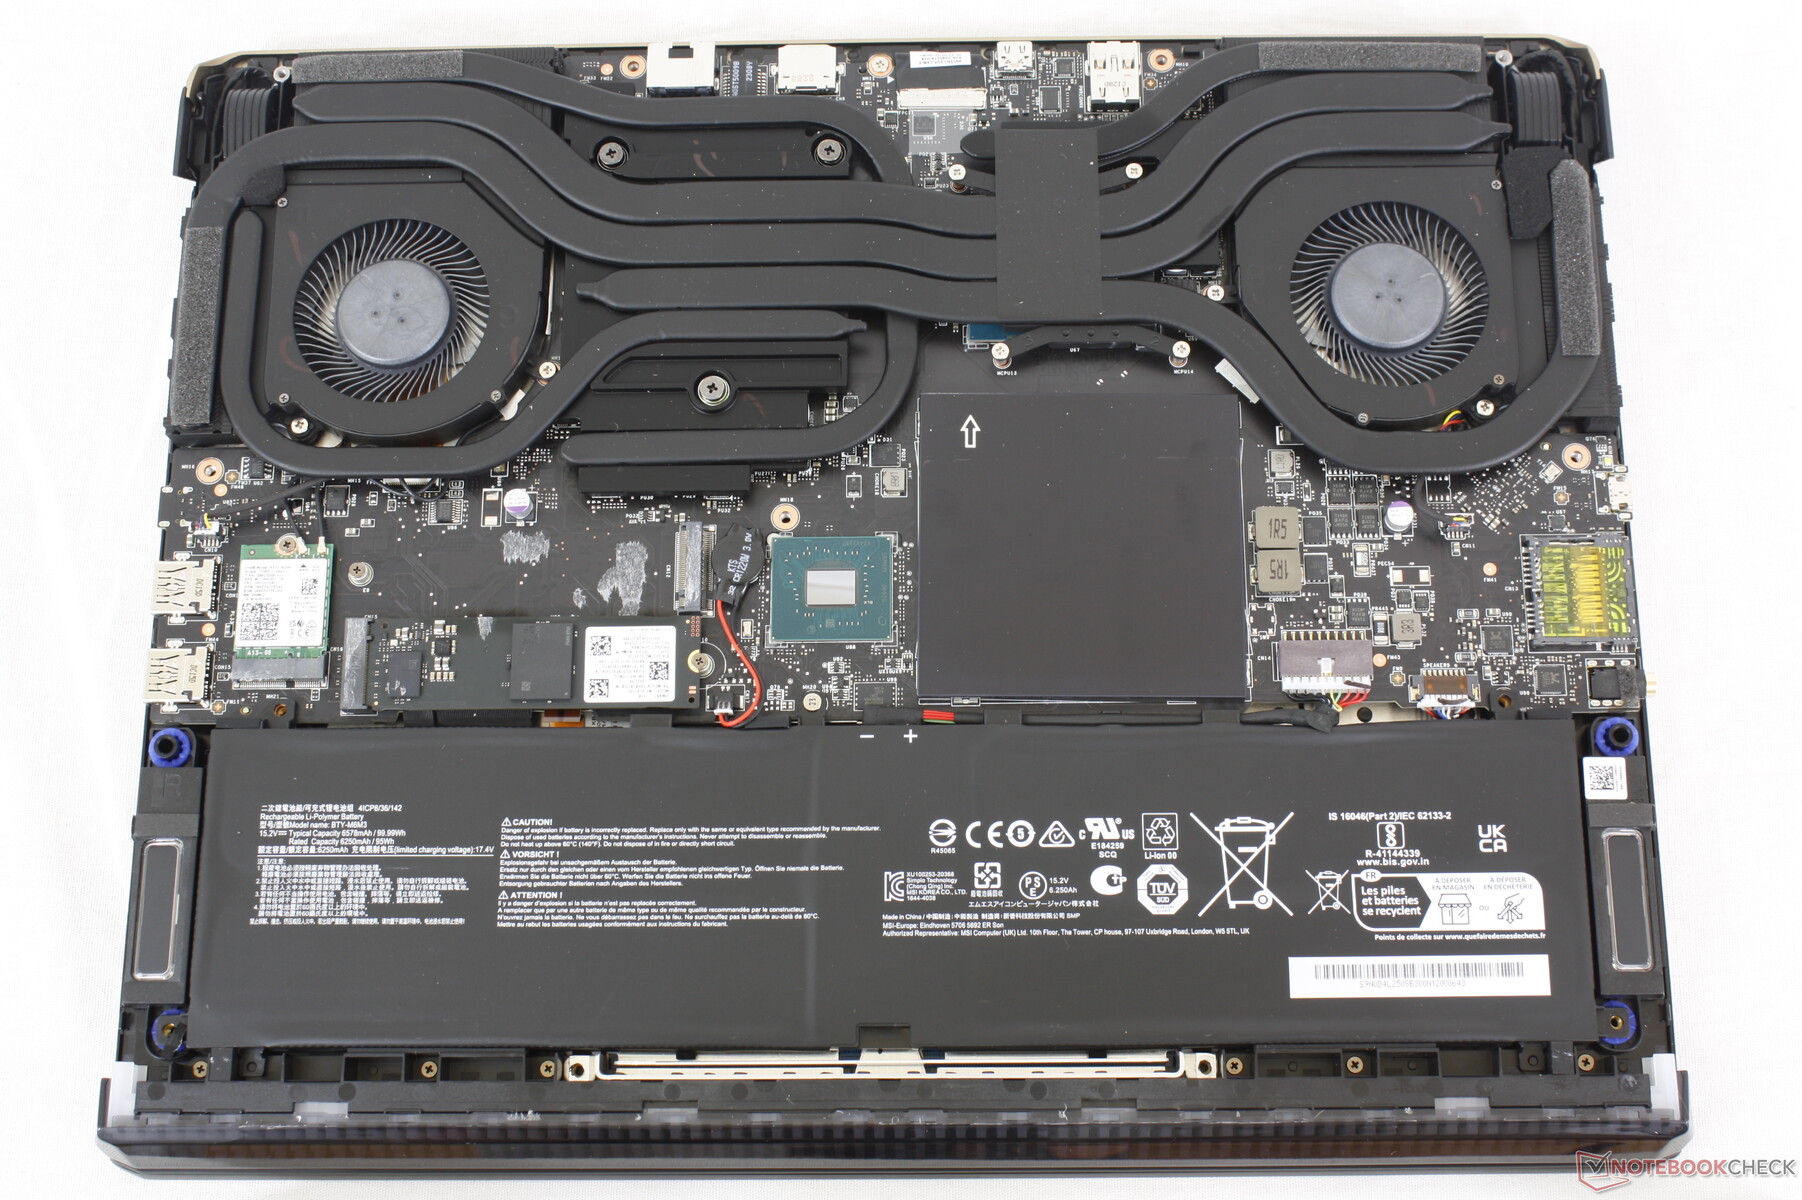
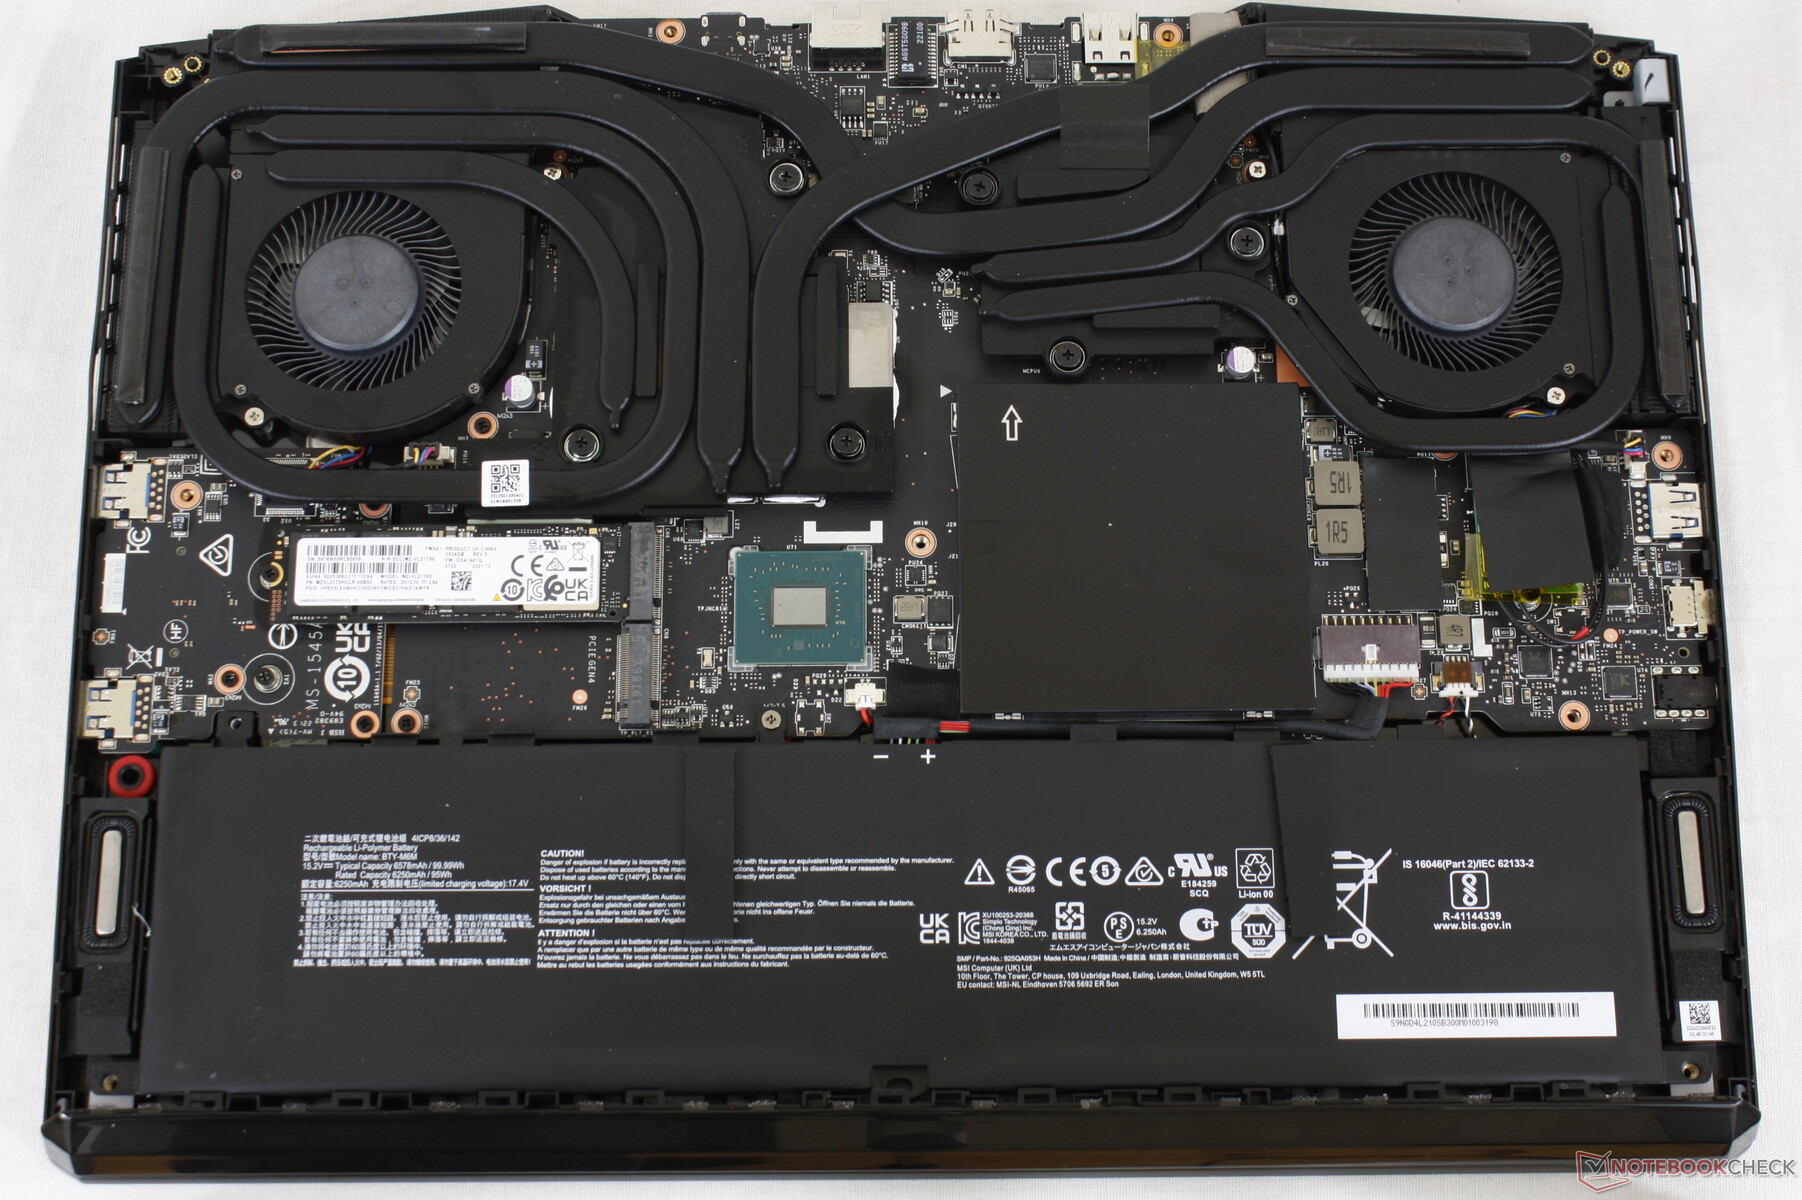
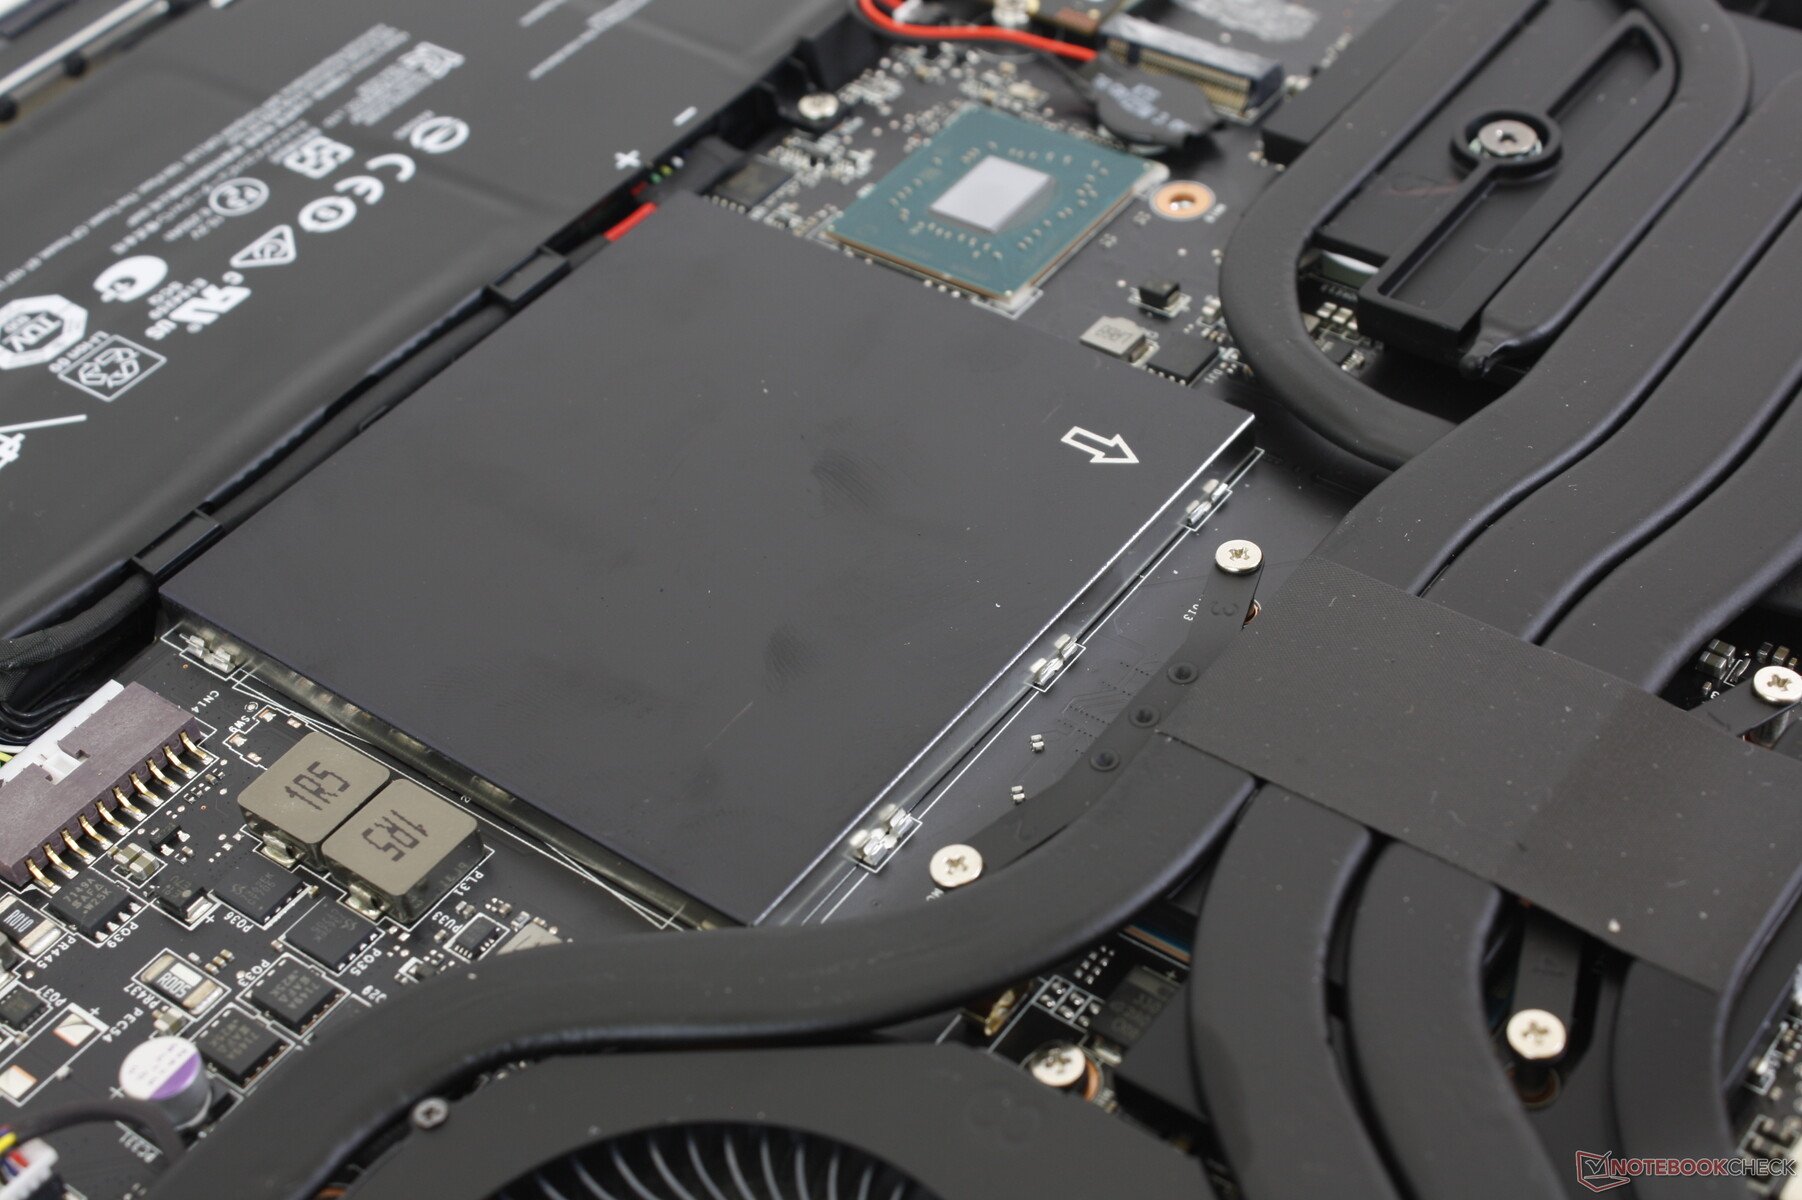
Os usuários têm acesso direto aos dois compartimentos de armazenamento M.2 2280, aos dois slots DDR5 SODIMM, ao módulo WLAN e à bateria quando estão dentro do gabinete.
Acessórios e garantia
A caixa de varejo inclui um pano de limpeza, além do adaptador CA e da documentação. Uma garantia limitada de um ano do fabricante se aplica se for comprada nos EUA.
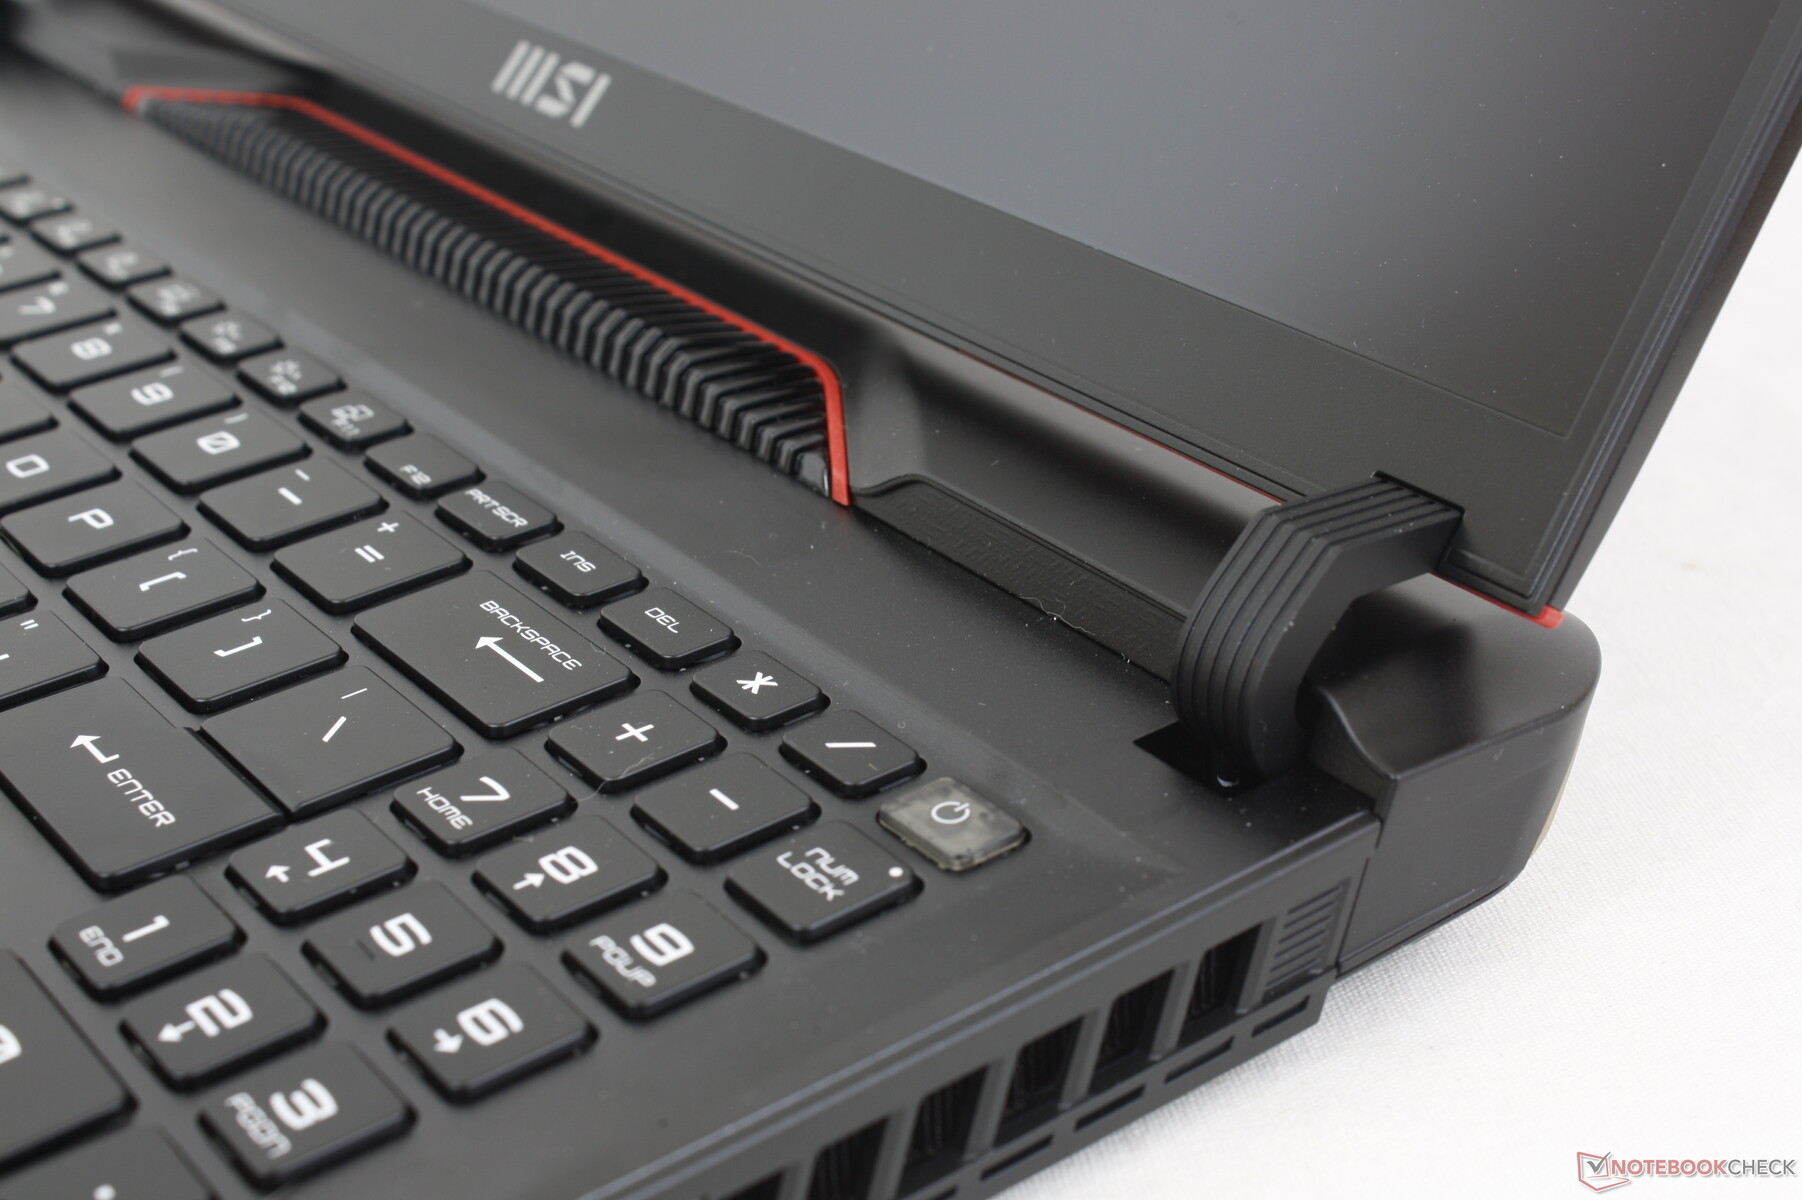
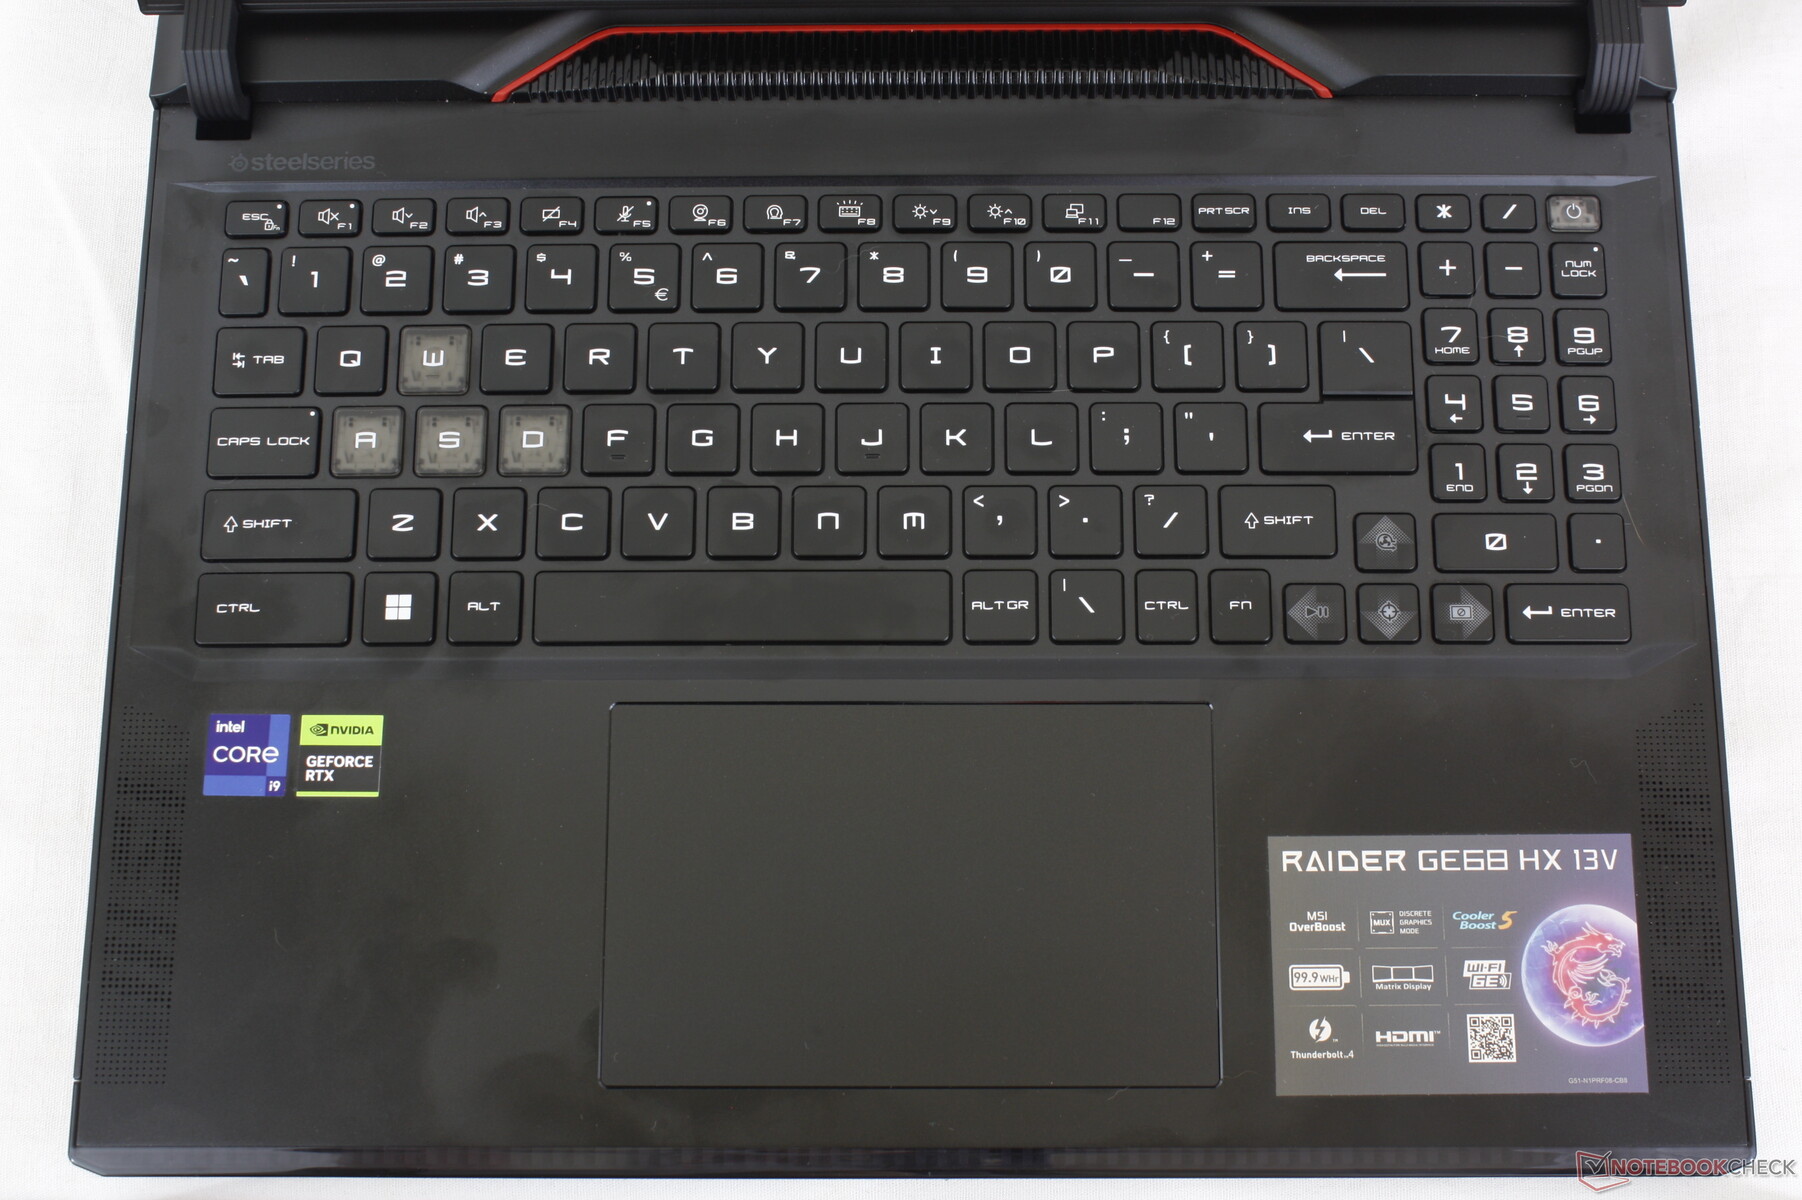
Dispositivos de entrada - Clickpad maior e novo Numpad
Teclado
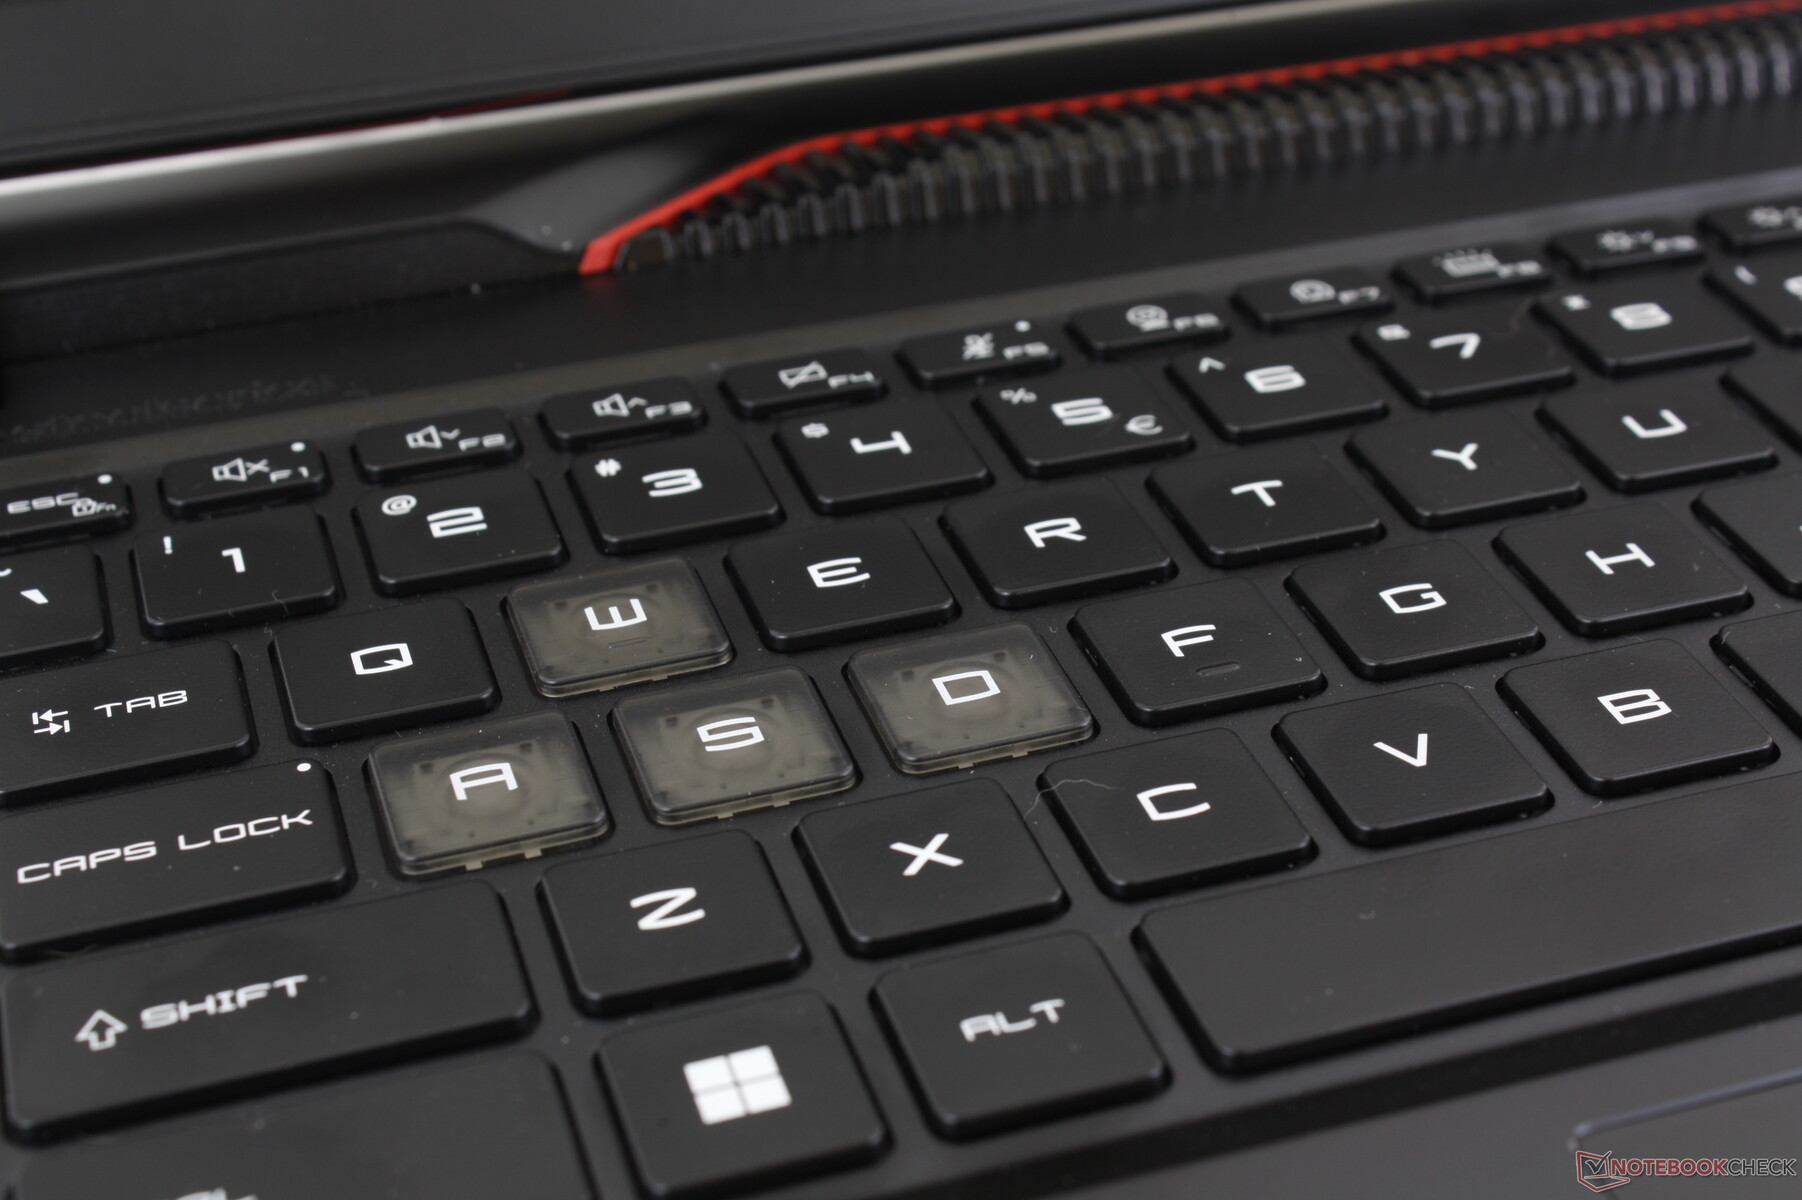
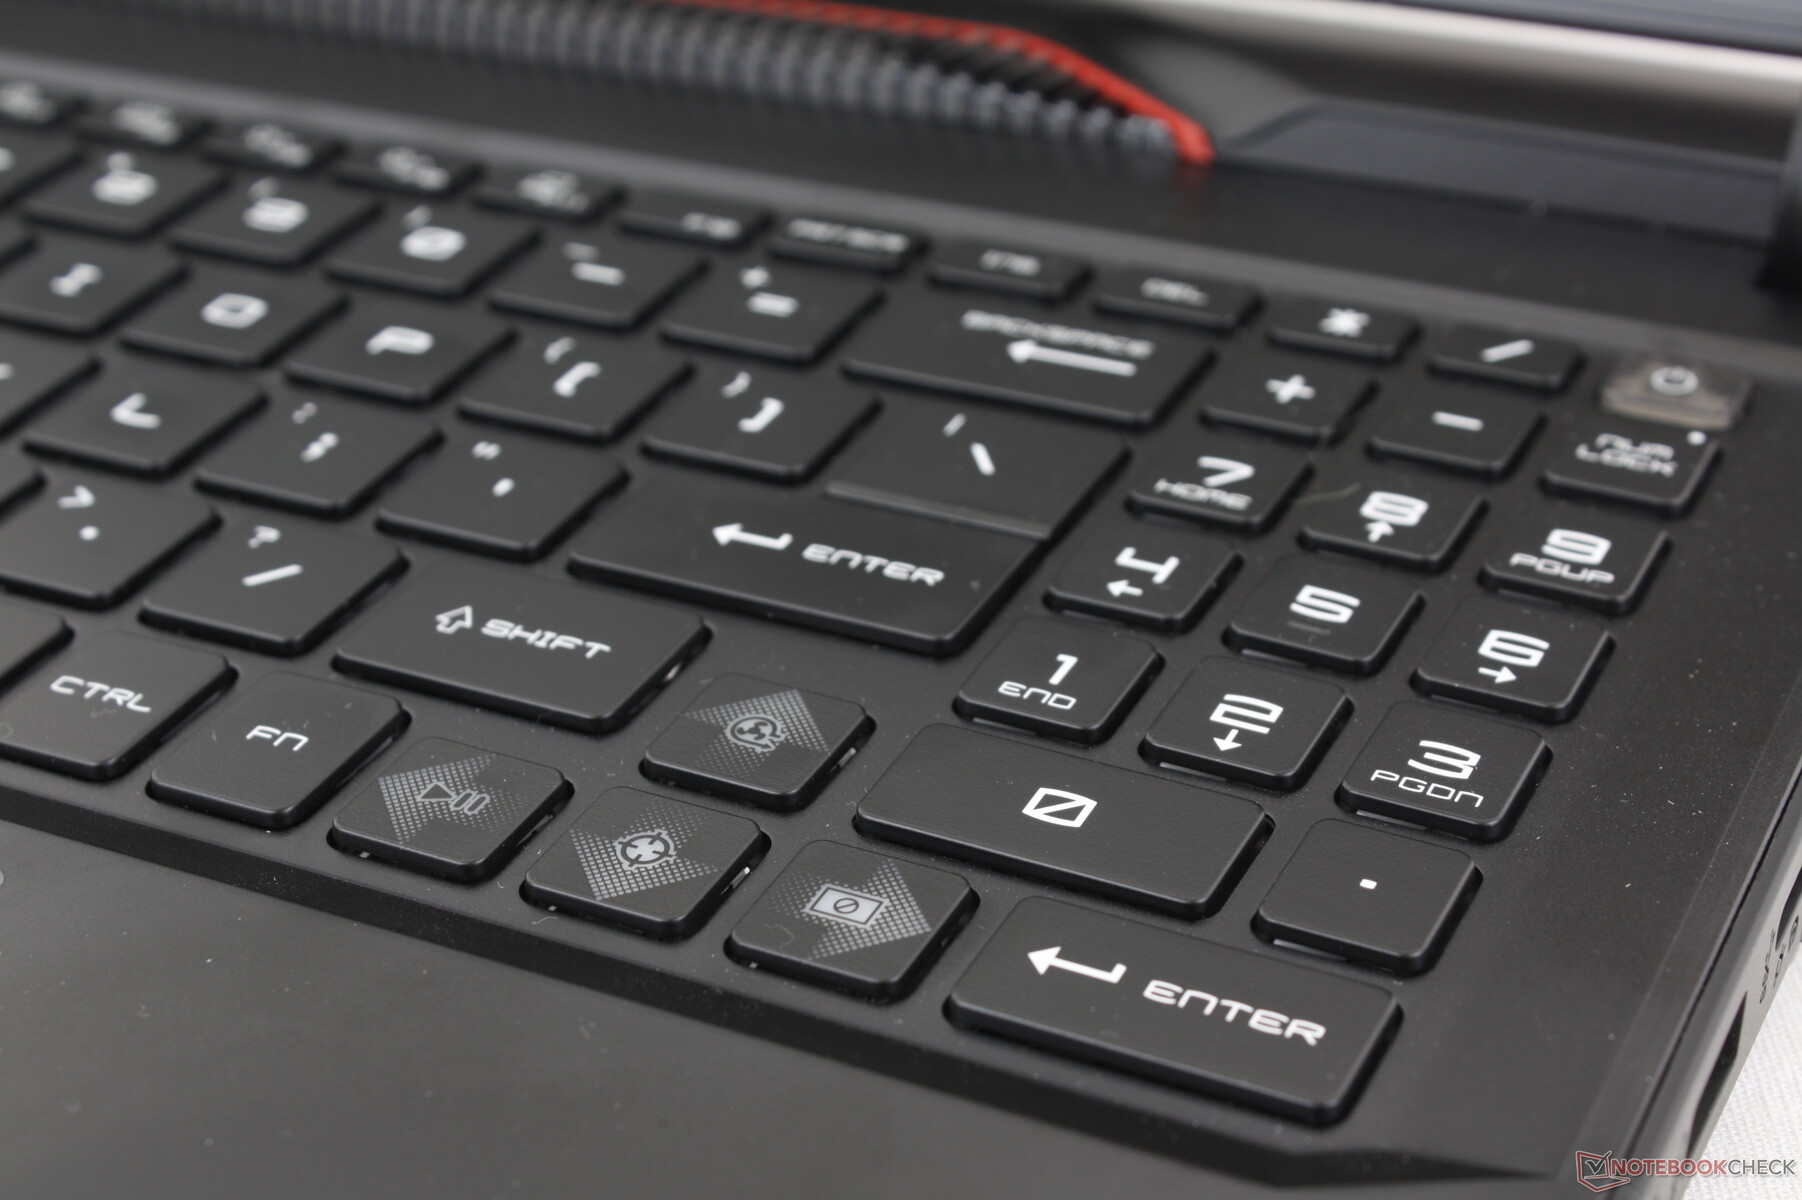
A MSI reformulou o layout do teclado em comparação com o GE67HX. Agora, há um teclado numérico integrado, enquanto as teclas Ctrl e Fn não estão mais espremidas de forma incômoda. Infelizmente, o tamanho das teclas de seta foi reduzido para dar espaço ao novo teclado numérico.
A resposta das teclas é excelente, com resposta firme e uniforme entre as principais teclas QWERTY. As teclas de espaço e Enter, em particular, são visivelmente mais altas, proporcionando uma sensação mais satisfatória.
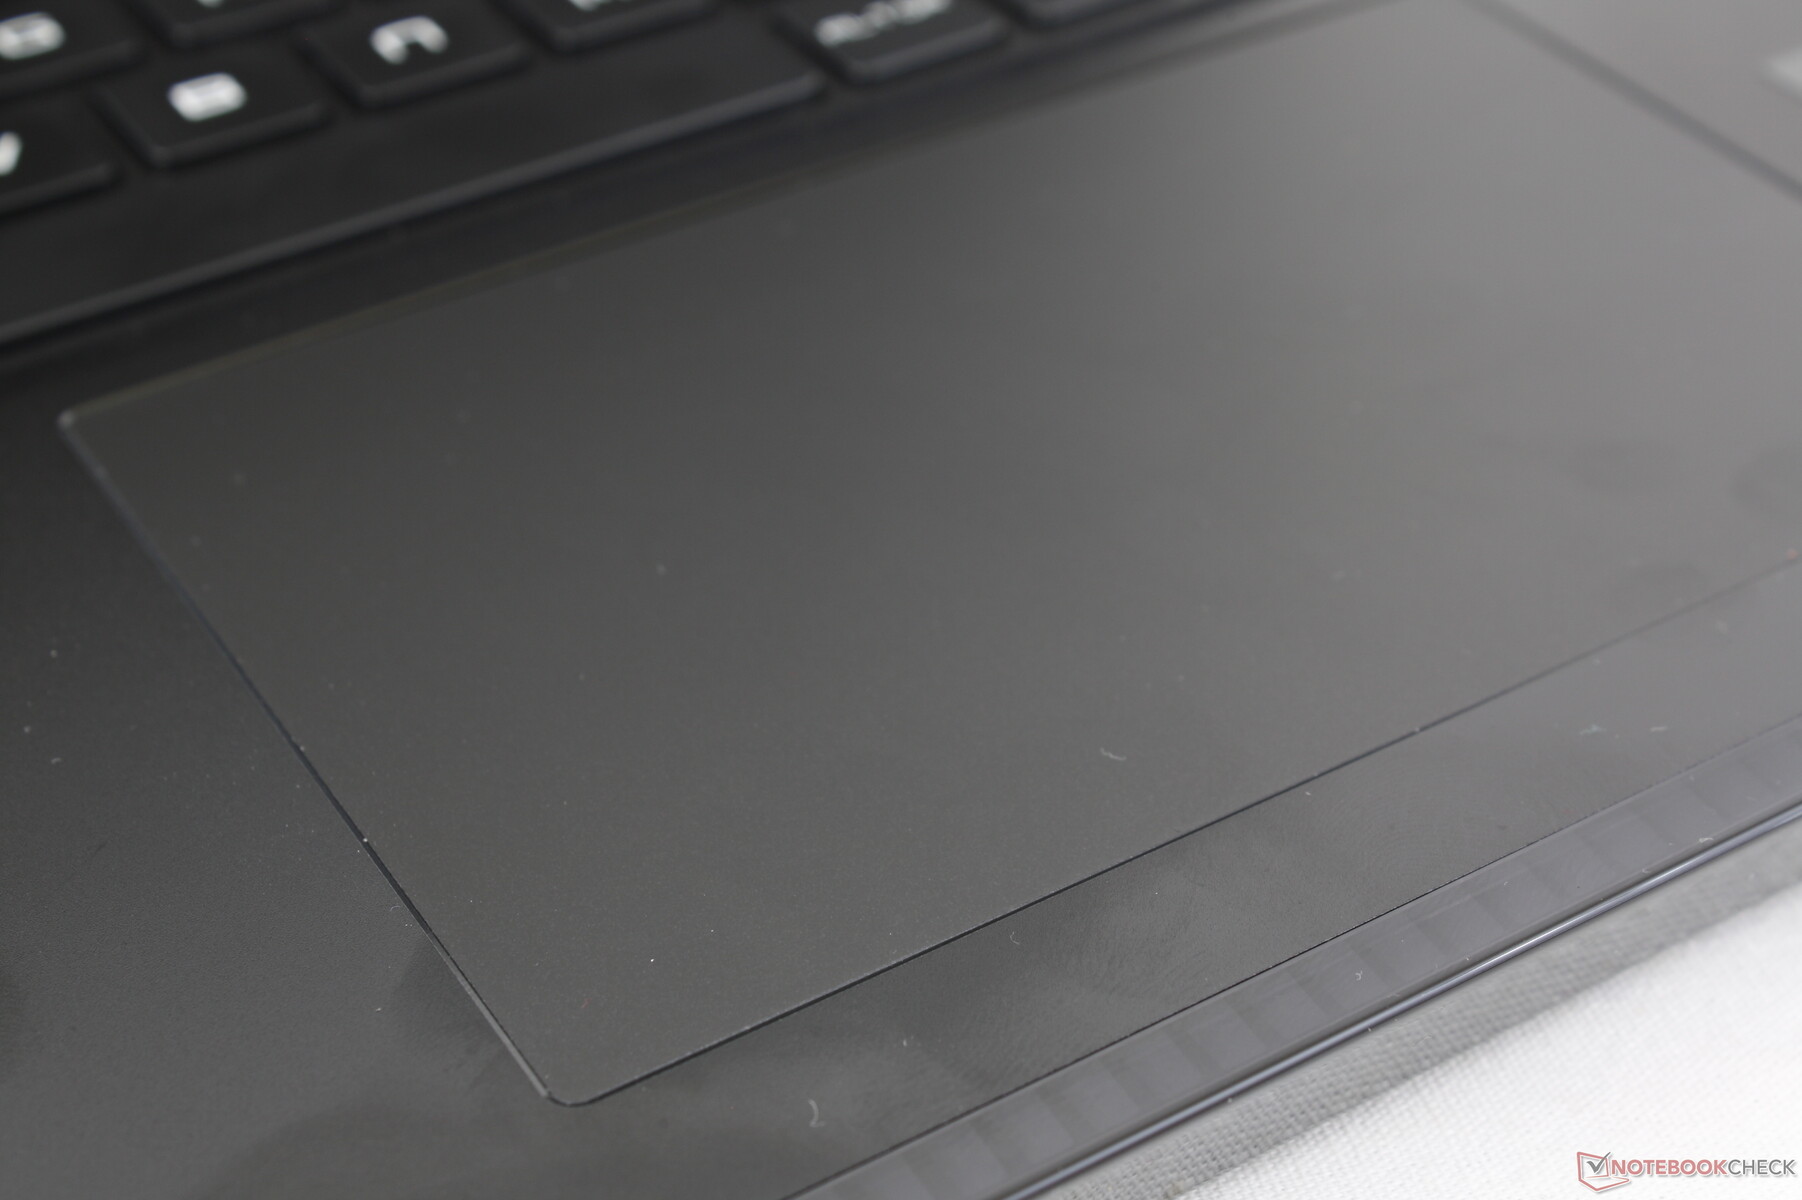
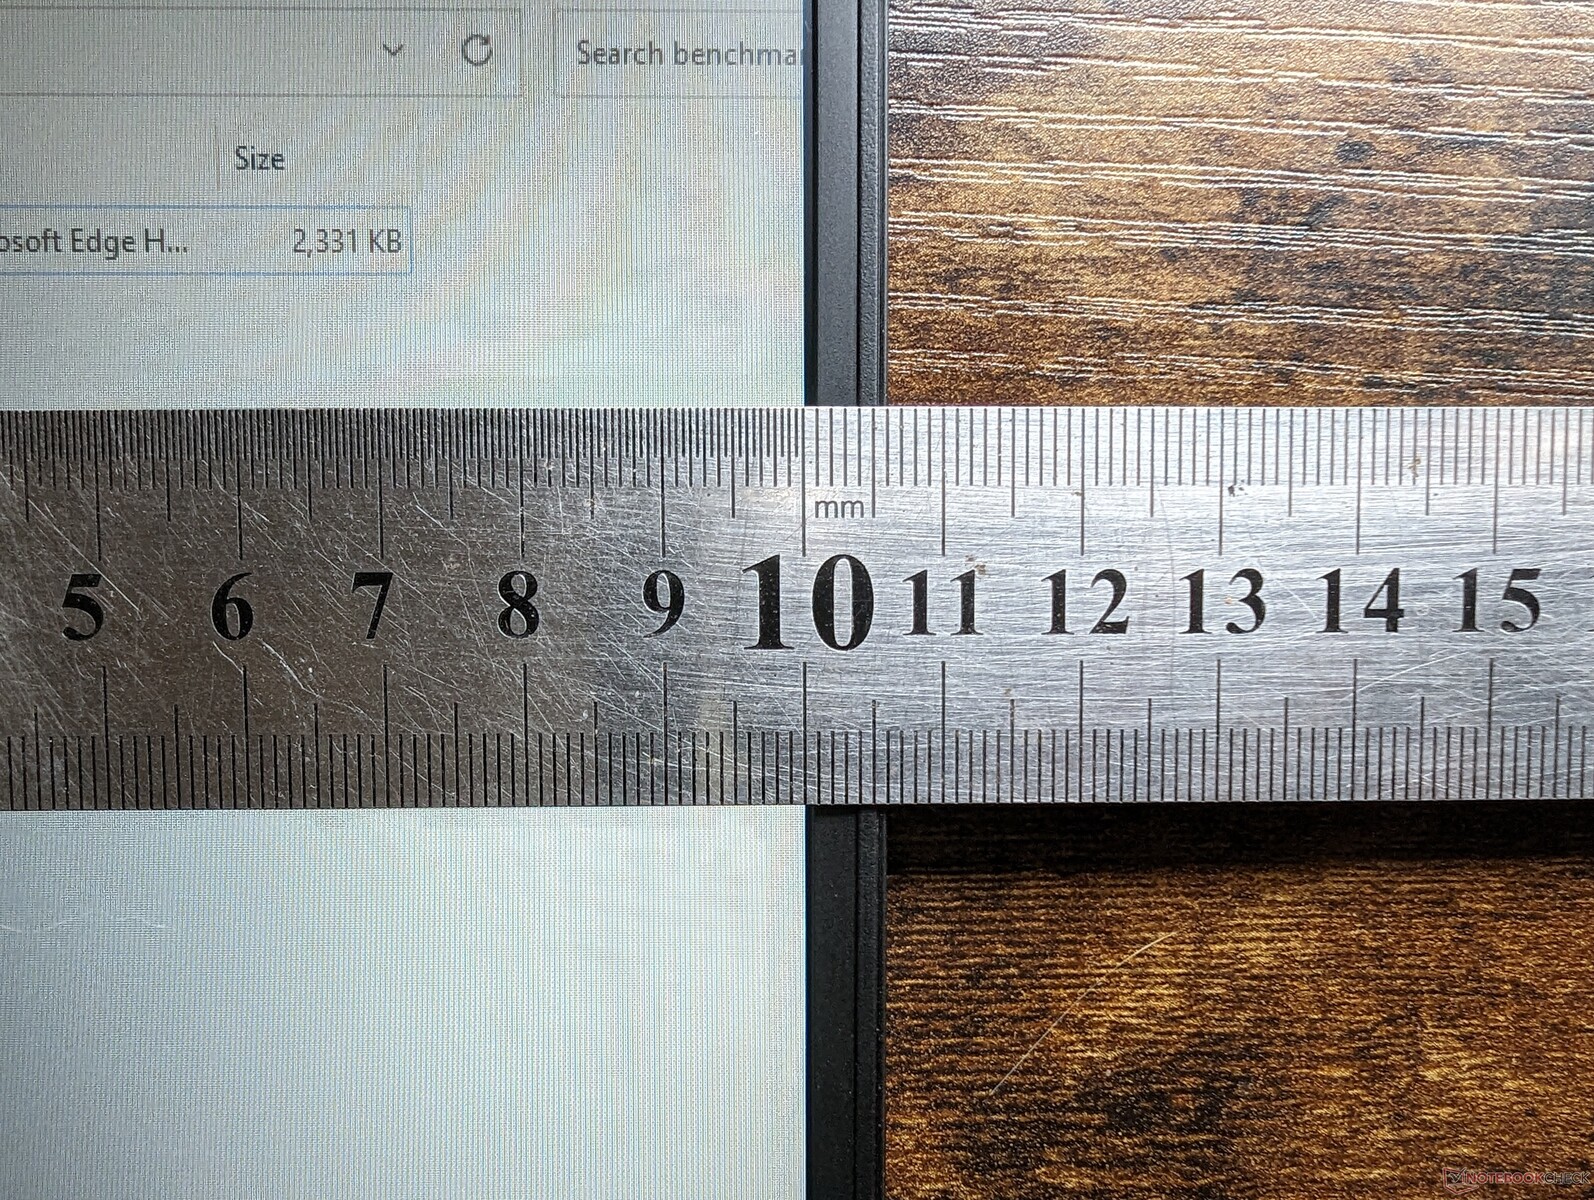
Touchpad
O tamanho do clickpad aumentou significativamente de apenas 10,5 x 6,5 cm no GE67HX para 13 x 8,3 cm no GE68HX. O deslizamento é muito suave e responsivo e quase não apresenta aderência, mesmo quando se move em velocidades mais lentas. Os cliques também são satisfatórios, mas o feedback não é perfeitamente uniforme, pois parece mais fácil quando se pressiona o centro, enquanto os cantos inferiores parecem mais esponjosos.
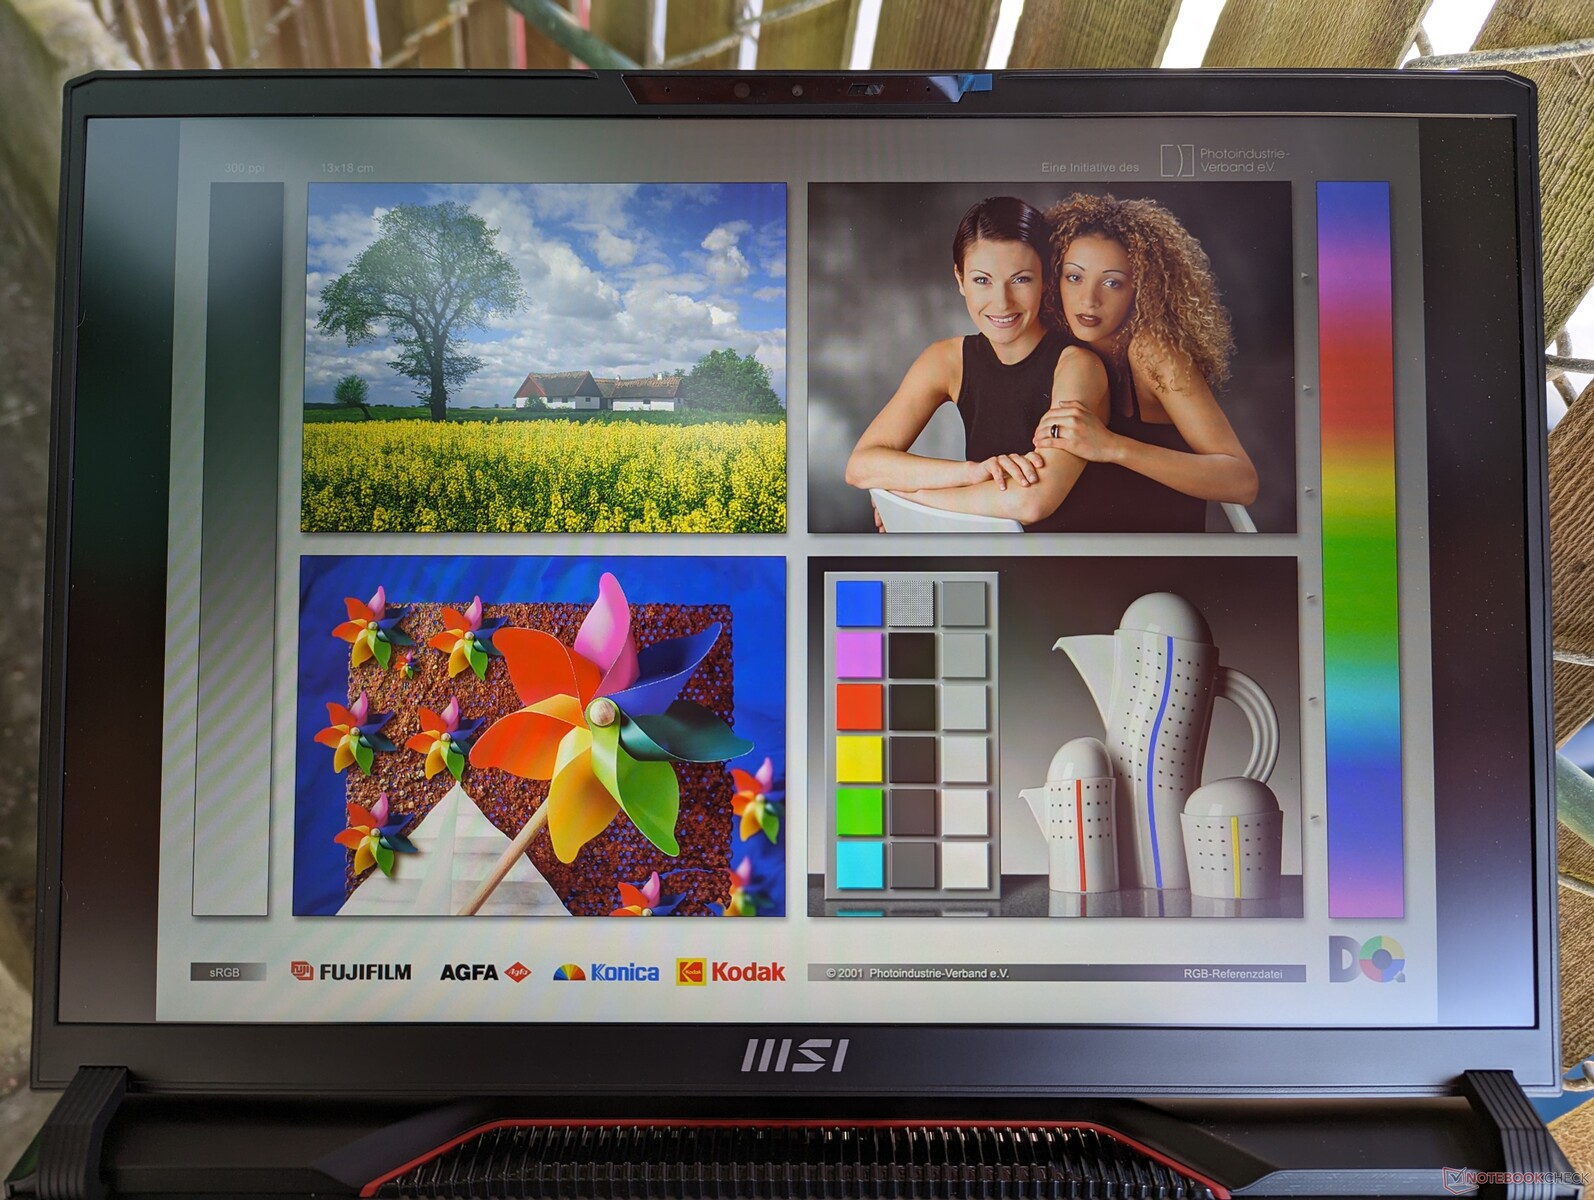
Tela - cores ruins
O Raider GE68HX é fornecido com duas opções diferentes de painel. Nossa unidade de análise específica vem com a opção em negrito abaixo:
- 2560 x 1600, 240 Hz, 100% DCI-P3, 3 ms, IPS
- 1920 x 1200, 144 Hz, 60% sRGB, 11 ms, IPS
A opção mais barata, de 144 Hz, não é recomendada devido à sua cobertura de cores mais estreita e aos tempos de resposta mais lentos, o que resulta em um efeito fantasma mais perceptível. As cores mais rasas são difíceis de ignorar, mesmo que você não faça muita edição de gráficos. Esse painel é mais adequado para laptops para jogos mais baratos, como o MSI Pulse 17 onde faixas de cores estreitas são comuns.
O G-Sync está notavelmente ausente em todas as configurações atuais do GE68HX.
| |||||||||||||||||||||||||
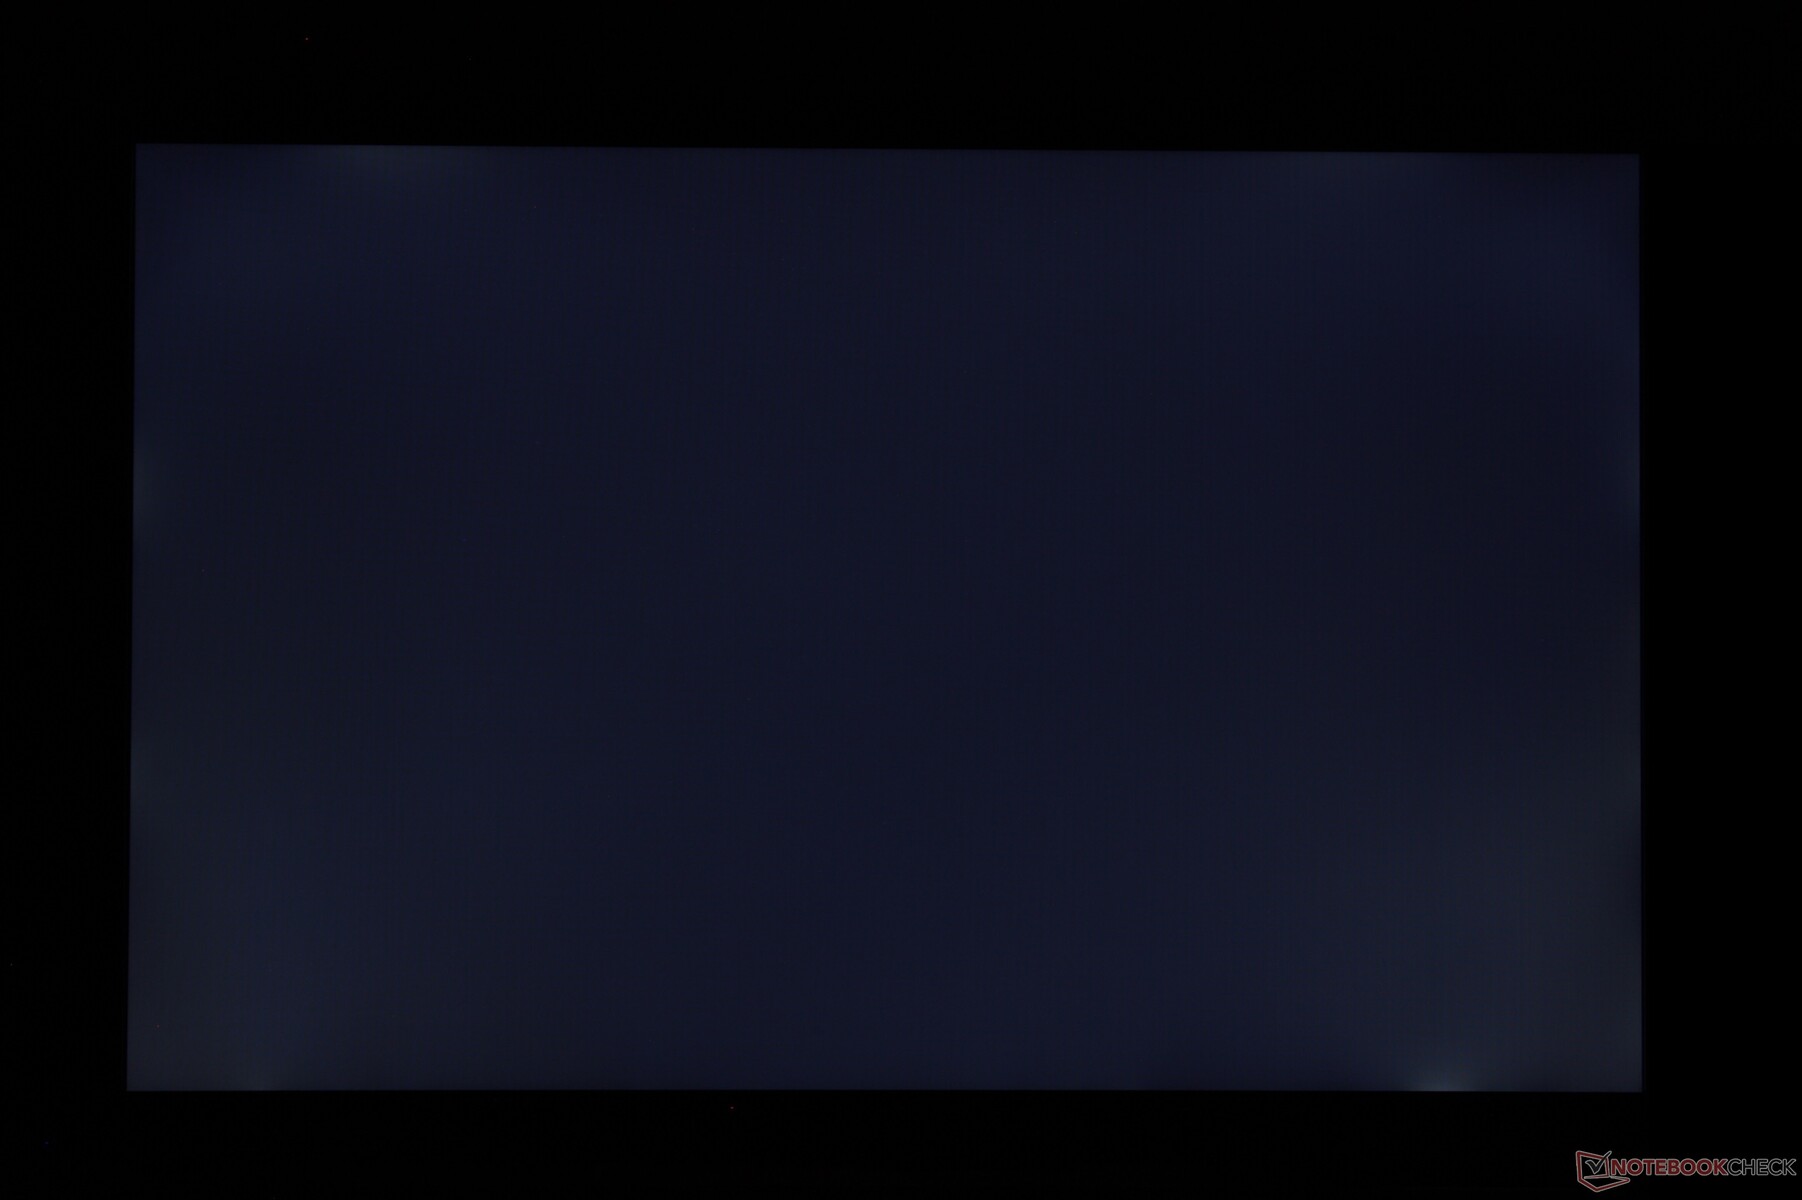
iluminação: 93 %
iluminação com acumulador: 300.9 cd/m²
Contraste: 971:1 (Preto: 0.31 cd/m²)
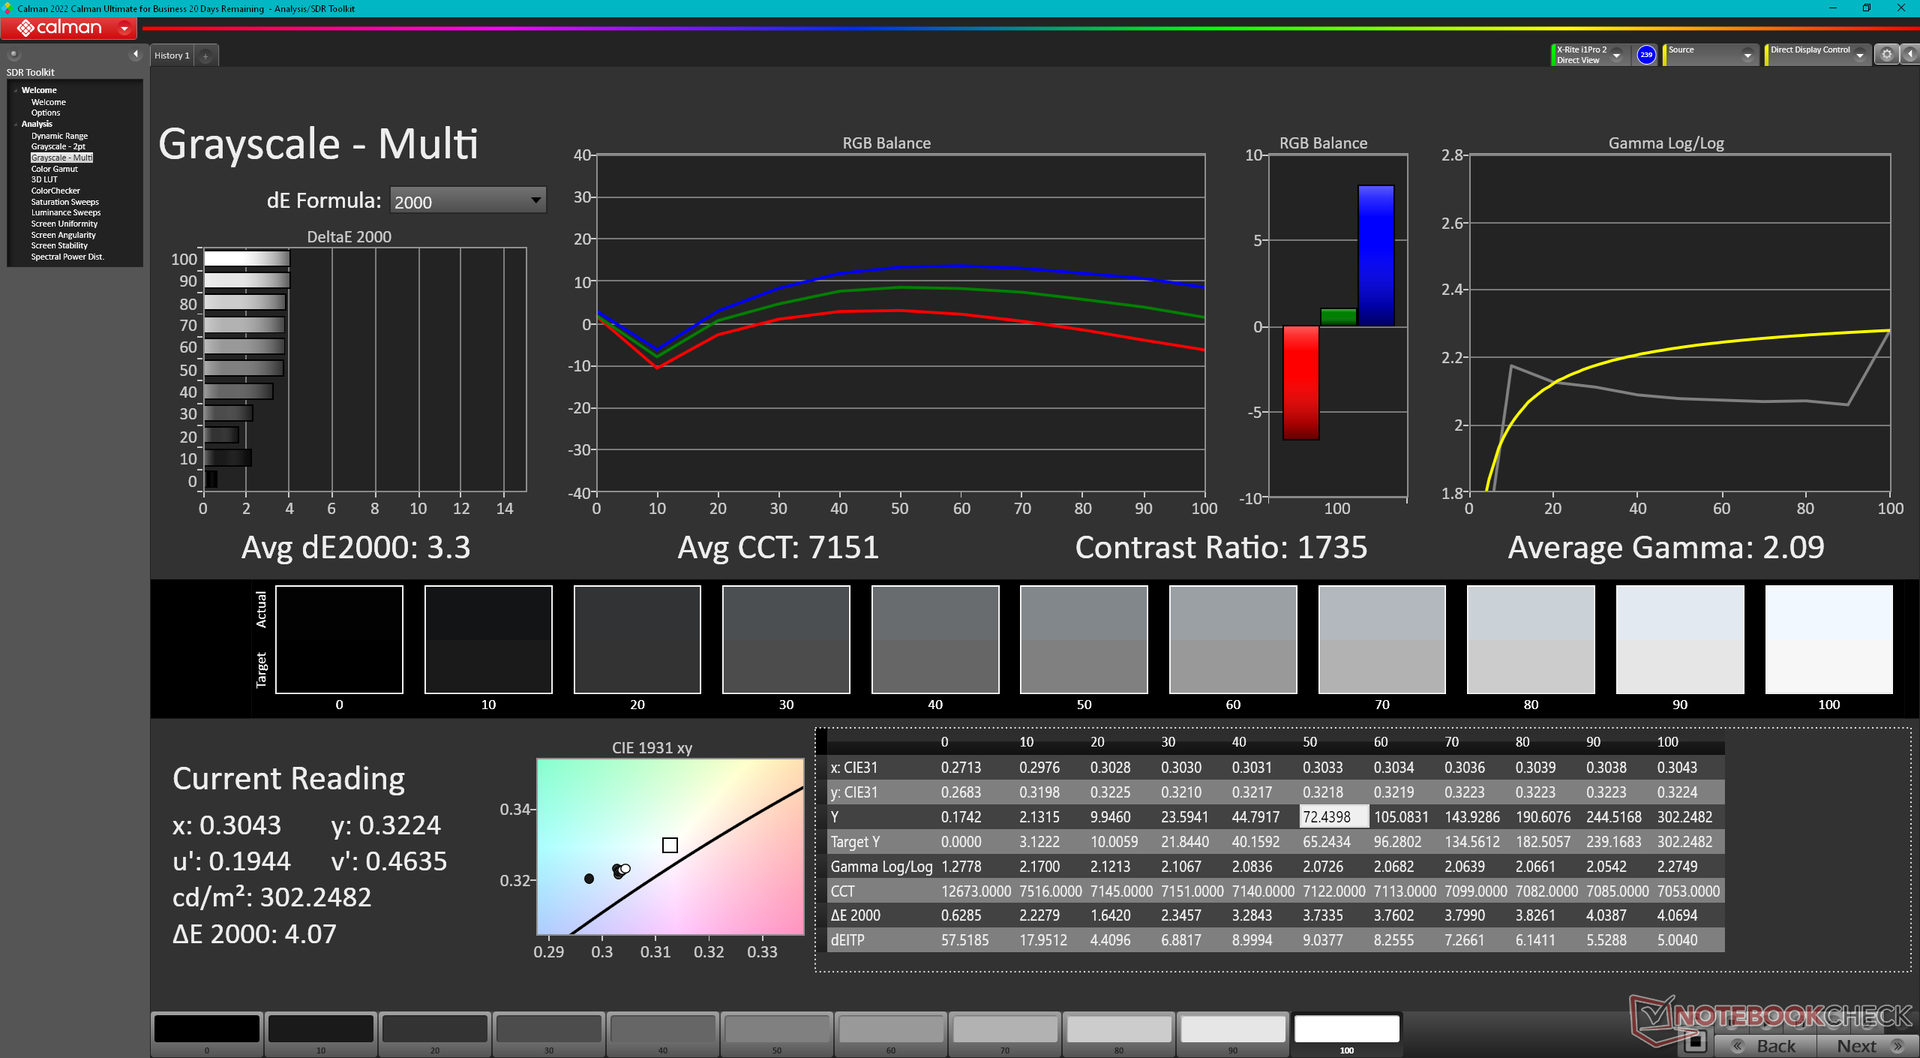
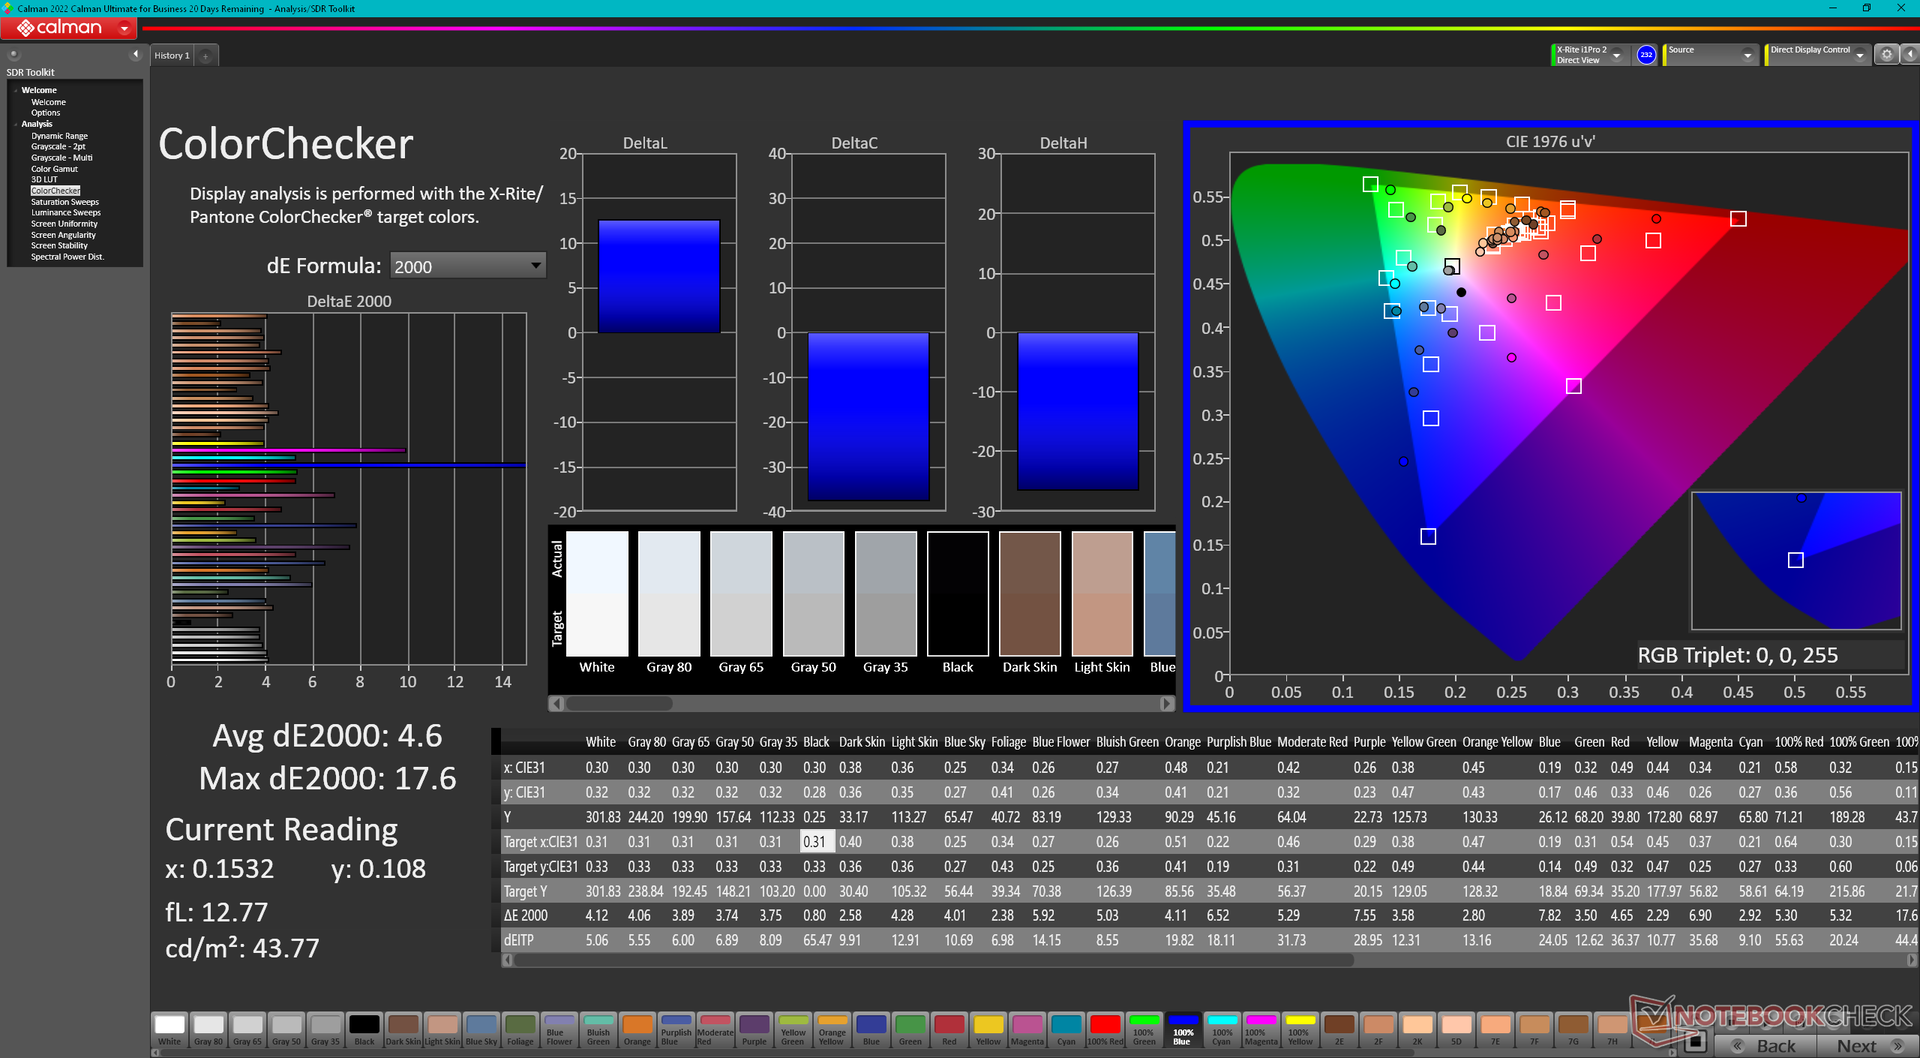
ΔE ColorChecker Calman: 4.6 | ∀{0.5-29.43 Ø4.71}
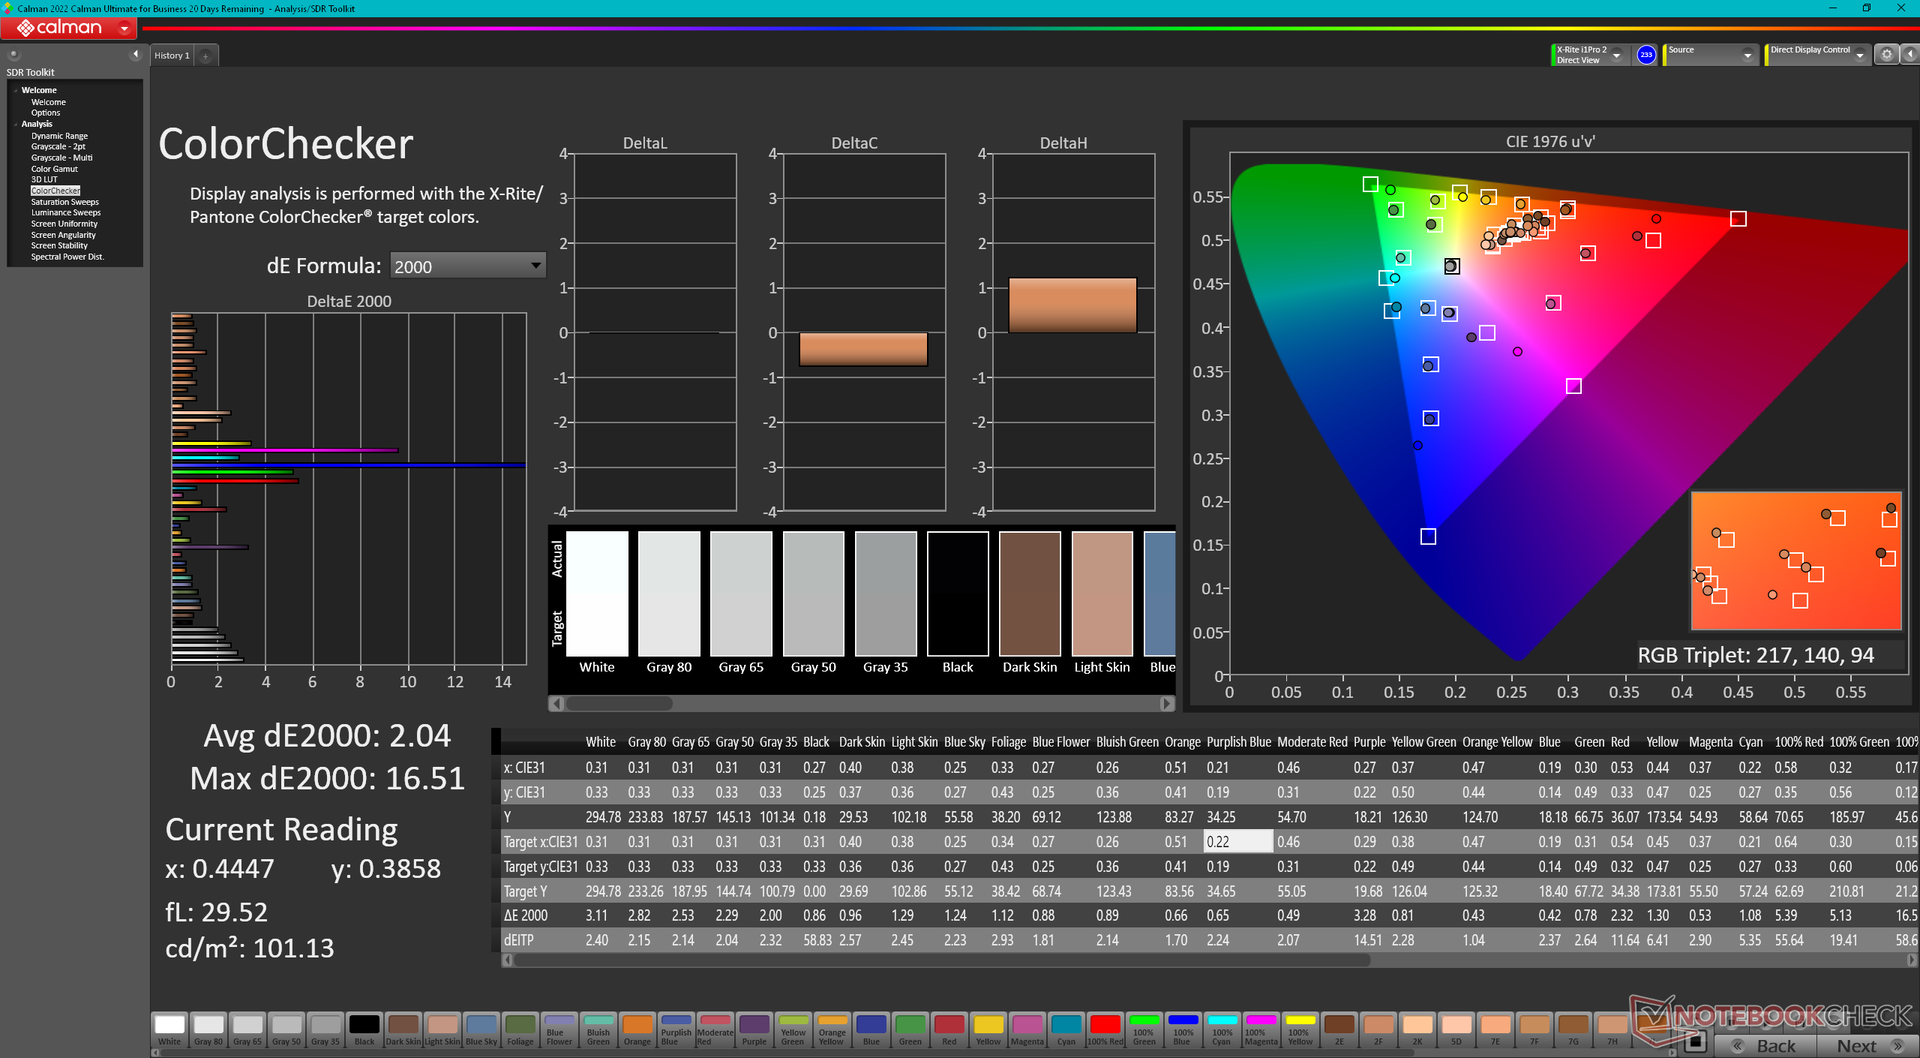
calibrated: 2.04
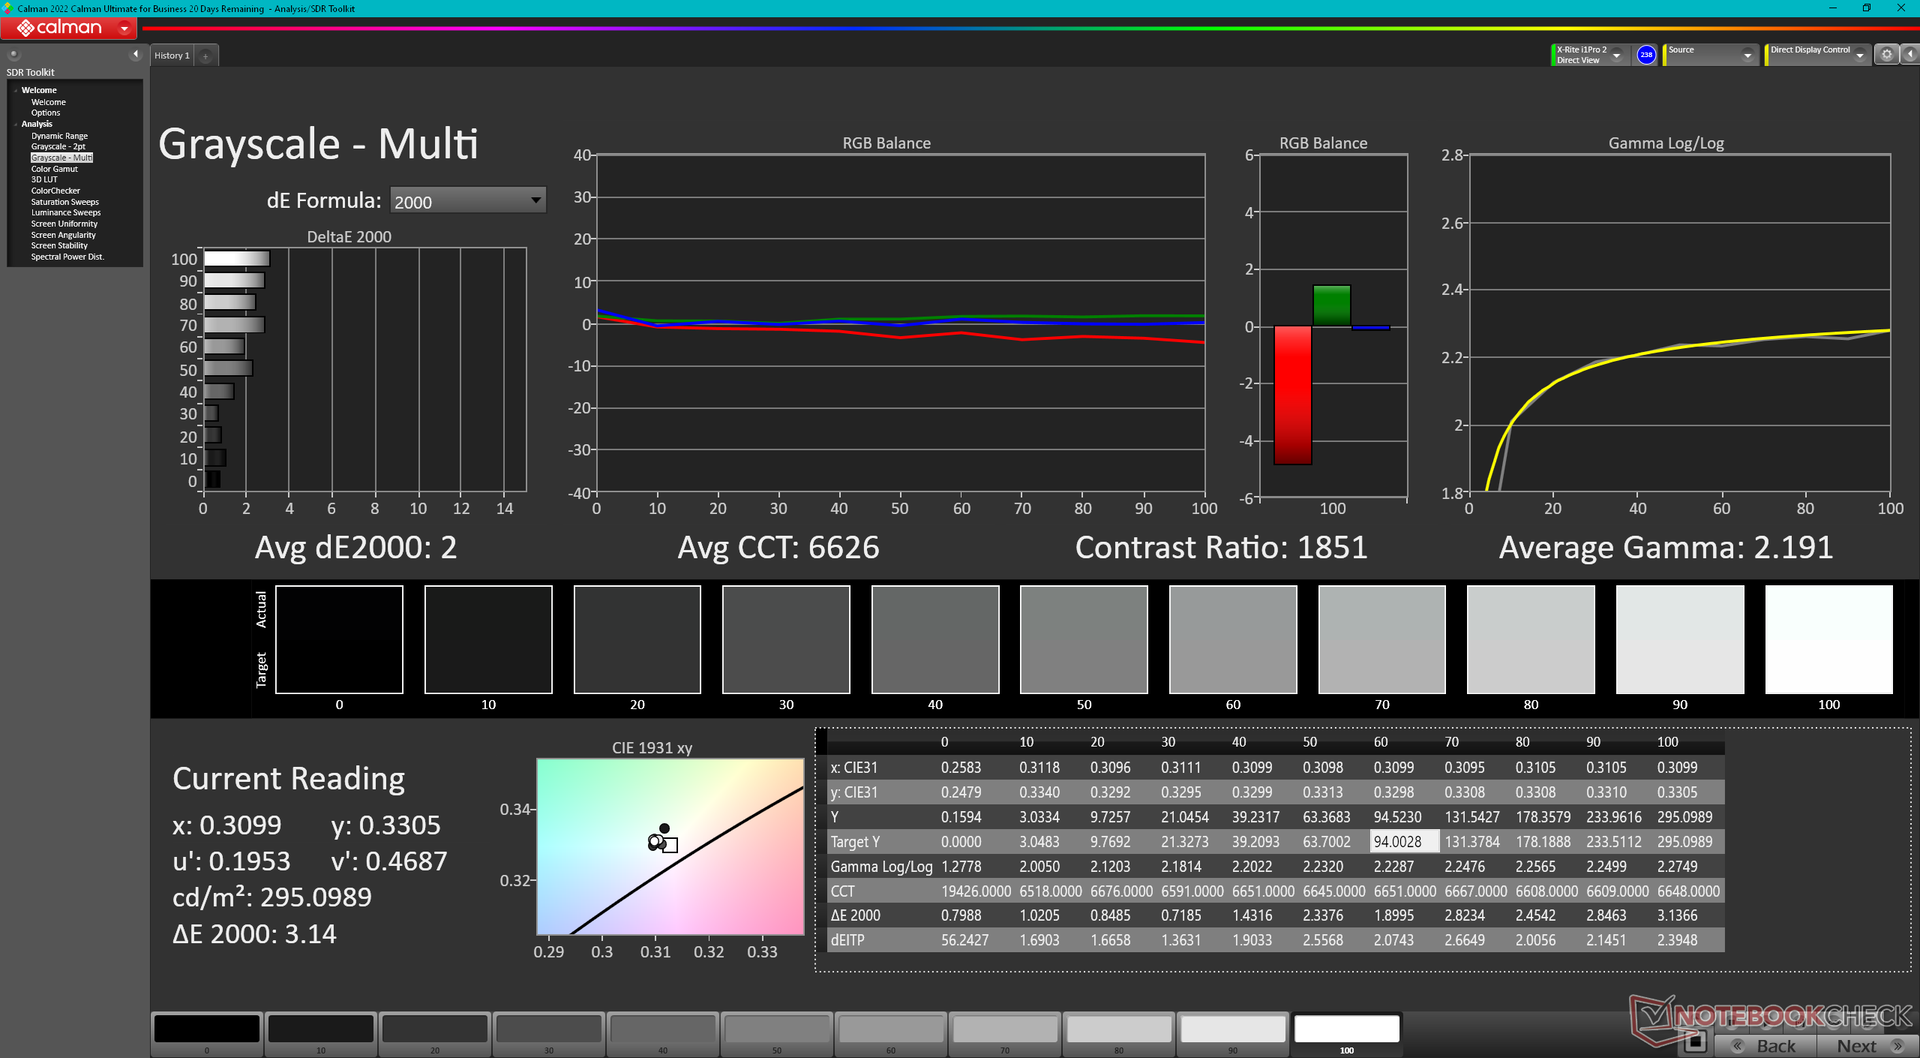
ΔE Greyscale Calman: 3.3 | ∀{0.09-98 Ø4.96}
43% AdobeRGB 1998 (Argyll 3D)
62.2% sRGB (Argyll 3D)
41.6% Display P3 (Argyll 3D)
Gamma: 2.09
CCT: 7151 K
| MSI Raider GE68HX 13VF Chi Mei N160JME-GTK, IPS, 1900x1200, 16" | MSI GE67 HX 12UGS Samsung ATNA562P02-0, OLED, 1920x1080, 15.6" | HP Omen 16-xf0376ng BOE0B81, IPS, 1920x1080, 16.1" | Alienware m16 R1 AMD BOE NE16NZ4, IPS, 2560x1600, 16" | Lenovo Legion Slim 7i 16 Gen 8 CSOT T3 MNG007DA2-3, IPS, 2560x1600, 16" | Asus ROG Zephyrus M16 GU604VY-NM042X BOE0B74 (NE160QDM-NM4, IPS, 2560x1600, 16" | |
|---|---|---|---|---|---|---|
| Display | 64% | 67% | 102% | 66% | 103% | |
| Display P3 Coverage (%) | 41.6 | 71.7 72% | 72.1 73% | 98.6 137% | 70.4 69% | 99.33 139% |
| sRGB Coverage (%) | 62.2 | 89.7 44% | 99.6 60% | 99.9 61% | 99.4 60% | 99.9 61% |
| AdobeRGB 1998 Coverage (%) | 43 | 75.2 75% | 72.3 68% | 88.9 107% | 72.5 69% | 90.01 109% |
| Response Times | 99% | 50% | 67% | 47% | -108% | |
| Response Time Grey 50% / Grey 80% * (ms) | 17.3 ? | 0.25 ? 99% | 12.3 ? 29% | 5.1 ? 71% | 12 ? 31% | 50.8 ? -194% |
| Response Time Black / White * (ms) | 24.2 ? | 0.4 ? 98% | 7.2 ? 70% | 9 ? 63% | 8.9 ? 63% | 29.6 ? -22% |
| PWM Frequency (Hz) | 480.4 ? | 12000 | ||||
| Screen | 17% | 10% | 10% | 34% | 297% | |
| Brightness middle (cd/m²) | 300.9 | 356.1 18% | 350 16% | 329 9% | 474.6 58% | 634 111% |
| Brightness (cd/m²) | 302 | 358 19% | 338 12% | 317 5% | 445 47% | 627 108% |
| Brightness Distribution (%) | 93 | 99 6% | 91 -2% | 89 -4% | 86 -8% | 92 -1% |
| Black Level * (cd/m²) | 0.31 | 0.35 -13% | 0.32 -3% | 0.39 -26% | 0.03 90% | |
| Contrast (:1) | 971 | 1000 3% | 1028 6% | 1217 25% | 21133 2076% | |
| Colorchecker dE 2000 * | 4.6 | 4.83 -5% | 3.29 28% | 3.71 19% | 2.12 54% | 0.89 81% |
| Colorchecker dE 2000 max. * | 17.6 | 7.94 55% | 8.47 52% | 7.23 59% | 4.73 73% | 1.79 90% |
| Colorchecker dE 2000 calibrated * | 2.04 | 2.23 -9% | 2.82 -38% | 0.57 72% | 0.91 55% | |
| Greyscale dE 2000 * | 3.3 | 3.1 6% | 3.2 3% | 2.2 33% | 2.8 15% | 1.13 66% |
| Gamma | 2.09 105% | 2.2 100% | 2.131 103% | 2.3 96% | 2.22 99% | 2.47 89% |
| CCT | 7151 91% | 5938 109% | 6317 103% | 6270 104% | 6542 99% | 6497 100% |
| Média Total (Programa/Configurações) | 60% /
44% | 42% /
28% | 60% /
38% | 49% /
43% | 97% /
198% |
* ... menor é melhor
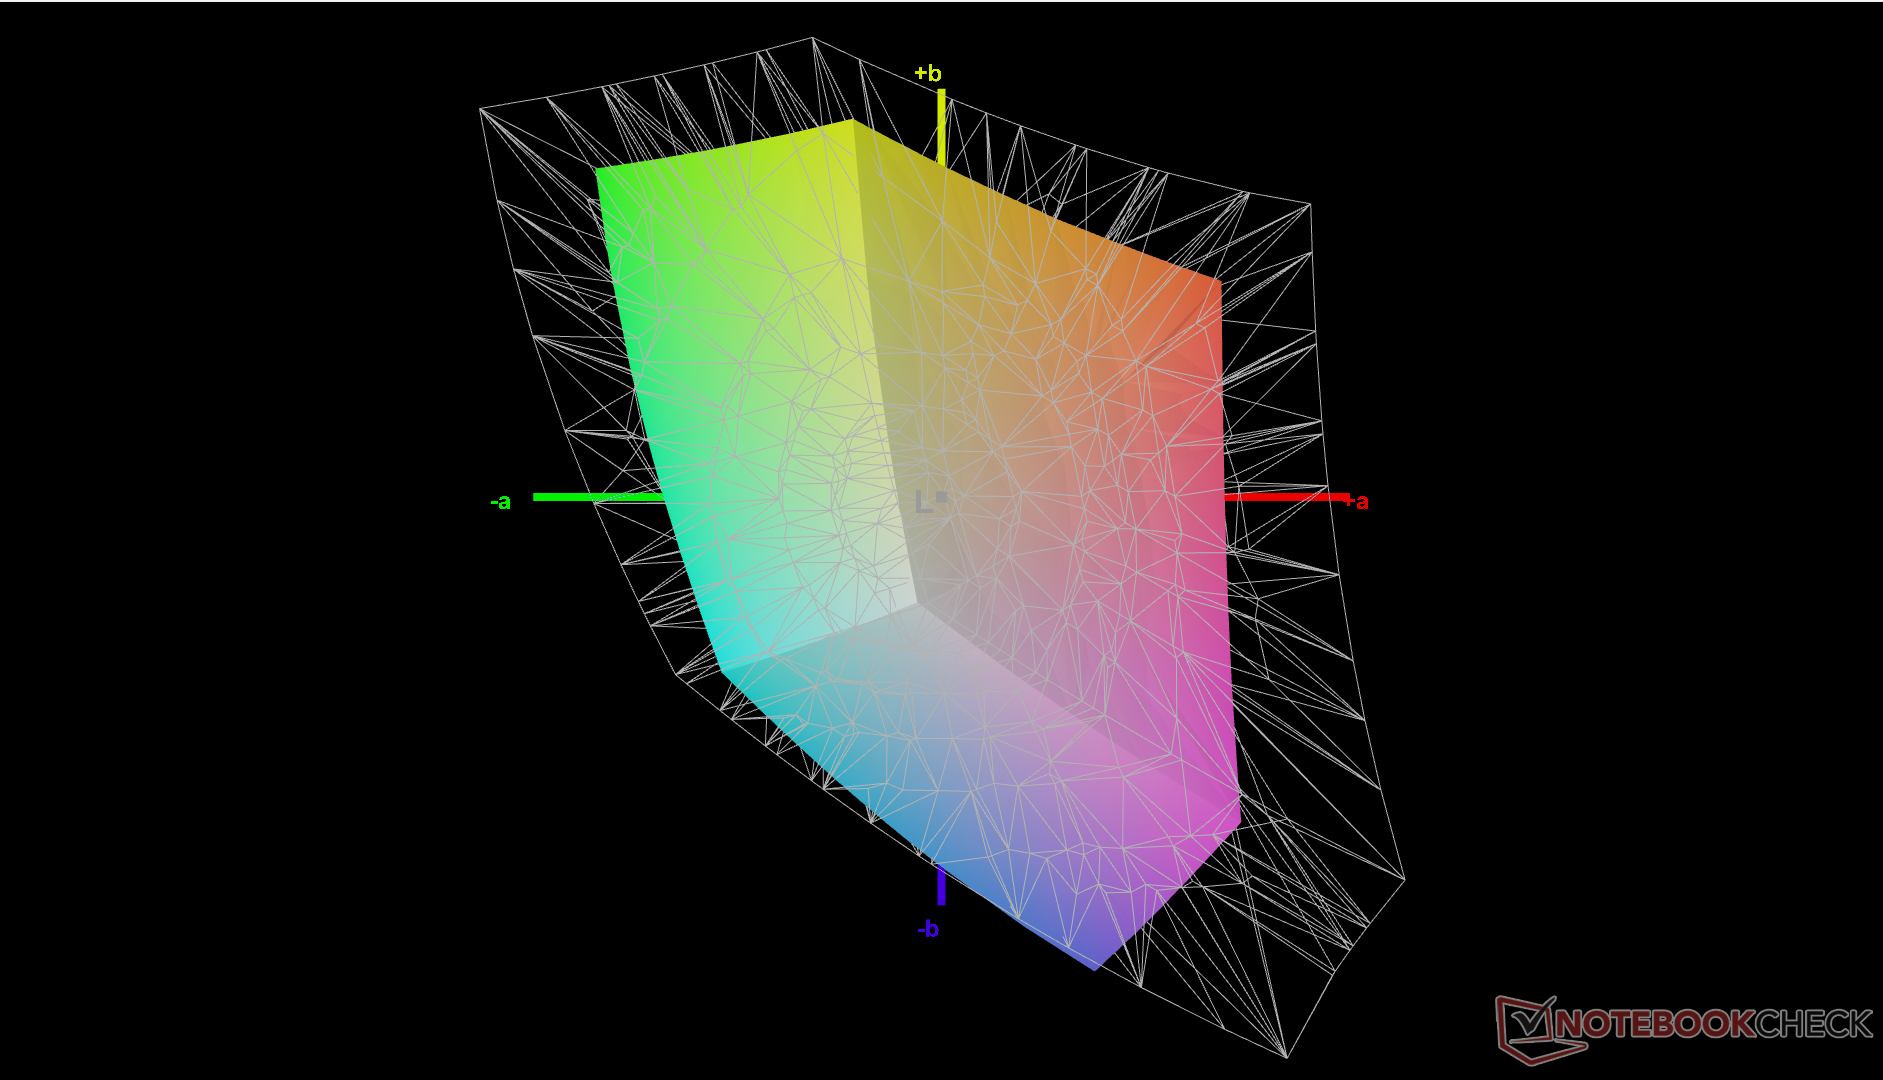
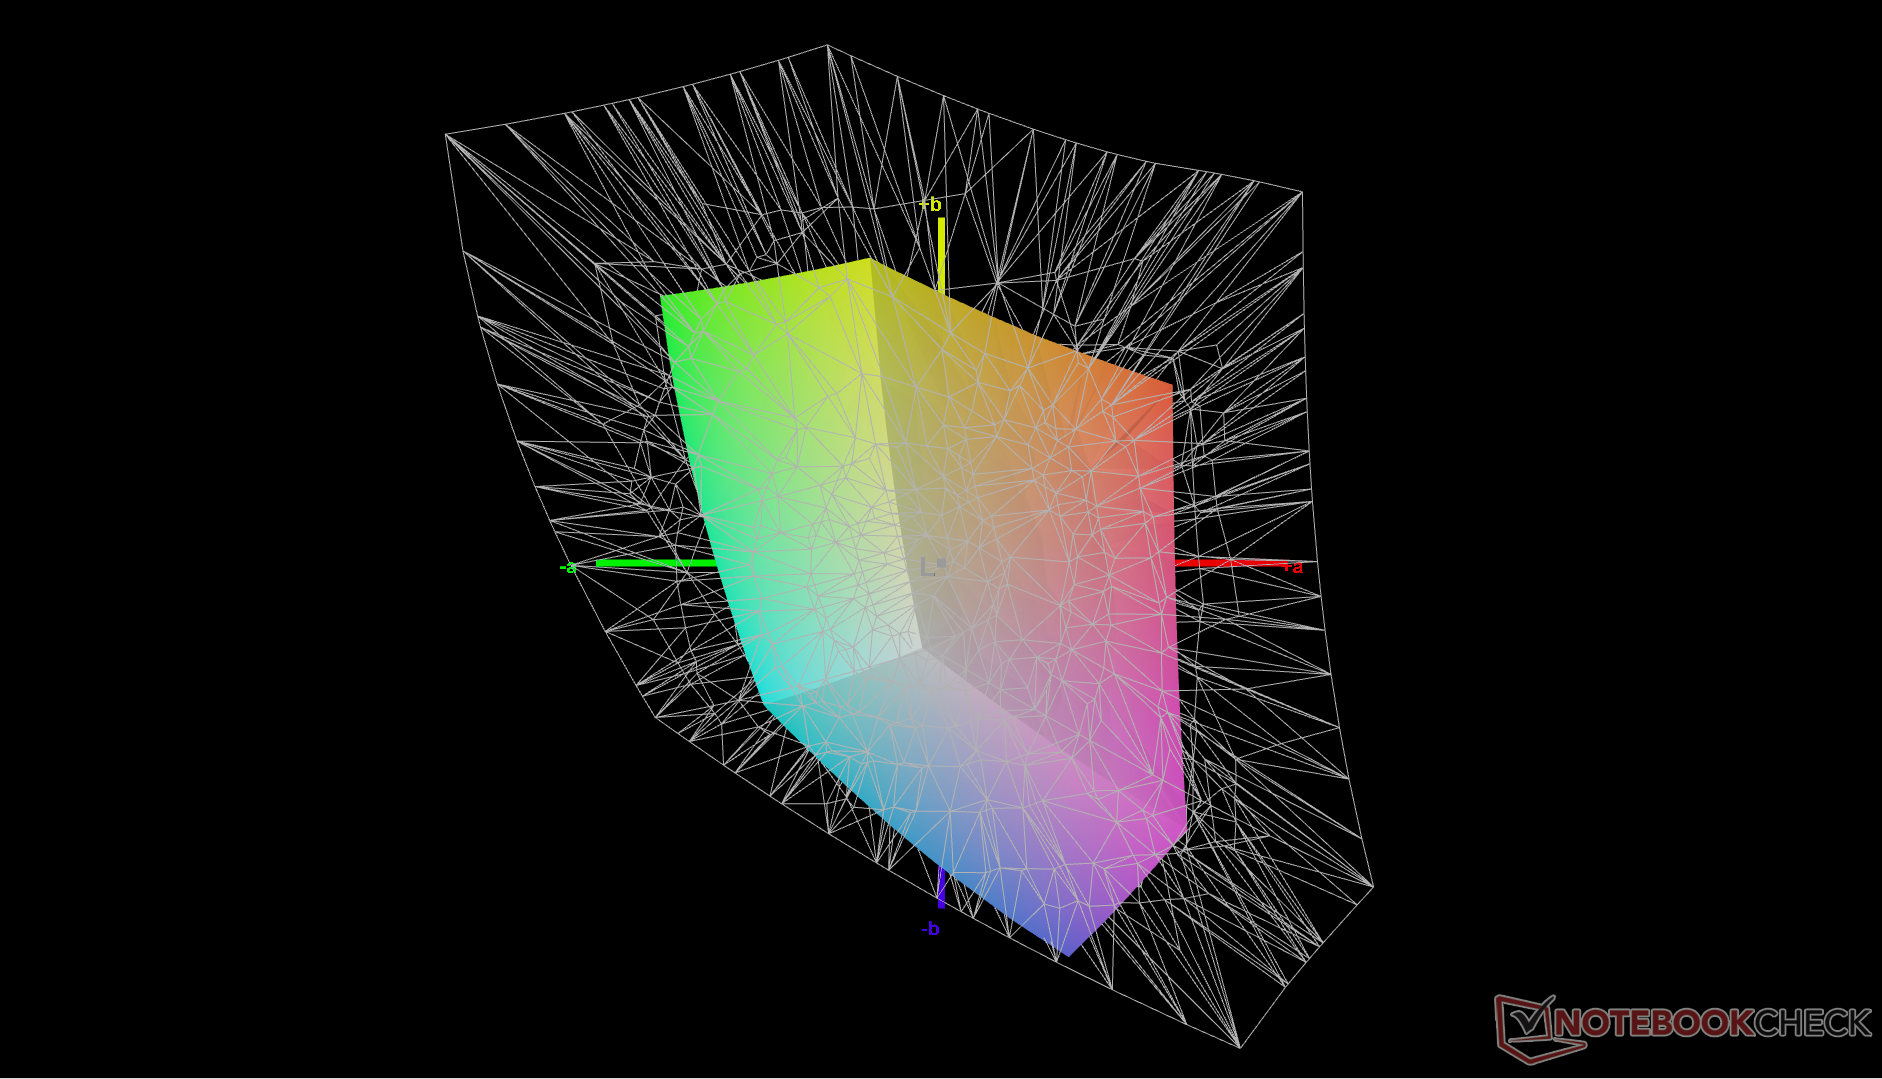
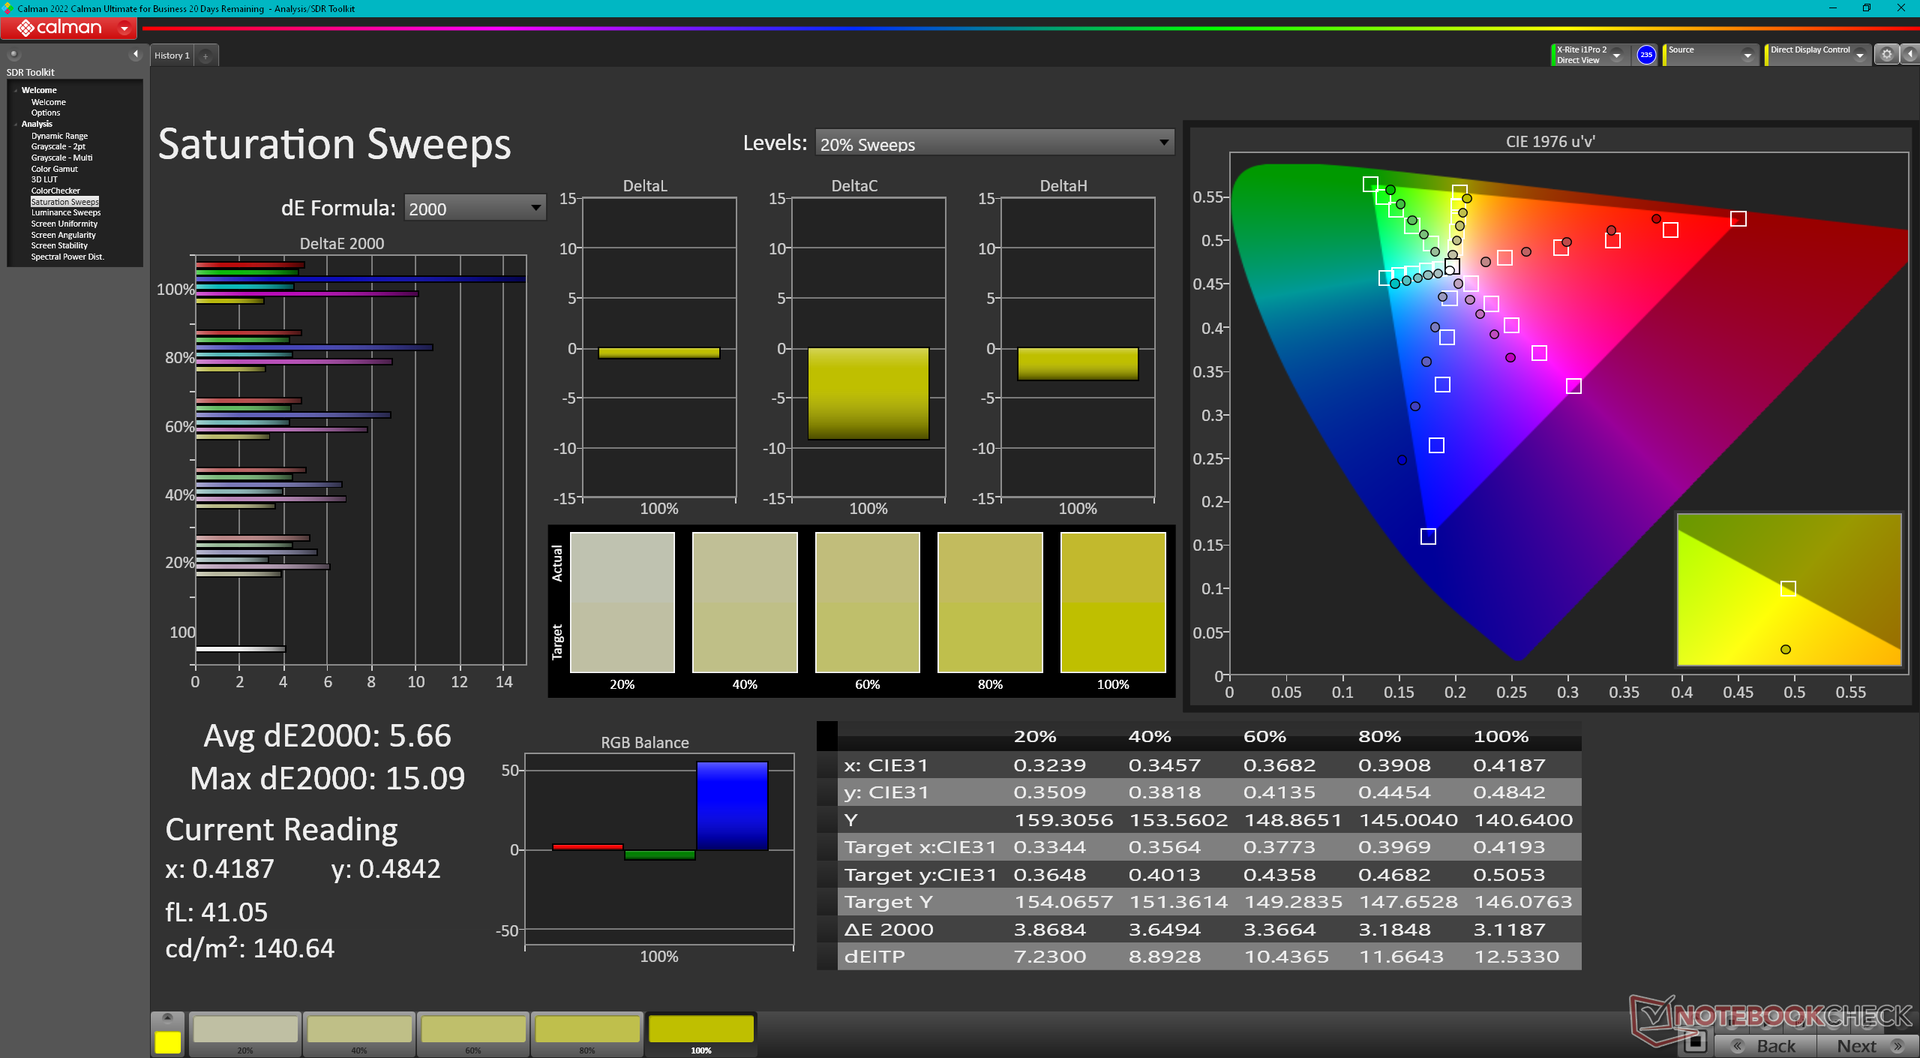
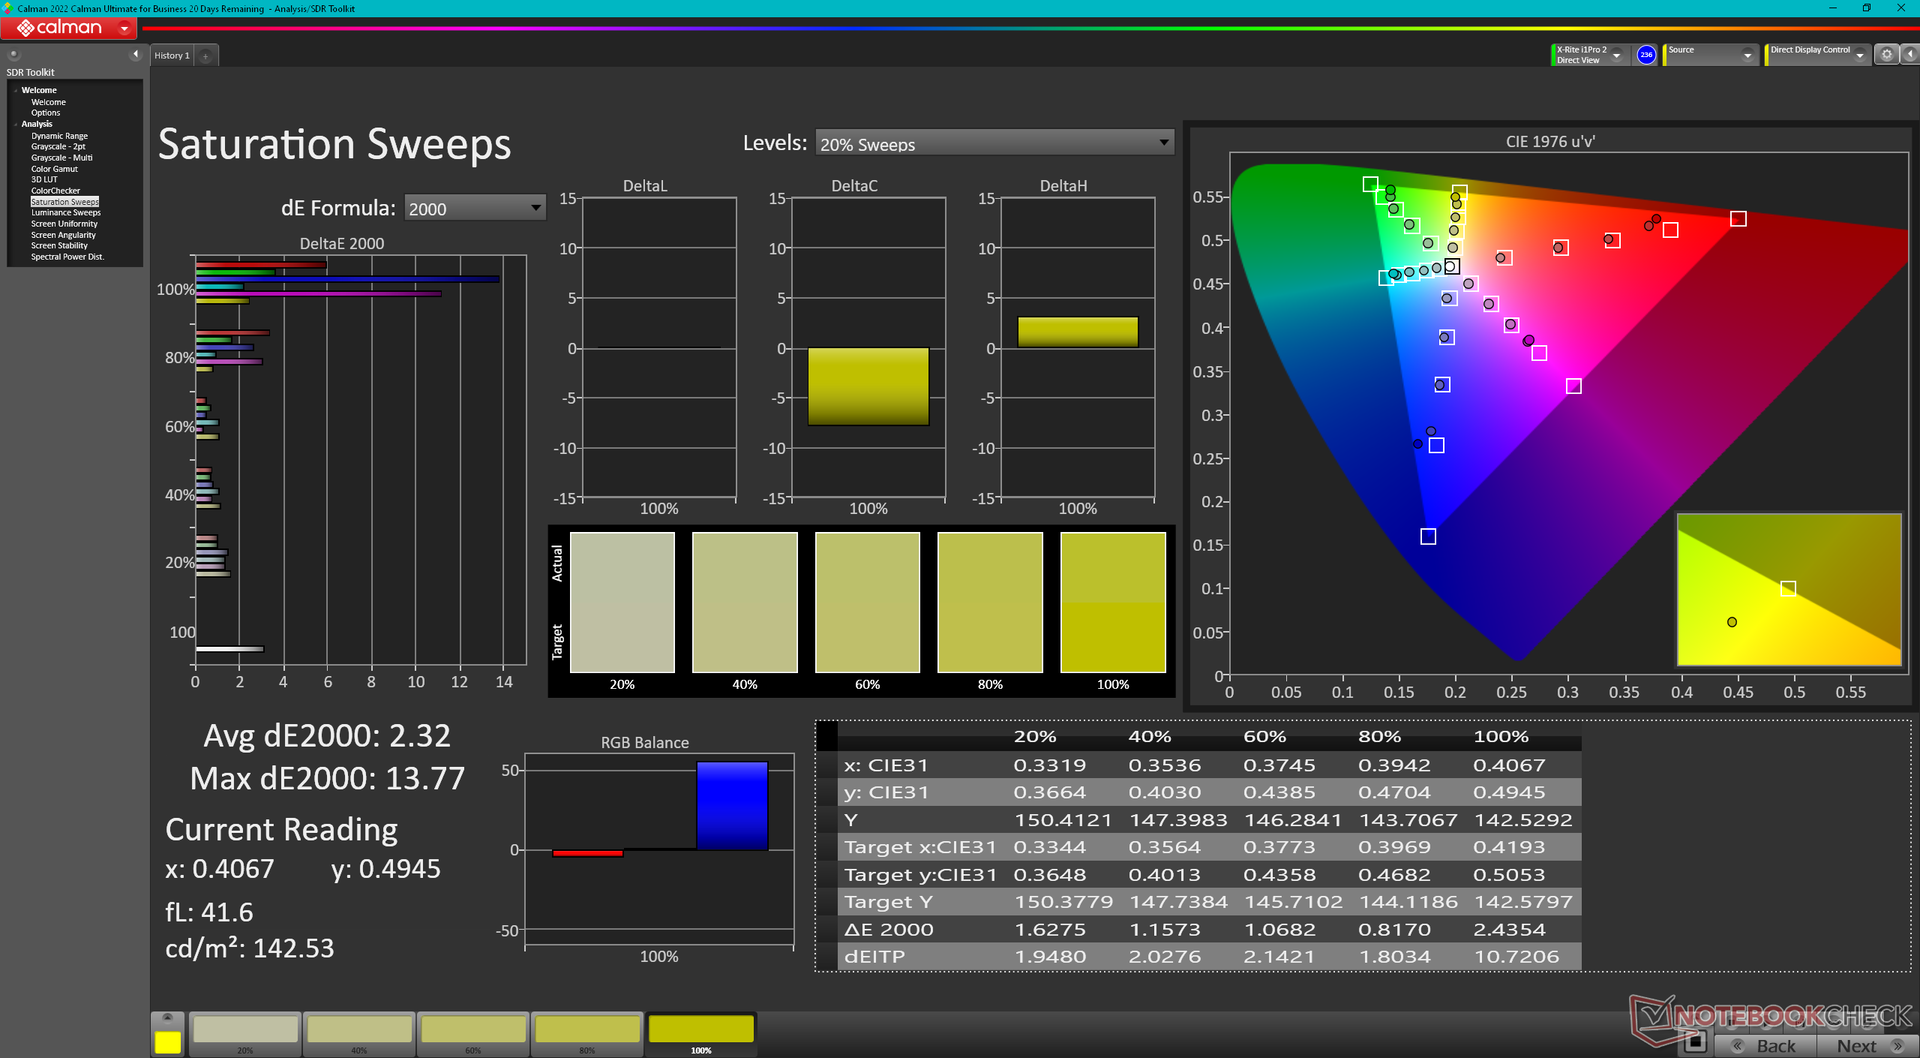
A tela não vem pré-calibrada, mas a precisão média das cores não é ruim, considerando todos os aspectos. A calibração do painel com um colorímetro X-Rite melhoraria os valores DeltaE médios de escala de cinza e de cores de 3,3 e 4,6 para apenas 2 e 2,04, respectivamente. As cores ainda se tornariam cada vez mais imprecisas em níveis de saturação mais altos, independentemente do quanto você as calibrasse, devido ao espaço de cores limitado do painel. O azul talvez seja o pior infrator, pois apareceria ligeiramente violeta. Nosso perfil ICM está disponível acima para download gratuito.
Exibir tempos de resposta
| ↔ Tempo de resposta preto para branco | ||
|---|---|---|
| 24.2 ms ... ascensão ↗ e queda ↘ combinadas | ↗ 10.6 ms ascensão | 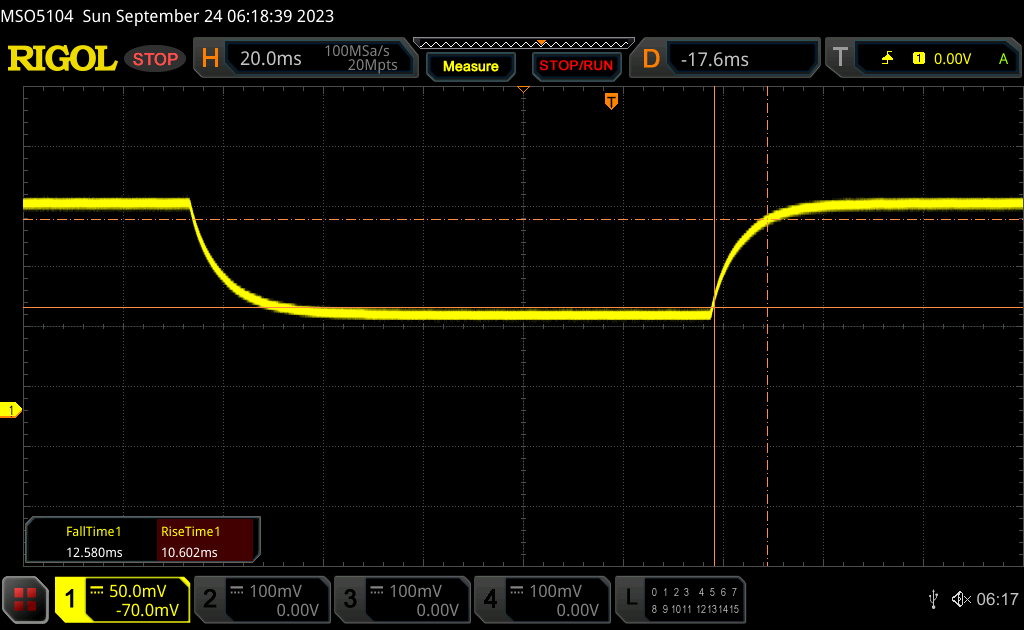 |
| ↘ 12.6 ms queda | ||
| A tela mostra boas taxas de resposta em nossos testes, mas pode ser muito lenta para jogadores competitivos. Em comparação, todos os dispositivos testados variam de 0.1 (mínimo) a 240 (máximo) ms. » 57 % de todos os dispositivos são melhores. Isso significa que o tempo de resposta medido é pior que a média de todos os dispositivos testados (19.8 ms). | ||
| ↔ Tempo de resposta 50% cinza a 80% cinza | ||
| 17.3 ms ... ascensão ↗ e queda ↘ combinadas | ↗ 9.4 ms ascensão | 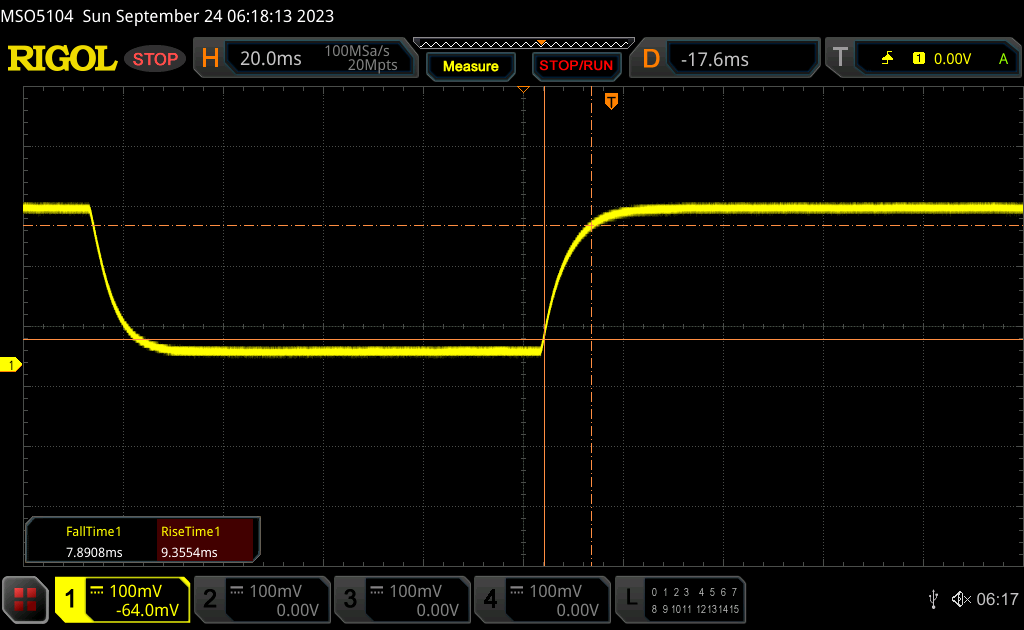 |
| ↘ 7.9 ms queda | ||
| A tela mostra boas taxas de resposta em nossos testes, mas pode ser muito lenta para jogadores competitivos. Em comparação, todos os dispositivos testados variam de 0.165 (mínimo) a 636 (máximo) ms. » 32 % de todos os dispositivos são melhores. Isso significa que o tempo de resposta medido é melhor que a média de todos os dispositivos testados (31 ms). | ||
Cintilação da tela / PWM (modulação por largura de pulso)
| Tela tremeluzindo / PWM não detectado | 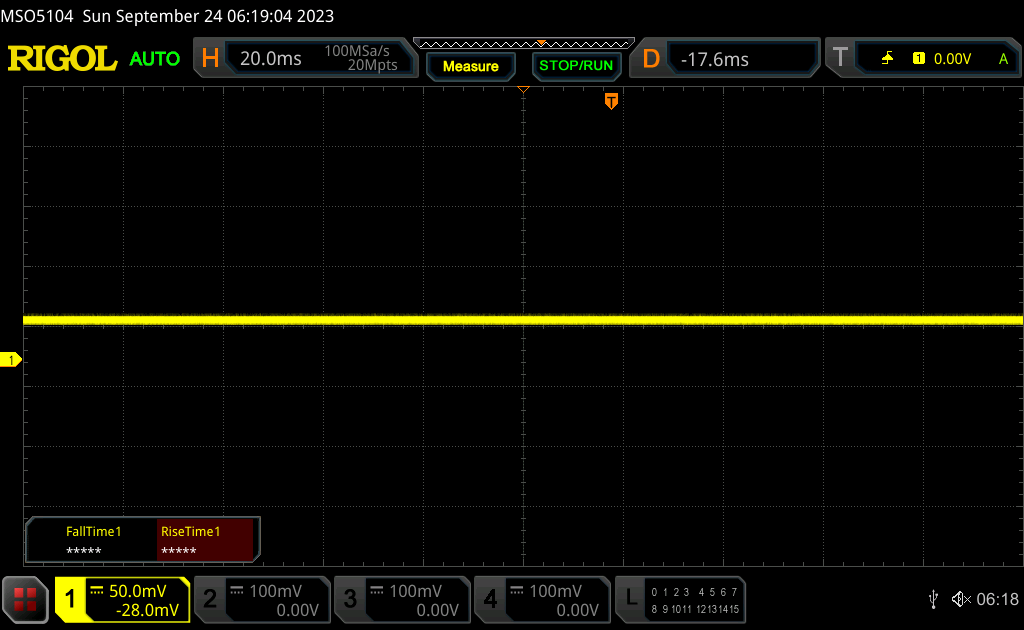 | ||
[pwm_comparison] Em comparação: 52 % de todos os dispositivos testados não usam PWM para escurecer a tela. Se PWM foi detectado, uma média de 7757 (mínimo: 5 - máximo: 343500) Hz foi medida. | |||
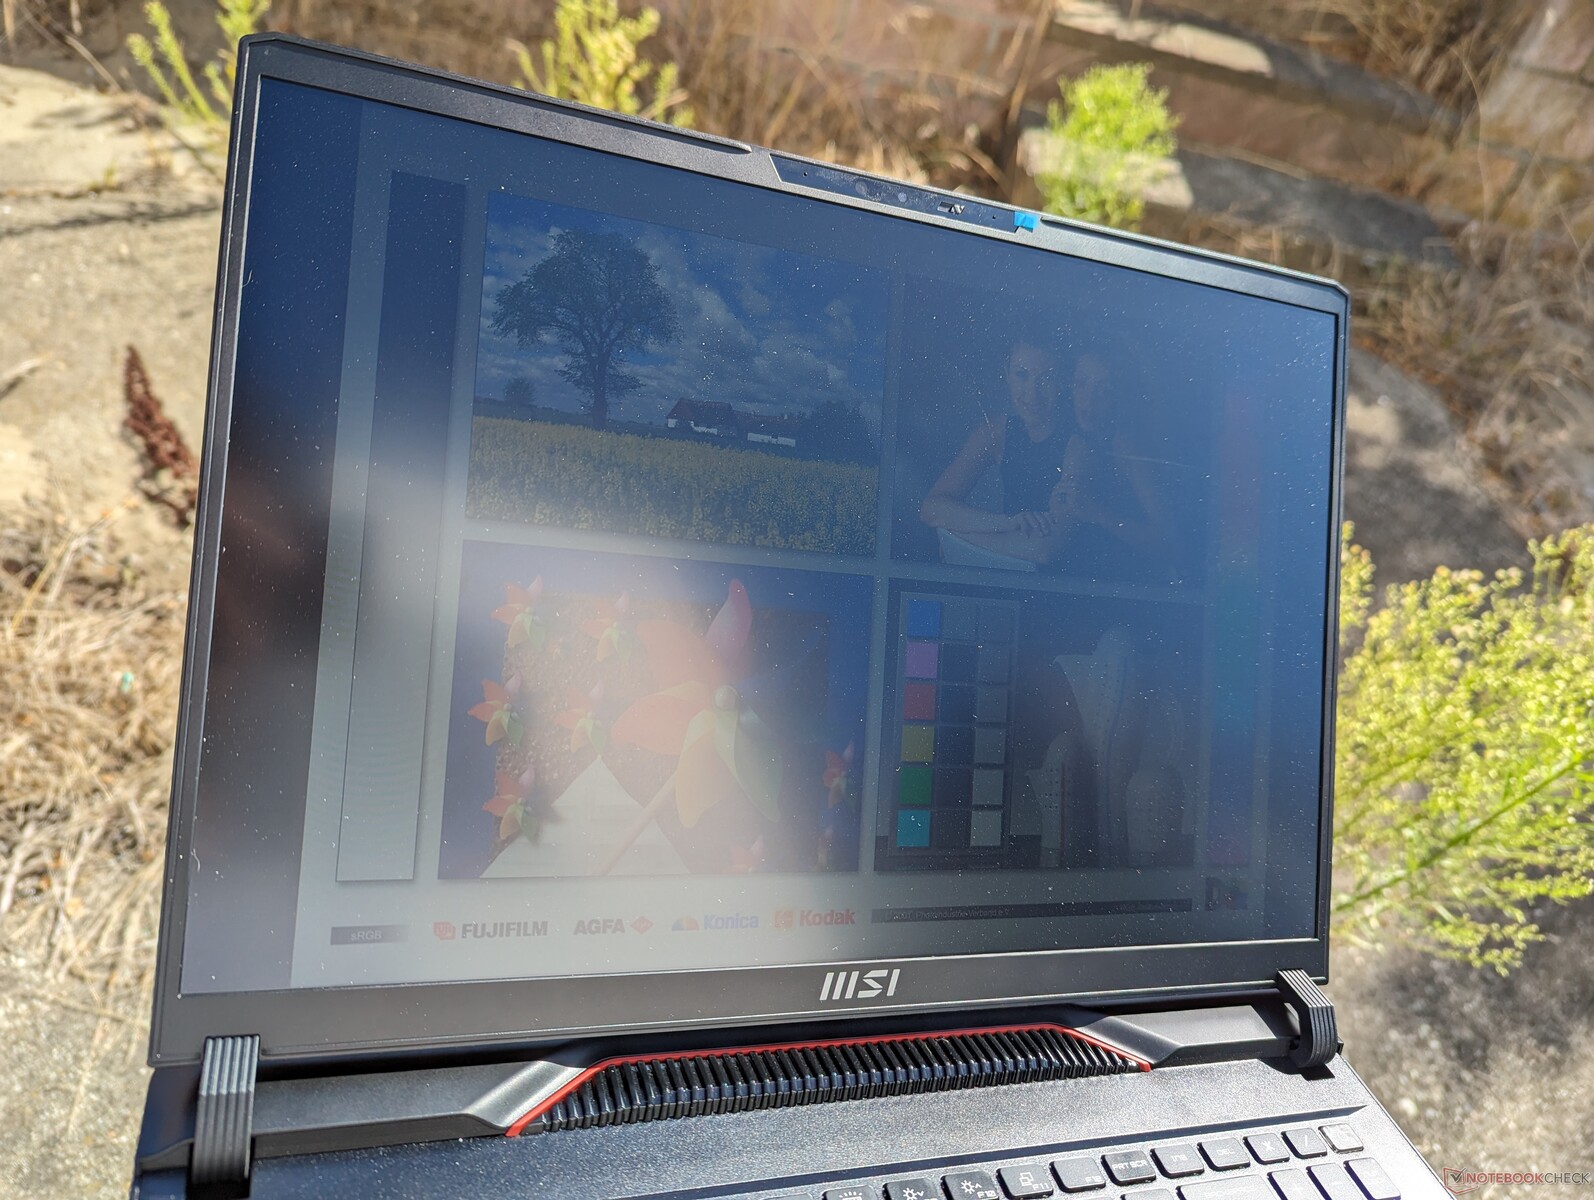
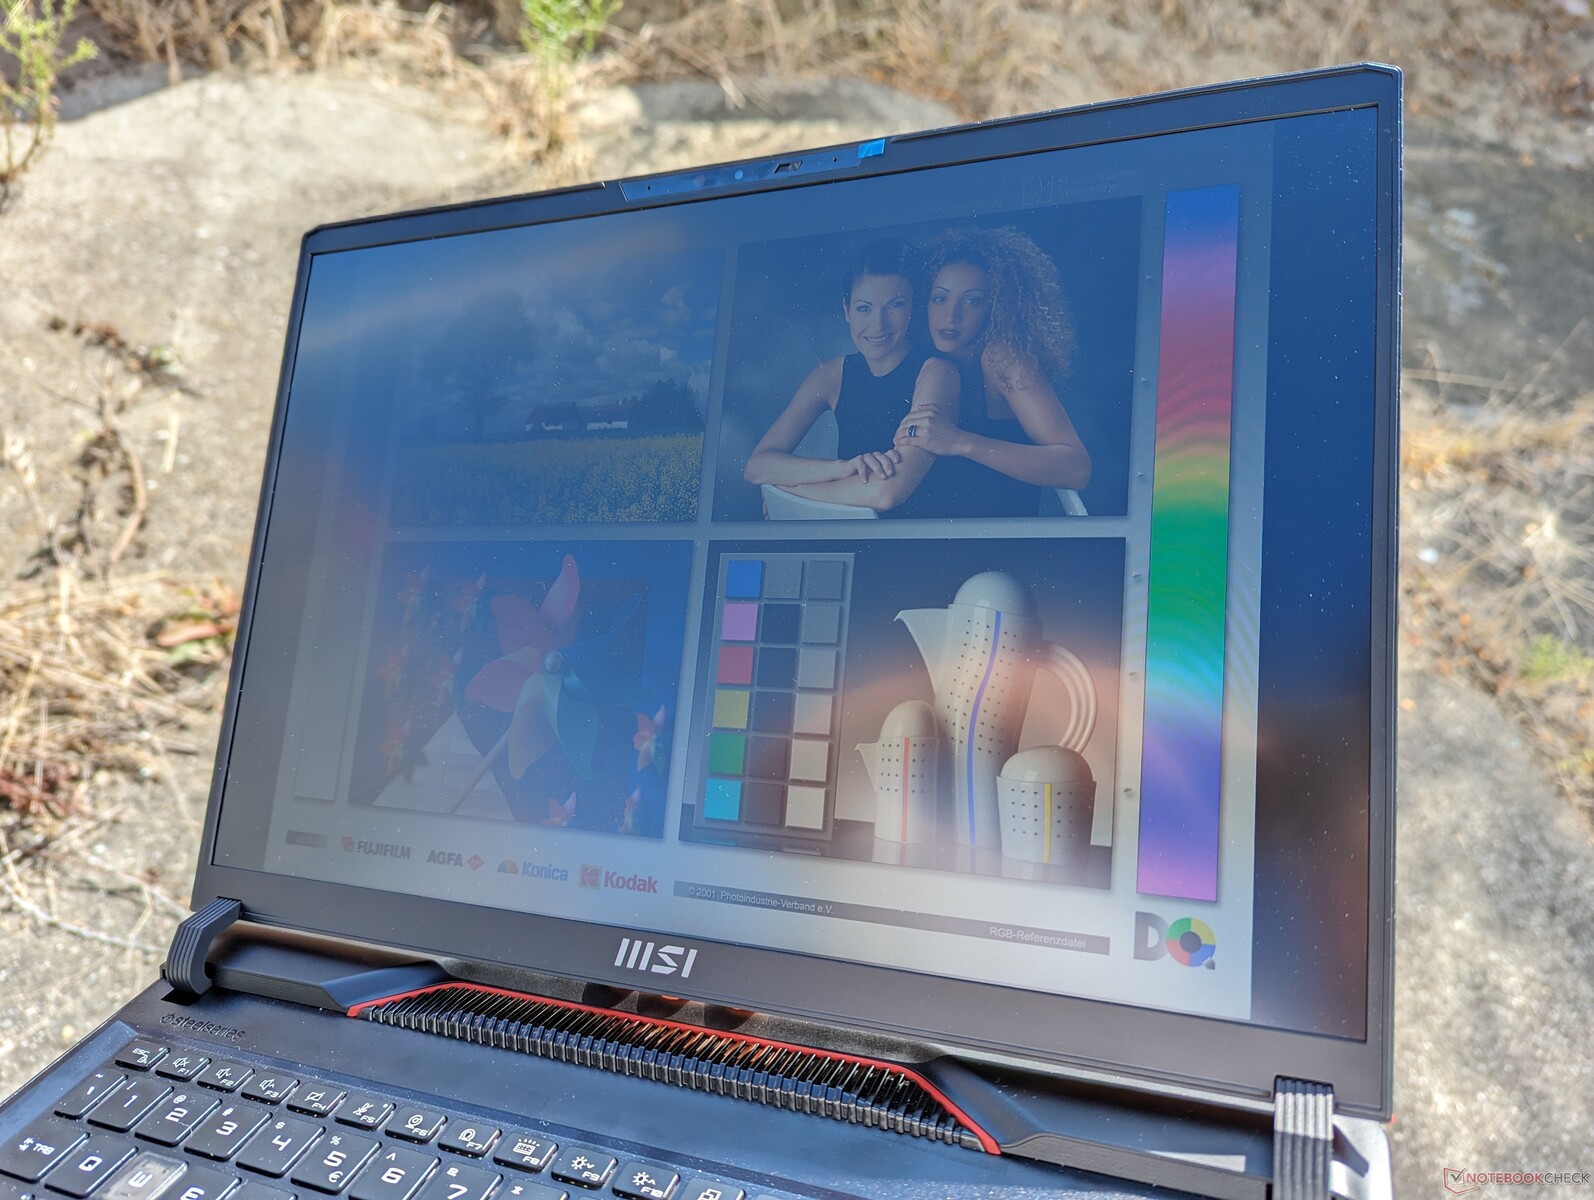
O brilho máximo de 300 nits é típico da maioria dos laptops para jogos. A luz solar direta deve ser evitada, caso contrário, as cores ficarão desbotadas. Para obter melhor visibilidade em ambientes externos, os usuários podem considerar o Zephyrus M16 e sua tela 2x mais brilhante.
Desempenho - Aumento impressionante em relação ao ano anterior
Condições de teste
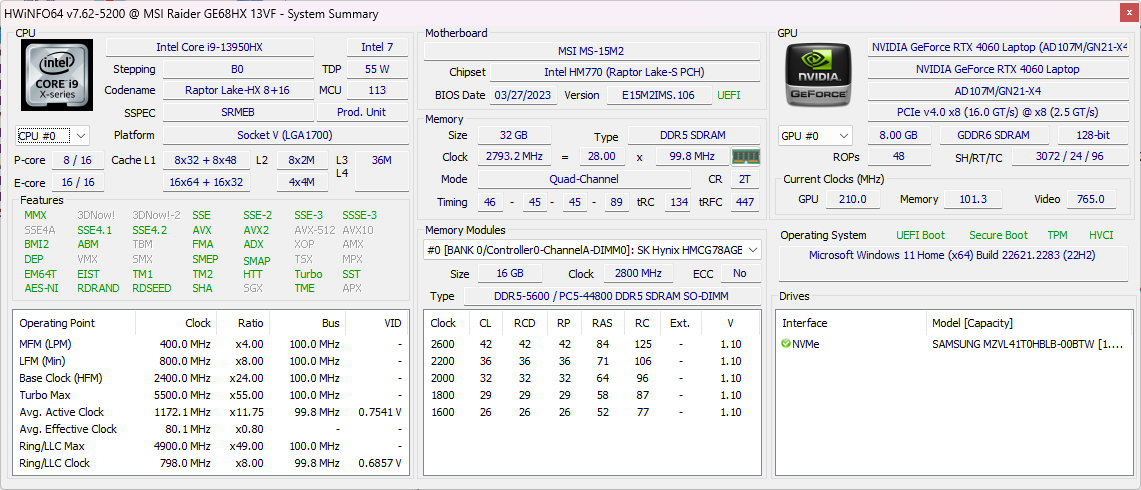
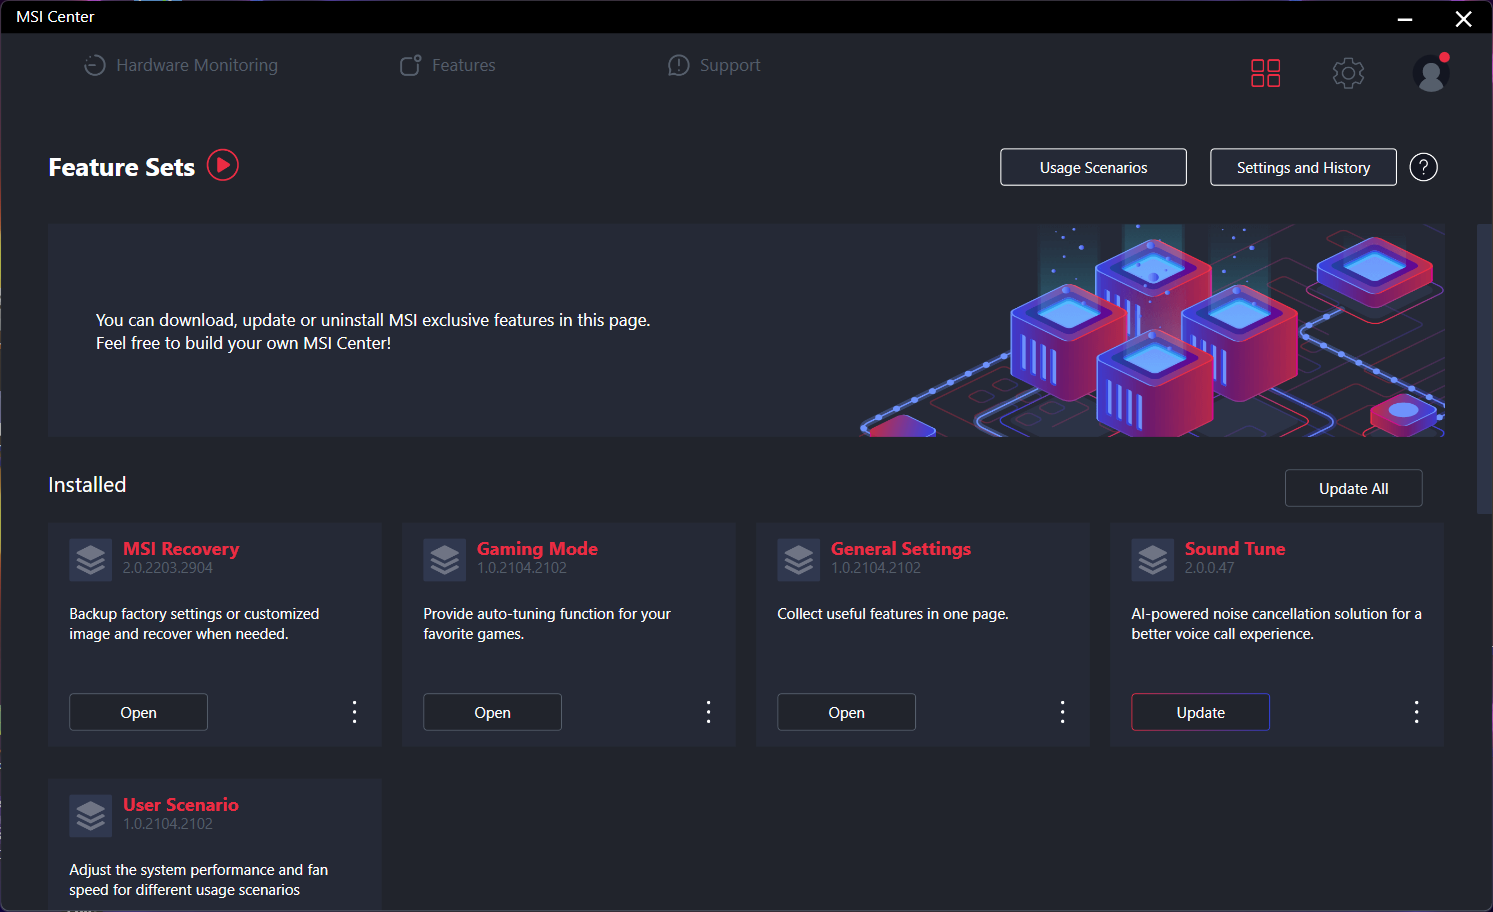
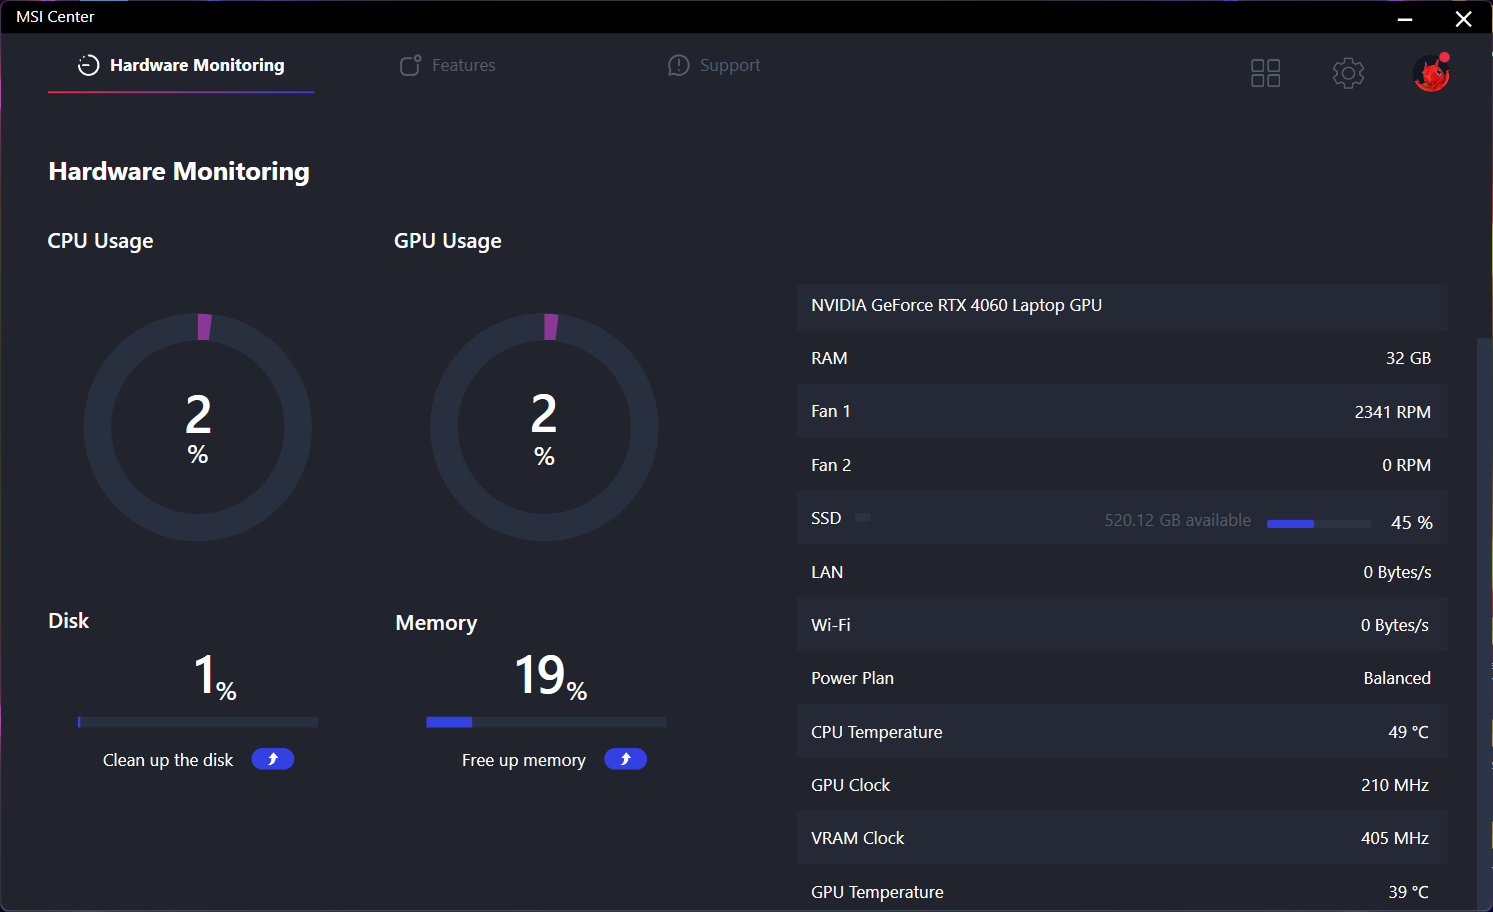
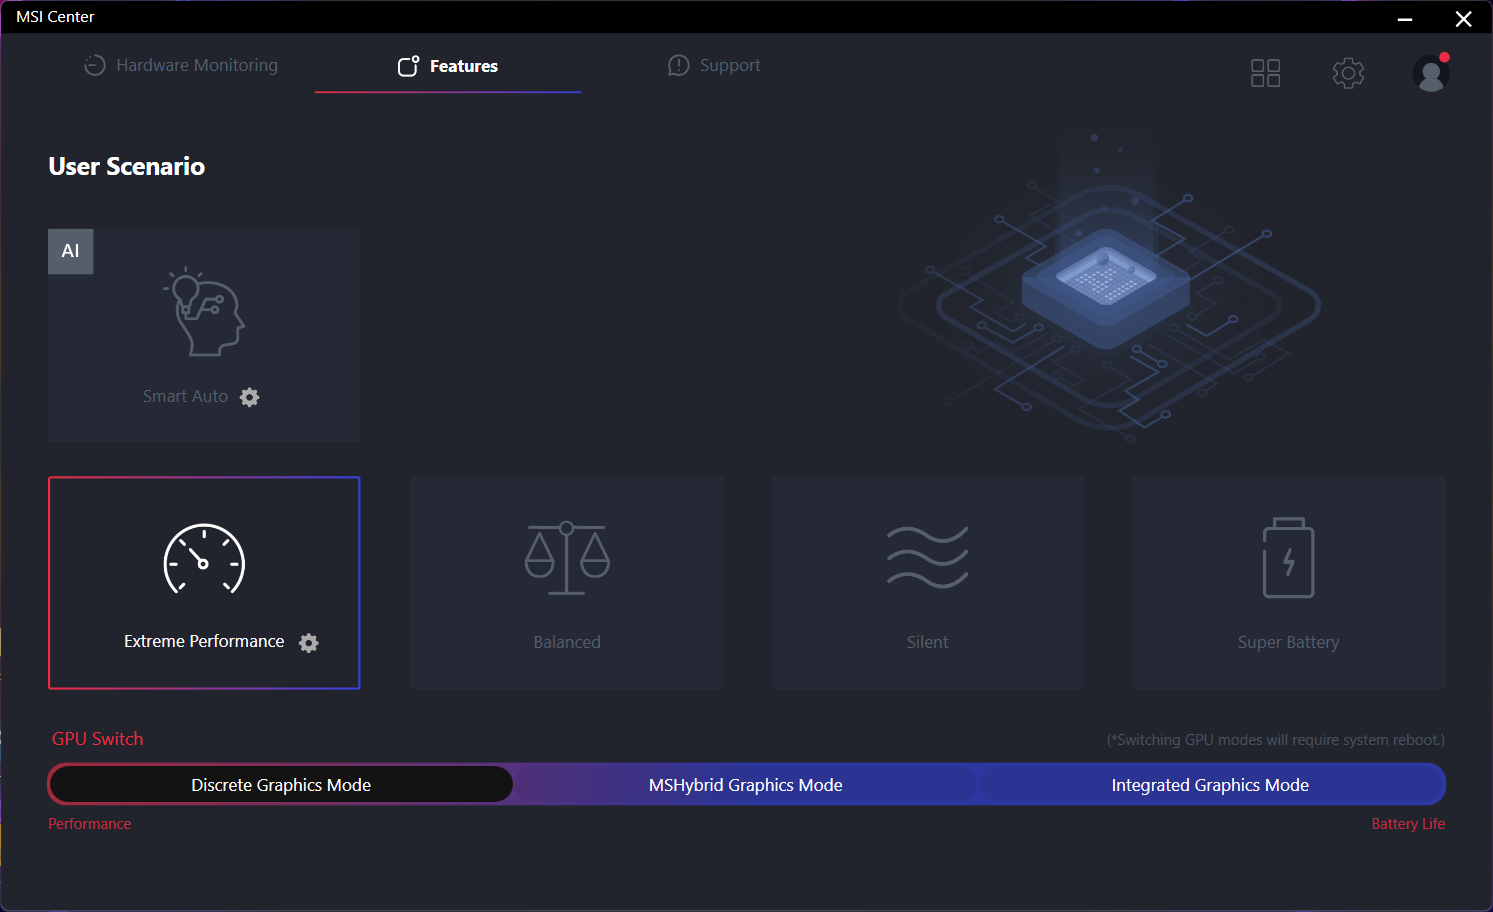
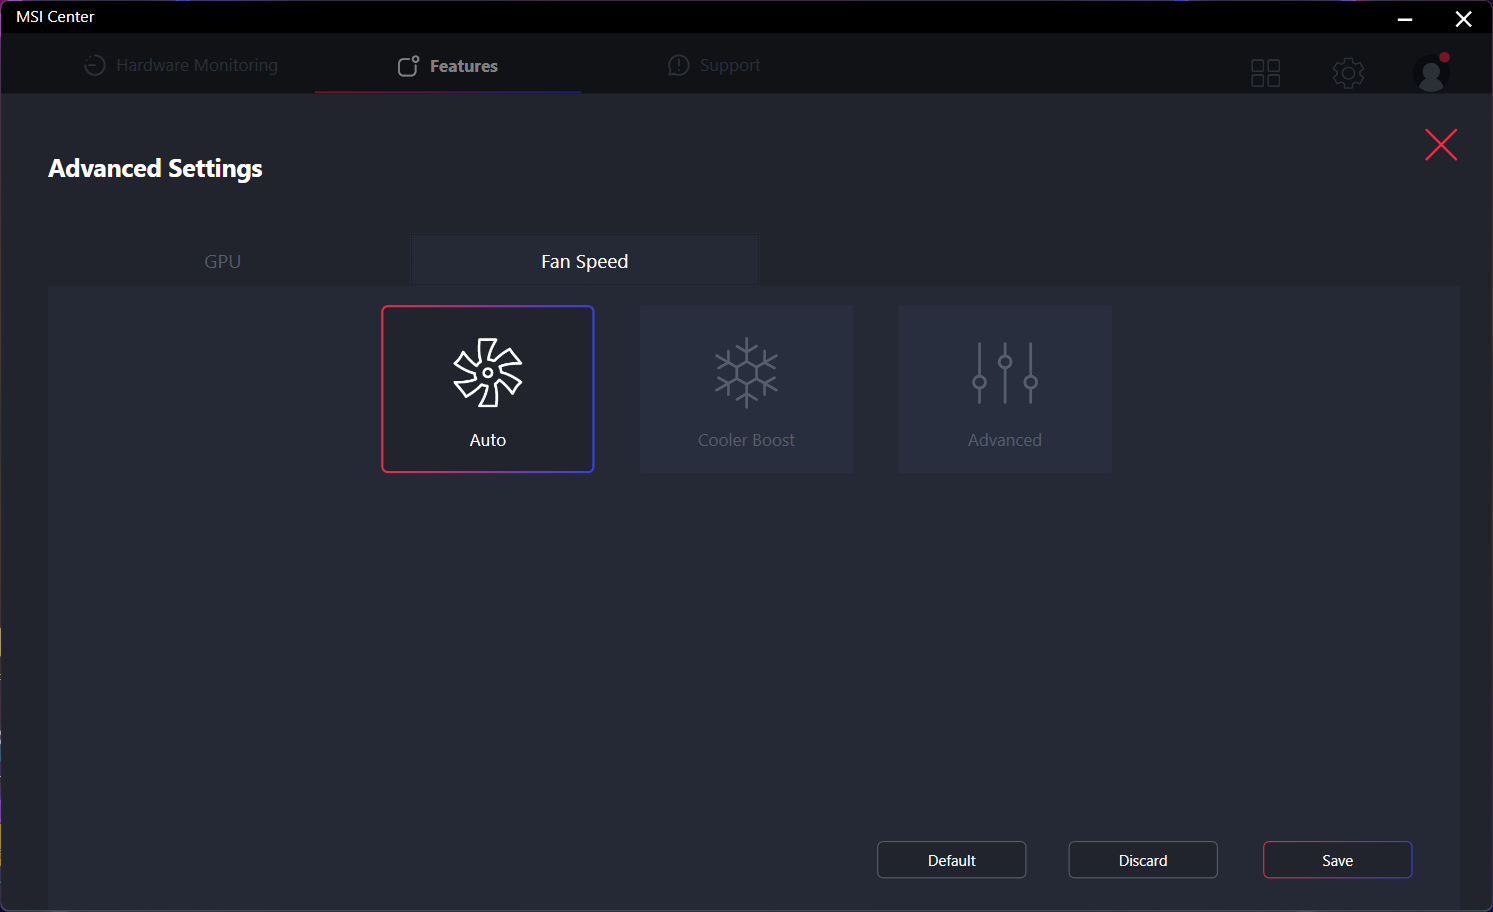
Definimos o Windows para o modo Desempenho e o MSI Center para o modo Desempenho extremo e o modo dGPU antes de executar os benchmarks abaixo. O MSI Center é o centro de controle para atualizações do sistema, sinais vitais, perfis de energia, modos de GPU e muito mais. No entanto, as configurações RGB são controladas por um aplicativo separado chamado SteelSeries GG.
O Cooler Boost é uma configuração de submenu no modo Extreme Performance. Ao ativá-lo, as ventoinhas internas funcionarão em suas RPMs máximas, independentemente da carga na tela.
A configuração da RTX 4060 é compatível com o MUX, mas não com o Advanced Optimus, o que significa que é necessário reiniciar o computador ao alternar entre os modos dGPU, MSHybrid e iGPU.
Processador
O desempenho da CPU e a estabilidade da taxa de clock são excelentes, com resultados de 5 a 10% mais rápidos do que a médiaCore i9-13950HX em nosso banco de dados ou quase 2x mais rápido do que o Core i7-13700H comumente encontrado na maioria dos outros notebooks para jogos. Essa é uma das CPUs móveis mais rápidas do mercado no momento e compete com o Zen 4 Ryzen 9 7945HX pelos três primeiros lugares.
O upgrade para o mais caro Core i9-13980HX mais caro, só deverá aumentar o desempenho em cerca de 5%, com base em nosso tempo com o Alienware m18 R1. Os benefícios são tão insignificantes que recomendamos ficar com o Core i9-13950HX para economizar algumas centenas de dólares.
Cinebench R15 Multi Loop
Cinebench R23: Multi Core | Single Core
Cinebench R20: CPU (Multi Core) | CPU (Single Core)
Cinebench R15: CPU Multi 64Bit | CPU Single 64Bit
Blender: v2.79 BMW27 CPU
7-Zip 18.03: 7z b 4 | 7z b 4 -mmt1
Geekbench 5.5: Multi-Core | Single-Core
HWBOT x265 Benchmark v2.2: 4k Preset
LibreOffice : 20 Documents To PDF
R Benchmark 2.5: Overall mean
* ... menor é melhor
AIDA64: FP32 Ray-Trace | FPU Julia | CPU SHA3 | CPU Queen | FPU SinJulia | FPU Mandel | CPU AES | CPU ZLib | FP64 Ray-Trace | CPU PhotoWorxx
| Performance rating | |
| Alienware m16 R1 AMD | |
| MSI Raider GE68HX 13VF | |
| Média Intel Core i9-13950HX | |
| HP Omen 16-xf0376ng | |
| Asus ROG Zephyrus M16 GU604VY-NM042X | |
| Lenovo Legion Slim 7i 16 Gen 8 | |
| MSI GE67 HX 12UGS | |
| AIDA64 / FP32 Ray-Trace | |
| Alienware m16 R1 AMD | |
| MSI Raider GE68HX 13VF | |
| HP Omen 16-xf0376ng | |
| Média Intel Core i9-13950HX (17993 - 28957, n=9) | |
| Asus ROG Zephyrus M16 GU604VY-NM042X | |
| Lenovo Legion Slim 7i 16 Gen 8 | |
| MSI GE67 HX 12UGS | |
| AIDA64 / FPU Julia | |
| Alienware m16 R1 AMD | |
| MSI Raider GE68HX 13VF | |
| Média Intel Core i9-13950HX (89362 - 144303, n=9) | |
| HP Omen 16-xf0376ng | |
| Asus ROG Zephyrus M16 GU604VY-NM042X | |
| Lenovo Legion Slim 7i 16 Gen 8 | |
| MSI GE67 HX 12UGS | |
| AIDA64 / CPU SHA3 | |
| Alienware m16 R1 AMD | |
| MSI Raider GE68HX 13VF | |
| Média Intel Core i9-13950HX (4518 - 7093, n=9) | |
| HP Omen 16-xf0376ng | |
| Asus ROG Zephyrus M16 GU604VY-NM042X | |
| MSI GE67 HX 12UGS | |
| Lenovo Legion Slim 7i 16 Gen 8 | |
| AIDA64 / CPU Queen | |
| Alienware m16 R1 AMD | |
| MSI Raider GE68HX 13VF | |
| Média Intel Core i9-13950HX (131931 - 140103, n=8) | |
| Lenovo Legion Slim 7i 16 Gen 8 | |
| Asus ROG Zephyrus M16 GU604VY-NM042X | |
| HP Omen 16-xf0376ng | |
| MSI GE67 HX 12UGS | |
| AIDA64 / FPU SinJulia | |
| Alienware m16 R1 AMD | |
| MSI Raider GE68HX 13VF | |
| HP Omen 16-xf0376ng | |
| Média Intel Core i9-13950HX (12318 - 17057, n=9) | |
| MSI GE67 HX 12UGS | |
| Asus ROG Zephyrus M16 GU604VY-NM042X | |
| Lenovo Legion Slim 7i 16 Gen 8 | |
| AIDA64 / FPU Mandel | |
| Alienware m16 R1 AMD | |
| MSI Raider GE68HX 13VF | |
| HP Omen 16-xf0376ng | |
| Média Intel Core i9-13950HX (44372 - 71038, n=9) | |
| Asus ROG Zephyrus M16 GU604VY-NM042X | |
| Lenovo Legion Slim 7i 16 Gen 8 | |
| MSI GE67 HX 12UGS | |
| AIDA64 / CPU AES | |
| Média Intel Core i9-13950HX (99981 - 204491, n=9) | |
| MSI Raider GE68HX 13VF | |
| MSI GE67 HX 12UGS | |
| Alienware m16 R1 AMD | |
| Asus ROG Zephyrus M16 GU604VY-NM042X | |
| Lenovo Legion Slim 7i 16 Gen 8 | |
| HP Omen 16-xf0376ng | |
| AIDA64 / CPU ZLib | |
| MSI Raider GE68HX 13VF | |
| Alienware m16 R1 AMD | |
| Média Intel Core i9-13950HX (1263 - 2069, n=9) | |
| MSI GE67 HX 12UGS | |
| Lenovo Legion Slim 7i 16 Gen 8 | |
| Asus ROG Zephyrus M16 GU604VY-NM042X | |
| HP Omen 16-xf0376ng | |
| AIDA64 / FP64 Ray-Trace | |
| Alienware m16 R1 AMD | |
| MSI Raider GE68HX 13VF | |
| HP Omen 16-xf0376ng | |
| Média Intel Core i9-13950HX (9649 - 15573, n=9) | |
| Asus ROG Zephyrus M16 GU604VY-NM042X | |
| Lenovo Legion Slim 7i 16 Gen 8 | |
| MSI GE67 HX 12UGS | |
| AIDA64 / CPU PhotoWorxx | |
| MSI Raider GE68HX 13VF | |
| Asus ROG Zephyrus M16 GU604VY-NM042X | |
| Média Intel Core i9-13950HX (40233 - 50864, n=9) | |
| HP Omen 16-xf0376ng | |
| MSI GE67 HX 12UGS | |
| Alienware m16 R1 AMD | |
| Lenovo Legion Slim 7i 16 Gen 8 | |
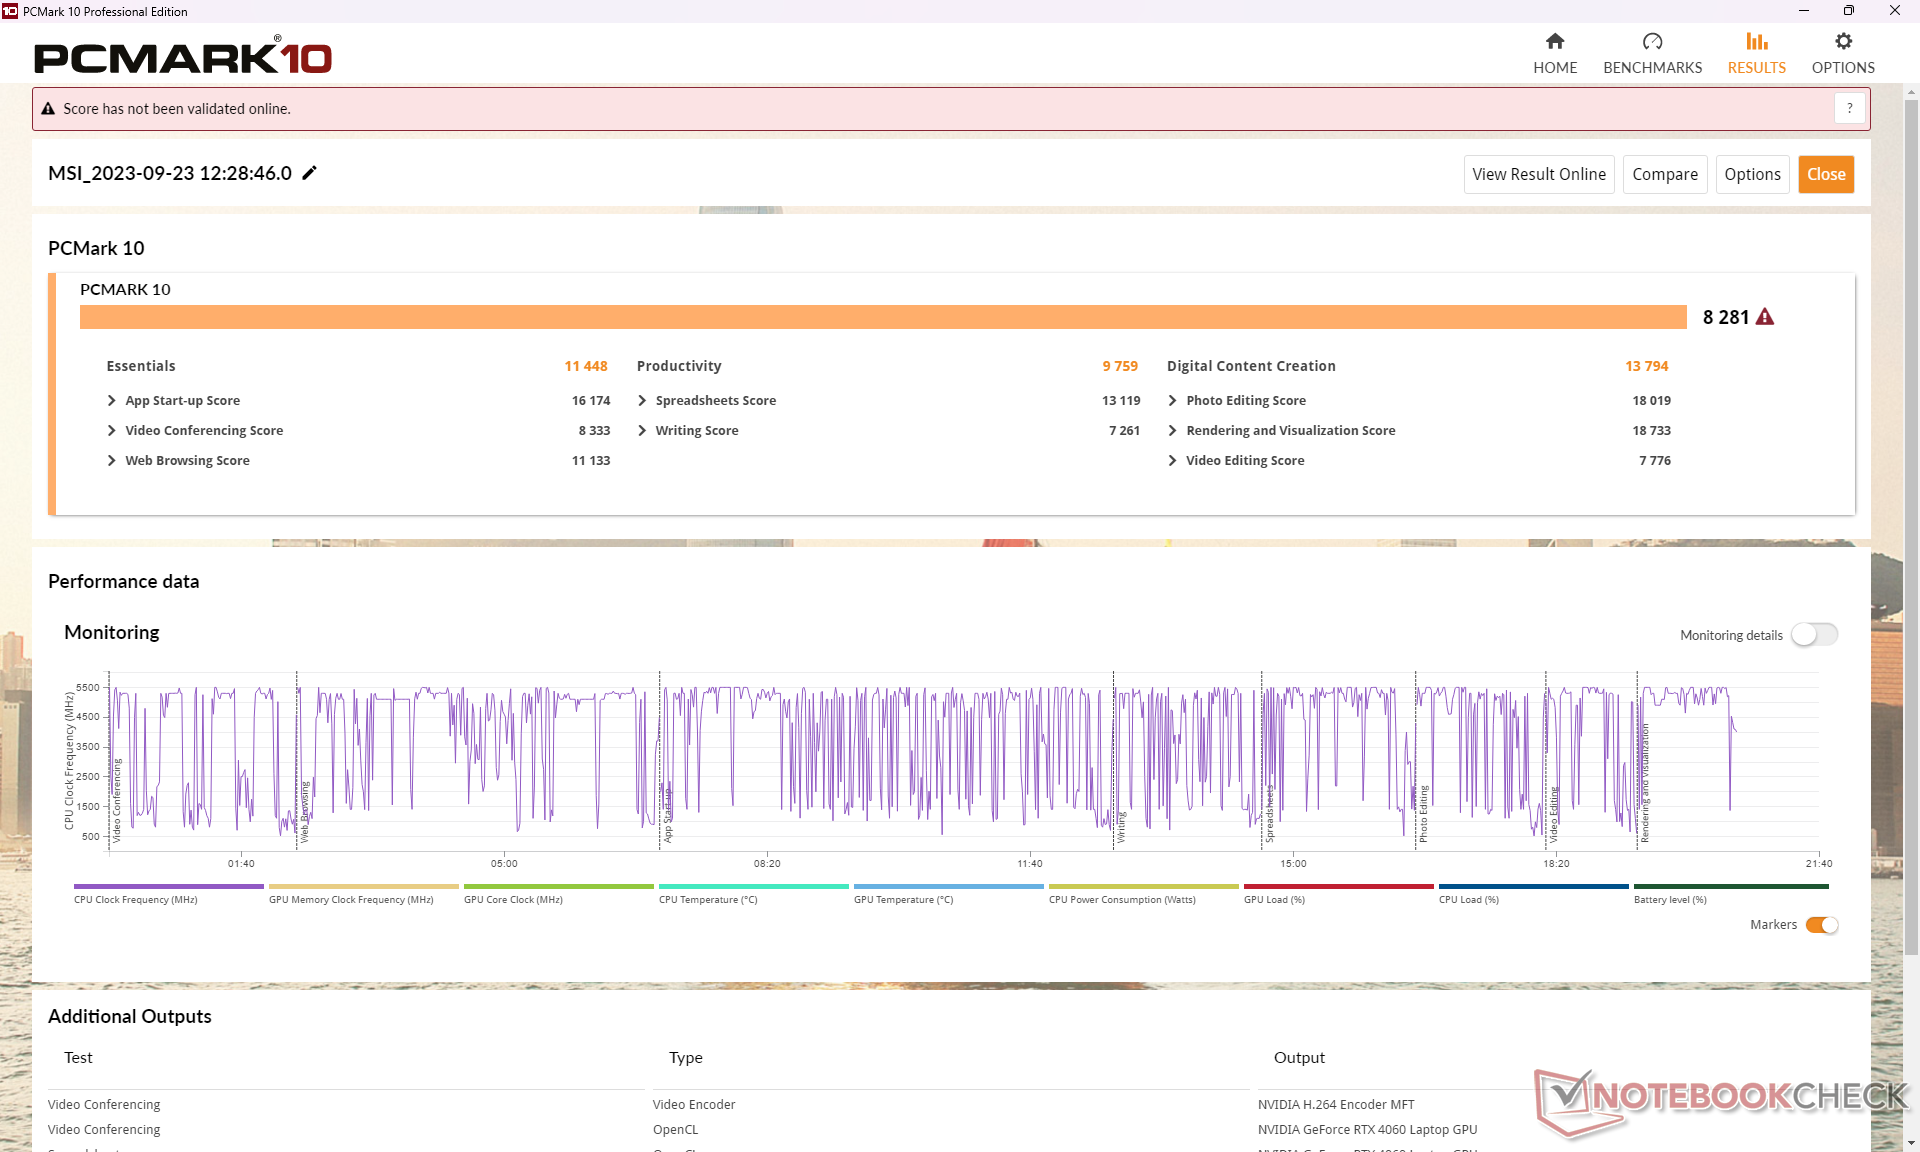
Desempenho do sistema
Os benchmarks do PCMark são comparáveis a outros notebooks para jogos de 16 polegadas, como o Alienware m16 R1 ou o Lenovo Legion Slim 7i 16 por apenas alguns pontos percentuais. Não tivemos nenhum problema ao acordar do modo de suspensão ou outros problemas notáveis com nossa unidade de teste durante os testes.
CrossMark: Overall | Productivity | Creativity | Responsiveness
| PCMark 10 / Score | |
| Alienware m16 R1 AMD | |
| Lenovo Legion Slim 7i 16 Gen 8 | |
| MSI Raider GE68HX 13VF | |
| Média Intel Core i9-13950HX, NVIDIA GeForce RTX 4060 Laptop GPU (n=1) | |
| Asus ROG Zephyrus M16 GU604VY-NM042X | |
| HP Omen 16-xf0376ng | |
| MSI GE67 HX 12UGS | |
| PCMark 10 / Essentials | |
| Asus ROG Zephyrus M16 GU604VY-NM042X | |
| Alienware m16 R1 AMD | |
| MSI Raider GE68HX 13VF | |
| Média Intel Core i9-13950HX, NVIDIA GeForce RTX 4060 Laptop GPU (n=1) | |
| Lenovo Legion Slim 7i 16 Gen 8 | |
| HP Omen 16-xf0376ng | |
| MSI GE67 HX 12UGS | |
| PCMark 10 / Productivity | |
| Asus ROG Zephyrus M16 GU604VY-NM042X | |
| Lenovo Legion Slim 7i 16 Gen 8 | |
| Alienware m16 R1 AMD | |
| HP Omen 16-xf0376ng | |
| MSI GE67 HX 12UGS | |
| MSI Raider GE68HX 13VF | |
| Média Intel Core i9-13950HX, NVIDIA GeForce RTX 4060 Laptop GPU (n=1) | |
| PCMark 10 / Digital Content Creation | |
| Alienware m16 R1 AMD | |
| MSI Raider GE68HX 13VF | |
| Média Intel Core i9-13950HX, NVIDIA GeForce RTX 4060 Laptop GPU (n=1) | |
| Lenovo Legion Slim 7i 16 Gen 8 | |
| HP Omen 16-xf0376ng | |
| MSI GE67 HX 12UGS | |
| Asus ROG Zephyrus M16 GU604VY-NM042X | |
| CrossMark / Overall | |
| Alienware m16 R1 AMD | |
| Lenovo Legion Slim 7i 16 Gen 8 | |
| MSI GE67 HX 12UGS | |
| Asus ROG Zephyrus M16 GU604VY-NM042X | |
| MSI Raider GE68HX 13VF | |
| Média Intel Core i9-13950HX, NVIDIA GeForce RTX 4060 Laptop GPU (n=1) | |
| CrossMark / Productivity | |
| Lenovo Legion Slim 7i 16 Gen 8 | |
| Alienware m16 R1 AMD | |
| MSI GE67 HX 12UGS | |
| Asus ROG Zephyrus M16 GU604VY-NM042X | |
| MSI Raider GE68HX 13VF | |
| Média Intel Core i9-13950HX, NVIDIA GeForce RTX 4060 Laptop GPU (n=1) | |
| CrossMark / Creativity | |
| MSI Raider GE68HX 13VF | |
| Média Intel Core i9-13950HX, NVIDIA GeForce RTX 4060 Laptop GPU (n=1) | |
| Asus ROG Zephyrus M16 GU604VY-NM042X | |
| Alienware m16 R1 AMD | |
| MSI GE67 HX 12UGS | |
| Lenovo Legion Slim 7i 16 Gen 8 | |
| CrossMark / Responsiveness | |
| MSI GE67 HX 12UGS | |
| Lenovo Legion Slim 7i 16 Gen 8 | |
| Alienware m16 R1 AMD | |
| Asus ROG Zephyrus M16 GU604VY-NM042X | |
| MSI Raider GE68HX 13VF | |
| Média Intel Core i9-13950HX, NVIDIA GeForce RTX 4060 Laptop GPU (n=1) | |
| PCMark 10 Score | 8281 pontos | |
Ajuda | ||
| AIDA64 / Memory Copy | |
| MSI Raider GE68HX 13VF | |
| Média Intel Core i9-13950HX (61938 - 78813, n=9) | |
| Asus ROG Zephyrus M16 GU604VY-NM042X | |
| HP Omen 16-xf0376ng | |
| MSI GE67 HX 12UGS | |
| Alienware m16 R1 AMD | |
| Lenovo Legion Slim 7i 16 Gen 8 | |
| AIDA64 / Memory Read | |
| MSI Raider GE68HX 13VF | |
| Média Intel Core i9-13950HX (62368 - 86831, n=9) | |
| Asus ROG Zephyrus M16 GU604VY-NM042X | |
| HP Omen 16-xf0376ng | |
| MSI GE67 HX 12UGS | |
| Alienware m16 R1 AMD | |
| Lenovo Legion Slim 7i 16 Gen 8 | |
| AIDA64 / Memory Write | |
| HP Omen 16-xf0376ng | |
| MSI Raider GE68HX 13VF | |
| Média Intel Core i9-13950HX (59501 - 80441, n=9) | |
| Asus ROG Zephyrus M16 GU604VY-NM042X | |
| MSI GE67 HX 12UGS | |
| Alienware m16 R1 AMD | |
| Lenovo Legion Slim 7i 16 Gen 8 | |
| AIDA64 / Memory Latency | |
| MSI GE67 HX 12UGS | |
| Alienware m16 R1 AMD | |
| HP Omen 16-xf0376ng | |
| Média Intel Core i9-13950HX (84.4 - 99.5, n=9) | |
| Asus ROG Zephyrus M16 GU604VY-NM042X | |
| MSI Raider GE68HX 13VF | |
| Lenovo Legion Slim 7i 16 Gen 8 | |
* ... menor é melhor
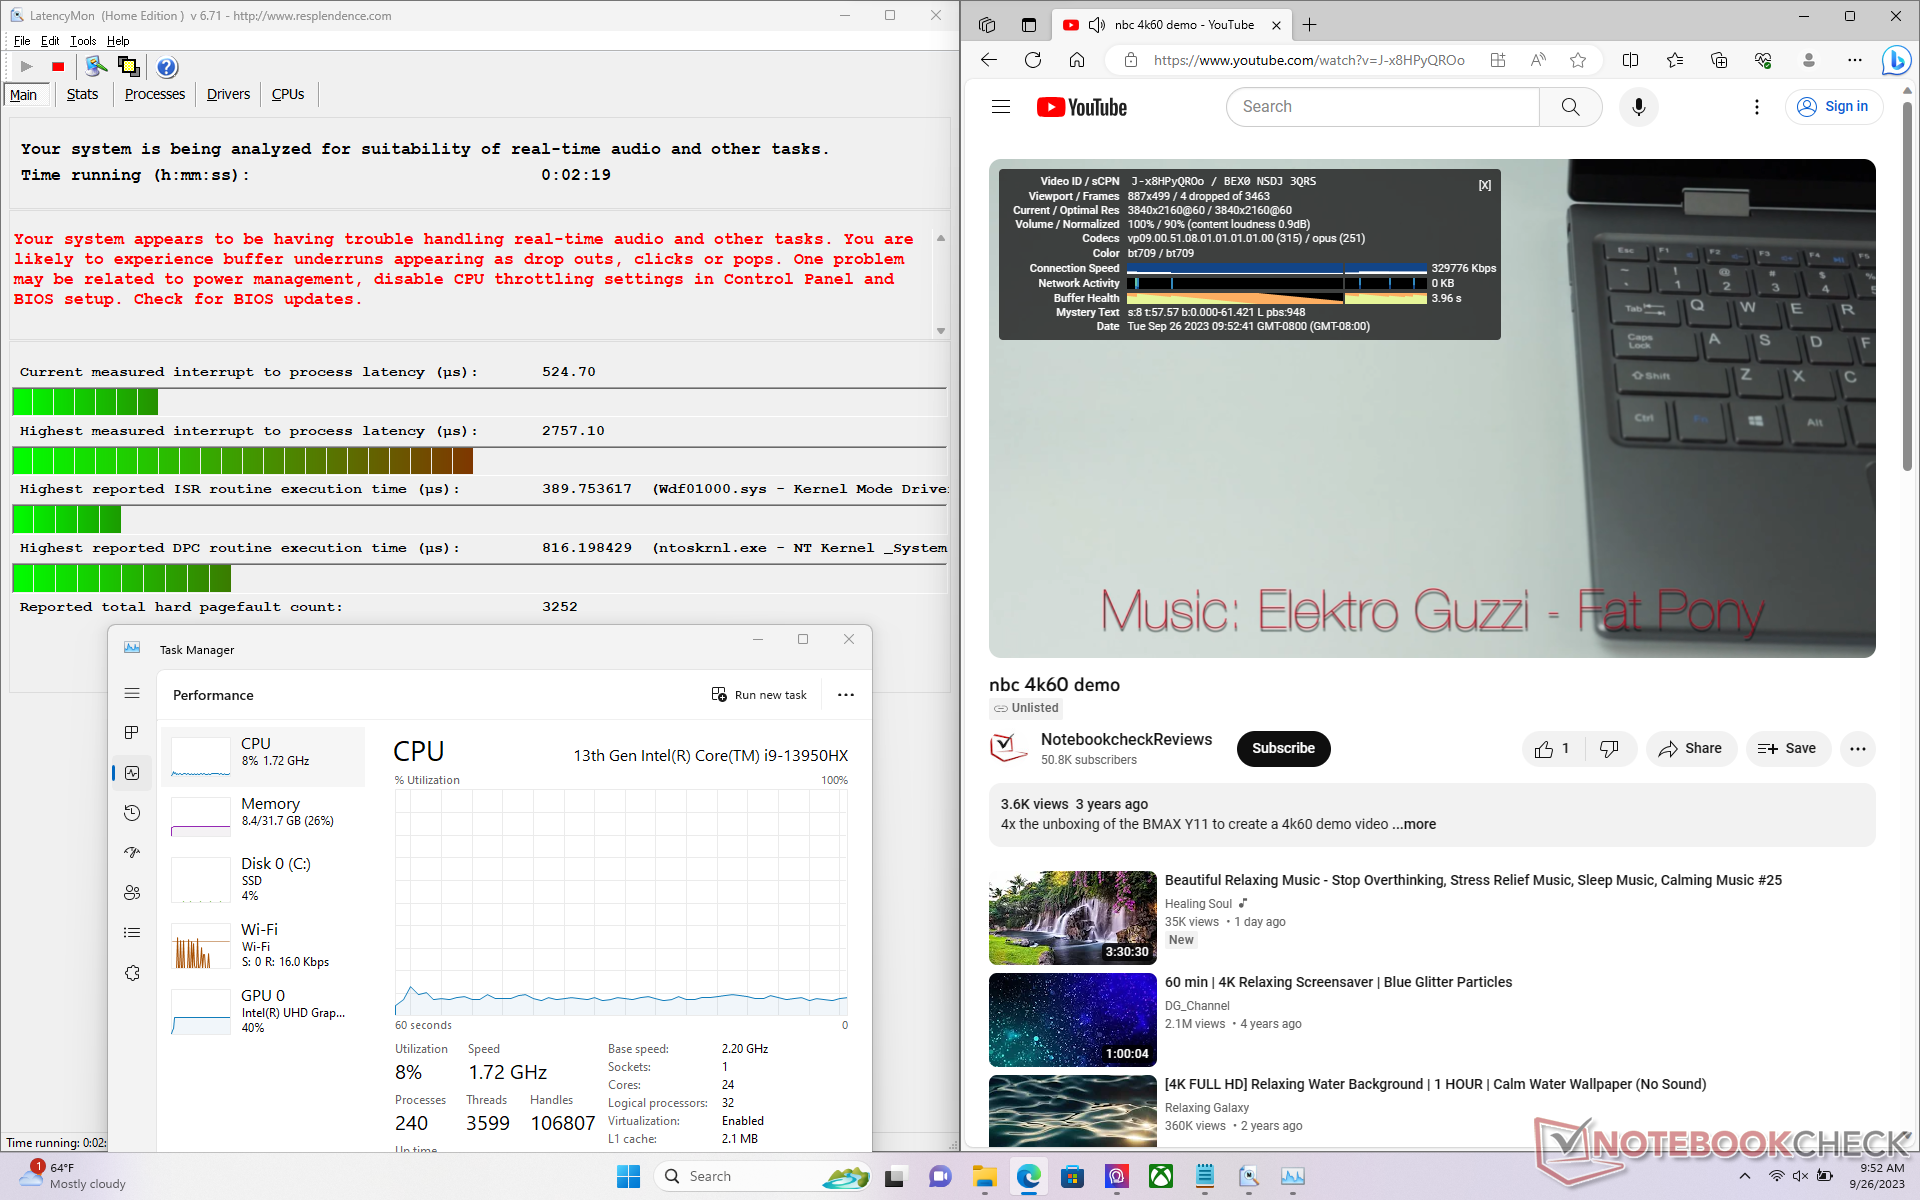
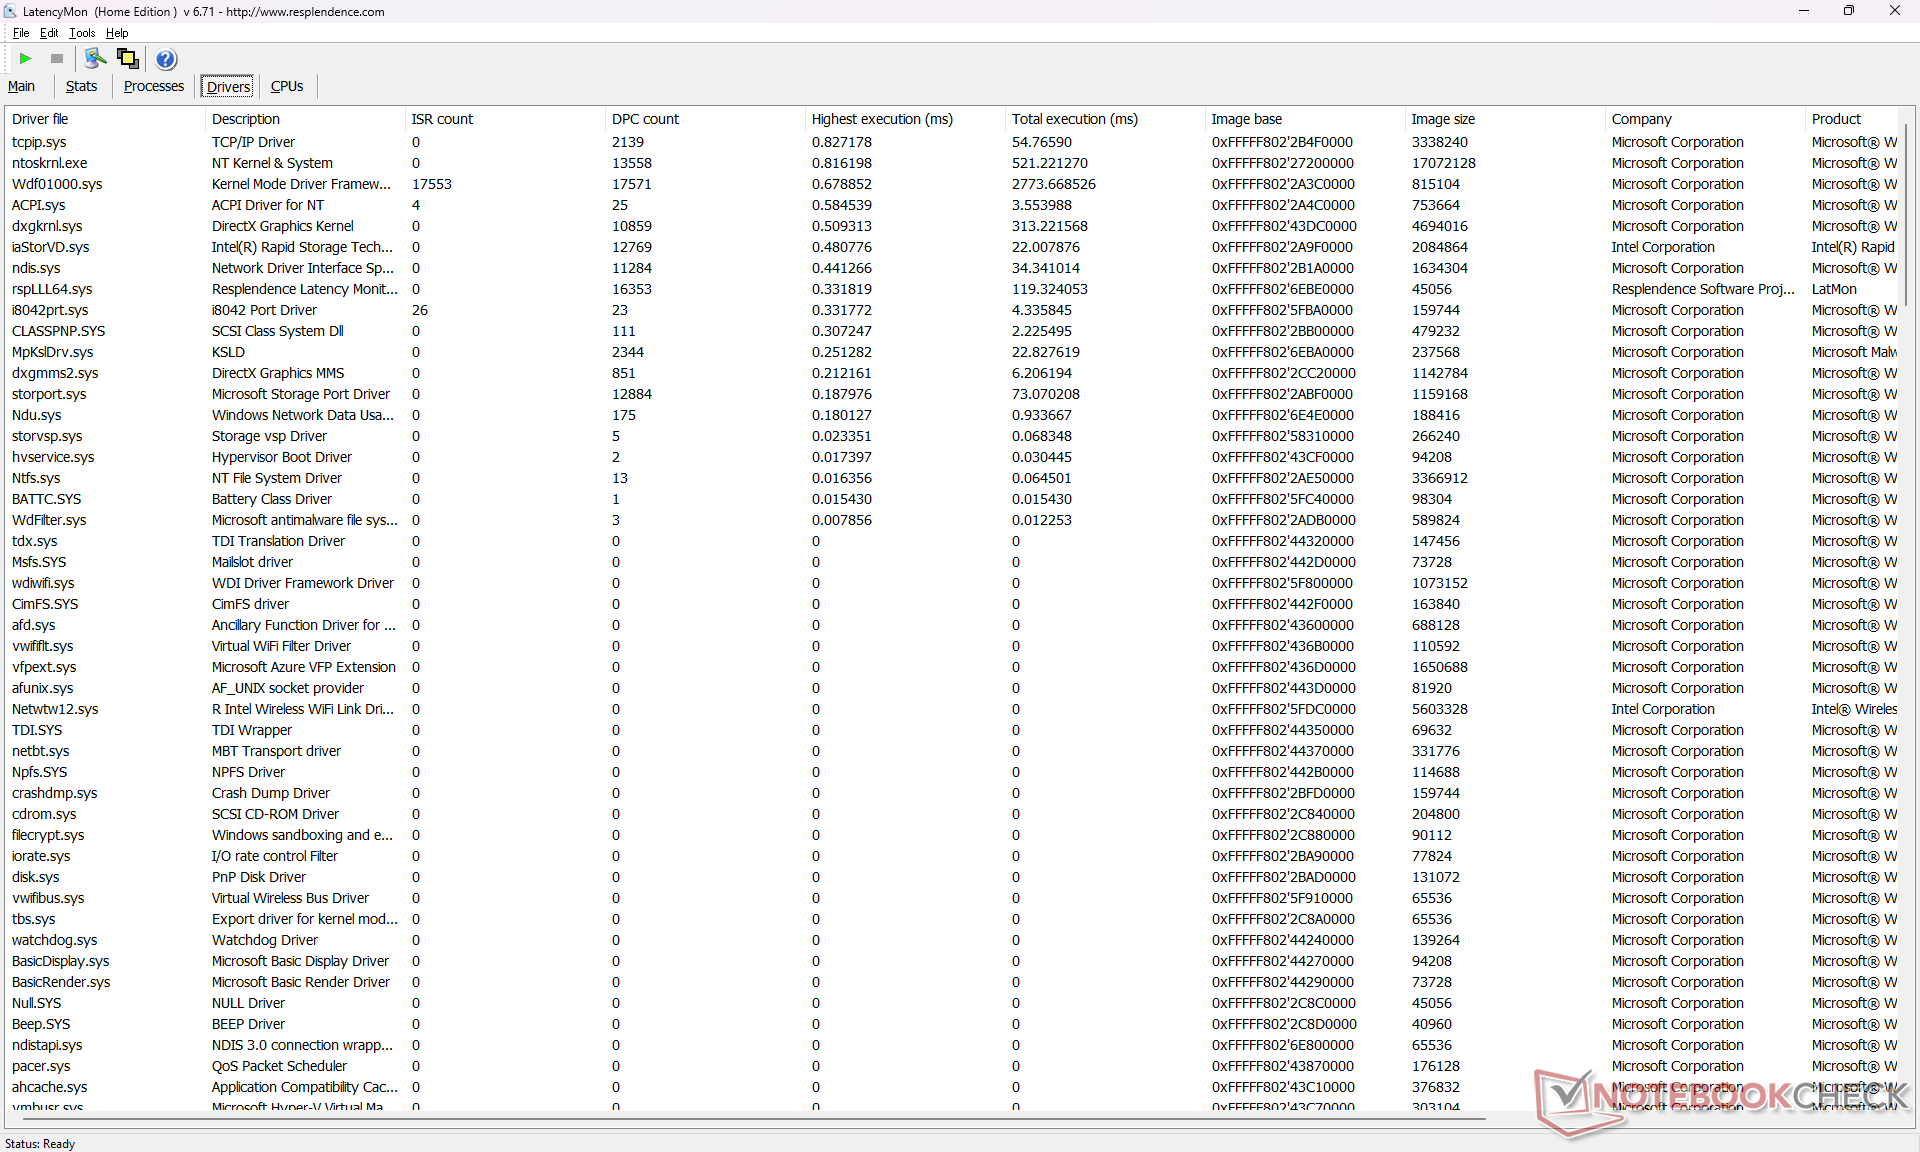
Latência DPC
O LatencyMon revela problemas de DPC ao abrir várias guias do navegador em nossa página inicial. a reprodução de vídeo 4K a 60 FPS é imperfeita, com 4 quadros perdidos registrados durante uma janela de 60 segundos.
| DPC Latencies / LatencyMon - interrupt to process latency (max), Web, Youtube, Prime95 | |
| Lenovo Legion Slim 7i 16 Gen 8 | |
| Asus ROG Zephyrus M16 GU604VY-NM042X | |
| MSI Raider GE68HX 13VF | |
| HP Omen 16-xf0376ng | |
| Alienware m16 R1 AMD | |
| MSI GE67 HX 12UGS | |
* ... menor é melhor
Dispositivos de armazenamento
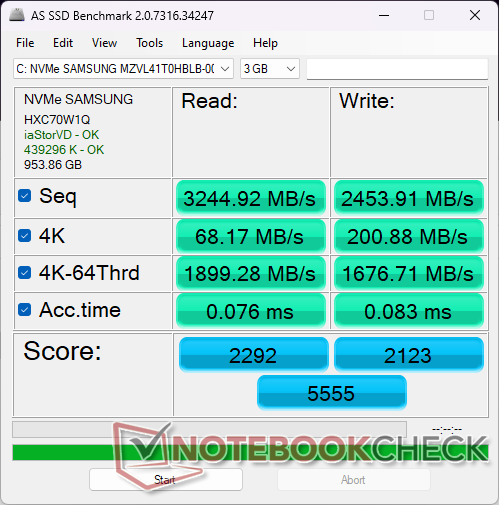
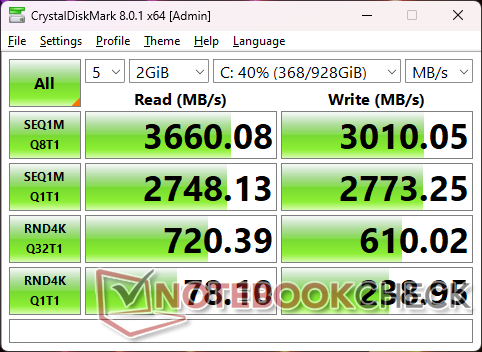
Nossa unidade vem com o modelo mais barato de 1 TB Samsung PM9B1 em vez do Samsung PM9A1, mais caro, provavelmente para economizar nos custos. O PM9B1 é quase metade da velocidade, com taxas máximas de leitura sequencial de cerca de 3.600 MB/s, em comparação com cerca de 7.000 MB/s no PM9A1. Apesar disso, o desempenho do SSD é estável, sem limitação.

| Drive Performance rating - Percent | |
| MSI GE67 HX 12UGS | |
| Lenovo Legion Slim 7i 16 Gen 8 | |
| Alienware m16 R1 AMD | |
| Asus ROG Zephyrus M16 GU604VY-NM042X | |
| HP Omen 16-xf0376ng | |
| MSI Raider GE68HX 13VF -11! | |
* ... menor é melhor
Disk Throttling: DiskSpd Read Loop, Queue Depth 8
Desempenho da GPU
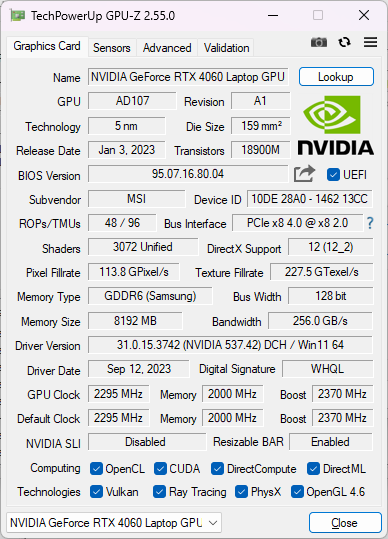
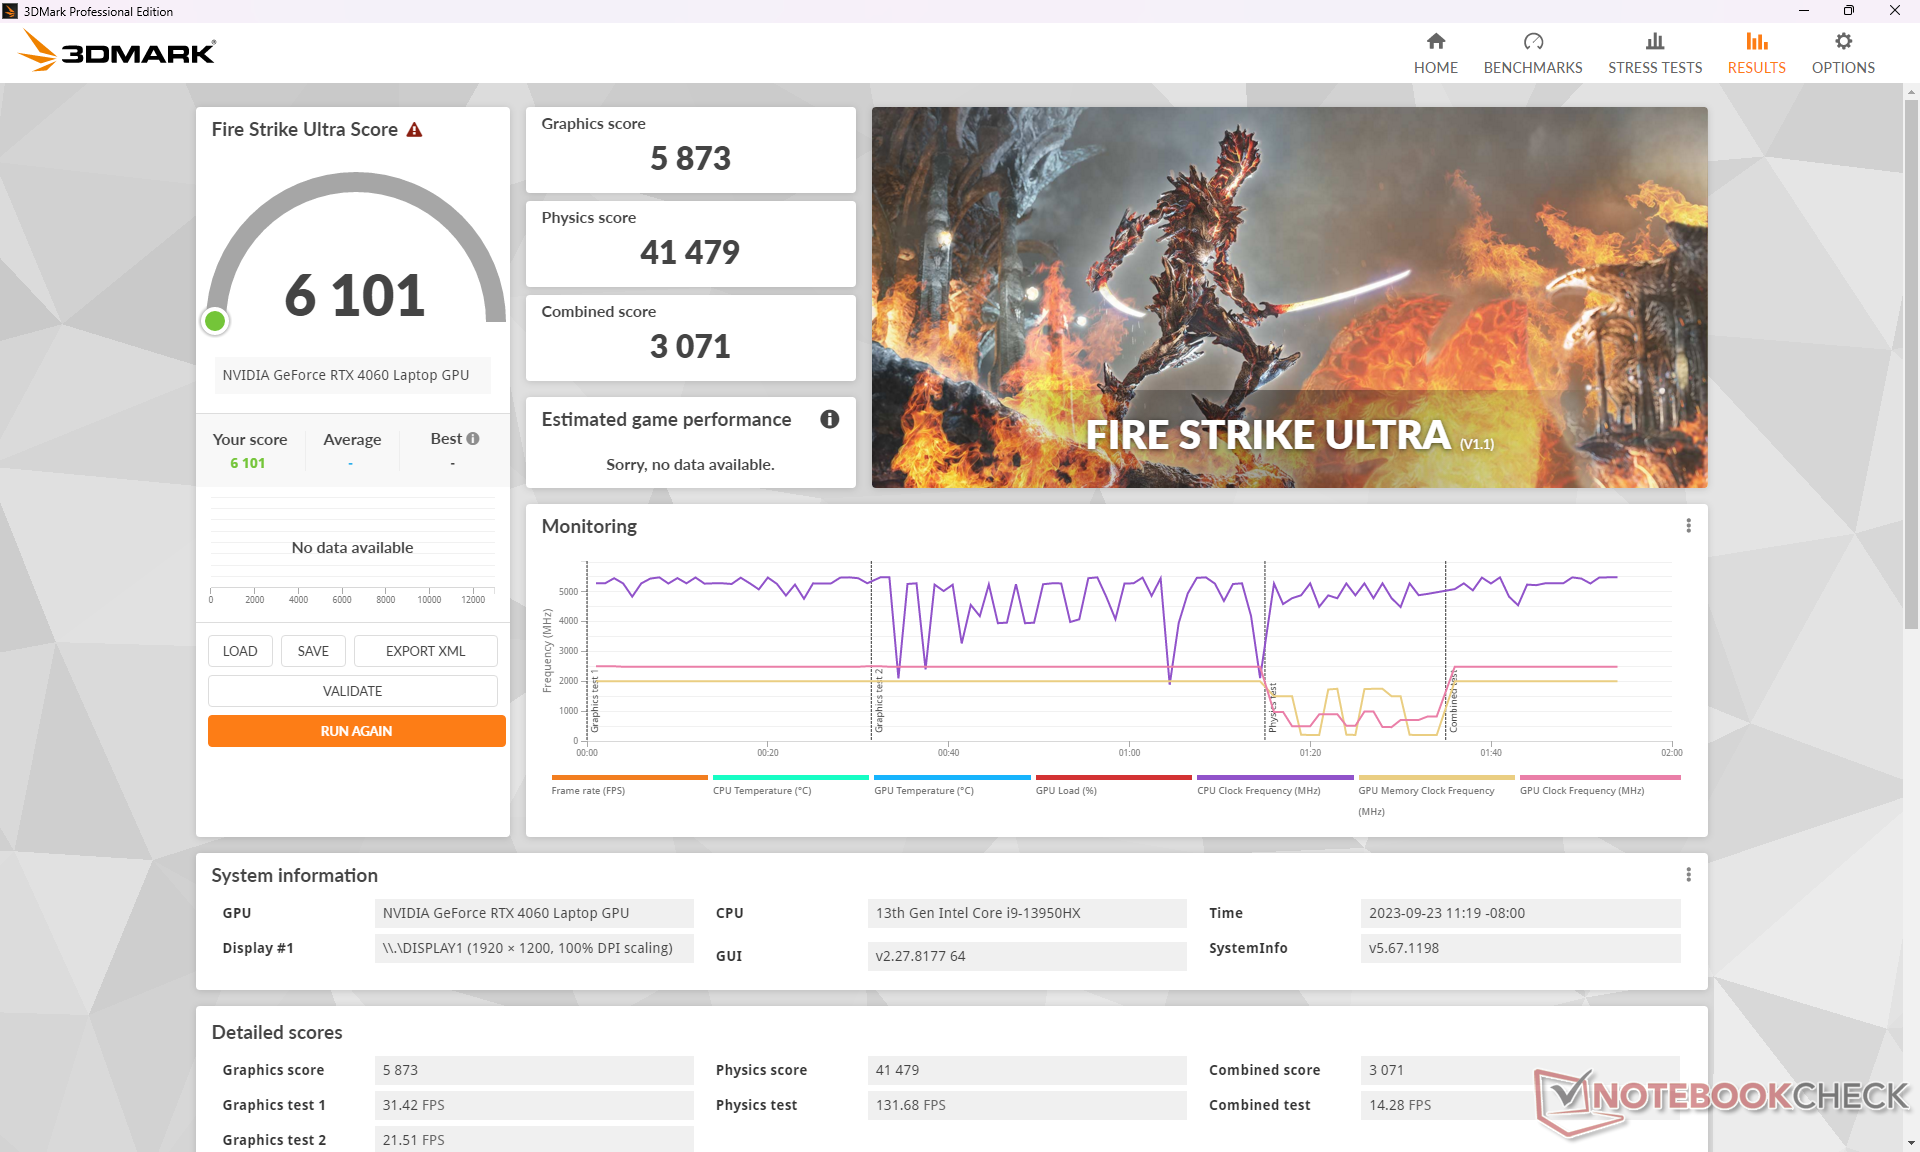
Nossa RTX 4060 apresenta um bom desempenho com resultados que estão apenas ligeiramente acima da média dos notebooks para jogos em nosso banco de dados equipados com a mesma GPU. O upgrade para a RTX 4070, 4080 ou 4090 deverá aumentar o desempenho em 10 a 20%, 60 a 80% e 80 a 100%, respectivamente, em relação à RTX 4060. A diferença de desempenho é maior entre a RTX 4070 e a 4080.
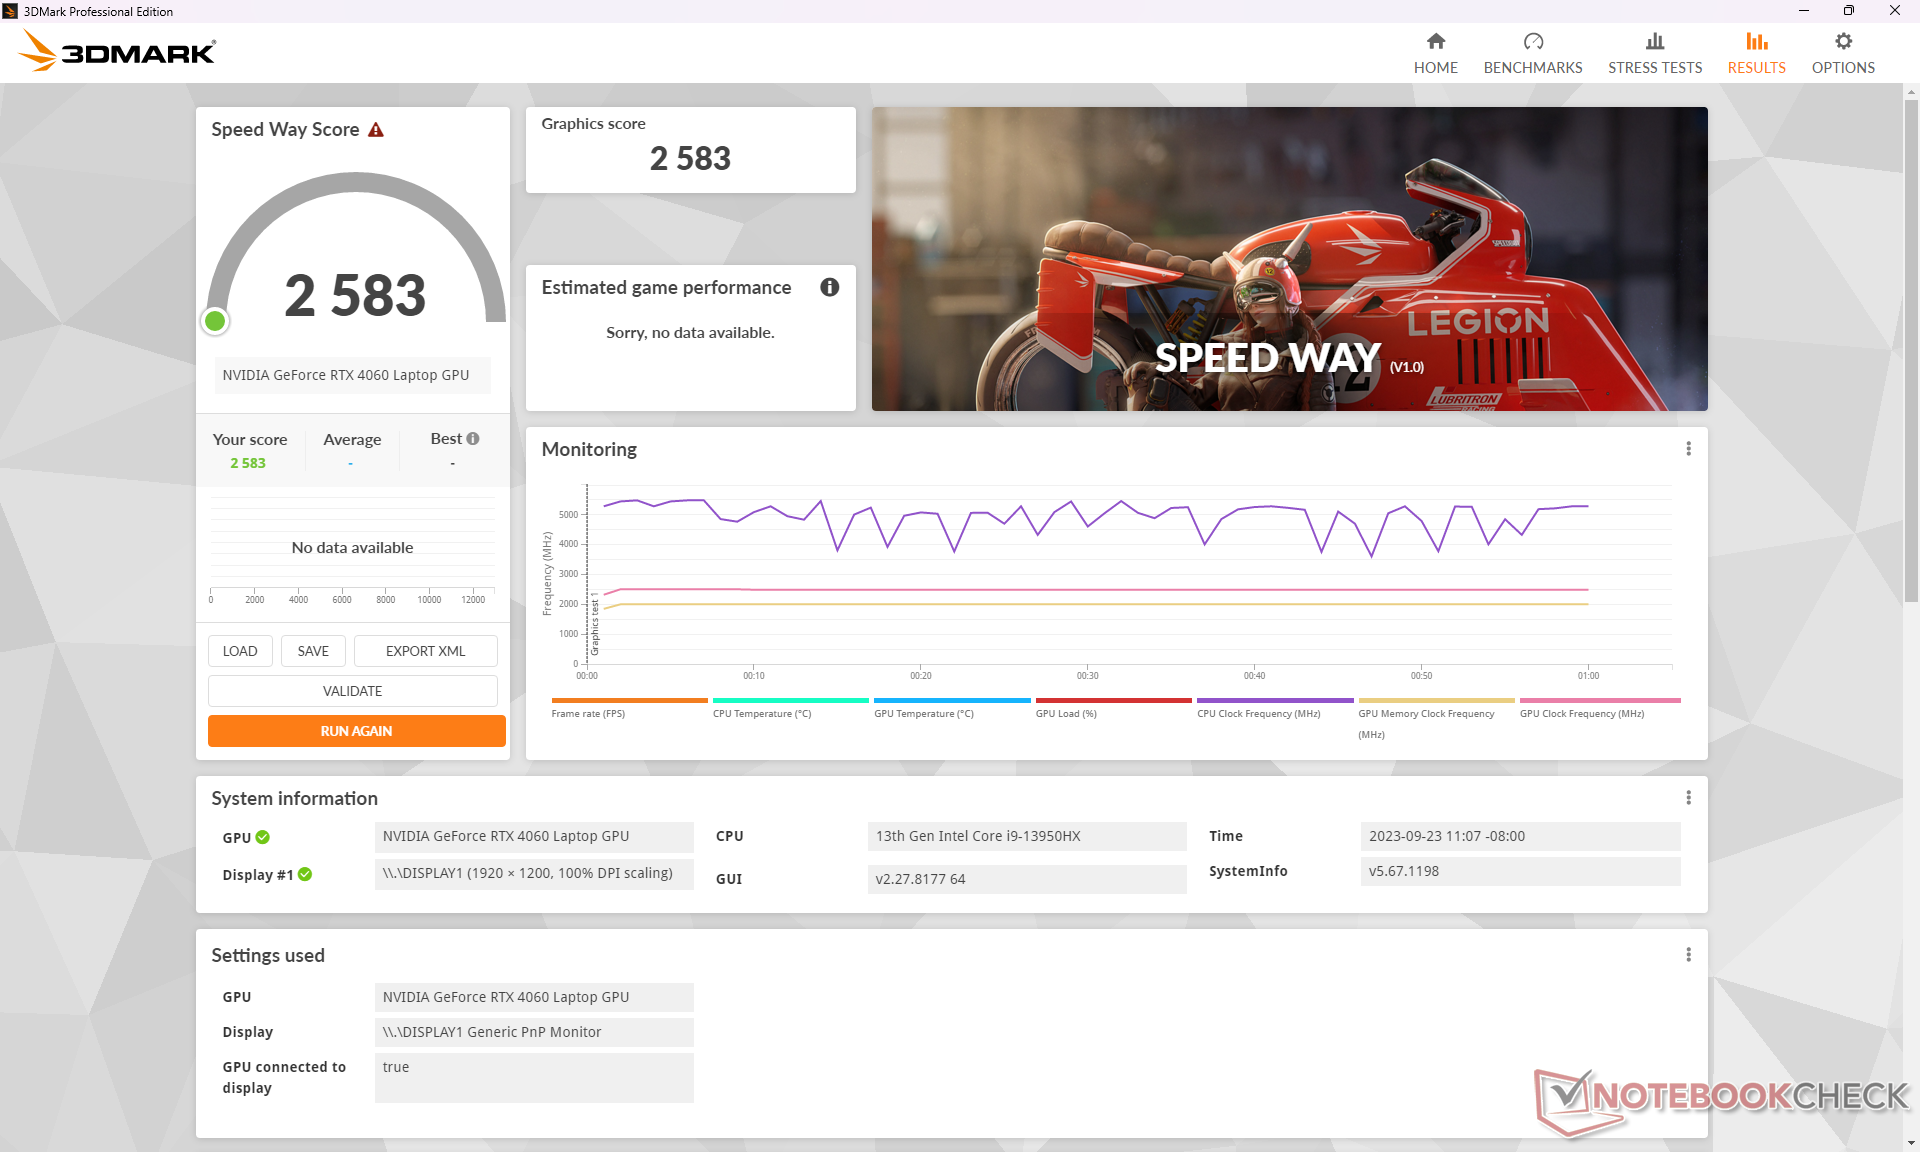
De forma irritante, a MSI programou o MSI Center para mudar automaticamente para o modo Extreme Performance sempre que detectar que o 3DMark está sendo executado e, infelizmente, não há uma maneira fácil de desativar isso. Achamos isso frustrante, pois tira o controle do usuário final. A alternância automática não ocorre durante a execução de jogos.
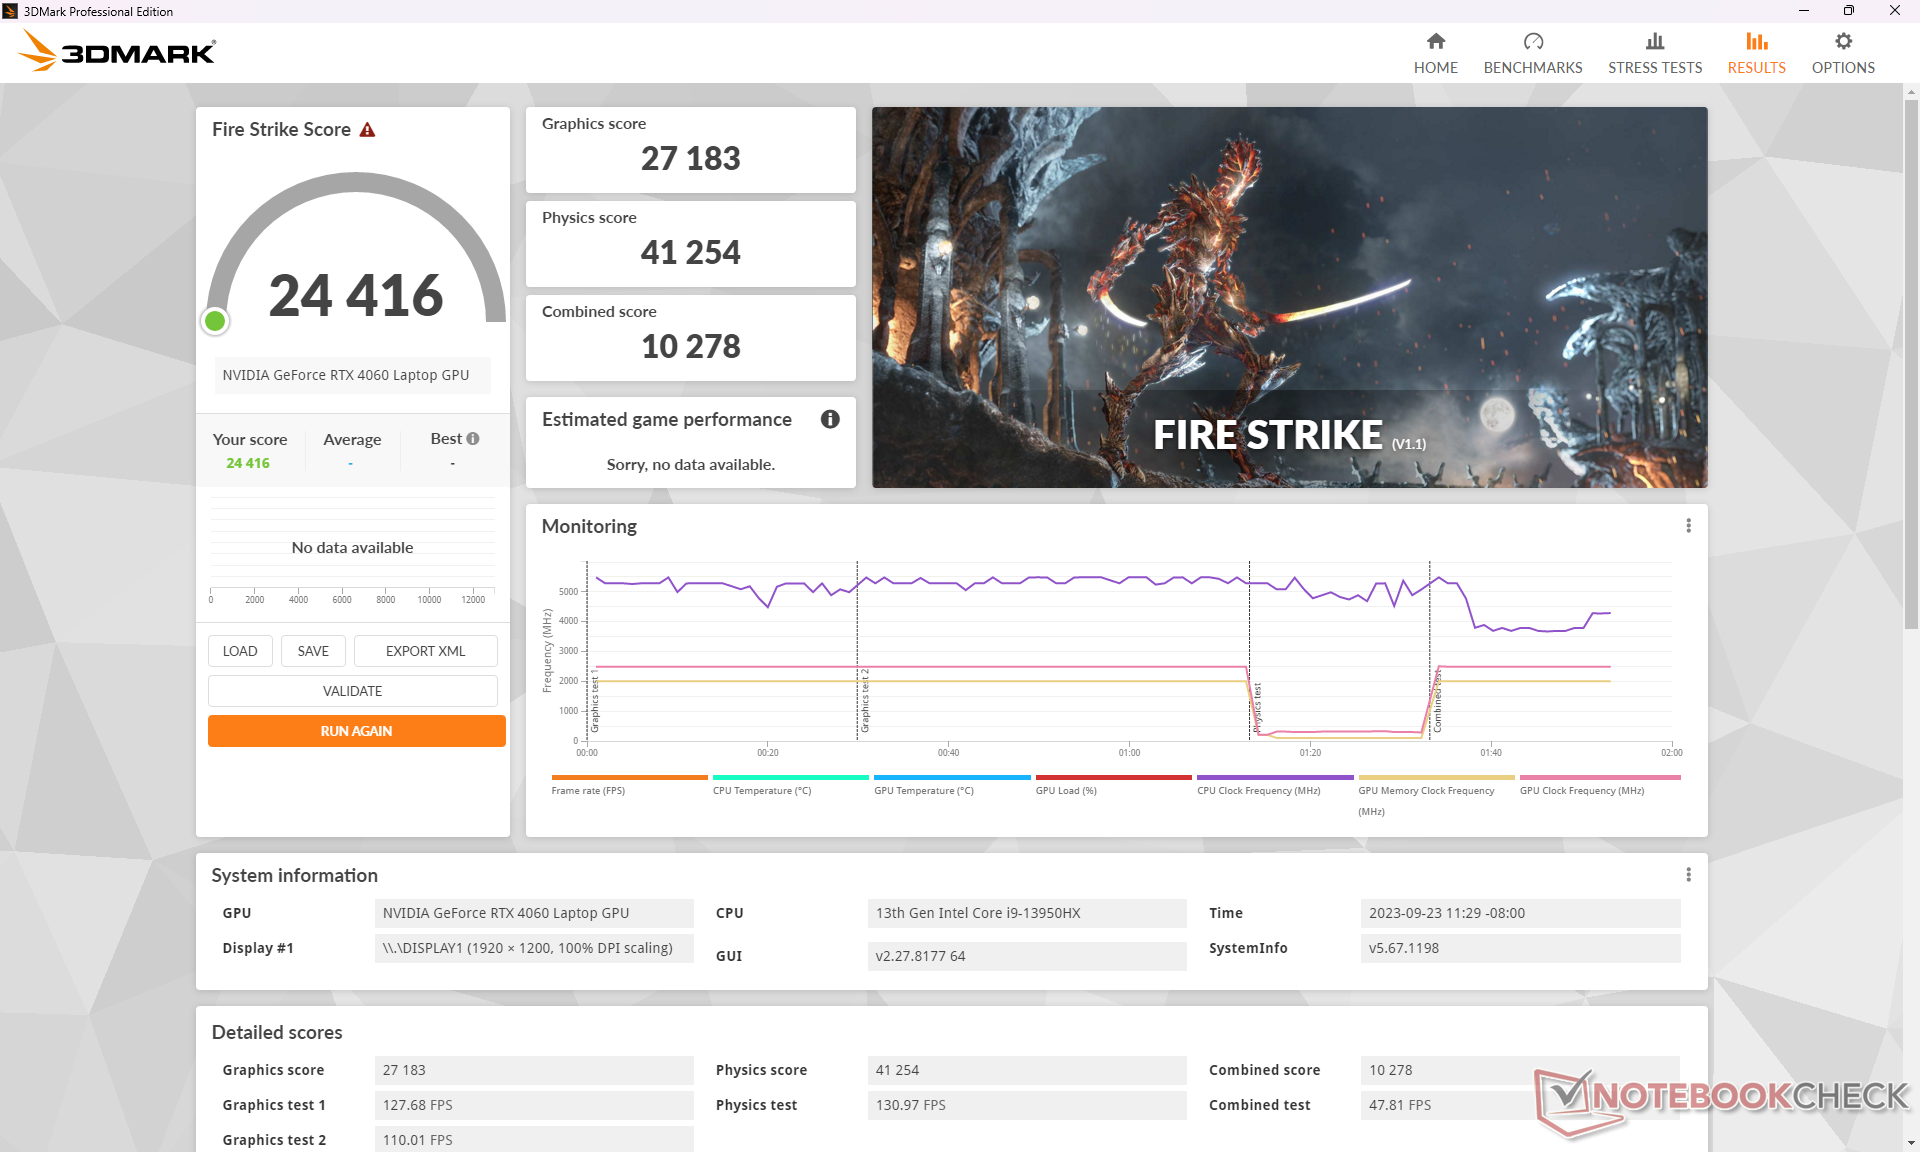
A ativação do Cooler Boost não parece afetar significativamente o desempenho da CPU ou da GPU, como mostram os resultados do site Fire Strike abaixo. Portanto, o recurso não é vital para o desempenho máximo e só é recomendado se for necessário manter temperaturas de funcionamento mais baixas.
| Perfil de energia | Fire Strike Gráficos | Fire Strike Física | Pontuação combinada |
| Modo de desempenho extremo (Cooler Boost ativado) | 27127 | 41525 | 11480 |
| Modo de desempenho extremo (Cooler Boost desativado) | 27183 (0%) | 41254 (-1%) | 10278 (-10%) |
| Energia da bateria | 19528 (-28%) | 18623 (-55%) | 5986 (-48%) |
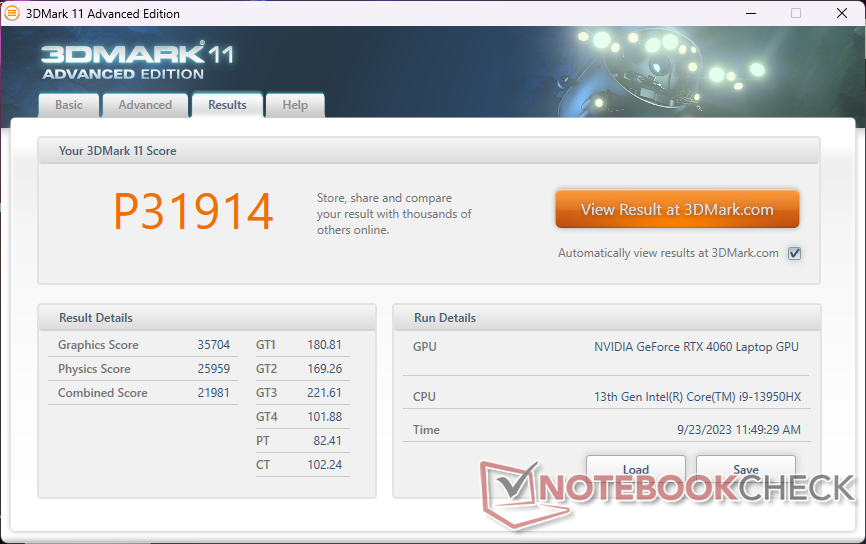
| 3DMark 11 Performance | 31914 pontos | |
| 3DMark Fire Strike Score | 24416 pontos | |
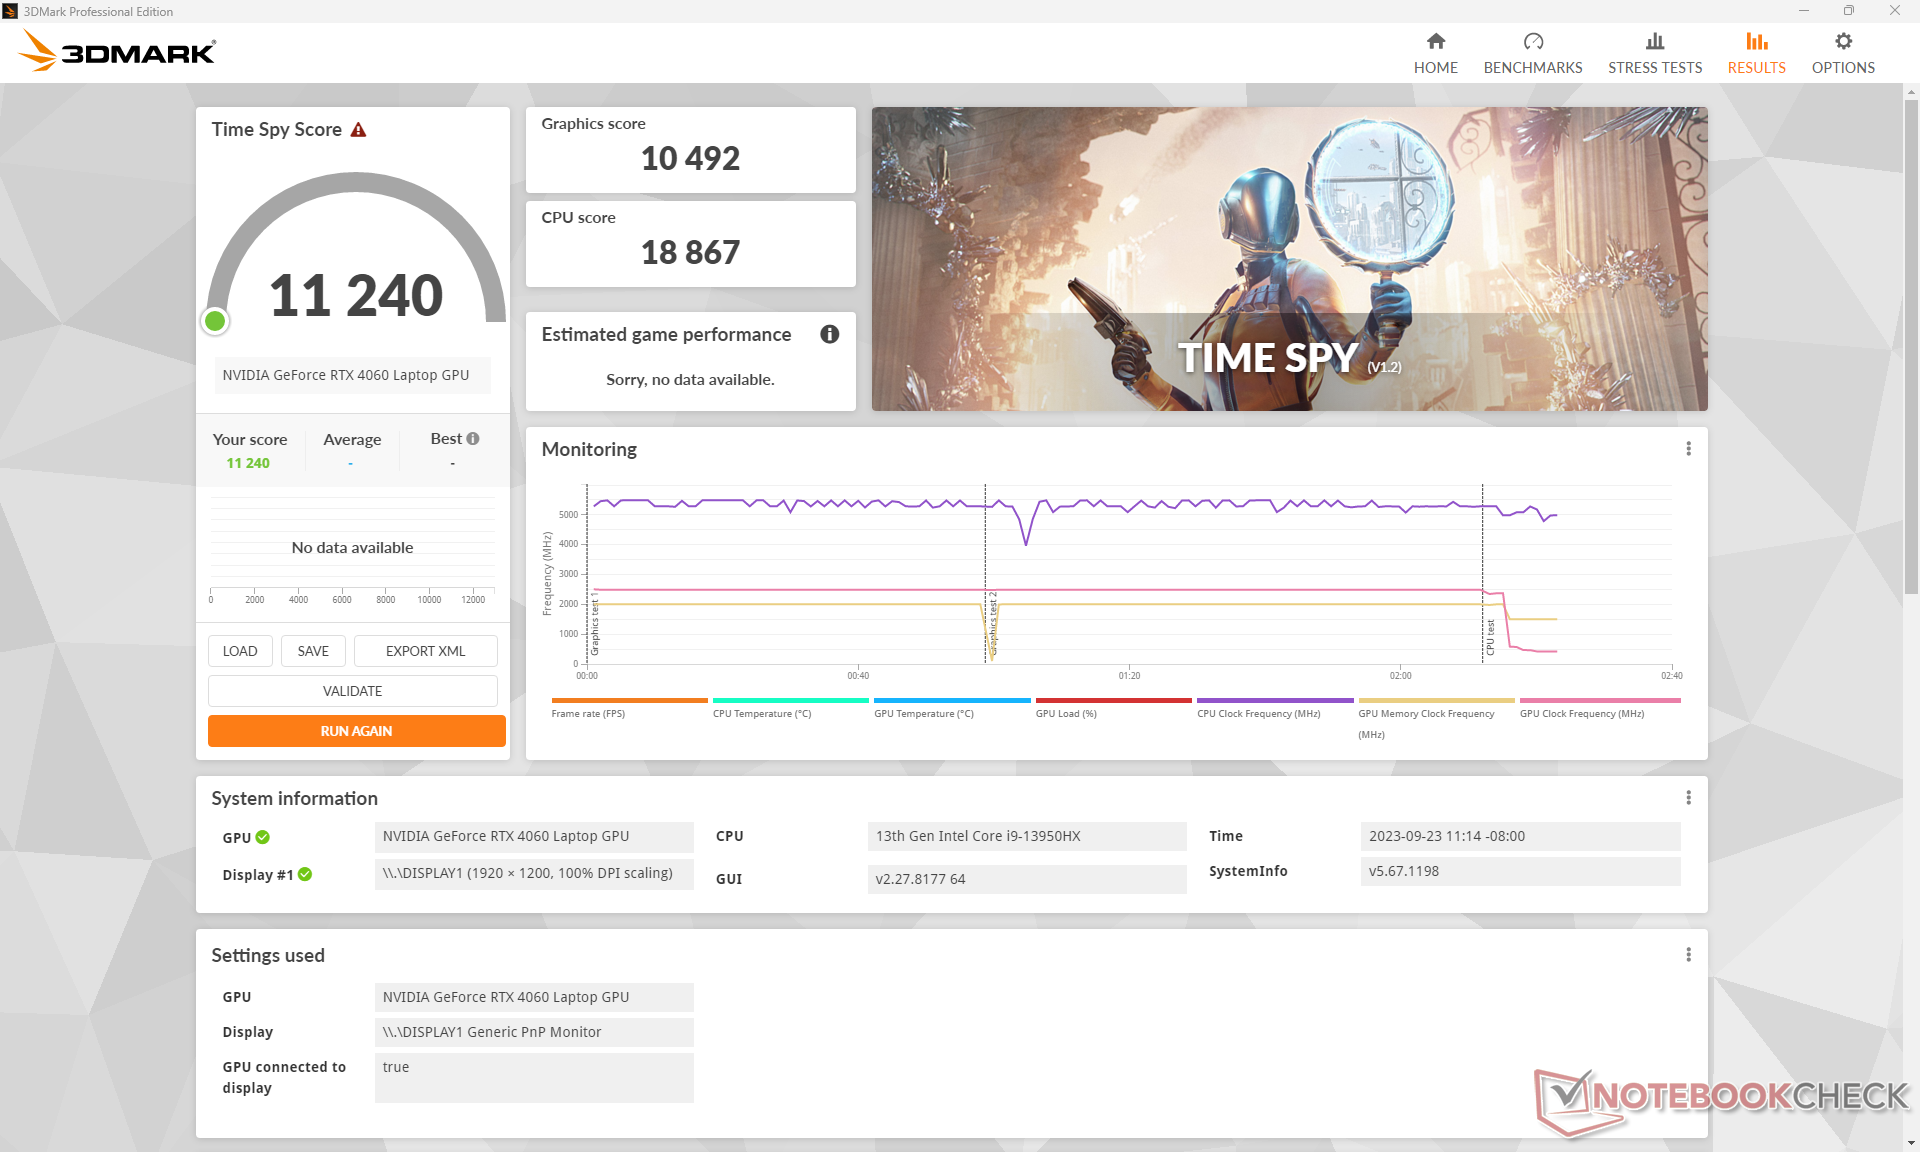
| 3DMark Time Spy Score | 11240 pontos | |
Ajuda | ||
* ... menor é melhor
Desempenho em jogos
Assim como a RTX 2060 e a RTX 3060 antes dela, a RTX 4060 é perfeita para jogos em 1080p60. Todos os jogos testados funcionam muito bem nas configurações máximas de 1080p, mas os jogos mais novos e mais exigentes, como Ratchet and Clank Rift Apart, tendem a cair abaixo de 60 FPS. Recomenda-se configurações mais baixas ou DLSS nesses casos, especialmente porque a tela principal não tem suporte para G-Sync.
| Tiny Tina's Wonderlands | |
| 1920x1080 Low Preset (DX12) | |
| Alienware m16 R1 AMD | |
| Lenovo Legion Slim 7i 16 Gen 8 | |
| MSI Raider GE68HX 13VF | |
| Média NVIDIA GeForce RTX 4060 Laptop GPU (164.4 - 235, n=9) | |
| 1920x1080 Medium Preset (DX12) | |
| Alienware m16 R1 AMD | |
| Lenovo Legion Slim 7i 16 Gen 8 | |
| MSI Raider GE68HX 13VF | |
| Média NVIDIA GeForce RTX 4060 Laptop GPU (116 - 192.3, n=9) | |
| 1920x1080 High Preset (DX12) | |
| Alienware m16 R1 AMD | |
| Lenovo Legion Slim 7i 16 Gen 8 | |
| MSI Raider GE68HX 13VF | |
| Média NVIDIA GeForce RTX 4060 Laptop GPU (86.6 - 121.2, n=10) | |
| 1920x1080 Badass Preset (DX12) | |
| Asus Zephyrus Duo 16 GX650PY-NM006W | |
| Alienware m16 R1 AMD | |
| Lenovo Legion Slim 7i 16 Gen 8 | |
| MSI Raider GE68HX 13VF | |
| Média NVIDIA GeForce RTX 4060 Laptop GPU (67.5 - 92.7, n=11) | |
| Ratchet & Clank Rift Apart | |
| 1920x1080 Low Preset | |
| Média NVIDIA GeForce RTX 4060 Laptop GPU (84.7 - 86, n=3) | |
| MSI Raider GE68HX 13VF | |
| 1920x1080 Medium Preset AA:T | |
| MSI Raider GE68HX 13VF | |
| Média NVIDIA GeForce RTX 4060 Laptop GPU (73.4 - 75, n=4) | |
| 1920x1080 High Preset AA:T | |
| Média NVIDIA GeForce RTX 4060 Laptop GPU (59 - 60.6, n=4) | |
| MSI Raider GE68HX 13VF | |
| 1920x1080 Very High Preset AA:T | |
| Média NVIDIA GeForce RTX 4060 Laptop GPU (51.6 - 54.8, n=4) | |
| MSI Raider GE68HX 13VF | |
Witcher 3 FPS Chart
| baixo | média | alto | ultra | |
|---|---|---|---|---|
| The Witcher 3 (2015) | 556.3 | 364.9 | 213.1 | 103.5 |
| Dota 2 Reborn (2015) | 232 | 207 | 199 | 182.2 |
| Final Fantasy XV Benchmark (2018) | 223 | 151.3 | 103.2 | |
| X-Plane 11.11 (2018) | 209 | 184 | 141.1 | |
| Far Cry 5 (2018) | 191 | 158 | 147 | 138 |
| Strange Brigade (2018) | 487 | 291 | 232 | 194 |
| Cyberpunk 2077 1.6 (2022) | 129.1 | 103 | 88.3 | 80.4 |
| Tiny Tina's Wonderlands (2022) | 233.9 | 184.6 | 116.5 | 88.3 |
| F1 22 (2022) | 288 | 271 | 206 | 65.5 |
| Ratchet & Clank Rift Apart (2023) | 84.7 | 75 | 59 | 51.6 |
Emissões
Ruído do sistema - o modo balanceado é recomendado para a maioria dos cenários
O ruído do ventilador é misto. As duas ventoinhas são muito sensíveis a cargas na tela, o que significa que elas aumentam de forma acentuada e rápida ao simplesmente iniciar aplicativos ou navegar na Web, mesmo quando configuradas para o perfil de energia balanceada. O ruído da ventoinha também é audível no modo Silencioso, mas a pulsação é muito menos frequente. Em geral, os usuários podem esperar um nível de ruído na faixa de 25 a 38 dB(A) ao navegar ou fazer streaming de vídeo, mesmo no modo Silencioso.
O ruído do ventilador durante os jogos pode variar bastante, dependendo do perfil de energia selecionado. Executando Witcher 3 nos modos Balanced (balanceado) ou Extreme Performance (desempenho extremo) resultaria em um nível de ruído de 46,2 dB(A) ou 57 dB(A), respectivamente. Se o Cooler Boost estiver ativado, o nível máximo aumentará ainda mais para 60,1 dB(A), tornando-se um dos laptops para jogos de 16 polegadas mais barulhentos. Felizmente, a perda de desempenho gráfico ao jogar no modo Balanced é muito pequena e, portanto, as configurações Extreme Performance e Cooler Boost só são recomendadas se você desejar temperaturas de funcionamento mais baixas ou se estiver fazendo overclock manual da GPU.
Barulho
| Ocioso |
| 25 / 31.3 / 37.5 dB |
| Carga |
| 44 / 60.1 dB |
 | ||
30 dB silencioso 40 dB(A) audível 50 dB(A) ruidosamente alto |
||
min: | ||
| MSI Raider GE68HX 13VF GeForce RTX 4060 Laptop GPU, i9-13950HX, Samsung PM9B1 1024GB MZVL41T0HBLB | MSI GE67 HX 12UGS GeForce RTX 3070 Ti Laptop GPU, i7-12800HX, Samsung PM9A1 MZVL21T0HCLR | HP Omen 16-xf0376ng GeForce RTX 4070 Laptop GPU, R7 7840HS, WDC PC SN810 512GB | Alienware m16 R1 AMD GeForce RTX 4080 Laptop GPU, R9 7845HX, Kioxia XG8 KXG80ZNV1T02 | Lenovo Legion Slim 7i 16 Gen 8 GeForce RTX 4070 Laptop GPU, i9-13900H, Samsung PM9A1 MZVL21T0HCLR | Asus ROG Zephyrus M16 GU604VY-NM042X GeForce RTX 4090 Laptop GPU, i9-13900H, Samsung PM9A1 MZVL22T0HBLB | |
|---|---|---|---|---|---|---|
| Noise | 12% | 9% | 12% | 16% | 5% | |
| desligado / ambiente * (dB) | 23.3 | 22.7 3% | 24 -3% | 22.9 2% | 22.8 2% | 24 -3% |
| Idle Minimum * (dB) | 25 | 22.9 8% | 25 -0% | 22.9 8% | 23.6 6% | 24 4% |
| Idle Average * (dB) | 31.3 | 22.9 27% | 29 7% | 29.7 5% | 23.6 25% | 29.96 4% |
| Idle Maximum * (dB) | 37.5 | 22.9 39% | 32 15% | 29.7 21% | 25.7 31% | 34.27 9% |
| Load Average * (dB) | 44 | 44.4 -1% | 44 -0% | 29.8 32% | 27.6 37% | 35.89 18% |
| Witcher 3 ultra * (dB) | 57 | 55.7 2% | 44 23% | 54.7 4% | 54.4 5% | 57.5 -1% |
| Load Maximum * (dB) | 60.1 | 57.4 4% | 46 23% | 54.7 9% | 54.4 9% | 57.54 4% |
* ... menor é melhor
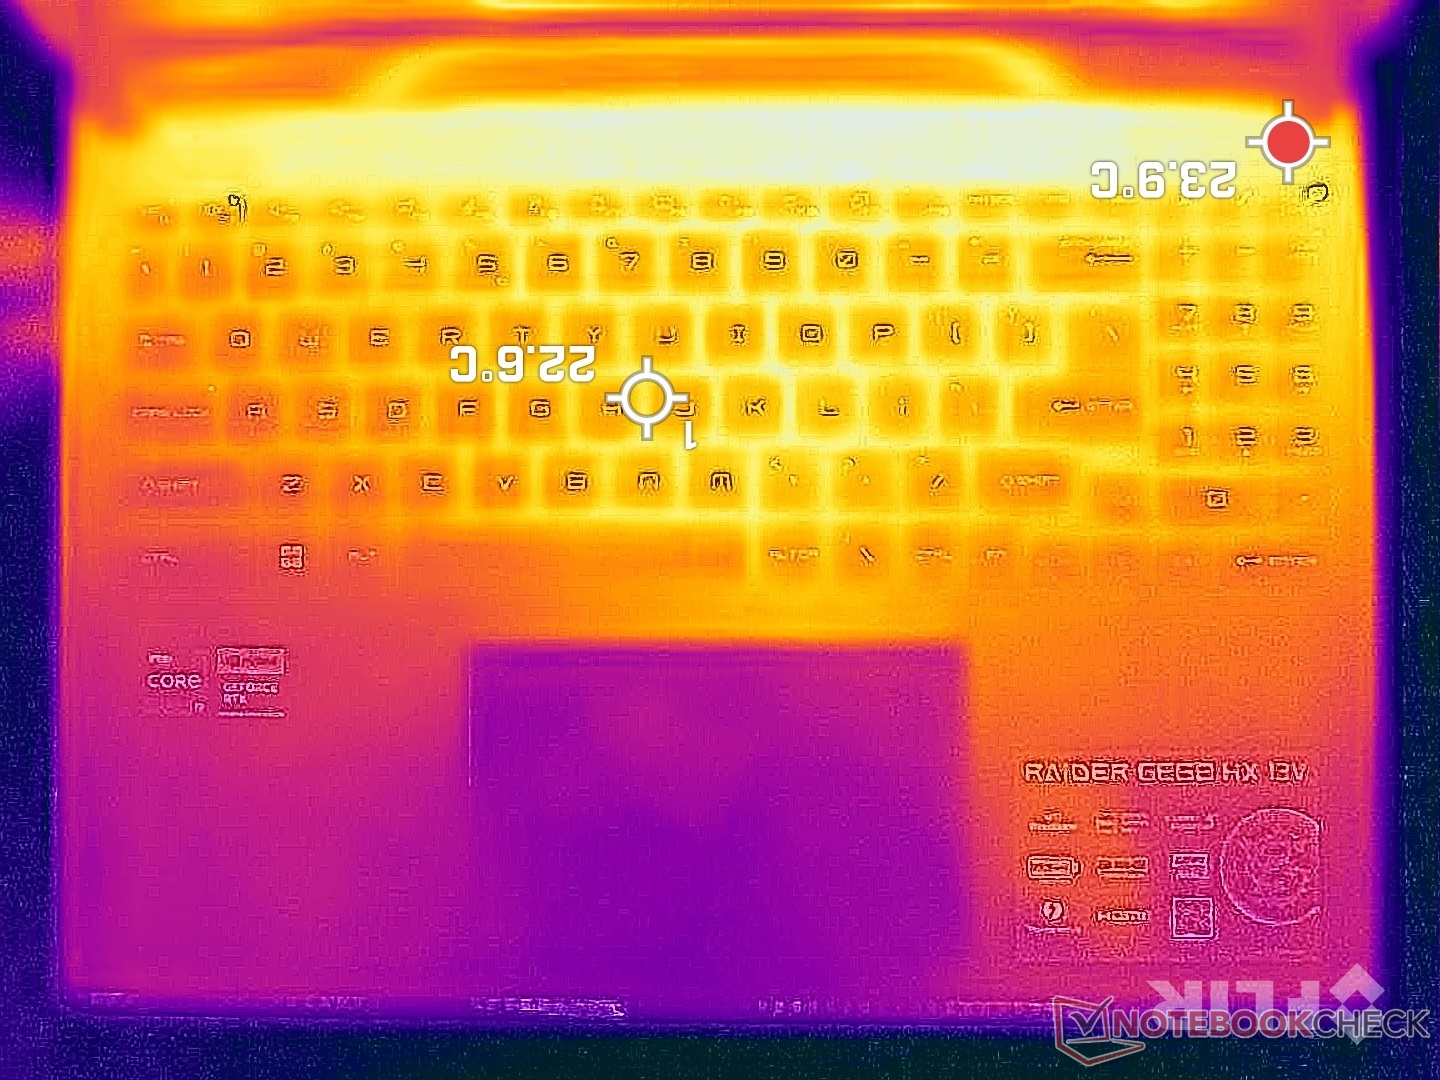
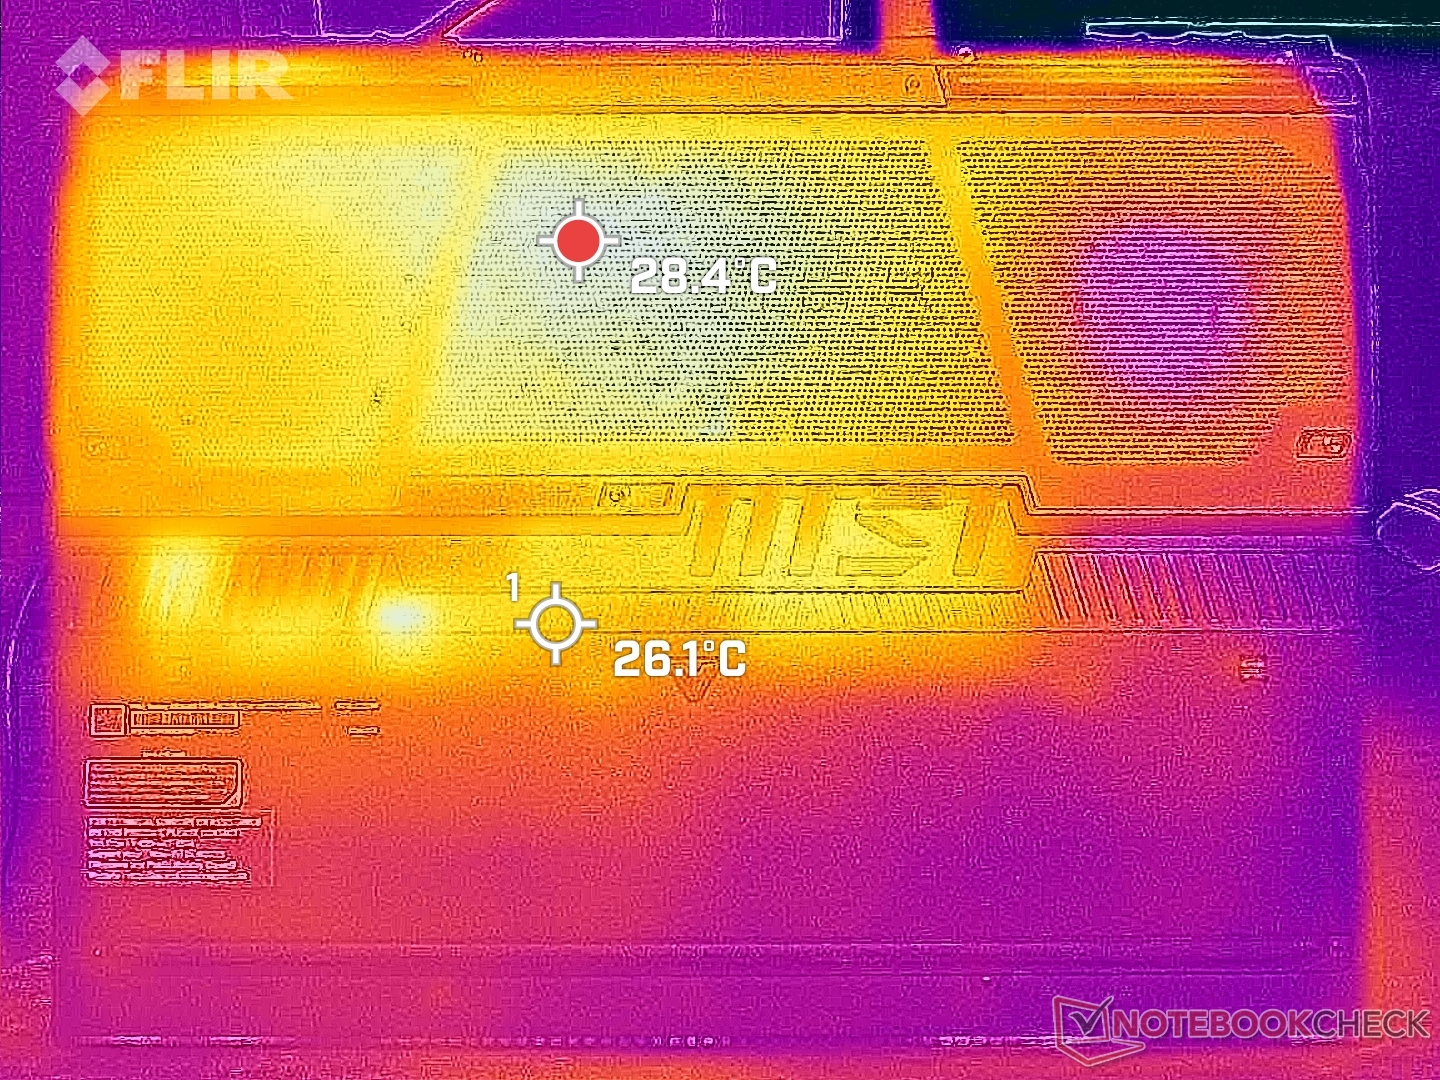
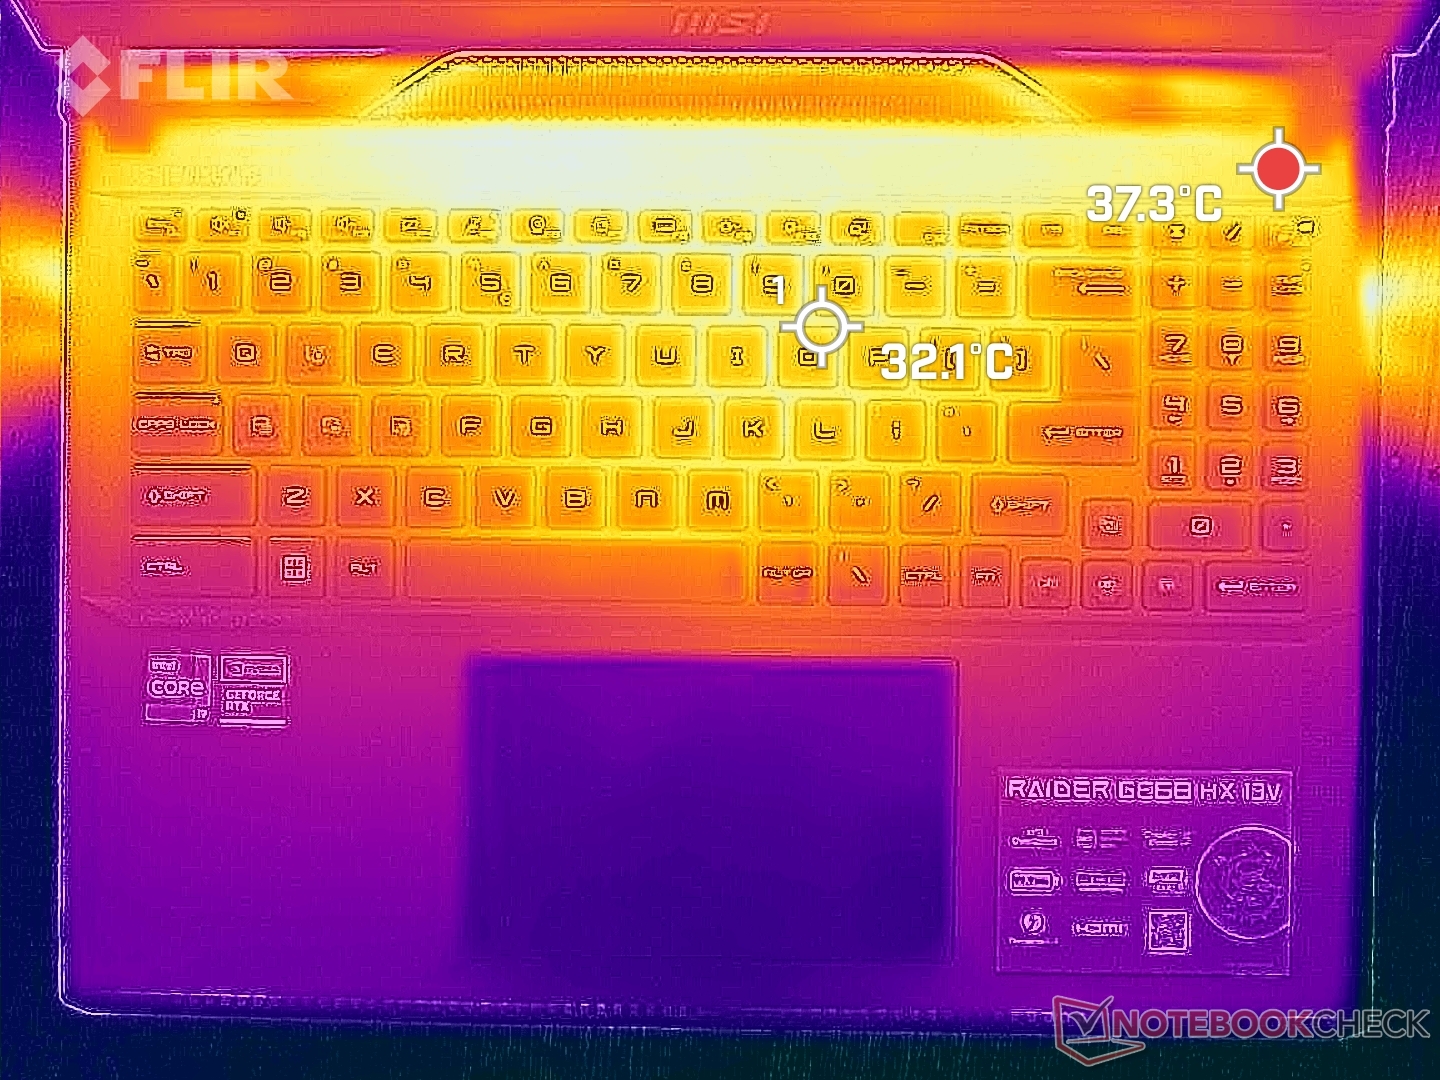
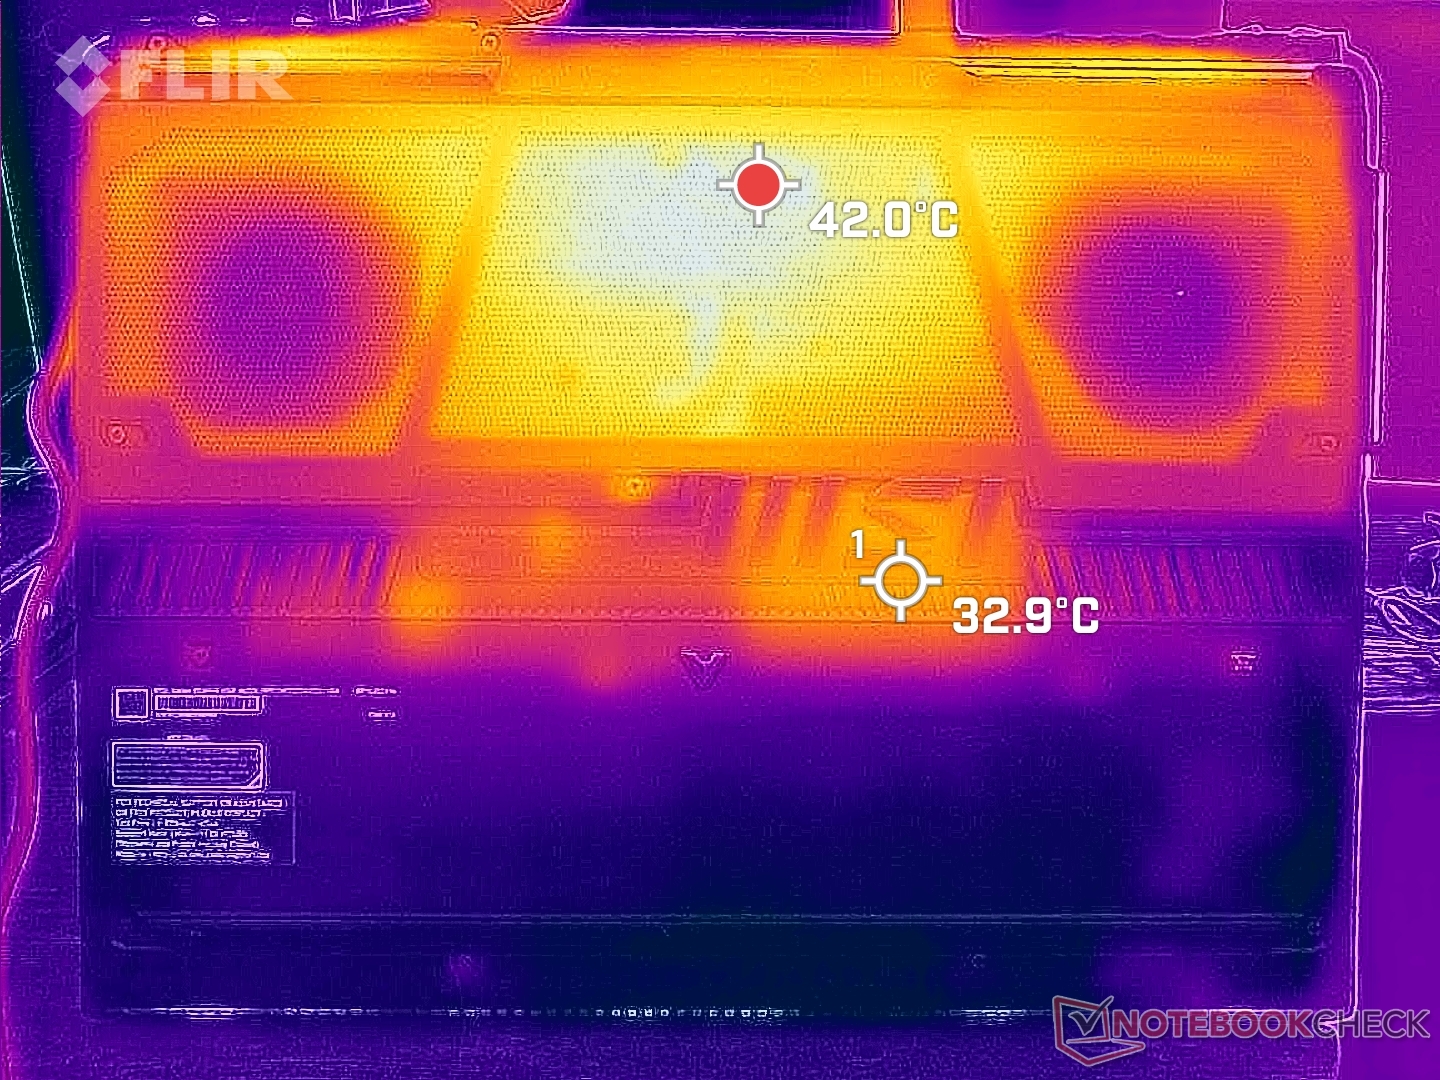
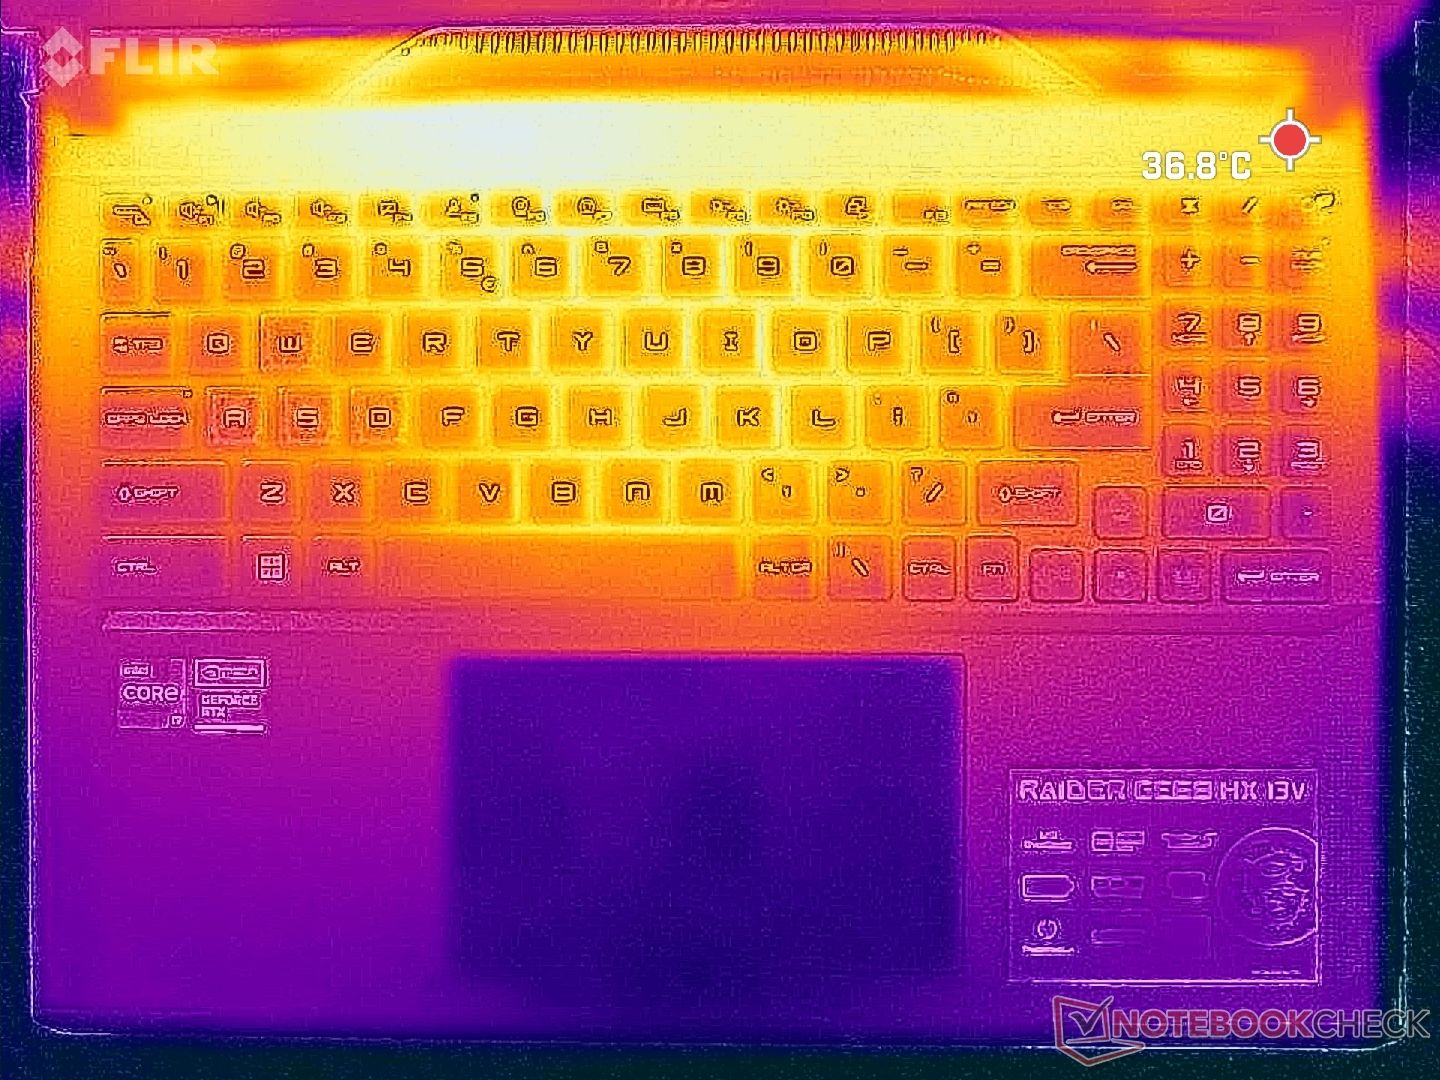
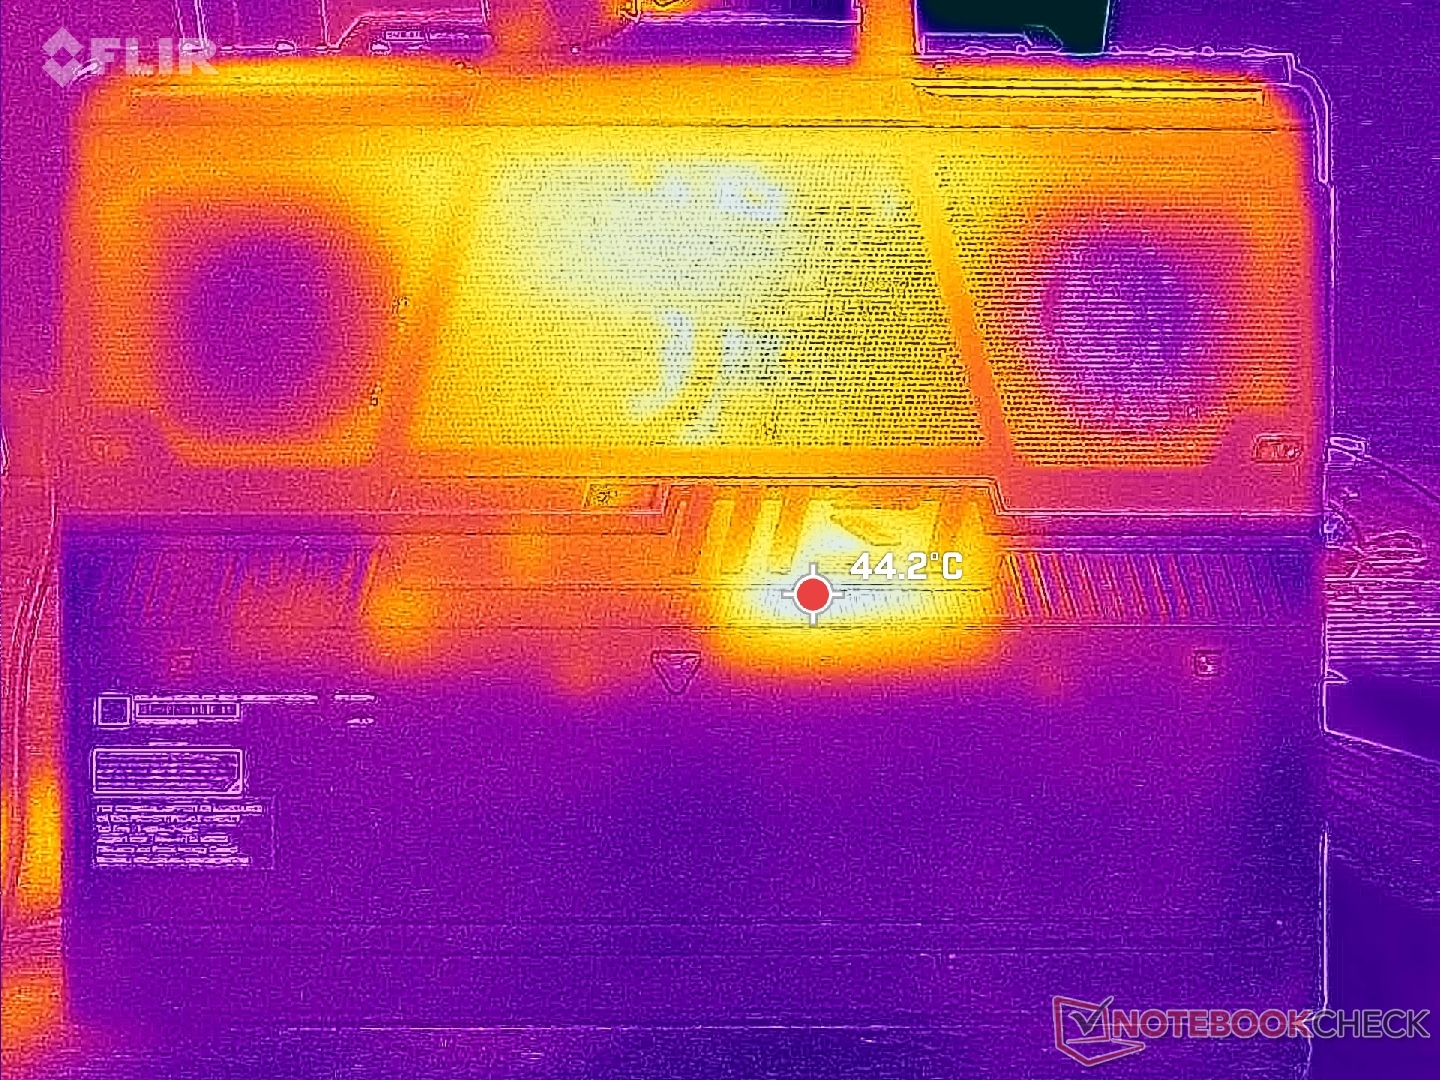
Temperatura
O desenvolvimento da temperatura da superfície é simétrico devido à forma como a solução de resfriamento foi projetada. O centro do teclado pode atingir até 40 °C, o que é muito mais frio do que o registrado no HP Omen 16 ou no Legion Slim 7i 16 G8 onde os pontos de acesso podem chegar a 45 a 50 °C cada. Os ventiladores geralmente mais barulhentos e a construção mais espessa do GE68HX trabalham a favor da MSI a partir dessa perspectiva.
(±) A temperatura máxima no lado superior é 41.4 °C / 107 F, em comparação com a média de 40.4 °C / 105 F , variando de 21.2 a 68.8 °C para a classe Gaming.
(-) A parte inferior aquece até um máximo de 45.4 °C / 114 F, em comparação com a média de 43.2 °C / 110 F
(+) Em uso inativo, a temperatura média para o lado superior é 27.7 °C / 82 F, em comparação com a média do dispositivo de 33.9 °C / ### class_avg_f### F.
(±) Jogando The Witcher 3, a temperatura média para o lado superior é 34 °C / 93 F, em comparação com a média do dispositivo de 33.9 °C / ## #class_avg_f### F.
(+) Os apoios para as mãos e o touchpad são mais frios que a temperatura da pele, com um máximo de 29.6 °C / 85.3 F e, portanto, são frios ao toque.
(±) A temperatura média da área do apoio para as mãos de dispositivos semelhantes foi 28.8 °C / 83.8 F (-0.8 °C / -1.5 F).
| MSI Raider GE68HX 13VF Intel Core i9-13950HX, NVIDIA GeForce RTX 4060 Laptop GPU | MSI GE67 HX 12UGS Intel Core i7-12800HX, NVIDIA GeForce RTX 3070 Ti Laptop GPU | HP Omen 16-xf0376ng AMD Ryzen 7 7840HS, NVIDIA GeForce RTX 4070 Laptop GPU | Alienware m16 R1 AMD AMD Ryzen 9 7845HX, NVIDIA GeForce RTX 4080 Laptop GPU | Lenovo Legion Slim 7i 16 Gen 8 Intel Core i9-13900H, NVIDIA GeForce RTX 4070 Laptop GPU | Asus ROG Zephyrus M16 GU604VY-NM042X Intel Core i9-13900H, NVIDIA GeForce RTX 4090 Laptop GPU | |
|---|---|---|---|---|---|---|
| Heat | 9% | -12% | -10% | -6% | -6% | |
| Maximum Upper Side * (°C) | 41.4 | 34.4 17% | 49 -18% | 48 -16% | 49.8 -20% | 50 -21% |
| Maximum Bottom * (°C) | 45.4 | 42 7% | 57 -26% | 39 14% | 48.8 -7% | 58 -28% |
| Idle Upper Side * (°C) | 29.8 | 24 19% | 31 -4% | 37 -24% | 29.4 1% | 26 13% |
| Idle Bottom * (°C) | 31.4 | 33.2 -6% | 31 1% | 36.2 -15% | 30 4% | 28 11% |
* ... menor é melhor
Teste de estresse
A CPU aumentaria para 4,1 GHz e 183 W ao iniciar o estresse do Prime95 antes de se estabelecer em 3,6 GHz, 134 W e 93 C apenas alguns segundos depois. Repetir esse teste no modelo do ano passado com o antigo Core i7-12800HX de 12ª geração resultaria em uma potência de pacote de CPU muito menor, de apenas 55 W, para mostrar o quanto a nova CPU de 13ª geração pode ser mais exigente.
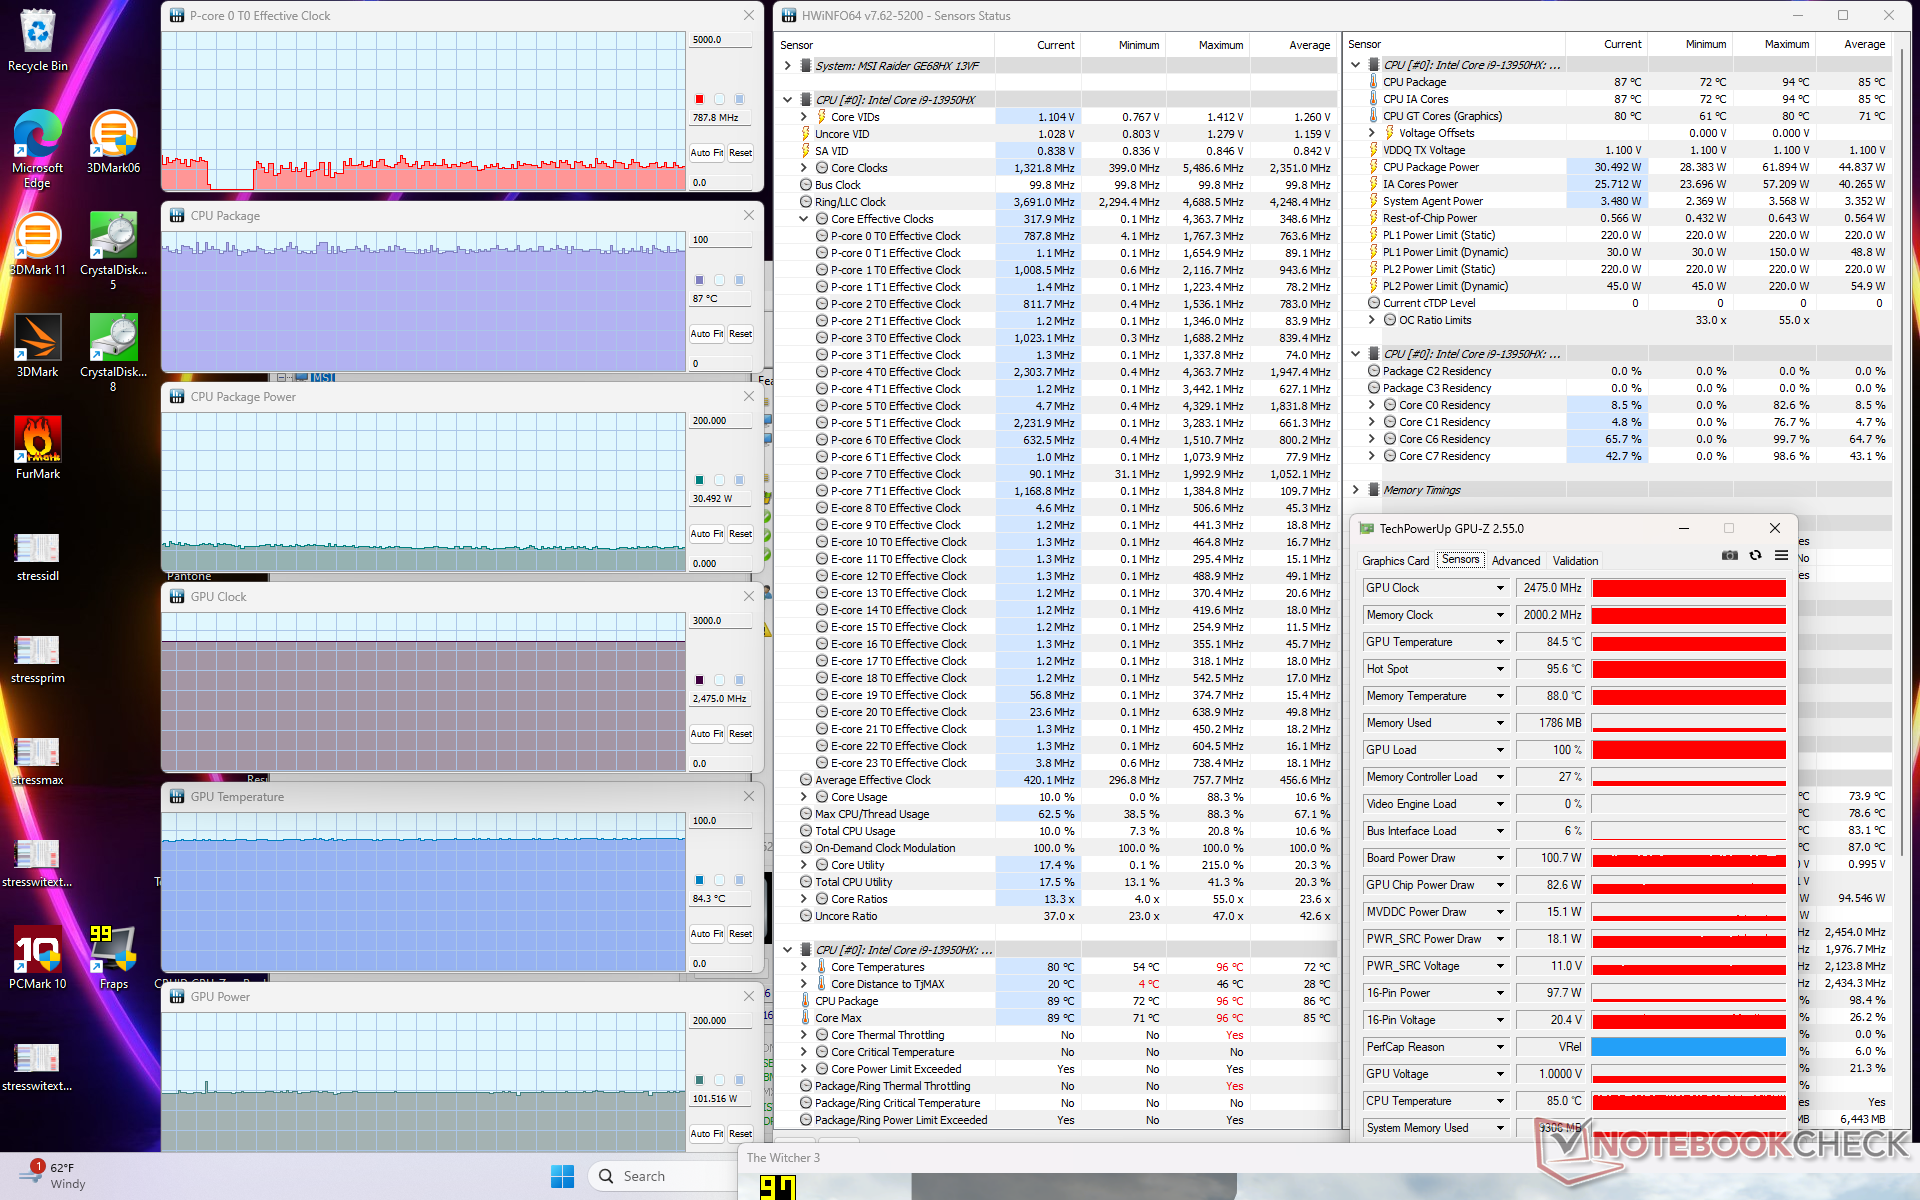
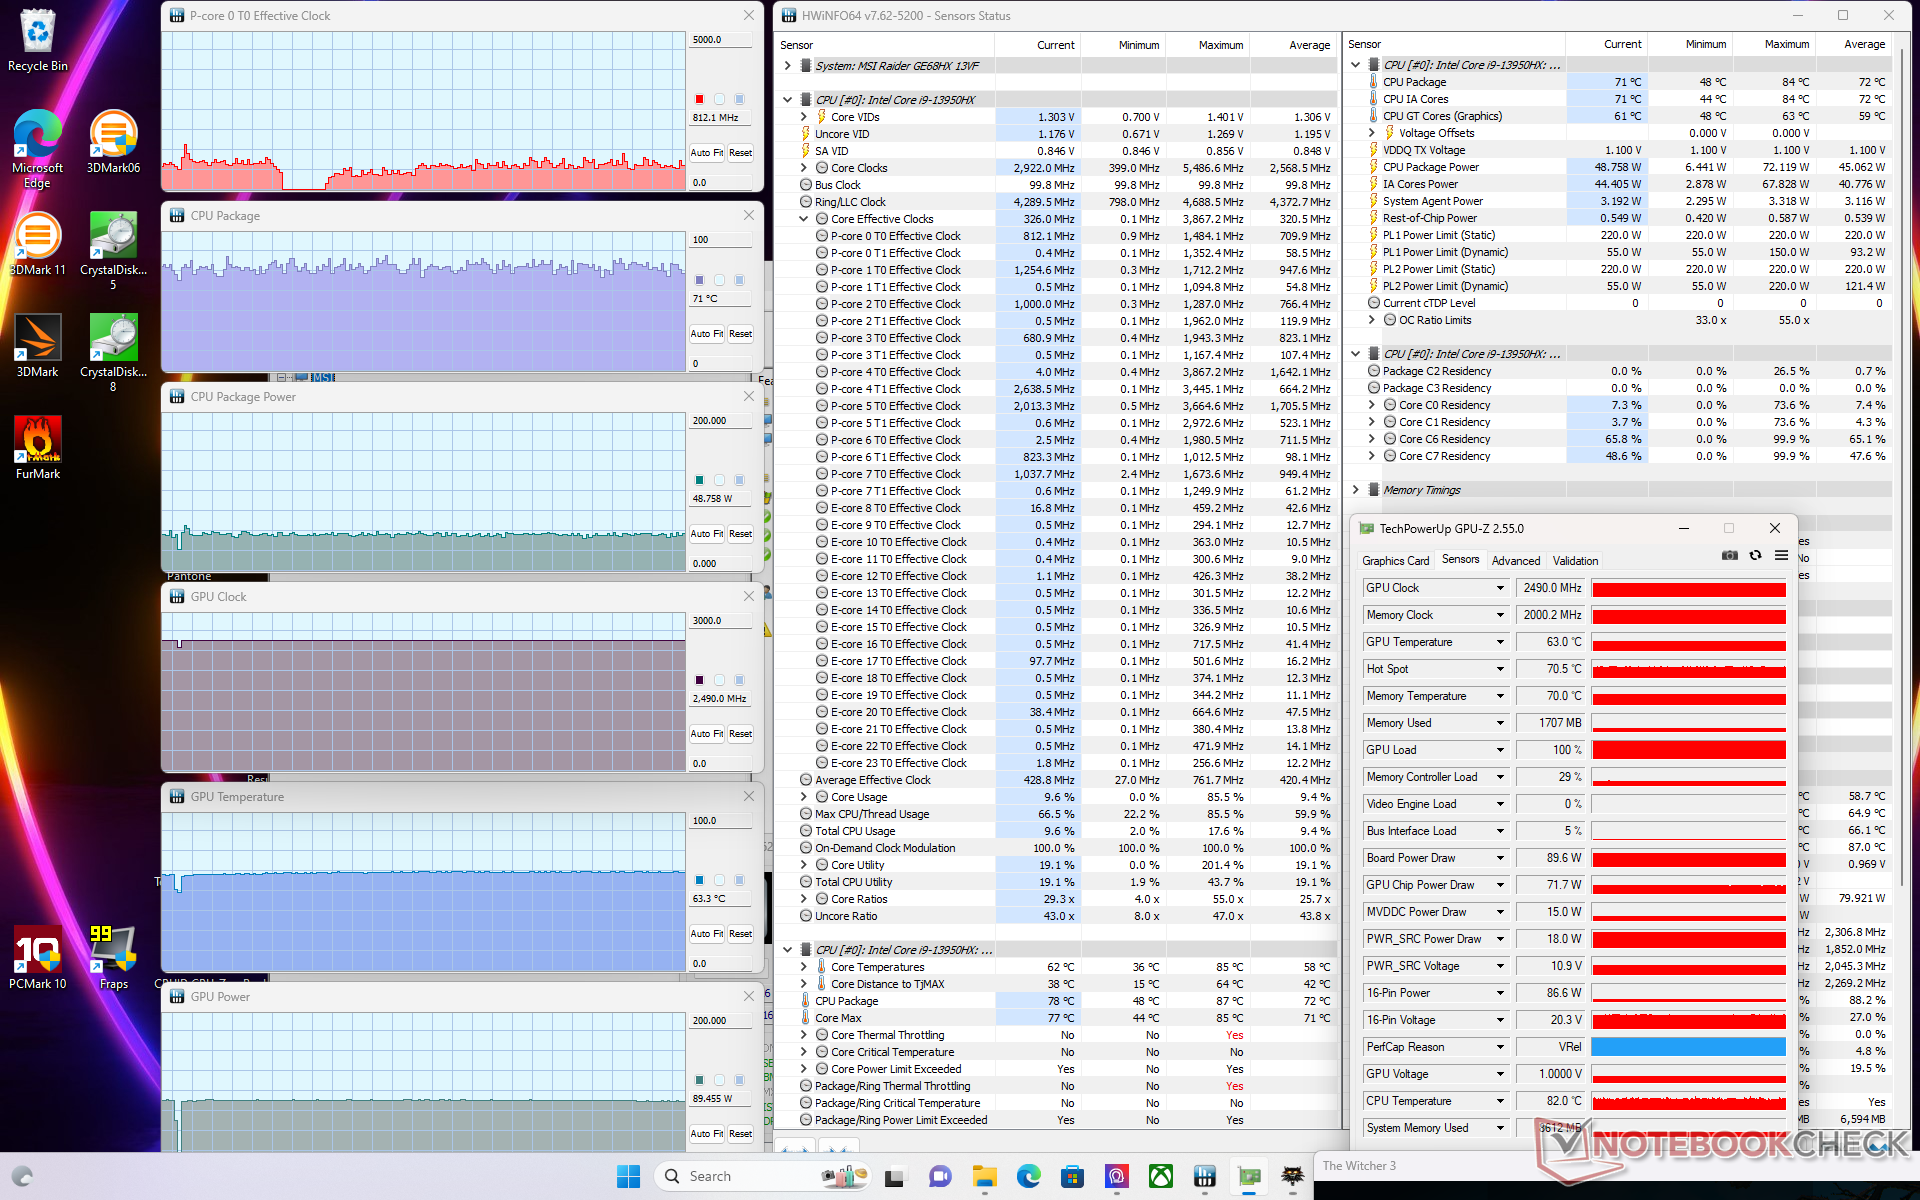
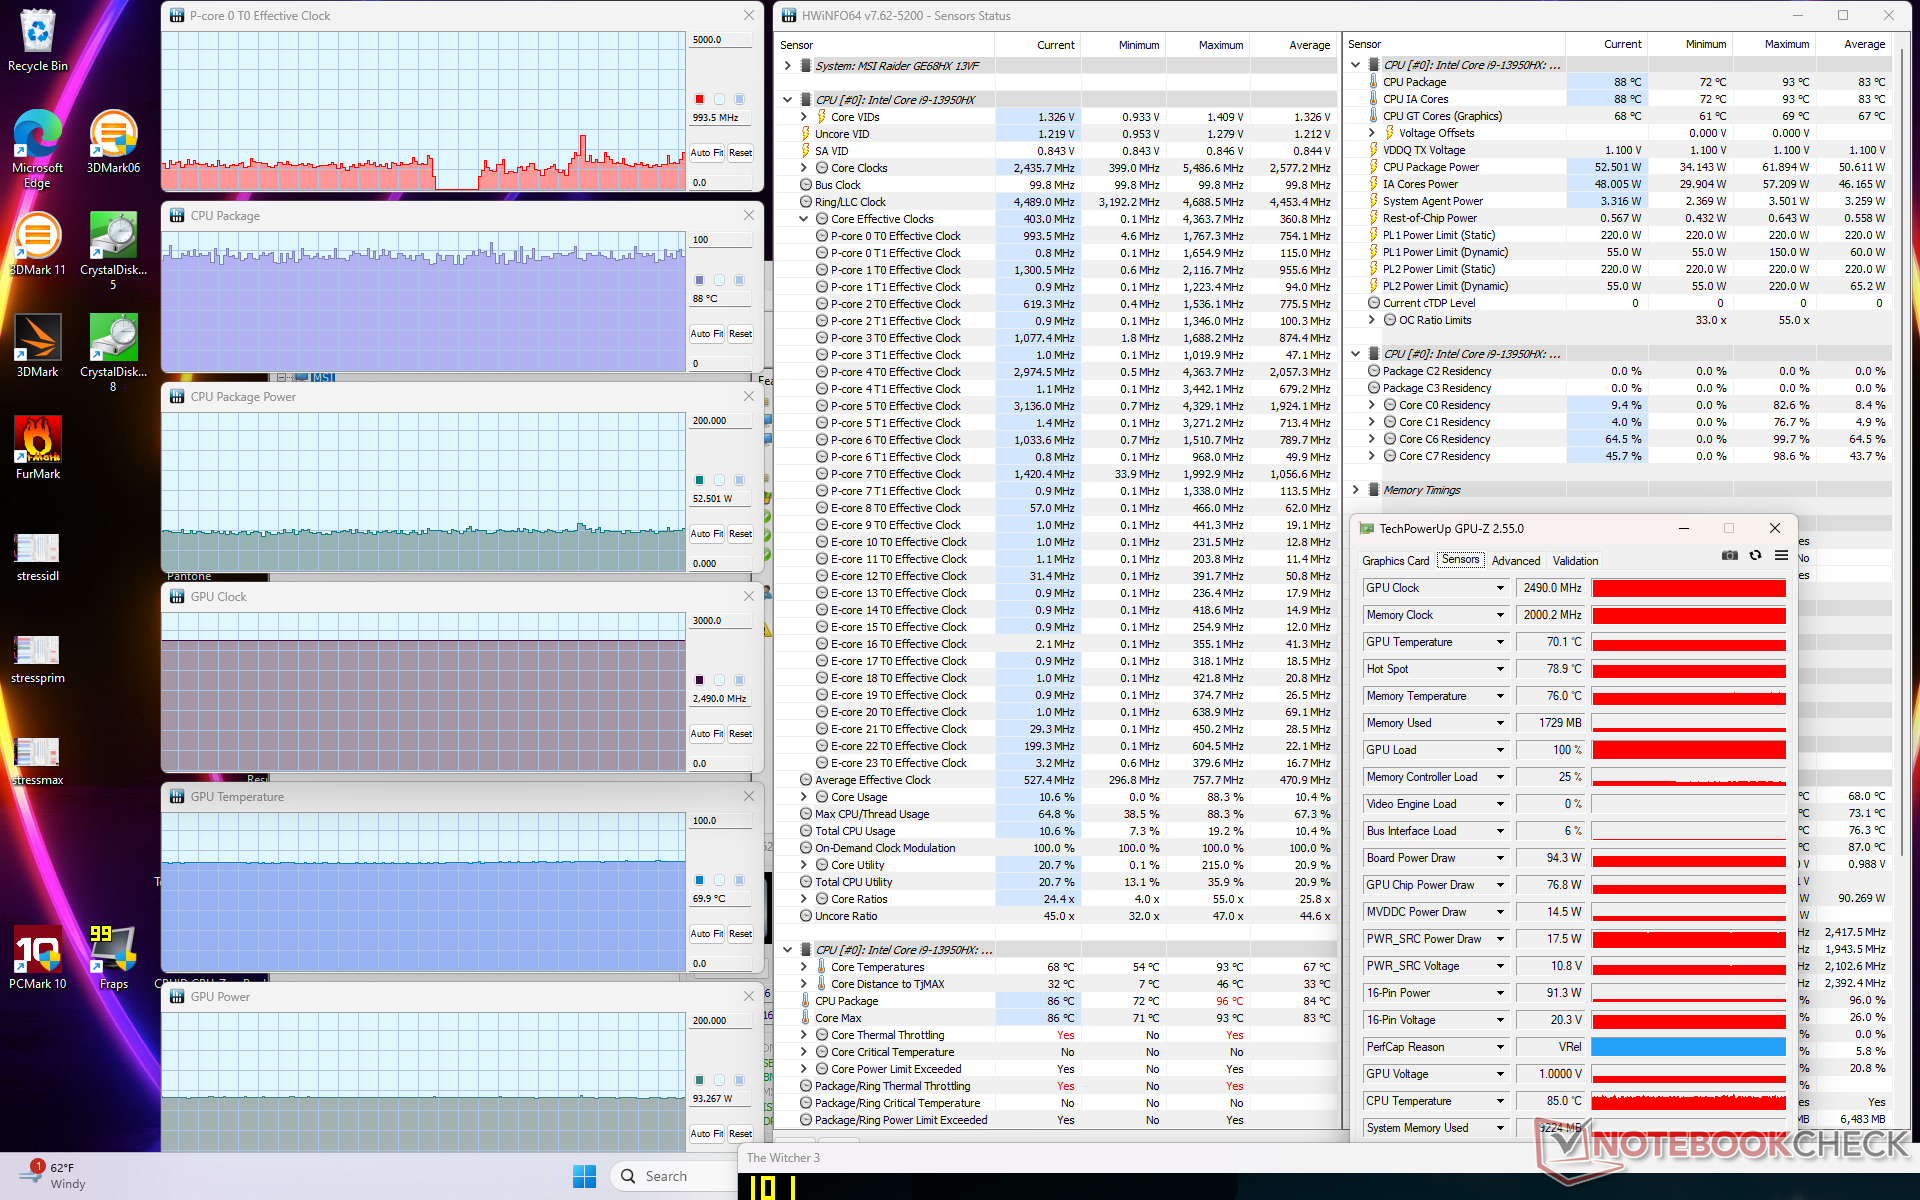
A taxa de clock e a temperatura da GPU se estabilizariam em 2475 MHz e 84 °C durante a execução Witcher 3 no modo balanceado. Curiosamente, a taxa de clock aumentaria apenas marginalmente para 2490 MHz se estivesse em execução no modo Extreme Performance, enquanto a temperatura da GPU diminuiria de forma mais significativa para 70 °C ou até mesmo apenas 63 °C se o Cooler Boost estivesse ativo, conforme mostrado em nossas capturas de tela e na tabela abaixo. A maioria dos outros notebooks MSI para jogos também apresentaria resultados semelhantes. Portanto, é recomendável jogar no modo Balanced, pois o impacto no desempenho da GPU é muito pequeno em relação às imensas diferenças de ruído do ventilador entre os perfis de energia predefinidos. As diferenças de desempenho entre os modos Equilibrado e Desempenho são geralmente mais significativas em outros laptops para jogos, como na série Asus Zephyrus.
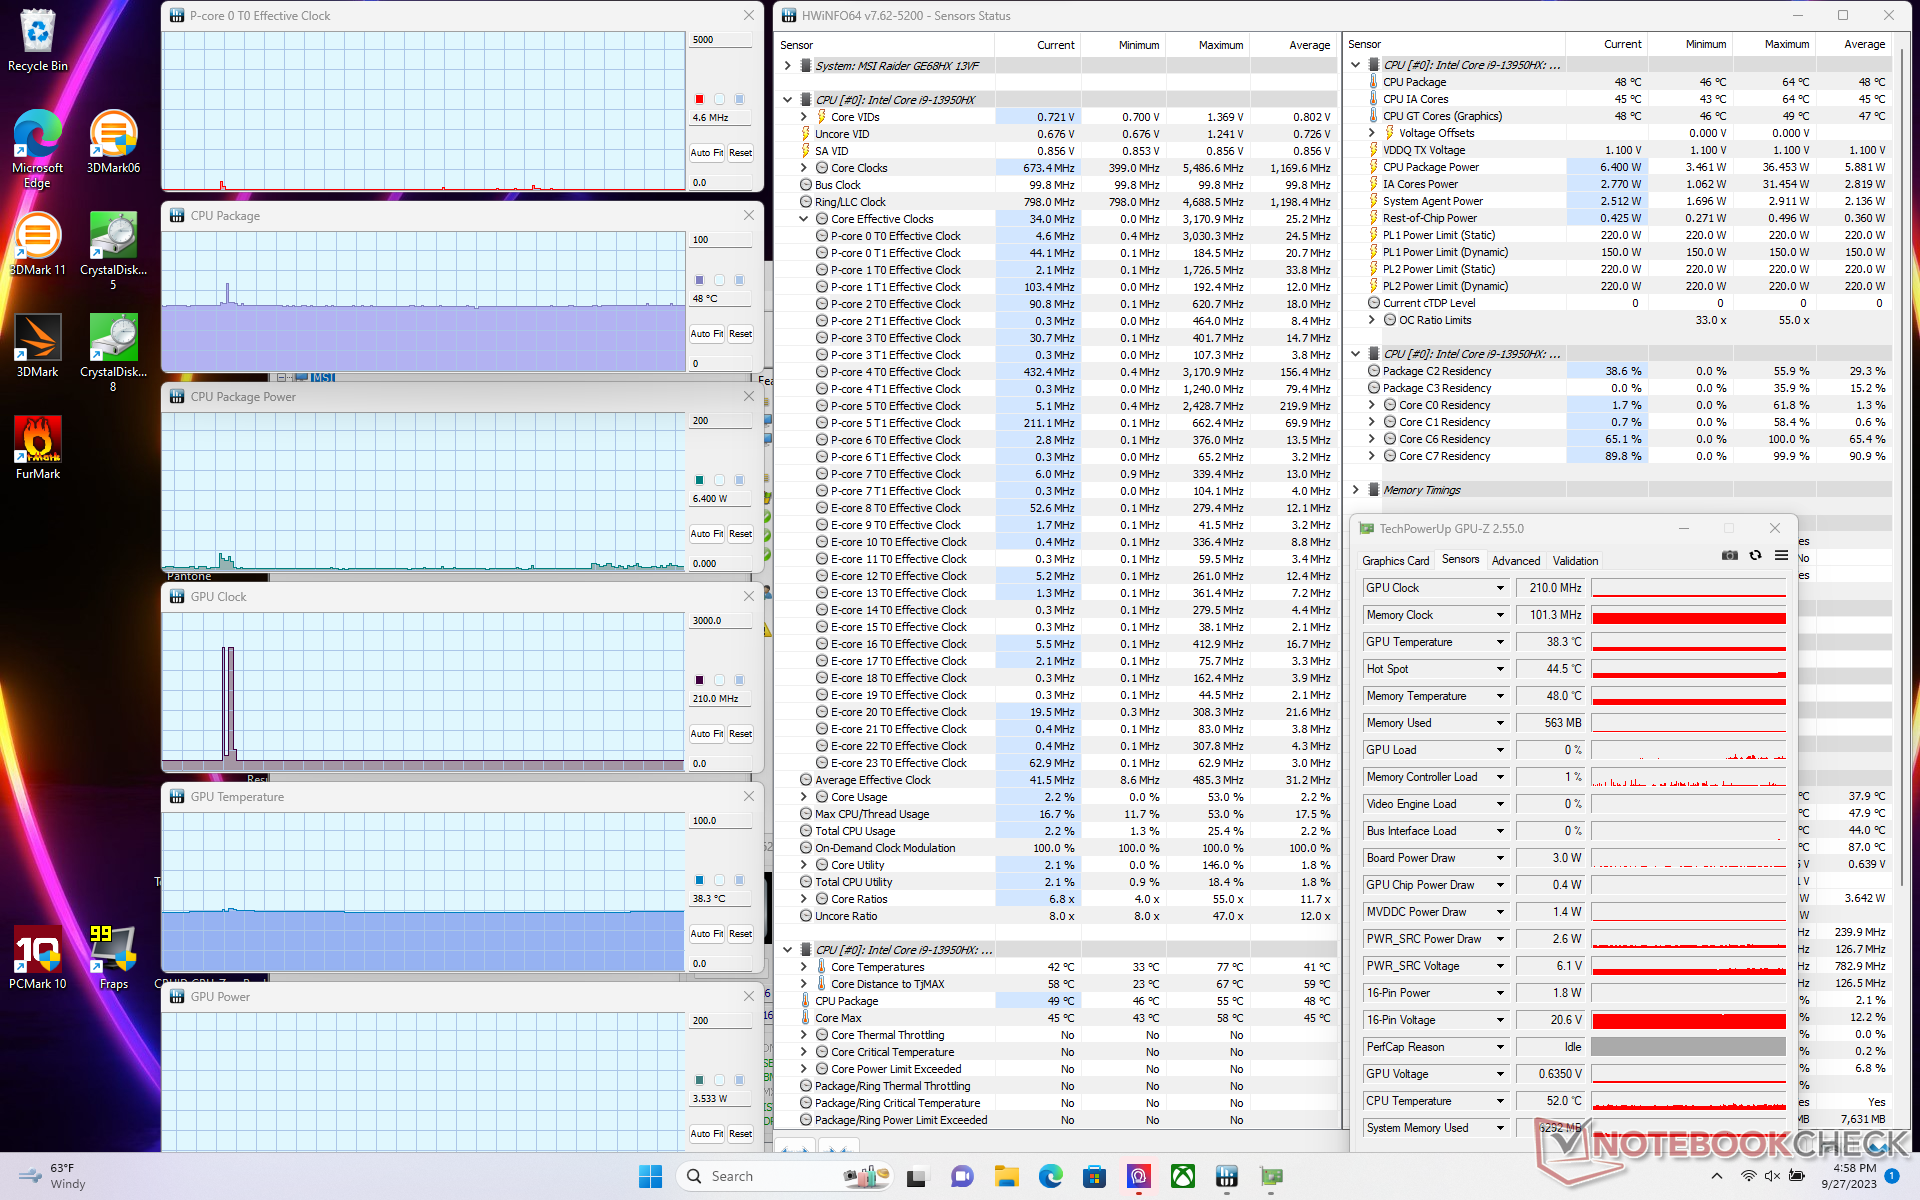
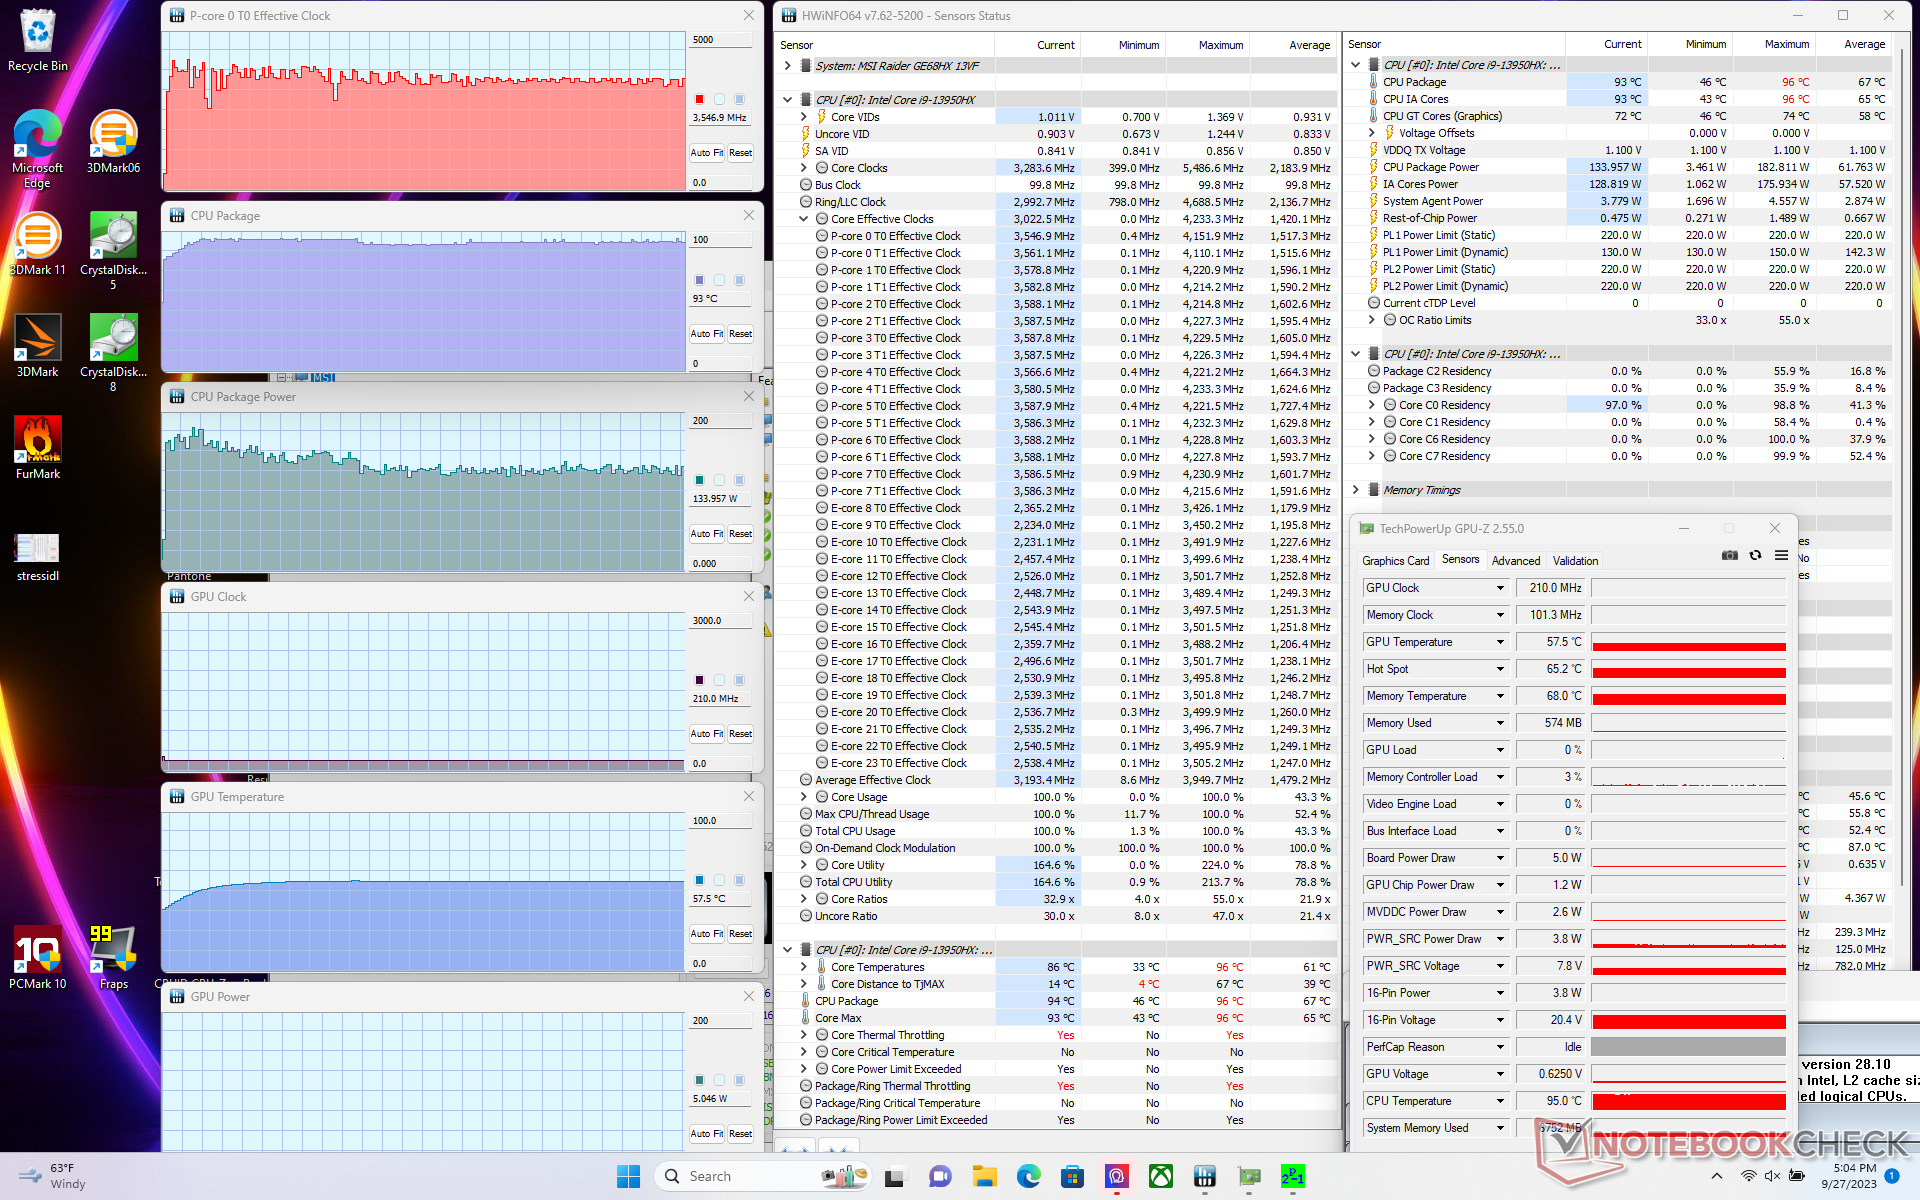
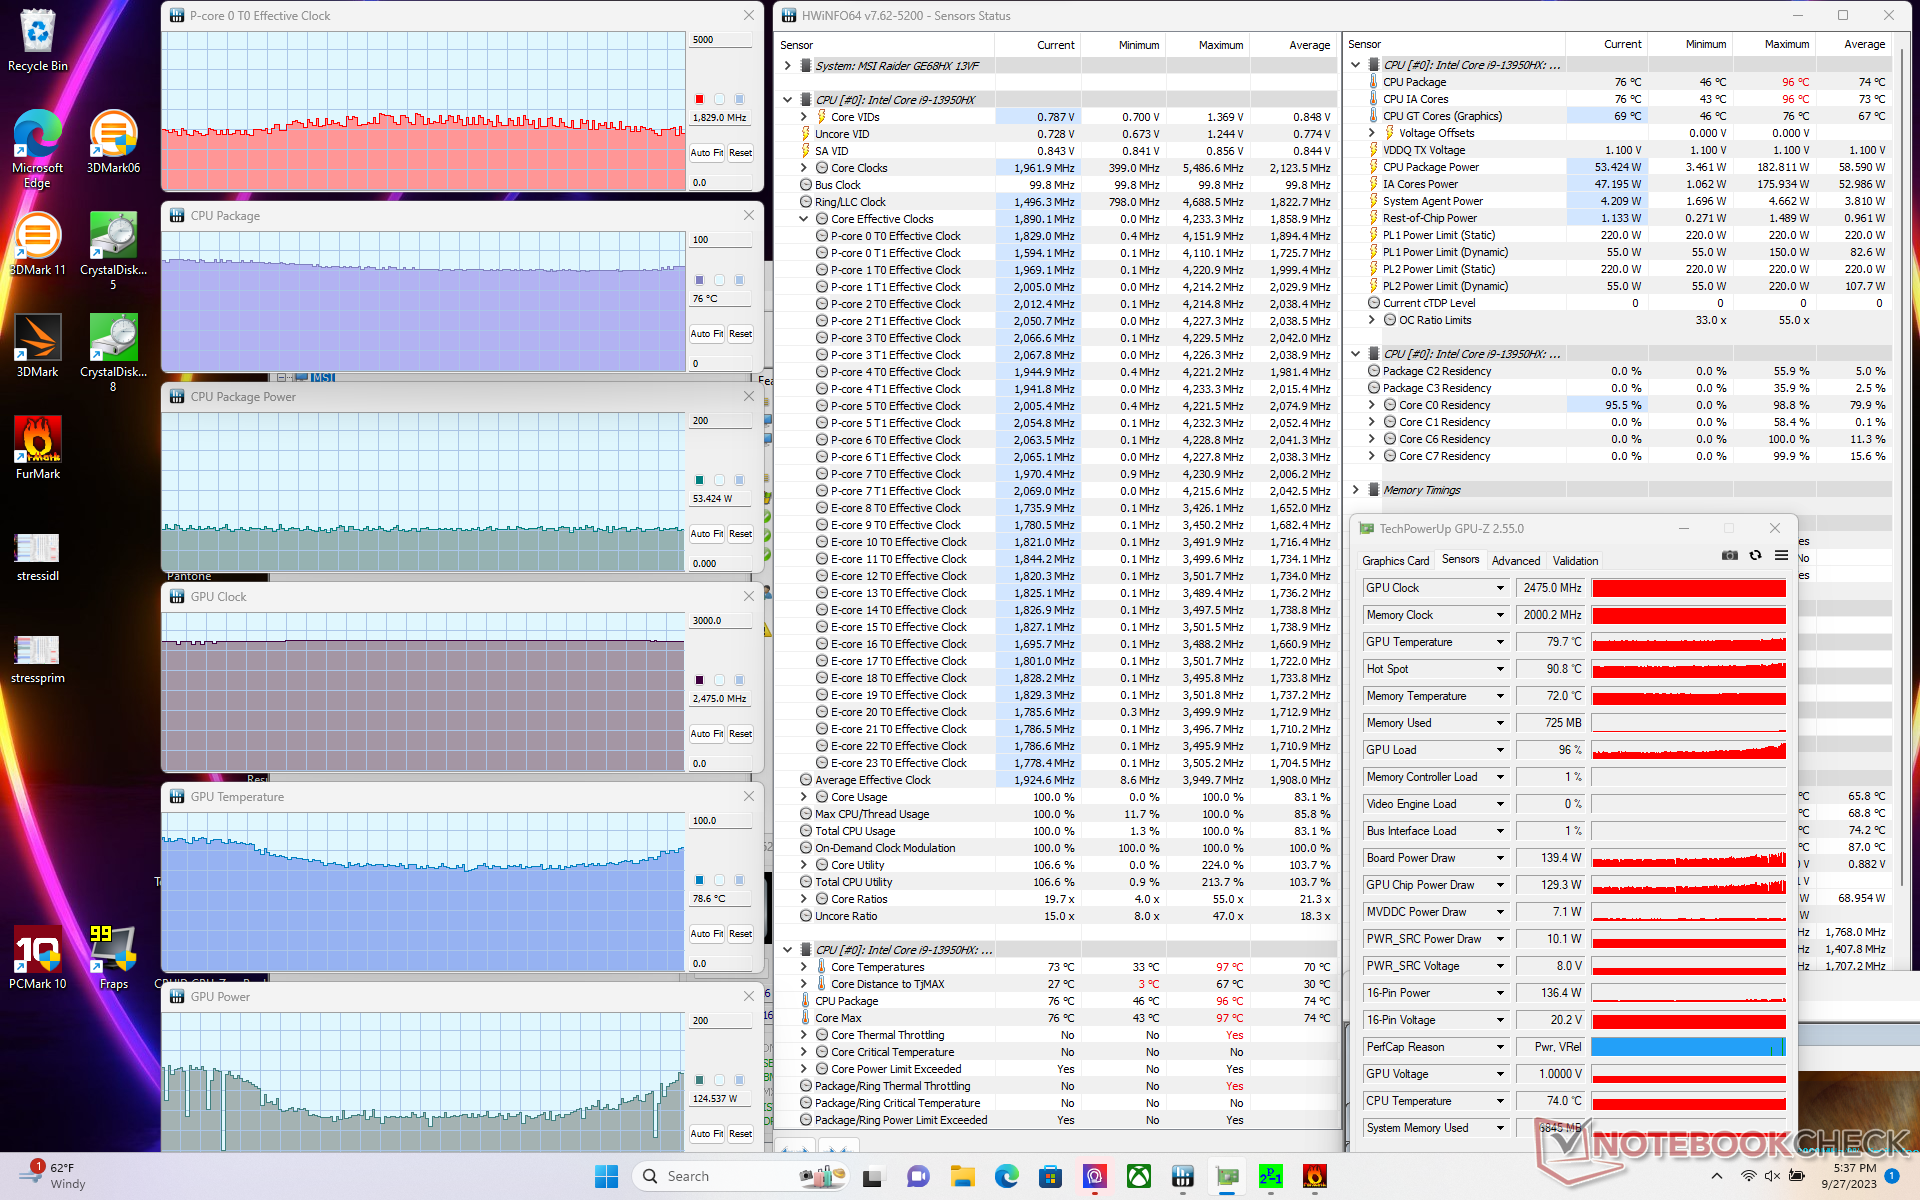
| Clock da CPU (GHz) | Clock da GPU (MHz) | Temperatura média da CPU (°C) | Temperatura média da GPU (°C) | |
| Sistema ocioso | -- | -- | 48 | 38 |
| Estresse doPrime95 (modo de desempenho extremo com Cooler Boost desativado) | ~3,6 | -- | 93 | 58 |
| Estresse do Prime95+ FurMark (modo de desempenho extremo com o Cooler Boost desativado) | ~1.9 | 2475 | 73 - 78 | 63 - 81 |
| Witcher 3 Estresse(modo balanceado) | ~0,8 | 2475 | 87 | 84 |
| Witcher 3 Estresse (Modo dedesempenho extremo com o Cooler Boost desativado) | ~0,8 | 2490 | 88 | 70 |
| Witcher 3 Estresse (Modo de desempenho extremocom o Cooler Boost ligado) | ~0,8 | 2490 | 71 | 63 |
Alto-falantes
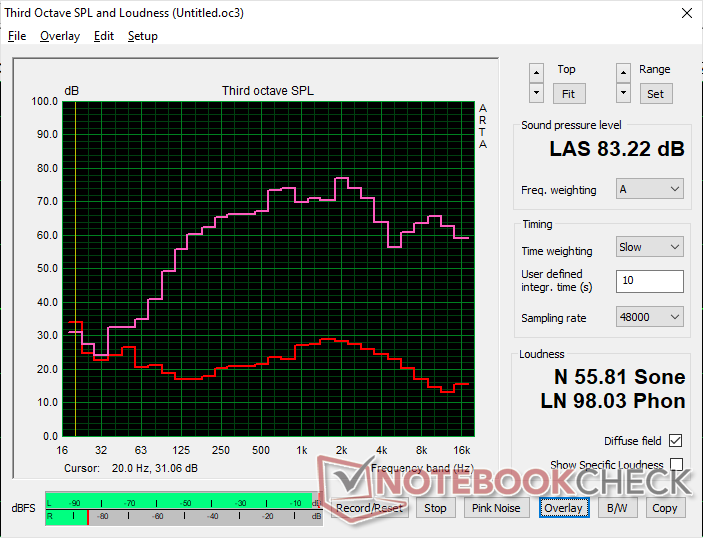
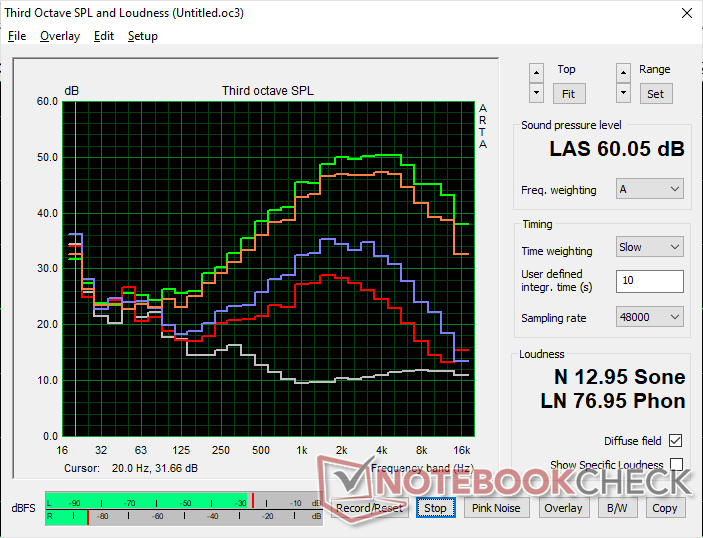
MSI Raider GE68HX 13VF análise de áudio
(+) | os alto-falantes podem tocar relativamente alto (###valor### dB)
Graves 100 - 315Hz
(±) | graves reduzidos - em média 6% menor que a mediana
(±) | a linearidade dos graves é média (9.5% delta para a frequência anterior)
Médios 400 - 2.000 Hz
(±) | médios mais altos - em média 5.6% maior que a mediana
(+) | médios são lineares (5.8% delta para frequência anterior)
Altos 2 - 16 kHz
(+) | agudos equilibrados - apenas 4.5% longe da mediana
(±) | a linearidade dos máximos é média (9.5% delta para frequência anterior)
Geral 100 - 16.000 Hz
(+) | o som geral é linear (13.3% diferença em relação à mediana)
Comparado com a mesma classe
» 19% de todos os dispositivos testados nesta classe foram melhores, 5% semelhantes, 76% piores
» O melhor teve um delta de 6%, a média foi 18%, o pior foi 132%
Comparado com todos os dispositivos testados
» 14% de todos os dispositivos testados foram melhores, 3% semelhantes, 83% piores
» O melhor teve um delta de 4%, a média foi 23%, o pior foi 134%
Apple MacBook Pro 16 2021 M1 Pro análise de áudio
(+) | os alto-falantes podem tocar relativamente alto (###valor### dB)
Graves 100 - 315Hz
(+) | bons graves - apenas 3.8% longe da mediana
(+) | o baixo é linear (5.2% delta para a frequência anterior)
Médios 400 - 2.000 Hz
(+) | médios equilibrados - apenas 1.3% longe da mediana
(+) | médios são lineares (2.1% delta para frequência anterior)
Altos 2 - 16 kHz
(+) | agudos equilibrados - apenas 1.9% longe da mediana
(+) | os máximos são lineares (2.7% delta da frequência anterior)
Geral 100 - 16.000 Hz
(+) | o som geral é linear (4.6% diferença em relação à mediana)
Comparado com a mesma classe
» 0% de todos os dispositivos testados nesta classe foram melhores, 0% semelhantes, 100% piores
» O melhor teve um delta de 5%, a média foi 17%, o pior foi 45%
Comparado com todos os dispositivos testados
» 0% de todos os dispositivos testados foram melhores, 0% semelhantes, 100% piores
» O melhor teve um delta de 4%, a média foi 23%, o pior foi 134%
Gerenciamento de energia - maior desempenho, maior consumo
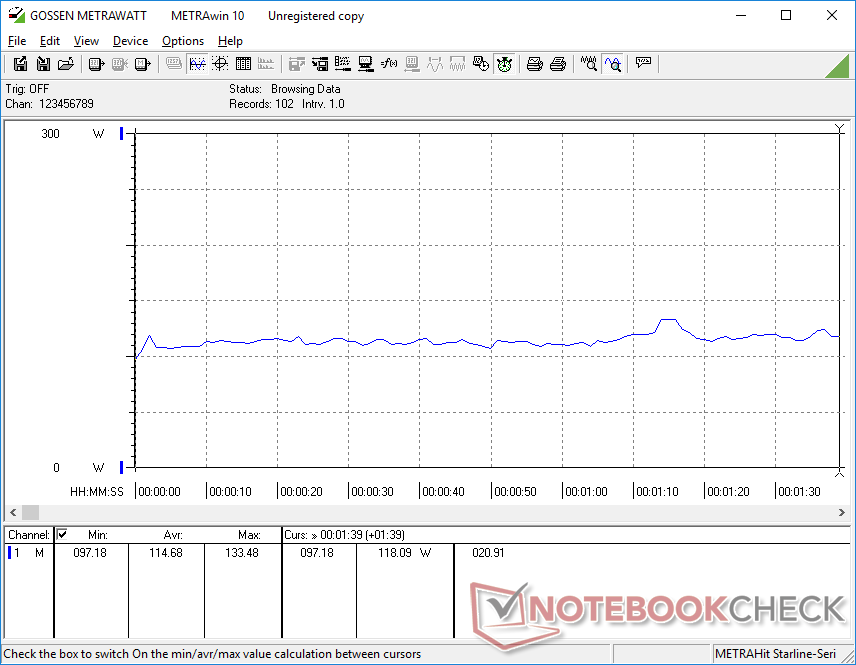
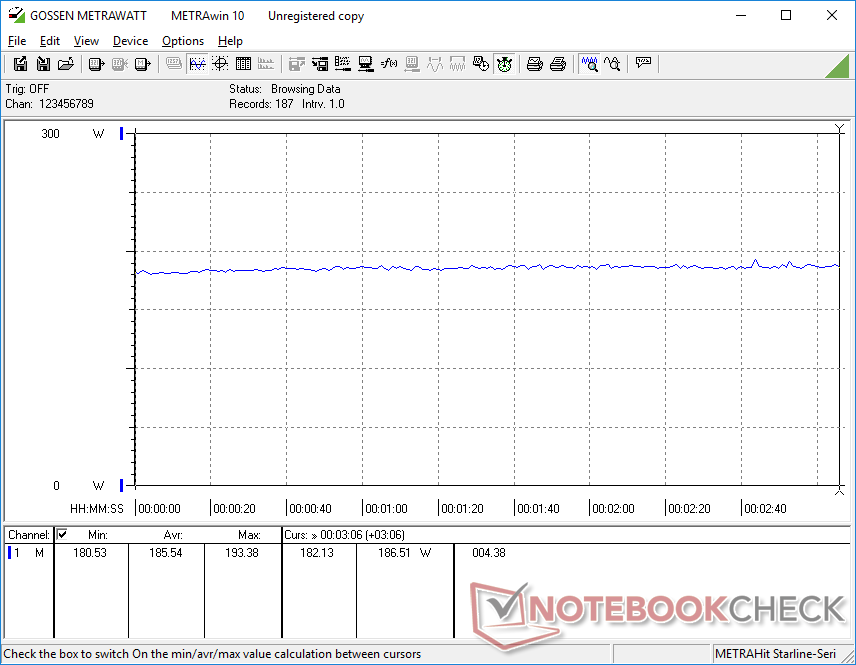
Consumo de energia
O consumo de energia quando em marcha lenta no desktop é praticamente o mesmo do modelo do ano passado. A marcha lenta no modo iGPU com os LEDs desligados economizaria até 8 W em comparação com a marcha lenta no modo dGPU com os LEDs frontais ativos.
O funcionamento Witcher 3 exigiria 22% menos energia do que no GE67HX com RTX 3070 Ti do ano passado, o que se correlaciona com o desempenho gráfico bruto 10 a 15 mais lento da nossa RTX 4060. Por outro lado, a execução do Prime95 exigiria 21% mais energia do que antes para um aumento de 35% a 40% no desempenho multi-thread.
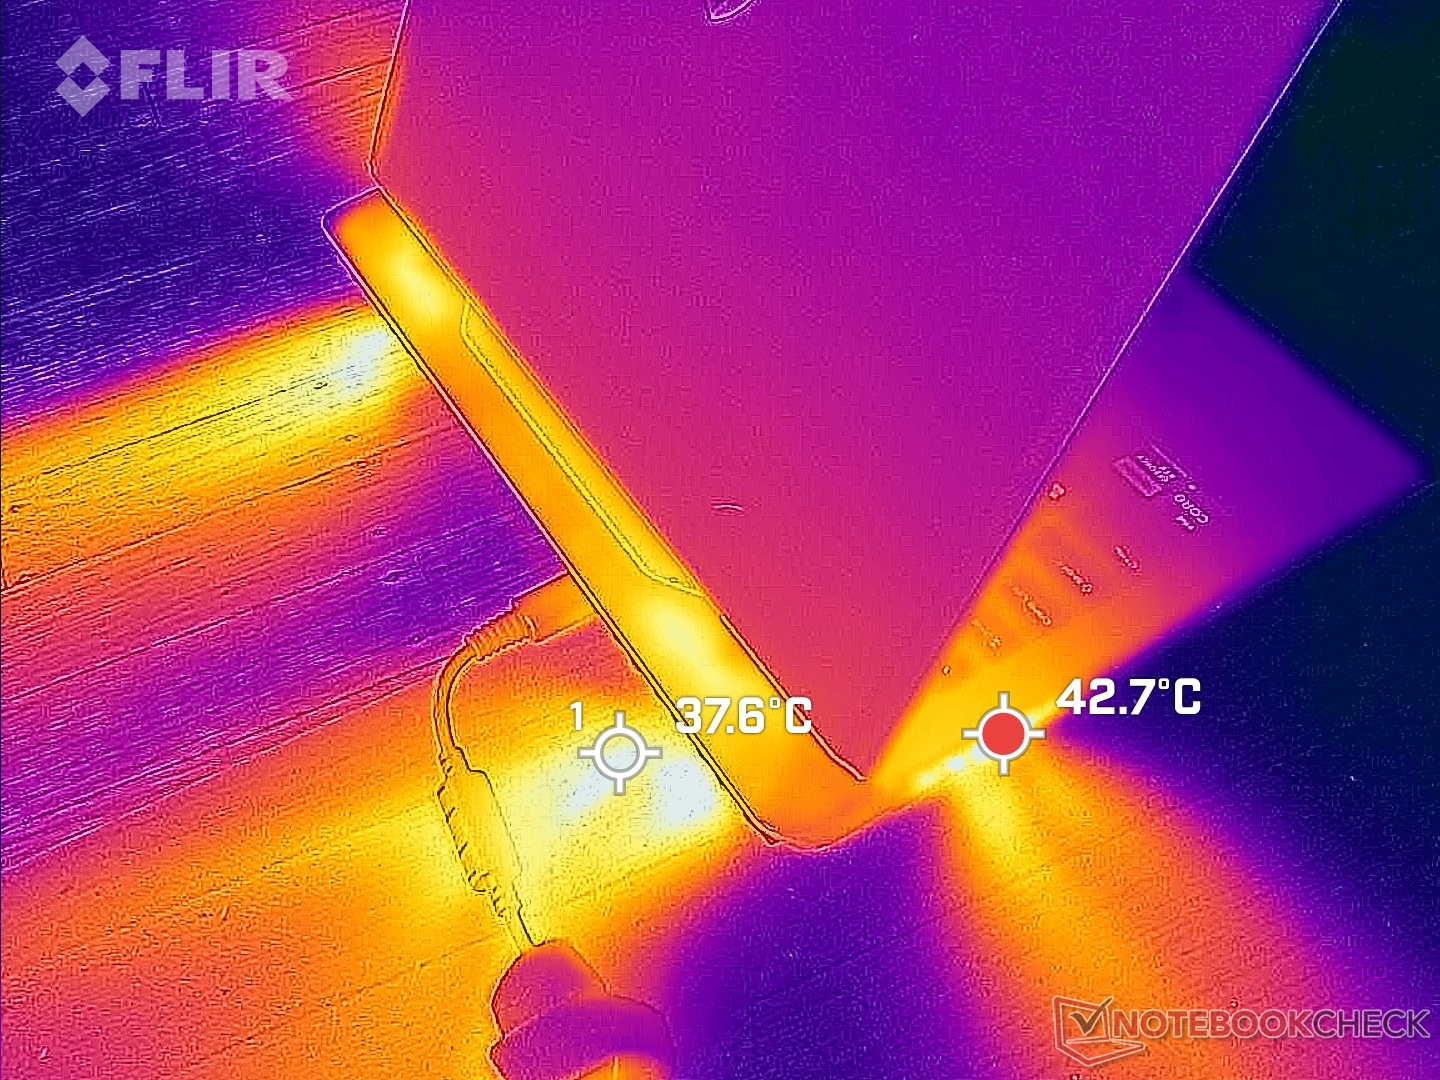
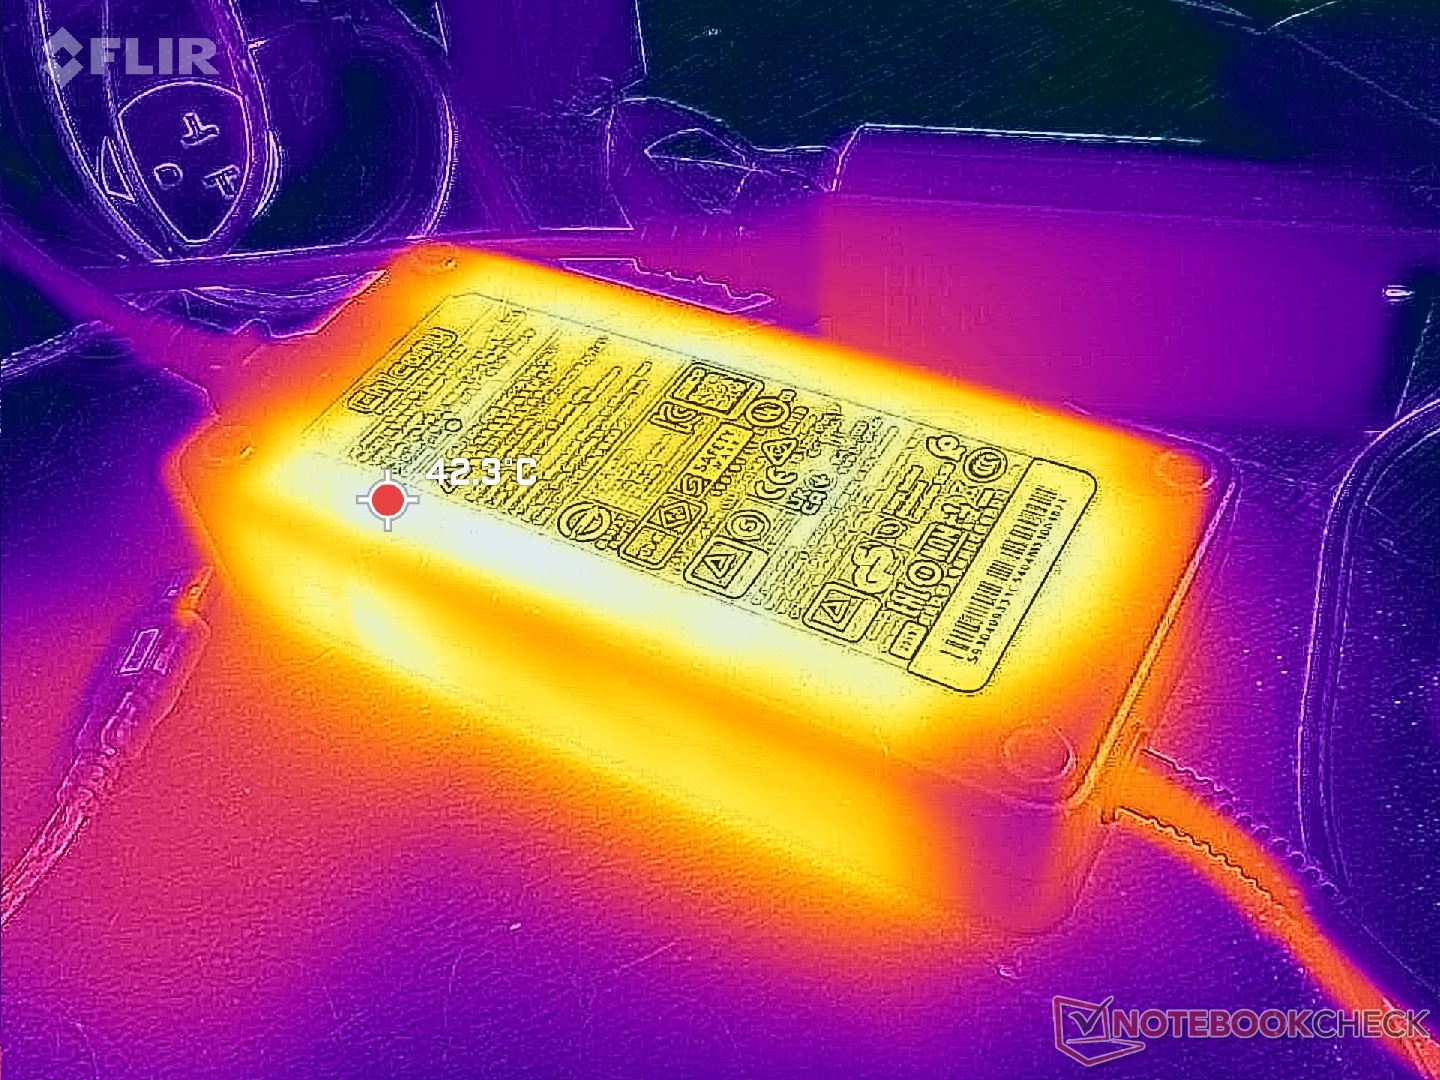
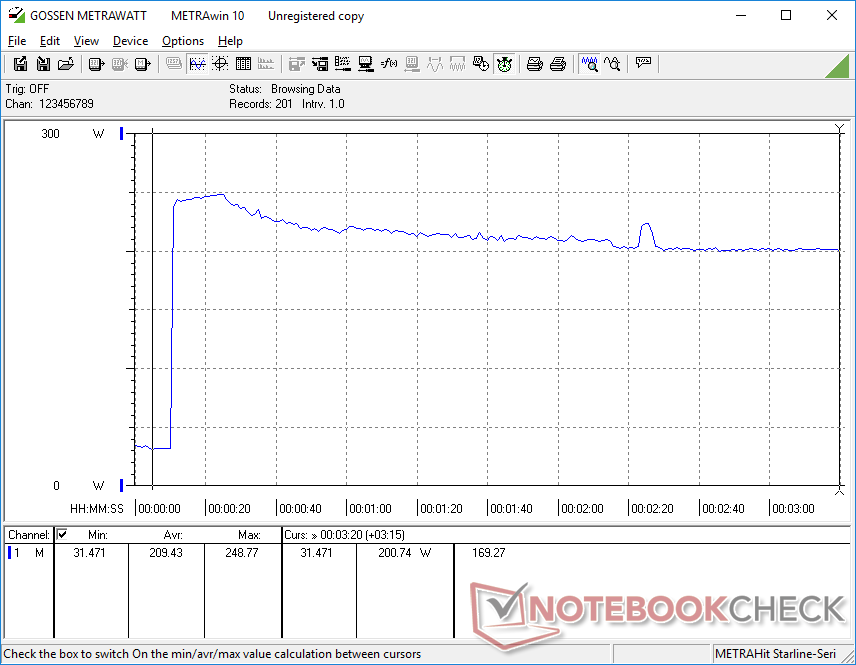
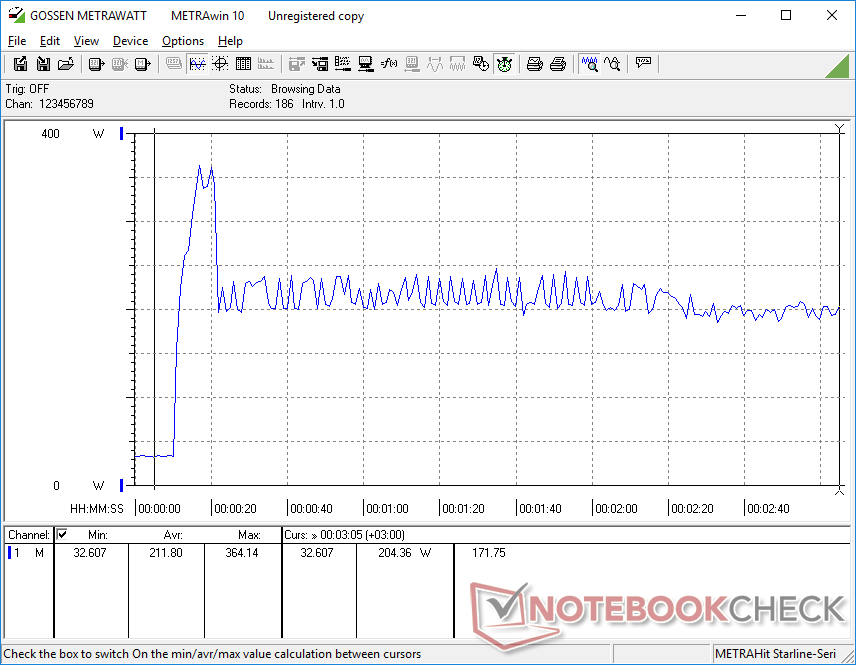
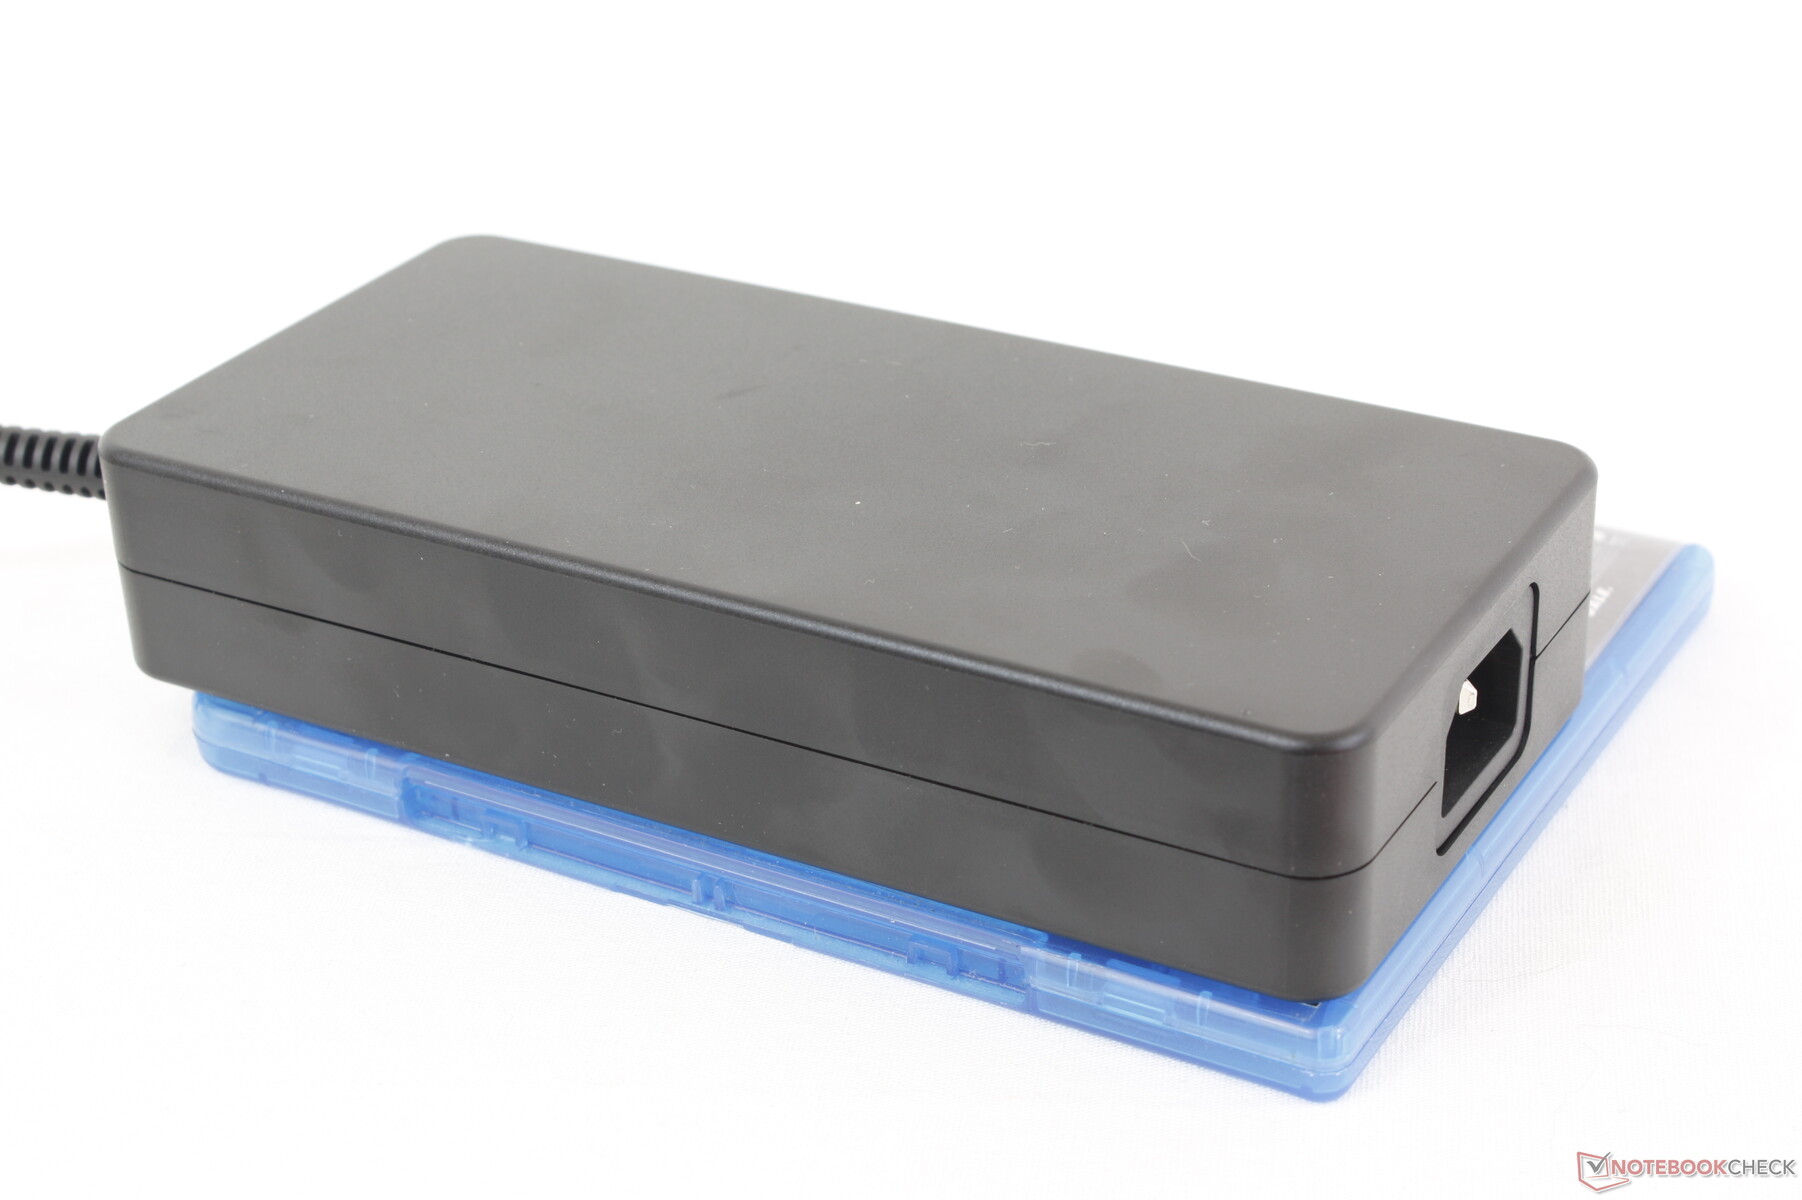
Conseguimos registrar um consumo máximo temporário de 365 W do grande adaptador CA de 280 W (~18 x 8,5 x 3,5 cm) ao iniciar o estresse do Prime95 e do FurMark. Essa taxa cairia e se estabilizaria em torno de 204 W depois de apenas alguns segundos, conforme mostram os gráficos abaixo. A MSI ainda não adotou o carregamento GaN, ao contrário dos laptops Razer Blade mais recentes.
| desligado | |
| Ocioso | |
| Carga |
|
Key:
min: | |
| MSI Raider GE68HX 13VF i9-13950HX, GeForce RTX 4060 Laptop GPU, Samsung PM9B1 1024GB MZVL41T0HBLB, IPS, 1900x1200, 16" | MSI GE67 HX 12UGS i7-12800HX, GeForce RTX 3070 Ti Laptop GPU, Samsung PM9A1 MZVL21T0HCLR, OLED, 1920x1080, 15.6" | HP Omen 16-xf0376ng R7 7840HS, GeForce RTX 4070 Laptop GPU, WDC PC SN810 512GB, IPS, 1920x1080, 16.1" | Alienware m16 R1 AMD R9 7845HX, GeForce RTX 4080 Laptop GPU, Kioxia XG8 KXG80ZNV1T02, IPS, 2560x1600, 16" | Lenovo Legion Slim 7i 16 Gen 8 i9-13900H, GeForce RTX 4070 Laptop GPU, Samsung PM9A1 MZVL21T0HCLR, IPS, 2560x1600, 16" | Asus ROG Zephyrus M16 GU604VY-NM042X i9-13900H, GeForce RTX 4090 Laptop GPU, Samsung PM9A1 MZVL22T0HBLB, IPS, 2560x1600, 16" | |
|---|---|---|---|---|---|---|
| Power Consumption | 1% | 34% | -81% | -12% | -4% | |
| Idle Minimum * (Watt) | 15.8 | 16.1 -2% | 9 43% | 39 -147% | 22 -39% | 20 -27% |
| Idle Average * (Watt) | 19.4 | 17.1 12% | 14 28% | 44.6 -130% | 29 -49% | 24 -24% |
| Idle Maximum * (Watt) | 27.3 | 26.6 3% | 20 27% | 68.1 -149% | 39.5 -45% | 25 8% |
| Load Average * (Watt) | 114.7 | 116.3 -1% | 84 27% | 129.8 -13% | 98.7 14% | 107 7% |
| Witcher 3 ultra * (Watt) | 185.5 | 237 -28% | 140.9 24% | 285 -54% | 171.8 7% | 208 -12% |
| Load Maximum * (Watt) | 364.2 | 291.1 20% | 176 52% | 327.3 10% | 213.2 41% | 267 27% |
* ... menor é melhor
Power Consumption Witcher 3 / Stresstest
Power Consumption external Monitor
Duração da bateria
A capacidade da bateria é a mais alta possível, com 99,9 Wh. Os tempos de execução são muito bons para um notebook de 16 polegadas para jogos, com pouco mais de 6,5 horas de navegação WLAN no mundo real no perfil de energia balanceado com a iGPU ativa. Esse é um dos laptops para jogos de 16 polegadas mais duradouros que testamos até hoje.
Infelizmente, o carregamento da capacidade vazia até a capacidade total é relativamente lento, com 2,5 horas, em comparação com 1,5 hora na maioria dos outros notebooks. Além disso, nenhum dos nossos adaptadores CA USB-C carregaria o notebook por meio de qualquer uma das três portas USB-C, embora a MSI anuncie o Power Delivery.
| MSI Raider GE68HX 13VF i9-13950HX, GeForce RTX 4060 Laptop GPU, 99.9 Wh | MSI GE67 HX 12UGS i7-12800HX, GeForce RTX 3070 Ti Laptop GPU, 99.9 Wh | HP Omen 16-xf0376ng R7 7840HS, GeForce RTX 4070 Laptop GPU, 83 Wh | Alienware m16 R1 AMD R9 7845HX, GeForce RTX 4080 Laptop GPU, 86 Wh | Lenovo Legion Slim 7i 16 Gen 8 i9-13900H, GeForce RTX 4070 Laptop GPU, 99.9 Wh | Asus ROG Zephyrus M16 GU604VY-NM042X i9-13900H, GeForce RTX 4090 Laptop GPU, 90 Wh | |
|---|---|---|---|---|---|---|
| Duração da bateria | -2% | -16% | -52% | -42% | 12% | |
| Reader / Idle (h) | 8.8 | 8.4 -5% | 4 -55% | 5.1 -42% | ||
| WiFi v1.3 (h) | 6.8 | 5.6 -18% | 5.7 -16% | 3.7 -46% | 4.4 -35% | 4.3 -37% |
| Load (h) | 1.8 | 2.1 17% | 0.8 -56% | 0.9 -50% | 2.9 61% | |
| H.264 (h) | 4.8 |
Pro
Contra
Veredicto - Não é ruim, mas não atinge o objetivo
Embora apreciemos o fato de o fabricante ter tomado uma direção diferente com os designs de seus notebooks para jogos, acreditamos firmemente que as mudanças não devem ser feitas às custas da facilidade de manutenção para o usuário final. O GE68HX é mais difícil de abrir do que o design do ano passado e isso pode ser especialmente problemático em um laptop para jogos em que os proprietários têm maior probabilidade de adicionar RAM e armazenamento. Em segundo lugar, o novo design é visivelmente mais espesso e pesado do que o visual "mais limpo" do GE67HX, o que pode não agradar a muitos usuários.
O novo chassi ainda oferece algumas vantagens. Em primeiro lugar, as dobradiças parecem mais resistentes do que antes, enquanto o restante do chassi é igualmente forte. Em segundo lugar, as temperaturas do núcleo são mais baixas do que no GE67HX para um melhor potencial de overclocking. O desempenho é até um pouco mais rápido do que o esperado com o perfil de energia e as configurações padrão. E, por fim, alguns usuários podem gostar do clickpad maior e do novo teclado numérico para outros aplicativos além dos jogos.
O desempenho e as temperaturas se beneficiam do design do chassi mais espesso, mas nem todos ficarão satisfeitos com o peso maior, a dificuldade de manutenção e as opções de tela de baixa qualidade, considerando o alto preço inicial.
A partir de US$ 1.700, no entanto, os cortes nas cores da tela, no G-Sync e no desempenho da SSD parecem desnecessários para um modelo da série GE de alta qualidade. Tais concessões são mais esperadas para os modelos das séries MSI Sword ou Katana, que são mais econômicas. O fabricante também está ficando para trás na tecnologia de carregamento; carregadores GaN menores e mais portáteis da Razer podem produzir a mesma quantidade de energia, enquanto o suporte de carregamento USB-C no GE68HX parece não ser confiável.
Alternativas como oLenovo Legion Slim 7i 16 Gen 8, Asus ROG Zephyrus M16ou Razer Blade 16 podem nem sempre oferecer CPUs Core-HX, mas são muito mais portáteis e têm opções gráficas semelhantes e telas melhores.
Preço e disponibilidade
MSI Raider GE68HX 13VF
- 09/30/2023 v7 (old)
Allen Ngo
Transparência
A seleção dos dispositivos a serem analisados é feita pela nossa equipe editorial. A amostra de teste foi adquirida gratuitamente pelo autor às suas próprias custas. O credor não teve influência nesta revisão, nem o fabricante recebeu uma cópia desta revisão antes da publicação. Não houve obrigação de publicar esta revisão. Como empresa de mídia independente, a Notebookcheck não está sujeita à autoridade de fabricantes, varejistas ou editores.
É assim que o Notebookcheck está testando
Todos os anos, o Notebookcheck analisa de forma independente centenas de laptops e smartphones usando procedimentos padronizados para garantir que todos os resultados sejam comparáveis. Desenvolvemos continuamente nossos métodos de teste há cerca de 20 anos e definimos padrões da indústria no processo. Em nossos laboratórios de teste, equipamentos de medição de alta qualidade são utilizados por técnicos e editores experientes. Esses testes envolvem um processo de validação em vários estágios. Nosso complexo sistema de classificação é baseado em centenas de medições e benchmarks bem fundamentados, o que mantém a objetividade.Price comparison

