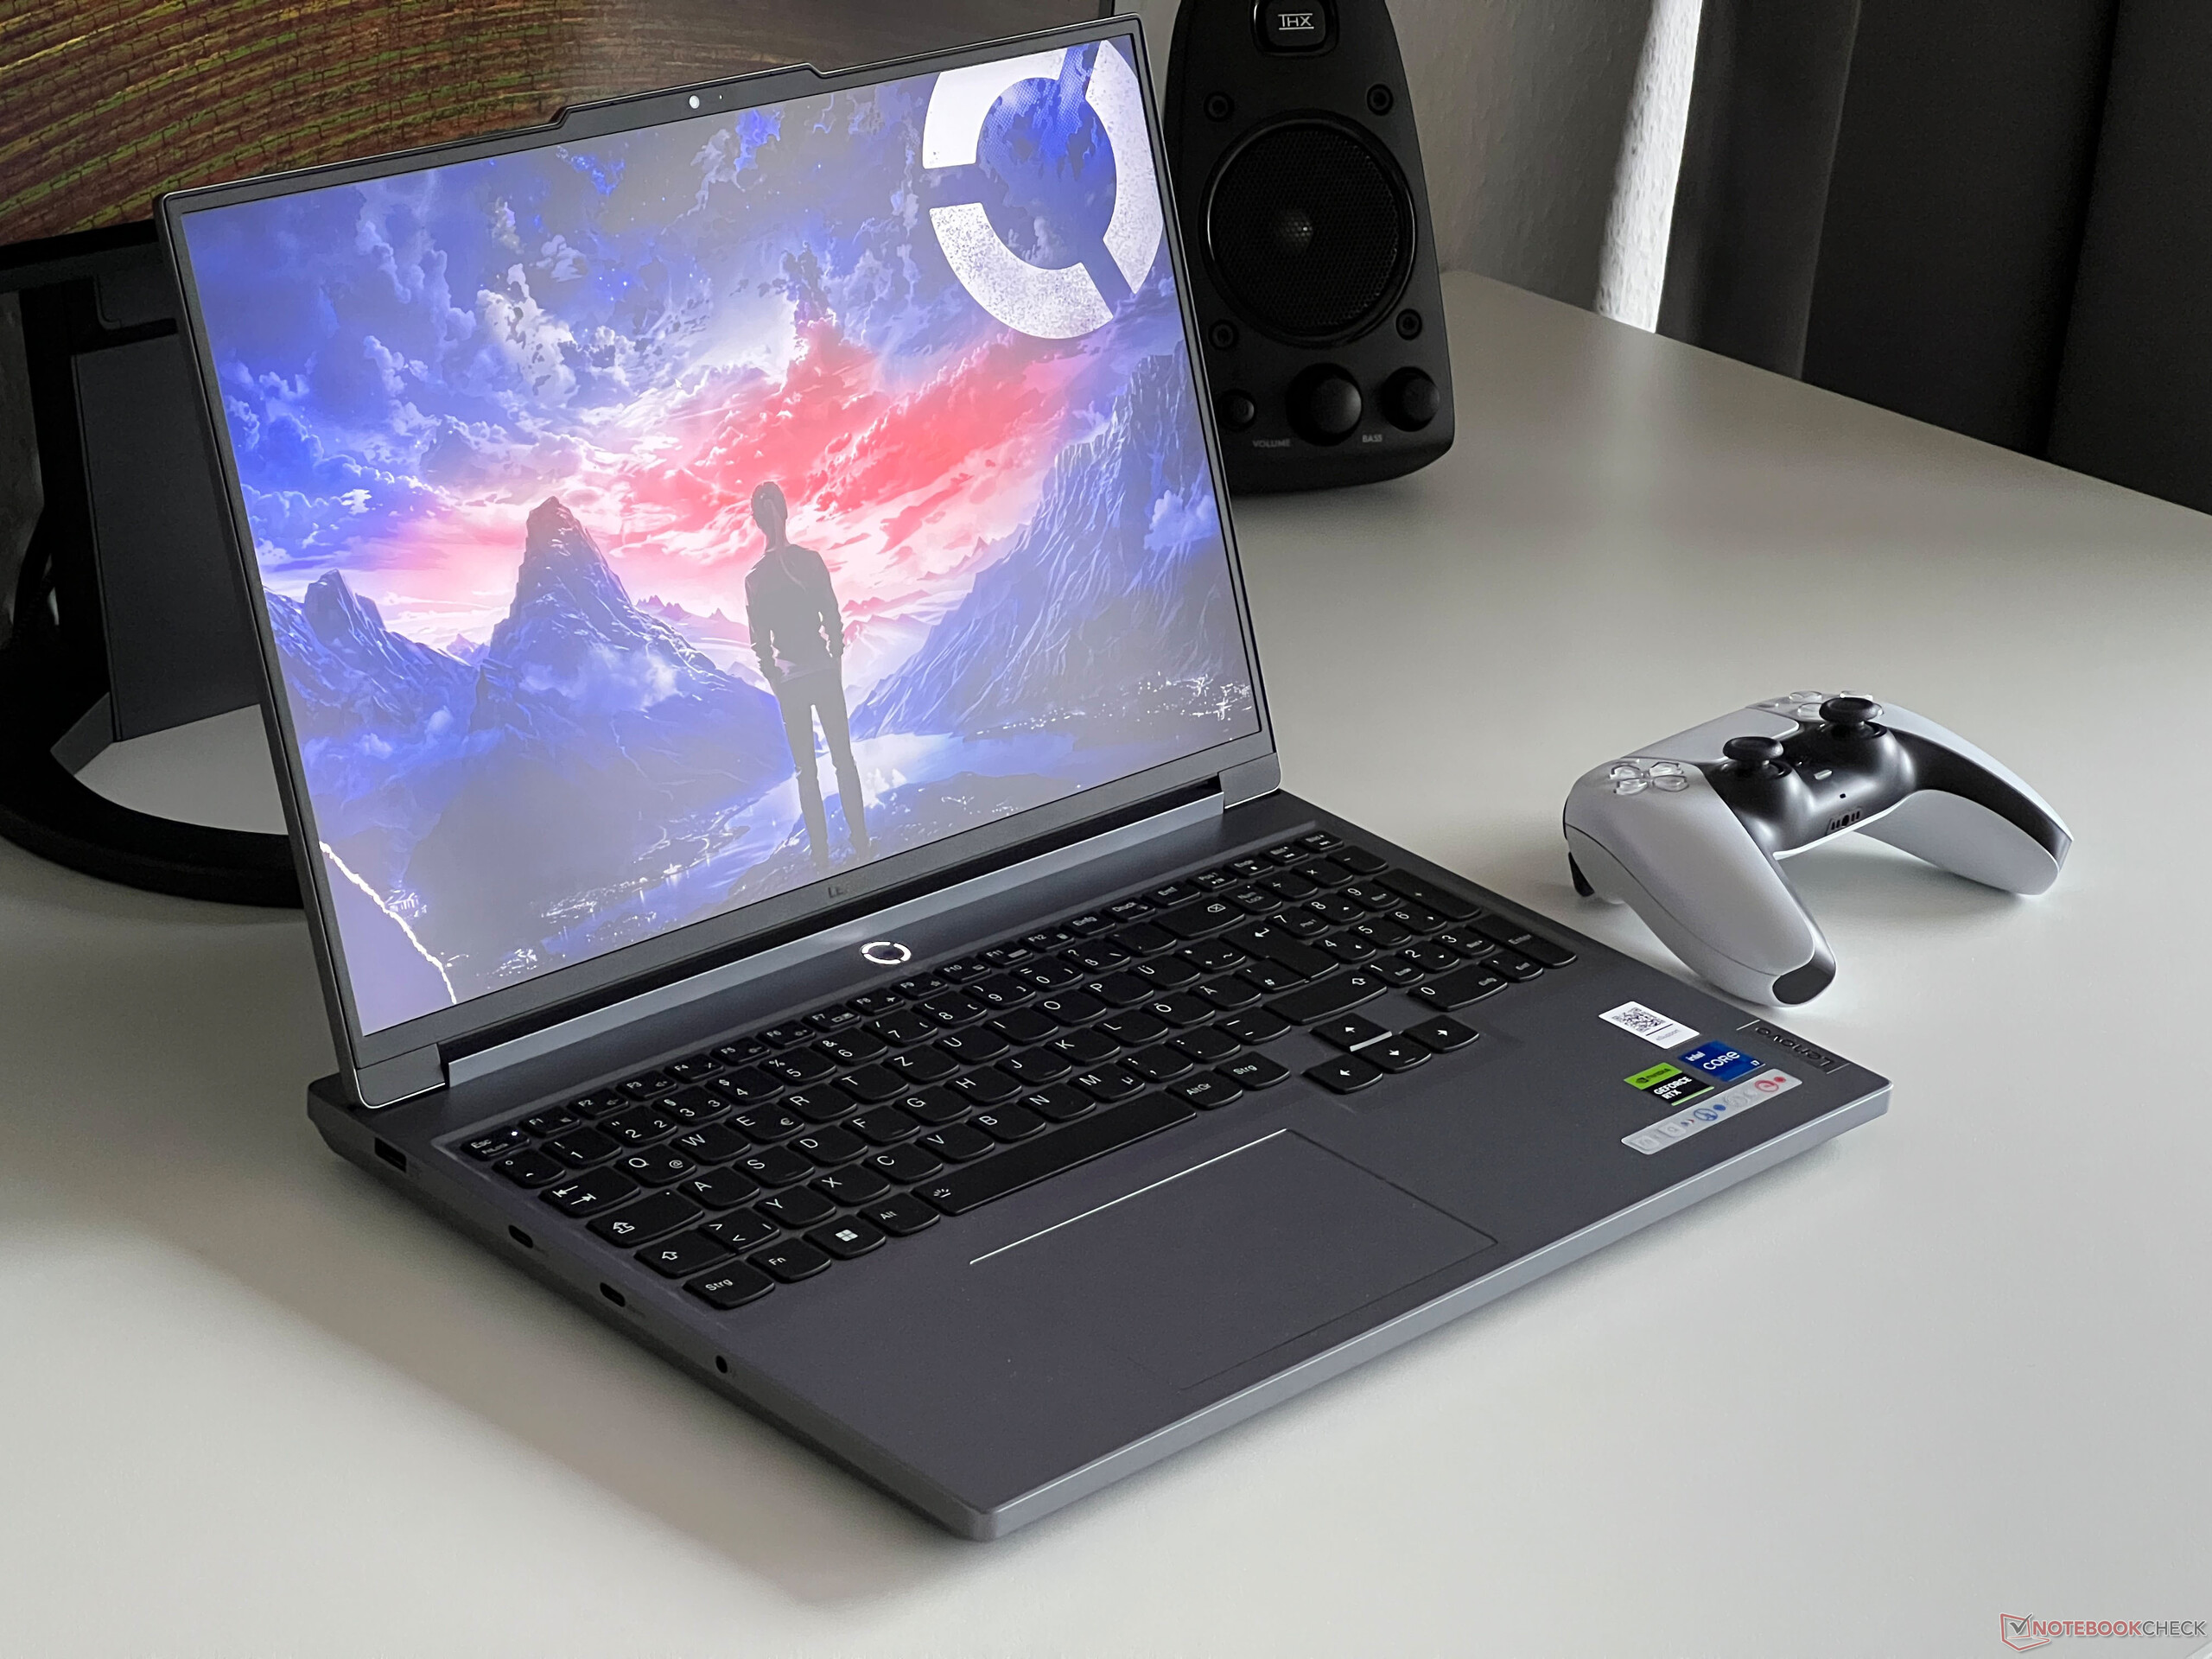
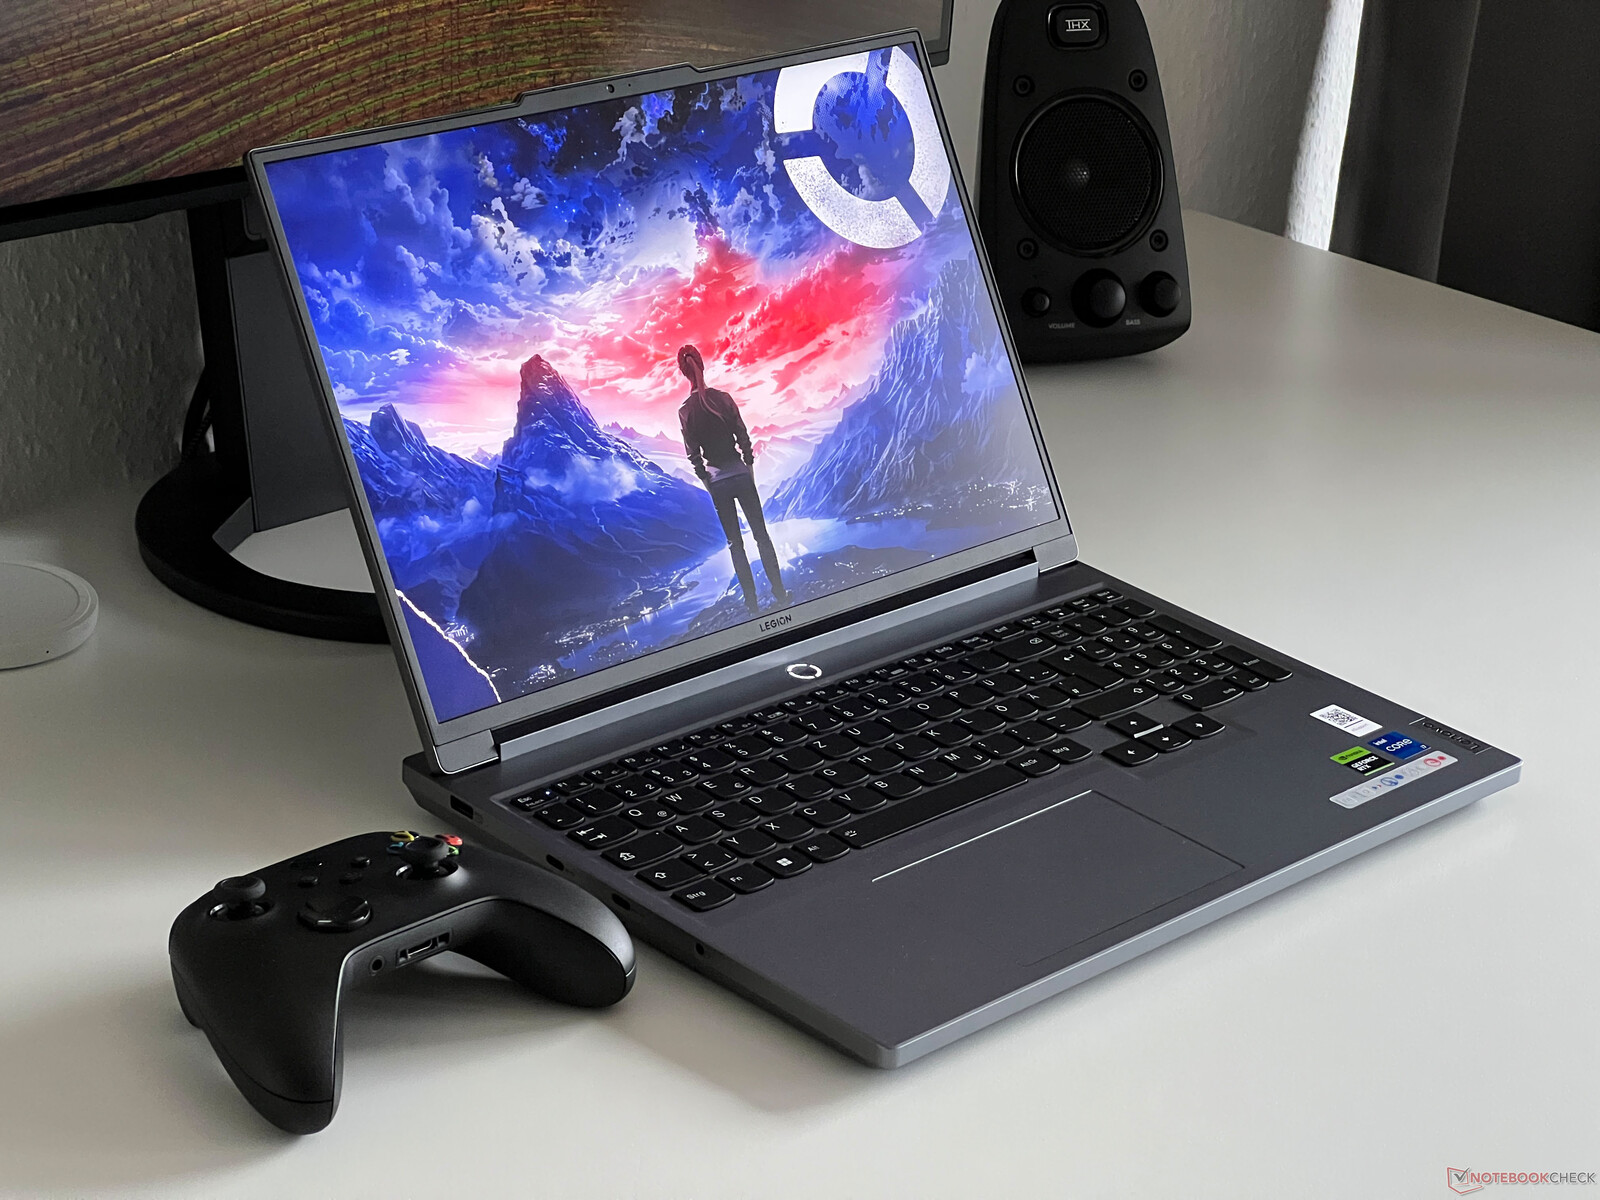
Análise do Lenovo Legion 5i 16 G9 - O laptop rápido para jogos com Raptor Lake-HX e um mecanismo de IA
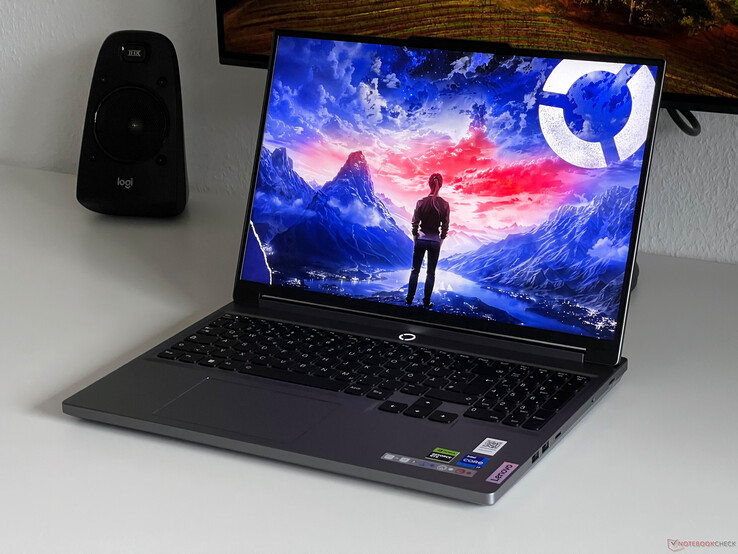
A Lenovo acaba de revelar seu novo gamer, o Legion 5i 16 G9, na CES deste ano - e já tivemos a chance de testá-lo. O laptop para jogos de médio porte da Lenovo fica entre a série LOQ, mais barata, e o Legion 5 Pro, mais caro. Com seu novo processador Raptor-Lake-HX, o Core i7-14650HXuma versão de 115 watts do Laptop RTX 4060 (incluindo o Advanced Optimus) e um rápido painel WQXGA de 240 Hz, o novo Legion 5i 16 se concentra inteiramente no desempenho, deixando de lado coisas como a iluminação extensiva do gabinete. Além disso, o fabricante faz uso de um chip especial de IA - supostamente, o AI Engine+ da Lenovo melhorará ainda mais a experiência de jogo dos usuários.
Testamos a versão do Legion 5i 16IRX G9 com o processador Core-i7, laptop RTX 4060, tela de 240 Hz, 16 GB de RAM e um SSD PCIe de 1 TB por US$ 1.610.
Possíveis concorrentes em comparação
Avaliação | Data | Modelo | Peso | Altura | Size | Resolução | Preço |
|---|---|---|---|---|---|---|---|
| 89.1 % v7 (old) | 02/2024 | Lenovo Legion 5 16IRX G9 i7-14650HX, GeForce RTX 4060 Laptop GPU | 2.4 kg | 25.2 mm | 16.00" | 2560x1600 | |
| 89.2 % v7 (old) | 10/2023 | Schenker XMG CORE 16 (L23) R7 7840HS, GeForce RTX 4070 Laptop GPU | 2.4 kg | 26.1 mm | 16.00" | 2560x1600 | |
| 85.1 % v7 (old) | 09/2023 | HP Victus 16-r0077ng i7-13700H, GeForce RTX 4070 Laptop GPU | 2.4 kg | 24 mm | 16.10" | 1920x1080 | |
| 87.3 % v7 (old) | 09/2023 | Lenovo LOQ 16IRH8 i7-13620H, GeForce RTX 4060 Laptop GPU | 2.7 kg | 25.9 mm | 16.00" | 2560x1600 | |
| 87.7 % v7 (old) | 08/2023 | Lenovo Legion Slim 5 16APH8 R7 7840HS, GeForce RTX 4060 Laptop GPU | 2.4 kg | 25.2 mm | 16.00" | 2560x1600 | |
| 85.6 % v7 (old) | 09/2023 | HP Victus 16-r0076TX i5-13500HX, GeForce RTX 4050 Laptop GPU | 2.3 kg | 22.9 mm | 16.10" | 1920x1080 | |
| 88.3 % v7 (old) | 09/2023 | Alienware m16 R1 Intel i7-13700HX, GeForce RTX 4060 Laptop GPU | 3 kg | 25.4 mm | 16.00" | 2560x1600 | |
| 87.9 % v7 (old) | 05/2023 | Lenovo Legion Pro 5 16IRX8 i7-13700HX, GeForce RTX 4060 Laptop GPU | 2.5 kg | 26.8 mm | 16.00" | 2560x1600 |
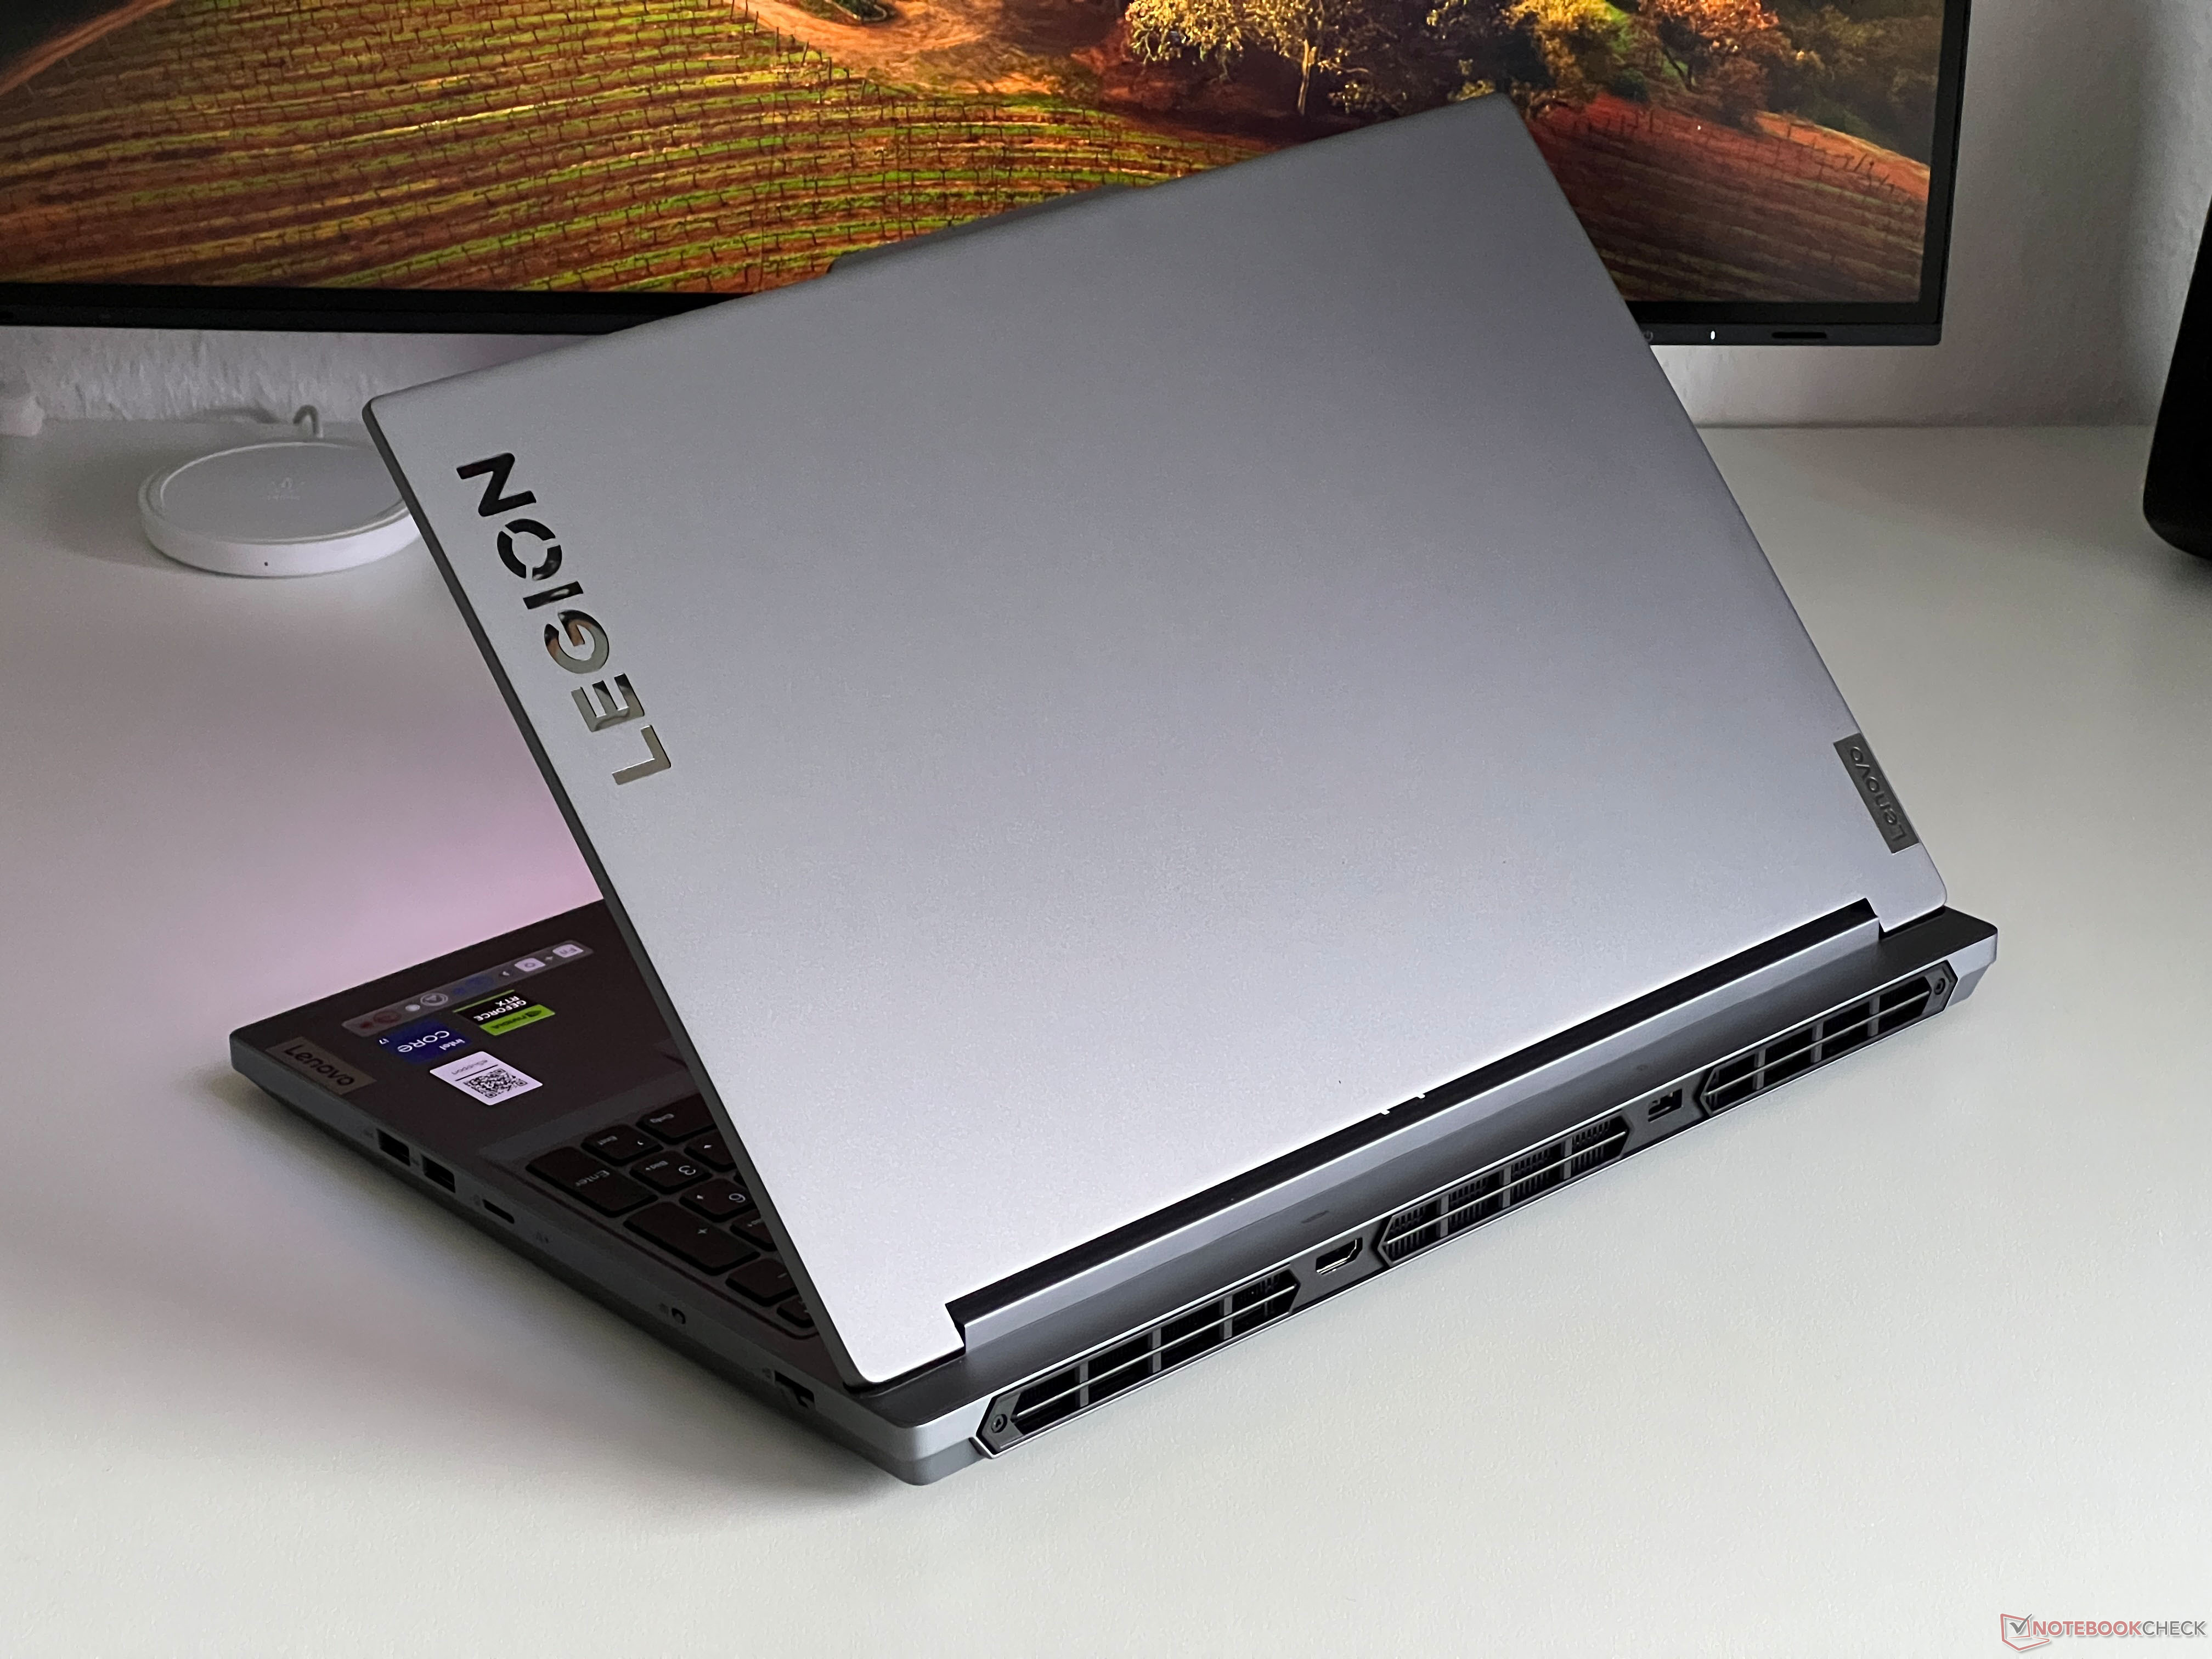
Case - O Legion apresenta parcialmente alumínio
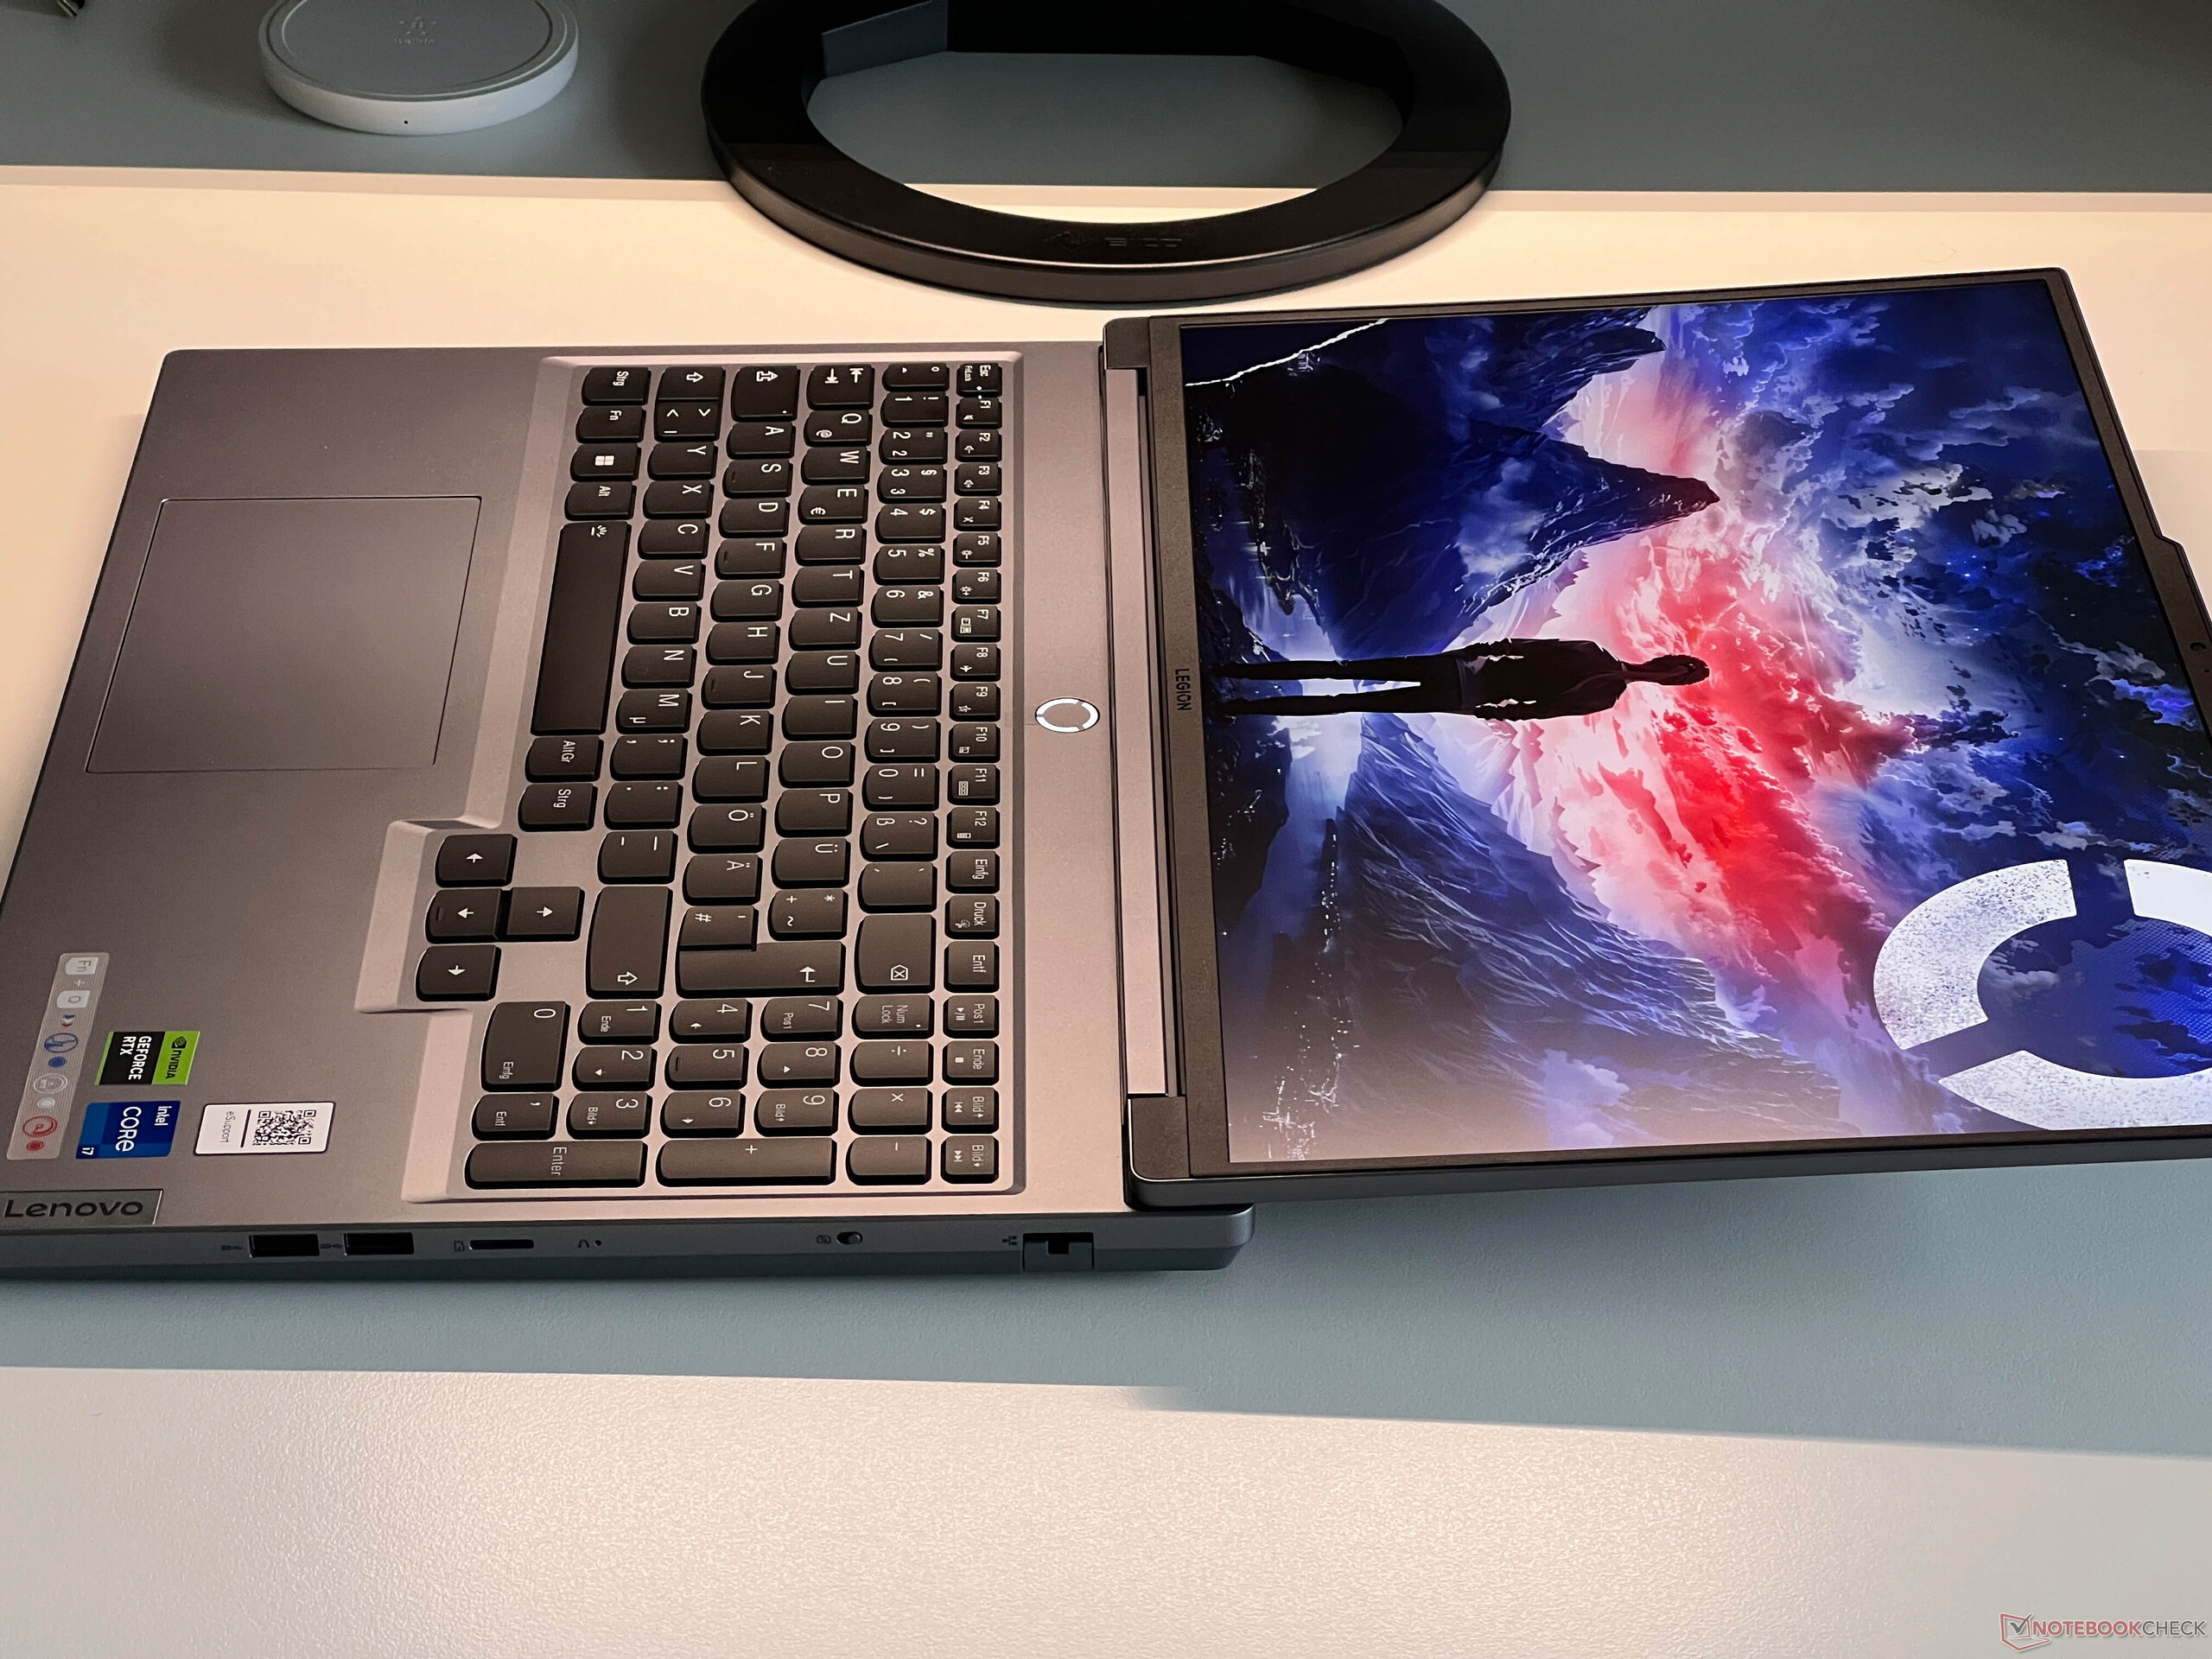
O gabinete do dispositivo é muito elegante para um laptop para jogos e, se o senhor prefere que as coisas sejam mais chamativas, o Legion 5i pode muito bem desapontá-lo. Além do teclado e das bordas pretas, ele não apresenta nenhum outro contraste de cores e, além disso, a Lenovo decidiu não instalar nenhuma iluminação no gabinete. Somente o LED de status ao redor do botão de energia acende em quatro cores que dependem do perfil de energia que está em uso. Pelo menos isso significa que o senhor também pode usar o laptop em ambientes mais profissionais, como na universidade.
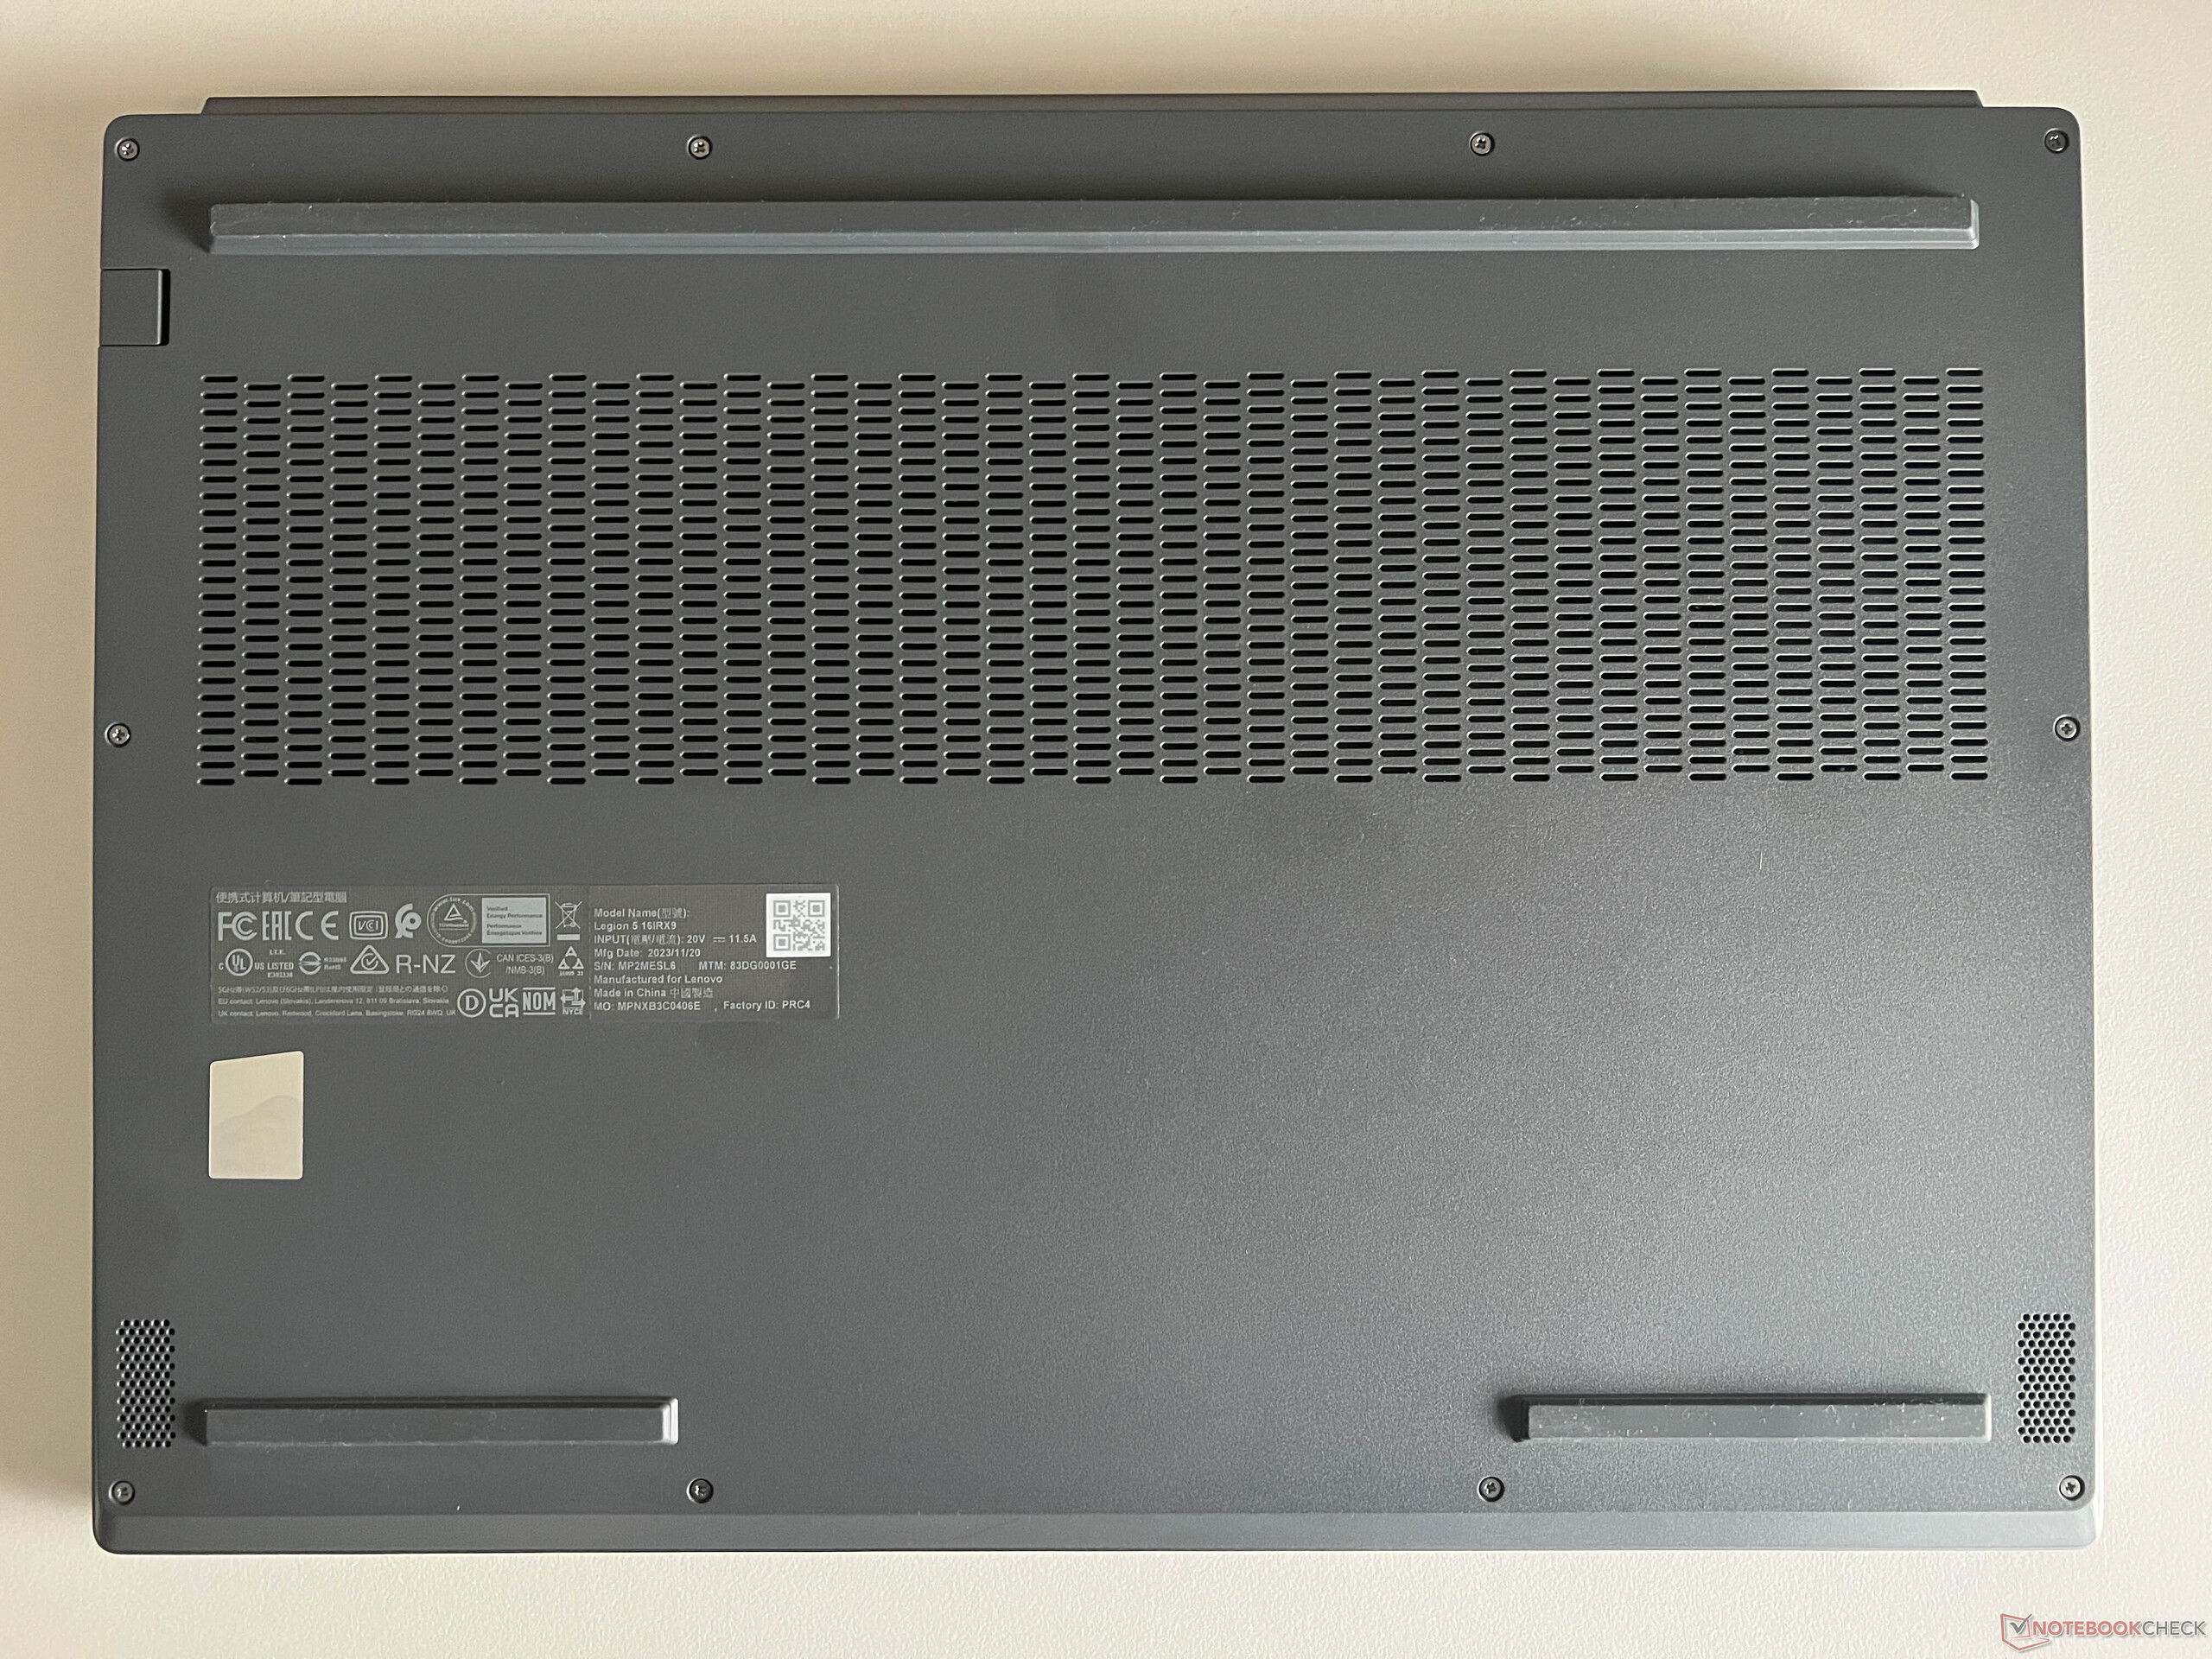
Em termos de qualidade, o gabinete tem um toque bastante sofisticado, embora apenas a tampa seja feita de alumínio. A unidade de base é feita inteiramente de plástico, mas a parte superior ainda é muito bonita. Apenas a parte inferior do gabinete é um pouco mais áspera, o que lhe dá uma sensação de ser mais barato. Uma vantagem do gabinete é que ele atrai muito pouco a sujeira e as marcas de impressões digitais. Sua estabilidade é boa em geral, mas isso não é uma surpresa devido à espessura da unidade básica (máximo de 2 cm na parte traseira). As dobradiças da tela foram bem ajustadas e permitem que o senhor abra o laptop com uma mão; o ângulo máximo de abertura é de 180 graus.
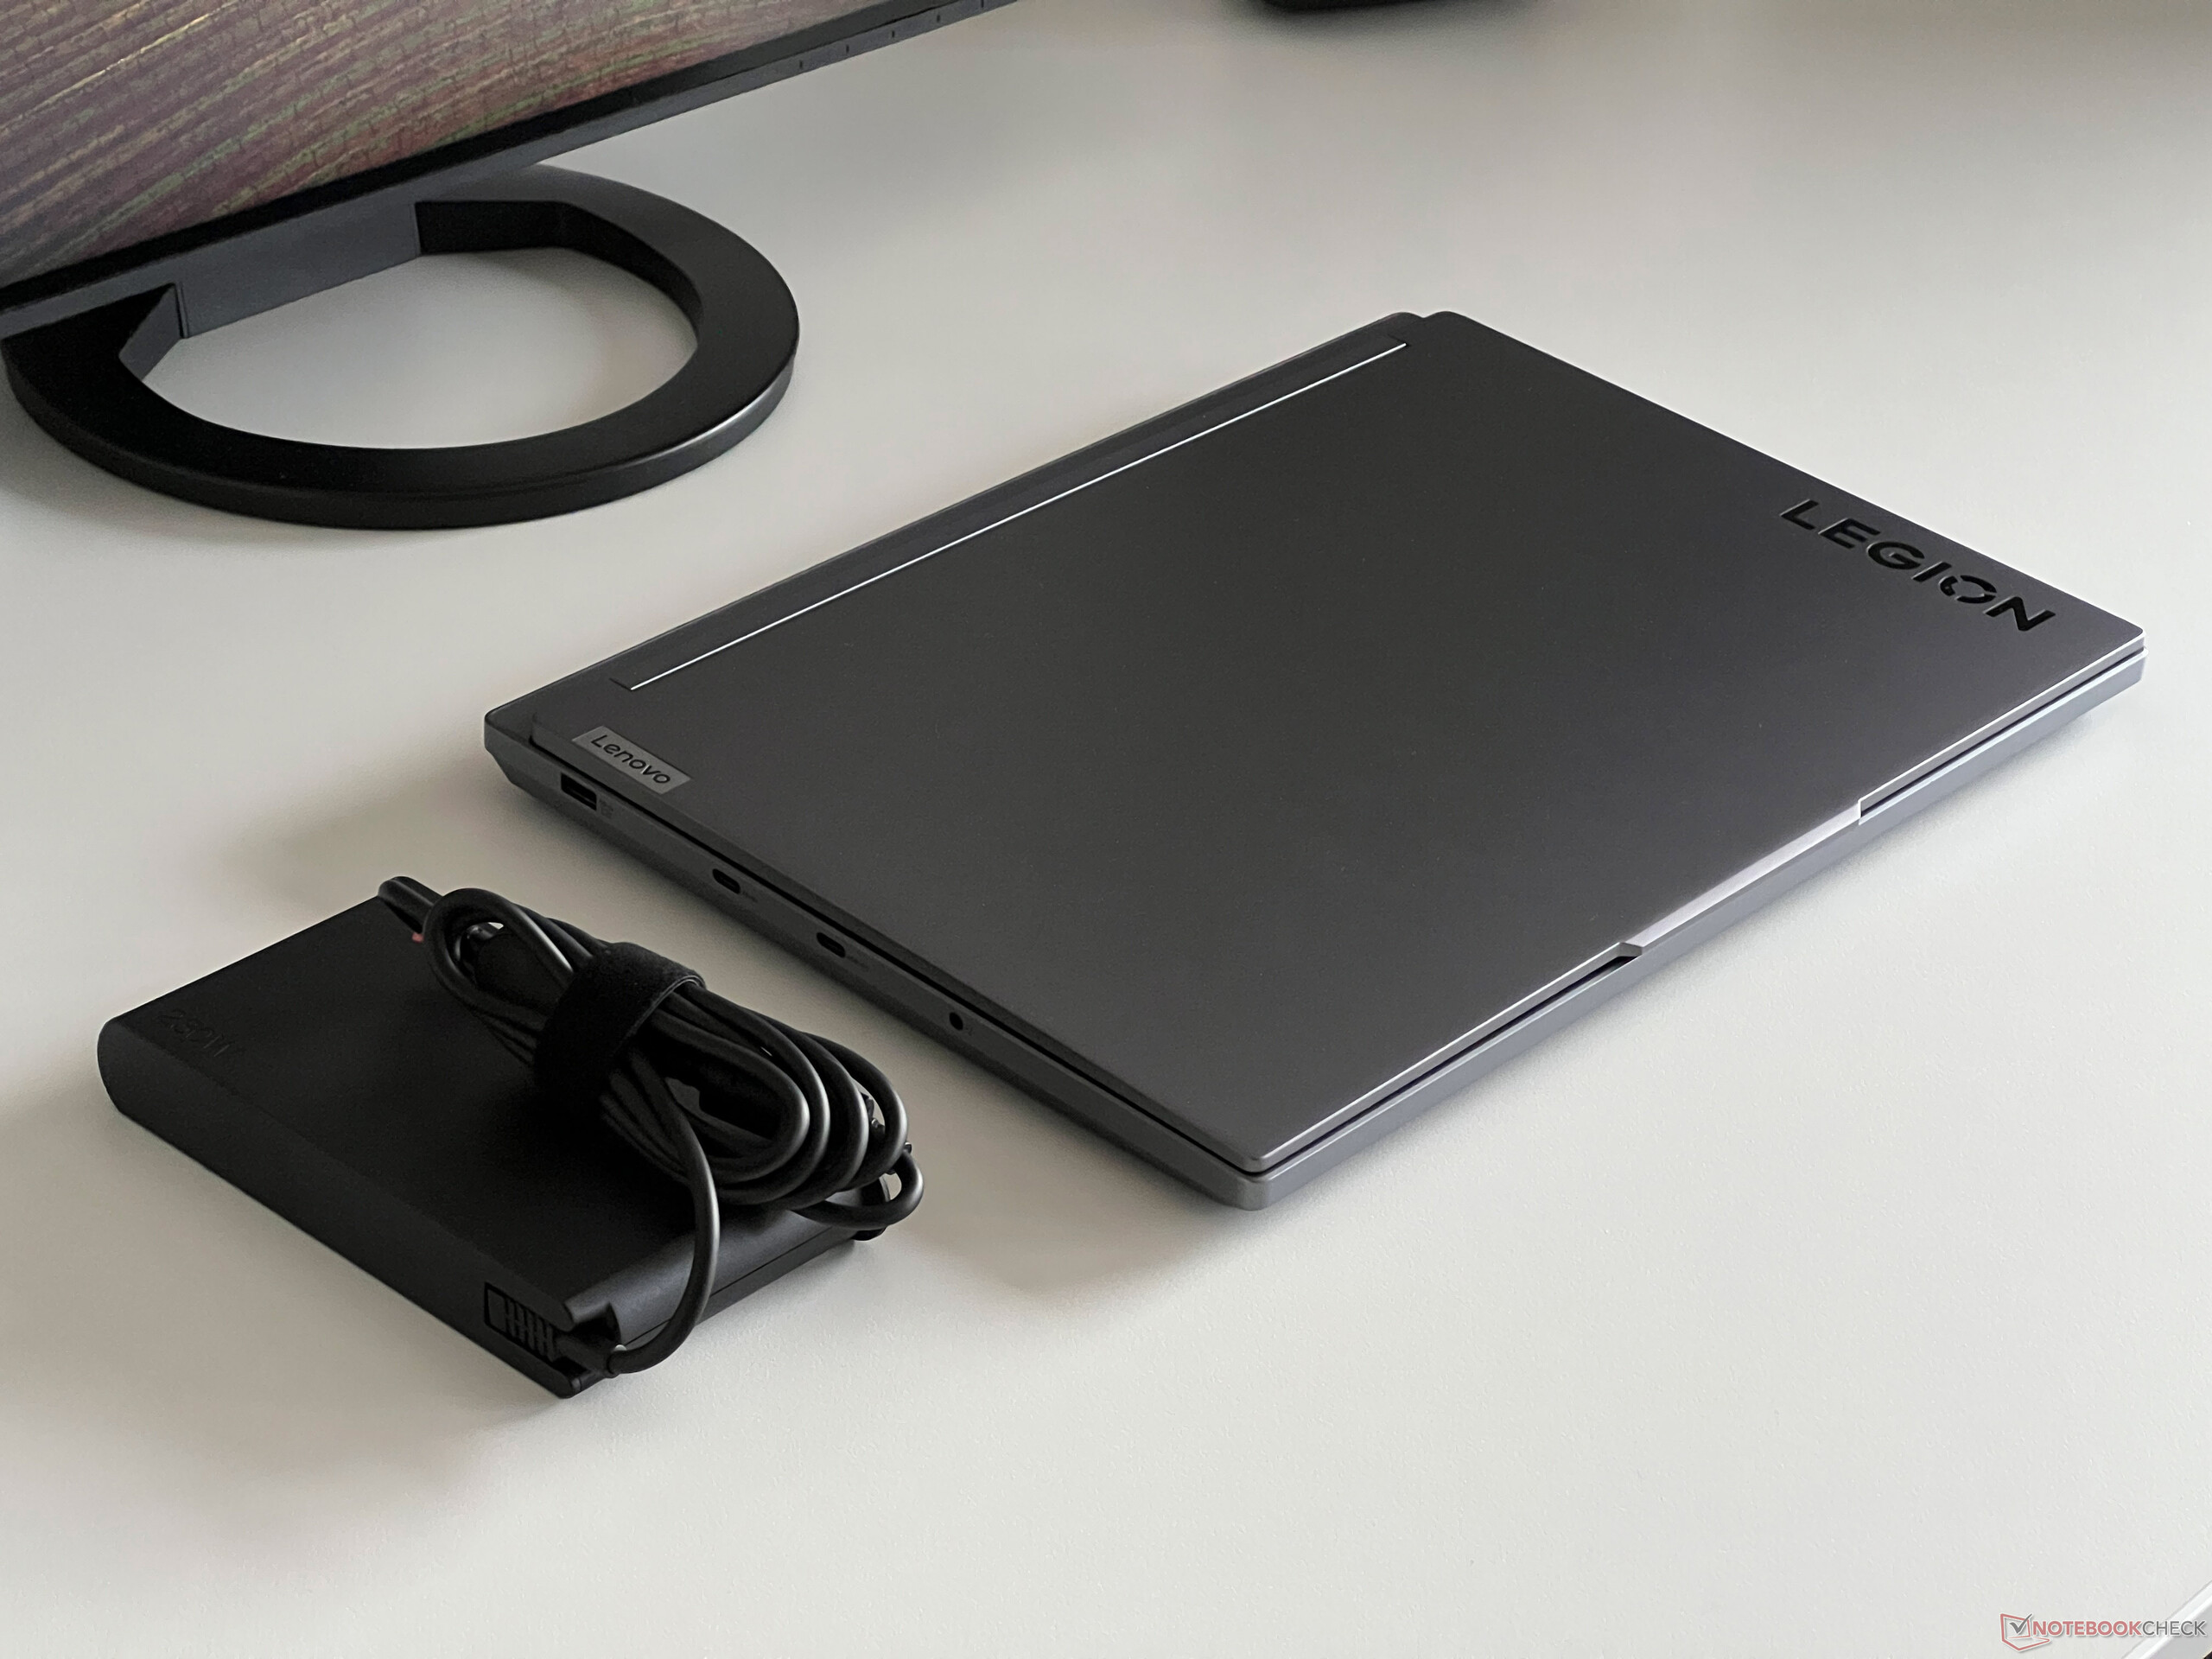
Pesando 2,4 kg, ele não é, de forma alguma, tão leve quanto uma pluma, mas dentro do campo de comparação, nossa amostra de teste tem um bom desempenho. Sua pegada também o torna um dos modelos mais compactos. O senhor terá que planejar um adicional de 869 gramas para a fonte de alimentação de 230 watts.
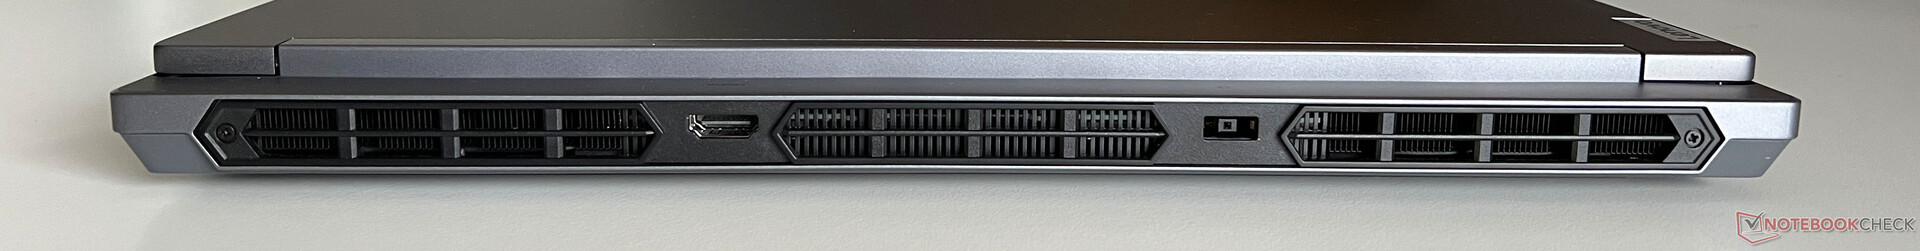
Conectividade - A Lenovo abandonou o Thunderbolt
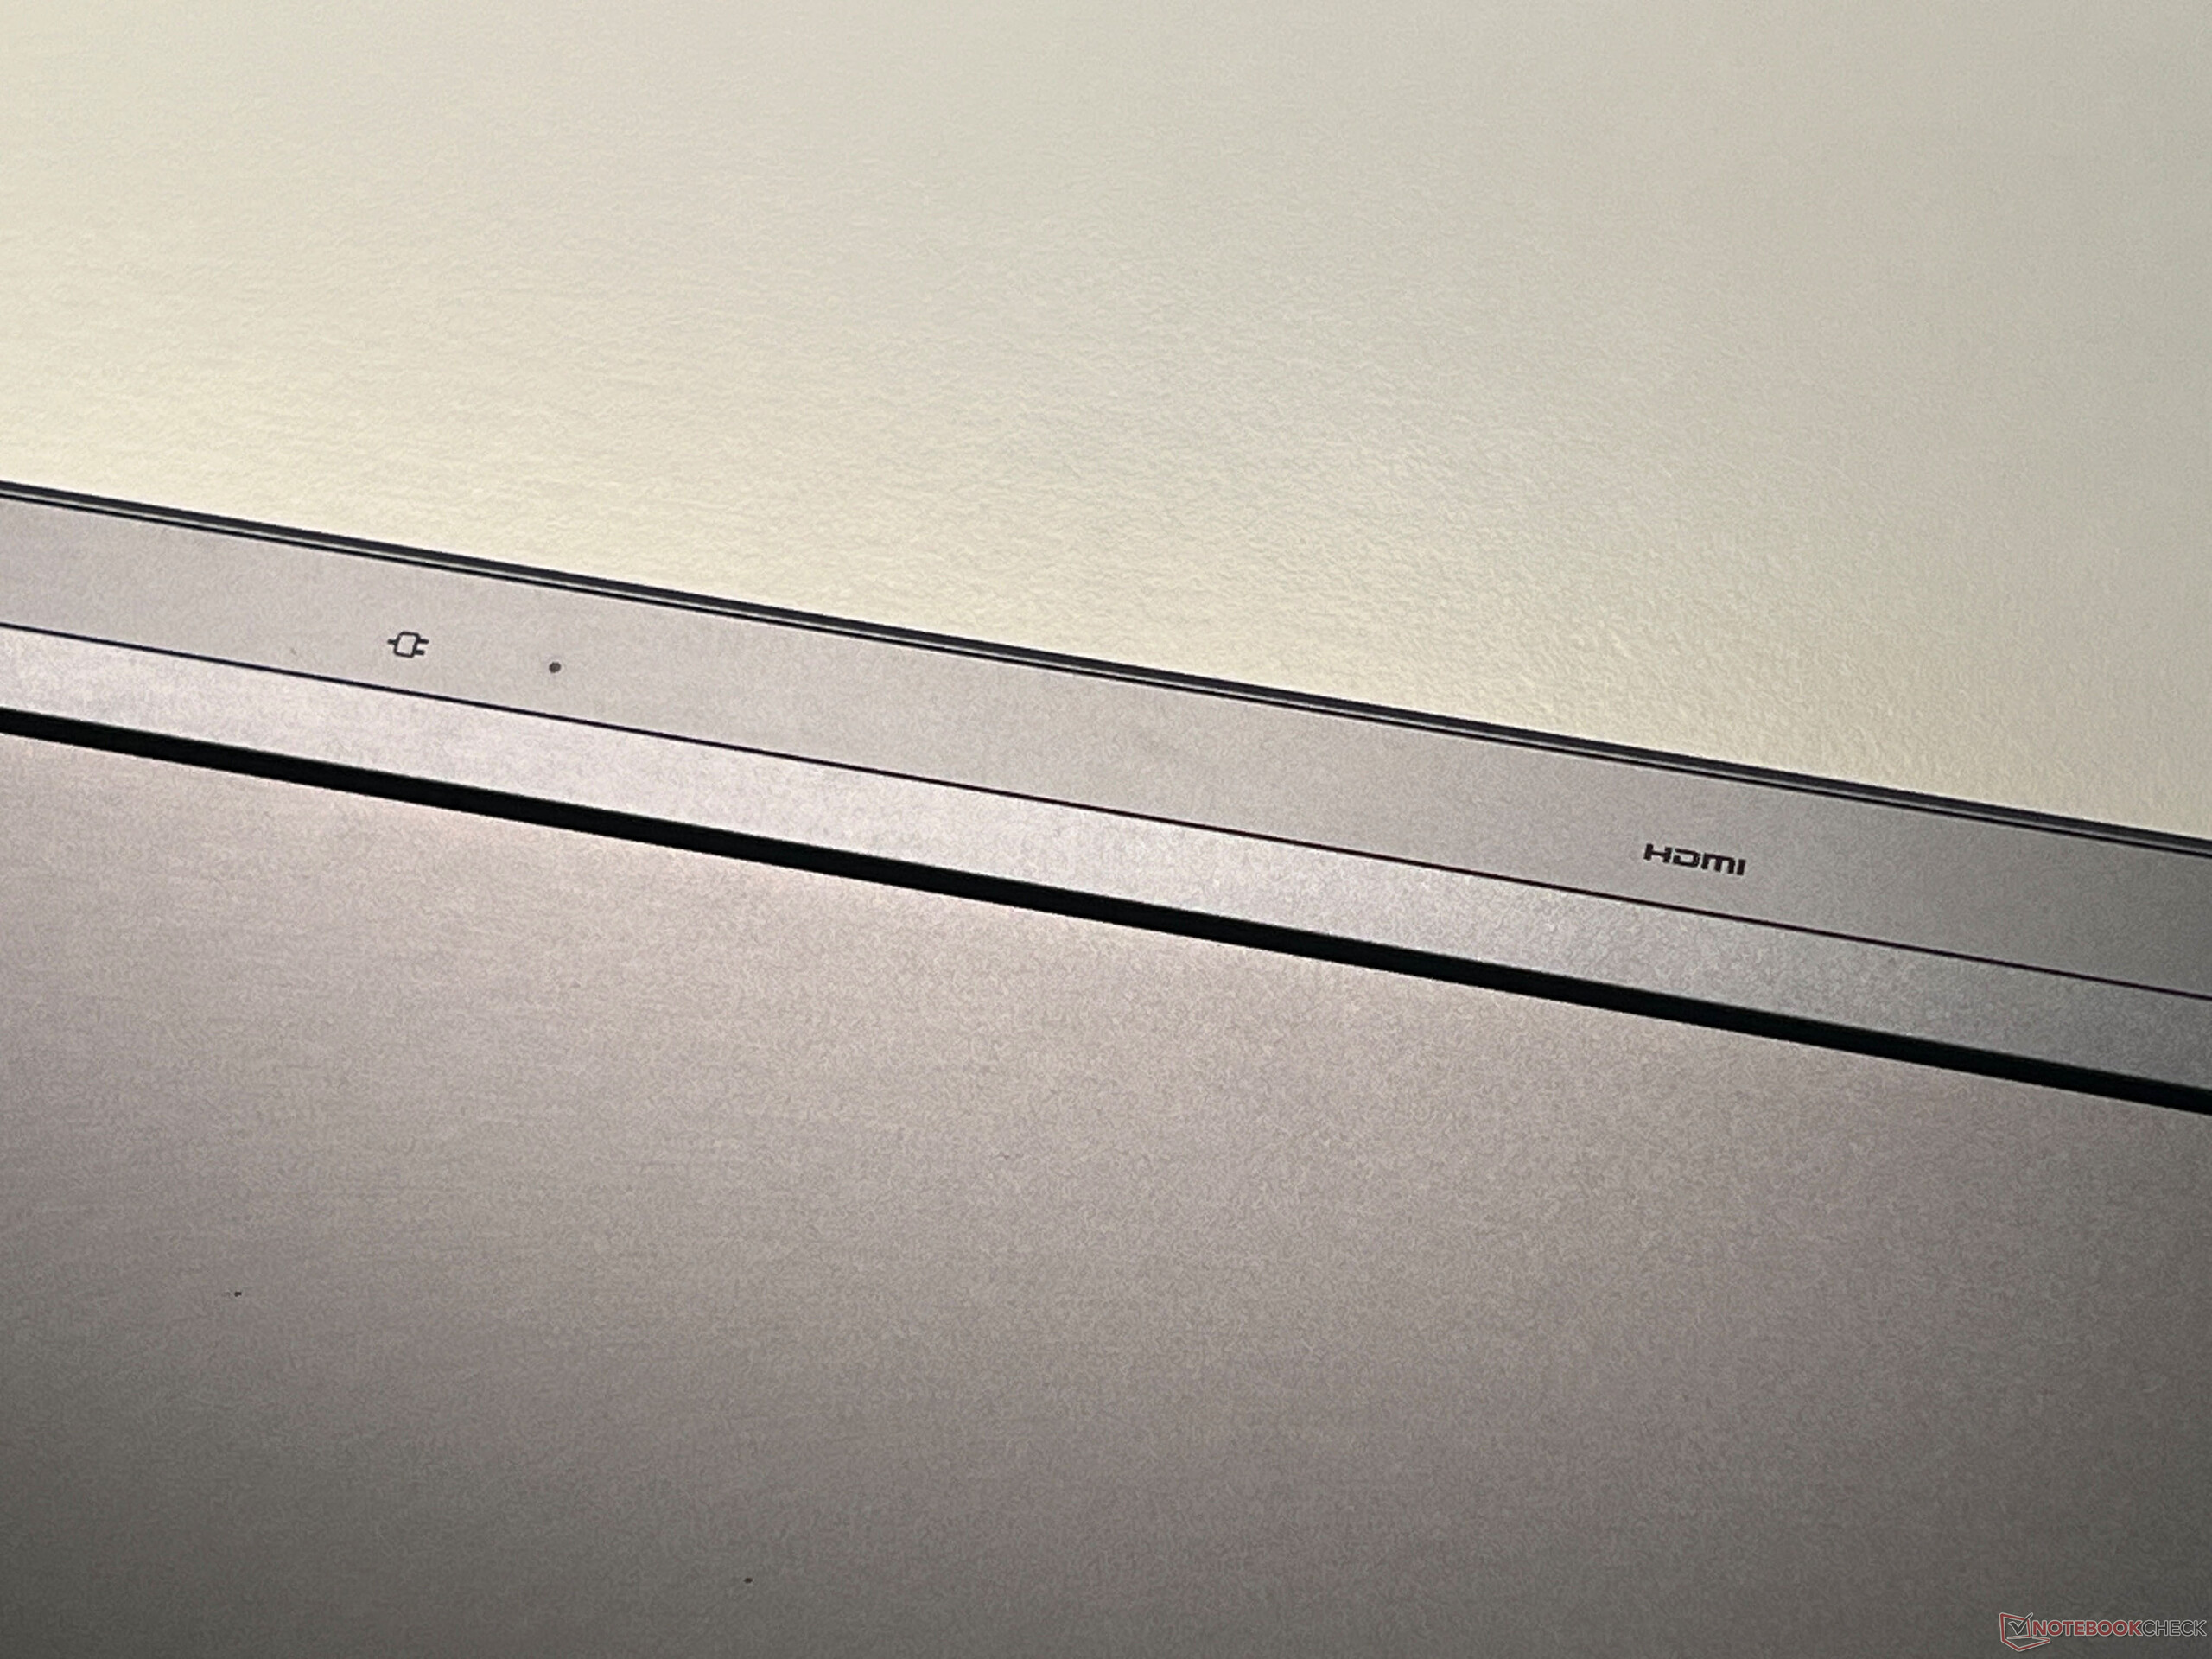
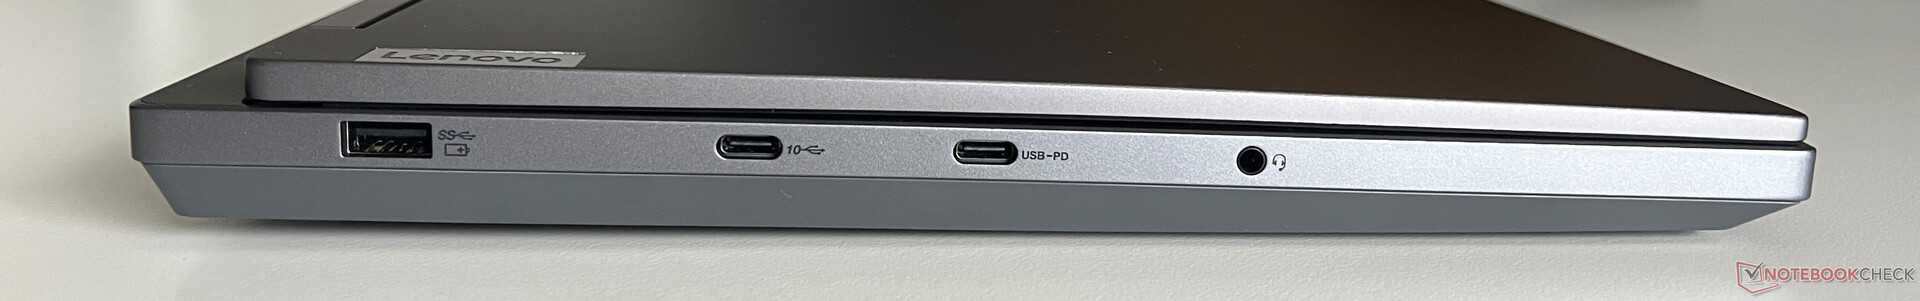
No Legion 5i 16 (assim como no Legion Pro 5i), a Lenovo decidiu não instalar o Thunderbolt 4, mas, por outro lado, ele apresenta uma boa seleção de portas espalhadas pelos três lados. A parte traseira abriga a conexão de energia e a porta HDMI, a esquerda apresenta três portas USB e há mais duas conexões USB no lado direito. Todas as saídas de vídeo são conectadas por meio da dGPU, o que significa que a GPU da Nvidia está sempre ativa quando um monitor externo é conectado.
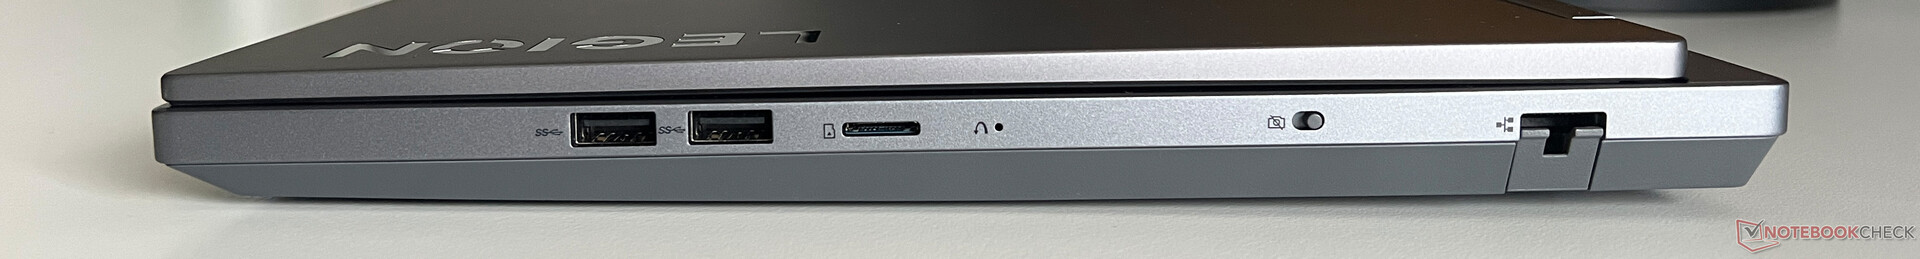
Leitor de cartão SD
O leitor de cartão microSD no lado direito do dispositivo não aceita totalmente os cartões e não é particularmente rápido. Em combinação com nosso cartão de referência (Angelibird AV Pro V60), medimos taxas de transferência baixas de cerca de 30 MB/s.
| SD Card Reader | |
| average JPG Copy Test (av. of 3 runs) | |
| Alienware m16 R1 Intel (AV PRO microSD 128 GB V60) | |
| Média da turma Gaming (20.9 - 210, n=55, últimos 2 anos) | |
| Lenovo Legion Slim 5 16APH8 (PNY EliteX-Pro60 V60 256 GB) | |
| Schenker XMG CORE 16 (L23) | |
| Lenovo Legion 5 16IRX G9 | |
| maximum AS SSD Seq Read Test (1GB) | |
| Alienware m16 R1 Intel (AV PRO microSD 128 GB V60) | |
| Média da turma Gaming (25.5 - 261, n=52, últimos 2 anos) | |
| Lenovo Legion Slim 5 16APH8 (PNY EliteX-Pro60 V60 256 GB) | |
| Schenker XMG CORE 16 (L23) | |
| Lenovo Legion 5 16IRX G9 | |
Comunicação
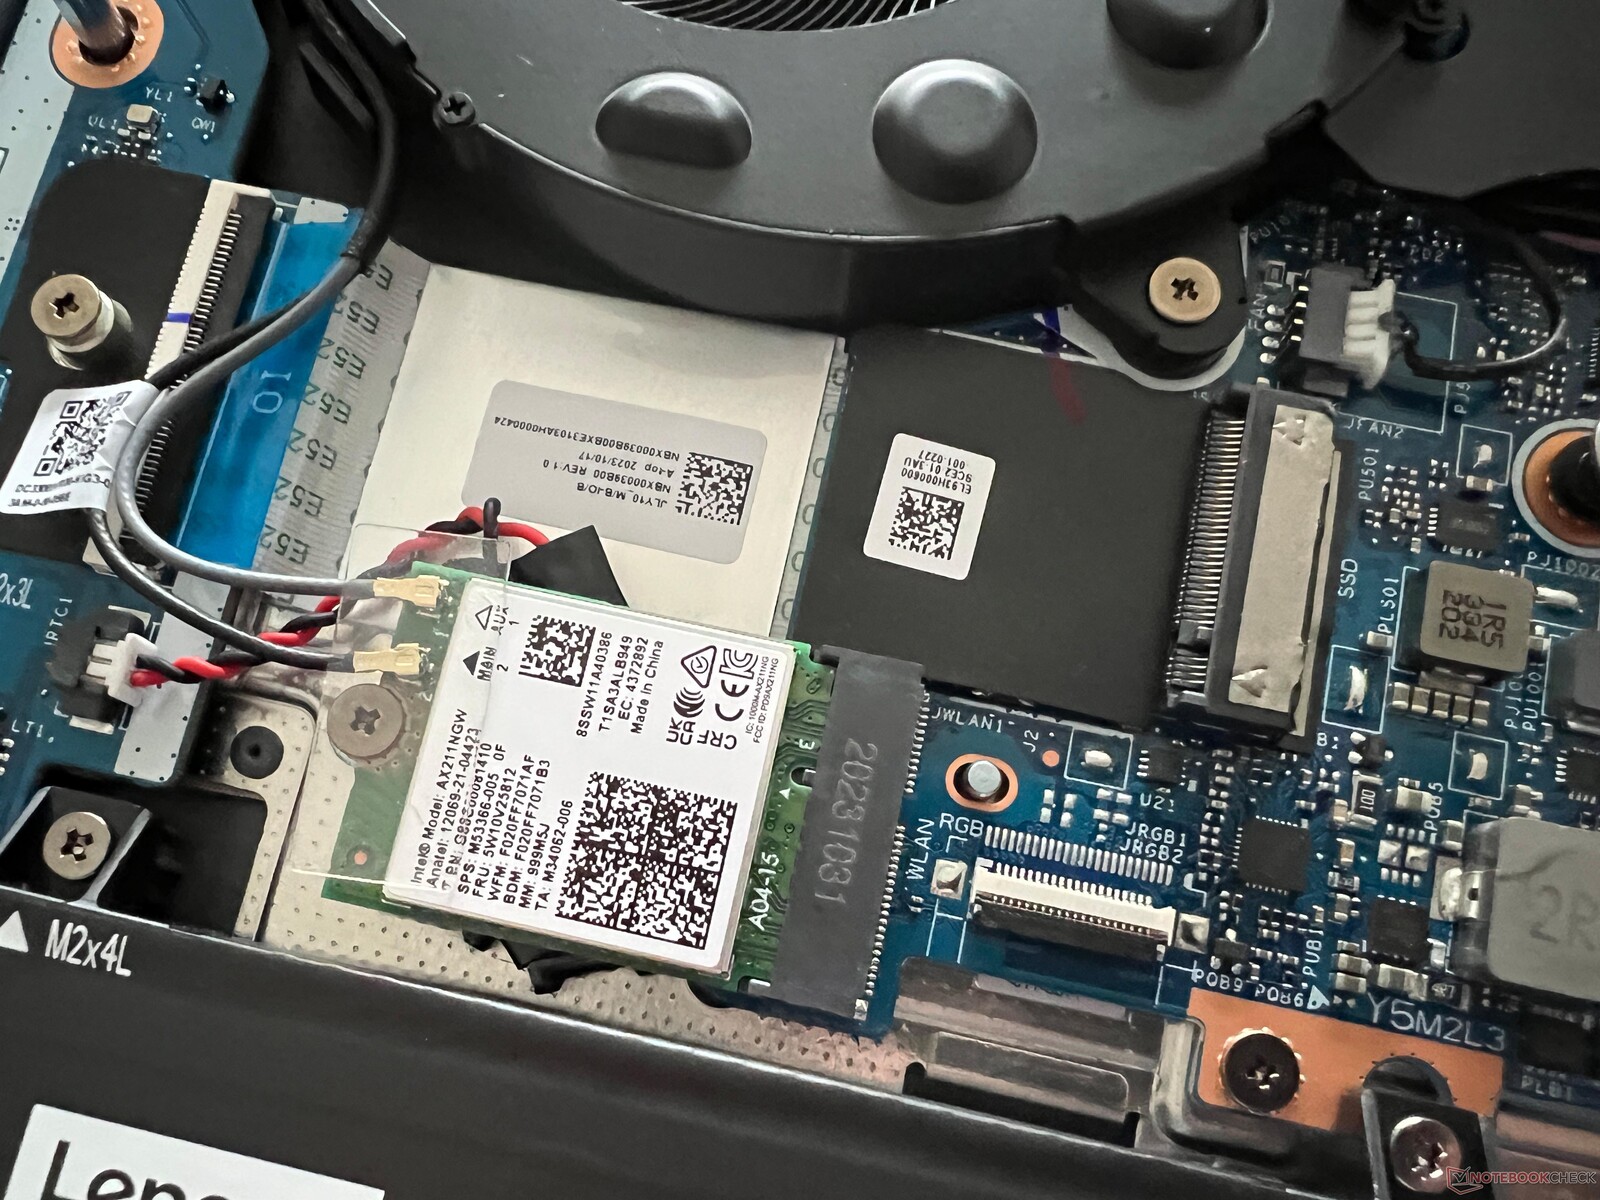
A Lenovo equipou o Legion com o módulo AX211 WLAN da Intel que, além do Bluetooth 5.3, também domina o atual padrão Wi-Fi-6E para redes de 6 GHz. Em combinação com nosso roteador de referência da Asus, suas taxas de transferência foram excelentes no total, embora a concorrência ainda tenha sido mais rápida em alguns momentos. No entanto, o senhor não deve perceber isso no uso prático e, durante nosso teste, nunca tivemos problemas com a qualidade do sinal. Além disso, o laptop possui uma porta Gigabit-Ethernet para conexões com fio.
| Networking | |
| Lenovo Legion 5 16IRX G9 | |
| iperf3 transmit AXE11000 | |
| iperf3 receive AXE11000 | |
| Schenker XMG CORE 16 (L23) | |
| iperf3 transmit AXE11000 | |
| iperf3 receive AXE11000 | |
| HP Victus 16-r0077ng | |
| iperf3 transmit AXE11000 | |
| iperf3 receive AXE11000 | |
| Lenovo LOQ 16IRH8 | |
| iperf3 transmit AXE11000 | |
| iperf3 receive AXE11000 | |
| Lenovo Legion Slim 5 16APH8 | |
| iperf3 transmit AXE11000 | |
| iperf3 receive AXE11000 | |
| iperf3 transmit AXE11000 6GHz | |
| iperf3 receive AXE11000 6GHz | |
| HP Victus 16-r0076TX | |
| iperf3 transmit AXE11000 | |
| iperf3 receive AXE11000 | |
| iperf3 transmit AXE11000 6GHz | |
| iperf3 receive AXE11000 6GHz | |
| Alienware m16 R1 Intel | |
| iperf3 transmit AXE11000 | |
| iperf3 receive AXE11000 | |
| Lenovo Legion Pro 5 16IRX8 | |
| iperf3 transmit AXE11000 | |
| iperf3 receive AXE11000 | |
| iperf3 transmit AXE11000 6GHz | |
| iperf3 receive AXE11000 6GHz | |
Webcam
A webcam de 1080p do Legion 5i cumpre sua função, tirando fotos decentes em boas condições de iluminação. Por outro lado, ela não é compatível com nenhum efeito de estúdio adicional e não tem um sensor IR para reconhecimento facial via Windows Hello. Há um botão no lado direito que desativa a webcam.


Manutenção
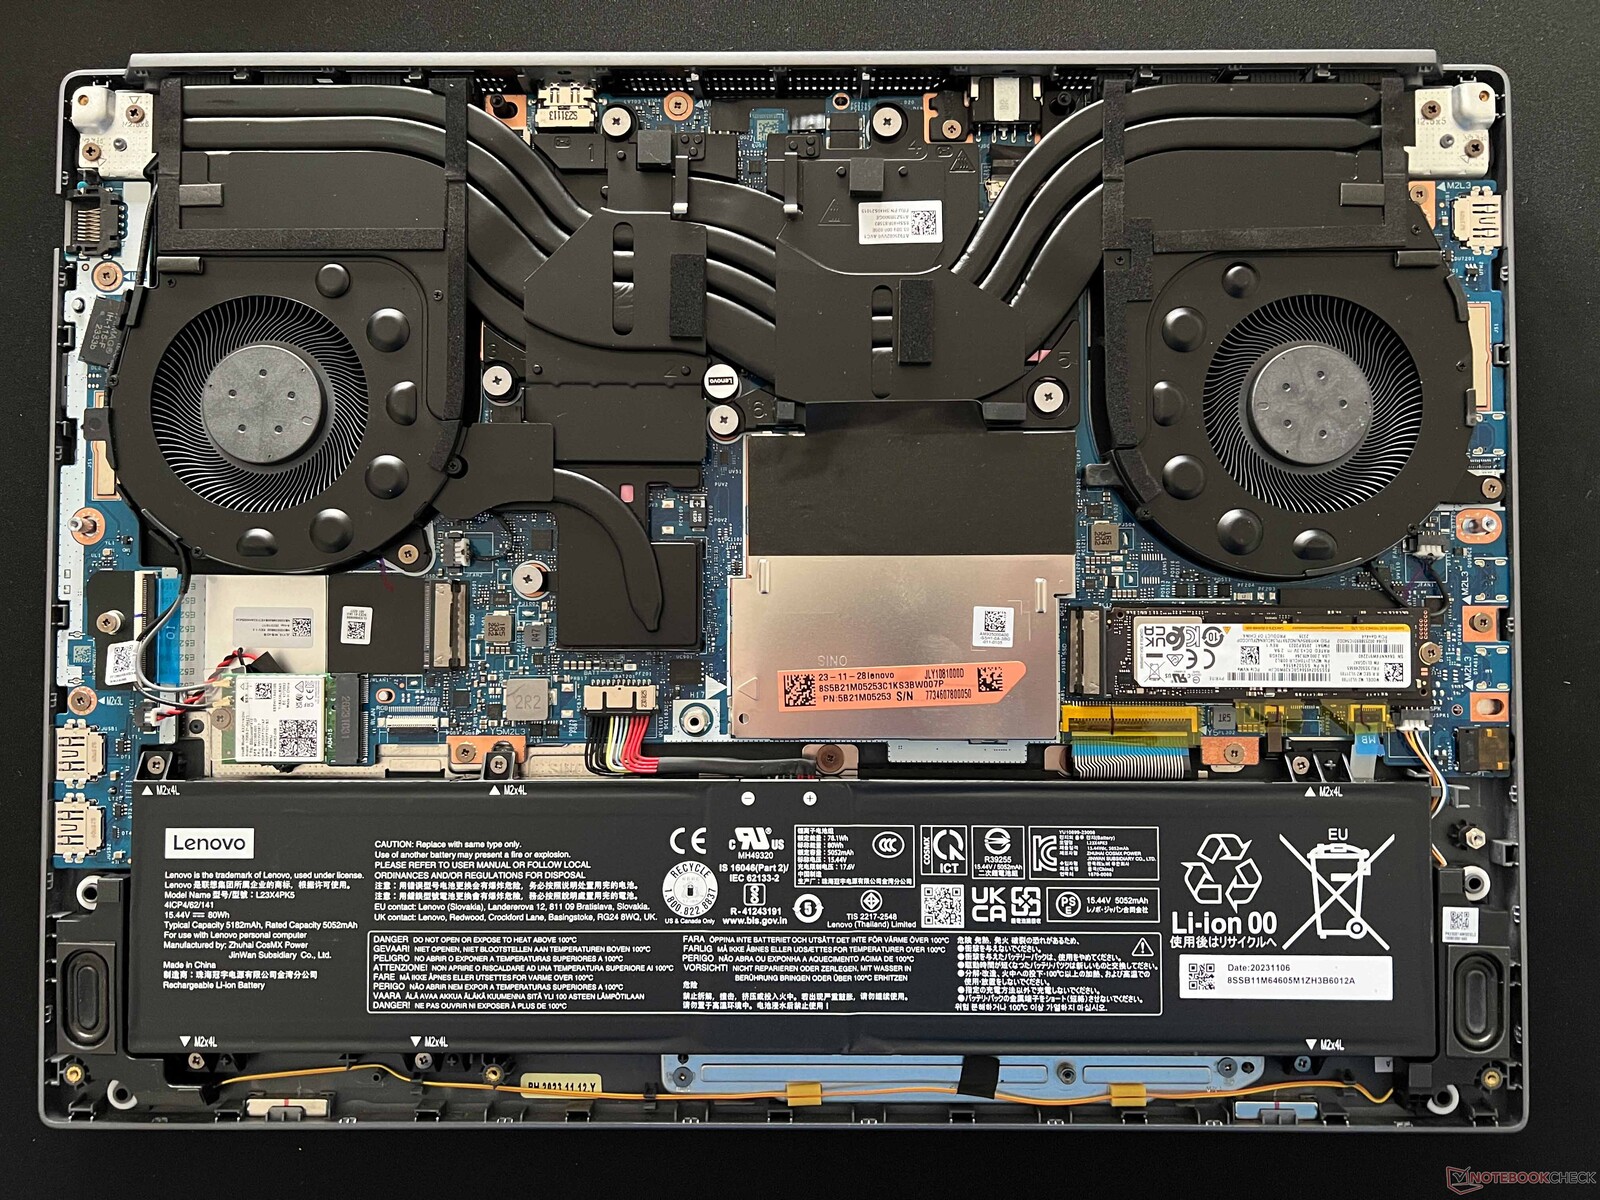
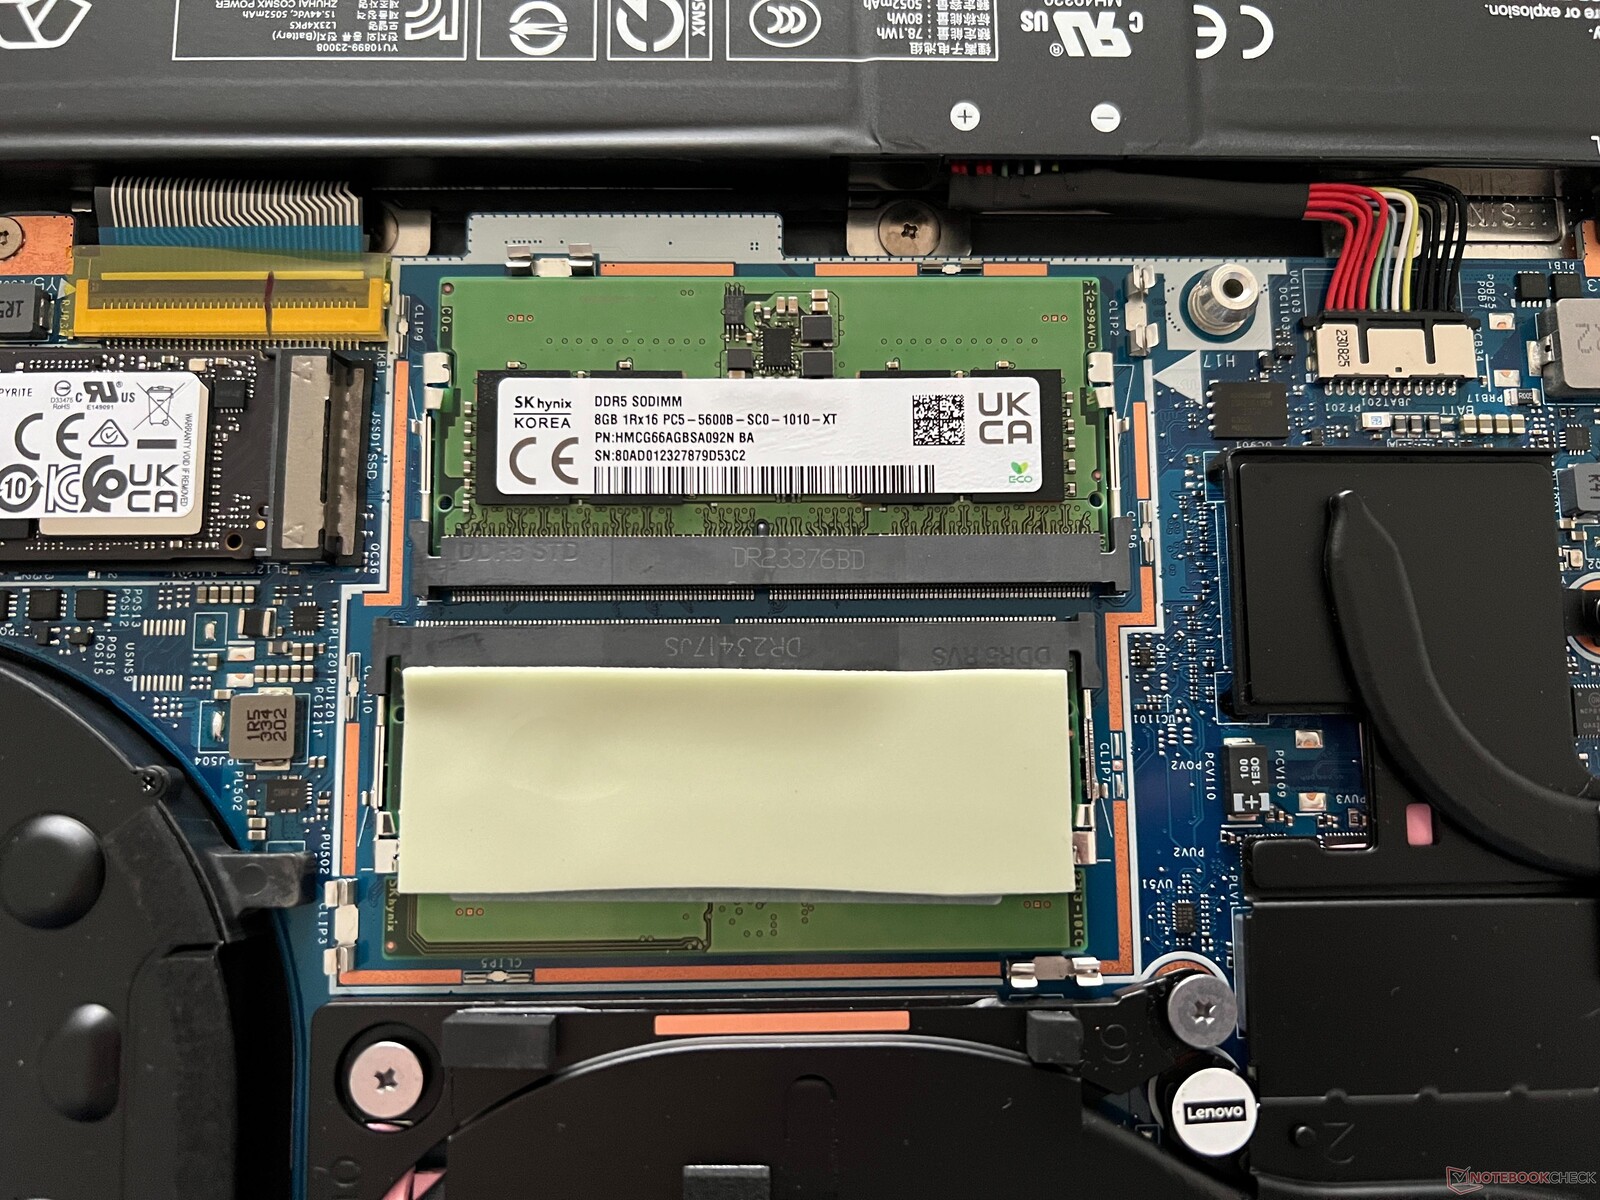
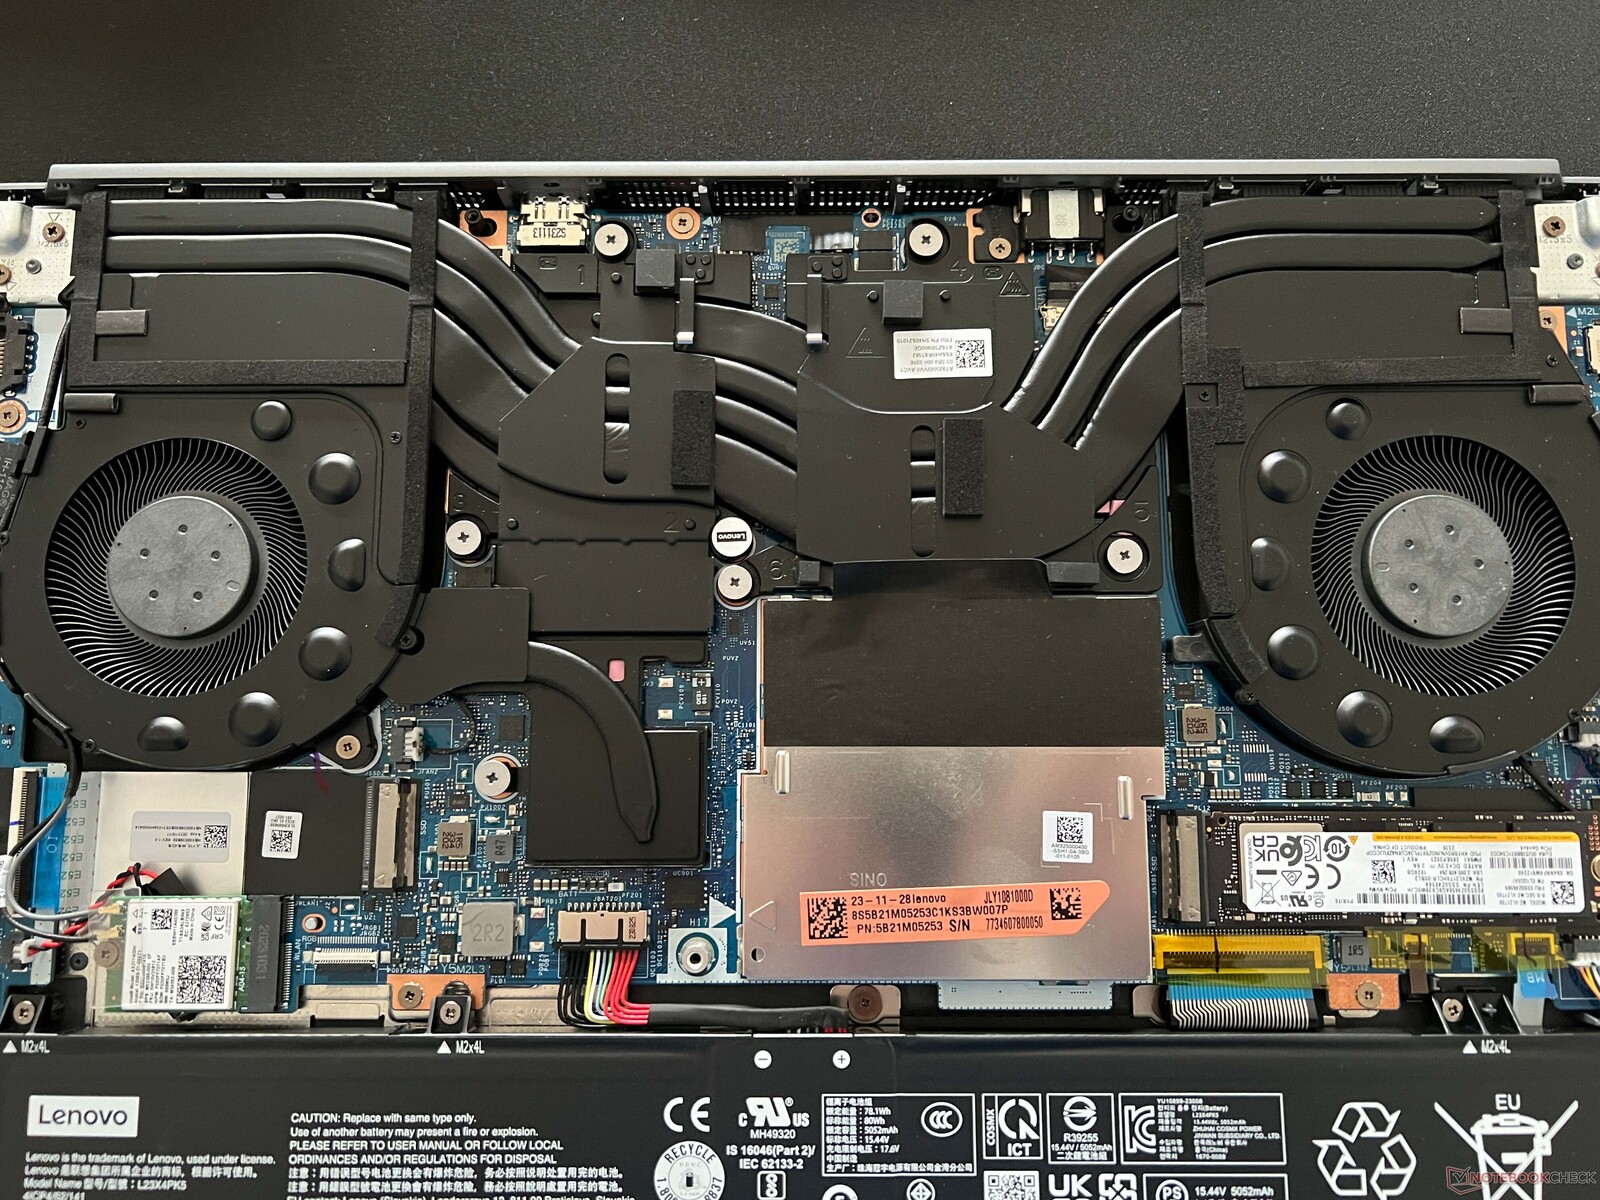
A parte inferior do gabinete é conectada por meio de parafusos de cabeça cruzada normais, mas ainda fica firme quando eles são removidos. O senhor deve usar uma ferramenta adequada para ajudar a abri-la. Na parte interna, as opções de manutenção do laptop são boas, pois além dos dois slots de RAM, ele também possui dois slots para SSDs M.2-2280. O módulo WLAN e a bateria (aparafusada) também podem ser trocados.
Dispositivos de entrada - elevador de 1,5 mm sem iluminação RGB
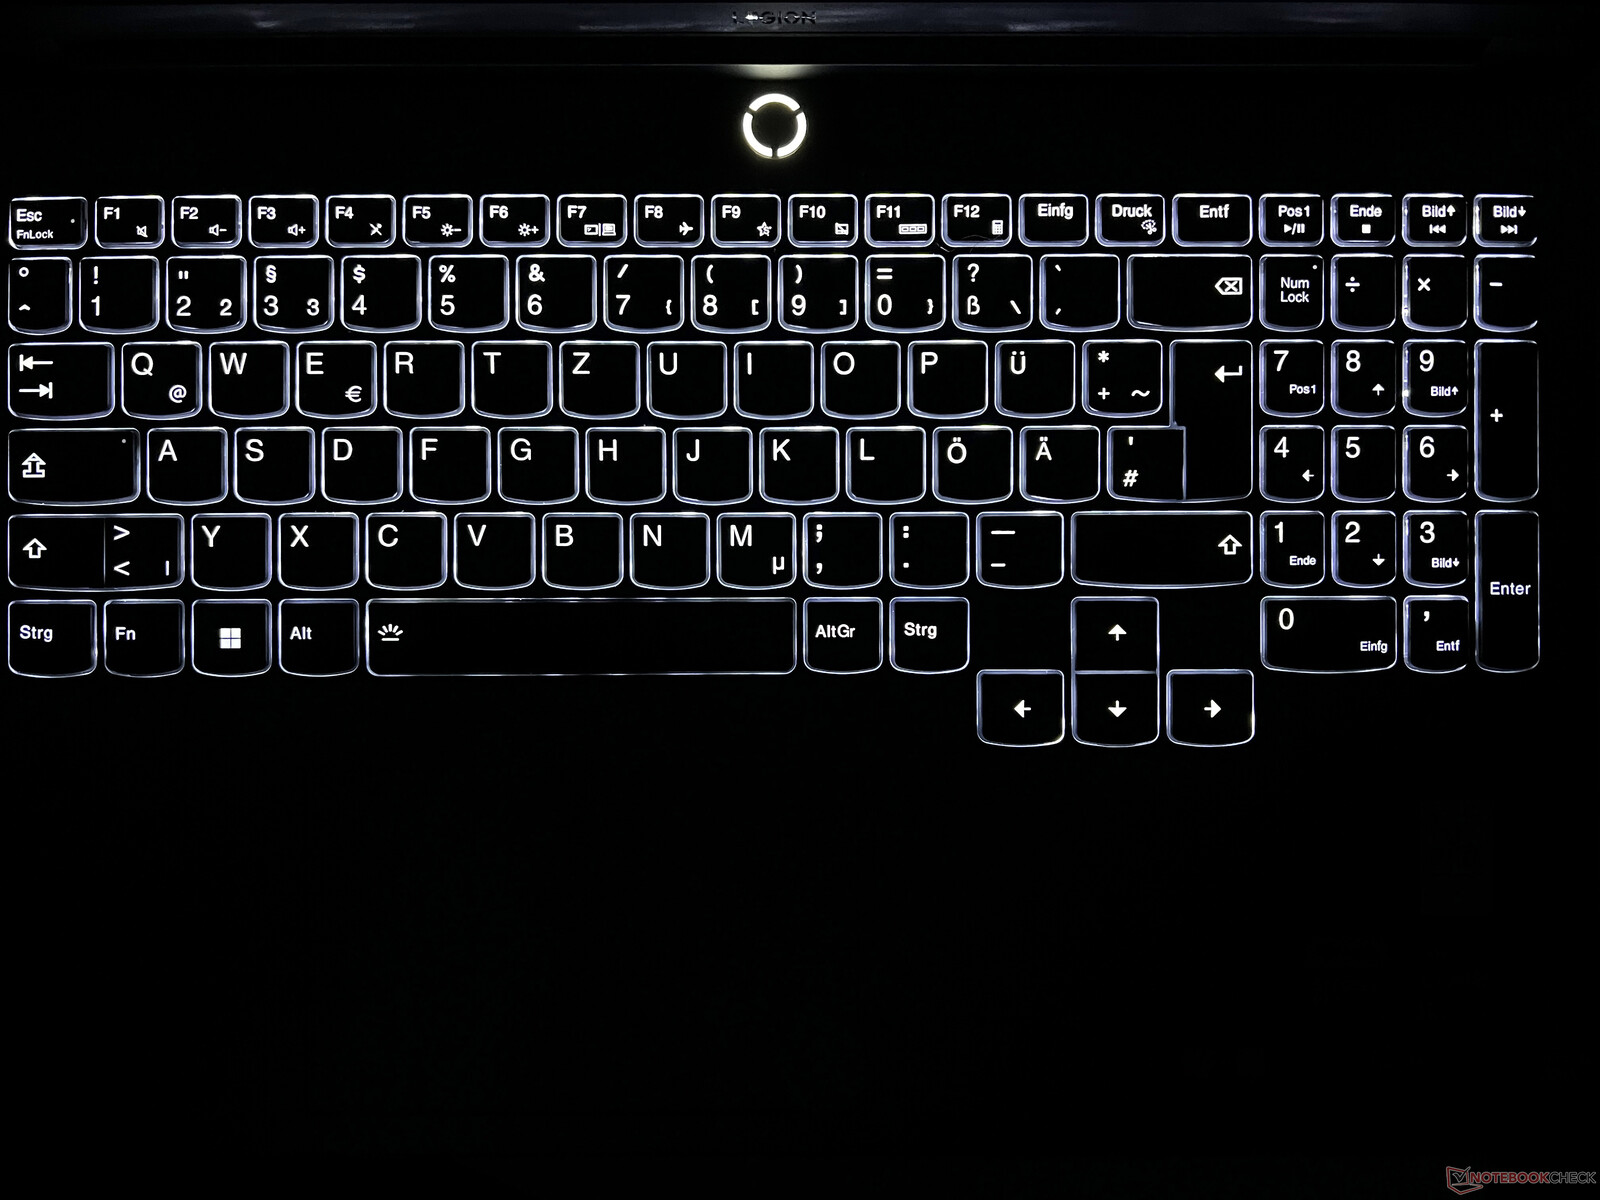
O teclado preto, que inclui um teclado numérico dedicado e teclas de seta deslocadas, é um teclado que já conhecemos de outros modelos do Legion. Suas teclas têm uma elevação de 1,5 mm e, no total, é confortável digitar nelas. Além dos jogos, também não há problema em digitar textos mais longos nesse teclado. Nossa configuração de teste é equipada com um teclado retroiluminado com duas configurações de brilho; o senhor pode optar por um com retroiluminação colorida de 4 zonas.
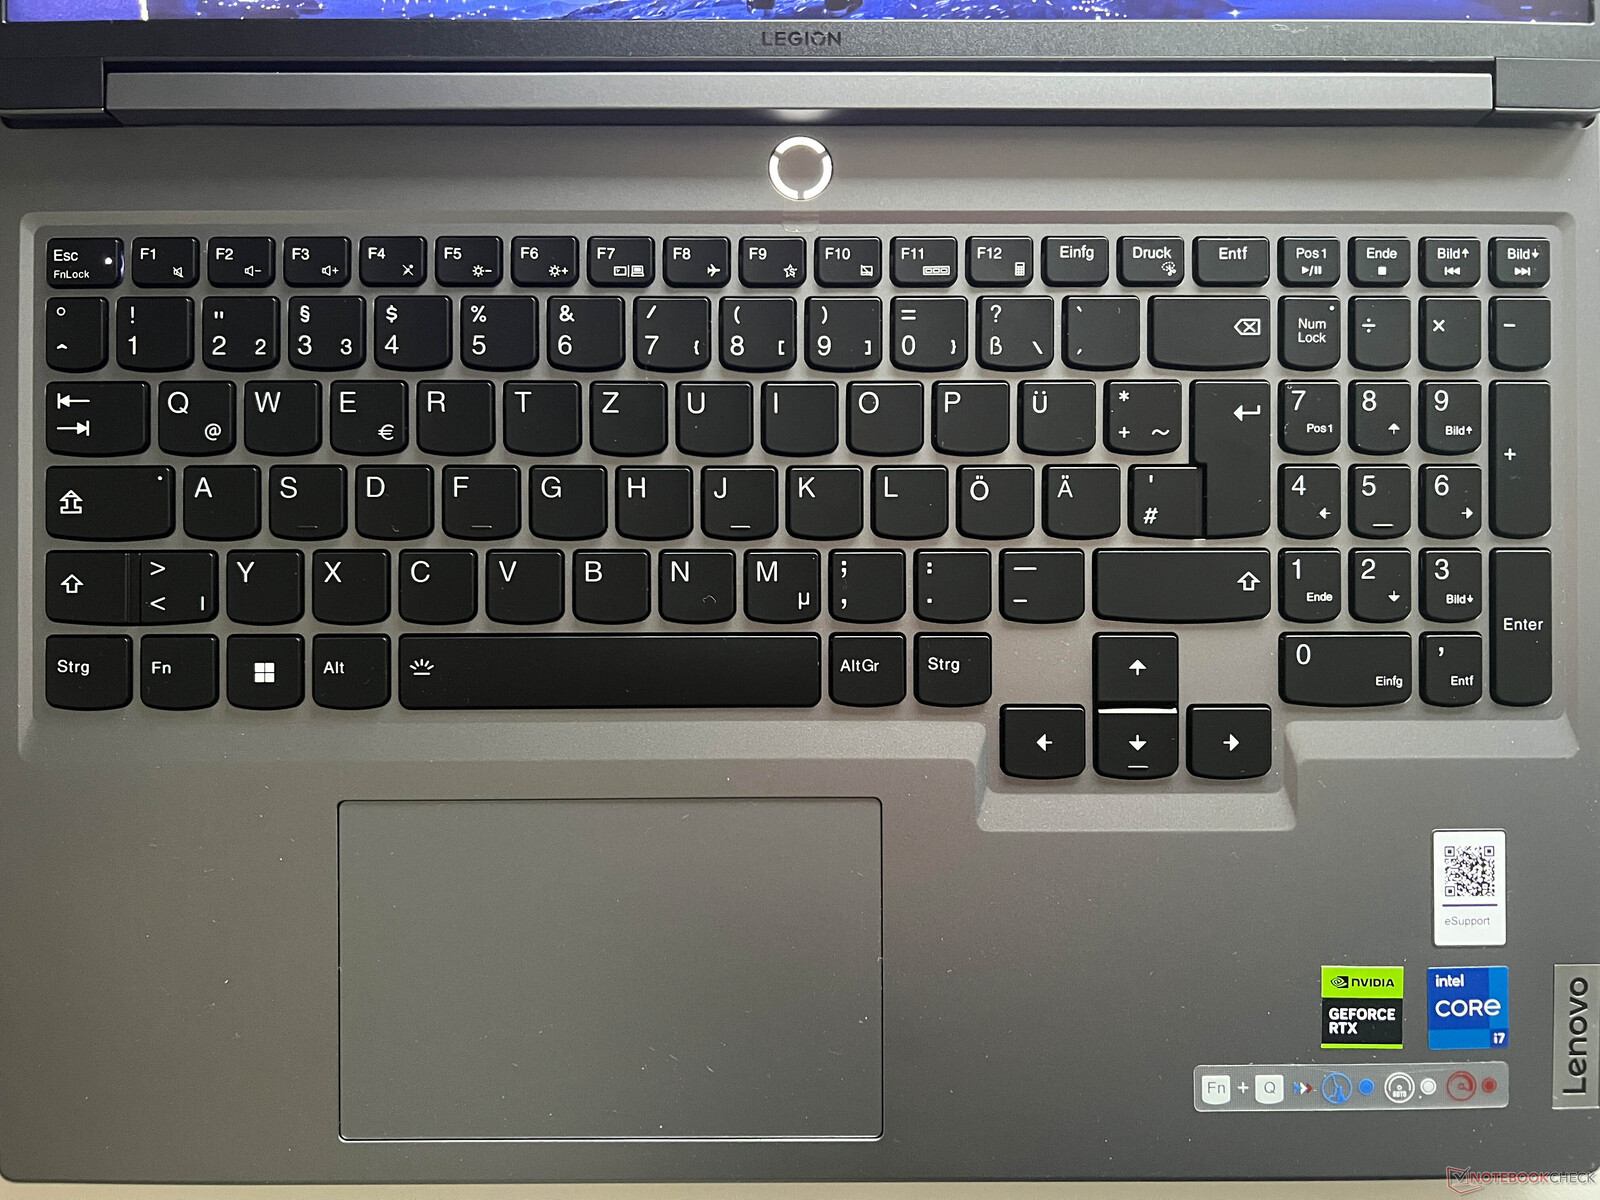
O clickpad está posicionado ligeiramente à esquerda e seu tamanho (12 x 7,5 cm) é perfeito para a operação normal do ponteiro, que também funciona perfeitamente bem. A parte inferior do teclado pode ser pressionada para baixo, o que, infelizmente, provoca um ruído alto. Durante os jogos, a maioria dos usuários usa um gamepad ou um mouse de qualquer forma. Eles podem ser conectados em ambos os lados do dispositivo.
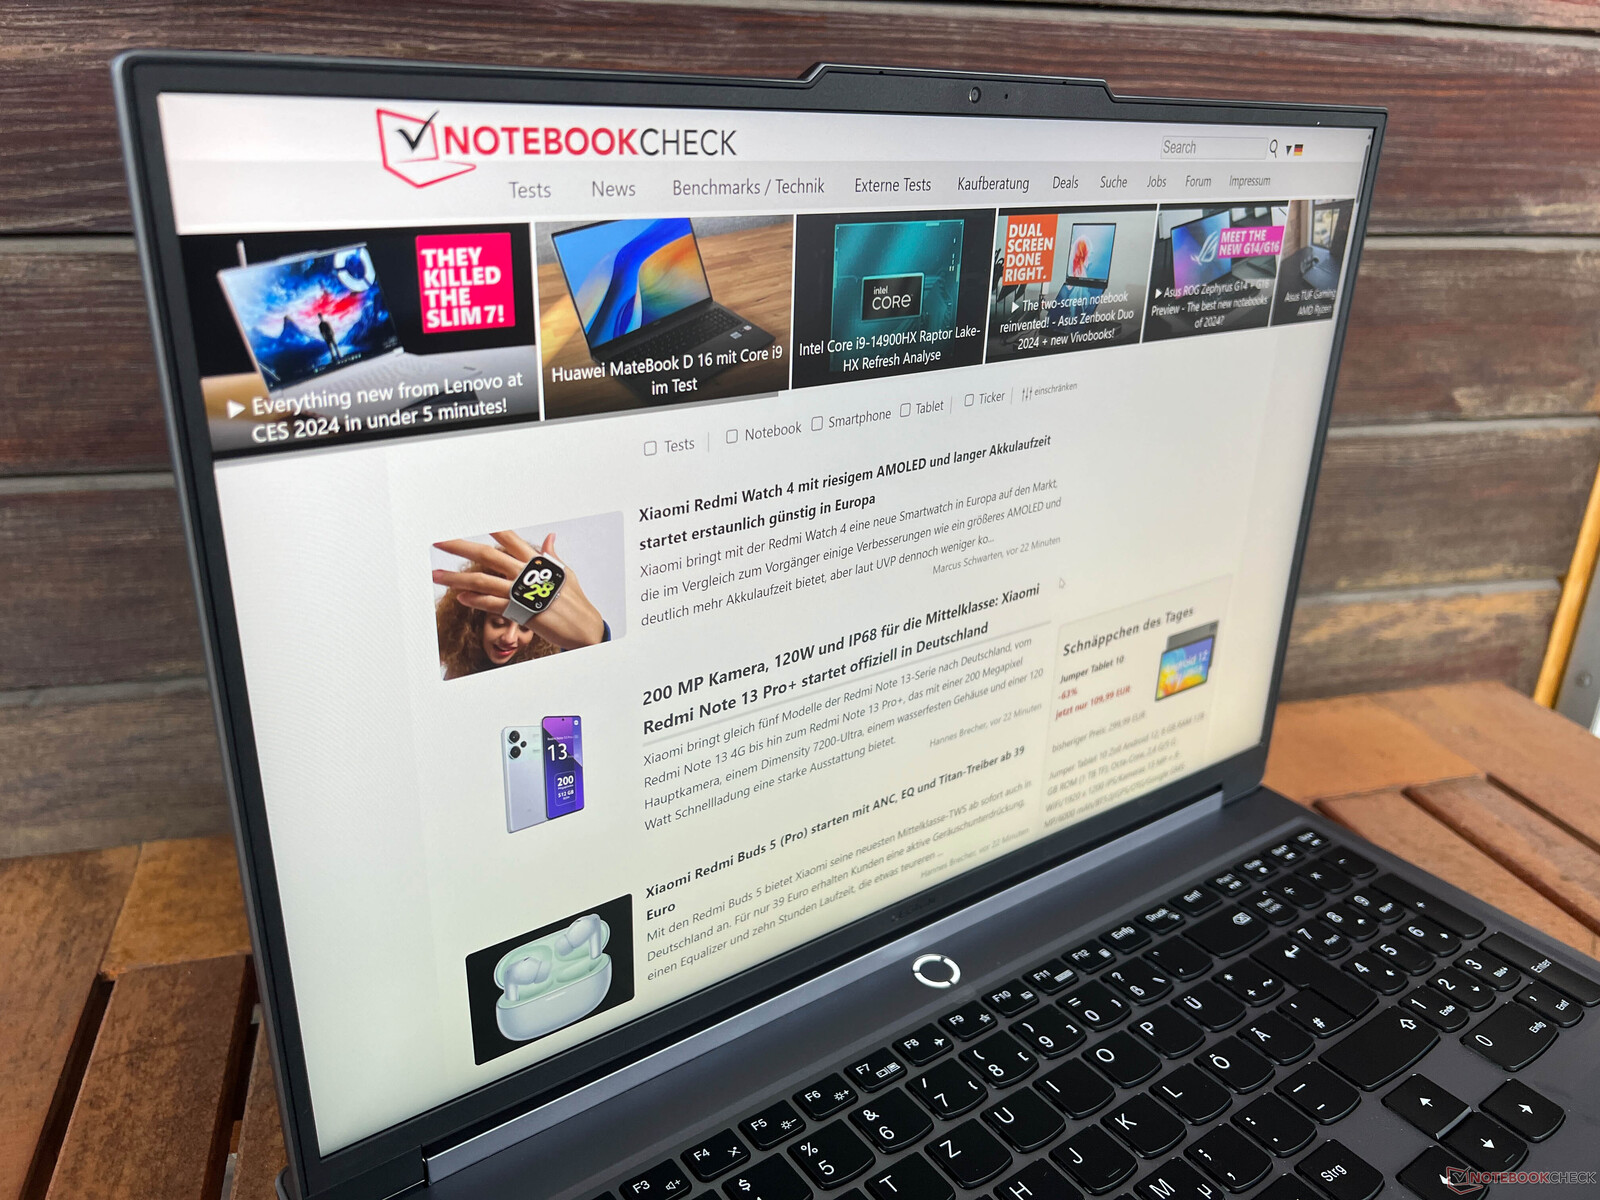
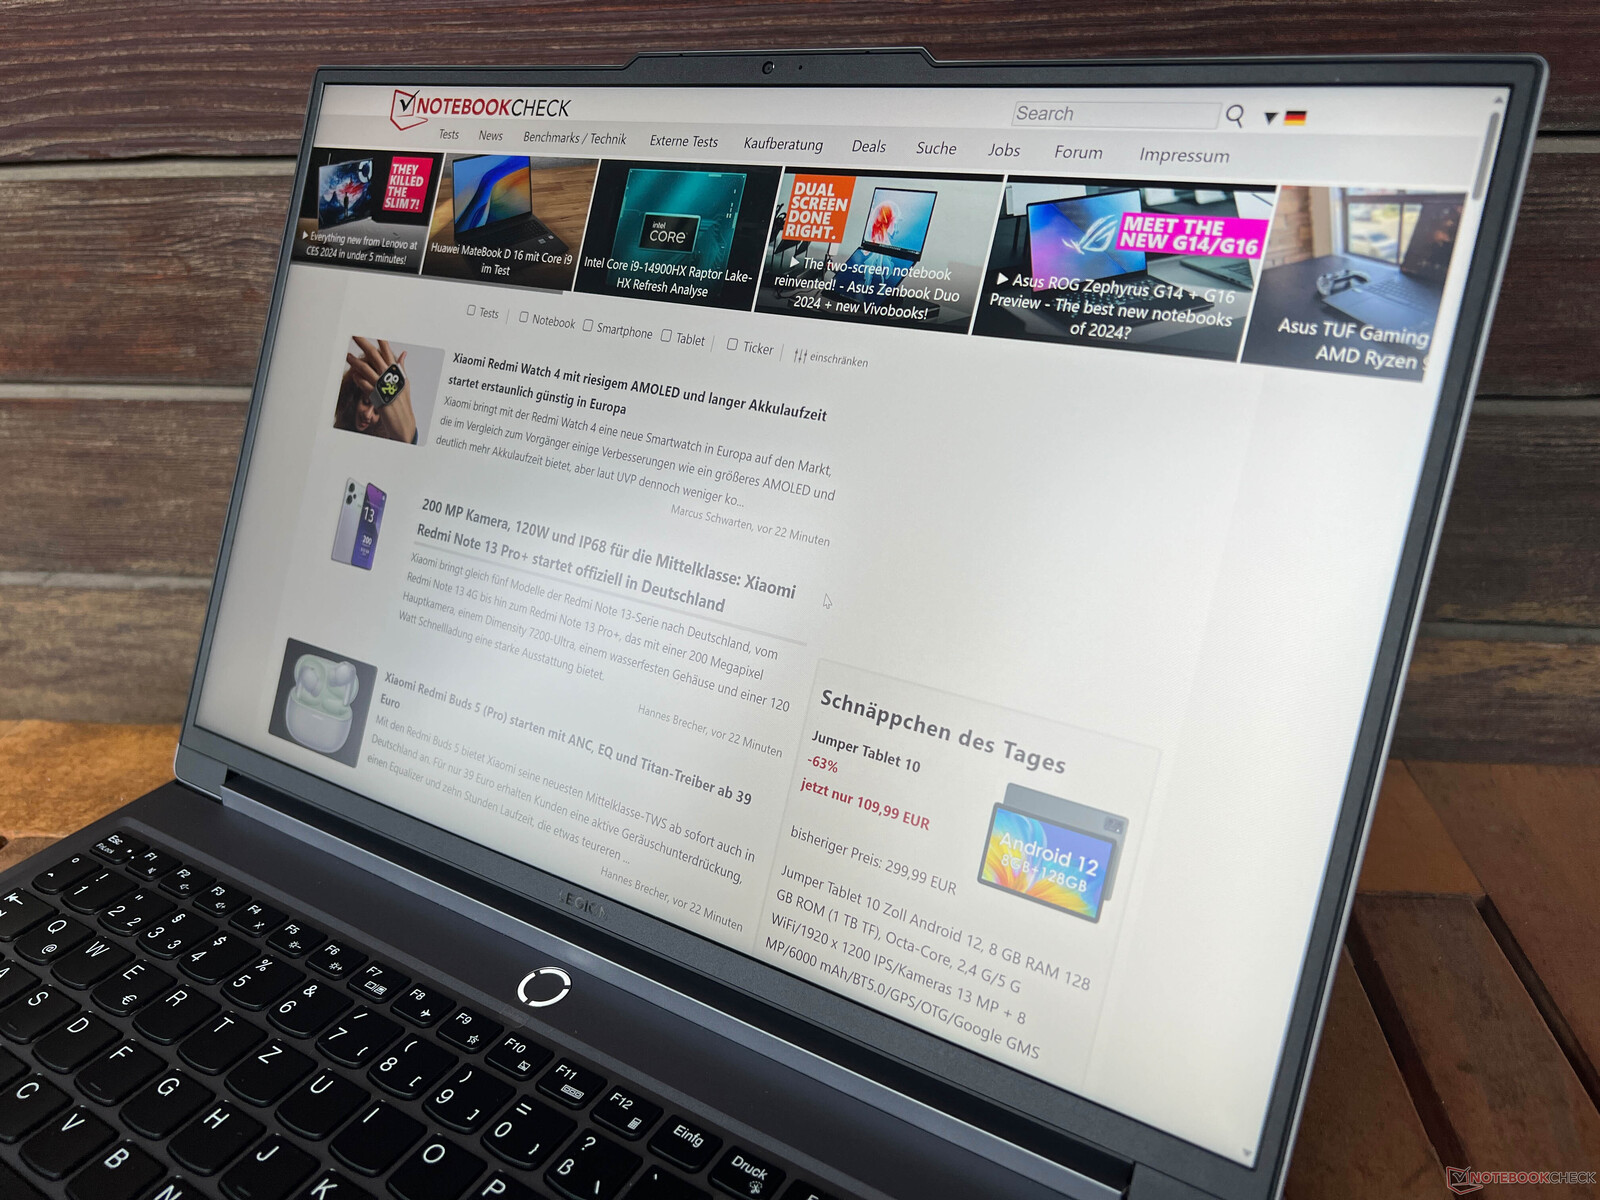
Tela - IPS de 240 Hz

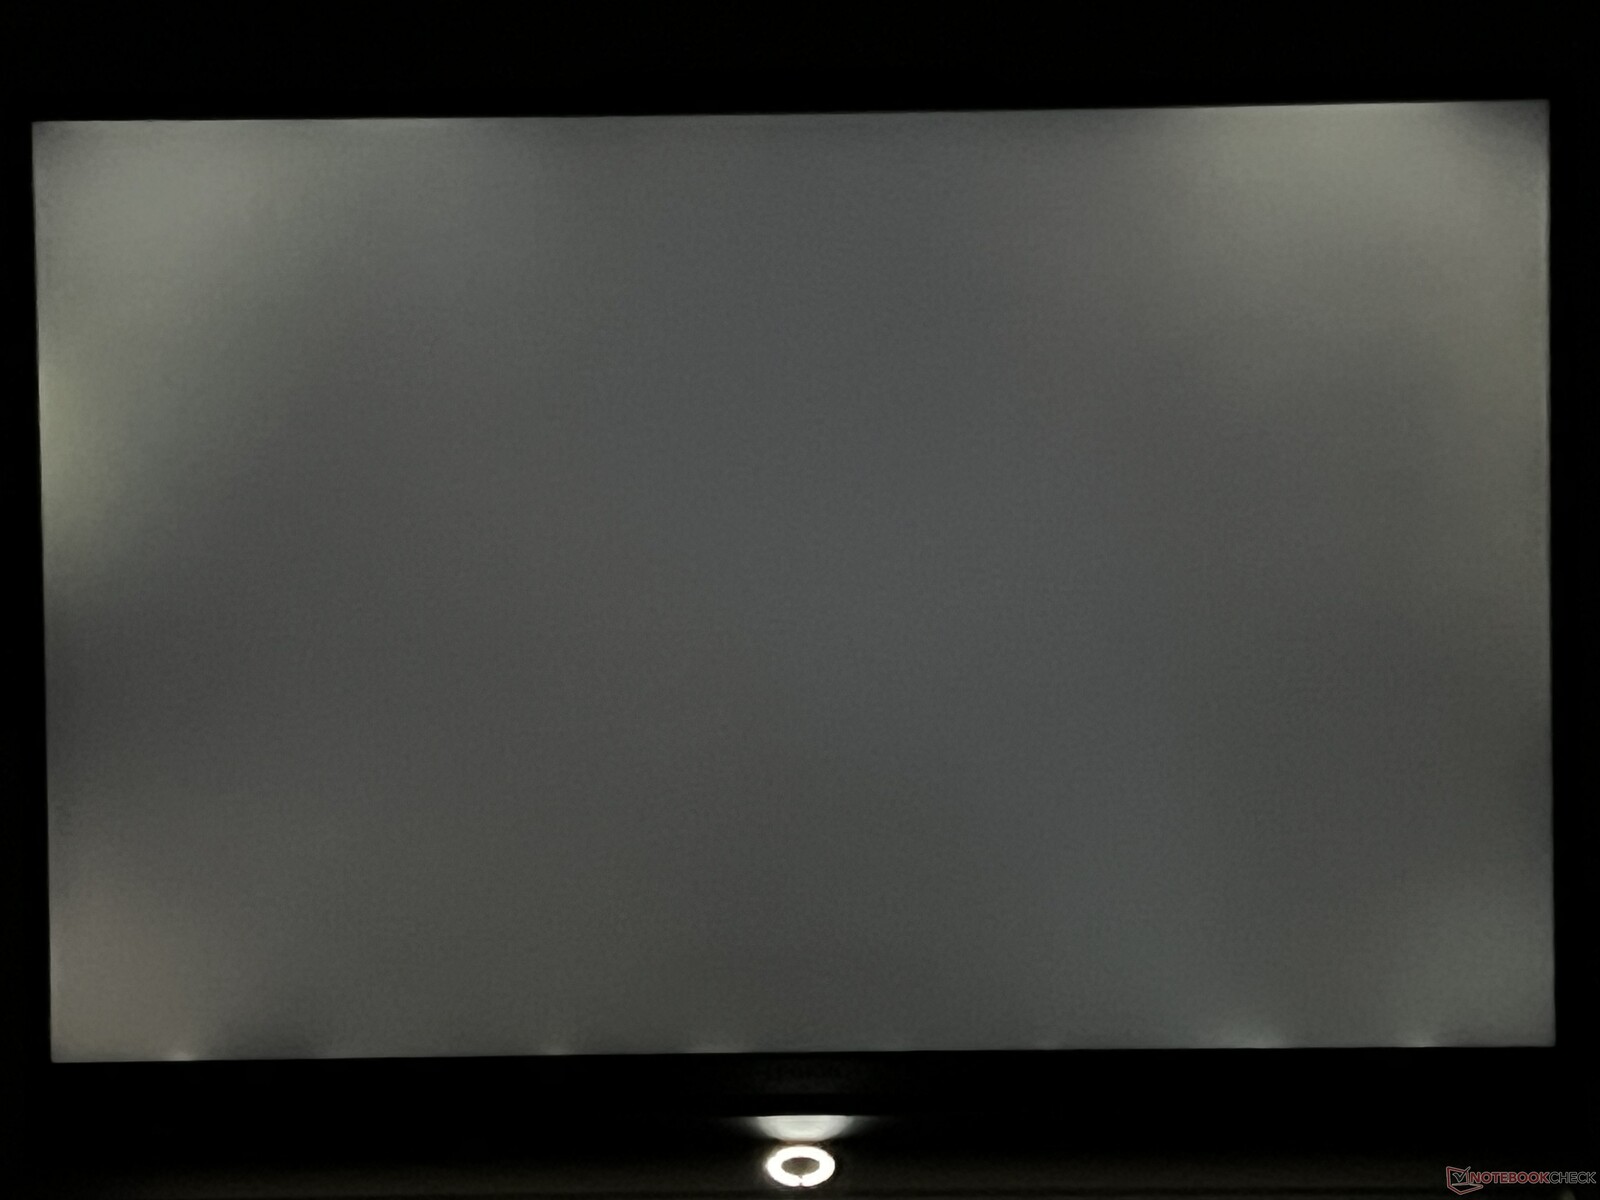
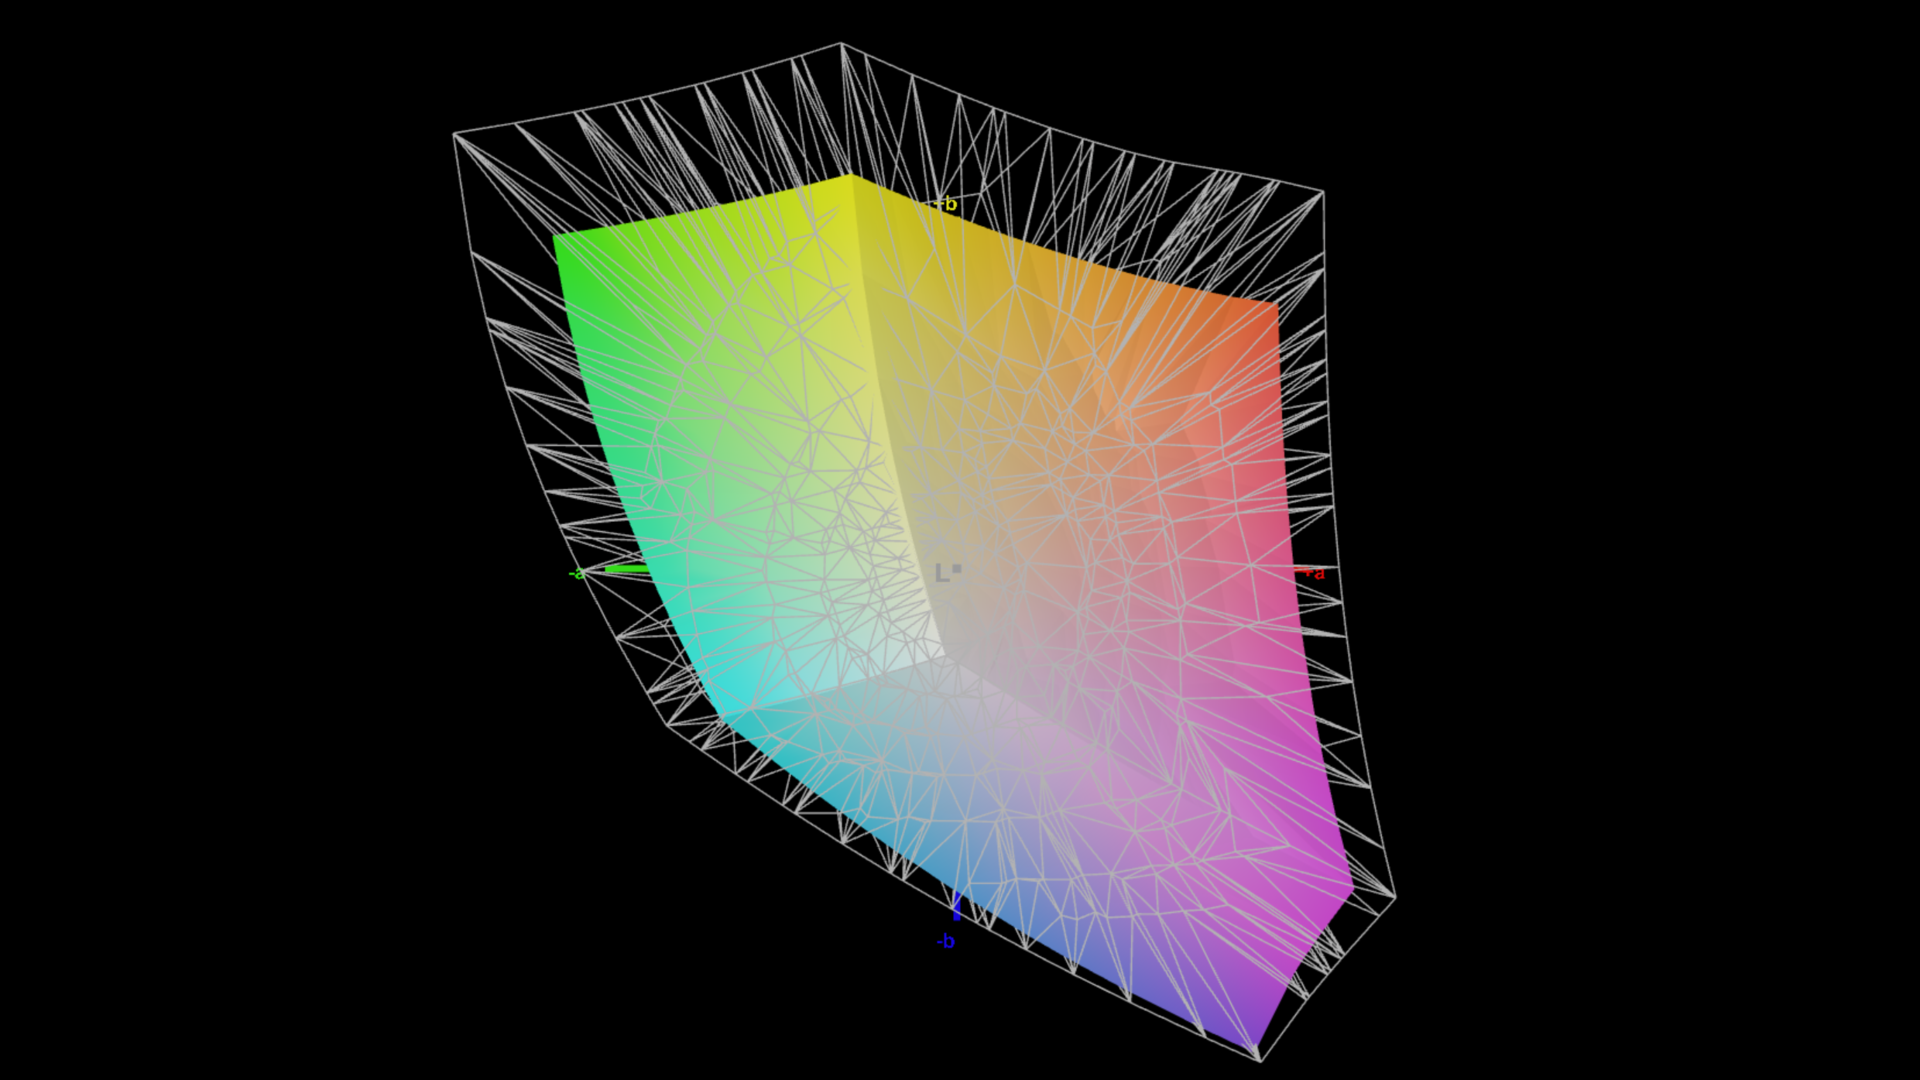
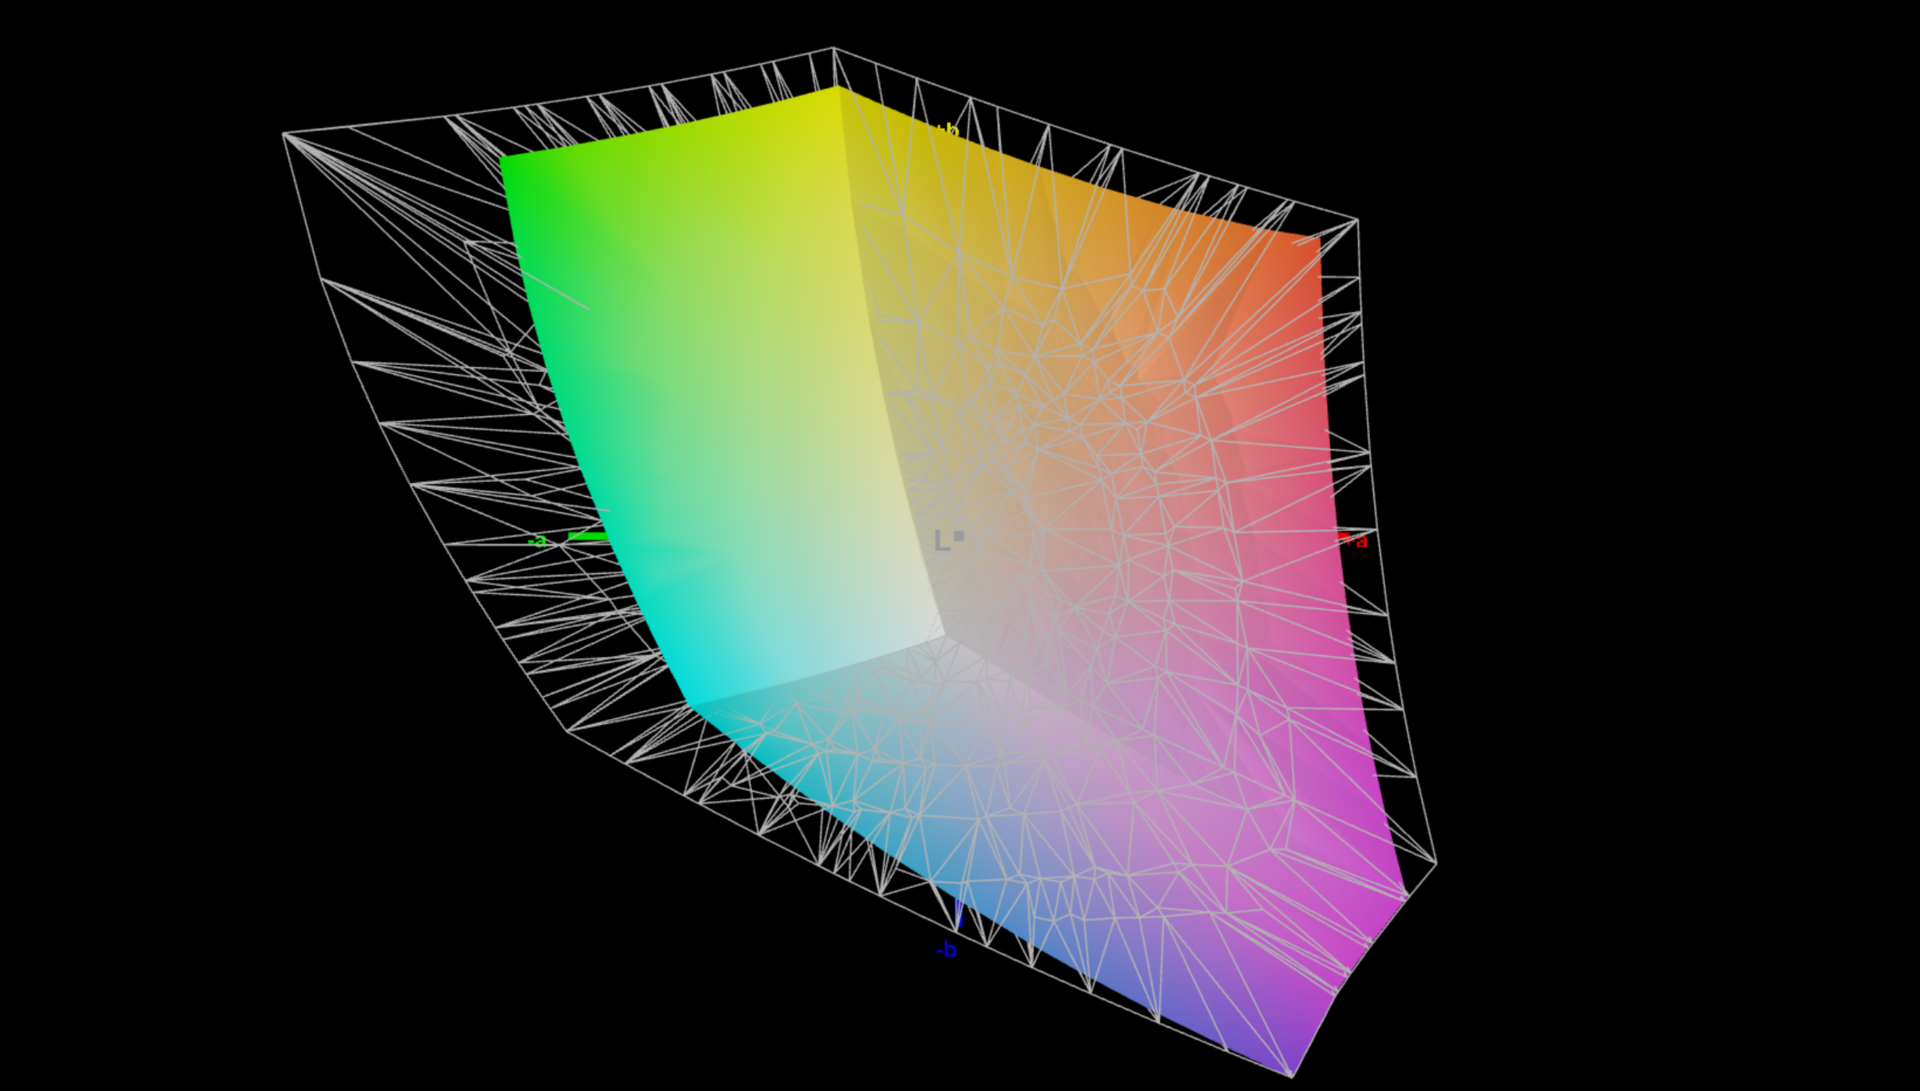
A Lenovo oferece duas telas WQXGA foscas diferentes com resolução de 2.560 x 1.600 pixels. Ao lado de uma versão com taxa de atualização de 165 Hz e brilho de 300 nits, o senhor também pode selecionar uma variante mais brilhante de 500 nits com taxa de atualização de 240 Hz. Essa última também suporta HDR e é a que foi instalada em nosso dispositivo de teste. Subjetivamente, a tela parece ótima; o conteúdo parece muito nítido, as cores são vivas e mesmo as áreas mais claras não parecem granuladas. No entanto, é possível notar alguns halos claros quando se olha para imagens escuras com o brilho aumentado.
Nosso painel atingiu um máximo de 528 cd/m² e uma média de 500 cd/m², o que significa que sua meta foi atingida. Seu valor de preto de 0,33 é aceitável e sua taxa de contraste máxima é superior a 1.500:1. As velocidades de reação da tela são rápidas e estão no mesmo nível de outros concorrentes IPS. Em suma, a tela é adequada para jogos e seus valores são melhores do que os da concorrência. O conteúdo HDR também é suportado (mas o HDR precisa ser ativado manualmente por meio das configurações do Windows).
| |||||||||||||||||||||||||
iluminação: 87 %
iluminação com acumulador: 519 cd/m²
Contraste: 1594:1 (Preto: 0.33 cd/m²)
ΔE ColorChecker Calman: 1.2 | ∀{0.5-29.43 Ø4.73}
calibrated: 1
ΔE Greyscale Calman: 1.3 | ∀{0.09-98 Ø4.97}
74.1% AdobeRGB 1998 (Argyll 3D)
100% sRGB (Argyll 3D)
72.4% Display P3 (Argyll 3D)
Gamma: 2.23
CCT: 6391 K
| Lenovo Legion 5 16IRX G9 NE160QDM-NZ3, IPS, 2560x1600, 16" | Schenker XMG CORE 16 (L23) BOE0AF0 (), IPS, 2560x1600, 16" | HP Victus 16-r0077ng CMN162D, IPS, 1920x1080, 16.1" | Lenovo LOQ 16IRH8 AUOC1A5 (B160QAN03.L), IPS, 2560x1600, 16" | Lenovo Legion Slim 5 16APH8 BOE NJ NE160QDM-NYC, IPS, 2560x1600, 16" | HP Victus 16-r0076TX Chi Mei CMN1629, IPS, 1920x1080, 16.1" | Alienware m16 R1 Intel BOE NE16NYB, IPS, 2560x1600, 16" | Lenovo Legion Pro 5 16IRX8 AU Optronics B160QAN03.1, IPS, 2560x1600, 16" | |
|---|---|---|---|---|---|---|---|---|
| Display | -4% | -6% | -2% | -3% | -5% | -5% | -1% | |
| Display P3 Coverage (%) | 72.4 | 68.3 -6% | 66.7 -8% | 70.5 -3% | 69.3 -4% | 67.5 -7% | 67.7 -6% | 71.2 -2% |
| sRGB Coverage (%) | 100 | 98.6 -1% | 98 -2% | 98.9 -1% | 100 0% | 97.5 -2% | 97.2 -3% | 98.8 -1% |
| AdobeRGB 1998 Coverage (%) | 74.1 | 69.6 -6% | 69 -7% | 72.6 -2% | 70 -6% | 69.7 -6% | 70 -6% | 73.3 -1% |
| Response Times | 9% | 0% | 29% | 12% | 32% | 42% | -18% | |
| Response Time Grey 50% / Grey 80% * (ms) | 12.5 ? | 13.2 ? -6% | 13.3 ? -6% | 7.2 ? 42% | 10.7 ? 14% | 6.18 ? 51% | 4 ? 68% | 14.5 ? -16% |
| Response Time Black / White * (ms) | 8.7 ? | 6.6 ? 24% | 8.2 ? 6% | 7.4 ? 15% | 7.8 ? 10% | 7.62 ? 12% | 7.3 ? 16% | 10.4 ? -20% |
| PWM Frequency (Hz) | ||||||||
| Screen | -67% | -16% | -24% | -14% | -21% | -51% | -20% | |
| Brightness middle (cd/m²) | 526 | 376 -29% | 308 -41% | 407 -23% | 371.6 -29% | 290 -45% | 306 -42% | 405.7 -23% |
| Brightness (cd/m²) | 500 | 358 -28% | 285 -43% | 369 -26% | 343 -31% | 275 -45% | 302 -40% | 368 -26% |
| Brightness Distribution (%) | 87 | 88 1% | 85 -2% | 85 -2% | 84 -3% | 82 -6% | 89 2% | 87 0% |
| Black Level * (cd/m²) | 0.33 | 0.33 -0% | 0.25 24% | 0.45 -36% | 0.44 -33% | 0.21 36% | 0.3 9% | 0.38 -15% |
| Contrast (:1) | 1594 | 1139 -29% | 1232 -23% | 904 -43% | 845 -47% | 1381 -13% | 1020 -36% | 1068 -33% |
| Colorchecker dE 2000 * | 1.2 | 2.74 -128% | 1.3 -8% | 1.43 -19% | 1.52 -27% | 1.7 -42% | 2.57 -114% | 1.65 -38% |
| Colorchecker dE 2000 max. * | 2.1 | 6.78 -223% | 2.76 -31% | 3.58 -70% | 2.68 -28% | 3.57 -70% | 4.26 -103% | 4.2 -100% |
| Colorchecker dE 2000 calibrated * | 1 | 0.88 12% | 0.92 8% | 1.07 -7% | 0.33 67% | 0.93 7% | 0.85 15% | 0.53 47% |
| Greyscale dE 2000 * | 1.3 | 3.57 -175% | 1.7 -31% | 1.13 13% | 1.2 8% | 1.5 -15% | 3.3 -154% | 1.2 8% |
| Gamma | 2.23 99% | 2.4 92% | 2.167 102% | 2.5 88% | 2.1 105% | 2.1 105% | 1.997 110% | 2.3 96% |
| CCT | 6391 102% | 7246 90% | 6767 96% | 6526 100% | 6503 100% | 6538 99% | 6895 94% | 6453 101% |
| Média Total (Programa/Configurações) | -21% /
-42% | -7% /
-12% | 1% /
-12% | -2% /
-8% | 2% /
-10% | -5% /
-28% | -13% /
-16% |
* ... menor é melhor
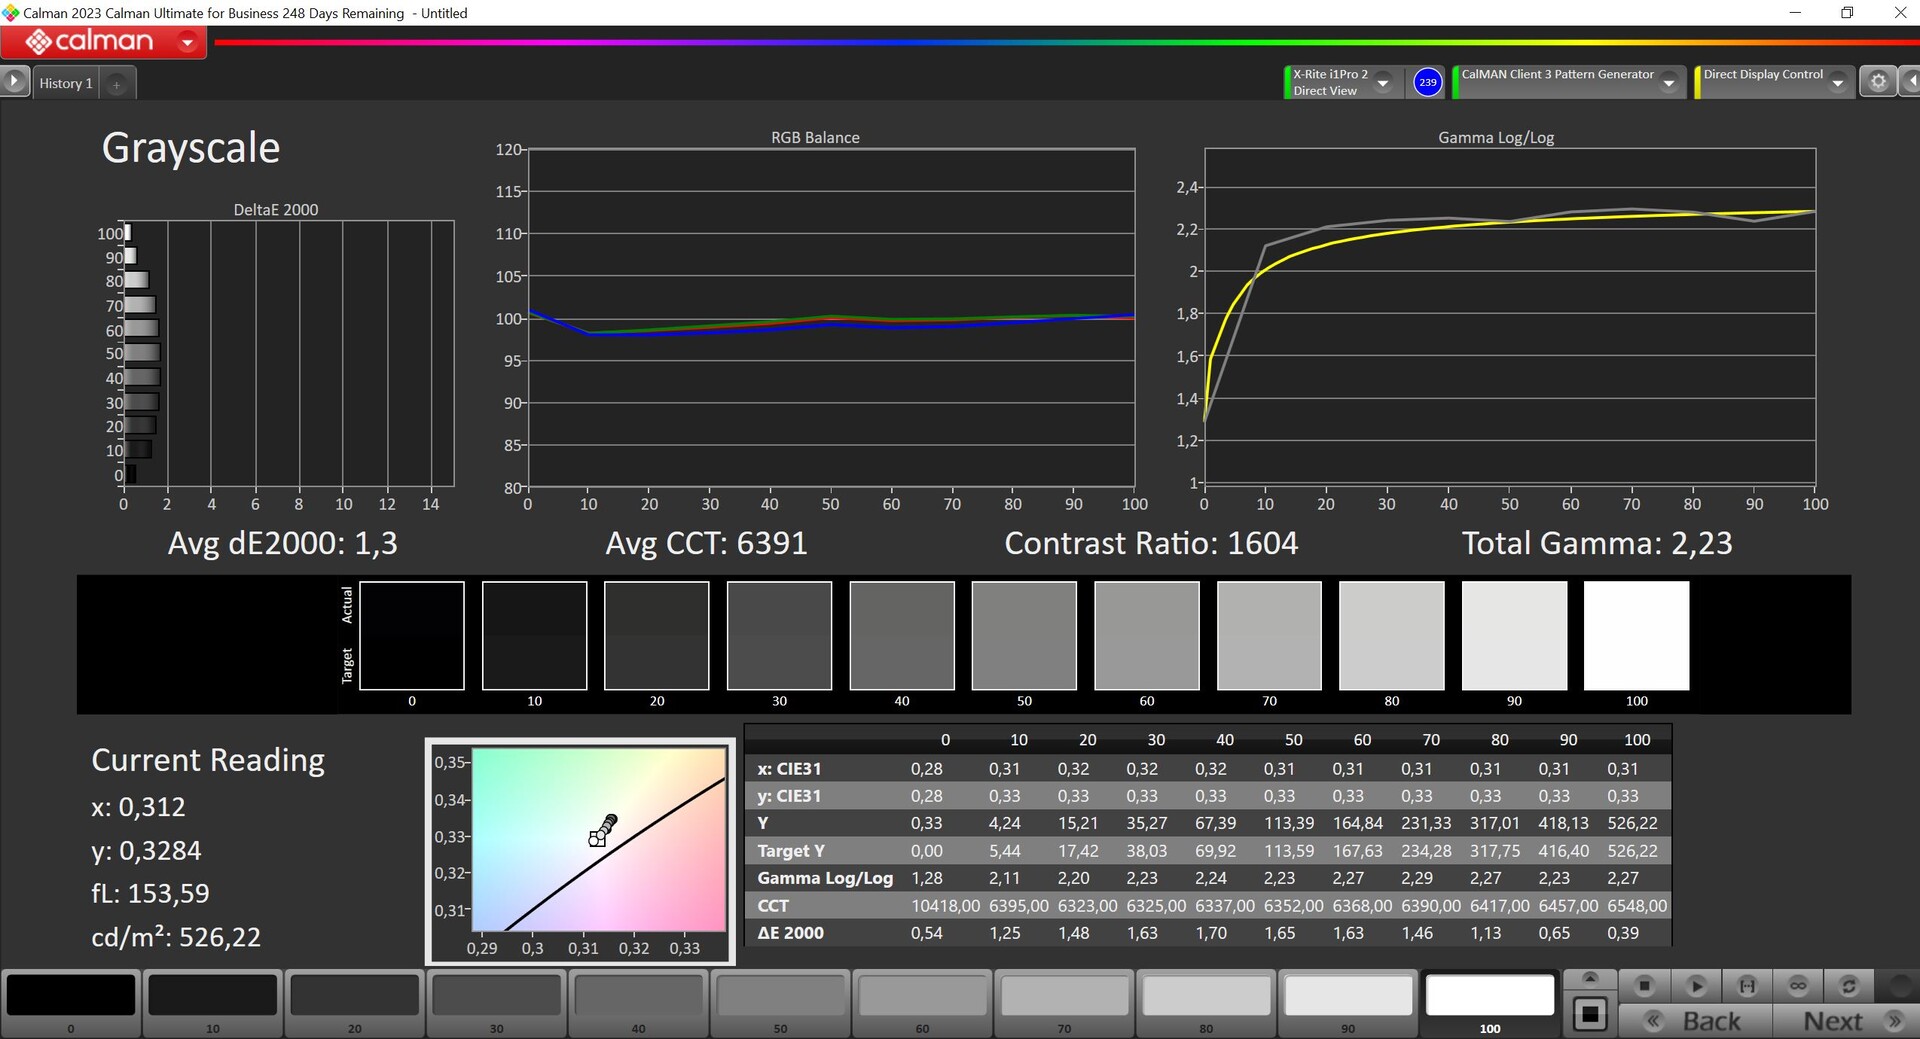


Ex works, a tela do Legion 5i vem pré-calibrada e há alguns perfis de cores diferentes disponíveis. Nós o analisamos usando o software profissional CalMAN (X-Rite i1 Pro2) usando o perfil "nativo". Sua representação já é excelente, pois nem a escala de cinza nem as cores mostram desvios do DeltaE-2000 acima de 3. Além disso, não notamos nenhuma tonalidade de cor e uma calibração do usuário poderia até ser supérflua. Talvez tenhamos conseguido melhorar a qualidade da representação com nossa própria calibração (que pode ser baixada gratuitamente mais acima), mas isso é apenas mensurável, não visível. Juntamente com sua cobertura sRGB completa, o painel pode ser usado com confiança para editar fotos ou vídeos.
Exibir tempos de resposta
| ↔ Tempo de resposta preto para branco | ||
|---|---|---|
| 8.7 ms ... ascensão ↗ e queda ↘ combinadas | ↗ 4.6 ms ascensão | 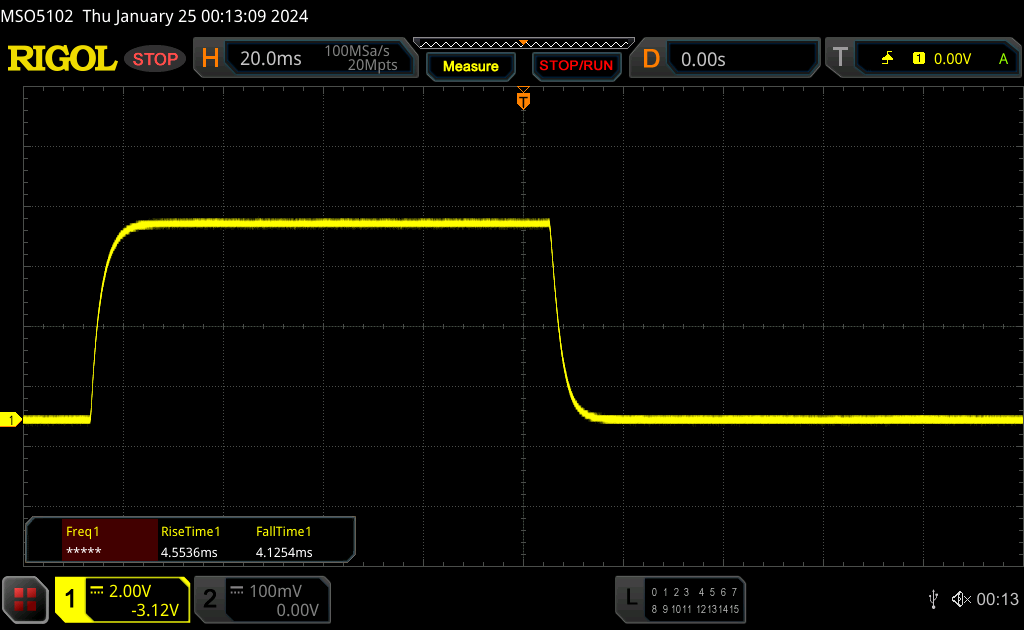 |
| ↘ 4.1 ms queda | ||
| A tela mostra taxas de resposta rápidas em nossos testes e deve ser adequada para jogos. Em comparação, todos os dispositivos testados variam de 0.1 (mínimo) a 240 (máximo) ms. » 24 % de todos os dispositivos são melhores. Isso significa que o tempo de resposta medido é melhor que a média de todos os dispositivos testados (19.9 ms). | ||
| ↔ Tempo de resposta 50% cinza a 80% cinza | ||
| 12.5 ms ... ascensão ↗ e queda ↘ combinadas | ↗ 6.1 ms ascensão | 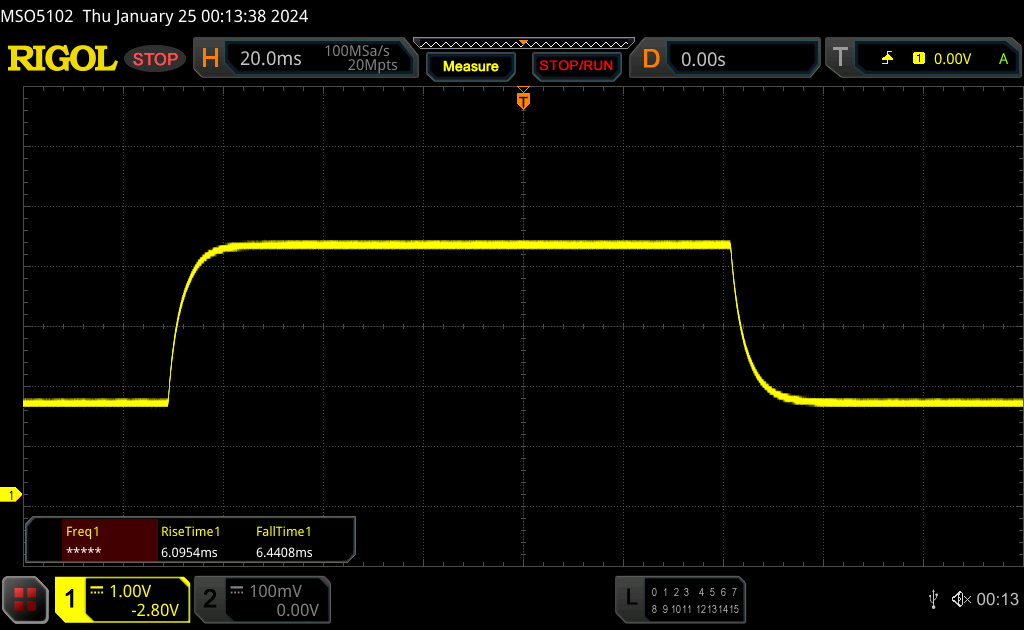 |
| ↘ 6.4 ms queda | ||
| A tela mostra boas taxas de resposta em nossos testes, mas pode ser muito lenta para jogadores competitivos. Em comparação, todos os dispositivos testados variam de 0.165 (mínimo) a 636 (máximo) ms. » 26 % de todos os dispositivos são melhores. Isso significa que o tempo de resposta medido é melhor que a média de todos os dispositivos testados (31.1 ms). | ||
Cintilação da tela / PWM (modulação por largura de pulso)
| Tela tremeluzindo / PWM não detectado |  | ||
[pwm_comparison] Em comparação: 52 % de todos os dispositivos testados não usam PWM para escurecer a tela. Se PWM foi detectado, uma média de 7798 (mínimo: 5 - máximo: 343500) Hz foi medida. | |||

Graças ao alto brilho e à superfície fosca da tela, o Legion 5i 16 pode ser usado muito bem em ambientes externos ou claros. A estabilidade do ângulo de visão do IPS é boa, mas a visualização na diagonal acima faz com que a imagem fique um pouco mais clara.

Desempenho - Raptor Lake-HX Refresh e Ada Lovelace
A Lenovo oferece o Legion 5i 16 G9 com cinco processadores HX diferentes da Intel, embora as duas variantes mais fracas ainda pertençam à 13ª geração do ano passado. O carro-chefe pode ser equipado com um Core i9-14900HX, na melhor das hipóteses, e nossa amostra de teste apresenta o Core i7-14650HX. As placas de vídeo disponíveis incluem os modelos atuais da Nvidia GeForce RTX 4050 Laptop, 4060 Laptop e 4070 Laptop com um TGP máximo de 115 watts e um switch MUX para comutação de gráficos Advanced Optimus.
Condições de teste
A Lenovo oferece três modos de desempenho diferentes no aplicativo Vantage pré-instalado, bem como um modo personalizado que o usuário pode ajustar amplamente (limites de energia da CPU/GPU, limite de temperatura da CPU/GPU, aumento dinâmico da CPU/GPU). Portanto, o senhor pode brincar com esses modos o quanto quiser. Listamos os respectivos parâmetros das três configurações predefinidas na tabela abaixo(modo silencioso, modo equilibrado e modo de desempenho).
| Perfil de energia | Carga da CPU | CB R23 Multi | Carga da GPU | Time Spy gráficos | Cyberpunk 2077 QHD Ultra | emissões máximas do ventilador |
|---|---|---|---|---|---|---|
| Modo silencioso | 65->55 watts | 16.720 pontos | 65 watts | 8.443 pontos | 35,4 fps | 34,6 dB(A) |
| Modo balanceado | 120->70 watts | 19.897 pontos | 80 watts | 9.749 pontos | 43,4 fps | 49,8 dB(A) |
| Modo de desempenho | 140->100 watts | 24.455 pontos | 125 watts | 11.267 pontos | 49,7 fps | 55,7 dB(A) |
Realizamos os seguintes benchmarks e medições usando o modo de desempenho, pois o desempenho do dispositivo para jogos, em particular, é muito maior usando esse modo. É claro que as ventoinhas também acabam sendo mais barulhentas, mas mesmo no modo balanceado, as ventoinhas podem ficar muito altas durante os jogos e o usuário provavelmente precisará de um fone de ouvido, portanto, é melhor usar o modo de desempenho. Os perfis podem ser selecionados por meio da combinação de teclas Fn+Q, em que o LED de status colorido no botão liga/desliga mostra qual modo está em uso no momento (vermelho: desempenho, branco: equilibrado, azul: silencioso, roxo: ajustado). Durante as tarefas simples do dia a dia, o senhor pode usar facilmente o modo silencioso e, muitas vezes, desfrutar de um dispositivo totalmente silencioso. No uso da bateria, não é possível usar o modo de desempenho.
A Lenovo deu ao AI Engine+ do Legion 5i 16 seu próprio chip LA1 AI, que pode ser ativado em conjunto com o modo balanceado. Supostamente, ele reconhece automaticamente os jogos e otimiza o desempenho do laptop, o que pode aumentar as temperaturas e as emissões de ruído do ventilador. No entanto, de modo geral, isso não é nada de novo e uma função semelhante já podia ser vista em modelos anteriores, nos quais os jogos acionavam uma mudança automática para o modo de desempenho. Por outro lado, não notamos nenhuma diferença em comparação com o modo balanceado ao usar esse novo AI Engine+, e o desempenho do dispositivo era frequentemente o mesmo ou até pior do que no modo de desempenho.
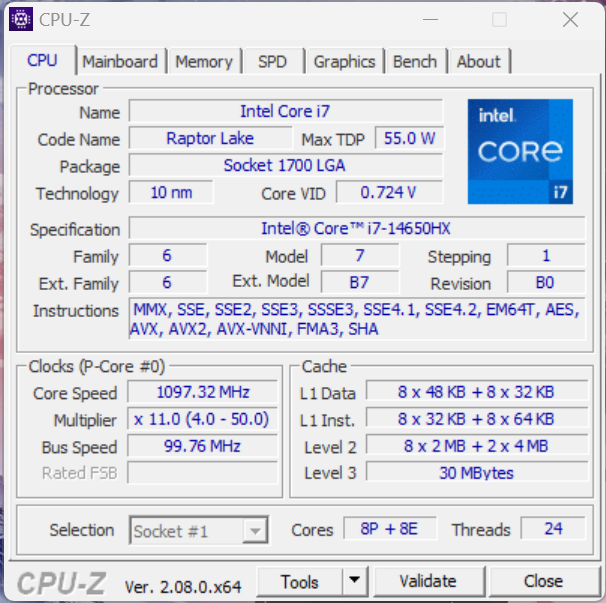
Processador - Core i7-14650HX
O novo Core i7-14650HX é o sucessor do antigo Core i7-13700HXque oferece a mesma configuração de núcleo (8x desempenho + 8x eficiência) com taxas de clock ligeiramente mais altas (até 5,2 GHz), mas, em termos de arquitetura geral, nada mudou. No Legion 5i 16, a nova CPU HX consome 140 watts por um curto período de tempo, antes de se equilibrar em 100 watts. O desempenho resultante é excelente, levando a uma vantagem de 10% sobre o antigo 13700HX. Os modelos da AMD também tiveram um desempenho visivelmente pior. Durante os testes de núcleo único, o Legion também ficou em primeiro lugar. No uso da bateria, seu consumo de energia é limitado a 50 watts, e é por isso que seu desempenho de vários núcleos caiu cerca de 40% (CB R23 Multi: 14.202 pontos).
Outros benchmarks de CPU podem ser encontrados em nossa seção de tecnologia Mobile Processors - Benchmark List .
Cinebench R15 Multi continuous test
Cinebench R23: Multi Core | Single Core
Cinebench R20: CPU (Multi Core) | CPU (Single Core)
Cinebench R15: CPU Multi 64Bit | CPU Single 64Bit
Blender: v2.79 BMW27 CPU
7-Zip 18.03: 7z b 4 | 7z b 4 -mmt1
Geekbench 6.7: Multi-Core | Single-Core
Geekbench 5.5: Multi-Core | Single-Core
HWBOT x265 Benchmark v2.2: 4k Preset
LibreOffice : 20 Documents To PDF
R Benchmark 2.5: Overall mean
| CPU Performance rating | |
| Média da turma Gaming | |
| Lenovo Legion 5 16IRX G9 | |
| Alienware m16 R1 Intel | |
| Média Intel Core i7-14650HX | |
| Lenovo Legion Pro 5 16IRX8 -2! | |
| Lenovo Legion Slim 5 16APH8 -2! | |
| Schenker XMG CORE 16 (L23) | |
| HP Victus 16-r0076TX -3! | |
| Lenovo LOQ 16IRH8 | |
| HP Victus 16-r0077ng | |
| Cinebench R23 / Multi Core | |
| Média da turma Gaming (10488 - 40970, n=113, últimos 2 anos) | |
| Lenovo Legion 5 16IRX G9 | |
| Alienware m16 R1 Intel | |
| Média Intel Core i7-14650HX (16453 - 24455, n=2) | |
| Lenovo Legion Pro 5 16IRX8 | |
| HP Victus 16-r0076TX | |
| Schenker XMG CORE 16 (L23) | |
| Lenovo Legion Slim 5 16APH8 | |
| HP Victus 16-r0077ng | |
| Lenovo LOQ 16IRH8 | |
| Cinebench R23 / Single Core | |
| Média da turma Gaming (1166 - 2356, n=113, últimos 2 anos) | |
| Média Intel Core i7-14650HX (1963 - 1975, n=2) | |
| Lenovo Legion 5 16IRX G9 | |
| Alienware m16 R1 Intel | |
| Lenovo LOQ 16IRH8 | |
| Lenovo Legion Slim 5 16APH8 | |
| Schenker XMG CORE 16 (L23) | |
| HP Victus 16-r0076TX | |
| HP Victus 16-r0077ng | |
| Lenovo Legion Pro 5 16IRX8 | |
| Cinebench R20 / CPU (Multi Core) | |
| Média da turma Gaming (4029 - 16108, n=112, últimos 2 anos) | |
| Lenovo Legion 5 16IRX G9 | |
| Alienware m16 R1 Intel | |
| Média Intel Core i7-14650HX (6236 - 9349, n=2) | |
| HP Victus 16-r0076TX | |
| Lenovo Legion Pro 5 16IRX8 | |
| Lenovo Legion Slim 5 16APH8 | |
| Schenker XMG CORE 16 (L23) | |
| HP Victus 16-r0077ng | |
| Lenovo LOQ 16IRH8 | |
| Cinebench R20 / CPU (Single Core) | |
| Média da turma Gaming (442 - 895, n=112, últimos 2 anos) | |
| Média Intel Core i7-14650HX (754 - 762, n=2) | |
| Lenovo Legion 5 16IRX G9 | |
| Alienware m16 R1 Intel | |
| Lenovo LOQ 16IRH8 | |
| Lenovo Legion Slim 5 16APH8 | |
| Schenker XMG CORE 16 (L23) | |
| Lenovo Legion Pro 5 16IRX8 | |
| HP Victus 16-r0077ng | |
| HP Victus 16-r0076TX | |
| Cinebench R15 / CPU Multi 64Bit | |
| Média da turma Gaming (1578 - 6271, n=113, últimos 2 anos) | |
| Lenovo Legion 5 16IRX G9 | |
| Média Intel Core i7-14650HX (3142 - 3799, n=2) | |
| Lenovo Legion Pro 5 16IRX8 | |
| Alienware m16 R1 Intel | |
| HP Victus 16-r0076TX | |
| Lenovo Legion Slim 5 16APH8 | |
| Schenker XMG CORE 16 (L23) | |
| Lenovo LOQ 16IRH8 | |
| HP Victus 16-r0077ng | |
| Cinebench R15 / CPU Single 64Bit | |
| Média da turma Gaming (188.8 - 343, n=112, últimos 2 anos) | |
| Lenovo Legion 5 16IRX G9 | |
| Média Intel Core i7-14650HX (284 - 287, n=2) | |
| Lenovo Legion Slim 5 16APH8 | |
| Alienware m16 R1 Intel | |
| Schenker XMG CORE 16 (L23) | |
| Lenovo Legion Pro 5 16IRX8 | |
| Lenovo LOQ 16IRH8 | |
| HP Victus 16-r0077ng | |
| HP Victus 16-r0076TX | |
| Blender / v2.79 BMW27 CPU | |
| Lenovo LOQ 16IRH8 | |
| HP Victus 16-r0077ng | |
| HP Victus 16-r0076TX | |
| Schenker XMG CORE 16 (L23) | |
| Lenovo Legion Slim 5 16APH8 | |
| Média Intel Core i7-14650HX (141 - 206, n=2) | |
| Alienware m16 R1 Intel | |
| Média da turma Gaming (80 - 330, n=110, últimos 2 anos) | |
| Lenovo Legion Pro 5 16IRX8 | |
| Lenovo Legion 5 16IRX G9 | |
| 7-Zip 18.03 / 7z b 4 | |
| Lenovo Legion 5 16IRX G9 | |
| Média da turma Gaming (33491 - 148086, n=111, últimos 2 anos) | |
| Alienware m16 R1 Intel | |
| Média Intel Core i7-14650HX (68711 - 93686, n=2) | |
| Lenovo Legion Pro 5 16IRX8 | |
| Schenker XMG CORE 16 (L23) | |
| HP Victus 16-r0076TX | |
| Lenovo Legion Slim 5 16APH8 | |
| HP Victus 16-r0077ng | |
| Lenovo LOQ 16IRH8 | |
| 7-Zip 18.03 / 7z b 4 -mmt1 | |
| Lenovo Legion 5 16IRX G9 | |
| Schenker XMG CORE 16 (L23) | |
| Média Intel Core i7-14650HX (6364 - 6695, n=2) | |
| Lenovo Legion Slim 5 16APH8 | |
| Alienware m16 R1 Intel | |
| Média da turma Gaming (4199 - 7436, n=111, últimos 2 anos) | |
| Lenovo LOQ 16IRH8 | |
| Lenovo Legion Pro 5 16IRX8 | |
| HP Victus 16-r0077ng | |
| HP Victus 16-r0076TX | |
| Geekbench 6.7 / Multi-Core | |
| Lenovo Legion 5 16IRX G9 | |
| Média da turma Gaming (6625 - 22104, n=112, últimos 2 anos) | |
| Média Intel Core i7-14650HX (12892 - 16010, n=2) | |
| Alienware m16 R1 Intel | |
| Schenker XMG CORE 16 (L23) | |
| Lenovo LOQ 16IRH8 | |
| HP Victus 16-r0077ng | |
| Geekbench 6.7 / Single-Core | |
| Média da turma Gaming (1490 - 3259, n=112, últimos 2 anos) | |
| Lenovo Legion 5 16IRX G9 | |
| Média Intel Core i7-14650HX (2744 - 2761, n=2) | |
| Schenker XMG CORE 16 (L23) | |
| Alienware m16 R1 Intel | |
| Lenovo LOQ 16IRH8 | |
| HP Victus 16-r0077ng | |
| Geekbench 5.5 / Multi-Core | |
| Média da turma Gaming (6460 - 27010, n=111, últimos 2 anos) | |
| Lenovo Legion 5 16IRX G9 | |
| Média Intel Core i7-14650HX (12584 - 16810, n=2) | |
| Alienware m16 R1 Intel | |
| Lenovo Legion Pro 5 16IRX8 | |
| HP Victus 16-r0076TX | |
| Lenovo LOQ 16IRH8 | |
| Schenker XMG CORE 16 (L23) | |
| Lenovo Legion Slim 5 16APH8 | |
| HP Victus 16-r0077ng | |
| Geekbench 5.5 / Single-Core | |
| Média da turma Gaming (986 - 2474, n=111, últimos 2 anos) | |
| Lenovo Legion Slim 5 16APH8 | |
| Schenker XMG CORE 16 (L23) | |
| Média Intel Core i7-14650HX (1933 - 1940, n=2) | |
| Lenovo Legion 5 16IRX G9 | |
| Alienware m16 R1 Intel | |
| Lenovo LOQ 16IRH8 | |
| Lenovo Legion Pro 5 16IRX8 | |
| HP Victus 16-r0076TX | |
| HP Victus 16-r0077ng | |
| HWBOT x265 Benchmark v2.2 / 4k Preset | |
| Média da turma Gaming (11.5 - 44.3, n=111, últimos 2 anos) | |
| Lenovo Legion 5 16IRX G9 | |
| Lenovo Legion Pro 5 16IRX8 | |
| Alienware m16 R1 Intel | |
| Lenovo Legion Slim 5 16APH8 | |
| Schenker XMG CORE 16 (L23) | |
| HP Victus 16-r0076TX | |
| Média Intel Core i7-14650HX (12.6 - 25.6, n=2) | |
| Lenovo LOQ 16IRH8 | |
| HP Victus 16-r0077ng | |
| LibreOffice / 20 Documents To PDF | |
| Schenker XMG CORE 16 (L23) | |
| HP Victus 16-r0077ng | |
| Média Intel Core i7-14650HX (43.8 - 55.6, n=2) | |
| Média da turma Gaming (19 - 88.8, n=111, últimos 2 anos) | |
| Lenovo LOQ 16IRH8 | |
| Alienware m16 R1 Intel | |
| Lenovo Legion 5 16IRX G9 | |
| Lenovo Legion Slim 5 16APH8 | |
| Lenovo Legion Pro 5 16IRX8 | |
| R Benchmark 2.5 / Overall mean | |
| HP Victus 16-r0077ng | |
| HP Victus 16-r0076TX | |
| Lenovo Legion Pro 5 16IRX8 | |
| Lenovo LOQ 16IRH8 | |
| Alienware m16 R1 Intel | |
| Schenker XMG CORE 16 (L23) | |
| Lenovo Legion Slim 5 16APH8 | |
| Média da turma Gaming (0.3439 - 0.759, n=112, últimos 2 anos) | |
| Média Intel Core i7-14650HX (0.4195 - 0.4244, n=2) | |
| Lenovo Legion 5 16IRX G9 | |
* ... menor é melhor
AIDA64: FP32 Ray-Trace | FPU Julia | CPU SHA3 | CPU Queen | FPU SinJulia | FPU Mandel | CPU AES | CPU ZLib | FP64 Ray-Trace | CPU PhotoWorxx
| Performance rating | |
| Média da turma Gaming | |
| Schenker XMG CORE 16 (L23) | |
| Lenovo Legion Slim 5 16APH8 | |
| Alienware m16 R1 Intel | |
| Lenovo Legion Pro 5 16IRX8 | |
| Lenovo Legion 5 16IRX G9 | |
| HP Victus 16-r0076TX | |
| Média Intel Core i7-14650HX | |
| HP Victus 16-r0077ng | |
| Lenovo LOQ 16IRH8 | |
| AIDA64 / FP32 Ray-Trace | |
| Média da turma Gaming (10227 - 85542, n=110, últimos 2 anos) | |
| Lenovo Legion Slim 5 16APH8 | |
| Schenker XMG CORE 16 (L23) | |
| Lenovo Legion Pro 5 16IRX8 | |
| Alienware m16 R1 Intel | |
| Lenovo Legion 5 16IRX G9 | |
| Média Intel Core i7-14650HX (13096 - 19044, n=2) | |
| HP Victus 16-r0076TX | |
| HP Victus 16-r0077ng | |
| Lenovo LOQ 16IRH8 | |
| AIDA64 / FPU Julia | |
| Média da turma Gaming (51376 - 238426, n=110, últimos 2 anos) | |
| Lenovo Legion Slim 5 16APH8 | |
| Schenker XMG CORE 16 (L23) | |
| Lenovo Legion Pro 5 16IRX8 | |
| Alienware m16 R1 Intel | |
| Lenovo Legion 5 16IRX G9 | |
| HP Victus 16-r0076TX | |
| Média Intel Core i7-14650HX (67335 - 95271, n=2) | |
| HP Victus 16-r0077ng | |
| Lenovo LOQ 16IRH8 | |
| AIDA64 / CPU SHA3 | |
| Média da turma Gaming (2180 - 9817, n=110, últimos 2 anos) | |
| Schenker XMG CORE 16 (L23) | |
| Lenovo Legion Slim 5 16APH8 | |
| Alienware m16 R1 Intel | |
| Lenovo Legion Pro 5 16IRX8 | |
| Lenovo Legion 5 16IRX G9 | |
| HP Victus 16-r0076TX | |
| Média Intel Core i7-14650HX (3109 - 4214, n=2) | |
| HP Victus 16-r0077ng | |
| Lenovo LOQ 16IRH8 | |
| AIDA64 / CPU Queen | |
| Lenovo Legion Slim 5 16APH8 | |
| Média da turma Gaming (49785 - 173351, n=101, últimos 2 anos) | |
| Alienware m16 R1 Intel | |
| Lenovo Legion Pro 5 16IRX8 | |
| HP Victus 16-r0076TX | |
| Schenker XMG CORE 16 (L23) | |
| Lenovo Legion 5 16IRX G9 | |
| Média Intel Core i7-14650HX (89907 - 101500, n=2) | |
| HP Victus 16-r0077ng | |
| Lenovo LOQ 16IRH8 | |
| AIDA64 / FPU SinJulia | |
| Schenker XMG CORE 16 (L23) | |
| Lenovo Legion Slim 5 16APH8 | |
| Média da turma Gaming (4424 - 33636, n=110, últimos 2 anos) | |
| Alienware m16 R1 Intel | |
| Lenovo Legion Pro 5 16IRX8 | |
| Lenovo Legion 5 16IRX G9 | |
| Média Intel Core i7-14650HX (9159 - 11913, n=2) | |
| HP Victus 16-r0076TX | |
| HP Victus 16-r0077ng | |
| Lenovo LOQ 16IRH8 | |
| AIDA64 / FPU Mandel | |
| Média da turma Gaming (25115 - 128721, n=110, últimos 2 anos) | |
| Lenovo Legion Slim 5 16APH8 | |
| Schenker XMG CORE 16 (L23) | |
| Lenovo Legion Pro 5 16IRX8 | |
| Alienware m16 R1 Intel | |
| Lenovo Legion 5 16IRX G9 | |
| Média Intel Core i7-14650HX (32747 - 47097, n=2) | |
| HP Victus 16-r0076TX | |
| HP Victus 16-r0077ng | |
| Lenovo LOQ 16IRH8 | |
| AIDA64 / CPU AES | |
| Alienware m16 R1 Intel | |
| Média da turma Gaming (39258 - 247074, n=110, últimos 2 anos) | |
| Lenovo Legion Pro 5 16IRX8 | |
| Schenker XMG CORE 16 (L23) | |
| Lenovo Legion 5 16IRX G9 | |
| HP Victus 16-r0076TX | |
| Média Intel Core i7-14650HX (63627 - 86485, n=2) | |
| Lenovo Legion Slim 5 16APH8 | |
| HP Victus 16-r0077ng | |
| Lenovo LOQ 16IRH8 | |
| AIDA64 / CPU ZLib | |
| Média da turma Gaming (574 - 2531, n=110, últimos 2 anos) | |
| Alienware m16 R1 Intel | |
| Lenovo Legion Pro 5 16IRX8 | |
| Lenovo Legion 5 16IRX G9 | |
| Média Intel Core i7-14650HX (924 - 1289, n=2) | |
| Lenovo Legion Slim 5 16APH8 | |
| HP Victus 16-r0076TX | |
| Schenker XMG CORE 16 (L23) | |
| HP Victus 16-r0077ng | |
| Lenovo LOQ 16IRH8 | |
| AIDA64 / FP64 Ray-Trace | |
| Média da turma Gaming (5509 - 45446, n=110, últimos 2 anos) | |
| Lenovo Legion Slim 5 16APH8 | |
| Schenker XMG CORE 16 (L23) | |
| Lenovo Legion Pro 5 16IRX8 | |
| Alienware m16 R1 Intel | |
| Lenovo Legion 5 16IRX G9 | |
| Média Intel Core i7-14650HX (7064 - 10316, n=2) | |
| HP Victus 16-r0076TX | |
| HP Victus 16-r0077ng | |
| Lenovo LOQ 16IRH8 | |
| AIDA64 / CPU PhotoWorxx | |
| Média da turma Gaming (12271 - 89891, n=110, últimos 2 anos) | |
| Schenker XMG CORE 16 (L23) | |
| HP Victus 16-r0077ng | |
| HP Victus 16-r0076TX | |
| Lenovo Legion Pro 5 16IRX8 | |
| Alienware m16 R1 Intel | |
| Média Intel Core i7-14650HX (33763 - 34470, n=2) | |
| Lenovo Legion 5 16IRX G9 | |
| Lenovo LOQ 16IRH8 | |
| Lenovo Legion Slim 5 16APH8 | |
Desempenho do sistema
Como era de se esperar, o novo Legion 5i 16 é um dispositivo de reação muito rápida e todas as entradas são implementadas sem hesitação. O sistema trava brevemente durante a inicialização de jogos, mas isso está relacionado à comutação de gráficos Advanced Optimus. O senhor pode evitar esse problema ativando a comutação Optimus normal, mas não terá o melhor desempenho. Durante o teste, não tivemos nenhum problema com o dispositivo de teste (travamentos etc.).
CrossMark: Overall | Productivity | Creativity | Responsiveness
WebXPRT 3: Overall
WebXPRT 4: Overall
Mozilla Kraken 1.1: Total
| PCMark 10 / Score | |
| Média da turma Gaming (5828 - 11574, n=96, últimos 2 anos) | |
| Schenker XMG CORE 16 (L23) | |
| Lenovo Legion Slim 5 16APH8 | |
| Lenovo Legion Pro 5 16IRX8 | |
| Lenovo Legion 5 16IRX G9 | |
| Média Intel Core i7-14650HX, NVIDIA GeForce RTX 4060 Laptop GPU (n=1) | |
| Alienware m16 R1 Intel | |
| HP Victus 16-r0077ng | |
| Lenovo LOQ 16IRH8 | |
| HP Victus 16-r0076TX | |
| PCMark 10 / Essentials | |
| Lenovo Legion Slim 5 16APH8 | |
| Schenker XMG CORE 16 (L23) | |
| Lenovo Legion Pro 5 16IRX8 | |
| Lenovo Legion 5 16IRX G9 | |
| Média Intel Core i7-14650HX, NVIDIA GeForce RTX 4060 Laptop GPU (n=1) | |
| Alienware m16 R1 Intel | |
| HP Victus 16-r0077ng | |
| Média da turma Gaming (8810 - 12600, n=100, últimos 2 anos) | |
| Lenovo LOQ 16IRH8 | |
| HP Victus 16-r0076TX | |
| PCMark 10 / Productivity | |
| Média da turma Gaming (6845 - 18766, n=98, últimos 2 anos) | |
| Schenker XMG CORE 16 (L23) | |
| Lenovo Legion Slim 5 16APH8 | |
| Alienware m16 R1 Intel | |
| Lenovo Legion 5 16IRX G9 | |
| Média Intel Core i7-14650HX, NVIDIA GeForce RTX 4060 Laptop GPU (n=1) | |
| Lenovo Legion Pro 5 16IRX8 | |
| HP Victus 16-r0077ng | |
| Lenovo LOQ 16IRH8 | |
| HP Victus 16-r0076TX | |
| PCMark 10 / Digital Content Creation | |
| Média da turma Gaming (7602 - 19657, n=98, últimos 2 anos) | |
| Schenker XMG CORE 16 (L23) | |
| Lenovo Legion Pro 5 16IRX8 | |
| Lenovo Legion 5 16IRX G9 | |
| Média Intel Core i7-14650HX, NVIDIA GeForce RTX 4060 Laptop GPU (n=1) | |
| Lenovo Legion Slim 5 16APH8 | |
| HP Victus 16-r0077ng | |
| Alienware m16 R1 Intel | |
| Lenovo LOQ 16IRH8 | |
| HP Victus 16-r0076TX | |
| CrossMark / Overall | |
| Lenovo Legion 5 16IRX G9 | |
| Média Intel Core i7-14650HX, NVIDIA GeForce RTX 4060 Laptop GPU (n=1) | |
| Alienware m16 R1 Intel | |
| Média da turma Gaming (1366 - 2409, n=98, últimos 2 anos) | |
| Lenovo LOQ 16IRH8 | |
| Lenovo Legion Slim 5 16APH8 | |
| HP Victus 16-r0076TX | |
| Schenker XMG CORE 16 (L23) | |
| Lenovo Legion Pro 5 16IRX8 | |
| CrossMark / Productivity | |
| Alienware m16 R1 Intel | |
| Lenovo Legion 5 16IRX G9 | |
| Média Intel Core i7-14650HX, NVIDIA GeForce RTX 4060 Laptop GPU (n=1) | |
| Lenovo LOQ 16IRH8 | |
| Média da turma Gaming (1386 - 2254, n=98, últimos 2 anos) | |
| Lenovo Legion Slim 5 16APH8 | |
| Schenker XMG CORE 16 (L23) | |
| Lenovo Legion Pro 5 16IRX8 | |
| HP Victus 16-r0076TX | |
| CrossMark / Creativity | |
| Lenovo Legion 5 16IRX G9 | |
| Média Intel Core i7-14650HX, NVIDIA GeForce RTX 4060 Laptop GPU (n=1) | |
| Alienware m16 R1 Intel | |
| Média da turma Gaming (1343 - 2729, n=98, últimos 2 anos) | |
| Lenovo LOQ 16IRH8 | |
| Lenovo Legion Slim 5 16APH8 | |
| HP Victus 16-r0076TX | |
| Schenker XMG CORE 16 (L23) | |
| Lenovo Legion Pro 5 16IRX8 | |
| CrossMark / Responsiveness | |
| Lenovo Legion 5 16IRX G9 | |
| Média Intel Core i7-14650HX, NVIDIA GeForce RTX 4060 Laptop GPU (n=1) | |
| Alienware m16 R1 Intel | |
| Lenovo LOQ 16IRH8 | |
| Média da turma Gaming (1226 - 2334, n=98, últimos 2 anos) | |
| Lenovo Legion Pro 5 16IRX8 | |
| Lenovo Legion Slim 5 16APH8 | |
| HP Victus 16-r0076TX | |
| Schenker XMG CORE 16 (L23) | |
| WebXPRT 3 / Overall | |
| Lenovo Legion Slim 5 16APH8 | |
| Lenovo LOQ 16IRH8 | |
| Lenovo LOQ 16IRH8 | |
| Média da turma Gaming (242 - 532, n=101, últimos 2 anos) | |
| Lenovo Legion 5 16IRX G9 | |
| Média Intel Core i7-14650HX, NVIDIA GeForce RTX 4060 Laptop GPU (n=1) | |
| Alienware m16 R1 Intel | |
| Schenker XMG CORE 16 (L23) | |
| HP Victus 16-r0077ng | |
| HP Victus 16-r0077ng | |
| HP Victus 16-r0076TX | |
| Lenovo Legion Pro 5 16IRX8 | |
| WebXPRT 4 / Overall | |
| Média da turma Gaming (176.4 - 354, n=101, últimos 2 anos) | |
| Lenovo Legion 5 16IRX G9 | |
| Média Intel Core i7-14650HX, NVIDIA GeForce RTX 4060 Laptop GPU (n=1) | |
| Alienware m16 R1 Intel | |
| Lenovo Legion Slim 5 16APH8 | |
| Lenovo Legion Pro 5 16IRX8 | |
| HP Victus 16-r0077ng | |
| HP Victus 16-r0077ng | |
| HP Victus 16-r0076TX | |
| Mozilla Kraken 1.1 / Total | |
| HP Victus 16-r0076TX | |
| HP Victus 16-r0077ng | |
| HP Victus 16-r0077ng | |
| Lenovo Legion Pro 5 16IRX8 | |
| Schenker XMG CORE 16 (L23) | |
| Lenovo LOQ 16IRH8 | |
| Lenovo LOQ 16IRH8 | |
| Alienware m16 R1 Intel | |
| Lenovo Legion Slim 5 16APH8 | |
| Lenovo Legion 5 16IRX G9 | |
| Média Intel Core i7-14650HX, NVIDIA GeForce RTX 4060 Laptop GPU (n=1) | |
| Média da turma Gaming (391 - 590, n=106, últimos 2 anos) | |
* ... menor é melhor
| PCMark 10 Score | 7645 pontos | |
Ajuda | ||
| AIDA64 / Memory Copy | |
| Média da turma Gaming (21750 - 129946, n=110, últimos 2 anos) | |
| Schenker XMG CORE 16 (L23) | |
| Lenovo Legion Slim 5 16APH8 | |
| HP Victus 16-r0077ng | |
| Lenovo Legion 5 16IRX G9 | |
| Média Intel Core i7-14650HX (58978 - 59727, n=2) | |
| Lenovo Legion Pro 5 16IRX8 | |
| Alienware m16 R1 Intel | |
| HP Victus 16-r0076TX | |
| Lenovo LOQ 16IRH8 | |
| AIDA64 / Memory Read | |
| Média da turma Gaming (22956 - 118858, n=110, últimos 2 anos) | |
| Lenovo Legion 5 16IRX G9 | |
| Média Intel Core i7-14650HX (70720 - 71455, n=2) | |
| HP Victus 16-r0077ng | |
| Lenovo Legion Pro 5 16IRX8 | |
| Alienware m16 R1 Intel | |
| HP Victus 16-r0076TX | |
| Lenovo LOQ 16IRH8 | |
| Lenovo Legion Slim 5 16APH8 | |
| Schenker XMG CORE 16 (L23) | |
| AIDA64 / Memory Write | |
| Schenker XMG CORE 16 (L23) | |
| Lenovo Legion Slim 5 16APH8 | |
| Média da turma Gaming (22297 - 135096, n=110, últimos 2 anos) | |
| Lenovo Legion Pro 5 16IRX8 | |
| HP Victus 16-r0077ng | |
| Alienware m16 R1 Intel | |
| HP Victus 16-r0076TX | |
| Média Intel Core i7-14650HX (51138 - 56811, n=2) | |
| Lenovo LOQ 16IRH8 | |
| Lenovo Legion 5 16IRX G9 | |
| AIDA64 / Memory Latency | |
| Lenovo LOQ 16IRH8 | |
| Média da turma Gaming (75.3 - 259, n=110, últimos 2 anos) | |
| HP Victus 16-r0076TX | |
| HP Victus 16-r0077ng | |
| Lenovo Legion Slim 5 16APH8 | |
| Média Intel Core i7-14650HX (89.8 - 95.2, n=2) | |
| Lenovo Legion 5 16IRX G9 | |
| Alienware m16 R1 Intel | |
| Schenker XMG CORE 16 (L23) | |
| Lenovo Legion Pro 5 16IRX8 | |
* ... menor é melhor
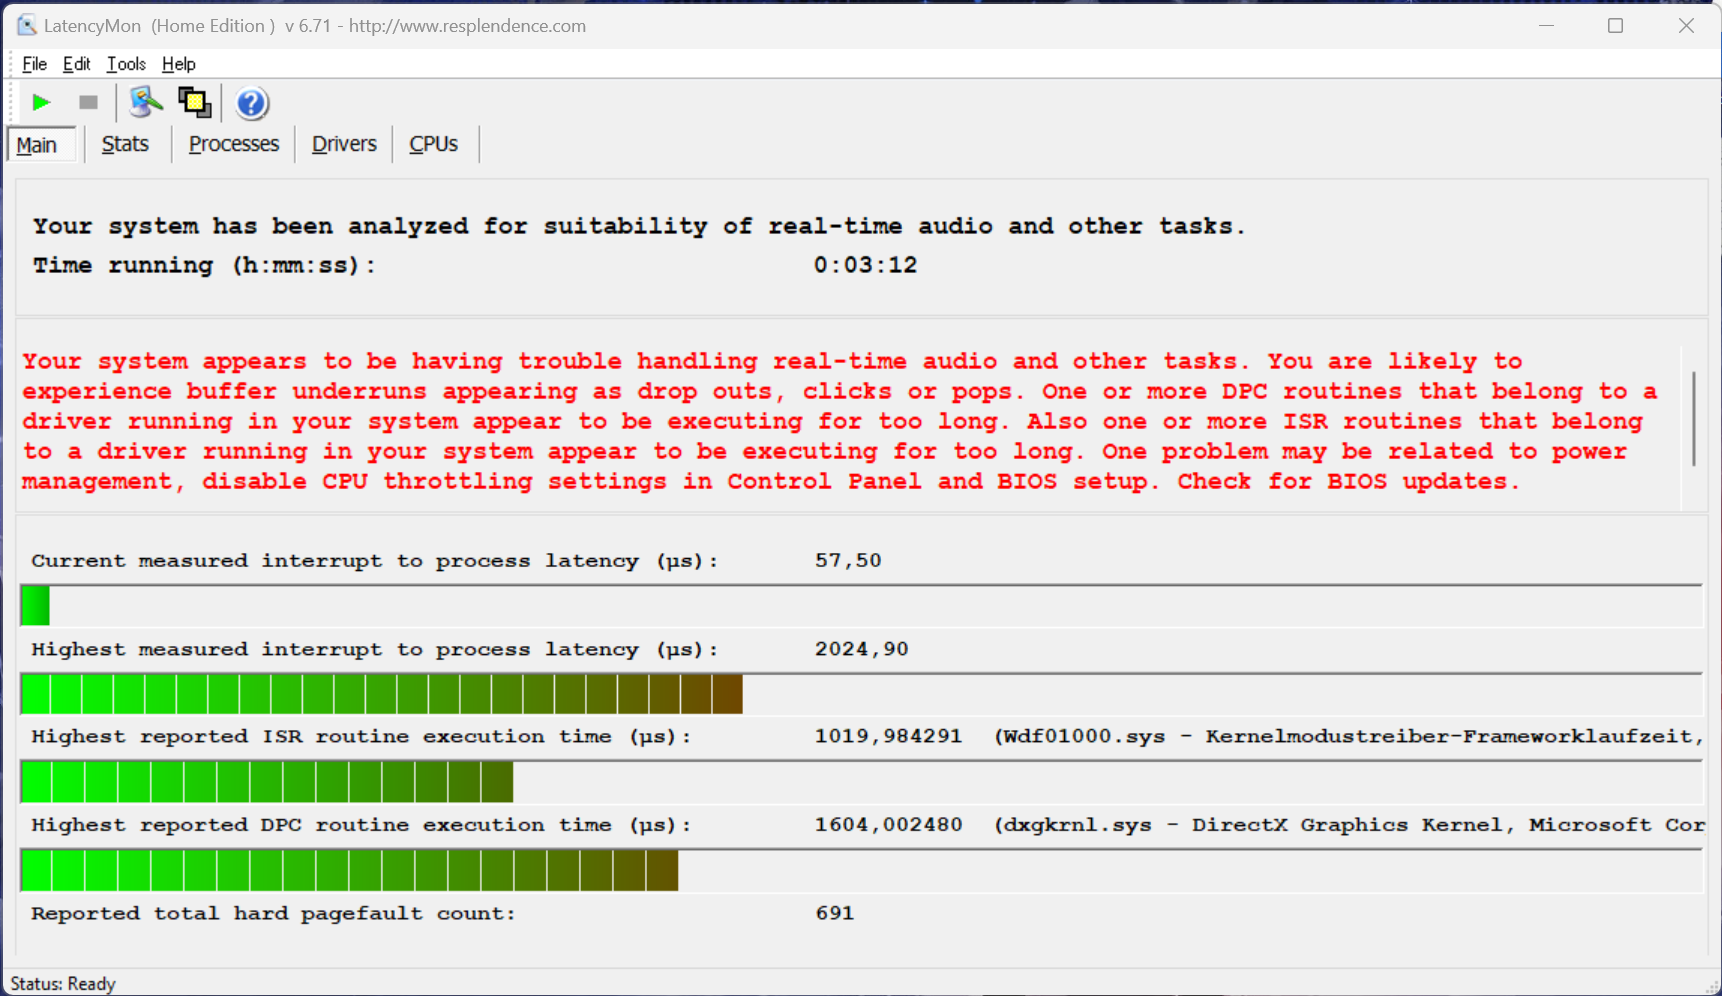
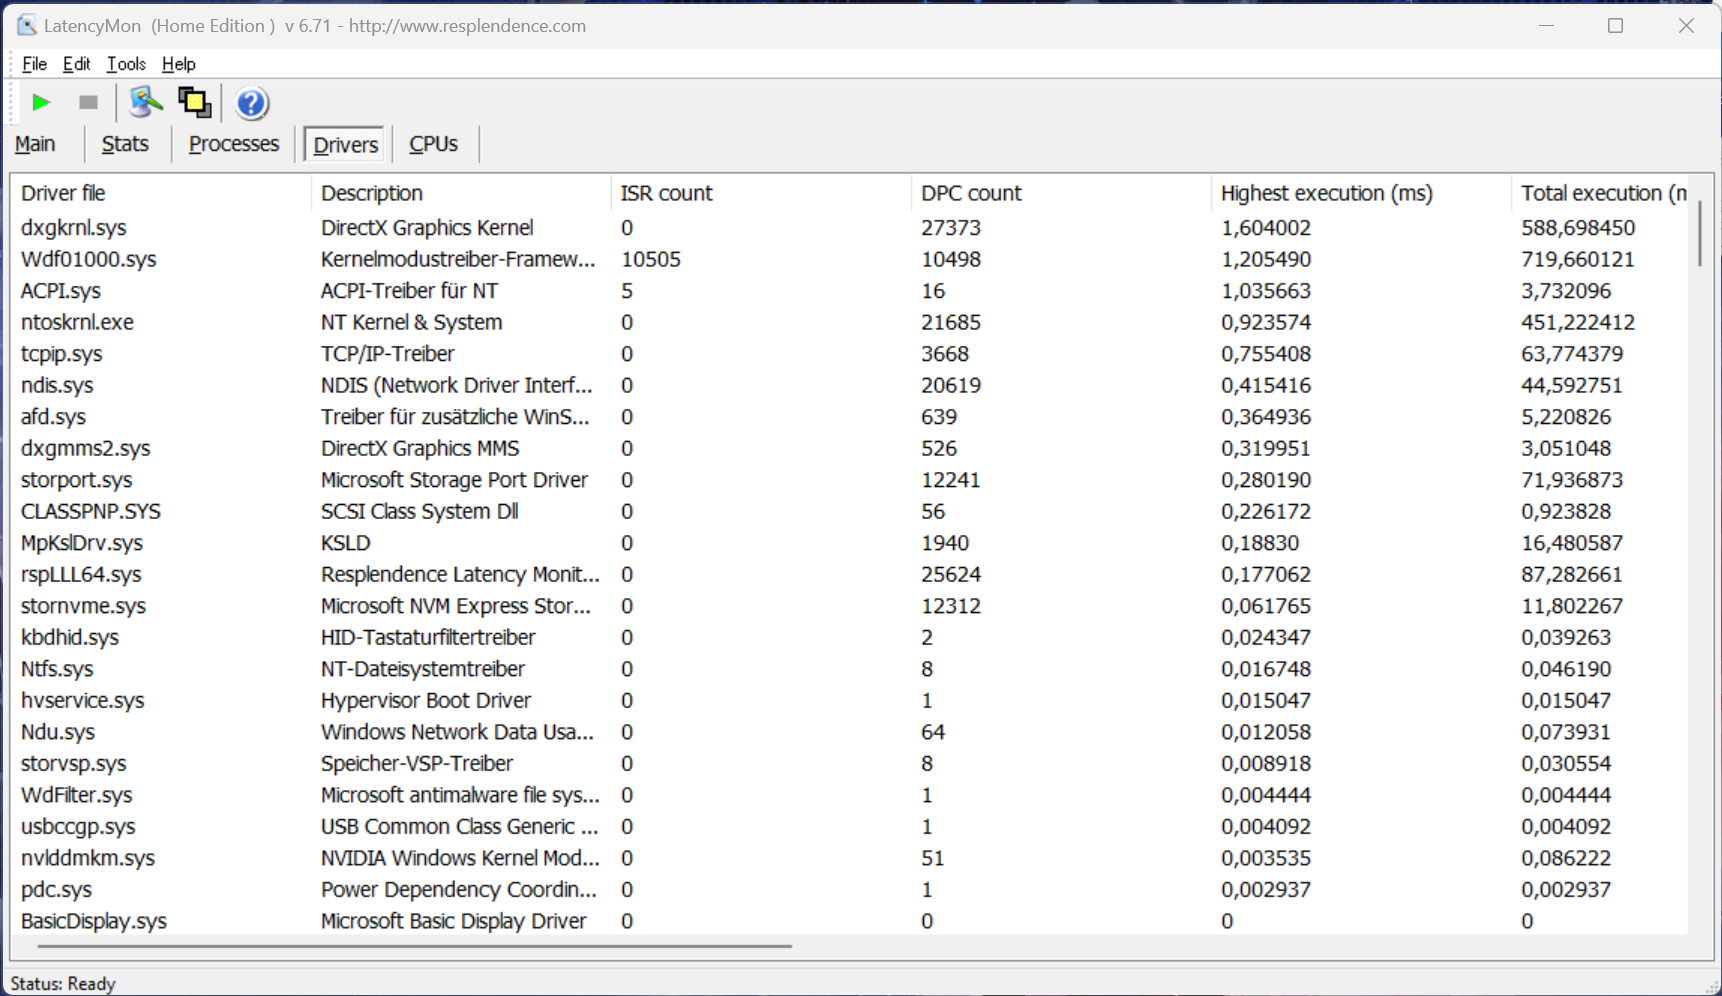
Latência DPC
Em nosso teste de latência padronizado (navegação na Web, reprodução em 4K no YouTube, carga da CPU), o dispositivo de teste com a versão atual do BIOS apresentou algumas limitações ao usar aplicativos de áudio em tempo real.
| DPC Latencies / LatencyMon - interrupt to process latency (max), Web, Youtube, Prime95 | |
| Alienware m16 R1 Intel | |
| Lenovo Legion 5 16IRX G9 | |
| HP Victus 16-r0076TX | |
| HP Victus 16-r0077ng | |
| Lenovo LOQ 16IRH8 | |
| Lenovo Legion Slim 5 16APH8 | |
| Lenovo Legion Pro 5 16IRX8 | |
| Schenker XMG CORE 16 (L23) | |
* ... menor é melhor
Dispositivos de armazenamento
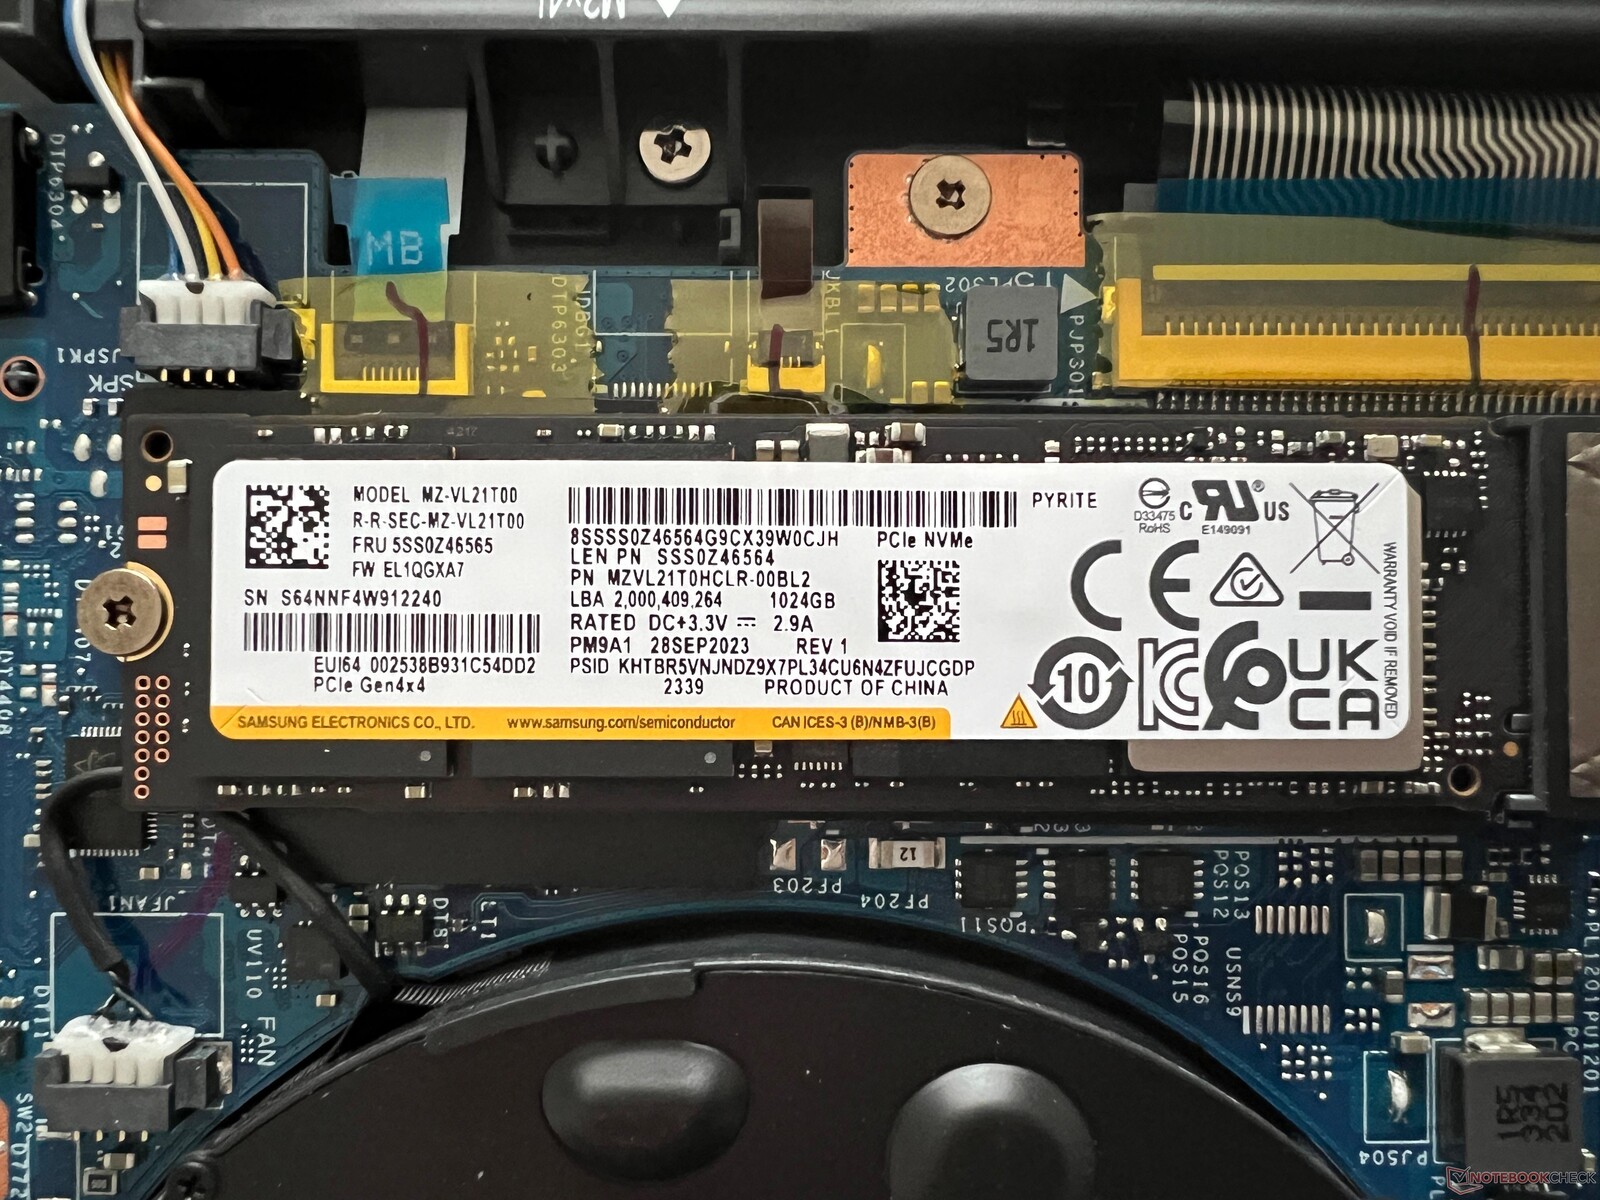
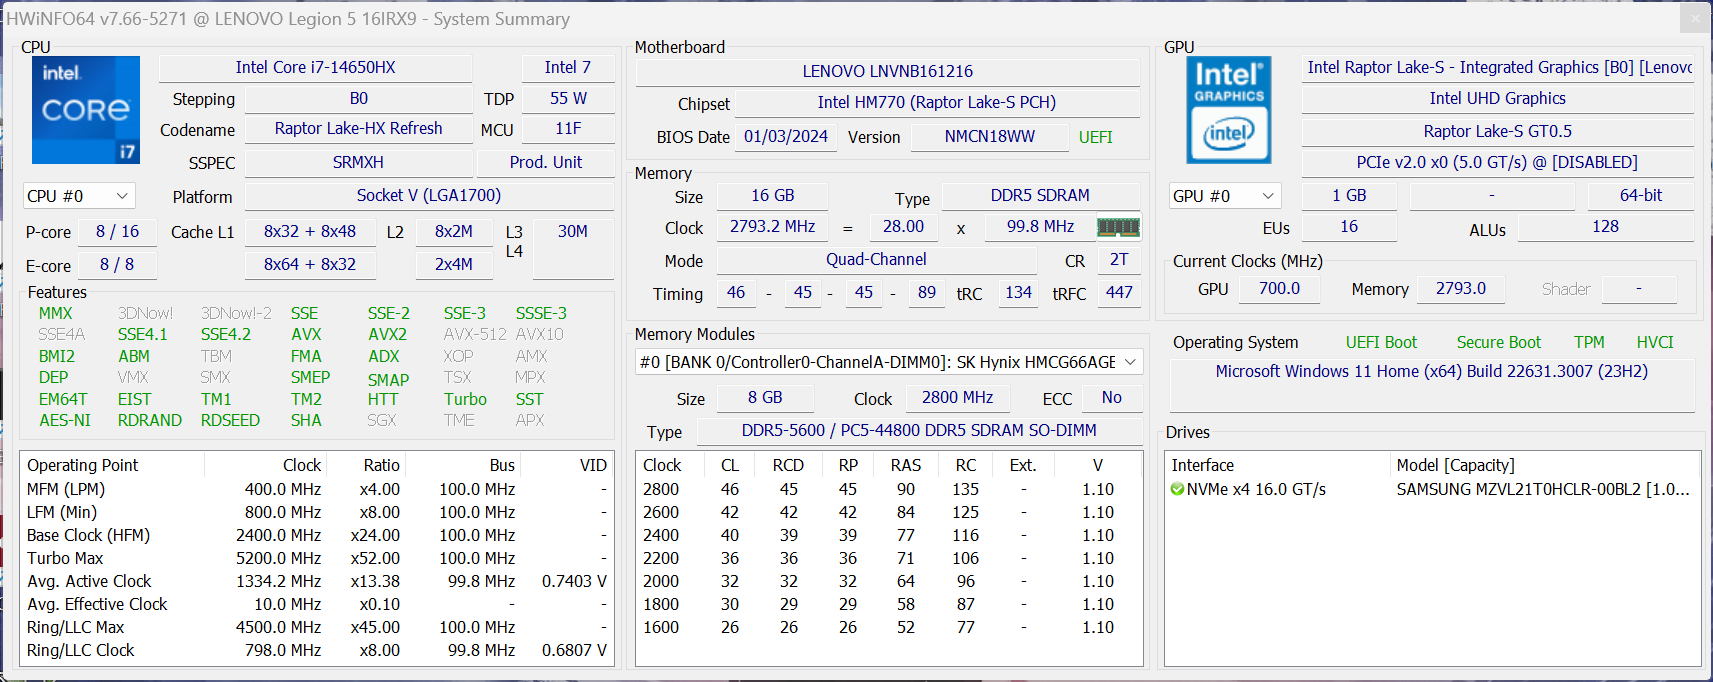
Como já foi mencionado, o Legion tem dois slots de SSD e o nosso dispositivo de teste está equipado com a versão de 1 TB do Samsung PM9A1 (versão OEM do 980 Pro), deixando os usuários com 888 GB livres para usar após a primeira inicialização do laptop. O desempenho do SSD PCIe-4.0 é excelente em geral, mas sob carga permanente, ele não permanece estável. No uso diário, isso não deve causar nenhuma limitação, mas um cooler adicional (ou dissipador de calor) poderia ter resolvido esse problema. Outros benchmarks de SSD podem ser encontrados aqui.

* ... menor é melhor
Reading continuous performance: DiskSpd Read Loop, Queue Depth 8
Placa de vídeo
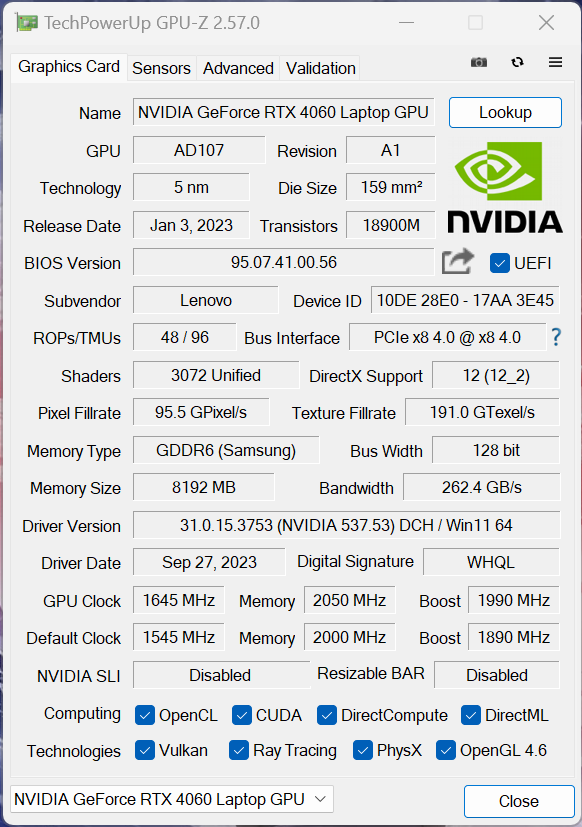
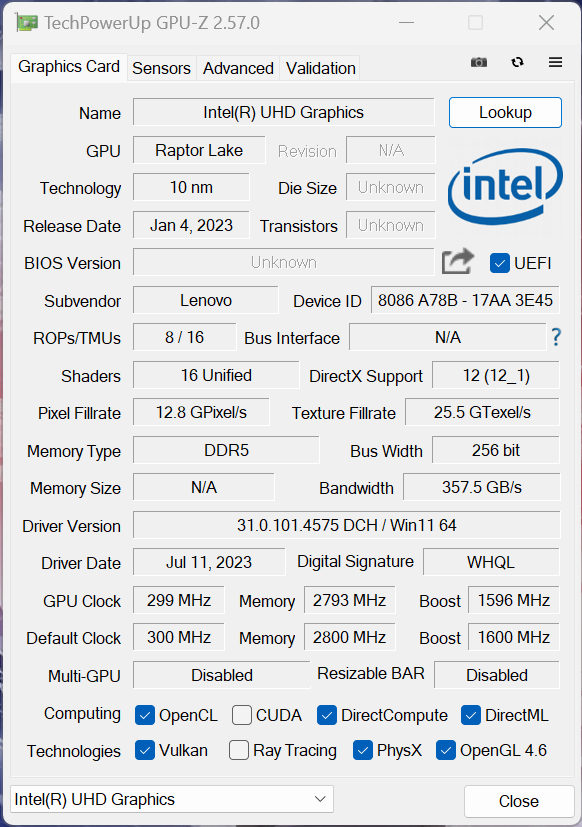
No dispositivo de teste, a Lenovo instalou o atual Laptop Nvidia GeForce RTX 4060 com um TGP de 115 watts - o senhor pode até mesmo fazer overclock da GPU por meio do aplicativo Vantage. Durante nosso teste, sua taxa de clock máxima foi de 2.430 MHz. O Optimus avançado por meio de um switch MUX é suportado e funcionou de forma confiável durante nosso teste, mas o senhor também pode desativar completamente a iGPU do processador.
O laptop RTX 4060 se saiu muito bem nos benchmarks, perdendo apenas para os dois modelos RTX-4070- embora a diferença para o HP Victus não seja grande. O desempenho da GPU permanece totalmente estável sob carga permanente, mas no uso da bateria, a GPU só pode consumir 50 watts. Isso resulta em uma perda de desempenho de pouco mais de 30%. Outros benchmarks de GPU podem ser encontrados em aqui.
| 3DMark 11 Performance | 32891 pontos | |
| 3DMark Fire Strike Score | 25376 pontos | |
| 3DMark Time Spy Score | 11731 pontos | |
Ajuda | ||
| Blender / v3.3 Classroom OPTIX/RTX | |
| HP Victus 16-r0076TX | |
| Alienware m16 R1 Intel | |
| HP Victus 16-r0077ng | |
| Lenovo Legion 5 16IRX G9 | |
| Média NVIDIA GeForce RTX 4060 Laptop GPU (19 - 28, n=53) | |
| Lenovo Legion Slim 5 16APH8 | |
| Lenovo LOQ 16IRH8 | |
| Lenovo Legion Pro 5 16IRX8 | |
| Schenker XMG CORE 16 (L23) | |
| Média da turma Gaming (9 - 32, n=112, últimos 2 anos) | |
| Blender / v3.3 Classroom CUDA | |
| HP Victus 16-r0076TX | |
| Lenovo Legion Slim 5 16APH8 | |
| Média NVIDIA GeForce RTX 4060 Laptop GPU (39 - 53, n=53) | |
| Lenovo LOQ 16IRH8 | |
| Lenovo Legion 5 16IRX G9 | |
| Lenovo Legion Pro 5 16IRX8 | |
| Alienware m16 R1 Intel | |
| HP Victus 16-r0077ng | |
| Média da turma Gaming (15 - 228, n=112, últimos 2 anos) | |
| Schenker XMG CORE 16 (L23) | |
| Blender / v3.3 Classroom CPU | |
| Lenovo LOQ 16IRH8 | |
| HP Victus 16-r0077ng | |
| HP Victus 16-r0076TX | |
| Média NVIDIA GeForce RTX 4060 Laptop GPU (189 - 452, n=53) | |
| Lenovo Legion Slim 5 16APH8 | |
| Schenker XMG CORE 16 (L23) | |
| Lenovo Legion Pro 5 16IRX8 | |
| Alienware m16 R1 Intel | |
| Média da turma Gaming (122 - 565, n=108, últimos 2 anos) | |
| Lenovo Legion 5 16IRX G9 | |
* ... menor é melhor
Desempenho em jogos
No total, o desempenho do laptop para jogos é excelente e está no limite superior para um laptop RTX 4060. Todos os jogos atuais podem ser executados sem problemas em QHD e com o máximo de detalhes, até mesmo jogos exigentes, como Cyberpunk 2077 ou Modern Warfare 3. Somente o raytracing pode causar alguns problemas e seria aconselhável usar a tecnologia de upscaling, como a DLSS. Além disso, seu desempenho em jogos permanece totalmente estável, mesmo em sessões mais longas. Outros benchmarks de jogos podem ser encontrados aqui.
| The Witcher 3 - 1920x1080 Ultra Graphics & Postprocessing (HBAO+) | |
| Média da turma Gaming (95 - 240, n=8, últimos 2 anos) | |
| Schenker XMG CORE 16 (L23) | |
| HP Victus 16-r0077ng | |
| Lenovo Legion Pro 5 16IRX8 | |
| Alienware m16 R1 Intel | |
| Lenovo LOQ 16IRH8 | |
| Lenovo Legion 5 16IRX G9 | |
| HP Victus 16-r0076TX | |
| Lenovo Legion Slim 5 16APH8 | |
| GTA V - 1920x1080 Highest AA:4xMSAA + FX AF:16x | |
| Média da turma Gaming (48.3 - 186.9, n=103, últimos 2 anos) | |
| Lenovo Legion 5 16IRX G9 | |
| Lenovo Legion Pro 5 16IRX8 | |
| Schenker XMG CORE 16 (L23) | |
| Lenovo LOQ 16IRH8 | |
| HP Victus 16-r0077ng | |
| Lenovo Legion Slim 5 16APH8 | |
Witcher 3 FPS diagram
| baixo | média | alto | ultra | QHD | |
|---|---|---|---|---|---|
| GTA V (2015) | 186 | 182.8 | 120.2 | 89 | |
| The Witcher 3 (2015) | 229 | 97.2 | 83 | ||
| Dota 2 Reborn (2015) | 209 | 189.7 | 179.9 | 168.7 | |
| Final Fantasy XV Benchmark (2018) | 154.2 | 106.3 | 77.5 | ||
| X-Plane 11.11 (2018) | 180.8 | 171 | 130.9 | ||
| Far Cry 5 (2018) | 161 | 155 | 147 | 111 | |
| Strange Brigade (2018) | 243 | 210 | 130 | ||
| F1 2021 (2021) | 464 | 380 | 292 | 146.7 | 104.6 |
| F1 22 (2022) | 296 | 287 | 217 | 71.4 | 45.2 |
| F1 23 (2023) | 306 | 292 | 207 | 63.7 | 39.4 |
| Cyberpunk 2077 (2023) | 133.1 | 110.4 | 95.3 | 81.8 | 49.7 |
| Assassin's Creed Mirage (2023) | 93 | 72 | |||
| Call of Duty Modern Warfare 3 2023 (2023) | 134 | 121 | 92 | 86 | 58 |
Emissões - alto, mas legal
Emissões de ruído
As duas ventoinhas do Legion 5i 16 têm muito trabalho a fazer e, se o senhor não usar o modo silencioso, elas girarão com frequência durante tarefas simples. Sob carga alta, o dispositivo fica muito alto, com 55 dB(A), mas, para ser honesto, os quase 50 dB(A) que medimos usando o modo balanceado são simplesmente muito altos para jogar adequadamente sem um fone de ouvido. Portanto, dependendo do jogo, talvez faça sentido verificar o desempenho no modo silencioso, pois seus 35 dB(A) são muito mais confortáveis. Não notamos nenhum outro ruído eletrônico vindo do nosso dispositivo de teste.
| Perfil de energia | 3DMark 06 | Witcher 3 | Cyberpunk 2077 Phantom Liberty | Teste de estresse |
|---|---|---|---|---|
| Modo silencioso | 34,6 dB(A) | 34,6 dB(A) | 30,4 dB(A) | 34,6 dB(A) |
| Modo balanceado | 34,6 dB(A) | 49,8 dB(A) | 49,8 dB(A) | 49,8 dB(A) |
| Modo de desempenho | 45,5 dB(A) | 55,7 dB(A) | 53,1 dB(A) | 55,7 dB(A) |
Barulho
| Ocioso |
| 24 / 28.8 / 32 dB |
| Carga |
| 45.5 / 55.7 dB |
 | ||
30 dB silencioso 40 dB(A) audível 50 dB(A) ruidosamente alto |
||
min: | ||
| Lenovo Legion 5 16IRX G9 GeForce RTX 4060 Laptop GPU, i7-14650HX, Samsung PM9A1 MZVL21T0HCLR | Schenker XMG CORE 16 (L23) GeForce RTX 4070 Laptop GPU, R7 7840HS, Samsung 990 Pro 1 TB | HP Victus 16-r0077ng GeForce RTX 4070 Laptop GPU, i7-13700H, Kioxia XG8 KXG80ZNV1T02 | Lenovo LOQ 16IRH8 GeForce RTX 4060 Laptop GPU, i7-13620H, Solidigm SSDPFINW512GZL | Lenovo Legion Slim 5 16APH8 GeForce RTX 4060 Laptop GPU, R7 7840HS, SK hynix PC801 HFS512GEJ9X115N | HP Victus 16-r0076TX GeForce RTX 4050 Laptop GPU, i5-13500HX, SK hynix PC801 HFS512GEJ9X101N BF | Alienware m16 R1 Intel GeForce RTX 4060 Laptop GPU, i7-13700HX, Kioxia KXG70ZNV512G | Lenovo Legion Pro 5 16IRX8 GeForce RTX 4060 Laptop GPU, i7-13700HX, SK hynix PC801 HFS512GEJ9X115N | |
|---|---|---|---|---|---|---|---|---|
| Noise | 8% | 2% | 4% | 10% | 9% | 2% | 12% | |
| desligado / ambiente * (dB) | 24 | 23 4% | 25 -4% | 23 4% | 22.9 5% | 21.57 10% | 25 -4% | 23 4% |
| Idle Minimum * (dB) | 24 | 23 4% | 28 -17% | 23 4% | 23.1 4% | 23.68 1% | 25 -4% | 23.1 4% |
| Idle Average * (dB) | 28.8 | 28.48 1% | 29 -1% | 23 20% | 23.1 20% | 23.68 18% | 26 10% | 23.1 20% |
| Idle Maximum * (dB) | 32 | 28.48 11% | 30 6% | 27.66 14% | 27.7 13% | 23.68 26% | 27 16% | 26.6 17% |
| Load Average * (dB) | 45.5 | 30 34% | 43 5% | 53.62 -18% | 33.3 27% | 39.44 13% | 52 -14% | 34.7 24% |
| Witcher 3 ultra * (dB) | 53.1 | 54.12 -2% | 46 13% | 53.5 -1% | 54 -2% | 55.4 -4% | 51 4% | 47.6 10% |
| Load Maximum * (dB) | 55.7 | 54.12 3% | 48 14% | 53.5 4% | 54 3% | 55.37 1% | 53 5% | 54.8 2% |
* ... menor é melhor
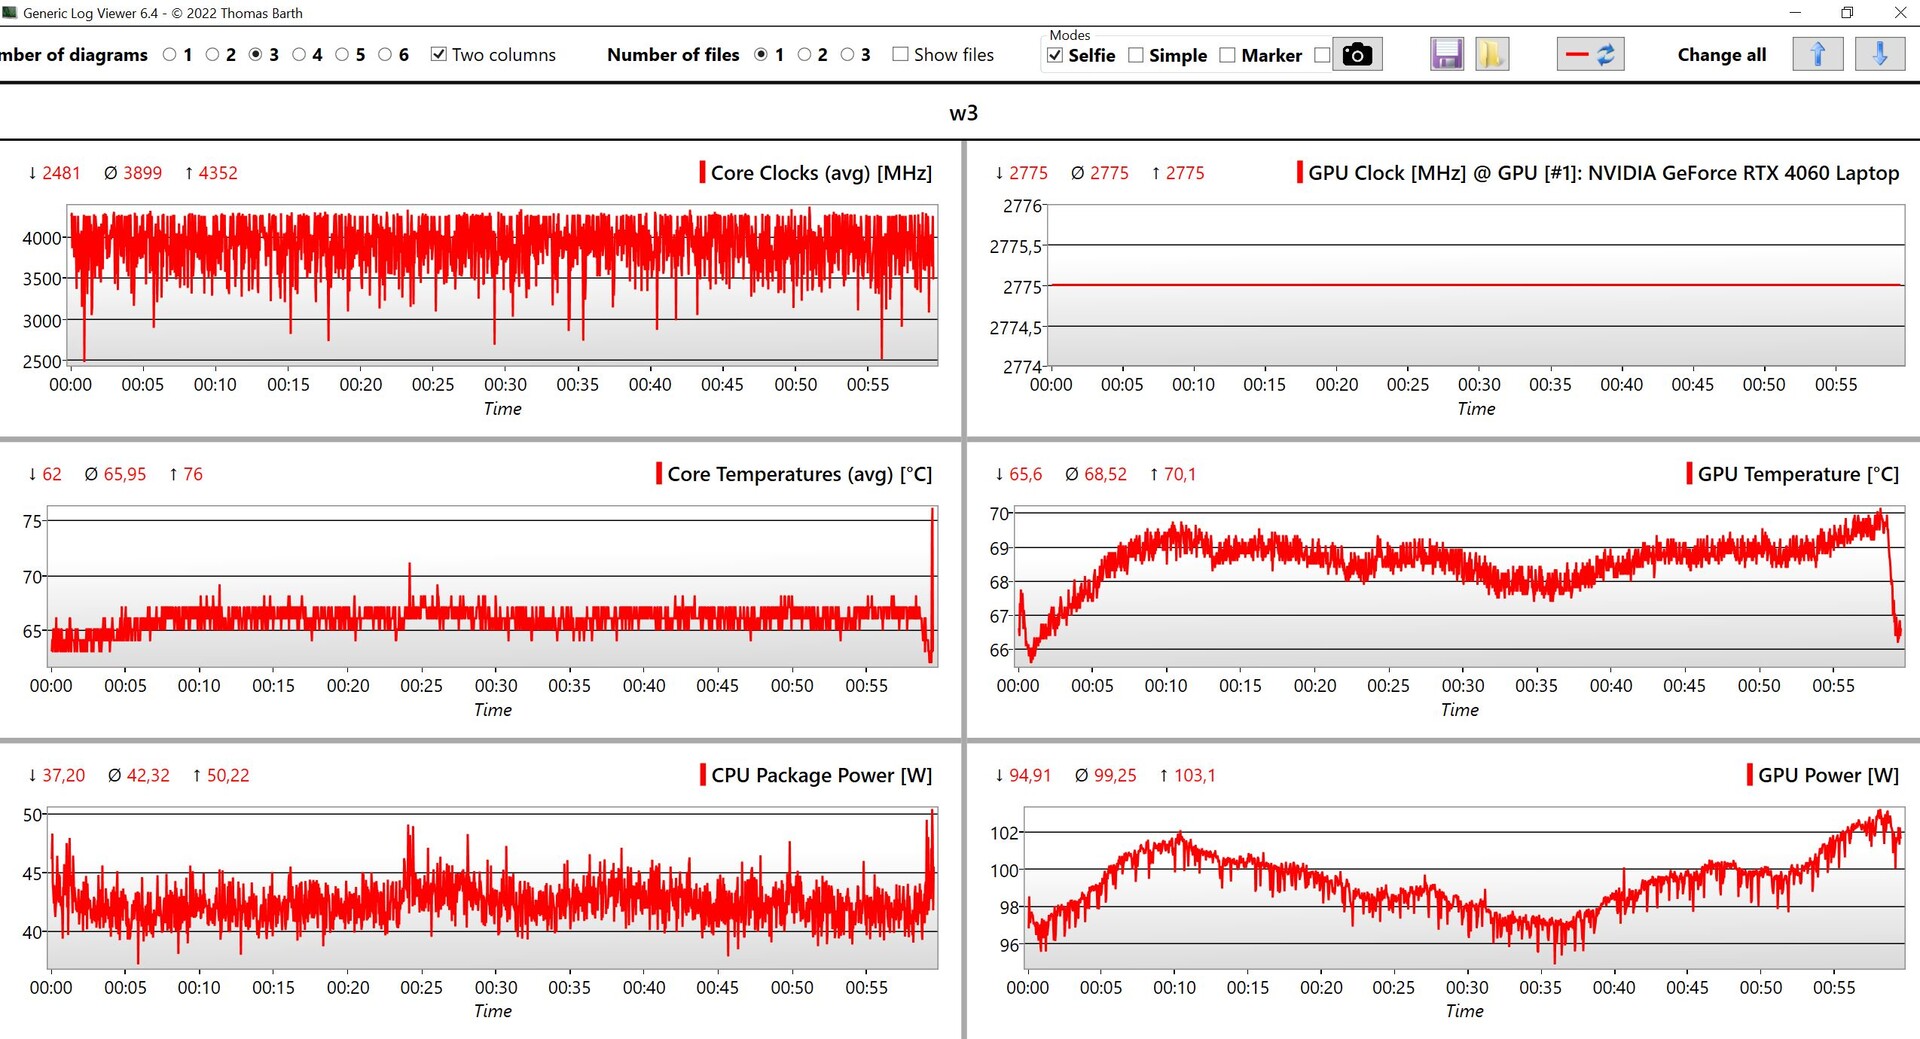
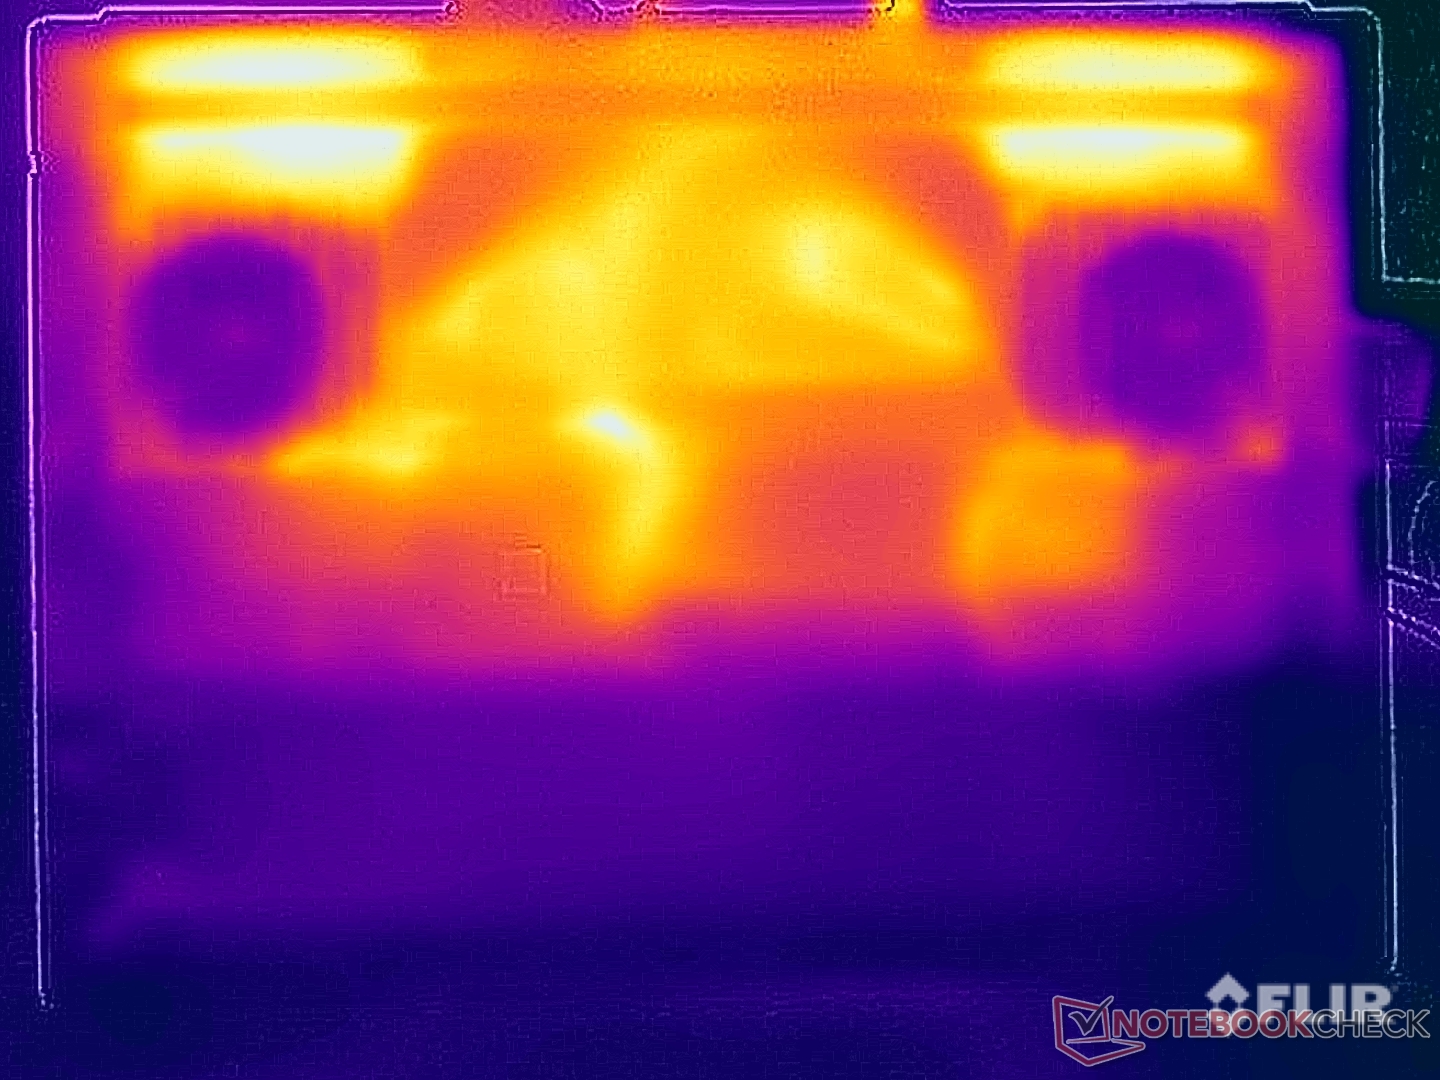
Temperatura
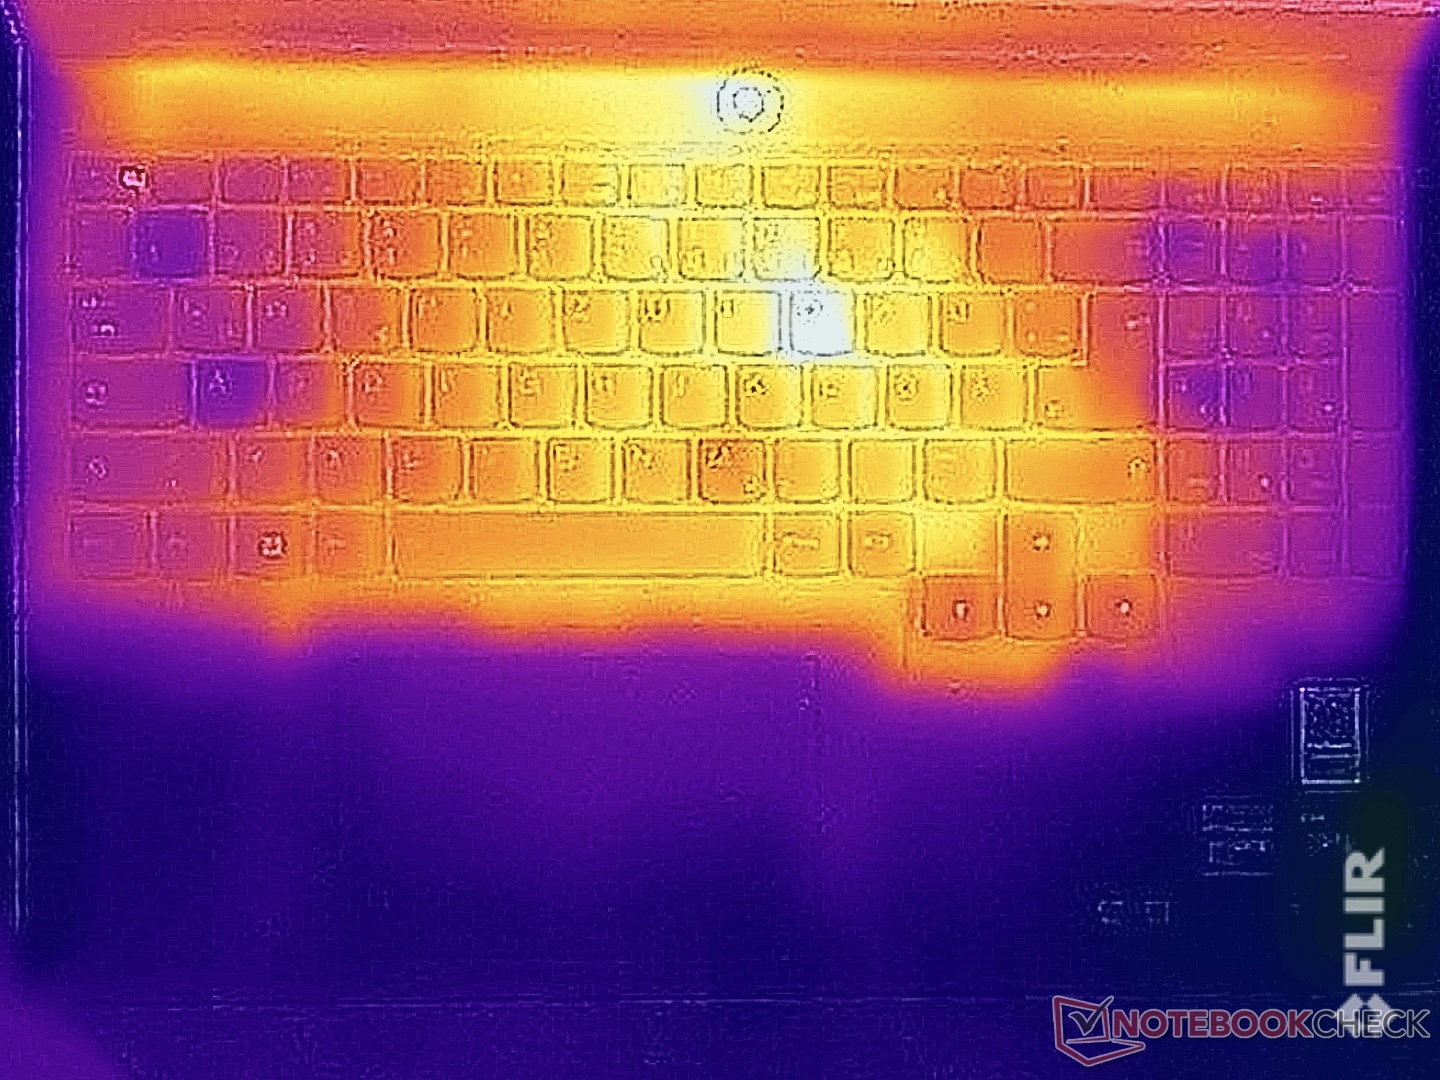
Alguns pontos do Legion já ficam visivelmente quentes no modo inativo, mas, por sua vez, as baixas temperaturas da superfície sob carga nos surpreenderam. Mesmo durante o teste de estresse, medimos apenas pouco mais de 40 °C na parte superior e, na parte inferior da unidade básica, observamos pouco mais de 43 °C. Esses resultados são excelentes e não há restrições quando se trata de manusear o dispositivo.
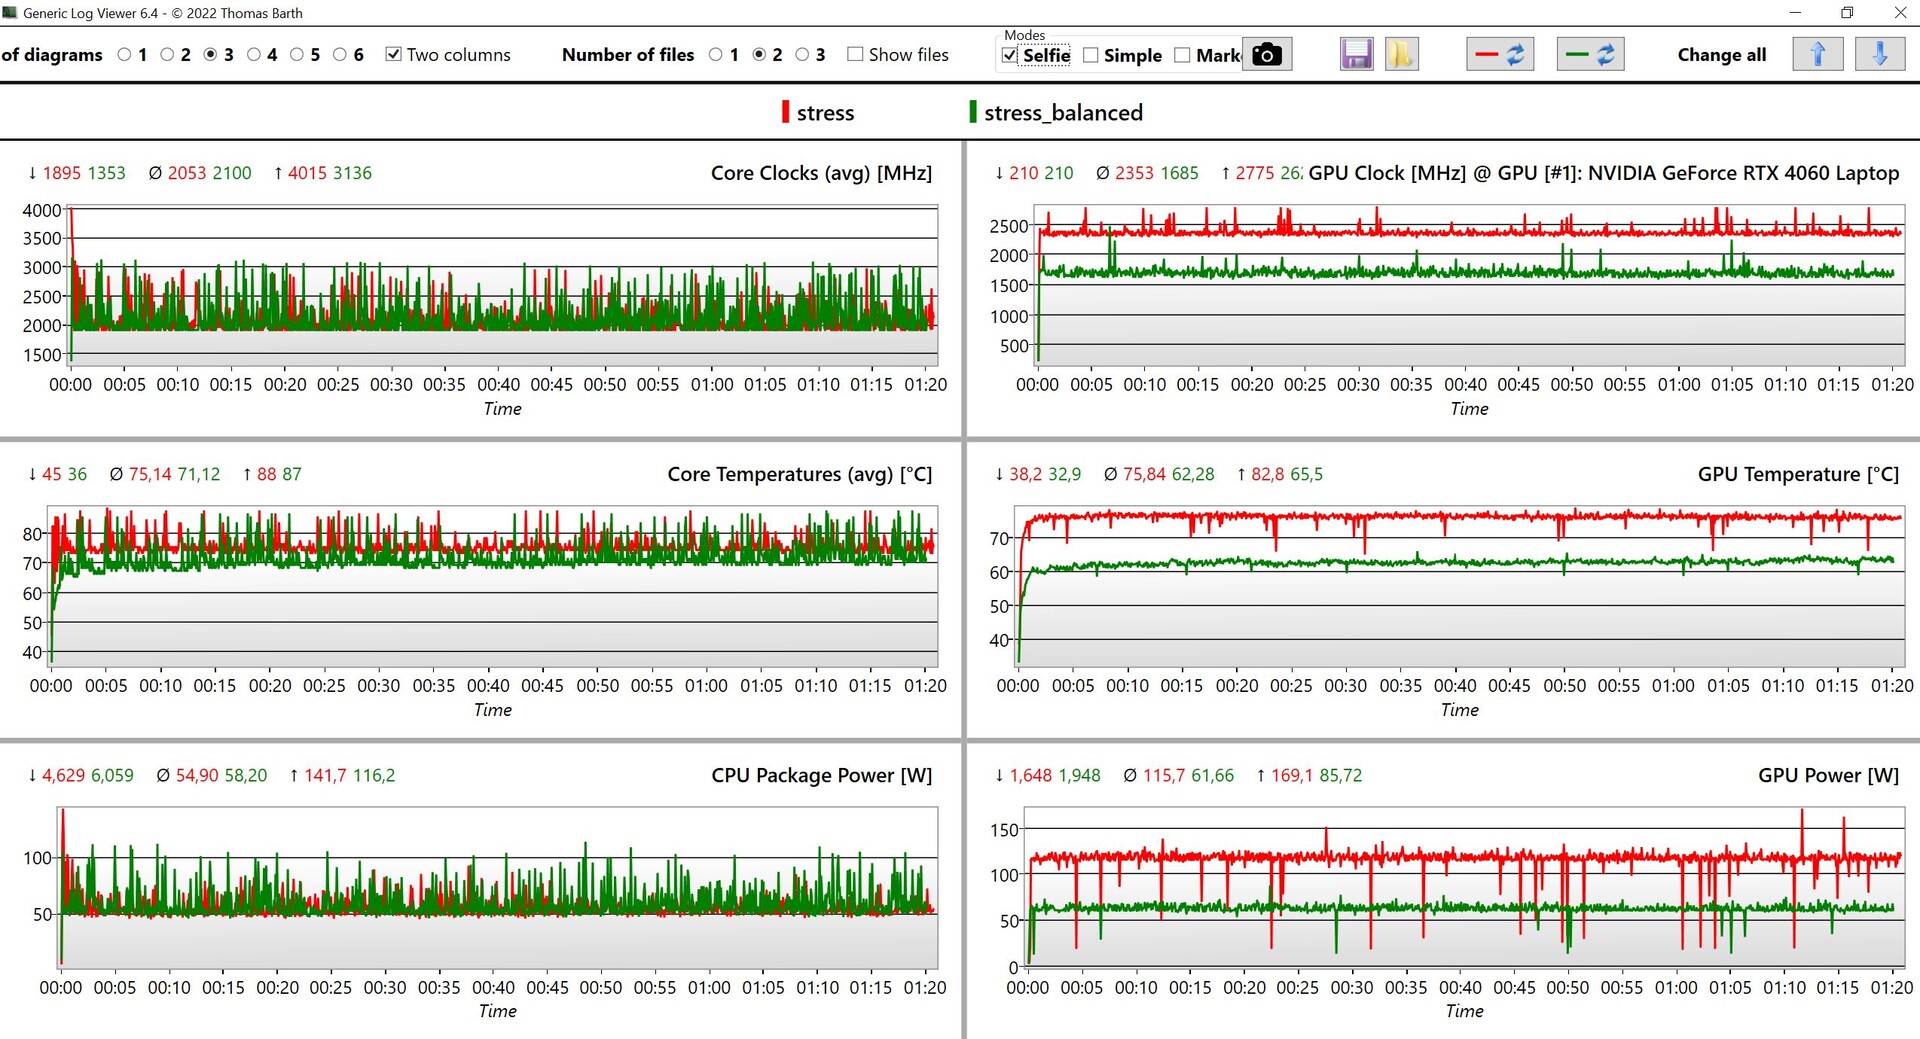
Além de usar o modo de desempenho, também executamos o teste de estresse usando o modo balanceado e reunimos os resultados no diagrama a seguir. Em ambos os perfis, o senhor pode ver o quanto o consumo do processador flutua, mas a GPU permanece constante e é aí que a diferença clara entre os dois perfis pode ser vista. No modo de desempenho, a GPU opera com 115 watts e, no modo balanceado, medimos pouco mais de 60 watts.
(±) A temperatura máxima no lado superior é 40.4 °C / 105 F, em comparação com a média de 40.4 °C / 105 F , variando de 21.2 a 68.8 °C para a classe Gaming.
(±) A parte inferior aquece até um máximo de 43.8 °C / 111 F, em comparação com a média de 43.2 °C / 110 F
(+) Em uso inativo, a temperatura média para o lado superior é 28 °C / 82 F, em comparação com a média do dispositivo de 33.9 °C / ### class_avg_f### F.
(±) Jogando The Witcher 3, a temperatura média para o lado superior é 33.2 °C / 92 F, em comparação com a média do dispositivo de 33.9 °C / ## #class_avg_f### F.
(+) Os apoios para as mãos e o touchpad são mais frios que a temperatura da pele, com um máximo de 26.9 °C / 80.4 F e, portanto, são frios ao toque.
(±) A temperatura média da área do apoio para as mãos de dispositivos semelhantes foi 28.8 °C / 83.8 F (+1.9 °C / 3.4 F).
| Lenovo Legion 5 16IRX G9 Intel Core i7-14650HX, NVIDIA GeForce RTX 4060 Laptop GPU | Schenker XMG CORE 16 (L23) AMD Ryzen 7 7840HS, NVIDIA GeForce RTX 4070 Laptop GPU | HP Victus 16-r0077ng Intel Core i7-13700H, NVIDIA GeForce RTX 4070 Laptop GPU | Lenovo LOQ 16IRH8 Intel Core i7-13620H, NVIDIA GeForce RTX 4060 Laptop GPU | Lenovo Legion Slim 5 16APH8 AMD Ryzen 7 7840HS, NVIDIA GeForce RTX 4060 Laptop GPU | HP Victus 16-r0076TX Intel Core i5-13500HX, NVIDIA GeForce RTX 4050 Laptop GPU | Alienware m16 R1 Intel Intel Core i7-13700HX, NVIDIA GeForce RTX 4060 Laptop GPU | Lenovo Legion Pro 5 16IRX8 Intel Core i7-13700HX, NVIDIA GeForce RTX 4060 Laptop GPU | |
|---|---|---|---|---|---|---|---|---|
| Heat | -3% | -13% | -6% | 9% | -3% | -18% | -4% | |
| Maximum Upper Side * (°C) | 40.4 | 46 -14% | 51 -26% | 48 -19% | 40.6 -0% | 48 -19% | 49 -21% | 42.8 -6% |
| Maximum Bottom * (°C) | 43.8 | 44 -0% | 54 -23% | 59 -35% | 42 4% | 48 -10% | 48 -10% | 50 -14% |
| Idle Upper Side * (°C) | 30.3 | 32 -6% | 37 -22% | 28 8% | 27.8 8% | 29.6 2% | 40 -32% | 29.6 2% |
| Idle Bottom * (°C) | 35.3 | 33 7% | 29 18% | 28 21% | 26.6 25% | 30.2 14% | 39 -10% | 34 4% |
* ... menor é melhor
Alto-falantes
Os dois alto-falantes estéreo (2 watts cada) fornecem apenas um som médio, suficiente para alguns vídeos e música de fundo. No entanto, o senhor não se beneficiará dos alto-falantes ao jogar, pois as ventoinhas são muito altas.
Lenovo Legion 5 16IRX G9 análise de áudio
(+) | os alto-falantes podem tocar relativamente alto (###valor### dB)
Graves 100 - 315Hz
(-) | quase nenhum baixo - em média 25.7% menor que a mediana
(±) | a linearidade dos graves é média (8.3% delta para a frequência anterior)
Médios 400 - 2.000 Hz
(+) | médios equilibrados - apenas 4.3% longe da mediana
(+) | médios são lineares (5.2% delta para frequência anterior)
Altos 2 - 16 kHz
(+) | agudos equilibrados - apenas 1.9% longe da mediana
(+) | os máximos são lineares (2.1% delta da frequência anterior)
Geral 100 - 16.000 Hz
(±) | a linearidade do som geral é média (16.1% diferença em relação à mediana)
Comparado com a mesma classe
» 39% de todos os dispositivos testados nesta classe foram melhores, 6% semelhantes, 54% piores
» O melhor teve um delta de 6%, a média foi 18%, o pior foi 132%
Comparado com todos os dispositivos testados
» 26% de todos os dispositivos testados foram melhores, 5% semelhantes, 69% piores
» O melhor teve um delta de 4%, a média foi 24%, o pior foi 134%
Schenker XMG CORE 16 (L23) análise de áudio
(±) | o volume do alto-falante é médio, mas bom (###valor### dB)
Graves 100 - 315Hz
(-) | quase nenhum baixo - em média 21.6% menor que a mediana
(±) | a linearidade dos graves é média (11.4% delta para a frequência anterior)
Médios 400 - 2.000 Hz
(±) | médios mais altos - em média 5.4% maior que a mediana
(+) | médios são lineares (6.7% delta para frequência anterior)
Altos 2 - 16 kHz
(+) | agudos equilibrados - apenas 2.3% longe da mediana
(+) | os máximos são lineares (6.6% delta da frequência anterior)
Geral 100 - 16.000 Hz
(±) | a linearidade do som geral é média (17.1% diferença em relação à mediana)
Comparado com a mesma classe
» 46% de todos os dispositivos testados nesta classe foram melhores, 12% semelhantes, 43% piores
» O melhor teve um delta de 6%, a média foi 18%, o pior foi 132%
Comparado com todos os dispositivos testados
» 31% de todos os dispositivos testados foram melhores, 8% semelhantes, 61% piores
» O melhor teve um delta de 4%, a média foi 24%, o pior foi 134%
Alienware m16 R1 Intel análise de áudio
(+) | os alto-falantes podem tocar relativamente alto (###valor### dB)
Graves 100 - 315Hz
(-) | quase nenhum baixo - em média 24% menor que a mediana
(±) | a linearidade dos graves é média (13.5% delta para a frequência anterior)
Médios 400 - 2.000 Hz
(+) | médios equilibrados - apenas 1.4% longe da mediana
(+) | médios são lineares (3.3% delta para frequência anterior)
Altos 2 - 16 kHz
(+) | agudos equilibrados - apenas 3.5% longe da mediana
(+) | os máximos são lineares (4.6% delta da frequência anterior)
Geral 100 - 16.000 Hz
(+) | o som geral é linear (13.4% diferença em relação à mediana)
Comparado com a mesma classe
» 19% de todos os dispositivos testados nesta classe foram melhores, 7% semelhantes, 74% piores
» O melhor teve um delta de 6%, a média foi 18%, o pior foi 132%
Comparado com todos os dispositivos testados
» 14% de todos os dispositivos testados foram melhores, 4% semelhantes, 83% piores
» O melhor teve um delta de 4%, a média foi 24%, o pior foi 134%
Gerenciamento de energia
Consumo de energia
Não notamos grandes surpresas no que diz respeito ao consumo do dispositivo e medimos um máximo de cerca de 20 watts no modo inativo, o que é aceitável, considerando a tela grande e o alto brilho. Durante o teste de estresse, o consumo máximo foi brevemente de ~247 watts, mas logo se estabilizou em 230 watts. Como resultado, a fonte de alimentação de 230 watts estará no seu limite se o senhor usar o modo de desempenho. No modo balanceado, o consumo do laptop se estabilizou em cerca de 180 watts.
| desligado | |
| Ocioso | |
| Carga |
|
Key:
min: | |
| Lenovo Legion 5 16IRX G9 i7-14650HX, GeForce RTX 4060 Laptop GPU, Samsung PM9A1 MZVL21T0HCLR, IPS, 2560x1600, 16" | Schenker XMG CORE 16 (L23) R7 7840HS, GeForce RTX 4070 Laptop GPU, Samsung 990 Pro 1 TB, IPS, 2560x1600, 16" | HP Victus 16-r0077ng i7-13700H, GeForce RTX 4070 Laptop GPU, Kioxia XG8 KXG80ZNV1T02, IPS, 1920x1080, 16.1" | Lenovo LOQ 16IRH8 i7-13620H, GeForce RTX 4060 Laptop GPU, Solidigm SSDPFINW512GZL, IPS, 2560x1600, 16" | Lenovo Legion Slim 5 16APH8 R7 7840HS, GeForce RTX 4060 Laptop GPU, SK hynix PC801 HFS512GEJ9X115N, IPS, 2560x1600, 16" | HP Victus 16-r0076TX i5-13500HX, GeForce RTX 4050 Laptop GPU, SK hynix PC801 HFS512GEJ9X101N BF, IPS, 1920x1080, 16.1" | Alienware m16 R1 Intel i7-13700HX, GeForce RTX 4060 Laptop GPU, Kioxia KXG70ZNV512G, IPS, 2560x1600, 16" | Lenovo Legion Pro 5 16IRX8 i7-13700HX, GeForce RTX 4060 Laptop GPU, SK hynix PC801 HFS512GEJ9X115N, IPS, 2560x1600, 16" | Média NVIDIA GeForce RTX 4060 Laptop GPU | Média da turma Gaming | |
|---|---|---|---|---|---|---|---|---|---|---|
| Power Consumption | 18% | 21% | 4% | 21% | 2% | 3% | -27% | 14% | -2% | |
| Idle Minimum * (Watt) | 15.4 | 11 29% | 8 48% | 17.2 -12% | 9.4 39% | 16.12 -5% | 10 35% | 24.5 -59% | 11.5 ? 25% | 13.3 ? 14% |
| Idle Average * (Watt) | 19.7 | 15.2 23% | 13 34% | 19.3 2% | 15.5 21% | 20.47 -4% | 14 29% | 29.2 -48% | 16 ? 19% | 19 ? 4% |
| Idle Maximum * (Watt) | 20.7 | 16 23% | 22 -6% | 21.2 -2% | 24.4 -18% | 22.11 -7% | 21 -1% | 34.3 -66% | 20.3 ? 2% | 24.5 ? -18% |
| Load Average * (Watt) | 102.6 | 64 38% | 86 16% | 90 12% | 74.1 28% | 94.8 8% | 119 -16% | 98.7 4% | 92.9 ? 9% | 108.1 ? -5% |
| Witcher 3 ultra * (Watt) | 191.3 | 179 6% | 141.8 26% | 168 12% | 112.9 41% | 166.9 13% | 186.7 2% | 178.6 7% | ||
| Load Maximum * (Watt) | 246.6 | 280 -14% | 233 6% | 211 14% | 206.5 16% | 237 4% | 323 -31% | 249.6 -1% | 210 ? 15% | 254 ? -3% |
* ... menor é melhor
Power consumption Witcher 3 / stress test
Power consumption with external monitor
Tempos de execução
O Legion 5i 16 tem uma bateria de 80 Wh, que é a menor capacidade em nosso campo de comparação. Por sua vez, seus resultados não são tão ruins e, a 150 cd/m² (61% do brilho total do nosso dispositivo de teste), um vídeo foi executado por cerca de 9,5 horas e nosso teste WLAN durou cerca de 7,5 horas (~5,5 horas com brilho máximo). Sob carga, o laptop já está esgotado após 46 minutos e um vídeo HDR só foi reproduzido por 2:14 horas com brilho máximo. Com 240 Hz selecionado, nossos tempos de execução do teste WLAN caíram para 5:27 horas (150 cd/m²) e 4:33 horas (brilho total).
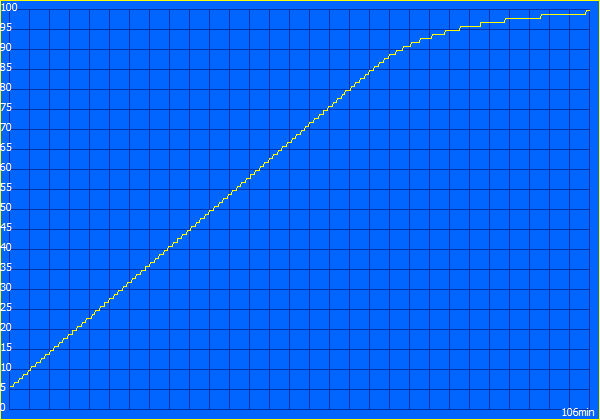
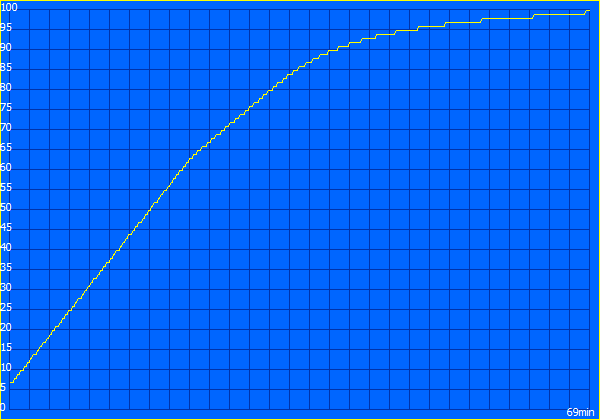
Uma carga completa leva 106 minutos com o dispositivo ligado, sendo que 80% são atingidos após cerca de 60 minutos. No aplicativo Vantage, o senhor também tem uma opção chamada "carregamento expresso", que faz com que os primeiros 60% sejam carregados mais rapidamente. Uma carga completa leva apenas 69 minutos usando esse modo (80% após 31 minutos).
| Lenovo Legion 5 16IRX G9 i7-14650HX, GeForce RTX 4060 Laptop GPU, 80 Wh | Schenker XMG CORE 16 (L23) R7 7840HS, GeForce RTX 4070 Laptop GPU, 99 Wh | HP Victus 16-r0077ng i7-13700H, GeForce RTX 4070 Laptop GPU, 83 Wh | Lenovo LOQ 16IRH8 i7-13620H, GeForce RTX 4060 Laptop GPU, 80 Wh | Lenovo Legion Slim 5 16APH8 R7 7840HS, GeForce RTX 4060 Laptop GPU, 80 Wh | HP Victus 16-r0076TX i5-13500HX, GeForce RTX 4050 Laptop GPU, 83 Wh | Alienware m16 R1 Intel i7-13700HX, GeForce RTX 4060 Laptop GPU, 86 Wh | Lenovo Legion Pro 5 16IRX8 i7-13700HX, GeForce RTX 4060 Laptop GPU, 80 Wh | Média da turma Gaming | |
|---|---|---|---|---|---|---|---|---|---|
| Duração da bateria | 73% | -4% | 13% | 23% | 17% | -17% | -34% | 22% | |
| H.264 (h) | 9.6 | 10.2 6% | 6.4 -33% | 7.7 -20% | 5.6 -42% | 8.26 ? -14% | |||
| WiFi v1.3 (h) | 7.4 | 8.4 14% | 7.1 -4% | 6.3 -15% | 7.1 -4% | 8.9 20% | 4.8 -35% | 3.4 -54% | 7.01 ? -5% |
| Load (h) | 0.8 | 2.4 200% | 1.5 88% | 1.2 50% | 1.2 50% | 1 25% | 0.7 -13% | 1.47 ? 84% | |
| Witcher 3 ultra (h) | 1.5 |
Pro
Contra
Veredicto - O Legion 5i 16 tem tudo a ver com desempenho

No geral, o novo Lenovo Legion 5i 16 causou uma impressão muito boa durante nosso teste. A Lenovo se concentrou nos recursos mais importantes, oferecendo componentes rápidos em combinação com uma excelente tela IPS de 240 Hz, que já retrata as cores com precisão logo que sai da caixa e dispensa o PWM. O desempenho para jogos é excelente e é possível executar os jogos atuais nas resoluções e configurações mais altas - o senhor só não conseguirá contornar o upscaling DLSS quando se trata de traçado de raios. O novo processador Raptor-Lake-HX não é, de forma alguma, um milagre de eficiência, mas seu desempenho é bom.
Ao mesmo tempo, a unidade de resfriamento do laptop garante que o desempenho possa ser aproveitado o tempo todo. Além disso, gostamos da distribuição em todos os vários perfis de energia, e a Lenovo oferece aos usuários muitas opções de personalização quando se trata das configurações da CPU e da GPU. Durante os jogos, o dispositivo se mantém surpreendentemente frio, mas, por sua vez, as duas ventoinhas fazem muito barulho, o que significa que um fone de ouvido é um pouco indispensável para as sessões de jogos.
Ótimo desempenho e uma impressionante tela de 240 Hz: O Legion 5i 16 da Lenovo é um jogador rápido de médio porte que coloca o desempenho em primeiro plano. No entanto, suas funções de IA são apenas um artifício até o momento.
O novo AI Engine+ da Lenovo, que supostamente melhora o desempenho dos jogos com a ajuda de um chip de IA, não funcionou durante nosso teste. É possível que ele seja aprimorado por meio de uma atualização, mas, por enquanto, talvez o senhor queira ativar o modo de desempenho manual. Há alguns pontos que deixam claro que a Lenovo economizou algum dinheiro, já que o laptop não possui Thunderbolt ou uma porta Ethernet de 2,5 Gbits por segundo.
Por US$ 1.610, o novo Legion 5i 16 não é uma pechincha e, por esse preço, o senhor já pode obter modelos com o Laptop RTX 4070 (especialmente laptops a partir de 2023), mas mesmo nesse caso, não é possível evitar ter que fazer certos compromissos de exibição.
Preço e disponibilidade
O novo Lenovo Legion 5i 16IRX G9 pode ser adquirido diretamente no site da Lenovo por US$ 1.609,99.
Lenovo Legion 5 16IRX G9
- 01/29/2024 v7 (old)
Andreas Osthoff
Transparência
A seleção dos dispositivos a serem analisados é feita pela nossa equipe editorial. A amostra de teste foi fornecida ao autor como empréstimo pelo fabricante ou varejista para fins desta revisão. O credor não teve influência nesta revisão, nem o fabricante recebeu uma cópia desta revisão antes da publicação. Não houve obrigação de publicar esta revisão. Como empresa de mídia independente, a Notebookcheck não está sujeita à autoridade de fabricantes, varejistas ou editores.
É assim que o Notebookcheck está testando
Todos os anos, o Notebookcheck analisa de forma independente centenas de laptops e smartphones usando procedimentos padronizados para garantir que todos os resultados sejam comparáveis. Desenvolvemos continuamente nossos métodos de teste há cerca de 20 anos e definimos padrões da indústria no processo. Em nossos laboratórios de teste, equipamentos de medição de alta qualidade são utilizados por técnicos e editores experientes. Esses testes envolvem um processo de validação em vários estágios. Nosso complexo sistema de classificação é baseado em centenas de medições e benchmarks bem fundamentados, o que mantém a objetividade.Price comparison

