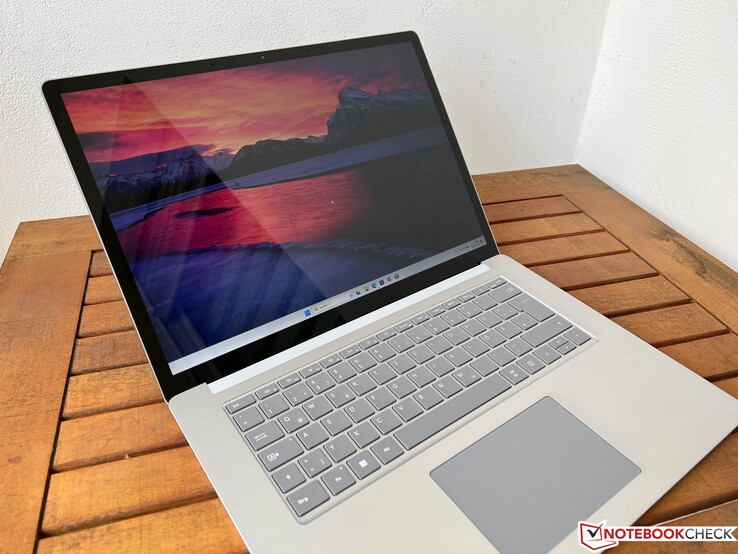
Análise do Microsoft Surface Laptop 5 15 - Design antigo por um preço premium
A Microsoft atualizou seu laptop Surface no final do ano passado, mas essa nova atualização não vem com muitos recursos novos. O fabricante decidiu abandonar a opção AMD para a 5ª geração e, em vez disso, agora oferece as versões de 13,5 e 15 polegadas exclusivamente com os processadores Intel Alder Lake. Além de seus novos processadores, praticamente nada mais mudou, já que os laptops ainda usam exatamente o mesmo gabinete. O preço, no entanto, permanece dentro da faixa premium e nossa configuração de teste - o modelo de 15 polegadas com o processador Core i7-1255U16 GB de RAM e um SSD de 512 GB - está sendo vendido atualmente pela Microsoft por um preço sugerido de cerca de US$ 4.000 - um preço excessivamente confiante, considerando as especificações técnicas do dispositivo. No entanto, o laptop pode ser encontrado muito mais barato em outros varejistas, com preços a partir de cerca de US$ 1.699. Testamos se o Surface Laptop 5 15 ainda pode competir com outros dispositivos semelhantes no início de 2023.
Possíveis concorrentes em comparação
Avaliação | Data | Modelo | Peso | Altura | Size | Resolução | Preço |
|---|---|---|---|---|---|---|---|
| 84.3 % v7 (old) | 04/2023 | Microsoft Surface Laptop 5 15, i7-1255U i7-1255U, Iris Xe G7 96EUs | 1.6 kg | 14.7 mm | 15.00" | 2496x1664 | |
| 84.9 % v7 (old) | 04/2021 | Microsoft Surface Laptop 4 15 AMD TFF_00028 R7 4980U, Vega 8 | 1.6 kg | 14.7 mm | 15.00" | 2496x1664 | |
| 85.9 % v7 (old) | 12/2022 | LG Gram 15Z90Q i5-1240P, Iris Xe G7 80EUs | 1.1 kg | 17.4 mm | 15.60" | 1920x1080 | |
| 89.5 % v7 (old) | 05/2022 | Dell XPS 15 9520 RTX 3050 Ti i7-12700H, GeForce RTX 3050 Ti Laptop GPU | 1.9 kg | 18 mm | 15.60" | 3456x2160 | |
| 87.3 % v7 (old) | 12/2021 | Samsung Galaxy Book Pro 15 NP950XDB-KC5US i7-1165G7, Iris Xe G7 96EUs | 1.1 kg | 11.7 mm | 15.60" | 1920x1080 | |
| 87.7 % v7 (old) | 05/2022 | Asus Zenbook Pro 15 OLED UM535Q R9 5900HX, GeForce RTX 3050 Ti Laptop GPU | 1.9 kg | 18 mm | 15.60" | 1920x1080 |
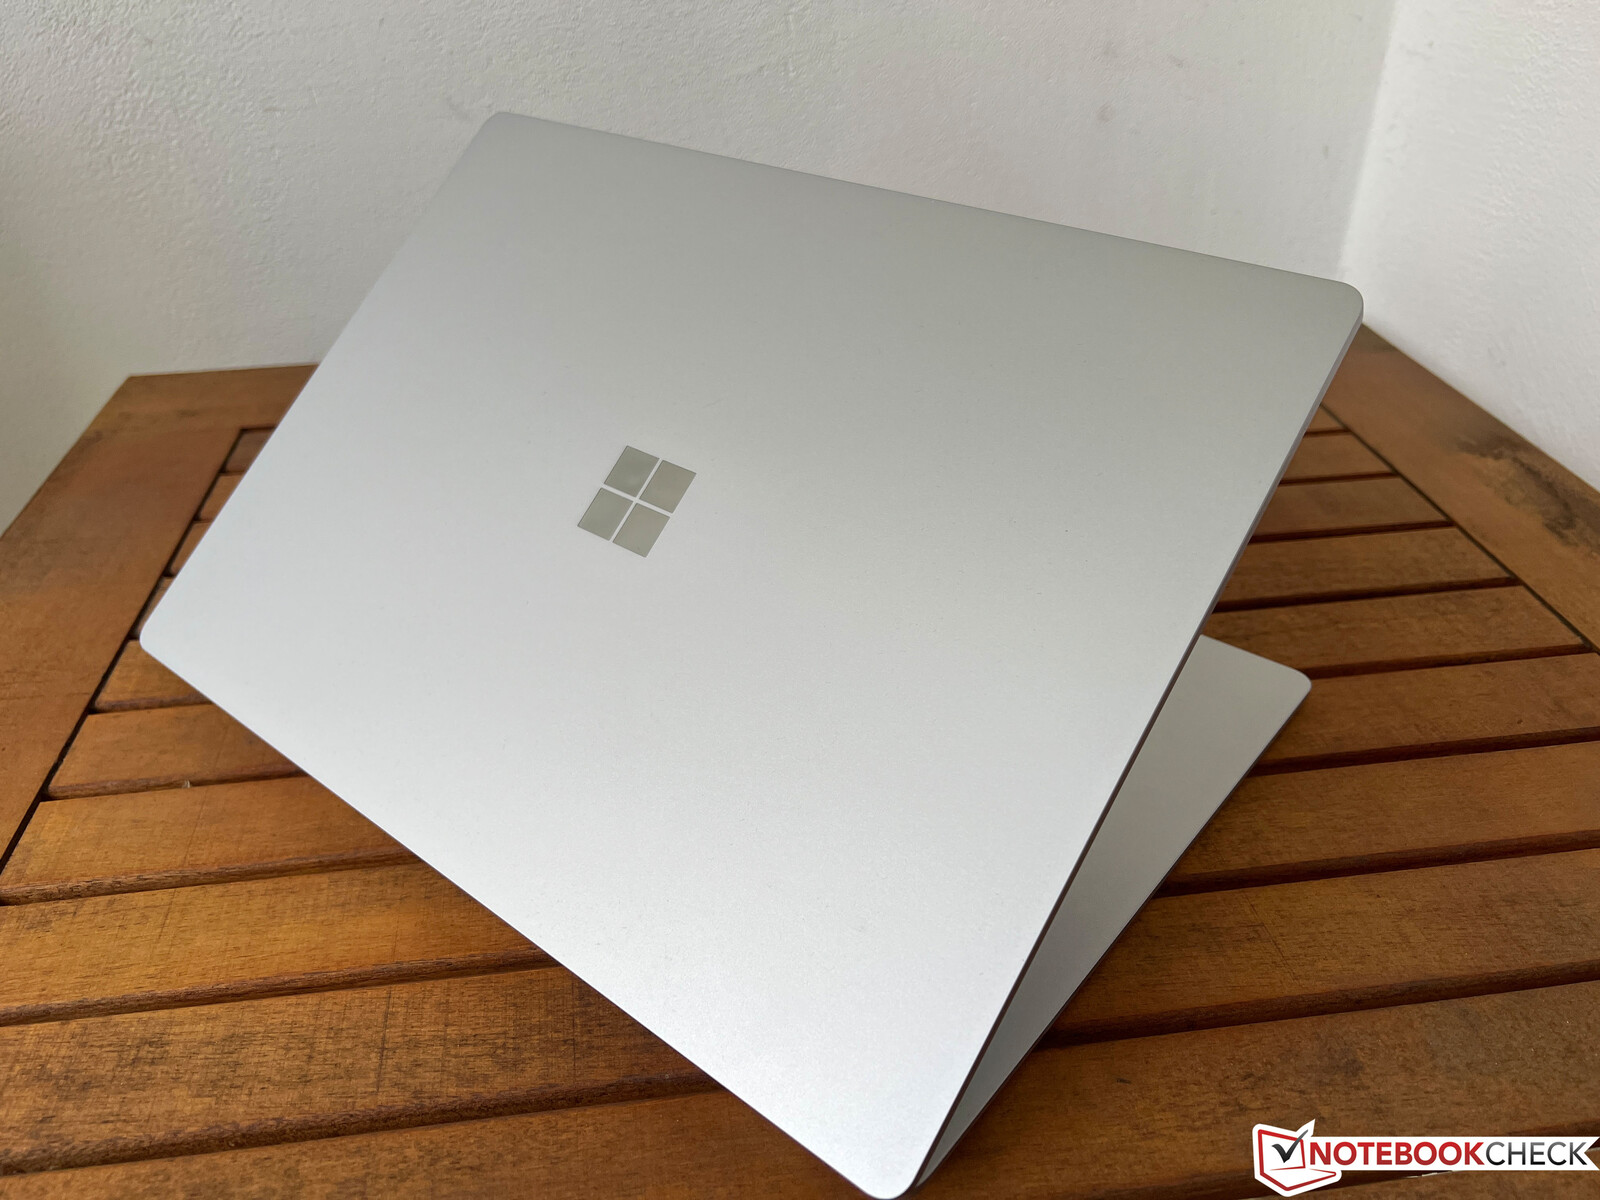
Estojo e recursos
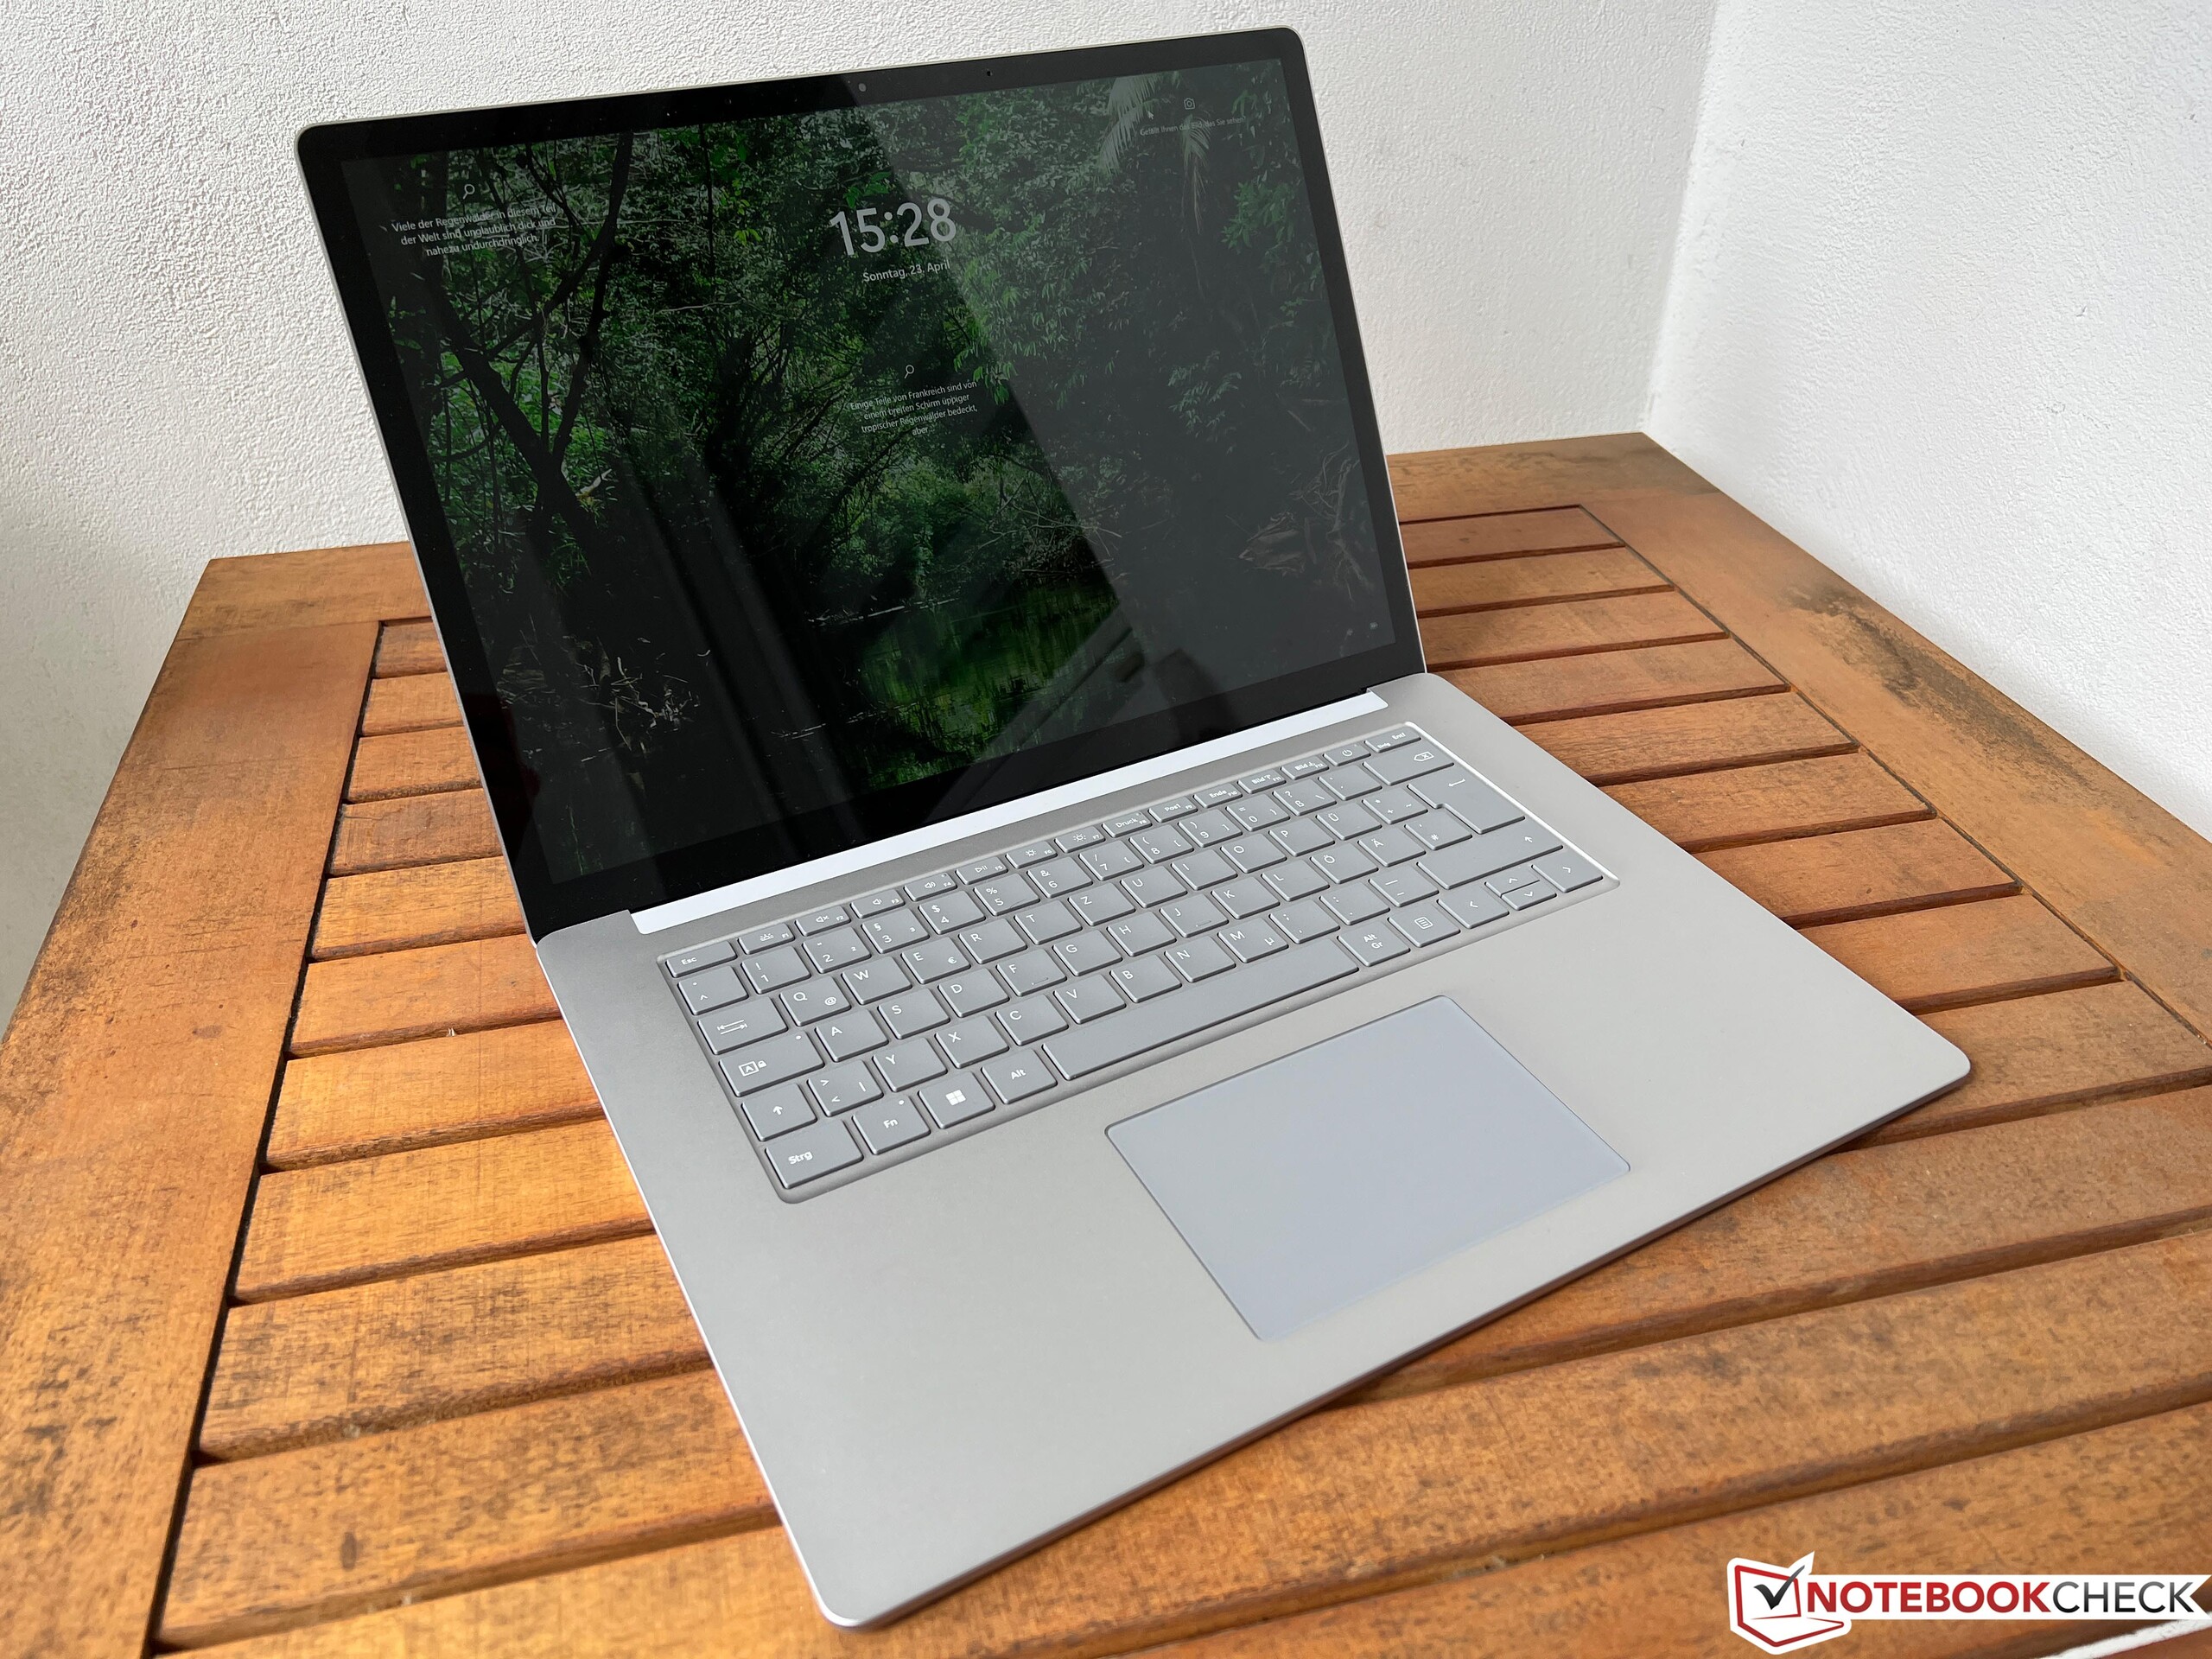
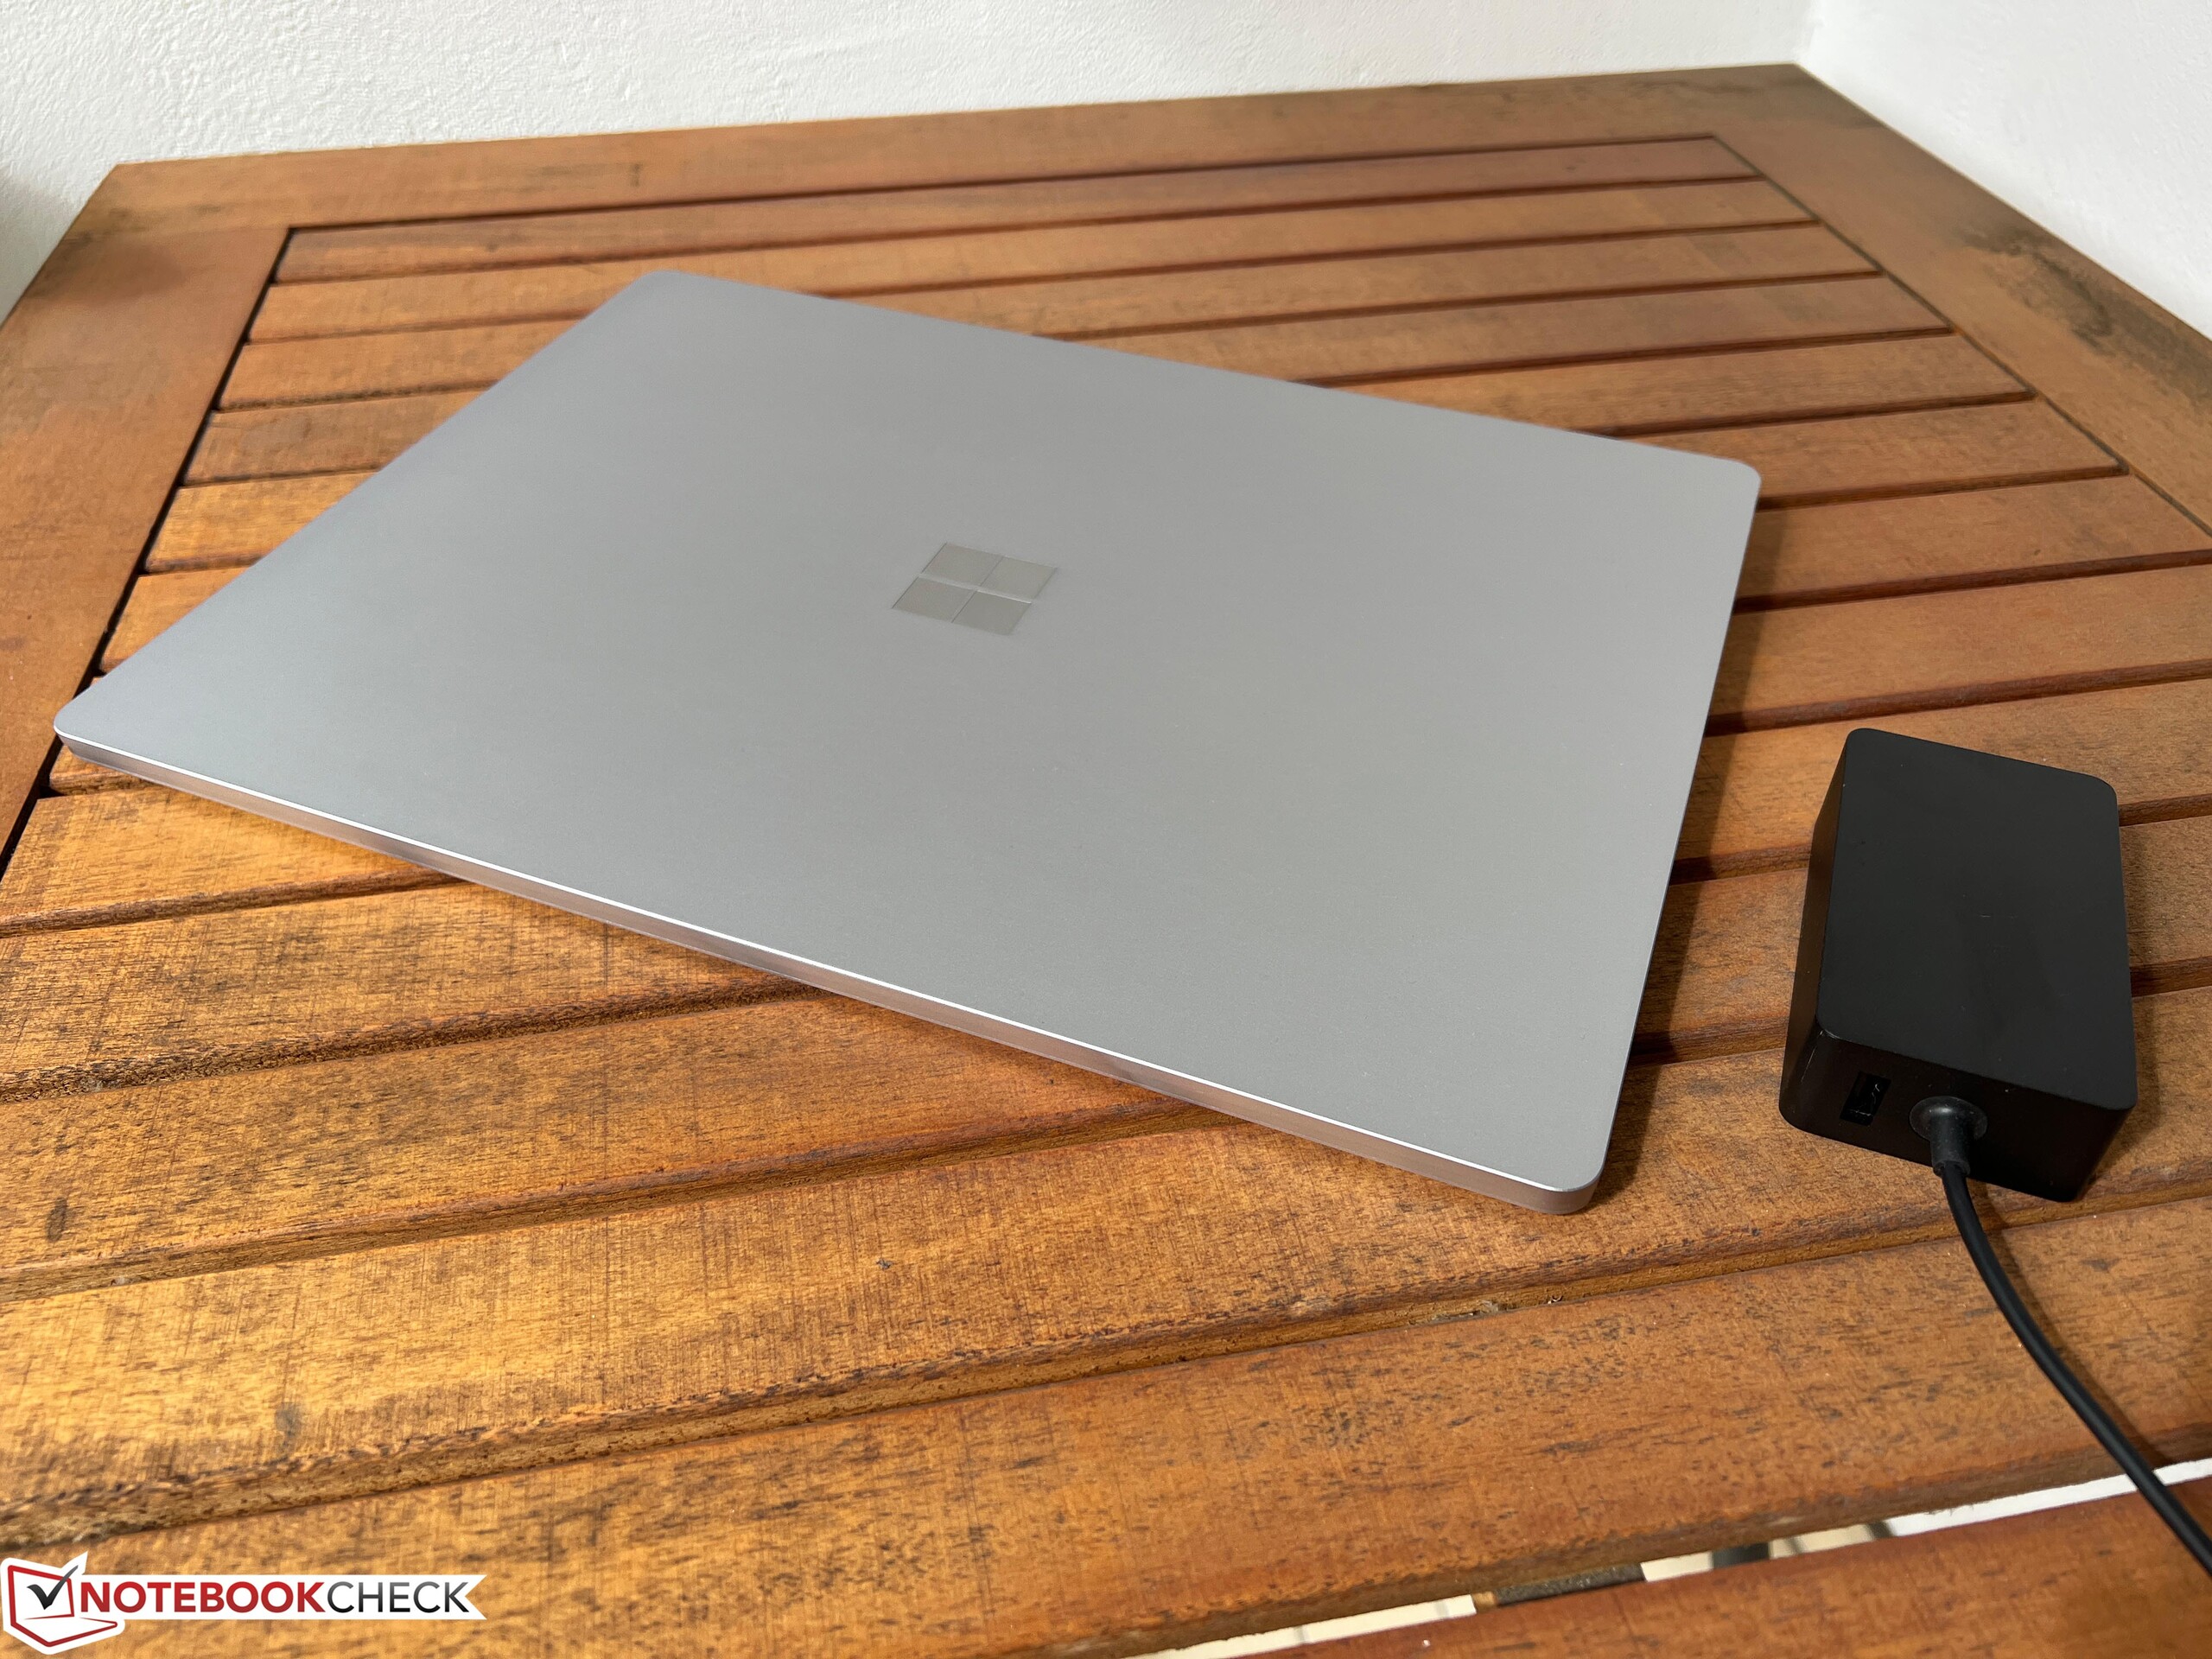
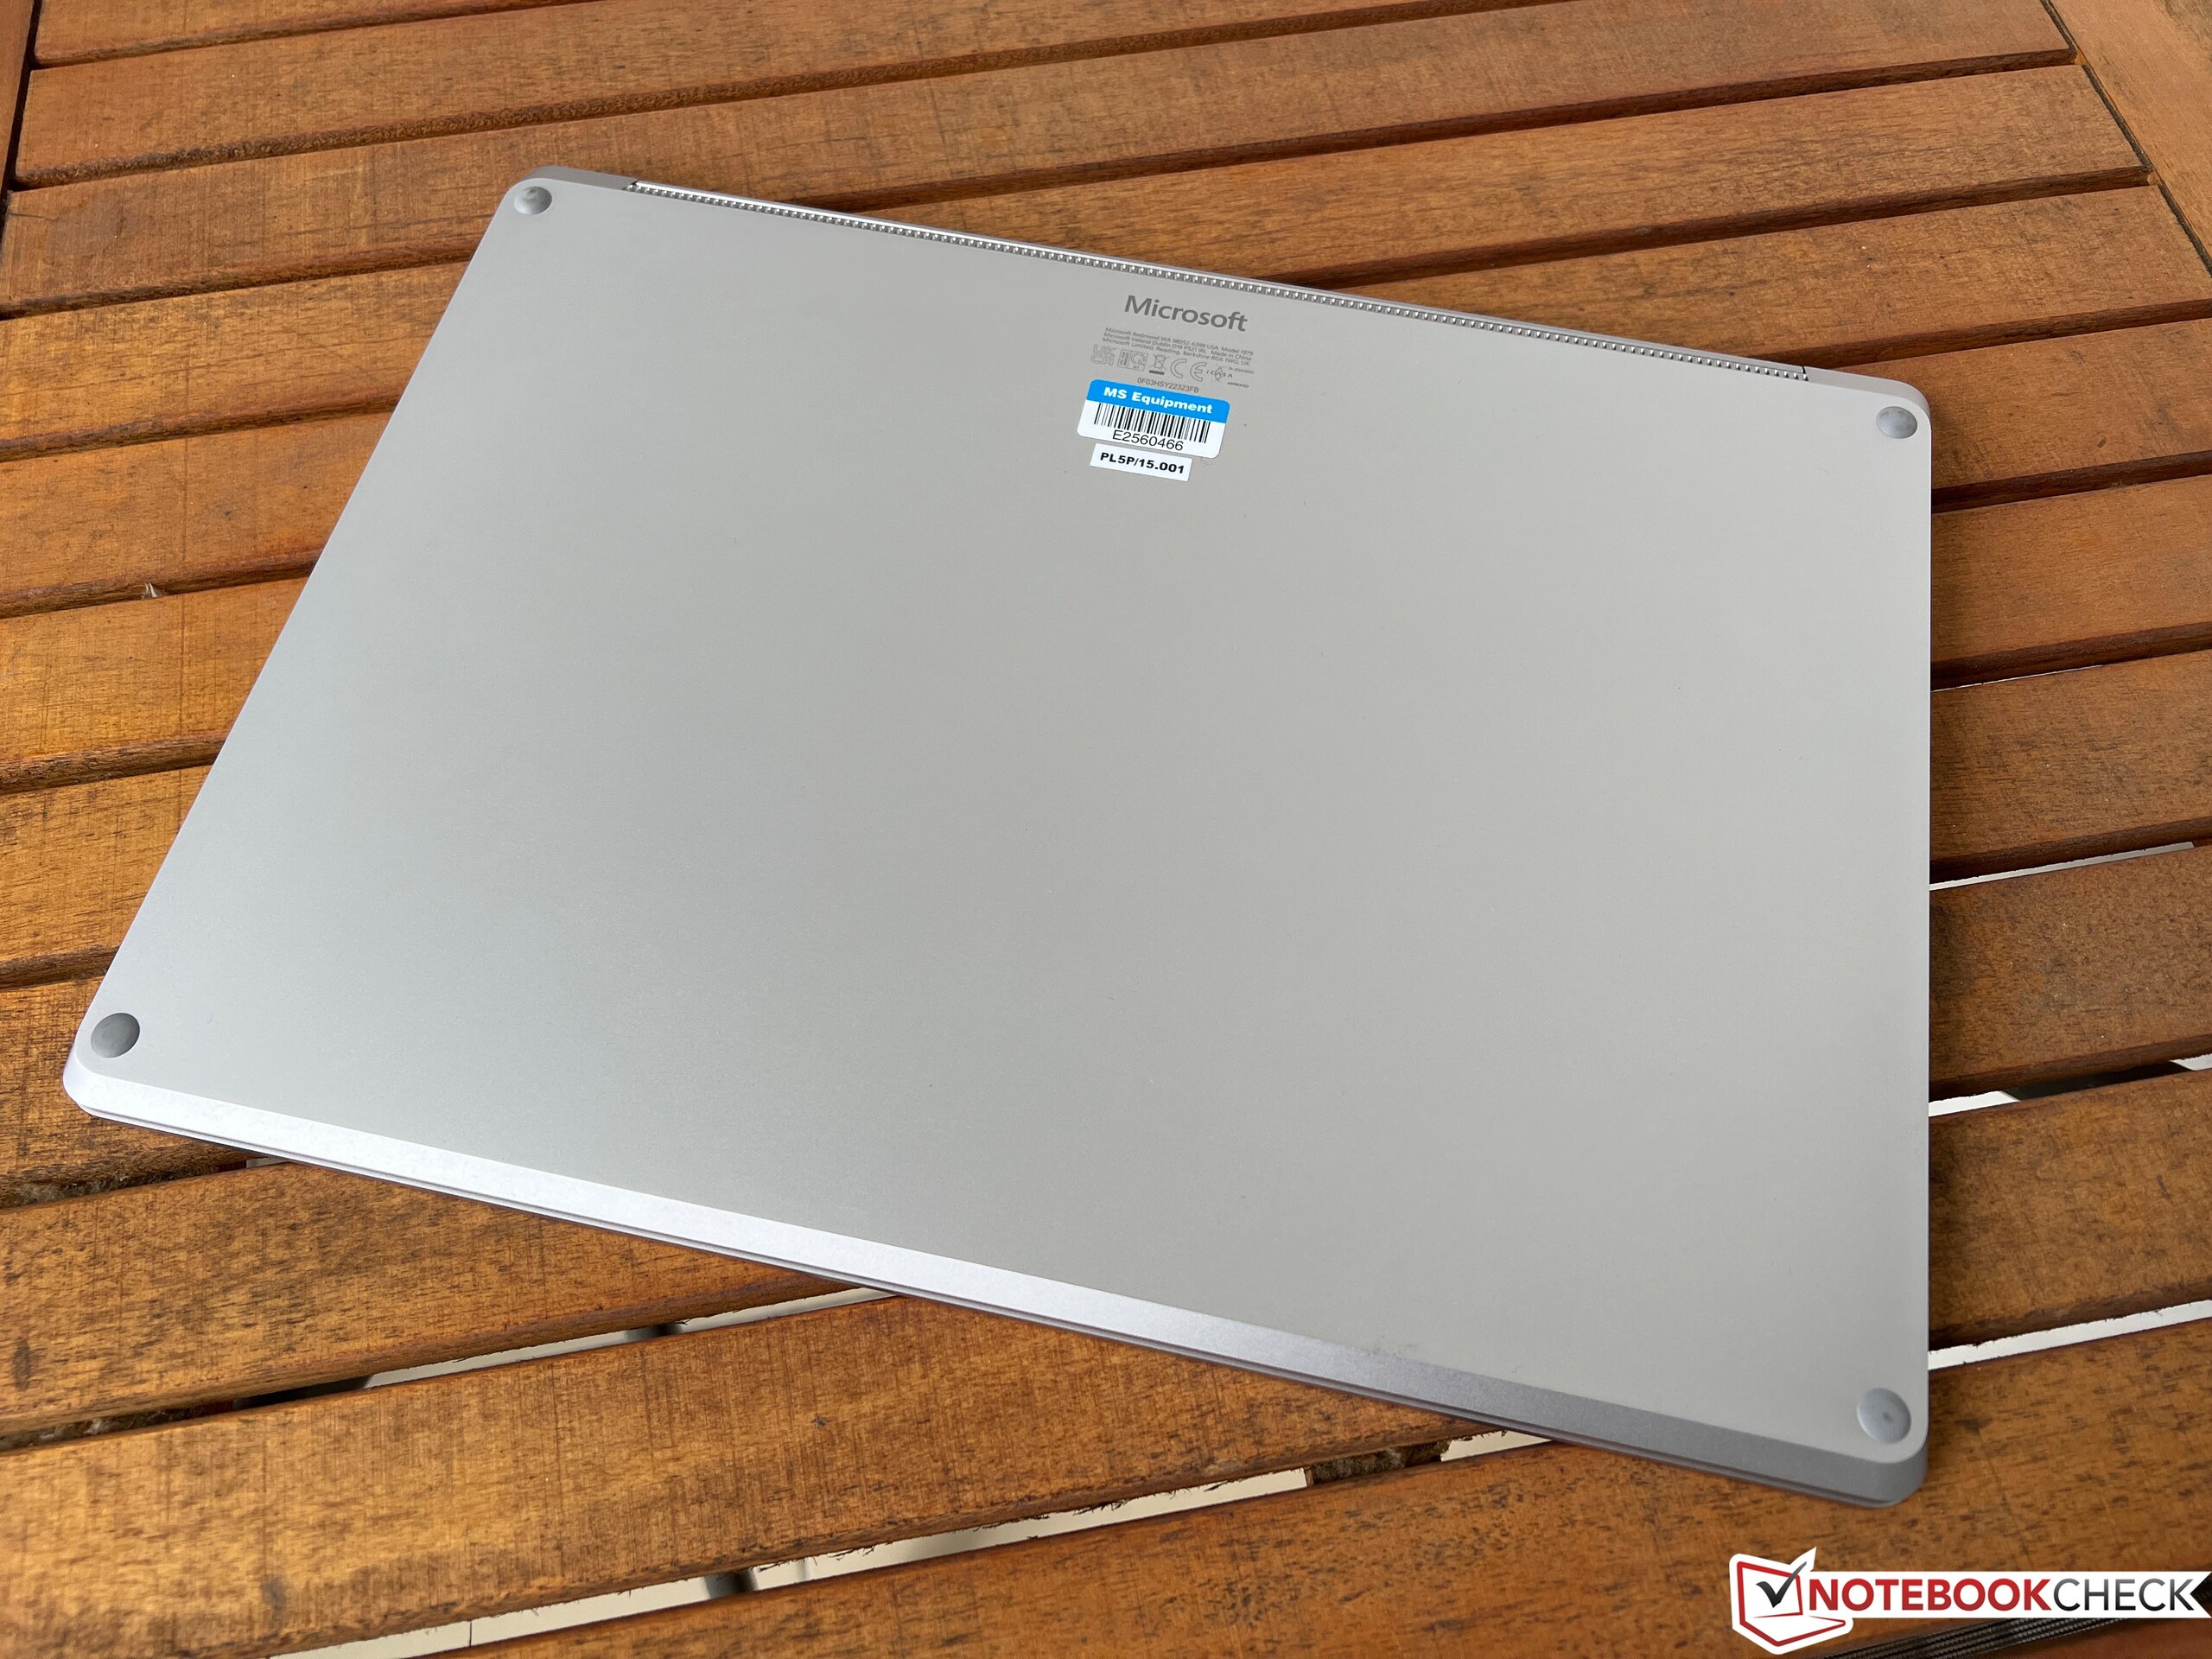
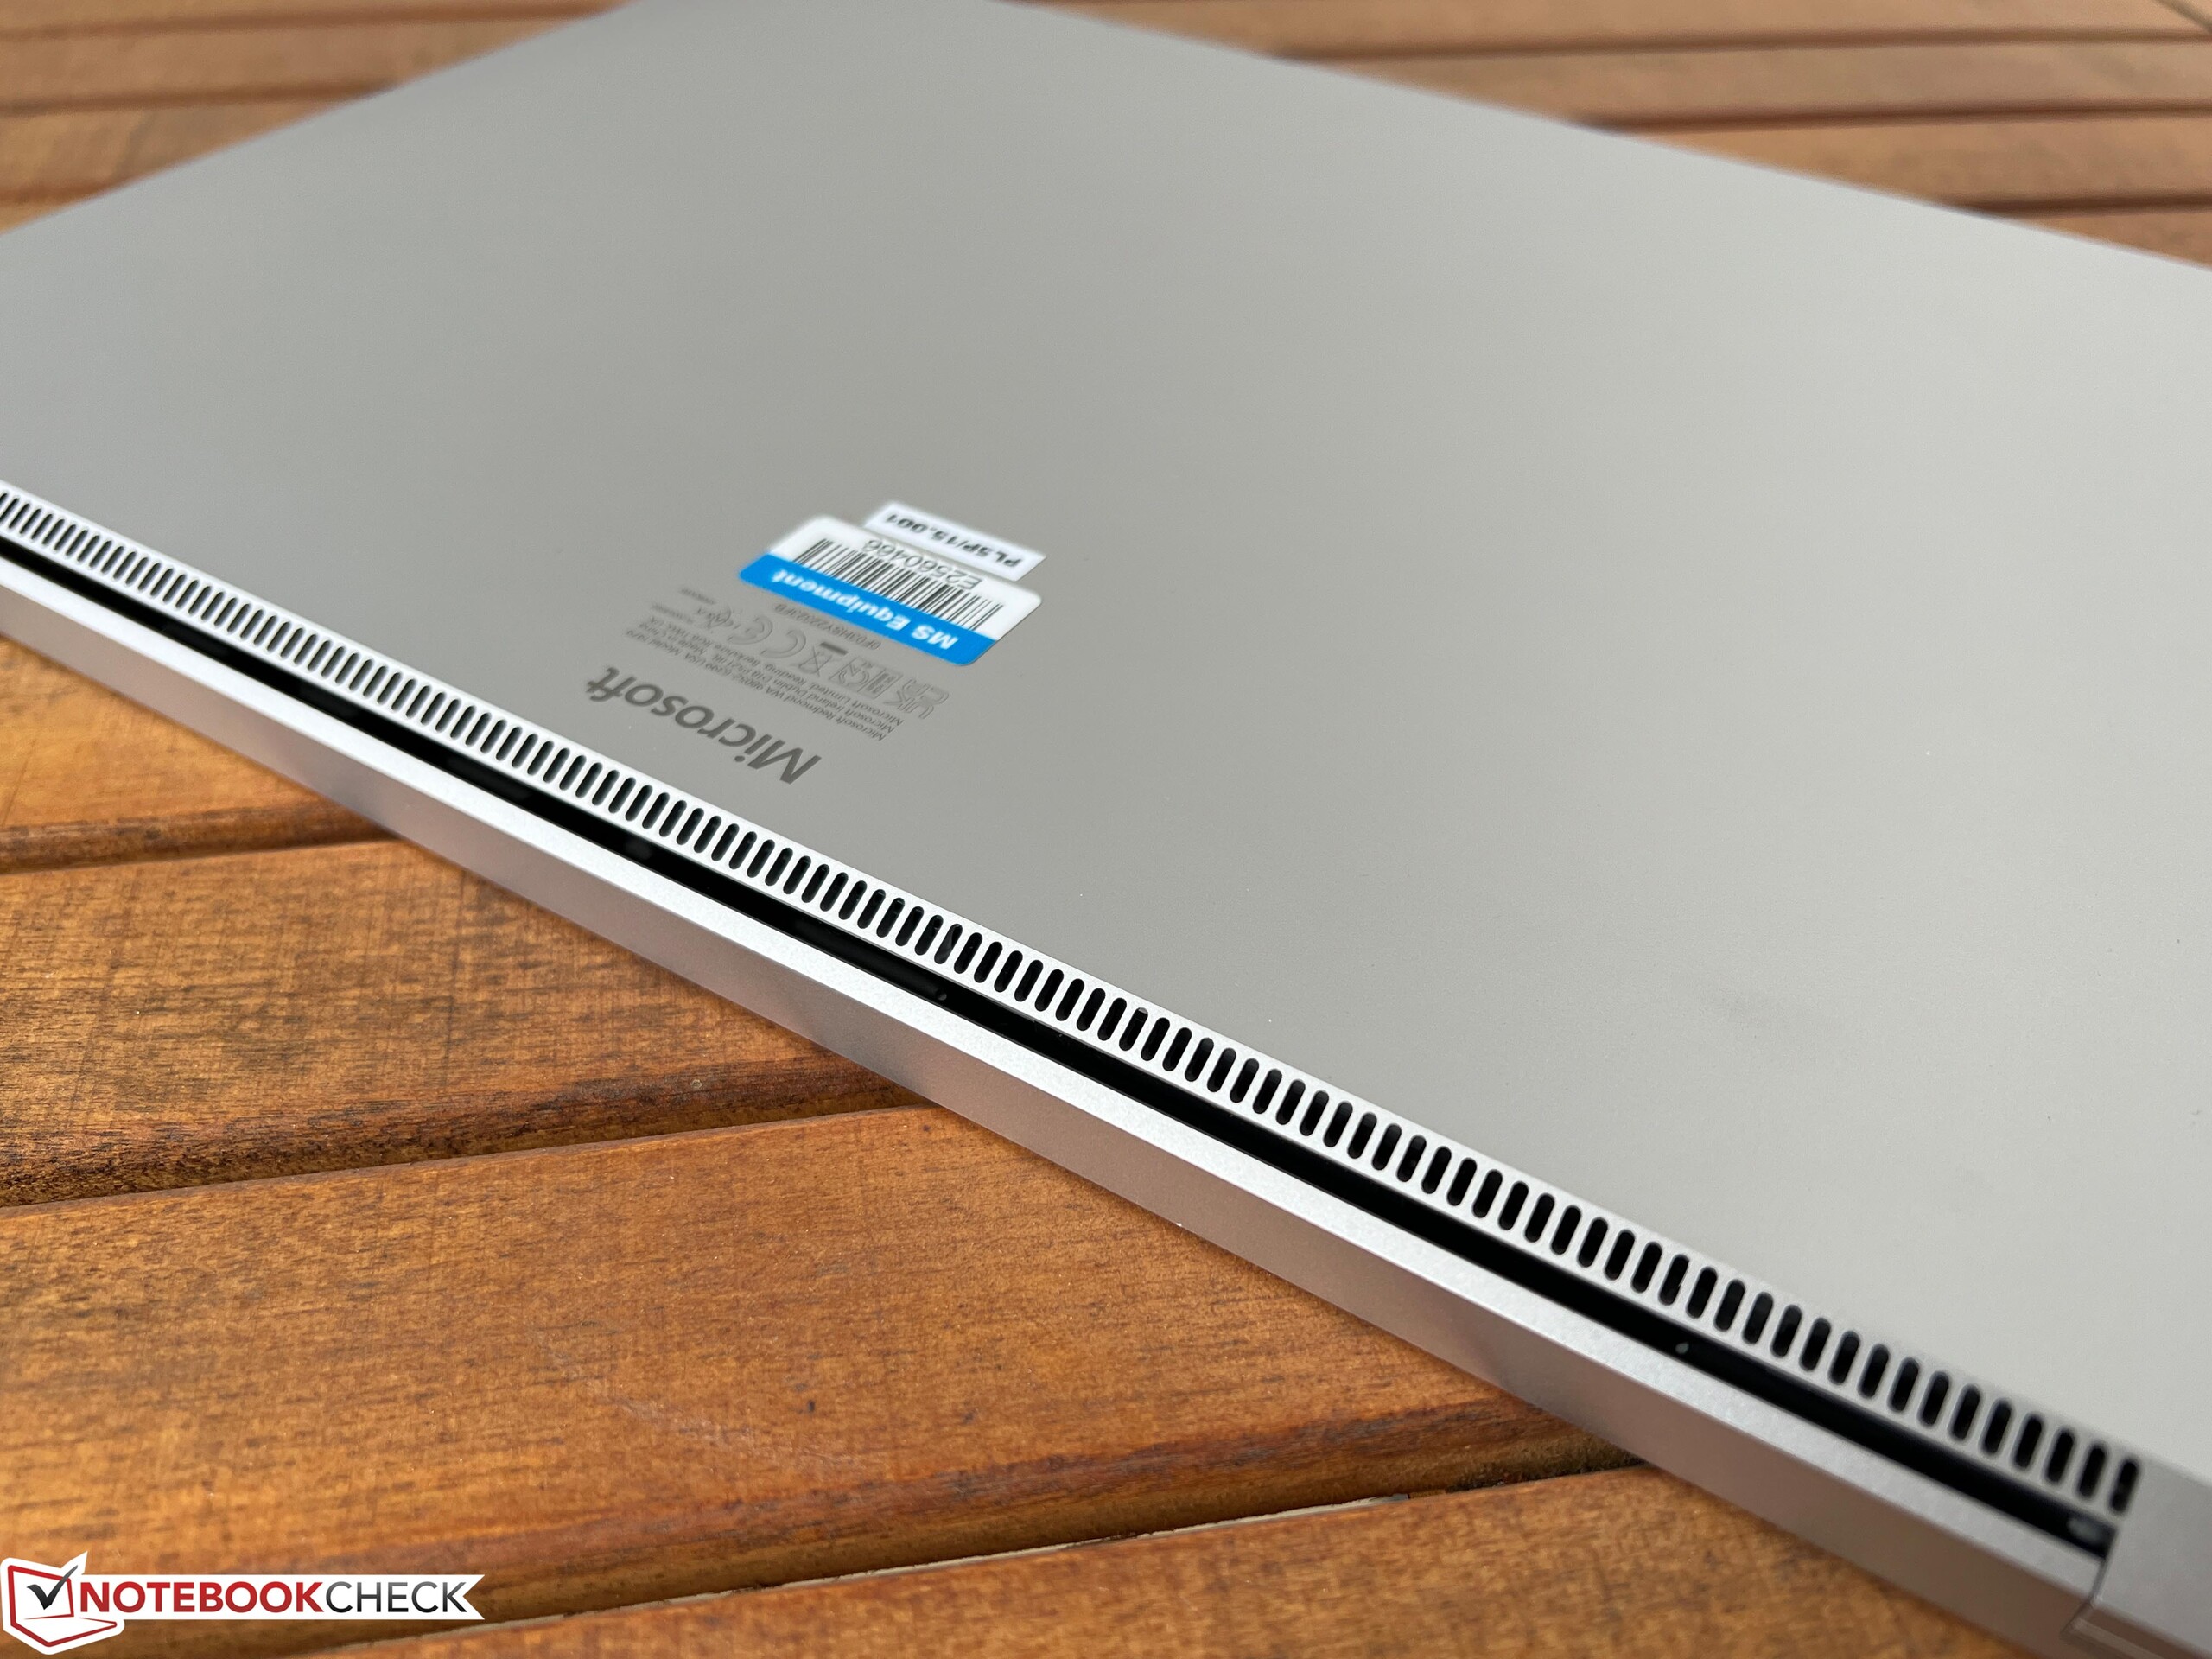
O gabinete do laptop permaneceu exatamente igual ao de seu antecessor. A Microsoft continua a oferecer as opções de cores platina e preta e, em geral, a caixa metálica do dispositivo é feita de materiais de boa qualidade, embora nosso dispositivo de teste tenha rangido muito quando manuseado. Além disso, suas bordas largas não são mais muito atuais, o que acaba mostrando a idade do design. As dobradiças da tela são ajustadas adequadamente (ângulo máximo de abertura ~135 graus), mas não conseguem evitar uma leve oscilação. O gabinete ainda não pode ser aberto, portanto, os usuários não podem limpar as ventoinhas, nem substituir ou atualizar nenhum dos componentes do laptop.
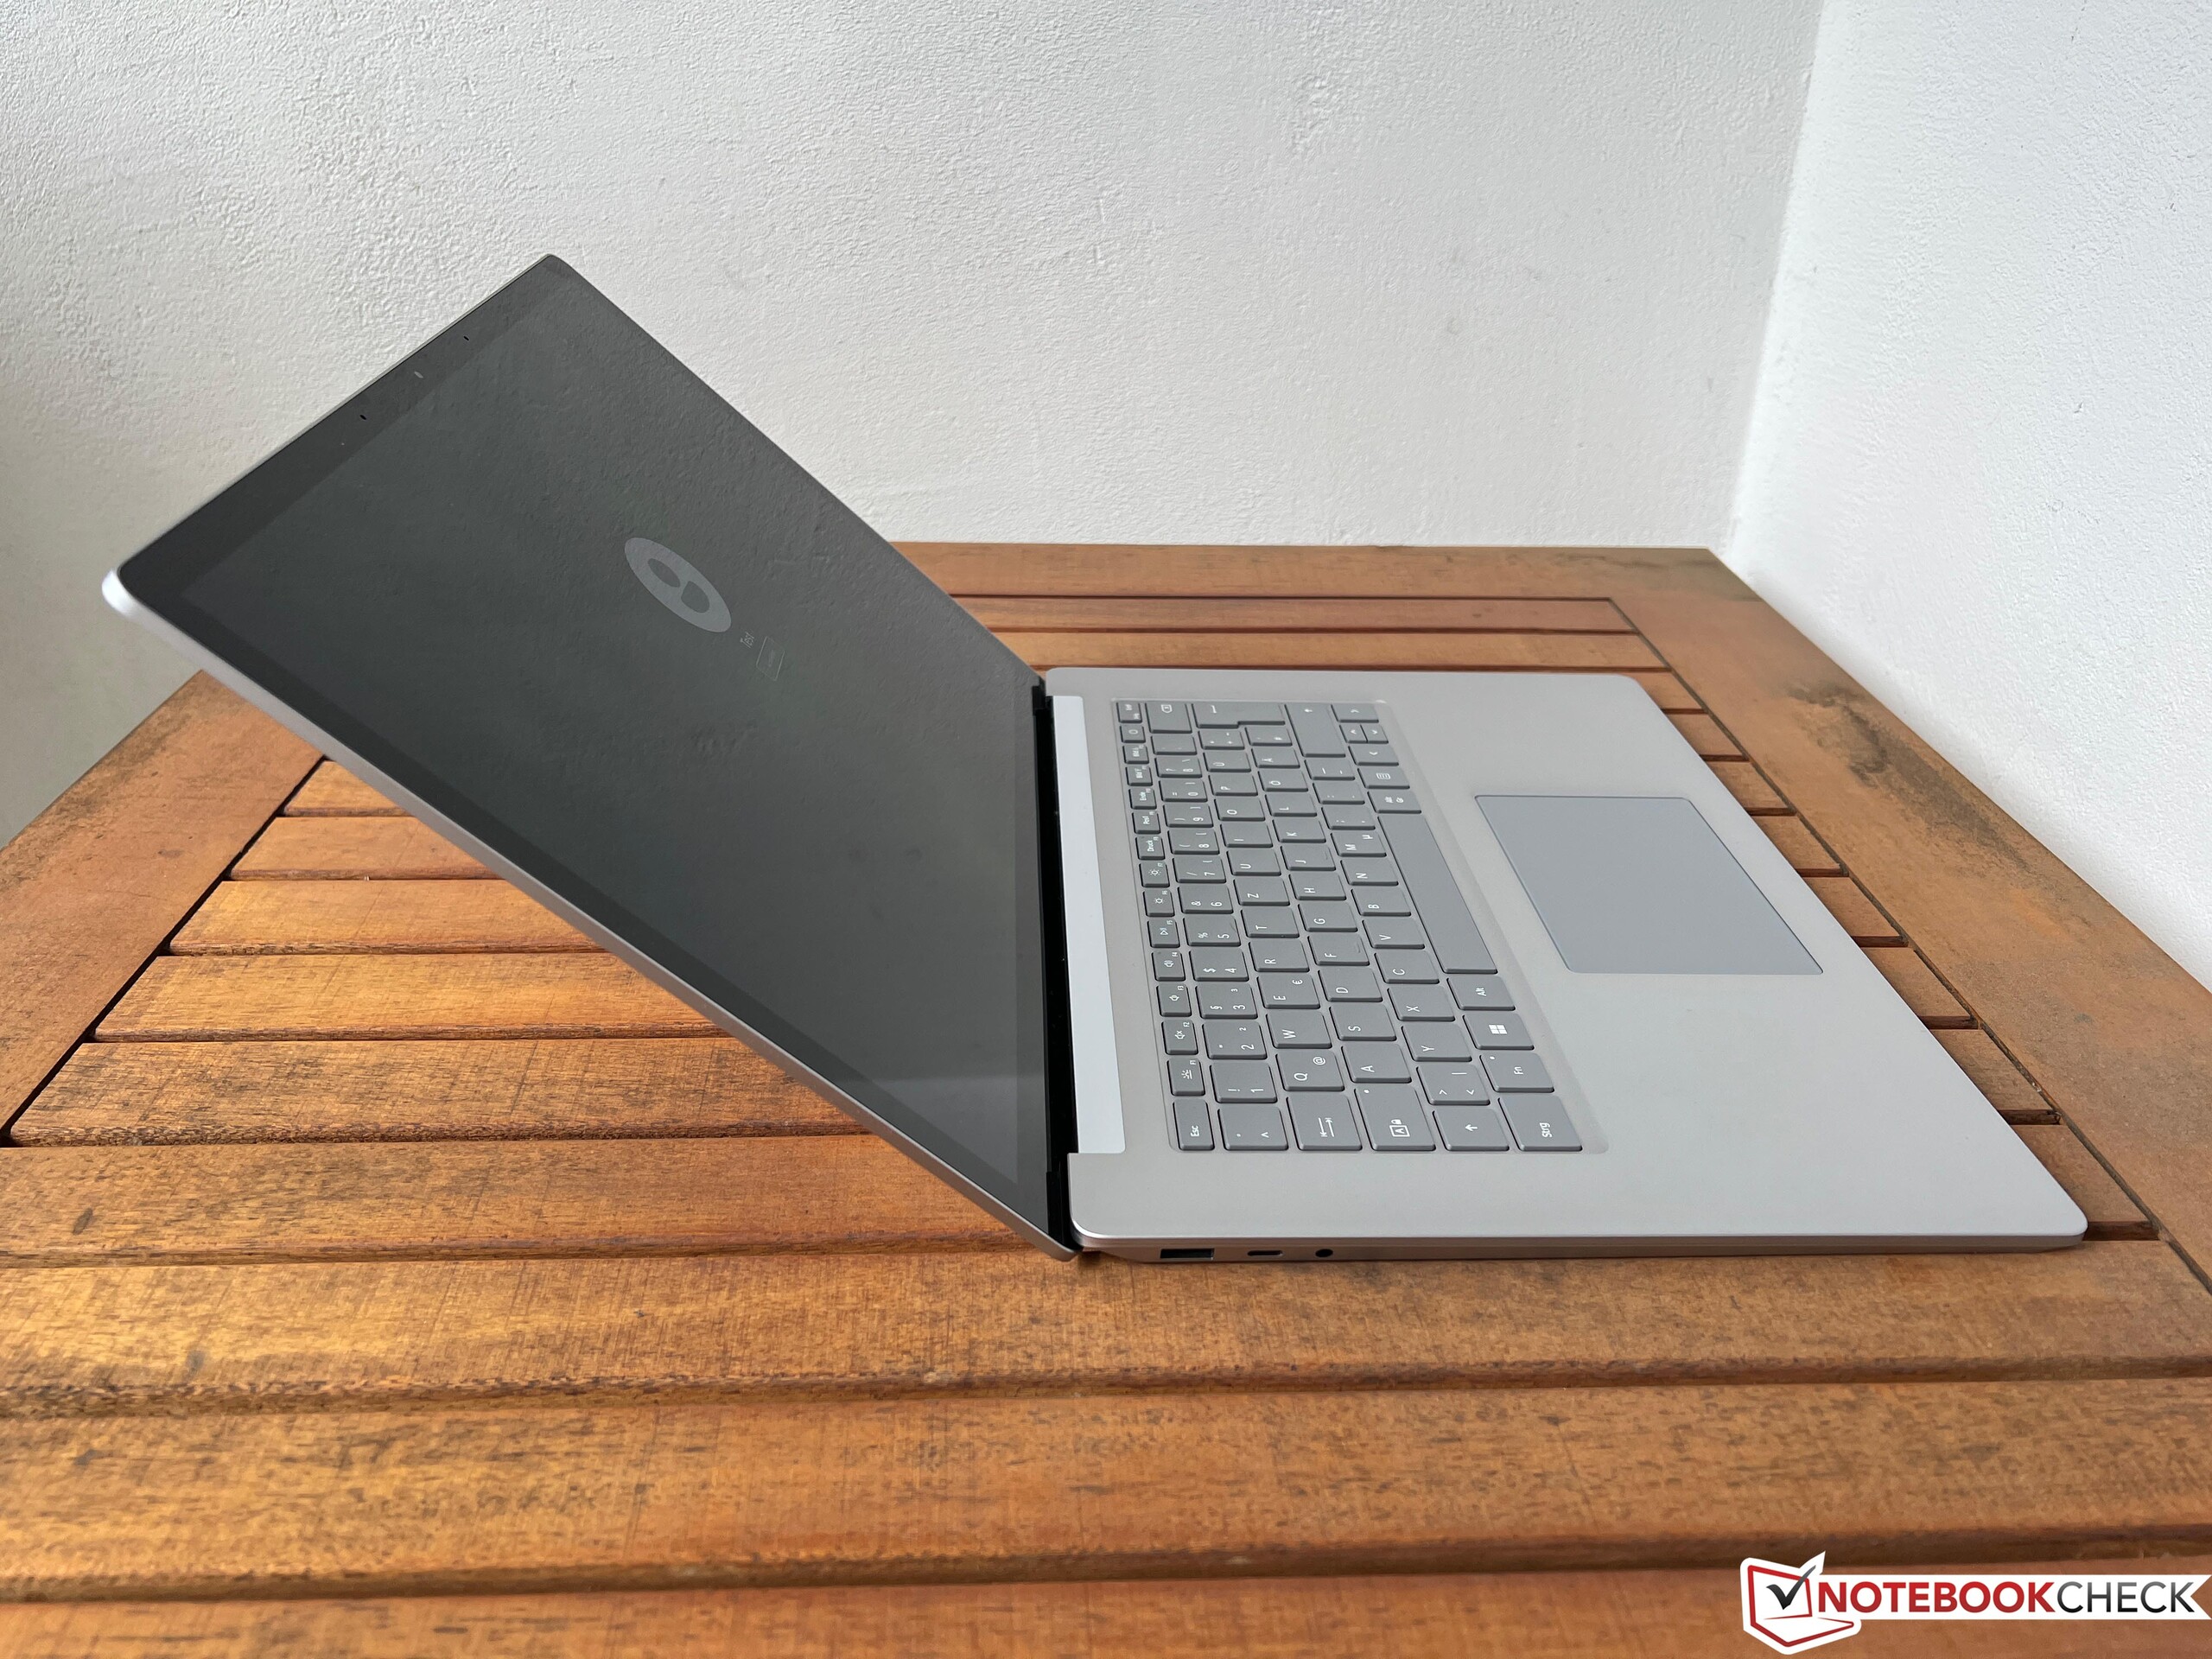
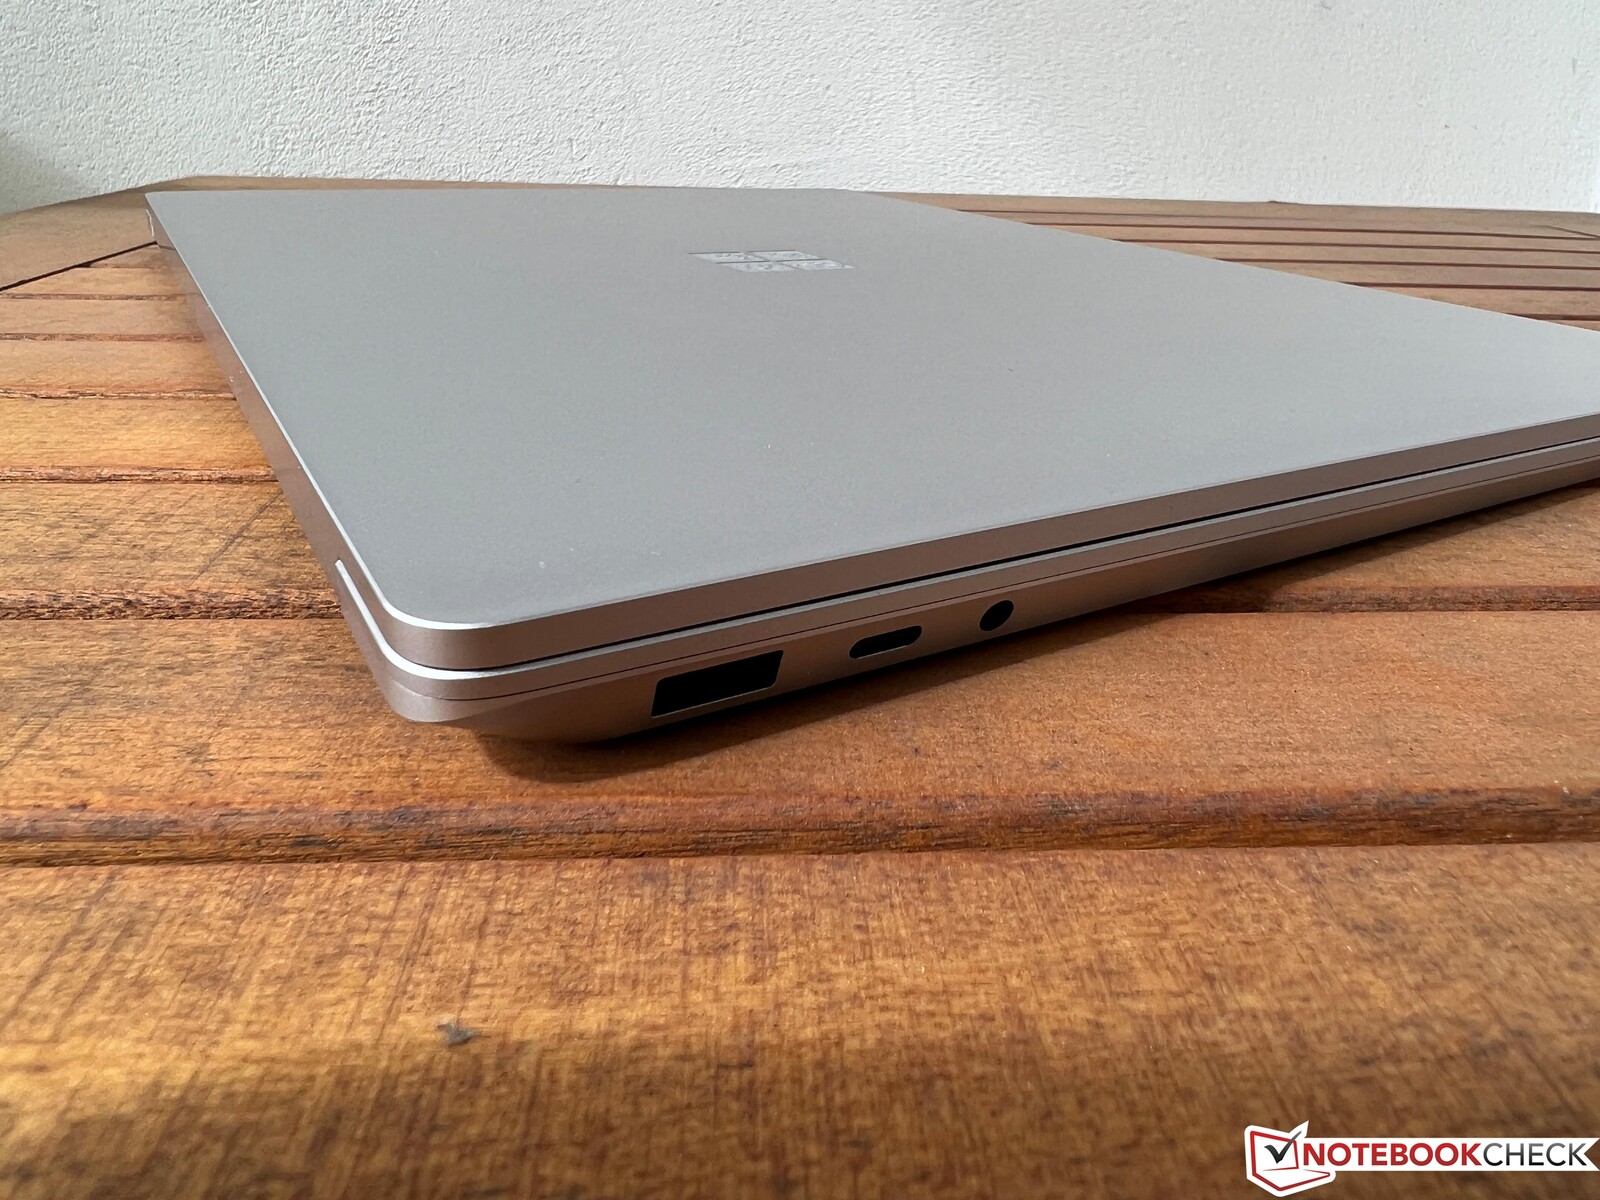
As conexões também são praticamente as mesmas de antes, embora agora a conexão USB-C finalmente suporte Thunderbolt 4. O dispositivo ainda depende de uma porta Surface Connect para carregar e conectar acessórios. Pelo menos há alguma continuidade aqui, embora ainda não consideremos o conector particularmente prático. Entretanto, a variedade de portas do dispositivo é muito limitada em vista do tamanho do gabinete.
O laptop ainda não tem um leitor de cartão SD e a Microsoft manteve o antigo módulo WLAN AX201. A webcam ainda tem uma resolução de apenas 720p, embora, em boas condições de iluminação, a qualidade da imagem seja realmente decente.

| Networking | |
| Microsoft Surface Laptop 5 15, i7-1255U | |
| iperf3 transmit AXE11000 | |
| iperf3 receive AXE11000 | |
| Microsoft Surface Laptop 4 15 AMD TFF_00028 | |
| iperf3 transmit AX12 | |
| iperf3 receive AX12 | |
| LG Gram 15Z90Q | |
| iperf3 transmit AXE11000 | |
| iperf3 receive AXE11000 | |
| Dell XPS 15 9520 RTX 3050 Ti | |
| iperf3 transmit AXE11000 | |
| iperf3 receive AXE11000 | |
| Samsung Galaxy Book Pro 15 NP950XDB-KC5US | |
| iperf3 transmit AX12 | |
| iperf3 receive AX12 | |
| Asus Zenbook Pro 15 OLED UM535Q | |
| iperf3 transmit AX12 | |
| iperf3 receive AX12 | |


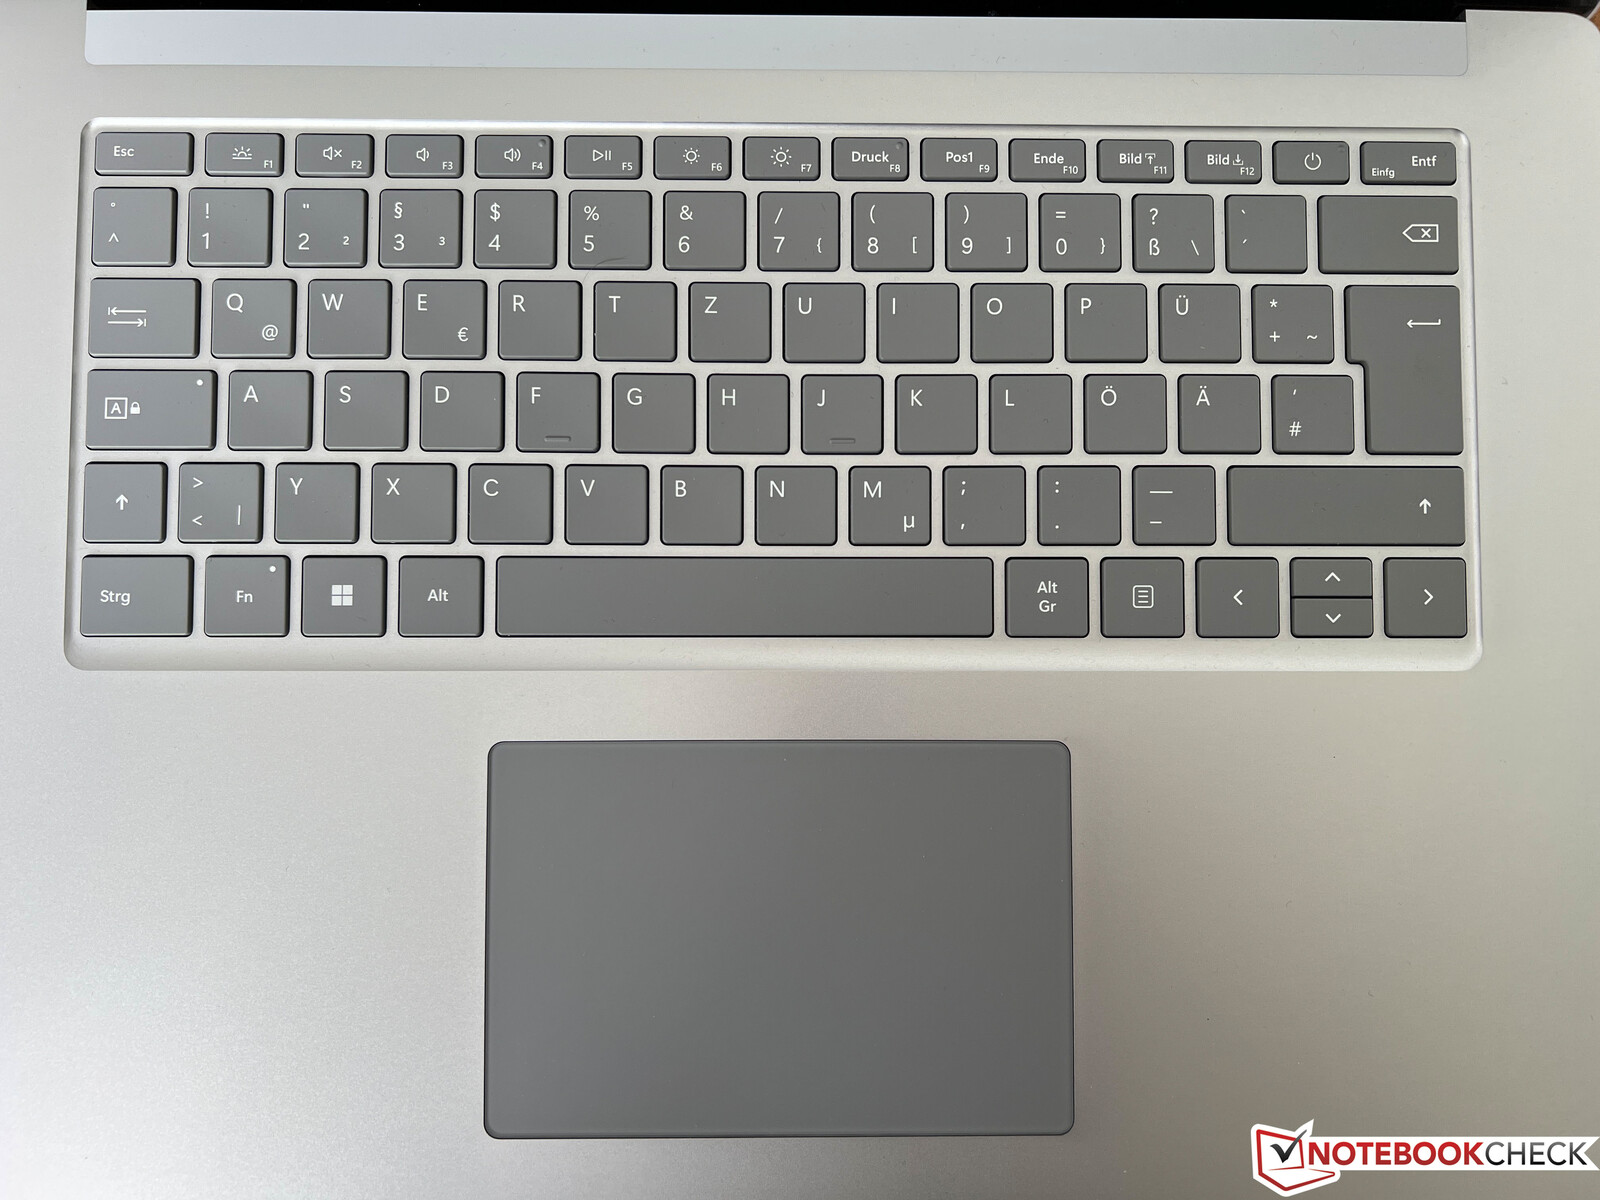
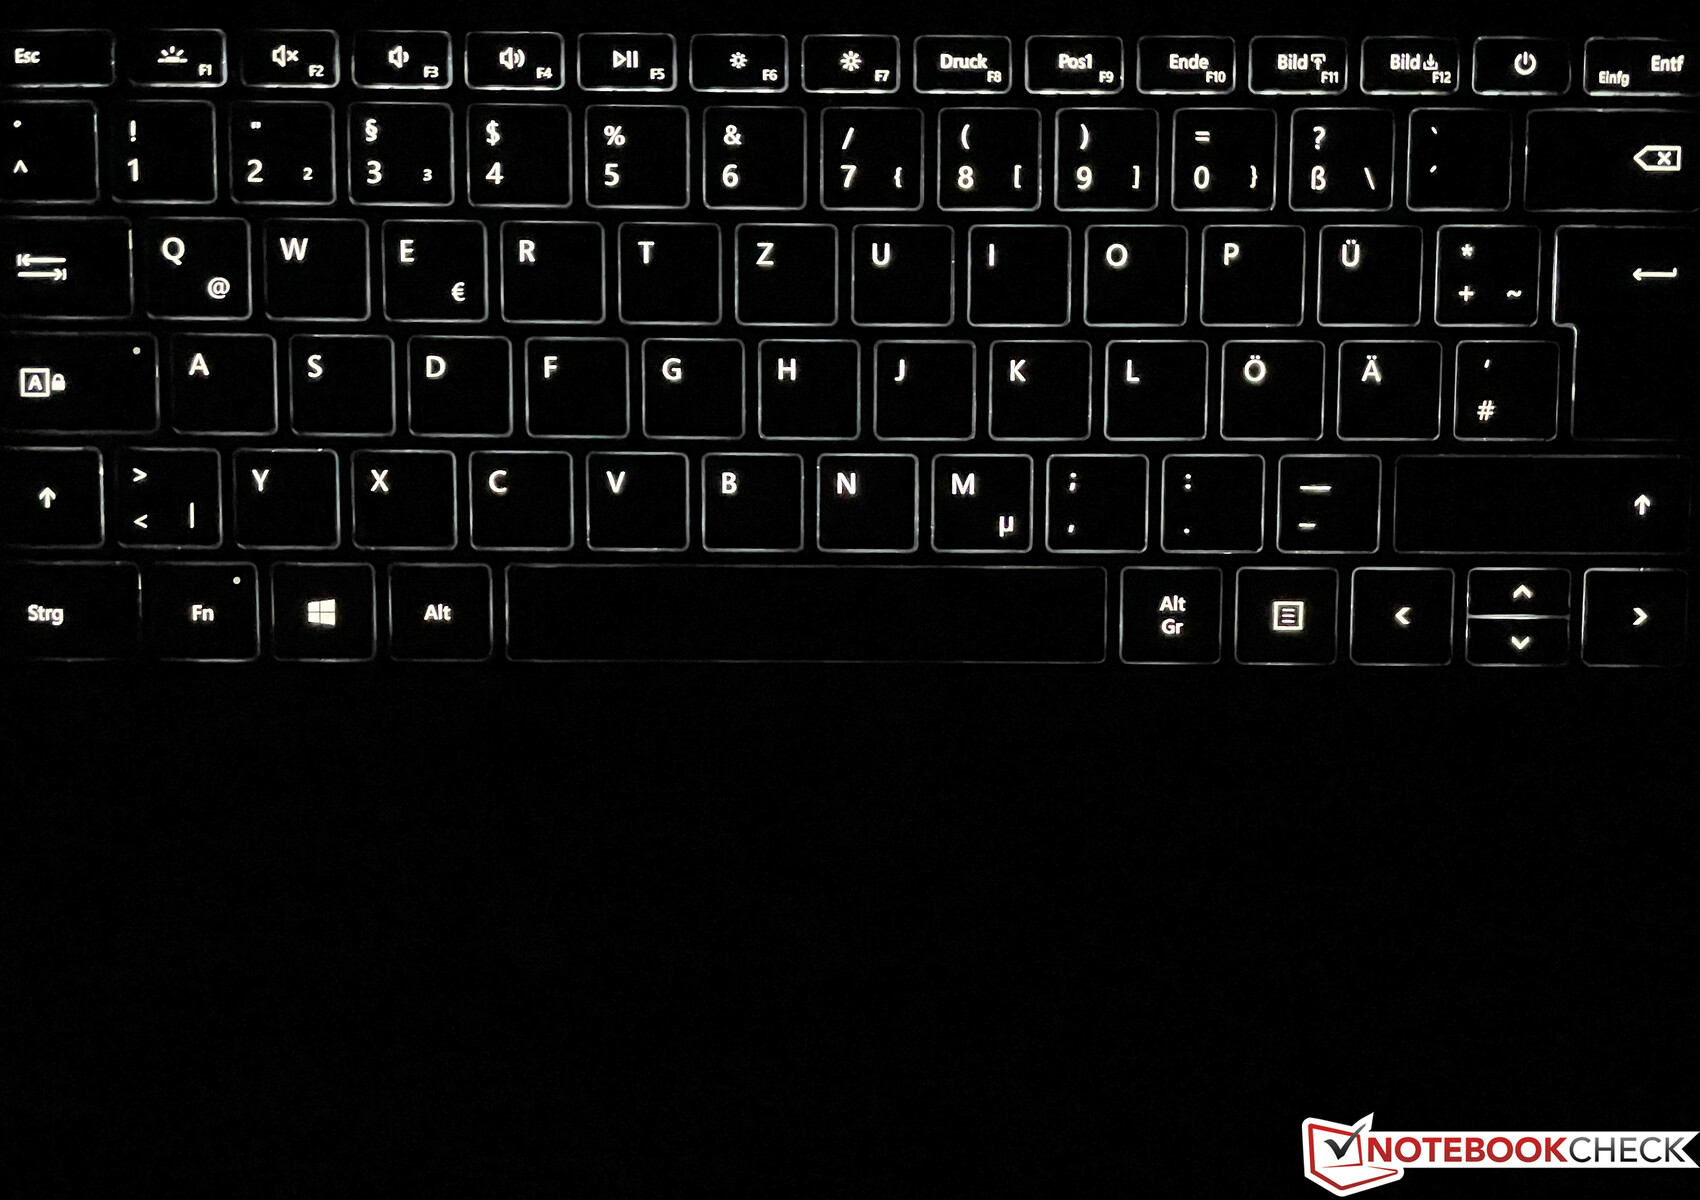
Dispositivos de entrada - Teclado retroiluminado e pequeno clickpad
Os dispositivos de entrada também foram adotados do modelo anterior. De modo geral, a sensação do teclado é boa quando você digita, mas as teclas grandes ainda tendem a chacoalhar um pouco. É possível escrever textos mais longos com o dispositivo, mas há teclados claramente melhores no mercado. A luz de fundo branca do teclado tem três níveis de ajuste.
O clickpad causa uma boa impressão e o controle normal do ponteiro não causa nenhum problema. O ruído do clique também não é muito alto. Seu tamanho de 11,5 x 7,7 cm ainda é suficiente, mas definitivamente haveria muito mais espaço para um teclado maior.
Tela - Tela sensível ao toque PixelSense
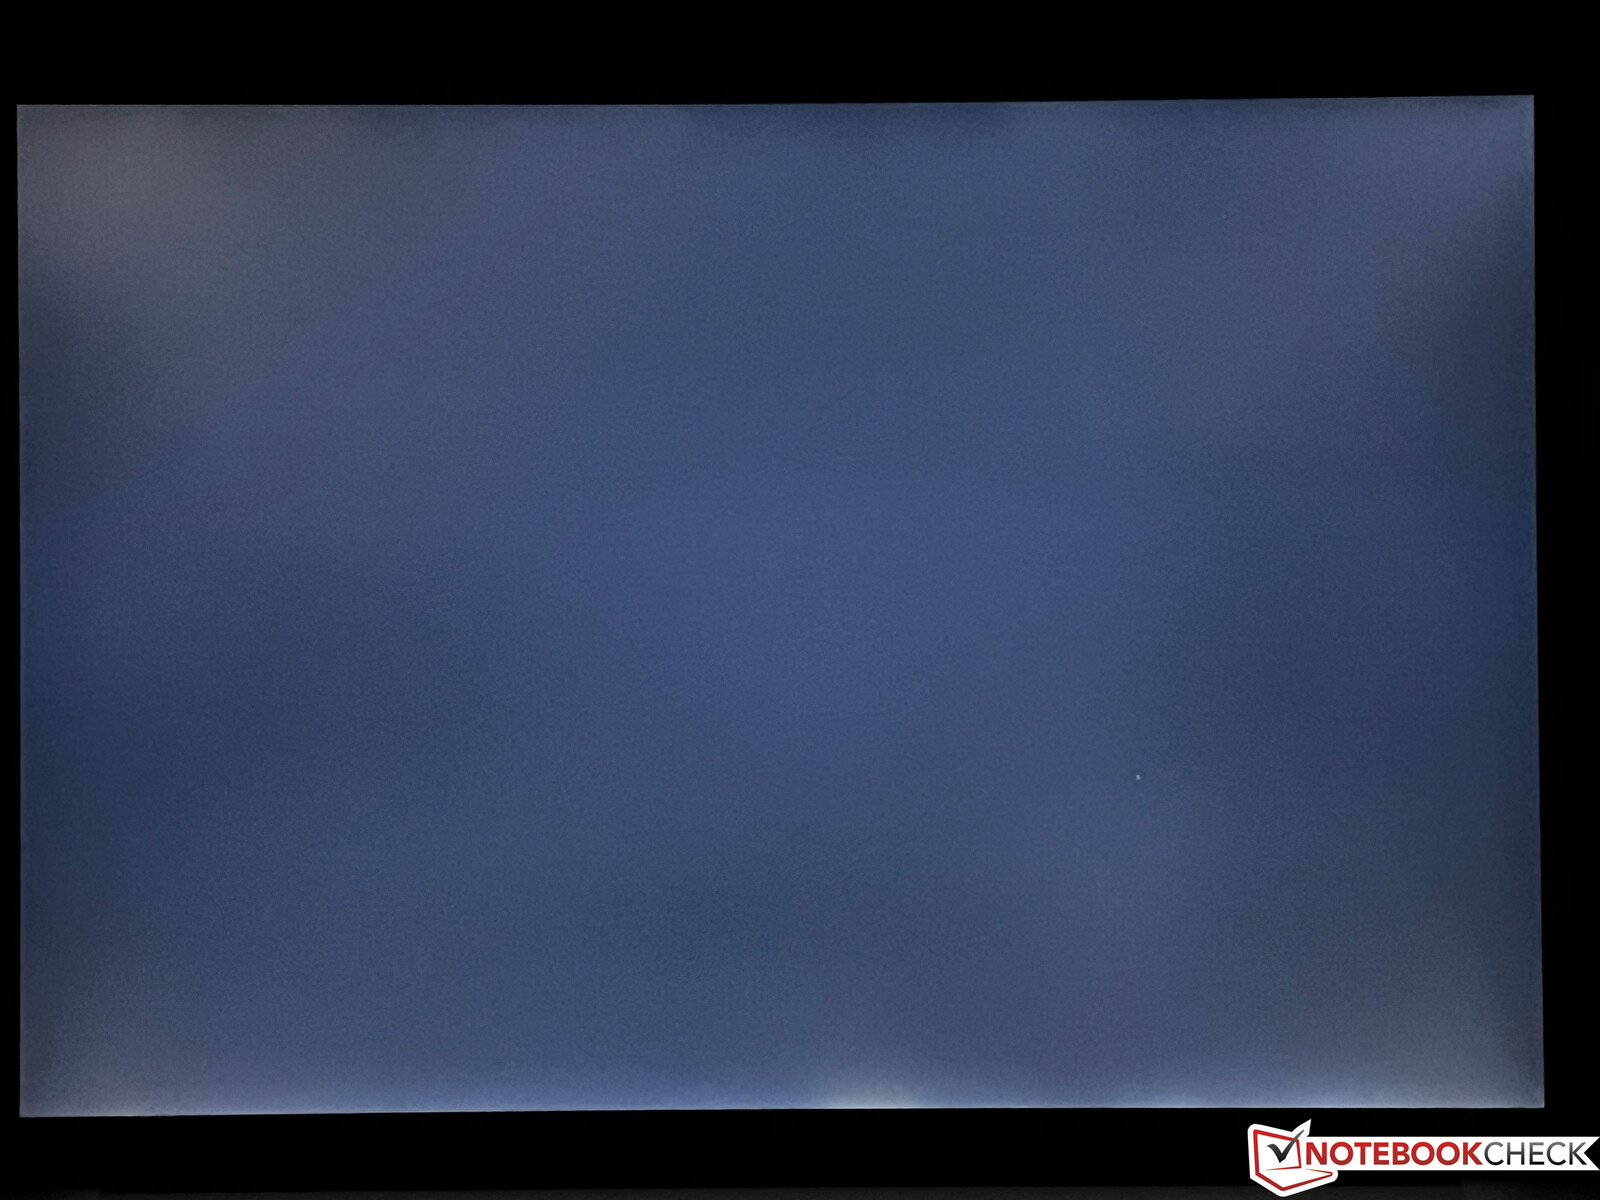
A tela de 15 polegadas ainda tem uma resolução de 2.496 x 1.664 pixels em uma proporção de 3:2. Subjetivamente, a qualidade da imagem da tela sensível ao toque ainda parece muito boa, mas as especificações técnicas do laptop de 60 Hz e cobertura sRGB não estão mais muito atualizadas, especialmente para essa faixa de preço. O dispositivo tem um brilho de 400 cd/m², e medimos um máximo de 438 cd/m² (média de ~400 cd/m²). O valor de preto de 0,29 é aceitável e resulta em uma taxa de contraste de quase 1.400:1.
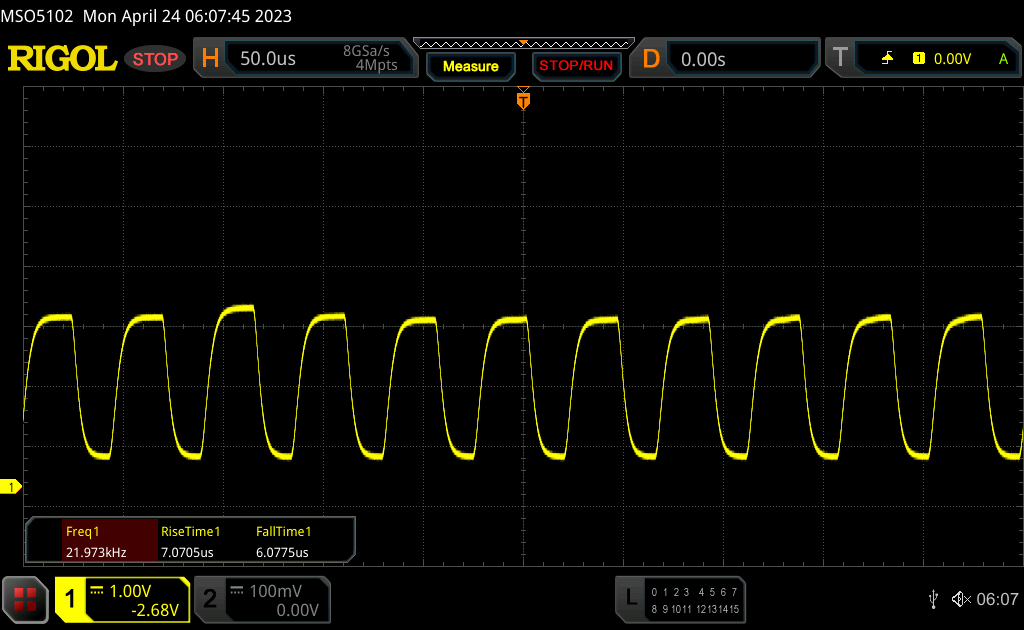
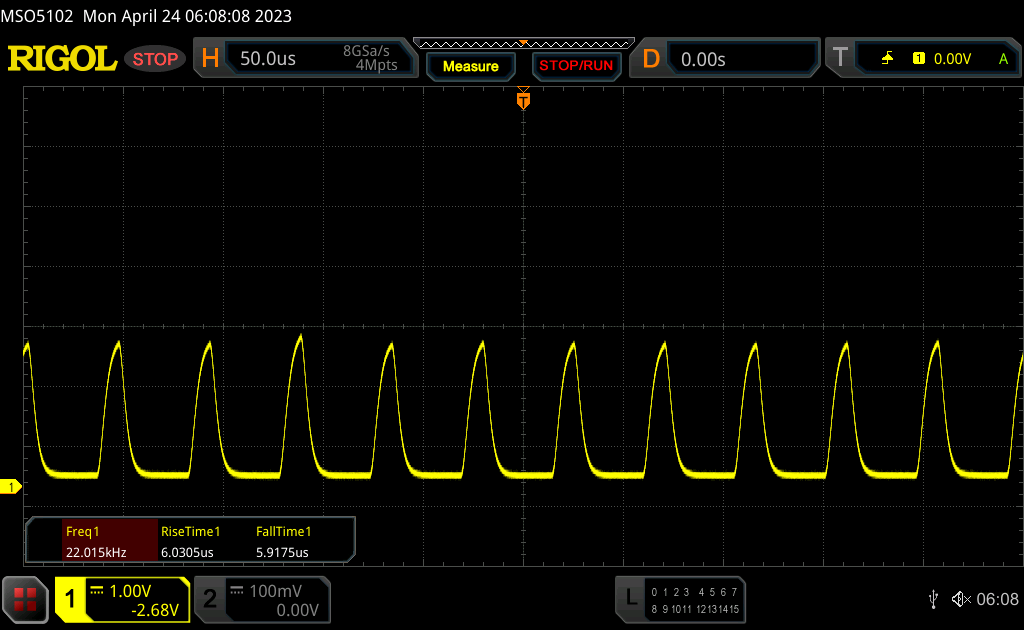
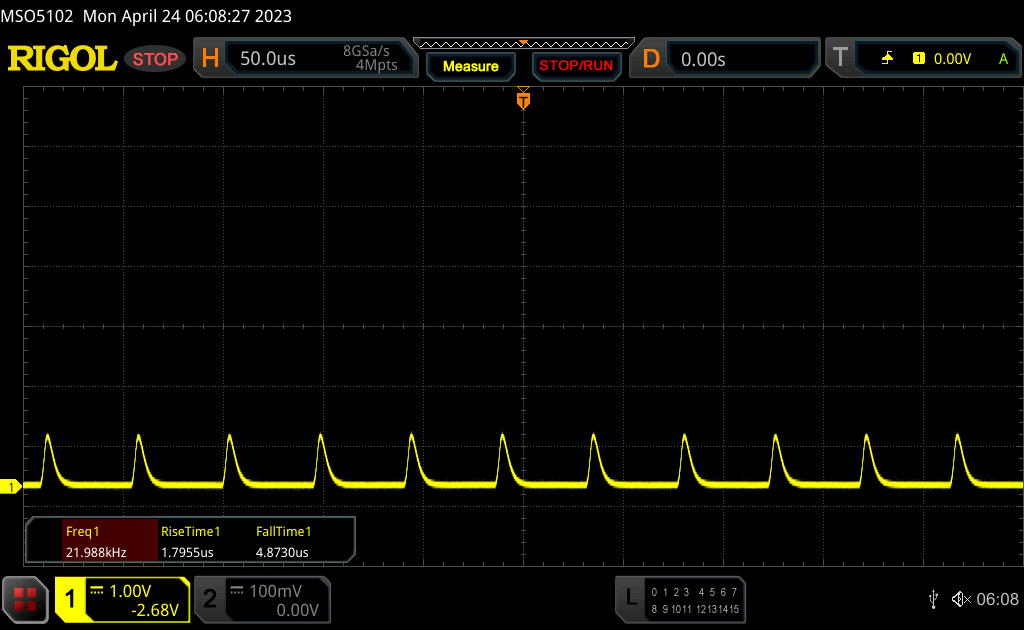
O painel apresenta um leve sangramento de tela em direção à borda inferior da tela em altos níveis de brilho com um fundo preto, mas isso não deve ser muito incômodo no uso diário. O PWM também pode ser visto em um brilho de 50% ou menos, mas sua frequência de ~22 kHz é extremamente alta e não deve causar nenhum problema para os usuários.
| |||||||||||||||||||||||||
iluminação: 85 %
iluminação com acumulador: 395 cd/m²
Contraste: 1369:1 (Preto: 0.29 cd/m²)
ΔE ColorChecker Calman: 0.8 | ∀{0.5-29.43 Ø4.71}
ΔE Greyscale Calman: 1.1 | ∀{0.09-98 Ø4.96}
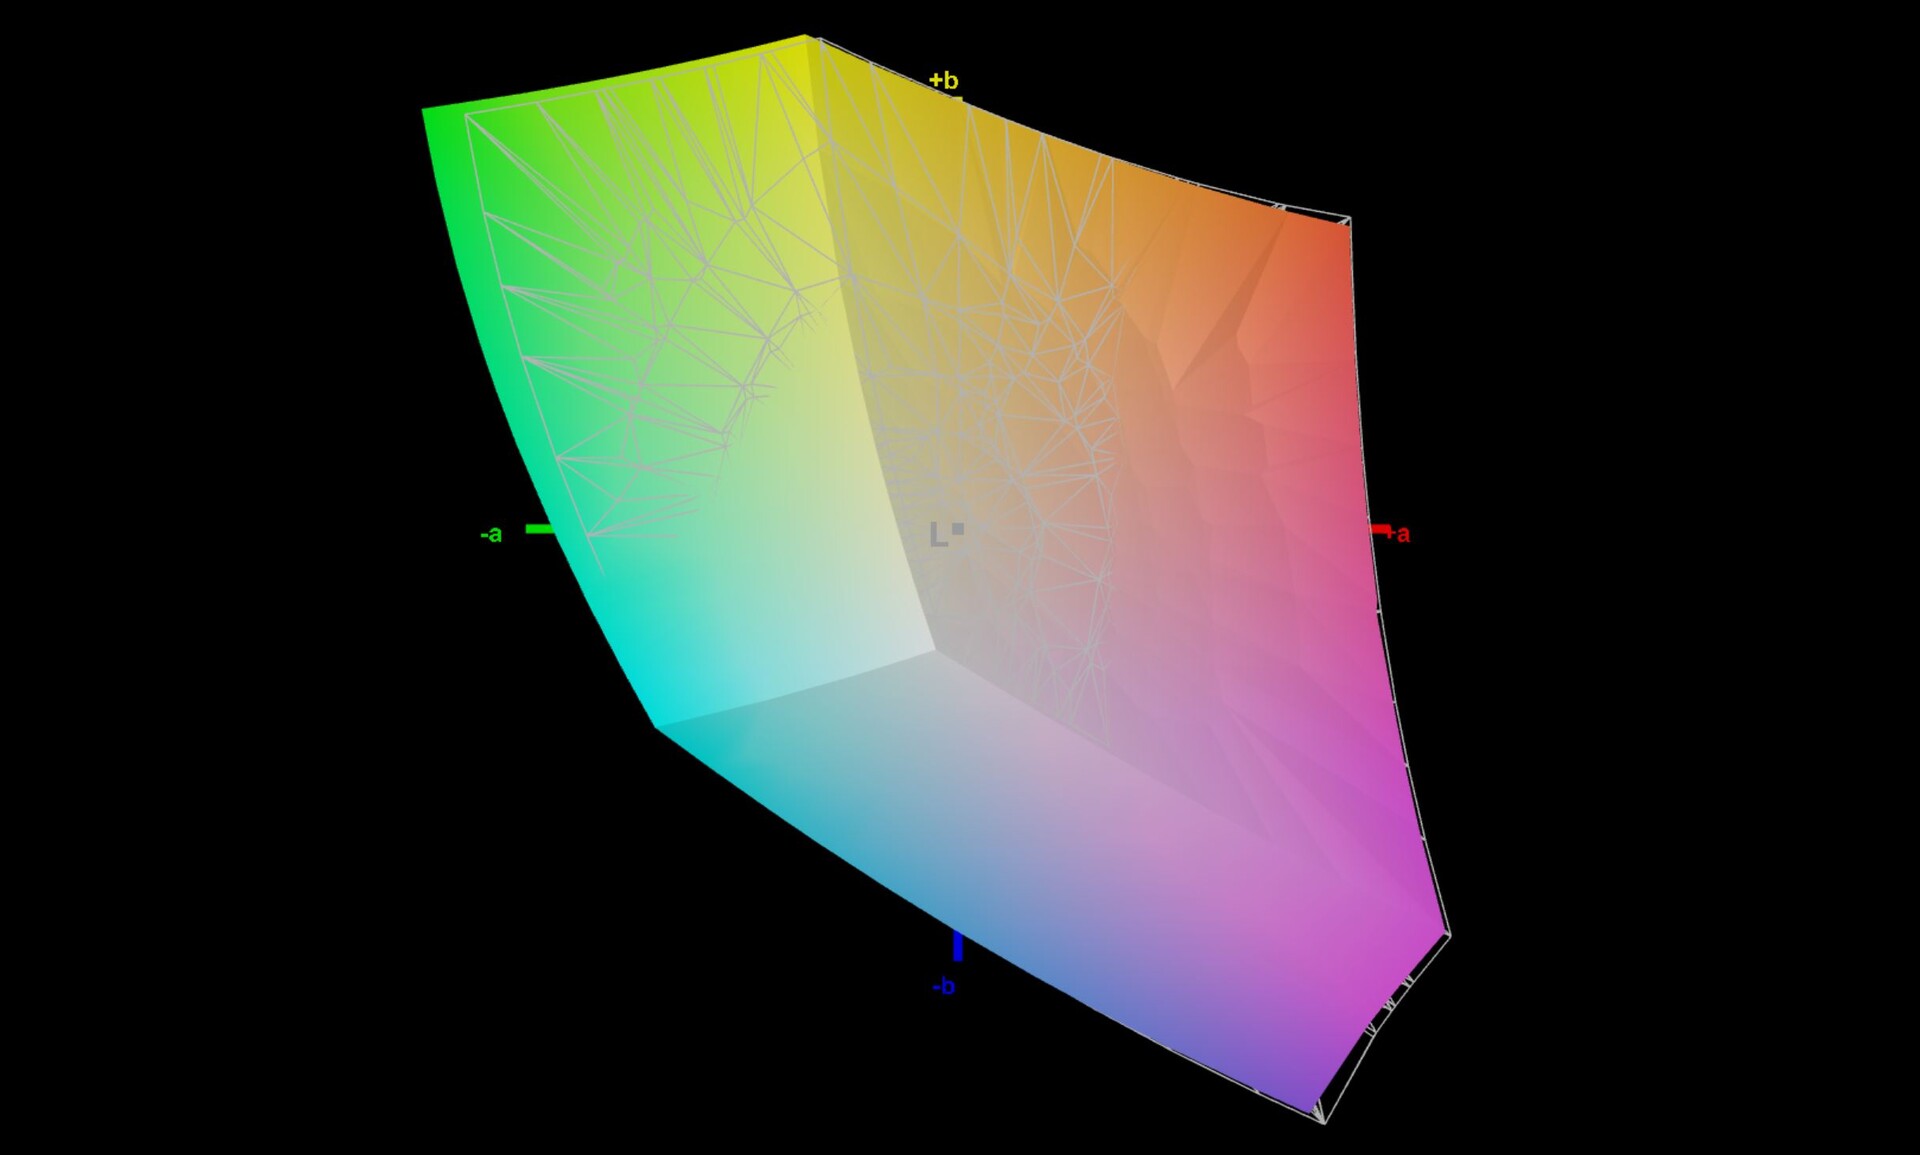
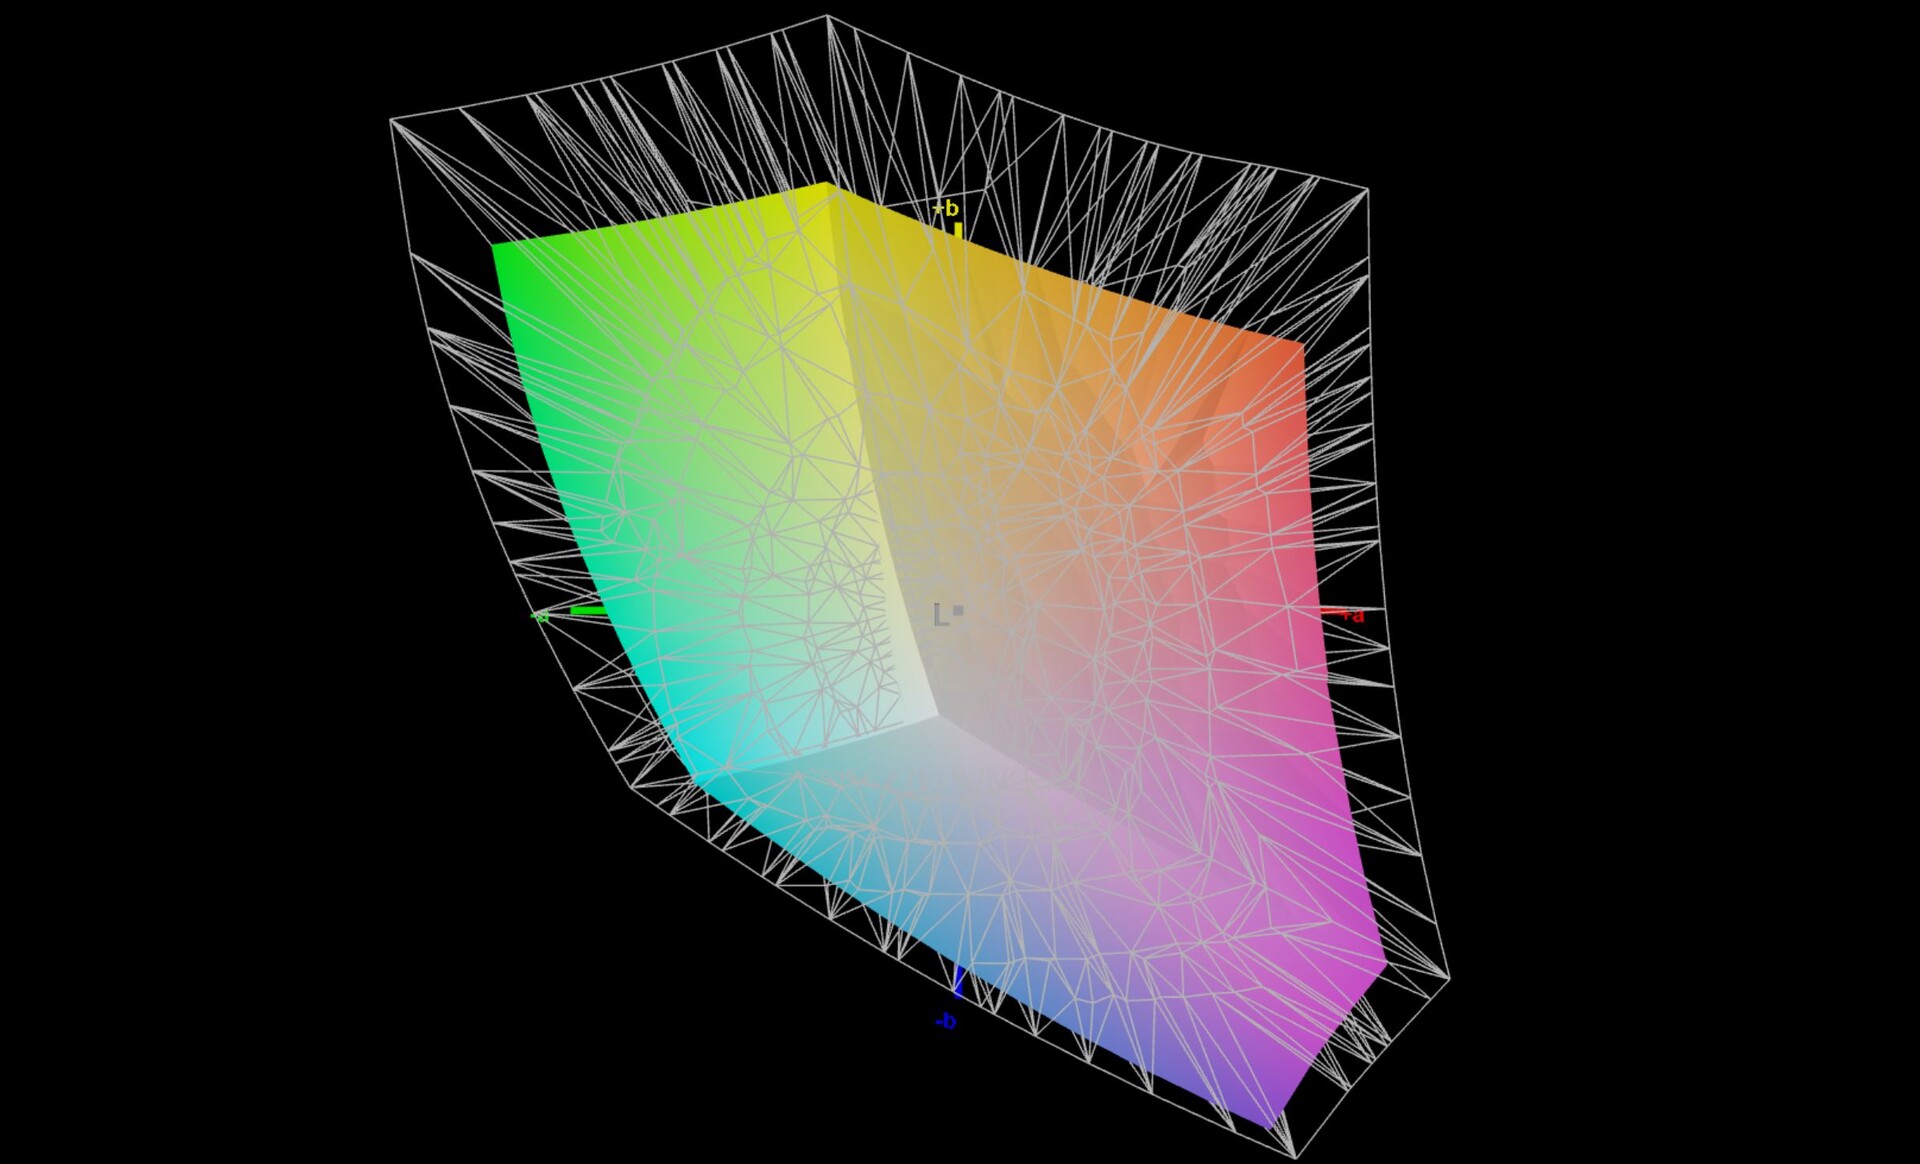
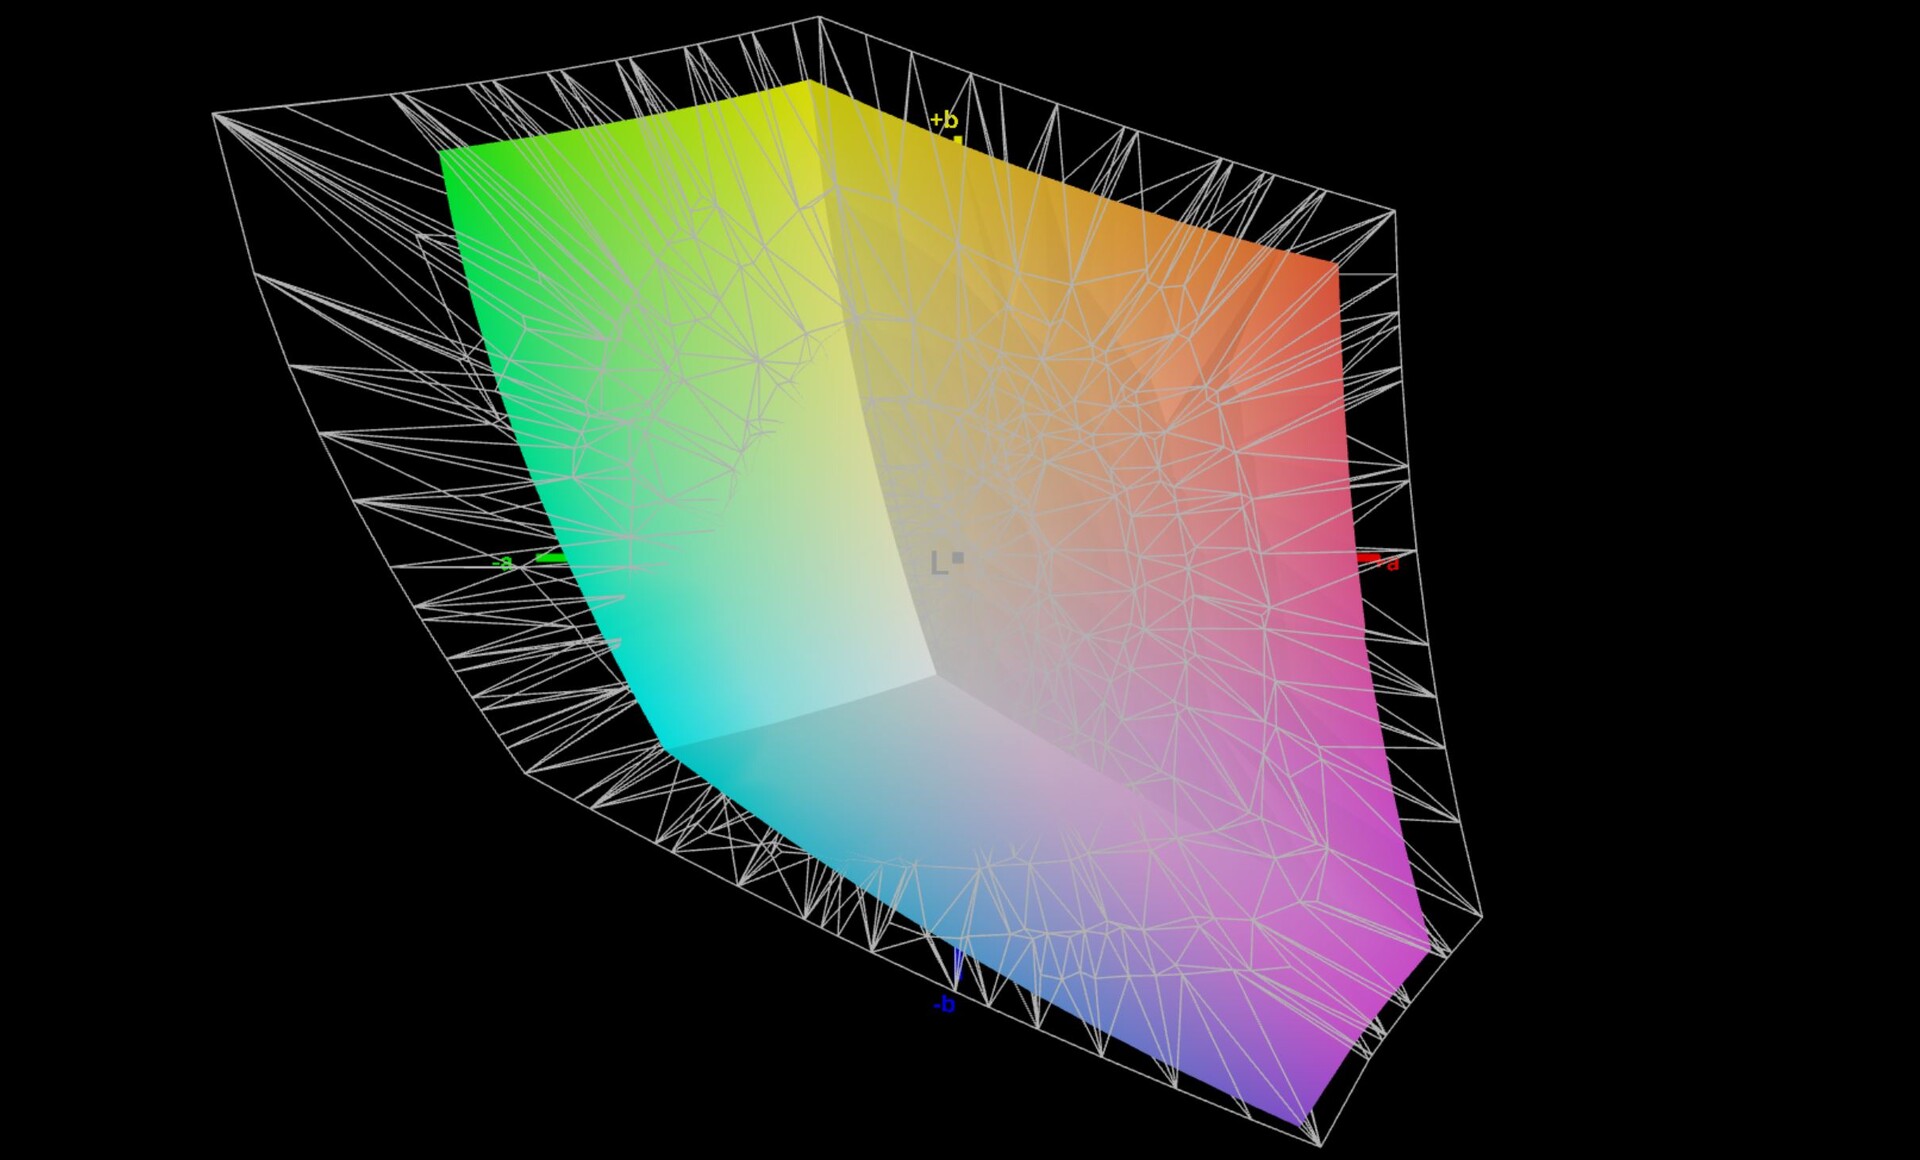
70.3% AdobeRGB 1998 (Argyll 3D)
97.3% sRGB (Argyll 3D)
68.1% Display P3 (Argyll 3D)
Gamma: 2.18
CCT: 6705 K
| Microsoft Surface Laptop 5 15, i7-1255U LQ150P1JX51, IPS, 2496x1664, 15" | Microsoft Surface Laptop 4 15 AMD TFF_00028 SHP14B4, IPS, 2496x1664, 15" | LG Gram 15Z90Q LG LP156WFC-SPZ2 (LGD0706), IPS, 1920x1080, 15.6" | Dell XPS 15 9520 RTX 3050 Ti Samsung 156XG01, OLED, 3456x2160, 15.6" | Samsung Galaxy Book Pro 15 NP950XDB-KC5US Samsung ATNA56YX02-0, AMOLED, 1920x1080, 15.6" | Asus Zenbook Pro 15 OLED UM535Q Samsung ATNA56YX03-0, OLED, 1920x1080, 15.6" | |
|---|---|---|---|---|---|---|
| Display | -3% | -5% | 23% | 24% | 13% | |
| Display P3 Coverage (%) | 68.1 | 65.2 -4% | 63.5 -7% | 97.8 44% | 87.6 29% | 79.3 16% |
| sRGB Coverage (%) | 97.3 | 97.7 0% | 95 -2% | 99.9 3% | 100 3% | 95.6 -2% |
| AdobeRGB 1998 Coverage (%) | 70.3 | 67.3 -4% | 65.1 -7% | 86 22% | 99.3 41% | 87.3 24% |
| Response Times | -10% | 20% | 95% | 94% | 94% | |
| Response Time Grey 50% / Grey 80% * (ms) | 52.4 ? | 58.4 ? -11% | 48.4 ? 8% | 1.9 ? 96% | 1.9 ? 96% | 2.1 ? 96% |
| Response Time Black / White * (ms) | 28.7 ? | 31.2 ? -9% | 19.6 ? 32% | 1.9 ? 93% | 2.2 ? 92% | 2.3 ? 92% |
| PWM Frequency (Hz) | 22000 ? | 21550 ? | 59.52 ? | 59 | 60.2 | |
| Screen | -82% | -99% | -180% | -122% | -83% | |
| Brightness middle (cd/m²) | 397 | 405 2% | 420 6% | 381.4 -4% | 296.8 -25% | 342.9 -14% |
| Brightness (cd/m²) | 399 | 379 -5% | 399 0% | 384 -4% | 298 -25% | 346 -13% |
| Brightness Distribution (%) | 85 | 79 -7% | 88 4% | 95 12% | 98 15% | 98 15% |
| Black Level * (cd/m²) | 0.29 | 0.26 10% | 0.32 -10% | |||
| Contrast (:1) | 1369 | 1558 14% | 1313 -4% | |||
| Colorchecker dE 2000 * | 0.8 | 2.6 -225% | 2.51 -214% | 4.34 -443% | 3.07 -284% | 2.42 -203% |
| Colorchecker dE 2000 max. * | 1.4 | 6.6 -371% | 6.64 -374% | 9.24 -560% | 5.29 -278% | 4.05 -189% |
| Greyscale dE 2000 * | 1.1 | 1.9 -73% | 3.3 -200% | 2 -82% | 2.6 -136% | 2.1 -91% |
| Gamma | 2.18 101% | 2.11 104% | 2.052 107% | 2.13 103% | 2.26 97% | 2.21 100% |
| CCT | 6705 97% | 6825 95% | 6921 94% | 6210 105% | 6904 94% | 6364 102% |
| Colorchecker dE 2000 calibrated * | 0.9 | 0.89 | ||||
| Color Space (Percent of AdobeRGB 1998) (%) | 62 | |||||
| Color Space (Percent of sRGB) (%) | 97.7 | |||||
| Média Total (Programa/Configurações) | -32% /
-53% | -28% /
-59% | -21% /
-75% | -1% /
-43% | 8% /
-24% |
* ... menor é melhor

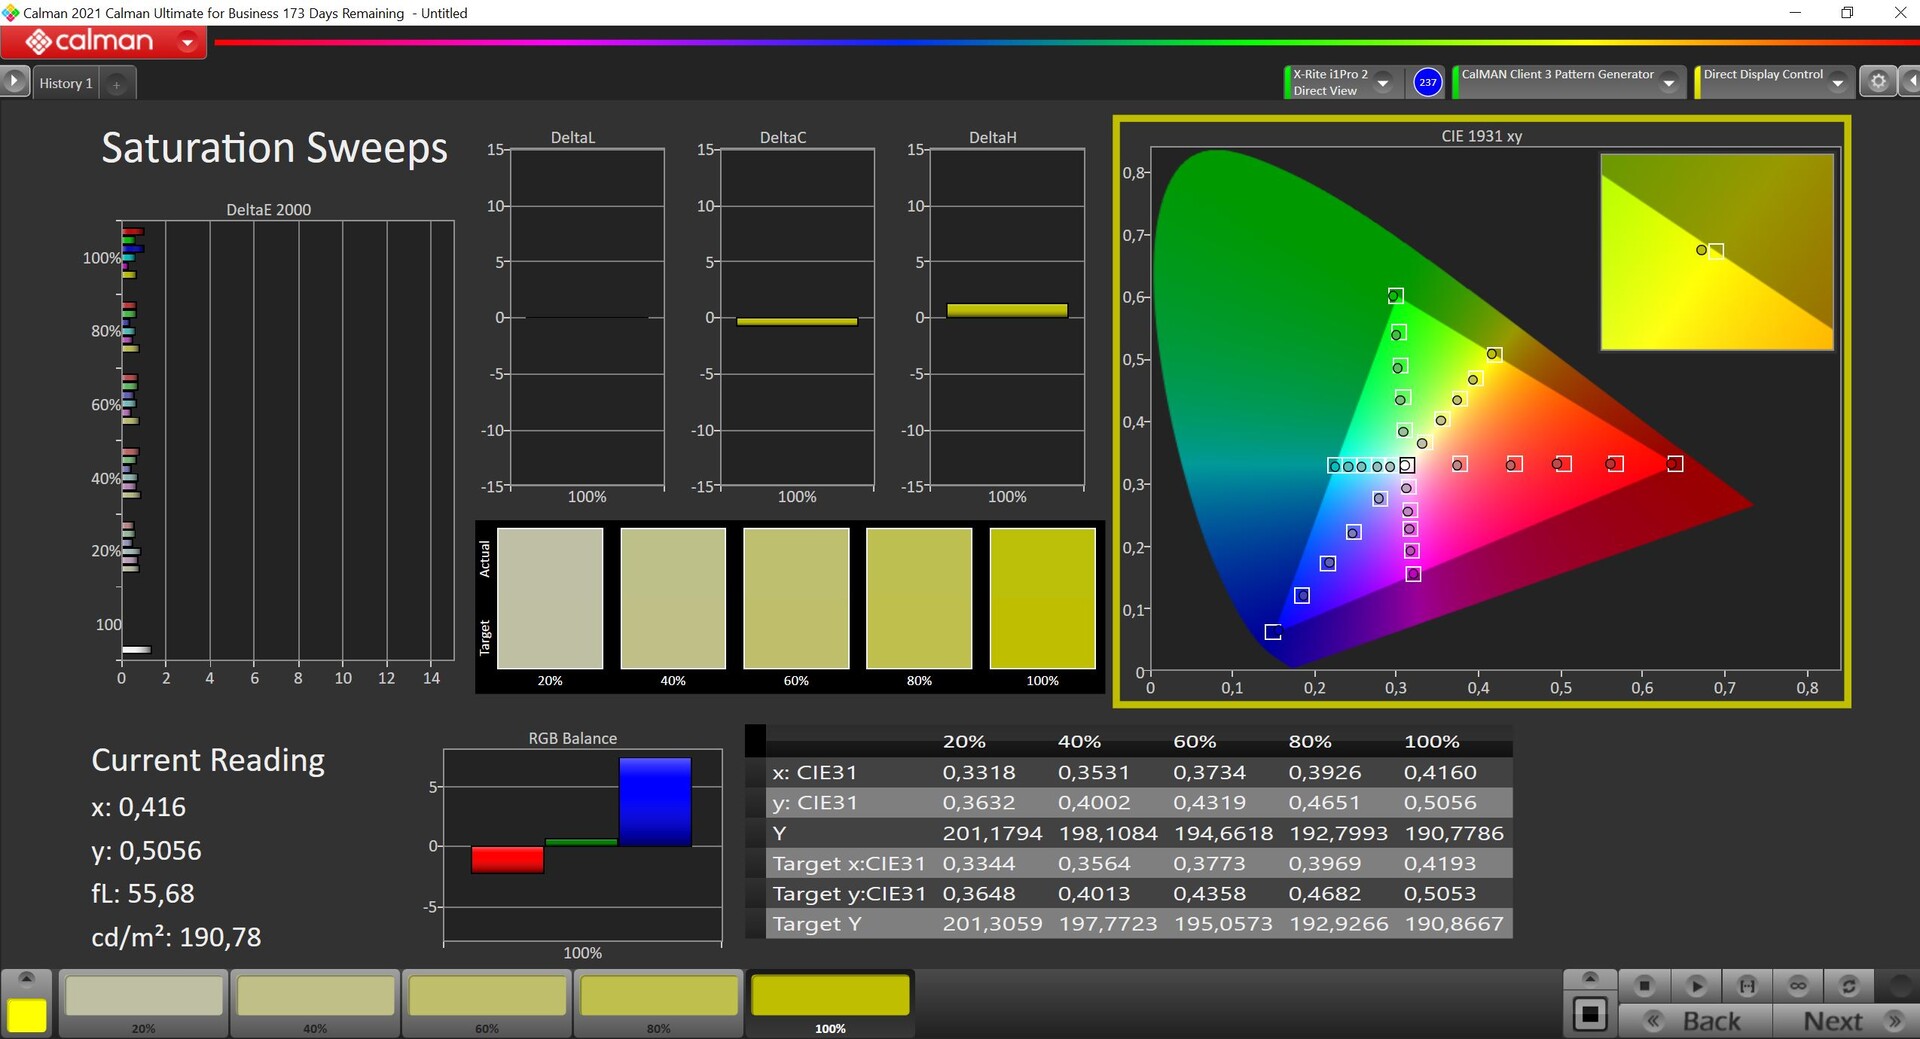
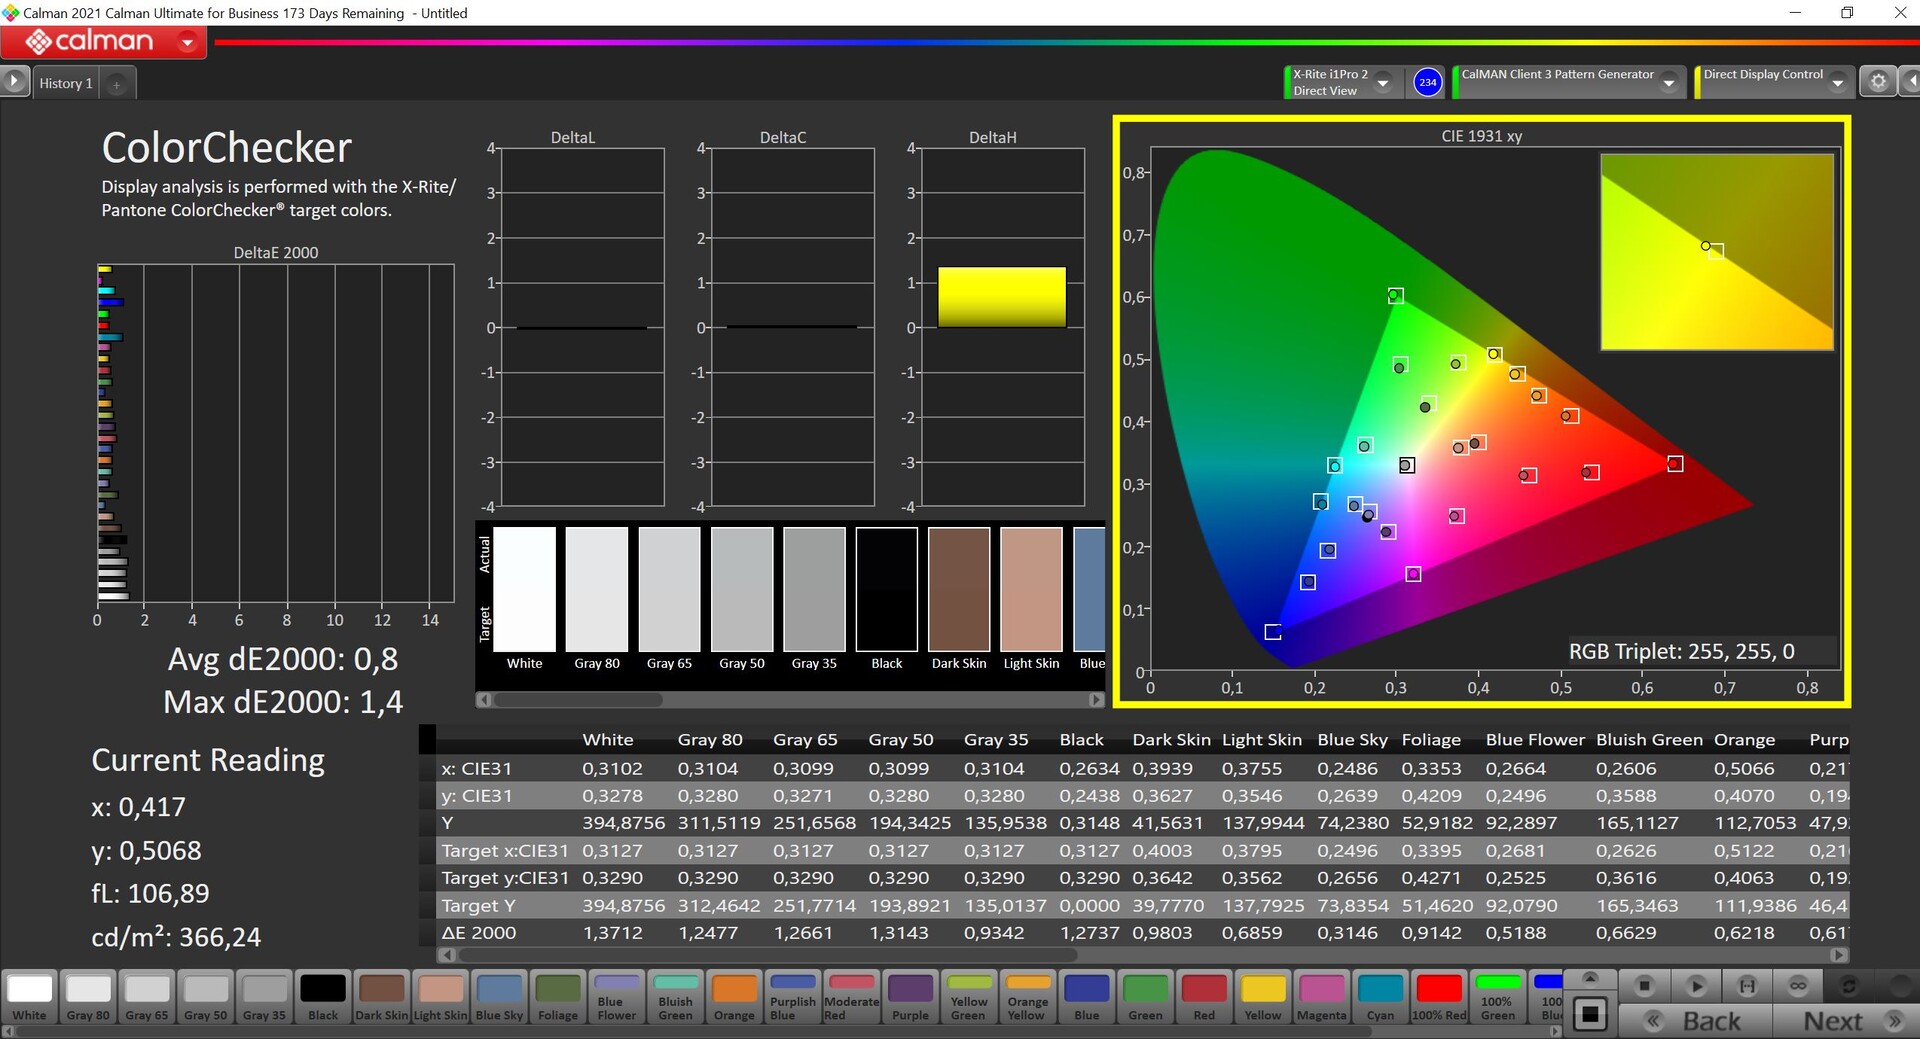
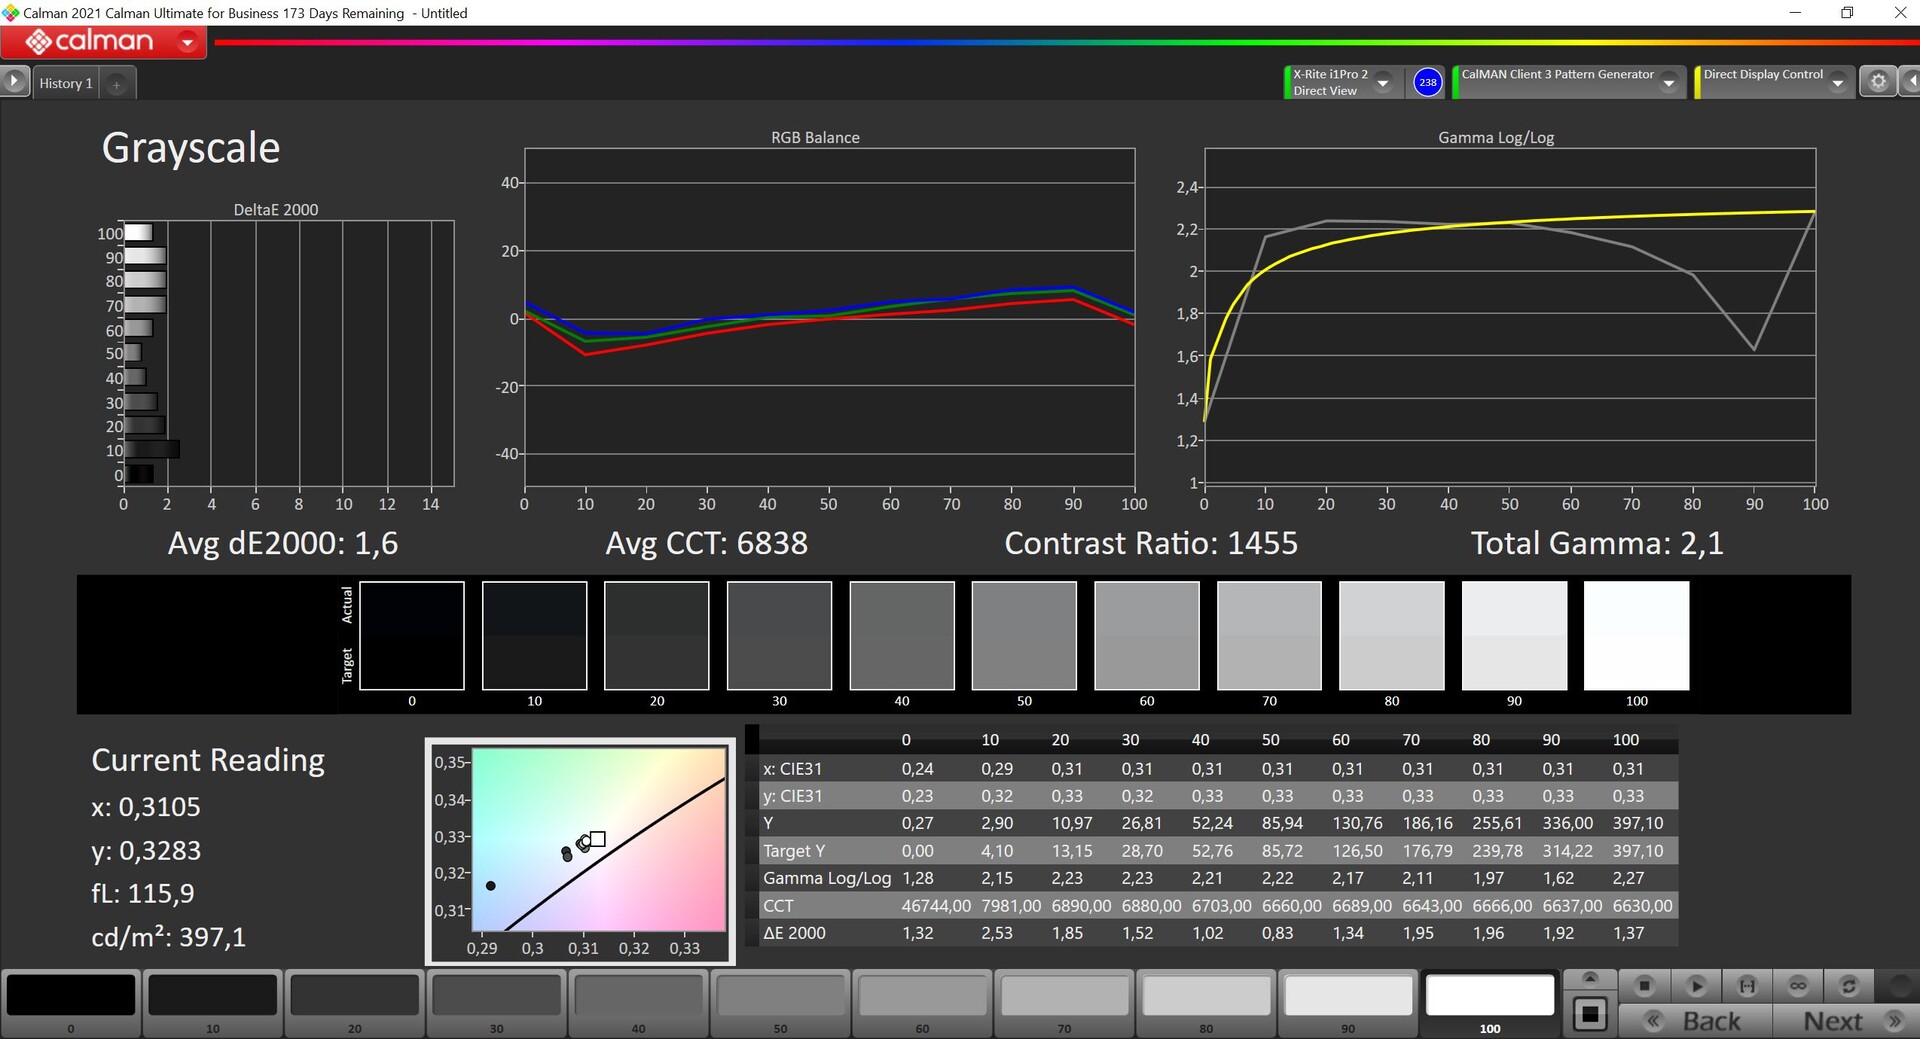
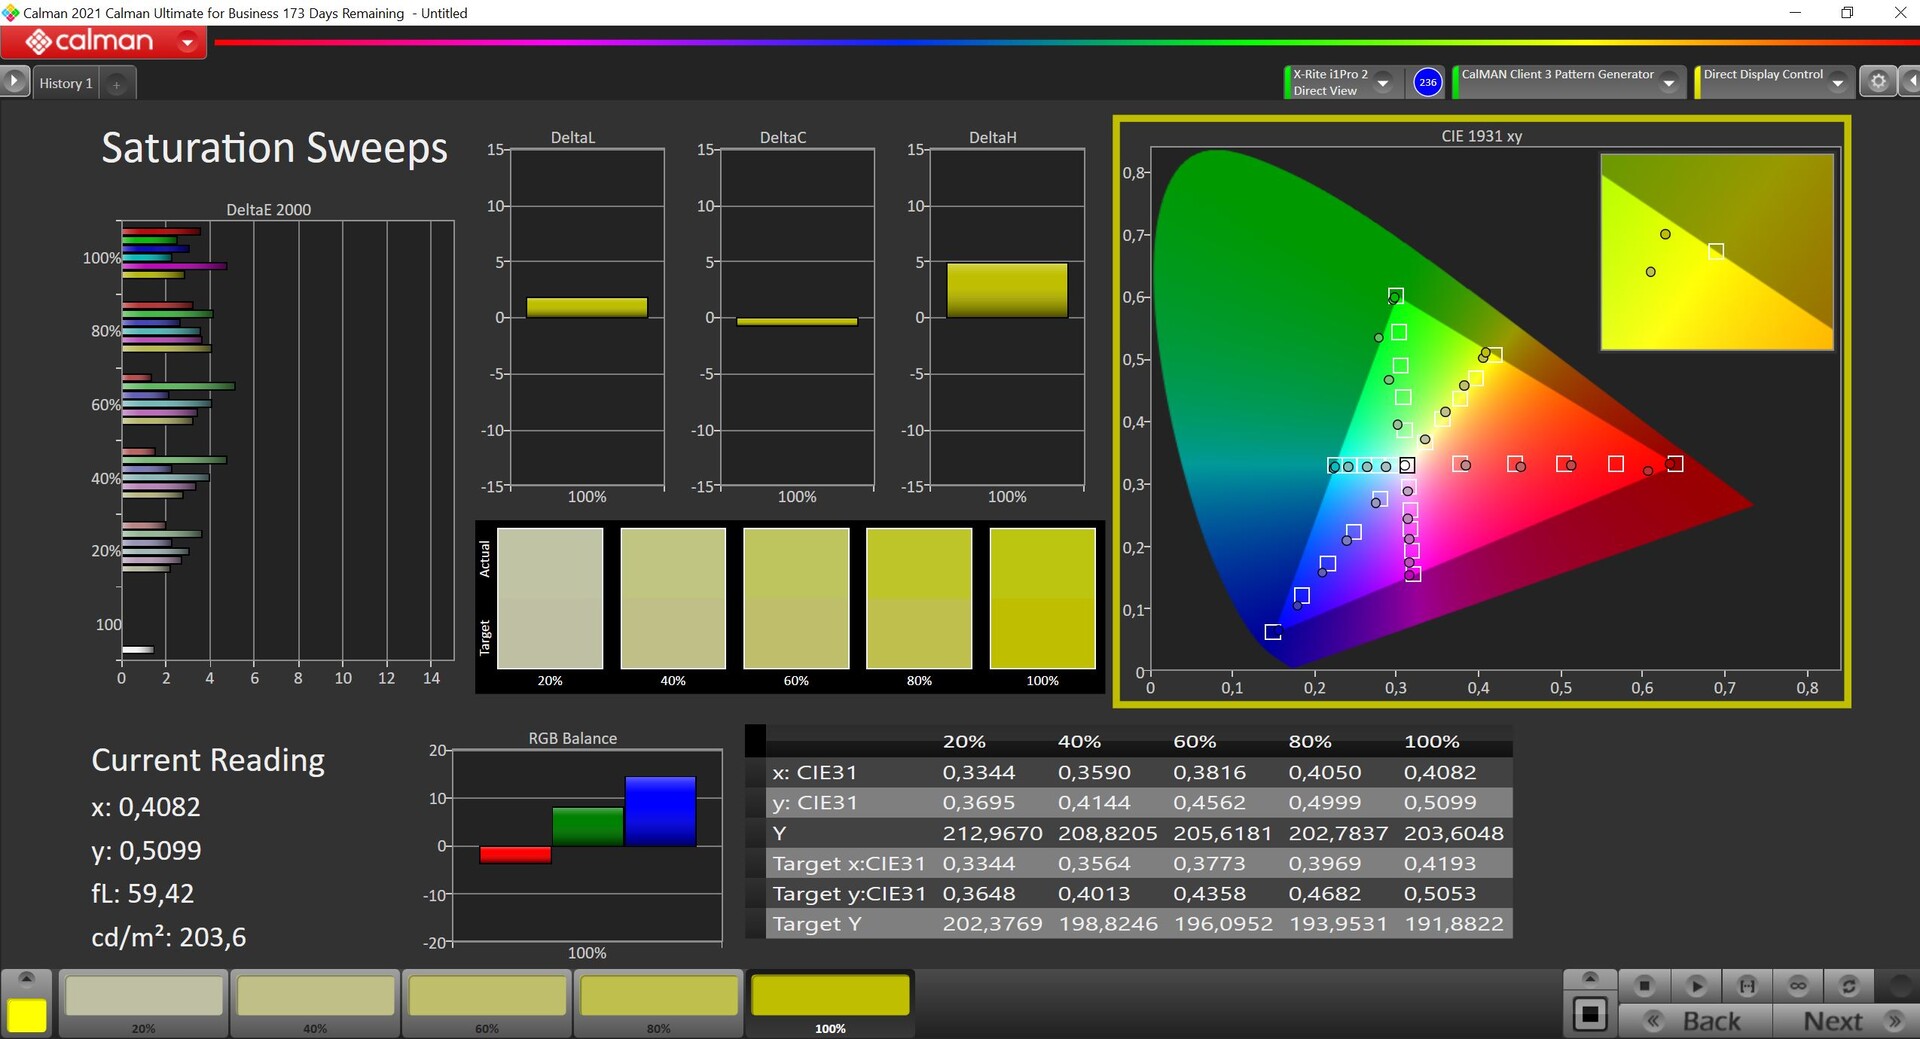
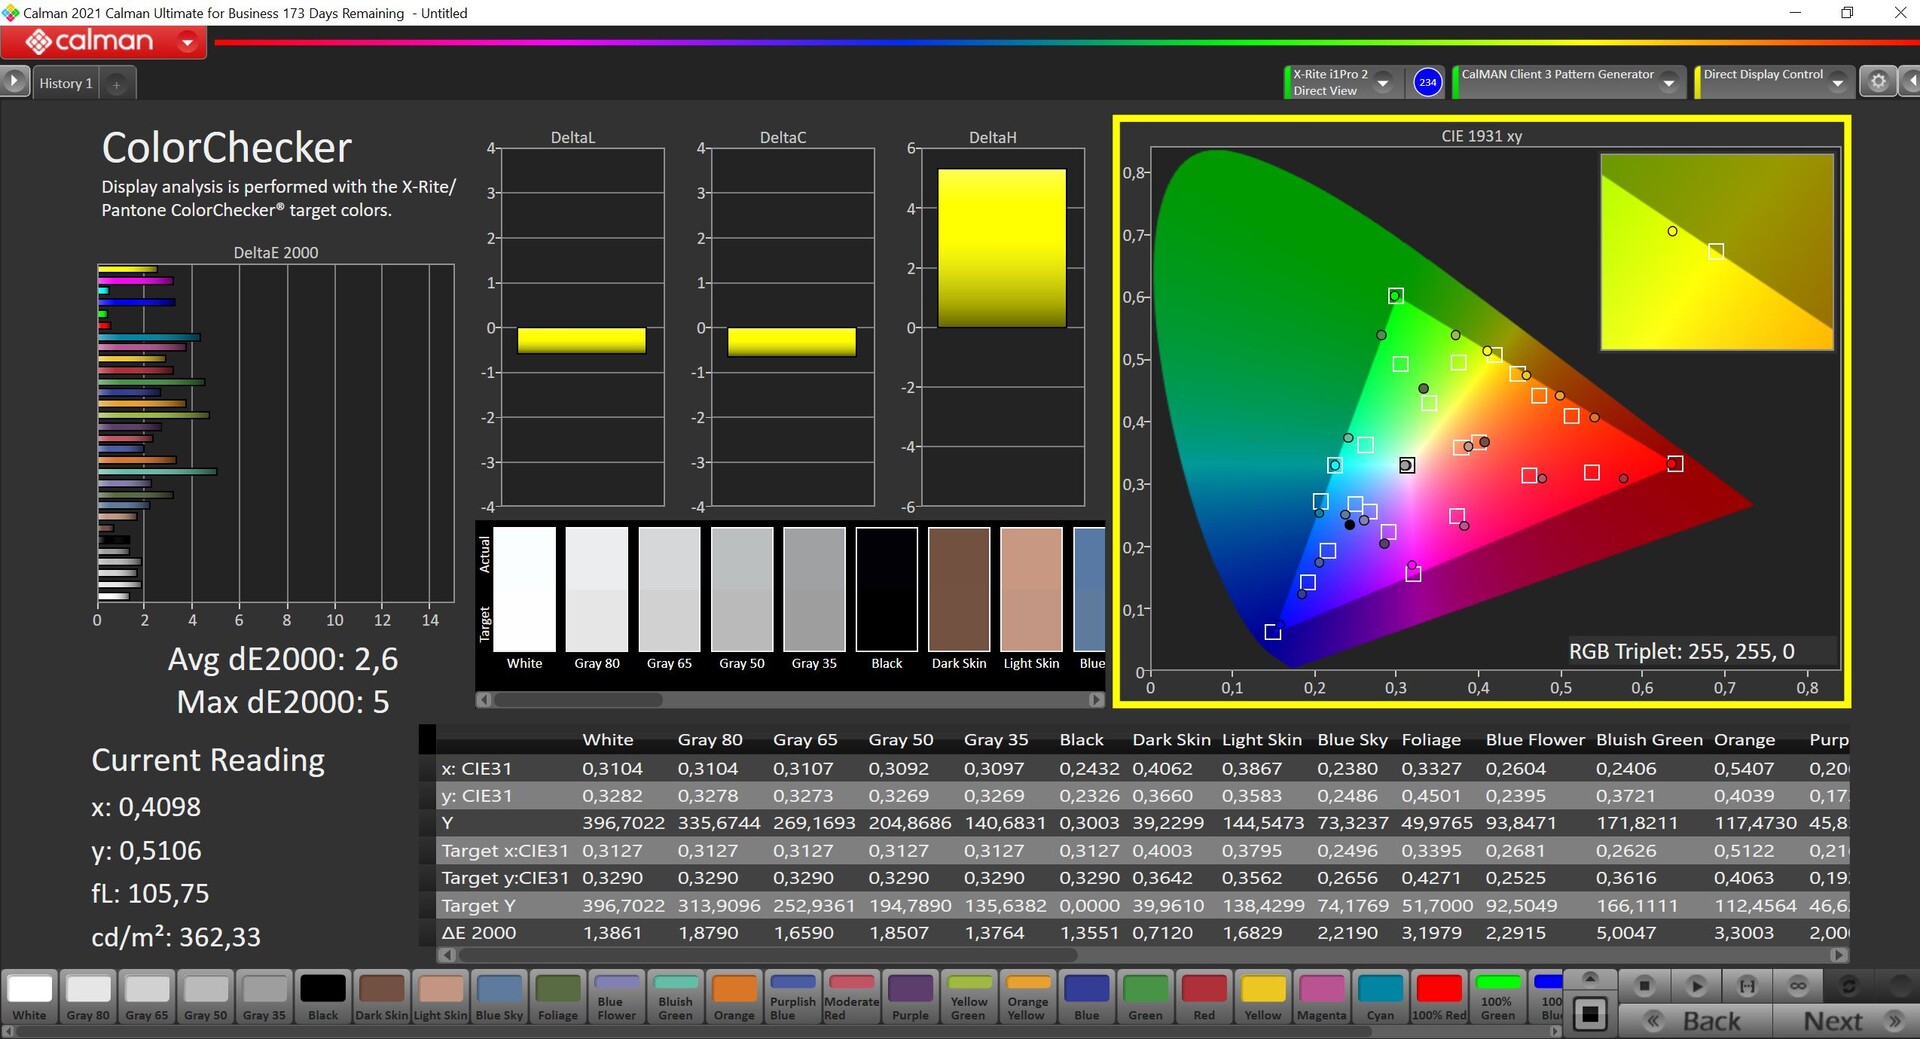
Analisamos o painel usando o software profissional CalMAN (X-Rite i1 Pro 2) e o dispositivo vem com dois perfis diferentes. Por padrão, o perfil Enhanced está ativado, no qual as cores parecem um pouco mais vivas e saturadas, mas isso também leva a desvios de cores mais altos. O perfil sRGB, subjetivamente, parece um pouco mais pálido, mas foi excelente em nossa análise e forneceu valores muito precisos, sem quaisquer discrepâncias, tanto para a escala de cinza quanto para as representações de cores. Juntamente com a cobertura sRGB completa, é definitivamente possível editar imagens sem problemas assim que o produto sai da caixa. Não foi possível melhorar ainda mais a tela com nossa própria calibração, e é por isso que não estamos oferecendo um perfil para download aqui.
Exibir tempos de resposta
| ↔ Tempo de resposta preto para branco | ||
|---|---|---|
| 28.7 ms ... ascensão ↗ e queda ↘ combinadas | ↗ 13 ms ascensão | 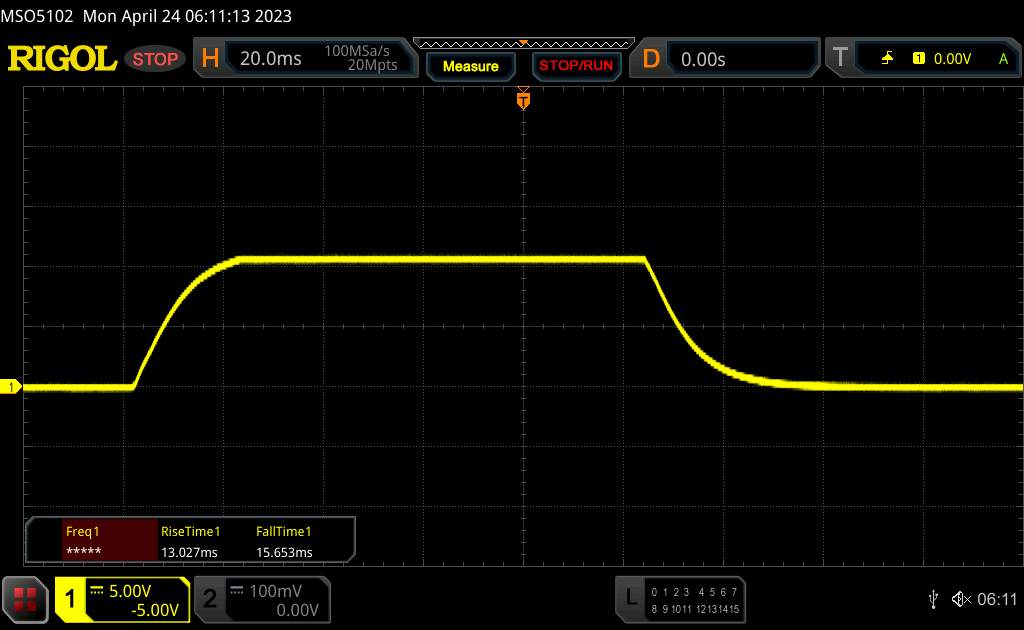 |
| ↘ 15.7 ms queda | ||
| A tela mostra taxas de resposta relativamente lentas em nossos testes e pode ser muito lenta para os jogadores. Em comparação, todos os dispositivos testados variam de 0.1 (mínimo) a 240 (máximo) ms. » 76 % de todos os dispositivos são melhores. Isso significa que o tempo de resposta medido é pior que a média de todos os dispositivos testados (19.8 ms). | ||
| ↔ Tempo de resposta 50% cinza a 80% cinza | ||
| 52.4 ms ... ascensão ↗ e queda ↘ combinadas | ↗ 24.4 ms ascensão | 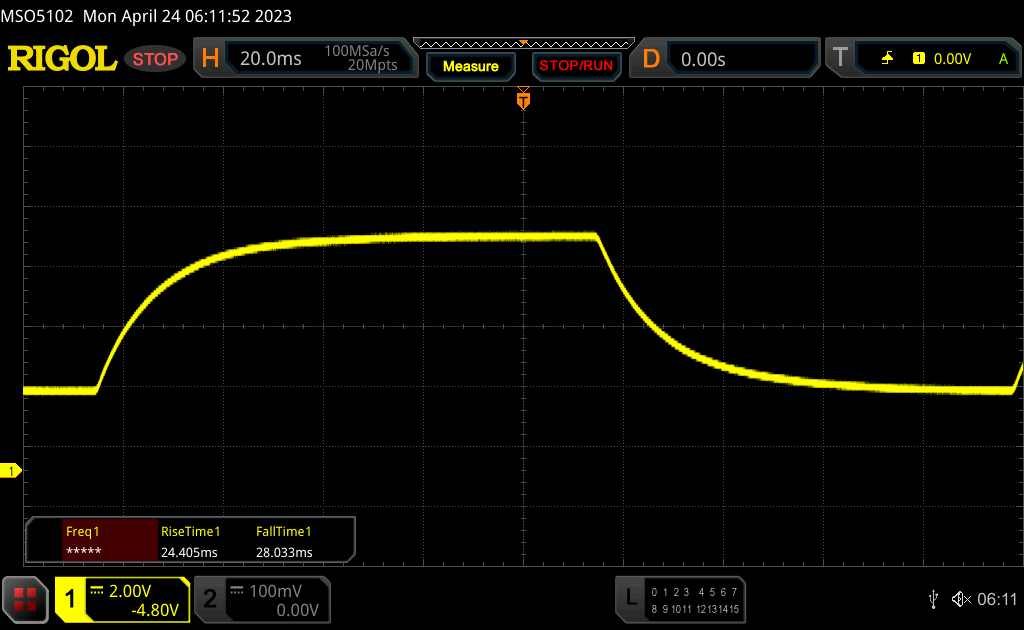 |
| ↘ 28 ms queda | ||
| A tela mostra taxas de resposta lentas em nossos testes e será insatisfatória para os jogadores. Em comparação, todos os dispositivos testados variam de 0.165 (mínimo) a 636 (máximo) ms. » 89 % de todos os dispositivos são melhores. Isso significa que o tempo de resposta medido é pior que a média de todos os dispositivos testados (31 ms). | ||
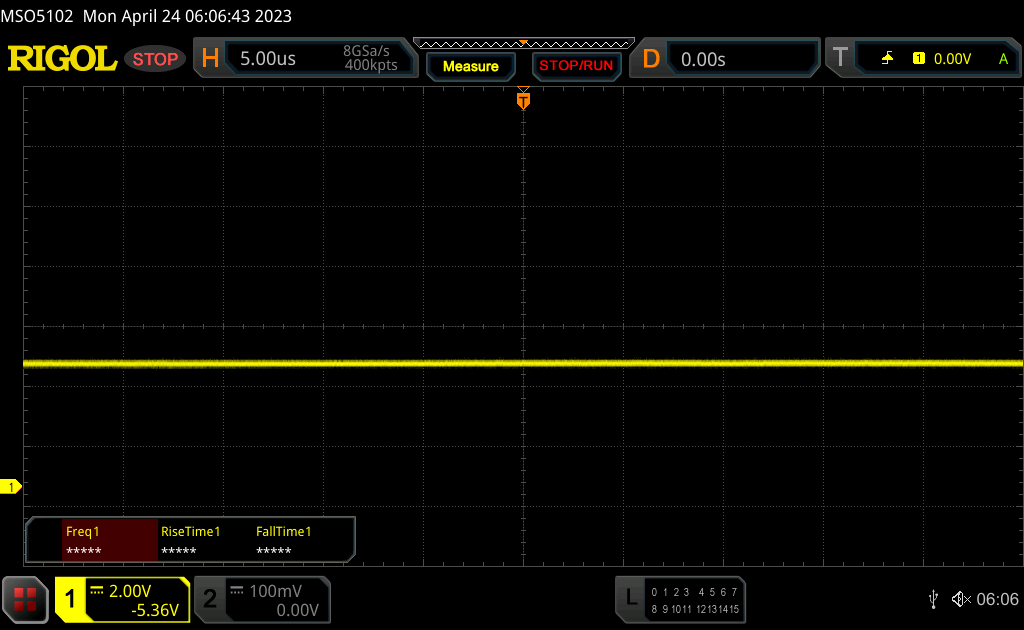
Cintilação da tela / PWM (modulação por largura de pulso)
| Tela tremeluzindo/PWM detectado | 22000 Hz | ≤ 50 % configuração de brilho | 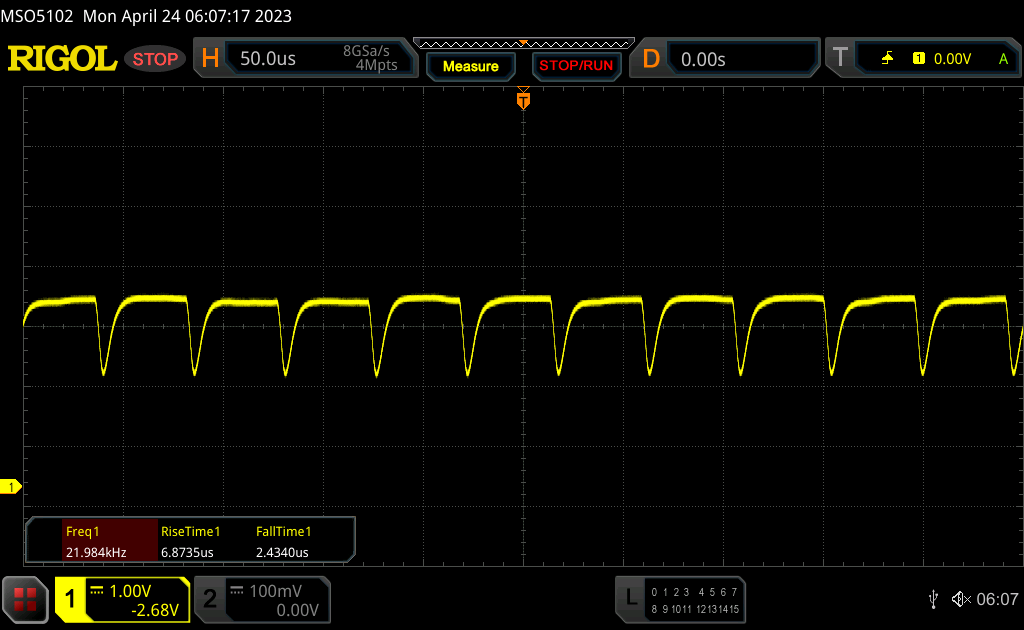 |
A luz de fundo da tela pisca em 22000 Hz (pior caso, por exemplo, utilizando PWM) Cintilação detectada em uma configuração de brilho de 50 % e abaixo. Não deve haver cintilação ou PWM acima desta configuração de brilho. A frequência de 22000 Hz é bastante alta, então a maioria dos usuários sensíveis ao PWM não deve notar nenhuma oscilação. [pwm_comparison] Em comparação: 52 % de todos os dispositivos testados não usam PWM para escurecer a tela. Se PWM foi detectado, uma média de 7754 (mínimo: 5 - máximo: 343500) Hz foi medida. | |||
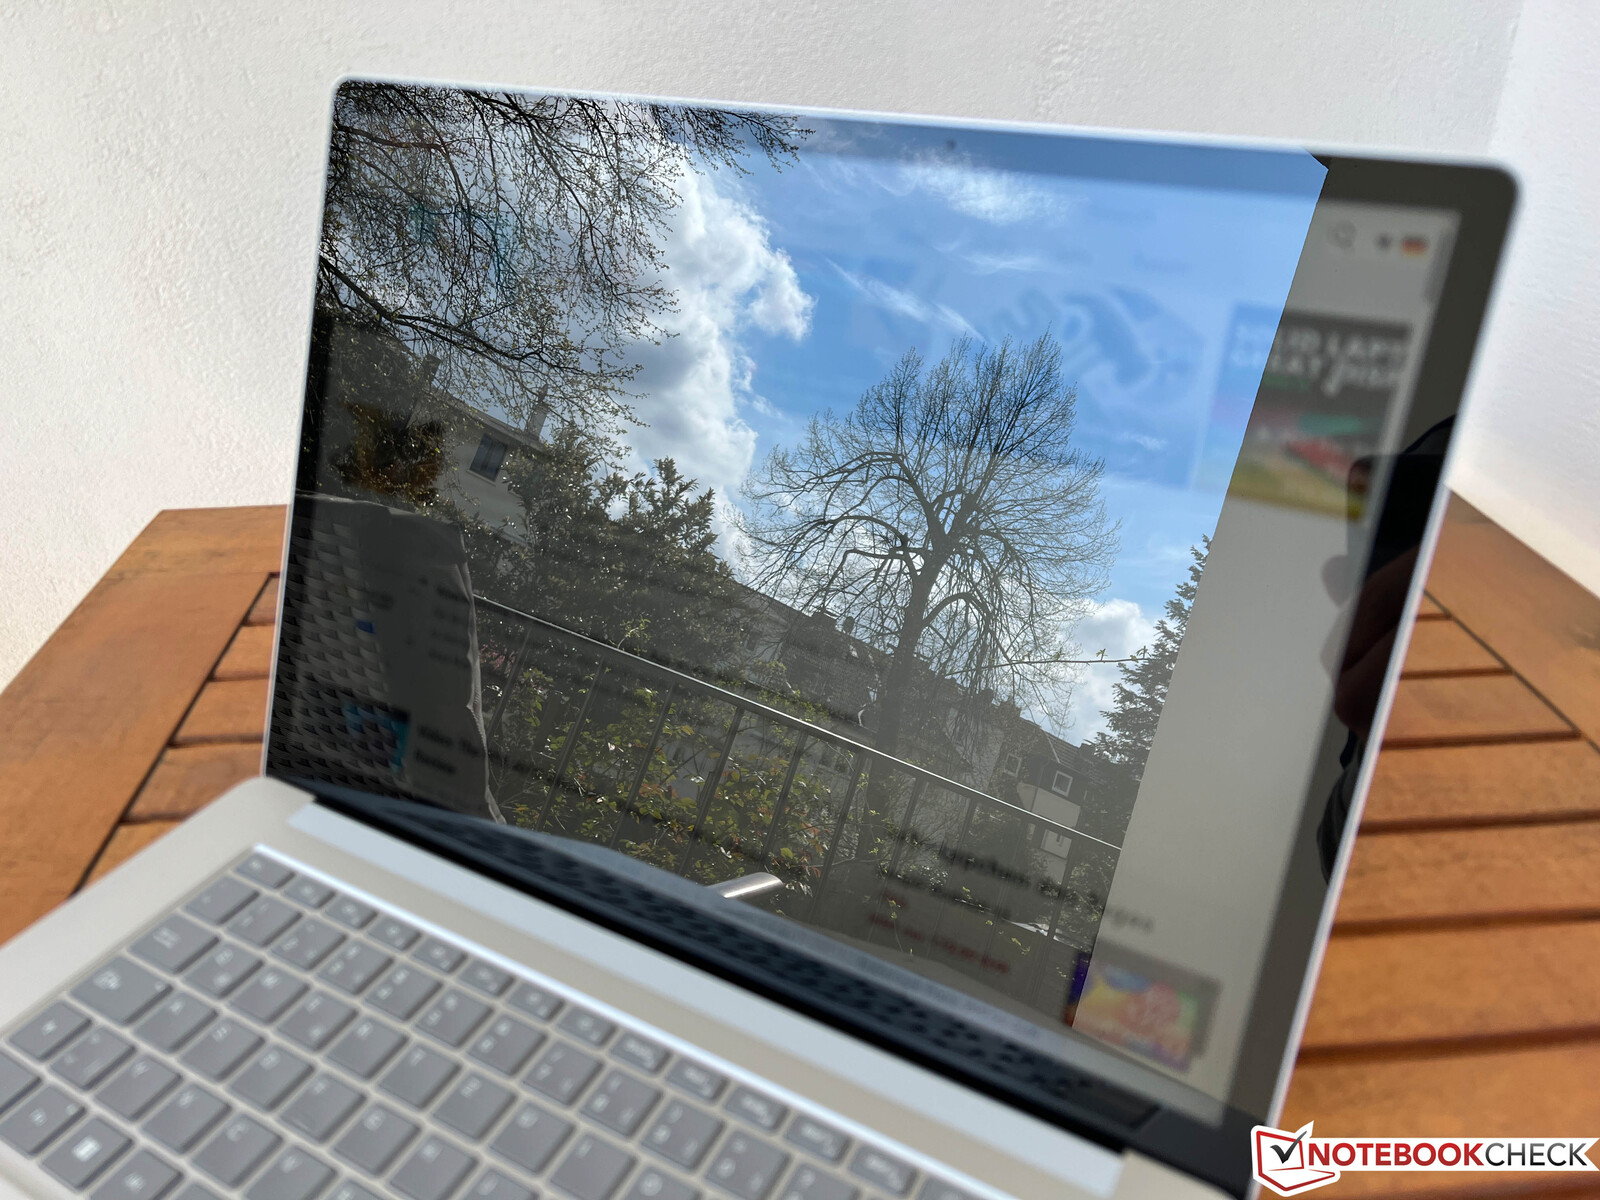
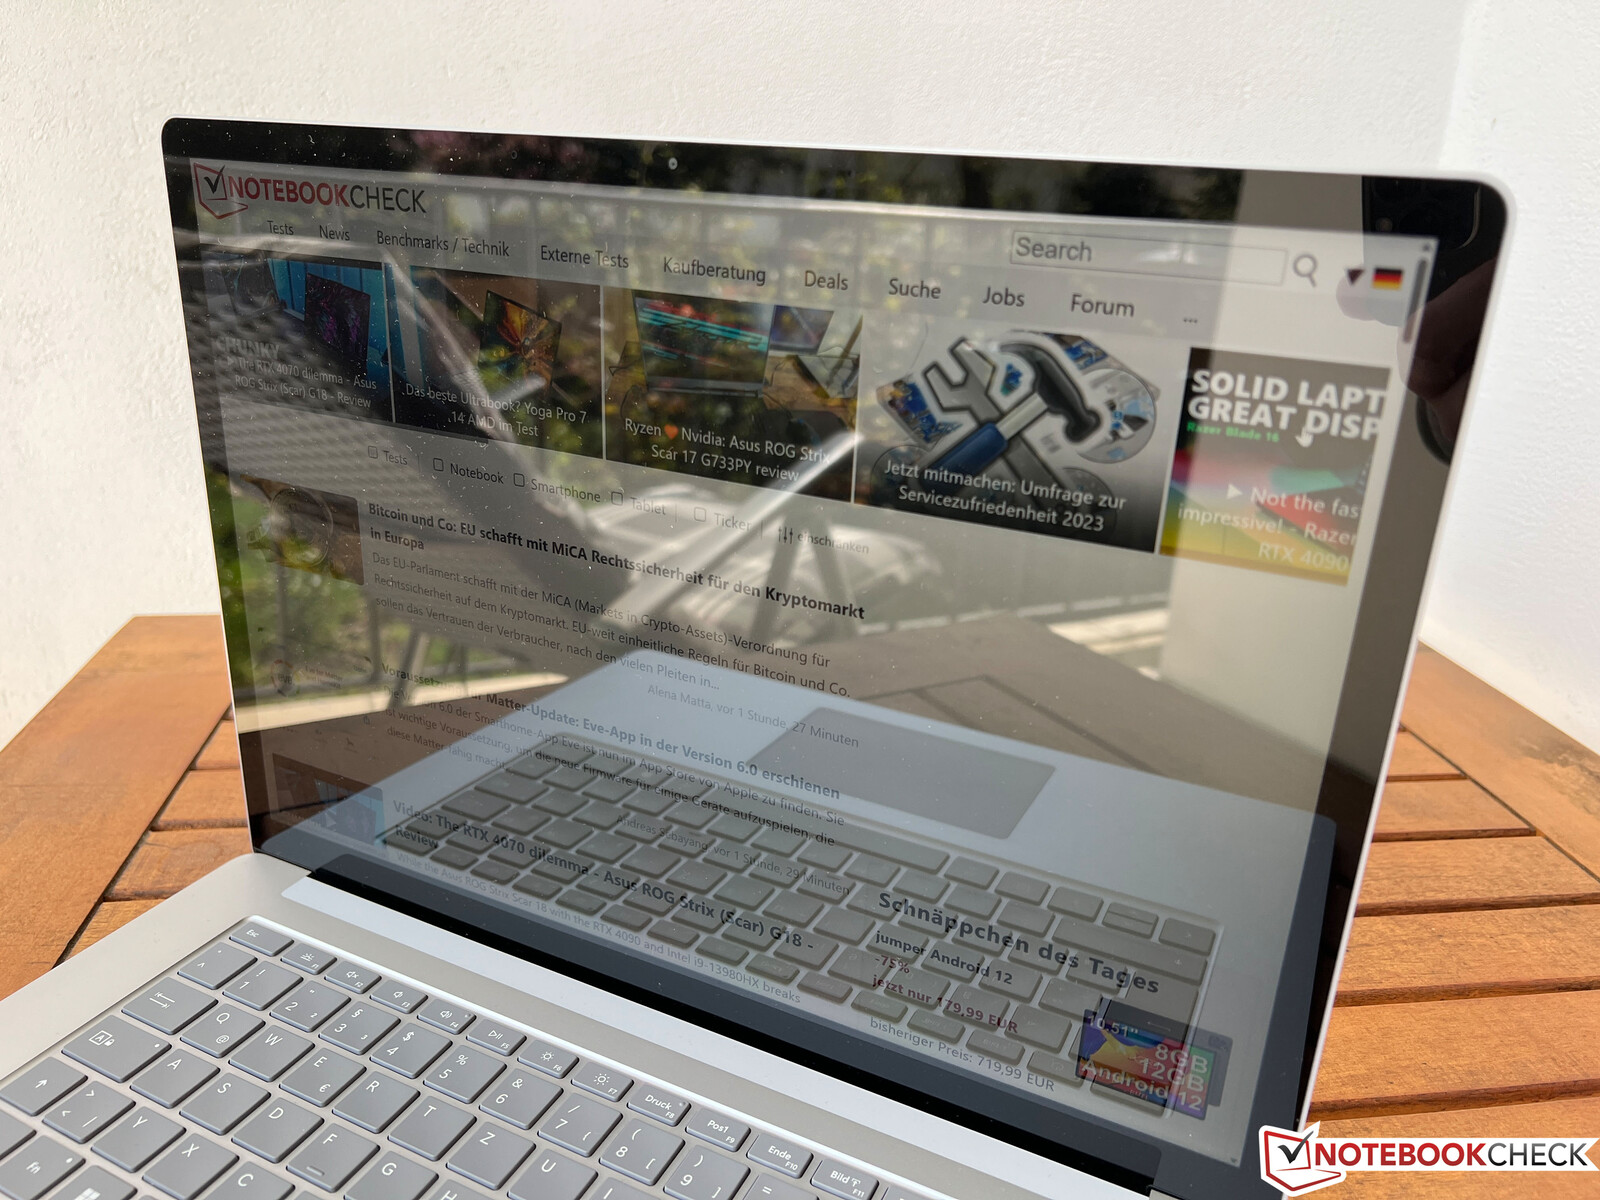
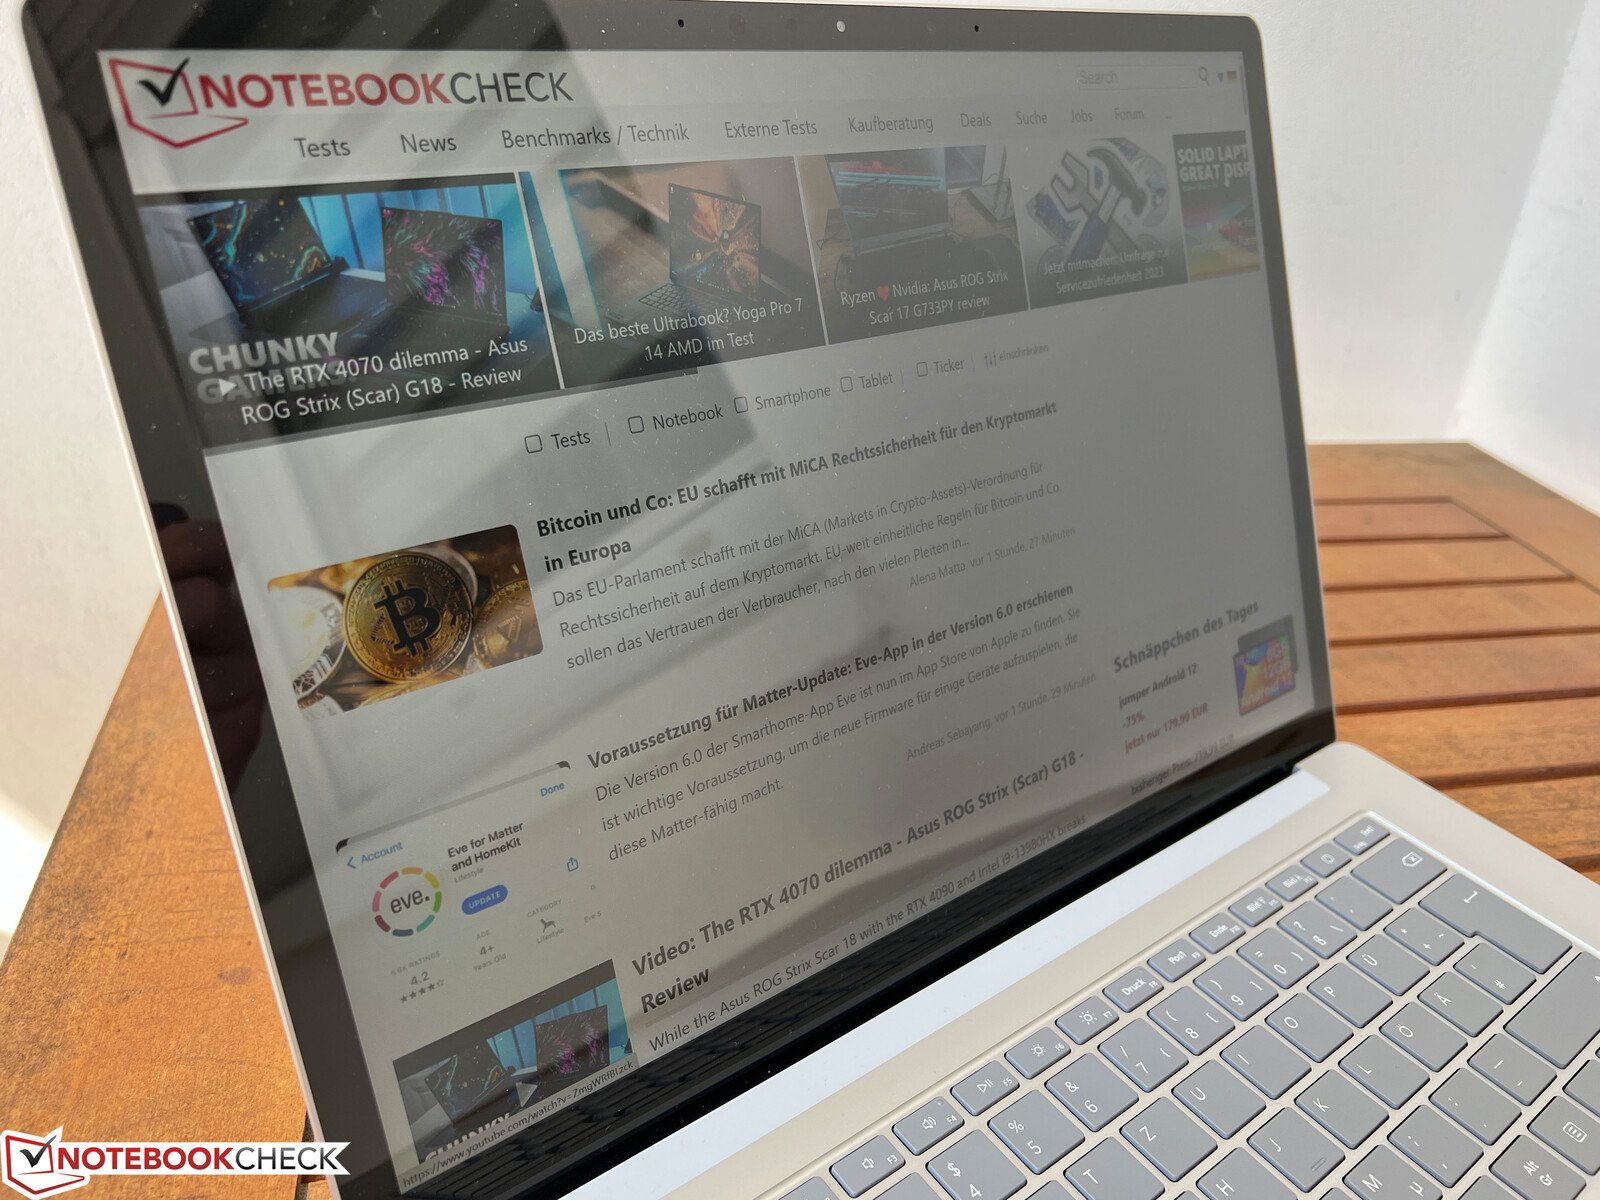
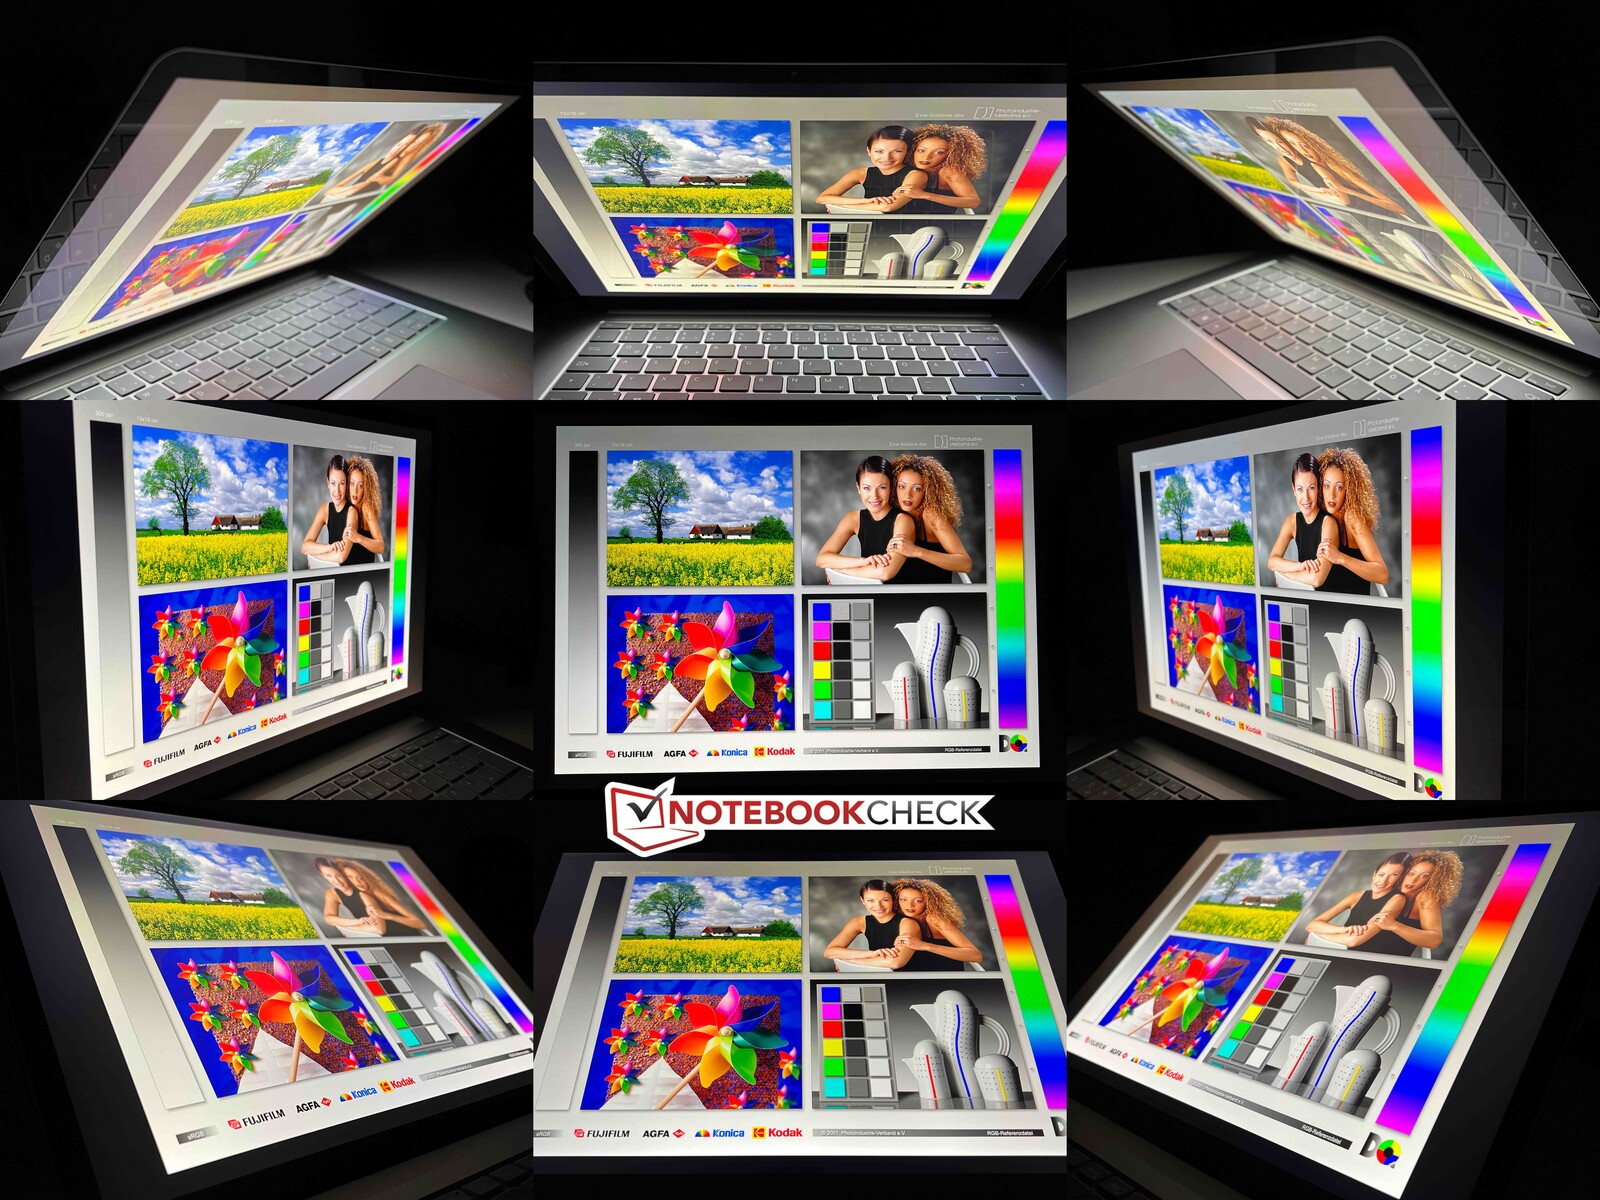
É difícil usar o Surface Laptop 5 em ambientes externos porque a tela sensível ao toque é muito reflexiva - o laptop funciona quase como um espelho em dias claros. Isso significa que você teria mais sorte se trabalhasse na sombra. A estabilidade do ângulo de visão é muito boa, mas os reflexos novamente se tornam um problema em ângulos maiores.
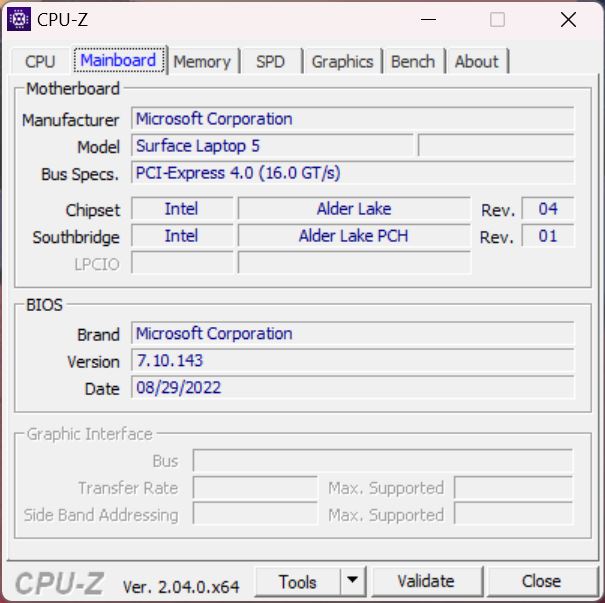
Desempenho - A Microsoft usou o Alder Lake-U
A Microsoft abandonou a versão AMD do laptop Surface e agora conta apenas com CPUs Intel. É aqui que os modelos Alder Lake da série U entram em cena. O fato de eles ainda não usarem CPUs Raptor Lake (13ª geração) não é um problema, pois elas oferecem um desempenho apenas marginalmente melhor. A RAM é soldada e não pode ser atualizada, mas a Microsoft pelo menos oferece a opção de até 32 GB de RAM.
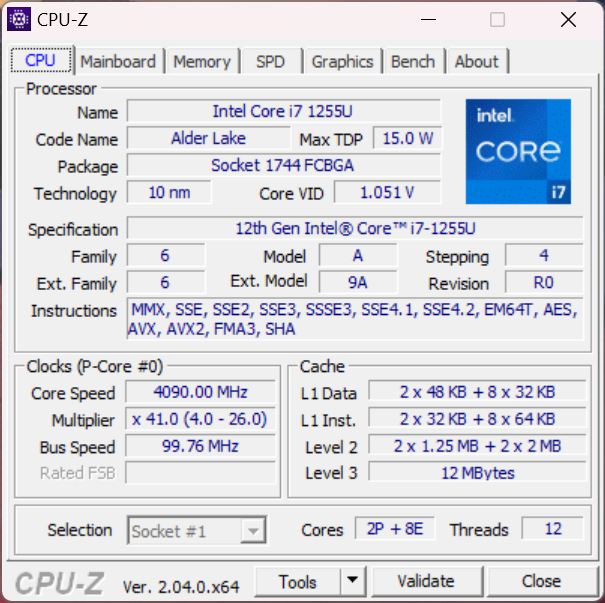
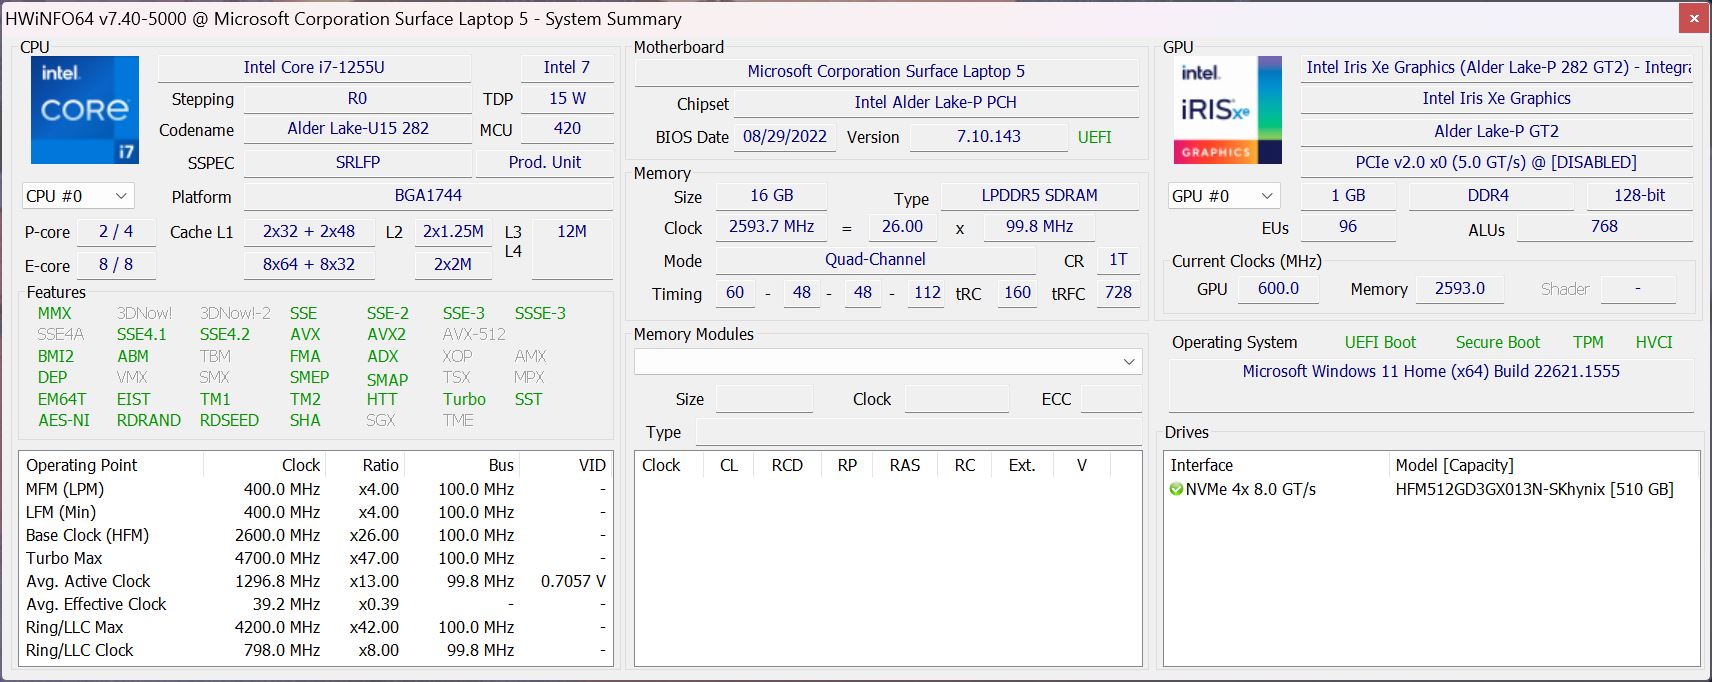
Processador - Core i7-1255U
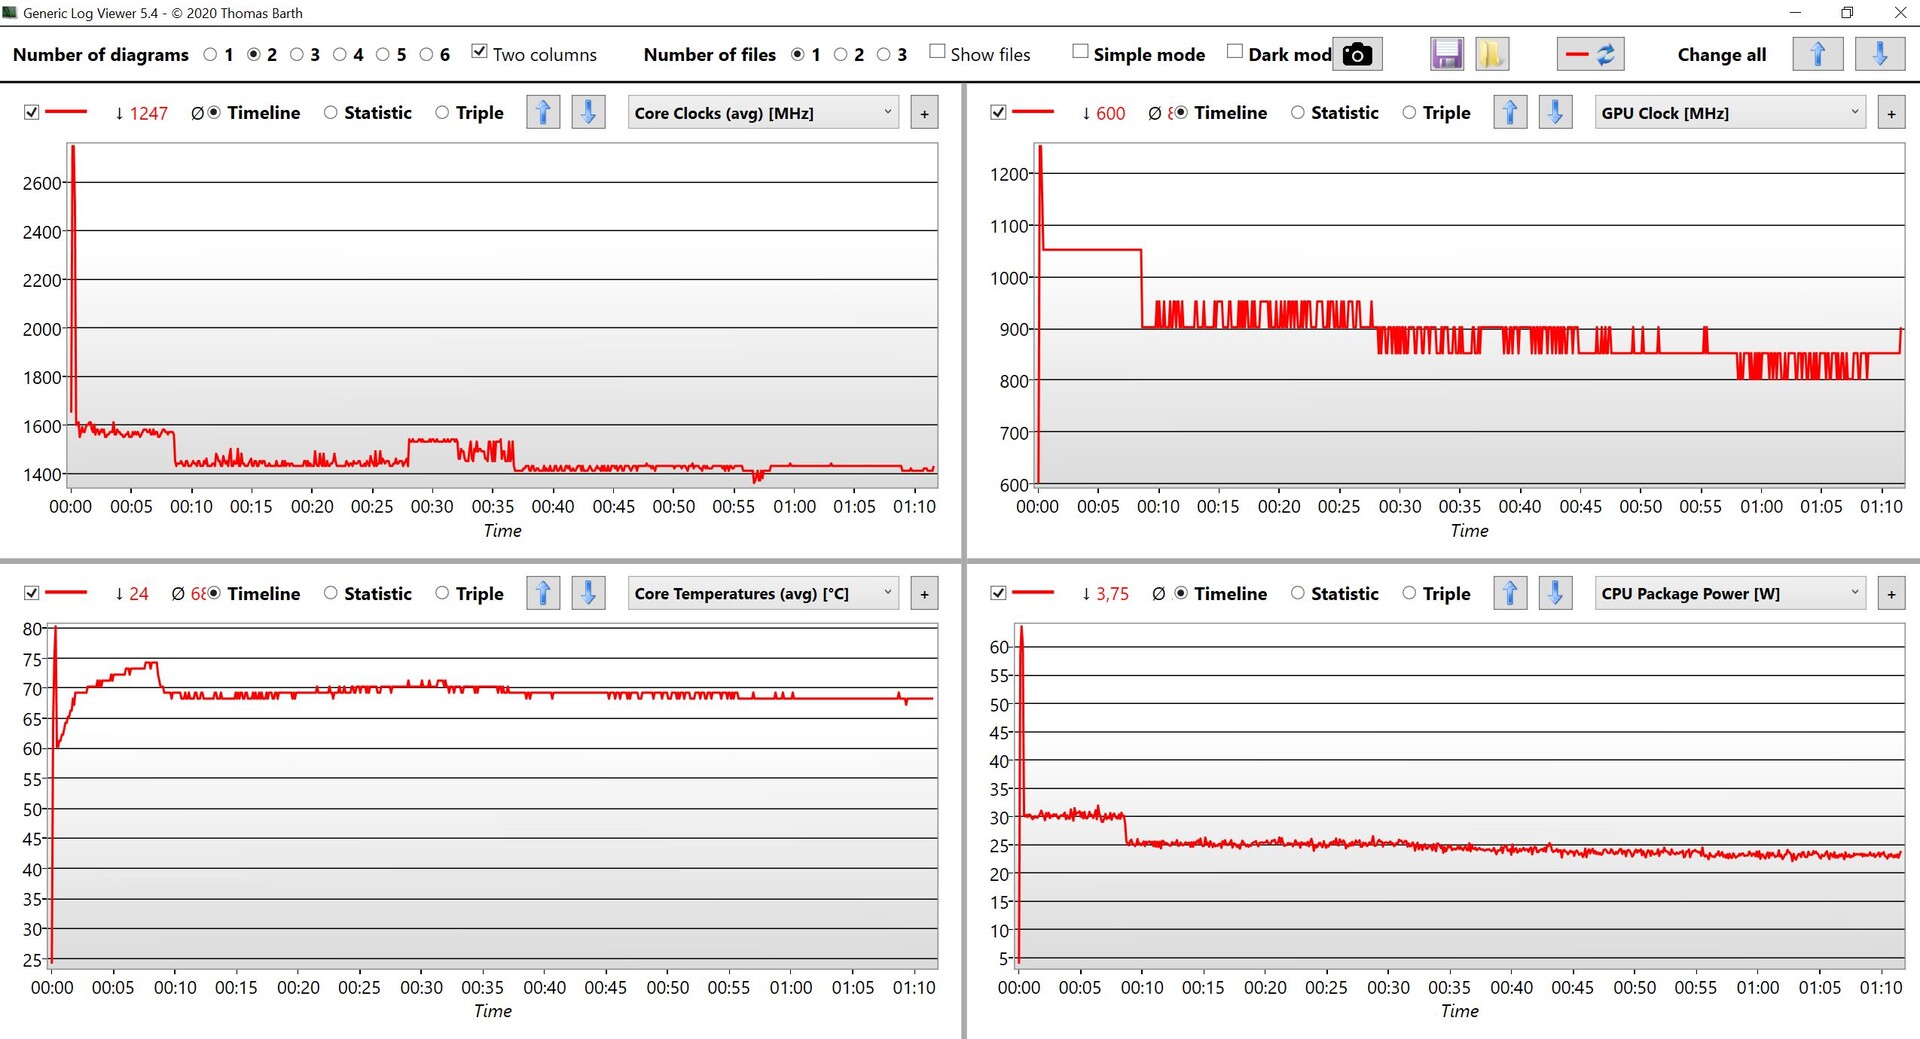
A série Alder Lake (12ª geração) Intel Core i7-1255Uapresenta dois núcleos de desempenho rápido, incluindo Hyper-threading em combinação com 8 núcleos de eficiência, o que significa que um total de até 12 threads pode ser processado simultaneamente. O processador do Surface Laptop 5 consumiu 60 watts por cerca de 1 a 2 segundos antes de se estabilizar em 30 watts. Observando essas taxas, não entendemos por que a Microsoft não optou por um chip Alder Lake P.
Em comparação com oSurface Laptop 4 13 com um Core i7-1185G7o modelo mais novo foi 33% mais rápido, em média, e seu desempenho de núcleo único, em particular, foi excelente. Em comparação com seu antecessor com um processador AMDno entanto, seu desempenho de vários núcleos foi pior - aqui, nós o comparamos com um Ryzen 7 4980U. O desempenho da CPU do laptop é definitivamente suficiente para as tarefas diárias, mas, em vista do preço mais alto, esperávamos mais dos níveis de desempenho.
Quando alimentado por sua bateria, o desempenho de vários núcleos do dispositivo caiu cerca de 8%. Aqui, o processador consumiu um máximo de 35/25 watts. No entanto, como as temperaturas não subiram tão rapidamente, a CPU conseguiu permanecer com 35 watts por muito mais tempo e depois caiu para 25 watts. Isso também mostra que sua configuração de TDP não é particularmente boa e o limite de 60 watts não faz muito sentido. Mais benchmarks de CPU estão disponíveis emnossa seção de tecnologia.
Cinebench R15 Multi continuous test
Cinebench R23: Multi Core | Single Core
Cinebench R20: CPU (Multi Core) | CPU (Single Core)
Cinebench R15: CPU Multi 64Bit | CPU Single 64Bit
Blender: v2.79 BMW27 CPU
7-Zip 18.03: 7z b 4 | 7z b 4 -mmt1
Geekbench 5.5: Multi-Core | Single-Core
HWBOT x265 Benchmark v2.2: 4k Preset
LibreOffice : 20 Documents To PDF
R Benchmark 2.5: Overall mean
| CPU Performance rating | |
| Dell XPS 15 9520 RTX 3050 Ti | |
| Asus Zenbook Pro 15 OLED UM535Q | |
| Média da turma Office | |
| Microsoft Surface Laptop 5 15, i7-1255U | |
| Média Intel Core i7-1255U | |
| LG Gram 15Z90Q | |
| Microsoft Surface Laptop 4 15 AMD TFF_00028 | |
| Microsoft Surface Laptop 4 13 i7 | |
| Samsung Galaxy Book Pro 15 NP950XDB-KC5US | |
| Cinebench R23 / Multi Core | |
| Dell XPS 15 9520 RTX 3050 Ti | |
| Asus Zenbook Pro 15 OLED UM535Q | |
| Média da turma Office (1673 - 22808, n=76, últimos 2 anos) | |
| Microsoft Surface Laptop 4 15 AMD TFF_00028 | |
| Microsoft Surface Laptop 5 15, i7-1255U | |
| LG Gram 15Z90Q | |
| Média Intel Core i7-1255U (5269 - 9628, n=11) | |
| Microsoft Surface Laptop 4 13 i7 | |
| Samsung Galaxy Book Pro 15 NP950XDB-KC5US | |
| Cinebench R23 / Single Core | |
| Dell XPS 15 9520 RTX 3050 Ti | |
| Média da turma Office (708 - 2130, n=76, últimos 2 anos) | |
| Microsoft Surface Laptop 5 15, i7-1255U | |
| Média Intel Core i7-1255U (1408 - 1775, n=11) | |
| Microsoft Surface Laptop 4 13 i7 | |
| LG Gram 15Z90Q | |
| Asus Zenbook Pro 15 OLED UM535Q | |
| Samsung Galaxy Book Pro 15 NP950XDB-KC5US | |
| Microsoft Surface Laptop 4 15 AMD TFF_00028 | |
| Cinebench R20 / CPU (Multi Core) | |
| Dell XPS 15 9520 RTX 3050 Ti | |
| Asus Zenbook Pro 15 OLED UM535Q | |
| Média da turma Office (648 - 8840, n=75, últimos 2 anos) | |
| Microsoft Surface Laptop 4 15 AMD TFF_00028 | |
| Microsoft Surface Laptop 5 15, i7-1255U | |
| LG Gram 15Z90Q | |
| Média Intel Core i7-1255U (2095 - 3702, n=11) | |
| Samsung Galaxy Book Pro 15 NP950XDB-KC5US | |
| Microsoft Surface Laptop 4 13 i7 | |
| Cinebench R20 / CPU (Single Core) | |
| Dell XPS 15 9520 RTX 3050 Ti | |
| Média da turma Office (345 - 816, n=75, últimos 2 anos) | |
| Microsoft Surface Laptop 5 15, i7-1255U | |
| Média Intel Core i7-1255U (550 - 682, n=11) | |
| Microsoft Surface Laptop 4 13 i7 | |
| Asus Zenbook Pro 15 OLED UM535Q | |
| LG Gram 15Z90Q | |
| Samsung Galaxy Book Pro 15 NP950XDB-KC5US | |
| Microsoft Surface Laptop 4 15 AMD TFF_00028 | |
| Cinebench R15 / CPU Multi 64Bit | |
| Dell XPS 15 9520 RTX 3050 Ti | |
| Asus Zenbook Pro 15 OLED UM535Q | |
| Média da turma Office (250 - 3380, n=77, últimos 2 anos) | |
| Microsoft Surface Laptop 4 15 AMD TFF_00028 | |
| Microsoft Surface Laptop 5 15, i7-1255U | |
| LG Gram 15Z90Q | |
| Média Intel Core i7-1255U (919 - 1577, n=11) | |
| Microsoft Surface Laptop 4 13 i7 | |
| Samsung Galaxy Book Pro 15 NP950XDB-KC5US | |
| Cinebench R15 / CPU Single 64Bit | |
| Dell XPS 15 9520 RTX 3050 Ti | |
| Média da turma Office (99.5 - 316, n=77, últimos 2 anos) | |
| Microsoft Surface Laptop 5 15, i7-1255U | |
| Asus Zenbook Pro 15 OLED UM535Q | |
| Média Intel Core i7-1255U (161 - 251, n=12) | |
| Microsoft Surface Laptop 4 13 i7 | |
| LG Gram 15Z90Q | |
| Microsoft Surface Laptop 4 15 AMD TFF_00028 | |
| Samsung Galaxy Book Pro 15 NP950XDB-KC5US | |
| Blender / v2.79 BMW27 CPU | |
| Microsoft Surface Laptop 4 13 i7 | |
| Samsung Galaxy Book Pro 15 NP950XDB-KC5US | |
| LG Gram 15Z90Q | |
| Média Intel Core i7-1255U (372 - 601, n=11) | |
| Microsoft Surface Laptop 5 15, i7-1255U | |
| Média da turma Office (158 - 1940, n=76, últimos 2 anos) | |
| Microsoft Surface Laptop 4 15 AMD TFF_00028 | |
| Asus Zenbook Pro 15 OLED UM535Q | |
| Dell XPS 15 9520 RTX 3050 Ti | |
| 7-Zip 18.03 / 7z b 4 | |
| Dell XPS 15 9520 RTX 3050 Ti | |
| Asus Zenbook Pro 15 OLED UM535Q | |
| Média da turma Office (7098 - 76886, n=77, últimos 2 anos) | |
| Microsoft Surface Laptop 4 15 AMD TFF_00028 | |
| Microsoft Surface Laptop 5 15, i7-1255U | |
| Média Intel Core i7-1255U (24126 - 37365, n=11) | |
| LG Gram 15Z90Q | |
| Microsoft Surface Laptop 4 13 i7 | |
| Samsung Galaxy Book Pro 15 NP950XDB-KC5US | |
| 7-Zip 18.03 / 7z b 4 -mmt1 | |
| Dell XPS 15 9520 RTX 3050 Ti | |
| Asus Zenbook Pro 15 OLED UM535Q | |
| Média da turma Office (3387 - 6469, n=77, últimos 2 anos) | |
| Média Intel Core i7-1255U (5059 - 5529, n=11) | |
| Microsoft Surface Laptop 5 15, i7-1255U | |
| Microsoft Surface Laptop 4 13 i7 | |
| Samsung Galaxy Book Pro 15 NP950XDB-KC5US | |
| LG Gram 15Z90Q | |
| Microsoft Surface Laptop 4 15 AMD TFF_00028 | |
| Geekbench 5.5 / Multi-Core | |
| Dell XPS 15 9520 RTX 3050 Ti | |
| Média da turma Office (1483 - 16999, n=73, últimos 2 anos) | |
| Microsoft Surface Laptop 5 15, i7-1255U | |
| LG Gram 15Z90Q | |
| Asus Zenbook Pro 15 OLED UM535Q | |
| Média Intel Core i7-1255U (4463 - 8821, n=12) | |
| Microsoft Surface Laptop 4 15 AMD TFF_00028 | |
| Microsoft Surface Laptop 4 13 i7 | |
| Samsung Galaxy Book Pro 15 NP950XDB-KC5US | |
| Geekbench 5.5 / Single-Core | |
| Média da turma Office (811 - 2175, n=73, últimos 2 anos) | |
| Dell XPS 15 9520 RTX 3050 Ti | |
| Microsoft Surface Laptop 5 15, i7-1255U | |
| Média Intel Core i7-1255U (1560 - 1712, n=12) | |
| LG Gram 15Z90Q | |
| Samsung Galaxy Book Pro 15 NP950XDB-KC5US | |
| Microsoft Surface Laptop 4 13 i7 | |
| Asus Zenbook Pro 15 OLED UM535Q | |
| Microsoft Surface Laptop 4 15 AMD TFF_00028 | |
| HWBOT x265 Benchmark v2.2 / 4k Preset | |
| Asus Zenbook Pro 15 OLED UM535Q | |
| Dell XPS 15 9520 RTX 3050 Ti | |
| Média da turma Office (2.21 - 26, n=76, últimos 2 anos) | |
| Microsoft Surface Laptop 5 15, i7-1255U | |
| Microsoft Surface Laptop 4 15 AMD TFF_00028 | |
| Média Intel Core i7-1255U (6.31 - 10.1, n=11) | |
| LG Gram 15Z90Q | |
| Samsung Galaxy Book Pro 15 NP950XDB-KC5US | |
| Microsoft Surface Laptop 4 13 i7 | |
| LibreOffice / 20 Documents To PDF | |
| Microsoft Surface Laptop 4 15 AMD TFF_00028 | |
| Média da turma Office (39.9 - 102.3, n=76, últimos 2 anos) | |
| LG Gram 15Z90Q | |
| Samsung Galaxy Book Pro 15 NP950XDB-KC5US | |
| Microsoft Surface Laptop 4 13 i7 | |
| Asus Zenbook Pro 15 OLED UM535Q | |
| Média Intel Core i7-1255U (35.6 - 52.5, n=11) | |
| Microsoft Surface Laptop 5 15, i7-1255U | |
| Dell XPS 15 9520 RTX 3050 Ti | |
| R Benchmark 2.5 / Overall mean | |
| Microsoft Surface Laptop 4 15 AMD TFF_00028 | |
| Samsung Galaxy Book Pro 15 NP950XDB-KC5US | |
| Microsoft Surface Laptop 4 13 i7 | |
| LG Gram 15Z90Q | |
| Média da turma Office (0.393 - 0.888, n=76, últimos 2 anos) | |
| Asus Zenbook Pro 15 OLED UM535Q | |
| Média Intel Core i7-1255U (0.4688 - 0.558, n=11) | |
| Microsoft Surface Laptop 5 15, i7-1255U | |
| Dell XPS 15 9520 RTX 3050 Ti | |
* ... menor é melhor
AIDA64: FP32 Ray-Trace | FPU Julia | CPU SHA3 | CPU Queen | FPU SinJulia | FPU Mandel | CPU AES | CPU ZLib | FP64 Ray-Trace | CPU PhotoWorxx
| Performance rating | |
| Asus Zenbook Pro 15 OLED UM535Q | |
| Média da turma Office | |
| Microsoft Surface Laptop 4 15 AMD TFF_00028 | |
| Dell XPS 15 9520 RTX 3050 Ti | |
| Microsoft Surface Laptop 5 15, i7-1255U | |
| LG Gram 15Z90Q | |
| Média Intel Core i7-1255U | |
| Samsung Galaxy Book Pro 15 NP950XDB-KC5US | |
| AIDA64 / FP32 Ray-Trace | |
| Asus Zenbook Pro 15 OLED UM535Q | |
| Média da turma Office (2083 - 31245, n=83, últimos 2 anos) | |
| Microsoft Surface Laptop 4 15 AMD TFF_00028 | |
| Dell XPS 15 9520 RTX 3050 Ti | |
| Microsoft Surface Laptop 5 15, i7-1255U | |
| Média Intel Core i7-1255U (4313 - 8127, n=11) | |
| LG Gram 15Z90Q | |
| Samsung Galaxy Book Pro 15 NP950XDB-KC5US | |
| AIDA64 / FPU Julia | |
| Asus Zenbook Pro 15 OLED UM535Q | |
| Microsoft Surface Laptop 4 15 AMD TFF_00028 | |
| Média da turma Office (8191 - 125394, n=83, últimos 2 anos) | |
| Microsoft Surface Laptop 5 15, i7-1255U | |
| LG Gram 15Z90Q | |
| Dell XPS 15 9520 RTX 3050 Ti | |
| Média Intel Core i7-1255U (19813 - 41353, n=11) | |
| Samsung Galaxy Book Pro 15 NP950XDB-KC5US | |
| AIDA64 / CPU SHA3 | |
| Asus Zenbook Pro 15 OLED UM535Q | |
| Média da turma Office (433 - 5755, n=83, últimos 2 anos) | |
| Dell XPS 15 9520 RTX 3050 Ti | |
| Microsoft Surface Laptop 4 15 AMD TFF_00028 | |
| Microsoft Surface Laptop 5 15, i7-1255U | |
| Média Intel Core i7-1255U (1325 - 2135, n=11) | |
| LG Gram 15Z90Q | |
| Samsung Galaxy Book Pro 15 NP950XDB-KC5US | |
| AIDA64 / CPU Queen | |
| Asus Zenbook Pro 15 OLED UM535Q | |
| Dell XPS 15 9520 RTX 3050 Ti | |
| Microsoft Surface Laptop 4 15 AMD TFF_00028 | |
| LG Gram 15Z90Q | |
| Média da turma Office (22784 - 115197, n=67, últimos 2 anos) | |
| Microsoft Surface Laptop 5 15, i7-1255U | |
| Média Intel Core i7-1255U (61375 - 65892, n=11) | |
| Samsung Galaxy Book Pro 15 NP950XDB-KC5US | |
| AIDA64 / FPU SinJulia | |
| Microsoft Surface Laptop 4 15 AMD TFF_00028 | |
| Asus Zenbook Pro 15 OLED UM535Q | |
| Dell XPS 15 9520 RTX 3050 Ti | |
| Média da turma Office (1378 - 18321, n=83, últimos 2 anos) | |
| Microsoft Surface Laptop 5 15, i7-1255U | |
| LG Gram 15Z90Q | |
| Média Intel Core i7-1255U (3577 - 5095, n=11) | |
| Samsung Galaxy Book Pro 15 NP950XDB-KC5US | |
| AIDA64 / FPU Mandel | |
| Asus Zenbook Pro 15 OLED UM535Q | |
| Microsoft Surface Laptop 4 15 AMD TFF_00028 | |
| Média da turma Office (4601 - 66922, n=83, últimos 2 anos) | |
| Dell XPS 15 9520 RTX 3050 Ti | |
| Microsoft Surface Laptop 5 15, i7-1255U | |
| Média Intel Core i7-1255U (11759 - 20187, n=11) | |
| LG Gram 15Z90Q | |
| Samsung Galaxy Book Pro 15 NP950XDB-KC5US | |
| AIDA64 / CPU AES | |
| Asus Zenbook Pro 15 OLED UM535Q | |
| Dell XPS 15 9520 RTX 3050 Ti | |
| Média da turma Office (4854 - 155900, n=83, últimos 2 anos) | |
| Microsoft Surface Laptop 4 15 AMD TFF_00028 | |
| Média Intel Core i7-1255U (27900 - 67458, n=11) | |
| Microsoft Surface Laptop 5 15, i7-1255U | |
| LG Gram 15Z90Q | |
| Samsung Galaxy Book Pro 15 NP950XDB-KC5US | |
| AIDA64 / CPU ZLib | |
| Dell XPS 15 9520 RTX 3050 Ti | |
| Asus Zenbook Pro 15 OLED UM535Q | |
| Microsoft Surface Laptop 4 15 AMD TFF_00028 | |
| Média da turma Office (114.6 - 1366, n=83, últimos 2 anos) | |
| Microsoft Surface Laptop 5 15, i7-1255U | |
| Média Intel Core i7-1255U (393 - 640, n=11) | |
| LG Gram 15Z90Q | |
| Samsung Galaxy Book Pro 15 NP950XDB-KC5US | |
| AIDA64 / FP64 Ray-Trace | |
| Asus Zenbook Pro 15 OLED UM535Q | |
| Média da turma Office (1109 - 17834, n=83, últimos 2 anos) | |
| Microsoft Surface Laptop 4 15 AMD TFF_00028 | |
| Dell XPS 15 9520 RTX 3050 Ti | |
| Microsoft Surface Laptop 5 15, i7-1255U | |
| Média Intel Core i7-1255U (2474 - 4400, n=11) | |
| Samsung Galaxy Book Pro 15 NP950XDB-KC5US | |
| LG Gram 15Z90Q | |
| AIDA64 / CPU PhotoWorxx | |
| LG Gram 15Z90Q | |
| Microsoft Surface Laptop 5 15, i7-1255U | |
| Média da turma Office (11090 - 65229, n=83, últimos 2 anos) | |
| Samsung Galaxy Book Pro 15 NP950XDB-KC5US | |
| Dell XPS 15 9520 RTX 3050 Ti | |
| Média Intel Core i7-1255U (13899 - 44054, n=11) | |
| Microsoft Surface Laptop 4 15 AMD TFF_00028 | |
| Asus Zenbook Pro 15 OLED UM535Q | |
Desempenho do sistema
O Surface Laptop 5 é um companheiro ágil para o uso diário e não identificamos nenhum problema durante nosso teste.
CrossMark: Overall | Productivity | Creativity | Responsiveness
| PCMark 10 / Score | |
| Dell XPS 15 9520 RTX 3050 Ti | |
| Asus Zenbook Pro 15 OLED UM535Q | |
| Média da turma Office (2601 - 9298, n=68, últimos 2 anos) | |
| Microsoft Surface Laptop 5 15, i7-1255U | |
| Média Intel Core i7-1255U, Intel Iris Xe Graphics G7 96EUs (4676 - 5523, n=9) | |
| Microsoft Surface Laptop 4 15 AMD TFF_00028 | |
| LG Gram 15Z90Q | |
| Samsung Galaxy Book Pro 15 NP950XDB-KC5US | |
| PCMark 10 / Essentials | |
| Dell XPS 15 9520 RTX 3050 Ti | |
| Média Intel Core i7-1255U, Intel Iris Xe Graphics G7 96EUs (9381 - 11654, n=9) | |
| Asus Zenbook Pro 15 OLED UM535Q | |
| Microsoft Surface Laptop 5 15, i7-1255U | |
| Média da turma Office (3245 - 11594, n=68, últimos 2 anos) | |
| Samsung Galaxy Book Pro 15 NP950XDB-KC5US | |
| LG Gram 15Z90Q | |
| Microsoft Surface Laptop 4 15 AMD TFF_00028 | |
| PCMark 10 / Productivity | |
| Média da turma Office (5336 - 17243, n=68, últimos 2 anos) | |
| Asus Zenbook Pro 15 OLED UM535Q | |
| Dell XPS 15 9520 RTX 3050 Ti | |
| Microsoft Surface Laptop 5 15, i7-1255U | |
| Microsoft Surface Laptop 4 15 AMD TFF_00028 | |
| Média Intel Core i7-1255U, Intel Iris Xe Graphics G7 96EUs (6530 - 7418, n=9) | |
| Samsung Galaxy Book Pro 15 NP950XDB-KC5US | |
| LG Gram 15Z90Q | |
| PCMark 10 / Digital Content Creation | |
| Dell XPS 15 9520 RTX 3050 Ti | |
| Média da turma Office (2049 - 13541, n=68, últimos 2 anos) | |
| Asus Zenbook Pro 15 OLED UM535Q | |
| Microsoft Surface Laptop 5 15, i7-1255U | |
| LG Gram 15Z90Q | |
| Microsoft Surface Laptop 4 15 AMD TFF_00028 | |
| Média Intel Core i7-1255U, Intel Iris Xe Graphics G7 96EUs (4498 - 6203, n=9) | |
| Samsung Galaxy Book Pro 15 NP950XDB-KC5US | |
| CrossMark / Overall | |
| Dell XPS 15 9520 RTX 3050 Ti | |
| Média da turma Office (381 - 2010, n=75, últimos 2 anos) | |
| Microsoft Surface Laptop 5 15, i7-1255U | |
| Média Intel Core i7-1255U, Intel Iris Xe Graphics G7 96EUs (1329 - 1573, n=9) | |
| Asus Zenbook Pro 15 OLED UM535Q | |
| CrossMark / Productivity | |
| Dell XPS 15 9520 RTX 3050 Ti | |
| Microsoft Surface Laptop 5 15, i7-1255U | |
| Média da turma Office (464 - 1880, n=75, últimos 2 anos) | |
| Média Intel Core i7-1255U, Intel Iris Xe Graphics G7 96EUs (1364 - 1554, n=9) | |
| Asus Zenbook Pro 15 OLED UM535Q | |
| CrossMark / Creativity | |
| Dell XPS 15 9520 RTX 3050 Ti | |
| Média da turma Office (319 - 2361, n=75, últimos 2 anos) | |
| Microsoft Surface Laptop 5 15, i7-1255U | |
| Média Intel Core i7-1255U, Intel Iris Xe Graphics G7 96EUs (1372 - 1660, n=9) | |
| Asus Zenbook Pro 15 OLED UM535Q | |
| CrossMark / Responsiveness | |
| Dell XPS 15 9520 RTX 3050 Ti | |
| Média Intel Core i7-1255U, Intel Iris Xe Graphics G7 96EUs (1117 - 1434, n=9) | |
| Média da turma Office (360 - 1820, n=75, últimos 2 anos) | |
| Microsoft Surface Laptop 5 15, i7-1255U | |
| Asus Zenbook Pro 15 OLED UM535Q | |
| PCMark 10 Score | 5472 pontos | |
Ajuda | ||
| AIDA64 / Memory Copy | |
| LG Gram 15Z90Q | |
| Média da turma Office (20075 - 110930, n=80, últimos 2 anos) | |
| Microsoft Surface Laptop 5 15, i7-1255U | |
| Dell XPS 15 9520 RTX 3050 Ti | |
| Samsung Galaxy Book Pro 15 NP950XDB-KC5US | |
| Média Intel Core i7-1255U (22846 - 67017, n=11) | |
| Asus Zenbook Pro 15 OLED UM535Q | |
| Microsoft Surface Laptop 4 15 AMD TFF_00028 | |
| AIDA64 / Memory Read | |
| LG Gram 15Z90Q | |
| Microsoft Surface Laptop 5 15, i7-1255U | |
| Média da turma Office (10084 - 128030, n=81, últimos 2 anos) | |
| Dell XPS 15 9520 RTX 3050 Ti | |
| Samsung Galaxy Book Pro 15 NP950XDB-KC5US | |
| Média Intel Core i7-1255U (22877 - 67398, n=11) | |
| Microsoft Surface Laptop 4 15 AMD TFF_00028 | |
| Asus Zenbook Pro 15 OLED UM535Q | |
| AIDA64 / Memory Write | |
| Média da turma Office (20073 - 119858, n=81, últimos 2 anos) | |
| LG Gram 15Z90Q | |
| Microsoft Surface Laptop 5 15, i7-1255U | |
| Samsung Galaxy Book Pro 15 NP950XDB-KC5US | |
| Dell XPS 15 9520 RTX 3050 Ti | |
| Média Intel Core i7-1255U (22883 - 65839, n=11) | |
| Asus Zenbook Pro 15 OLED UM535Q | |
| Microsoft Surface Laptop 4 15 AMD TFF_00028 | |
| AIDA64 / Memory Latency | |
| Microsoft Surface Laptop 5 15, i7-1255U | |
| Microsoft Surface Laptop 4 15 AMD TFF_00028 | |
| LG Gram 15Z90Q | |
| Média da turma Office (7.6 - 162.9, n=76, últimos 2 anos) | |
| Samsung Galaxy Book Pro 15 NP950XDB-KC5US | |
| Dell XPS 15 9520 RTX 3050 Ti | |
| Asus Zenbook Pro 15 OLED UM535Q | |
| Média Intel Core i7-1255U (76 - 163.2, n=11) | |
* ... menor é melhor
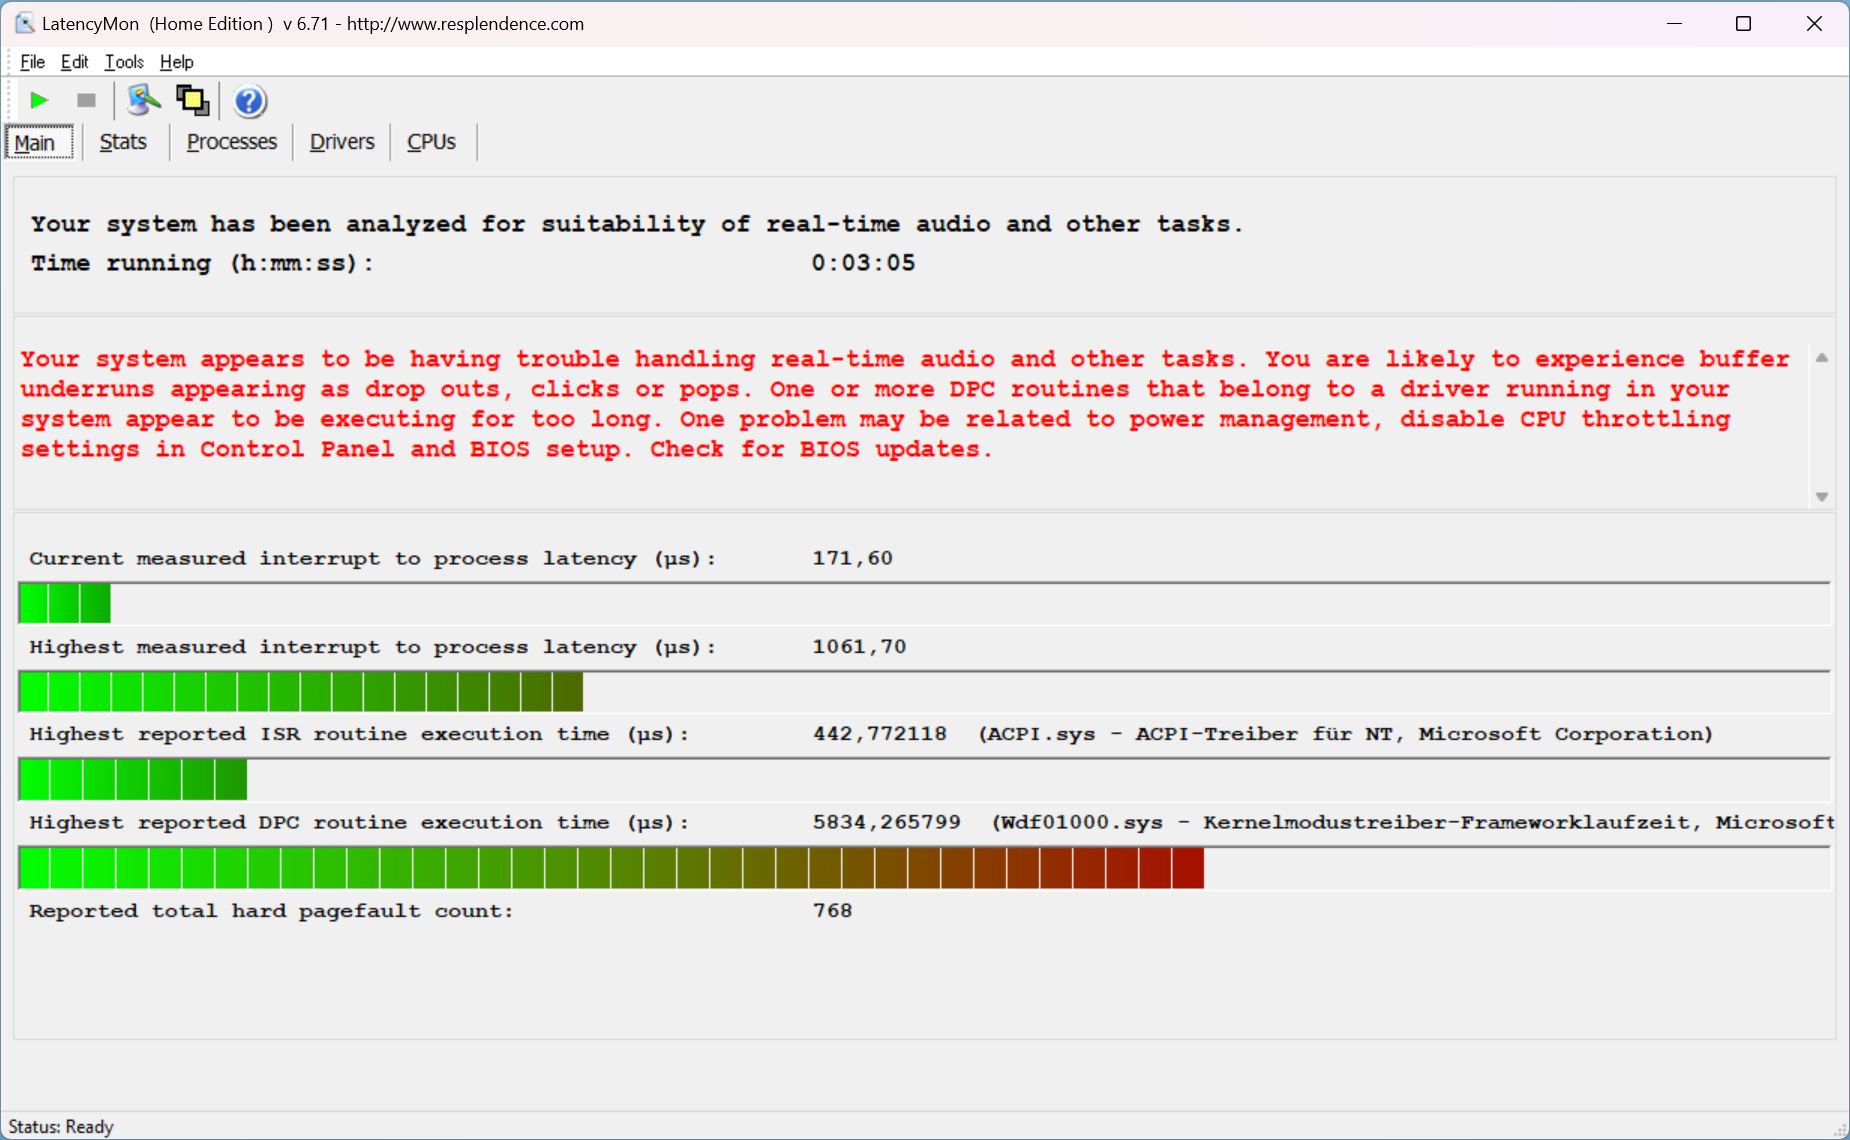
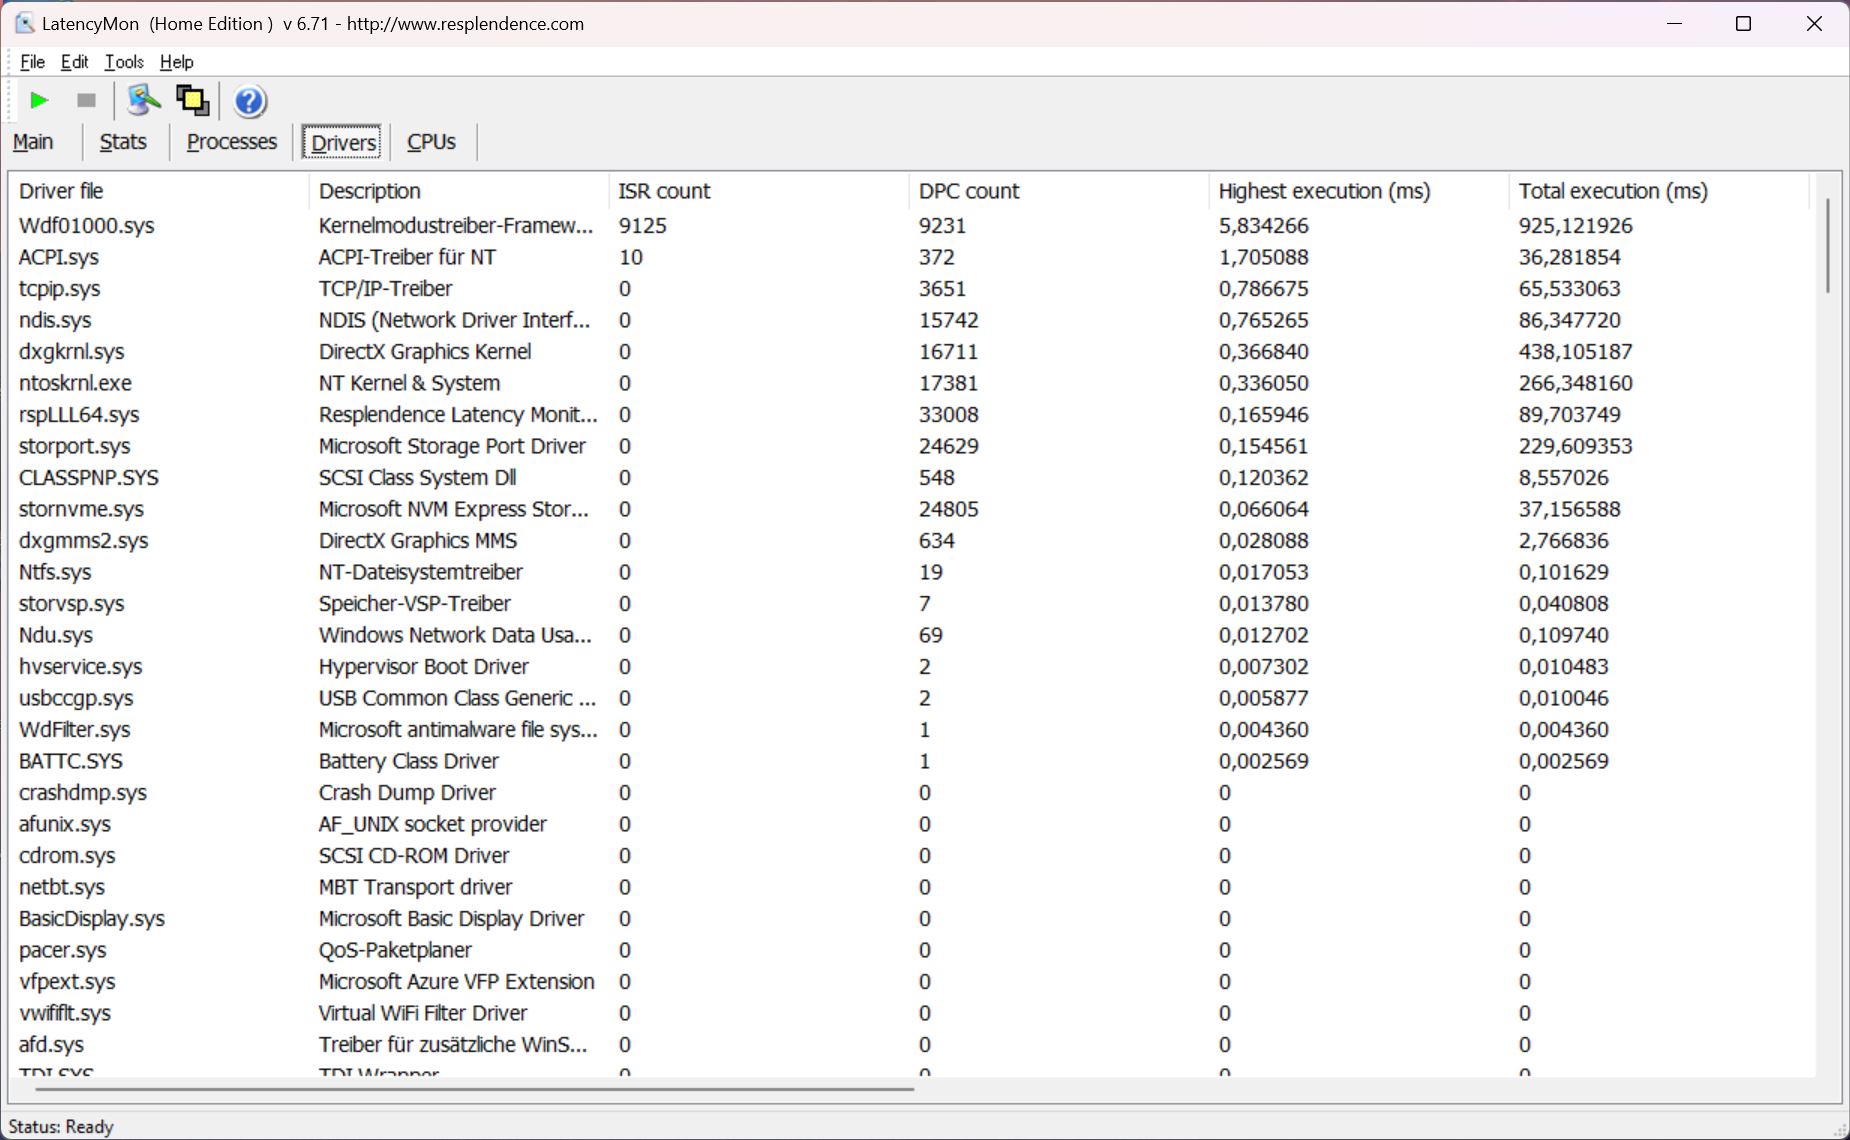
Latência DPC
Com a versão atual do BIOS, nosso dispositivo de teste mostrou algumas limitações em nosso teste de latência padronizado.
| DPC Latencies / LatencyMon - interrupt to process latency (max), Web, Youtube, Prime95 | |
| Microsoft Surface Laptop 5 15, i7-1255U | |
| Dell XPS 15 9520 RTX 3050 Ti | |
| LG Gram 15Z90Q | |
| Microsoft Surface Laptop 4 15 AMD TFF_00028 | |
| Samsung Galaxy Book Pro 15 NP950XDB-KC5US | |
| Asus Zenbook Pro 15 OLED UM535Q | |
* ... menor é melhor
Dispositivos de armazenamento
O laptop tem um SSD NVMe da SK hynix (BC711) instalado com uma capacidade de armazenamento de 512 GB, dos quais 415 GB ainda estão disponíveis após a primeira inicialização. A unidade está conectada via PCIe 3.0 - a interface 4.0 mais recente ainda não é compatível com o Surface Laptop 5. Em geral, as taxas de transferência do dispositivo foram perfeitamente suficientes, com um máximo de 3,5 GB/s, e seu desempenho permaneceu completamente estável, mesmo sob carga mais longa. Mais benchmarks de SSD podem ser encontrados aqui.

* ... menor é melhor
Reading continuous performance: DiskSpd Read Loop, Queue Depth 8
Placa de vídeo
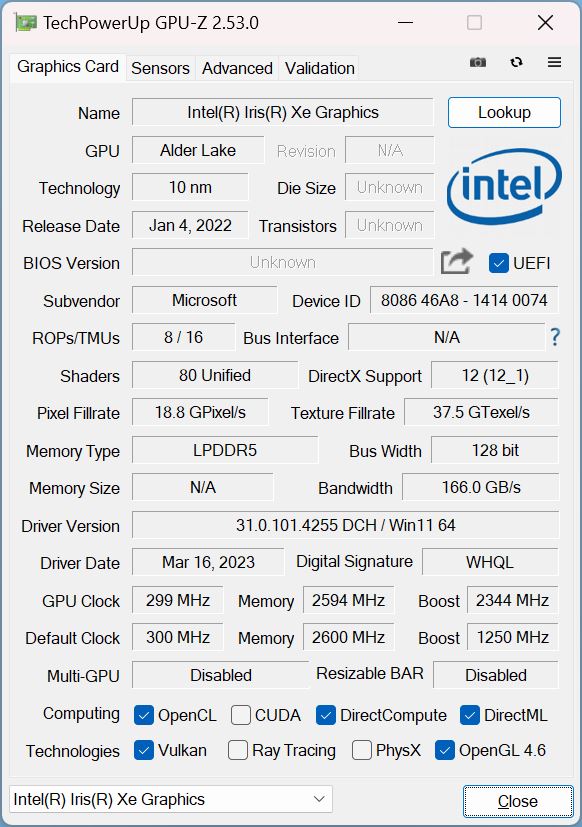
O processador Alder Lake usa uma placa de vídeo integrada Iris Xe Graphics G7 integrada com 96 EUsque já conhecemos há algum tempo - e que ainda é usada nas atuais CPUs Raptor Lake. Não há placa de vídeo dedicada. Para tarefas simples, incluindo reprodução de vídeo de alta resolução, a Iris Xe Graphics G7 teve desempenho suficiente e ficou cerca de 40% à frente da antiga Vega 8 em seu antecessor da AMD, mas ainda estamos falando de um baixo nível de desempenho geral. Seus concorrentes de 15 polegadas com placas de vídeo dedicadas, como aRTX 3050 Ti oferecem um desempenho significativamente maior, mesmo para jogos. Com o Surface Laptop 5, você terá que se contentar em jogar jogos mais antigos ou menos exigentes com detalhes reduzidos.
O desempenho da GPU permaneceu estável sob carga mais longa, mas houve um pequeno déficit de cerca de 15% no modo de bateria (1.359 pontos emTime Spy Graphics). Mais benchmarks de GPU estão disponíveis aqui.
| 3DMark 11 Performance | 6844 pontos | |
| 3DMark Fire Strike Score | 4739 pontos | |
| 3DMark Time Spy Score | 1782 pontos | |
Ajuda | ||
| Blender / v3.3 Classroom CPU | |
| LG Gram 15Z90Q | |
| Microsoft Surface Laptop 5 15, i7-1255U | |
| Média Intel Iris Xe Graphics G7 96EUs (336 - 1259, n=109) | |
| Média da turma Office (245 - 3219, n=75, últimos 2 anos) | |
* ... menor é melhor
| The Witcher 3 - 1920x1080 Ultra Graphics & Postprocessing (HBAO+) | |
| Asus Zenbook Pro 15 OLED UM535Q | |
| Dell XPS 15 9520 RTX 3050 Ti | |
| Média da turma Office (14.8 - 28.1, n=3, últimos 2 anos) | |
| Samsung Galaxy Book Pro 15 NP950XDB-KC5US | |
| Microsoft Surface Laptop 4 15 AMD TFF_00028 | |
| Microsoft Surface Laptop 5 15, i7-1255U | |
| LG Gram 15Z90Q | |
| GTA V - 1920x1080 Highest AA:4xMSAA + FX AF:16x | |
| Asus Zenbook Pro 15 OLED UM535Q | |
| Dell XPS 15 9520 RTX 3050 Ti | |
| Média da turma Office (5.77 - 45.3, n=69, últimos 2 anos) | |
| Samsung Galaxy Book Pro 15 NP950XDB-KC5US | |
| Microsoft Surface Laptop 5 15, i7-1255U | |
| Final Fantasy XV Benchmark - 1920x1080 High Quality | |
| Asus Zenbook Pro 15 OLED UM535Q | |
| Dell XPS 15 9520 RTX 3050 Ti | |
| Samsung Galaxy Book Pro 15 NP950XDB-KC5US | |
| Média da turma Office (8.09 - 79.5, n=71, últimos 2 anos) | |
| Microsoft Surface Laptop 5 15, i7-1255U | |
| LG Gram 15Z90Q | |
| Strange Brigade - 1920x1080 ultra AA:ultra AF:16 | |
| Asus Zenbook Pro 15 OLED UM535Q | |
| Dell XPS 15 9520 RTX 3050 Ti | |
| Média da turma Office (12.9 - 142.1, n=53, últimos 2 anos) | |
| Samsung Galaxy Book Pro 15 NP950XDB-KC5US | |
| Microsoft Surface Laptop 5 15, i7-1255U | |
Witcher 3 FPS diagram
| baixo | média | alto | ultra | |
|---|---|---|---|---|
| GTA V (2015) | 98.5 | 87.9 | 22.7 | 9.87 |
| The Witcher 3 (2015) | 88 | 56 | 31 | 12.4 |
| Dota 2 Reborn (2015) | 105.4 | 79.8 | 61.2 | 55.2 |
| Final Fantasy XV Benchmark (2018) | 42.9 | 23.8 | 16.4 | |
| X-Plane 11.11 (2018) | 42.5 | 35 | 28.8 | |
| Strange Brigade (2018) | 87.2 | 38 | 30 | 24.3 |
| F1 2021 (2021) | 101.7 | 50.3 | 39.4 | 27.1 |
| F1 22 (2022) | 45 | 41.4 | 29.6 | 22.3 |
Emissões e energia
Emissões de ruído
Assim como seu antecessora curva da ventoinha do Surface Laptop 5 15 é extremamente defensiva e, mesmo sob carga total, demorou cerca de um minuto até que as ventoinhas começassem a funcionar. Os níveis de ruído caíram um pouco no geral - medimos 38,1 dB(A) em jogos e durante o teste de estresse. O ruído nunca atingiu níveis irritantes (ou ficou agudo), mas esses resultados ainda não são excelentes, considerando o baixo nível de desempenho do laptop e seu gabinete grande. No entanto, o dispositivo sempre permaneceu silencioso no uso diário e nenhum outro ruído eletrônico pôde ser ouvido.
Barulho
| Ocioso |
| 23.3 / 23.3 / 23.3 dB |
| Carga |
| 35 / 38.1 dB |
 | ||
30 dB silencioso 40 dB(A) audível 50 dB(A) ruidosamente alto |
||
min: | ||
| Microsoft Surface Laptop 5 15, i7-1255U Iris Xe G7 96EUs, i7-1255U, SK Hynix BC711 512GB HFM512GD3GX013N | Microsoft Surface Laptop 4 15 AMD TFF_00028 Vega 8, R7 4980U, SK Hynix BC511 HFM512GDJTNI | LG Gram 15Z90Q Iris Xe G7 80EUs, i5-1240P, Samsung PM9A1 MZVL21T0HCLR | Dell XPS 15 9520 RTX 3050 Ti GeForce RTX 3050 Ti Laptop GPU, i7-12700H, WDC PC SN810 512GB | Samsung Galaxy Book Pro 15 NP950XDB-KC5US Iris Xe G7 96EUs, i7-1165G7, Samsung PM991a MZ9LQ1T0HBLB-00BKN | Asus Zenbook Pro 15 OLED UM535Q GeForce RTX 3050 Ti Laptop GPU, R9 5900HX, WDC PC SN730 SDBPNTY-1T00 | |
|---|---|---|---|---|---|---|
| Noise | -6% | -8% | 1% | -3% | -7% | |
| desligado / ambiente * (dB) | 23.3 | 24.2 -4% | 25 -7% | 22.8 2% | 23 1% | 22.8 2% |
| Idle Minimum * (dB) | 23.3 | 24.2 -4% | 26 -12% | 22.9 2% | 23.2 -0% | 22.9 2% |
| Idle Average * (dB) | 23.3 | 24.2 -4% | 27 -16% | 22.9 2% | 23.2 -0% | 22.9 2% |
| Idle Maximum * (dB) | 23.3 | 24.2 -4% | 28 -20% | 22.9 2% | 23.2 -0% | 22.9 2% |
| Load Average * (dB) | 35 | 39.9 -14% | 37 -6% | 30.9 12% | 35.8 -2% | 33.2 5% |
| Witcher 3 ultra * (dB) | 38.1 | 39.9 -5% | 37 3% | 37.8 1% | 41.9 -10% | 47.3 -24% |
| Load Maximum * (dB) | 38.1 | 39.9 -5% | 37 3% | 44.7 -17% | 41.9 -10% | 52.8 -39% |
* ... menor é melhor
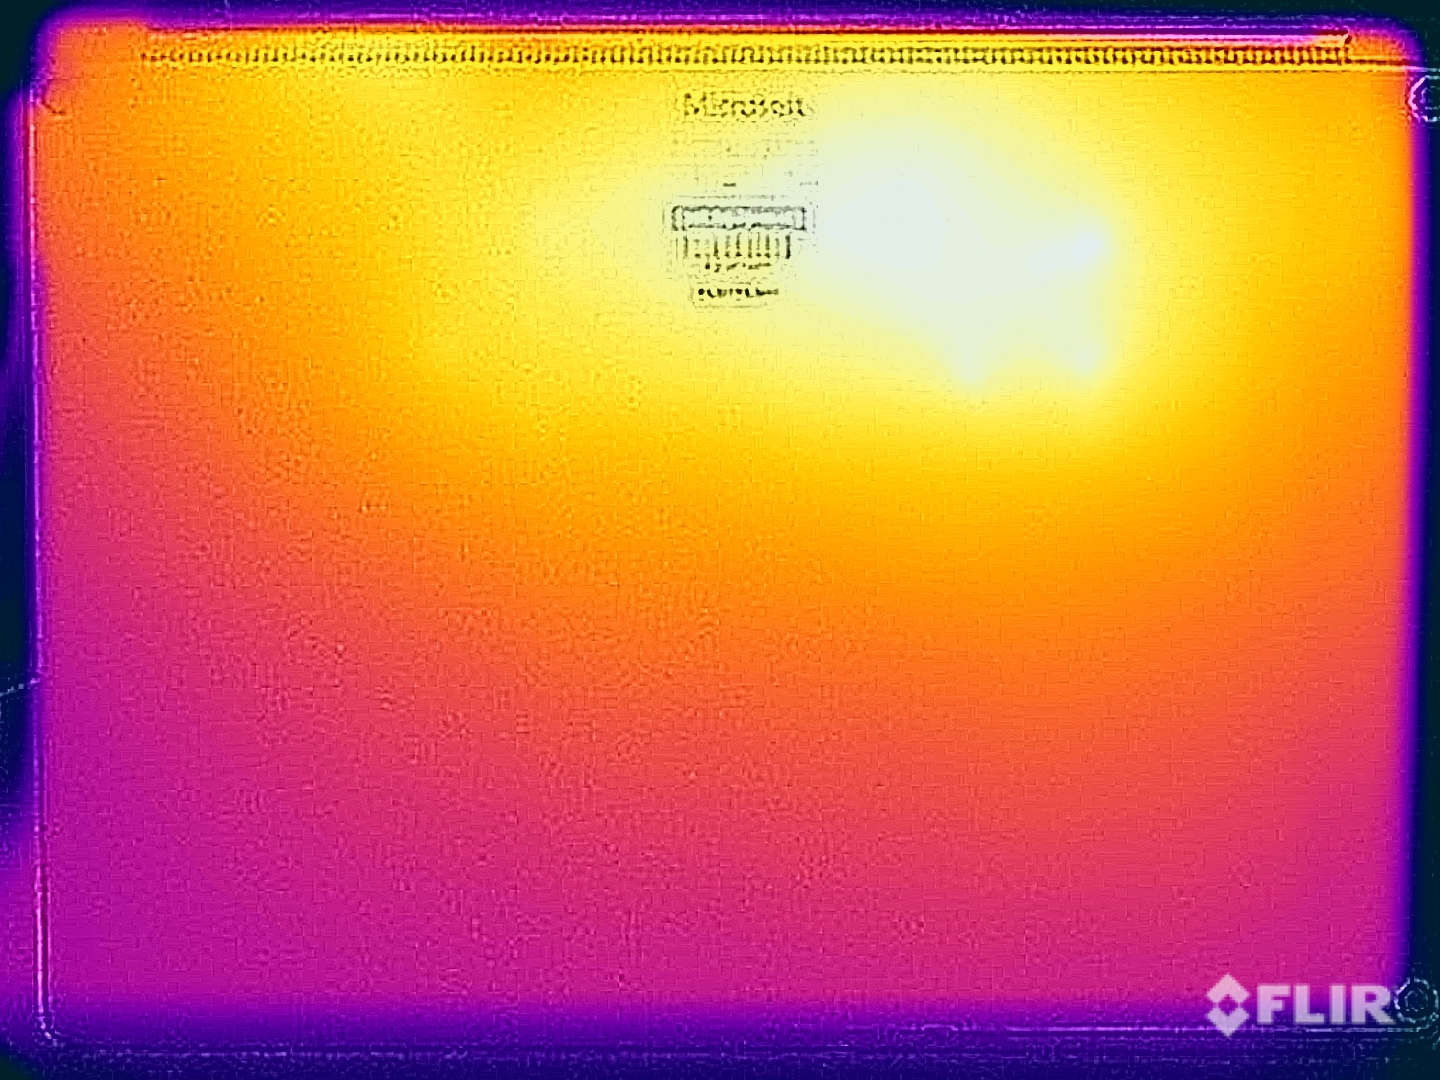
Temperatura
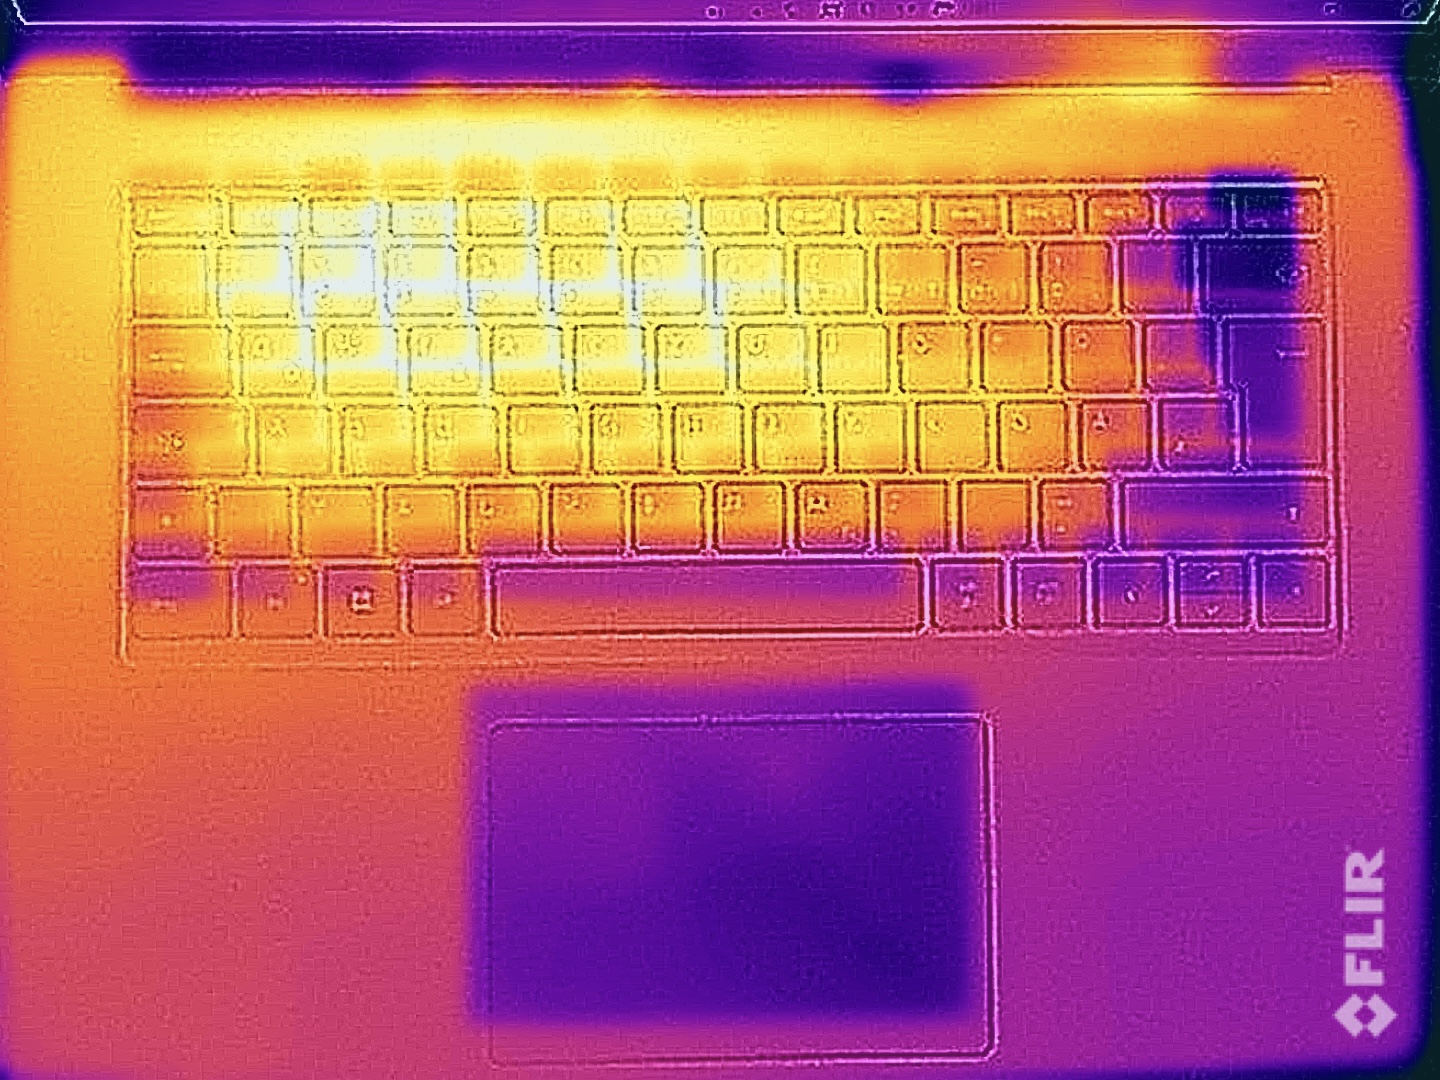
O gabinete quase não esquentou durante tarefas simples, mas medimos até 47 °C na parte inferior do gabinete sob carga. Devido às suas superfícies metálicas, essa temperatura já se mostra desconfortável ao toque, portanto, não recomendamos colocar o dispositivo sobre as coxas nesse cenário.
Essas altas temperaturas foram um pouco surpreendentes, pois o consumo de energia do dispositivo só se estabilizou em 25 watts após alguns minutos em nosso teste de estresse, mas caiu ainda mais para cerca de 23 watts após 30 minutos - o que não é muito bom, considerando o tamanho do gabinete. Entretanto, não notamos nenhuma redução na energia diretamente após o teste de estresse.
(±) A temperatura máxima no lado superior é 44.6 °C / 112 F, em comparação com a média de 34.3 °C / 94 F , variando de 21.2 a 62.5 °C para a classe Office.
(-) A parte inferior aquece até um máximo de 47.4 °C / 117 F, em comparação com a média de 36.8 °C / 98 F
(+) Em uso inativo, a temperatura média para o lado superior é 22.2 °C / 72 F, em comparação com a média do dispositivo de 29.5 °C / ### class_avg_f### F.
(±) Jogando The Witcher 3, a temperatura média para o lado superior é 37.8 °C / 100 F, em comparação com a média do dispositivo de 29.5 °C / ## #class_avg_f### F.
(±) Os apoios para as mãos e o touchpad podem ficar muito quentes ao toque, com um máximo de 36.5 °C / 97.7 F.
(-) A temperatura média da área do apoio para as mãos de dispositivos semelhantes foi 27.5 °C / 81.5 F (-9 °C / -16.2 F).
| Microsoft Surface Laptop 5 15, i7-1255U Intel Core i7-1255U, Intel Iris Xe Graphics G7 96EUs | Microsoft Surface Laptop 4 15 AMD TFF_00028 AMD Ryzen 7 4980U, AMD Radeon RX Vega 8 (Ryzen 4000/5000) | LG Gram 15Z90Q Intel Core i5-1240P, Intel Iris Xe Graphics G7 80EUs | Dell XPS 15 9520 RTX 3050 Ti Intel Core i7-12700H, NVIDIA GeForce RTX 3050 Ti Laptop GPU | Samsung Galaxy Book Pro 15 NP950XDB-KC5US Intel Core i7-1165G7, Intel Iris Xe Graphics G7 96EUs | Asus Zenbook Pro 15 OLED UM535Q AMD Ryzen 9 5900HX, NVIDIA GeForce RTX 3050 Ti Laptop GPU | |
|---|---|---|---|---|---|---|
| Heat | 2% | -3% | -25% | 5% | -28% | |
| Maximum Upper Side * (°C) | 44.6 | 41.8 6% | 46 -3% | 51.4 -15% | 37.2 17% | 36 19% |
| Maximum Bottom * (°C) | 47.4 | 44.8 5% | 45 5% | 51 -8% | 47 1% | 47.2 -0% |
| Idle Upper Side * (°C) | 22.6 | 23 -2% | 25 -11% | 30 -33% | 22 3% | 37 -64% |
| Idle Bottom * (°C) | 23.3 | 23.6 -1% | 24 -3% | 33 -42% | 23.6 -1% | 39.2 -68% |
* ... menor é melhor
Alto-falantes
Não há grades de alto-falante visíveis porque o som é emitido pelas aberturas do teclado. Isso funciona muito bem na prática porque, embora existam módulos ainda mais altos, a qualidade geral é muito boa e os alto-falantes externos não são realmente necessários.
Microsoft Surface Laptop 5 15, i7-1255U análise de áudio
(±) | o volume do alto-falante é médio, mas bom (###valor### dB)
Graves 100 - 315Hz
(±) | graves reduzidos - em média 14% menor que a mediana
(±) | a linearidade dos graves é média (9.3% delta para a frequência anterior)
Médios 400 - 2.000 Hz
(+) | médios equilibrados - apenas 2.3% longe da mediana
(+) | médios são lineares (4.1% delta para frequência anterior)
Altos 2 - 16 kHz
(+) | agudos equilibrados - apenas 2.8% longe da mediana
(+) | os máximos são lineares (3.2% delta da frequência anterior)
Geral 100 - 16.000 Hz
(+) | o som geral é linear (12.9% diferença em relação à mediana)
Comparado com a mesma classe
» 6% de todos os dispositivos testados nesta classe foram melhores, 2% semelhantes, 91% piores
» O melhor teve um delta de 7%, a média foi 21%, o pior foi 53%
Comparado com todos os dispositivos testados
» 12% de todos os dispositivos testados foram melhores, 3% semelhantes, 85% piores
» O melhor teve um delta de 4%, a média foi 23%, o pior foi 134%
Dell XPS 15 9520 RTX 3050 Ti análise de áudio
(+) | os alto-falantes podem tocar relativamente alto (###valor### dB)
Graves 100 - 315Hz
(+) | bons graves - apenas 4.4% longe da mediana
(+) | o baixo é linear (6.8% delta para a frequência anterior)
Médios 400 - 2.000 Hz
(+) | médios equilibrados - apenas 2.6% longe da mediana
(+) | médios são lineares (4.1% delta para frequência anterior)
Altos 2 - 16 kHz
(+) | agudos equilibrados - apenas 1.9% longe da mediana
(+) | os máximos são lineares (5.4% delta da frequência anterior)
Geral 100 - 16.000 Hz
(+) | o som geral é linear (6.4% diferença em relação à mediana)
Comparado com a mesma classe
» 4% de todos os dispositivos testados nesta classe foram melhores, 1% semelhantes, 95% piores
» O melhor teve um delta de 5%, a média foi 17%, o pior foi 45%
Comparado com todos os dispositivos testados
» 1% de todos os dispositivos testados foram melhores, 0% semelhantes, 99% piores
» O melhor teve um delta de 4%, a média foi 23%, o pior foi 134%
Consumo de energia
As medições de consumo não apresentaram surpresas e o consumo máximo em modo inativo (brilho total) foi de 8,4 watts. O dispositivo atingiu os limites da fonte de alimentação por alguns segundos durante a alta carga da CPU, o que é praticamente a norma hoje em dia devido aos altos limites de energia das CPUs Intel atuais. Durante nosso teste de estresse, o consumo se estabilizou rapidamente em 45 watts e a fonte de alimentação de 65 watts, que também oferece outra saída USB-A para carregamento, foi suficiente.
| desligado | |
| Ocioso | |
| Carga |
|
Key:
min: | |
Power consumption Witcher 3 / stress test
Power consumption with external monitor
Tempos de execução
A capacidade da bateria permanece inalterada em 47,4 watts-hora e os tempos de execução foram piores em todos os aspectos em comparação com seu antecessor com um processador AMD. Observamos um pouco mais de 8,5 horas no teste WLAN com 150 cd/m² (corresponde a 64% do brilho máximo no dispositivo de teste) e 6,5 horas com brilho total. O antecessor da AMD conseguiu cerca de 10,5 e 7 horas, respectivamente. O modelo Intel também se saiu pior no teste de vídeo, com 9:44 horas em comparação com cerca de 15 horas (Surface Laptop 4 AMD).
| Microsoft Surface Laptop 5 15, i7-1255U i7-1255U, Iris Xe G7 96EUs, 47.4 Wh | Microsoft Surface Laptop 4 15 AMD TFF_00028 R7 4980U, Vega 8, 47.4 Wh | LG Gram 15Z90Q i5-1240P, Iris Xe G7 80EUs, 80 Wh | Dell XPS 15 9520 RTX 3050 Ti i7-12700H, GeForce RTX 3050 Ti Laptop GPU, 86 Wh | Samsung Galaxy Book Pro 15 NP950XDB-KC5US i7-1165G7, Iris Xe G7 96EUs, 68 Wh | Asus Zenbook Pro 15 OLED UM535Q R9 5900HX, GeForce RTX 3050 Ti Laptop GPU, 96 Wh | Média da turma Office | |
|---|---|---|---|---|---|---|---|
| Duração da bateria | 28% | 32% | 21% | -5% | 53% | 31% | |
| H.264 (h) | 9.7 | 14.8 53% | 15.5 ? 60% | ||||
| WiFi v1.3 (h) | 8.6 | 10.4 21% | 11.9 38% | 8.8 2% | 10.1 17% | 12.8 49% | 13.2 ? 53% |
| Load (h) | 2.3 | 2.5 9% | 2.9 26% | 3.2 39% | 1.7 -26% | 3.6 57% | 1.808 ? -21% |
Pro
Contra
Veredicto - O Surface Laptop 5 precisa urgentemente de uma atualização maior
A quinta geração do laptop Surface está claramente começando a mostrar sua idade. Não estamos falando do processador Alder-Lake do ano passado, já que os modelos Raptor-Lake mais recentes oferecem apenas um desempenho ligeiramente superior, mas sim do design do dispositivo em si. As bordas da tela são simplesmente muito largas para um dispositivo moderno, uma webcam de 720p não está mais atualizada e um sistema de resfriamento mais forte também seria útil. Seu desempenho geral é bastante modesto para um gabinete de 15 polegadas, e claramente faltam opções de manutenção.
Entendemos que a Microsoft cancelou a versão da AMD devido à situação de fornecimento e que seu desempenho inferior de vários núcleos provavelmente não será um grande problema para um laptop de escritório, mas também notamos que a duração da bateria é significativamente menor. Portanto, o novo Surface Laptop 5 não é realmente um passo na direção certa.
O Microsoft Surface Laptop 5 precisa urgentemente de uma atualização extensa - há anos, parece que você recebe sempre o mesmo produto. Frequentemente, seus concorrentes oferecem muito mais recursos e melhor desempenho - e também por um preço mais baixo. Em 2023, o pacote oferecido simplesmente não é suficiente para justificar seu alto preço.
A tela de formato 3:2 do dispositivo ainda é adequada para o trabalho produtivo e também tem uma boa qualidade de imagem subjetiva, mas a Microsoft está claramente atrasada em termos de especificações. Haveria muito mais potencial aqui com uma frequência mais alta e maior cobertura de espaço de cores.
Com exceção da caixa um tanto rangente da amostra de análise, o Surface Laptop 5 é, na verdade, um dispositivo sólido; o grande problema é o preço. O preço sugerido para o nosso dispositivo de teste com 16 GB de RAM e um SSD de 512 GB (portanto, de forma alguma uma variante de ponta) é de cerca de US$ 4.000, e a Microsoft ainda cobra esse preço até hoje. Isso é claramente um exagero para o produto oferecido e até mesmo o preço atual de US$ 1.699 nas ruas ainda é muito alto quando você olha para o Lenovo Yoga Pro 7 14por exemplo, que teve uma pontuação muito melhor em praticamente todas as disciplinas e custa apenas cerca de US$ 1.449.
Preço e disponibilidade
Você pode encontrar o Surface Laptop 5 15 muito mais barato do que o MRSP na Amazon por US$ 1.699.
Microsoft Surface Laptop 5 15, i7-1255U
- 04/24/2023 v7 (old)
Andreas Osthoff
Transparência
A seleção dos dispositivos a serem analisados é feita pela nossa equipe editorial. A amostra de teste foi fornecida ao autor como empréstimo pelo fabricante ou varejista para fins desta revisão. O credor não teve influência nesta revisão, nem o fabricante recebeu uma cópia desta revisão antes da publicação. Não houve obrigação de publicar esta revisão. Como empresa de mídia independente, a Notebookcheck não está sujeita à autoridade de fabricantes, varejistas ou editores.
É assim que o Notebookcheck está testando
Todos os anos, o Notebookcheck analisa de forma independente centenas de laptops e smartphones usando procedimentos padronizados para garantir que todos os resultados sejam comparáveis. Desenvolvemos continuamente nossos métodos de teste há cerca de 20 anos e definimos padrões da indústria no processo. Em nossos laboratórios de teste, equipamentos de medição de alta qualidade são utilizados por técnicos e editores experientes. Esses testes envolvem um processo de validação em vários estágios. Nosso complexo sistema de classificação é baseado em centenas de medições e benchmarks bem fundamentados, o que mantém a objetividade.Price comparison

