Microsoft Surface Laptop 4 13 Laptop Review - Muito caro com CPU Intel?

O modelo maior de 15 polegadas do Portátil de superfície 4 já estava disponível com as CPUs Intel ou AMD no ano passado, e a Microsoft agora adiciona uma opção AMD para o menor Laptop 4 de superfície de 13,5 polegadas também. Com exceção do processador, no entanto, nada realmente mudou. Nosso modelo de teste está equipado com um CPU Core i7-1185G716 GB de RAM, e 512 GB de armazenamento PCIe-SSD por 1849 euros. A CPU AMD está disponível apenas com 8 GB de RAM e 256 GB de armazenamento, e você tem que obter uma CPU Intel se precisar de mais memória/armazenamento. O preço base com um Core i5 é de 1449 Euros (8 GB de RAM, 512 GB de SSD). Vamos nos concentrar no desempenho neste artigo, consulte nossa revisão anterior do Surface Laptop 3 para obter informações abrangentes sobre o chassi e os dispositivos de entrada
mögliche Konkurrenten im Vergleich
Avaliação | Data | Modelo | Peso | Altura | Size | Resolução | Preço |
|---|---|---|---|---|---|---|---|
| 84.7 % v7 (old) | 05/2021 | Microsoft Surface Laptop 4 13 i7 i7-1185G7, Iris Xe G7 96EUs | 1.3 kg | 14.5 mm | 13.50" | 2256x1504 | |
| 87.6 % v7 (old) | 04/2021 | Lenovo Yoga Slim 7i Carbon 13 ITL i7-1165G7, Iris Xe G7 96EUs | 975 g | 15 mm | 13.30" | 2560x1600 | |
| 87.4 % v7 (old) | 12/2020 | Dell XPS 13 9310 Core i7 4K i7-1185G7, Iris Xe G7 96EUs | 1.3 kg | 14.8 mm | 13.40" | 3840x2400 | |
| 91.1 % v7 (old) | 12/2020 | Apple MacBook Pro 13 Late 2020 M1 Entry (8 / 256 GB) M1, M1 8-Core GPU | 1.4 kg | 15.6 mm | 13.30" | 2560x1600 |
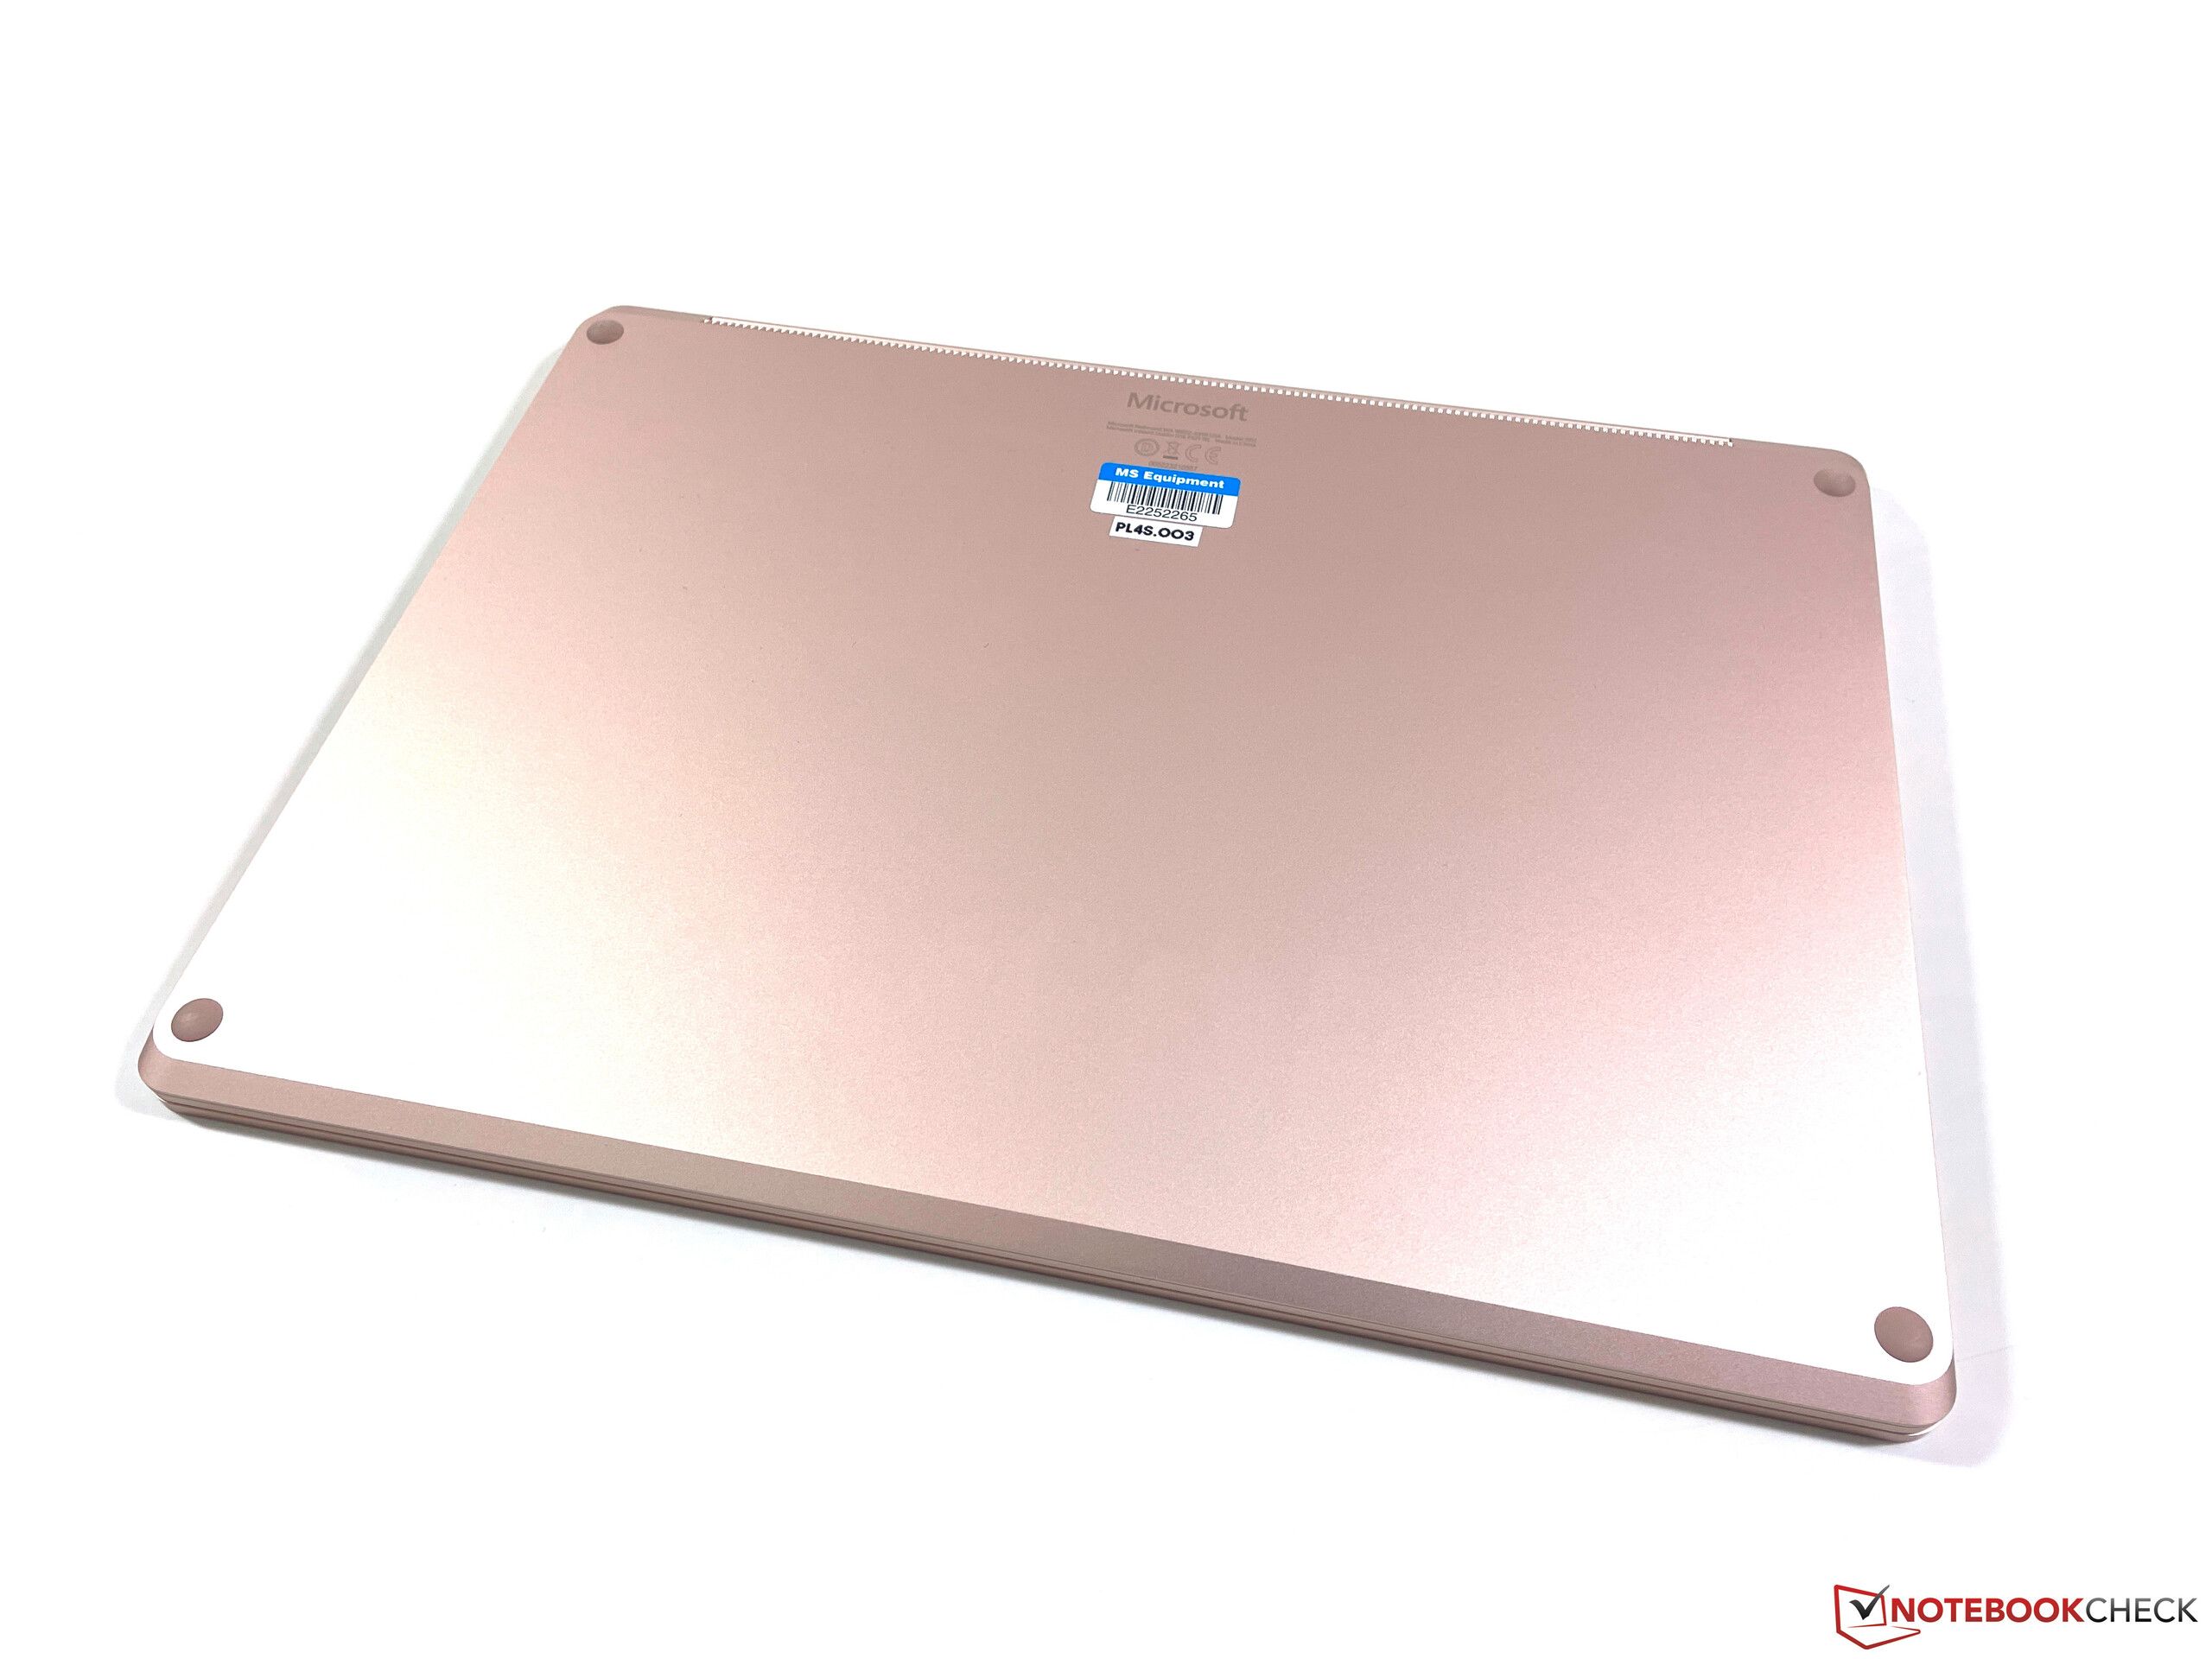
Estojo e Conectividade
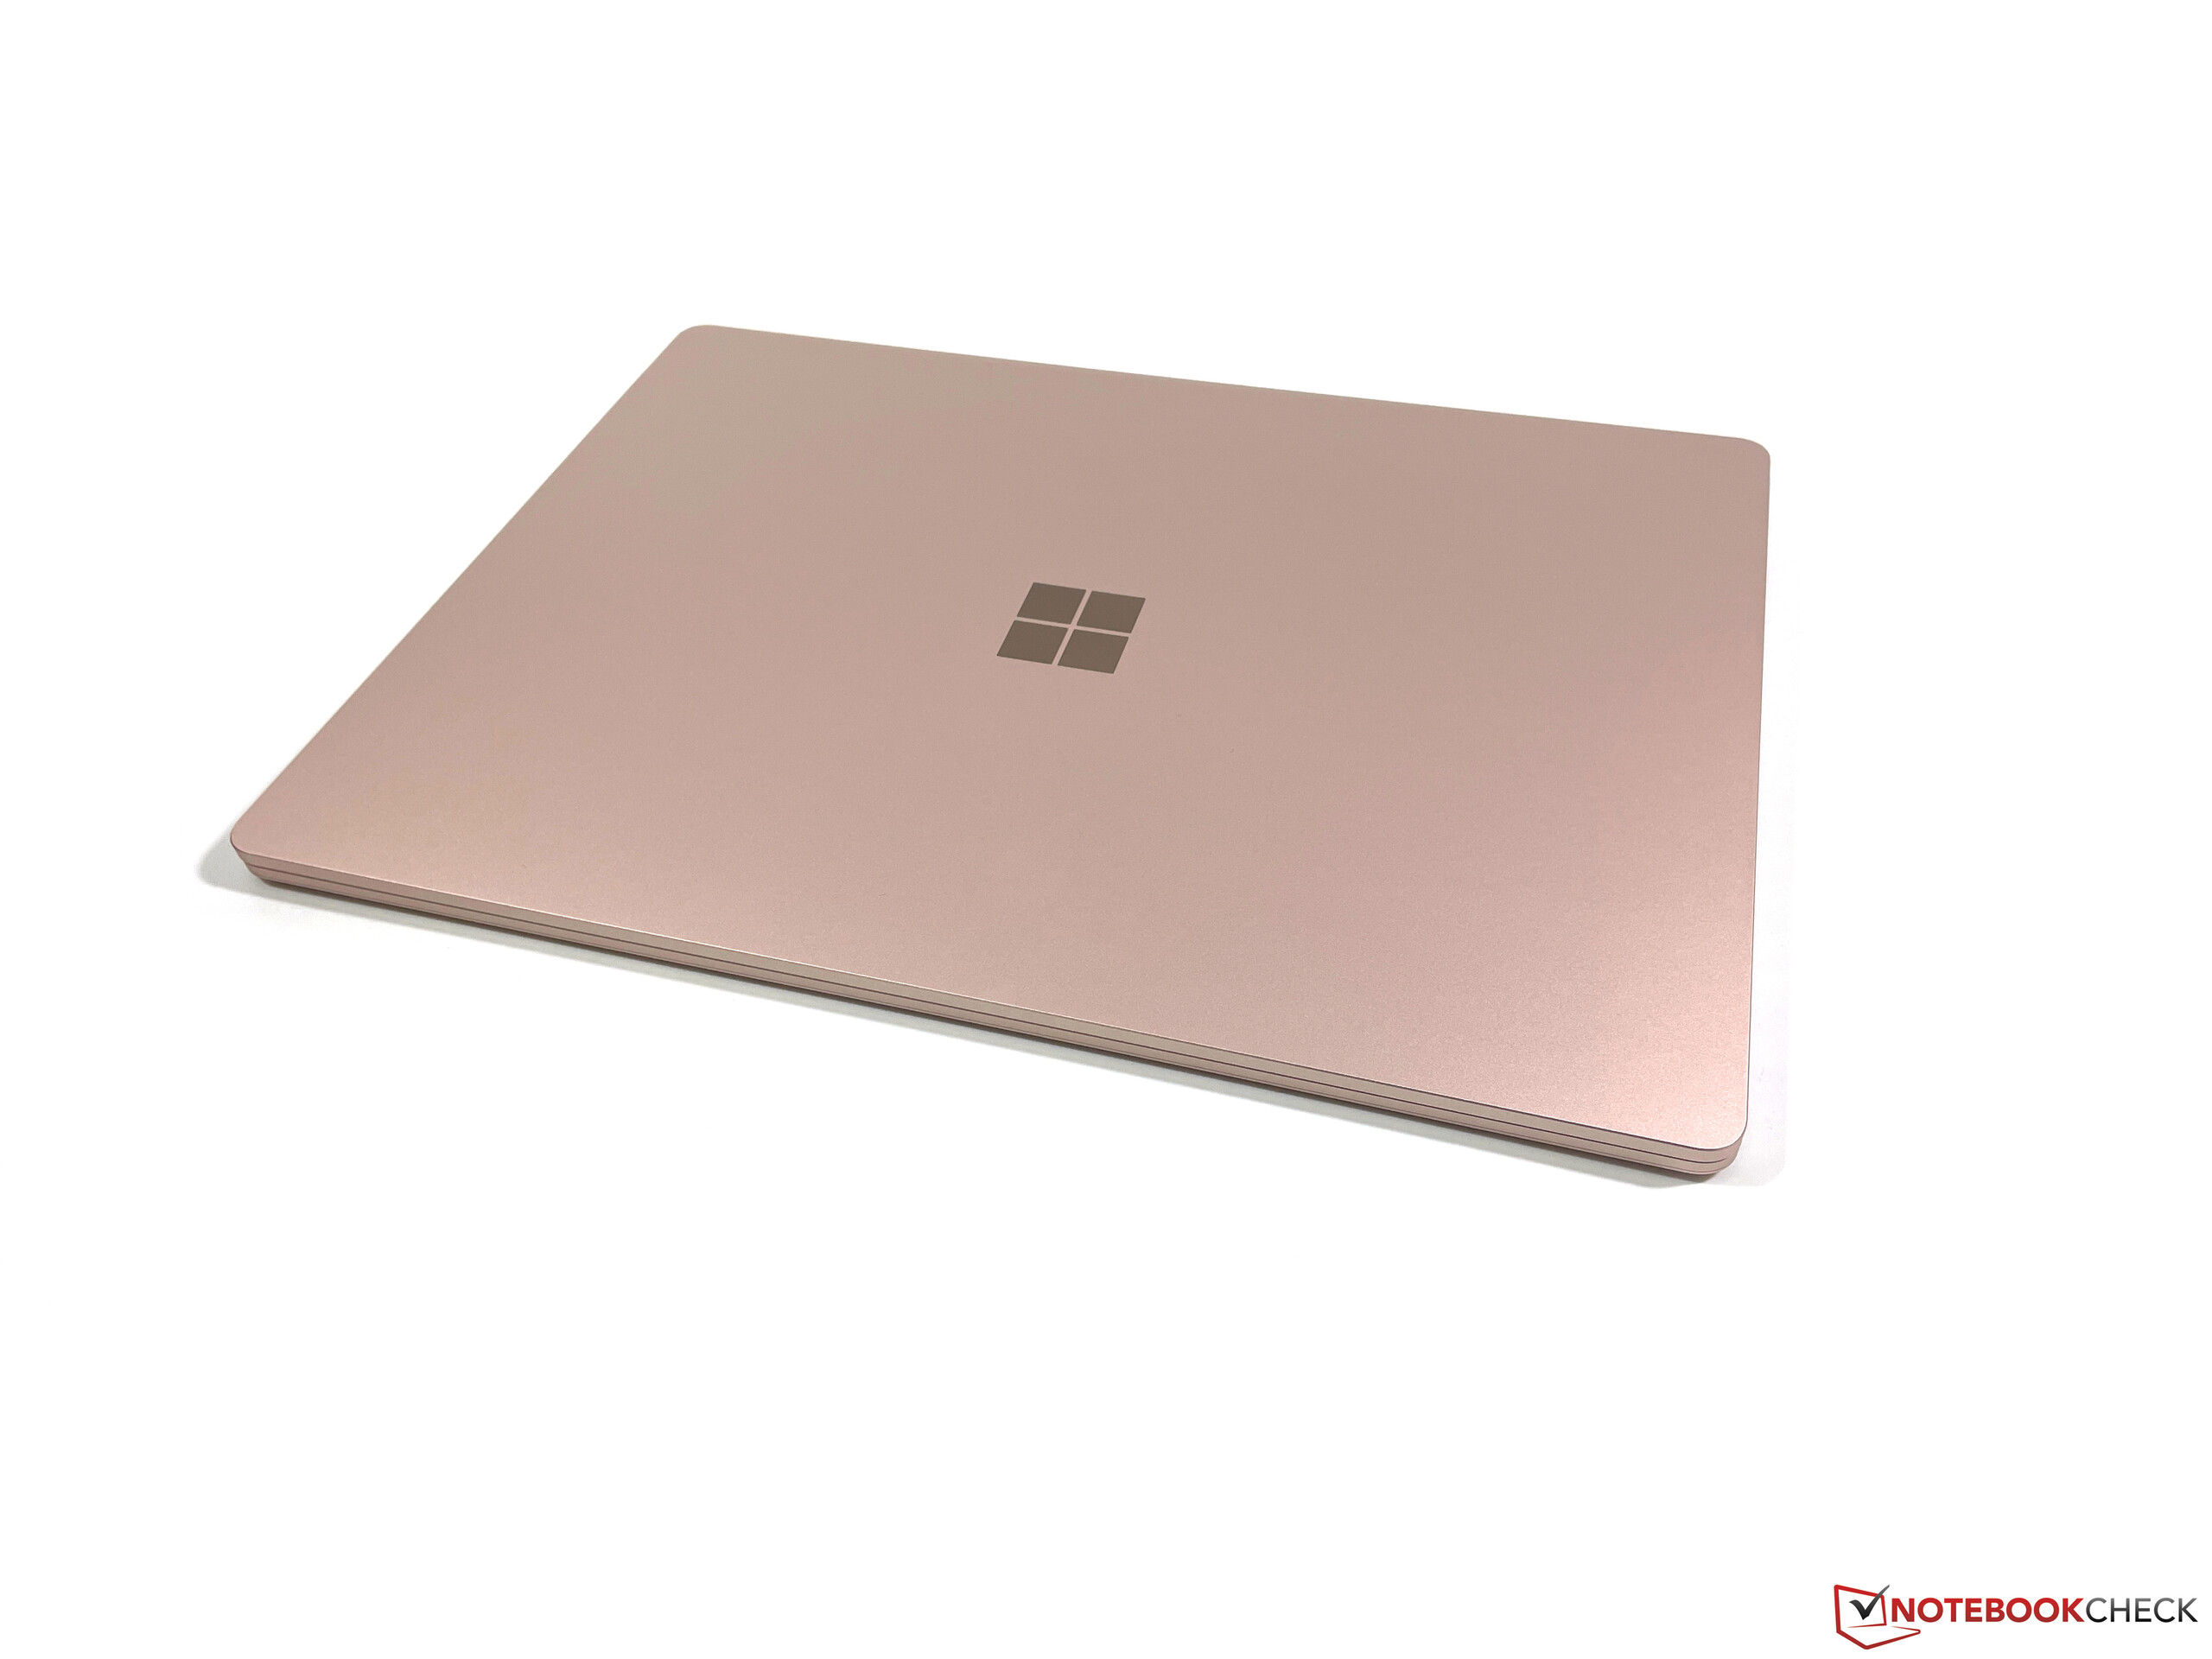
O estojo está novamente disponível em várias cores e você pode obter metal ou Alcântara para a parte superior da unidade base. Uma comparação direta revela que a versão de Alcântara não é tão robusta na área central do teclado, mas não deve haver nenhuma limitação na prática. Em suma, a qualidade do chassi ainda é muito boa, mas dificilmente se consegue manter o dispositivo. Os parafusos estão escondidos sob os pés de apoio colados e tudo que você poderia mudar é o compacto M.2-2230 SSD, embora não haja muitos drives adequados no mercado de qualquer forma.
Conectividade
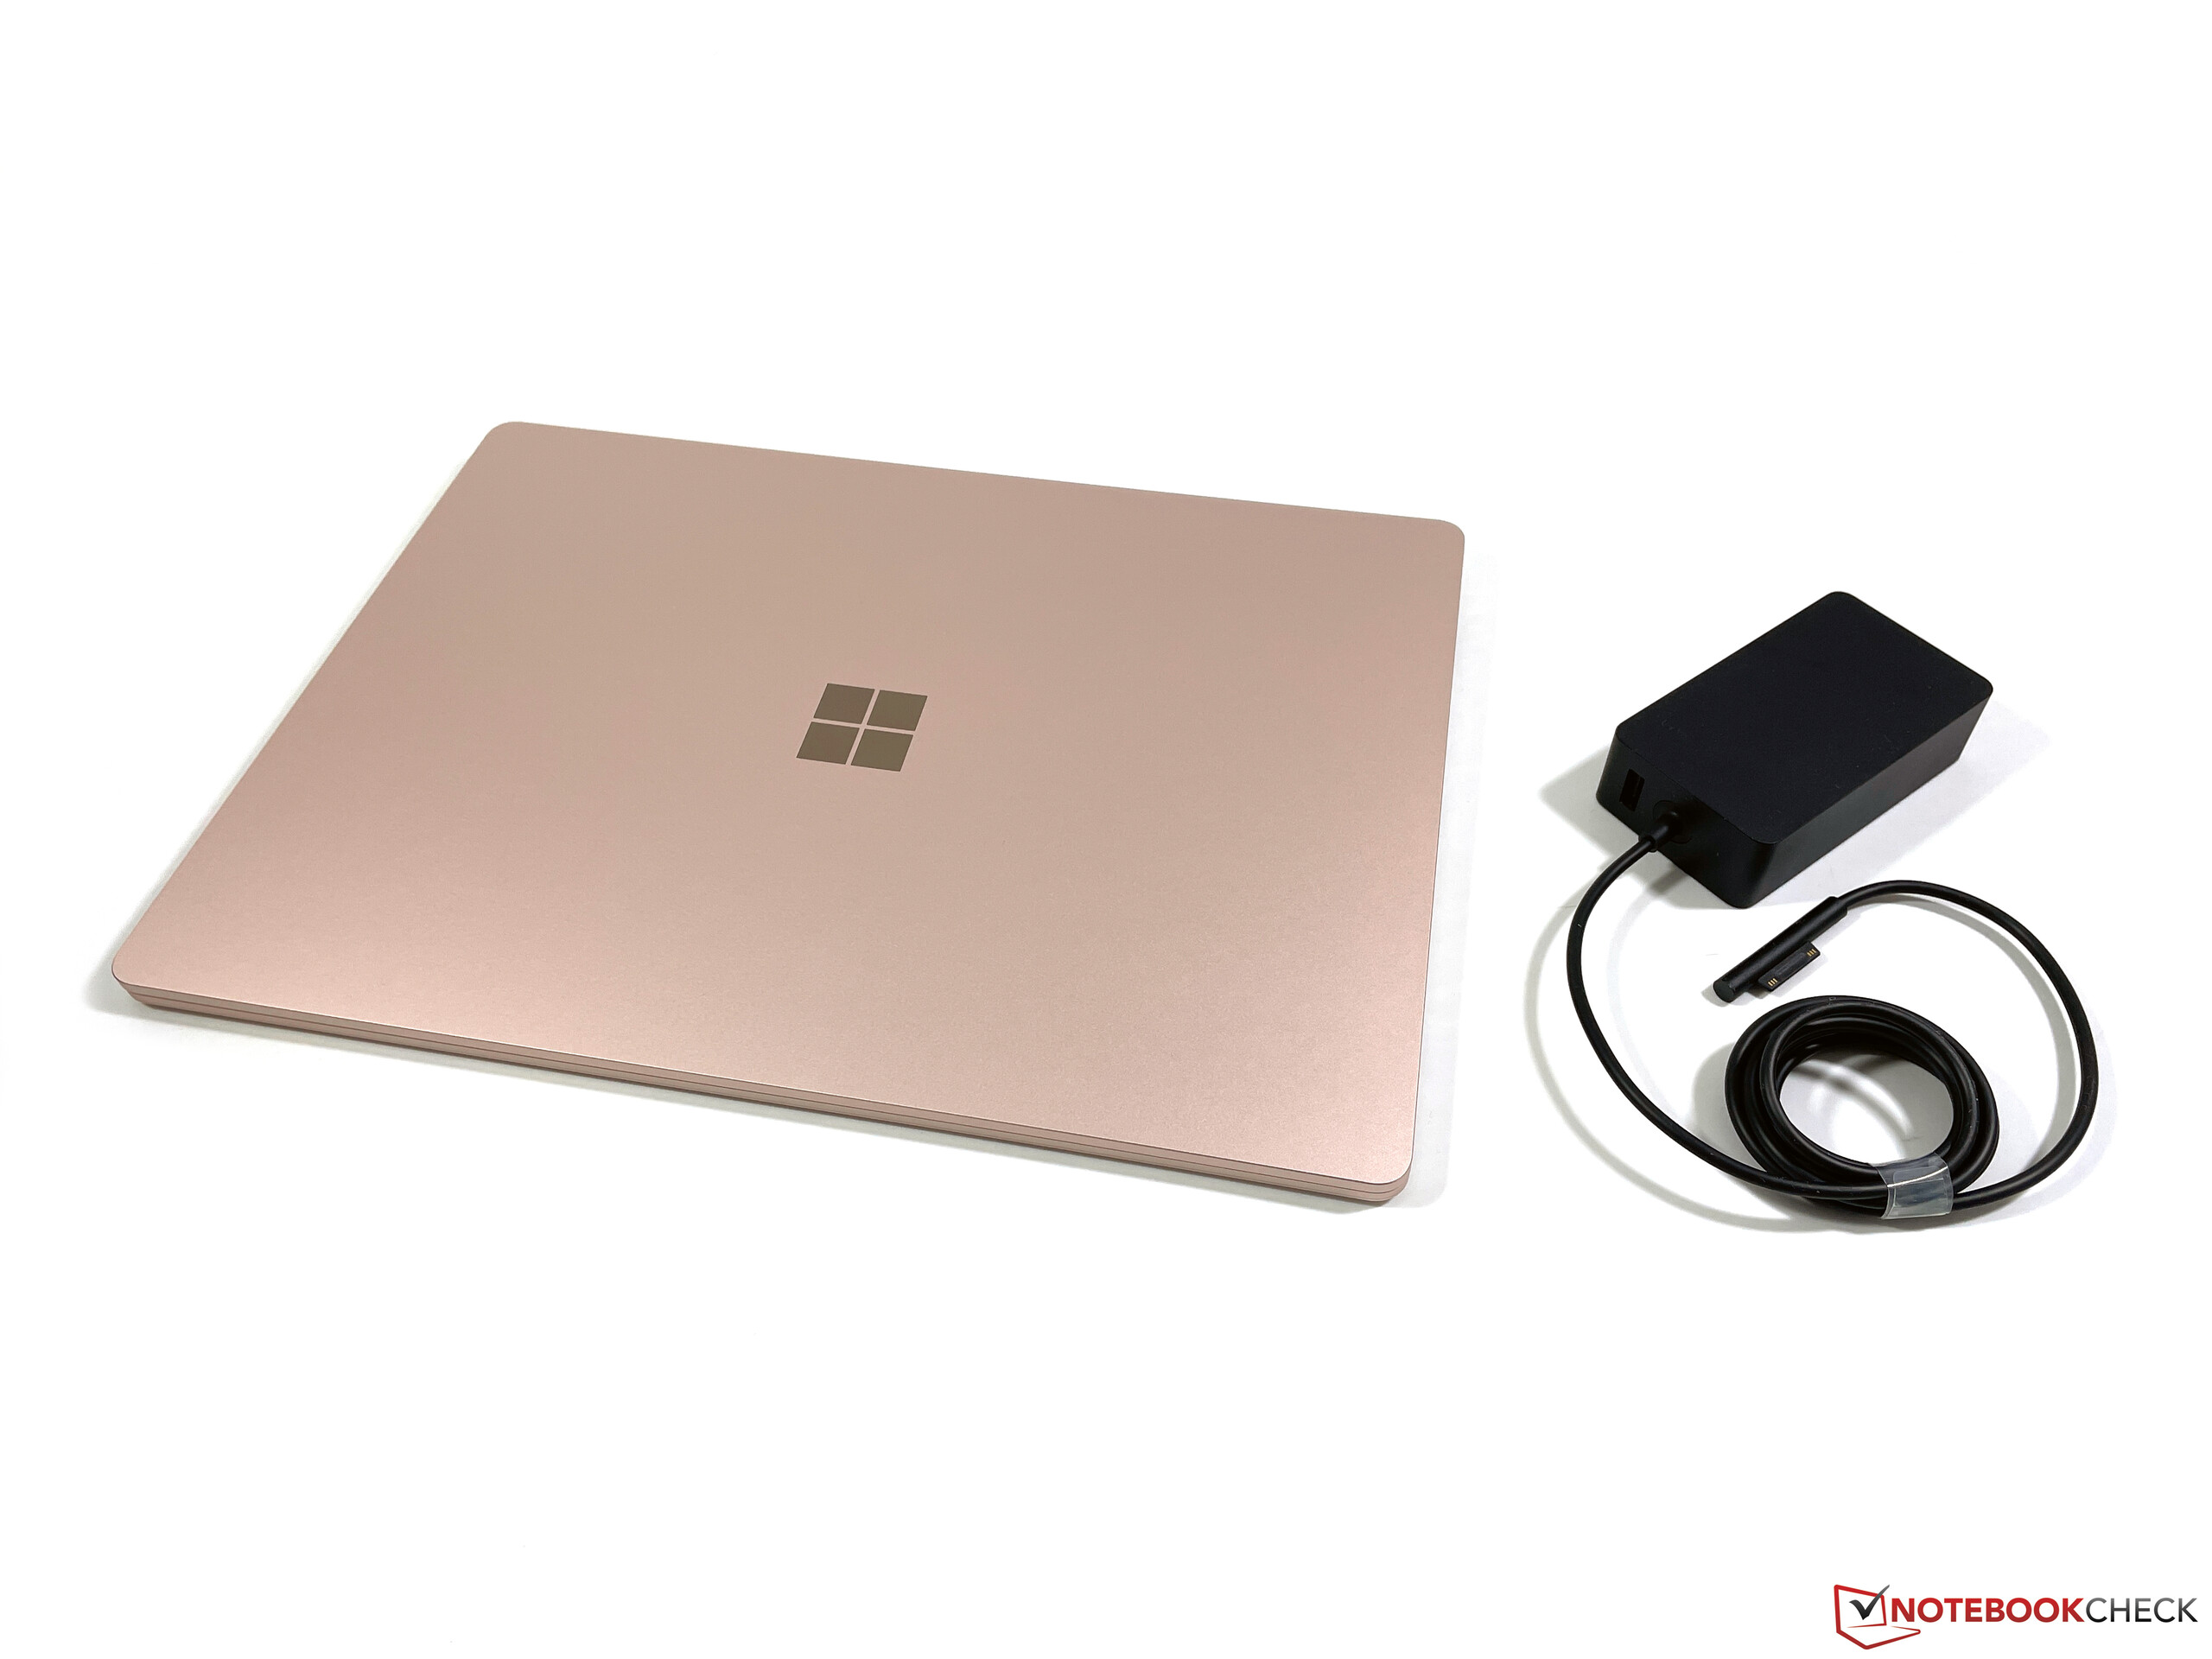
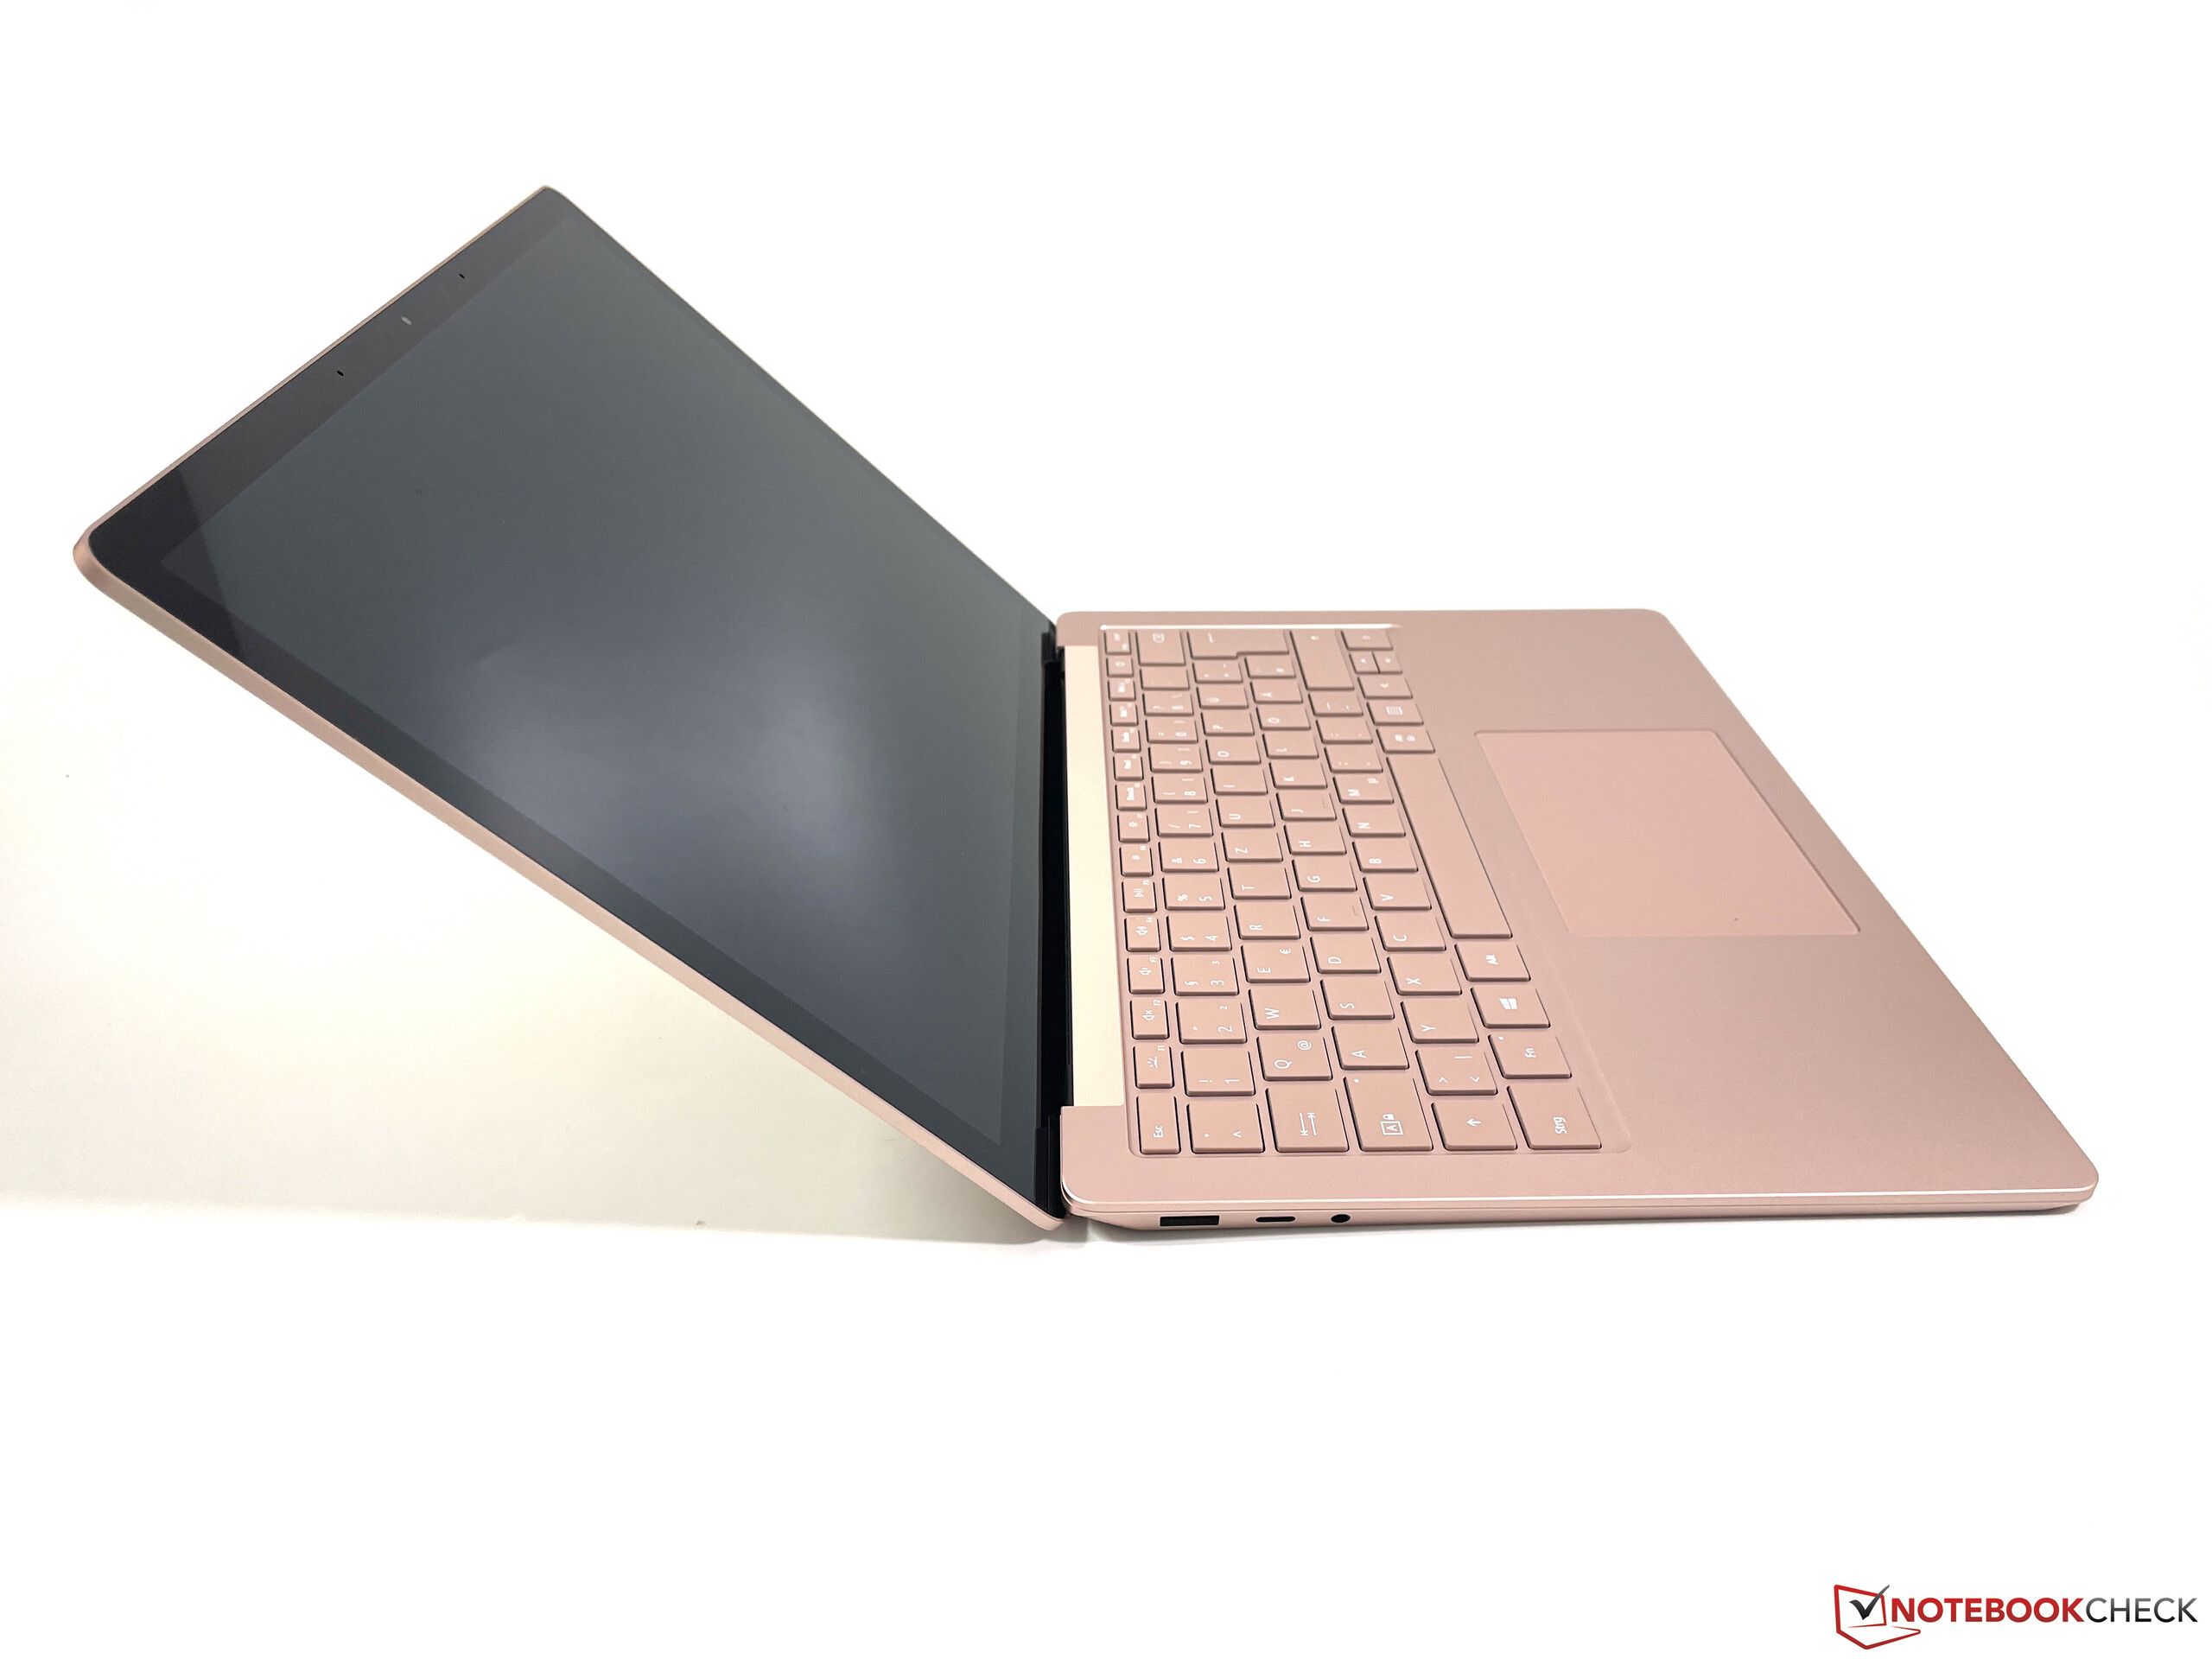
A Microsoft ainda evita os modernos conectores Thunderbolt 4 ou USB 4, e você mais uma vez obtém a porta proprietária Surface Connect para o adaptador de energia e alguns acessórios da Microsoft no lado direito, mas o manuseio não é ótimo. Devido à unidade base angular, você só pode anexar o adaptador de energia quando levantar o dispositivo do lado direito. Também é possível carregar via USB-C.
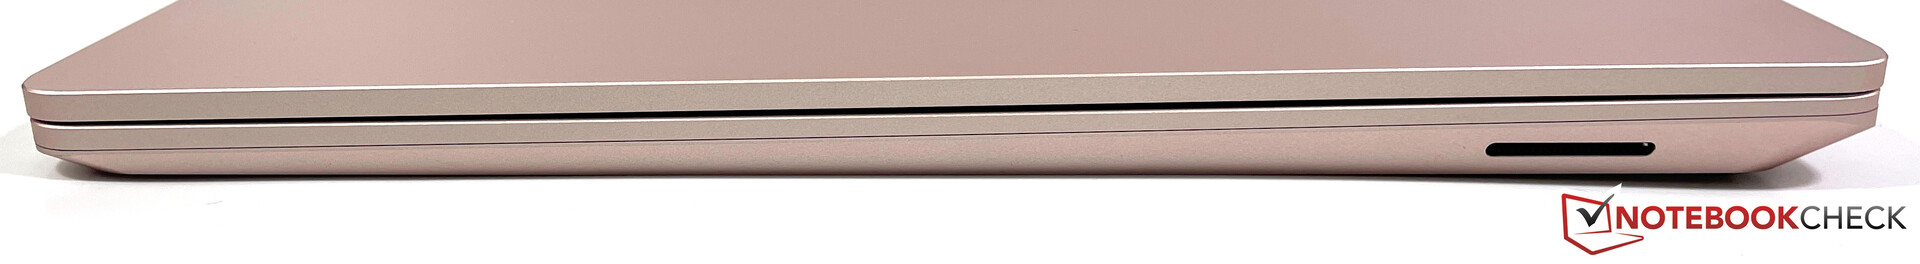
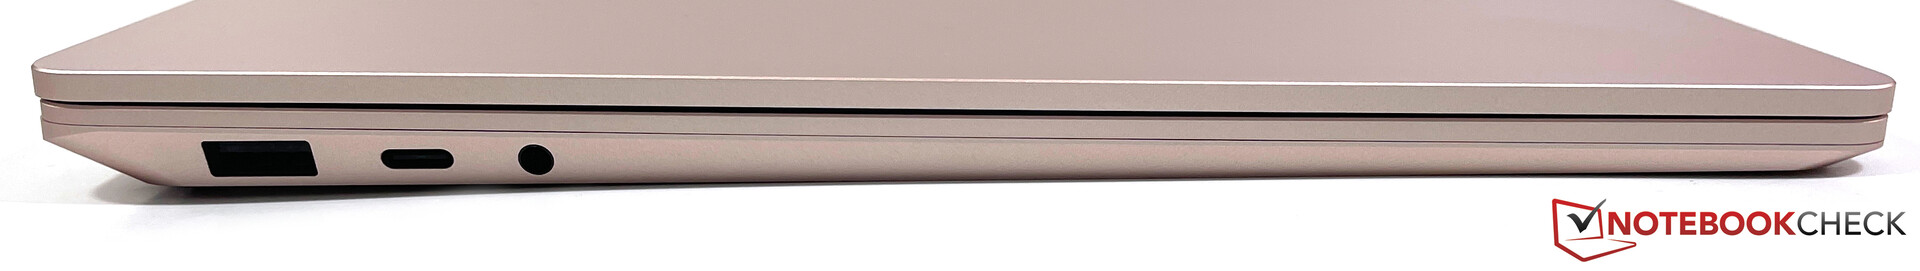
O módulo Wi-Fi (Intel AX201) é idêntico ao módulo modelo anterior e suporta o padrão Wi-Fi 6 rápido. Nosso teste Wi-Fi padronizado com o roteador Netgear Nighthawk RAX120 revela boas taxas de transferência e não tivemos nenhum problema de sinal com o roteador da Netgear ou com o AVM Fritz!Box 7590. Ao contrário doSuperfície Pro 7 Plusnão há opção para um módulo LTE no Laptop de Superfície 4.


Dispositivos de entrada
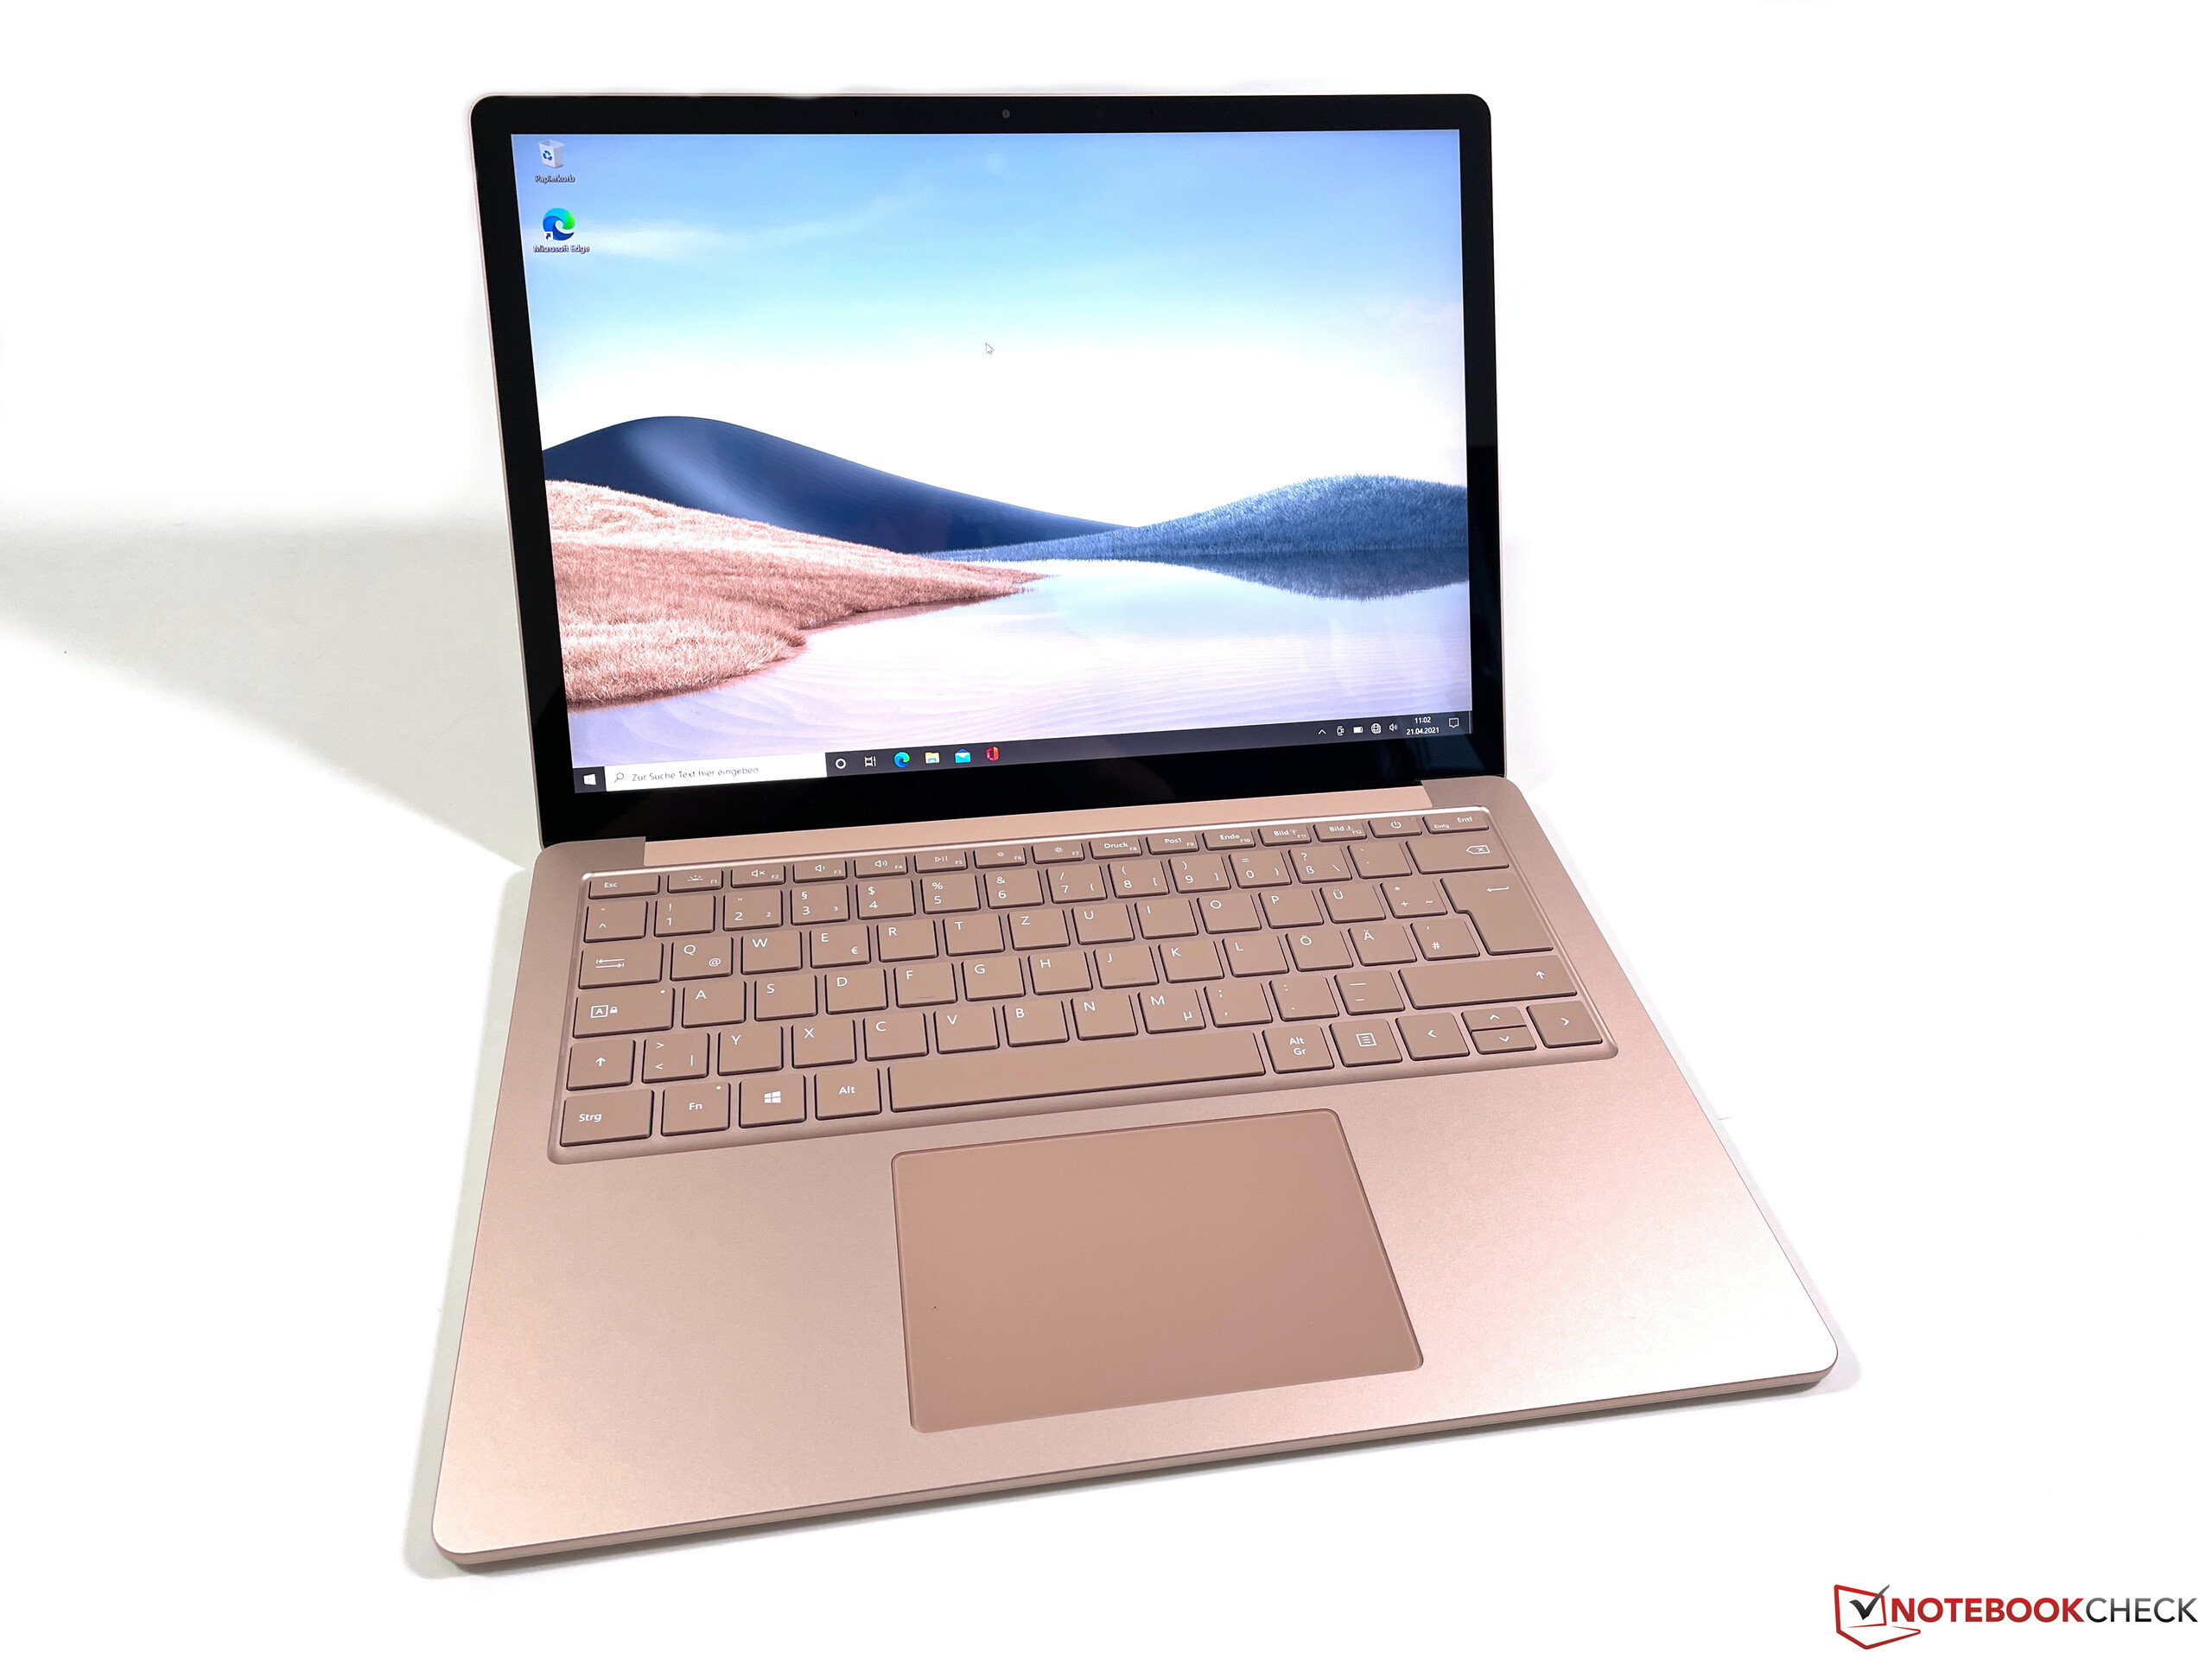
Os dispositivos de entrada não mudaram. O teclado é decente para um sub-portátil e o touchpad é muito confiável. Nossa cor de chassi é chamada de Sandstone e o contraste nas teclas com as letras brancas não é grande, e a iluminação branca também não ajuda muito.
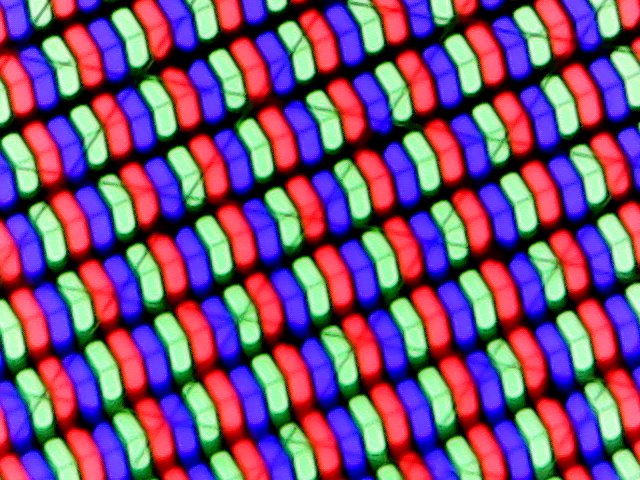
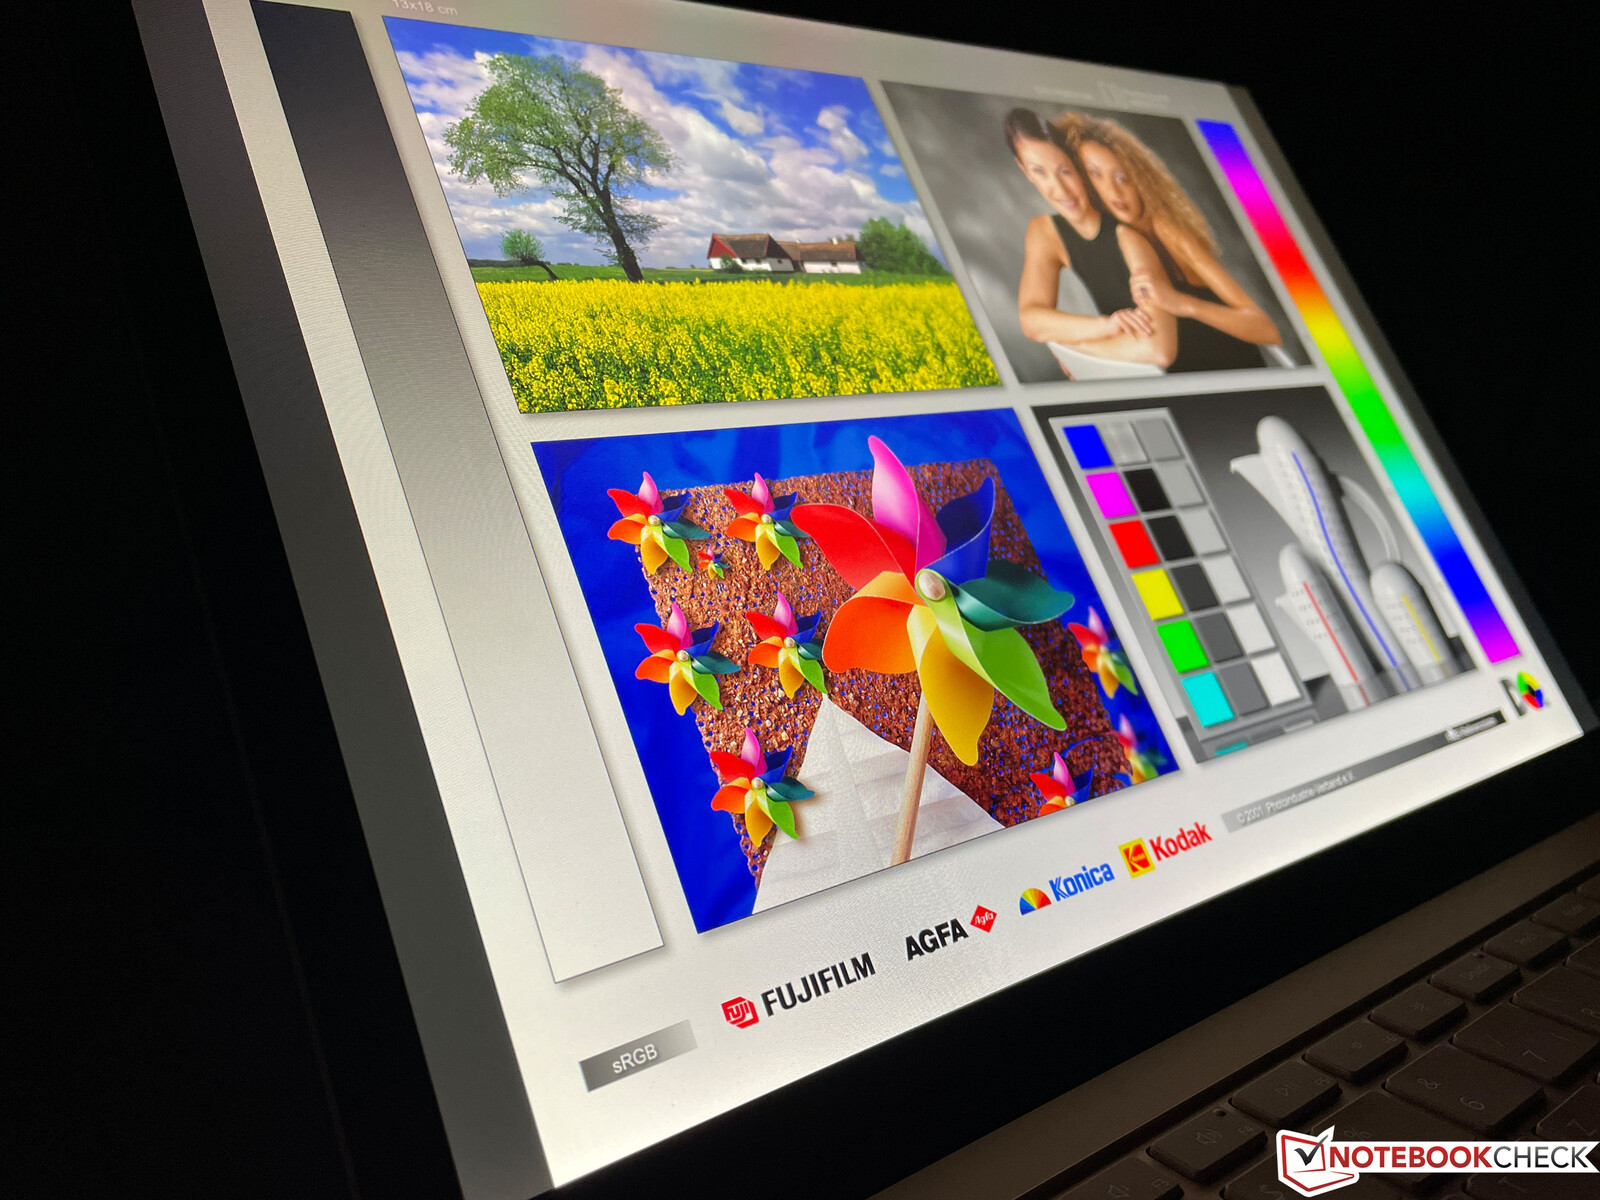
Visor - Superfície com tela 3:2 Touchscreen
Podemos mantê-lo curto na seção de exibição, porque a Microsoft ainda usa o mesmo painel. A impressão subjetiva da imagem é excelente e você só pode notar um pequeno sangramento de luz de fundo na borda inferior. A tela também é idêntica em cerca de 400 lêndeas, mas isto também significa que não há muito espaço de manobra em ambientes muito brilhantes e a concorrência da Dell ou do Apple é superior neste aspecto.
| |||||||||||||||||||||||||
iluminação: 94 %
iluminação com acumulador: 406 cd/m²
Contraste: 1424:1 (Preto: 0.29 cd/m²)
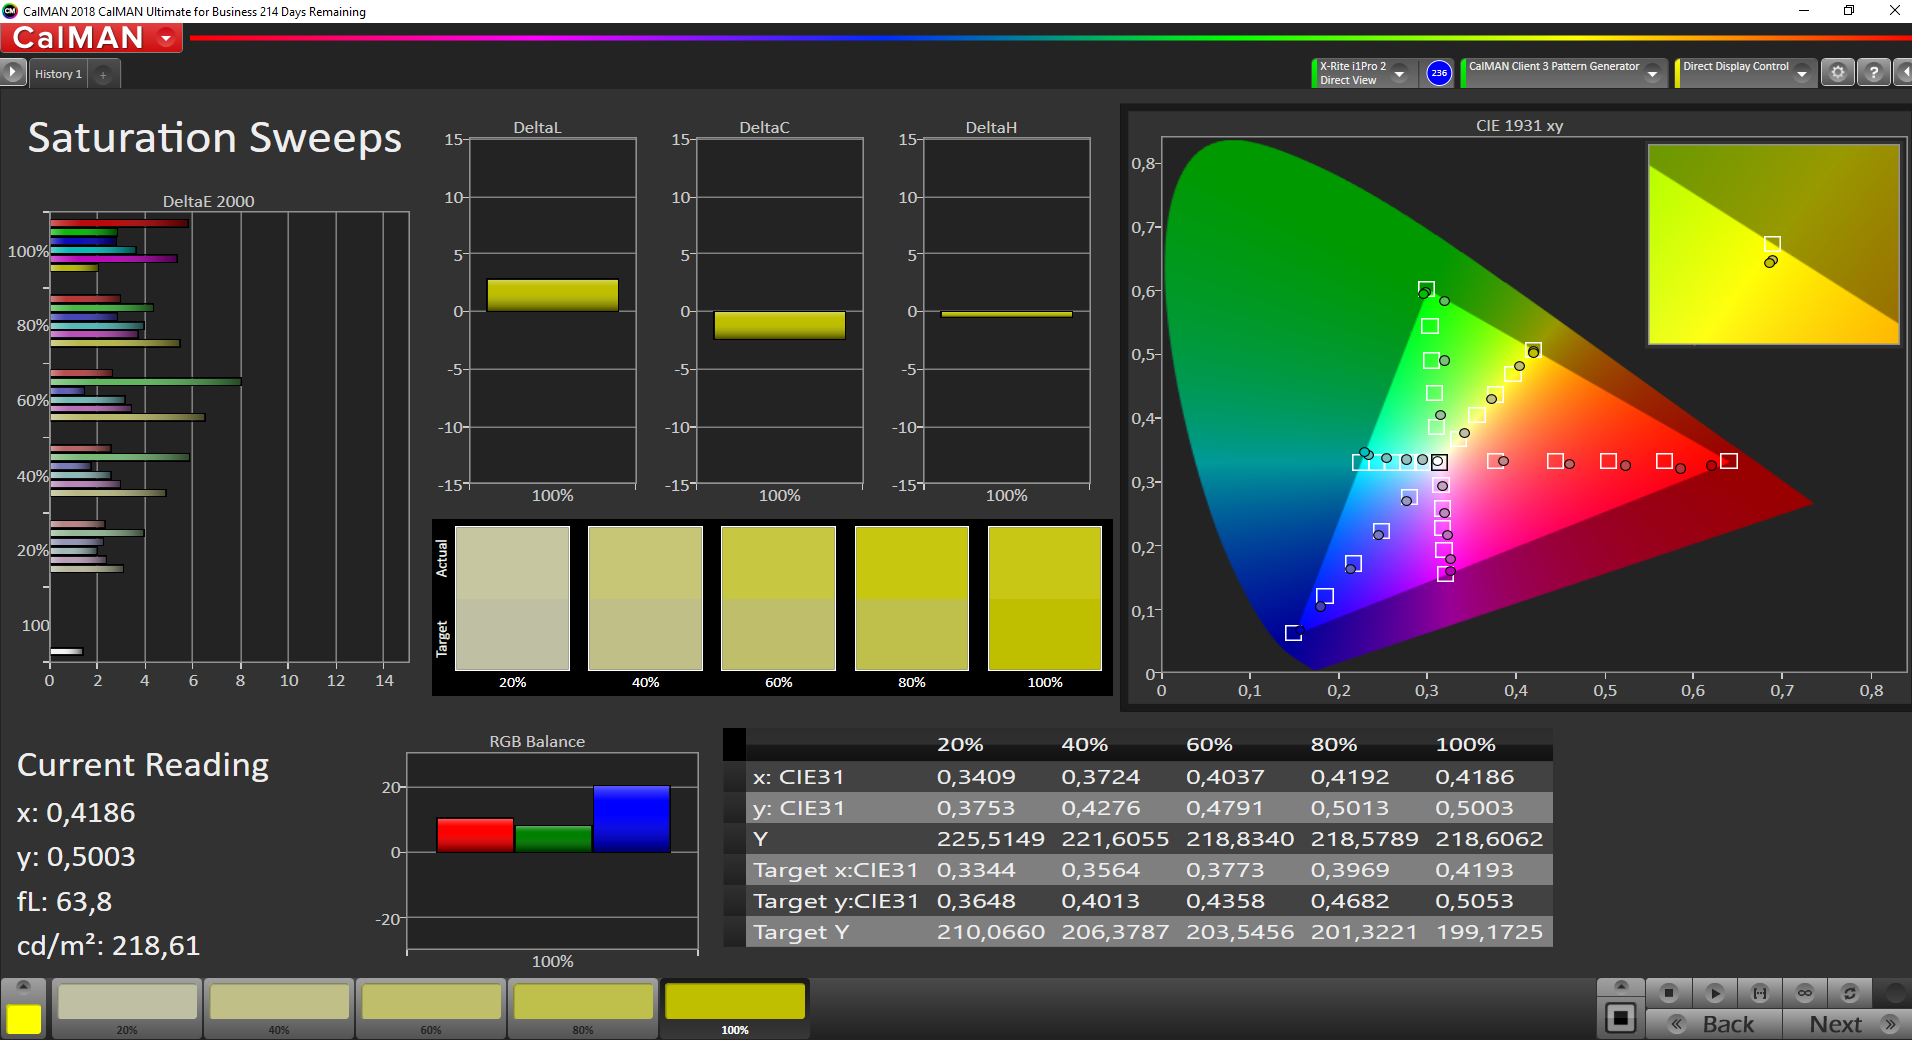
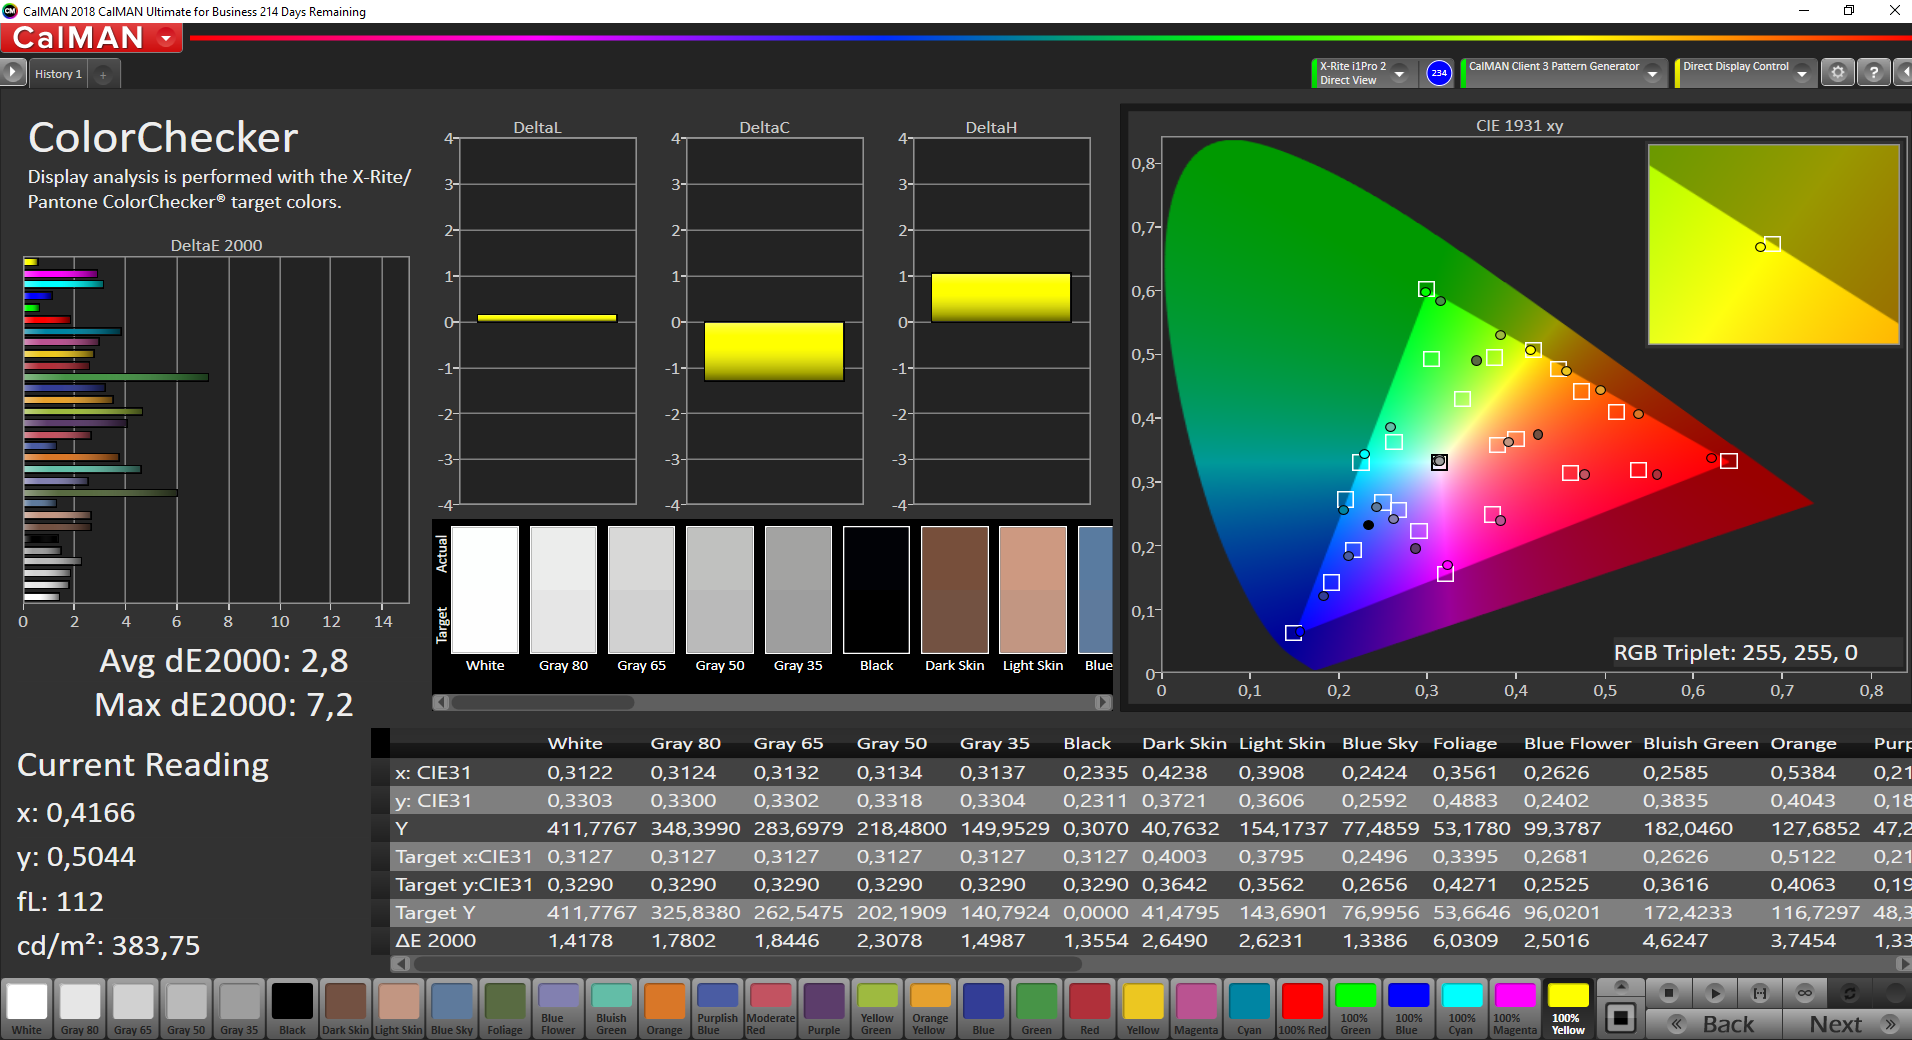
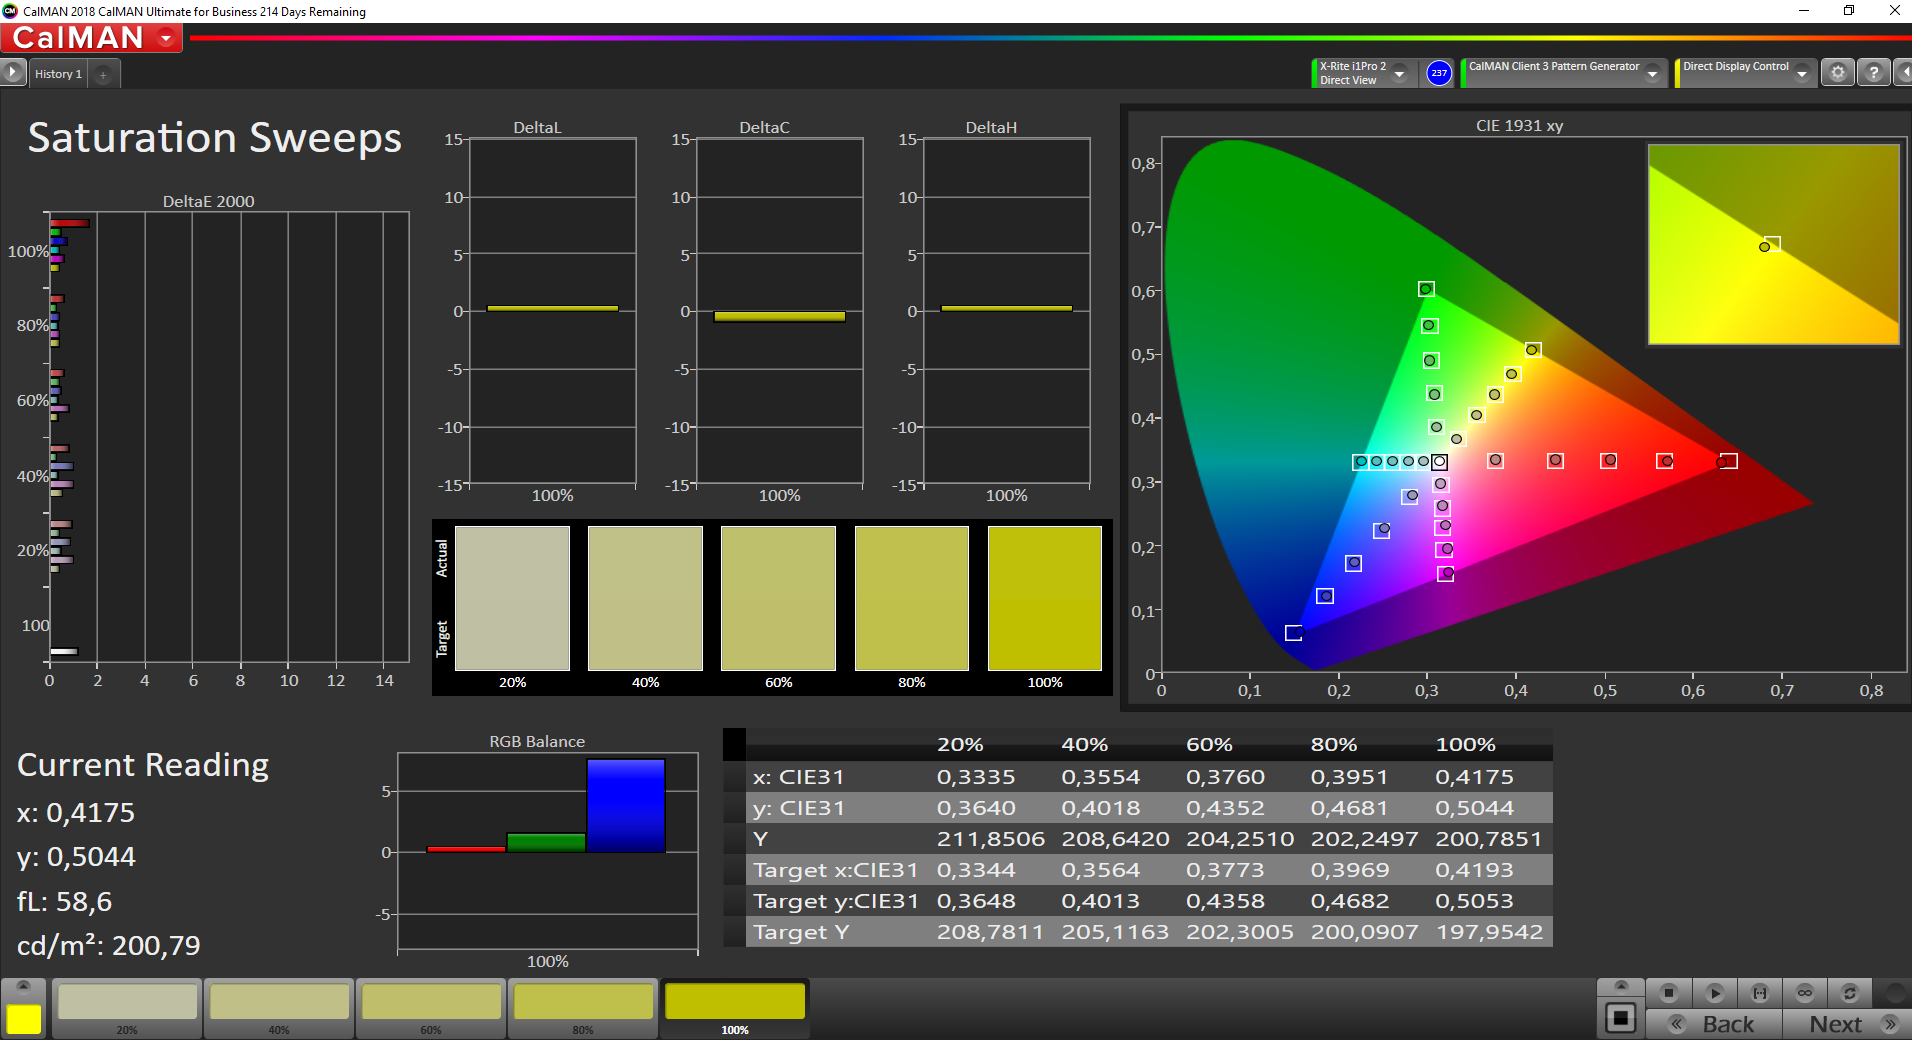
ΔE ColorChecker Calman: 2.8 | ∀{0.5-29.43 Ø4.71}
calibrated: 0.8
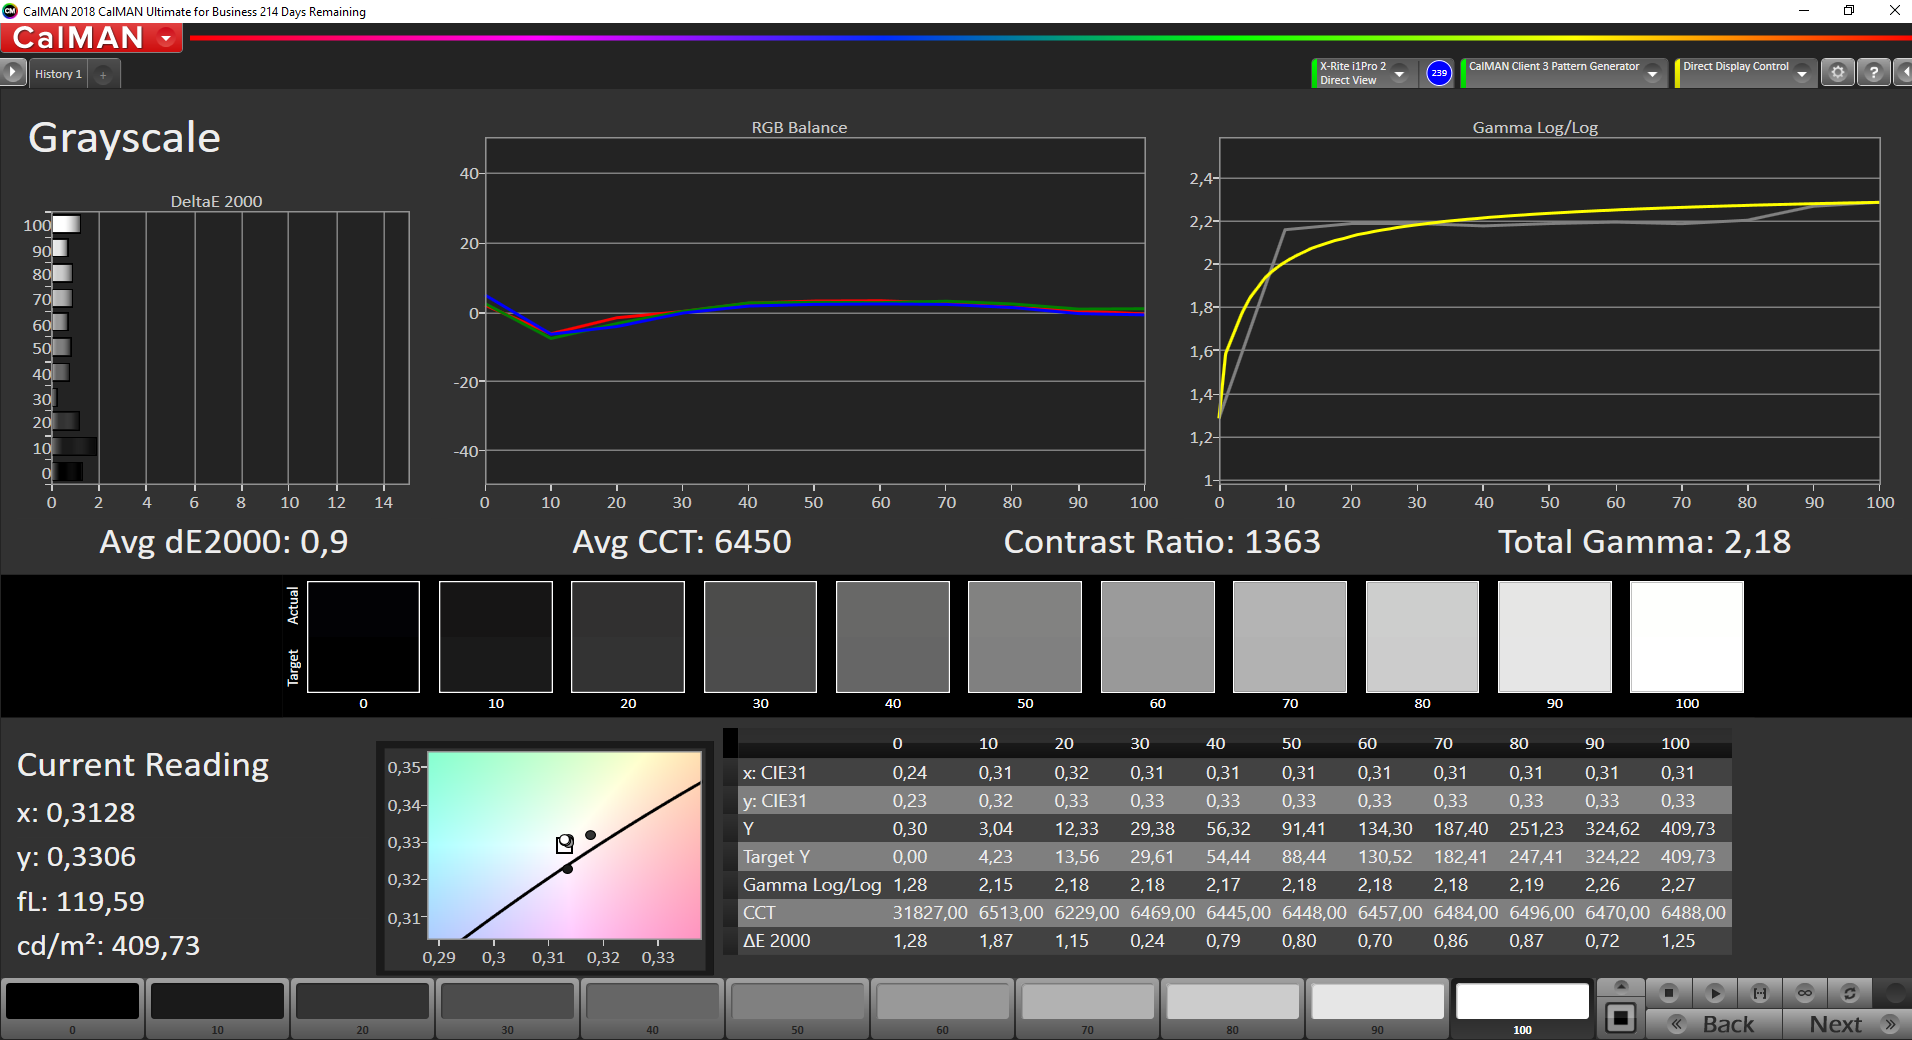
ΔE Greyscale Calman: 1.9 | ∀{0.09-98 Ø4.96}
97.2% sRGB (Argyll 1.6.3 3D)
61.6% AdobeRGB 1998 (Argyll 1.6.3 3D)
66.9% AdobeRGB 1998 (Argyll 3D)
97.2% sRGB (Argyll 3D)
64.7% Display P3 (Argyll 3D)
Gamma: 2.12
CCT: 6510 K
| Microsoft Surface Laptop 4 13 i7 LQ135P1JX51, IPS, 2256x1504, 13.5" | Lenovo Yoga Slim 7i Carbon 13 ITL N133GCA-GQ1, a-SI IPS LED, 2560x1600, 13.3" | Dell XPS 13 9310 Core i7 4K Sharp LQ134R1, IPS, 3840x2400, 13.4" | Apple MacBook Pro 13 Late 2020 M1 Entry (8 / 256 GB) IPS, 2560x1600, 13.3" | Microsoft Surface Laptop 3 13 Core i5-1035G7 Sharp LQ135P1JX51, IPS, 2256x1504, 13.5" | |
|---|---|---|---|---|---|
| Display | 0% | 15% | 1% | ||
| Display P3 Coverage (%) | 64.7 | 65.1 1% | 80.2 24% | 65.7 2% | |
| sRGB Coverage (%) | 97.2 | 97.1 0% | 100 3% | 98.6 1% | |
| AdobeRGB 1998 Coverage (%) | 66.9 | 66.6 0% | 78.9 18% | 67.8 1% | |
| Response Times | 44% | 2% | 31% | 1% | |
| Response Time Grey 50% / Grey 80% * (ms) | 62.8 ? | 38.4 ? 39% | 59.2 ? 6% | 48 ? 24% | 59.2 ? 6% |
| Response Time Black / White * (ms) | 39.8 ? | 20.8 ? 48% | 40.4 ? -2% | 25.2 ? 37% | 41.6 ? -5% |
| PWM Frequency (Hz) | 21930 ? | 2137 ? | 122000 ? | 21740 ? | |
| Screen | -1% | -10% | 22% | 10% | |
| Brightness middle (cd/m²) | 413 | 325 -21% | 508.7 23% | 510 23% | 403.4 -2% |
| Brightness (cd/m²) | 400 | 297 -26% | 479 20% | 491 23% | 397 -1% |
| Brightness Distribution (%) | 94 | 83 -12% | 84 -11% | 94 0% | 89 -5% |
| Black Level * (cd/m²) | 0.29 | 0.26 10% | 0.3 -3% | 0.29 -0% | 0.34 -17% |
| Contrast (:1) | 1424 | 1250 -12% | 1696 19% | 1759 24% | 1186 -17% |
| Colorchecker dE 2000 * | 2.8 | 2.2 21% | 2.72 3% | 1.3 54% | 0.94 66% |
| Colorchecker dE 2000 max. * | 7.2 | 3.5 51% | 4.7 35% | 3 58% | 2.92 59% |
| Colorchecker dE 2000 calibrated * | 0.8 | 0.6 25% | 1.92 -140% | 0.99 -24% | |
| Greyscale dE 2000 * | 1.9 | 2.8 -47% | 3.4 -79% | 2 -5% | 0.9 53% |
| Gamma | 2.12 104% | 2.05 107% | 2.11 104% | 2.23 99% | 2.13 103% |
| CCT | 6510 100% | 6452 101% | 6245 104% | 6933 94% | 6620 98% |
| Color Space (Percent of AdobeRGB 1998) (%) | 61.6 | 61.3 0% | 70.7 15% | 88.3 43% | 62.3 1% |
| Color Space (Percent of sRGB) (%) | 97.2 | 97 0% | 100 3% | 100 3% | 98.7 2% |
| Média Total (Programa/Configurações) | 14% /
5% | 2% /
-4% | 27% /
24% | 4% /
8% |
* ... menor é melhor
Exibir tempos de resposta
| ↔ Tempo de resposta preto para branco | ||
|---|---|---|
| 39.8 ms ... ascensão ↗ e queda ↘ combinadas | ↗ 21.2 ms ascensão | 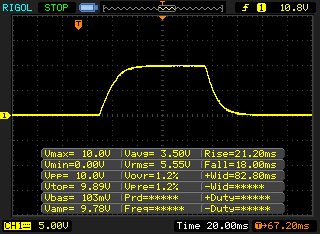 |
| ↘ 18 ms queda | ||
| A tela mostra taxas de resposta lentas em nossos testes e será insatisfatória para os jogadores. Em comparação, todos os dispositivos testados variam de 0.1 (mínimo) a 240 (máximo) ms. » 97 % de todos os dispositivos são melhores. Isso significa que o tempo de resposta medido é pior que a média de todos os dispositivos testados (19.8 ms). | ||
| ↔ Tempo de resposta 50% cinza a 80% cinza | ||
| 62.8 ms ... ascensão ↗ e queda ↘ combinadas | ↗ 30.4 ms ascensão | 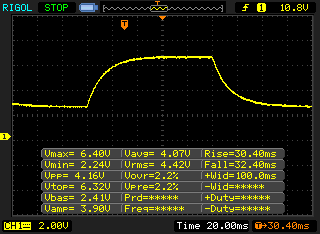 |
| ↘ 32.4 ms queda | ||
| A tela mostra taxas de resposta lentas em nossos testes e será insatisfatória para os jogadores. Em comparação, todos os dispositivos testados variam de 0.165 (mínimo) a 636 (máximo) ms. » 97 % de todos os dispositivos são melhores. Isso significa que o tempo de resposta medido é pior que a média de todos os dispositivos testados (31 ms). | ||
Cintilação da tela / PWM (modulação por largura de pulso)
| Tela tremeluzindo/PWM detectado | 21930 Hz | ≤ 50 % configuração de brilho | 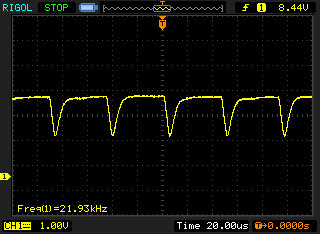 |
A luz de fundo da tela pisca em 21930 Hz (pior caso, por exemplo, utilizando PWM) Cintilação detectada em uma configuração de brilho de 50 % e abaixo. Não deve haver cintilação ou PWM acima desta configuração de brilho. A frequência de 21930 Hz é bastante alta, então a maioria dos usuários sensíveis ao PWM não deve notar nenhuma oscilação. [pwm_comparison] Em comparação: 52 % de todos os dispositivos testados não usam PWM para escurecer a tela. Se PWM foi detectado, uma média de 7757 (mínimo: 5 - máximo: 343500) Hz foi medida. | |||
A calibração de fábrica é um pouco pior em comparação com o modelo de teste anterior, mas não há uma cor fundida. Todos os desvios de cor estão dentro da faixa desejada após nossa calibração, portanto o display é adequado para edição de imagem/vídeo no pequeno espaço de cor sRGB.


Desempenho - Tiger Lake i7 a 25W
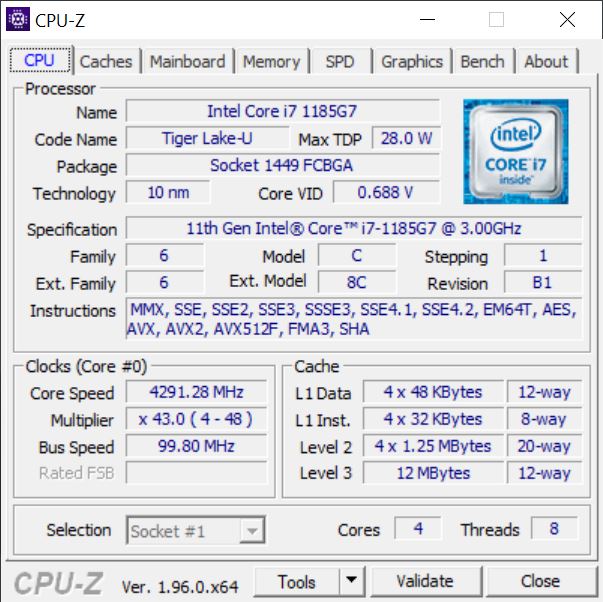
Processador - i7-1185G7
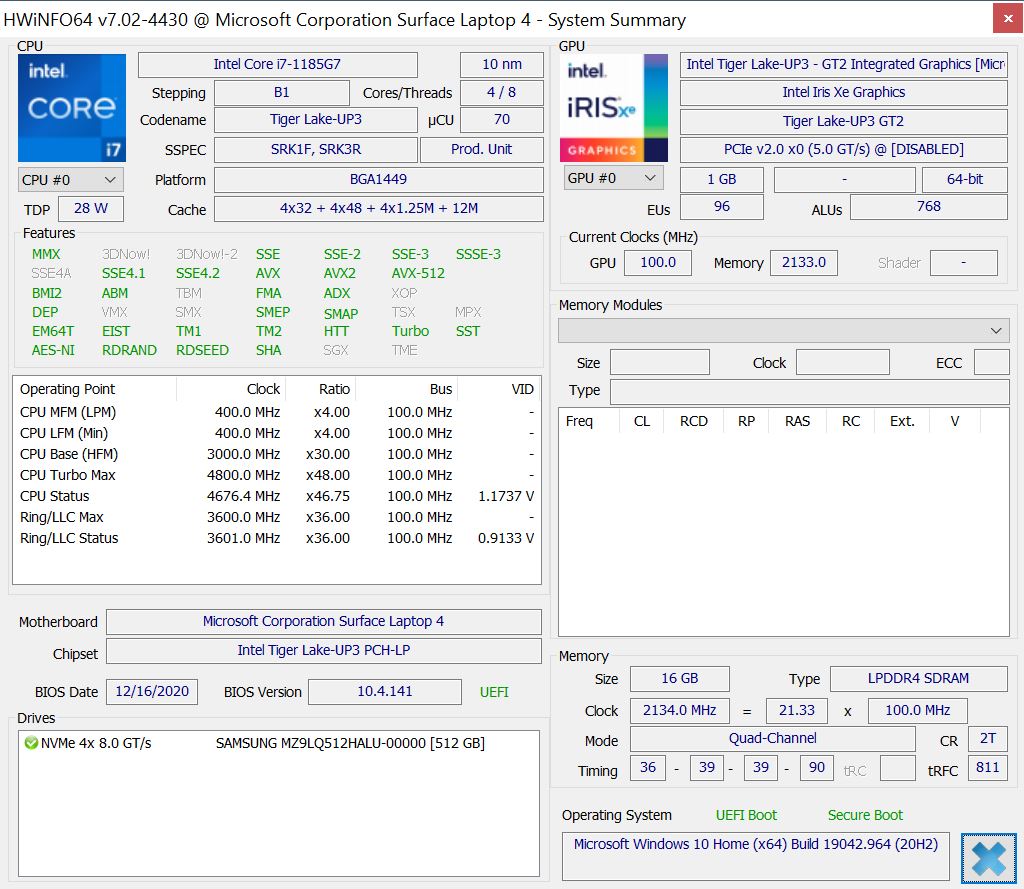
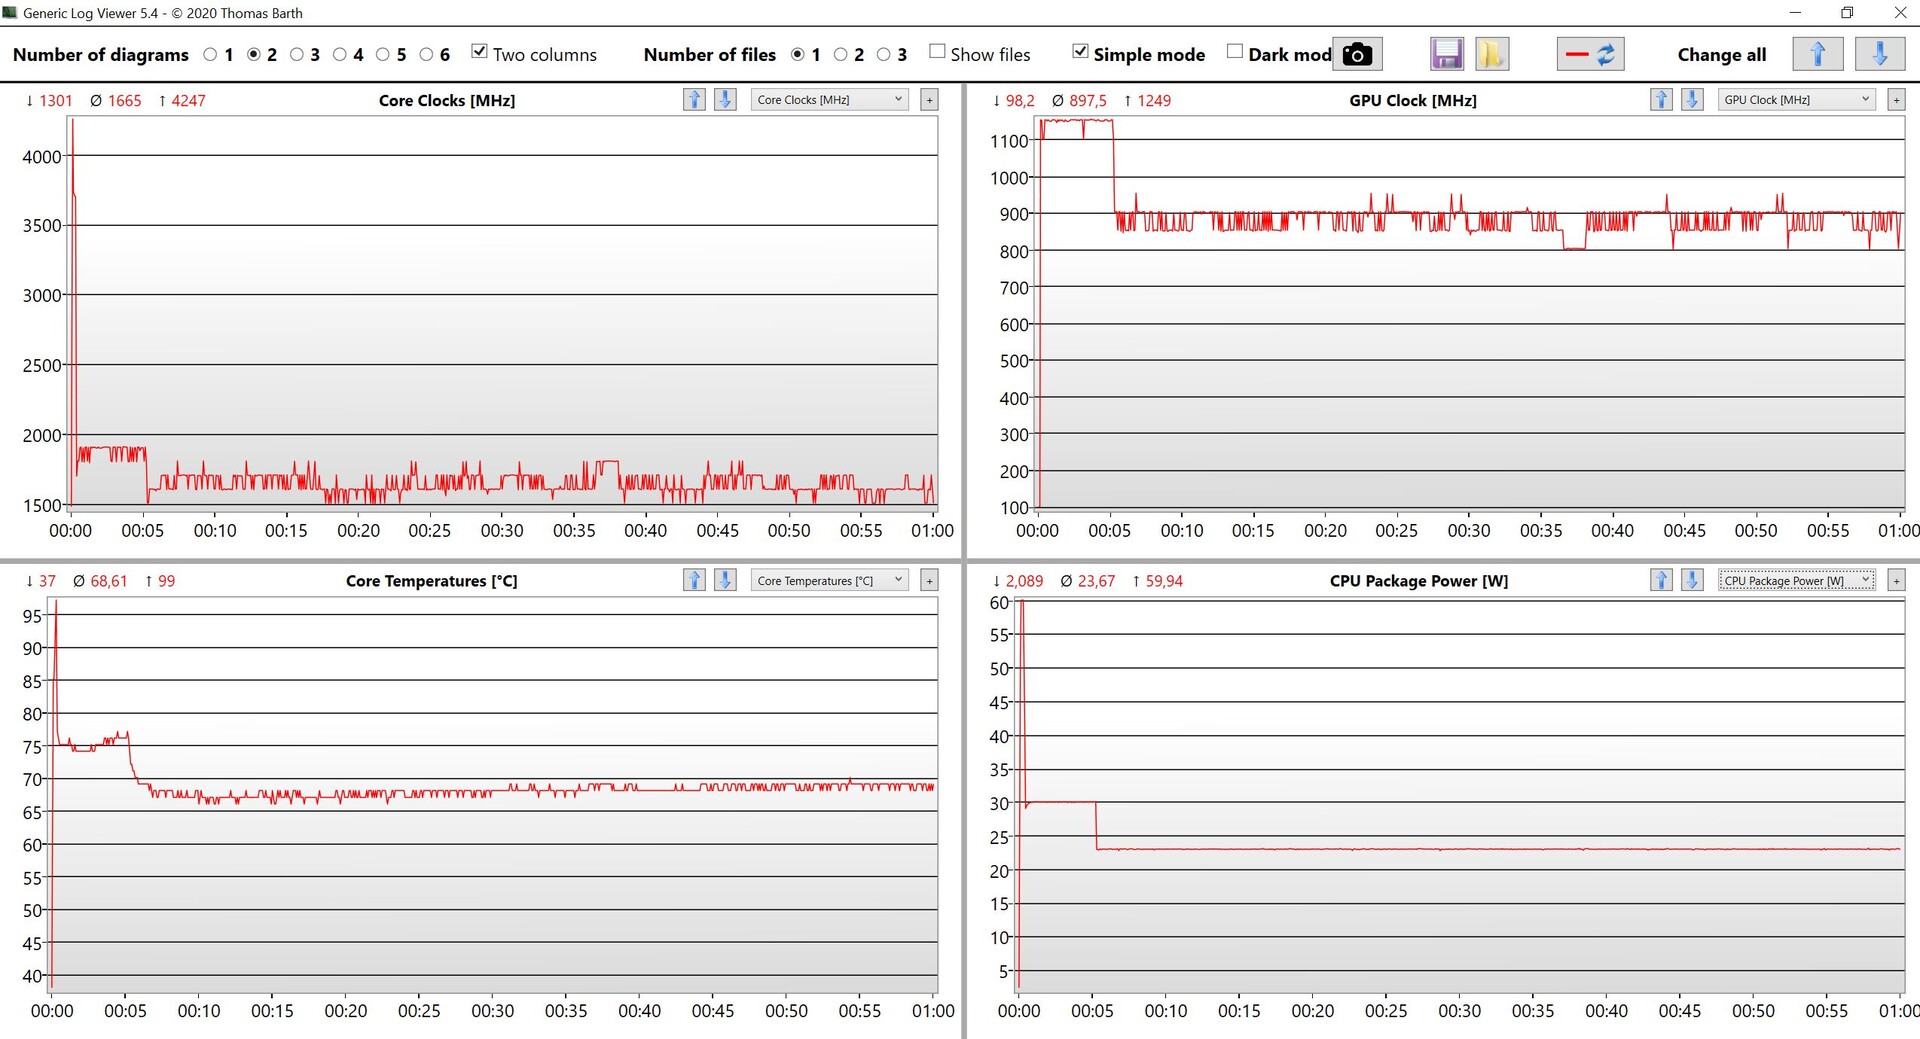
Nossa unidade de teste está equipada com o processador ULV mais rápido da Intel que você pode obter agora mesmo, oCore i7-1185G7(Tiger Lake) com quatro núcleos e um relógio máximo de até 4,8 GHz (ou 4,3 GHz para todos os núcleos ativos, respectivamente. Os limites de potência são muito generosos para um laptop de 13 polegadas a 50W para rajadas curtas e depois de 30W (4x ~3,5 GHz) por alguns minutos. Podemos ver que o nível do TDP eventualmente se estabilizará em 23W (4x 3,0-3,1 GHz) após cerca de 12 minutos.
Isto significa que o laptop de superfície é mais rápido que os rivais da Lenovo e Dell, e o i7 é também uma CPU muito poderosa para tarefas diárias, mas o grande problema é a comparação comApple's M1 chipnoMacBook Pro 13. Ele está no mesmo nível em aplicações nativas quando olhamos para o desempenho de núcleo único (ver Cinebench R23), mas é muito mais rápido que o i7 em cenários de vários núcleos (com um consumo de energia muito menor).
O desempenho não é reduzido com a energia da bateria.
Cinebench R20: CPU (Single Core) | CPU (Multi Core)
Cinebench R15: CPU Single 64Bit | CPU Multi 64Bit
Blender: v2.79 BMW27 CPU
7-Zip 18.03: 7z b 4 -mmt1 | 7z b 4
Geekbench 5.5: Single-Core | Multi-Core
HWBOT x265 Benchmark v2.2: 4k Preset
LibreOffice : 20 Documents To PDF
R Benchmark 2.5: Overall mean
| Cinebench R23 / Single Core | |
| Média da turma Subnotebook (358 - 2213, n=61, últimos 2 anos) | |
| Microsoft Surface Laptop 4 13 i7 | |
| Apple MacBook Pro 13 Late 2020 M1 Entry (8 / 256 GB) | |
| Média Intel Core i7-1185G7 (1251 - 1532, n=24) | |
| Dell XPS 13 9310 Core i7 4K | |
| Lenovo Yoga Slim 7i Carbon 13 ITL | |
| Cinebench R23 / Multi Core | |
| Média da turma Subnotebook (1555 - 21812, n=60, últimos 2 anos) | |
| Apple MacBook Pro 13 Late 2020 M1 Entry (8 / 256 GB) | |
| Média Intel Core i7-1185G7 (3610 - 6383, n=24) | |
| Microsoft Surface Laptop 4 13 i7 | |
| Dell XPS 13 9310 Core i7 4K | |
| Lenovo Yoga Slim 7i Carbon 13 ITL | |
| Cinebench R20 / CPU (Single Core) | |
| Média da turma Subnotebook (128 - 832, n=57, últimos 2 anos) | |
| Microsoft Surface Laptop 4 13 i7 | |
| Dell XPS 13 9310 Core i7 4K | |
| Média Intel Core i7-1185G7 (489 - 593, n=28) | |
| Lenovo Yoga Slim 7i Carbon 13 ITL | |
| Microsoft Surface Laptop 3 13 Core i5-1035G7 | |
| Apple MacBook Pro 13 Late 2020 M1 Entry (8 / 256 GB) | |
| Cinebench R20 / CPU (Multi Core) | |
| Média da turma Subnotebook (579 - 8541, n=57, últimos 2 anos) | |
| Apple MacBook Pro 13 Late 2020 M1 Entry (8 / 256 GB) | |
| Média Intel Core i7-1185G7 (1425 - 2493, n=28) | |
| Dell XPS 13 9310 Core i7 4K | |
| Microsoft Surface Laptop 4 13 i7 | |
| Lenovo Yoga Slim 7i Carbon 13 ITL | |
| Microsoft Surface Laptop 3 13 Core i5-1035G7 | |
| Cinebench R15 / CPU Single 64Bit | |
| Média da turma Subnotebook (72.4 - 322, n=57, últimos 2 anos) | |
| Microsoft Surface Laptop 4 13 i7 | |
| Lenovo Yoga Slim 7i Carbon 13 ITL | |
| Dell XPS 13 9310 Core i7 4K | |
| Média Intel Core i7-1185G7 (168 - 230, n=27) | |
| Apple MacBook Pro 13 Late 2020 M1 Entry (8 / 256 GB) | |
| Microsoft Surface Laptop 3 13 Core i5-1035G7 | |
| Cinebench R15 / CPU Multi 64Bit | |
| Média da turma Subnotebook (327 - 3345, n=57, últimos 2 anos) | |
| Apple MacBook Pro 13 Late 2020 M1 Entry (8 / 256 GB) | |
| Microsoft Surface Laptop 4 13 i7 | |
| Dell XPS 13 9310 Core i7 4K | |
| Média Intel Core i7-1185G7 (617 - 1066, n=32) | |
| Lenovo Yoga Slim 7i Carbon 13 ITL | |
| Microsoft Surface Laptop 3 13 Core i5-1035G7 | |
| Blender / v2.79 BMW27 CPU | |
| Microsoft Surface Laptop 3 13 Core i5-1035G7 | |
| Lenovo Yoga Slim 7i Carbon 13 ITL | |
| Dell XPS 13 9310 Core i7 4K | |
| Microsoft Surface Laptop 4 13 i7 | |
| Média Intel Core i7-1185G7 (478 - 745, n=28) | |
| Média da turma Subnotebook (159 - 2271, n=58, últimos 2 anos) | |
| 7-Zip 18.03 / 7z b 4 -mmt1 | |
| Média da turma Subnotebook (2643 - 6699, n=59, últimos 2 anos) | |
| Microsoft Surface Laptop 4 13 i7 | |
| Lenovo Yoga Slim 7i Carbon 13 ITL | |
| Média Intel Core i7-1185G7 (3678 - 5507, n=27) | |
| Dell XPS 13 9310 Core i7 4K | |
| Microsoft Surface Laptop 3 13 Core i5-1035G7 | |
| 7-Zip 18.03 / 7z b 4 | |
| Média da turma Subnotebook (11668 - 77867, n=57, últimos 2 anos) | |
| Microsoft Surface Laptop 4 13 i7 | |
| Média Intel Core i7-1185G7 (18812 - 27693, n=27) | |
| Dell XPS 13 9310 Core i7 4K | |
| Lenovo Yoga Slim 7i Carbon 13 ITL | |
| Microsoft Surface Laptop 3 13 Core i5-1035G7 | |
| Geekbench 5.5 / Single-Core | |
| Média da turma Subnotebook (726 - 2224, n=48, últimos 2 anos) | |
| Apple MacBook Pro 13 Late 2020 M1 Entry (8 / 256 GB) | |
| Lenovo Yoga Slim 7i Carbon 13 ITL | |
| Dell XPS 13 9310 Core i7 4K | |
| Microsoft Surface Laptop 4 13 i7 | |
| Média Intel Core i7-1185G7 (1398 - 1626, n=21) | |
| Geekbench 5.5 / Multi-Core | |
| Média da turma Subnotebook (2557 - 17218, n=48, últimos 2 anos) | |
| Apple MacBook Pro 13 Late 2020 M1 Entry (8 / 256 GB) | |
| Dell XPS 13 9310 Core i7 4K | |
| Microsoft Surface Laptop 4 13 i7 | |
| Lenovo Yoga Slim 7i Carbon 13 ITL | |
| Média Intel Core i7-1185G7 (4620 - 5944, n=21) | |
| HWBOT x265 Benchmark v2.2 / 4k Preset | |
| Média da turma Subnotebook (0.97 - 25.1, n=57, últimos 2 anos) | |
| Média Intel Core i7-1185G7 (5.02 - 8.13, n=27) | |
| Microsoft Surface Laptop 4 13 i7 | |
| Dell XPS 13 9310 Core i7 4K | |
| Lenovo Yoga Slim 7i Carbon 13 ITL | |
| Microsoft Surface Laptop 3 13 Core i5-1035G7 | |
| LibreOffice / 20 Documents To PDF | |
| Média da turma Subnotebook (39.9 - 220, n=56, últimos 2 anos) | |
| Microsoft Surface Laptop 4 13 i7 | |
| Média Intel Core i7-1185G7 (41.3 - 61.7, n=26) | |
| Lenovo Yoga Slim 7i Carbon 13 ITL | |
| Dell XPS 13 9310 Core i7 4K | |
| R Benchmark 2.5 / Overall mean | |
| Dell XPS 13 9310 Core i7 4K | |
| Média Intel Core i7-1185G7 (0.55 - 0.615, n=27) | |
| Microsoft Surface Laptop 4 13 i7 | |
| Lenovo Yoga Slim 7i Carbon 13 ITL | |
| Média da turma Subnotebook (0.4024 - 1.456, n=58, últimos 2 anos) | |
* ... menor é melhor
Desempenho do sistema
A impressão subjetiva de desempenho com o processador rápido e o PCIe-SSD é muito boa, o que também é apoiado pelos bons resultados do benchmark. Entretanto, todos os dispositivos de comparação estão praticamente no mesmo nível, e você não notará uma diferença nas situações cotidianas, mesmo quando você vem do antigoSuperfície do Laptop 3.
| PCMark 10 Score | 4809 pontos | |
Ajuda | ||
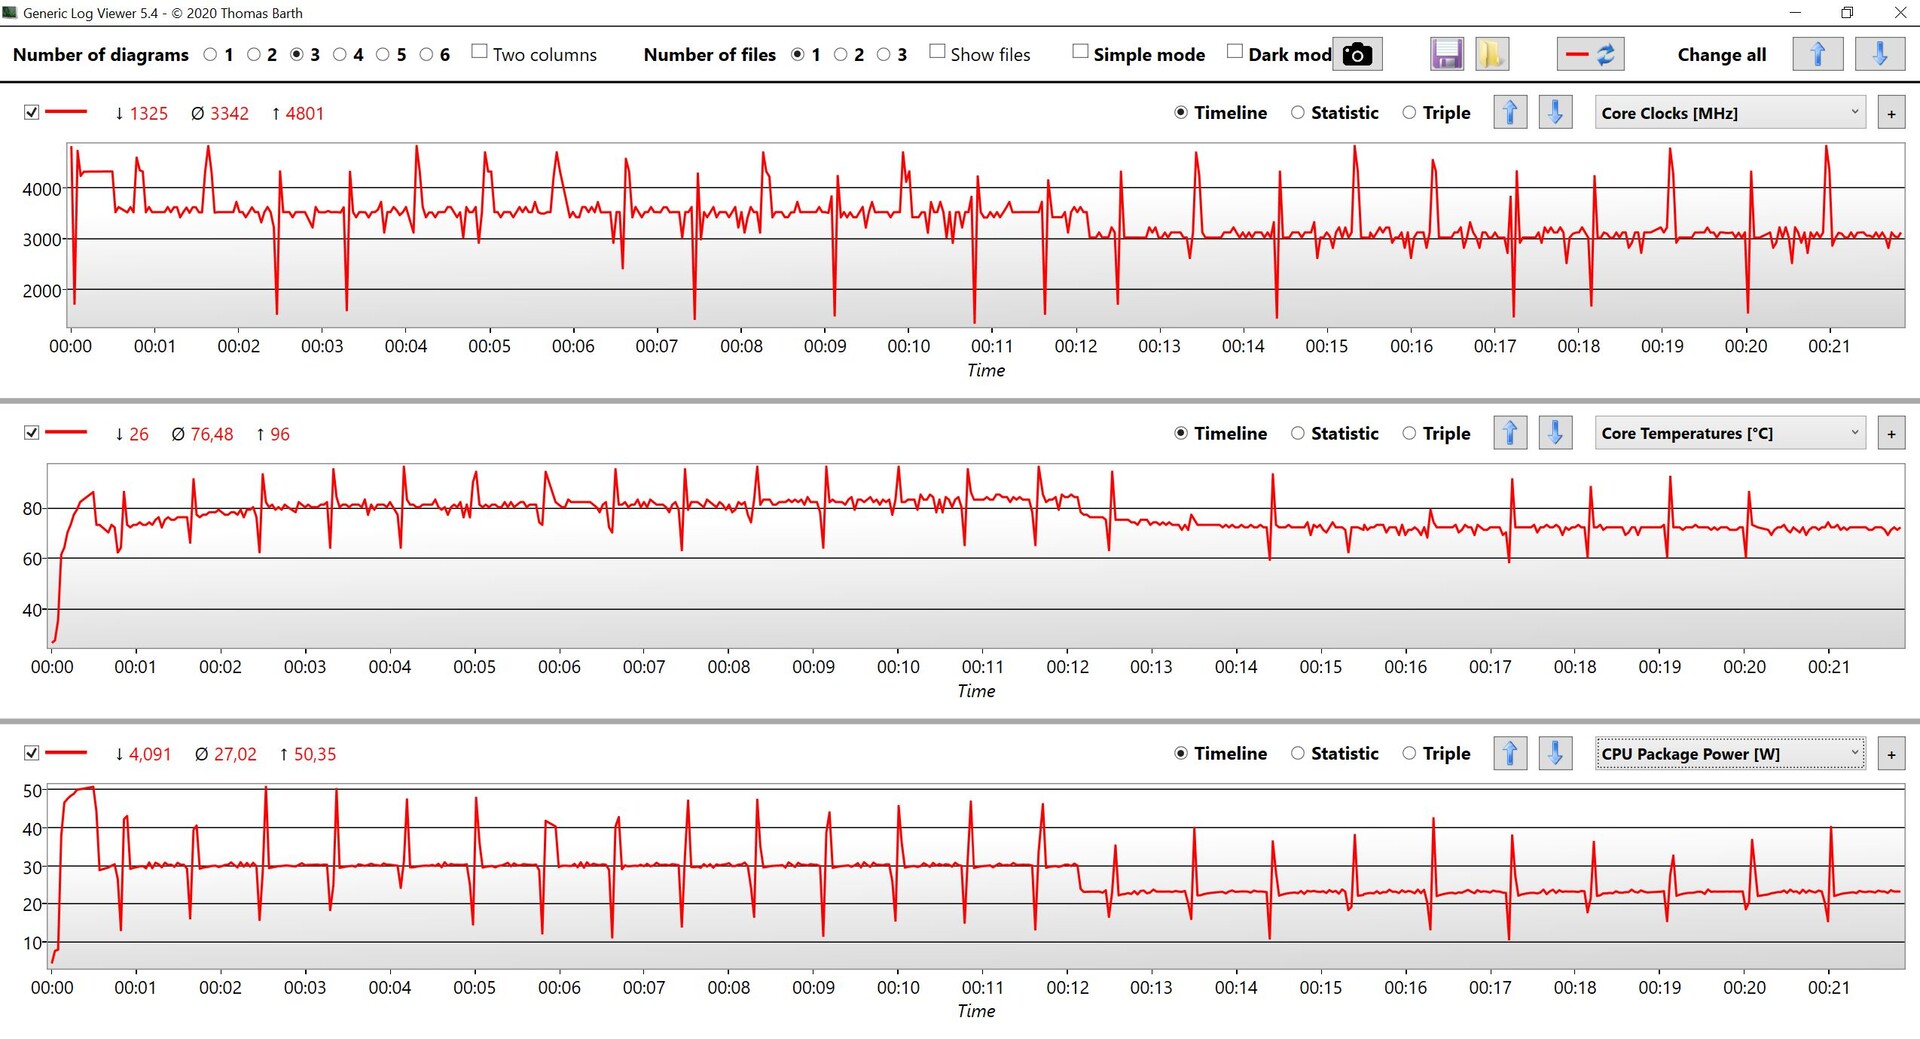
Latência do DPC
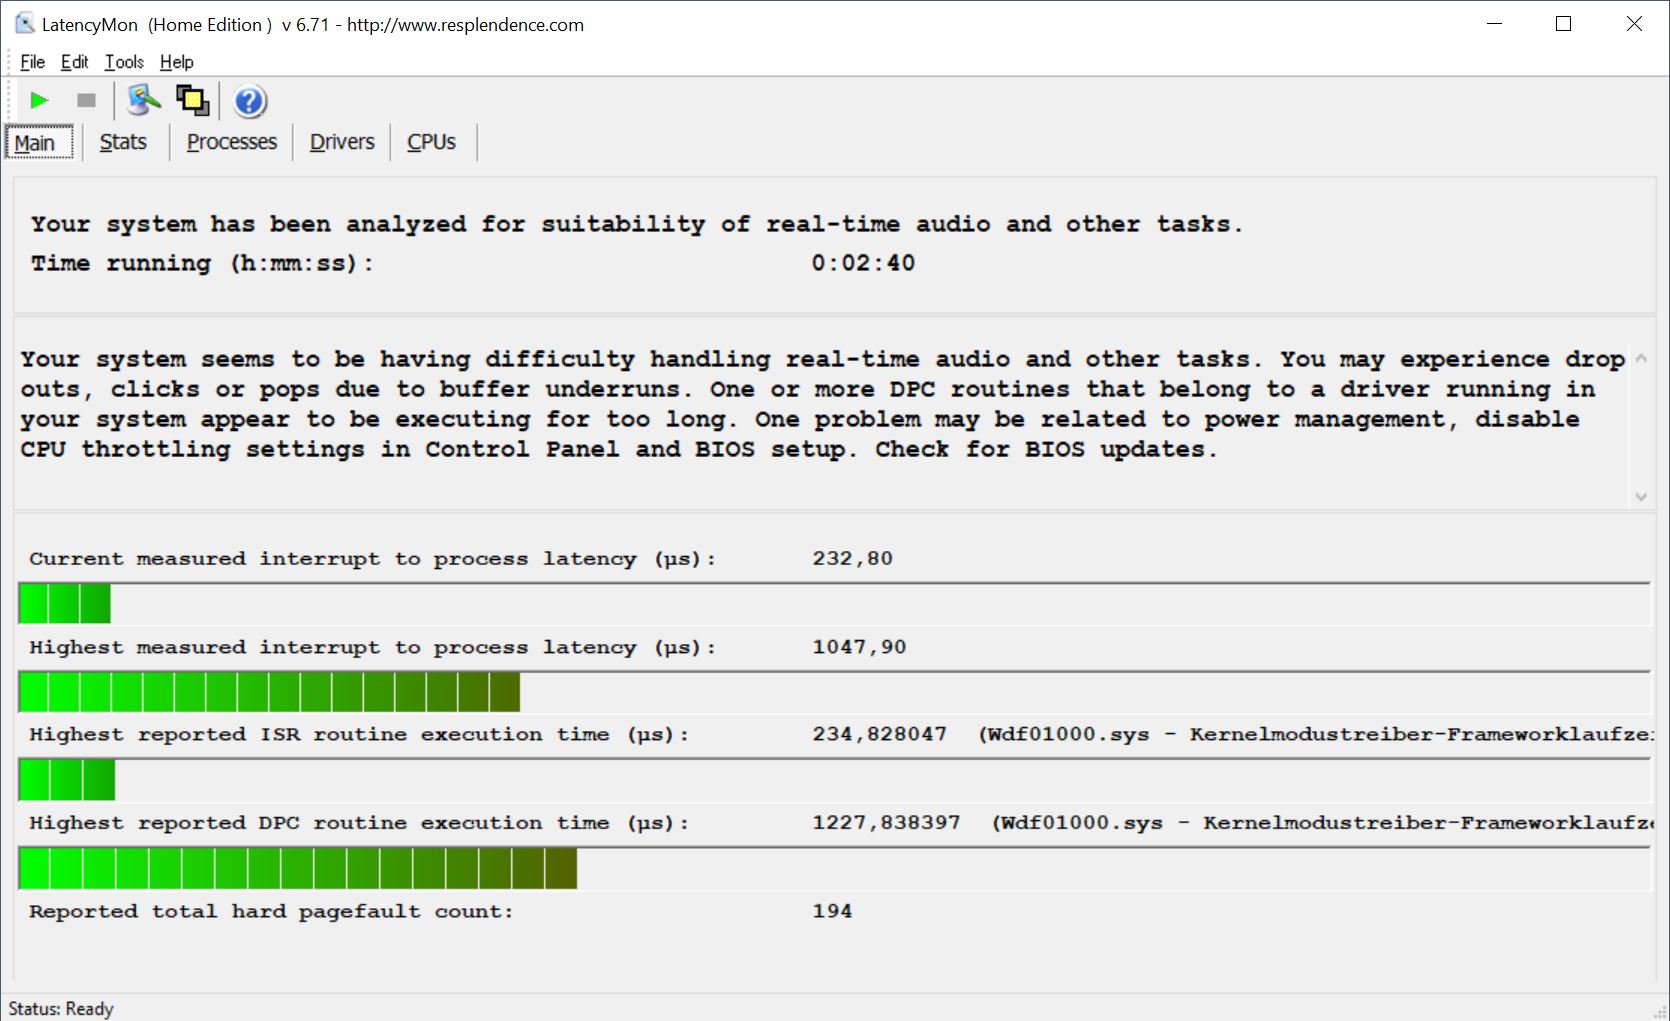
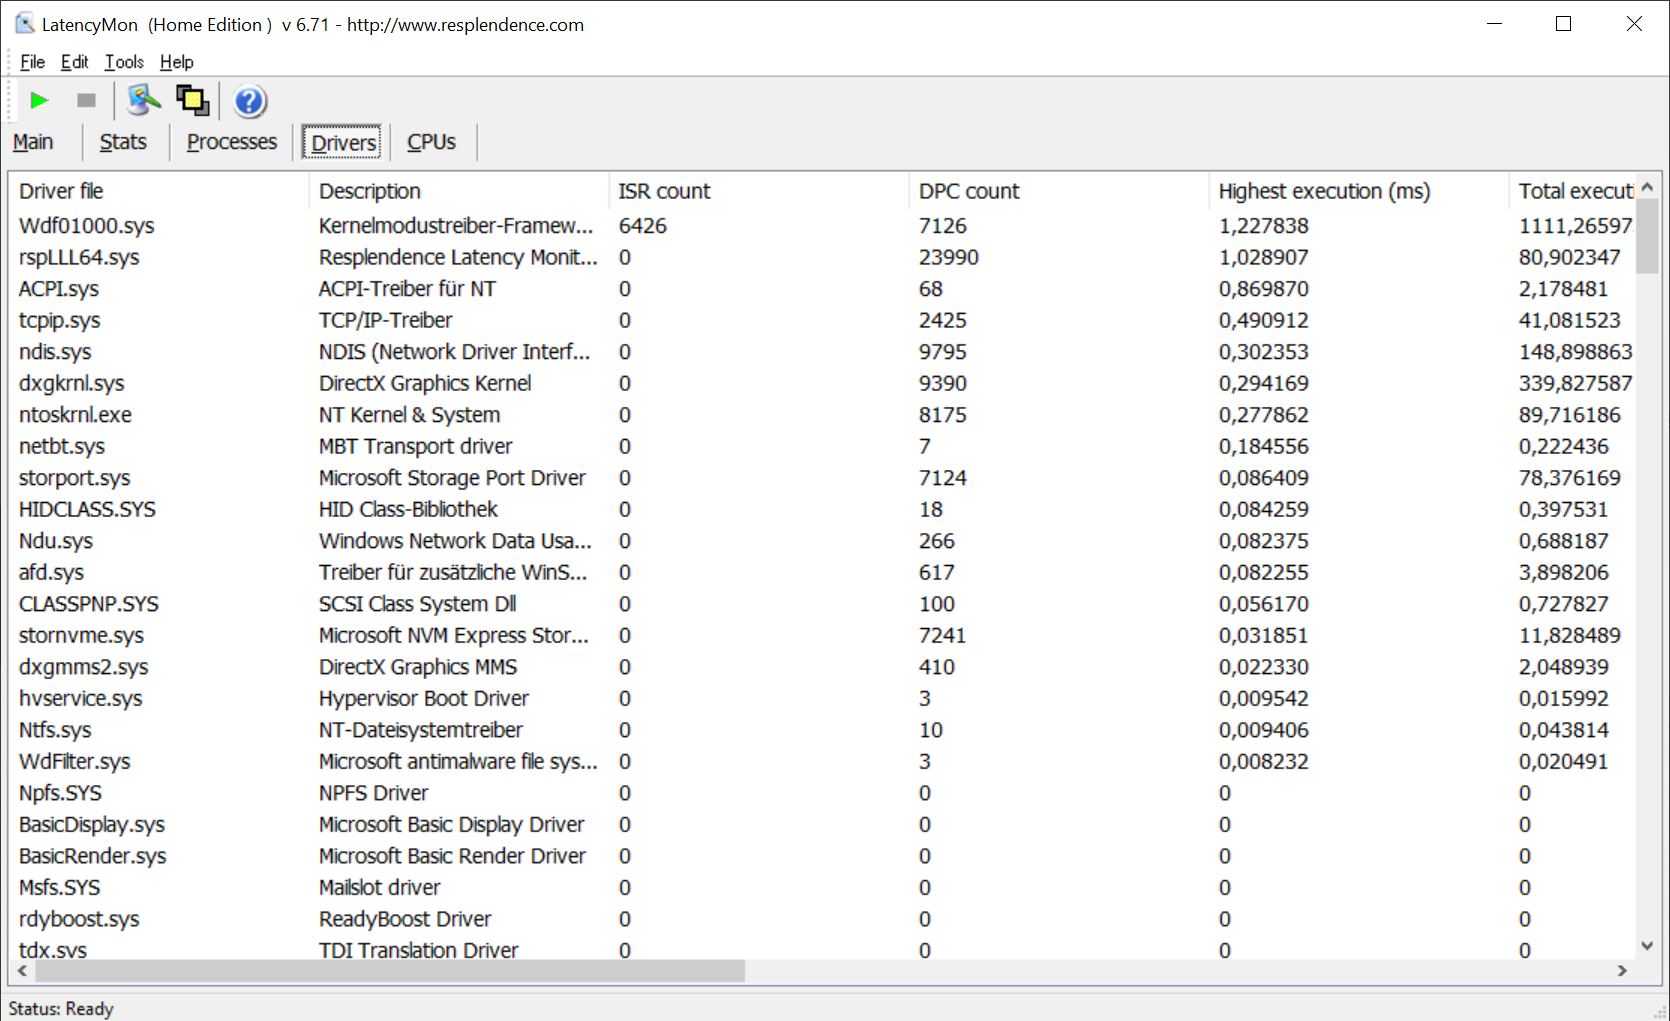
| DPC Latencies / LatencyMon - interrupt to process latency (max), Web, Youtube, Prime95 | |
| Dell XPS 13 9310 Core i7 4K | |
| Microsoft Surface Laptop 4 13 i7 | |
| Lenovo Yoga Slim 7i Carbon 13 ITL | |
* ... menor é melhor
Dispositivos de armazenamento
A Microsoft utiliza SSDs M.2-2230 compactos como no Surface Pro 7 Plus, que é anexado através da interface PCIe. Nosso modelo de teste foi equipado com um PM991 da Samsung e uma capacidade de armazenamento de 512 GB; 426 GB são gratuitos para o usuário após a configuração inicial. As taxas de transferência são apenas médias e os concorrentes utilizam drives mais rápidos, mas dificilmente você notará a diferença nos cenários cotidianos.
| Microsoft Surface Laptop 4 13 i7 Samsung PM991 MZ9LQ512HALU | Lenovo Yoga Slim 7i Carbon 13 ITL Samsung SSD PM981a MZVLB512HBJQ | Dell XPS 13 9310 Core i7 4K Micron 2300 512GB MTFDHBA512TDV | Microsoft Surface Laptop 3 13 Core i5-1035G7 SK hynix BC501 HFM256GDGTNG | Média Samsung PM991 MZ9LQ512HALU | Média da turma Subnotebook | |
|---|---|---|---|---|---|---|
| CrystalDiskMark 5.2 / 6 | 64% | 42% | -7% | 14% | 131% | |
| Write 4K (MB/s) | 118.2 | 139.5 18% | 86 -27% | 112.3 -5% | 130.2 ? 10% | 150.3 ? 27% |
| Read 4K (MB/s) | 37.54 | 36.38 -3% | 40.11 7% | 42.13 12% | 42 ? 12% | 63.8 ? 70% |
| Write Seq (MB/s) | 1017 | 1977 94% | 1738 71% | 630 -38% | 1063 ? 5% | 2795 ? 175% |
| Read Seq (MB/s) | 926 | 2207 138% | 1553 68% | 1023 10% | 1274 ? 38% | 3303 ? 257% |
| Write 4K Q32T1 (MB/s) | 354.2 | 510 44% | 454.9 28% | 336.6 -5% | 411 ? 16% | 433 ? 22% |
| Read 4K Q32T1 (MB/s) | 352.6 | 387.8 10% | 385.4 9% | 399.6 13% | 439 ? 25% | 498 ? 41% |
| Write Seq Q32T1 (MB/s) | 1174 | 2986 154% | 2784 137% | 821 -30% | 1189 ? 1% | 4677 ? 298% |
| Read Seq Q32T1 (MB/s) | 2261 | 3540 57% | 3217 42% | 2030 -10% | 2275 ? 1% | 5850 ? 159% |
| AS SSD | 63% | -21% | -45% | -8% | 71% | |
| Seq Read (MB/s) | 1821 | 2861 57% | 2144 18% | 1387 -24% | 1604 ? -12% | 4491 ? 147% |
| Seq Write (MB/s) | 794 | 1321 66% | 1389 75% | 504 -37% | 1014 ? 28% | 2933 ? 269% |
| 4K Read (MB/s) | 47.54 | 52.5 10% | 49.77 5% | 42.35 -11% | 44.4 ? -7% | 59 ? 24% |
| 4K Write (MB/s) | 141.6 | 196.7 39% | 105 -26% | 120 -15% | 134.8 ? -5% | 165.1 ? 17% |
| 4K-64 Read (MB/s) | 782 | 1153 47% | 855 9% | 497.4 -36% | 818 ? 5% | 854 ? 9% |
| 4K-64 Write (MB/s) | 766 | 1807 136% | 1660 117% | 354.9 -54% | 744 ? -3% | 1694 ? 121% |
| Access Time Read * (ms) | 0.191 | 0.064 66% | 0.058 70% | 0.055 71% | 0.1445 ? 24% | 0.06636 ? 65% |
| Access Time Write * (ms) | 0.027 | 0.018 33% | 0.272 -907% | 0.093 -244% | 0.061 ? -126% | 0.05079 ? -88% |
| Score Read (Points) | 1012 | 1491 47% | 1119 11% | 678 -33% | 1023 ? 1% | 1360 ? 34% |
| Score Write (Points) | 987 | 2136 116% | 1904 93% | 525 -47% | 980 ? -1% | 2153 ? 118% |
| Score Total (Points) | 2477 | 4322 74% | 3570 44% | 1520 -39% | 2507 ? 1% | 4146 ? 67% |
| Copy ISO MB/s (MB/s) | 1243 | 1929 55% | 764 -39% | 1264 ? 2% | 2564 ? 106% | |
| Copy Program MB/s (MB/s) | 628 | 1012 61% | 256.1 -59% | 515 ? -18% | 819 ? 30% | |
| Copy Game MB/s (MB/s) | 976 | 1737 78% | 368.4 -62% | 995 ? 2% | 1766 ? 81% | |
| Média Total (Programa/Configurações) | 64% /
63% | 11% /
2% | -26% /
-31% | 3% /
-0% | 101% /
93% |
* ... menor é melhor

Disk Throttling: DiskSpd Read Loop, Queue Depth 8
Desempenho da GPU
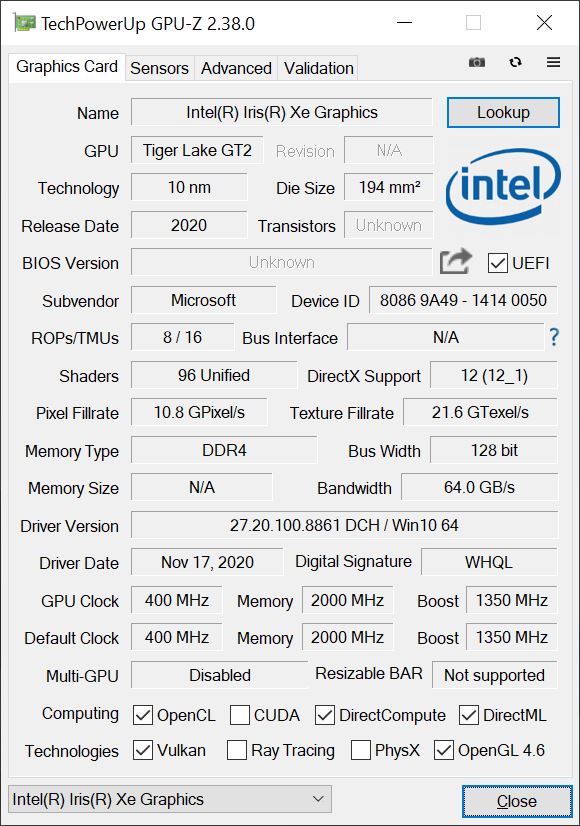
OCore i7-1185G7está equipada com a versão mais potente deG7 da Intel Xe Graphics(96 EUs). Tem um relógio um pouco mais alto de 1350 MHz e é muito mais rápido do que o antigoUHD Graphics. Dependendo do benchmark, o novo Laptop 4 de superfície é entre 60-100% mais rápido do que o modelo anterior. A GPU integrada é uma boa solução para cargas de trabalho comuns, incluindo reprodução de vídeo de alta resolução e a eficiência durante a reprodução de vídeo foi melhorada ainda mais com esta geração
O desempenho gráfico não é completamente estável; o teste de estresse 3DMark Fire Strike não é aprovado em 94,4%, mas este déficit pode ser ignorado mesmo em sessões de jogo mais longas. A GPU tem desempenho semelhante com a energia da bateria.
| 3DMark 11 Performance | 7364 pontos | |
| 3DMark Cloud Gate Standard Score | 20740 pontos | |
| 3DMark Fire Strike Score | 5010 pontos | |
| 3DMark Time Spy Score | 1776 pontos | |
Ajuda | ||
Desempenho nos jogos
Apesar do maior desempenho do iGPU, o Laptop de Superfície 4 é adequado apenas para azulejos mais antigos ou menos exigentes. Os jogos modernos muitas vezes exigirão reduções substanciais em termos de resolução e/ou ajustes. Mais jogos de referência com o Xe Graphics G7 estão disponíveis aqui.
| baixo | média | alto | ultra | |
|---|---|---|---|---|
| The Witcher 3 (2015) | 95 | 61 | 33 | 16 |
| Dota 2 Reborn (2015) | 83 | 56.9 | 37.7 | 37.4 |
| X-Plane 11.11 (2018) | 24.8 | 34.1 | 31.3 |
Emissions & Energy
Ruído do sistema
O aumento do desempenho também afeta o ruído do ventilador. O nível máximo de ruído de cerca de 40 dB(A) é comparável ao modelo anterior, mas o ventilador atinge este nível mais rapidamente com cargas de trabalho moderadas em comparação com o modelo anterior. O ventilador ainda está ocioso muitas vezes quando você faz coisas diárias e você pode reduzir o ruído do ventilador com o controle deslizante de desempenho do Windows quando você não precisa do desempenho total. Ainda assim, a velocidade do ventilador não é alta ou irritante mesmo na velocidade máxima e não notamos nenhum som eletrônico como lamentação da bobina.
Barulho
| Ocioso |
| 24.2 / 24.2 / 24.2 dB |
| Carga |
| 39.5 / 39.5 dB |
 | ||
30 dB silencioso 40 dB(A) audível 50 dB(A) ruidosamente alto |
||
min: | ||
| Microsoft Surface Laptop 4 13 i7 Iris Xe G7 96EUs, i7-1185G7, Samsung PM991 MZ9LQ512HALU | Lenovo Yoga Slim 7i Carbon 13 ITL Iris Xe G7 96EUs, i7-1165G7, Samsung SSD PM981a MZVLB512HBJQ | Dell XPS 13 9310 Core i7 4K Iris Xe G7 96EUs, i7-1185G7, Micron 2300 512GB MTFDHBA512TDV | Apple MacBook Pro 13 Late 2020 M1 Entry (8 / 256 GB) M1 8-Core GPU, M1, Apple SSD AP0256 | Microsoft Surface Laptop 3 13 Core i5-1035G7 Iris Plus Graphics G7 (Ice Lake 64 EU), i5-1035G7, SK hynix BC501 HFM256GDGTNG | |
|---|---|---|---|---|---|
| Noise | -12% | -4% | -12% | -8% | |
| desligado / ambiente * (dB) | 24.2 | 28.7 -19% | 27.7 -14% | 29.2 -21% | 28.5 -18% |
| Idle Minimum * (dB) | 24.2 | 28.7 -19% | 27.8 -15% | 29.2 -21% | 28.5 -18% |
| Idle Average * (dB) | 24.2 | 28.7 -19% | 27.8 -15% | 29.2 -21% | 28.5 -18% |
| Idle Maximum * (dB) | 24.2 | 30.6 -26% | 27.8 -15% | 29.2 -21% | 28.5 -18% |
| Load Average * (dB) | 39.5 | 37.3 6% | 27.9 29% | 32.1 19% | 28.5 28% |
| Load Maximum * (dB) | 39.5 | 37.3 6% | 37 6% | 41.9 -6% | 40.4 -2% |
| Witcher 3 ultra * (dB) | 37.3 | 32.8 | 40.4 |
* ... menor é melhor
Temperatura
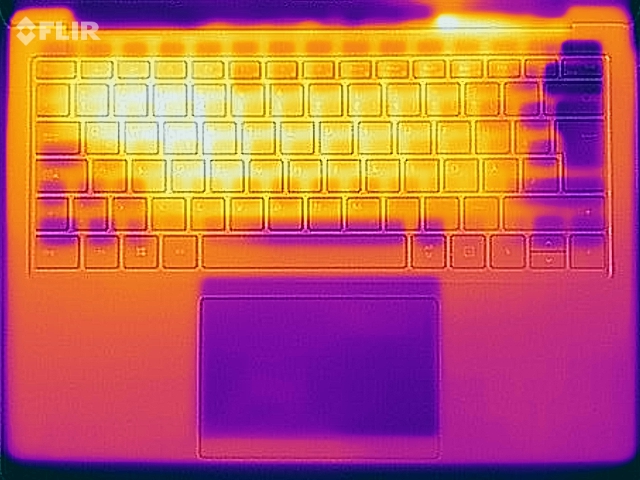
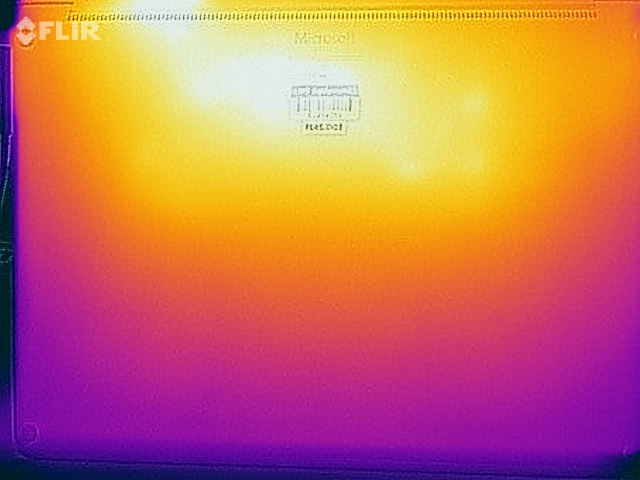
As superfícies metálicas do Laptop 4 de superfície ficam bem quentes sob carga e quase 47 °C é subjetivamente mais desconfortável no contato direto com a pele em comparação com as caixas plásticas. Você não deve colocá-lo no colo quando realmente o estressa, mas a baixa carga de trabalho (como navegação na web, reprodução de vídeo) não é problema algum.
Nosso teste de estresse com carga combinada CPU/GPU mostra que o processador consome quase 60W no início (apenas como lembrete, é uma CPU com um valor nominal de TDP de 15W), mas depois níveis de 30W e mais tarde de 23W (semelhante ao desempenho puro da CPU). A CPU e a GPU têm que compartilhar o TDP, de modo que a CPU só funciona a 1,6-1,7 GHz e o iGPU com 900 MHz.
(±) A temperatura máxima no lado superior é 44.6 °C / 112 F, em comparação com a média de 35.9 °C / 97 F , variando de 21.4 a 59 °C para a classe Subnotebook.
(-) A parte inferior aquece até um máximo de 46.9 °C / 116 F, em comparação com a média de 39.2 °C / 103 F
(+) Em uso inativo, a temperatura média para o lado superior é 23.5 °C / 74 F, em comparação com a média do dispositivo de 30.8 °C / ### class_avg_f### F.
(-) Jogando The Witcher 3, a temperatura média para o lado superior é 39.9 °C / 104 F, em comparação com a média do dispositivo de 30.8 °C / ## #class_avg_f### F.
(±) Os apoios para as mãos e o touchpad podem ficar muito quentes ao toque, com um máximo de 37.7 °C / 99.9 F.
(-) A temperatura média da área do apoio para as mãos de dispositivos semelhantes foi 28.2 °C / 82.8 F (-9.5 °C / -17.1 F).
Oradores
Os dois alto-falantes estéreo do Laptop Superficial ainda são muito bons. Como era de se esperar, não se obtém muito baixo, mas o som ainda é rico e os módulos também são barulhentos o suficiente para reuniões ou conferências. Eles também funcionam bem para reprodução de mídia; alto-falantes externos ou fones de ouvido soam melhor, mas não são realmente necessários.
Microsoft Surface Laptop 4 13 i7 análise de áudio
(±) | o volume do alto-falante é médio, mas bom (###valor### dB)
Graves 100 - 315Hz
(±) | graves reduzidos - em média 10.5% menor que a mediana
(±) | a linearidade dos graves é média (7.9% delta para a frequência anterior)
Médios 400 - 2.000 Hz
(+) | médios equilibrados - apenas 2.7% longe da mediana
(+) | médios são lineares (3.5% delta para frequência anterior)
Altos 2 - 16 kHz
(+) | agudos equilibrados - apenas 3.2% longe da mediana
(+) | os máximos são lineares (5.8% delta da frequência anterior)
Geral 100 - 16.000 Hz
(+) | o som geral é linear (12.2% diferença em relação à mediana)
Comparado com a mesma classe
» 15% de todos os dispositivos testados nesta classe foram melhores, 5% semelhantes, 80% piores
» O melhor teve um delta de 5%, a média foi 18%, o pior foi 53%
Comparado com todos os dispositivos testados
» 10% de todos os dispositivos testados foram melhores, 2% semelhantes, 88% piores
» O melhor teve um delta de 4%, a média foi 23%, o pior foi 134%
Apple MacBook Pro 13 Late 2020 M1 Entry (8 / 256 GB) análise de áudio
(±) | o volume do alto-falante é médio, mas bom (###valor### dB)
Graves 100 - 315Hz
(±) | graves reduzidos - em média 8.7% menor que a mediana
(±) | a linearidade dos graves é média (8.6% delta para a frequência anterior)
Médios 400 - 2.000 Hz
(+) | médios equilibrados - apenas 4.2% longe da mediana
(+) | médios são lineares (4.2% delta para frequência anterior)
Altos 2 - 16 kHz
(+) | agudos equilibrados - apenas 1.2% longe da mediana
(+) | os máximos são lineares (4% delta da frequência anterior)
Geral 100 - 16.000 Hz
(+) | o som geral é linear (12.9% diferença em relação à mediana)
Comparado com a mesma classe
» 20% de todos os dispositivos testados nesta classe foram melhores, 5% semelhantes, 75% piores
» O melhor teve um delta de 5%, a média foi 18%, o pior foi 53%
Comparado com todos os dispositivos testados
» 12% de todos os dispositivos testados foram melhores, 3% semelhantes, 85% piores
» O melhor teve um delta de 4%, a média foi 23%, o pior foi 134%
Consumo de energia
Nossas medidas de consumo são bastante discretas. Como sempre, você deve evitar o nível mais alto de iluminação do teclado na energia da bateria, pois ela irá drenar a bateria desnecessariamente. O consumo no teste de estresse é de 65W por um curto período, mas rapidamente se eleva a 47W (30W TDP) ou 38W (23W TDP), respectivamente. O adaptador de energia de 65W é, portanto, completamente suficiente. O adaptador de energia também oferece uma porta USB-A adicional (até 5W), onde você pode carregar outros dispositivos como um smartphone.
| desligado | |
| Ocioso | |
| Carga |
|
Key:
min: | |
Tempo de uso da bateria
A Microsoft aumentou ligeiramente a capacidade da bateria de 45 para 47,7 Wh, mas o tempo de execução no teste Wi-Fi ainda é um pouco menor devido aos componentes mais potentes. Determinamos um tempo de funcionamento de cerca de 7,5 horas a 150 lêndeas e apenas ~6 horas com o brilho máximo. Somente o modelo 4K doDell XPS 13 9310é vencido, todos os outros rivais têm mais resistência, e a vantagem doMacBook Pro 13é maciço, porque consegue cerca de 20 horas (e ainda ~10 horas no brilho máximo).
Pro
Contra
Veredicto - Microsoft fica para trás
O laptop de superfície 4 13.5 com o processador Intel é basicamente apenas uma pequena atualização com um processador novo e mais rápido, mas a maior vantagem é a GPU integrada mais eficiente e mais rápida. Tudo o resto é praticamente o mesmo
Ainda gostamos do chassi robusto e a tela tátil 3:2 também cria uma boa imagem, mas ela se beneficiaria de uma luz de fundo mais potente em ambientes mais brilhantes. Os alto-falantes também são bons, mas a conectividade e a duração da bateria são dois aspectos em que o dispositivo ficou atrás da concorrência
Apesar do novo processador, o Surface Laptop 4 13.5 parece bastante ultrapassado e a Microsoft deve considerar uma grande atualização. A relação preço-desempenho é bastante ruim e não é fácil recomendar o laptop. Também não entendemos as limitações das configurações
O Laptop de Superfície 4 13.5 dificilmente é uma barganha e 1849 euros para nossa unidade de teste é um preço íngreme. Claro, um equipamento similarMacBook Pro 13com 16 GB de RAM e 512 GB de armazenamento SSD é até um pouco mais caro, mas é definitivamente o melhor produto com mais desempenho, portas modernas, uma melhor exibição e, especialmente, muito mais resistência.
Preço e Disponibilidade
Nosso modelo de teste do laptop de superfície 4 13,5 está disponível em Amazon por $1699.
Microsoft Surface Laptop 4 13 i7
- 05/11/2021 v7 (old)
Andreas Osthoff
Price comparison

