2022 Dell XPS 15 9520 3,5K OLED revisão portátil: Ignorar ou comprar?
A Dell iniciou a década com um estrondo ao introduzir o XPS 15 9500 totalmente renovado para suceder à geração mais antiga Série XPS 15 7590. O modelo mudou a família XPS 15 de 16:9 para 16:10 ao lado de um novo design de chassi com CPUs Intel Comet Lake-H de 10ª geração e a GPU GeForce GTX 1650 Ti. O XPS 15 9510 levou-o um passo adiante com as CPUs da 11ª geração Tiger Lake-H e os painéis OLED 3,5K opcionais. Agora, o XPS 15 9520 é mais uma atualização incremental com CPUs Alder Lake-H do 12º gênero e RAM DDR5 mais rápida.
Recomendamos que se verifique nossa revisão existente sobre o XPS 15 9500 pois o chassi do XPS 15 9520 permanece idêntico. Esta página de revisão focalizará o desempenho do XPS 15 9520 e outras diferenças que os usuários podem esperar quando comparado aos modelos anteriores.
As alternativas ao Dell XPS 15 9520 incluem outros laptops multimídia de 15,6 polegadas de última geração com gráficos discretos como o Asus Zenbook Pro 15 OLED, Criador da Lenovo Yoga 7 15, HP Spectre x360 15, HP Envy 15ou o MSI Creator 15.
Mais análises da Dell:
Possíveis concorrentes em comparação
Avaliação | Data | Modelo | Peso | Altura | Size | Resolução | Preço |
|---|---|---|---|---|---|---|---|
| 89.5 % v7 (old) | 05/2022 | Dell XPS 15 9520 RTX 3050 Ti i7-12700H, GeForce RTX 3050 Ti Laptop GPU | 1.9 kg | 18 mm | 15.60" | 3456x2160 | |
| 88.4 % v7 (old) | 08/2021 | Dell XPS 15 9510 11800H RTX 3050 Ti OLED i7-11800H, GeForce RTX 3050 Ti Laptop GPU | 1.9 kg | 18 mm | 15.60" | 3456x2160 | |
| 85 % v7 (old) | 01/2020 | HP Spectre X360 15-5ZV31AV i7-10510U, GeForce MX250 | 2.1 kg | 19.3 mm | 15.60" | 3840x2160 | |
| 87.7 % v7 (old) | 05/2022 | Asus Zenbook Pro 15 OLED UM535Q R9 5900HX, GeForce RTX 3050 Ti Laptop GPU | 1.9 kg | 18 mm | 15.60" | 1920x1080 | |
| 82.4 % v7 (old) | 02/2021 | MSI Stealth 15M A11SEK i7-1185G7, GeForce RTX 2060 Max-Q | 1.7 kg | 16.15 mm | 15.60" | 1920x1080 | |
| 93.2 % v7 (old) | 11/2021 | Apple MacBook Pro 16 2021 M1 Pro M1 Pro, M1 Pro 16-Core GPU | 2.2 kg | 16.8 mm | 16.20" | 3456x2234 |
Caso
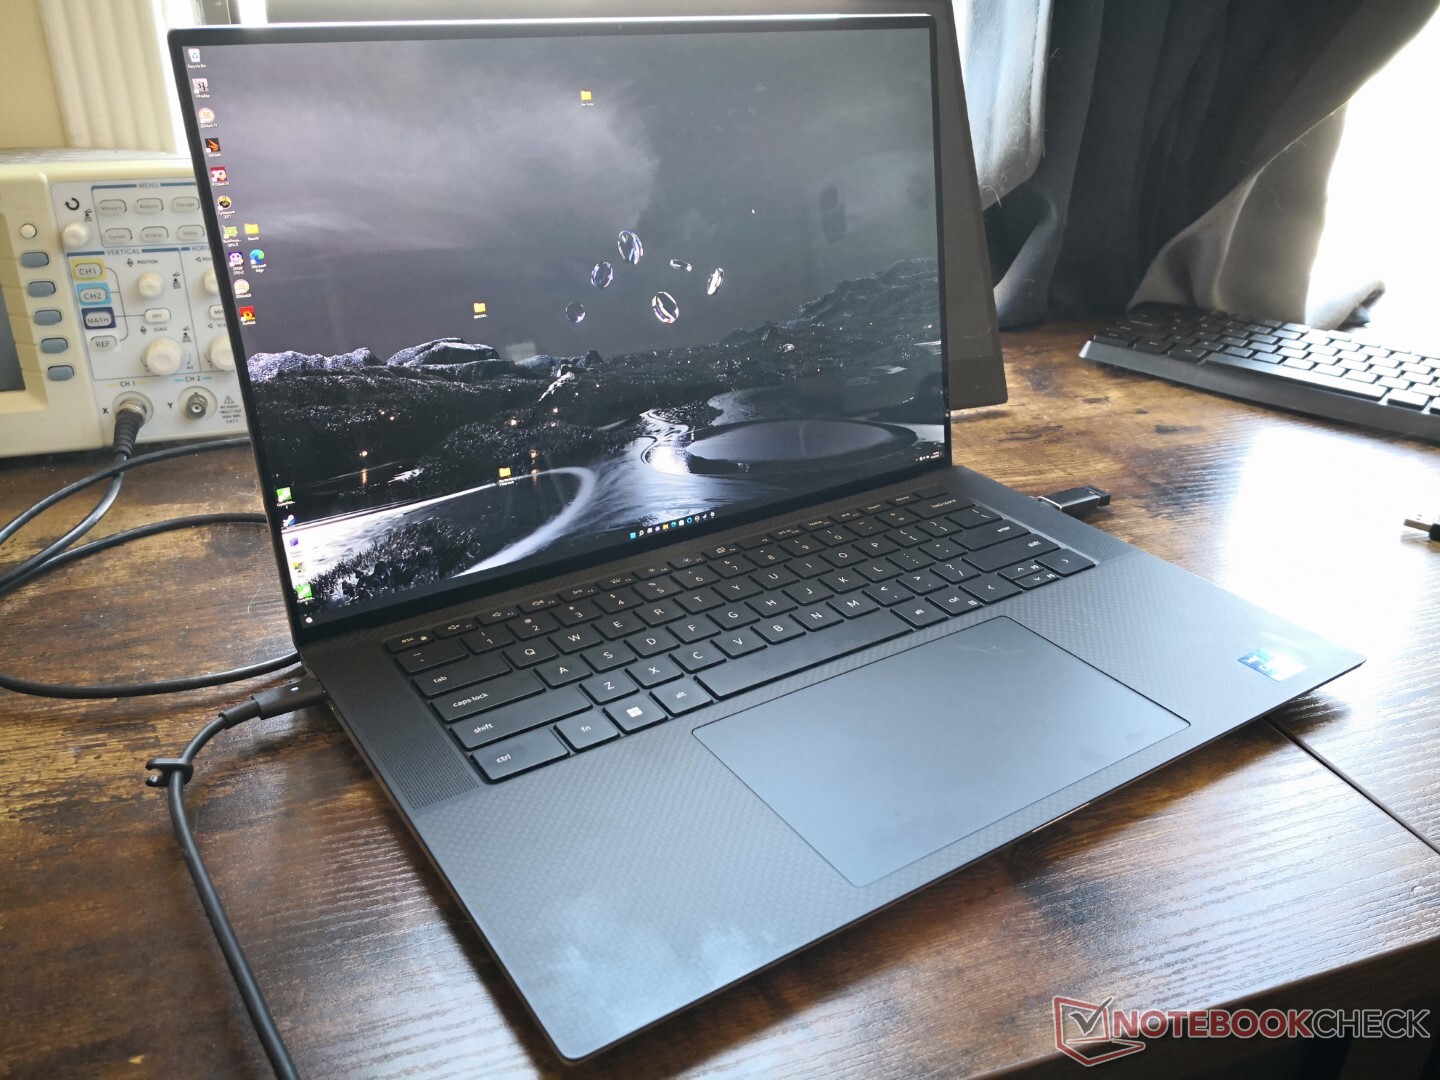
O chassi XPS 15 9520 ainda é um dos menores projetos em sua categoria de tamanho, apesar de ter dois anos de idade. As luneiras muito estreitas em todos os quatro lados, incluindo o queixo, ajudam a reduzir a pegada por margens maiores do que as do Zenbook Pro 15 ou Spectre x360 15.
Leitor de cartões SD
| SD Card Reader | |
| average JPG Copy Test (av. of 3 runs) | |
| Dell XPS 15 9510 11800H RTX 3050 Ti OLED (AV Pro V60) | |
| Dell XPS 15 9500 Core i7 4K UHD (Toshiba Exceria Pro SDXC 64 GB UHS-II) | |
| MSI Stealth 15M A11SEK (Toshiba Exceria Pro M501 microSDXC 32GB) | |
| Dell XPS 15 9520 RTX 3050 Ti (Toshiba Exceria Pro SDXC 64 GB UHS-II) | |
| HP Spectre X360 15-5ZV31AV (Toshiba Exceria Pro M501 UHS-II) | |
| Asus Zenbook Pro 15 OLED UM535Q (Toshiba Exceria Pro SDXC 64 GB UHS-II) | |
| maximum AS SSD Seq Read Test (1GB) | |
| MSI Stealth 15M A11SEK (Toshiba Exceria Pro M501 microSDXC 32GB) | |
| Dell XPS 15 9510 11800H RTX 3050 Ti OLED (AV Pro V60) | |
| Dell XPS 15 9500 Core i7 4K UHD (Toshiba Exceria Pro SDXC 64 GB UHS-II) | |
| HP Spectre X360 15-5ZV31AV (Toshiba Exceria Pro M501 UHS-II) | |
| Dell XPS 15 9520 RTX 3050 Ti (Toshiba Exceria Pro SDXC 64 GB UHS-II) | |
| Asus Zenbook Pro 15 OLED UM535Q (Toshiba Exceria Pro SDXC 64 GB UHS-II) | |
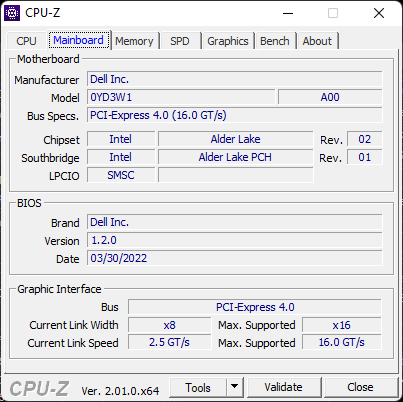
Comunicação
Um Intel AX211 vem como padrão para conectividade Wi-Fi 6E e Bluetooth 5.2. No entanto, a Dell confirmou conosco que o XPS 15 9520 não foi projetado para suportar redes Wi-Fi 6E de 6 GHz apesar do fato de que o chip AX211 pode. Assim, os proprietários do XPS 15 9520 só poderão se conectar a redes de 2,4 GHz e 5 GHz até Wi-Fi 6.
| Networking | |
| iperf3 transmit AX12 | |
| Dell XPS 15 9510 11800H RTX 3050 Ti OLED | |
| Dell XPS 15 9500 Core i7 4K UHD | |
| MSI Stealth 15M A11SEK | |
| Asus Zenbook Pro 15 OLED UM535Q | |
| iperf3 receive AX12 | |
| Dell XPS 15 9500 Core i7 4K UHD | |
| Dell XPS 15 9510 11800H RTX 3050 Ti OLED | |
| MSI Stealth 15M A11SEK | |
| Asus Zenbook Pro 15 OLED UM535Q | |
| iperf3 receive AXE11000 | |
| Dell XPS 15 9520 RTX 3050 Ti | |
| iperf3 transmit AXE11000 | |
| Dell XPS 15 9520 RTX 3050 Ti | |
Webcam
A Dell melhorou as cores da webcam ao separar os sensores IR e RGB quando comparados com os XPS 15 9510 ou 9500. No entanto, ela permanece apenas 1 MP, comparado a 2 MP em outros laptops de 15,6 polegadas, como o Lâmina Razer 15. Assim, embora as cores possam ser um pouco melhores, o quadro ainda é lamacento.


Manutenção
Acessórios e Garantia
A caixa de varejo inclui o adaptador USB-C AC, papelada e um USB-C para HDMI e adaptador USB-A em tamanho real. Este último é particularmente útil, pois o sistema integra apenas portas USB-C.
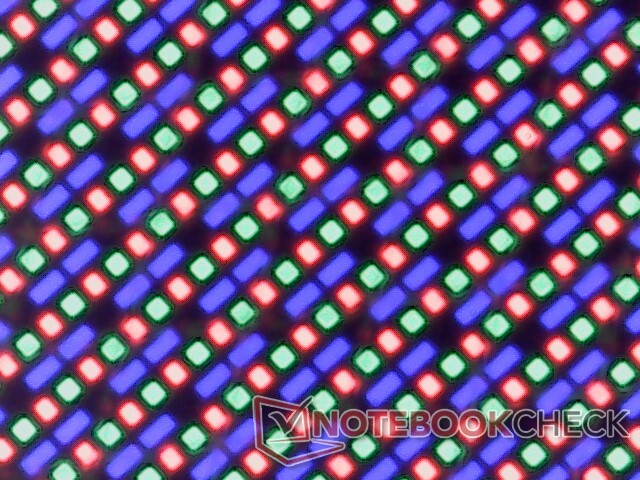
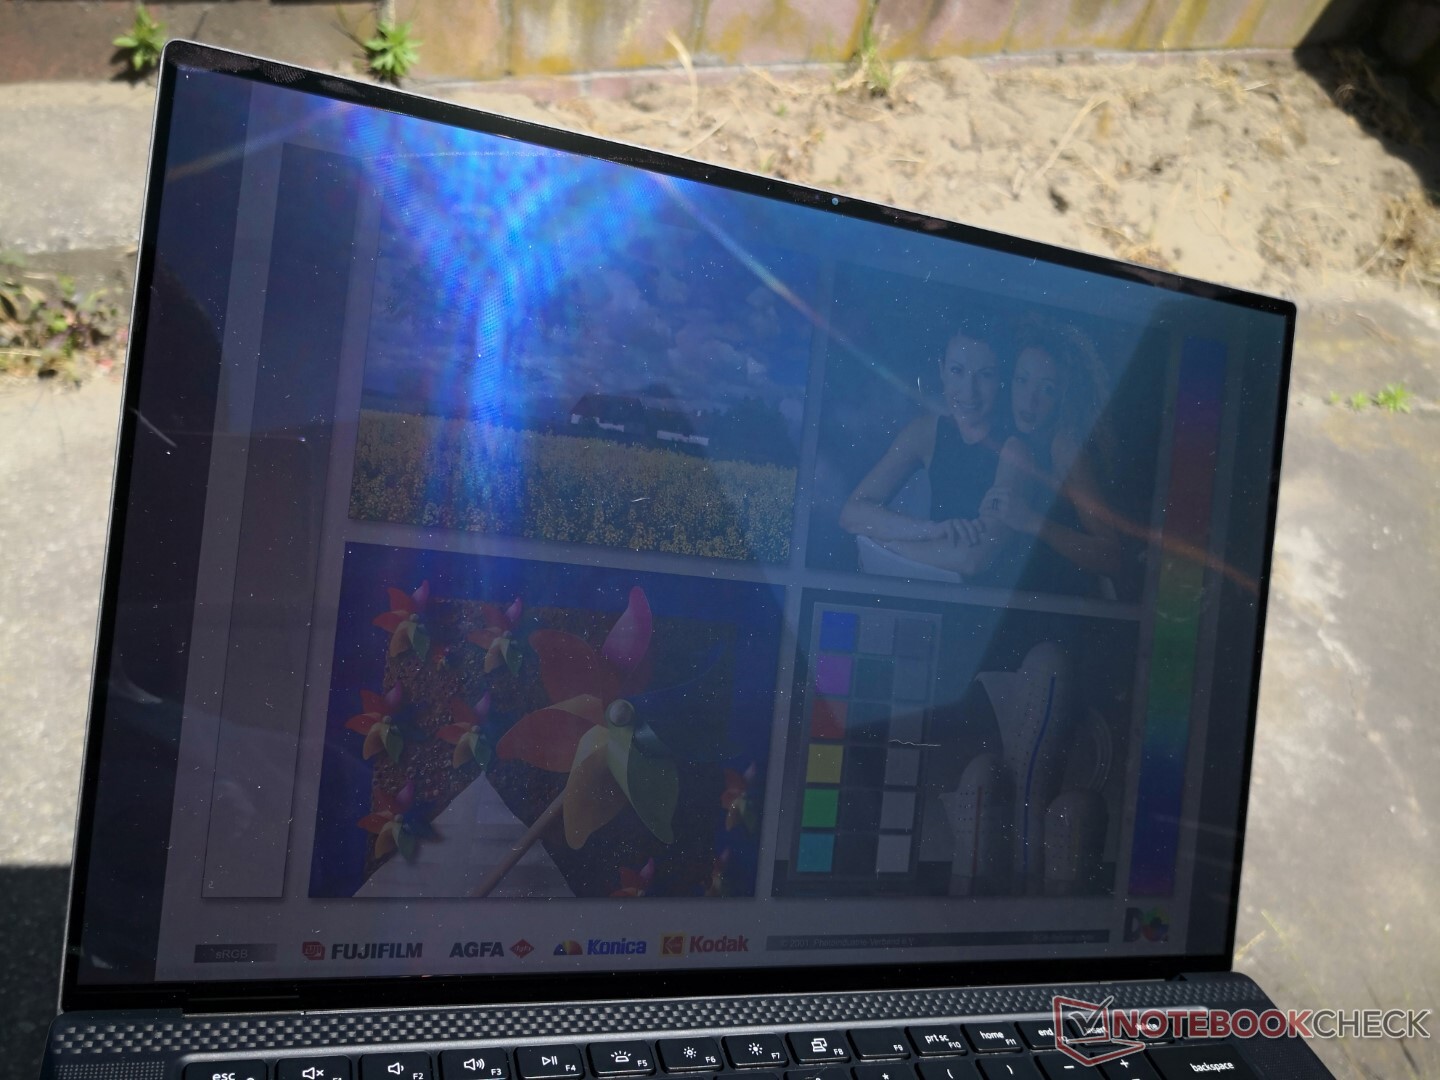
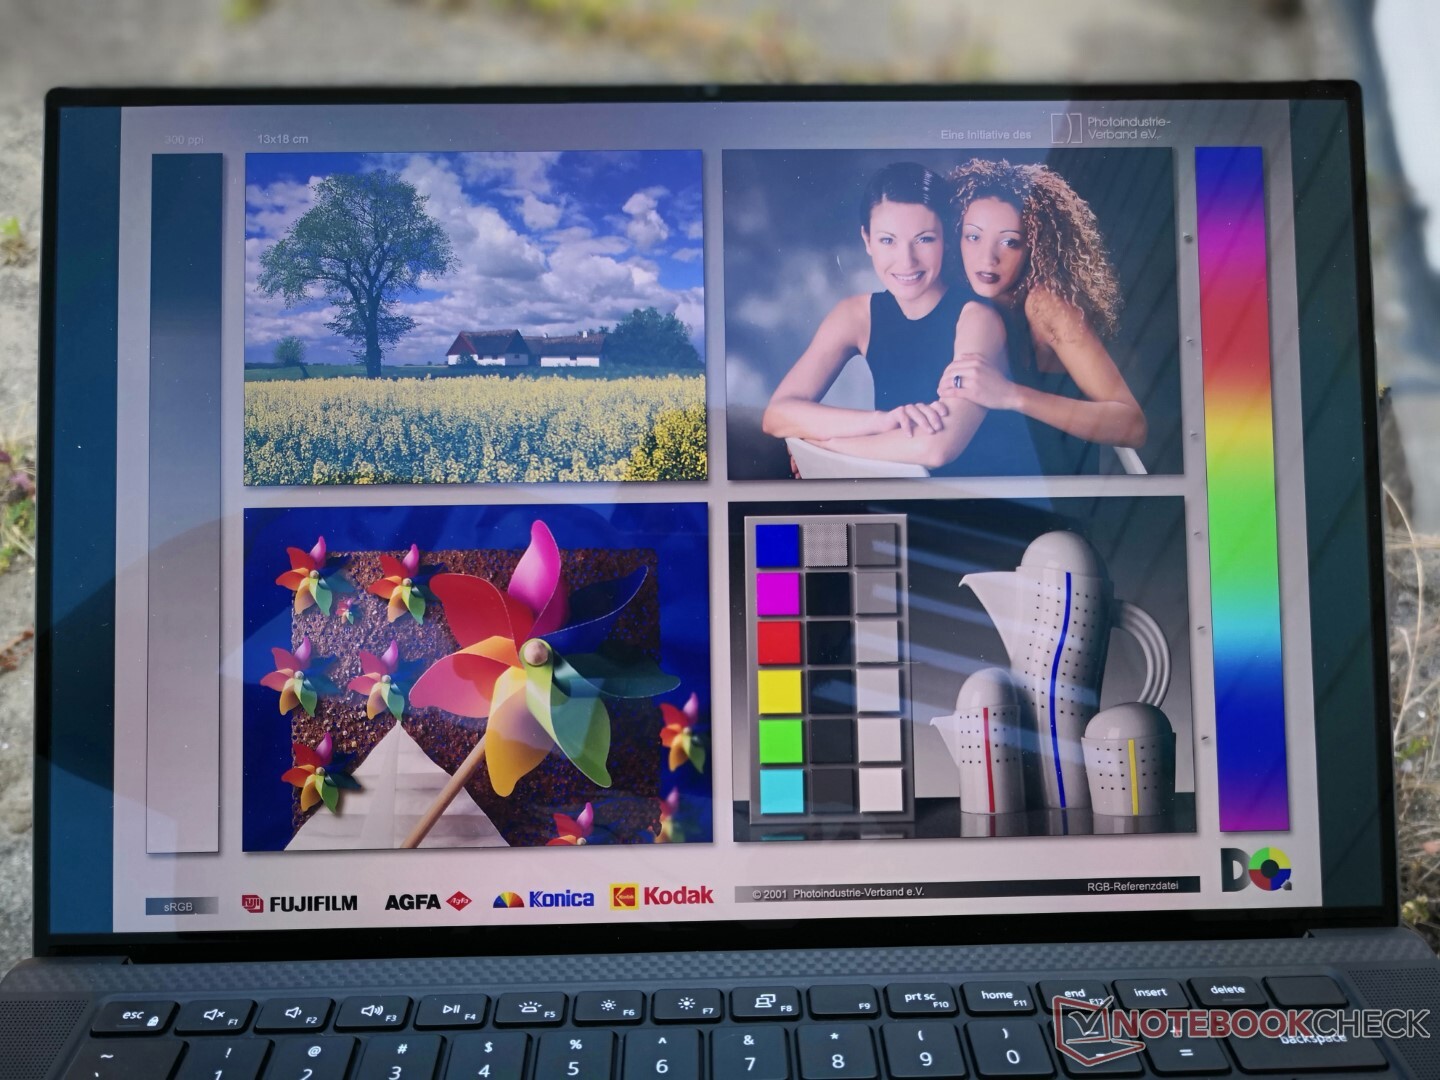
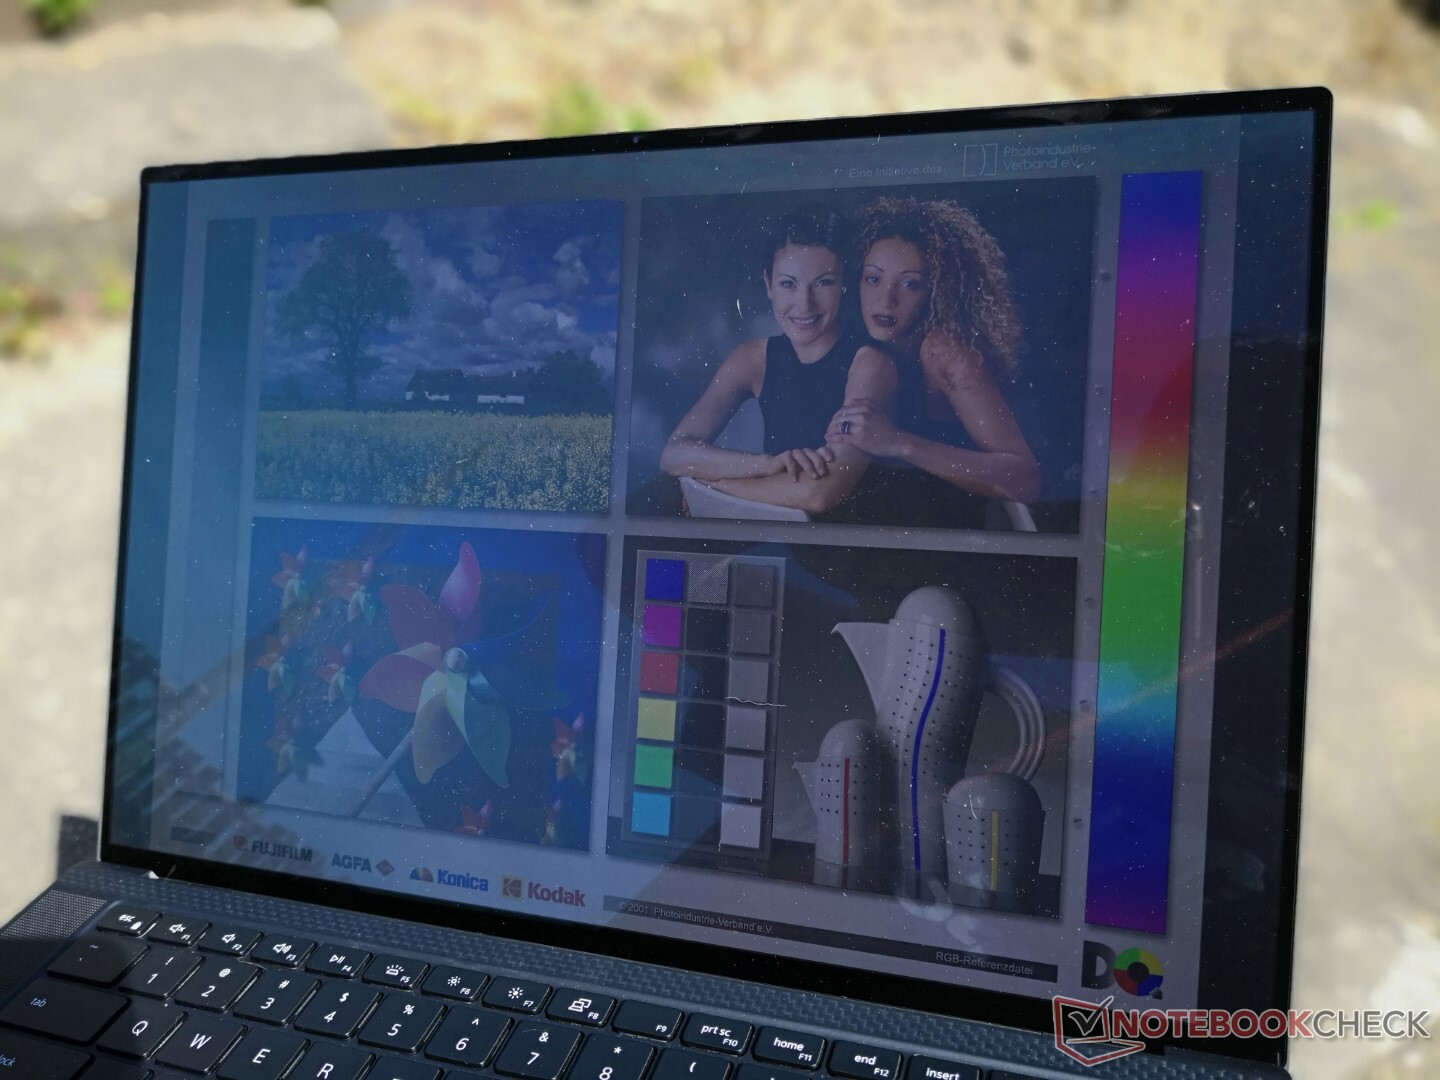
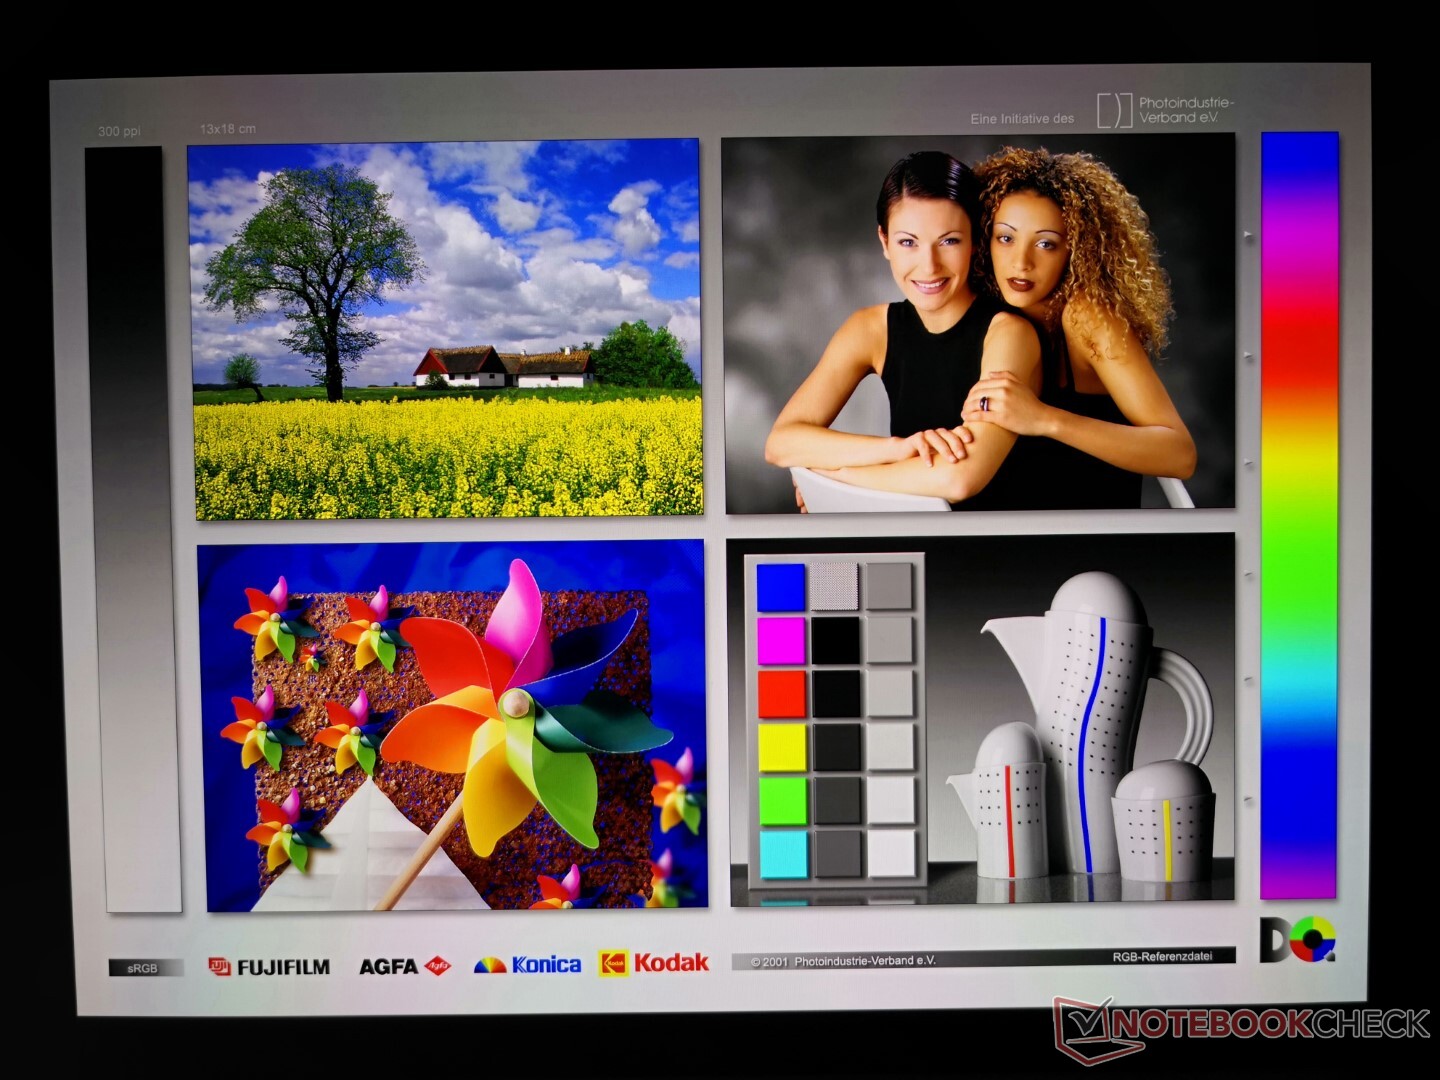
Mostrador - Uncomum 3,5K OLED
Nossa unidade de revisão vem com a mesma tela tátil OLED 3,5K que estava disponível no XPS 15 9510 do ano passado, o que significa que a experiência visual não mudou de ano para ano. Uma opção IPS de baixa resolução 1920 x 1200 e uma opção IPS de alta resolução 3840 x 2400 também estão disponíveis, mas infelizmente todos os painéis estão limitados a uma taxa de atualização de 60 Hz. Alguns Ultrabooks como o Lenovo IdeaPad Slim 7i Pro ou Asus Vivobook Pro 14 já estão sendo enviados com painéis mais rápidos de 90 Hz para uma experiência de IU visivelmente mais suave.
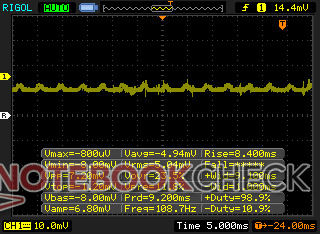
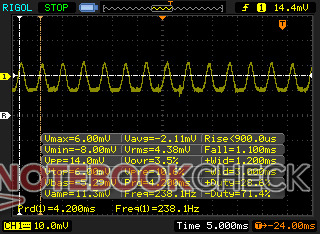
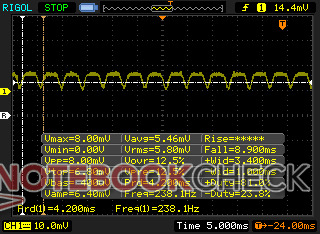
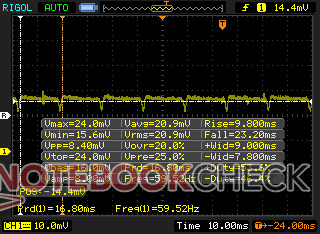
Tenha em mente que a modulação da largura de pulso está presente em todo o brilho a 238 Hz de 0 a 25% de brilho e 59 Hz de 26% a 100% de brilho. Se a cintilação da tela for um problema, então recomendamos a configuração com IPS.
| |||||||||||||||||||||||||
iluminação: 95 %
iluminação com acumulador: 381.4 cd/m²
Contraste: ∞:1 (Preto: 0 cd/m²)
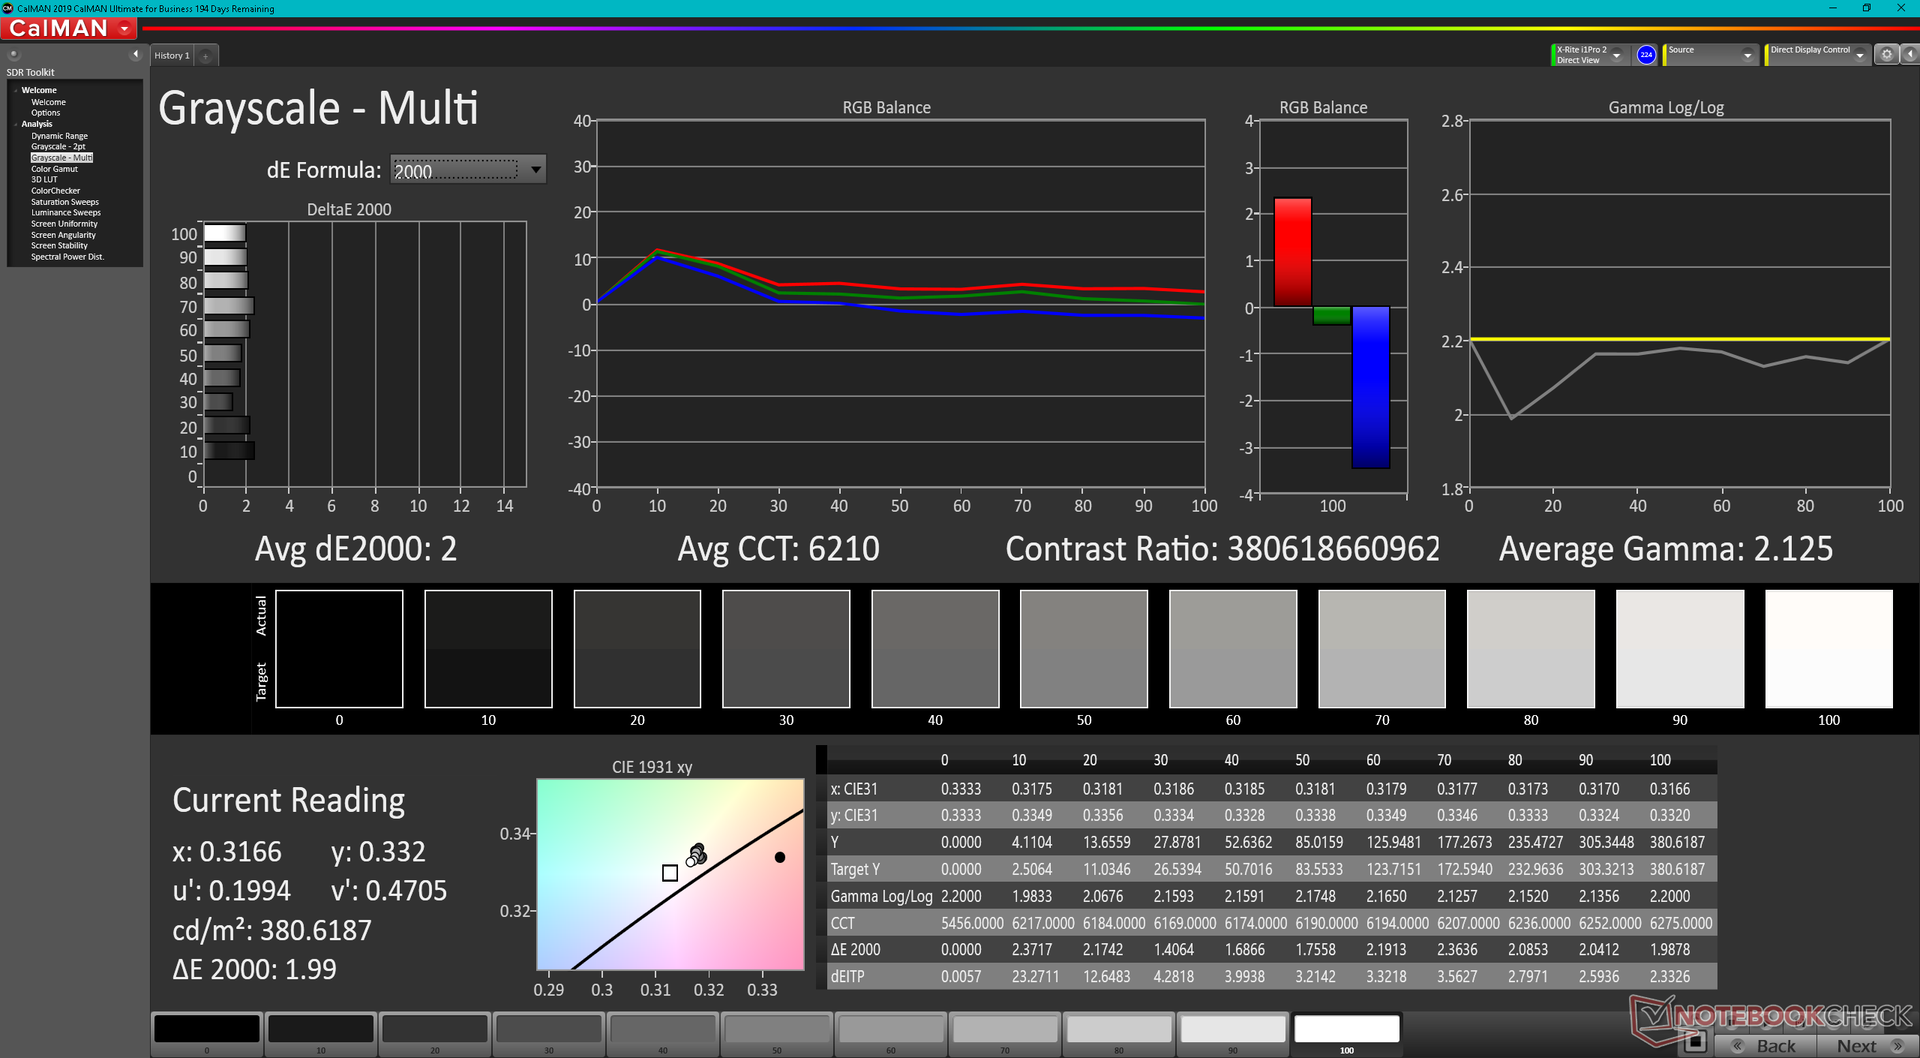
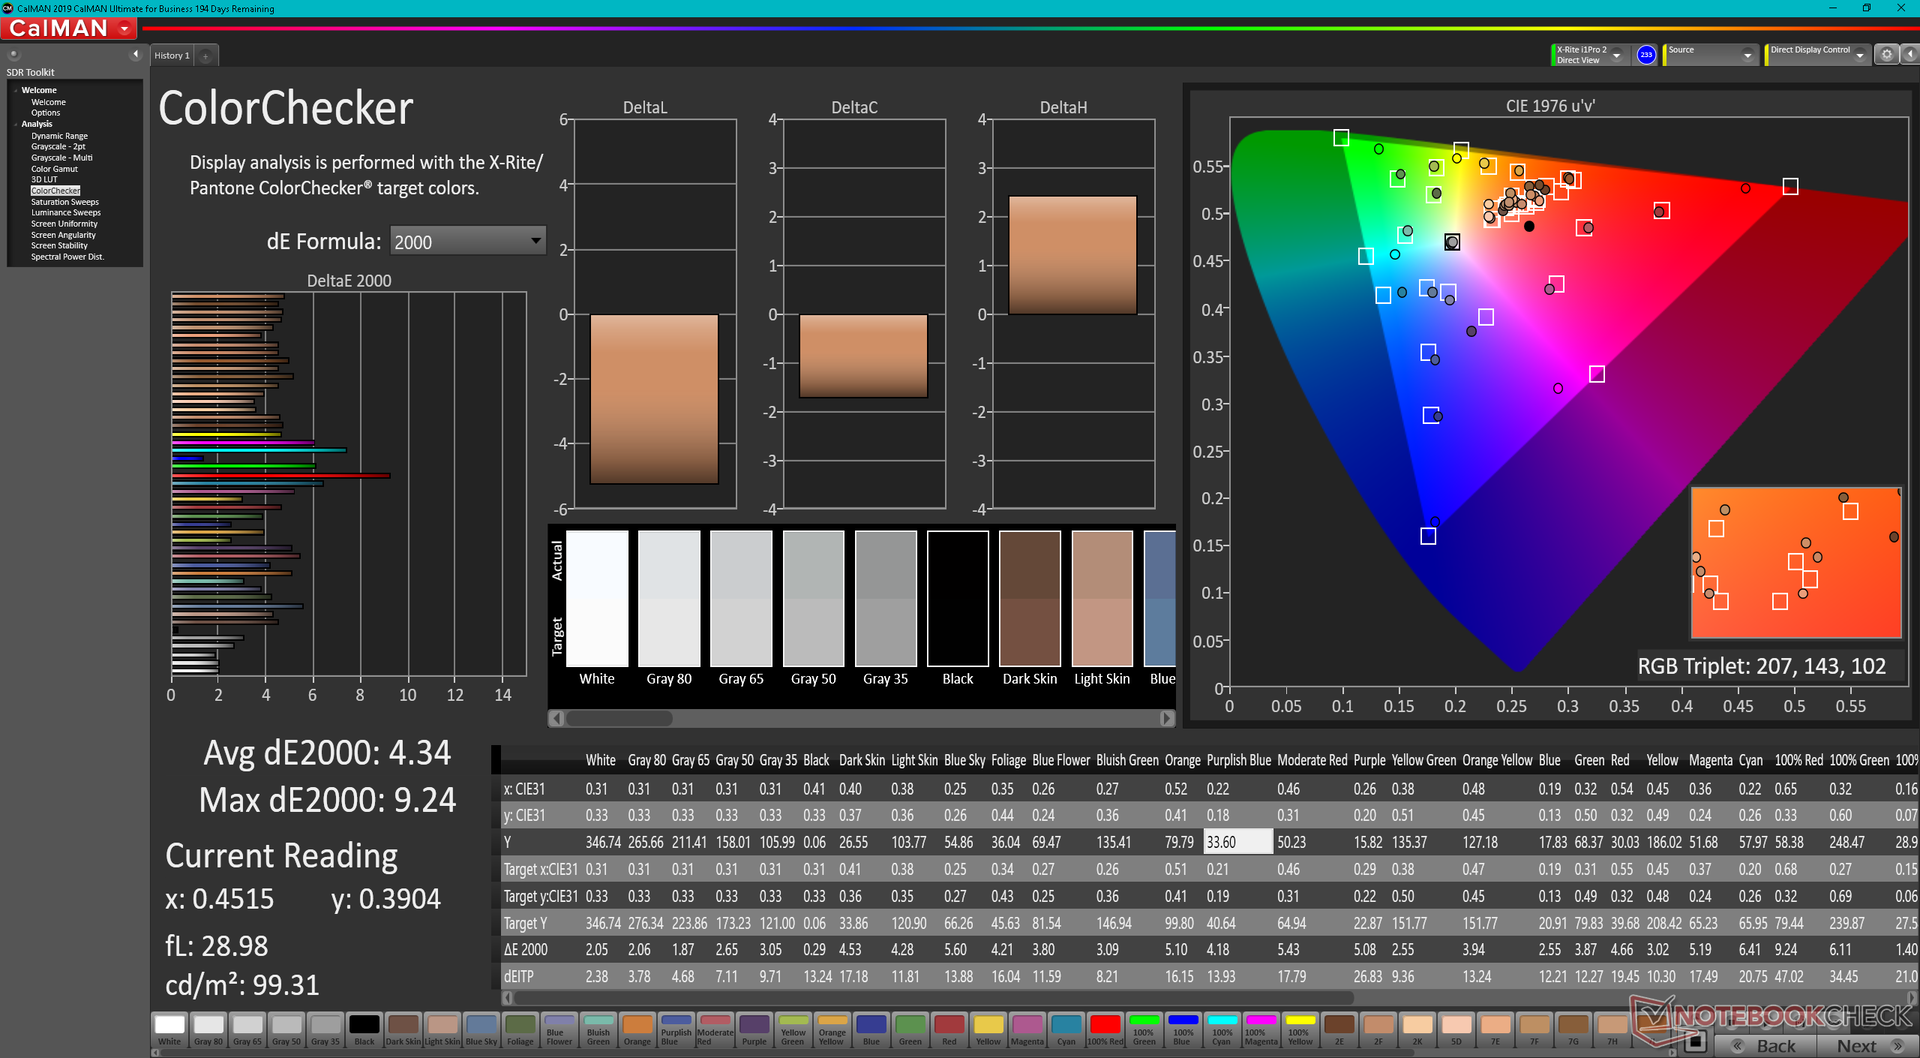
ΔE ColorChecker Calman: 4.34 | ∀{0.5-29.43 Ø4.72}
ΔE Greyscale Calman: 2 | ∀{0.09-98 Ø4.97}
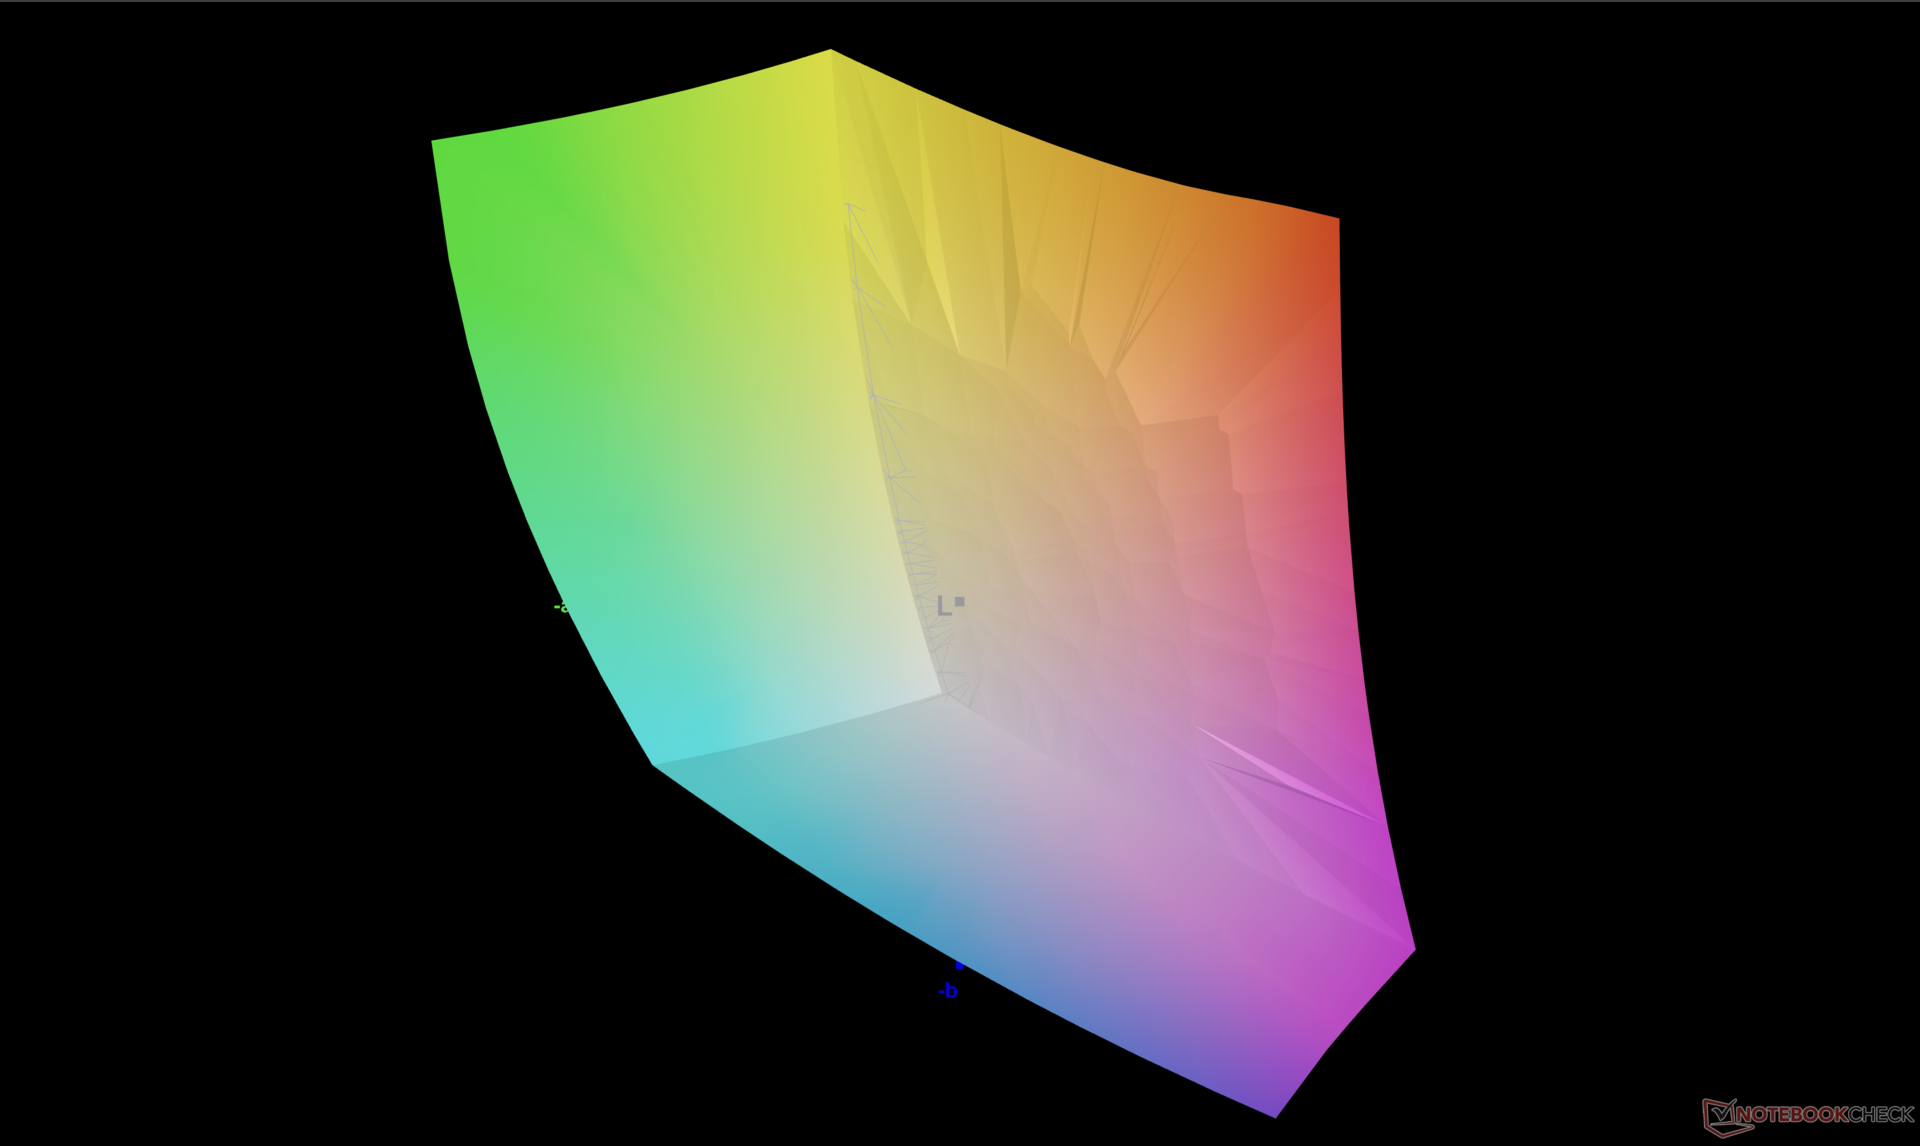
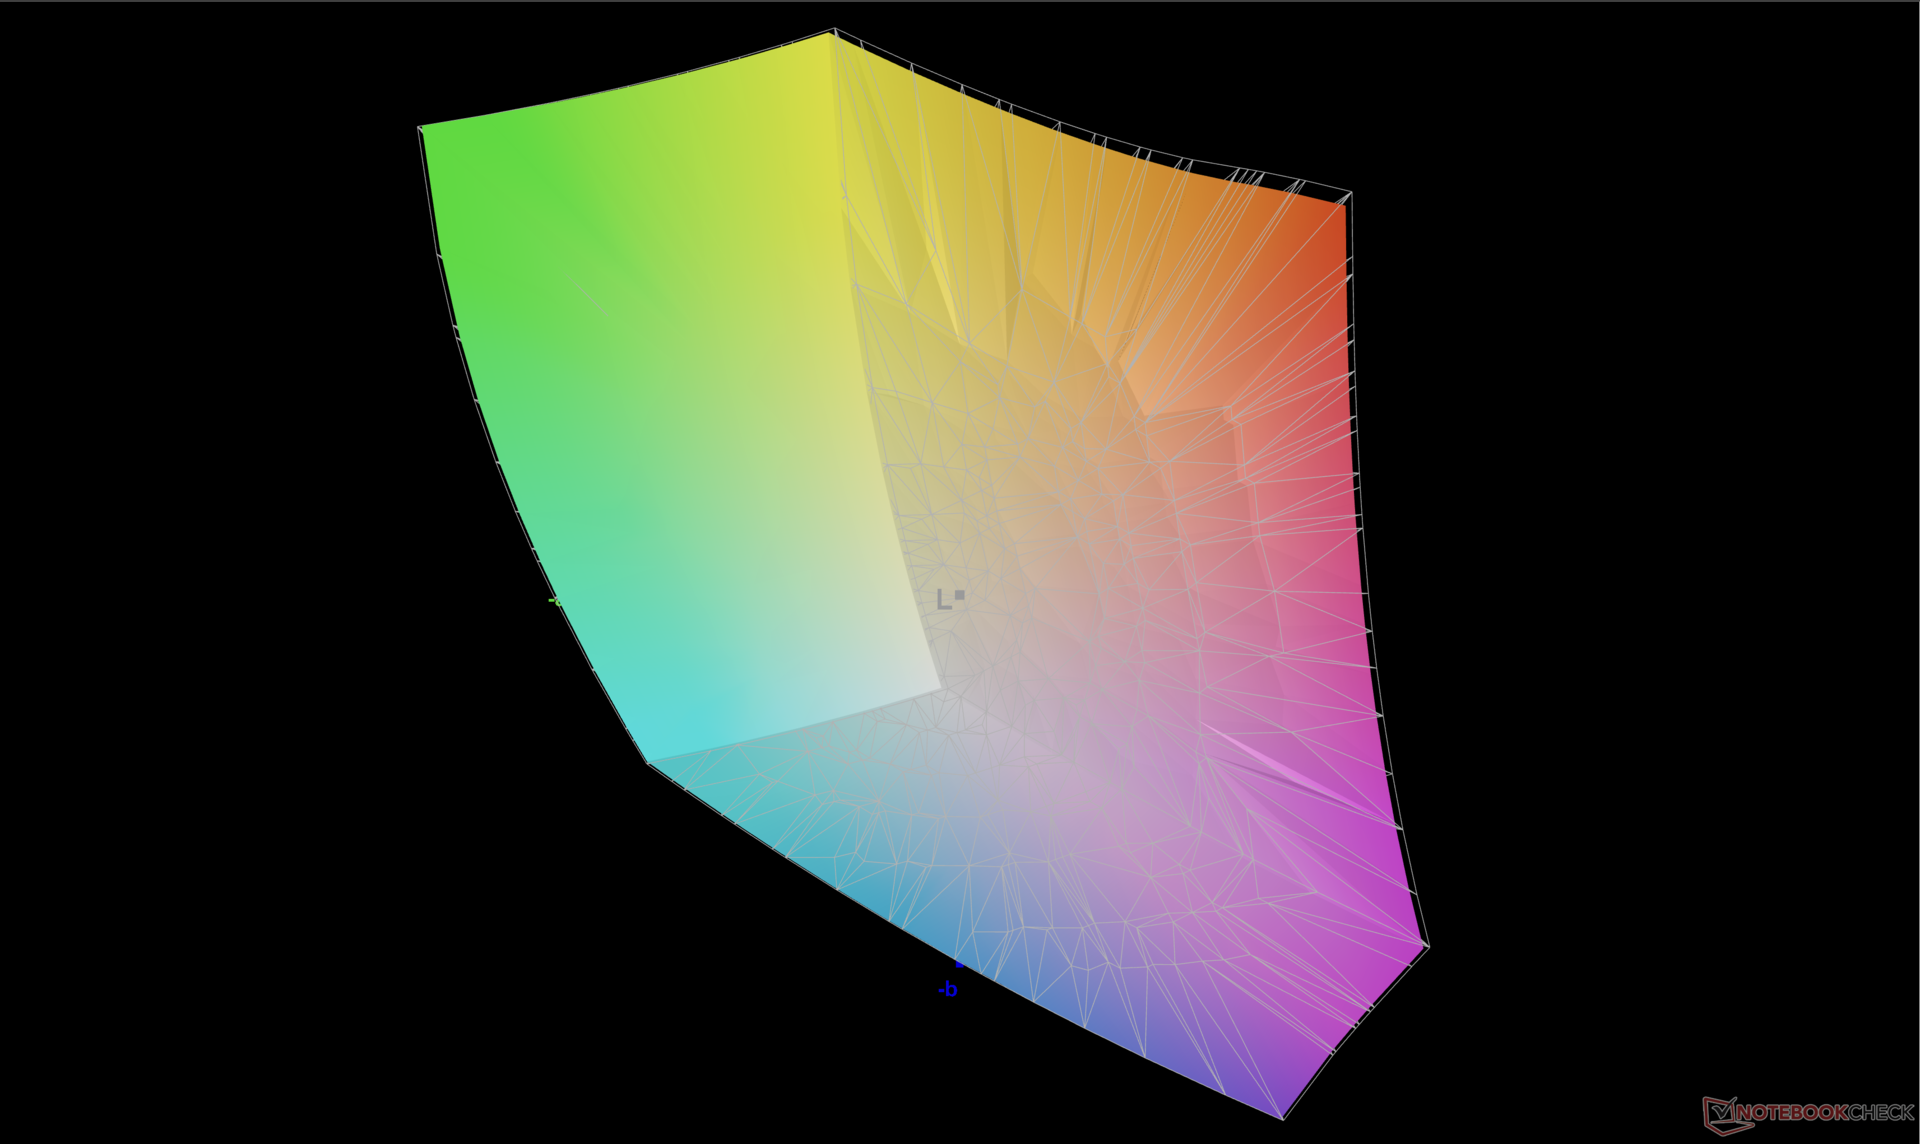
86% AdobeRGB 1998 (Argyll 3D)
99.9% sRGB (Argyll 3D)
97.8% Display P3 (Argyll 3D)
Gamma: 2.13
CCT: 6210 K
| Dell XPS 15 9520 RTX 3050 Ti Samsung 156XG01, OLED, 3456x2160, 15.6" | Dell XPS 15 9510 11800H RTX 3050 Ti OLED SDC414D, OLED, 3456x2160, 15.6" | Dell XPS 15 9500 Core i7 4K UHD Sharp LQ156R1, IPS, 3840x2400, 15.6" | HP Spectre X360 15-5ZV31AV AU Optronics AUO30EB, IPS, 3840x2160, 15.6" | Asus Zenbook Pro 15 OLED UM535Q Samsung ATNA56YX03-0, OLED, 1920x1080, 15.6" | MSI Stealth 15M A11SEK Chi Mei N156HCE-EN1, IPS, 1920x1080, 15.6" | |
|---|---|---|---|---|---|---|
| Display | 5% | 3% | -19% | -7% | -23% | |
| Display P3 Coverage (%) | 97.8 | 99.9 2% | 89.7 -8% | 68.3 -30% | 79.3 -19% | 62 -37% |
| sRGB Coverage (%) | 99.9 | 100 0% | 100 0% | 94.3 -6% | 95.6 -4% | 93.4 -7% |
| AdobeRGB 1998 Coverage (%) | 86 | 98.1 14% | 99.8 16% | 68.4 -20% | 87.3 2% | 64.1 -25% |
| Response Times | -68% | -2195% | -2468% | -16% | -2079% | |
| Response Time Grey 50% / Grey 80% * (ms) | 1.9 ? | 3.6 ? -89% | 54 ? -2742% | 56.8 ? -2889% | 2.1 ? -11% | 47.6 ? -2405% |
| Response Time Black / White * (ms) | 1.9 ? | 2.8 ? -47% | 33.2 ? -1647% | 40.8 ? -2047% | 2.3 ? -21% | 35.2 ? -1753% |
| PWM Frequency (Hz) | 59.52 ? | 59.5 ? | 60.2 | 25000 ? | ||
| Screen | 22% | 5% | -11% | 13% | -4% | |
| Brightness middle (cd/m²) | 381.4 | 362 -5% | 557.9 46% | 284.6 -25% | 342.9 -10% | 279 -27% |
| Brightness (cd/m²) | 384 | 367 -4% | 541 41% | 285 -26% | 346 -10% | 252 -34% |
| Brightness Distribution (%) | 95 | 97 2% | 91 -4% | 85 -11% | 98 3% | 82 -14% |
| Black Level * (cd/m²) | 0.06 | 0.39 | 0.25 | 0.32 | ||
| Colorchecker dE 2000 * | 4.34 | 2.1 52% | 4.54 -5% | 3.52 19% | 2.42 44% | 1.72 60% |
| Colorchecker dE 2000 max. * | 9.24 | 4.1 56% | 7.92 14% | 5.56 40% | 4.05 56% | 5.62 39% |
| Greyscale dE 2000 * | 2 | 1.4 30% | 3.2 -60% | 3.2 -60% | 2.1 -5% | 2.9 -45% |
| Gamma | 2.13 103% | 2.18 101% | 1.99 111% | 2.28 96% | 2.21 100% | 2.3 96% |
| CCT | 6210 105% | 6608 98% | 6451 101% | 7070 92% | 6364 102% | 6700 97% |
| Contrast (:1) | 6033 | 1431 | 1138 | 872 | ||
| Colorchecker dE 2000 calibrated * | 2.5 | 3.82 | 3 | 1.39 | ||
| Color Space (Percent of AdobeRGB 1998) (%) | 89.5 | 61.1 | 59 | |||
| Color Space (Percent of sRGB) (%) | 100 | 93.8 | 93.2 | |||
| Média Total (Programa/Configurações) | -14% /
1% | -729% /
-395% | -833% /
-460% | -3% /
2% | -702% /
-386% |
* ... menor é melhor
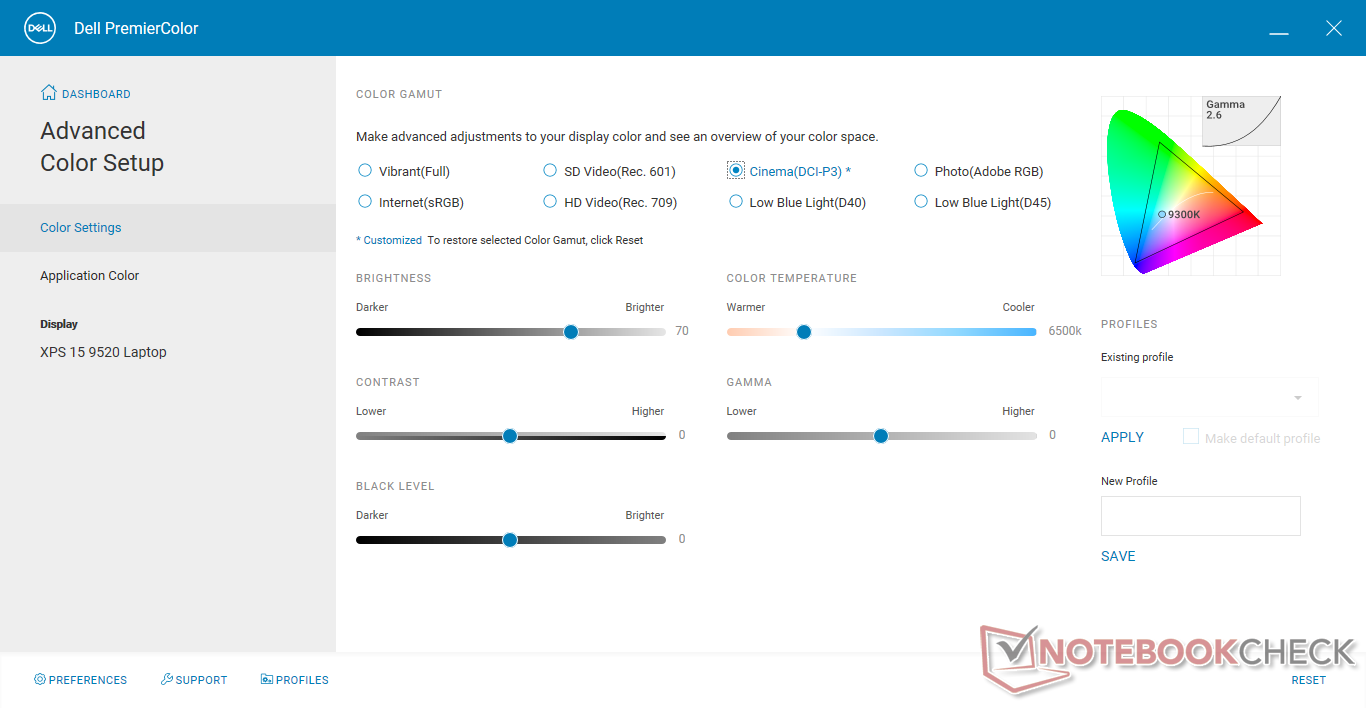
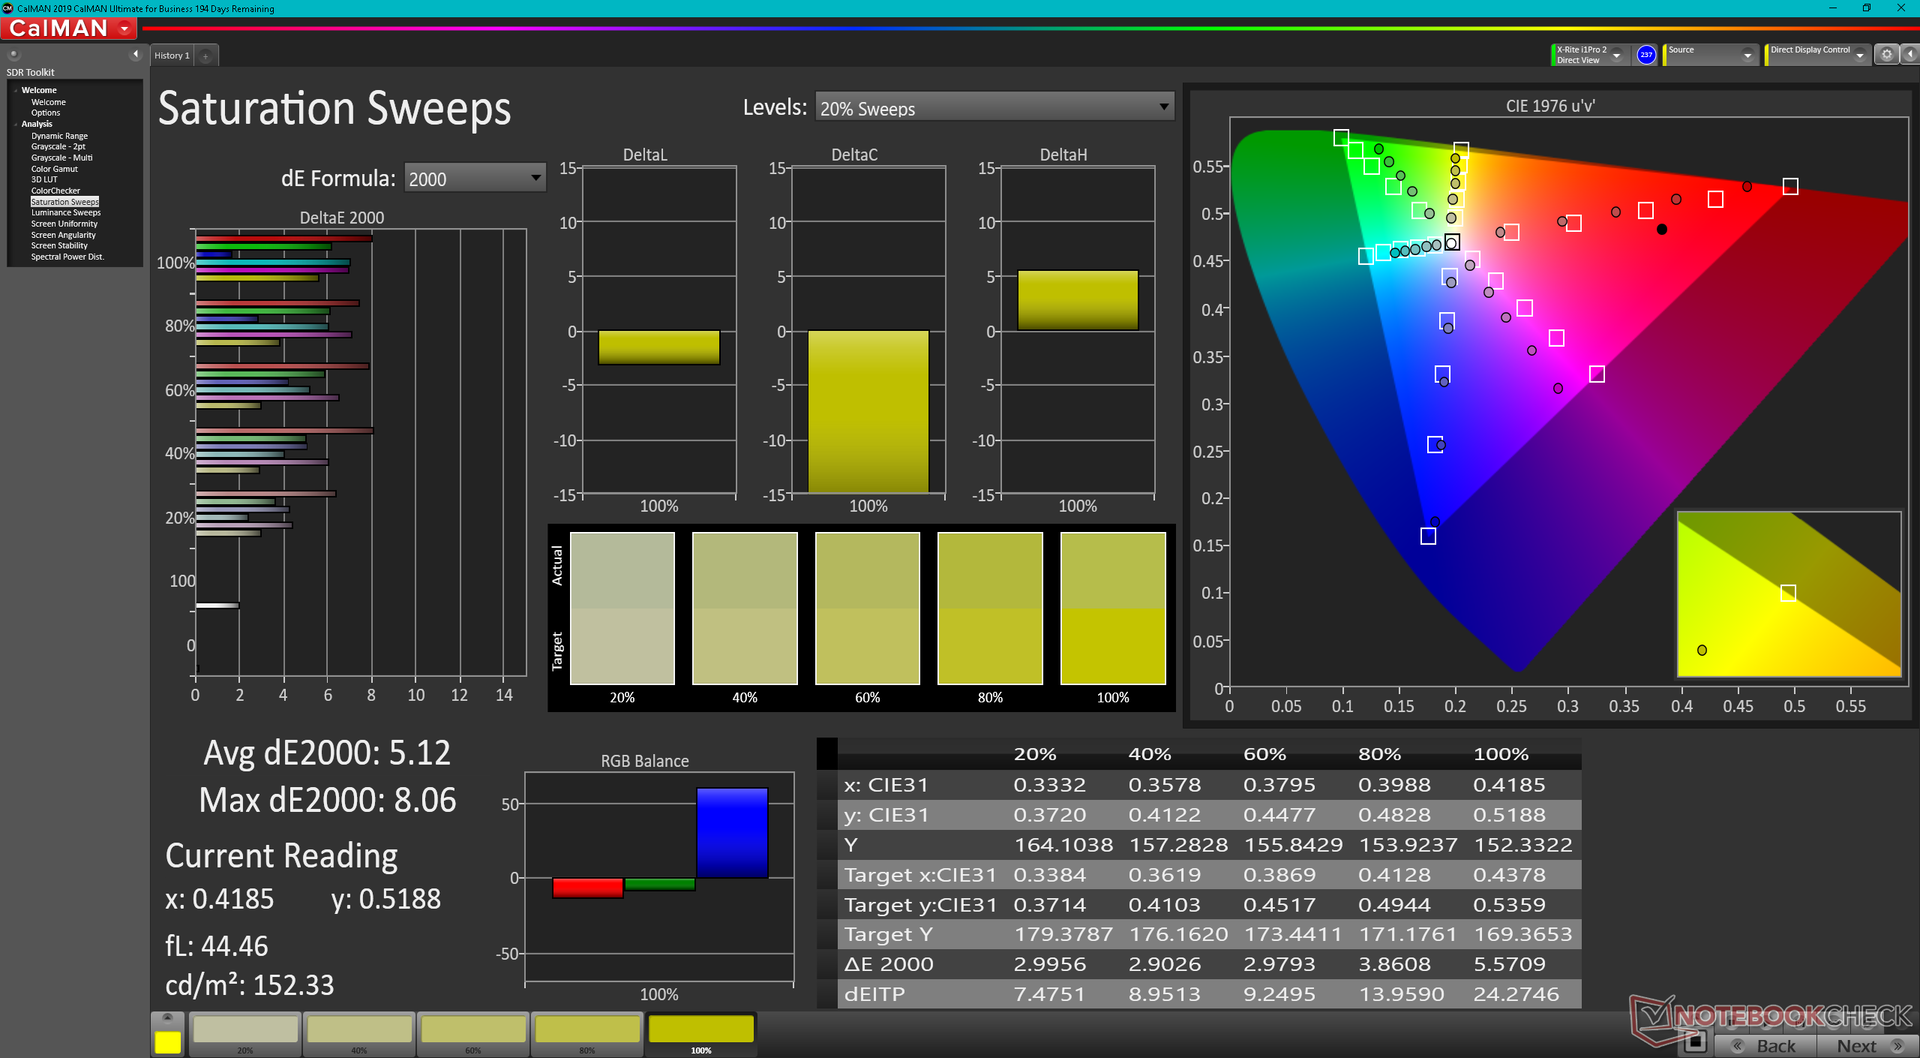
Embora possamos confirmar pelo menos 98% de cobertura DCI-P3, as cores em nossa unidade não foram bem calibradas em relação ao padrão, mesmo quando definidas para DCI-P3 através do software PremierColor.
Exibir tempos de resposta
| ↔ Tempo de resposta preto para branco | ||
|---|---|---|
| 1.9 ms ... ascensão ↗ e queda ↘ combinadas | ↗ 1.1 ms ascensão | 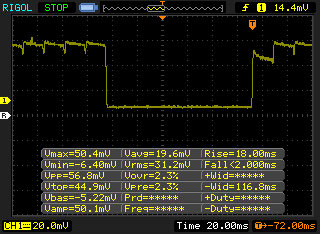 |
| ↘ 0.8 ms queda | ||
| A tela mostra taxas de resposta muito rápidas em nossos testes e deve ser muito adequada para jogos em ritmo acelerado. Em comparação, todos os dispositivos testados variam de 0.1 (mínimo) a 240 (máximo) ms. » 11 % de todos os dispositivos são melhores. Isso significa que o tempo de resposta medido é melhor que a média de todos os dispositivos testados (19.8 ms). | ||
| ↔ Tempo de resposta 50% cinza a 80% cinza | ||
| 1.9 ms ... ascensão ↗ e queda ↘ combinadas | ↗ 1.1 ms ascensão | 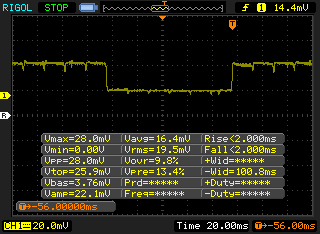 |
| ↘ 0.8 ms queda | ||
| A tela mostra taxas de resposta muito rápidas em nossos testes e deve ser muito adequada para jogos em ritmo acelerado. Em comparação, todos os dispositivos testados variam de 0.165 (mínimo) a 636 (máximo) ms. » 9 % de todos os dispositivos são melhores. Isso significa que o tempo de resposta medido é melhor que a média de todos os dispositivos testados (31 ms). | ||
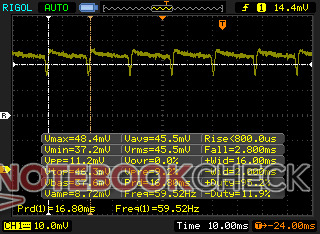
Cintilação da tela / PWM (modulação por largura de pulso)
| Tela tremeluzindo/PWM detectado | 59.52 Hz | ≤ 100 % configuração de brilho | 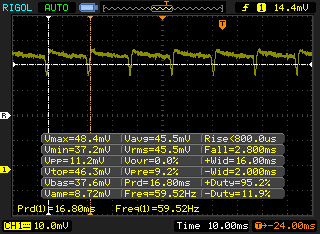 |
A luz de fundo da tela pisca em 59.52 Hz (pior caso, por exemplo, utilizando PWM) Cintilação detectada em uma configuração de brilho de 100 % e abaixo. Não deve haver cintilação ou PWM acima desta configuração de brilho. A frequência de 59.52 Hz é muito baixa, portanto a oscilação pode causar fadiga ocular e dores de cabeça após uso prolongado. [pwm_comparison] Em comparação: 52 % de todos os dispositivos testados não usam PWM para escurecer a tela. Se PWM foi detectado, uma média de 7753 (mínimo: 5 - máximo: 343500) Hz foi medida. | |||
Desempenho - Intel 12th Gen Opções
Condições de teste
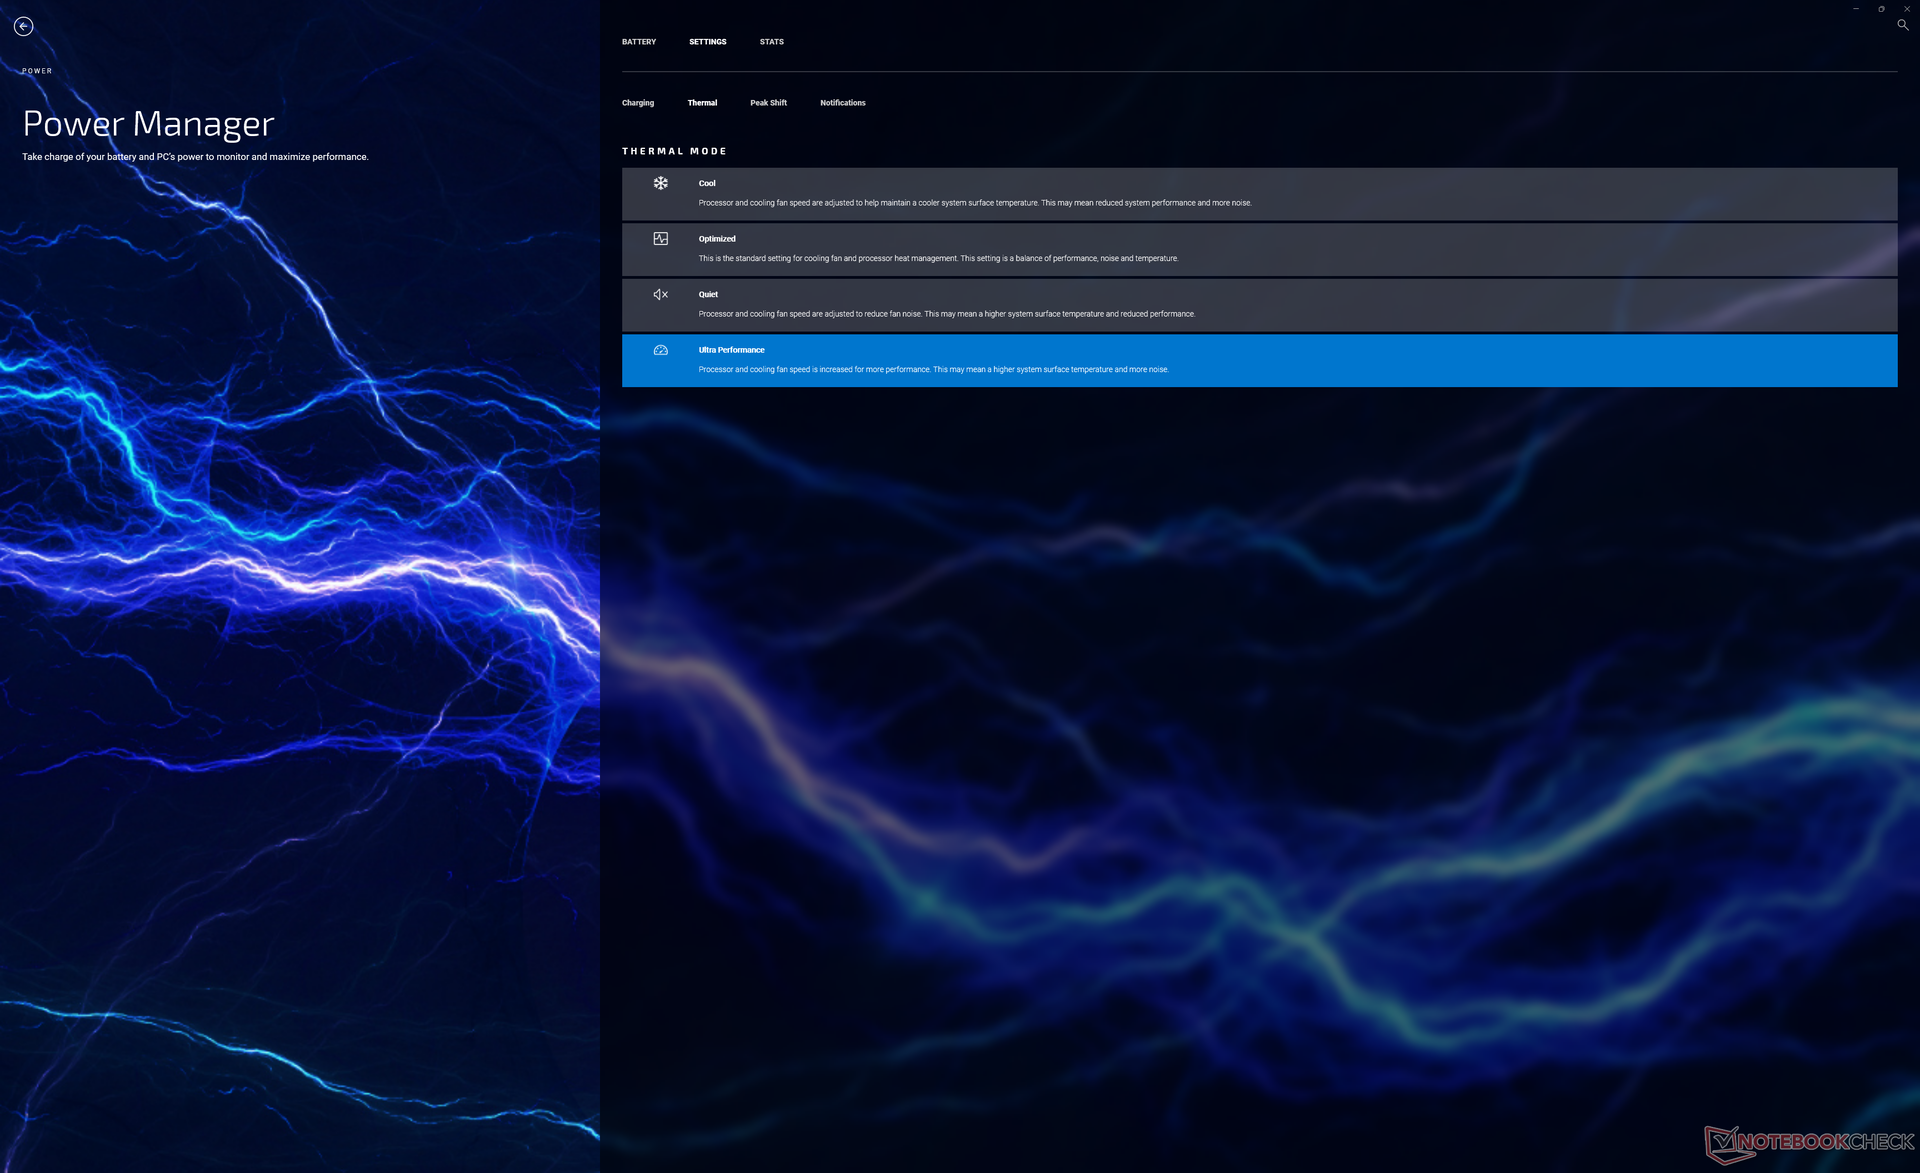
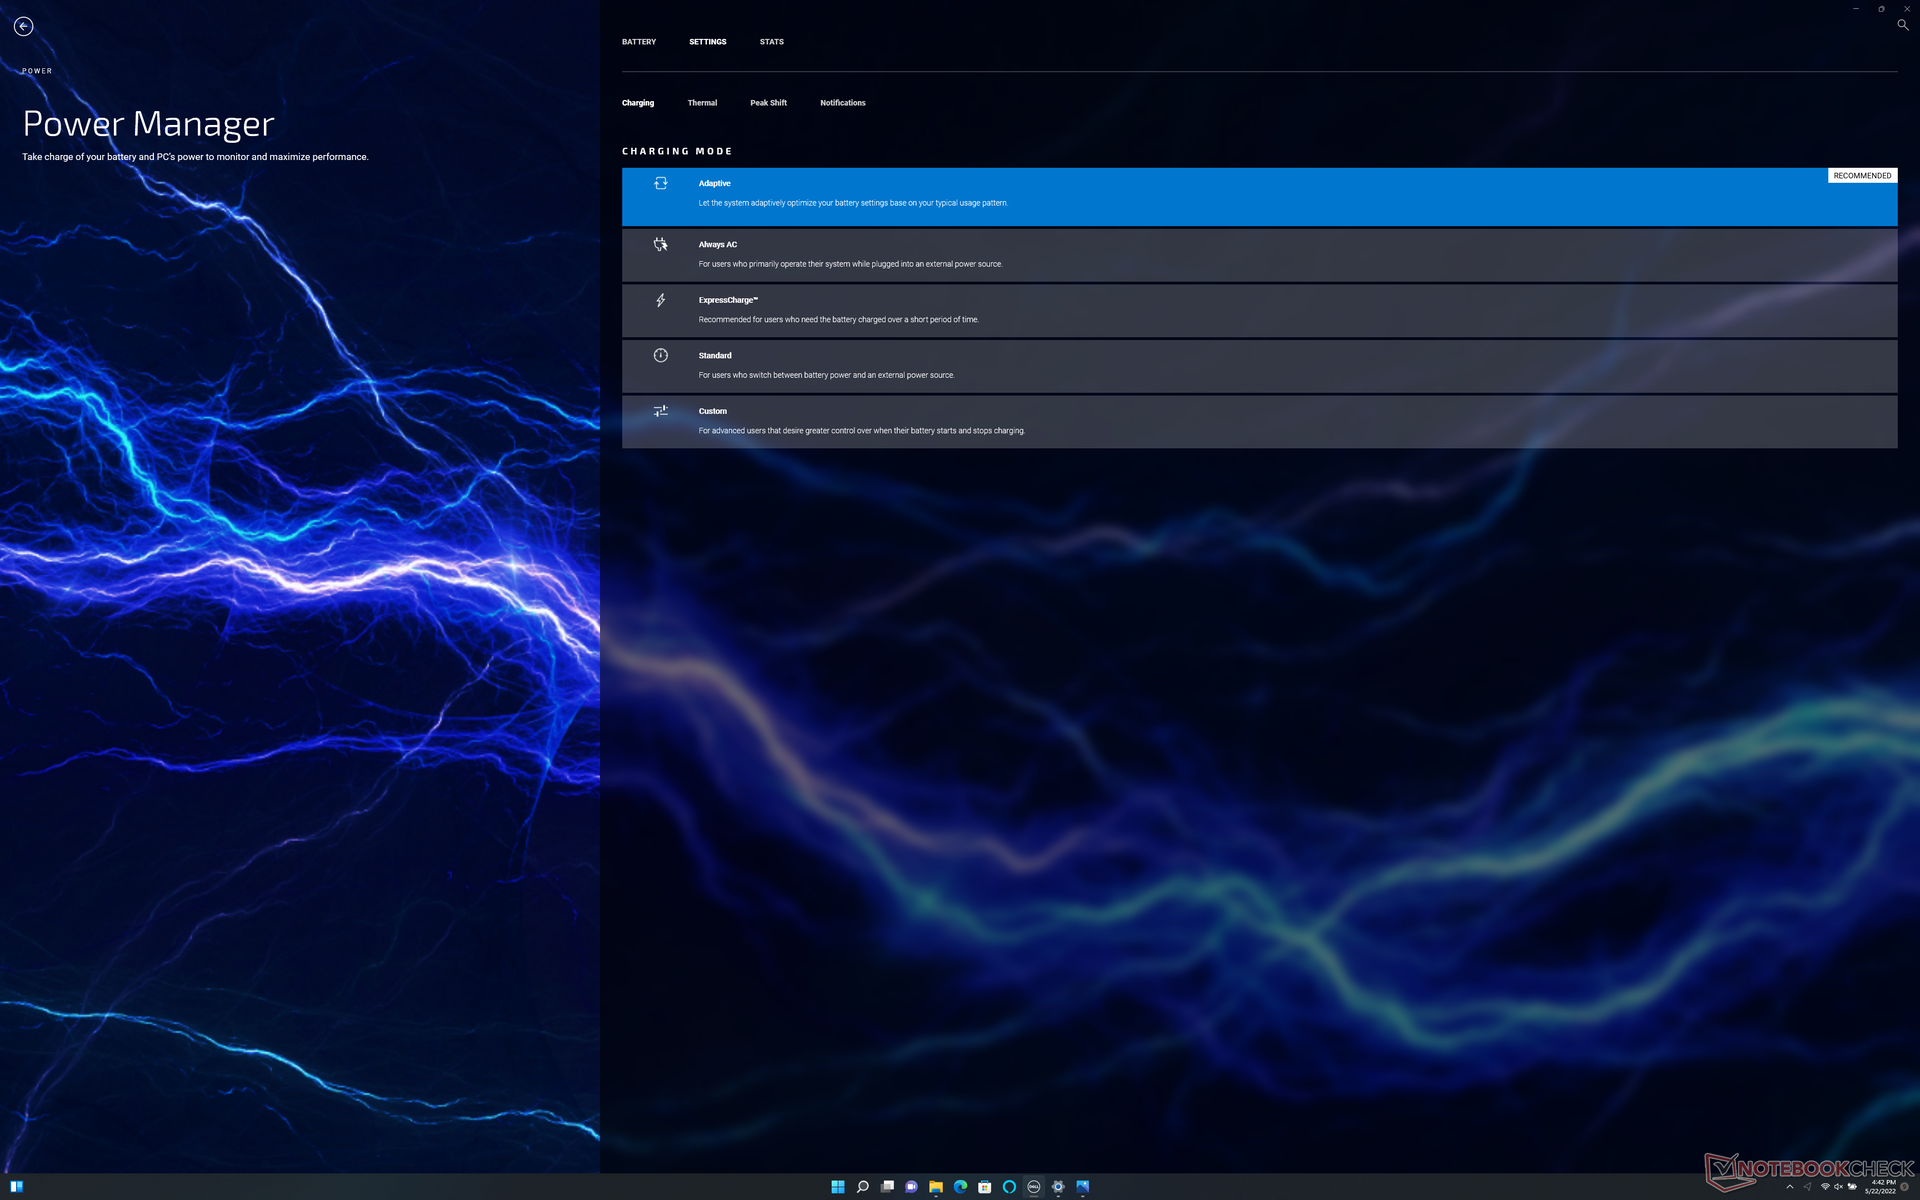
Nossa unidade foi ajustada para o modo Performance via Windows e Ultra Performance via o aplicativo My Dell antes de executar quaisquer benchmarks abaixo para obter as melhores pontuações possíveis. Observe que My Dell substituiu efetivamente o software Dell Power Manager mais antigo. Recomendamos aos usuários que se familiarizem com o novo aplicativo, pois ele é o one-stop shop para atualizações e configurações de desempenho da Dell
O TGP de 45 W GeForce RTX 3050 Ti GPU não mudou em relação ao anterior XPS 15 9510. Espera-se que não haja nenhuma chave MUX ou sincronização adaptativa, uma vez que o XPS 15 não foi projetado para jogos.
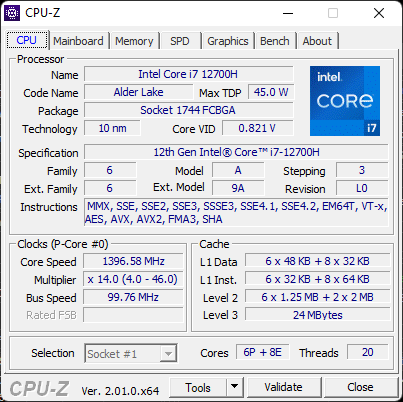
Processador
O aumento no desempenho da CPU do XPS 15 9510 para o 9520 é mais significativo do que o aumento no desempenho da CPU do XPS 9500 para o 9510. Saltando doNúcleo i7-11800H no XPS 15 9510 para o Núcleo i7-12700H em nosso 9520 concederá um aumento de 35 a 40 por cento no desempenho de múltiplas roscas e um aumento de 15 a 20 por cento no desempenho de uma única rosca. O salto é suficiente para impulsionar a CPU Intel da 12ª geração um pouco à frente da popular Ryzen 7 5800H que superou infamamemente a maioria das CPUs da série Intel Core-H do 11º gênero em cargas de trabalho de múltiplas linhas
O desempenho da CPU poderia ter sido melhor, apesar do aumento ano após ano mencionado anteriormente. Quando comparado com os mais de 20 outros laptops que testamos até agora com a mesma CPU Core i7-12700H, a de nosso XPS 15 9520 é mais lenta que a média em cerca de 5 a 15 por cento. A execução do CineBench R15 xT em loop mostra que a CPU da Dell não é capaz de manter altas taxas de Turbo Boost por tanto tempo quanto a maioria dos outros laptops com o mesmo processador. Modelos como oAsus TUF Gaming F15 FX507ZM pode rodar a mesma CPU até 36 por cento mais rápido do que em nossa Dell.
Cinebench R15 Multi Loop
Cinebench R23: Multi Core | Single Core
Cinebench R15: CPU Multi 64Bit | CPU Single 64Bit
Blender: v2.79 BMW27 CPU
7-Zip 18.03: 7z b 4 | 7z b 4 -mmt1
Geekbench 5.5: Multi-Core | Single-Core
HWBOT x265 Benchmark v2.2: 4k Preset
LibreOffice : 20 Documents To PDF
R Benchmark 2.5: Overall mean
* ... menor é melhor
AIDA64: FP32 Ray-Trace | FPU Julia | CPU SHA3 | CPU Queen | FPU SinJulia | FPU Mandel | CPU AES | CPU ZLib | FP64 Ray-Trace | CPU PhotoWorxx
| Performance rating | |
| Asus Zenbook Pro 15 OLED UM535Q | |
| Média Intel Core i7-12700H | |
| Dell XPS 15 9520 RTX 3050 Ti | |
| Dell XPS 15 9500 Core i7 4K UHD | |
| Dell XPS 15 9510 11800H RTX 3050 Ti OLED -9! | |
| AIDA64 / FP32 Ray-Trace | |
| Asus Zenbook Pro 15 OLED UM535Q | |
| Média Intel Core i7-12700H (2585 - 17957, n=64) | |
| Dell XPS 15 9500 Core i7 4K UHD | |
| Dell XPS 15 9520 RTX 3050 Ti | |
| AIDA64 / FPU Julia | |
| Asus Zenbook Pro 15 OLED UM535Q | |
| Dell XPS 15 9500 Core i7 4K UHD | |
| Média Intel Core i7-12700H (12439 - 90760, n=64) | |
| Dell XPS 15 9520 RTX 3050 Ti | |
| AIDA64 / CPU SHA3 | |
| Asus Zenbook Pro 15 OLED UM535Q | |
| Média Intel Core i7-12700H (833 - 4242, n=64) | |
| Dell XPS 15 9500 Core i7 4K UHD | |
| Dell XPS 15 9520 RTX 3050 Ti | |
| AIDA64 / CPU Queen | |
| Asus Zenbook Pro 15 OLED UM535Q | |
| Dell XPS 15 9520 RTX 3050 Ti | |
| Média Intel Core i7-12700H (57923 - 103202, n=63) | |
| Dell XPS 15 9500 Core i7 4K UHD | |
| AIDA64 / FPU SinJulia | |
| Asus Zenbook Pro 15 OLED UM535Q | |
| Dell XPS 15 9500 Core i7 4K UHD | |
| Média Intel Core i7-12700H (3249 - 9939, n=64) | |
| Dell XPS 15 9520 RTX 3050 Ti | |
| AIDA64 / FPU Mandel | |
| Asus Zenbook Pro 15 OLED UM535Q | |
| Dell XPS 15 9500 Core i7 4K UHD | |
| Média Intel Core i7-12700H (7135 - 44760, n=64) | |
| Dell XPS 15 9520 RTX 3050 Ti | |
| AIDA64 / CPU AES | |
| Asus Zenbook Pro 15 OLED UM535Q | |
| Média Intel Core i7-12700H (31839 - 144360, n=64) | |
| Dell XPS 15 9520 RTX 3050 Ti | |
| Dell XPS 15 9500 Core i7 4K UHD | |
| AIDA64 / CPU ZLib | |
| Média Intel Core i7-12700H (305 - 1171, n=64) | |
| Dell XPS 15 9520 RTX 3050 Ti | |
| Asus Zenbook Pro 15 OLED UM535Q | |
| Dell XPS 15 9500 Core i7 4K UHD | |
| Dell XPS 15 9510 11800H RTX 3050 Ti OLED | |
| AIDA64 / FP64 Ray-Trace | |
| Asus Zenbook Pro 15 OLED UM535Q | |
| Média Intel Core i7-12700H (1437 - 9692, n=64) | |
| Dell XPS 15 9520 RTX 3050 Ti | |
| Dell XPS 15 9500 Core i7 4K UHD | |
| AIDA64 / CPU PhotoWorxx | |
| Dell XPS 15 9520 RTX 3050 Ti | |
| Média Intel Core i7-12700H (12863 - 52207, n=64) | |
| Dell XPS 15 9500 Core i7 4K UHD | |
| Asus Zenbook Pro 15 OLED UM535Q | |
Desempenho do sistema
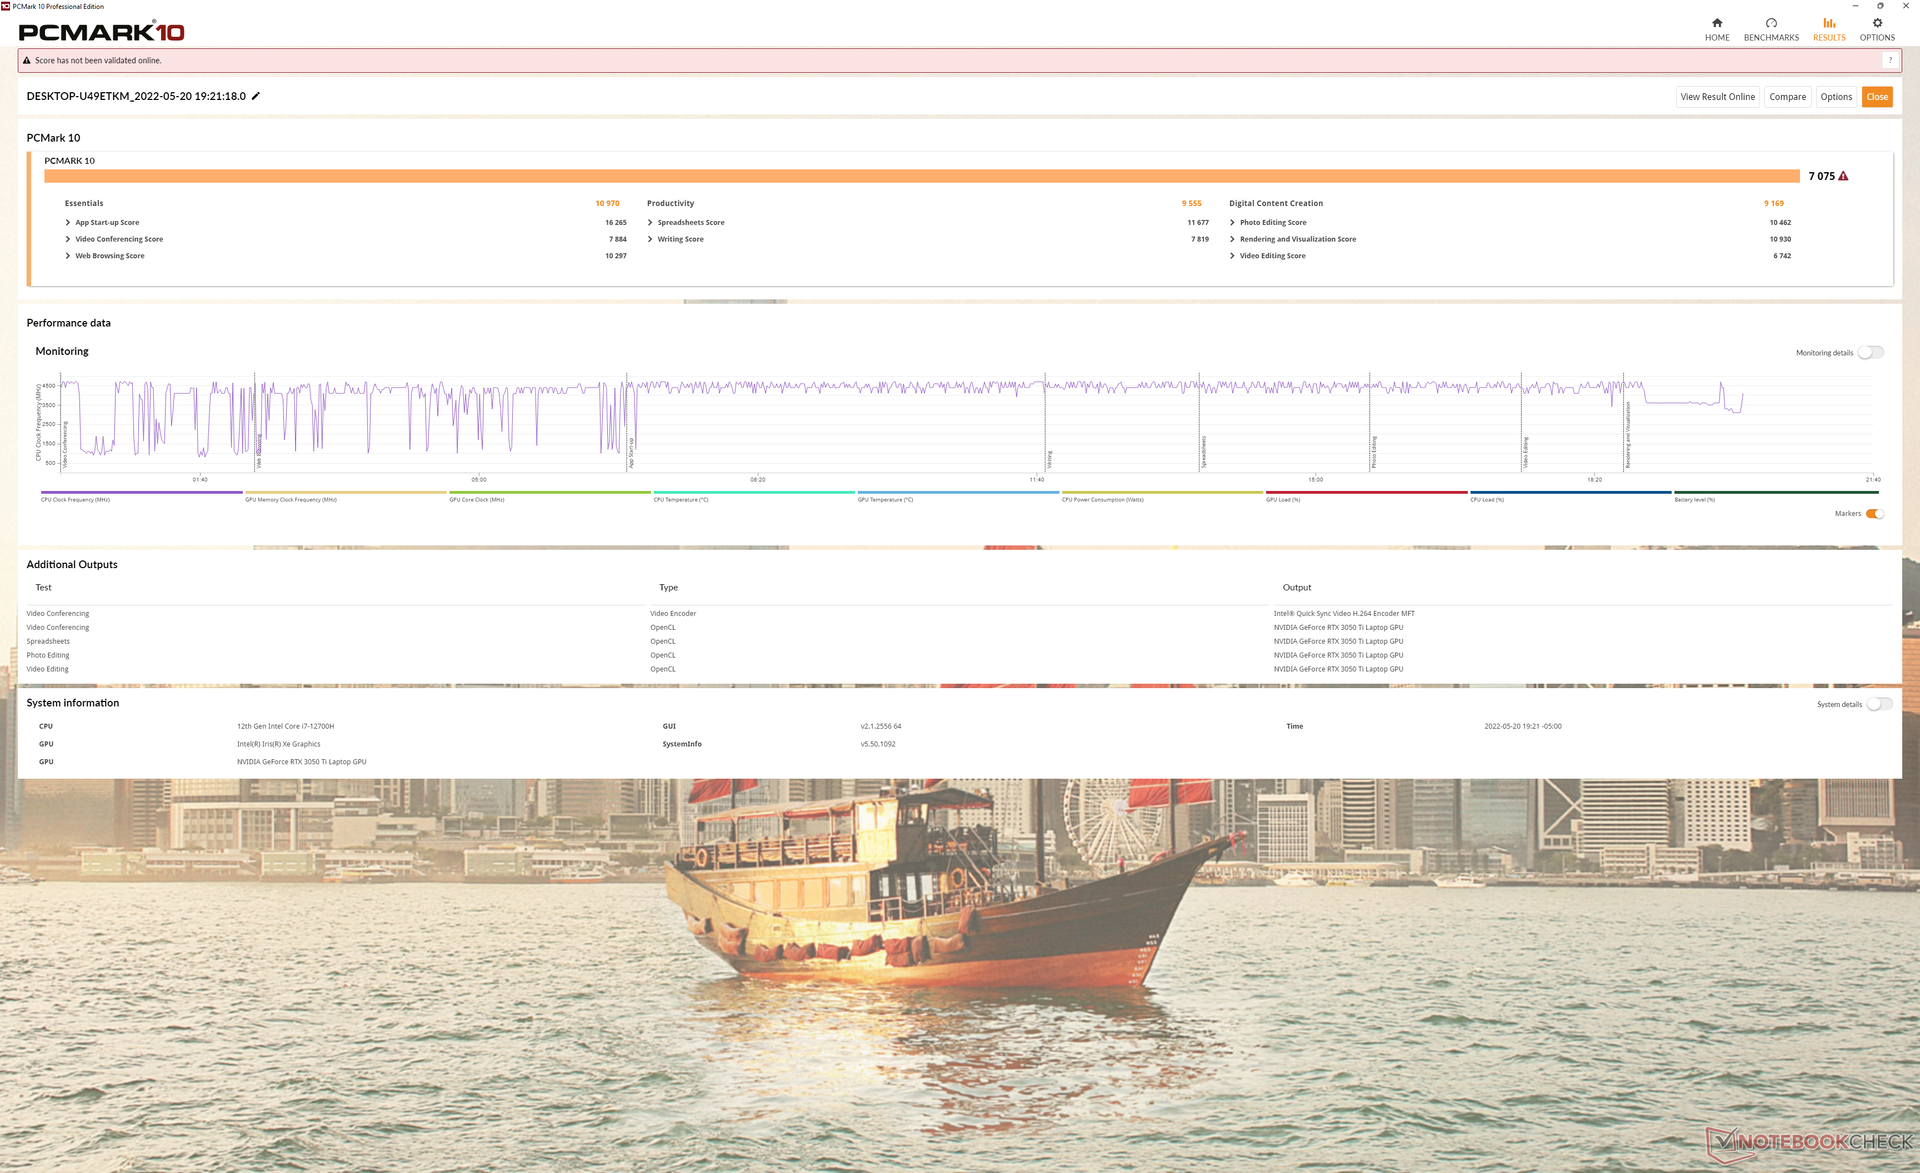
Os resultados do PCMark 10 são consistentemente mais altos do que o que registramos no antigo XPS 15 9510 e 9500 devido em grande parte ao aumento do desempenho da CPU e do SSD.
CrossMark: Overall | Productivity | Creativity | Responsiveness
| PCMark 10 / Score | |
| Dell XPS 15 9520 RTX 3050 Ti | |
| Média Intel Core i7-12700H, NVIDIA GeForce RTX 3050 Ti Laptop GPU (6623 - 7075, n=5) | |
| Asus Zenbook Pro 15 OLED UM535Q | |
| Dell XPS 15 9510 11800H RTX 3050 Ti OLED | |
| MSI Stealth 15M A11SEK | |
| Dell XPS 15 9500 Core i7 4K UHD | |
| HP Spectre X360 15-5ZV31AV | |
| PCMark 10 / Essentials | |
| Dell XPS 15 9520 RTX 3050 Ti | |
| Asus Zenbook Pro 15 OLED UM535Q | |
| Média Intel Core i7-12700H, NVIDIA GeForce RTX 3050 Ti Laptop GPU (9540 - 10970, n=5) | |
| Dell XPS 15 9500 Core i7 4K UHD | |
| MSI Stealth 15M A11SEK | |
| Dell XPS 15 9510 11800H RTX 3050 Ti OLED | |
| HP Spectre X360 15-5ZV31AV | |
| PCMark 10 / Productivity | |
| Asus Zenbook Pro 15 OLED UM535Q | |
| Dell XPS 15 9520 RTX 3050 Ti | |
| Média Intel Core i7-12700H, NVIDIA GeForce RTX 3050 Ti Laptop GPU (8530 - 9555, n=5) | |
| MSI Stealth 15M A11SEK | |
| Dell XPS 15 9510 11800H RTX 3050 Ti OLED | |
| Dell XPS 15 9500 Core i7 4K UHD | |
| HP Spectre X360 15-5ZV31AV | |
| PCMark 10 / Digital Content Creation | |
| Média Intel Core i7-12700H, NVIDIA GeForce RTX 3050 Ti Laptop GPU (8855 - 9542, n=5) | |
| Dell XPS 15 9520 RTX 3050 Ti | |
| Asus Zenbook Pro 15 OLED UM535Q | |
| Dell XPS 15 9510 11800H RTX 3050 Ti OLED | |
| MSI Stealth 15M A11SEK | |
| Dell XPS 15 9500 Core i7 4K UHD | |
| HP Spectre X360 15-5ZV31AV | |
| CrossMark / Overall | |
| Dell XPS 15 9520 RTX 3050 Ti | |
| Média Intel Core i7-12700H, NVIDIA GeForce RTX 3050 Ti Laptop GPU (1654 - 1872, n=5) | |
| Asus Zenbook Pro 15 OLED UM535Q | |
| CrossMark / Productivity | |
| Dell XPS 15 9520 RTX 3050 Ti | |
| Média Intel Core i7-12700H, NVIDIA GeForce RTX 3050 Ti Laptop GPU (1595 - 1792, n=5) | |
| Asus Zenbook Pro 15 OLED UM535Q | |
| CrossMark / Creativity | |
| Dell XPS 15 9520 RTX 3050 Ti | |
| Média Intel Core i7-12700H, NVIDIA GeForce RTX 3050 Ti Laptop GPU (1699 - 1993, n=5) | |
| Asus Zenbook Pro 15 OLED UM535Q | |
| CrossMark / Responsiveness | |
| Dell XPS 15 9520 RTX 3050 Ti | |
| Média Intel Core i7-12700H, NVIDIA GeForce RTX 3050 Ti Laptop GPU (1383 - 1768, n=5) | |
| Asus Zenbook Pro 15 OLED UM535Q | |
| PCMark 10 Score | 7075 pontos | |
Ajuda | ||
| AIDA64 / Memory Copy | |
| Dell XPS 15 9520 RTX 3050 Ti | |
| Média Intel Core i7-12700H (25615 - 80511, n=64) | |
| Asus Zenbook Pro 15 OLED UM535Q | |
| Dell XPS 15 9500 Core i7 4K UHD | |
| AIDA64 / Memory Read | |
| Dell XPS 15 9520 RTX 3050 Ti | |
| Média Intel Core i7-12700H (25586 - 79442, n=64) | |
| Asus Zenbook Pro 15 OLED UM535Q | |
| Dell XPS 15 9500 Core i7 4K UHD | |
| AIDA64 / Memory Write | |
| Dell XPS 15 9520 RTX 3050 Ti | |
| Média Intel Core i7-12700H (23679 - 88660, n=64) | |
| Asus Zenbook Pro 15 OLED UM535Q | |
| Dell XPS 15 9500 Core i7 4K UHD | |
| AIDA64 / Memory Latency | |
| Dell XPS 15 9520 RTX 3050 Ti | |
| Asus Zenbook Pro 15 OLED UM535Q | |
| Média Intel Core i7-12700H (76.2 - 133.9, n=62) | |
| Dell XPS 15 9500 Core i7 4K UHD | |
| Dell XPS 15 9510 11800H RTX 3050 Ti OLED | |
* ... menor é melhor
Latência do DPC
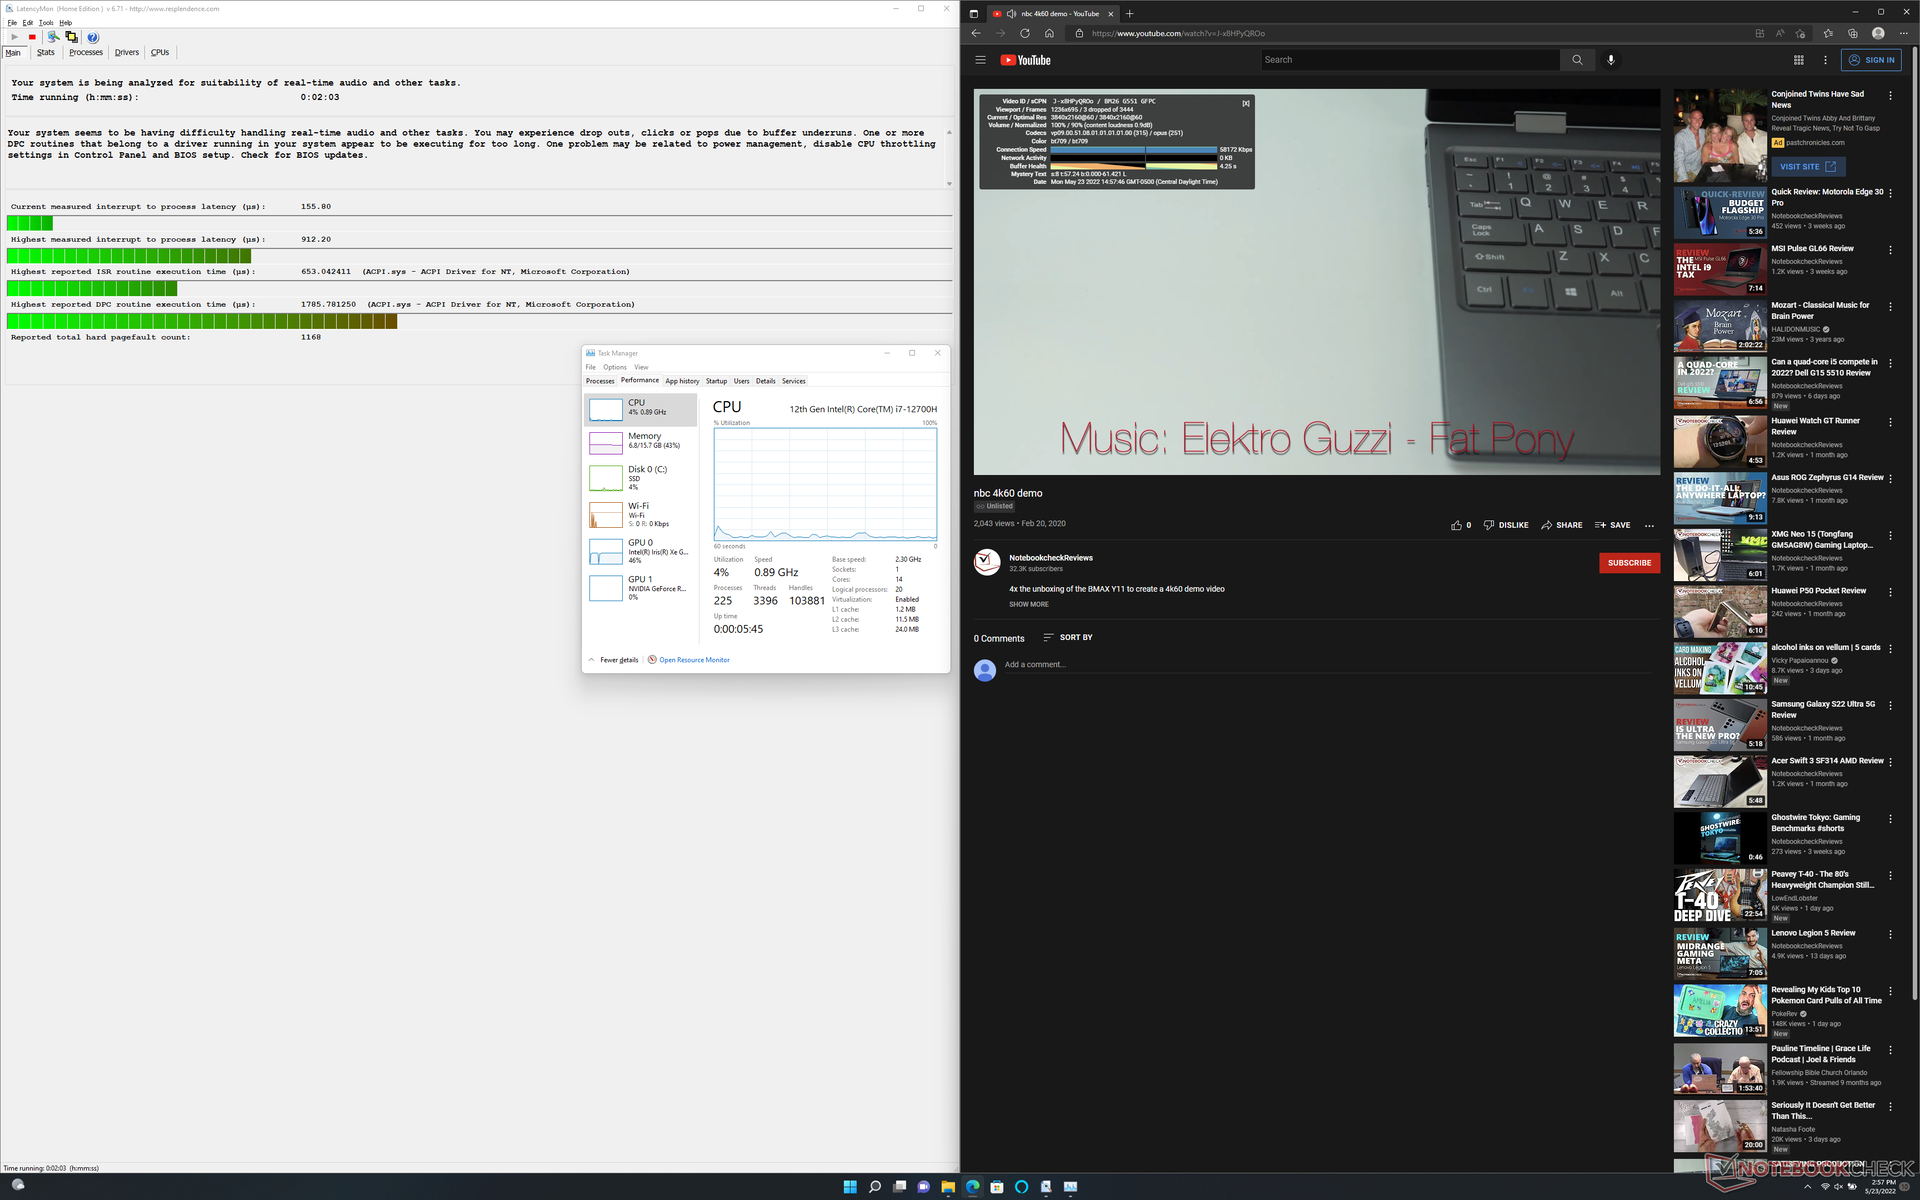
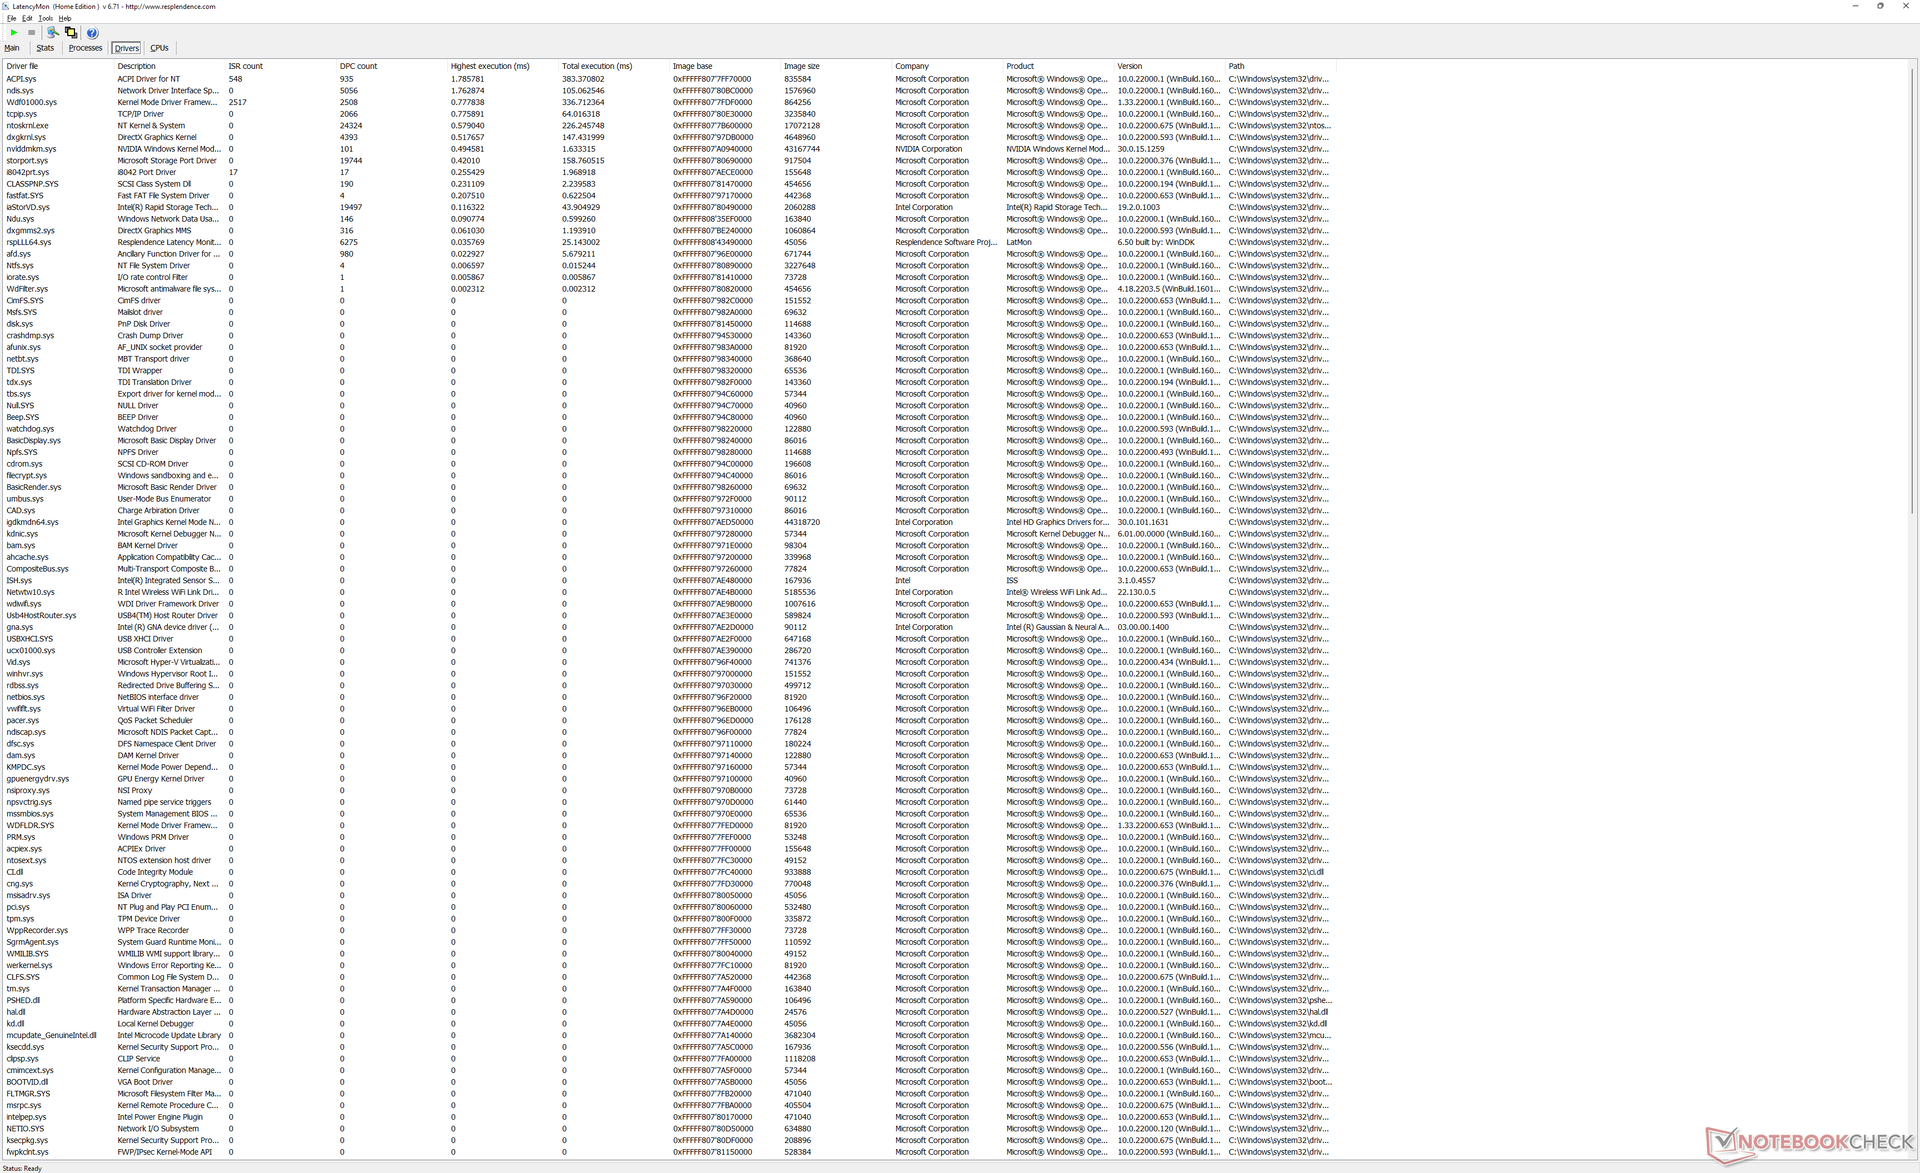
LatencyMon revela pequenos problemas de DPC ao abrir várias abas do navegador em nossa página inicial. a reprodução de vídeo de 4K a 60 FPS é, de outra forma, suave e com apenas 3 quadros descartados durante nosso teste de vídeo de minutos.
| DPC Latencies / LatencyMon - interrupt to process latency (max), Web, Youtube, Prime95 | |
| Dell XPS 15 9500 Core i7 4K UHD | |
| Dell XPS 15 9510 11800H RTX 3050 Ti OLED | |
| Dell XPS 15 9520 RTX 3050 Ti | |
| MSI Stealth 15M A11SEK | |
| Asus Zenbook Pro 15 OLED UM535Q | |
* ... menor é melhor
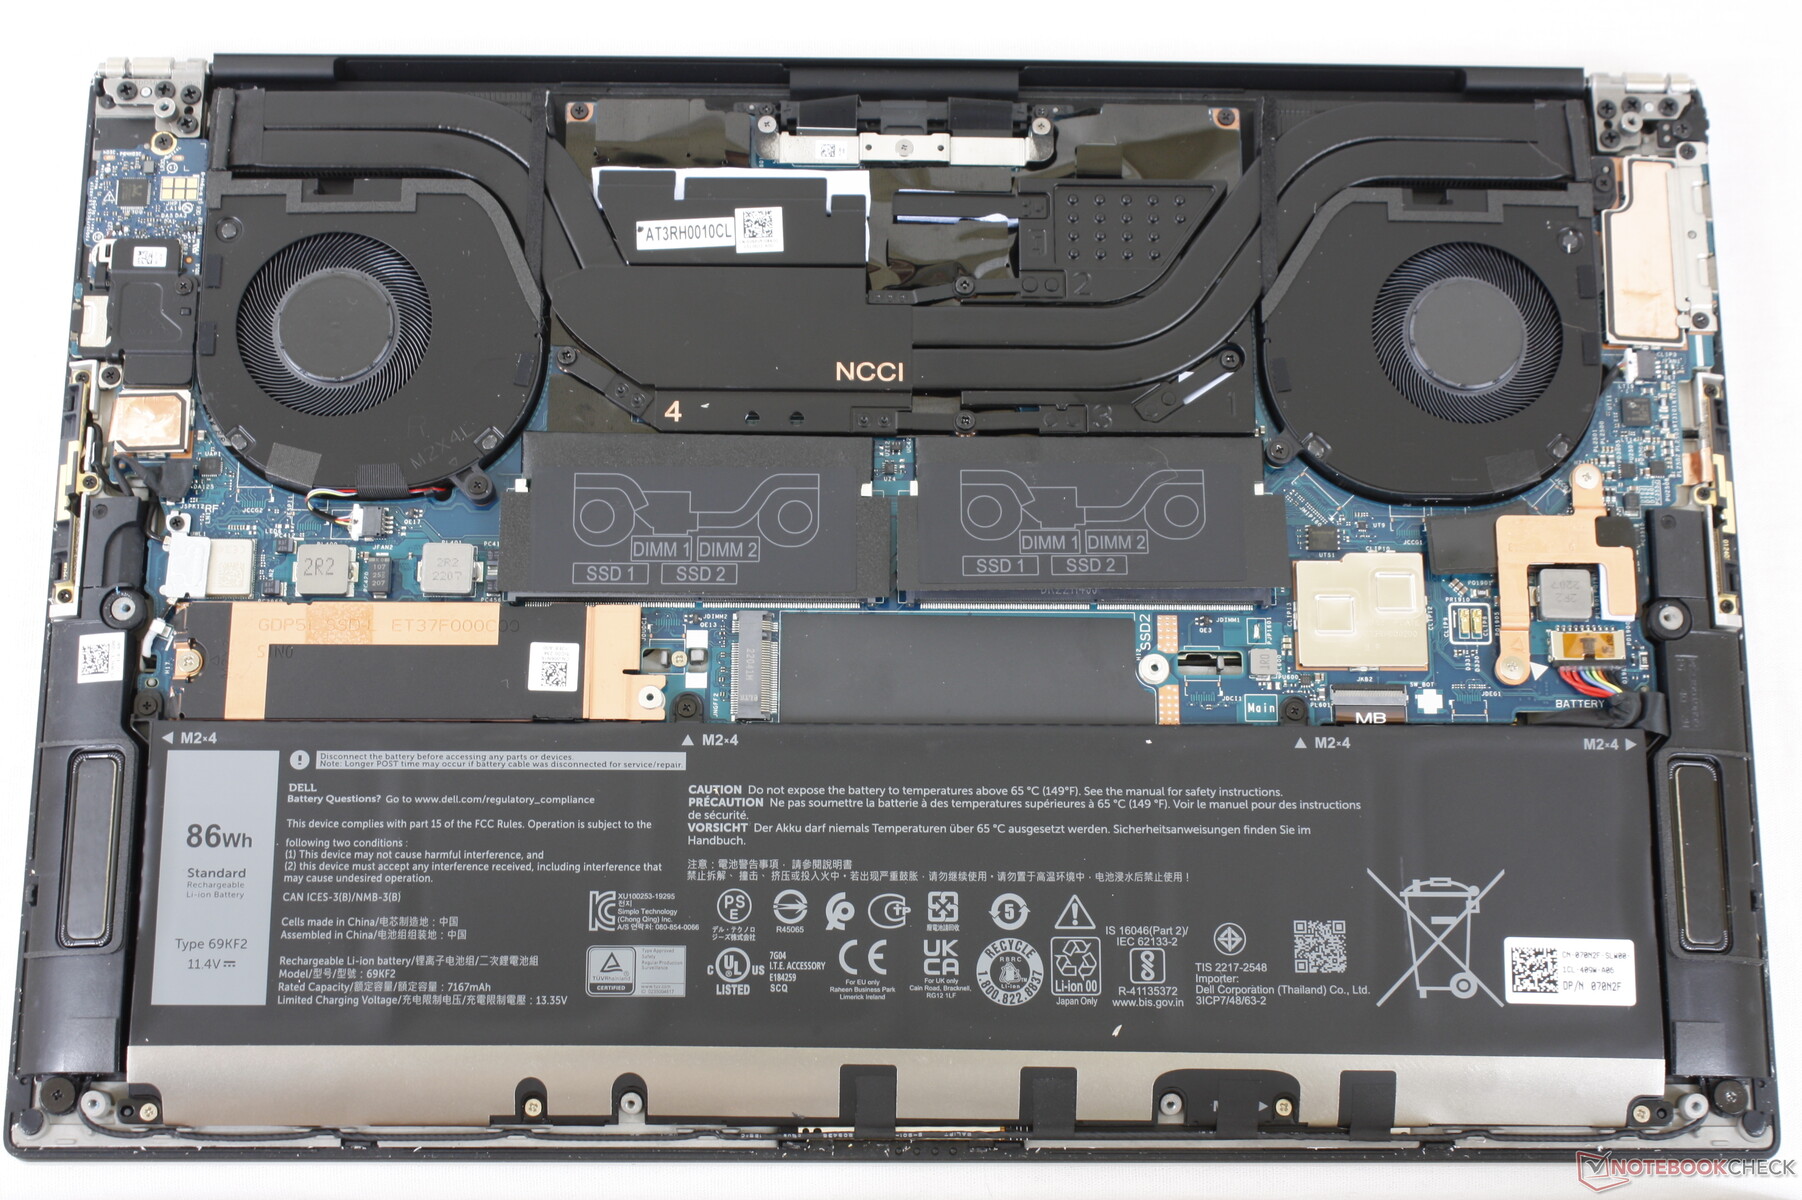
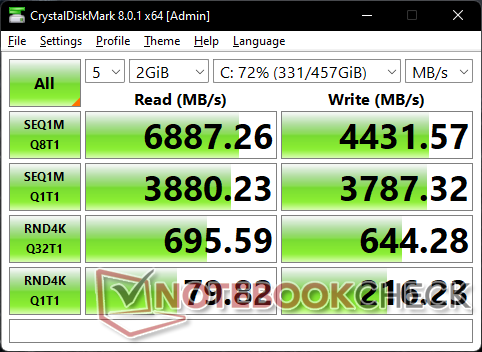
Dispositivos de armazenamento - Suporta até duas SSDs PCIe4 NVMe
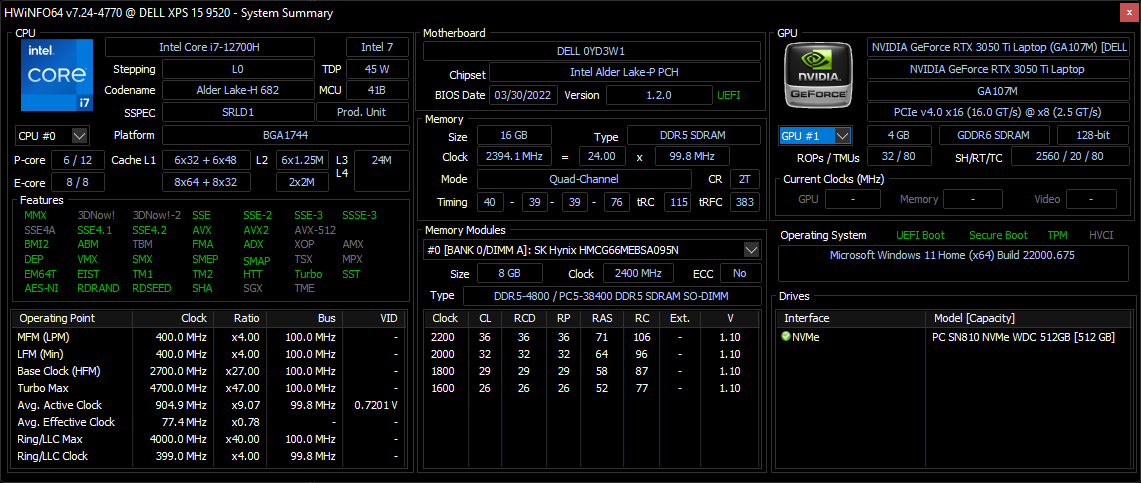
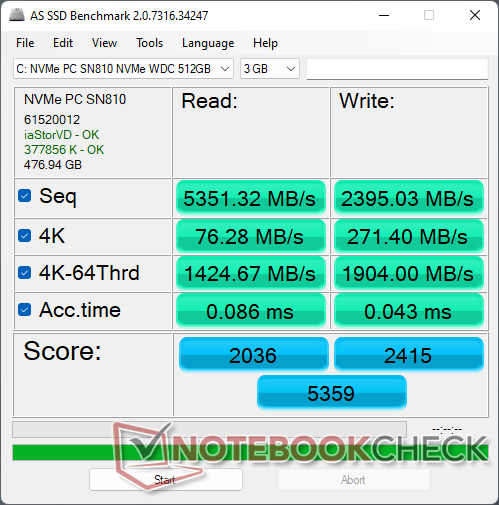
Nossa unidade de teste é fornecida com um PCIe4 x4 Western Digital SN810 NVMe SSD ao contrário das soluções PCIe3 x4 em modelos mais antigos. As taxas de transferência são significativamente mais rápidas como resultado, em até ~6700 MB/s ou mais do dobro da maioria das unidades PCIe3. O SN810 em nossa unidade não teria problemas em manter sua taxa máxima de transferência por períodos prolongados quando estressado sob o DiskSpd para sugerir uma excelente dissipação de calor.

* ... menor é melhor
Disk Throttling: DiskSpd Read Loop, Queue Depth 8
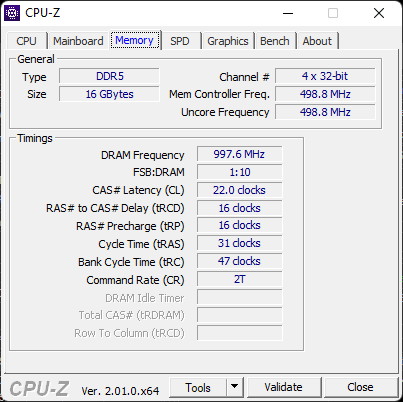
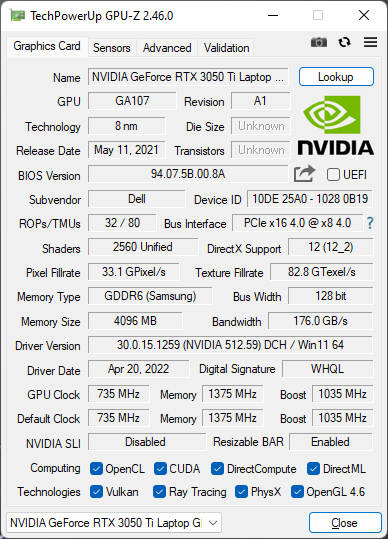
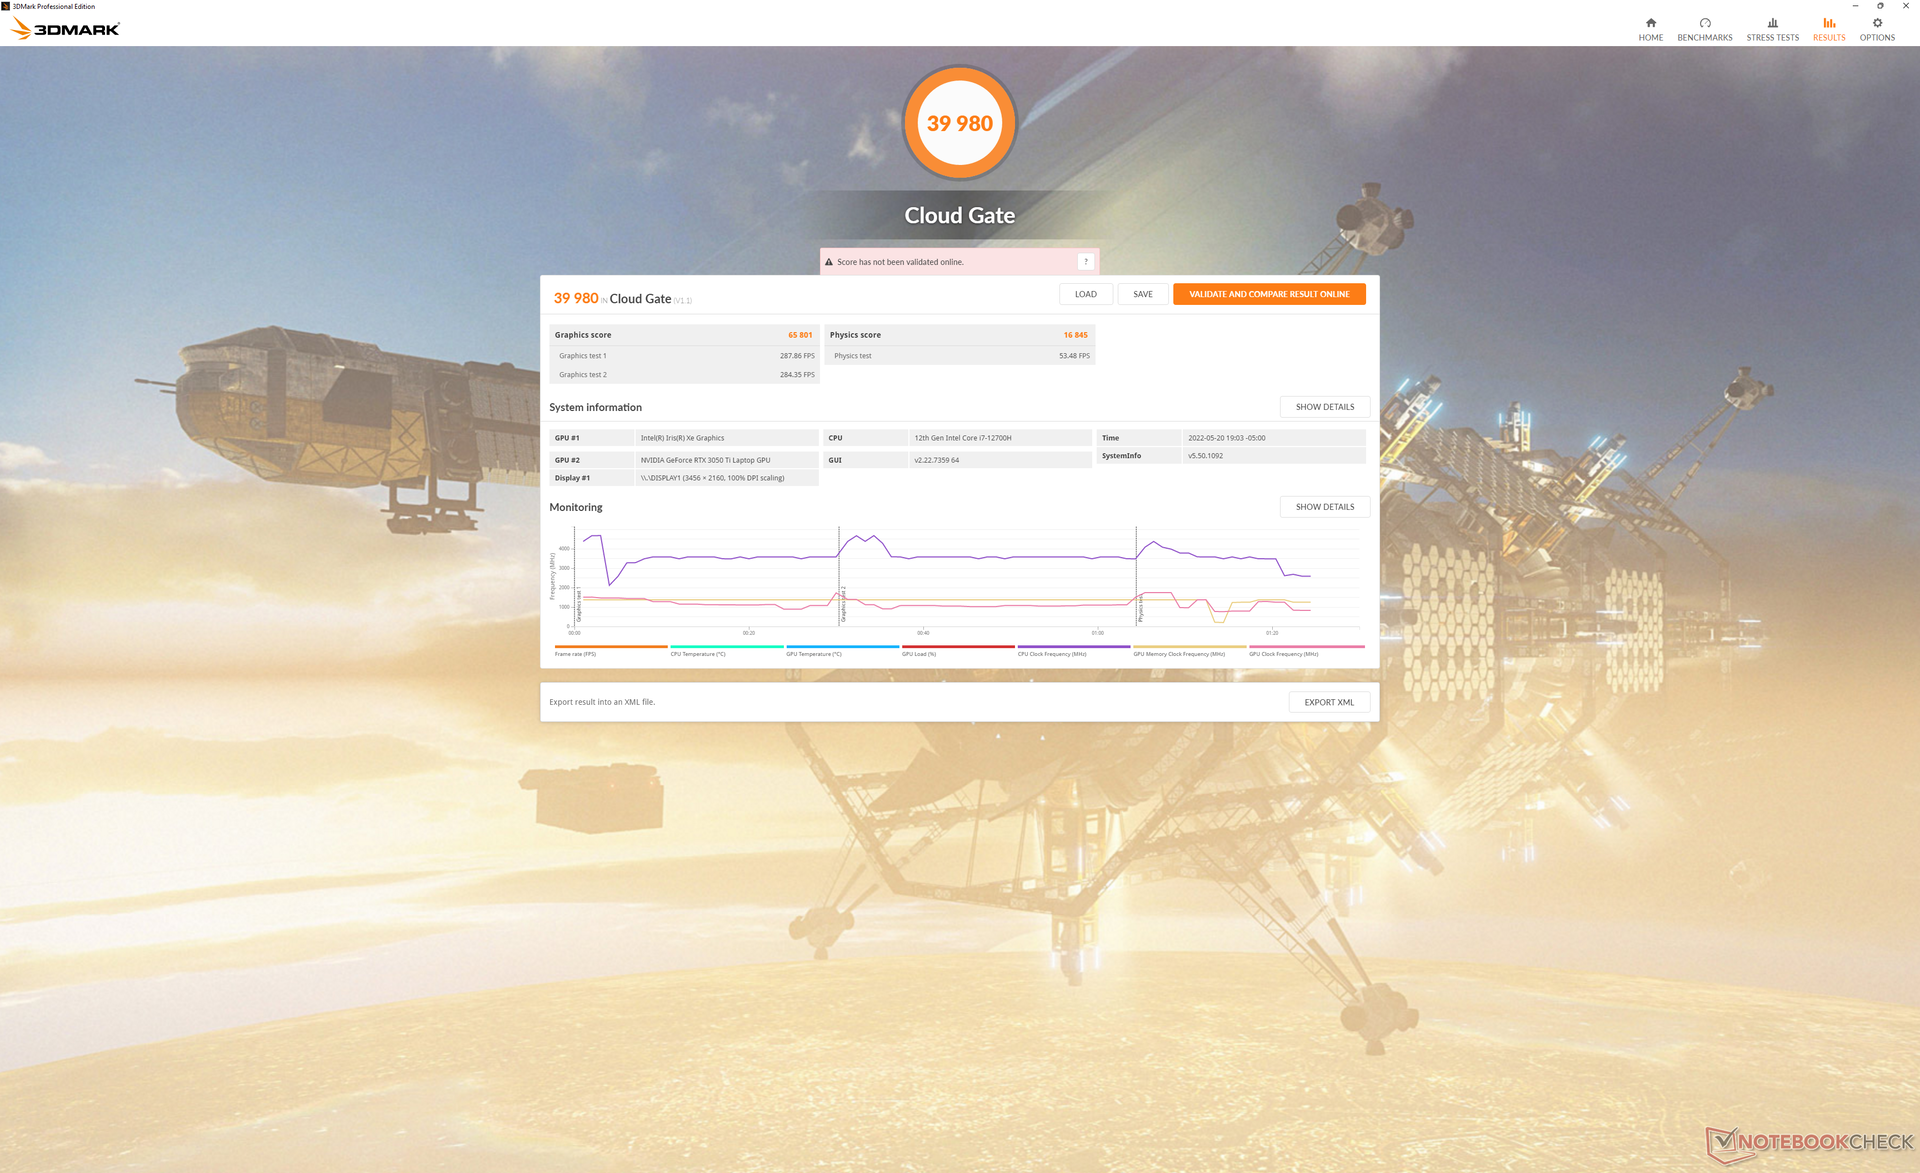
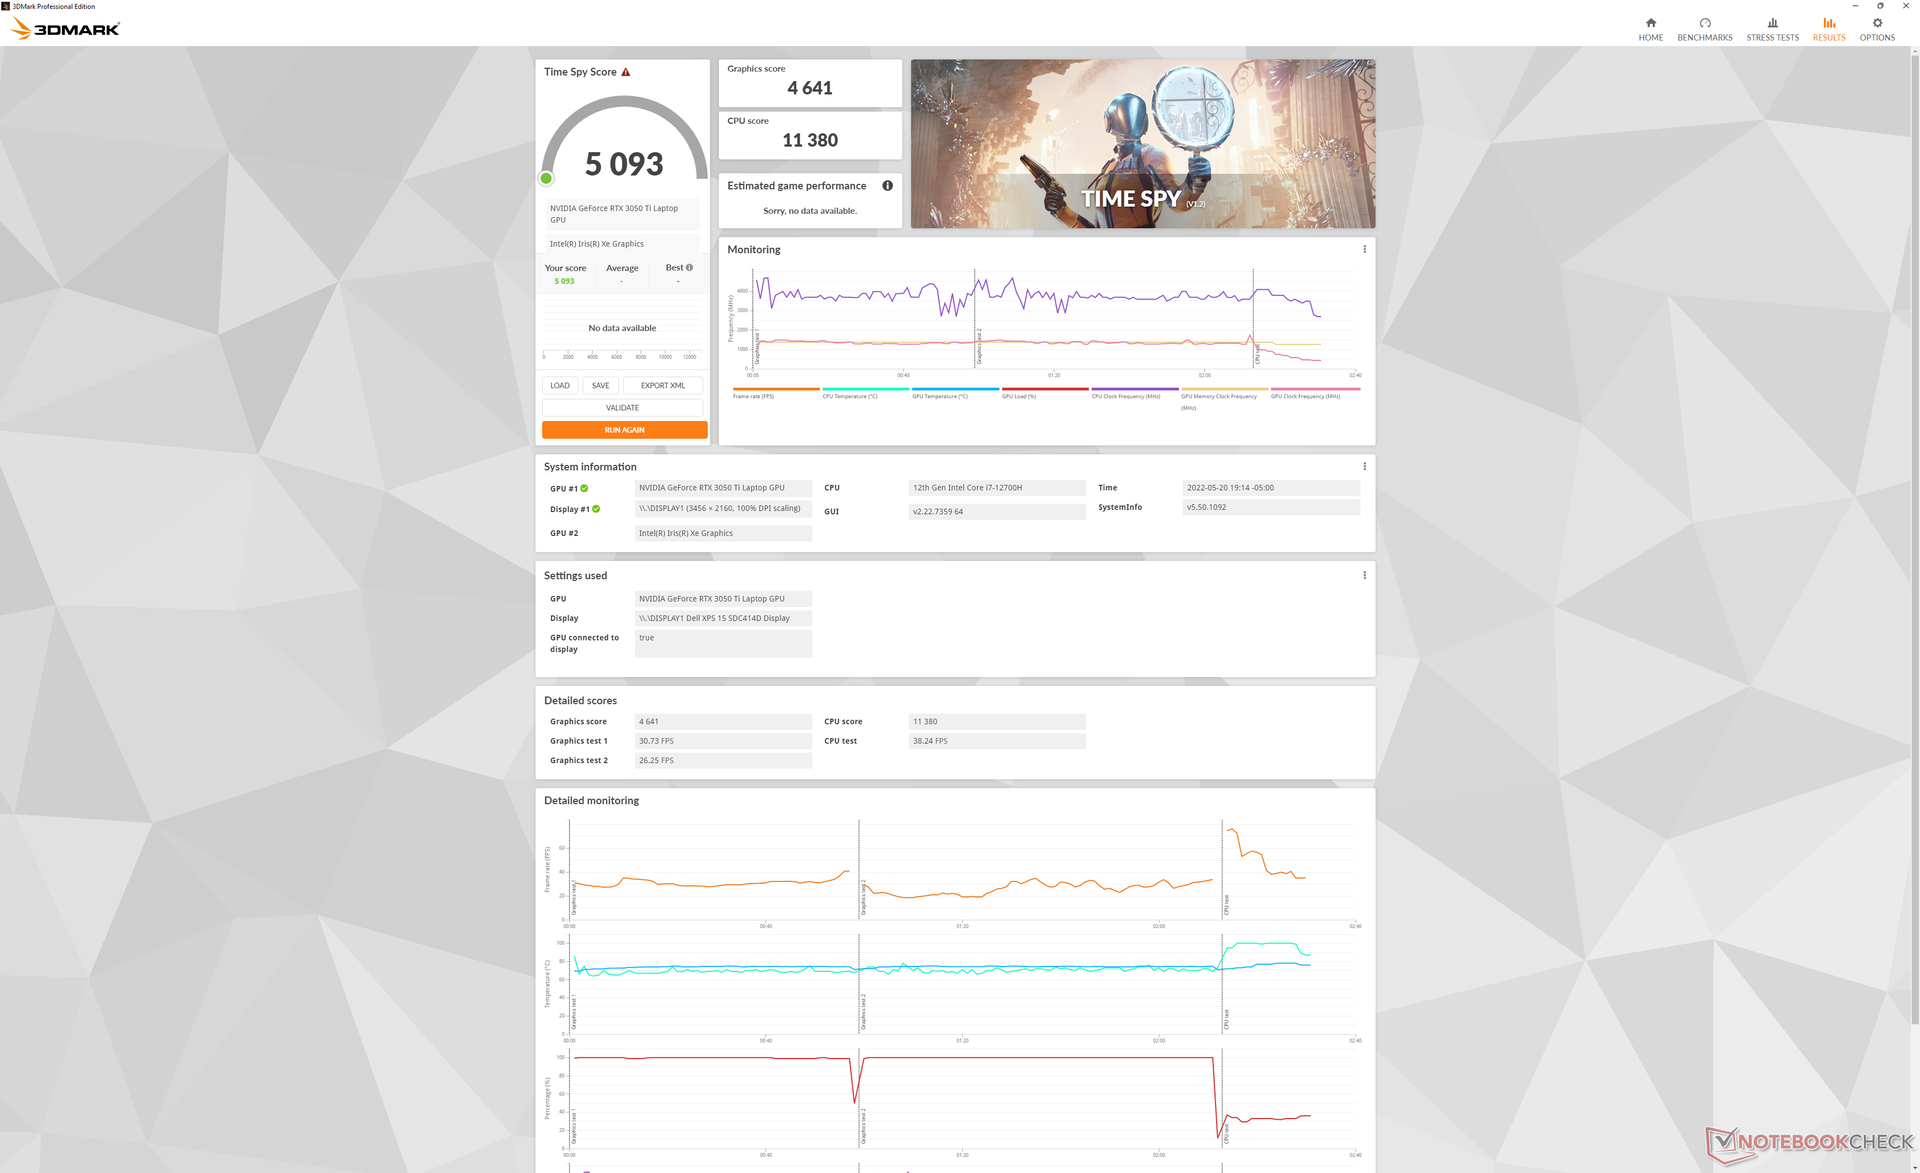
Desempenho da GPU - GeForce RTX 3050 Ti Pelo Segundo Ano em Uma Fileira
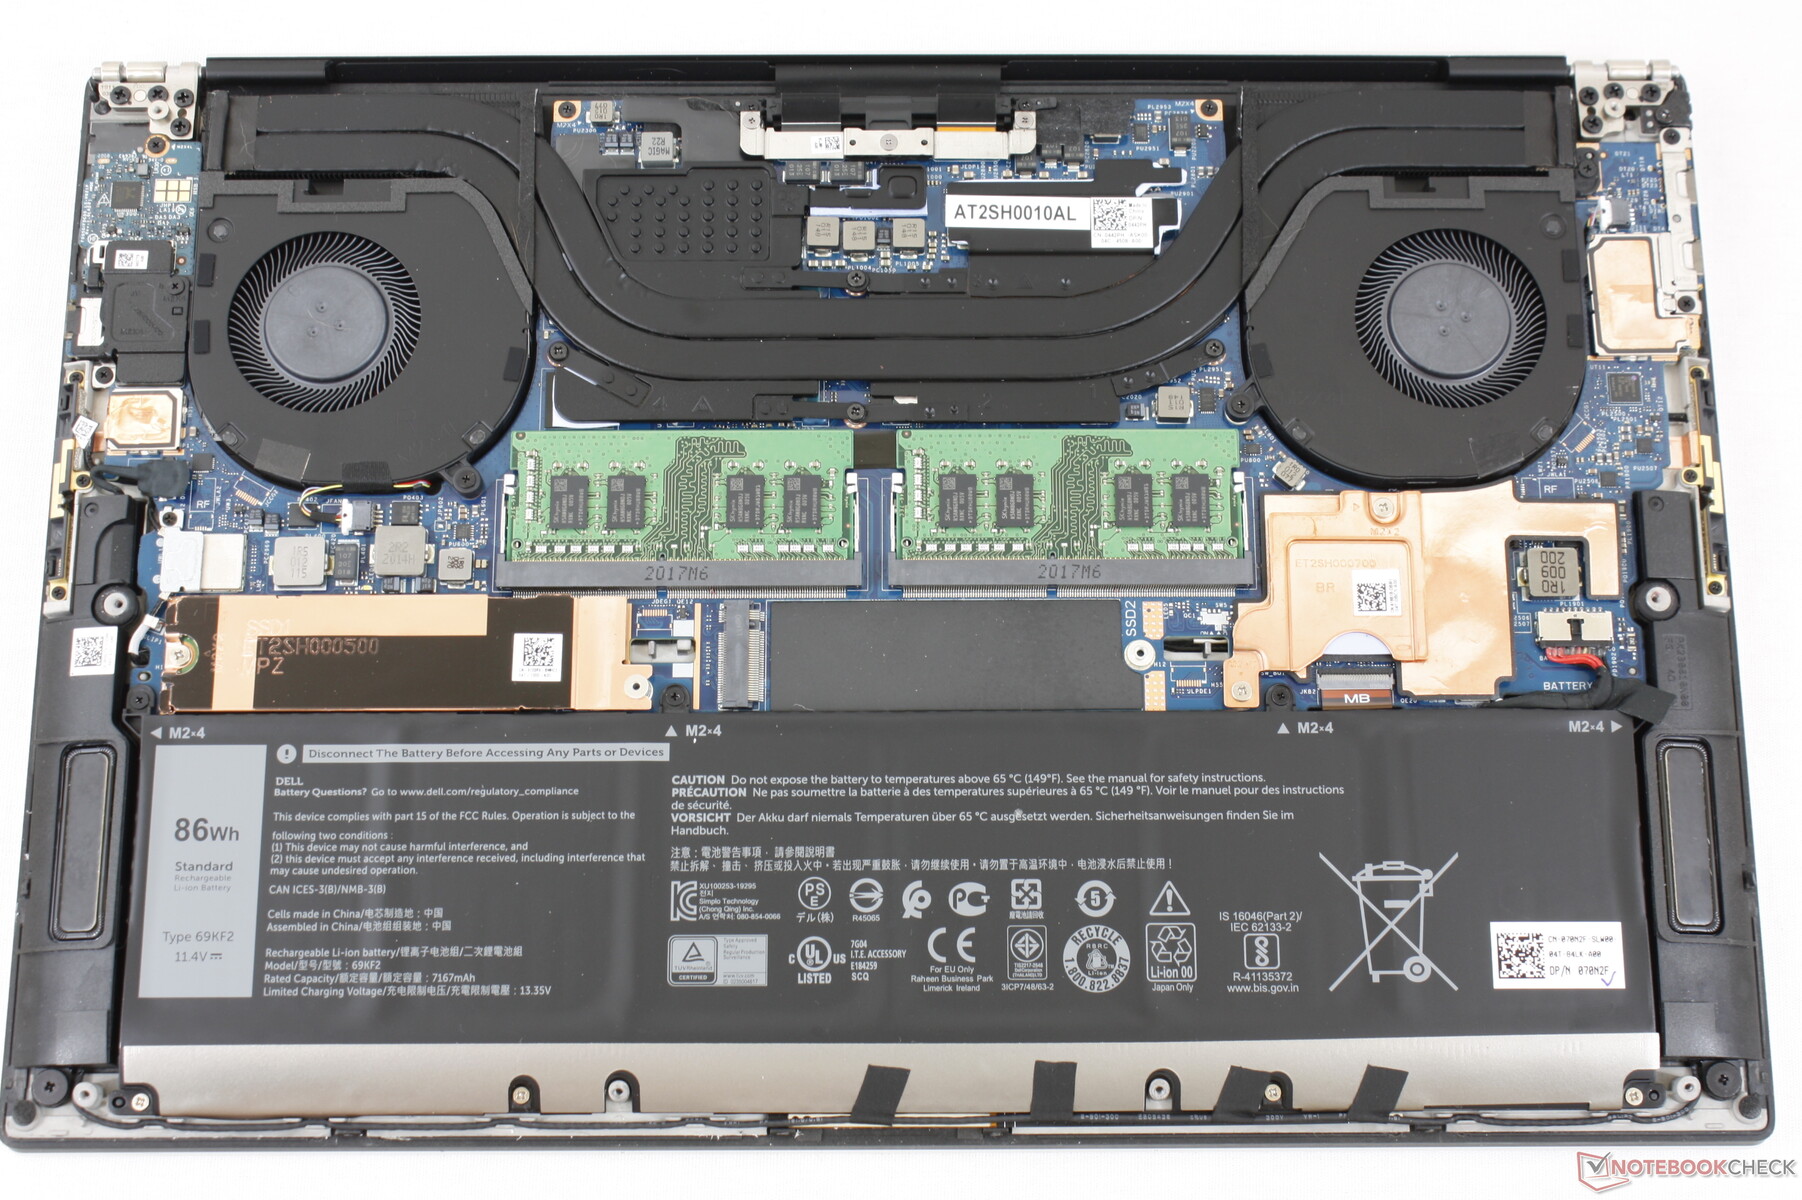
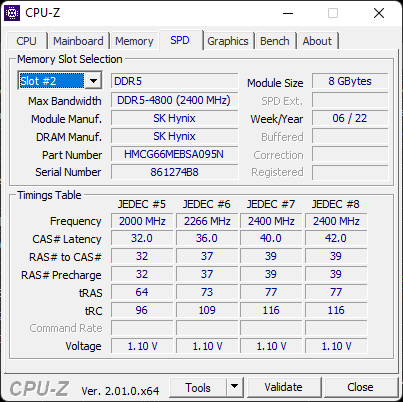
O XPS 15 9520 vem com RAM mais rápida do que no XPS 15 9510 (DDR5-4800 vs. DDR4-3200) o que deve levar a um desempenho gráfico ligeiramente mais rápido. Infelizmente, a Dell baixou a taxa de clock da GPU de 1530 MHz no XPS 15 9510 para 1035 MHz no 9520 e, portanto, qualquer ganho potencial de desempenho da RAM mais rápida foi cancelado GeForce RTX 3050 Ti os resultados do 3DMark entre o XPS 15 9510 e 9520 são quase idênticos.
O desempenho gráfico permanece cerca de 20 a 30 por cento mais rápido do que o GTX 1650 Ti sobre o antigo XPS 15 9500.
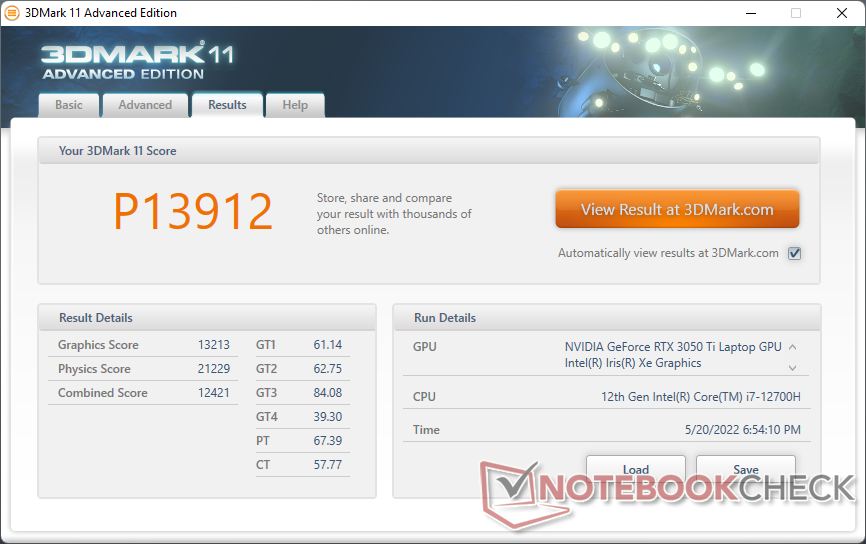
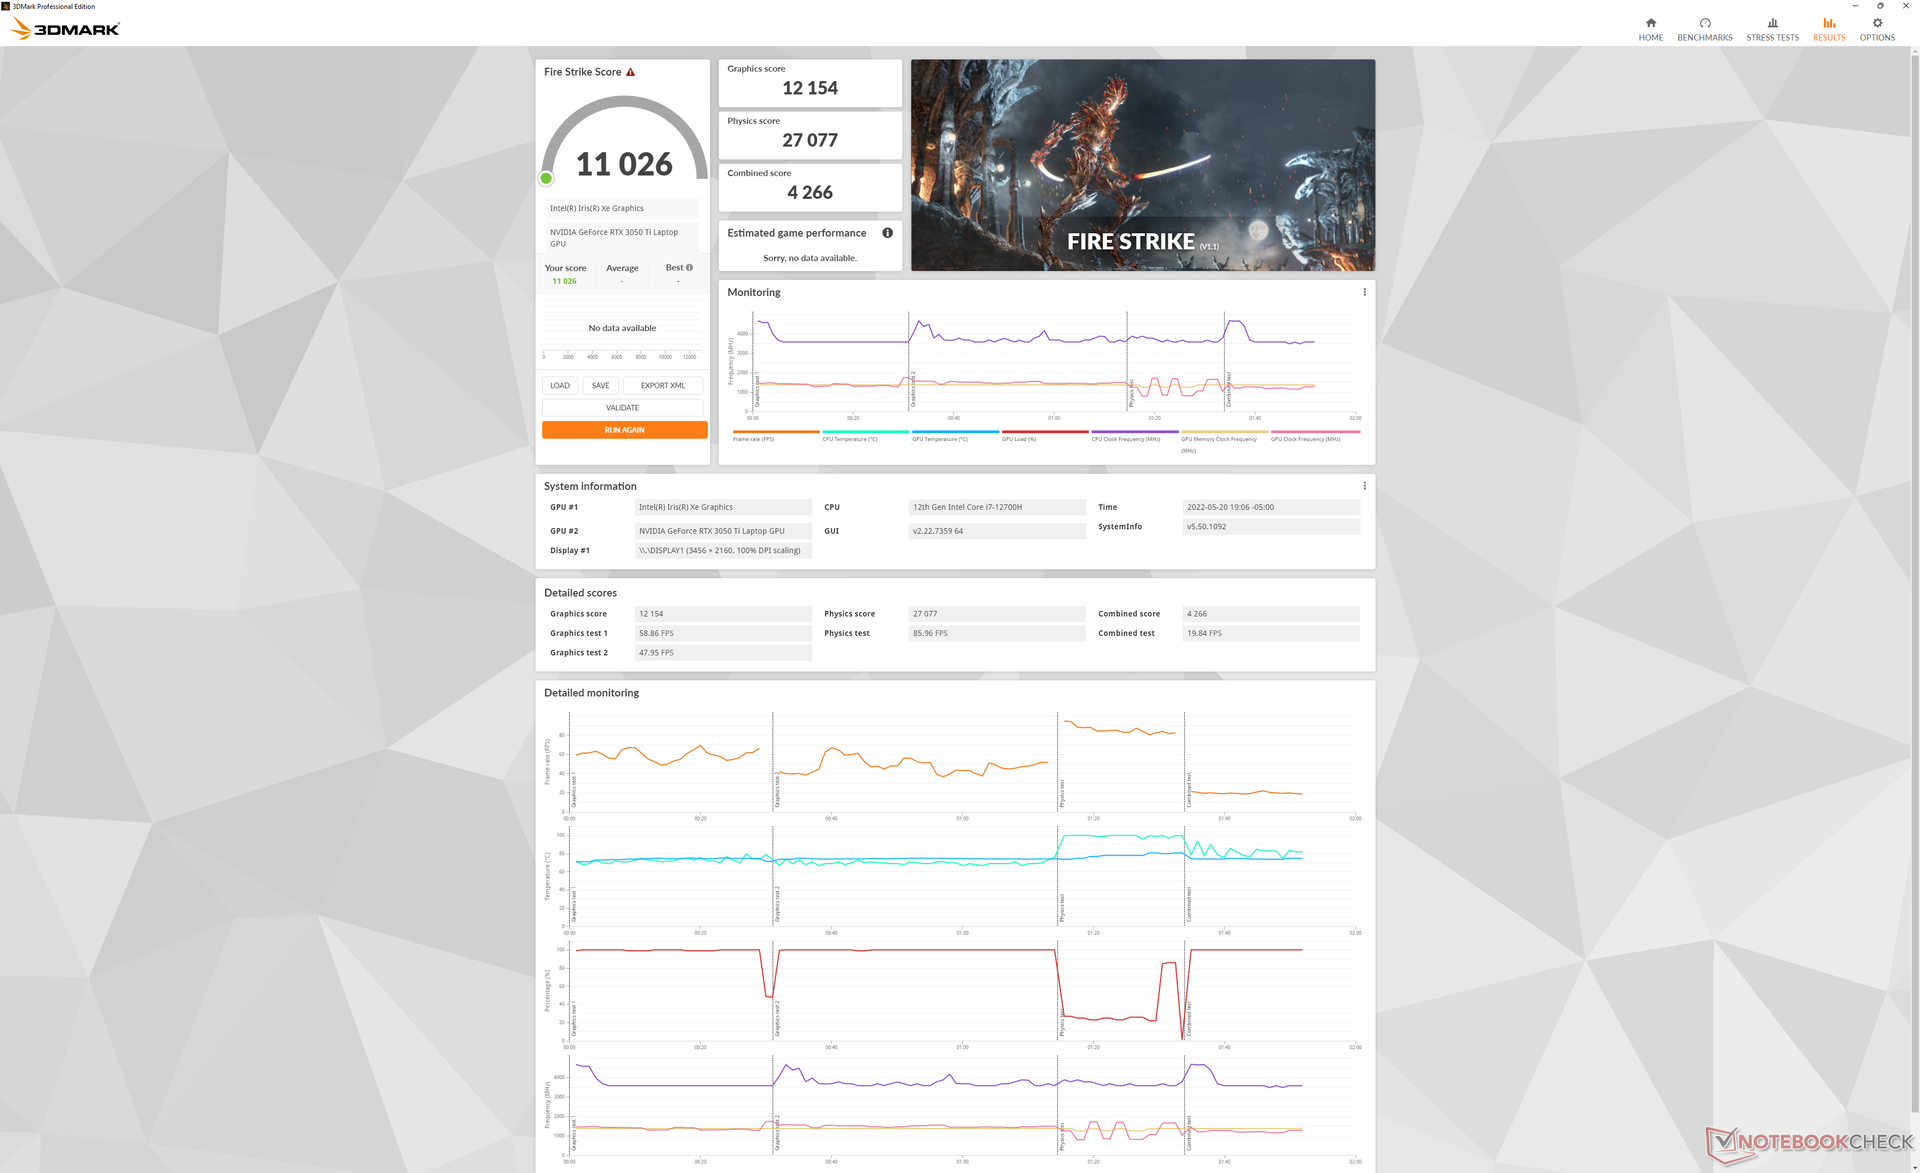
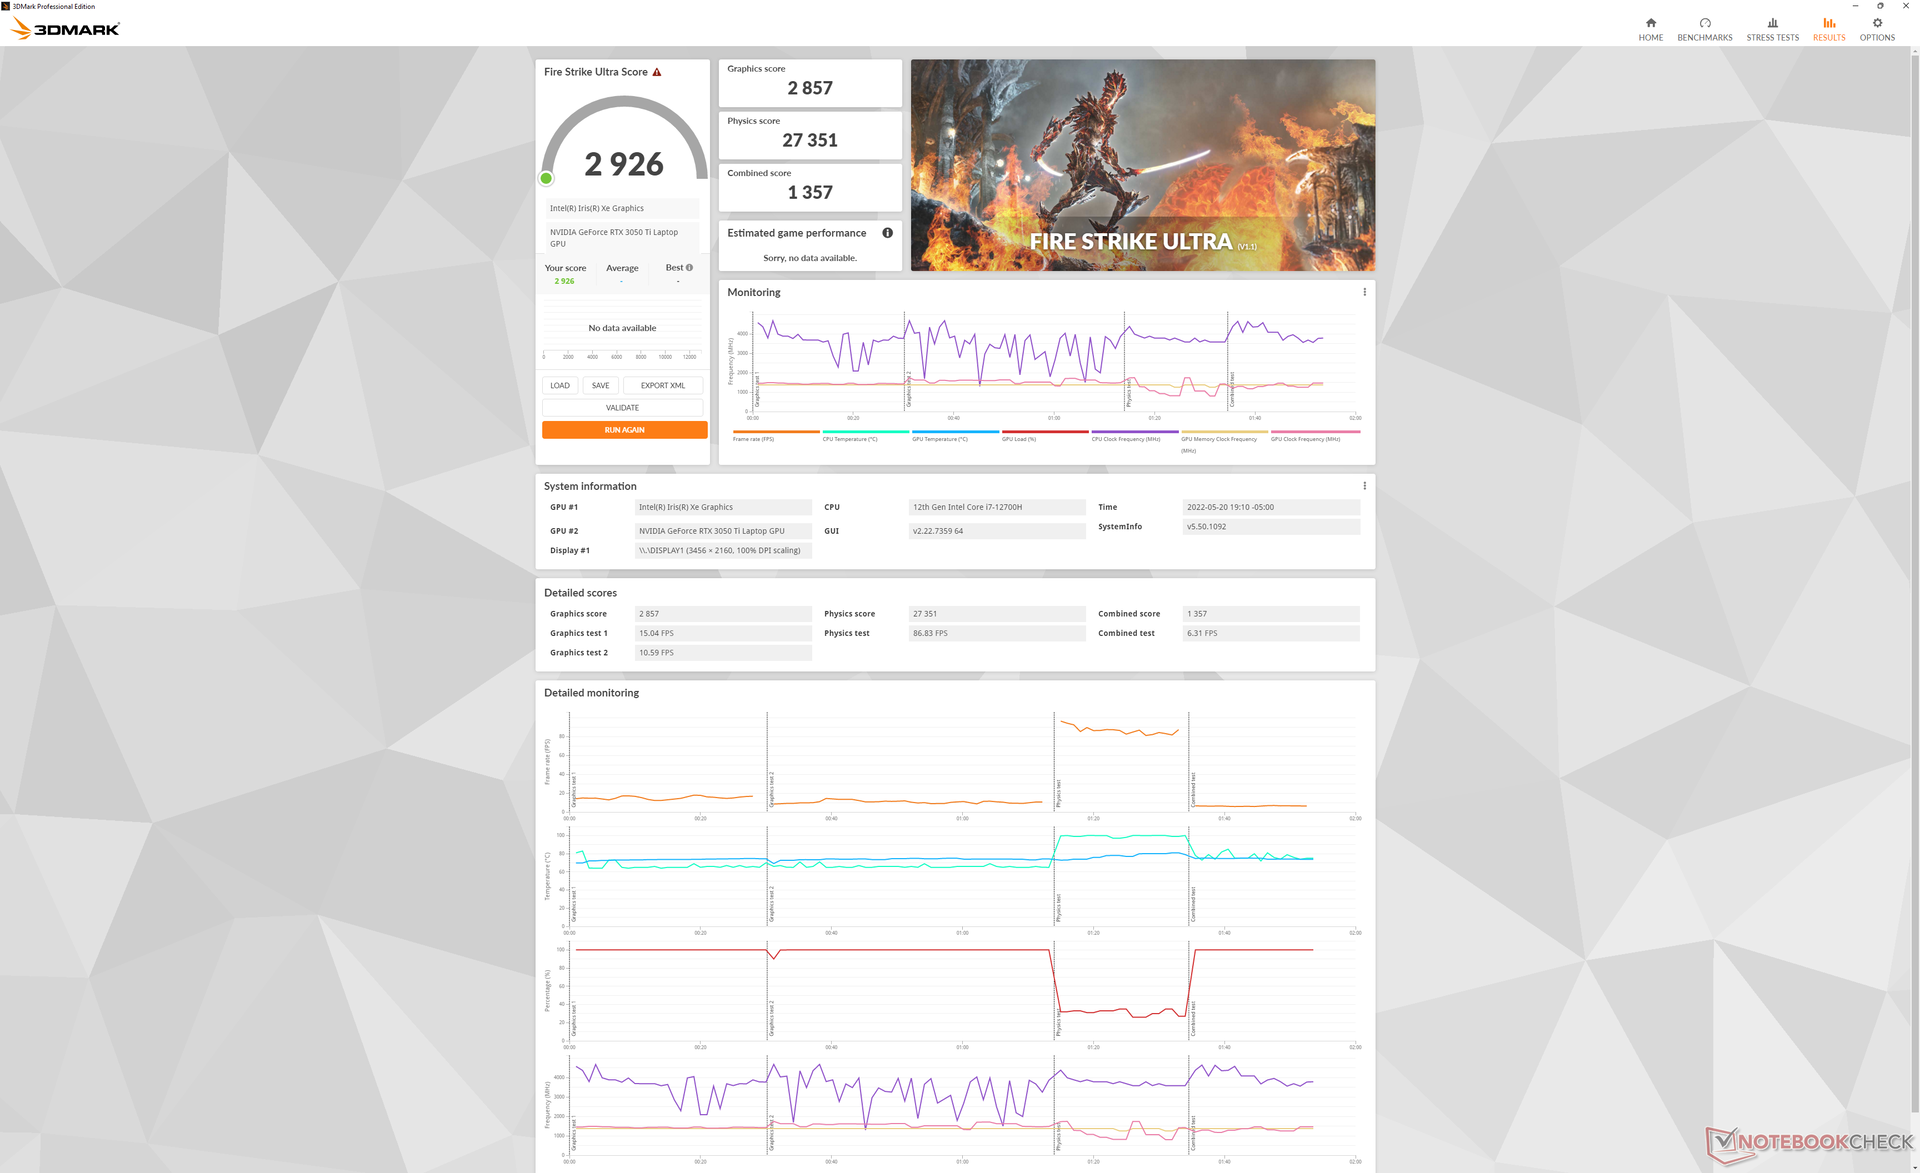
| 3DMark 11 Performance | 13912 pontos | |
| 3DMark Cloud Gate Standard Score | 39980 pontos | |
| 3DMark Fire Strike Score | 11026 pontos | |
| 3DMark Time Spy Score | 5093 pontos | |
Ajuda | ||
| Cyberpunk 2077 1.6 | |
| 1920x1080 Low Preset | |
| Asus Zenbook Pro 15 OLED UM535Q | |
| Média NVIDIA GeForce RTX 3050 Ti Laptop GPU (48.2 - 81.9, n=9) | |
| Dell XPS 15 9520 RTX 3050 Ti | |
| 1920x1080 Medium Preset | |
| Asus Zenbook Pro 15 OLED UM535Q | |
| Média NVIDIA GeForce RTX 3050 Ti Laptop GPU (47.4 - 67.4, n=9) | |
| Dell XPS 15 9520 RTX 3050 Ti | |
| 1920x1080 High Preset | |
| Média NVIDIA GeForce RTX 3050 Ti Laptop GPU (39 - 51.5, n=9) | |
| Asus Zenbook Pro 15 OLED UM535Q | |
| Dell XPS 15 9520 RTX 3050 Ti | |
| 1920x1080 Ultra Preset | |
| Asus Zenbook Pro 15 OLED UM535Q | |
| Média NVIDIA GeForce RTX 3050 Ti Laptop GPU (31 - 50.5, n=9) | |
| Dell XPS 15 9520 RTX 3050 Ti | |
Witcher 3 FPS Chart
| baixo | média | alto | ultra | QHD | 4K | |
|---|---|---|---|---|---|---|
| GTA V (2015) | 185 | 181.3 | 90.3 | 49.9 | 37.4 | |
| The Witcher 3 (2015) | 226.5 | 127.1 | 62.4 | 34.2 | ||
| Dota 2 Reborn (2015) | 180.3 | 166.1 | 116.1 | 104.5 | 47.1 | |
| Final Fantasy XV Benchmark (2018) | 106.6 | 62.9 | 45.7 | 34.1 | ||
| X-Plane 11.11 (2018) | 137.6 | 117 | 100.6 | 73.7 | ||
| Strange Brigade (2018) | 206 | 109.6 | 91.1 | 79.4 | 60.4 | |
| Cyberpunk 2077 1.6 (2022) | 59.4 | 47.4 | 39.3 | 39.5 | 20.2 |
Emissões
Ruído do sistema
O ruído dos ventiladores parece ser mais silencioso do que nos modelos XPS mais antigos quando submetidos a cargas similares. Ou, no mínimo, leva um pouco mais de tempo para que os ventiladores do modelo 9520 subam em RPMs quando são introduzidas cargas exigentes. Ao final da primeira cena de referência 3DMark 06, por exemplo, o ruído dos ventiladores seria de apenas 31 dB(A) comparado a 36 dB(A) e 46 dB(A) no XPS 15 9510 e 9500, respectivamente. O sistema ainda é mais silencioso do que o esperado na maioria das condições, mesmo quando configurado para o modo Ultra Performance.
Barulho
| Ocioso |
| 22.9 / 22.9 / 22.9 dB |
| Carga |
| 30.9 / 44.7 dB |
 | ||
30 dB silencioso 40 dB(A) audível 50 dB(A) ruidosamente alto |
||
min: | ||
| Dell XPS 15 9520 RTX 3050 Ti GeForce RTX 3050 Ti Laptop GPU, i7-12700H, WDC PC SN810 512GB | Dell XPS 15 9510 11800H RTX 3050 Ti OLED GeForce RTX 3050 Ti Laptop GPU, i7-11800H, Micron 2300 512GB MTFDHBA512TDV | Dell XPS 15 9500 Core i7 4K UHD GeForce GTX 1650 Ti Mobile, i7-10875H, SK Hynix PC611 512GB | HP Spectre X360 15-5ZV31AV GeForce MX250, i7-10510U, Intel SSD 660p 2TB SSDPEKNW020T8 | Asus Zenbook Pro 15 OLED UM535Q GeForce RTX 3050 Ti Laptop GPU, R9 5900HX, WDC PC SN730 SDBPNTY-1T00 | MSI Stealth 15M A11SEK GeForce RTX 2060 Max-Q, i7-1185G7, WDC PC SN530 SDBPNPZ-1T00 | |
|---|---|---|---|---|---|---|
| Noise | -2% | -23% | -17% | -7% | -34% | |
| desligado / ambiente * (dB) | 22.8 | 23.8 -4% | 28.4 -25% | 30.1 -32% | 22.8 -0% | 27.5 -21% |
| Idle Minimum * (dB) | 22.9 | 23.8 -4% | 28.4 -24% | 30.1 -31% | 22.9 -0% | 32.3 -41% |
| Idle Average * (dB) | 22.9 | 23.8 -4% | 28.4 -24% | 30.1 -31% | 22.9 -0% | 32.3 -41% |
| Idle Maximum * (dB) | 22.9 | 23.8 -4% | 28.4 -24% | 30.1 -31% | 22.9 -0% | 33.7 -47% |
| Load Average * (dB) | 30.9 | 36 -17% | 46 -49% | 30.1 3% | 33.2 -7% | 46.3 -50% |
| Witcher 3 ultra * (dB) | 37.8 | 36 5% | 42 -11% | 39.7 -5% | 47.3 -25% | 41.3 -9% |
| Load Maximum * (dB) | 44.7 | 38.2 15% | 47.1 -5% | 42 6% | 52.8 -18% | 56.2 -26% |
* ... menor é melhor
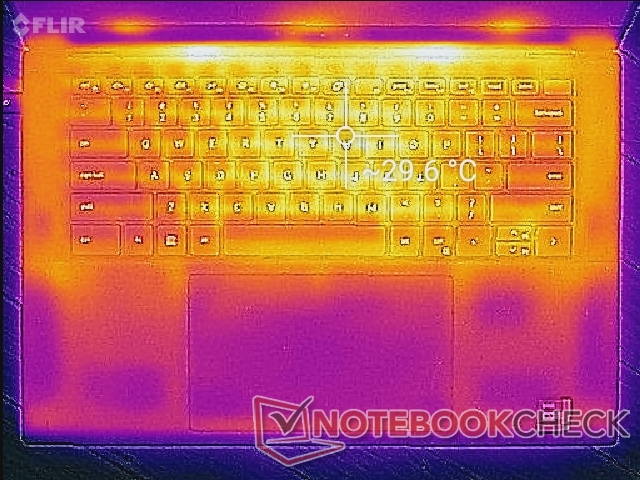
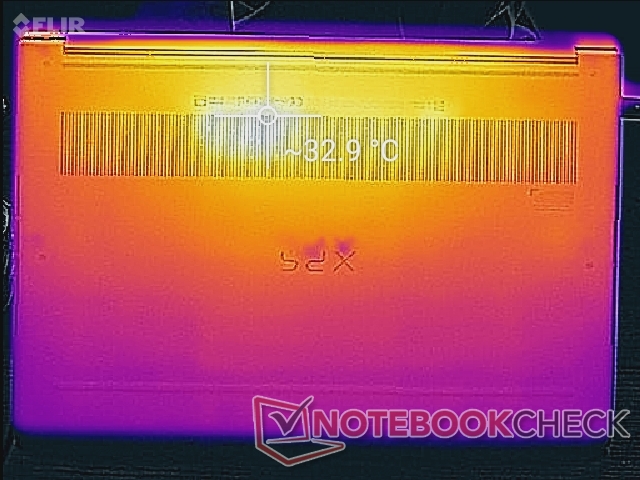
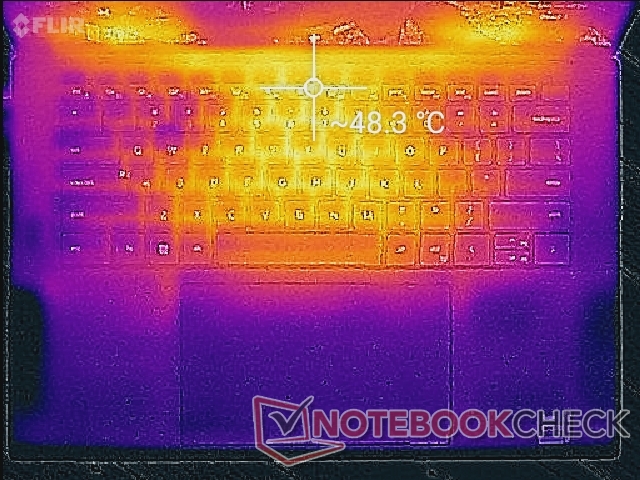
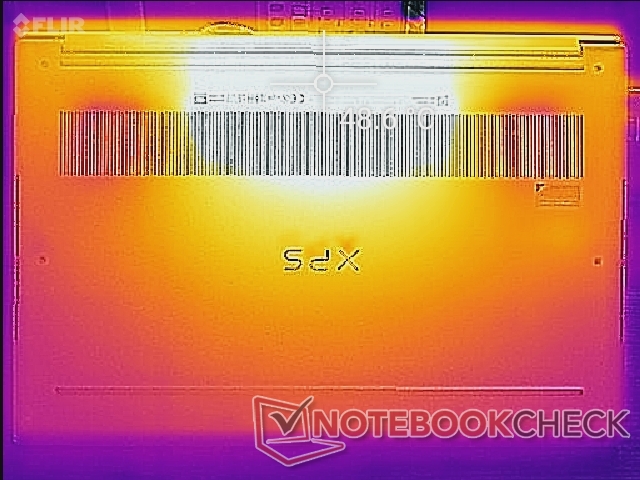
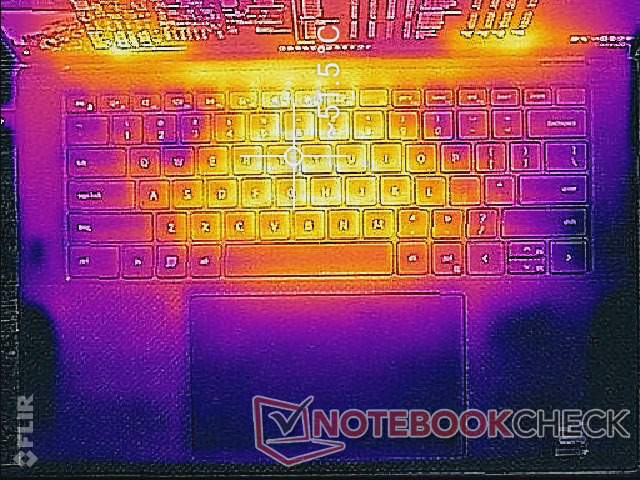
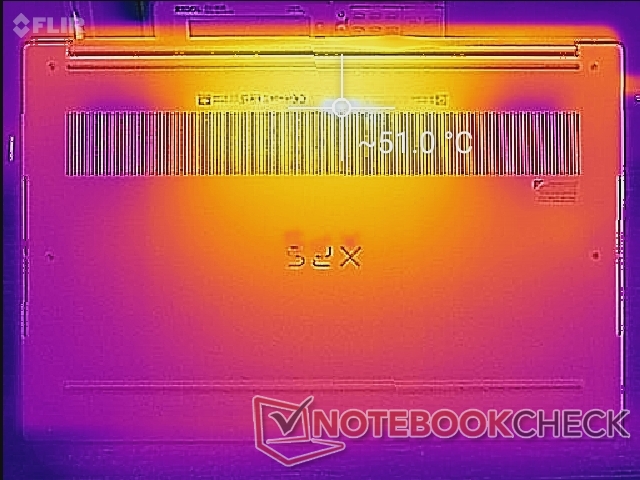
Temperatura - Ligeiramente mais quente em geral
As temperaturas de superfície quando sob carga são mais quentes do que as que registramos nos modelos mais antigos XPS 15 9510 e 9500. Os pontos quentes podem atingir 51 C a 52 C na parte superior e inferior, respectivamente, em comparação com 44 C a 47 C em cada uma das versões anteriores. Pontos quentes em concorrentes como o Zenbook Pro 15 OLED são mais frios em alguns graus C quando em condições similares. Afinal, o XPS 9520 é um dos menores laptops Core H do mercado, com 15,6 polegadas.
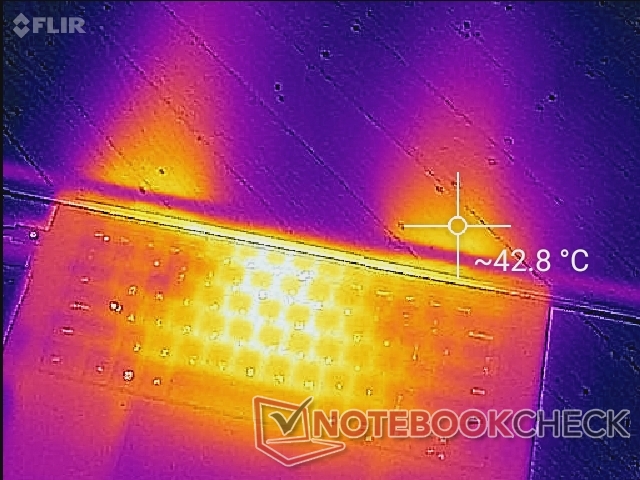
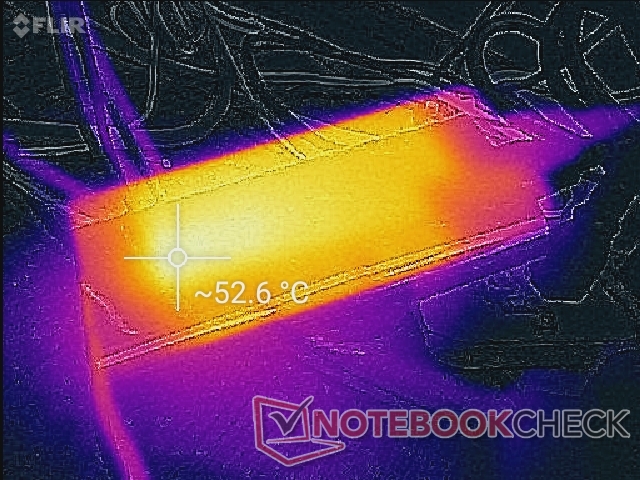
(-) A temperatura máxima no lado superior é 51.4 °C / 125 F, em comparação com a média de 36.8 °C / 98 F , variando de 21 a 71 °C para a classe Multimedia.
(-) A parte inferior aquece até um máximo de 51 °C / 124 F, em comparação com a média de 39.1 °C / 102 F
(+) Em uso inativo, a temperatura média para o lado superior é 27.8 °C / 82 F, em comparação com a média do dispositivo de 31.3 °C / ### class_avg_f### F.
(±) Jogando The Witcher 3, a temperatura média para o lado superior é 35.2 °C / 95 F, em comparação com a média do dispositivo de 31.3 °C / ## #class_avg_f### F.
(+) Os apoios para as mãos e o touchpad são mais frios que a temperatura da pele, com um máximo de 31.6 °C / 88.9 F e, portanto, são frios ao toque.
(-) A temperatura média da área do apoio para as mãos de dispositivos semelhantes foi 28.7 °C / 83.7 F (-2.9 °C / -5.2 F).
| Dell XPS 15 9520 RTX 3050 Ti Intel Core i7-12700H, NVIDIA GeForce RTX 3050 Ti Laptop GPU | Dell XPS 15 9510 11800H RTX 3050 Ti OLED Intel Core i7-11800H, NVIDIA GeForce RTX 3050 Ti Laptop GPU | Dell XPS 15 9500 Core i7 4K UHD Intel Core i7-10875H, NVIDIA GeForce GTX 1650 Ti Mobile | HP Spectre X360 15-5ZV31AV Intel Core i7-10510U, NVIDIA GeForce MX250 | Asus Zenbook Pro 15 OLED UM535Q AMD Ryzen 9 5900HX, NVIDIA GeForce RTX 3050 Ti Laptop GPU | MSI Stealth 15M A11SEK Intel Core i7-1185G7, NVIDIA GeForce RTX 2060 Max-Q | |
|---|---|---|---|---|---|---|
| Heat | 13% | 3% | 17% | -1% | 10% | |
| Maximum Upper Side * (°C) | 51.4 | 45.5 11% | 44 14% | 47 9% | 36 30% | 47.2 8% |
| Maximum Bottom * (°C) | 51 | 44.2 13% | 48.8 4% | 47.4 7% | 47.2 7% | 47.4 7% |
| Idle Upper Side * (°C) | 30 | 27 10% | 33 -10% | 22.8 24% | 37 -23% | 27.2 9% |
| Idle Bottom * (°C) | 33 | 26.7 19% | 32.4 2% | 23.6 28% | 39.2 -19% | 28.2 15% |
* ... menor é melhor
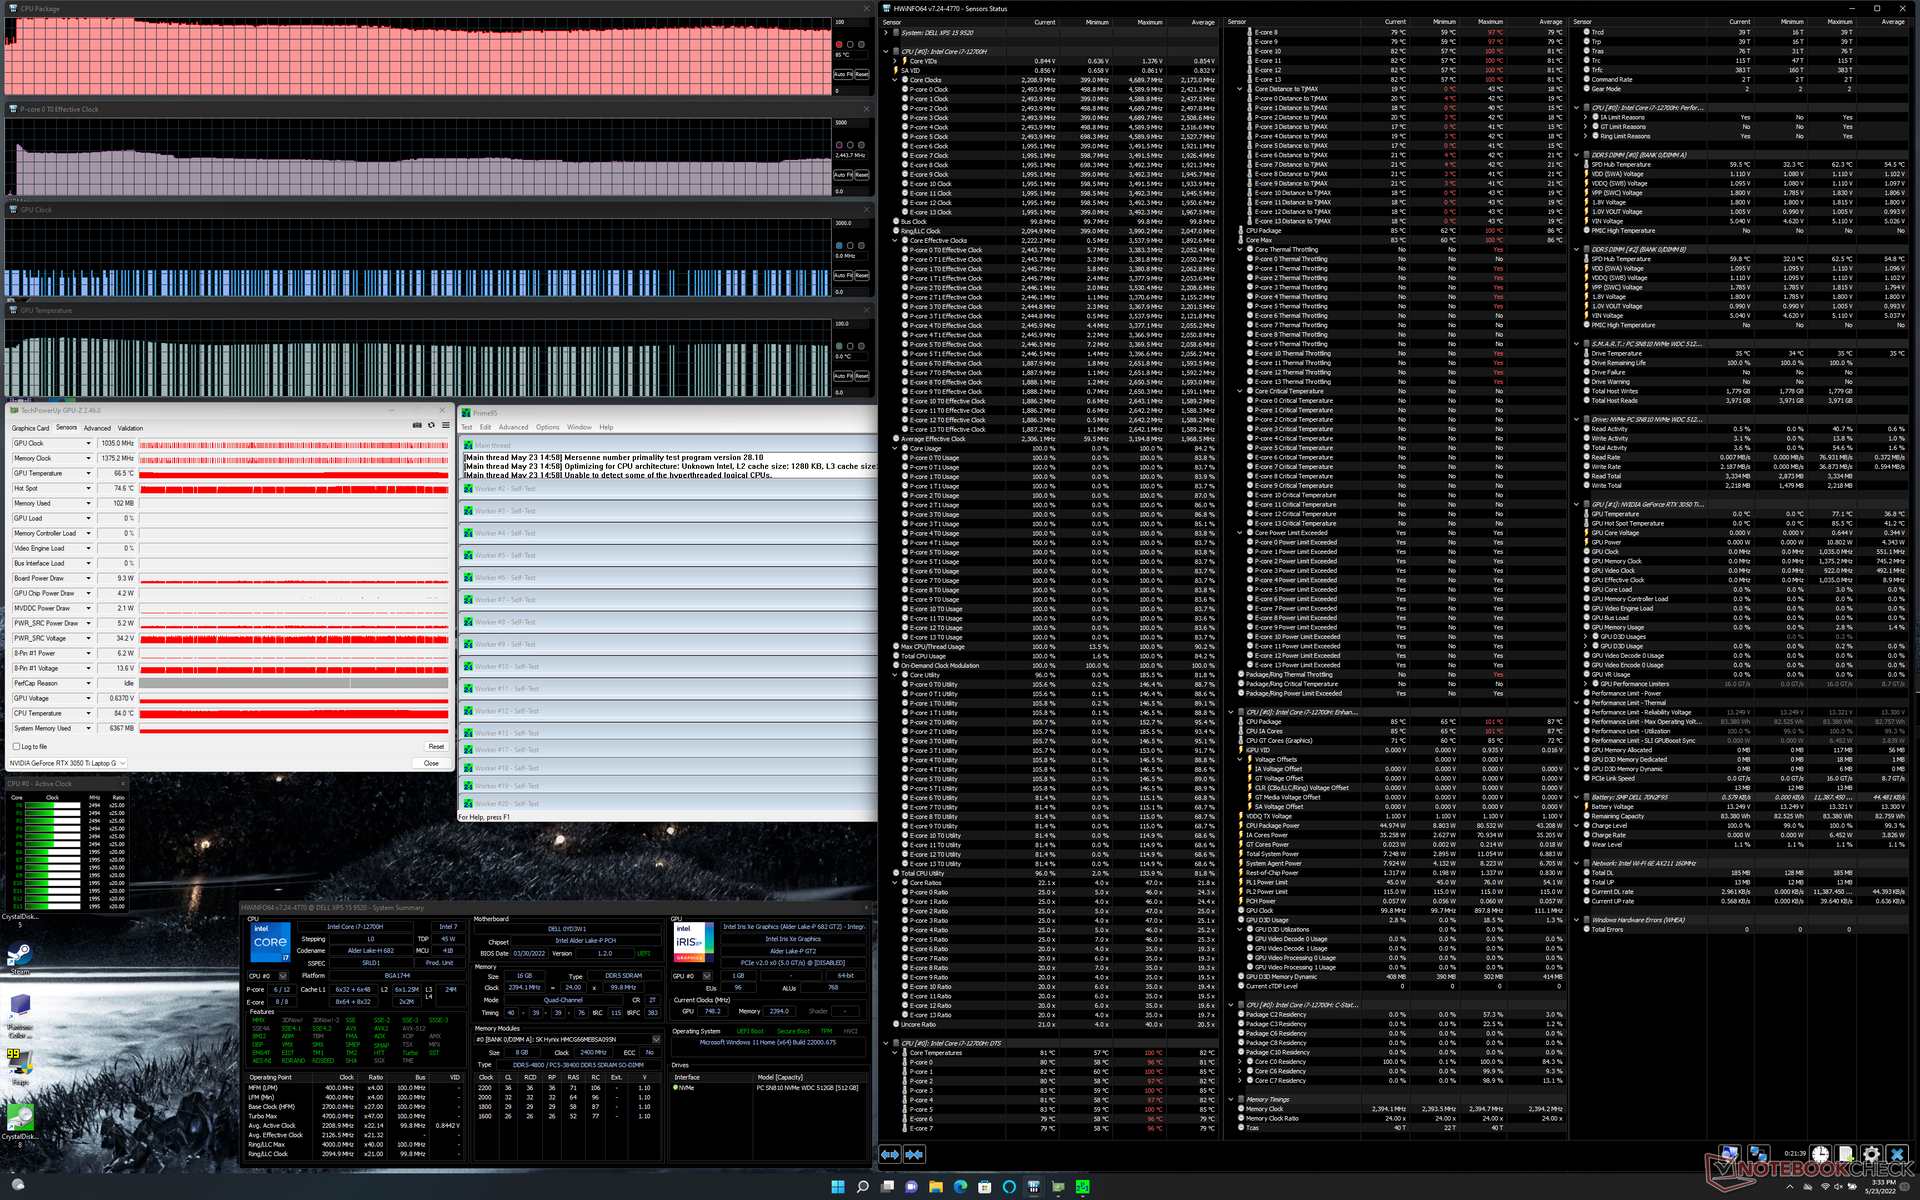
Teste de estresse
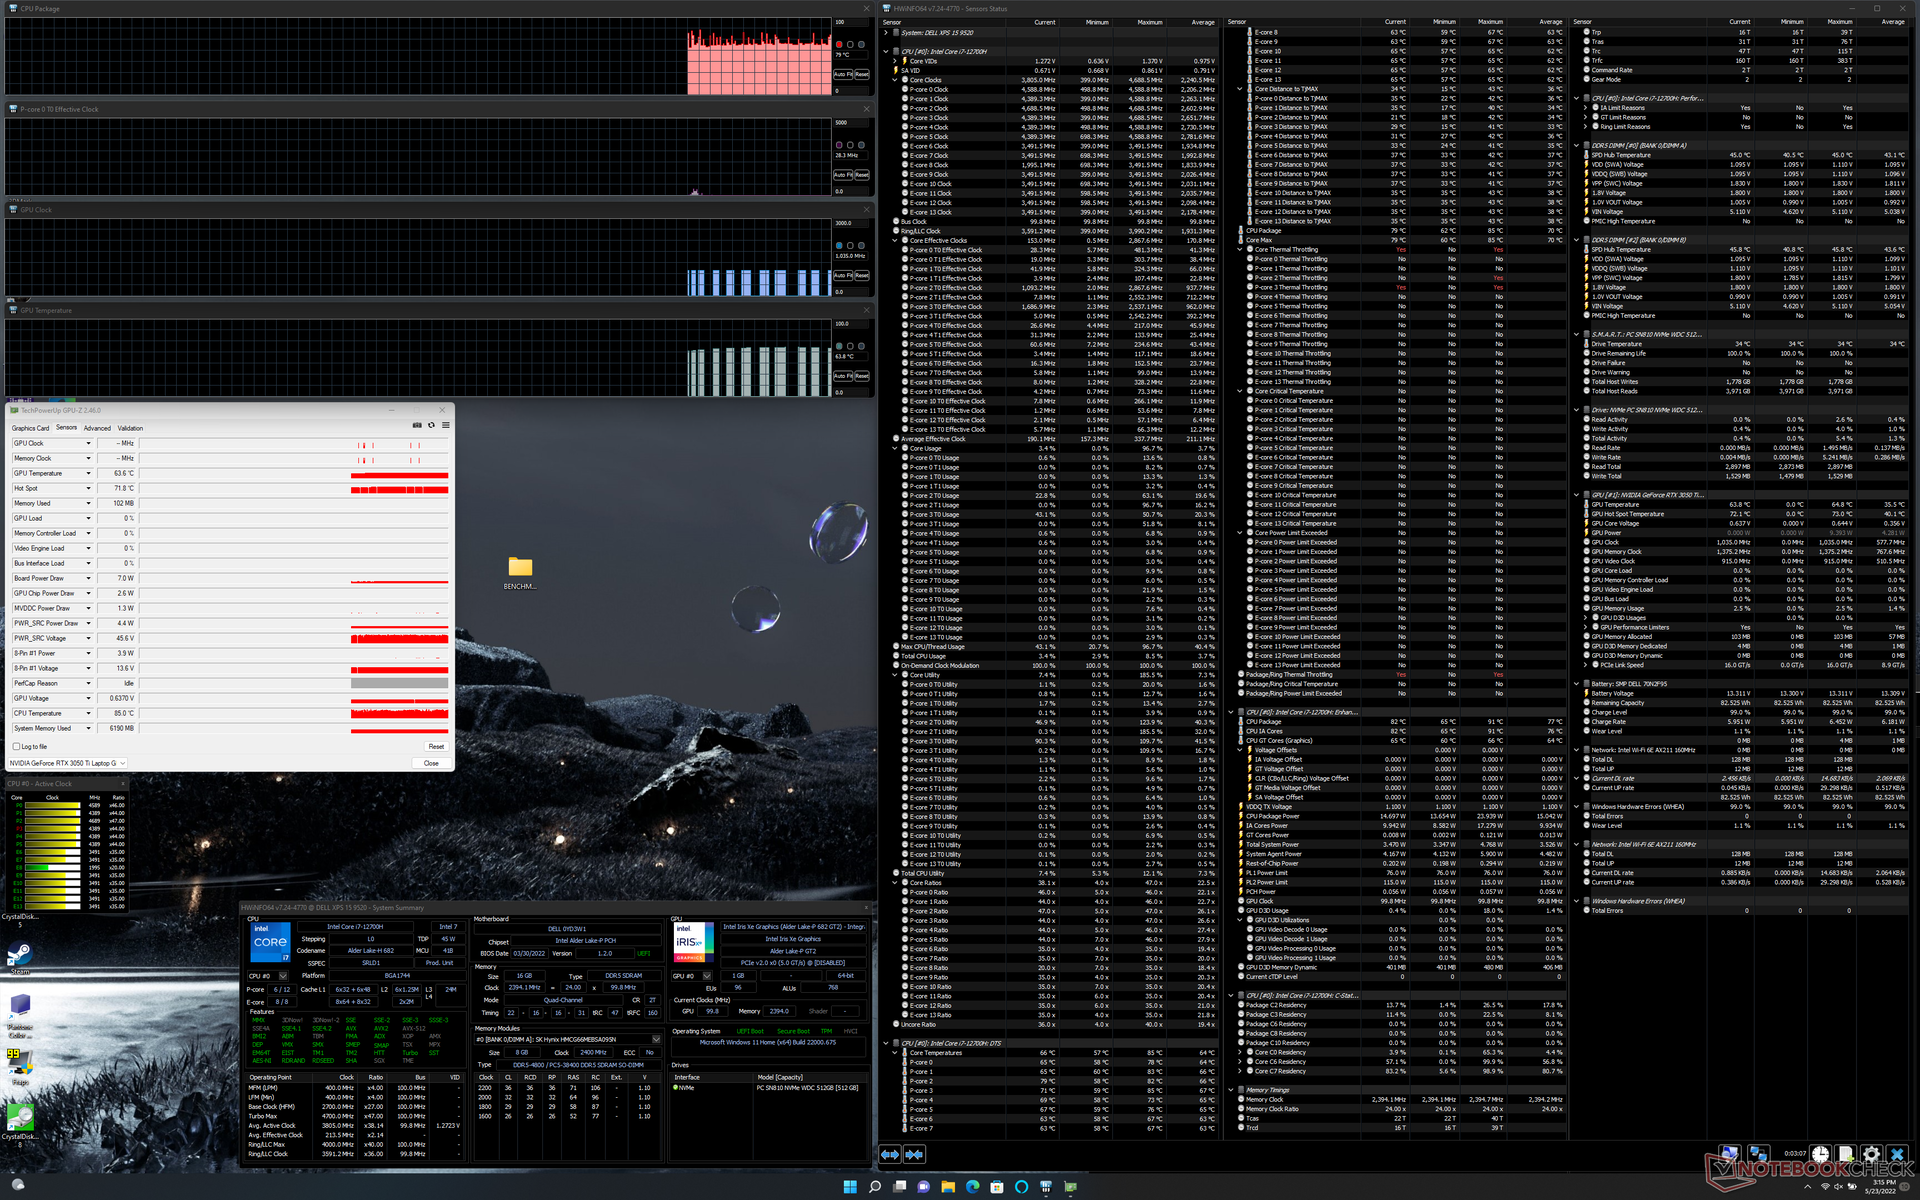
Quando estressada sob Prime95, a CPU aumentaria para 81 W, 100 C e 3,3 GHz durante os primeiros 10 segundos aproximadamente antes de cair rapidamente e se estabilizar em 45 W, 85 C e 2,5 GHz a fim de manter a temperatura sob controle. A execução deste mesmo teste no XPS 15 9500 resultaria em uma temperatura estável da CPU de 73 C em comparação. Assim, parece que o XPS 15 9520 está funcionando mais quente que seus antecessores, a fim de extrair mais desempenho do processador a partir do mesmo projeto geral do chassi.
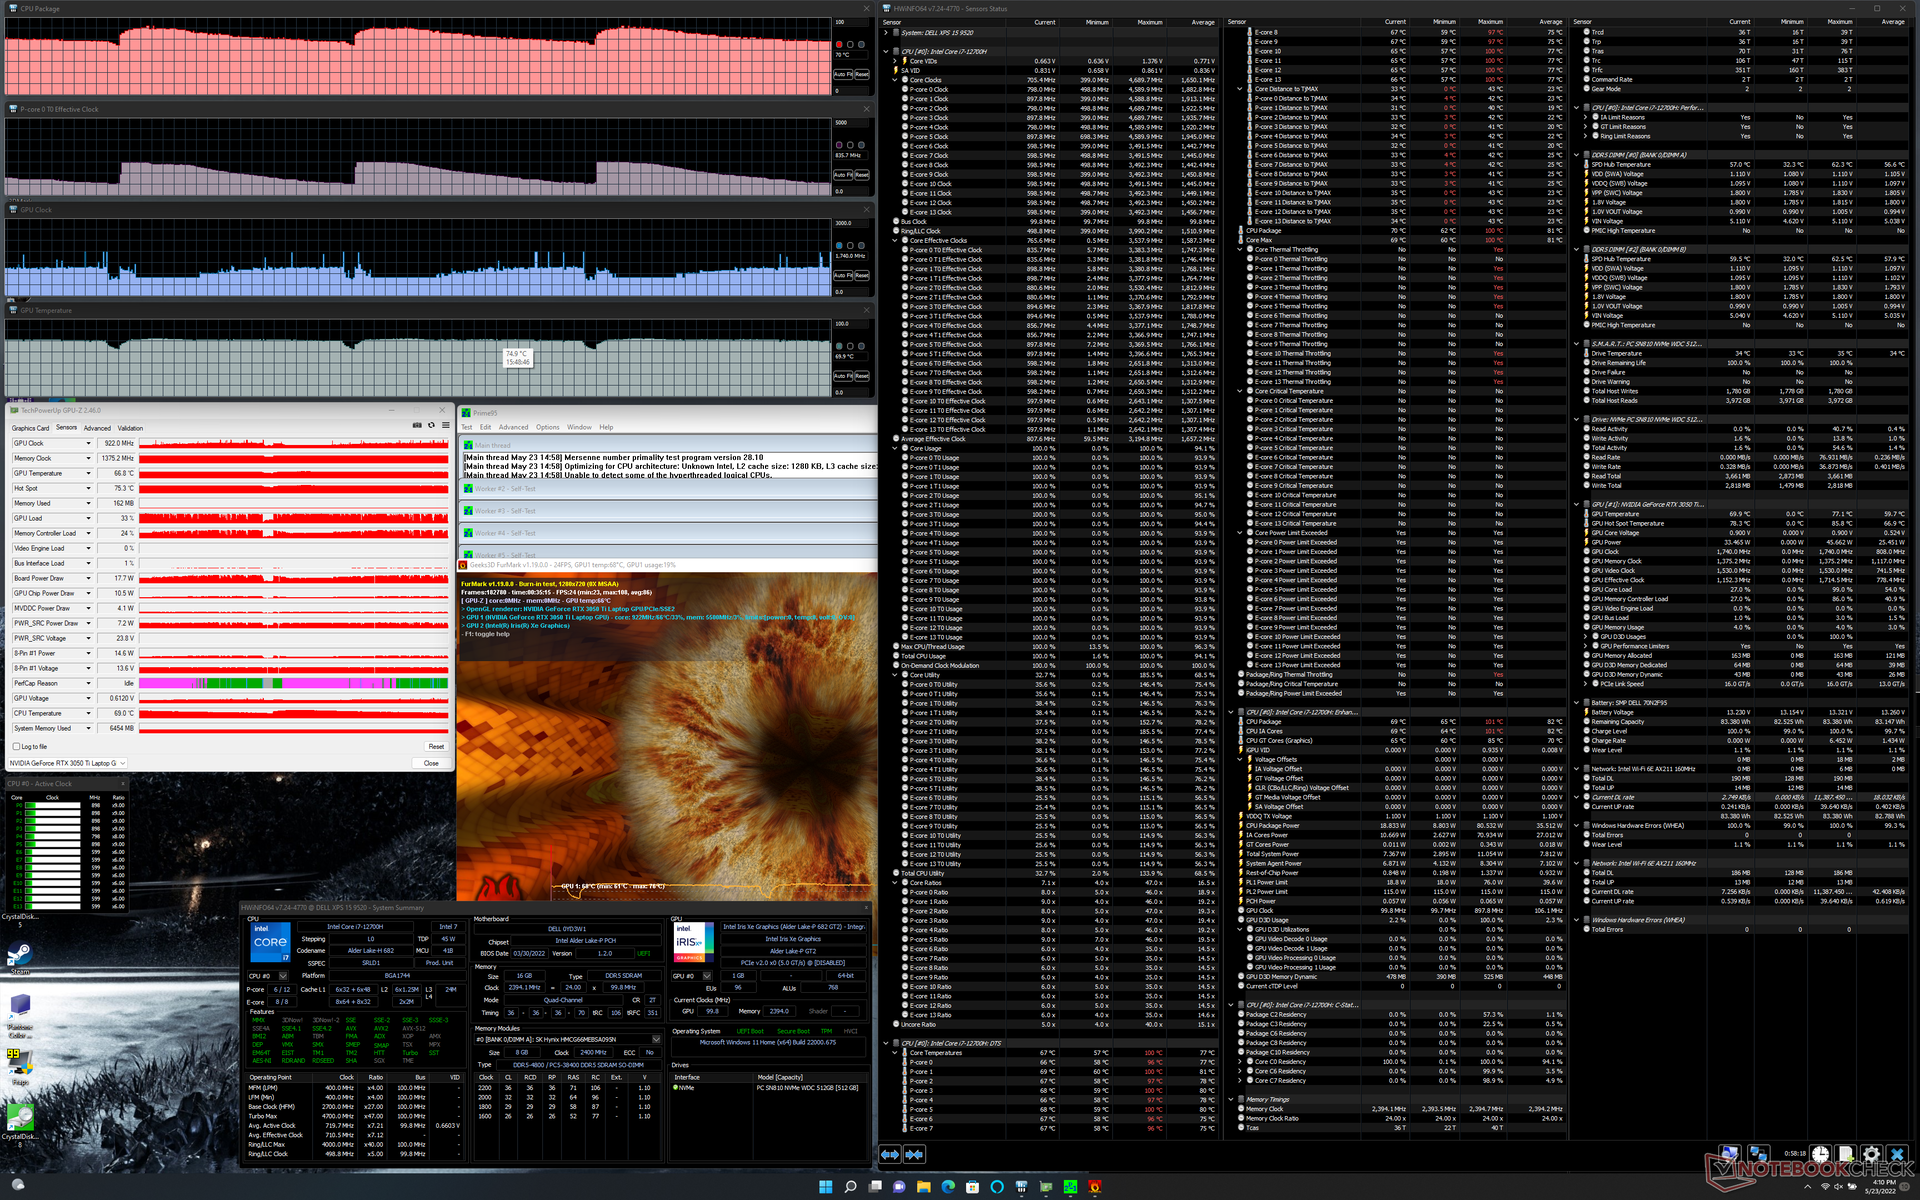
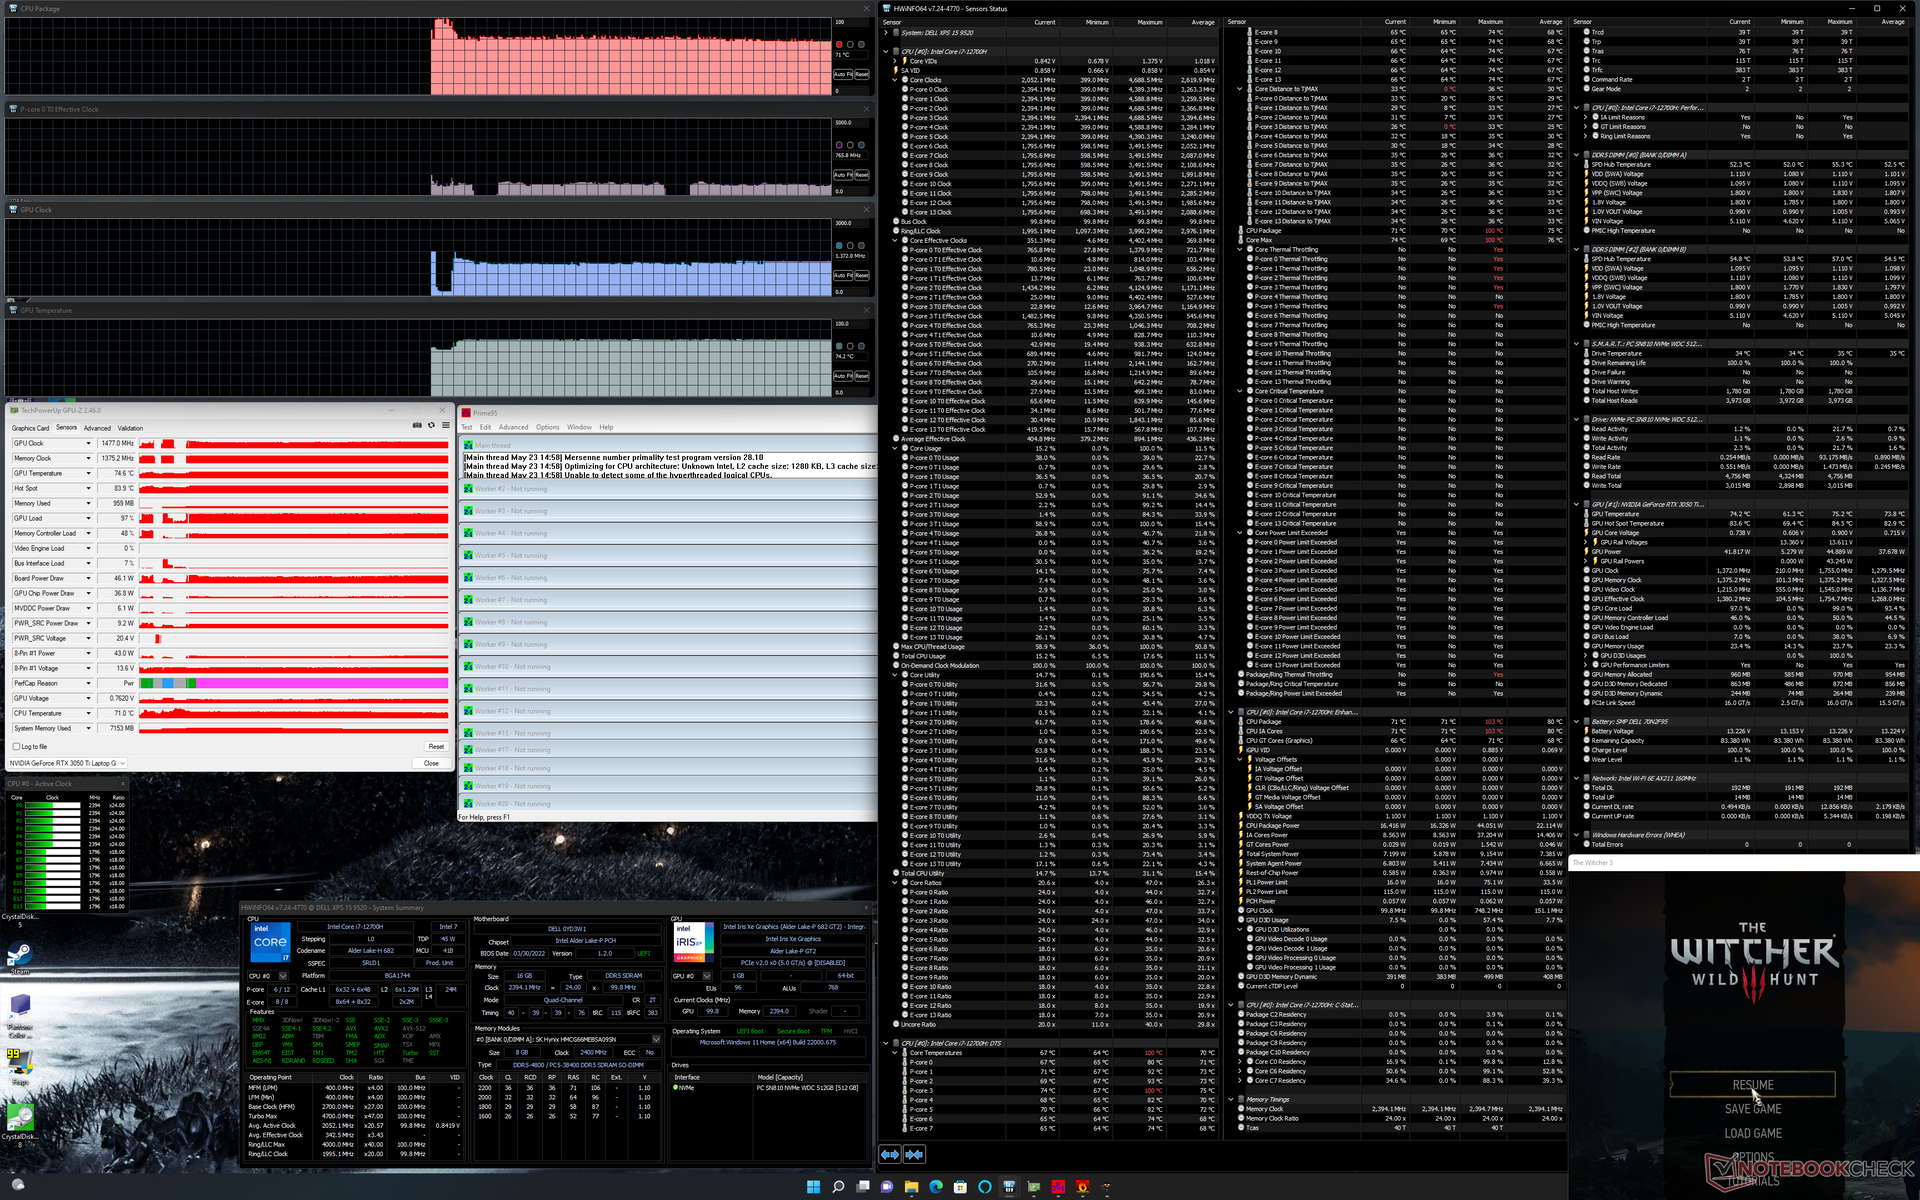
As taxas de relógio GPU, consumo de energia e temperatura se estabilizariam em 1477 MHz, 46 W e 74 C, respectivamente, quando em funcionamento Witcher 3 no modo Ultra Performance. A execução no modo Otimizado resultaria em taxas de relógio e temperaturas ligeiramente mais baixas, como mostra a tabela abaixo, assim como um consumo de energia menor de 41 W. Os usuários devem executar o sistema no modo Ultra Performance se quiserem extrair o máximo de performance possível da GPU. A execução deste mesmo teste no XPS 15 9500 com o mais lento GeForce GTX 1650 Ti resultaria em temperaturas semelhantes de CPU e GPU.
Funcionando com bateria limita o desempenho. Um teste Fire Strike em baterias retornaria pontuações Física e Gráfica de 9450 e 8332 pontos, respectivamente, em comparação com 27077 e 12154 pontos quando em rede elétrica.
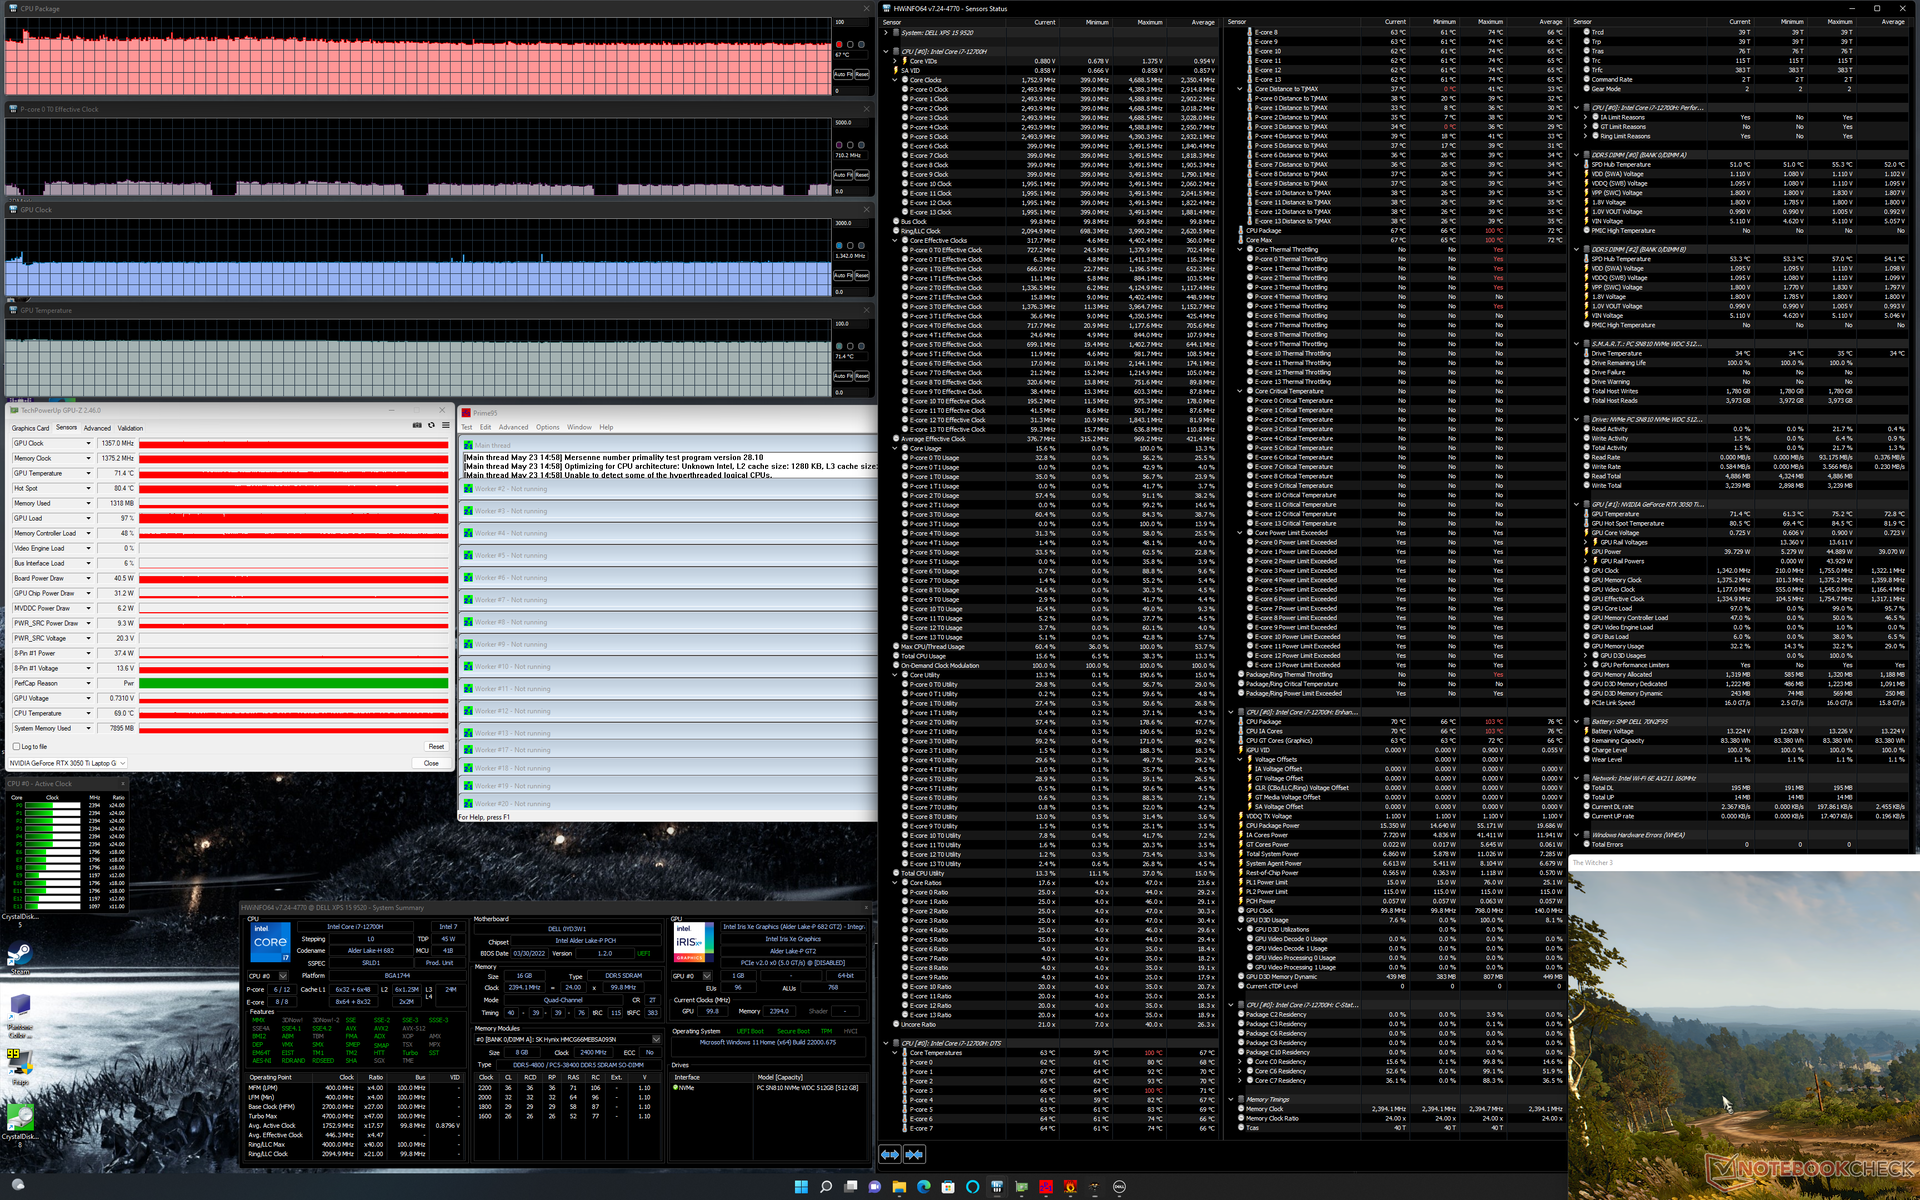
| Relógio CPU (GHz) | Relógio GPU (MHz) | Temperatura média da CPU (°C) | Temperatura média da GPU (°C) | |
| System Idle | -- | -- | 79 | 64 |
| Prime95 Stress | 2.4 | 85 | -- | 67 |
| Prime95 + FurMark Stress | 0,8 - 2,3 | 700 - 1100 | 79 - 86 | 62 - 75 |
| Witcher 3 Stress (modo equilibrado) | 0.7 | 1357 | 67 | 71 |
| Witcher 3 Estresse (modo de desempenho) | 0.8 | 1477 | 71 | 74 |
Oradores
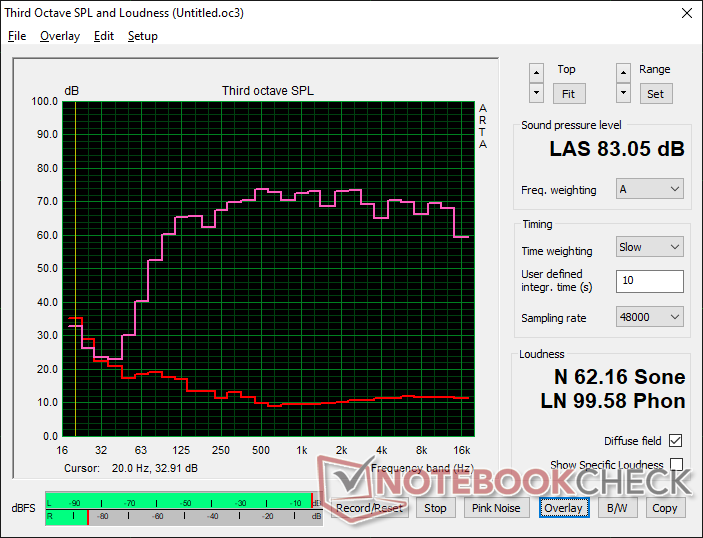
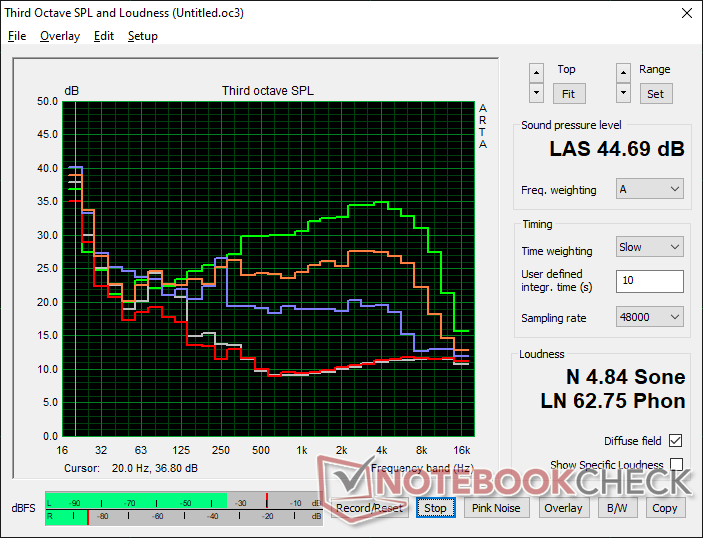
Dell XPS 15 9520 RTX 3050 Ti análise de áudio
(+) | os alto-falantes podem tocar relativamente alto (###valor### dB)
Graves 100 - 315Hz
(+) | bons graves - apenas 4.4% longe da mediana
(+) | o baixo é linear (6.8% delta para a frequência anterior)
Médios 400 - 2.000 Hz
(+) | médios equilibrados - apenas 2.6% longe da mediana
(+) | médios são lineares (4.1% delta para frequência anterior)
Altos 2 - 16 kHz
(+) | agudos equilibrados - apenas 1.9% longe da mediana
(+) | os máximos são lineares (5.4% delta da frequência anterior)
Geral 100 - 16.000 Hz
(+) | o som geral é linear (6.4% diferença em relação à mediana)
Comparado com a mesma classe
» 4% de todos os dispositivos testados nesta classe foram melhores, 1% semelhantes, 95% piores
» O melhor teve um delta de 5%, a média foi 17%, o pior foi 45%
Comparado com todos os dispositivos testados
» 1% de todos os dispositivos testados foram melhores, 0% semelhantes, 99% piores
» O melhor teve um delta de 4%, a média foi 23%, o pior foi 134%
Apple MacBook Pro 16 2021 M1 Pro análise de áudio
(+) | os alto-falantes podem tocar relativamente alto (###valor### dB)
Graves 100 - 315Hz
(+) | bons graves - apenas 3.8% longe da mediana
(+) | o baixo é linear (5.2% delta para a frequência anterior)
Médios 400 - 2.000 Hz
(+) | médios equilibrados - apenas 1.3% longe da mediana
(+) | médios são lineares (2.1% delta para frequência anterior)
Altos 2 - 16 kHz
(+) | agudos equilibrados - apenas 1.9% longe da mediana
(+) | os máximos são lineares (2.7% delta da frequência anterior)
Geral 100 - 16.000 Hz
(+) | o som geral é linear (4.6% diferença em relação à mediana)
Comparado com a mesma classe
» 0% de todos os dispositivos testados nesta classe foram melhores, 0% semelhantes, 100% piores
» O melhor teve um delta de 5%, a média foi 17%, o pior foi 45%
Comparado com todos os dispositivos testados
» 0% de todos os dispositivos testados foram melhores, 0% semelhantes, 100% piores
» O melhor teve um delta de 4%, a média foi 23%, o pior foi 134%
Gerenciamento de energia - Mais energia
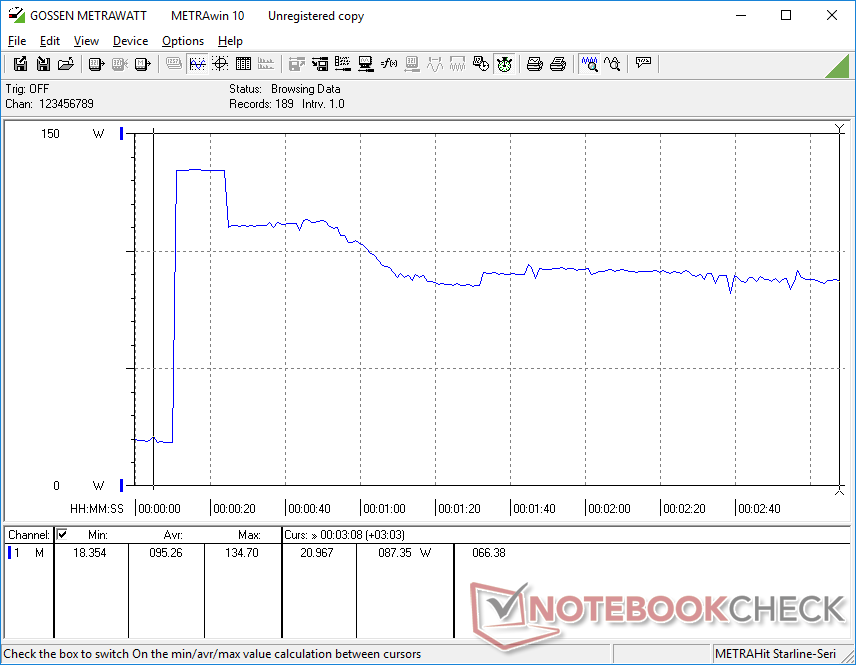
Consumo de energia
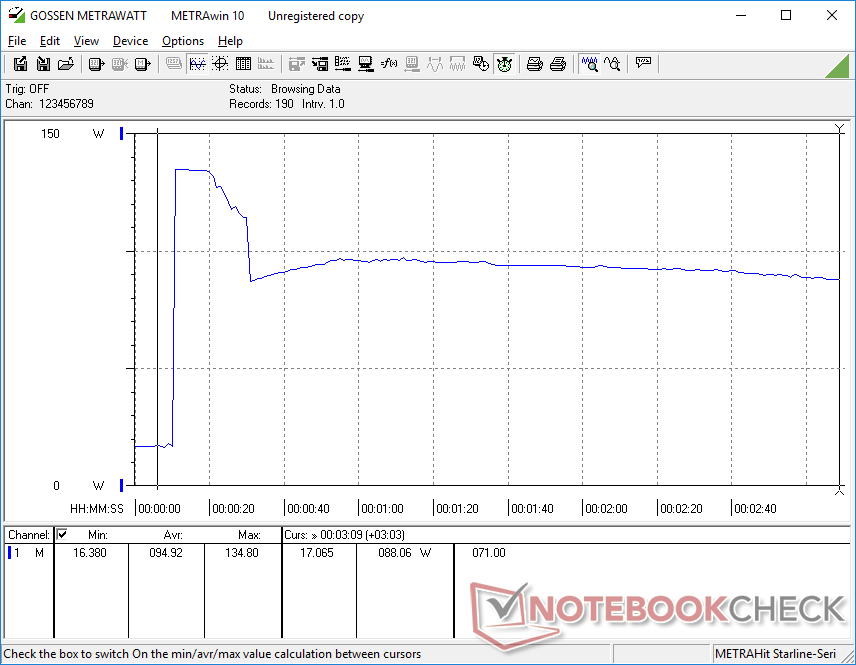
Os XPS 15 9500, 9510 e 9520 são os únicos grandes laptops no mercado no momento com adaptadores USB-C de 130 W que ultrapassam o limite de 100 W de fornecimento de energia USB-C estabelecido pelo USB-IF. A maior sobrecarga permite que a bateria continue carregando a uma taxa decente, mesmo quando a carga é muito alta, como nos jogos. Também vale a pena notar que a unidade de teste não exibiria nenhum problema de carga que experimentamos no XPS 17 9700.
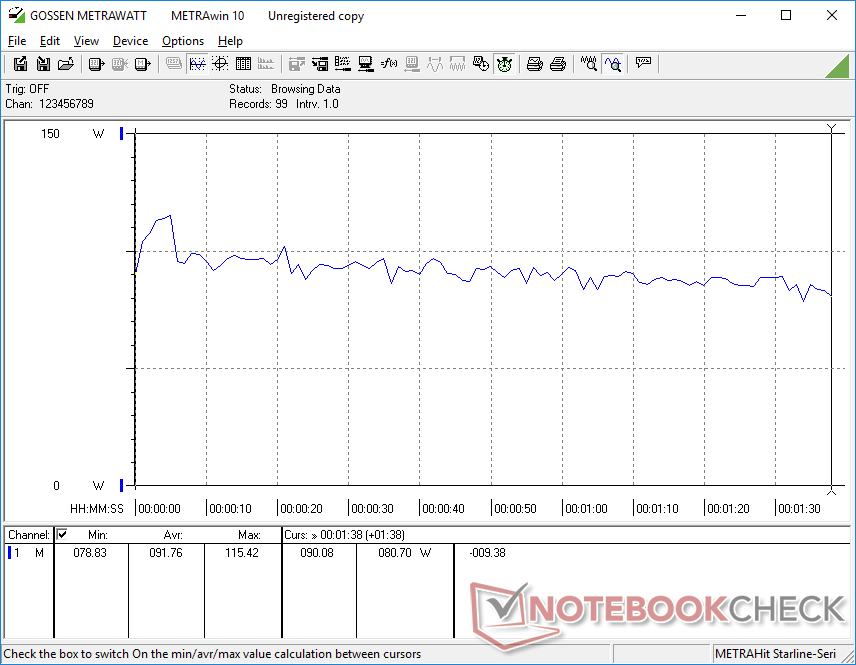
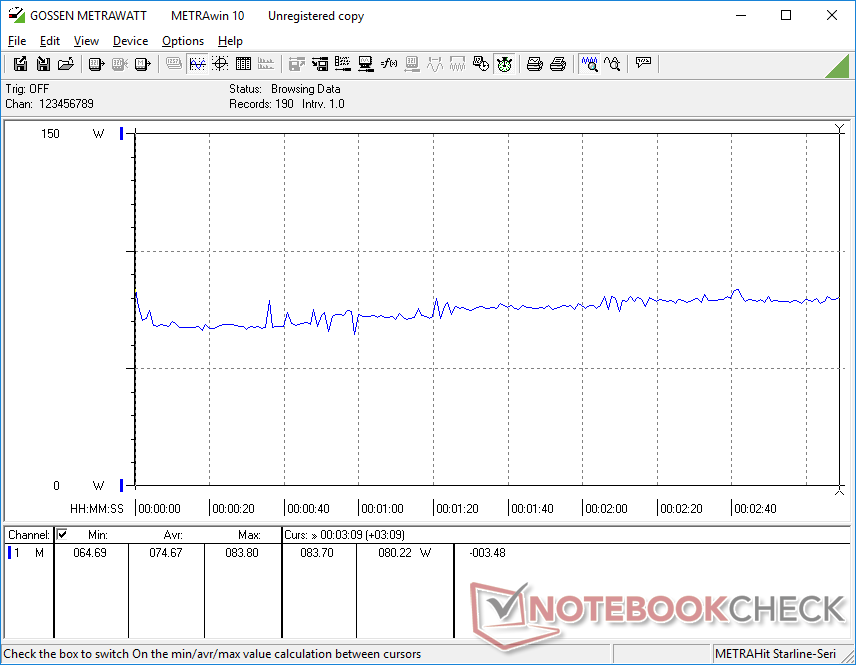
Rodando Witcher 3 consome 75 W para estar perto do que gravamos no XPS 15 9510 ou no concorrente AMD Zenbook Pro 15 OLED. Talvez mais interessante, rodar Prime95 consumiria um constante 88 W em comparação com 65 W no Core 7-11800H, alimentado pelo XPS 15 9510. Assim, o consumo de energia aumentou em aproximadamente 35% para o ganho anual de 35 a 42% no desempenho multi-tarefa que registramos acima. O consumo de energia geralmente maior se alinha com o que estamos observando no Plataforma do Lago Alder como um todo
O adaptador USB-C AC de 130 W (~14,3 x 6,6 x 2,3 cm) pequeno-médio (~14,3 x 6,6 x 2,3 cm) que vem com o XPS 15 9520 é idêntico ao que vem com o XPS 9500 e 9510.
| desligado | |
| Ocioso | |
| Carga |
|
Key:
min: | |
| Dell XPS 15 9520 RTX 3050 Ti i7-12700H, GeForce RTX 3050 Ti Laptop GPU, WDC PC SN810 512GB, OLED, 3456x2160, 15.6" | Dell XPS 15 9510 11800H RTX 3050 Ti OLED i7-11800H, GeForce RTX 3050 Ti Laptop GPU, Micron 2300 512GB MTFDHBA512TDV, OLED, 3456x2160, 15.6" | Dell XPS 15 9500 Core i7 4K UHD i7-10875H, GeForce GTX 1650 Ti Mobile, SK Hynix PC611 512GB, IPS, 3840x2400, 15.6" | HP Spectre X360 15-5ZV31AV i7-10510U, GeForce MX250, Intel SSD 660p 2TB SSDPEKNW020T8, IPS, 3840x2160, 15.6" | Asus Zenbook Pro 15 OLED UM535Q R9 5900HX, GeForce RTX 3050 Ti Laptop GPU, WDC PC SN730 SDBPNTY-1T00, OLED, 1920x1080, 15.6" | MSI Stealth 15M A11SEK i7-1185G7, GeForce RTX 2060 Max-Q, WDC PC SN530 SDBPNPZ-1T00, IPS, 1920x1080, 15.6" | |
|---|---|---|---|---|---|---|
| Power Consumption | -5% | -27% | 20% | 5% | -25% | |
| Idle Minimum * (Watt) | 5.5 | 7.6 -38% | 5.7 -4% | 5.2 5% | 5.5 -0% | 7.3 -33% |
| Idle Average * (Watt) | 7.2 | 9.9 -38% | 13.5 -88% | 8.5 -18% | 7.4 -3% | 10.1 -40% |
| Idle Maximum * (Watt) | 16 | 10.8 32% | 19.6 -23% | 8.7 46% | 14.9 7% | 17.6 -10% |
| Load Average * (Watt) | 91.8 | 81 12% | 114.1 -24% | 65.6 29% | 78.2 15% | 106.6 -16% |
| Witcher 3 ultra * (Watt) | 74.6 | 76.2 -2% | 93 -25% | 56.5 24% | 80.1 -7% | 105.4 -41% |
| Load Maximum * (Watt) | 134.7 | 131 3% | 135.2 -0% | 92.4 31% | 110.9 18% | 151.2 -12% |
* ... menor é melhor
Power Consumption Witcher 3 / Stresstest
Power Consumption external Monitor
Vida útil da bateria
Com quase 9 horas de uso constante da WLAN no mundo real, os tempos de execução são em geral similares ao que registramos no XPS 9500 e quase 2 horas a mais do que no XPS 9510. Entretanto, tenha em mente que as cores brancas exigirão mais alguns watts do que cores mais escuras quando no mesmo ajuste de brilho, uma vez que nossa configuração usa um painel OLED.
O carregamento do vazio para a capacidade total com o adaptador AC incluído. leva cerca de 2 a 2,5 horas quando ocioso ou com cargas baixas.
| Dell XPS 15 9520 RTX 3050 Ti i7-12700H, GeForce RTX 3050 Ti Laptop GPU, 86 Wh | Dell XPS 15 9510 11800H RTX 3050 Ti OLED i7-11800H, GeForce RTX 3050 Ti Laptop GPU, 86 Wh | Dell XPS 15 9500 Core i7 4K UHD i7-10875H, GeForce GTX 1650 Ti Mobile, 86 Wh | HP Spectre X360 15-5ZV31AV i7-10510U, GeForce MX250, 84 Wh | Asus Zenbook Pro 15 OLED UM535Q R9 5900HX, GeForce RTX 3050 Ti Laptop GPU, 96 Wh | MSI Stealth 15M A11SEK i7-1185G7, GeForce RTX 2060 Max-Q, 52 Wh | |
|---|---|---|---|---|---|---|
| Duração da bateria | -32% | 7% | 22% | 45% | -42% | |
| Reader / Idle (h) | 14.8 | 23 55% | 22.6 53% | 26.2 77% | 10.5 -29% | |
| WiFi v1.3 (h) | 8.8 | 7 -20% | 9.1 3% | 10.8 23% | 12.8 45% | 6.3 -28% |
| Load (h) | 3.2 | 1.8 -44% | 2 -37% | 2.9 -9% | 3.6 13% | 1 -69% |
| H.264 (h) | 10.4 |
Pro
Contra
Veredicto - A Diferença do Lago do Amieiro
Se as CPUs no XPS 15 9500 ou 9510 fossem muito lentas para suas aplicações específicas, então valeria a pena considerar o 9520. Seu 12º gênero Núcleo i7-12700H pode oferecer um desempenho multitarefa 70% e 40% mais rápido do que a 10ª geração Núcleo i7-10875H e 11º gêneroNúcleo i7-11800Hrespectivamente, sem afetar significativamente a vida útil da bateria. O impulso inerente ao desempenho gráfico integrado também pode ser suficiente para satisfazer a maioria dos usuários de escritório sem a necessidade de atualização para qualquer opção de Nvidia discreta e de preço.
Os usuários de energia apreciarão os ganhos significativos no desempenho do processador em relação às opções do 11º ou 10º gênero da Intel. Para tarefas de escritório mais básicas ou moderadas, entretanto, a potência extra da série 12ª geração pode não valer o aumento de preço.
Fora do desempenho da CPU, no entanto, a experiência permanece a mesma que na XPS 9510 ou mesmo 9500. A GPU Nvidia tem sido reduzida desde a 9510 e, portanto, os benefícios de uma RAM DDR5 mais rápida foram minimizados. Certas mudanças que teríamos gostado de ver, como por exemplo, displays de atualização mais altos, uma webcam de resolução mais alta, suporte adequado a Wi-Fi 6E, ou um obturador de privacidade, continuam ausentes. Se a CPU mais rápida da 12ª geração não for atraente, então você pode comprar o XPS 15 9510 que tem exatamente as mesmas opções de display e GPU que nosso 9520, mas a preços mais baixos.
Preço e Disponibilidade
Dell está atualmente enviando sua série XPS 15 9520 a partir de US$1500 para o modelo base até US$3500 se configurado com tudo ao máximo.
Dell XPS 15 9520 RTX 3050 Ti
- 08/30/2022 v7 (old)
Allen Ngo
Price comparison

