Análise do laptop Lenovo ThinkPad X13 G3 AMD: O já muito bom ThinkPad ficou ainda melhor com o Ryzen 6000
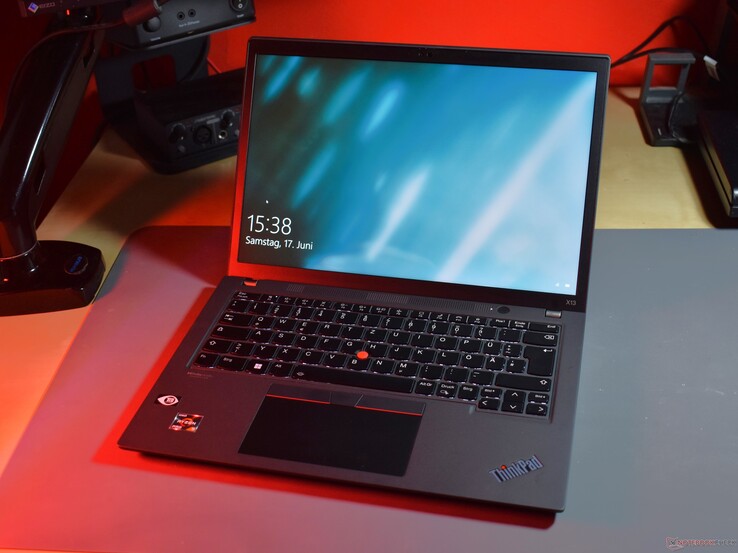
Uma análise de um ThinkPad 2022 em 2023 - parece uma contradição, mas pode fazer sentido. O dispositivo da análise de hoje, o Lenovo ThinkPad X13 Gen 3 AMD, pode ser "tecnologia de ontem", mas isso não significa que seja ruim. O sucessor desse laptop compacto para negócios, o Lenovo ThinkPad X13 Gen 4ainda não está disponível em sua versão AMD. Motivo suficiente para dar uma última olhada na variante mais antiga - talvez valha a pena comprá-la em uma próxima promoção com desconto.
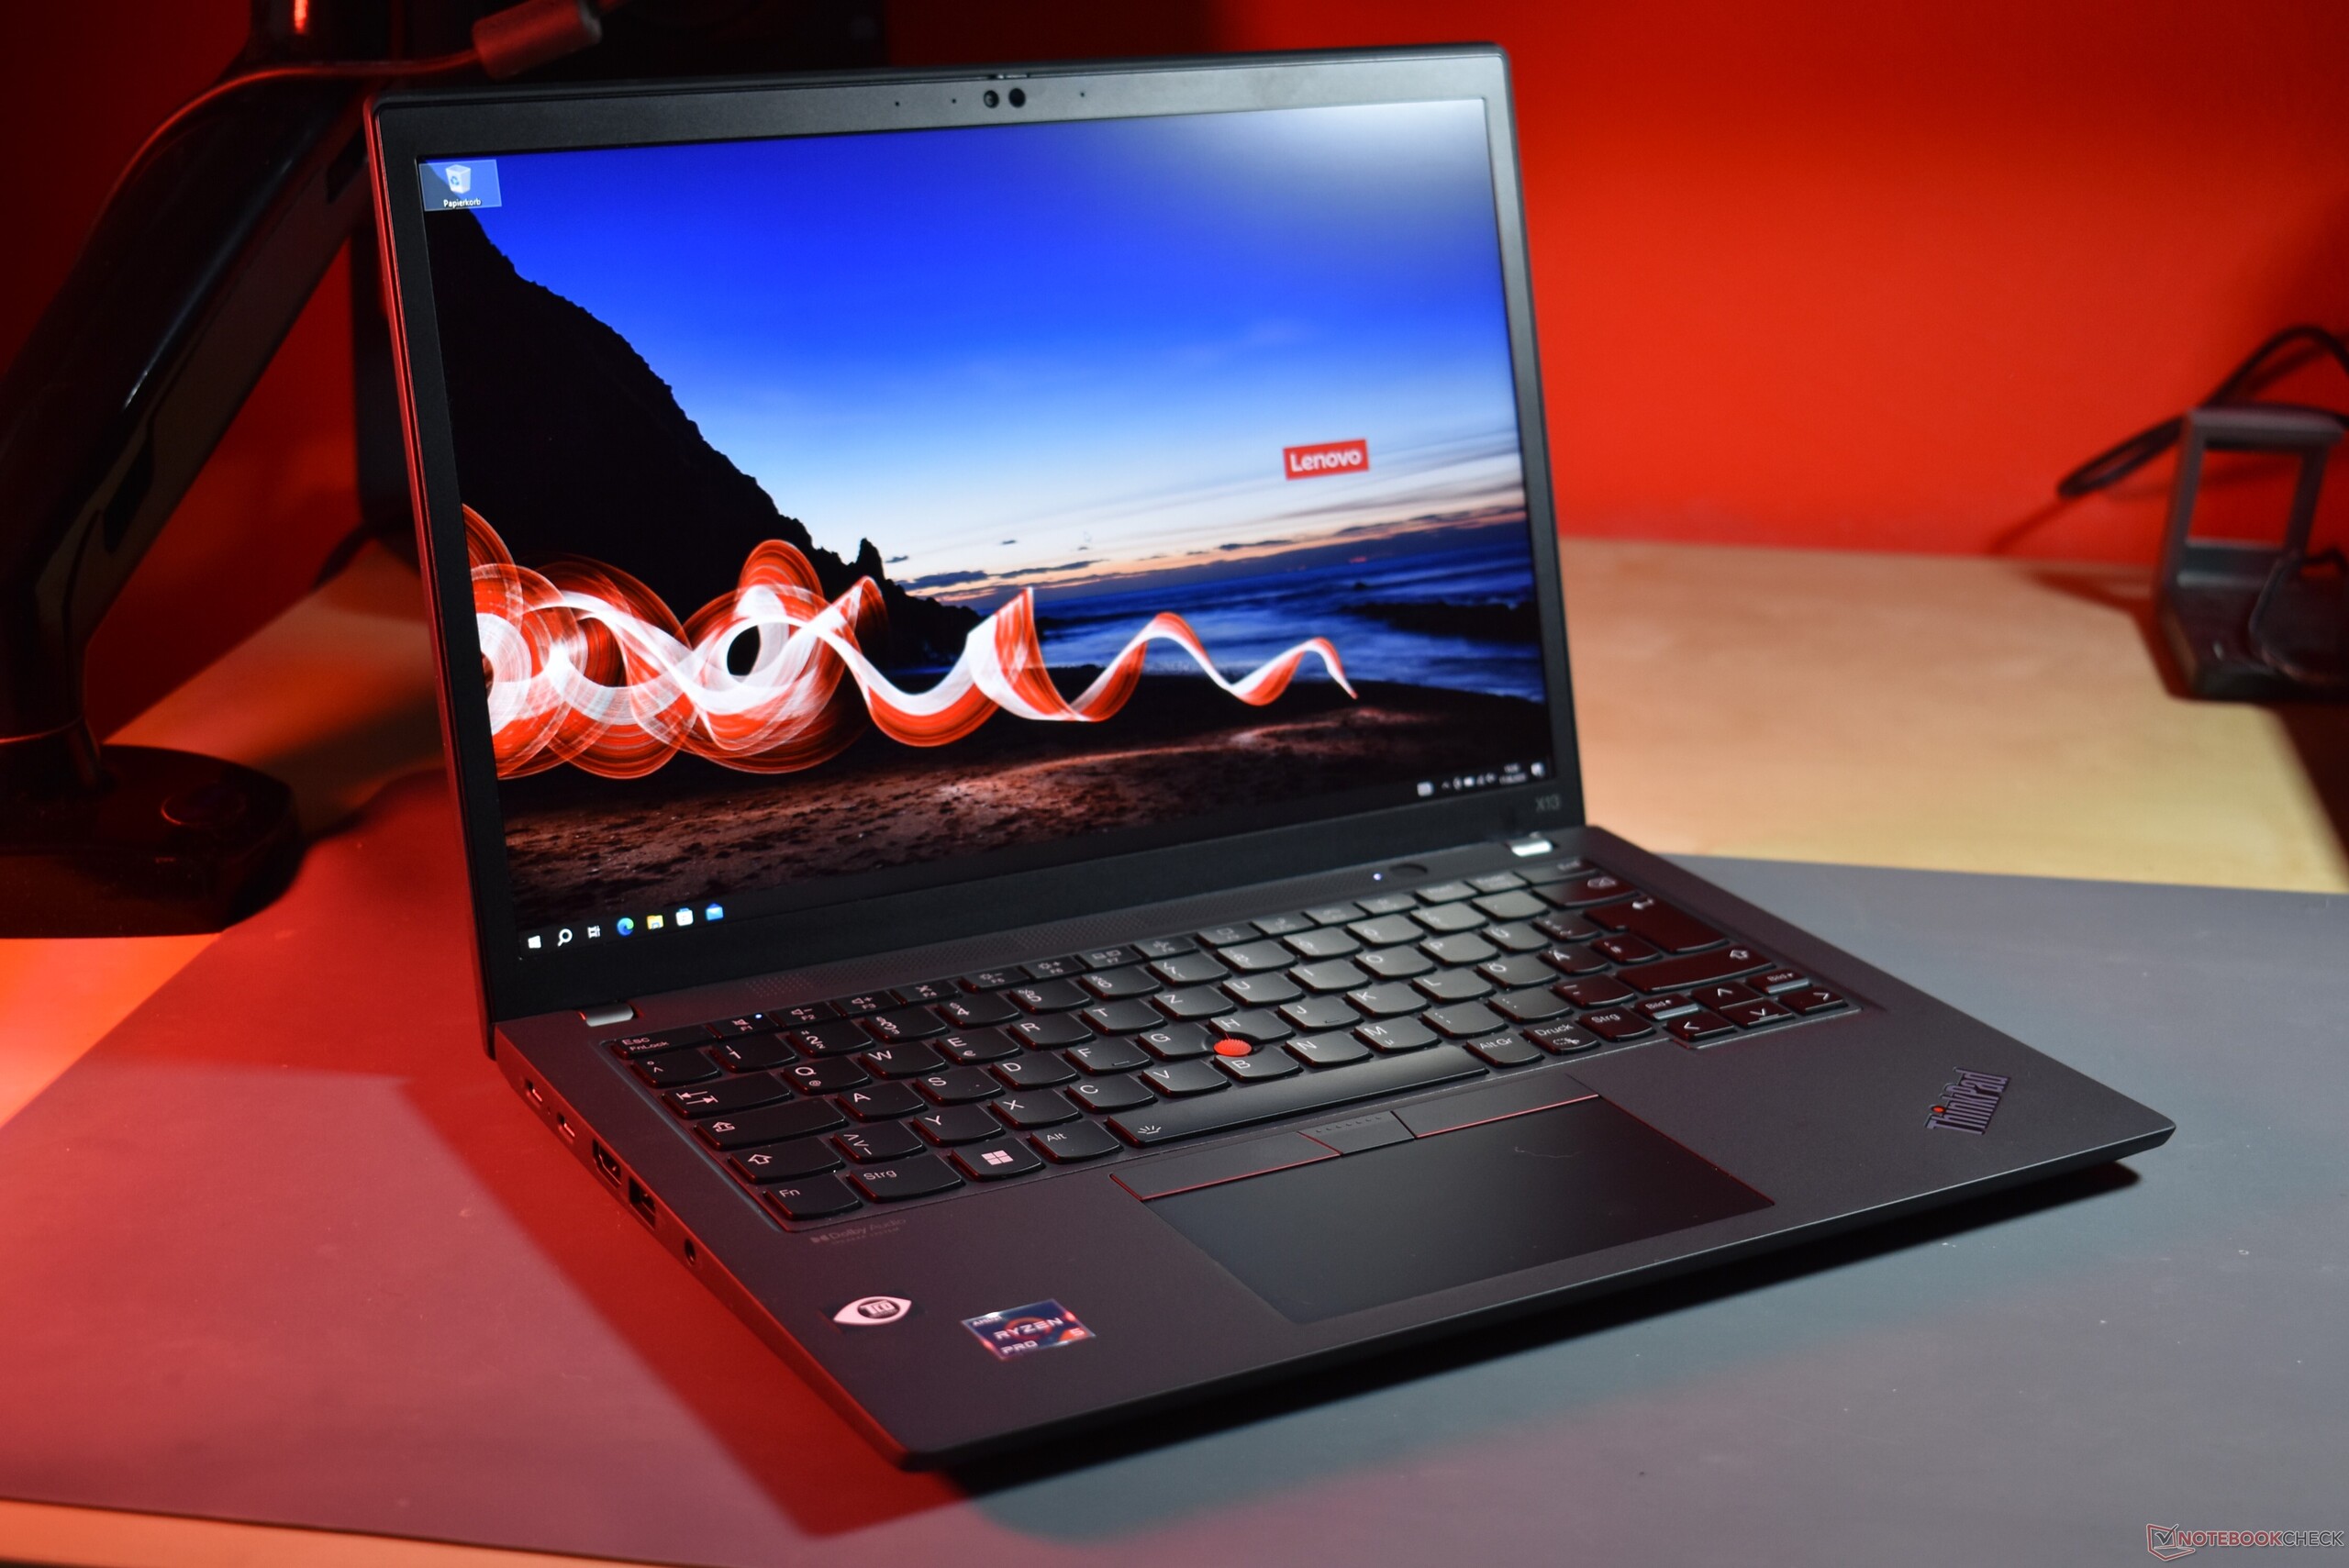
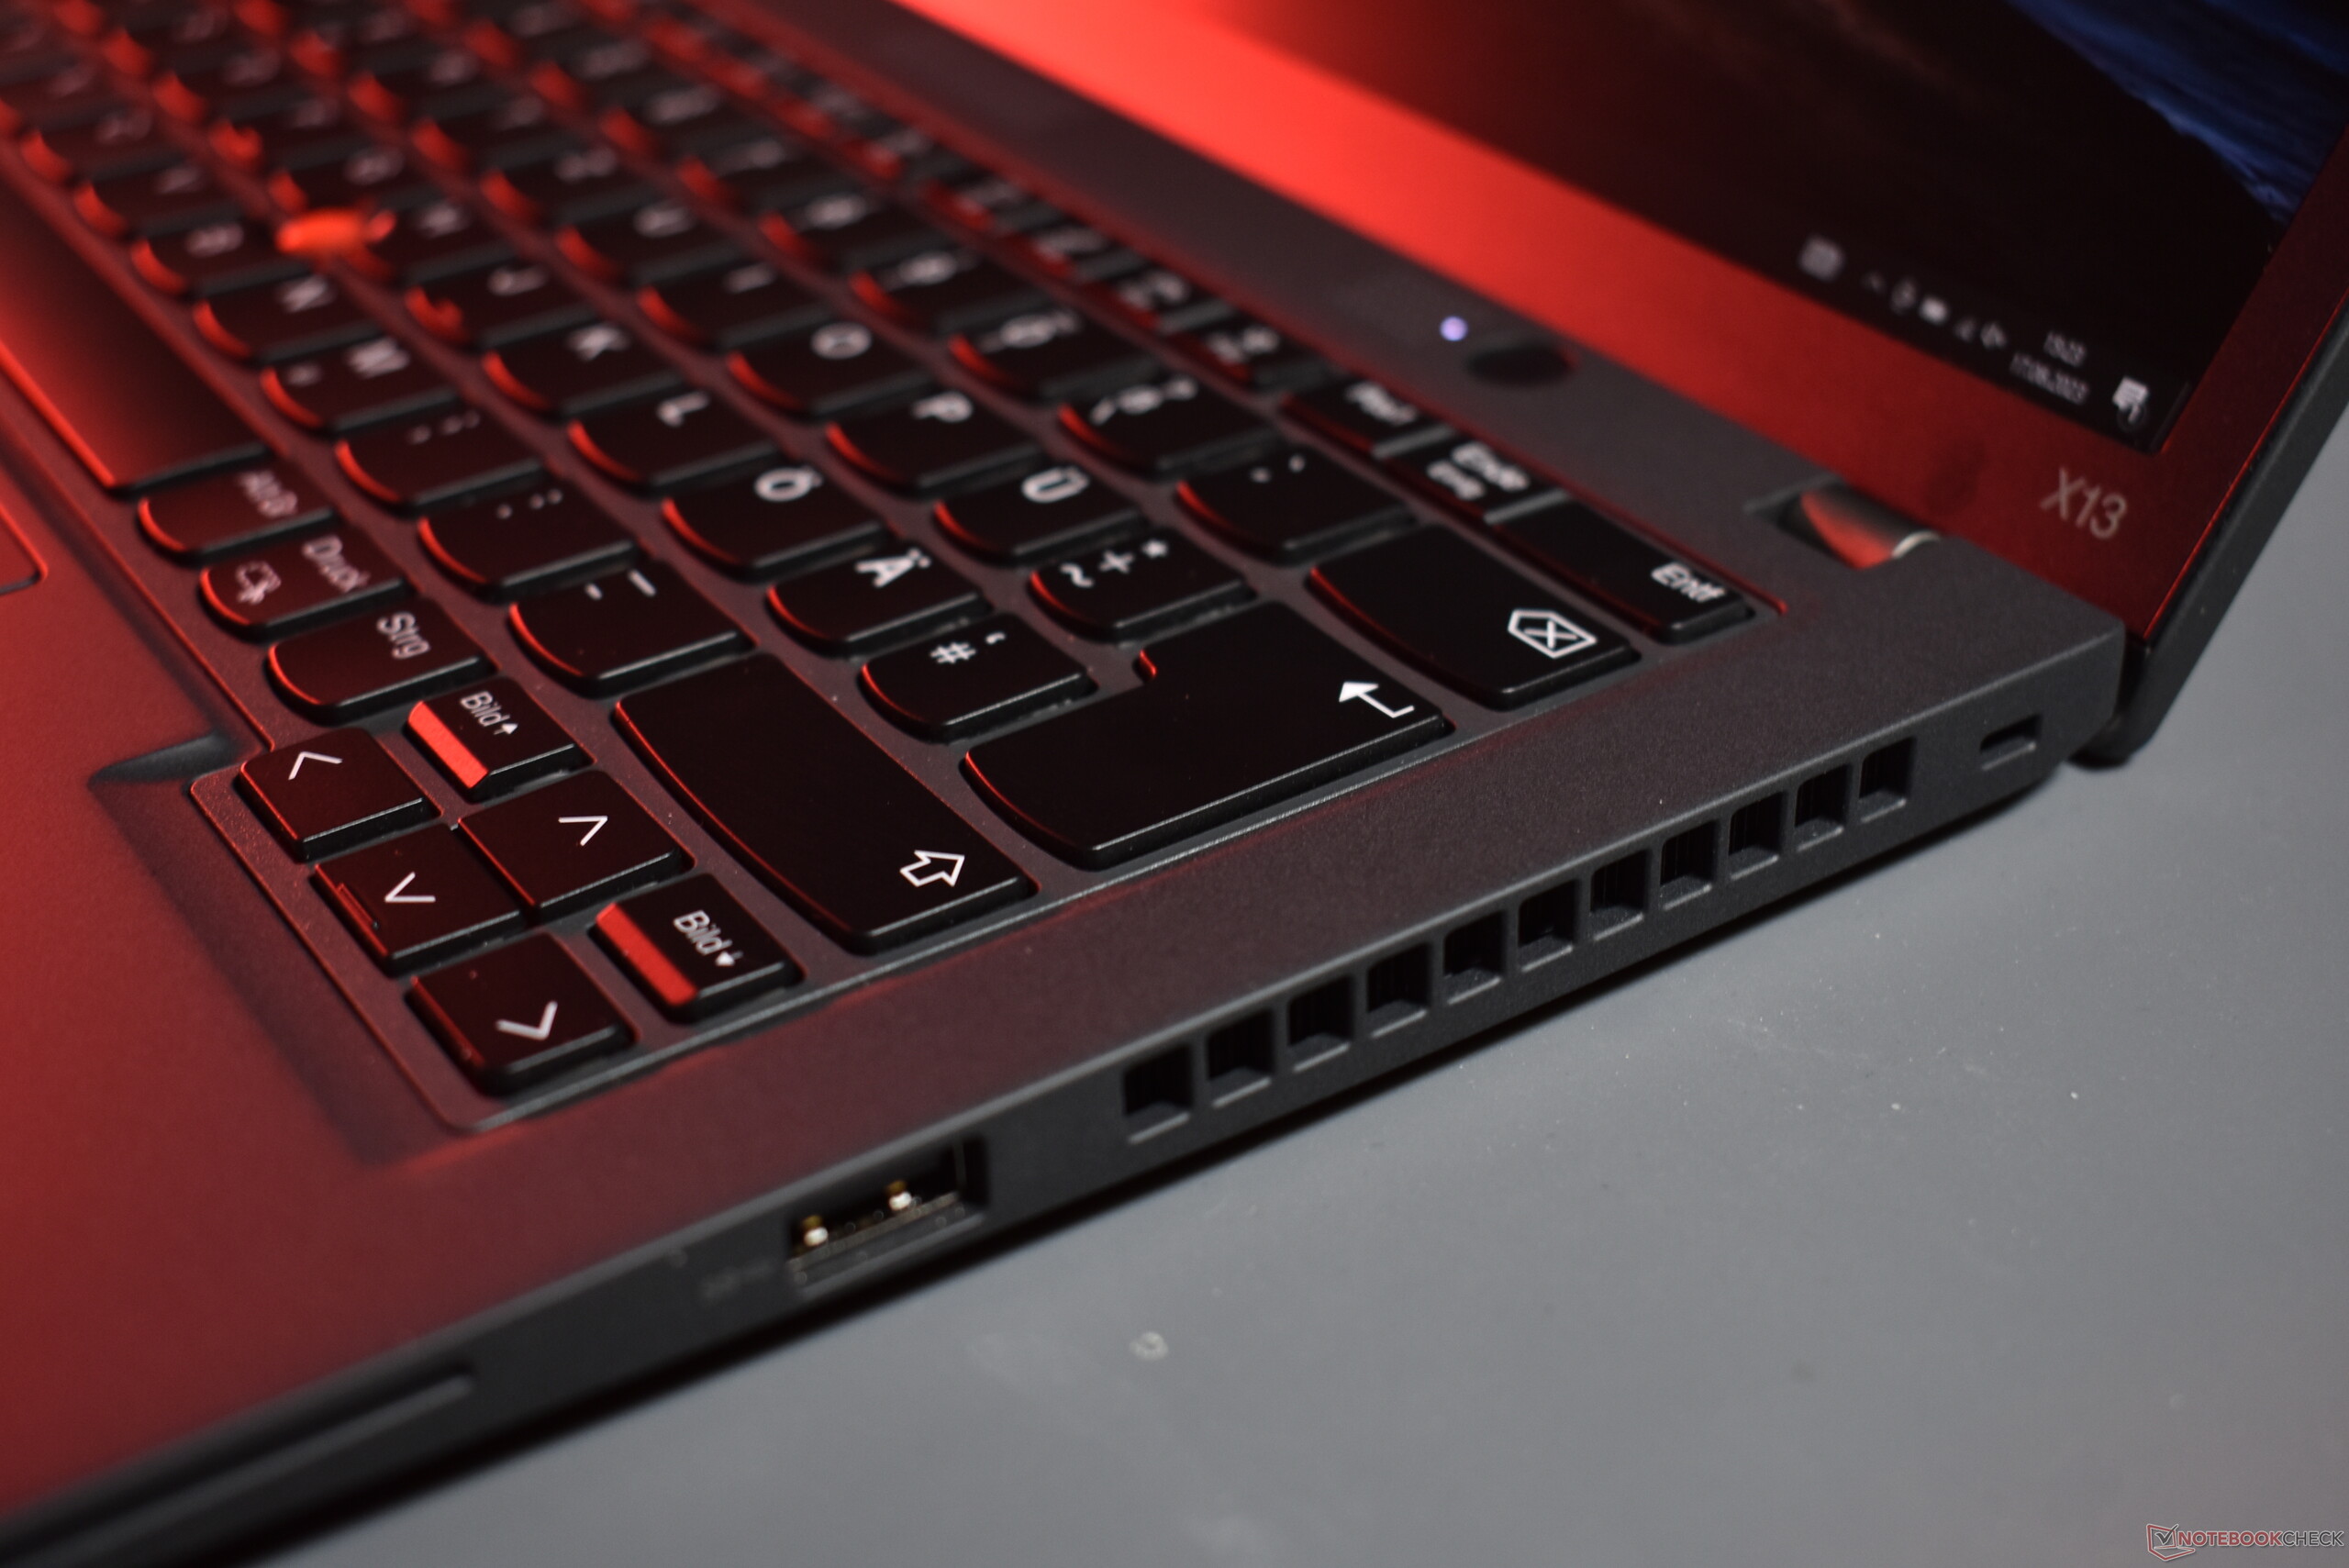
Como essa é uma atualização de um design existente, não perderemos tempo com outra descrição do design, dos dispositivos de entrada e da conectividade. Informações detalhadas sobre esses tópicos podem ser encontradas na análise do ThinkPad X13 Gen 2.
Possíveis concorrentes em comparação
Avaliação | Data | Modelo | Peso | Altura | Size | Resolução | Preço |
|---|---|---|---|---|---|---|---|
| 90.6 % v7 (old) | 06/2023 | Lenovo ThinkPad X13 G3 21CM002UGE R5 PRO 6650U, Radeon 660M | 1.3 kg | 18.1 mm | 13.30" | 1920x1200 | |
| 90.6 % v7 (old) | 11/2021 | Lenovo ThinkPad X13 G2 AMD 20XH001KGE R5 PRO 5650U, Vega 7 | 1.4 kg | 18.19 mm | 13.30" | 1920x1200 | |
| 89.2 % v7 (old) | 01/2023 | HP EliteBook 835 G9 R7 PRO 6850U, Radeon 680M | 1.3 kg | 19.2 mm | 13.30" | 1920x1200 | |
| 89 % v7 (old) | 07/2022 | Dell Latitude 13 7330 i7-1265U, Iris Xe G7 96EUs | 1 kg | 16.96 mm | 13.30" | 1920x1080 | |
| 89.4 % v7 (old) | 11/2022 | Lenovo ThinkPad X13 G3 21BN0046GE i5-1235U, Iris Xe G7 80EUs | 1.3 kg | 18.9 mm | 13.30" | 1920x1200 |
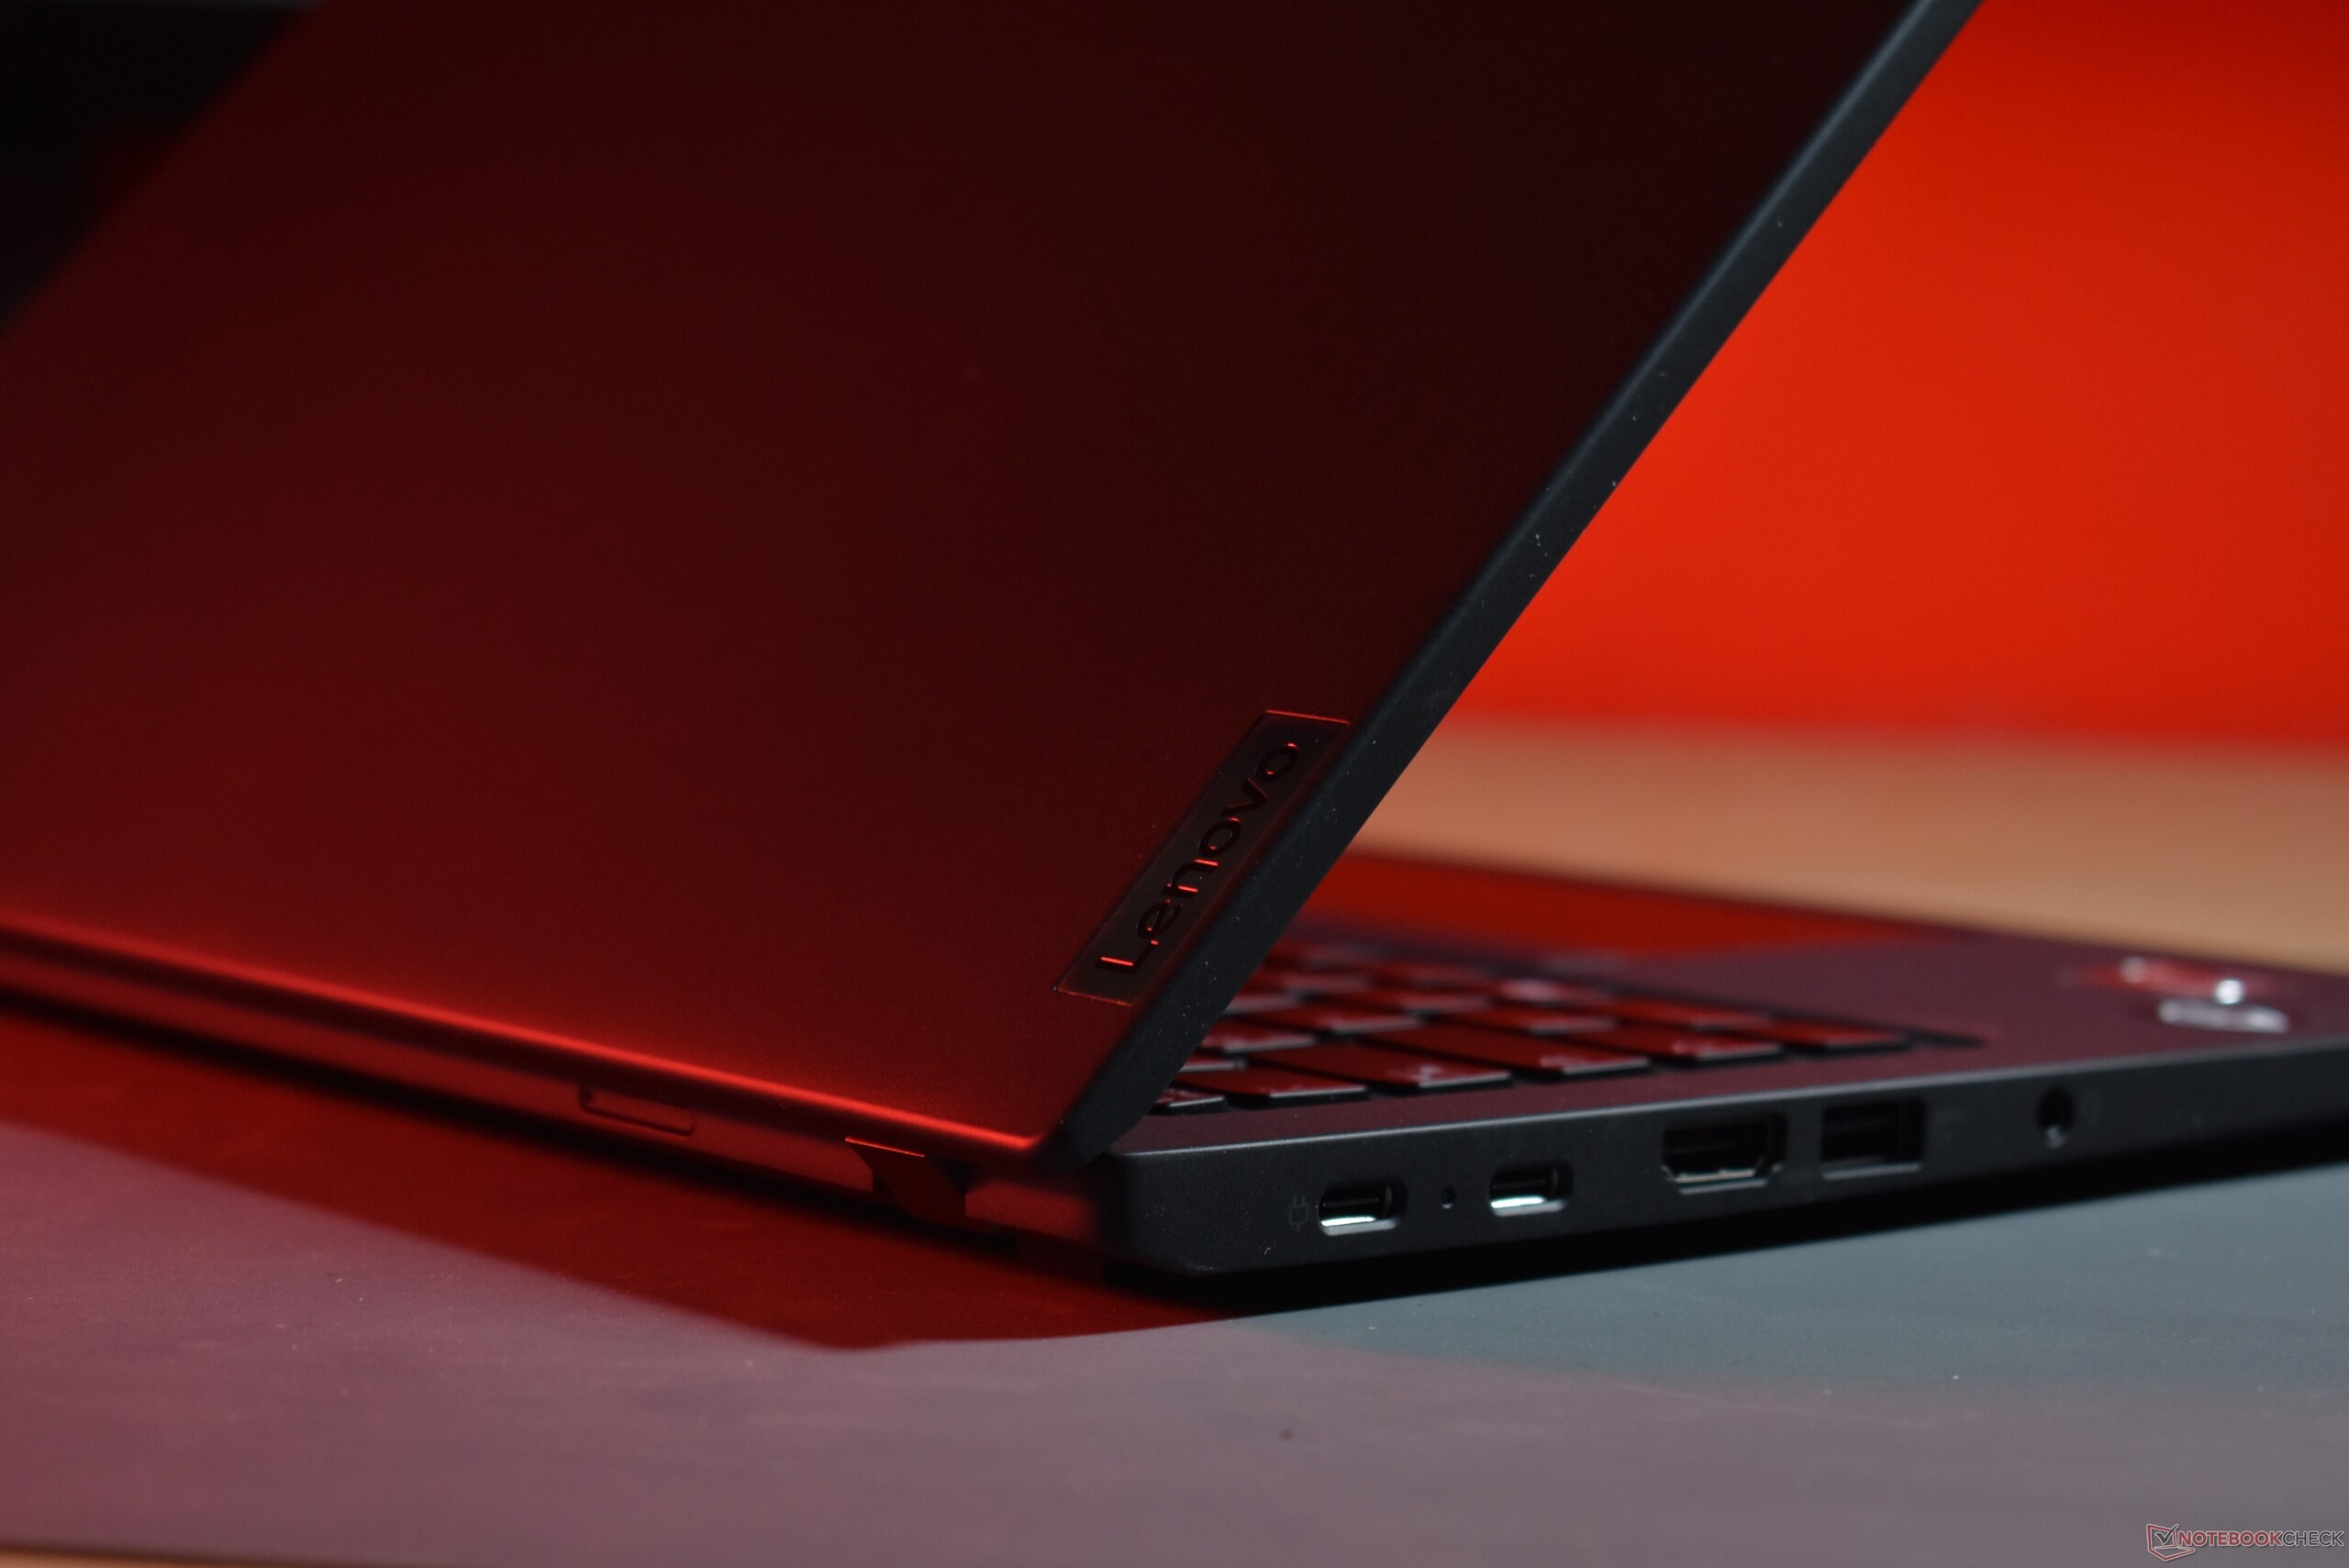
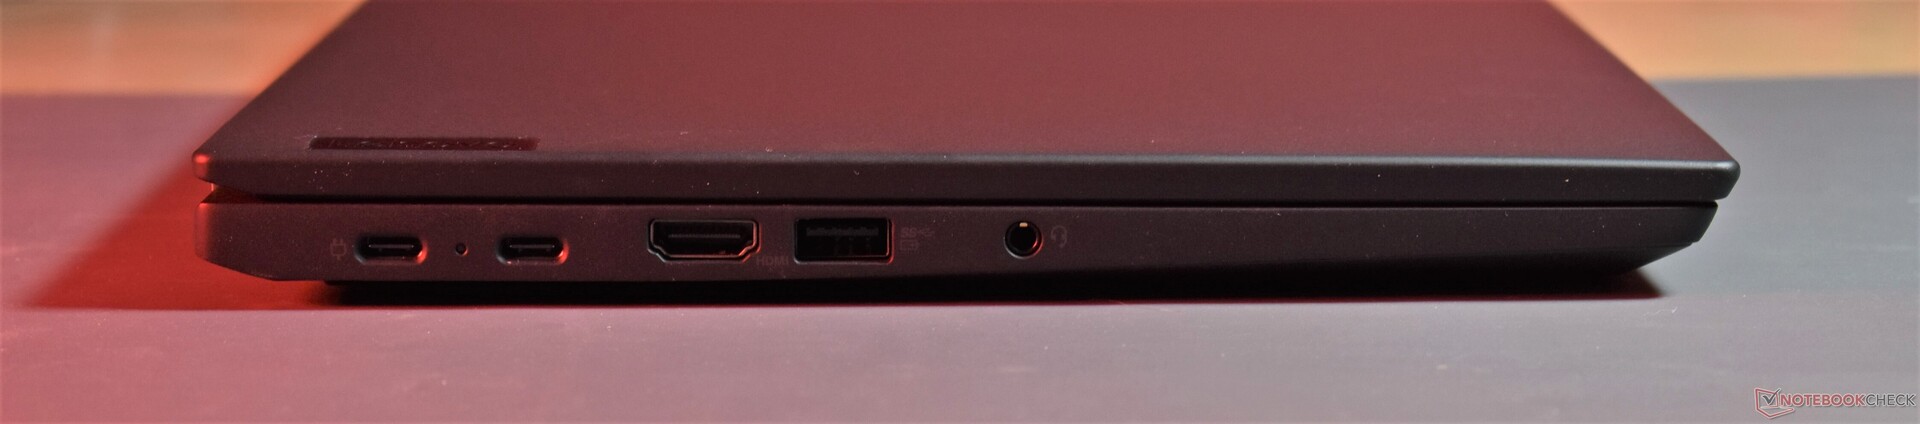
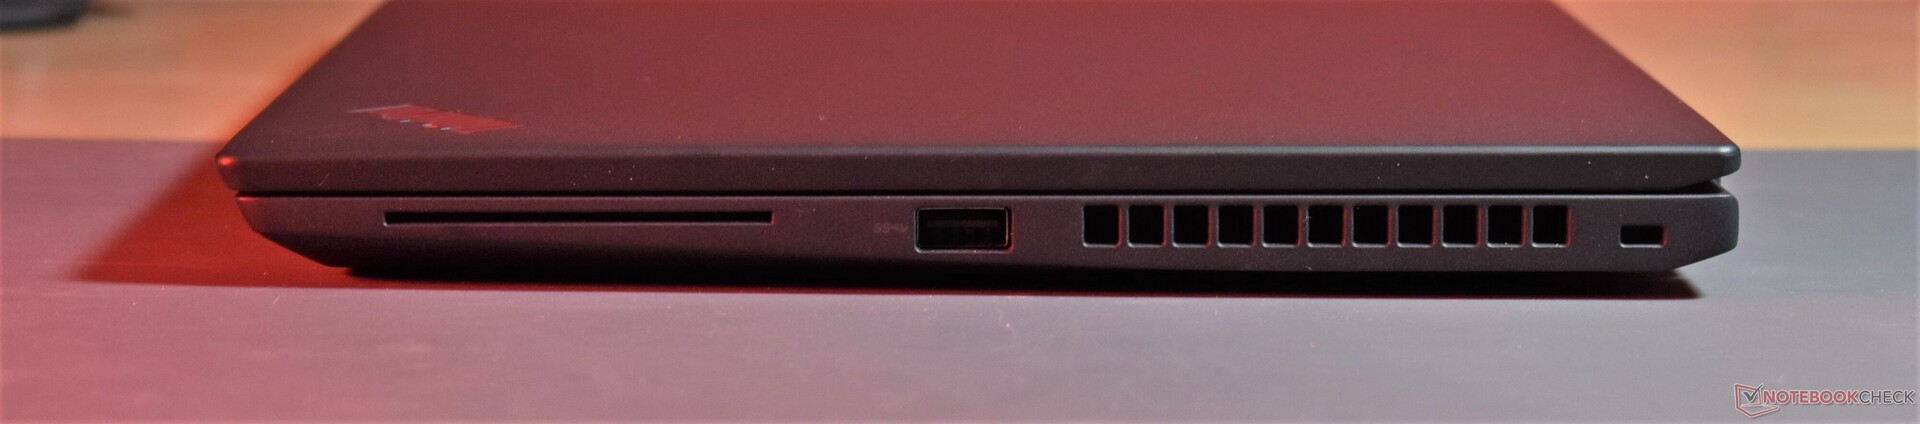
Conectividade
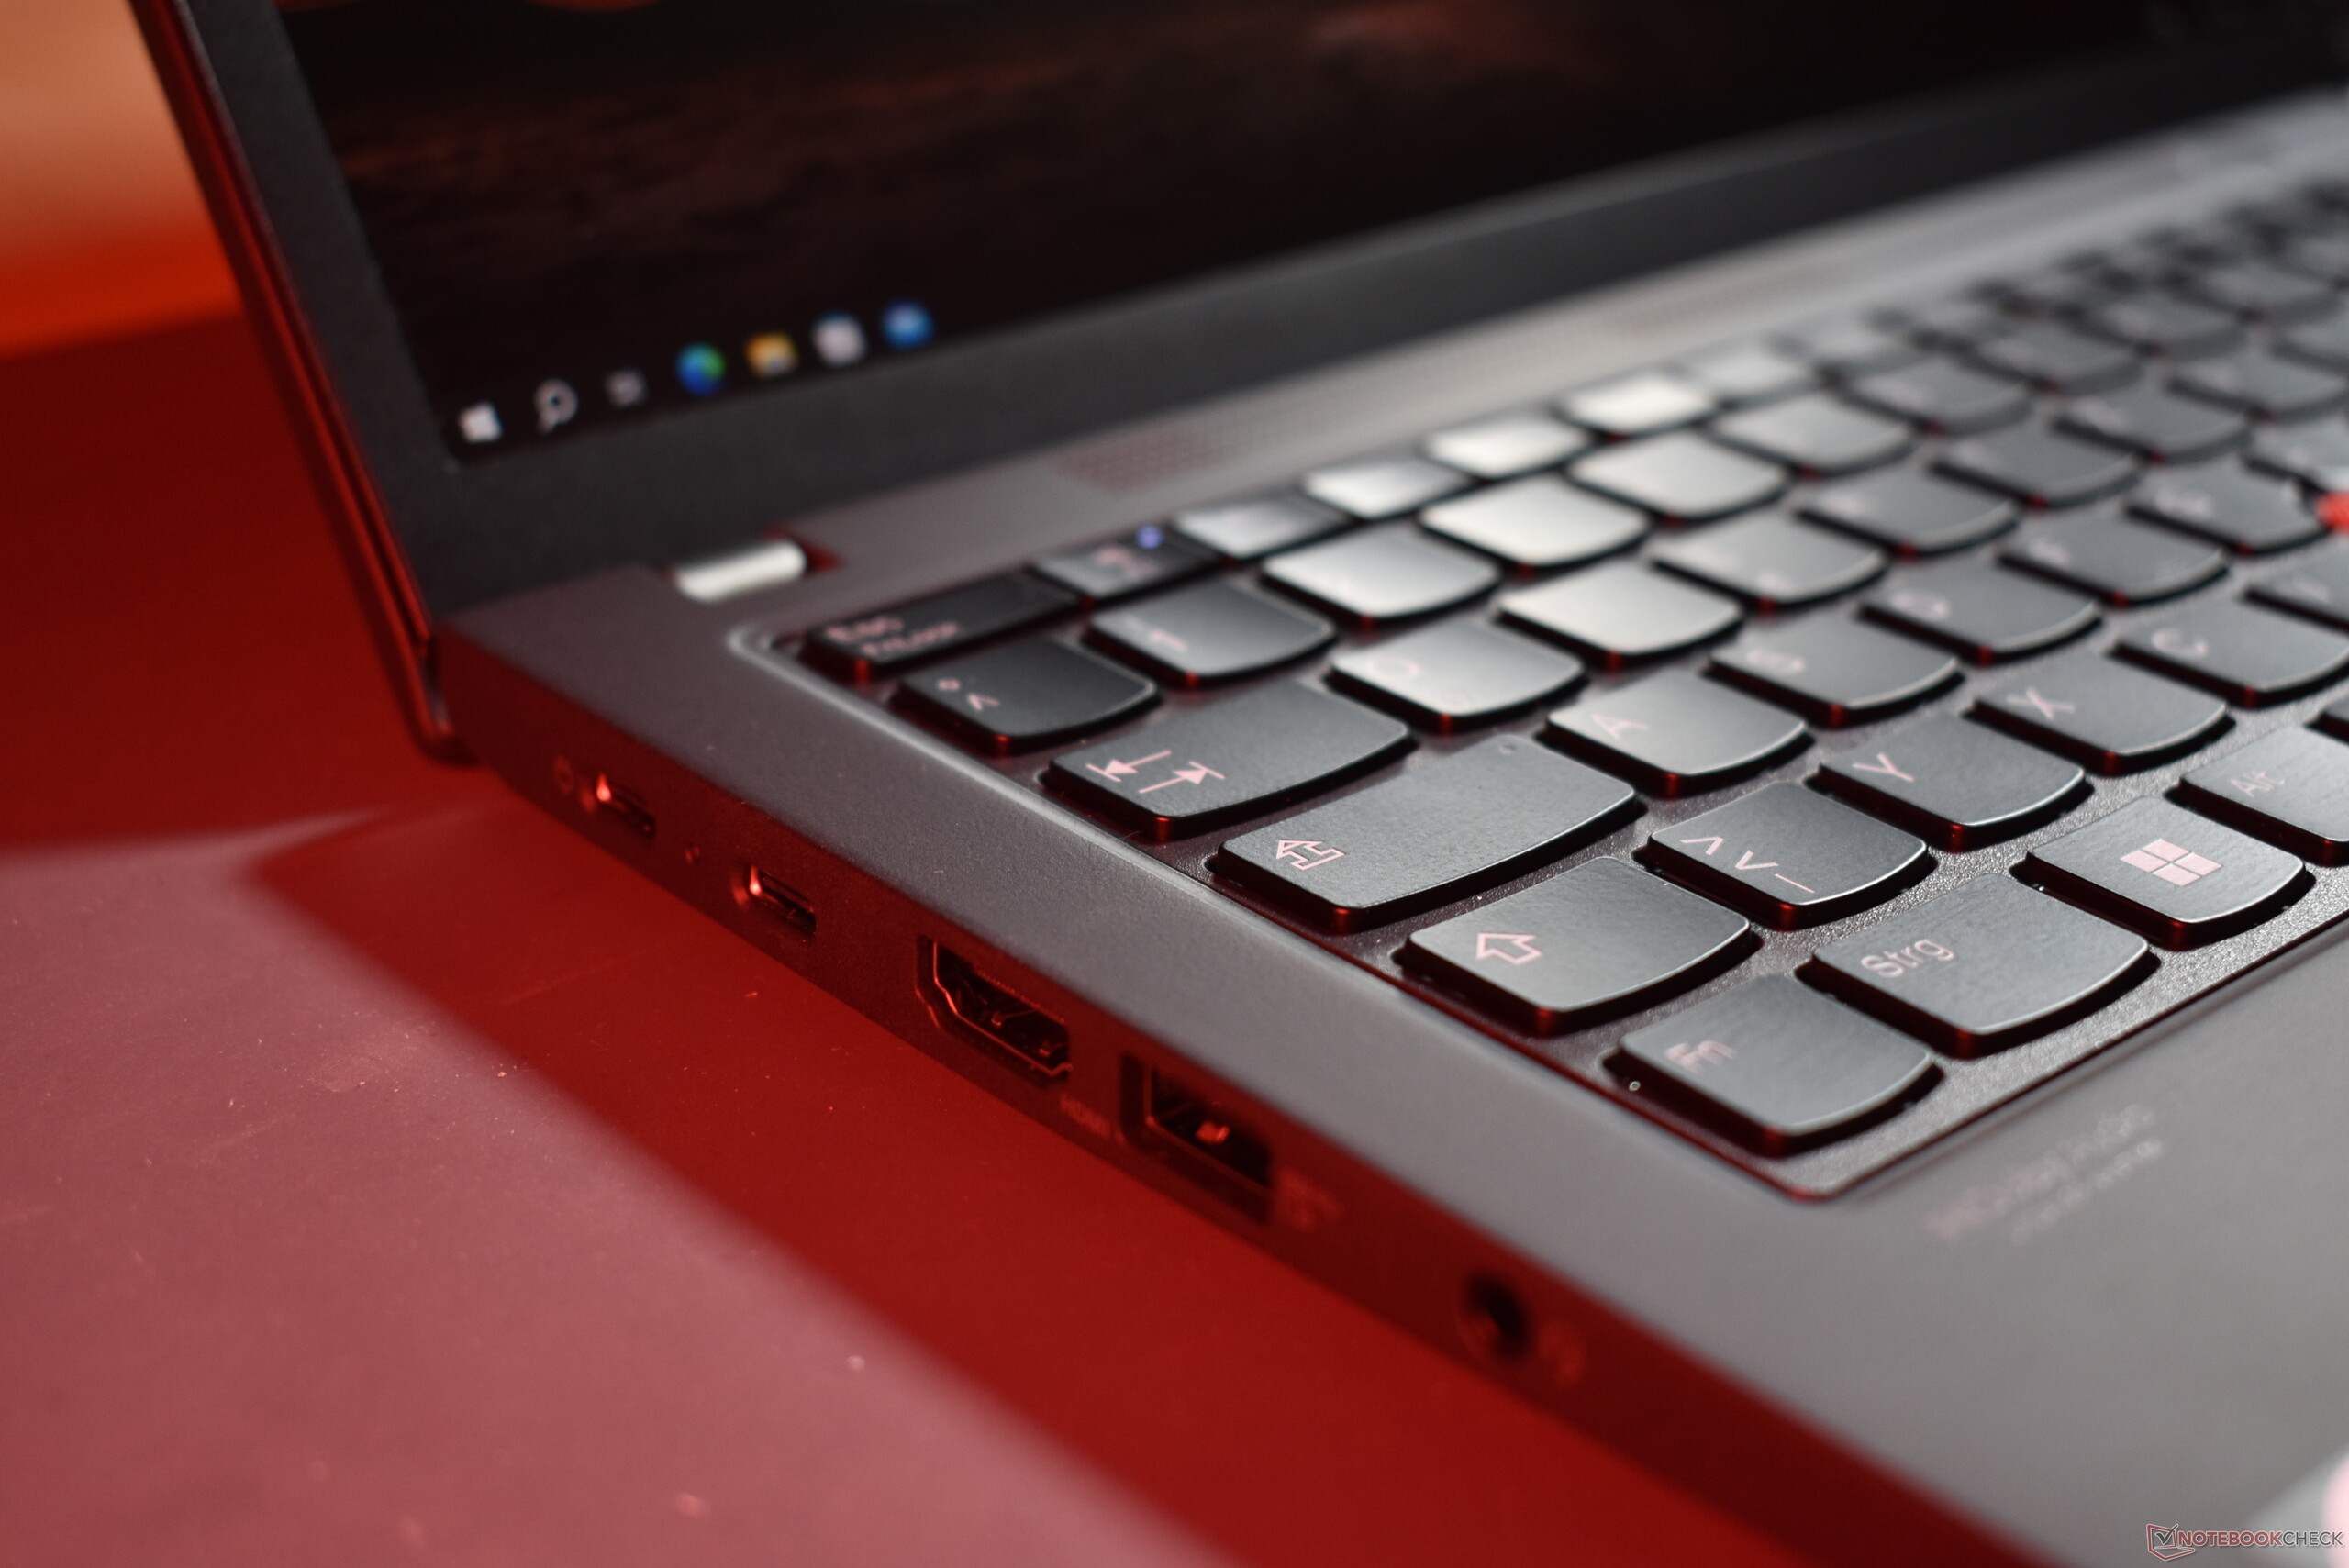
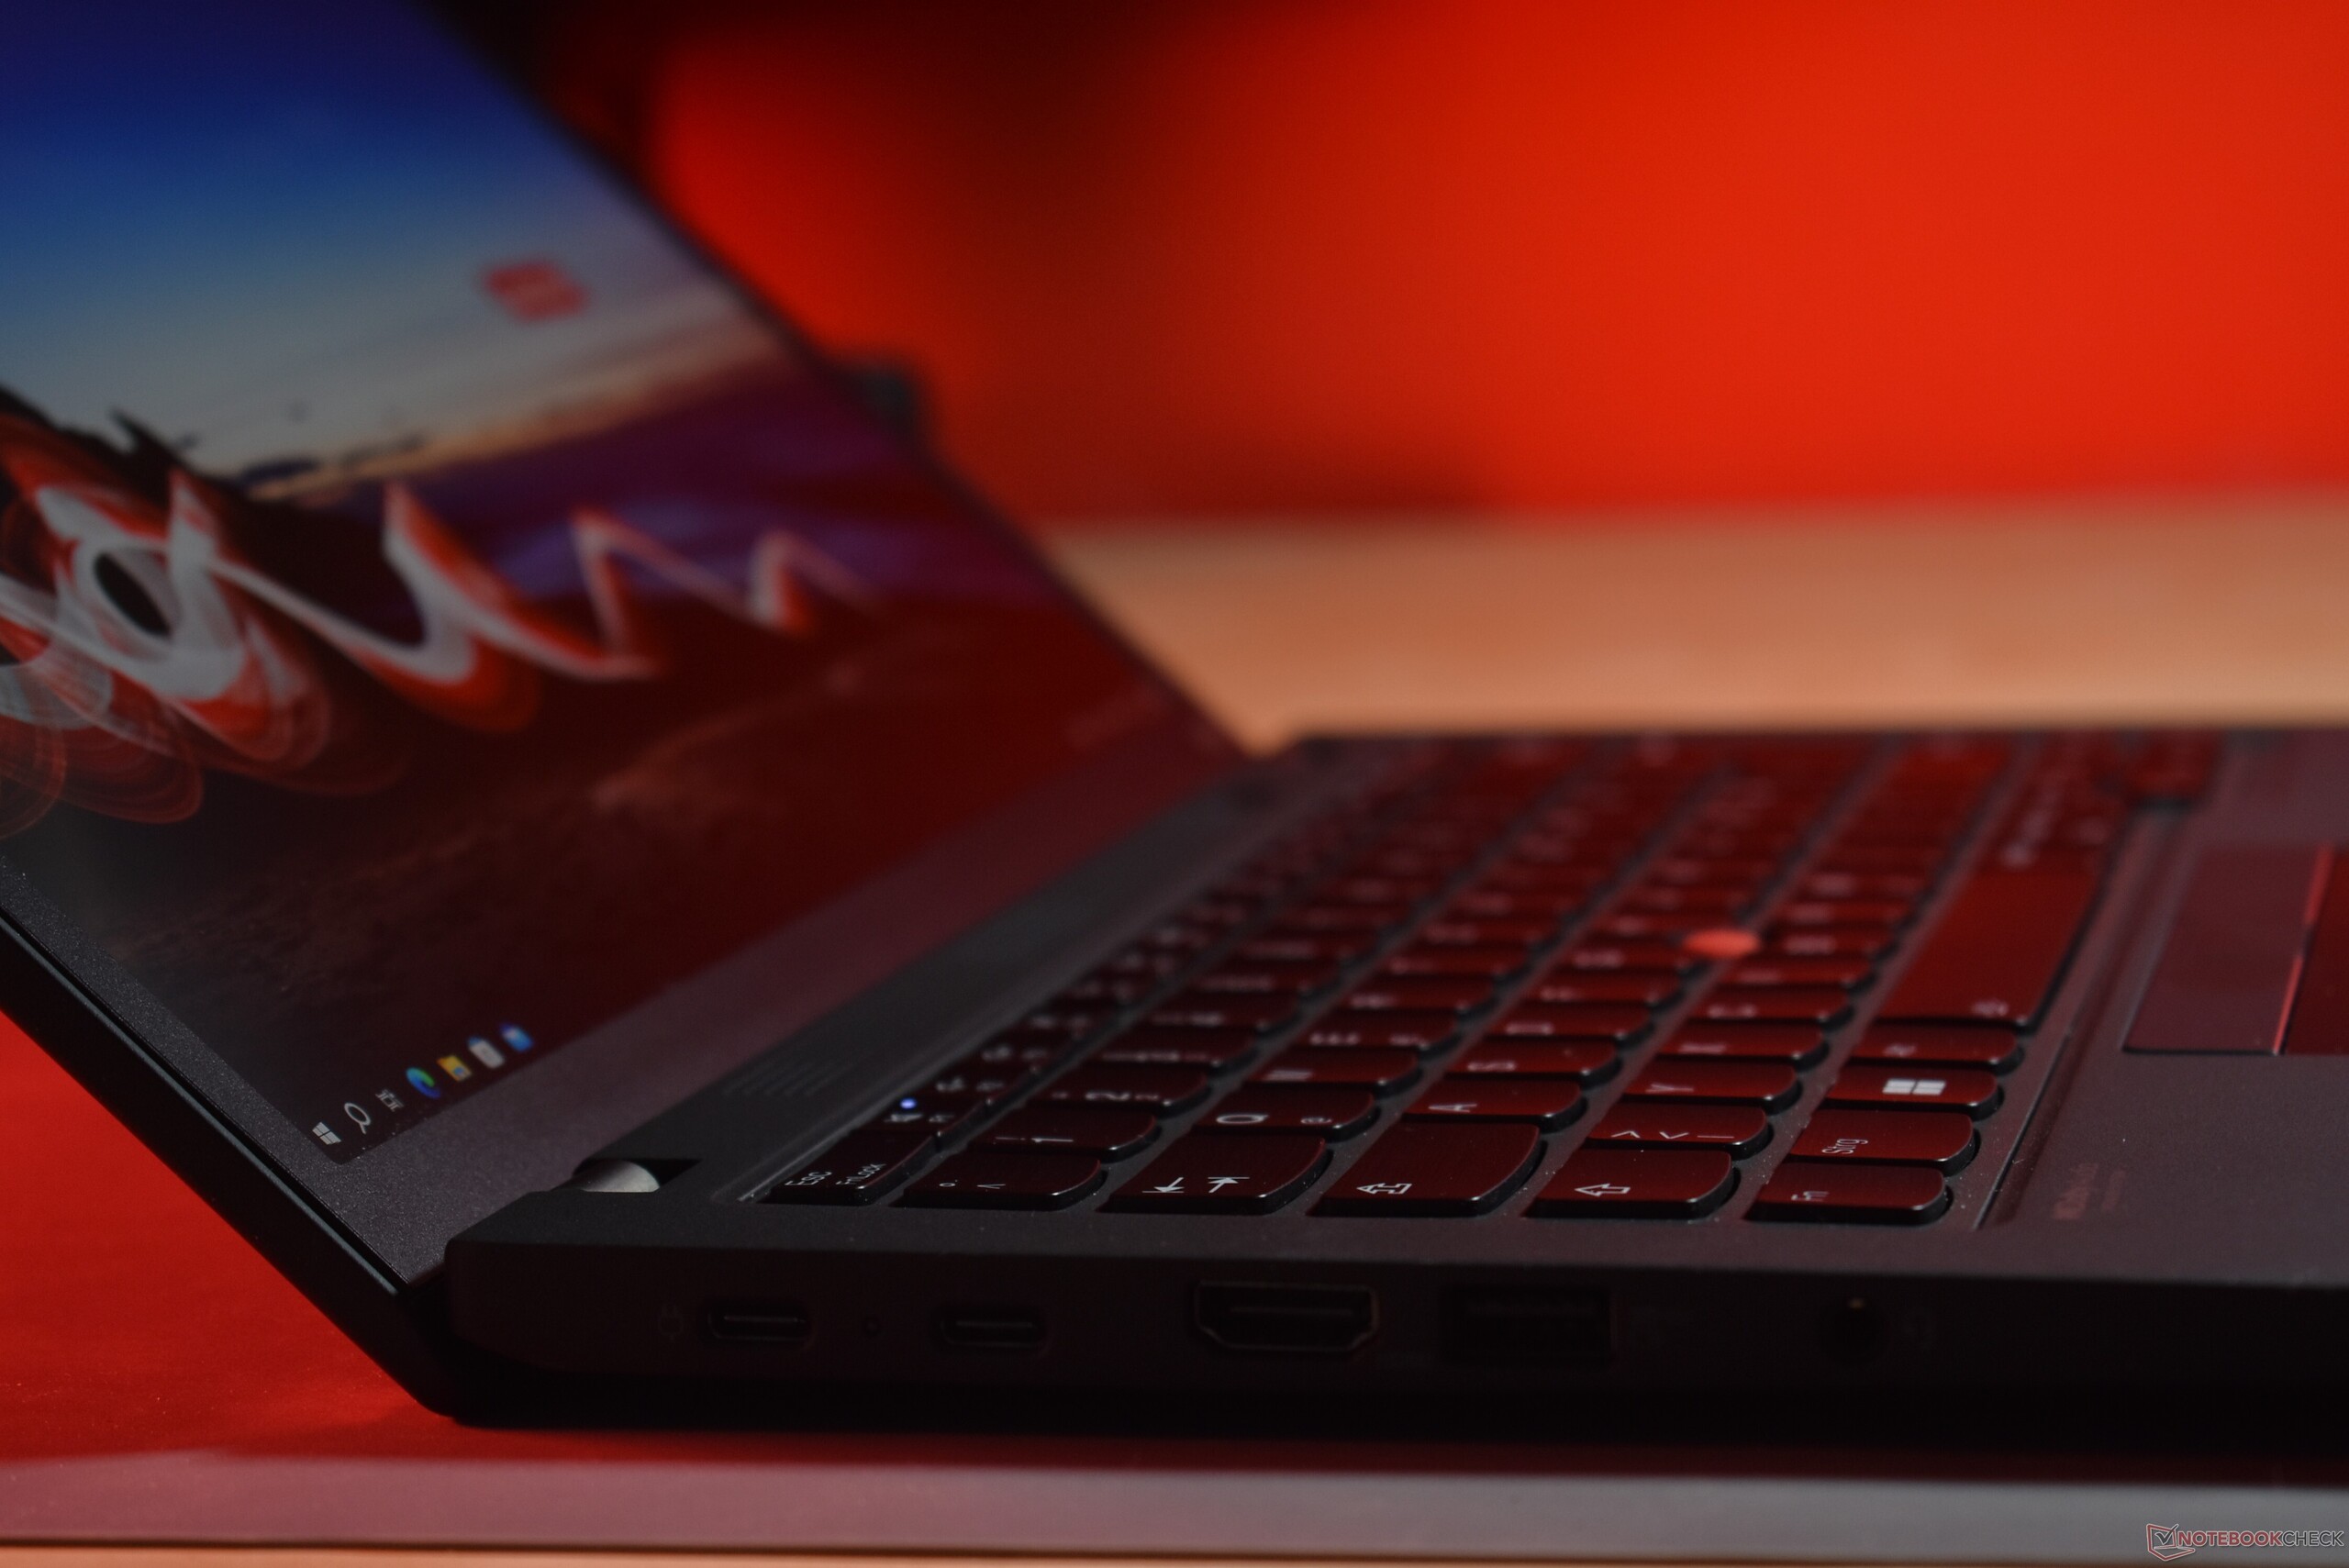
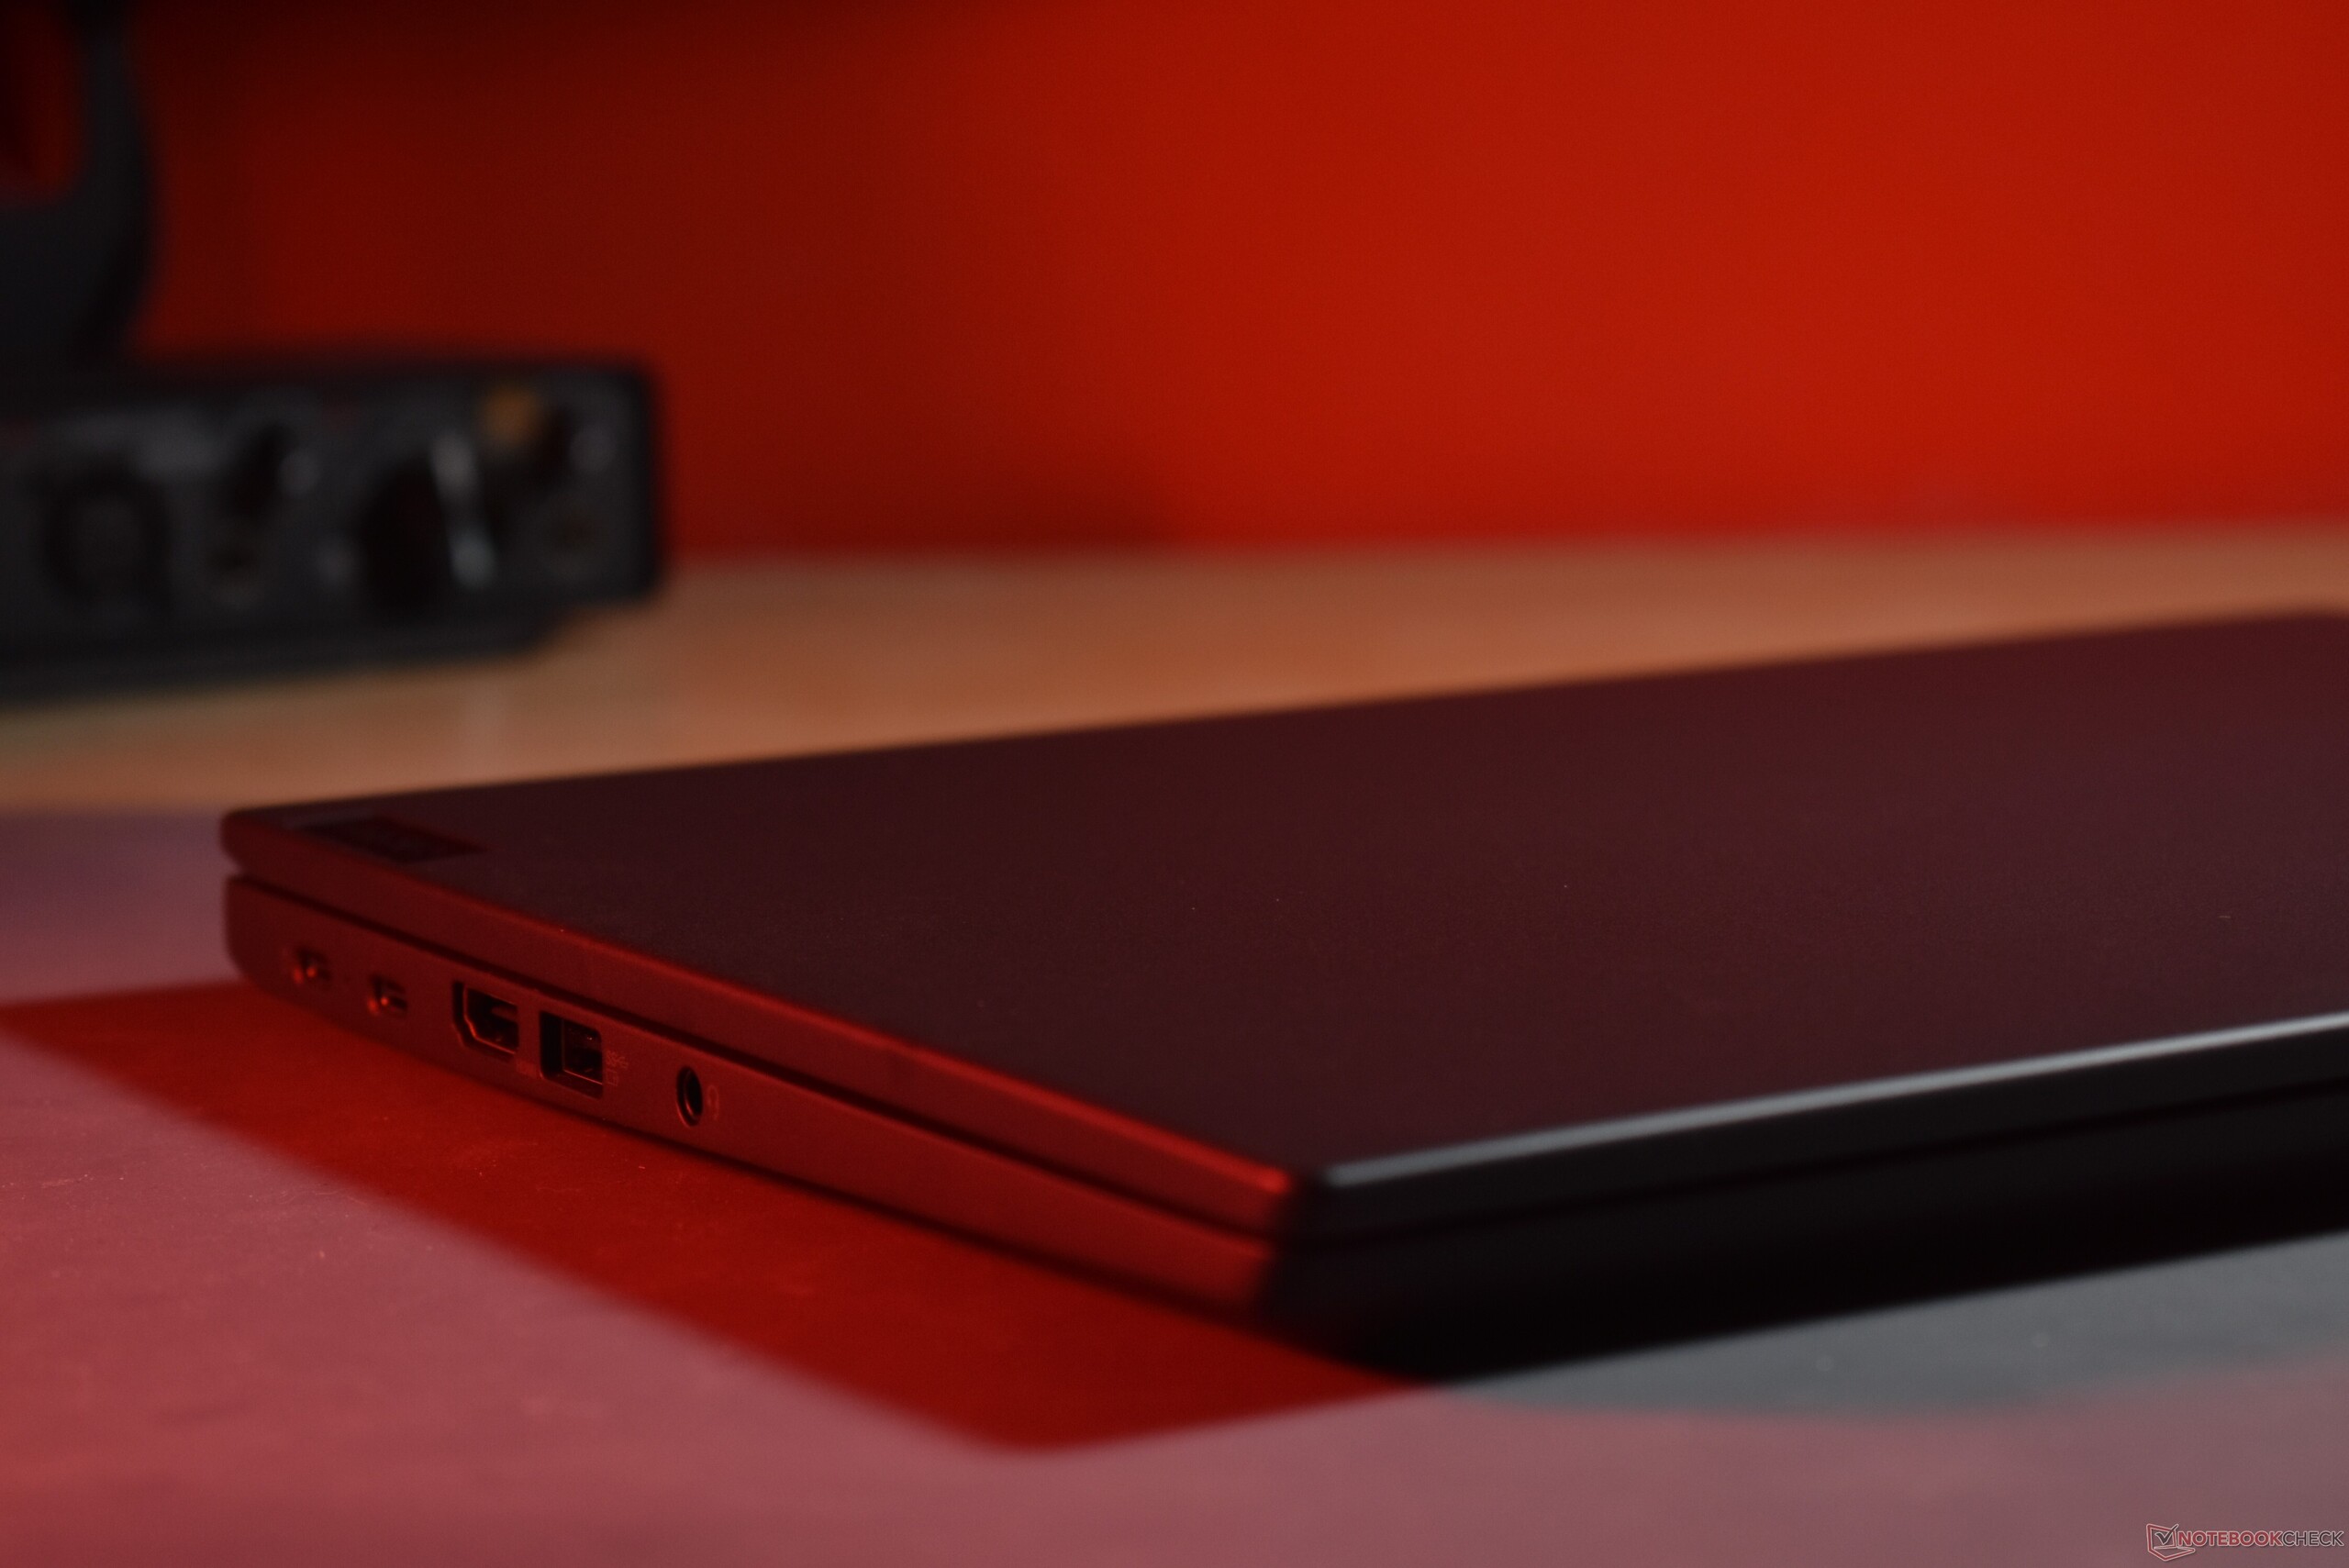
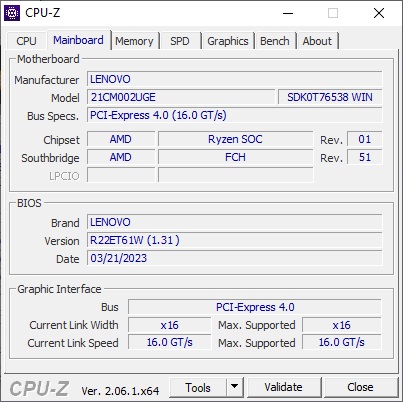
Em comparação com oLenovo ThinkPad X13 Gen 2 AMDa seleção de portas permanece basicamente inalterada. A novidade é a adição de USB4, o que significa compatibilidade com Thunderbolt.
Comunicação
Notavelmente fracas são as taxas de transferência de upload do Lenovo ThinkPad X13 G3 AMD, ou melhor, de sua solução Qualcomm WiFi. As taxas de download, por outro lado, são perfeitamente boas.
| Networking | |
| Lenovo ThinkPad X13 G3 21CM002UGE | |
| iperf3 transmit AXE11000 | |
| iperf3 receive AXE11000 | |
| iperf3 transmit AXE11000 6GHz | |
| iperf3 receive AXE11000 6GHz | |
| HP EliteBook 835 G9 | |
| iperf3 transmit AXE11000 | |
| iperf3 receive AXE11000 | |
| Dell Latitude 13 7330 | |
| iperf3 transmit AXE11000 6GHz | |
| iperf3 receive AXE11000 6GHz | |
| Lenovo ThinkPad X13 G3 21BN0046GE | |
| iperf3 transmit AXE11000 | |
| iperf3 receive AXE11000 | |
| Média Qualcomm WCN685x | |
| iperf3 transmit AXE11000 | |
| iperf3 receive AXE11000 | |
| iperf3 transmit AXE11000 6GHz | |
| iperf3 receive AXE11000 6GHz | |
Webcam
Em comparação com o Lenovo ThinkPad X13 Gen 2não há alterações na qualidade da webcam de 1080p.


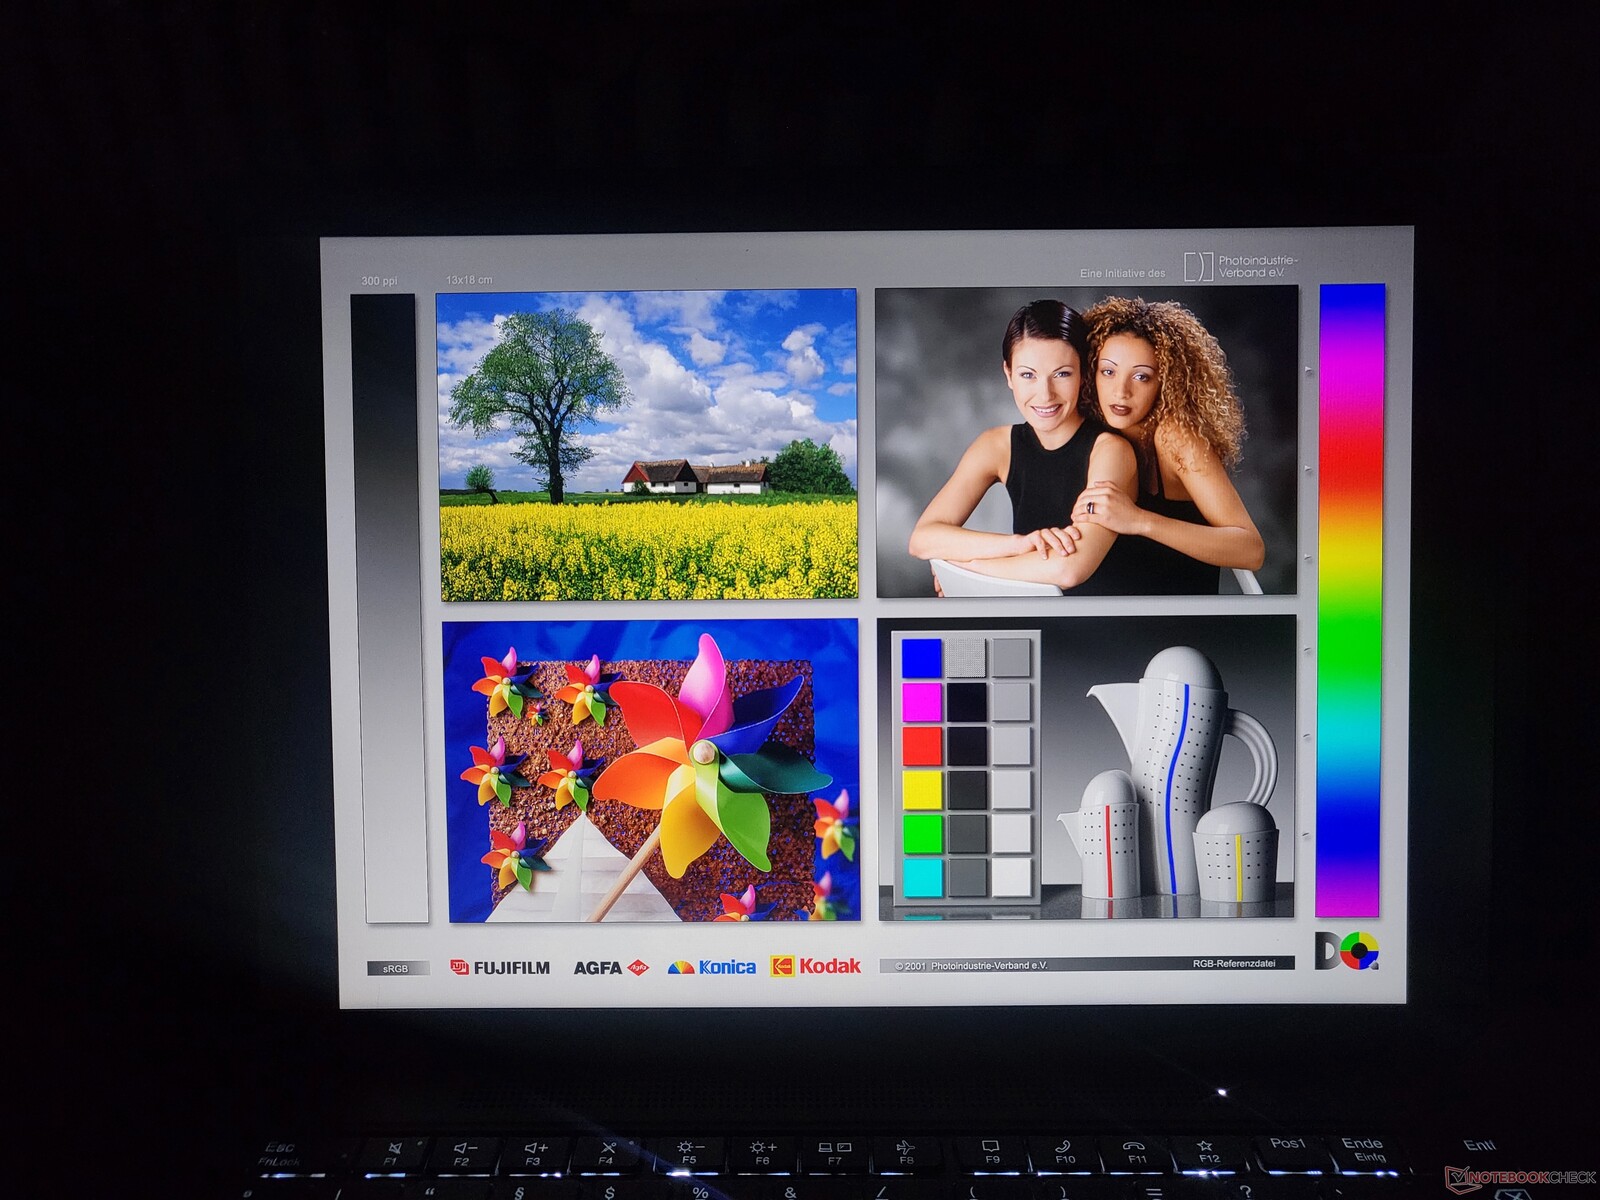
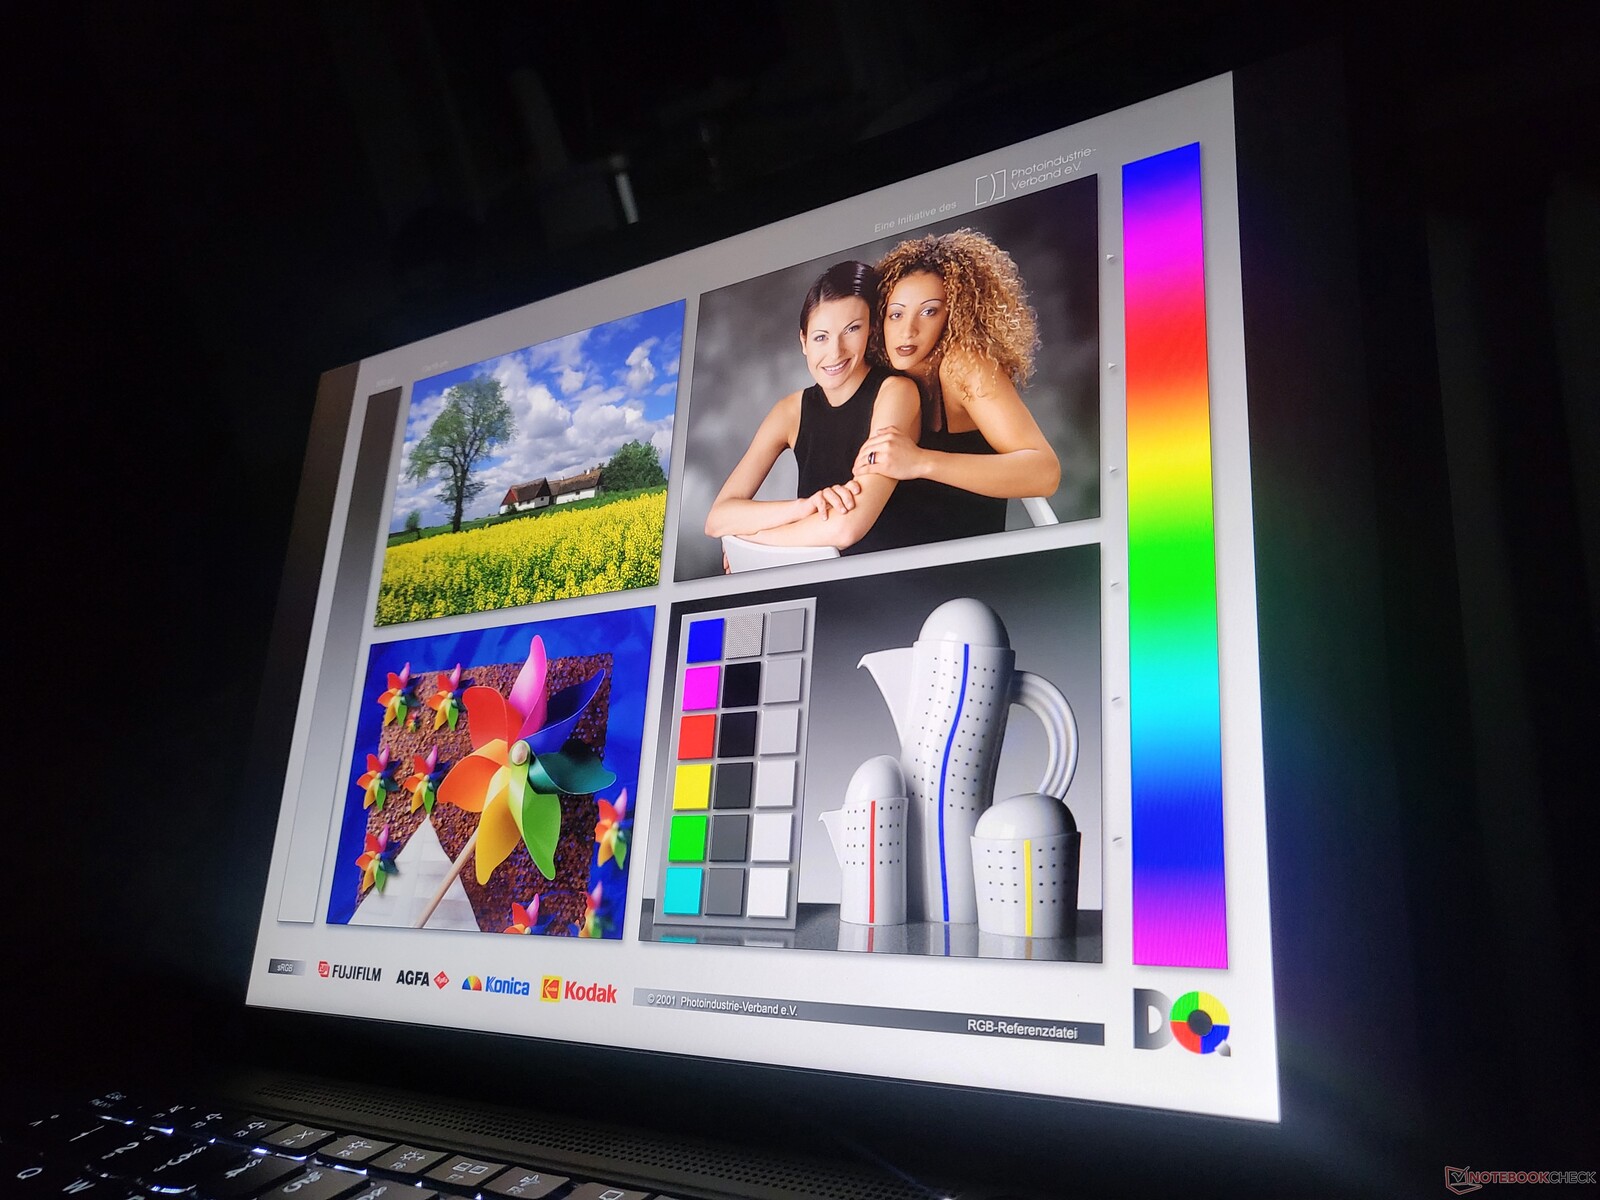
Tela: o brilho da tela do laptop Lenovo poderia ser melhor

A seleção de telas de 13,3 polegadas permanece inalterada em comparação com o modelo de 2022. Todas as telas disponíveis têm superfície fosca, proporção de 16:10 e taxa de atualização de 60 Hz:
- 1.920 x 1.200 (WUXGA), 300 cd/m², 72% NTSC
- 1.920 x 1.200 (WUXGA), 300 cd/m², 72% NTSC, On-Cell Touch
- 1.920 x 1.200 (WUXGA), 500 cd/m², 72% NTSC, PrivacyGuard
- 2.560 x 1.600 (WQXGA), 400 cd/m², 100% sRGB, baixo consumo de energia, Dolby Vision
O brilho médio medido de 321 cd/m² está ligeiramente acima do limite anunciado de 300 cd/m². Notável: A concorrência, na forma da Dell e da HP, oferece telas muito mais brilhantes. Uma média de 830 cd/m², como o HP EliteBook 835 G9 não é realmente necessária no painel básico, mas seria bom se a Lenovo concedesse ao X13 telas mais brilhantes - sem forçar o usuário a atualizar para os painéis WQXGA ou PrivacyGuard. 400 cd/m² mais X como oDell Latitude 7330seria razoável.
| |||||||||||||||||||||||||
iluminação: 85 %
iluminação com acumulador: 348 cd/m²
Contraste: 1024:1 (Preto: 0.34 cd/m²)
ΔE ColorChecker Calman: 1.3 | ∀{0.5-29.43 Ø4.71}
calibrated: 1
ΔE Greyscale Calman: 0.9 | ∀{0.09-98 Ø4.96}
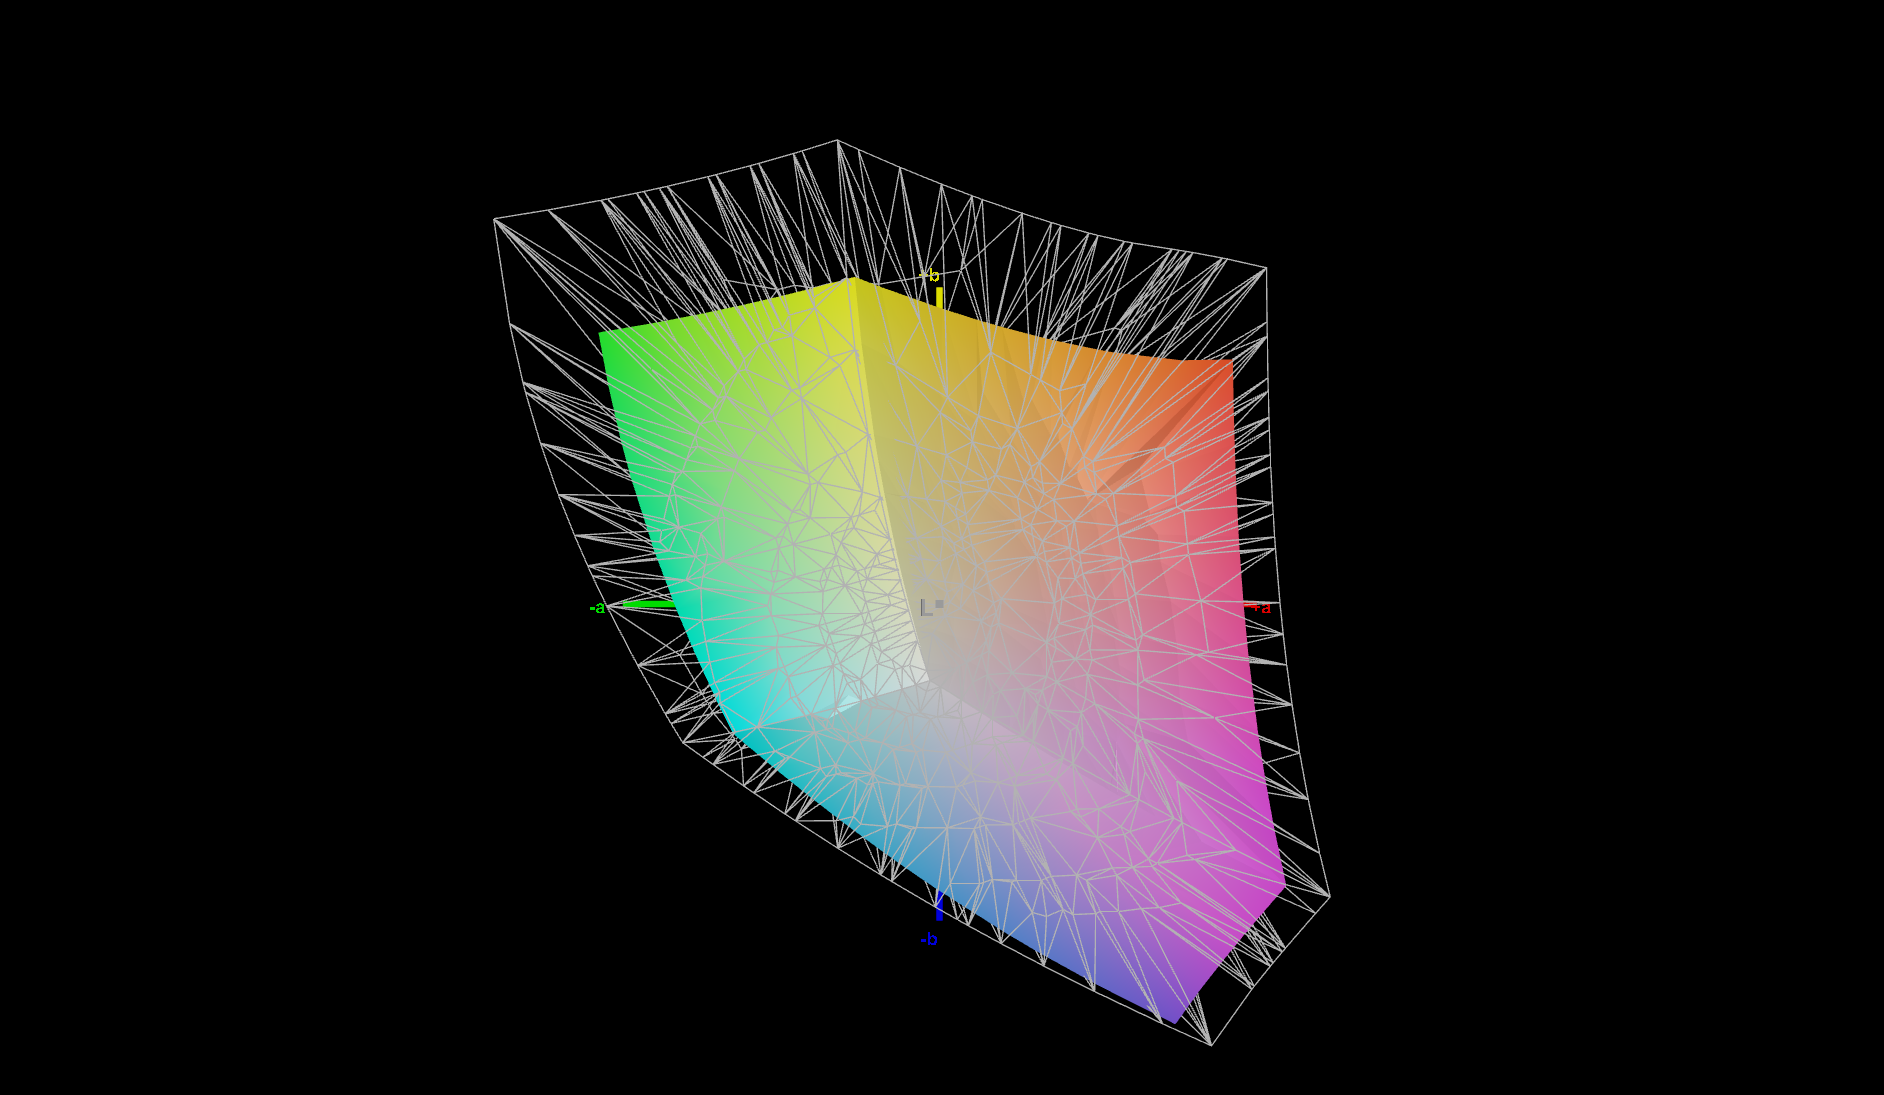
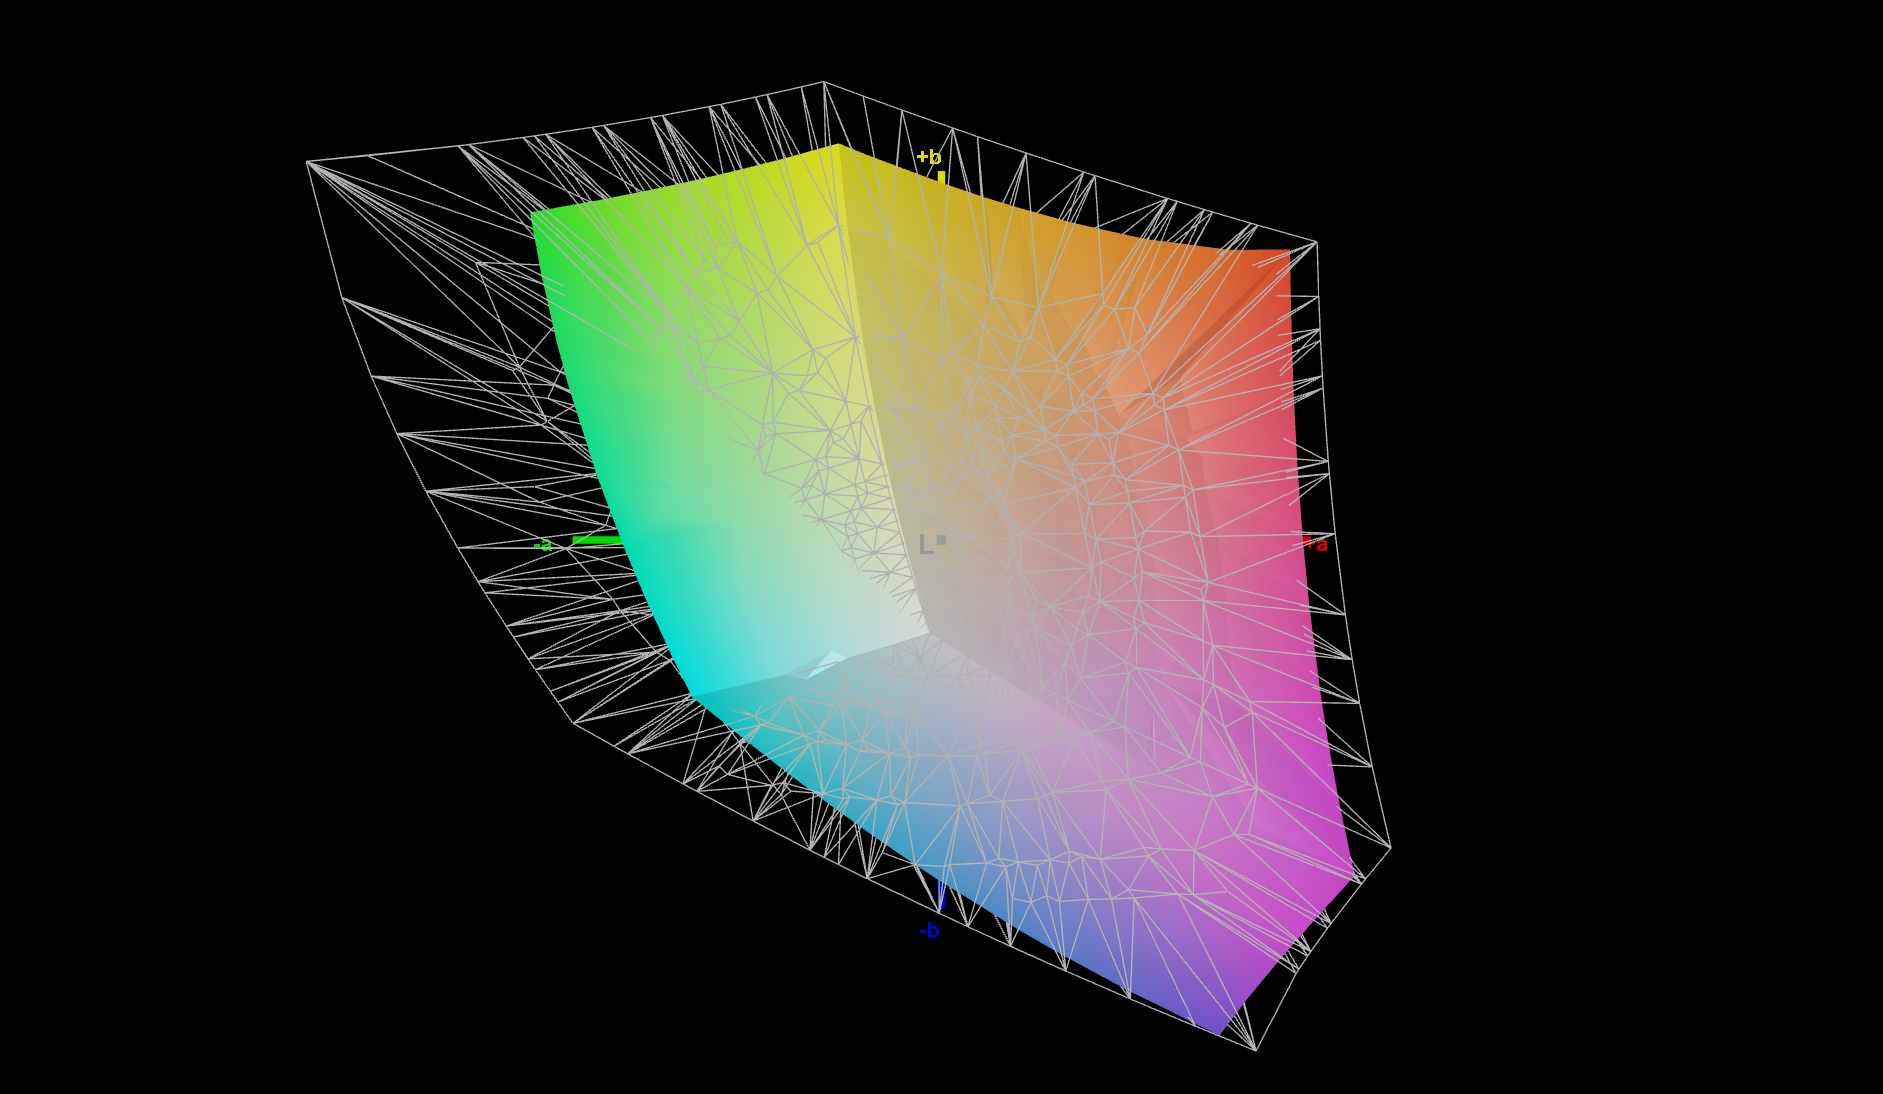
70.3% AdobeRGB 1998 (Argyll 3D)
98.4% sRGB (Argyll 3D)
69% Display P3 (Argyll 3D)
Gamma: 2.16
CCT: 6431 K
| Lenovo ThinkPad X13 G3 21CM002UGE M133NW4J R3, IPS LED, 1920x1200, 13.3" | Lenovo ThinkPad X13 G2 AMD 20XH001KGE NV133WUM-N61, IPS LED, 1920x1200, 13.3" | HP EliteBook 835 G9 InfoVision X133NV4M R0, IPS, 1920x1200, 13.3" | Dell Latitude 13 7330 LG Philips 133WF9, IPS, 1920x1080, 13.3" | Lenovo ThinkPad X13 G3 21BN0046GE NV133WUM-N61, IPS Grade, 1920x1200, 13.3" | |
|---|---|---|---|---|---|
| Display | 1% | 2% | -4% | 1% | |
| Display P3 Coverage (%) | 69 | 70.1 2% | 70.7 2% | 66.1 -4% | 70.4 2% |
| sRGB Coverage (%) | 98.4 | 99.4 1% | 100 2% | 93.5 -5% | 99.8 1% |
| AdobeRGB 1998 Coverage (%) | 70.3 | 71.3 1% | 72.1 3% | 68.2 -3% | 71 1% |
| Response Times | 23% | 17% | -8% | 48% | |
| Response Time Grey 50% / Grey 80% * (ms) | 44.2 ? | 34 ? 23% | 37.7 ? 15% | 48.4 ? -10% | 22.9 ? 48% |
| Response Time Black / White * (ms) | 28.1 ? | 22 ? 22% | 22.7 ? 19% | 29.6 ? -5% | 14.8 ? 47% |
| PWM Frequency (Hz) | |||||
| Screen | -14% | 21% | -16% | -25% | |
| Brightness middle (cd/m²) | 348 | 309 -11% | 928 167% | 460.1 32% | 290 -17% |
| Brightness (cd/m²) | 321 | 297 -7% | 828 158% | 445 39% | 288 -10% |
| Brightness Distribution (%) | 85 | 81 -5% | 65 -24% | 89 5% | 88 4% |
| Black Level * (cd/m²) | 0.34 | 0.26 24% | 0.35 -3% | 0.31 9% | 0.21 38% |
| Contrast (:1) | 1024 | 1188 16% | 2651 159% | 1484 45% | 1381 35% |
| Colorchecker dE 2000 * | 1.3 | 1.6 -23% | 1.76 -35% | 2.42 -86% | 1.9 -46% |
| Colorchecker dE 2000 max. * | 2.5 | 3 -20% | 3.94 -58% | 3.97 -59% | 4 -60% |
| Colorchecker dE 2000 calibrated * | 1 | 0.8 20% | 1.09 -9% | 0.77 23% | 0.8 20% |
| Greyscale dE 2000 * | 0.9 | 2 -122% | 2.4 -167% | 2.3 -156% | 2.6 -189% |
| Gamma | 2.16 102% | 2.24 98% | 2.324 95% | 2.23 99% | 2.23 99% |
| CCT | 6431 101% | 6315 103% | 6689 97% | 6262 104% | 6195 105% |
| Média Total (Programa/Configurações) | 3% /
-6% | 13% /
16% | -9% /
-13% | 8% /
-9% |
* ... menor é melhor
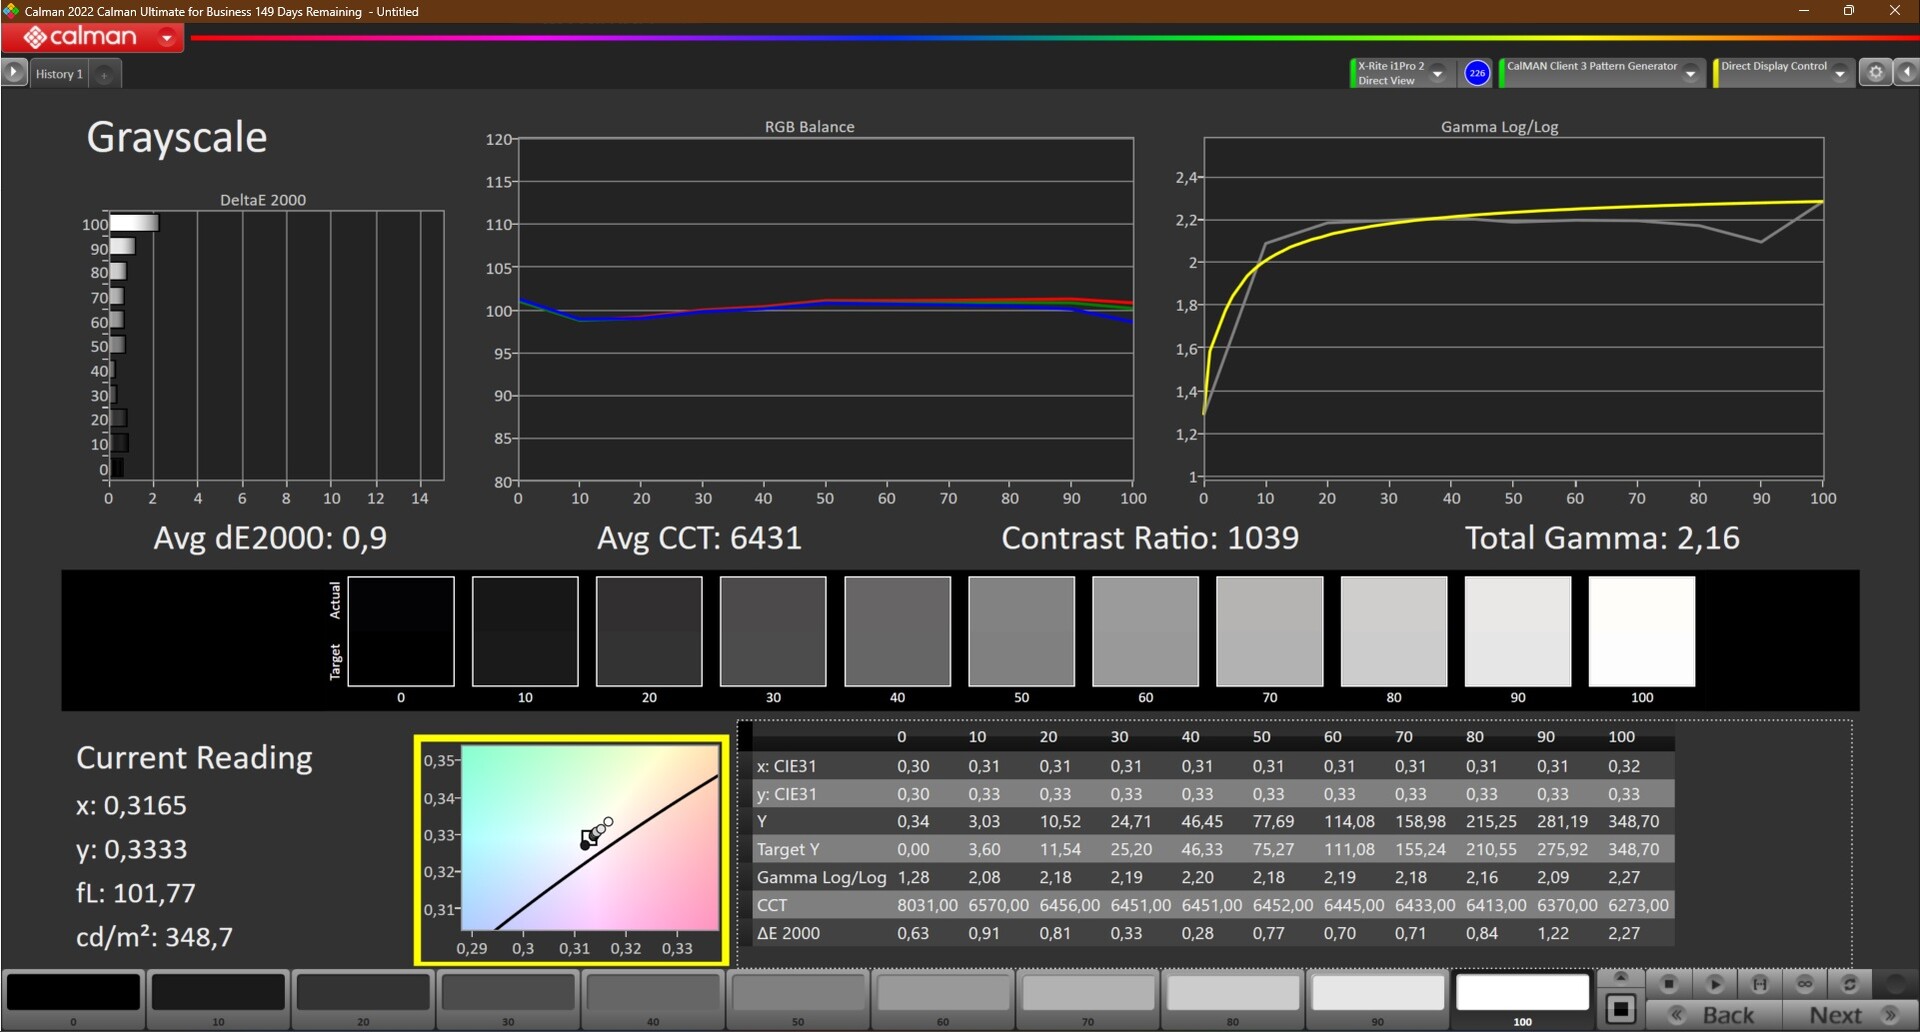
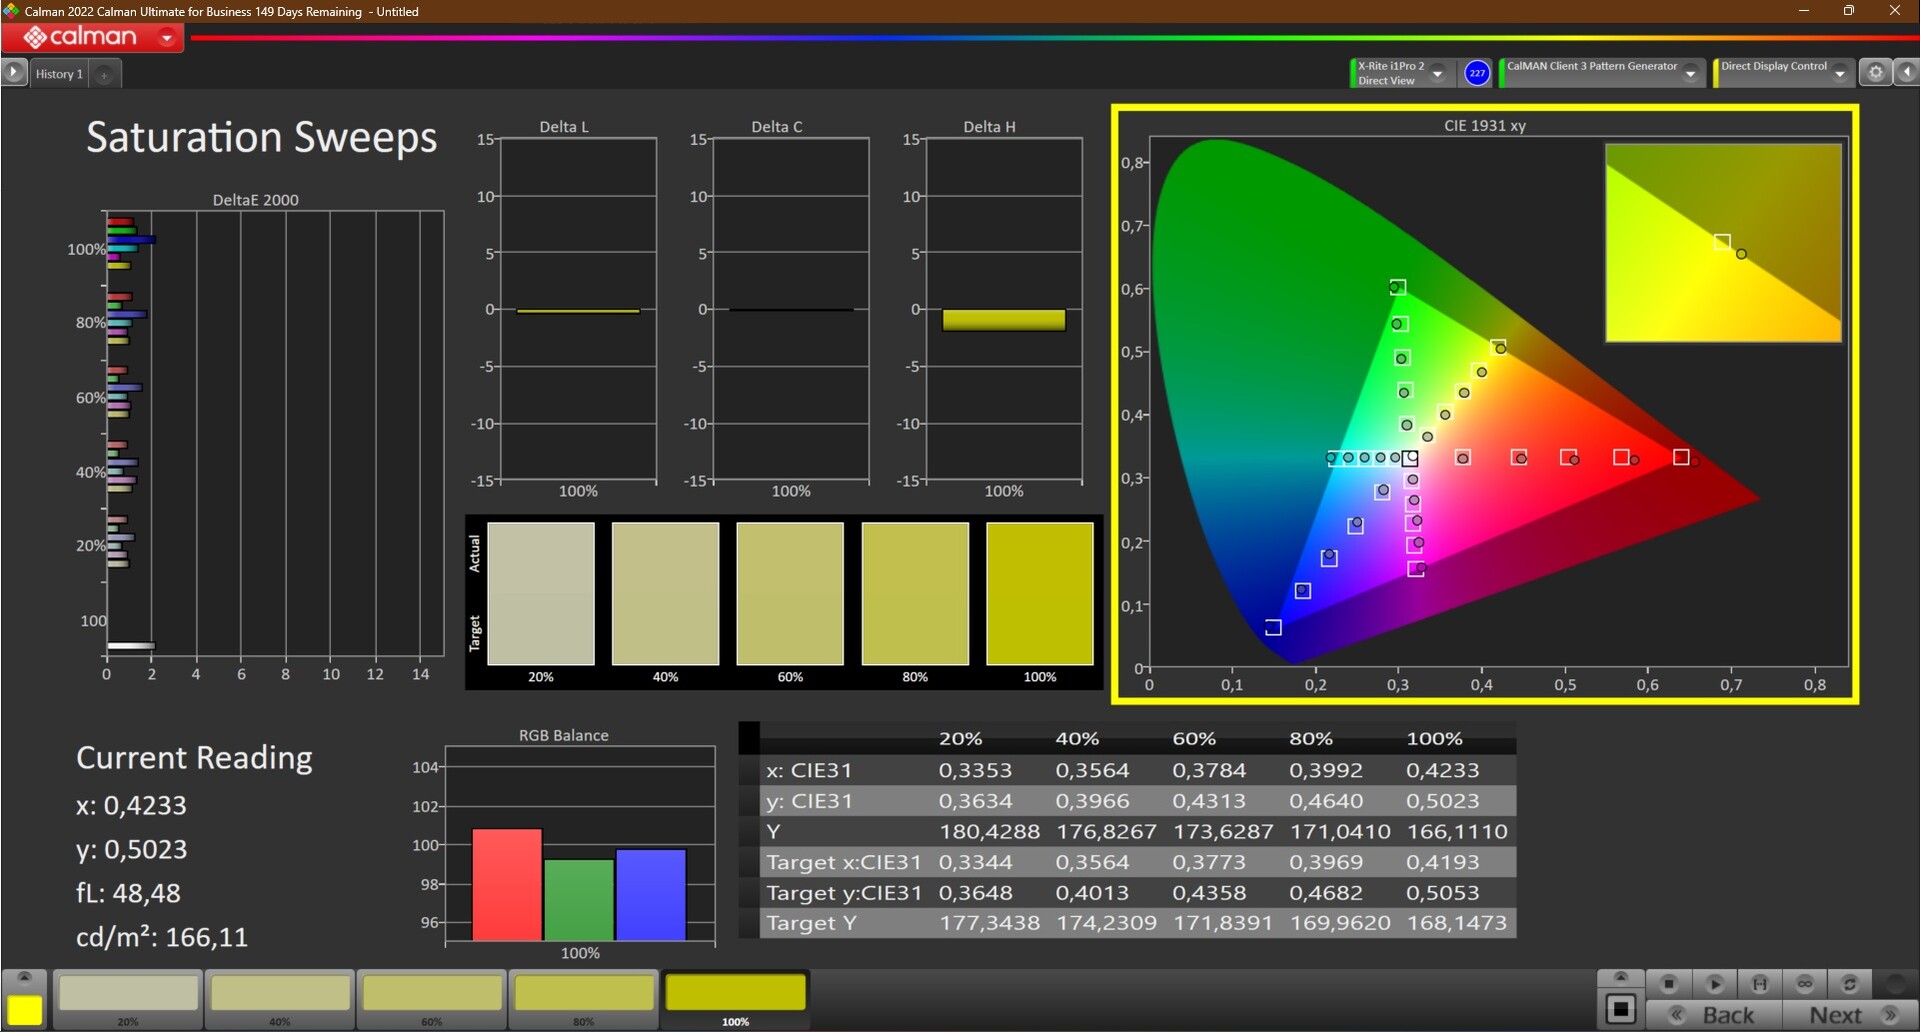
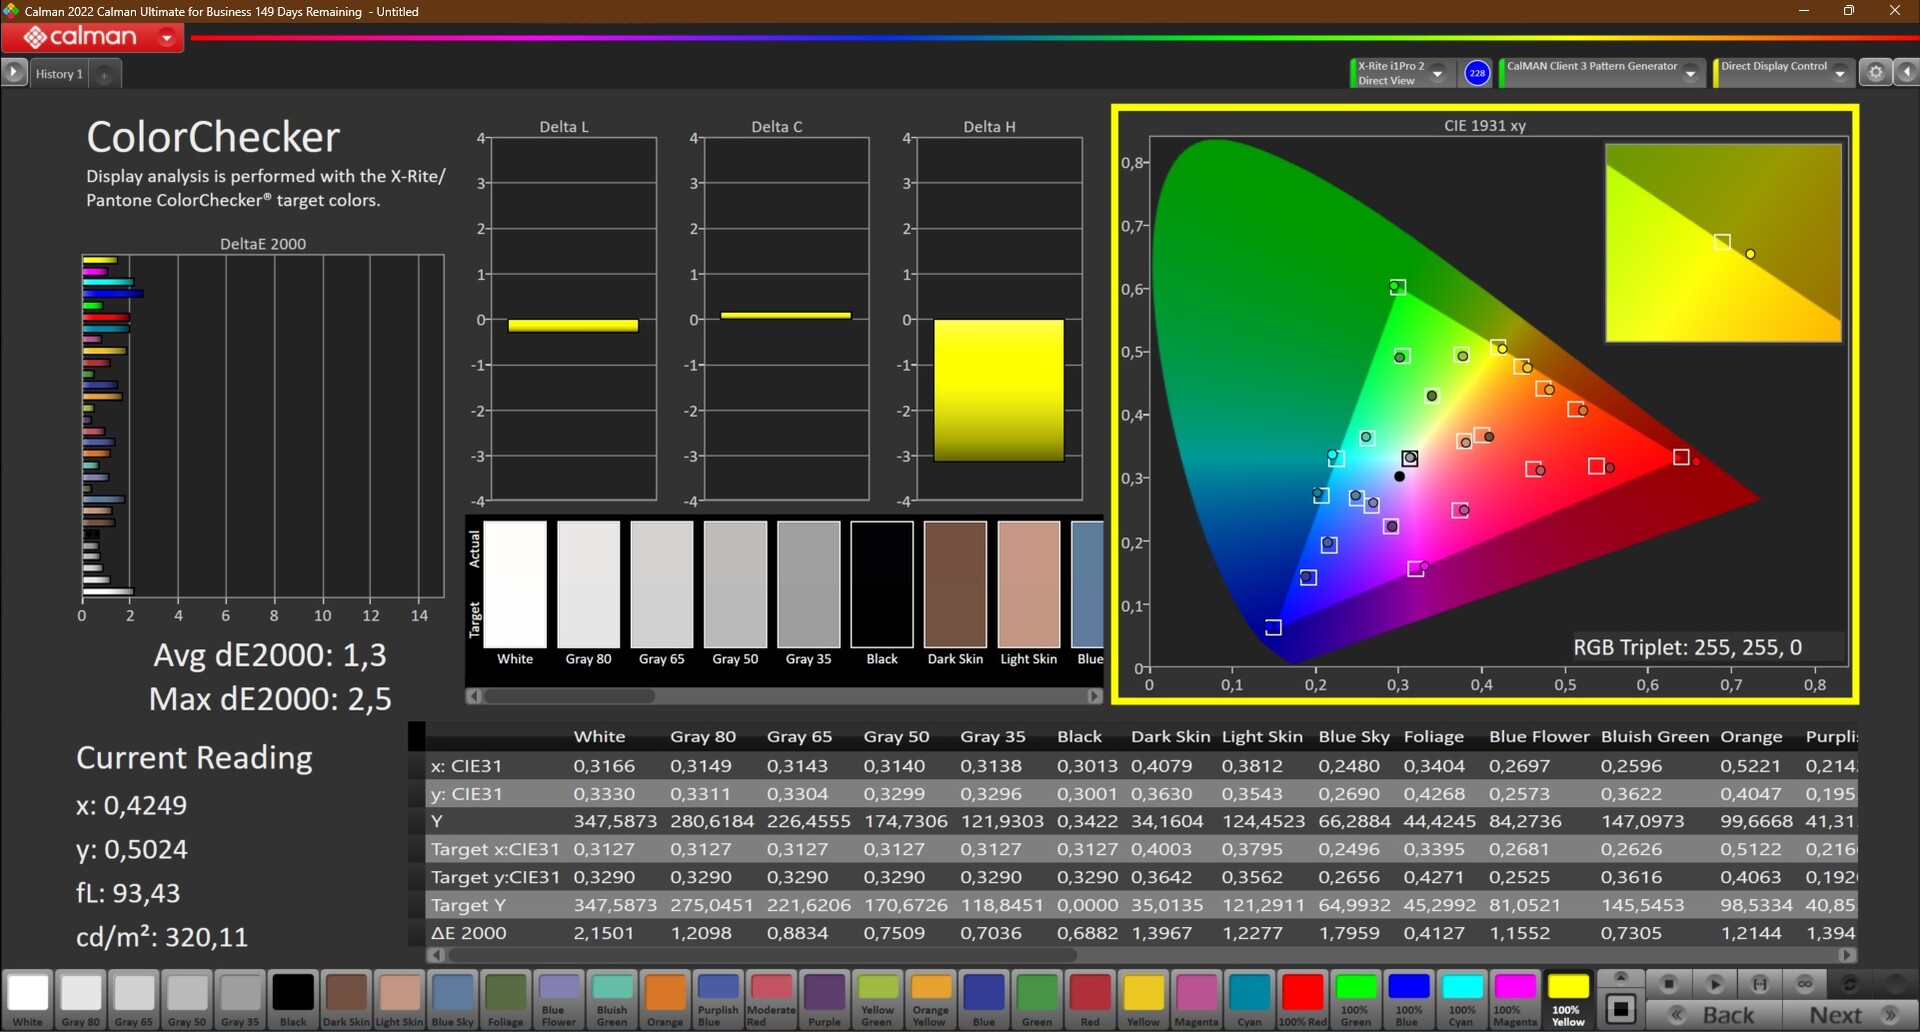
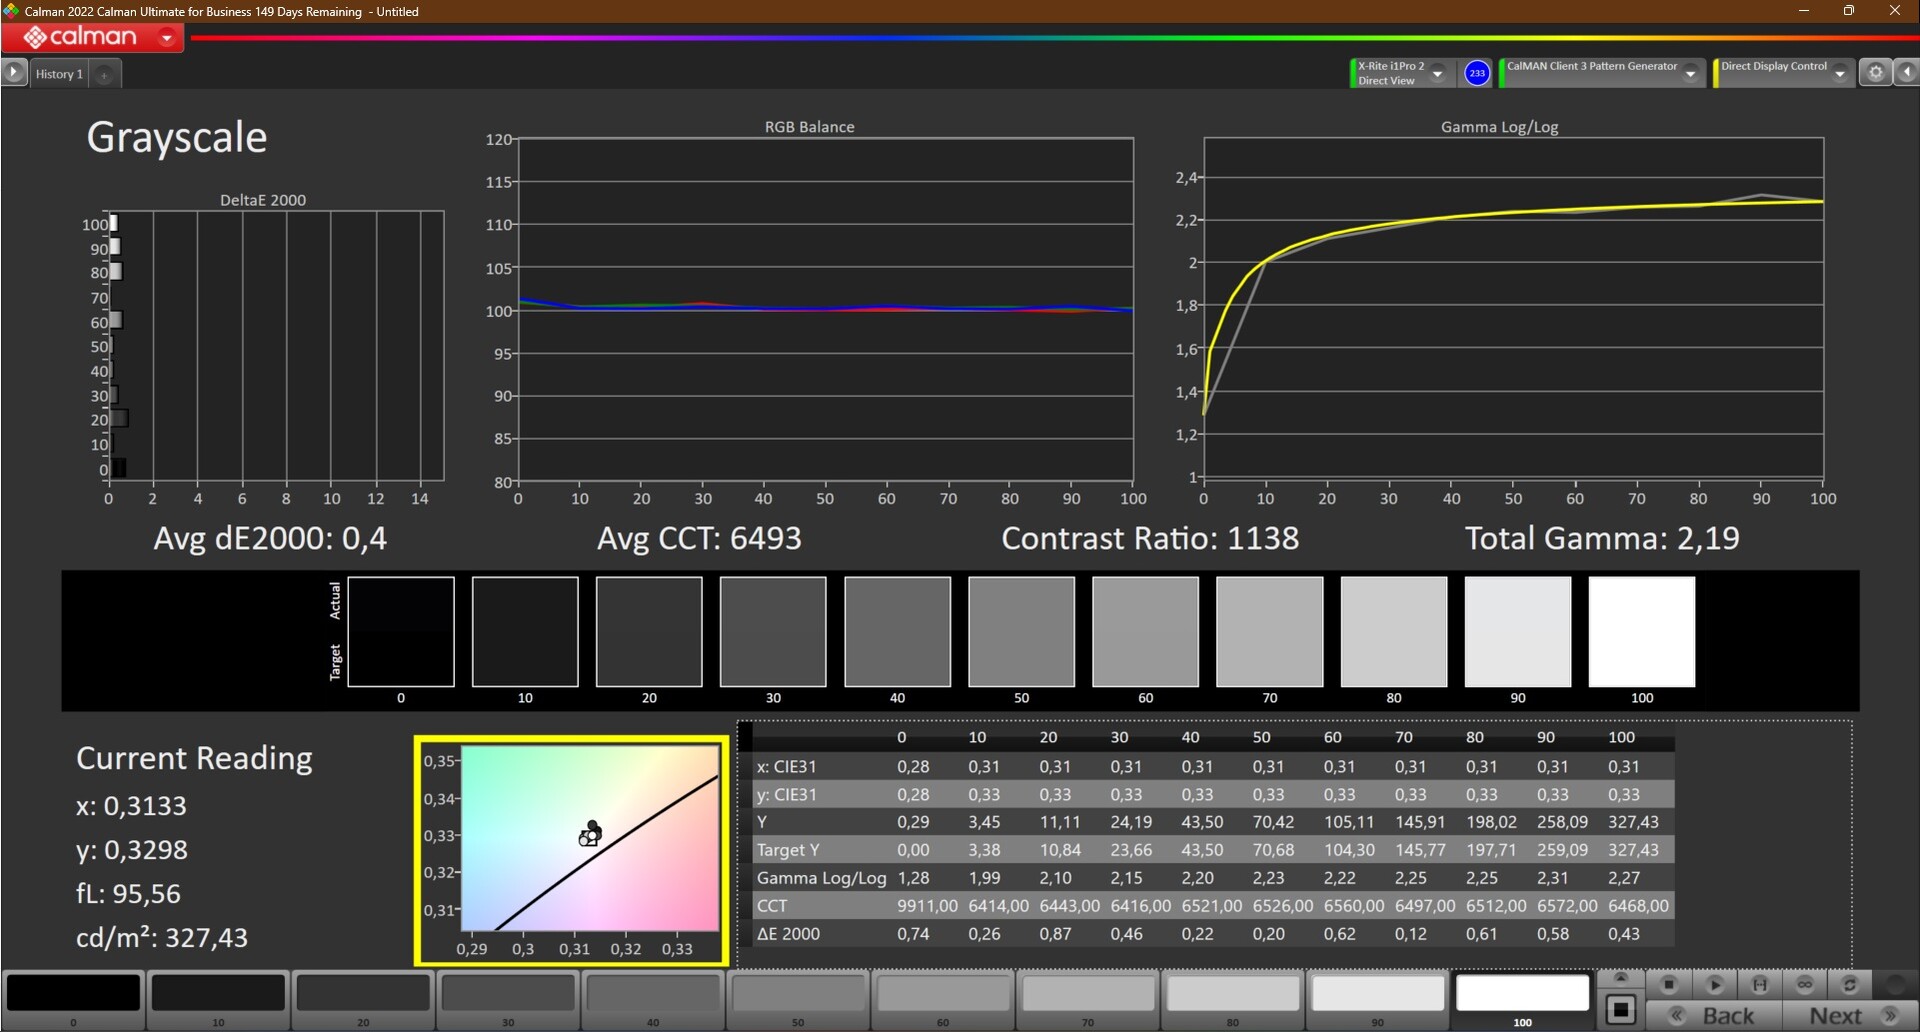

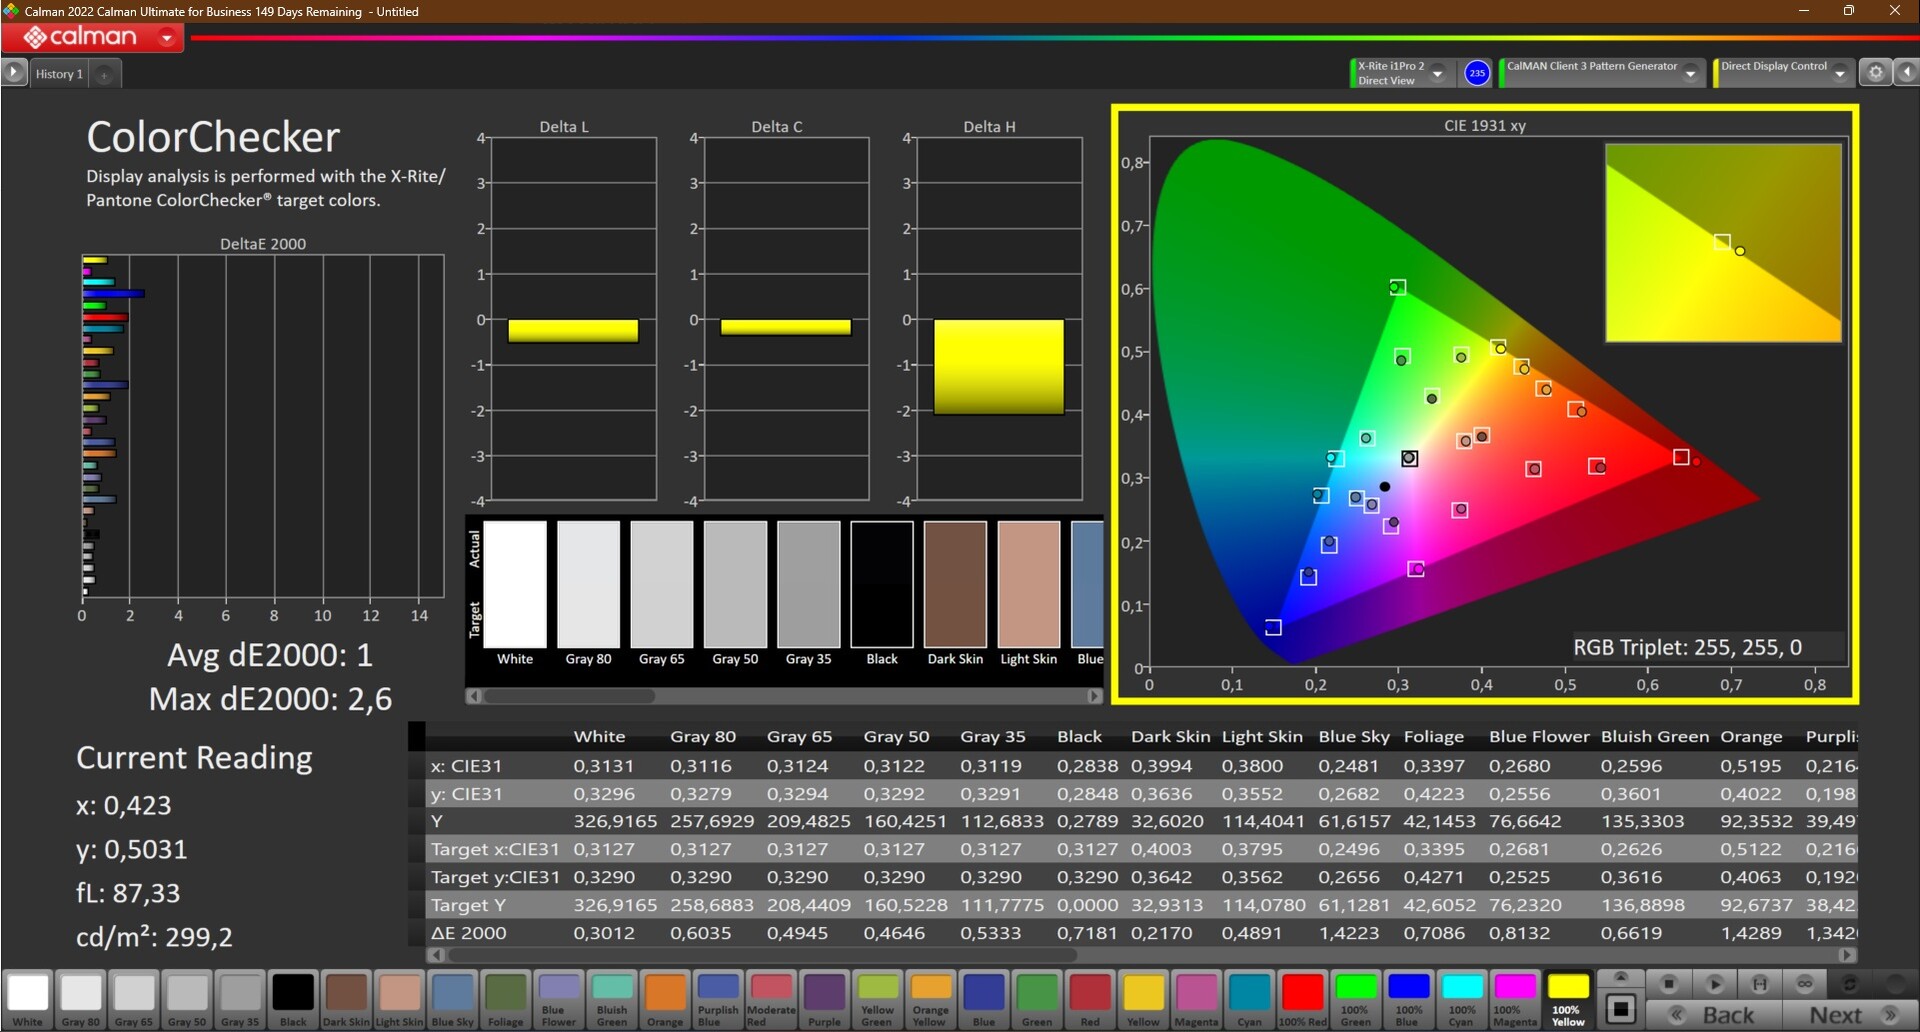
O painel já vem de fábrica muito bem ajustado em termos de cores. O deltaE médio baixo de apenas 1,3, medido com o CalMan e o Colorímetro X-Rite i1Pro 2, é uma prova disso. Após uma calibração com o X-Rite i1Profiler, a tela fica com cores um pouco mais precisas (1,0 em vez de 1,3). O perfil de cores que criamos para essa finalidade está disponível para download gratuito, como sempre.
Em termos de cobertura da gama de cores, o painel do Lenovo ThinkPad X13 G3 AMD está cobrindo quase completamente a gama de cores sRGB. Ele pode ser usado para tarefas básicas de edição de fotos.

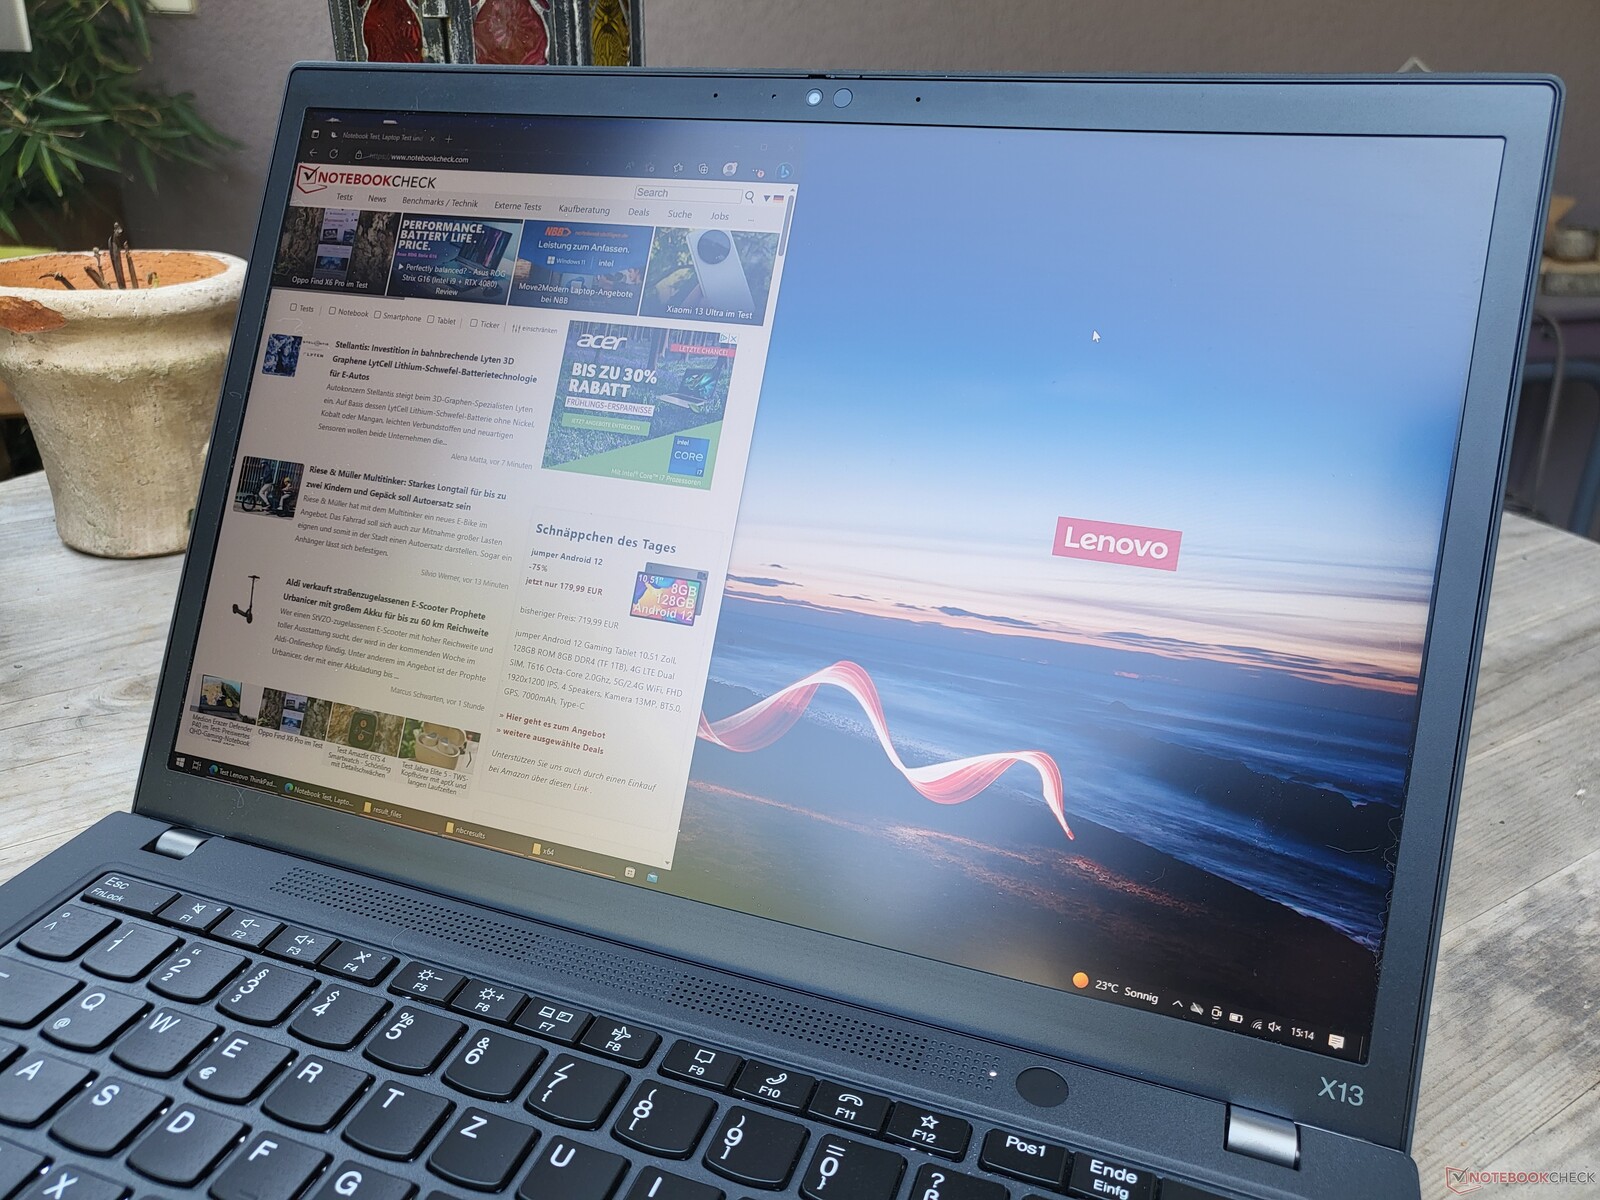
Em exteriores, o ThinkPad X13 Gen 3 é utilizável, graças à superfície fosca da tela. Como antes: gostaríamos de ter uma tela mais brilhante, especialmente para um laptop dessa classe de dispositivo móvel.
Exibir tempos de resposta
| ↔ Tempo de resposta preto para branco | ||
|---|---|---|
| 28.1 ms ... ascensão ↗ e queda ↘ combinadas | ↗ 14.2 ms ascensão | 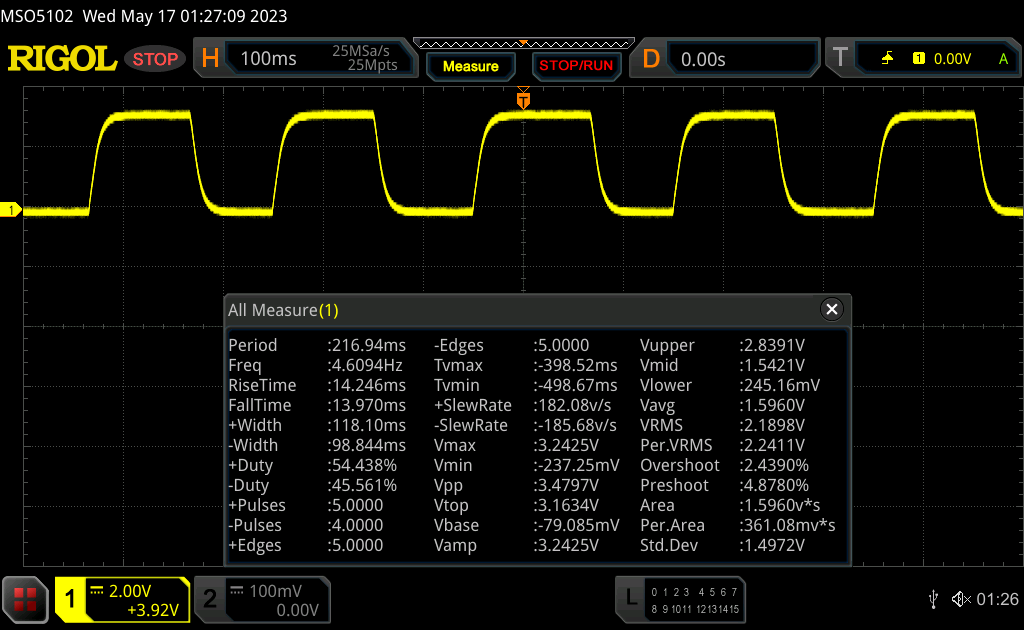 |
| ↘ 13.9 ms queda | ||
| A tela mostra taxas de resposta relativamente lentas em nossos testes e pode ser muito lenta para os jogadores. Em comparação, todos os dispositivos testados variam de 0.1 (mínimo) a 240 (máximo) ms. » 75 % de todos os dispositivos são melhores. Isso significa que o tempo de resposta medido é pior que a média de todos os dispositivos testados (19.8 ms). | ||
| ↔ Tempo de resposta 50% cinza a 80% cinza | ||
| 44.2 ms ... ascensão ↗ e queda ↘ combinadas | ↗ 20.7 ms ascensão | 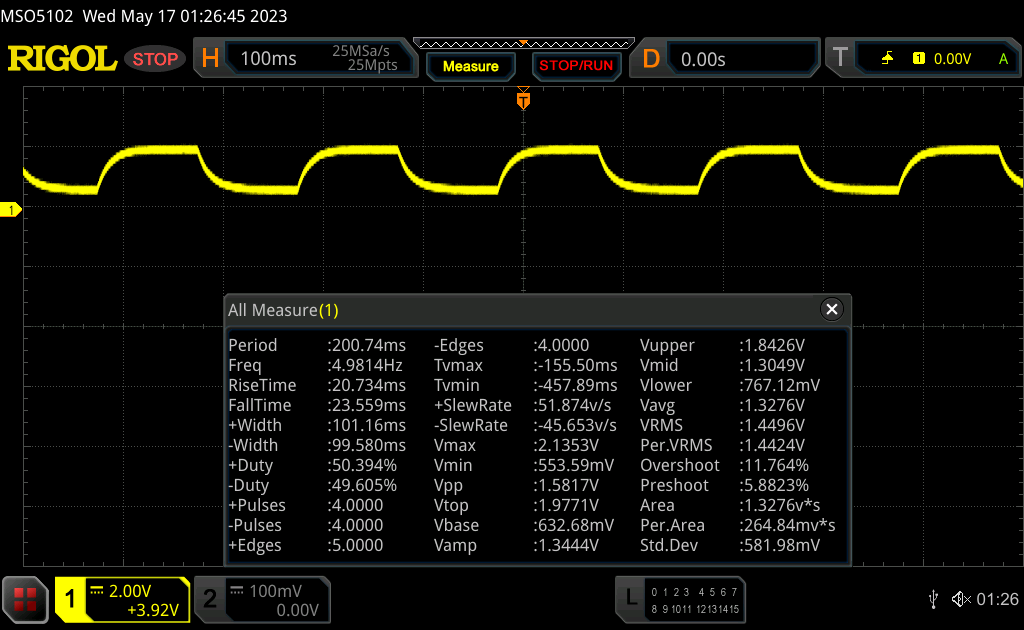 |
| ↘ 23.5 ms queda | ||
| A tela mostra taxas de resposta lentas em nossos testes e será insatisfatória para os jogadores. Em comparação, todos os dispositivos testados variam de 0.165 (mínimo) a 636 (máximo) ms. » 76 % de todos os dispositivos são melhores. Isso significa que o tempo de resposta medido é pior que a média de todos os dispositivos testados (31 ms). | ||
Cintilação da tela / PWM (modulação por largura de pulso)
| Tela tremeluzindo / PWM não detectado | 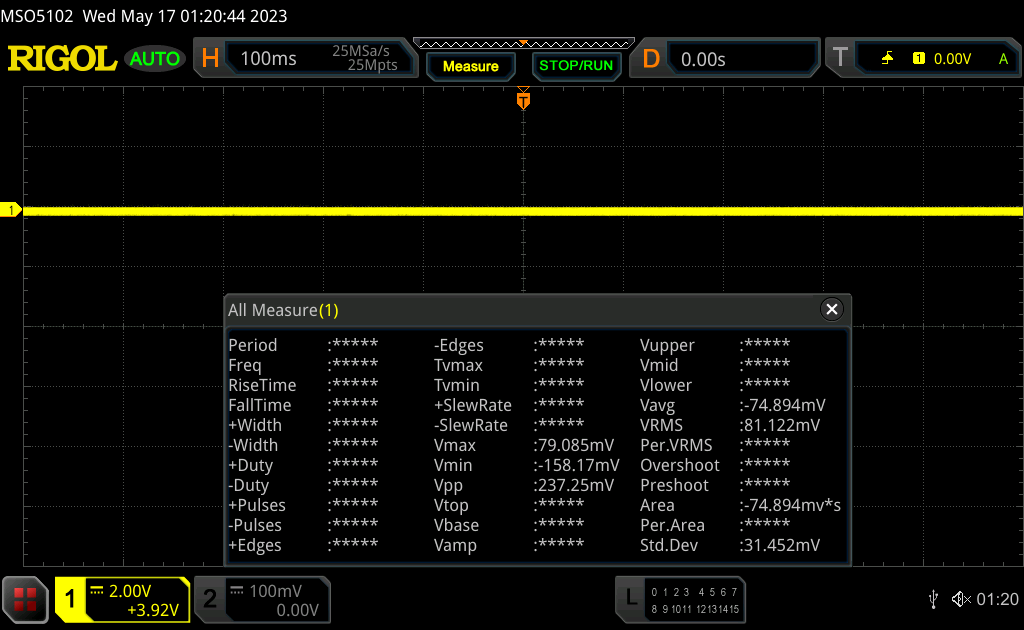 | ||
[pwm_comparison] Em comparação: 52 % de todos os dispositivos testados não usam PWM para escurecer a tela. Se PWM foi detectado, uma média de 7754 (mínimo: 5 - máximo: 343500) Hz foi medida. | |||


Desempenho: O AMD Ryzen 5 oferece bom desempenho
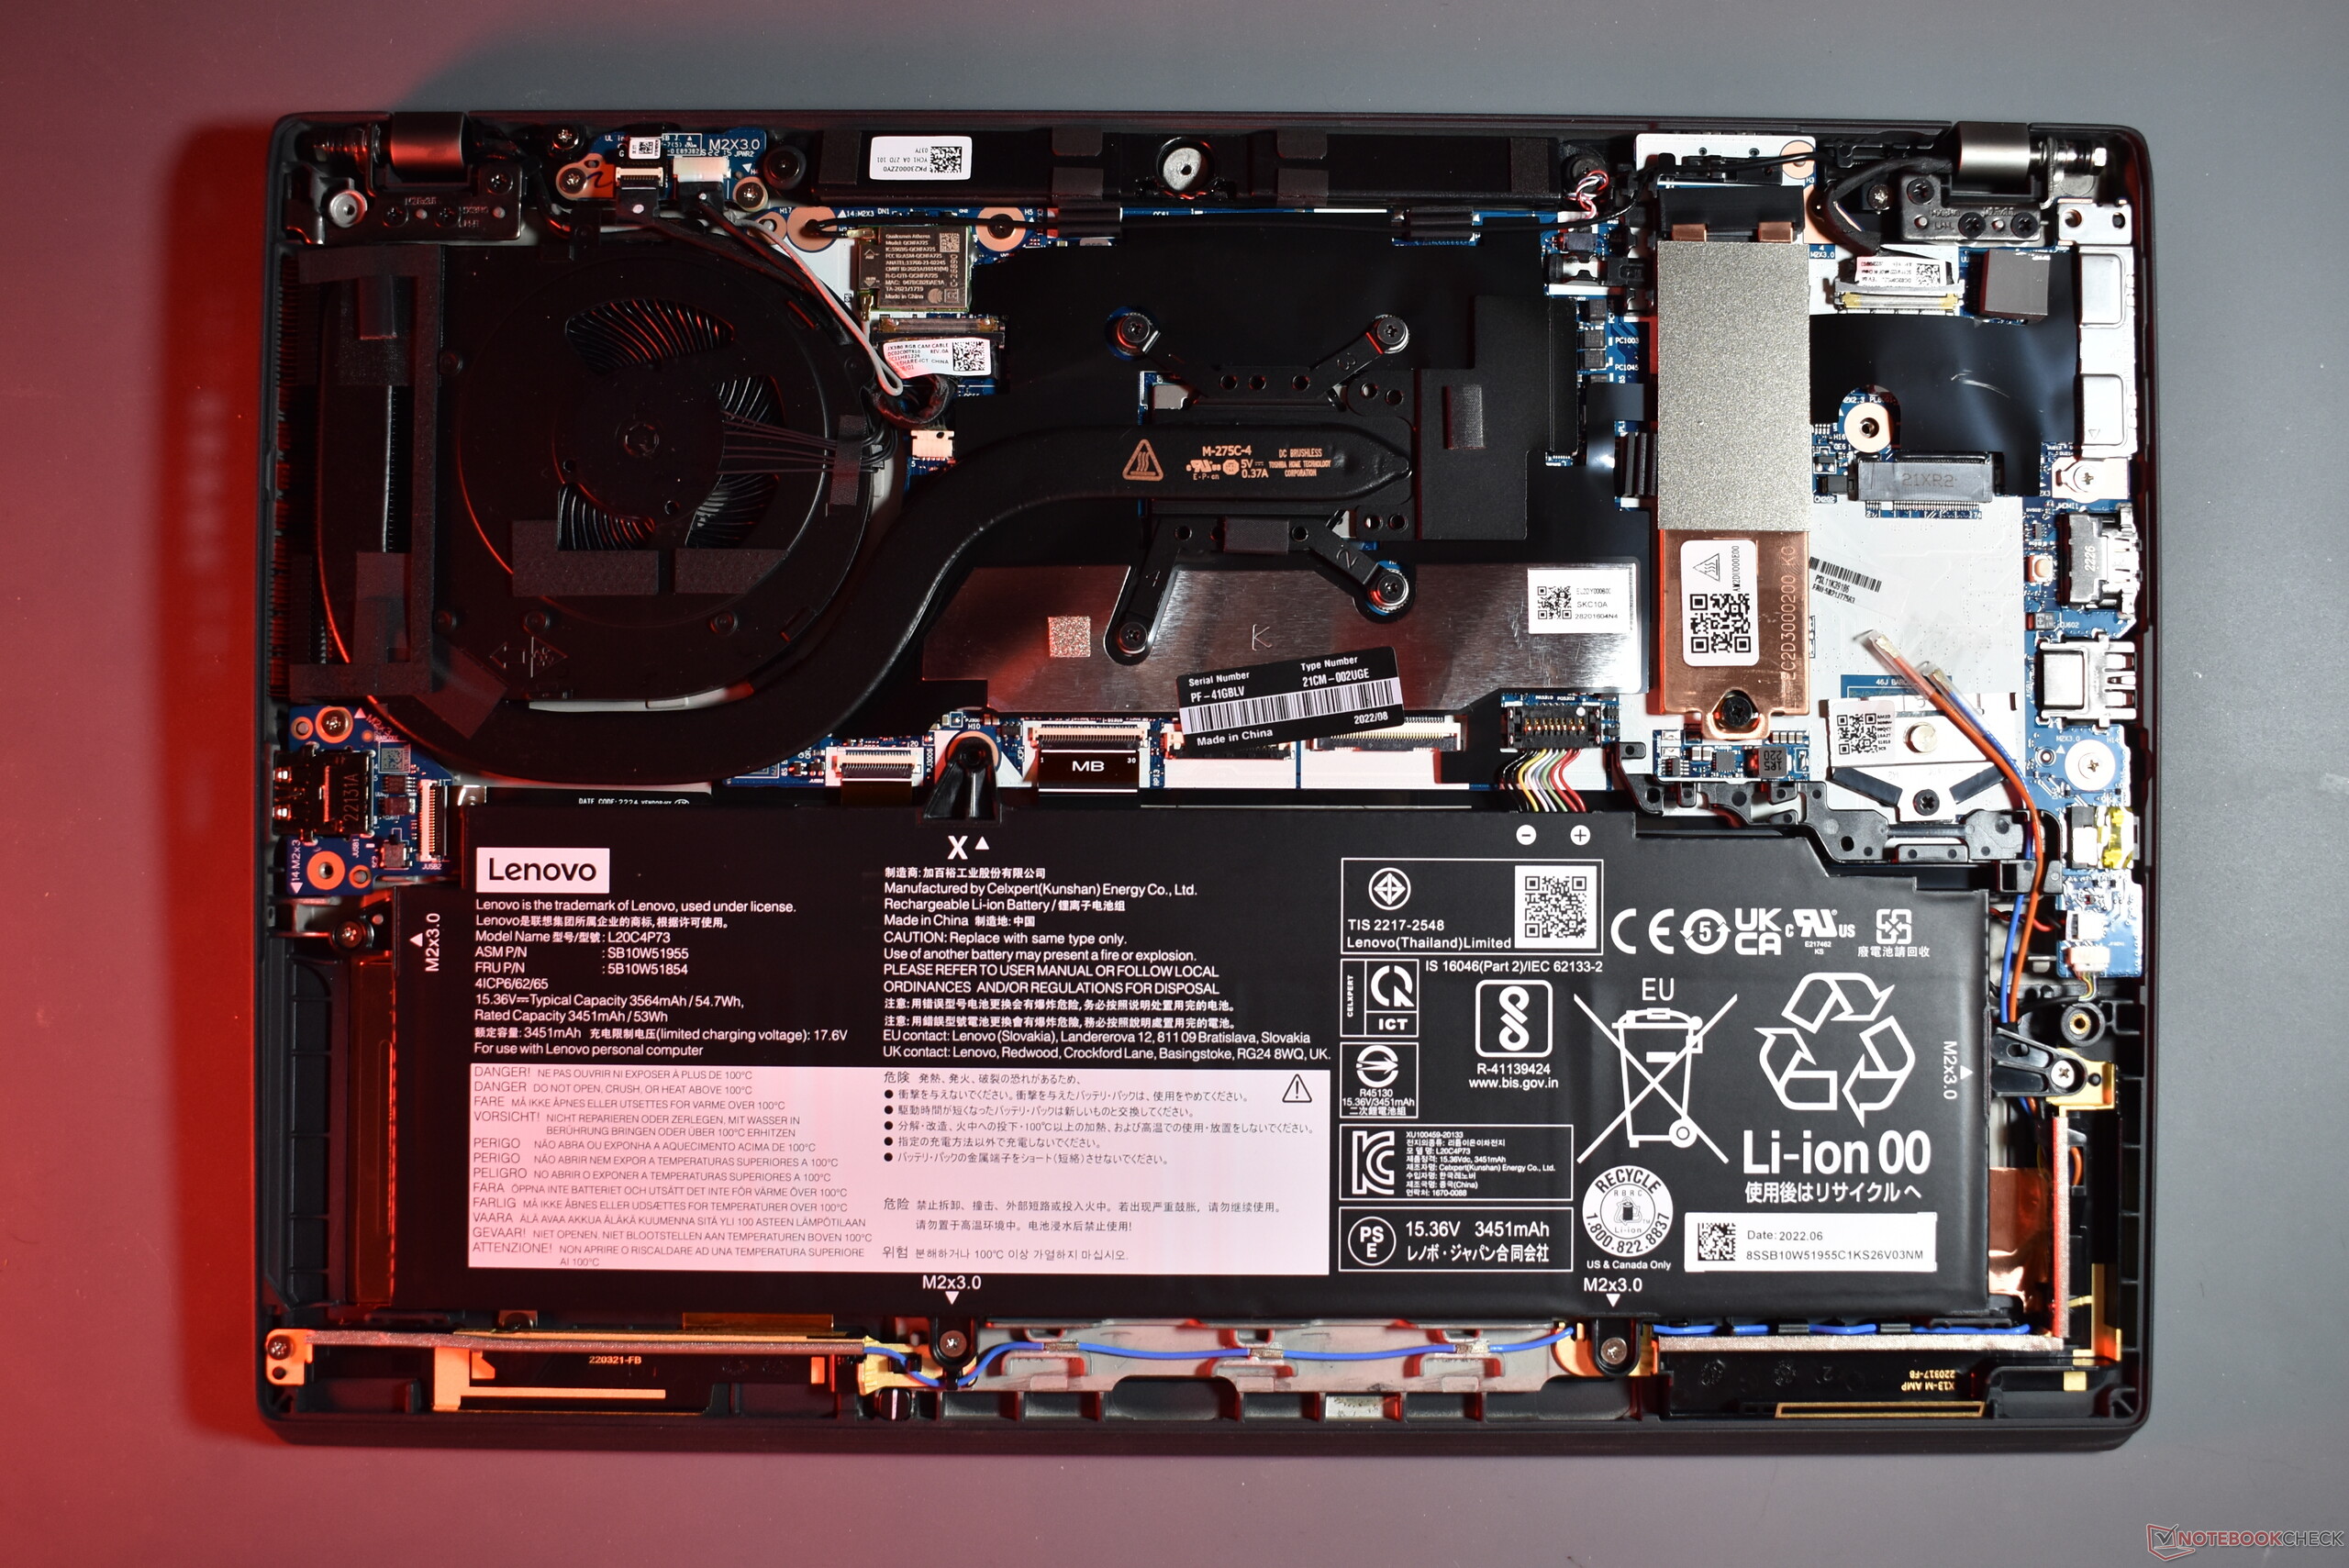
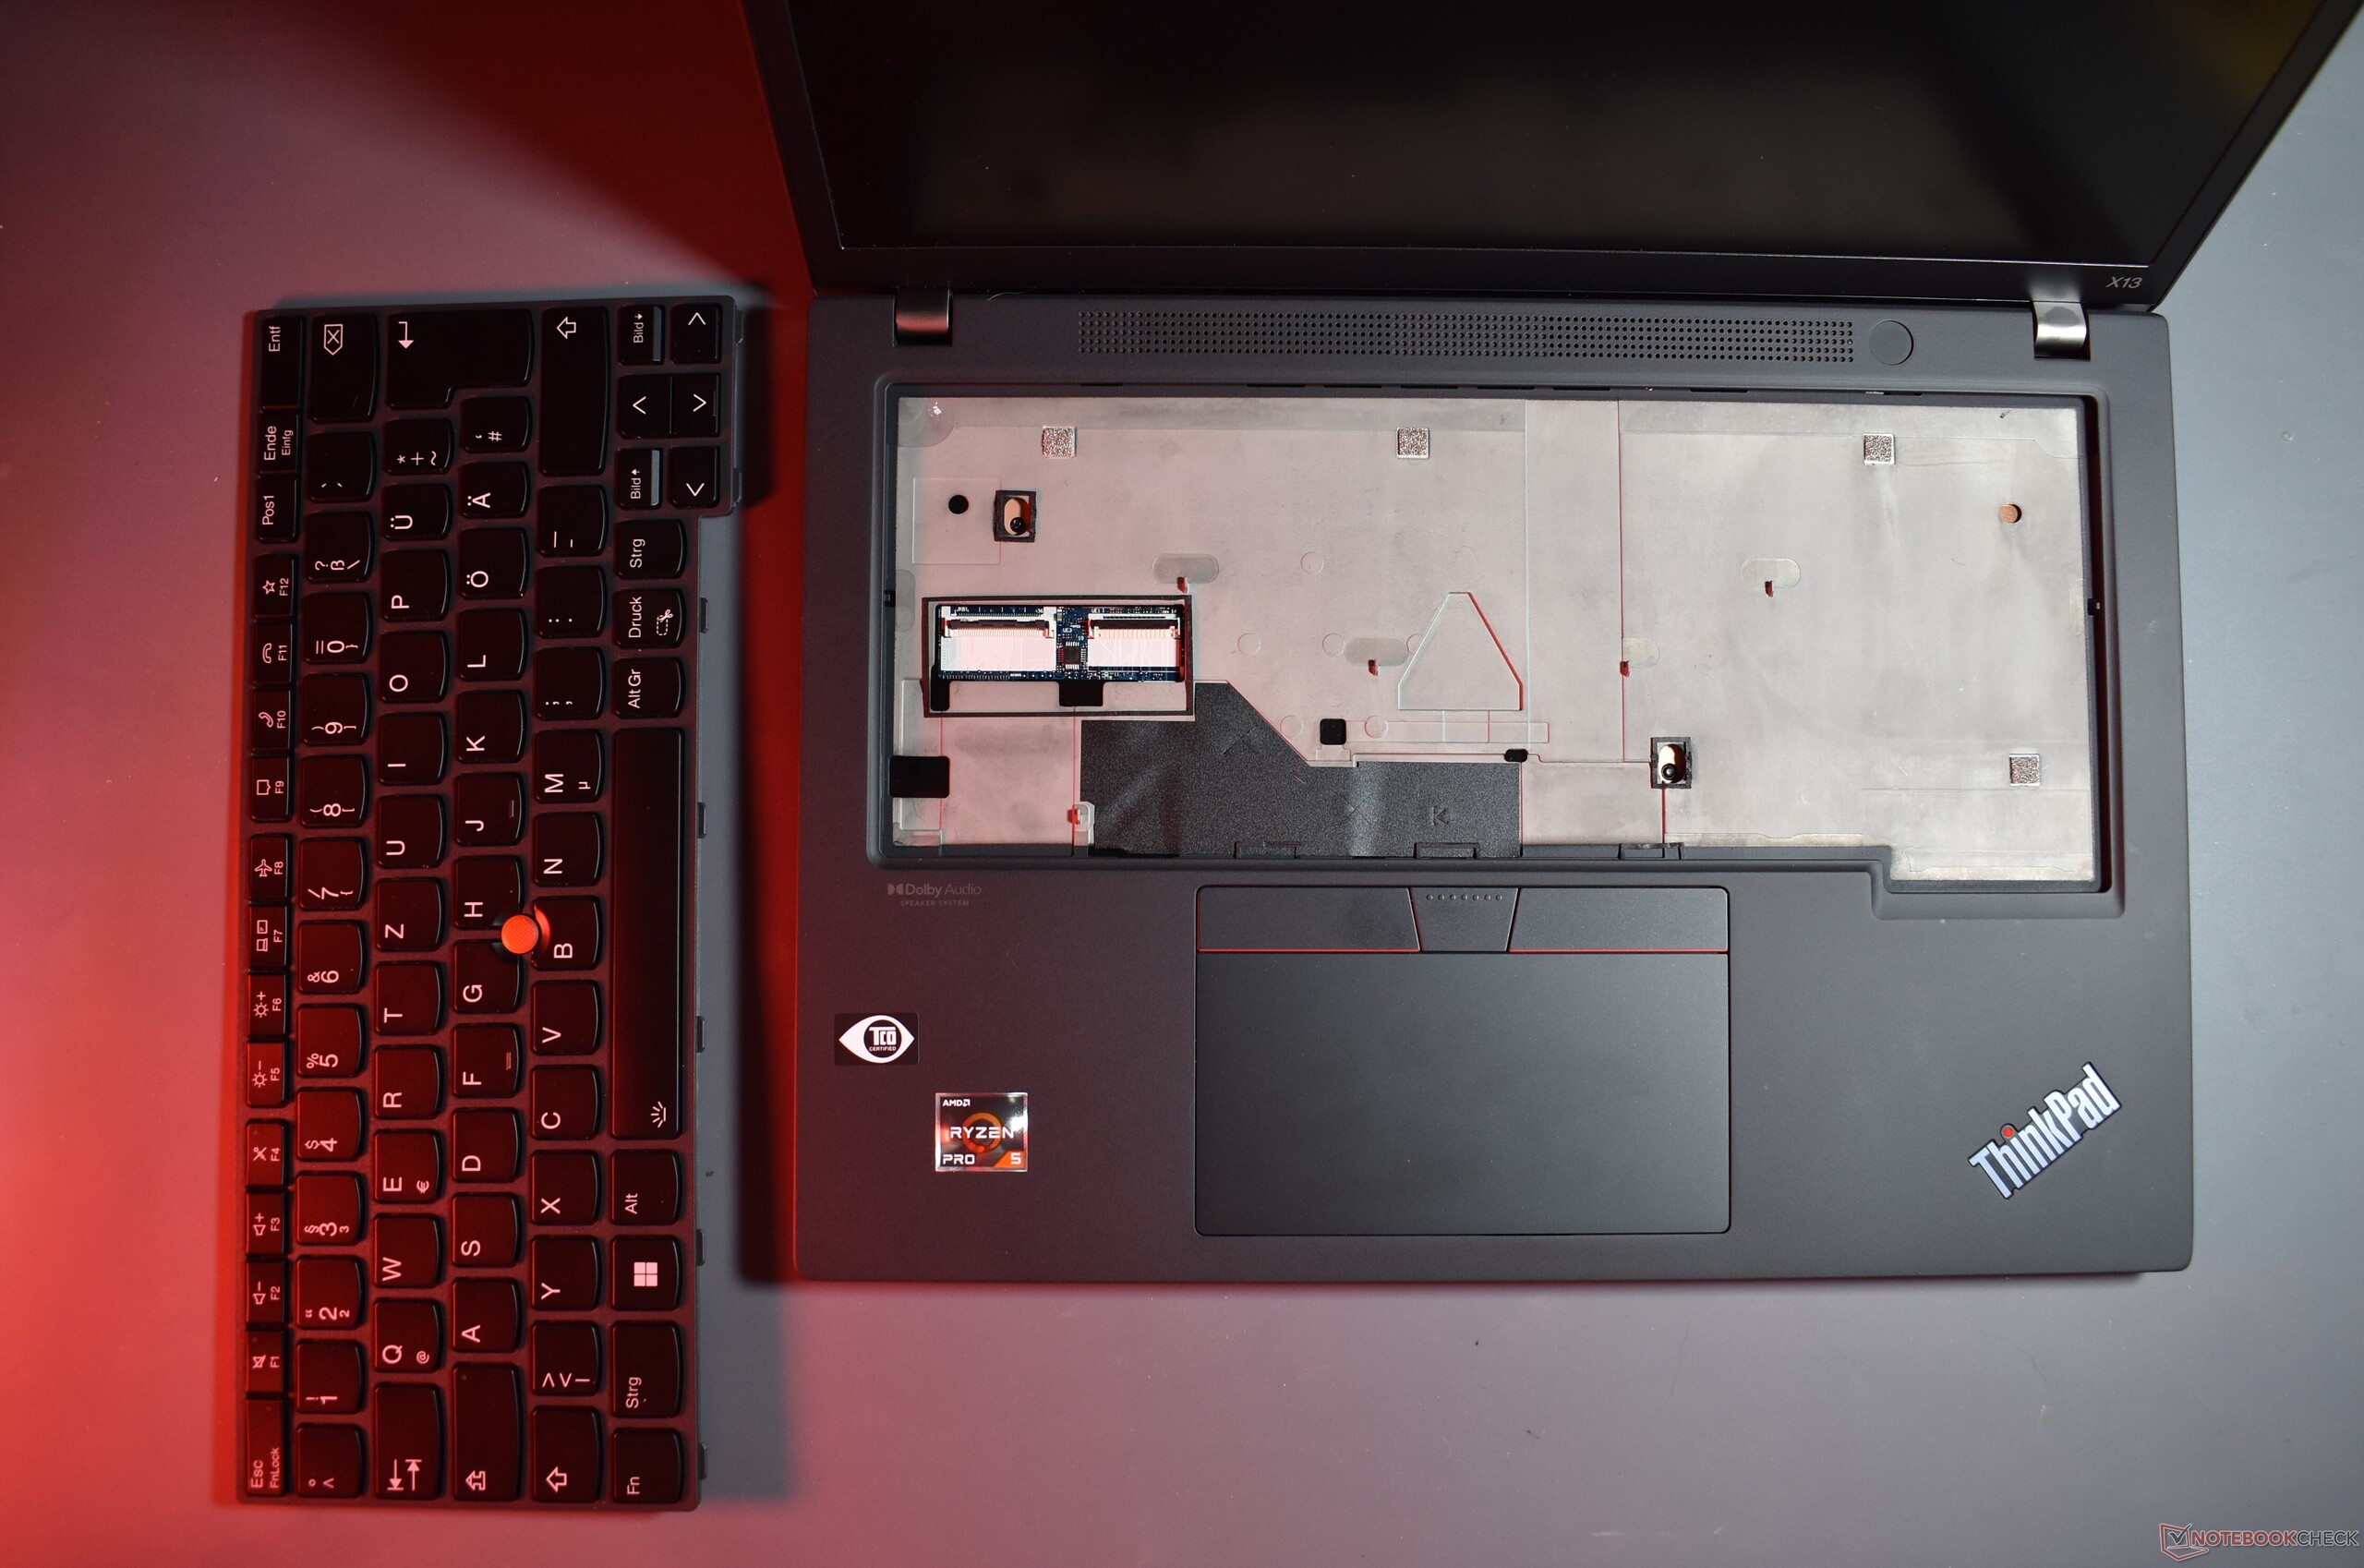
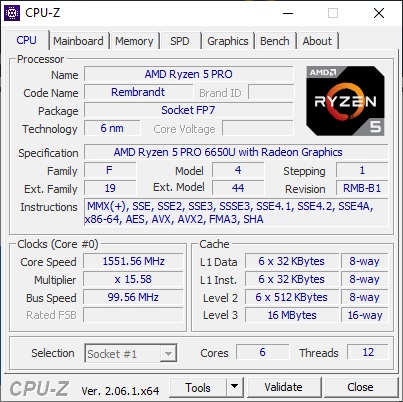
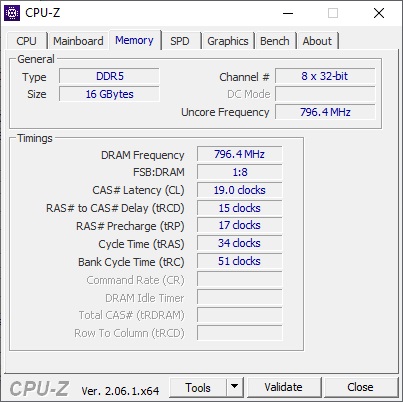
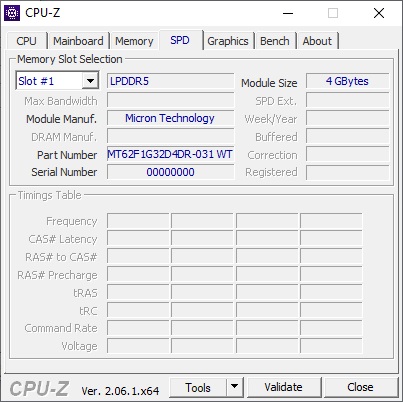
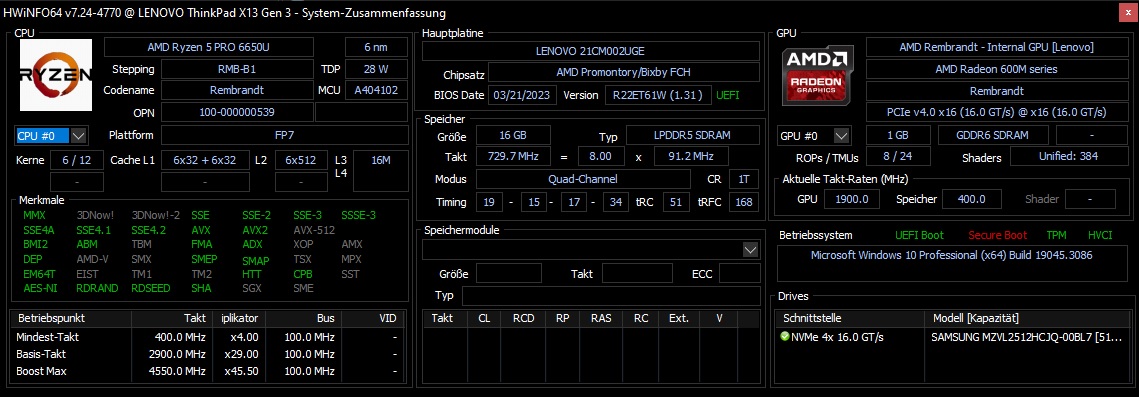
A Lenovo vende o ThinkPad X13 Gen 3 AMD com duas CPUs AMD diferentes, sendo que as opções disponíveis são AMD Ryzen 5 Pro 6650Ue o Ryzen 7 Pro 6850U. Dependendo da CPU escolhida, a Radeon 660Mou a Radeon 680Mservem como solução de GPU. A RAM está sempre soldada, há variantes com 8, 16 ou 32 GB de memória LPDDR5-6400. O SSD M.2 2280 não é soldado, a Lenovo oferece um máximo de 2 TB de armazenamento SSD.
Condições de teste
Como de costume para os ThinkPads da Lenovo, não há software OEM proprietário para gerenciar os perfis de energia. Em vez disso, os perfis de energia do Windows são utilizados para gerenciar os limites de energia (PL1 = desempenho sob carga sustentada, PL2 = desempenho de aumento de curto prazo).
- Mais eficiência da bateria: PL1 12 W / PL2 12 W
- Melhor desempenho: PL1 17 W / PL2 25 W
- Melhor desempenho: PL1 22,5 W / PL2 30 W
Processador
OAMD Ryzen 5 Pro 6650U é um processador U da geração Rembrandt, destinado a laptops comerciais compactos. Como uma CPU "Pro", esse chip concorre diretamente com os processadores vPro da Intel. O TDP típico é avaliado em 15 W, a CPU tem seis núcleos e doze threads. É possível fazer comparações abrangentes de benchmark com outras CPUs com a nossa Ferramenta de comparação de CPU.
O desempenho do ThinkPad X13 Gen 3 AMD é ligeiramente melhor do que o do antecessor. Os modelos baseados em Intel ThinkPad X13 G3 Intel eDell Latitude 7330oferecem um melhor desempenho de núcleo único e, em parte, um melhor desempenho de aumento, mas não são bons quando se trata de testes contínuos de vários núcleos. Enquanto isso, o HP EliteBook 835 G9 oferece um grande salto de potência, mas esse modelo é equipado com o chip octacore AMD Ryzen 7 Pro 6850U, que também está disponível para o AMD X13 Gen 3.
O desempenho da CPU não é limitado no modo de bateria.
Cinebench R15 Multi sustained load
Cinebench R23: Multi Core | Single Core
Cinebench R20: CPU (Multi Core) | CPU (Single Core)
Cinebench R15: CPU Multi 64Bit | CPU Single 64Bit
Blender: v2.79 BMW27 CPU
7-Zip 18.03: 7z b 4 | 7z b 4 -mmt1
Geekbench 5.5: Multi-Core | Single-Core
HWBOT x265 Benchmark v2.2: 4k Preset
LibreOffice : 20 Documents To PDF
R Benchmark 2.5: Overall mean
| CPU Performance rating | |
| Média da turma Subnotebook | |
| HP EliteBook 835 G9 | |
| Dell Latitude 13 7330 | |
| Média AMD Ryzen 5 PRO 6650U | |
| Lenovo ThinkPad X13 G3 21BN0046GE | |
| Lenovo ThinkPad X13 G3 21CM002UGE | |
| Lenovo ThinkPad X13 G2 AMD 20XH001KGE | |
| Cinebench R23 / Multi Core | |
| Média da turma Subnotebook (1555 - 21812, n=59, últimos 2 anos) | |
| HP EliteBook 835 G9 | |
| Média AMD Ryzen 5 PRO 6650U (7805 - 9534, n=4) | |
| Dell Latitude 13 7330 | |
| Lenovo ThinkPad X13 G3 21CM002UGE | |
| Lenovo ThinkPad X13 G2 AMD 20XH001KGE | |
| Lenovo ThinkPad X13 G3 21BN0046GE | |
| Cinebench R23 / Single Core | |
| Média da turma Subnotebook (358 - 2213, n=60, últimos 2 anos) | |
| Dell Latitude 13 7330 | |
| Lenovo ThinkPad X13 G3 21BN0046GE | |
| HP EliteBook 835 G9 | |
| Média AMD Ryzen 5 PRO 6650U (1439 - 1476, n=4) | |
| Lenovo ThinkPad X13 G3 21CM002UGE | |
| Lenovo ThinkPad X13 G2 AMD 20XH001KGE | |
| Cinebench R20 / CPU (Multi Core) | |
| Média da turma Subnotebook (579 - 8541, n=56, últimos 2 anos) | |
| HP EliteBook 835 G9 | |
| Lenovo ThinkPad X13 G3 21BN0046GE | |
| Média AMD Ryzen 5 PRO 6650U (3057 - 3684, n=4) | |
| Dell Latitude 13 7330 | |
| Lenovo ThinkPad X13 G3 21CM002UGE | |
| Lenovo ThinkPad X13 G2 AMD 20XH001KGE | |
| Cinebench R20 / CPU (Single Core) | |
| Média da turma Subnotebook (128 - 832, n=56, últimos 2 anos) | |
| Dell Latitude 13 7330 | |
| Lenovo ThinkPad X13 G3 21BN0046GE | |
| HP EliteBook 835 G9 | |
| Média AMD Ryzen 5 PRO 6650U (548 - 578, n=4) | |
| Lenovo ThinkPad X13 G3 21CM002UGE | |
| Lenovo ThinkPad X13 G2 AMD 20XH001KGE | |
| Cinebench R15 / CPU Multi 64Bit | |
| Média da turma Subnotebook (327 - 3345, n=56, últimos 2 anos) | |
| HP EliteBook 835 G9 | |
| Média AMD Ryzen 5 PRO 6650U (1299 - 1555, n=4) | |
| Dell Latitude 13 7330 | |
| Lenovo ThinkPad X13 G3 21CM002UGE | |
| Lenovo ThinkPad X13 G2 AMD 20XH001KGE | |
| Lenovo ThinkPad X13 G3 21BN0046GE | |
| Cinebench R15 / CPU Single 64Bit | |
| Média da turma Subnotebook (72.4 - 322, n=56, últimos 2 anos) | |
| Dell Latitude 13 7330 | |
| Média AMD Ryzen 5 PRO 6650U (230 - 234, n=4) | |
| Lenovo ThinkPad X13 G3 21CM002UGE | |
| HP EliteBook 835 G9 | |
| Lenovo ThinkPad X13 G2 AMD 20XH001KGE | |
| Lenovo ThinkPad X13 G3 21BN0046GE | |
| Blender / v2.79 BMW27 CPU | |
| Lenovo ThinkPad X13 G3 21CM002UGE | |
| Lenovo ThinkPad X13 G3 21CM002UGE | |
| Lenovo ThinkPad X13 G3 21BN0046GE | |
| Lenovo ThinkPad X13 G2 AMD 20XH001KGE | |
| Média AMD Ryzen 5 PRO 6650U (328 - 548, n=5) | |
| Dell Latitude 13 7330 | |
| Média da turma Subnotebook (159 - 2271, n=57, últimos 2 anos) | |
| HP EliteBook 835 G9 | |
| 7-Zip 18.03 / 7z b 4 | |
| HP EliteBook 835 G9 | |
| Média da turma Subnotebook (11668 - 77867, n=56, últimos 2 anos) | |
| Lenovo ThinkPad X13 G3 21BN0046GE | |
| Lenovo ThinkPad X13 G3 21CM002UGE | |
| Média AMD Ryzen 5 PRO 6650U (32613 - 41530, n=4) | |
| Lenovo ThinkPad X13 G2 AMD 20XH001KGE | |
| Dell Latitude 13 7330 | |
| 7-Zip 18.03 / 7z b 4 -mmt1 | |
| Dell Latitude 13 7330 | |
| Média da turma Subnotebook (2643 - 6699, n=58, últimos 2 anos) | |
| HP EliteBook 835 G9 | |
| Média AMD Ryzen 5 PRO 6650U (5175 - 5427, n=4) | |
| Lenovo ThinkPad X13 G3 21BN0046GE | |
| Lenovo ThinkPad X13 G3 21CM002UGE | |
| Lenovo ThinkPad X13 G2 AMD 20XH001KGE | |
| Geekbench 5.5 / Multi-Core | |
| Média da turma Subnotebook (2557 - 17218, n=48, últimos 2 anos) | |
| Lenovo ThinkPad X13 G3 21BN0046GE | |
| HP EliteBook 835 G9 | |
| Dell Latitude 13 7330 | |
| Média AMD Ryzen 5 PRO 6650U (6171 - 7227, n=4) | |
| Lenovo ThinkPad X13 G3 21CM002UGE | |
| Lenovo ThinkPad X13 G2 AMD 20XH001KGE | |
| Geekbench 5.5 / Single-Core | |
| Média da turma Subnotebook (726 - 2224, n=48, últimos 2 anos) | |
| Dell Latitude 13 7330 | |
| HP EliteBook 835 G9 | |
| Lenovo ThinkPad X13 G3 21BN0046GE | |
| Média AMD Ryzen 5 PRO 6650U (1433 - 1487, n=4) | |
| Lenovo ThinkPad X13 G3 21CM002UGE | |
| Lenovo ThinkPad X13 G2 AMD 20XH001KGE | |
| HWBOT x265 Benchmark v2.2 / 4k Preset | |
| Média da turma Subnotebook (0.97 - 25.1, n=56, últimos 2 anos) | |
| HP EliteBook 835 G9 | |
| Média AMD Ryzen 5 PRO 6650U (8.71 - 11.8, n=4) | |
| Lenovo ThinkPad X13 G3 21CM002UGE | |
| Dell Latitude 13 7330 | |
| Lenovo ThinkPad X13 G2 AMD 20XH001KGE | |
| Lenovo ThinkPad X13 G3 21BN0046GE | |
| LibreOffice / 20 Documents To PDF | |
| Lenovo ThinkPad X13 G3 21CM002UGE | |
| Média AMD Ryzen 5 PRO 6650U (50.3 - 63.2, n=4) | |
| HP EliteBook 835 G9 | |
| Média da turma Subnotebook (39.9 - 220, n=55, últimos 2 anos) | |
| Lenovo ThinkPad X13 G2 AMD 20XH001KGE | |
| Dell Latitude 13 7330 | |
| Lenovo ThinkPad X13 G3 21BN0046GE | |
| R Benchmark 2.5 / Overall mean | |
| Lenovo ThinkPad X13 G3 21CM002UGE | |
| Lenovo ThinkPad X13 G2 AMD 20XH001KGE | |
| Média AMD Ryzen 5 PRO 6650U (0.521 - 0.59, n=4) | |
| Média da turma Subnotebook (0.4024 - 1.456, n=57, últimos 2 anos) | |
| Lenovo ThinkPad X13 G3 21BN0046GE | |
| HP EliteBook 835 G9 | |
| Dell Latitude 13 7330 | |
* ... menor é melhor
AIDA64: FP32 Ray-Trace | FPU Julia | CPU SHA3 | CPU Queen | FPU SinJulia | FPU Mandel | CPU AES | CPU ZLib | FP64 Ray-Trace | CPU PhotoWorxx
| Performance rating | |
| Média da turma Subnotebook | |
| HP EliteBook 835 G9 | |
| Média AMD Ryzen 5 PRO 6650U | |
| Lenovo ThinkPad X13 G2 AMD 20XH001KGE | |
| Lenovo ThinkPad X13 G3 21CM002UGE | |
| Lenovo ThinkPad X13 G3 21BN0046GE | |
| Dell Latitude 13 7330 | |
| AIDA64 / FP32 Ray-Trace | |
| Média da turma Subnotebook (1135 - 32888, n=57, últimos 2 anos) | |
| HP EliteBook 835 G9 | |
| Média AMD Ryzen 5 PRO 6650U (8854 - 10630, n=4) | |
| Lenovo ThinkPad X13 G3 21CM002UGE | |
| Lenovo ThinkPad X13 G2 AMD 20XH001KGE | |
| Lenovo ThinkPad X13 G3 21BN0046GE | |
| Dell Latitude 13 7330 | |
| AIDA64 / FPU Julia | |
| HP EliteBook 835 G9 | |
| Média da turma Subnotebook (5218 - 123315, n=57, últimos 2 anos) | |
| Média AMD Ryzen 5 PRO 6650U (56214 - 68106, n=4) | |
| Lenovo ThinkPad X13 G3 21CM002UGE | |
| Lenovo ThinkPad X13 G2 AMD 20XH001KGE | |
| Lenovo ThinkPad X13 G3 21BN0046GE | |
| Dell Latitude 13 7330 | |
| AIDA64 / CPU SHA3 | |
| Média da turma Subnotebook (444 - 5287, n=57, últimos 2 anos) | |
| HP EliteBook 835 G9 | |
| Média AMD Ryzen 5 PRO 6650U (1881 - 2326, n=4) | |
| Lenovo ThinkPad X13 G3 21BN0046GE | |
| Dell Latitude 13 7330 | |
| Lenovo ThinkPad X13 G3 21CM002UGE | |
| Lenovo ThinkPad X13 G2 AMD 20XH001KGE | |
| AIDA64 / CPU Queen | |
| HP EliteBook 835 G9 | |
| Média AMD Ryzen 5 PRO 6650U (69023 - 78797, n=4) | |
| Lenovo ThinkPad X13 G3 21CM002UGE | |
| Lenovo ThinkPad X13 G2 AMD 20XH001KGE | |
| Dell Latitude 13 7330 | |
| Lenovo ThinkPad X13 G3 21BN0046GE | |
| Média da turma Subnotebook (10579 - 95002, n=48, últimos 2 anos) | |
| AIDA64 / FPU SinJulia | |
| HP EliteBook 835 G9 | |
| Média AMD Ryzen 5 PRO 6650U (8320 - 9488, n=4) | |
| Lenovo ThinkPad X13 G3 21CM002UGE | |
| Lenovo ThinkPad X13 G2 AMD 20XH001KGE | |
| Média da turma Subnotebook (744 - 18418, n=57, últimos 2 anos) | |
| Lenovo ThinkPad X13 G3 21BN0046GE | |
| Dell Latitude 13 7330 | |
| AIDA64 / FPU Mandel | |
| HP EliteBook 835 G9 | |
| Média AMD Ryzen 5 PRO 6650U (30969 - 37461, n=4) | |
| Média da turma Subnotebook (3341 - 65433, n=57, últimos 2 anos) | |
| Lenovo ThinkPad X13 G3 21CM002UGE | |
| Lenovo ThinkPad X13 G2 AMD 20XH001KGE | |
| Lenovo ThinkPad X13 G3 21BN0046GE | |
| Dell Latitude 13 7330 | |
| AIDA64 / CPU AES | |
| Lenovo ThinkPad X13 G2 AMD 20XH001KGE | |
| Média AMD Ryzen 5 PRO 6650U (37259 - 93914, n=4) | |
| Média da turma Subnotebook (638 - 96917, n=57, últimos 2 anos) | |
| HP EliteBook 835 G9 | |
| Lenovo ThinkPad X13 G3 21BN0046GE | |
| Dell Latitude 13 7330 | |
| Lenovo ThinkPad X13 G3 21CM002UGE | |
| AIDA64 / CPU ZLib | |
| Média da turma Subnotebook (164.9 - 1379, n=57, últimos 2 anos) | |
| HP EliteBook 835 G9 | |
| Lenovo ThinkPad X13 G3 21BN0046GE | |
| Dell Latitude 13 7330 | |
| Média AMD Ryzen 5 PRO 6650U (504 - 602, n=4) | |
| Lenovo ThinkPad X13 G3 21CM002UGE | |
| Lenovo ThinkPad X13 G2 AMD 20XH001KGE | |
| AIDA64 / FP64 Ray-Trace | |
| Média da turma Subnotebook (610 - 17495, n=57, últimos 2 anos) | |
| HP EliteBook 835 G9 | |
| Média AMD Ryzen 5 PRO 6650U (4620 - 5468, n=4) | |
| Lenovo ThinkPad X13 G3 21CM002UGE | |
| Lenovo ThinkPad X13 G2 AMD 20XH001KGE | |
| Lenovo ThinkPad X13 G3 21BN0046GE | |
| Dell Latitude 13 7330 | |
| AIDA64 / CPU PhotoWorxx | |
| Média da turma Subnotebook (6569 - 85600, n=57, últimos 2 anos) | |
| Lenovo ThinkPad X13 G3 21BN0046GE | |
| HP EliteBook 835 G9 | |
| Lenovo ThinkPad X13 G3 21CM002UGE | |
| Média AMD Ryzen 5 PRO 6650U (19643 - 26137, n=4) | |
| Dell Latitude 13 7330 | |
| Lenovo ThinkPad X13 G2 AMD 20XH001KGE | |
Desempenho do sistema
Quando se trata do desempenho do sistema, o modelo AMD é melhor do que a variante Intel. No uso diário, o desempenho é perfeitamente bom.
CrossMark: Overall | Productivity | Creativity | Responsiveness
| PCMark 10 / Score | |
| Média da turma Subnotebook (4920 - 9939, n=45, últimos 2 anos) | |
| HP EliteBook 835 G9 | |
| Lenovo ThinkPad X13 G2 AMD 20XH001KGE | |
| Média AMD Ryzen 5 PRO 6650U, AMD Radeon 660M (5513 - 5958, n=4) | |
| Lenovo ThinkPad X13 G3 21CM002UGE | |
| Dell Latitude 13 7330 | |
| Lenovo ThinkPad X13 G3 21BN0046GE | |
| PCMark 10 / Essentials | |
| Dell Latitude 13 7330 | |
| Média da turma Subnotebook (8552 - 11646, n=45, últimos 2 anos) | |
| Lenovo ThinkPad X13 G2 AMD 20XH001KGE | |
| HP EliteBook 835 G9 | |
| Lenovo ThinkPad X13 G3 21CM002UGE | |
| Média AMD Ryzen 5 PRO 6650U, AMD Radeon 660M (9578 - 9982, n=4) | |
| Lenovo ThinkPad X13 G3 21BN0046GE | |
| PCMark 10 / Productivity | |
| Média da turma Subnotebook (5435 - 16606, n=45, últimos 2 anos) | |
| Lenovo ThinkPad X13 G2 AMD 20XH001KGE | |
| HP EliteBook 835 G9 | |
| Média AMD Ryzen 5 PRO 6650U, AMD Radeon 660M (7848 - 9094, n=4) | |
| Lenovo ThinkPad X13 G3 21CM002UGE | |
| Dell Latitude 13 7330 | |
| Lenovo ThinkPad X13 G3 21BN0046GE | |
| PCMark 10 / Digital Content Creation | |
| Média da turma Subnotebook (5722 - 13779, n=45, últimos 2 anos) | |
| HP EliteBook 835 G9 | |
| Média AMD Ryzen 5 PRO 6650U, AMD Radeon 660M (5837 - 6447, n=4) | |
| Lenovo ThinkPad X13 G3 21CM002UGE | |
| Lenovo ThinkPad X13 G2 AMD 20XH001KGE | |
| Dell Latitude 13 7330 | |
| Lenovo ThinkPad X13 G3 21BN0046GE | |
| CrossMark / Overall | |
| Média da turma Subnotebook (365 - 2356, n=59, últimos 2 anos) | |
| Dell Latitude 13 7330 | |
| HP EliteBook 835 G9 | |
| Média AMD Ryzen 5 PRO 6650U, AMD Radeon 660M (1338 - 1432, n=3) | |
| Lenovo ThinkPad X13 G3 21BN0046GE | |
| Lenovo ThinkPad X13 G3 21CM002UGE | |
| CrossMark / Productivity | |
| Média da turma Subnotebook (364 - 2277, n=59, últimos 2 anos) | |
| Dell Latitude 13 7330 | |
| HP EliteBook 835 G9 | |
| Média AMD Ryzen 5 PRO 6650U, AMD Radeon 660M (1366 - 1440, n=3) | |
| Lenovo ThinkPad X13 G3 21CM002UGE | |
| Lenovo ThinkPad X13 G3 21BN0046GE | |
| CrossMark / Creativity | |
| Média da turma Subnotebook (372 - 2743, n=59, últimos 2 anos) | |
| Dell Latitude 13 7330 | |
| Lenovo ThinkPad X13 G3 21BN0046GE | |
| Média AMD Ryzen 5 PRO 6650U, AMD Radeon 660M (1397 - 1517, n=3) | |
| HP EliteBook 835 G9 | |
| Lenovo ThinkPad X13 G3 21CM002UGE | |
| CrossMark / Responsiveness | |
| Média da turma Subnotebook (312 - 1854, n=59, últimos 2 anos) | |
| Lenovo ThinkPad X13 G3 21BN0046GE | |
| Dell Latitude 13 7330 | |
| HP EliteBook 835 G9 | |
| Média AMD Ryzen 5 PRO 6650U, AMD Radeon 660M (1106 - 1229, n=3) | |
| Lenovo ThinkPad X13 G3 21CM002UGE | |
| PCMark 10 Score | 5685 pontos | |
Ajuda | ||
| AIDA64 / Memory Copy | |
| Média da turma Subnotebook (14554 - 131023, n=57, últimos 2 anos) | |
| Lenovo ThinkPad X13 G3 21BN0046GE | |
| Lenovo ThinkPad X13 G3 21CM002UGE | |
| HP EliteBook 835 G9 | |
| Média AMD Ryzen 5 PRO 6650U (31014 - 48558, n=4) | |
| Dell Latitude 13 7330 | |
| Lenovo ThinkPad X13 G2 AMD 20XH001KGE | |
| AIDA64 / Memory Read | |
| Média da turma Subnotebook (15948 - 127174, n=57, últimos 2 anos) | |
| Lenovo ThinkPad X13 G3 21BN0046GE | |
| HP EliteBook 835 G9 | |
| Dell Latitude 13 7330 | |
| Lenovo ThinkPad X13 G3 21CM002UGE | |
| Média AMD Ryzen 5 PRO 6650U (34690 - 39833, n=4) | |
| Lenovo ThinkPad X13 G2 AMD 20XH001KGE | |
| AIDA64 / Memory Write | |
| Média da turma Subnotebook (15709 - 135141, n=57, últimos 2 anos) | |
| Lenovo ThinkPad X13 G3 21BN0046GE | |
| Lenovo ThinkPad X13 G3 21CM002UGE | |
| HP EliteBook 835 G9 | |
| Média AMD Ryzen 5 PRO 6650U (34563 - 51117, n=4) | |
| Dell Latitude 13 7330 | |
| Lenovo ThinkPad X13 G2 AMD 20XH001KGE | |
| AIDA64 / Memory Latency | |
| Lenovo ThinkPad X13 G3 21CM002UGE | |
| Média AMD Ryzen 5 PRO 6650U (91.6 - 126.5, n=4) | |
| Lenovo ThinkPad X13 G2 AMD 20XH001KGE | |
| Média da turma Subnotebook (6.1 - 159.9, n=55, últimos 2 anos) | |
| HP EliteBook 835 G9 | |
| Lenovo ThinkPad X13 G3 21BN0046GE | |
| Dell Latitude 13 7330 | |
* ... menor é melhor
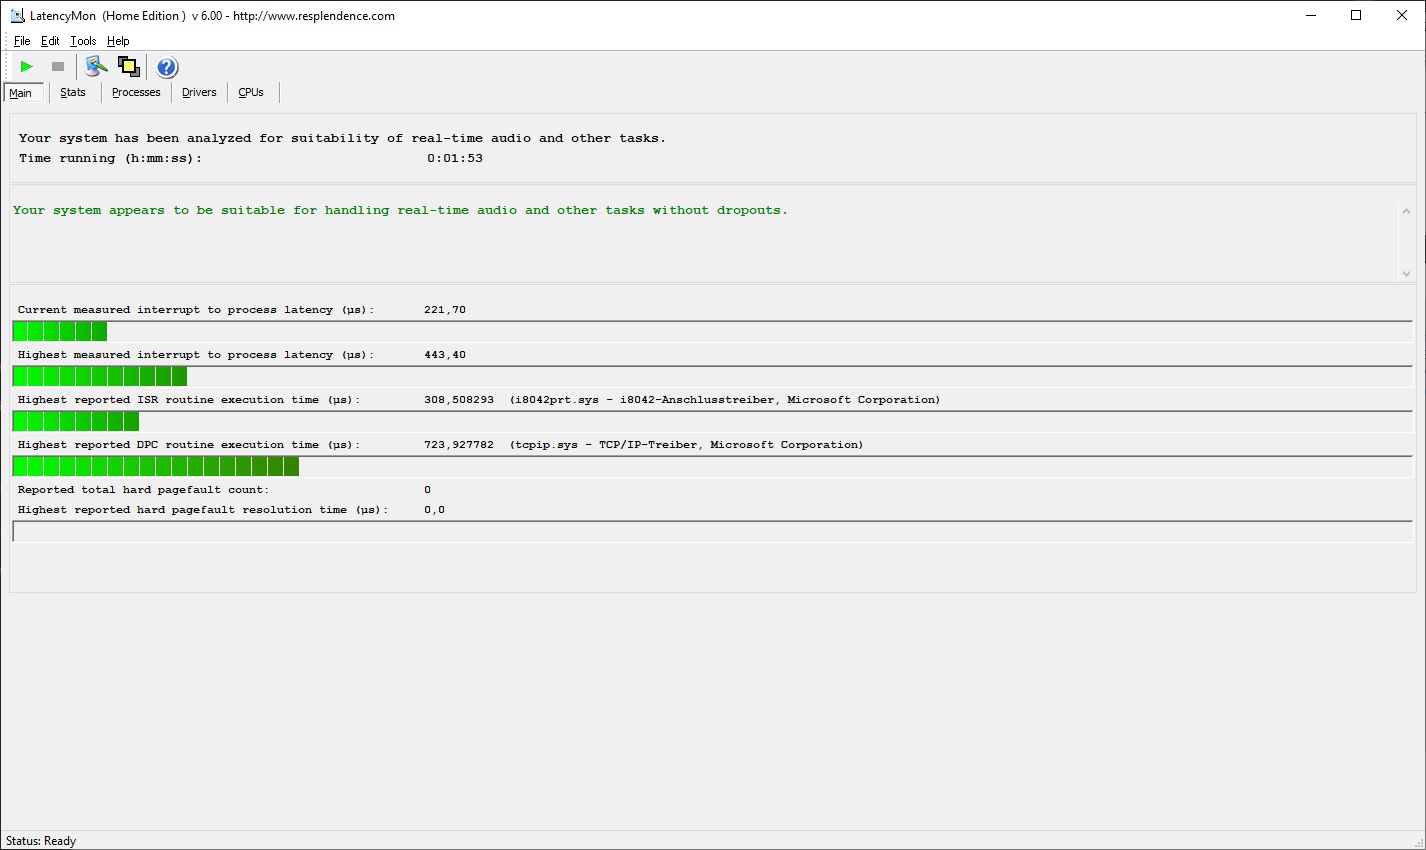
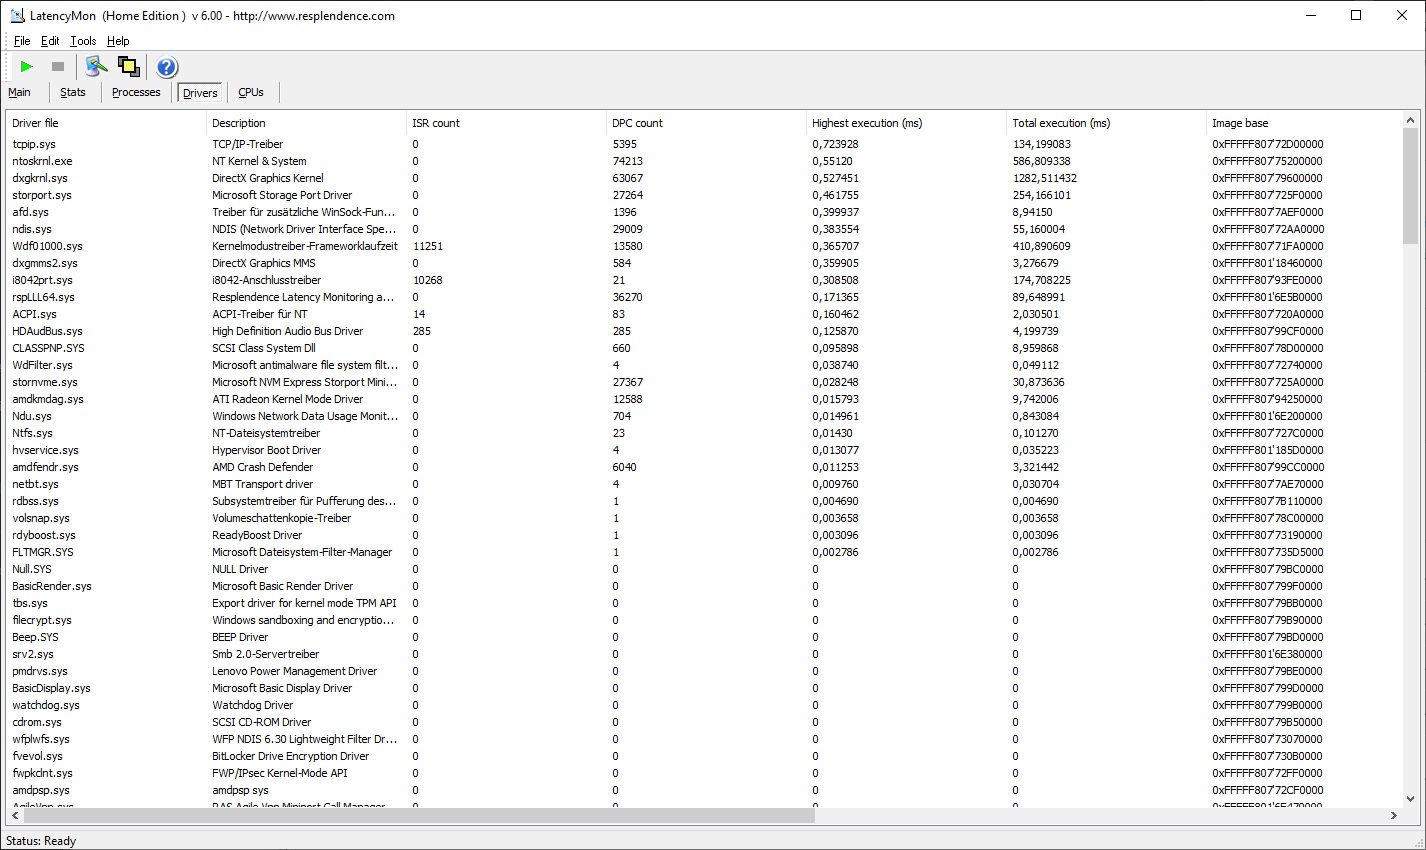
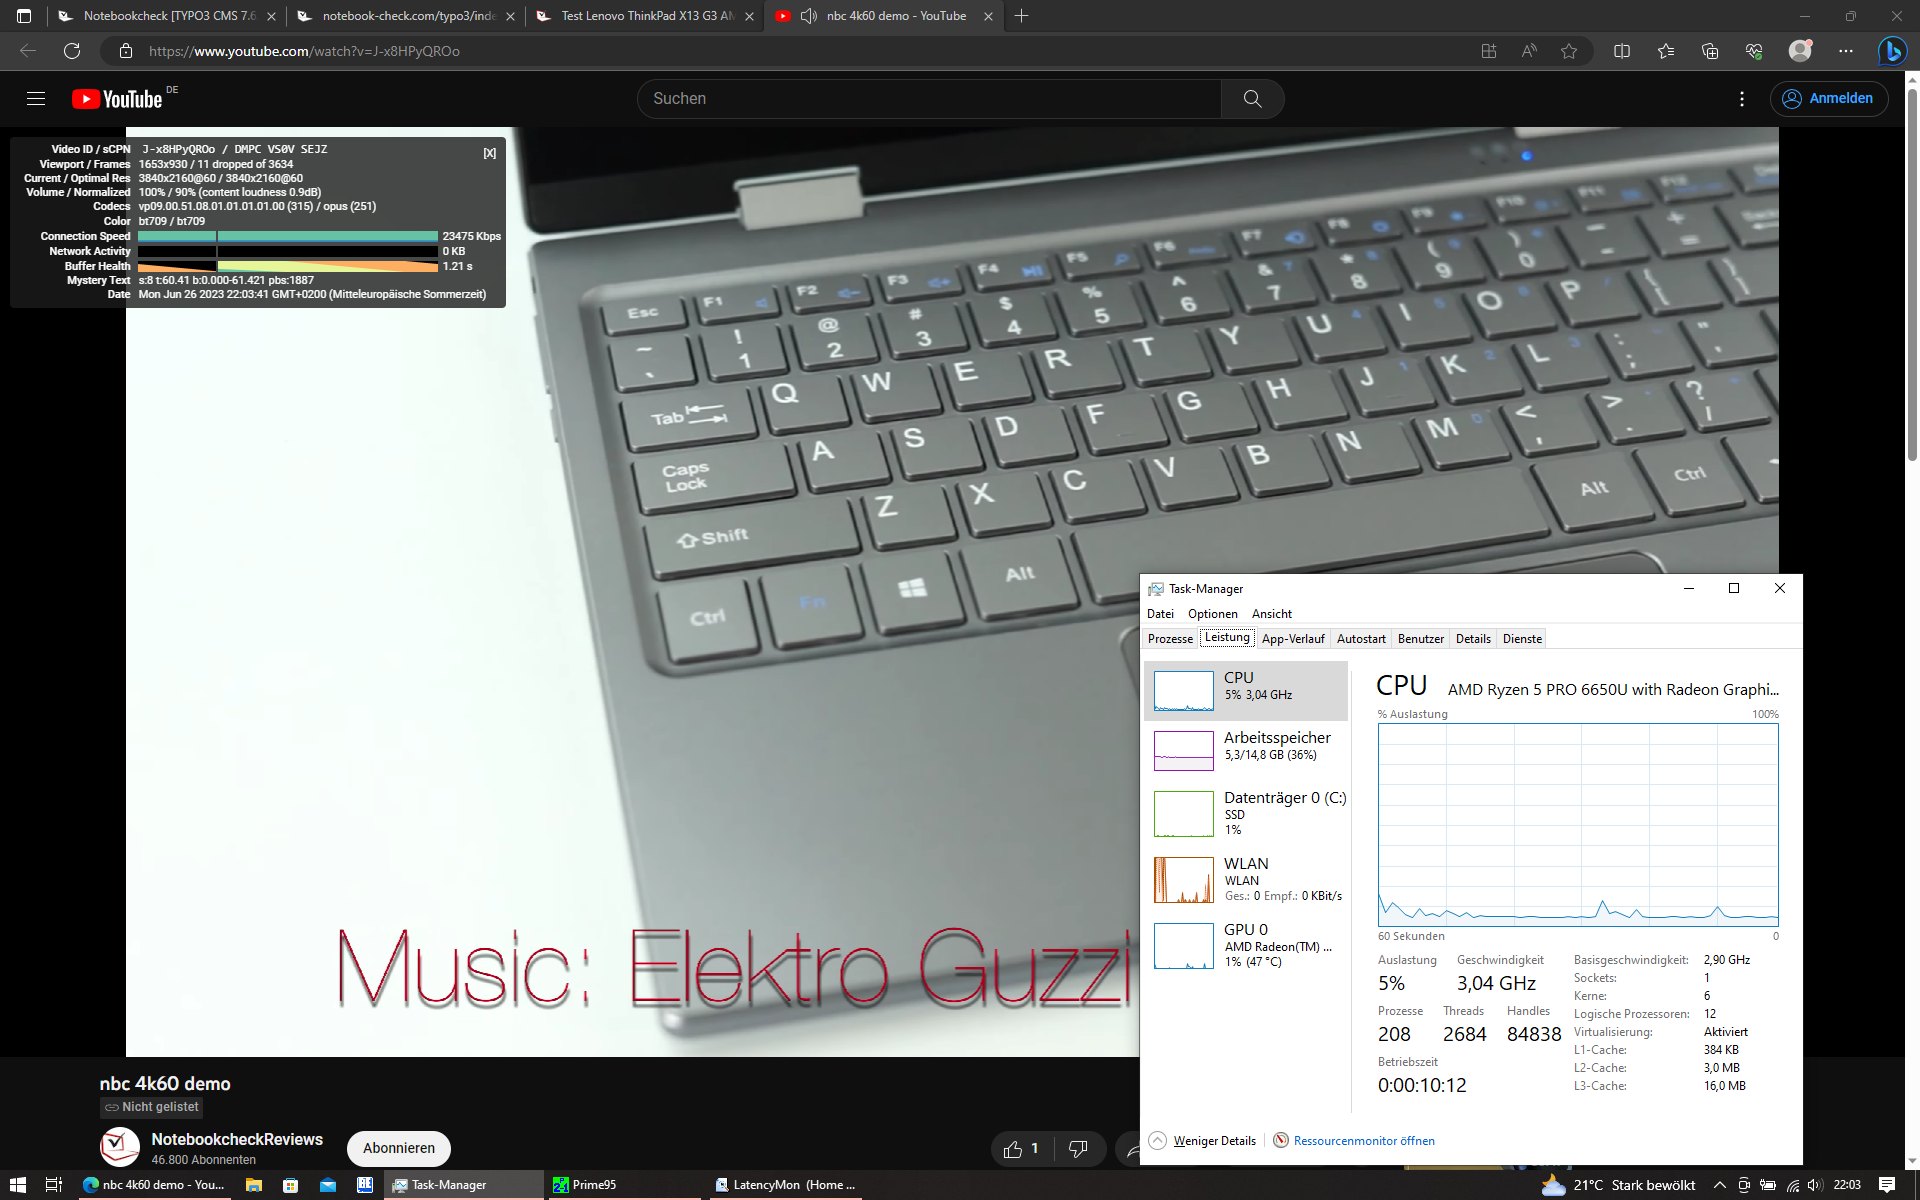
Latência DPC
Na configuração testada, o Lenovo ThinkPad X13 Gen 3 AMD não teve problemas com questões de latência de DPC.
| DPC Latencies / LatencyMon - interrupt to process latency (max), Web, Youtube, Prime95 | |
| Lenovo ThinkPad X13 G2 AMD 20XH001KGE | |
| Lenovo ThinkPad X13 G3 21BN0046GE | |
| HP EliteBook 835 G9 | |
| Dell Latitude 13 7330 | |
| Lenovo ThinkPad X13 G3 21CM002UGE | |
* ... menor é melhor
Armazenamento
O SSD M.2 2280 do Lenovo ThinkPad X13 G3 AMD vem da Samsung. O PM9A1 tem uma capacidade de 512 GB e está conectado por meio do padrão NVMe PCIe 4.0. Essa SSD poderia ser ainda mais rápida, mas ainda assim funciona mais rápido no X13 G3 em comparação com as SSDs nos dispositivos de comparação.

* ... menor é melhor
Sustained load read: DiskSpd Read Loop, Queue Depth 8
Placa de vídeo
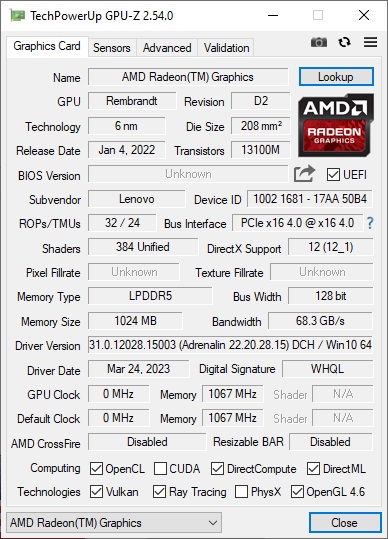
AAMD Radeon 660M é a solução gráfica padrão da classe Ryzen 5. Como uma GPU integrada, a Radeon 660M não tem sua própria memória, ela precisa contar com a memória principal do sistema. A conclusão lógica: o desempenho da GPU depende da velocidade da RAM e se a RAM é executada no modo de canal único ou duplo.
No ThinkPad X13 G3 AMD, a iGPU pode contar com a rápida memória LPDDR5-6400, que é executada no modo de canal duplo. Essas são condições ideais, e o ThinkPad X13 Gen 3 está muito à frente dos modelos Intel com i5 e seu próprio antecessor. Mais uma vez, o HP EliteBook 835 G9com a Radeon 680M mais potente fica à frente do ThinkPad.
Esse laptop de negócios não foi feito para jogos; no entanto, os jogos recentes ainda podem ser jogados - em baixa potência.
Assim como a CPU, a GPU oferece 100% de seu desempenho no modo de bateria.
| 3DMark 11 Performance | 7067 pontos | |
| 3DMark Cloud Gate Standard Score | 21798 pontos | |
| 3DMark Fire Strike Score | 4472 pontos | |
| 3DMark Time Spy Score | 1729 pontos | |
Ajuda | ||
* ... menor é melhor
| The Witcher 3 - 1920x1080 Ultra Graphics & Postprocessing (HBAO+) | |
| Média da turma Subnotebook (13.9 - 34.6, n=12, últimos 2 anos) | |
| HP EliteBook 835 G9 | |
| Lenovo ThinkPad X13 G3 21CM002UGE | |
| Dell Latitude 13 7330 | |
| Lenovo ThinkPad X13 G3 21BN0046GE | |
| GTA V - 1920x1080 Highest AA:4xMSAA + FX AF:16x | |
| Média da turma Subnotebook (10.7 - 43.7, n=55, últimos 2 anos) | |
| HP EliteBook 835 G9 | |
| Lenovo ThinkPad X13 G3 21CM002UGE | |
| Lenovo ThinkPad X13 G2 AMD 20XH001KGE | |
| Lenovo ThinkPad X13 G3 21BN0046GE | |
| Dell Latitude 13 7330 | |
| Final Fantasy XV Benchmark - 1920x1080 High Quality | |
| Média da turma Subnotebook (11.6 - 54.5, n=53, últimos 2 anos) | |
| HP EliteBook 835 G9 | |
| Lenovo ThinkPad X13 G3 21BN0046GE | |
| Lenovo ThinkPad X13 G3 21CM002UGE | |
| Dell Latitude 13 7330 | |
| Strange Brigade - 1920x1080 ultra AA:ultra AF:16 | |
| Média da turma Subnotebook (19 - 101.3, n=49, últimos 2 anos) | |
| HP EliteBook 835 G9 | |
| Lenovo ThinkPad X13 G3 21CM002UGE | |
| Lenovo ThinkPad X13 G2 AMD 20XH001KGE | |
| Dell Latitude 13 7330 | |
| Lenovo ThinkPad X13 G3 21BN0046GE | |
| Dota 2 Reborn - 1920x1080 ultra (3/3) best looking | |
| Média da turma Subnotebook (13 - 97, n=60, últimos 2 anos) | |
| HP EliteBook 835 G9 | |
| Lenovo ThinkPad X13 G2 AMD 20XH001KGE | |
| Dell Latitude 13 7330 | |
| Lenovo ThinkPad X13 G3 21BN0046GE | |
| Lenovo ThinkPad X13 G3 21CM002UGE | |
Witcher 3 FPS graph
| baixo | média | alto | ultra | |
|---|---|---|---|---|
| GTA V (2015) | 118.8 | 103.2 | 36.4 | 14.2 |
| The Witcher 3 (2015) | 86.7 | 27.6 | 17.9 | |
| Dota 2 Reborn (2015) | 93.7 | 72.2 | 37.4 | 32.8 |
| Final Fantasy XV Benchmark (2018) | 45.5 | 21.9 | 16 | |
| X-Plane 11.11 (2018) | 36 | 24.2 | 22.1 | |
| Strange Brigade (2018) | 99.5 | 40 | 31.5 | 26.7 |
| F1 22 (2022) | 42.4 | 37 | 26.2 | 5.13 |
Emissões: O ThinkPad X13 é frio e silencioso
Ruído
O Lenovo ThinkPad X13 G3 AMD é um notebook bastante silencioso. Em praticamente todos os casos, ele é menos barulhento do que os concorrentes. Deve-se observar, porém, que o antecessor direto X13 Gen 2 AMDera ainda menos barulhento.
Detectamos um leve ruído de assobio ao usar o ThinkPad, mas ele só era perceptível quando se colocava o ouvido diretamente sobre o teclado. No entanto, ouvidos sensíveis ainda podem ser incomodados.
Barulho
| Ocioso |
| 23.1 / 23.1 / 23.1 dB |
| Carga |
| 27 / 35.5 dB |
 | ||
30 dB silencioso 40 dB(A) audível 50 dB(A) ruidosamente alto |
||
min: | ||
| Lenovo ThinkPad X13 G3 21CM002UGE Radeon 660M, R5 PRO 6650U, Samsung PM9A1 MZVL2512HCJQ | Lenovo ThinkPad X13 G2 AMD 20XH001KGE Vega 7, R5 PRO 5650U, Samsung SSD PM981a MZVLB512HBJQ | HP EliteBook 835 G9 Radeon 680M, R7 PRO 6850U, Kioxia BG5 KBG50ZNV512G | Dell Latitude 13 7330 Iris Xe G7 96EUs, i7-1265U, Toshiba KBG40ZNS512G NVMe | Lenovo ThinkPad X13 G3 21BN0046GE Iris Xe G7 80EUs, i5-1235U, SK Hynix HFS512 GDE9X081N | |
|---|---|---|---|---|---|
| Noise | -3% | -13% | -9% | -4% | |
| desligado / ambiente * (dB) | 23.1 | 24.17 -5% | 26 -13% | 23.4 -1% | 24.6 -6% |
| Idle Minimum * (dB) | 23.1 | 24.17 -5% | 26 -13% | 23.4 -1% | 24.6 -6% |
| Idle Average * (dB) | 23.1 | 24.17 -5% | 27 -17% | 23.4 -1% | 24.6 -6% |
| Idle Maximum * (dB) | 23.1 | 24.17 -5% | 28 -21% | 23.4 -1% | 25.9 -12% |
| Load Average * (dB) | 27 | 29.92 -11% | 35 -30% | 37.8 -40% | 30.7 -14% |
| Witcher 3 ultra * (dB) | 38.7 | 37 4% | 39.2 -1% | 34.6 11% | |
| Load Maximum * (dB) | 35.5 | 31.52 11% | 37 -4% | 43 -21% | 34.6 3% |
* ... menor é melhor
Calor
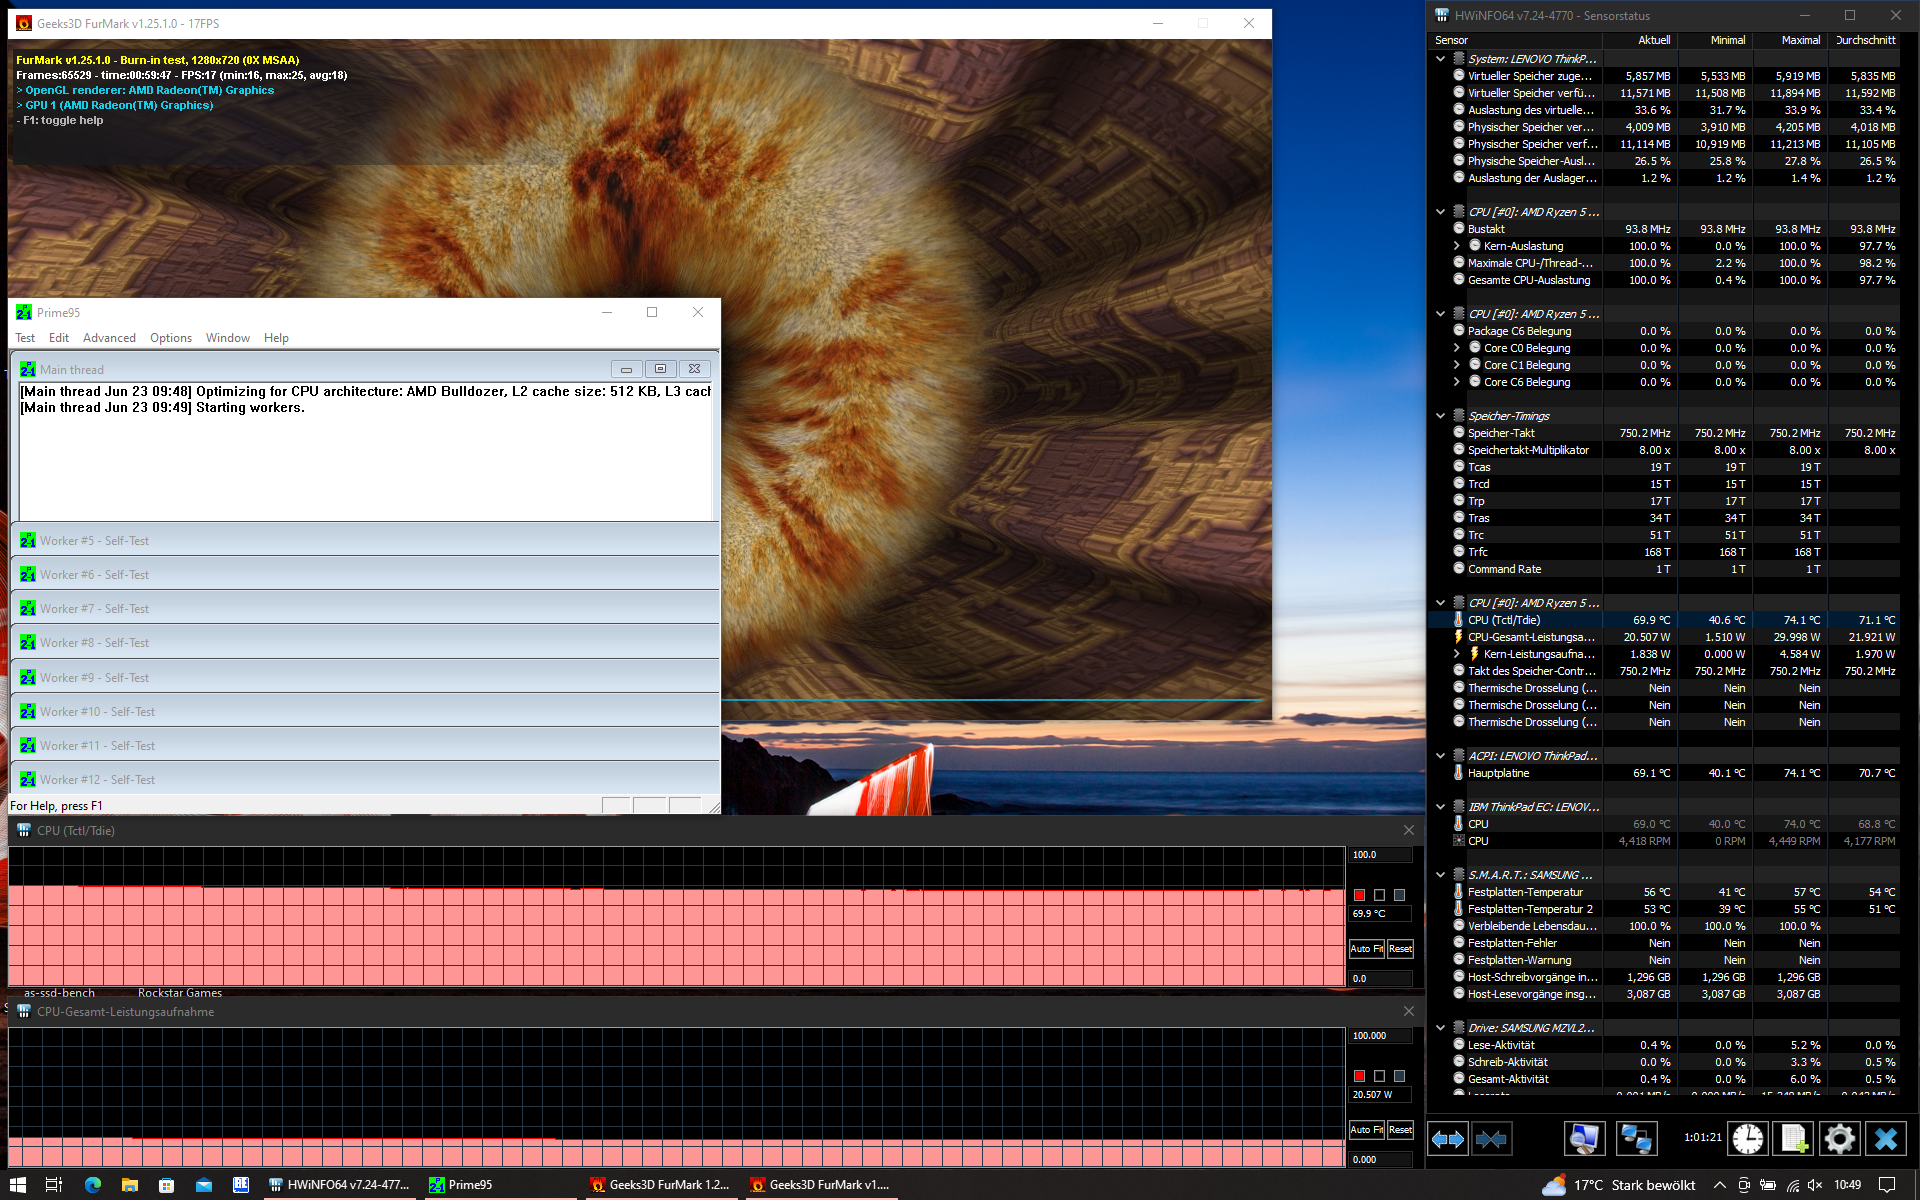
O Lenovo ThinkPad X13 Gen 3 não esquenta muito. Mesmo sob carga total, as temperaturas do chassi mal ultrapassam a marca dos 40 graus Celsius/100 graus Fahrenheit.
Durante o teste de estresse, o processador pode sustentar um consumo de energia de 20 W. Não foi possível detectar a aceleração.
(+) A temperatura máxima no lado superior é 38.1 °C / 101 F, em comparação com a média de 35.9 °C / 97 F , variando de 21.4 a 59 °C para a classe Subnotebook.
(±) A parte inferior aquece até um máximo de 40.1 °C / 104 F, em comparação com a média de 39.2 °C / 103 F
(+) Em uso inativo, a temperatura média para o lado superior é 30.9 °C / 88 F, em comparação com a média do dispositivo de 30.8 °C / ### class_avg_f### F.
(±) Jogando The Witcher 3, a temperatura média para o lado superior é 34.3 °C / 94 F, em comparação com a média do dispositivo de 30.8 °C / ## #class_avg_f### F.
(+) Os apoios para as mãos e o touchpad são mais frios que a temperatura da pele, com um máximo de 31.6 °C / 88.9 F e, portanto, são frios ao toque.
(-) A temperatura média da área do apoio para as mãos de dispositivos semelhantes foi 28.2 °C / 82.8 F (-3.4 °C / -6.1 F).
| Lenovo ThinkPad X13 G3 21CM002UGE AMD Ryzen 5 PRO 6650U, AMD Radeon 660M | Lenovo ThinkPad X13 G2 AMD 20XH001KGE AMD Ryzen 5 PRO 5650U, AMD Radeon RX Vega 7 | HP EliteBook 835 G9 AMD Ryzen 7 PRO 6850U, AMD Radeon 680M | Dell Latitude 13 7330 Intel Core i7-1265U, Intel Iris Xe Graphics G7 96EUs | Lenovo ThinkPad X13 G3 21BN0046GE Intel Core i5-1235U, Intel Iris Xe Graphics G7 80EUs | |
|---|---|---|---|---|---|
| Heat | 9% | 4% | 12% | -4% | |
| Maximum Upper Side * (°C) | 38.1 | 43.7 -15% | 46 -21% | 38.6 -1% | 45.3 -19% |
| Maximum Bottom * (°C) | 40.1 | 38 5% | 49 -22% | 42 -5% | 41.8 -4% |
| Idle Upper Side * (°C) | 33.6 | 25.8 23% | 24 29% | 23.8 29% | 31.6 6% |
| Idle Bottom * (°C) | 33.4 | 26.2 22% | 24 28% | 24.6 26% | 32.6 2% |
* ... menor é melhor
Alto-falantes
Os alto-falantes voltados para o usuário emitem um som de qualidade mediana, sem base - apenas na parte mais alta do espectro de ondas sonoras, o som é equilibrado. Os alto-falantes doHP EliteBook 835 G9não são muito melhores, mas pelo menos um pouco mais altos.
Lenovo ThinkPad X13 G3 21CM002UGE análise de áudio
(±) | o volume do alto-falante é médio, mas bom (###valor### dB)
Graves 100 - 315Hz
(-) | quase nenhum baixo - em média 24% menor que a mediana
(±) | a linearidade dos graves é média (14.2% delta para a frequência anterior)
Médios 400 - 2.000 Hz
(+) | médios equilibrados - apenas 2.9% longe da mediana
(+) | médios são lineares (2.8% delta para frequência anterior)
Altos 2 - 16 kHz
(+) | agudos equilibrados - apenas 2.7% longe da mediana
(+) | os máximos são lineares (3.9% delta da frequência anterior)
Geral 100 - 16.000 Hz
(±) | a linearidade do som geral é média (19.3% diferença em relação à mediana)
Comparado com a mesma classe
» 60% de todos os dispositivos testados nesta classe foram melhores, 7% semelhantes, 34% piores
» O melhor teve um delta de 5%, a média foi 18%, o pior foi 53%
Comparado com todos os dispositivos testados
» 47% de todos os dispositivos testados foram melhores, 8% semelhantes, 46% piores
» O melhor teve um delta de 4%, a média foi 23%, o pior foi 134%
HP EliteBook 835 G9 análise de áudio
(±) | o volume do alto-falante é médio, mas bom (###valor### dB)
Graves 100 - 315Hz
(-) | quase nenhum baixo - em média 17.8% menor que a mediana
(±) | a linearidade dos graves é média (11.2% delta para a frequência anterior)
Médios 400 - 2.000 Hz
(+) | médios equilibrados - apenas 1.7% longe da mediana
(+) | médios são lineares (3.2% delta para frequência anterior)
Altos 2 - 16 kHz
(+) | agudos equilibrados - apenas 3.2% longe da mediana
(±) | a linearidade dos máximos é média (8% delta para frequência anterior)
Geral 100 - 16.000 Hz
(+) | o som geral é linear (14.7% diferença em relação à mediana)
Comparado com a mesma classe
» 31% de todos os dispositivos testados nesta classe foram melhores, 5% semelhantes, 64% piores
» O melhor teve um delta de 5%, a média foi 18%, o pior foi 53%
Comparado com todos os dispositivos testados
» 19% de todos os dispositivos testados foram melhores, 4% semelhantes, 77% piores
» O melhor teve um delta de 4%, a média foi 23%, o pior foi 134%
Gerenciamento de energia: Lenovo ThinkPad eficiente
Consumo de energia
O laptop da Lenovo pode se orgulhar de ter um consumo de energia bastante baixo; todos os dispositivos de análise são, em média, menos eficientes. A diferença é importante, especialmente quando em marcha lenta. Nessa área, oHP EliteBook 835 G9é notavelmente pior.
O consumo máximo de 49,1 W está bem dentro da capacidade do carregador de 65 W.
| desligado | |
| Ocioso | |
| Carga |
|
Key:
min: | |
| Lenovo ThinkPad X13 G3 21CM002UGE R5 PRO 6650U, Radeon 660M, Samsung PM9A1 MZVL2512HCJQ, IPS LED, 1920x1200, 13.3" | Lenovo ThinkPad X13 G2 AMD 20XH001KGE R5 PRO 5650U, Vega 7, Samsung SSD PM981a MZVLB512HBJQ, IPS LED, 1920x1200, 13.3" | HP EliteBook 835 G9 R7 PRO 6850U, Radeon 680M, Kioxia BG5 KBG50ZNV512G, IPS, 1920x1200, 13.3" | Dell Latitude 13 7330 i7-1265U, Iris Xe G7 96EUs, Toshiba KBG40ZNS512G NVMe, IPS, 1920x1080, 13.3" | Lenovo ThinkPad X13 G3 21BN0046GE i5-1235U, Iris Xe G7 80EUs, SK Hynix HFS512 GDE9X081N, IPS Grade, 1920x1200, 13.3" | Média AMD Radeon 660M | Média da turma Subnotebook | |
|---|---|---|---|---|---|---|---|
| Power Consumption | -7% | -33% | -10% | -7% | -38% | -26% | |
| Idle Minimum * (Watt) | 3.2 | 3.82 -19% | 5 -56% | 2.8 13% | 2.7 16% | 4.68 ? -46% | 3.73 ? -17% |
| Idle Average * (Watt) | 5.2 | 5.74 -10% | 6 -15% | 4.8 8% | 5.2 -0% | 7.08 ? -36% | 6.51 ? -25% |
| Idle Maximum * (Watt) | 6.1 | 7.65 -25% | 11 -80% | 7.3 -20% | 6.2 -2% | 9.12 ? -50% | 7.88 ? -29% |
| Load Average * (Watt) | 33.6 | 35.79 -7% | 45 -34% | 48.1 -43% | 38.4 -14% | 44.2 ? -32% | 42.3 ? -26% |
| Witcher 3 ultra * (Watt) | 39.3 | 35.6 9% | 45.2 -15% | 35.4 10% | 41.9 -7% | ||
| Load Maximum * (Watt) | 49.1 | 45.04 8% | 48 2% | 63.6 -30% | 66.7 -36% | 62.4 ? -27% | 64.8 ? -32% |
* ... menor é melhor
Power consumption Witcher 3 / stress test
Energieaufnahme mit externem Monitor
Duração da bateria
A bateria interna ainda tem uma capacidade de 54,7 Wh, embora também exista uma variante com 41 Wh. O modelo que testamos alcançou ótimos tempos de duração da bateria: As 12 horas e 30 minutos no teste WiFi (brilho de tela de 150 cd/m²) já são formidáveis, mas as 10 horas e 40 minutos no mesmo teste com brilho máximo de tela são ainda melhores em termos relativos. O ThinkPad X13 G3 AMD é um dispositivo capaz de durar o dia inteiro de trabalho.
| Lenovo ThinkPad X13 G3 21CM002UGE R5 PRO 6650U, Radeon 660M, 54.7 Wh | Lenovo ThinkPad X13 G2 AMD 20XH001KGE R5 PRO 5650U, Vega 7, 54.7 Wh | HP EliteBook 835 G9 R7 PRO 6850U, Radeon 680M, 51 Wh | Dell Latitude 13 7330 i7-1265U, Iris Xe G7 96EUs, 41 Wh | Lenovo ThinkPad X13 G3 21BN0046GE i5-1235U, Iris Xe G7 80EUs, 54.7 Wh | Média da turma Subnotebook | |
|---|---|---|---|---|---|---|
| Duração da bateria | -17% | -27% | -21% | 8% | 23% | |
| WiFi v1.3 (h) | 12.5 | 9.3 -26% | 9.1 -27% | 8.3 -34% | 10.2 -18% | 14 ? 12% |
| Load (h) | 1.5 | 1.4 -7% | 1.1 -27% | 1.4 -7% | 2 33% | 1.998 ? 33% |
Pro
Contra
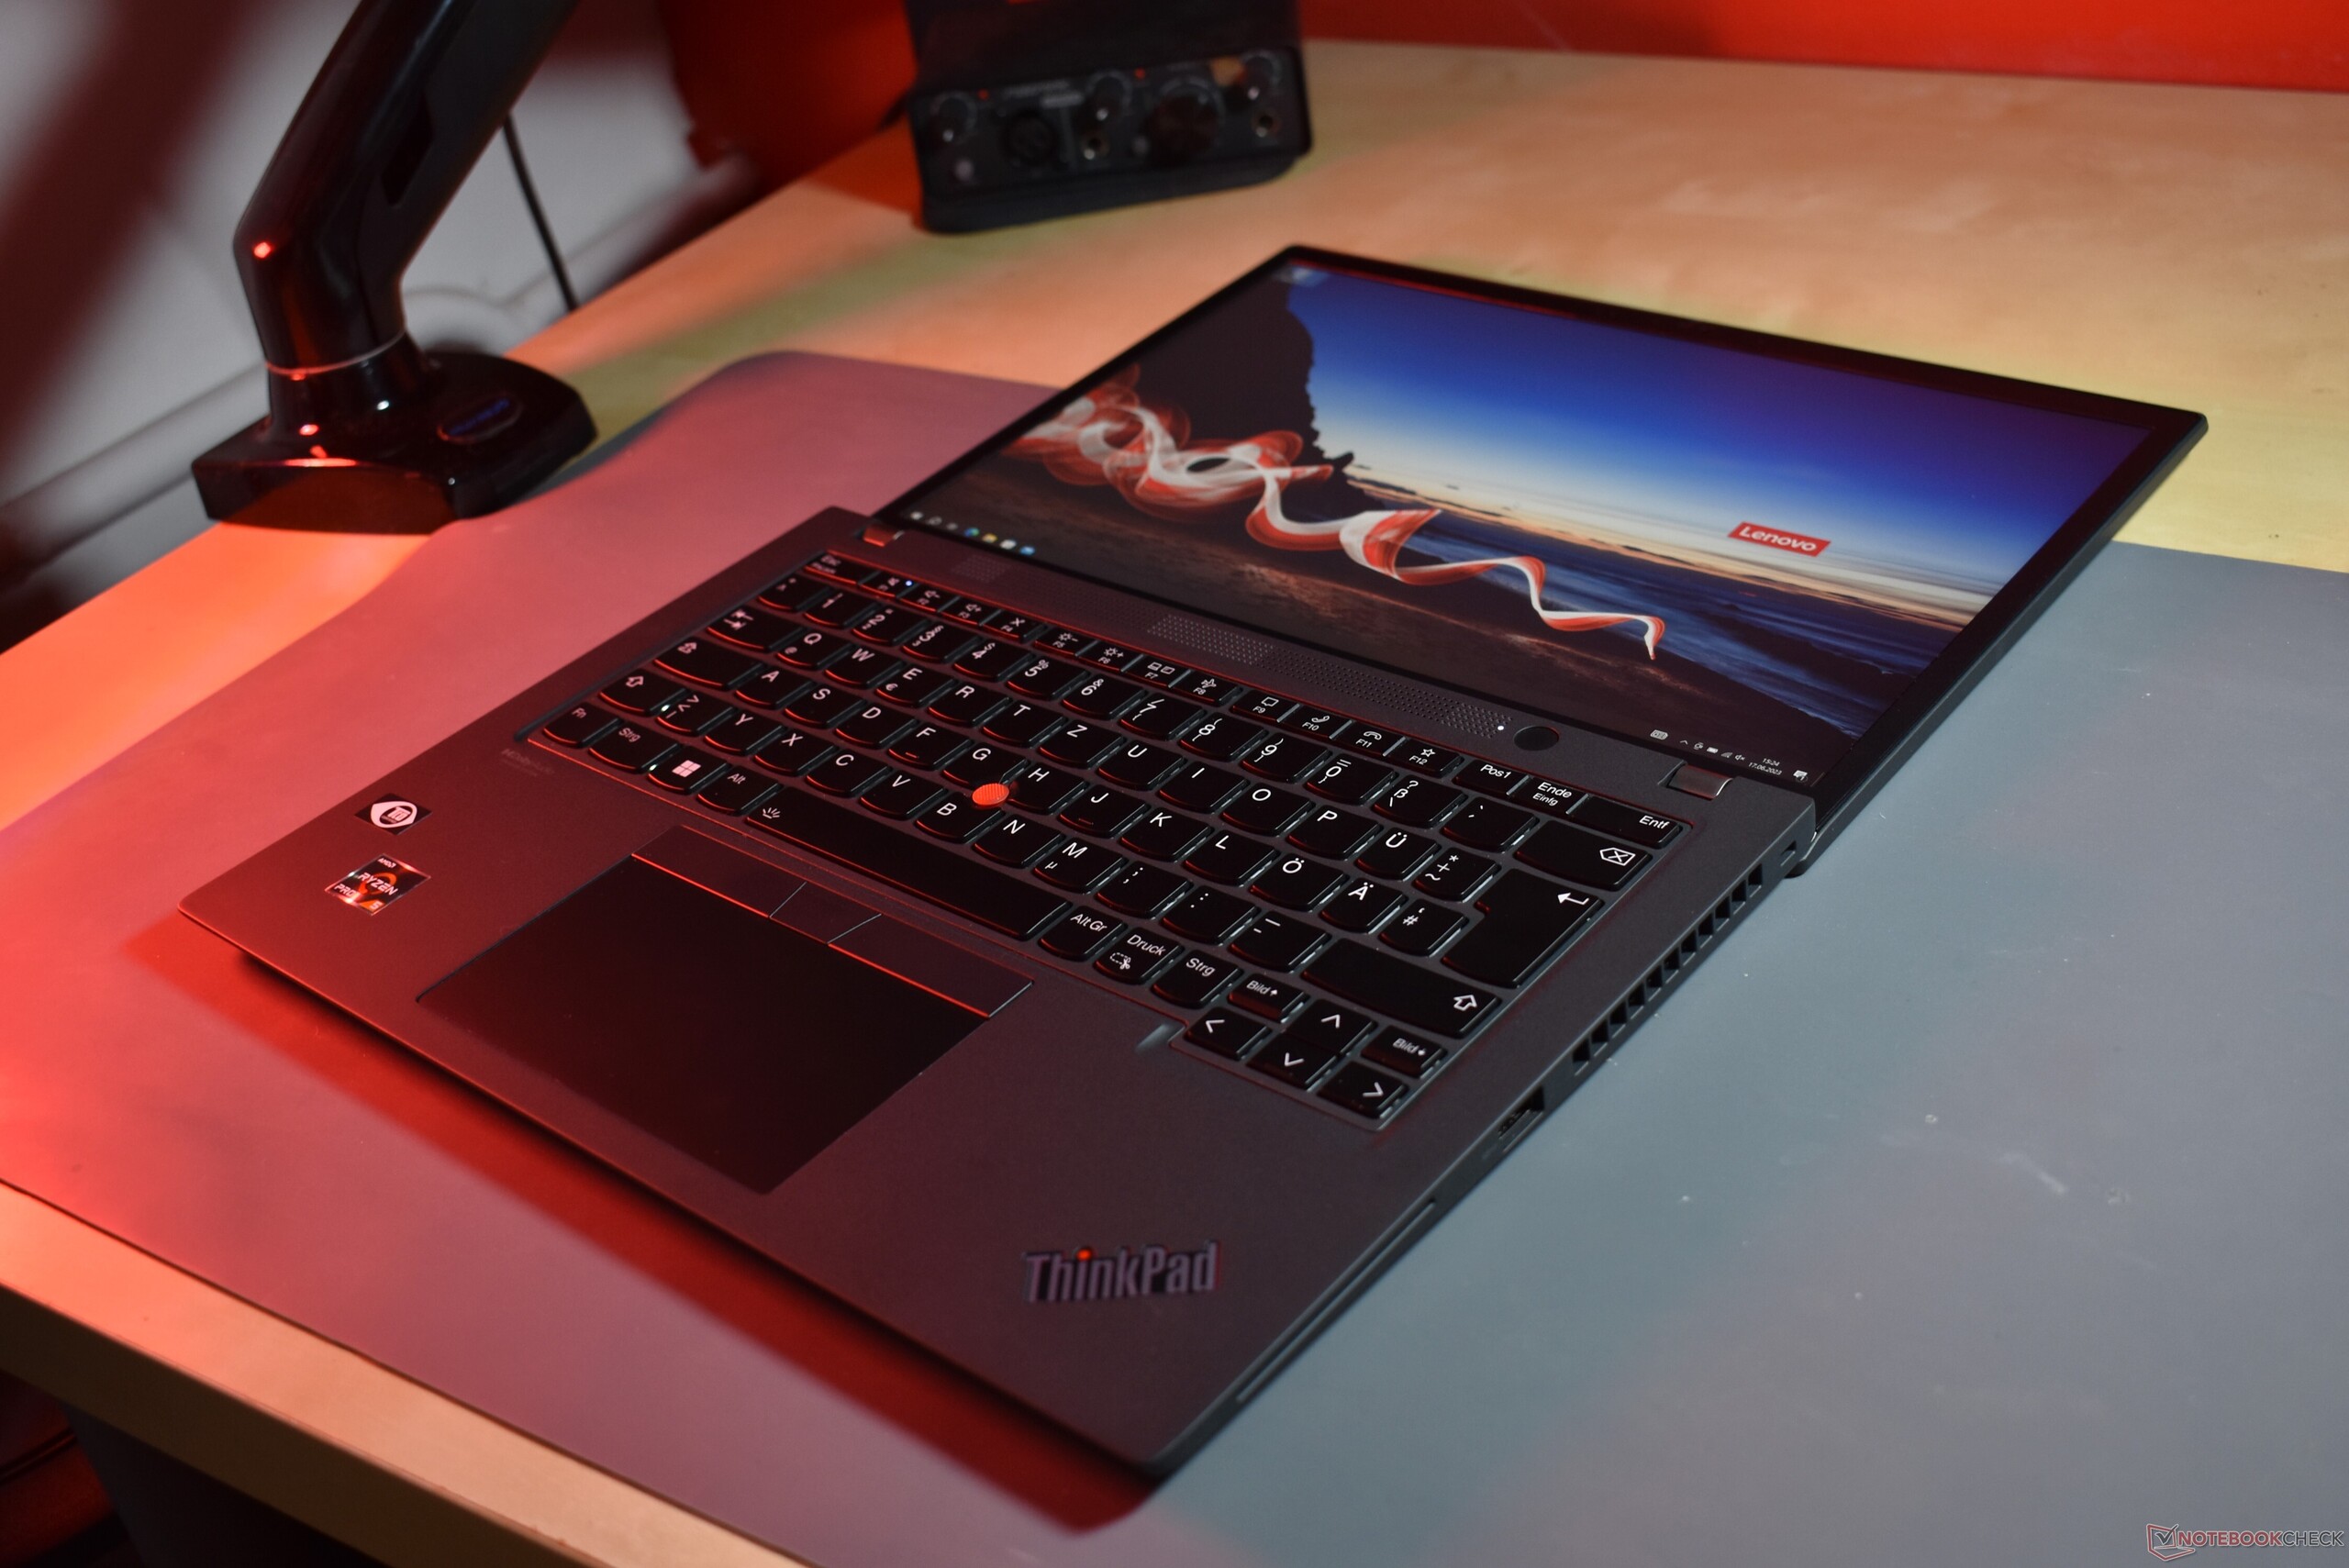
Veredicto: O ThinkPad X13 AMD ainda é um subnotebook muito bom

Com o Lenovo ThinkPad X13 Gen 3 AMD, o fabricante se baseia em um laptop já muito bom, oLenovo ThinkPad X13 Gen 2. O novo modelo tem todos os aspectos que tornaram o antigo bom, mas acrescenta USB4 e Rembrandt. Logicamente, não é de se admirar que o novo modelo também alcance uma classificação muito boa.
Além dos pontos fortes existentes, como o chassi robusto e leve, os dispositivos de entrada agradáveis e as boas opções de conectividade, o novo modelo tem uma duração de bateria aprimorada. O ThinkPad X13 Gen 3 alcança um bom desempenho e ainda funciona de forma fria e silenciosa, o que não é um dado adquirido quando comparado com a concorrência da Intel.
É claro que ainda há espaço para melhorias. O brilho da tela poderia ser melhor, especialmente quando se leva em conta os concorrentes. Também gostaríamos de ver uma webcam de alta resolução, bem como uma RAM atualizável. Além disso, as taxas de upload do WiFi foram bastante baixas.
Compacto, com desempenho, bateria de longa duração, frio e silencioso - o Lenovo ThinkPad X13 Gen 3 AMD combina muitos atributos positivos.
Isso é principalmente uma crítica de alto nível. Se você está procurando um dispositivo de trabalho rápido e ultramóvel, que dure o dia inteiro, o ThinkPad X13 G3 AMD definitivamente deve ser um concorrente. O mesmo vale para o HP EliteBook 835 G9 - os compradores doDell Latitude 7330têm de enfrentar as CPUs da Intel, que oferecem melhor desempenho em um único núcleo, mas são menos eficientes em outros aspectos. OLenovo ThinkPad X13 Gen 4com AMD Phoenix já está no horizonte, mas ainda não está disponível - comprar o antecessor definitivamente não é uma má escolha.
Preços e disponibilidade
A Amazon oferece o Lenovo ThinkPad X13 G3 AMD por US$ 1.200.
Lenovo ThinkPad X13 G3 21CM002UGE
- 06/27/2023 v7 (old)
Benjamin Herzig
Transparência
A seleção dos dispositivos a serem analisados é feita pela nossa equipe editorial. A amostra de teste foi fornecida ao autor como empréstimo pelo fabricante ou varejista para fins desta revisão. O credor não teve influência nesta revisão, nem o fabricante recebeu uma cópia desta revisão antes da publicação. Não houve obrigação de publicar esta revisão. Como empresa de mídia independente, a Notebookcheck não está sujeita à autoridade de fabricantes, varejistas ou editores.
É assim que o Notebookcheck está testando
Todos os anos, o Notebookcheck analisa de forma independente centenas de laptops e smartphones usando procedimentos padronizados para garantir que todos os resultados sejam comparáveis. Desenvolvemos continuamente nossos métodos de teste há cerca de 20 anos e definimos padrões da indústria no processo. Em nossos laboratórios de teste, equipamentos de medição de alta qualidade são utilizados por técnicos e editores experientes. Esses testes envolvem um processo de validação em vários estágios. Nosso complexo sistema de classificação é baseado em centenas de medições e benchmarks bem fundamentados, o que mantém a objetividade.Price comparison

