Estreia do Intel Core i7-1265U: Dell Latitude 13 7330 Revisão de 1 kg de laptop
Não confundir com o Dell Latitude 7330 Resistenteo Latitude 7330 é o seu laptop mais tradicional para escritórios e empresas. Ele vem em ambas as opções clamshell e conversível 2 em 1, cada uma com opções similares de CPU Intel 12th gen Core-U, portas e design geral do chassi, mas com diferentes opções de exibição e material do chassi para escolher. Recomendamos verificar a página do produto ou o PDF técnico disponível publicamente para o Latitude 7330, pois oferece mais opções configuráveis do que a maioria dos outros laptops, desde diferentes webcams, tamanhos de bateria, WAN e até leitores MicroSD
Nossa unidade específica de revisão é a clamshell de liga de magnésio Latitude 7330, que tem como alvo um peso de apenas 1 kg para ser um dos mais leves laptops comerciais de 13,3 polegadas do mercado. Alguns outros laptops também prometeram projetos similares super leves no passado, tais como o Série LG Gram, Samsung Galaxy Série Book Pro, Libélula HP Elite Dragonflyou o Série Toshiba Portege Z todos os quais servem como alternativas ao Latitude 7330. Nossa configuração como varejo revisado por aproximadamente US$ 2.000,00.
Mais análises da Dell
Possíveis concorrentes em comparação
Avaliação | Data | Modelo | Peso | Altura | Size | Resolução | Preço |
|---|---|---|---|---|---|---|---|
| 89 % v7 (old) | 07/2022 | Dell Latitude 13 7330 i7-1265U, Iris Xe G7 96EUs | 1 kg | 16.96 mm | 13.30" | 1920x1080 | |
| 87.9 % v7 (old) | 10/2020 | Lenovo ThinkPad X13 Yoga 20SX0004GE i7-10510U, UHD Graphics 620 | 1.3 kg | 15.95 mm | 13.30" | 1920x1080 | |
| 85.1 % v7 (old) | 07/2022 | Framework Laptop 13.5 12th Gen Intel i7-1260P, Iris Xe G7 96EUs | 1.3 kg | 15.85 mm | 13.50" | 2256x1504 | |
| 86.6 % v7 (old) | 12/2020 | Razer Book 13 FHD i7-1165G7, Iris Xe G7 96EUs | 1.4 kg | 15.15 mm | 13.40" | 1920x1200 | |
| 89.4 % v7 (old) | 07/2020 | Dell Latitude 7310 i7-10610U, UHD Graphics 620 | 1.2 kg | 18.3 mm | 13.30" | 1920x1080 | |
| 85.2 % v7 (old) | 05/2021 | Microsoft Surface Laptop 4 13 Ryzen 5 R5 4680U, Vega 7 | 1.3 kg | 14 mm | 13.50" | 2256x1504 |
Caso - Três opções diferentes
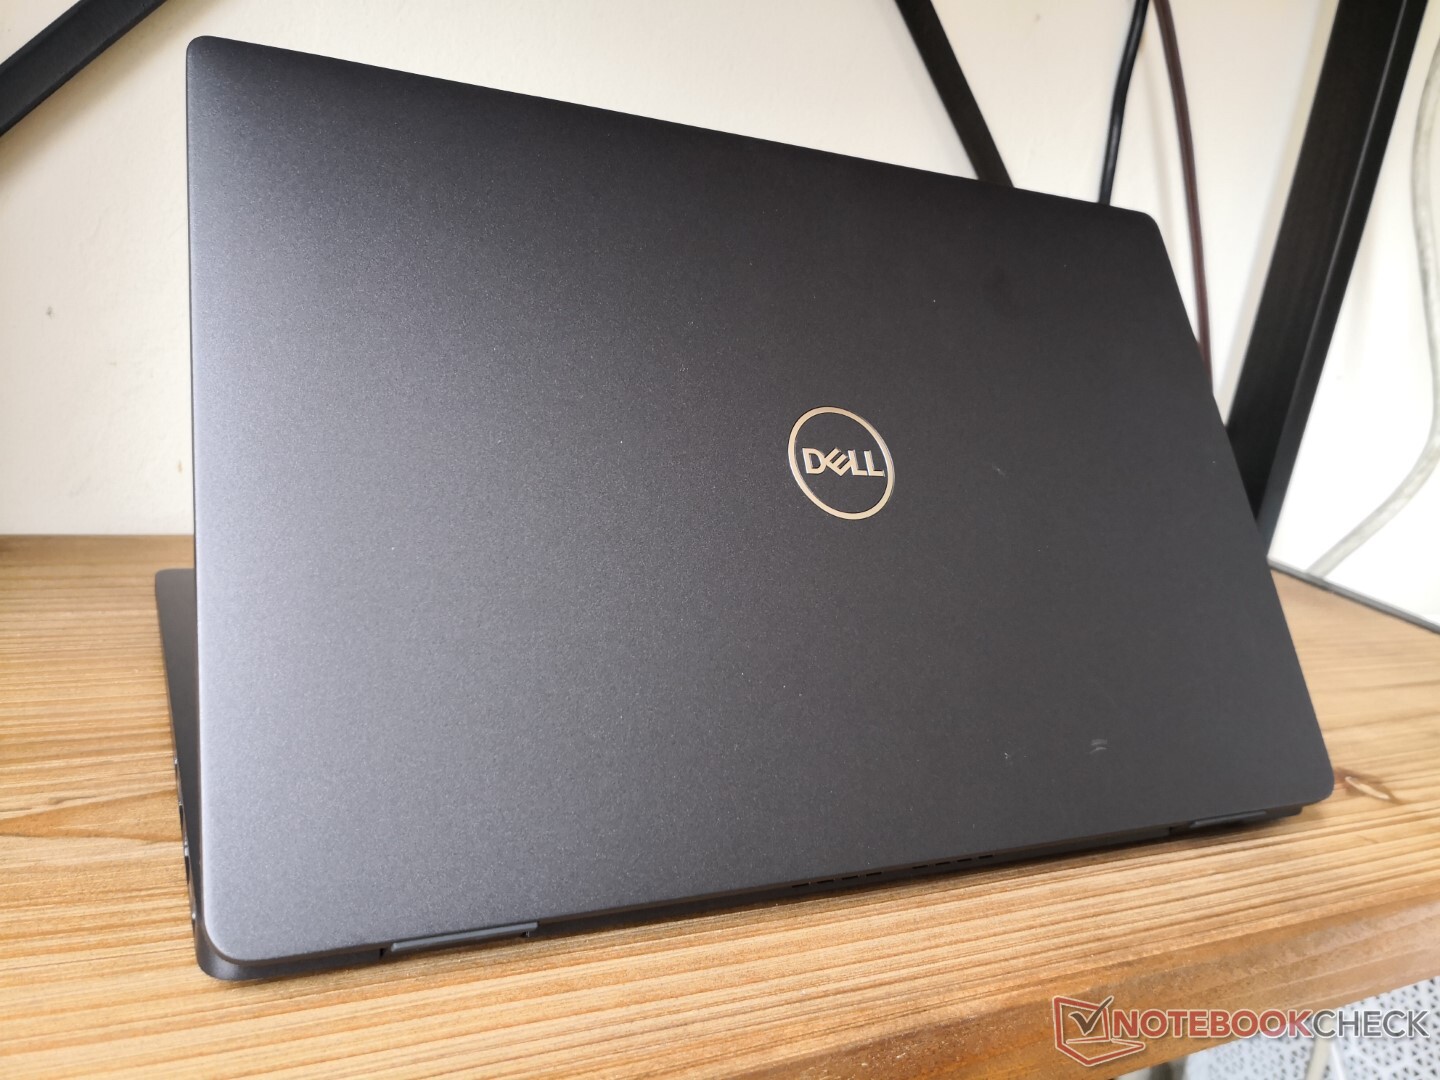
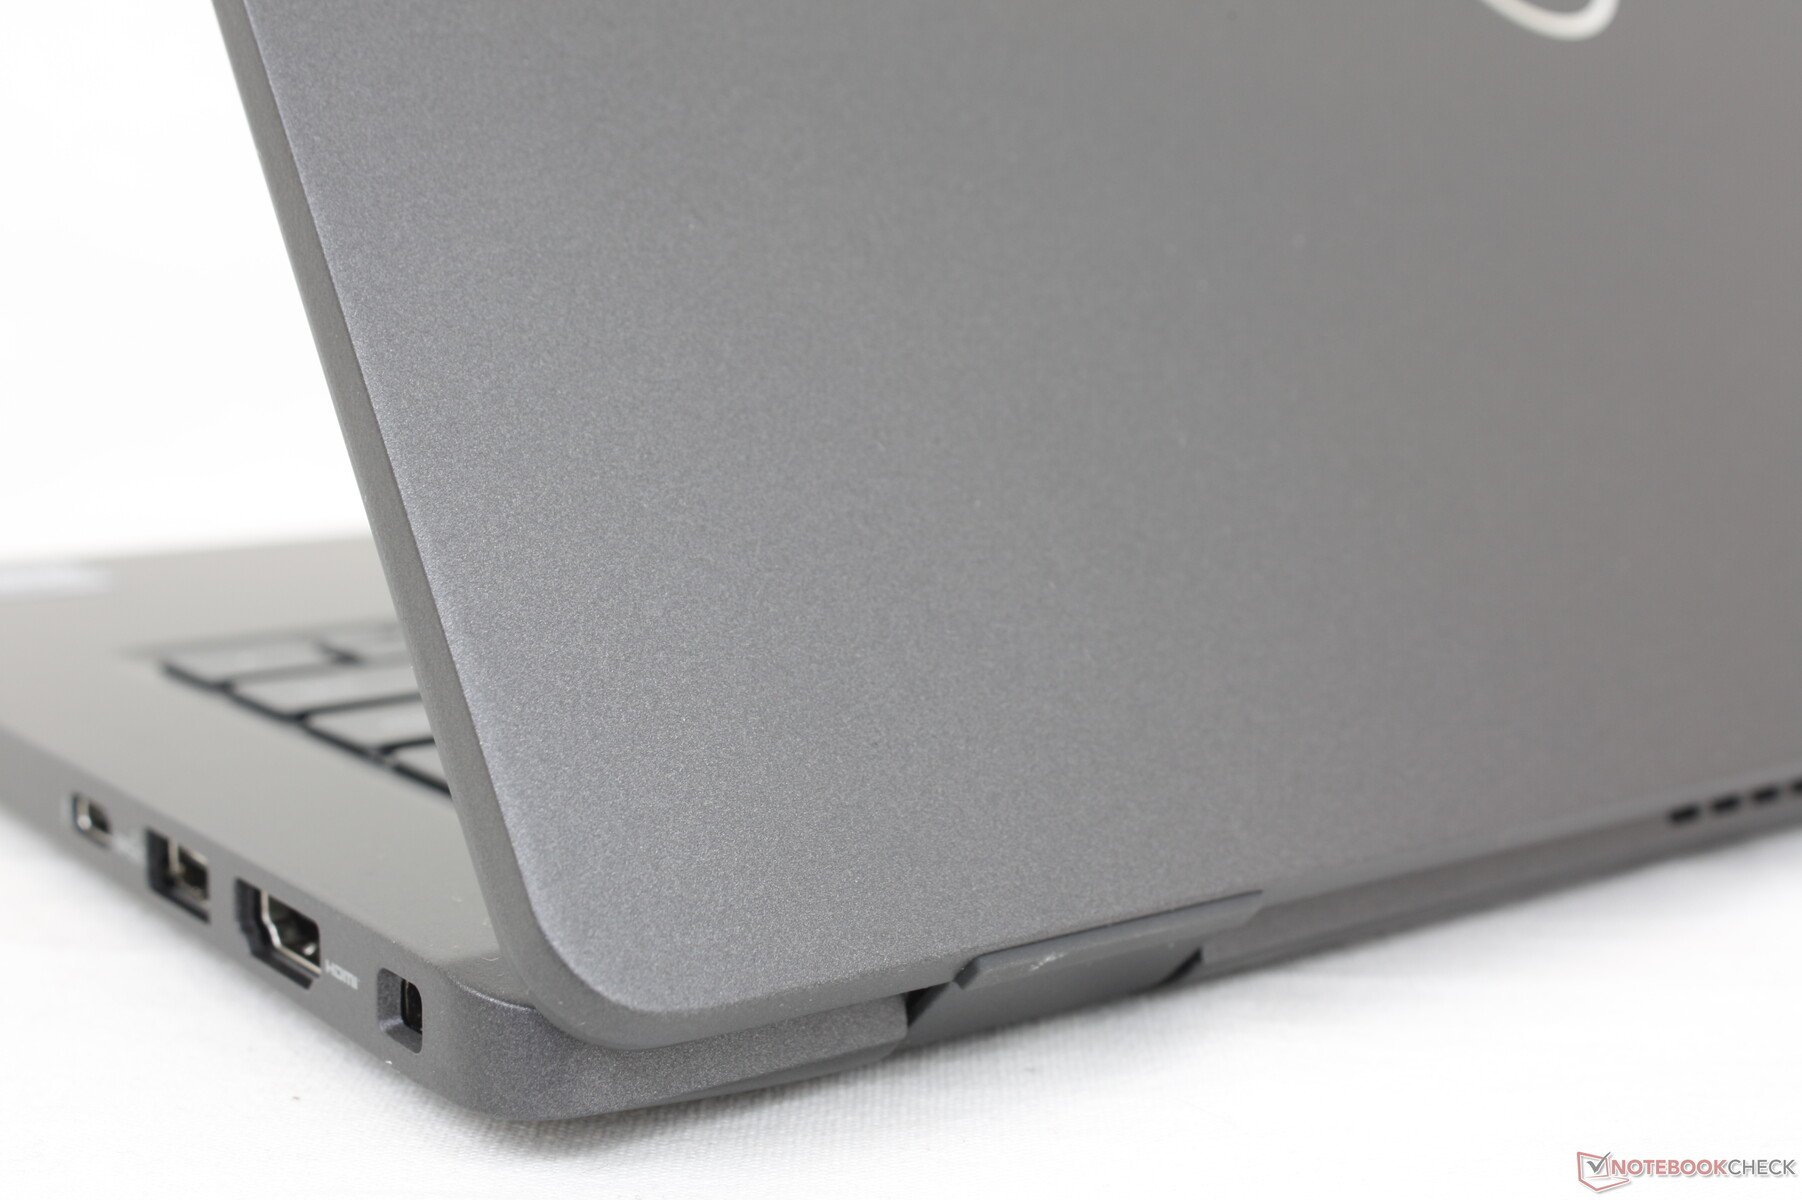
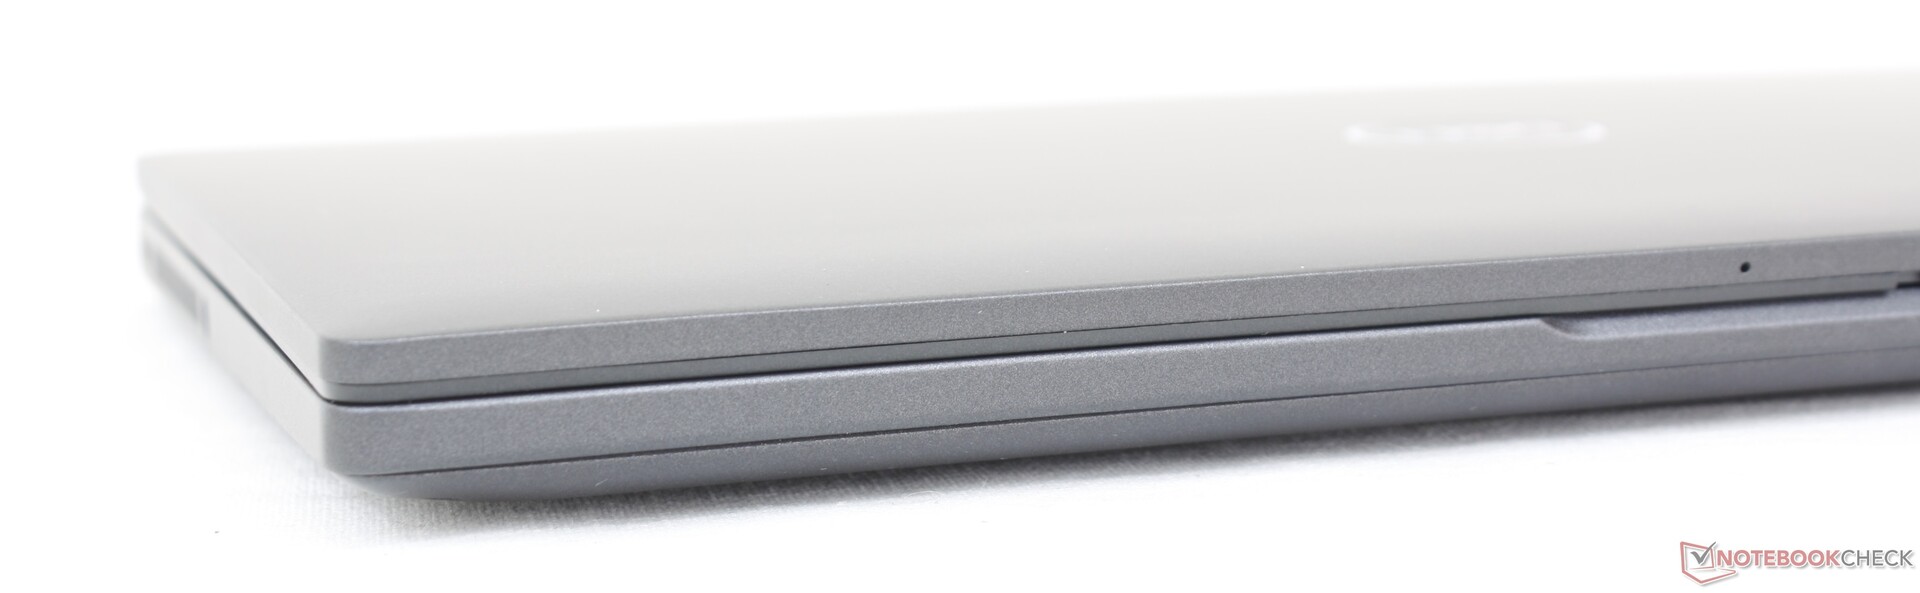
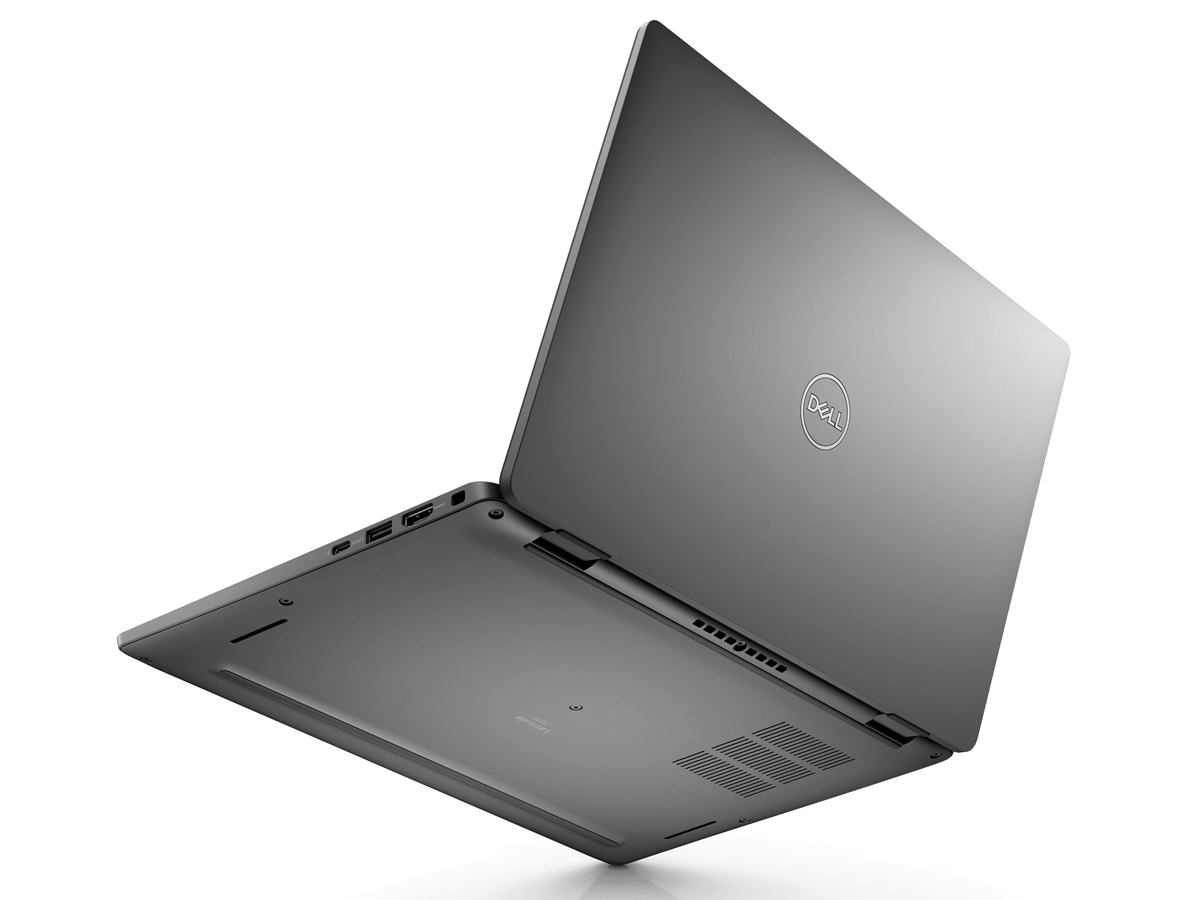
já existem laptops de 13 polegadas que prometem ser de 1 kg ou até mais leves, mas quase sempre vêm com algumas advertências. Mais notadamente, tais modelos normalmente mostram muito mais flexibilidade para uma impressão geral mais fraca quando se trata de durabilidade. Passe apenas um minuto com o LG Gram 13 em comparação com o mais pesado Dell XPS 13 9310 e as diferenças de finura em seus esqueletos se tornam imediatamente perceptíveis. O Latitude 7330 de alguma forma evitou a tendência ao ser mais rígido do que o esperado para uma construção de 1 kg. A base, por exemplo, não torce ou dobra quase tanto quanto no LG acima mencionado. A rigidez geral está em algum lugar entre o Gram 13 e o XPS 13, o que consideramos uma troca justa se você valoriza o peso superleve.
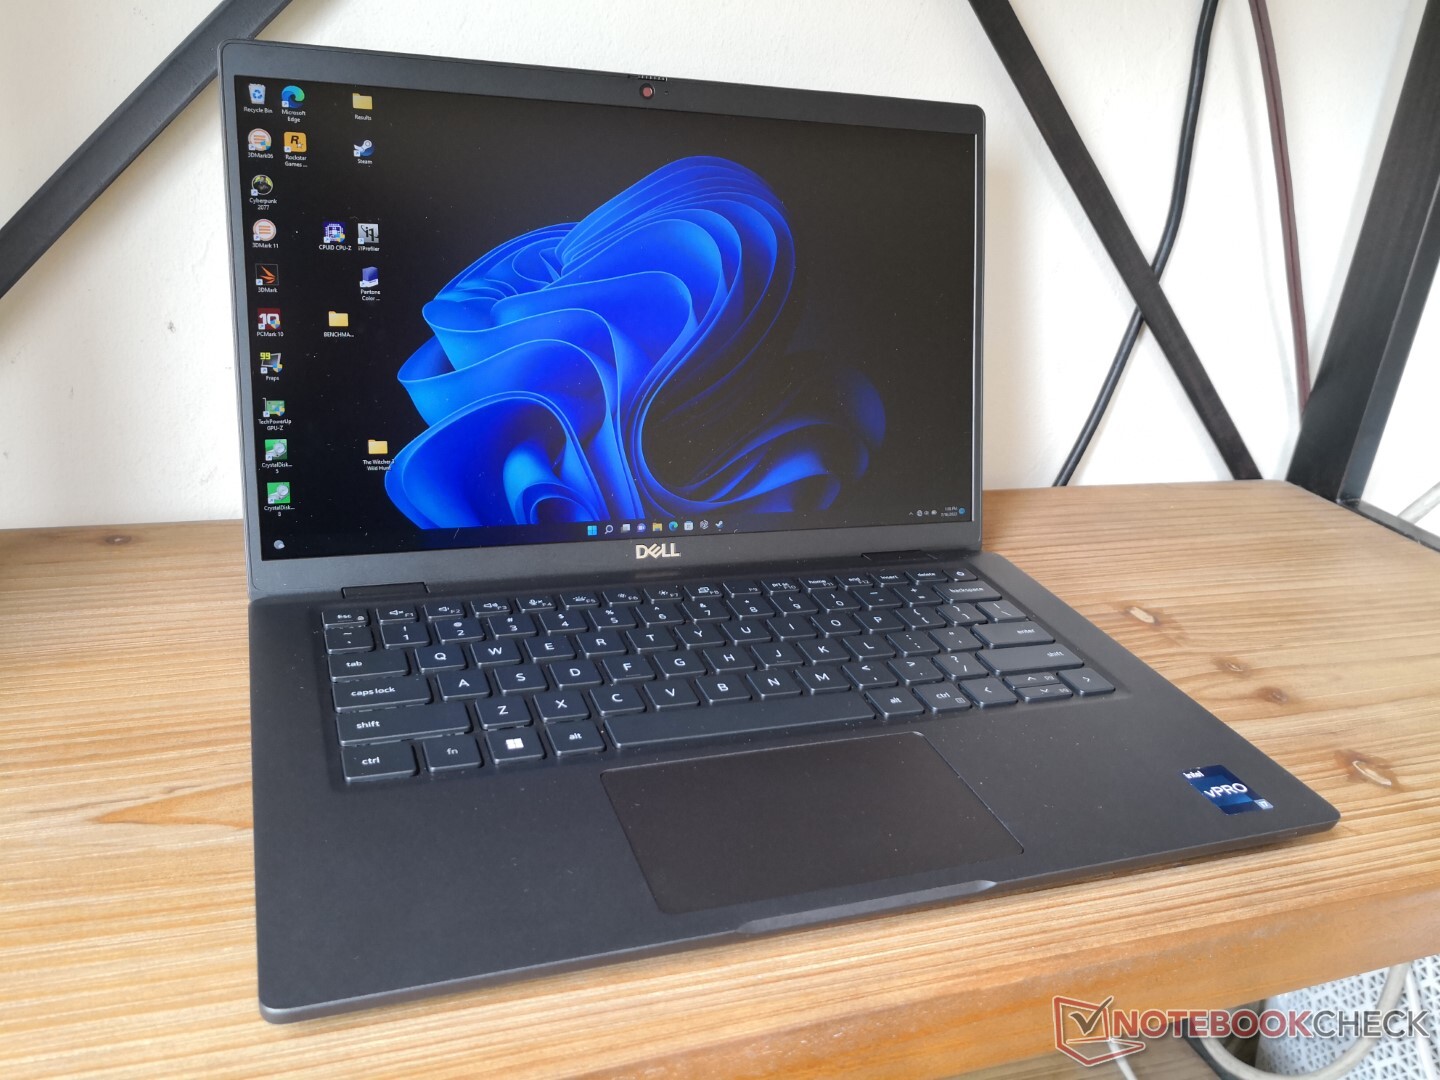
O peso muito baixo de apenas 1 kg é o principal ponto de venda da opção de liga de magnésio. A maioria dos sub-portáteis nesta categoria de tamanho são tipicamente algumas centenas de gramas mais pesados para serem muito perceptíveis quando se viaja ou se trabalha em movimento. As dimensões gerais são apenas um pouco menores do que com o Latitude 7310 que já era bastante pequena
Optar pelas opções de fibra de carbono ou alumínio implicará, ao invés disso, um aumento de peso de cerca de 160 g e 240 g, respectivamente, em relação à nossa opção de magnésio.
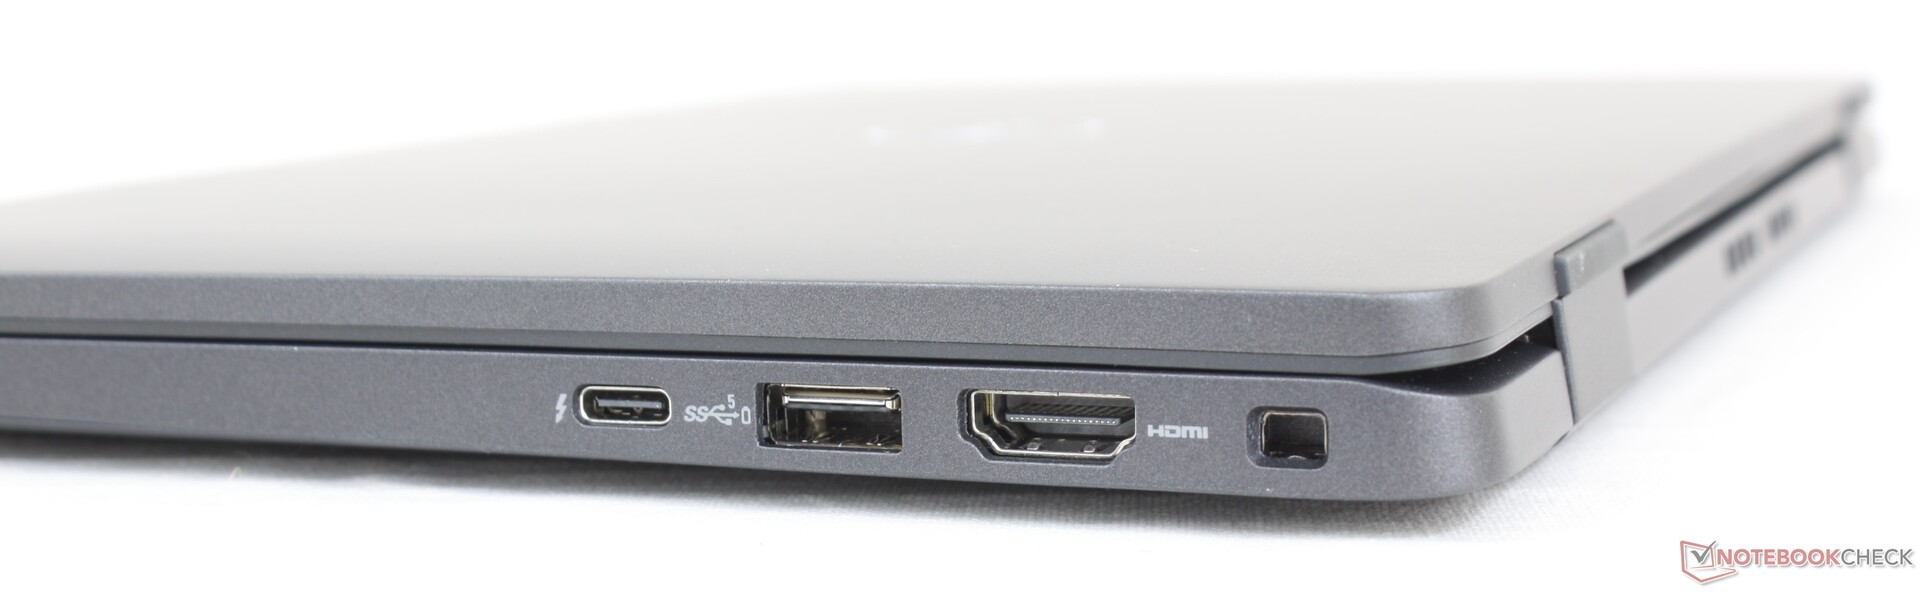
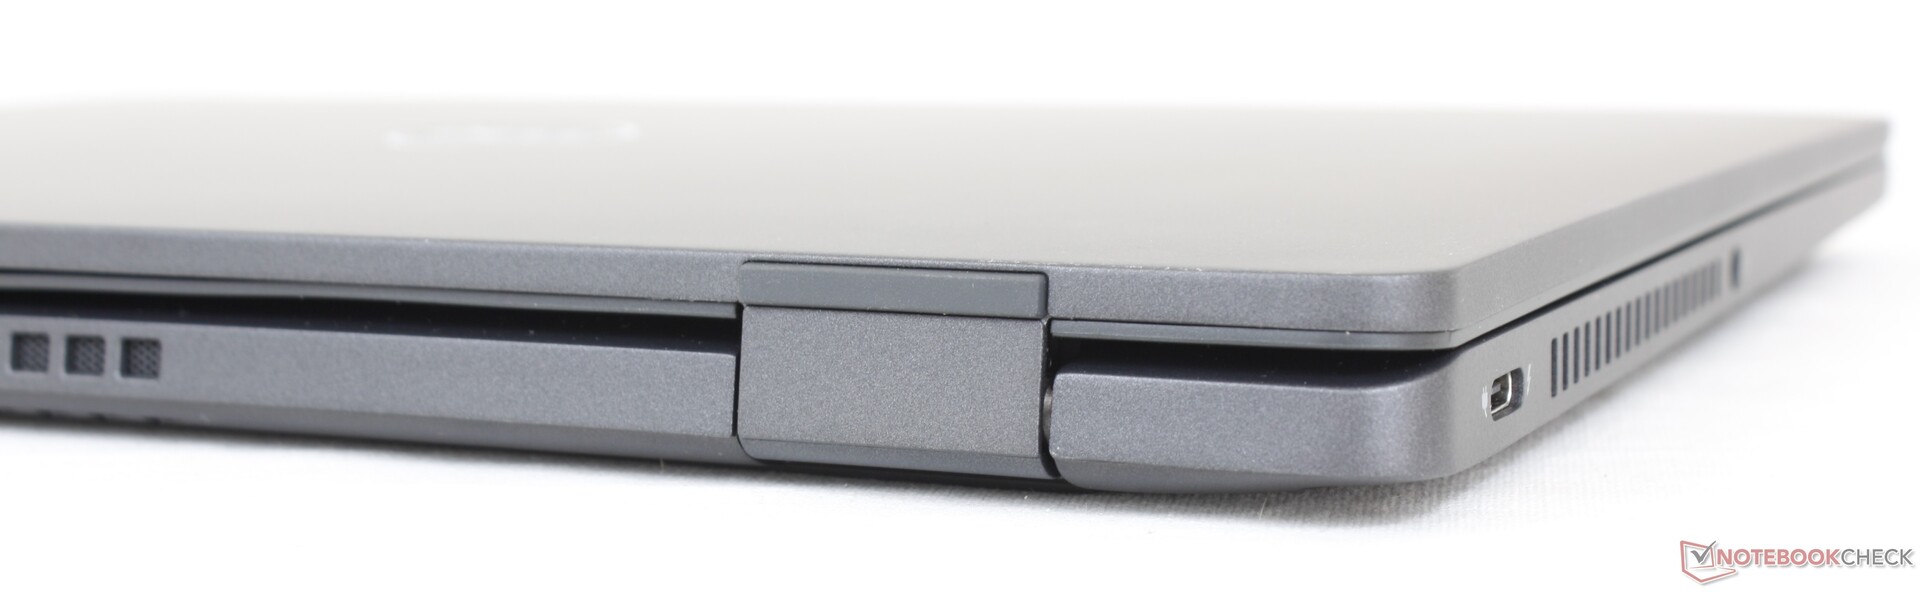
Conectividade - Suporte Thunderbolt 4
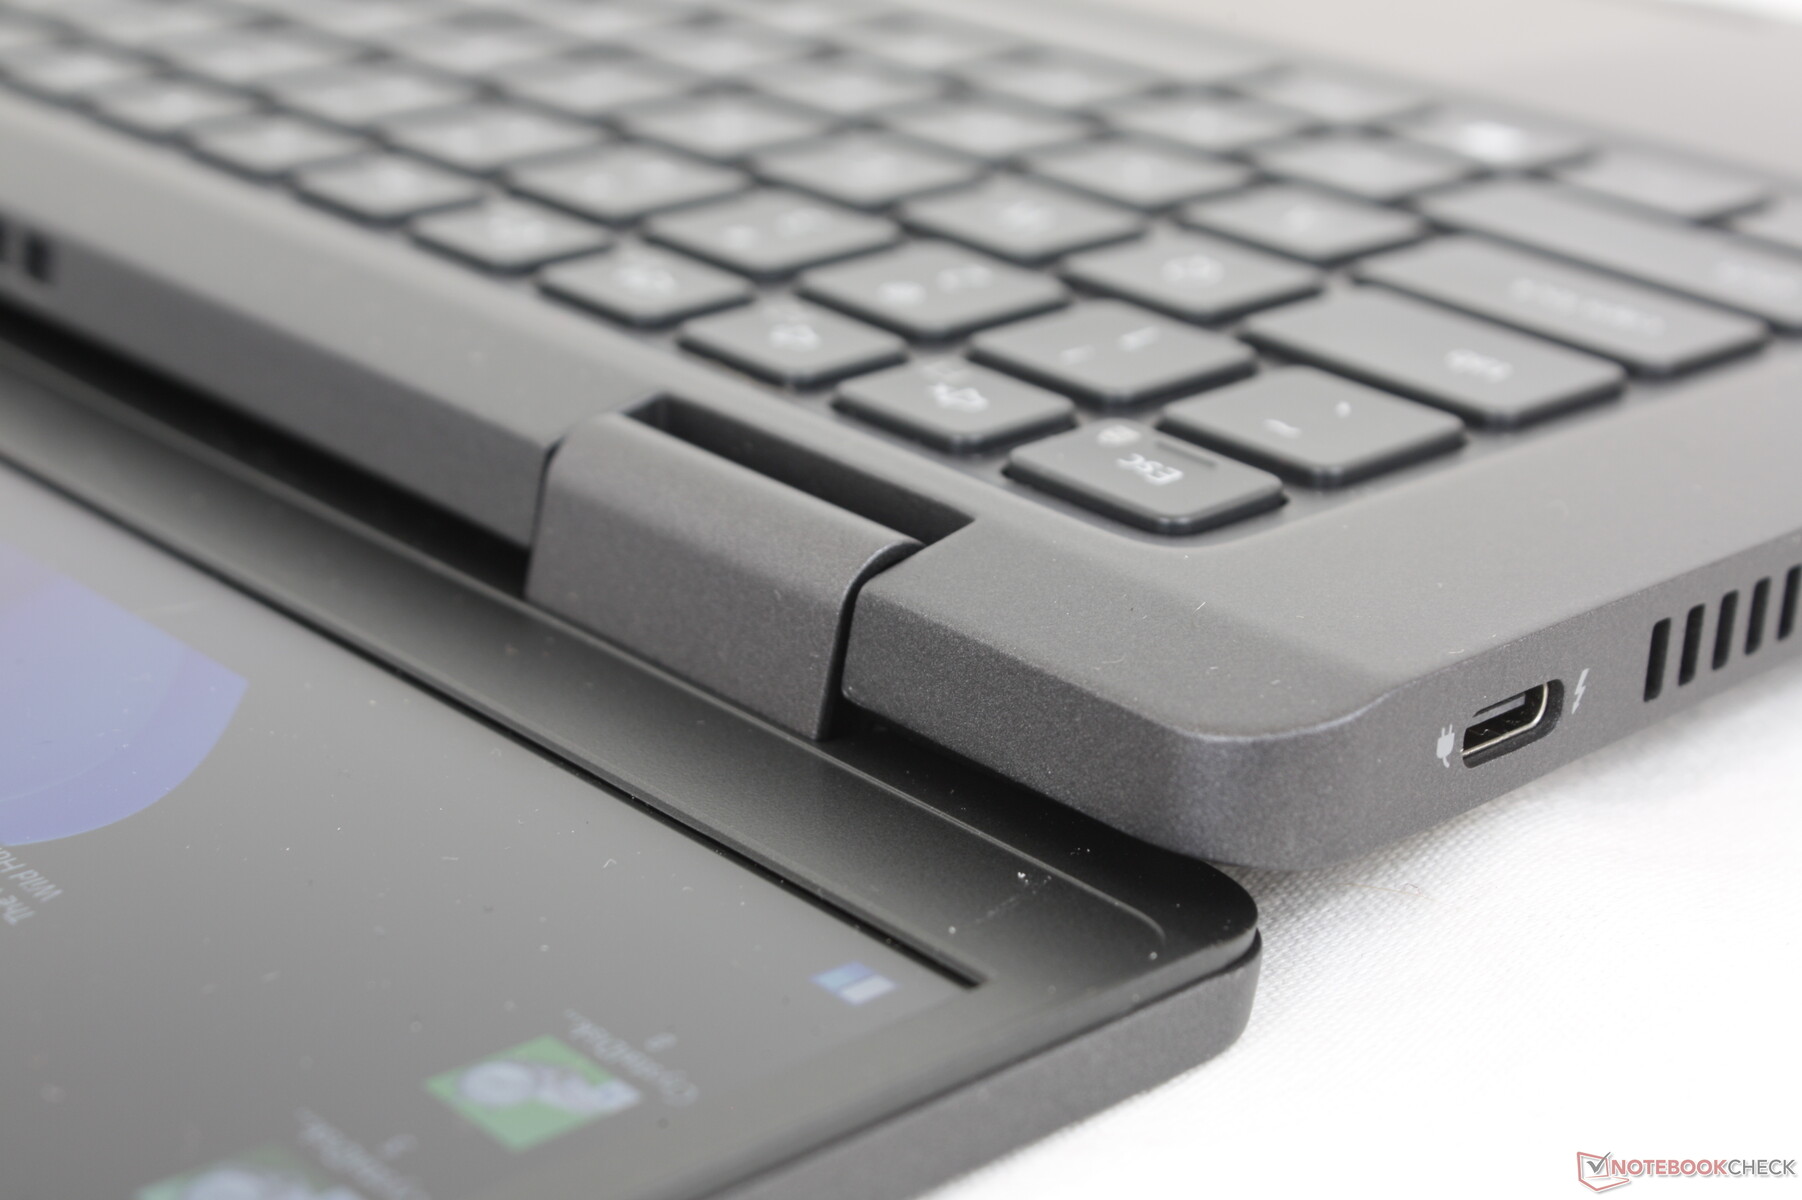
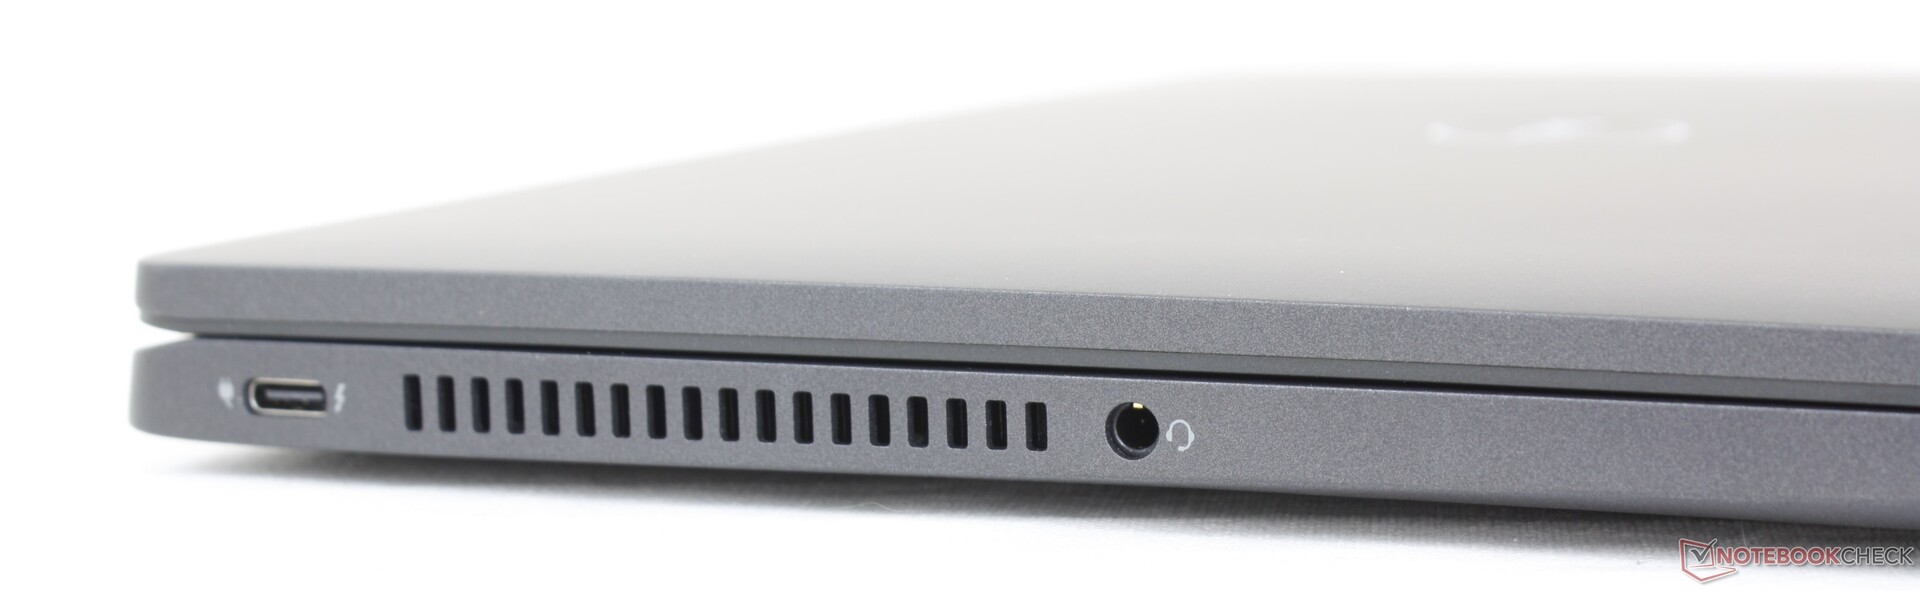
As opções de porta são as mesmas que estavam no Latitude 7310, mas reordenadas para melhorar a conveniência. As duas portas USB-C, por exemplo, estão agora cada uma ao longo das bordas esquerda e direita do chassi, respectivamente, em comparação com apenas a borda esquerda no modelo mais antigo. Esta mudança permite que os usuários carreguem o laptop de ambos os lados.
Comunicação - LTE Opcional
O Intel AX211 vem como padrão para conectividade Wi-Fi 6E e Bluetooth 5.2. Não tivemos grandes problemas de conectividade quando acoplados à nossa rede de 6 GHz. As diferenças de desempenho entre Wi-Fi 6 e Wi-Fi 6E serão mínimas para a maioria dos usuários.
Embora nossa unidade não venha configurada com WAN, os usuários têm que optar por configurar com um módulo Qualcomm Snapdragon X20 LTE-A CAT 9 ou CAT 16 habilitado para eSIM.
| Networking | |
| iperf3 transmit AX12 | |
| Microsoft Surface Laptop 4 13 Ryzen 5 | |
| Dell Latitude 7310 | |
| Razer Book 13 FHD | |
| Lenovo ThinkPad X13 Yoga 20SX0004GE | |
| iperf3 receive AX12 | |
| Razer Book 13 FHD | |
| Microsoft Surface Laptop 4 13 Ryzen 5 | |
| Dell Latitude 7310 | |
| Lenovo ThinkPad X13 Yoga 20SX0004GE | |
| iperf3 receive AXE11000 6GHz | |
| Framework Laptop 13.5 12th Gen Intel | |
| Dell Latitude 13 7330 | |
| iperf3 transmit AXE11000 6GHz | |
| Dell Latitude 13 7330 | |
| Framework Laptop 13.5 12th Gen Intel | |
Webcam
Os usuários podem configurar entre uma webcam HD (720p) ou FHD (1080p) com suporte opcional IR para Windows Olá. Recomendamos a atualização para 1080p, pois a qualidade de imagem de nossa configuração 720p é borrada e brutalmente desatualizada.
Um deslizador de obturador manual é instalado para privacidade.


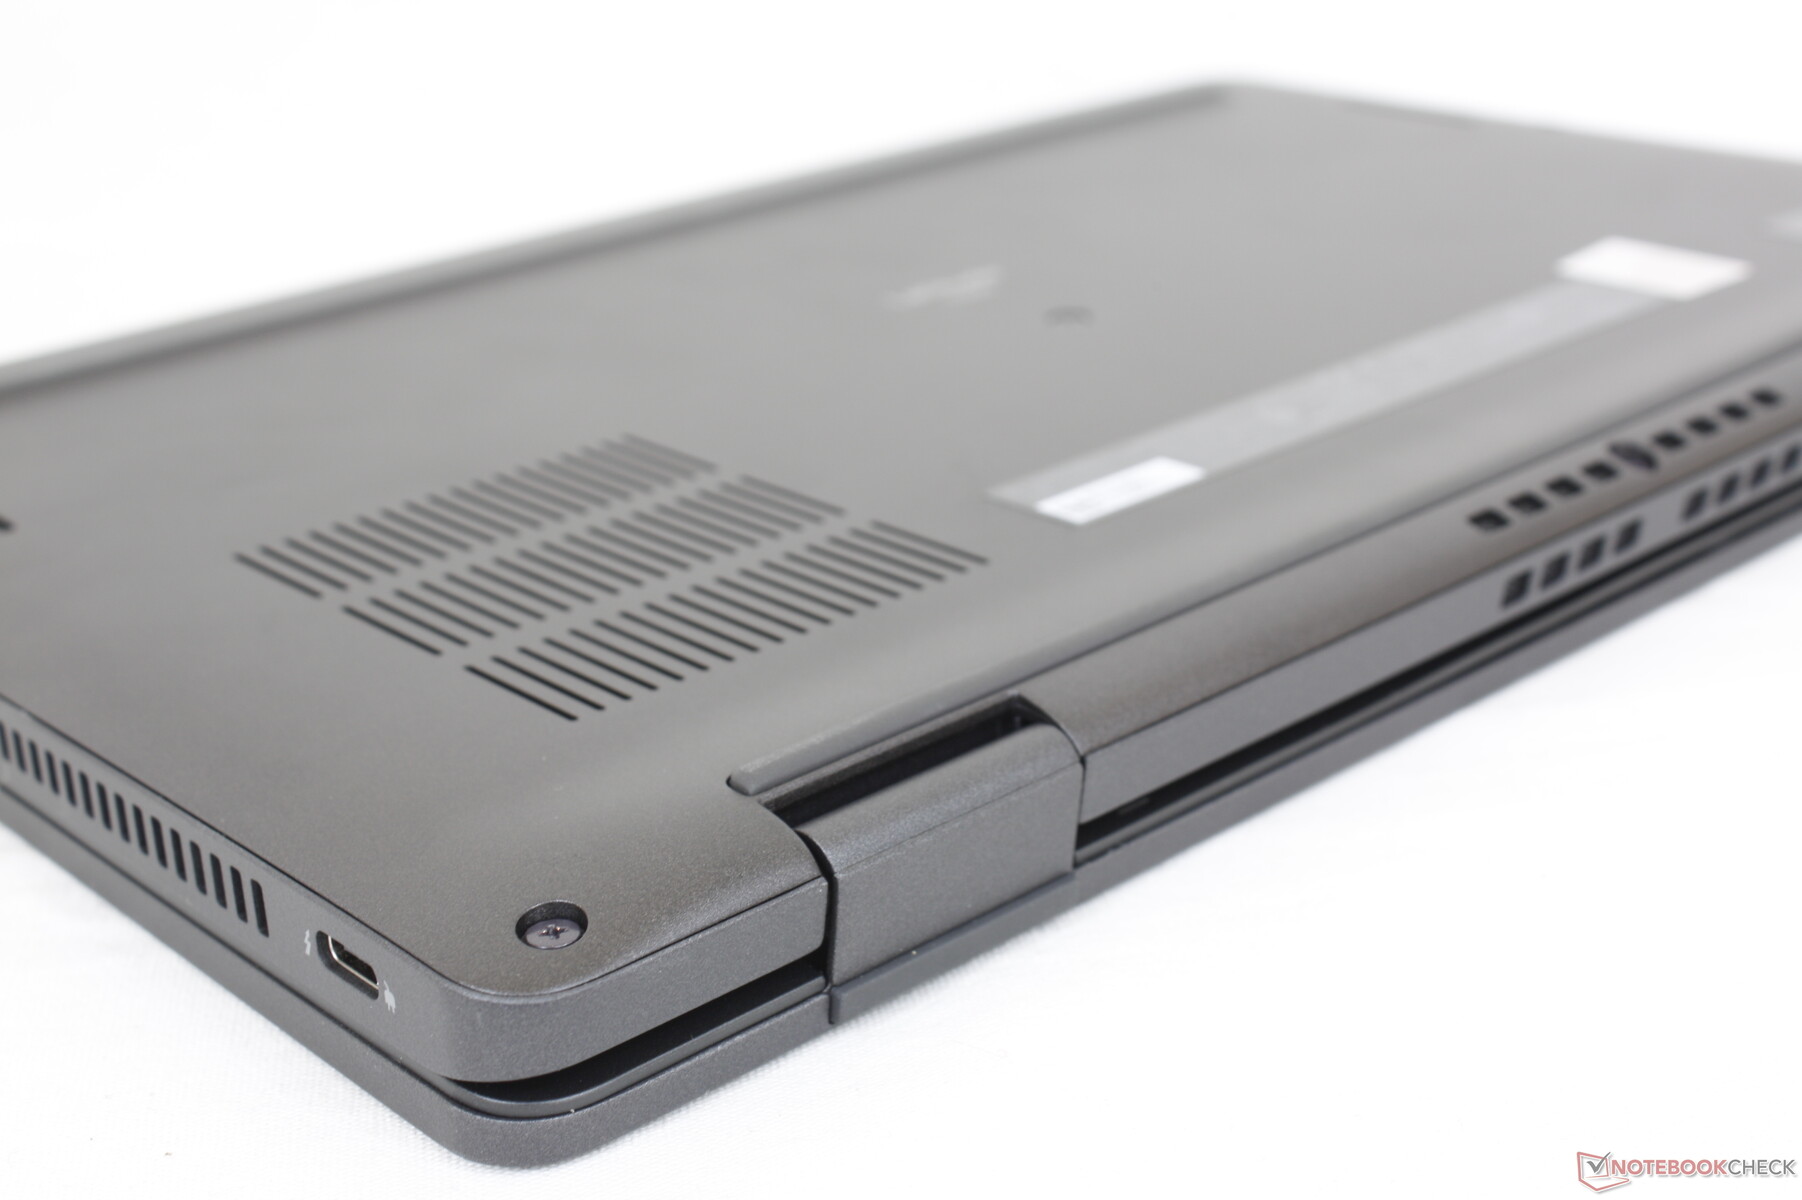
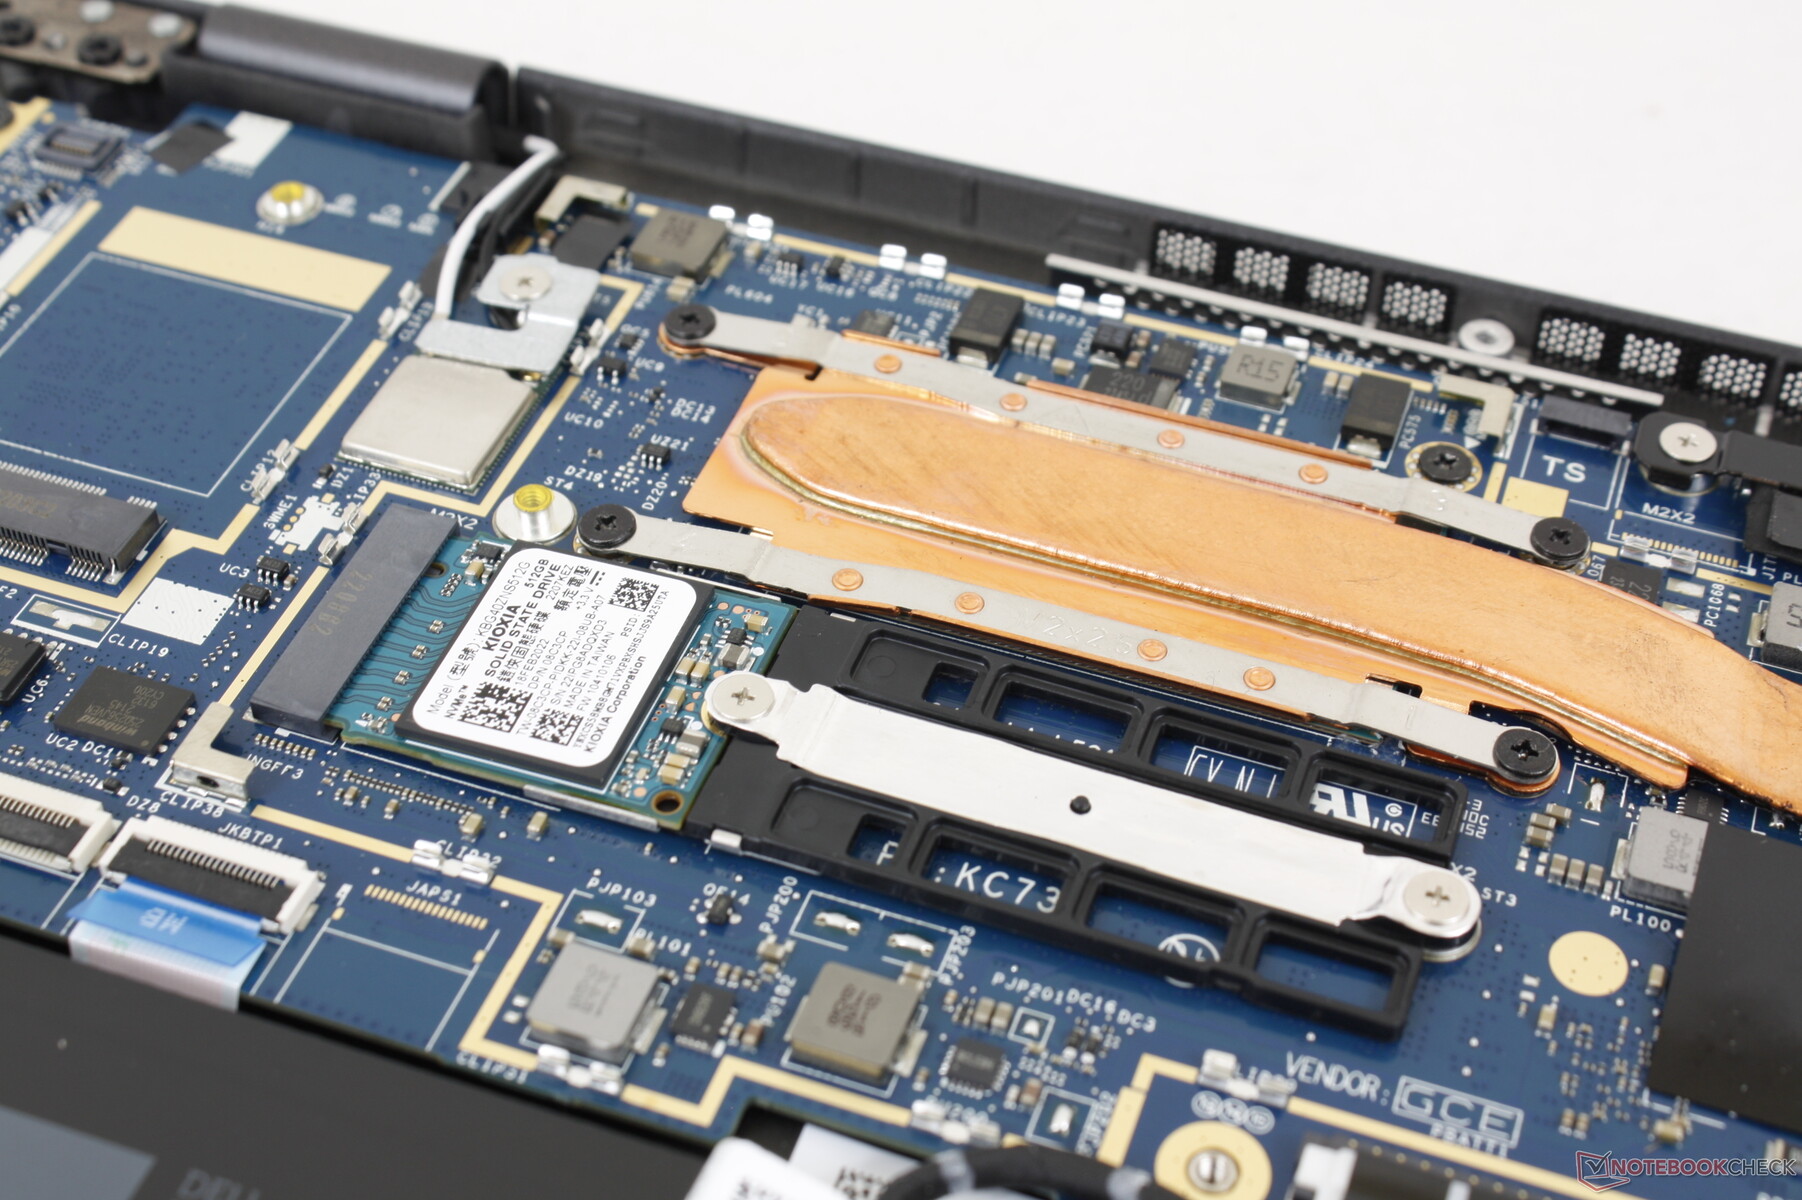
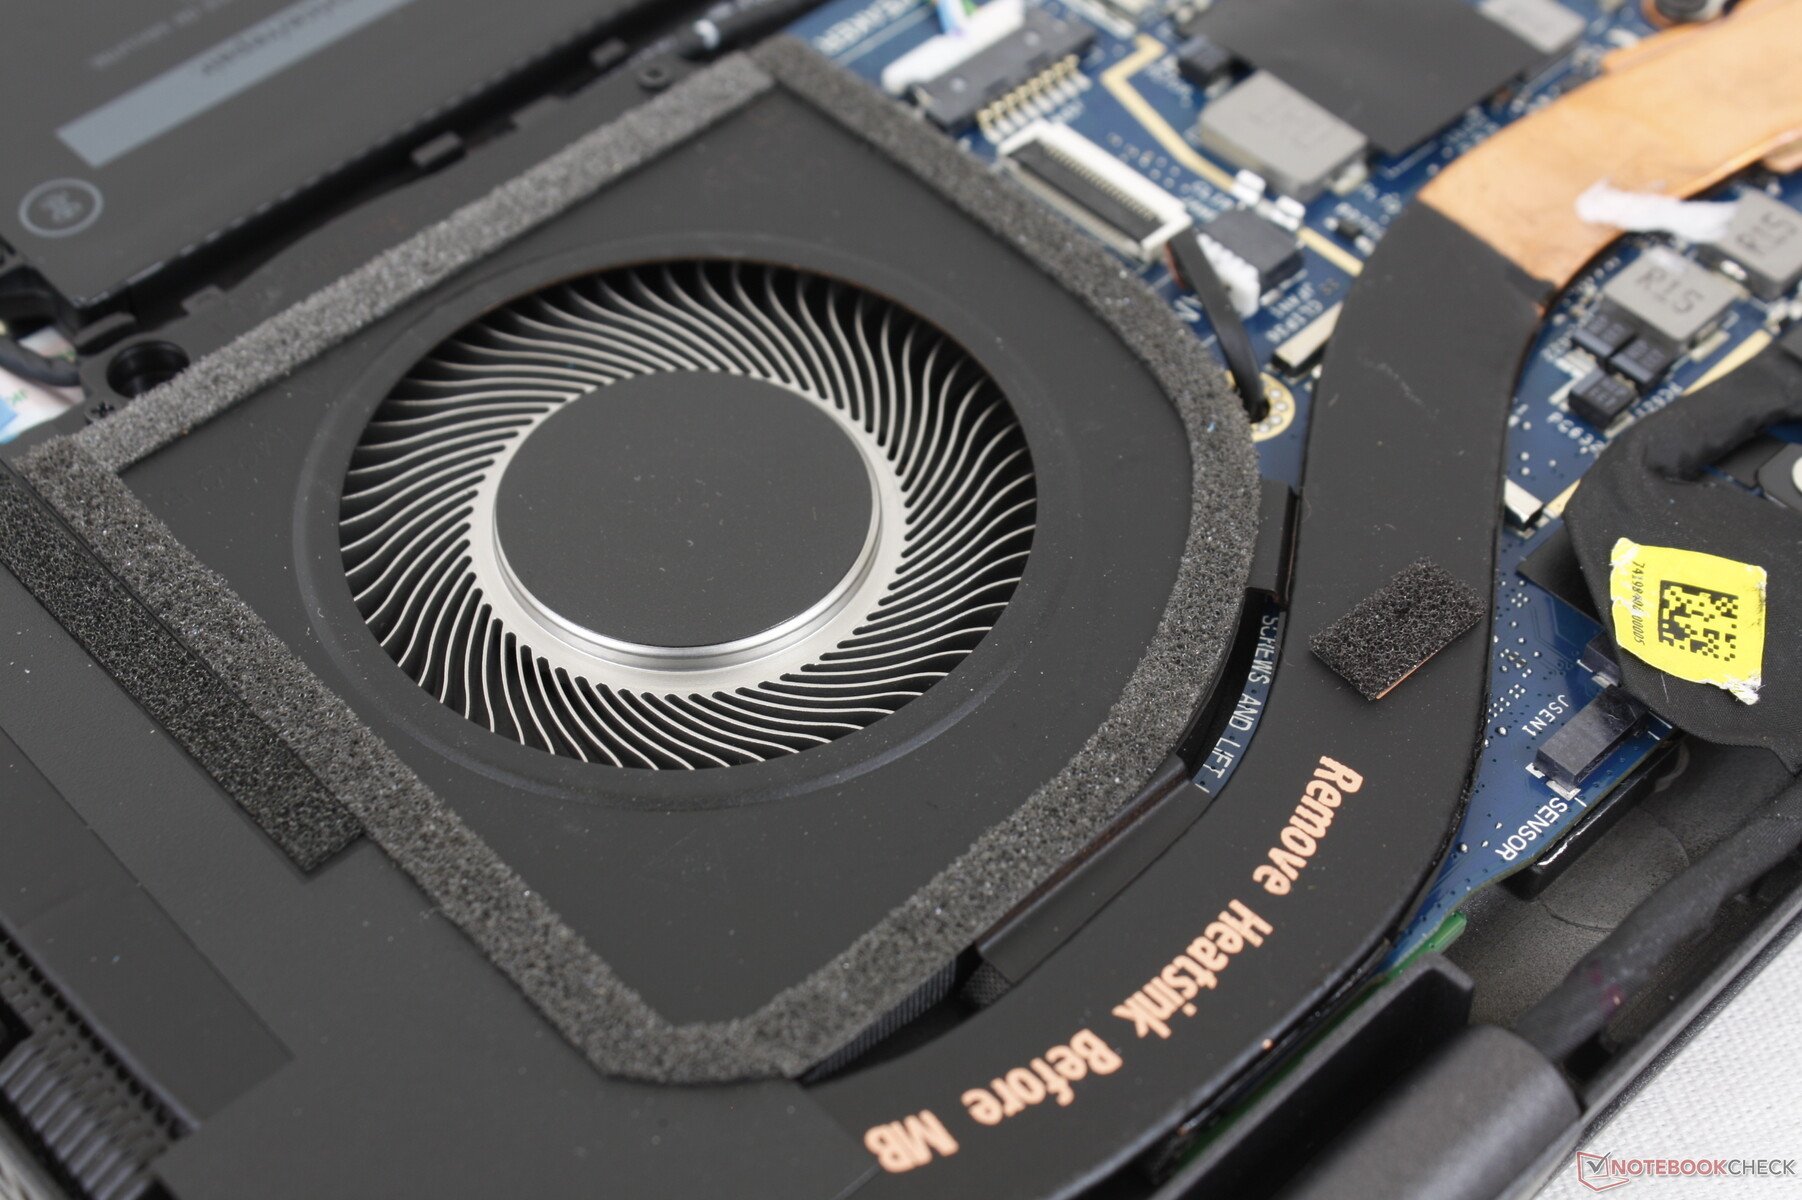
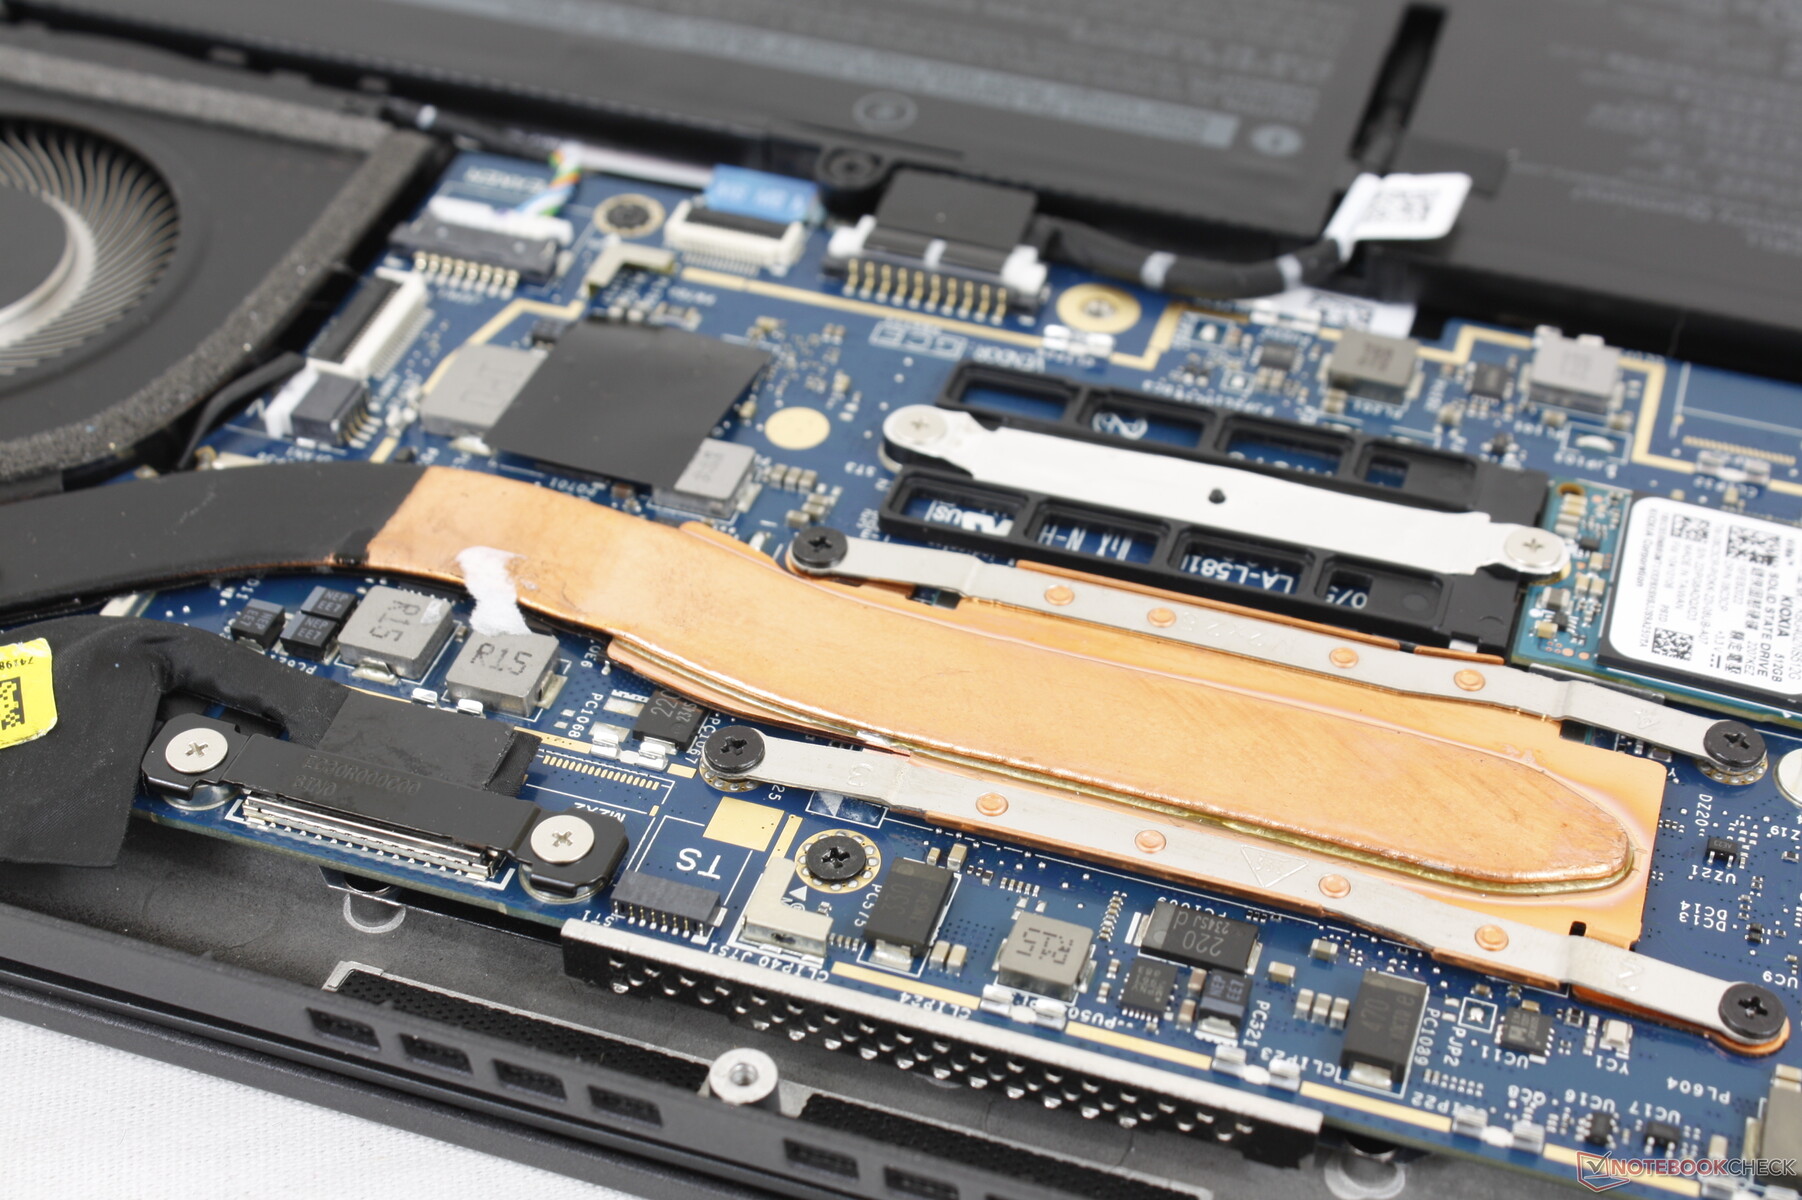
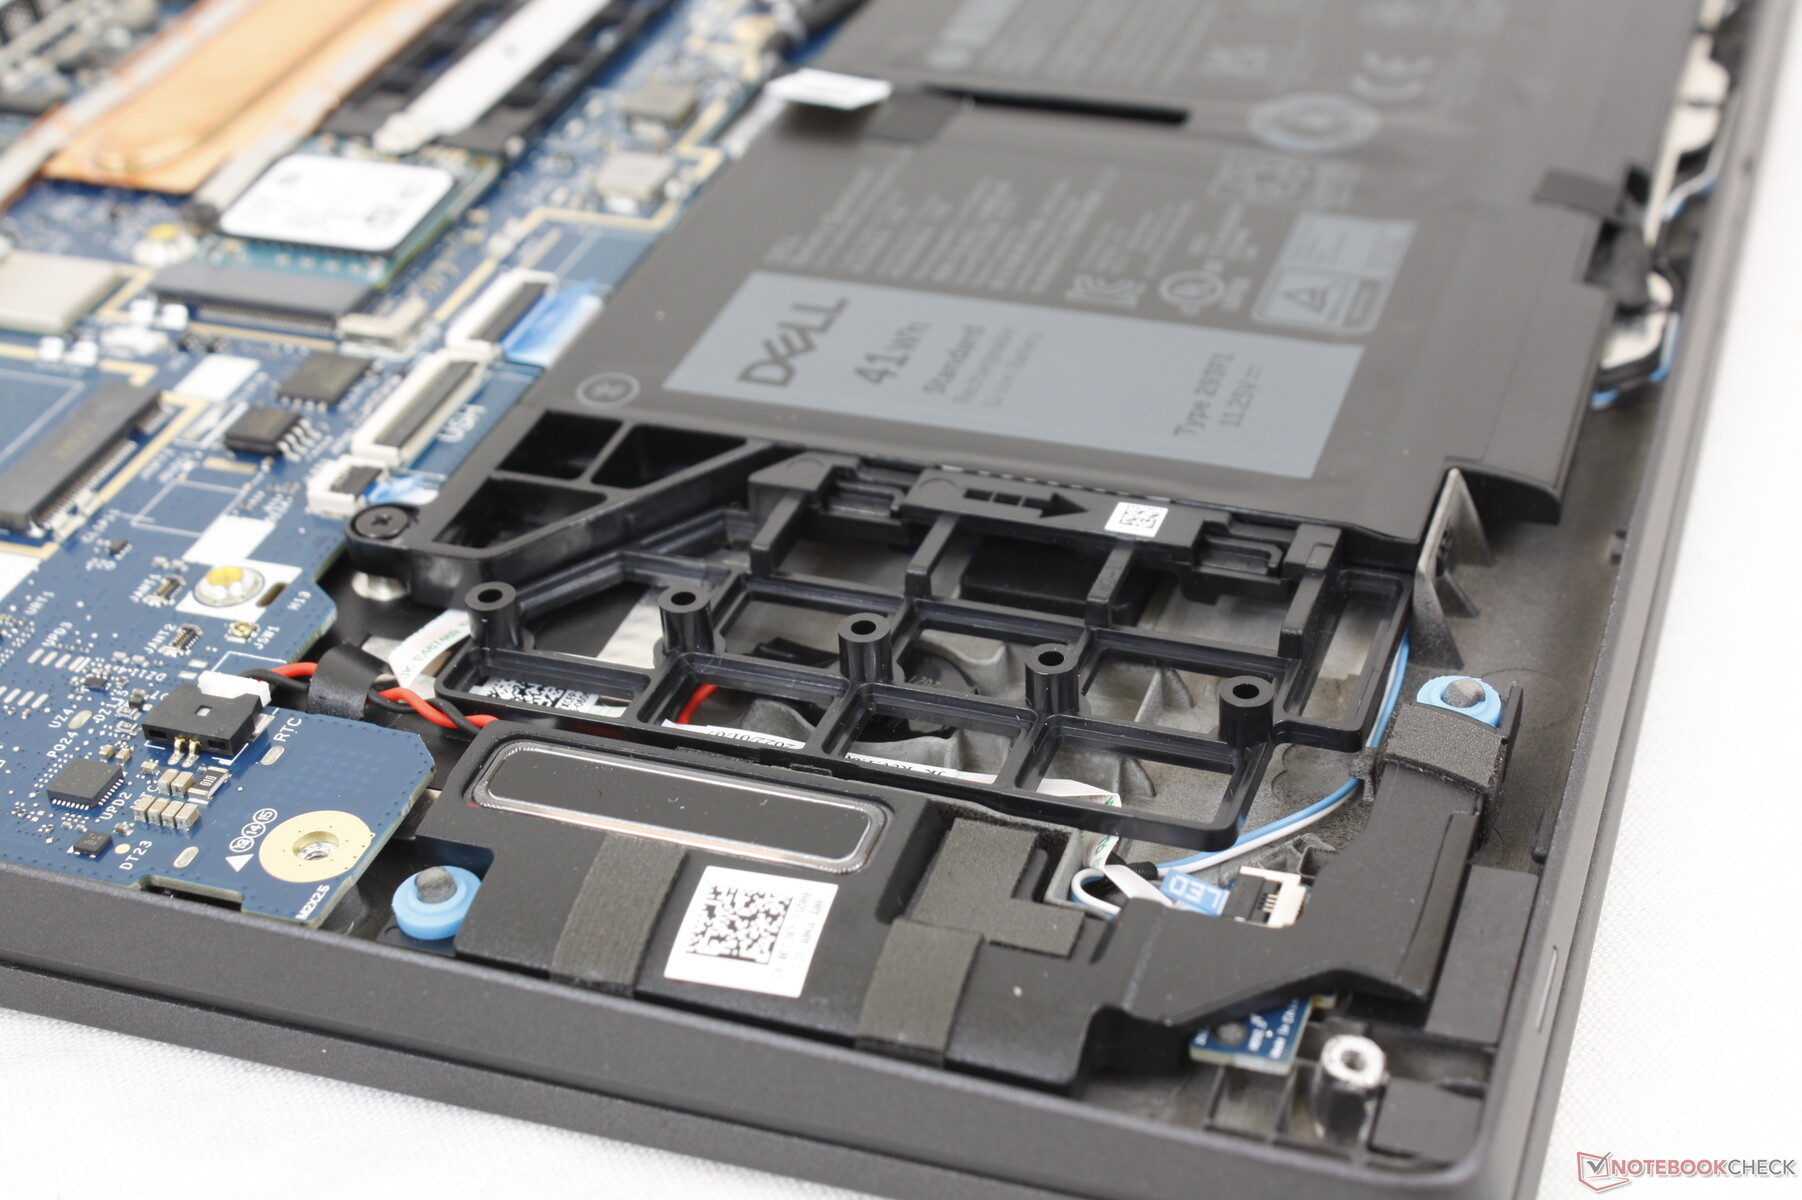
Manutenção
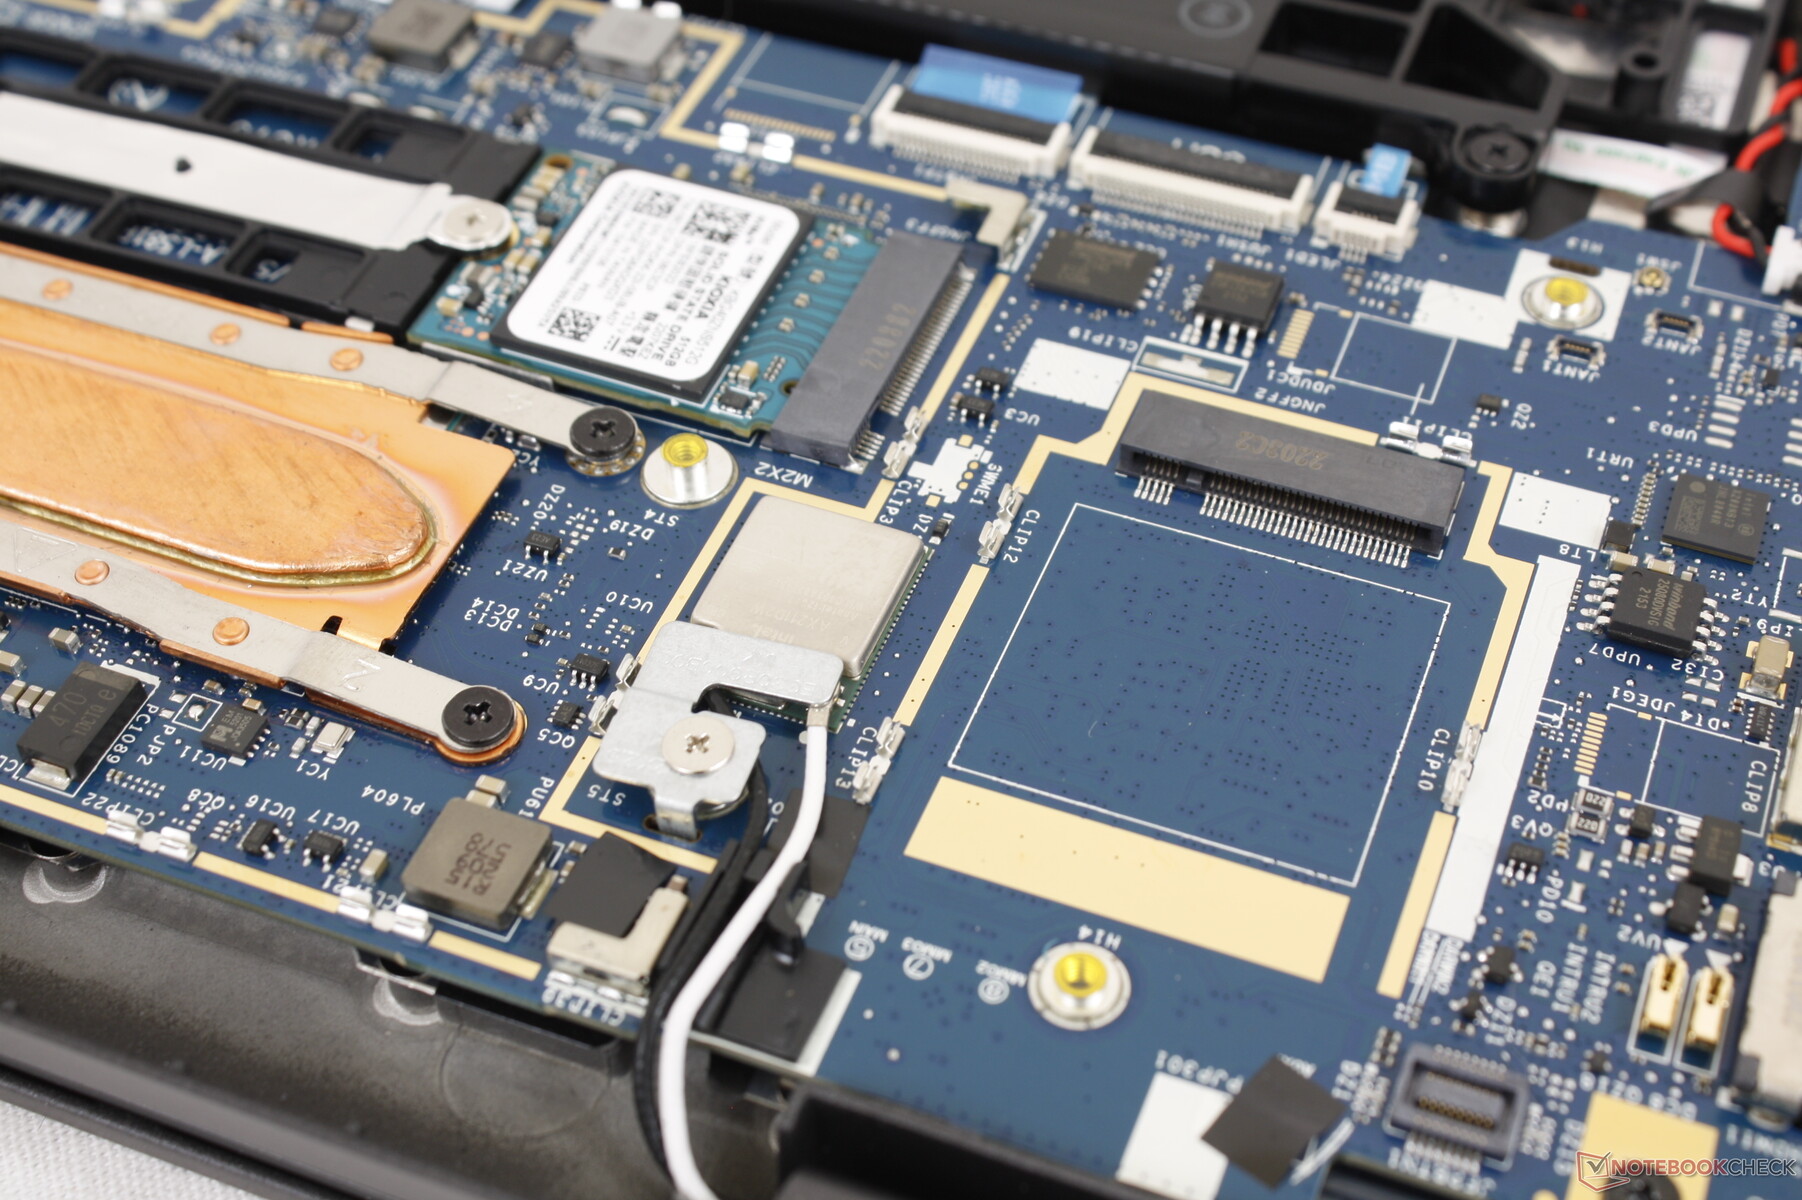
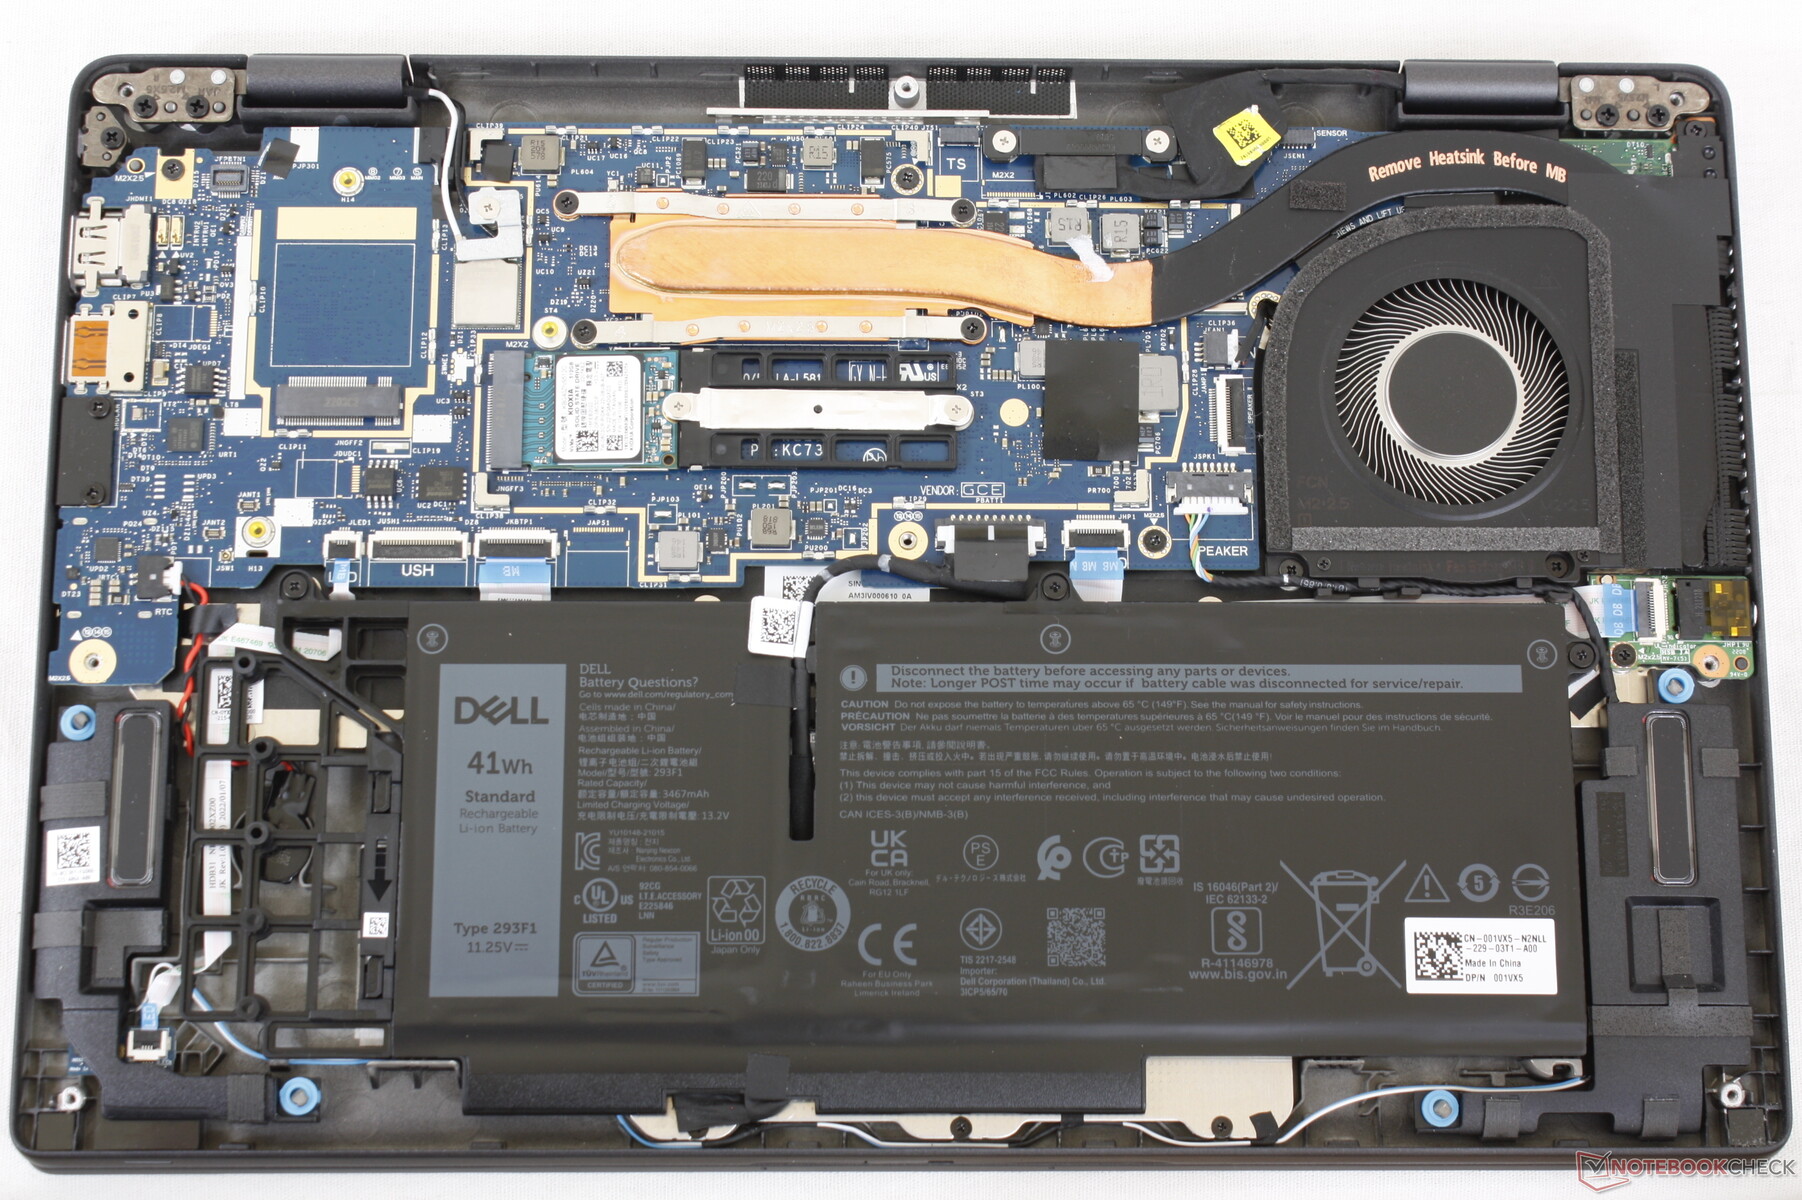
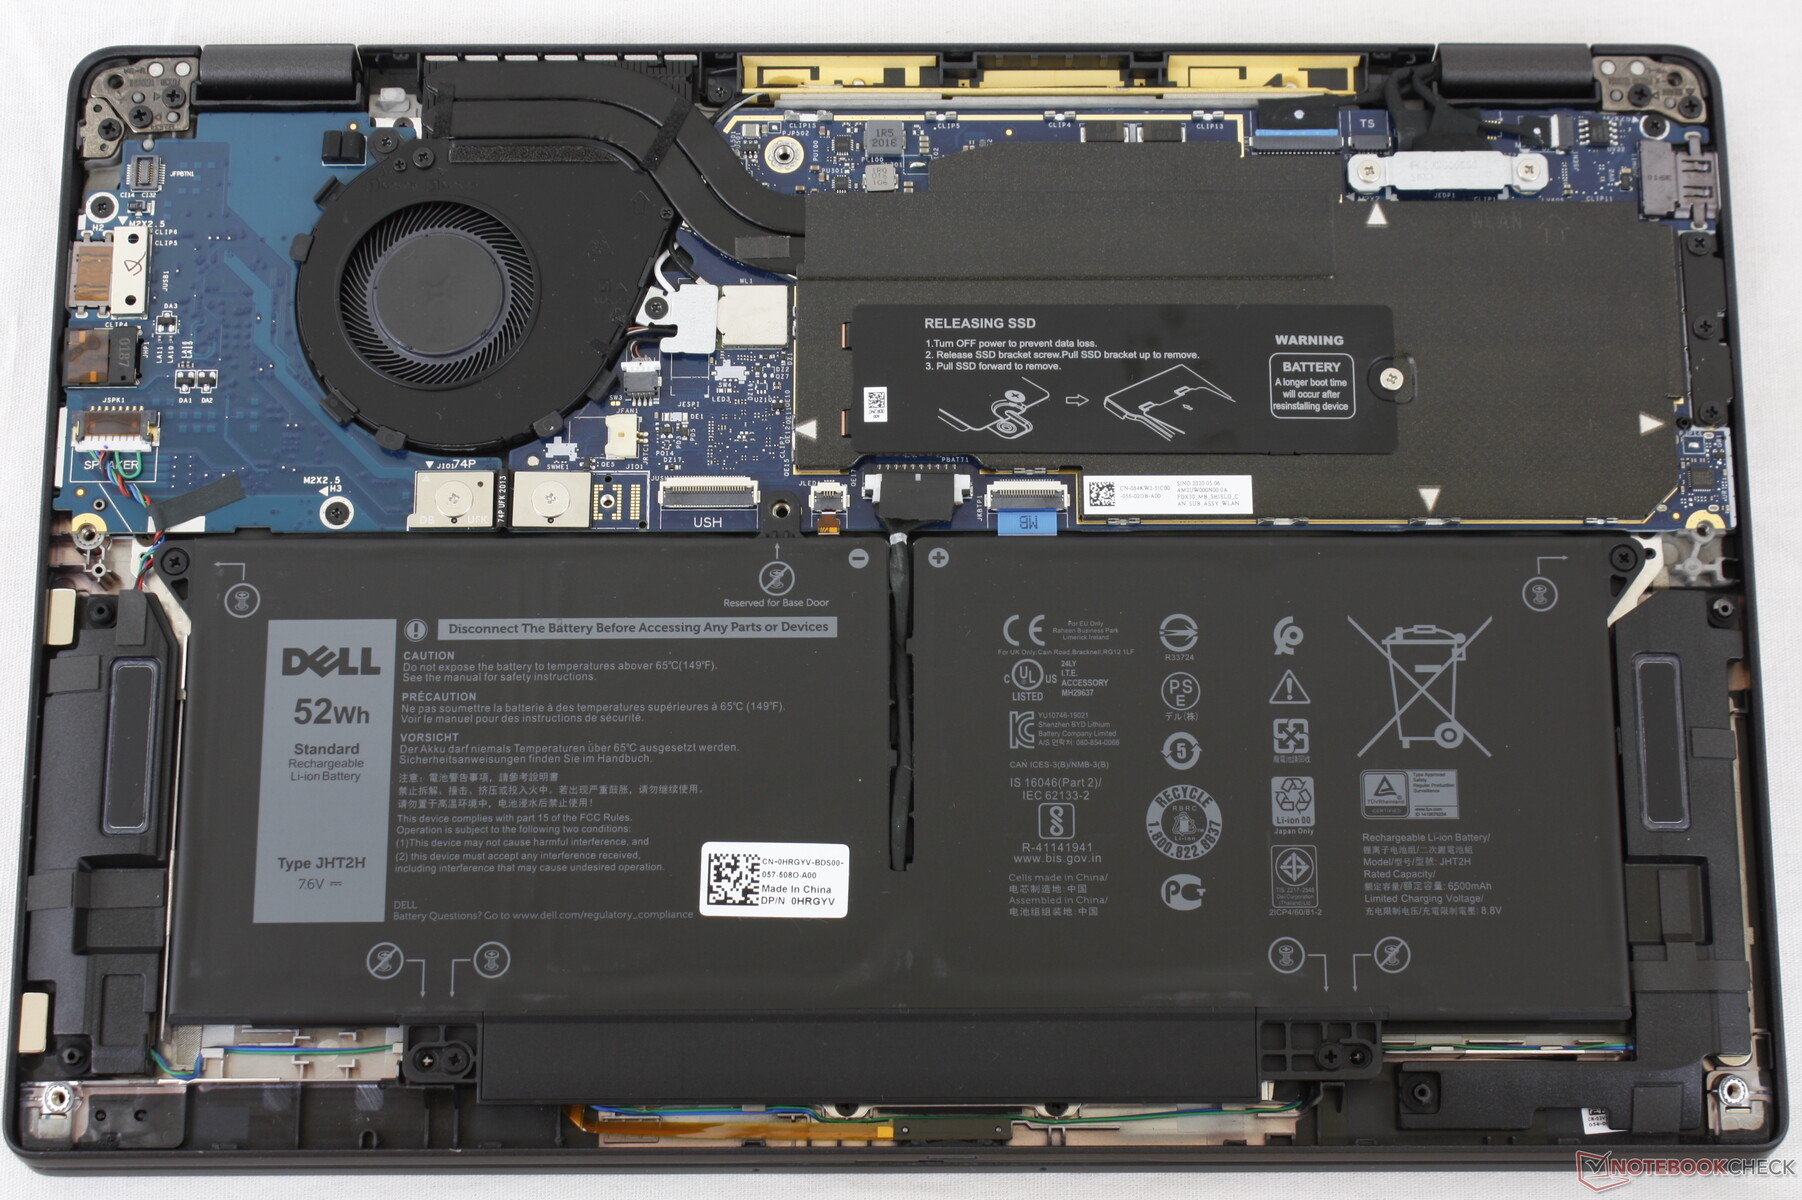
O painel inferior é facilmente removível com apenas uma chave de fenda Philips. Não há muito a ser reparado além do SSD M.2 e da bateria desde que os módulos WLAN e RAM são soldados.
Note que não há nenhuma antena incluída se a configuração sem WAN for feita para desencorajar os proprietários de instalar seu próprio módulo WAN. Além disso, observe o espaço vazio à esquerda da bateria de 41 Wh para reduzir o peso; este espaço se torna ocupado se a configuração for feita com a opção maior de 58 Wh.
Acessórios e Garantia
Não há extras na caixa além do adaptador AC e da papelada. Uma garantia de três anos vem como é habitual para a maioria dos modelos Latitude.
Dispositivos de entrada - O mesmo de antes
Teclado
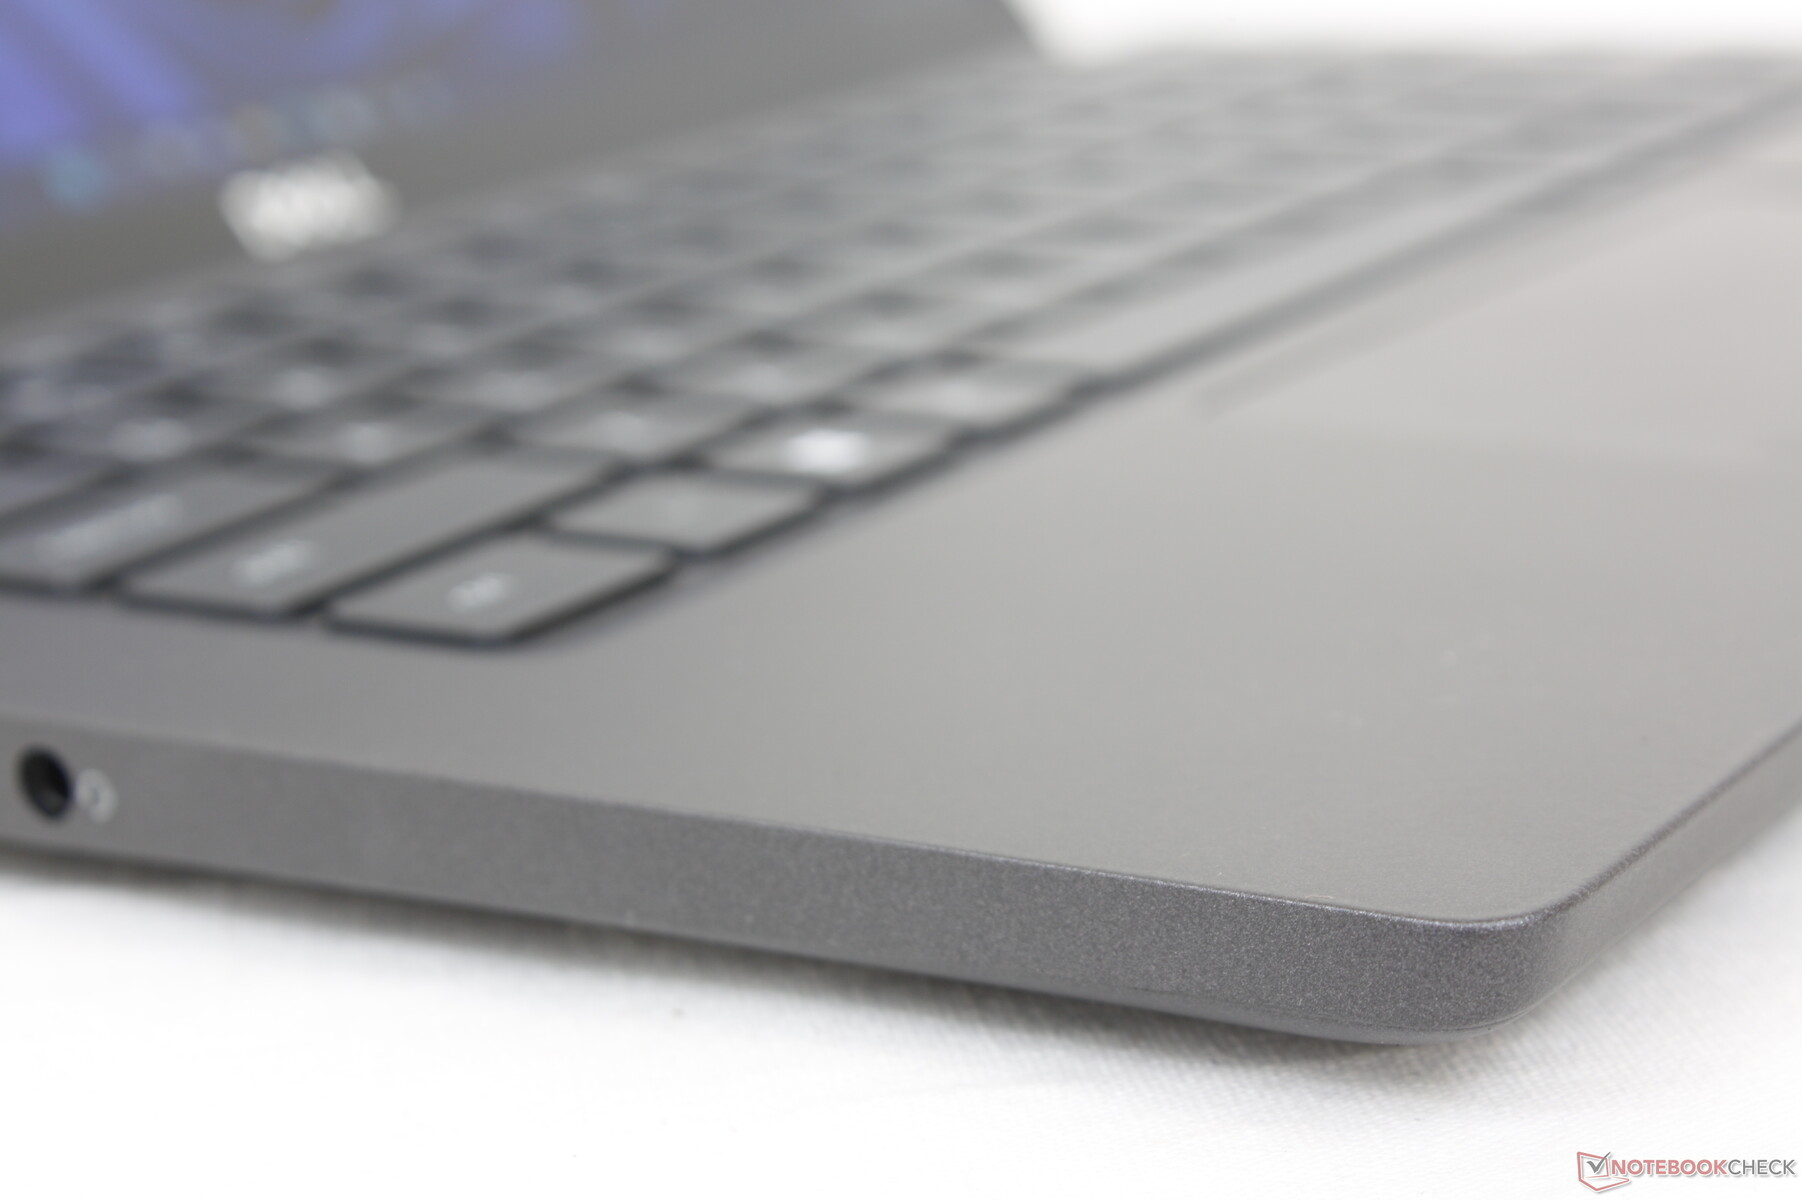
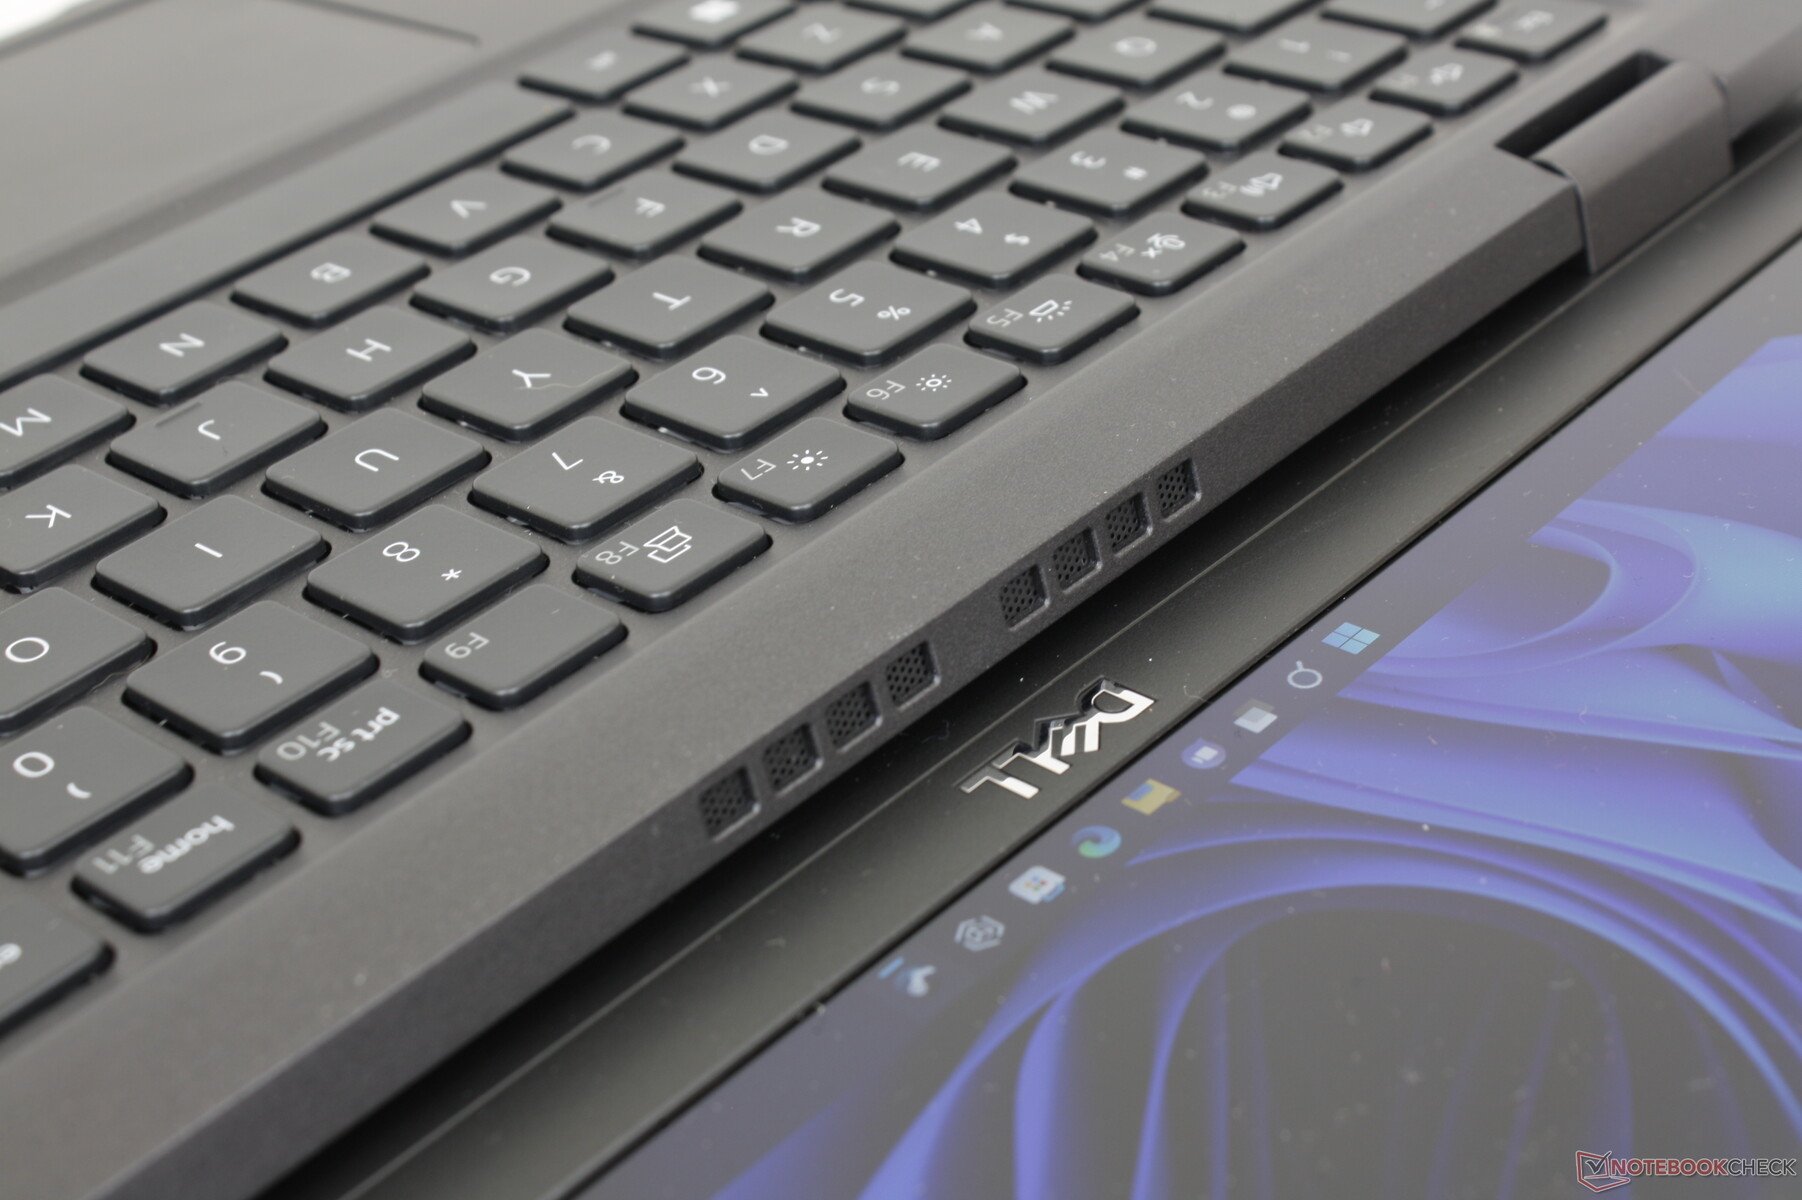
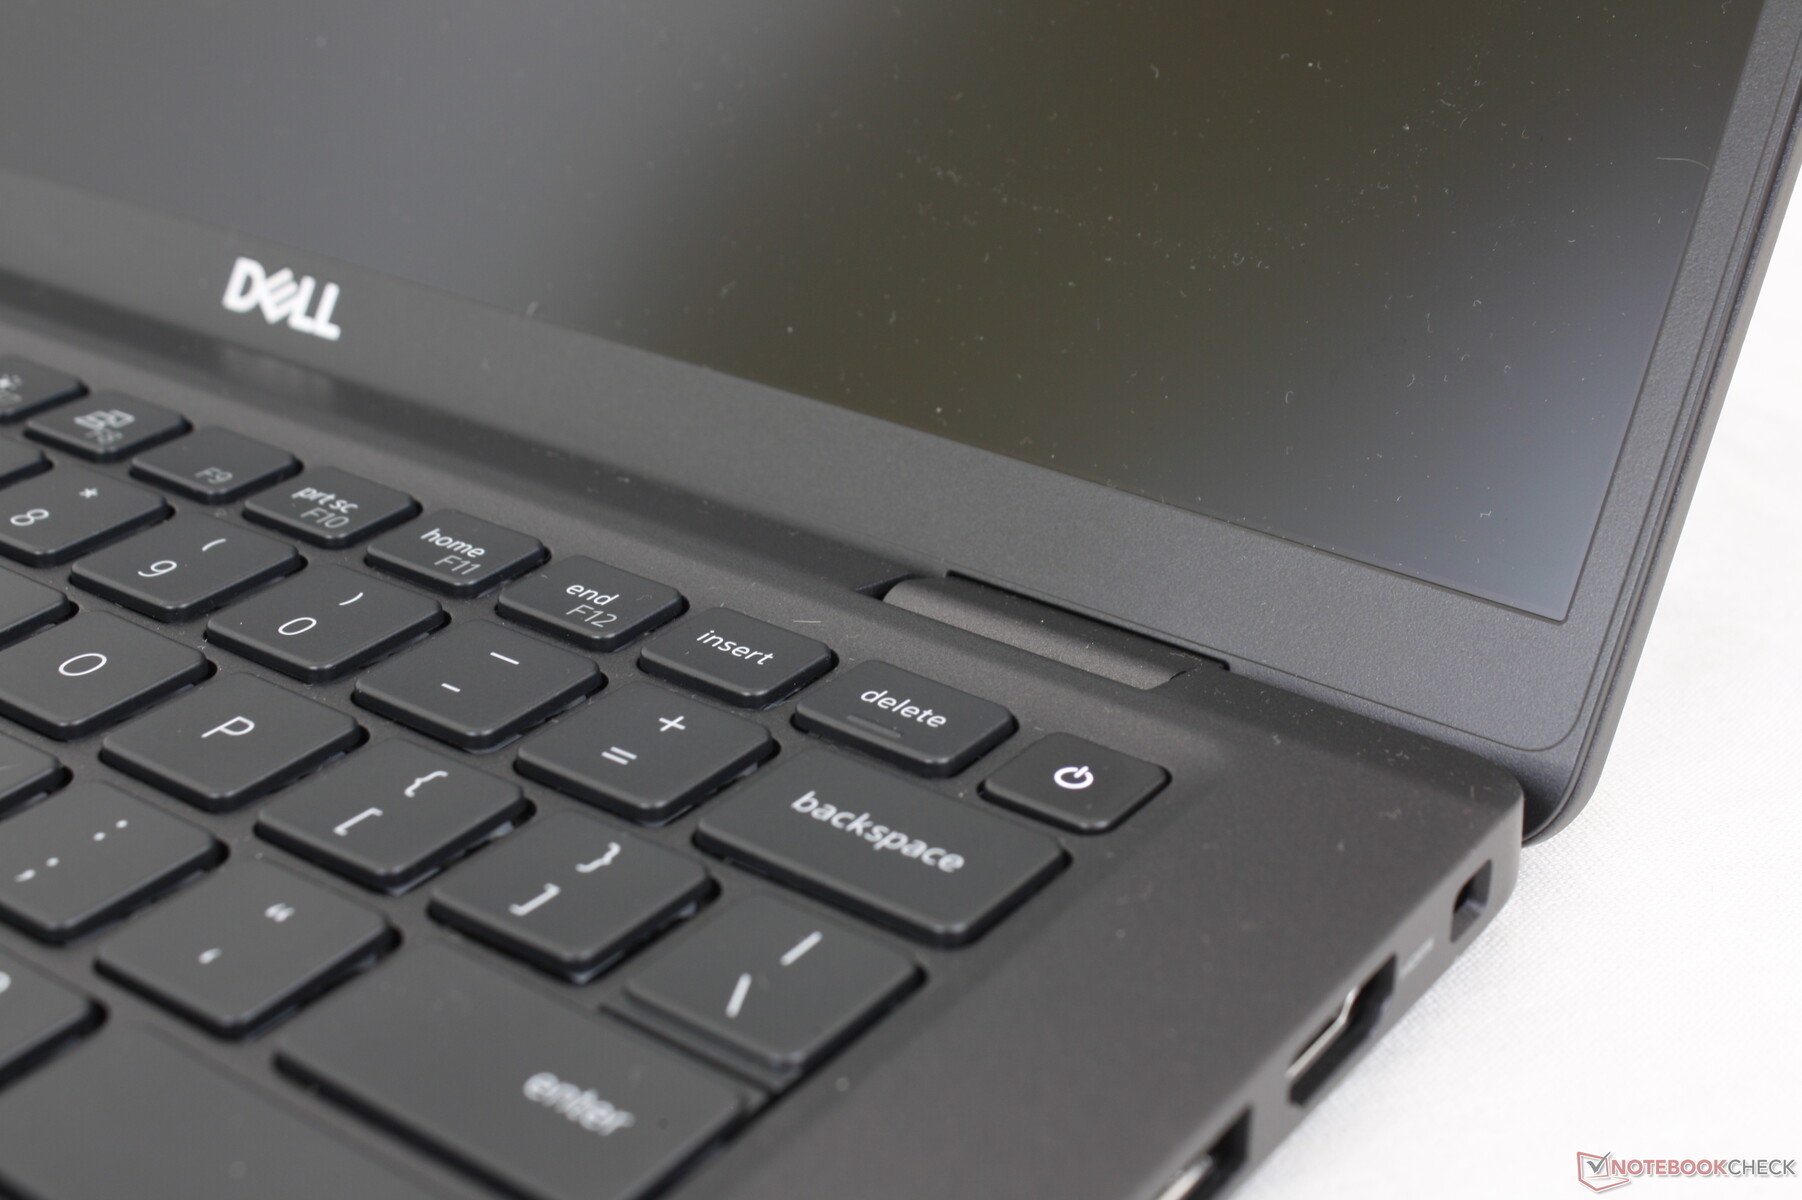
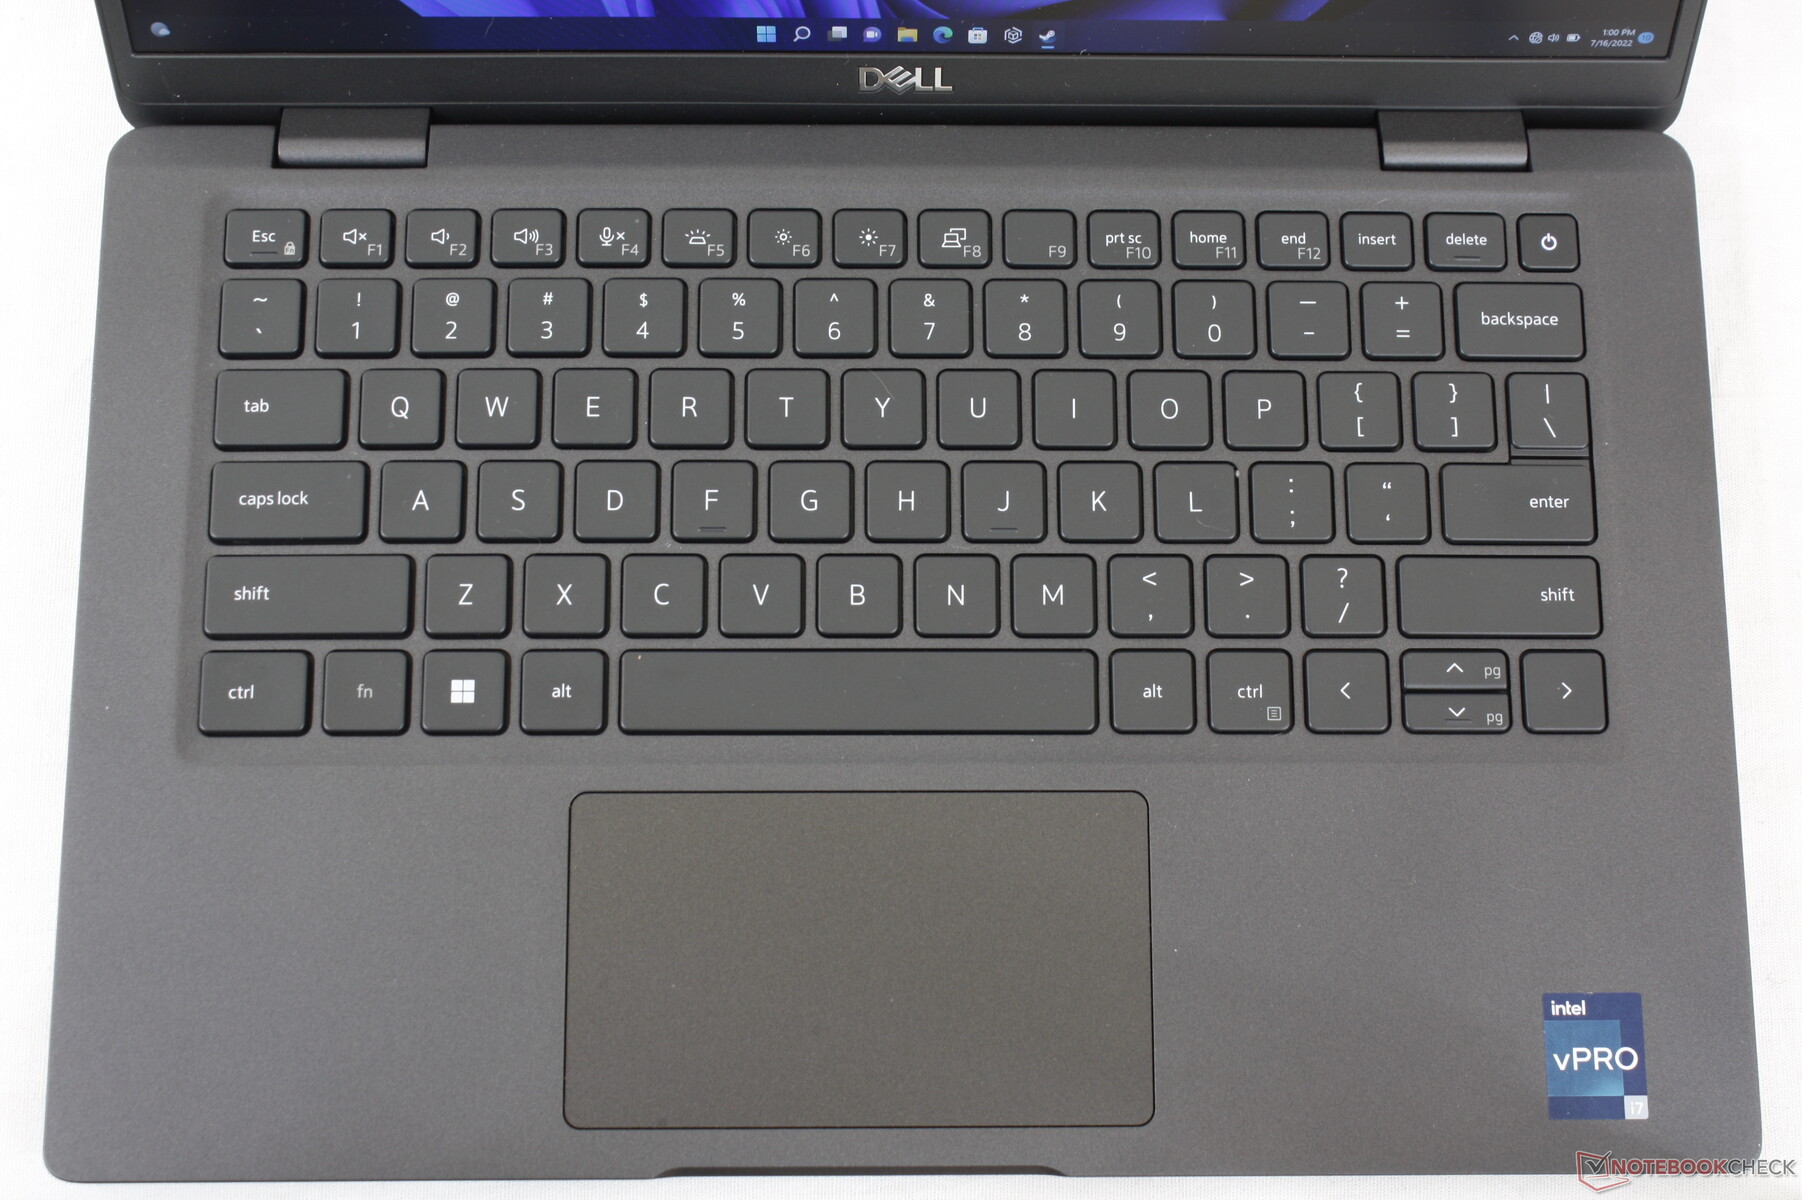
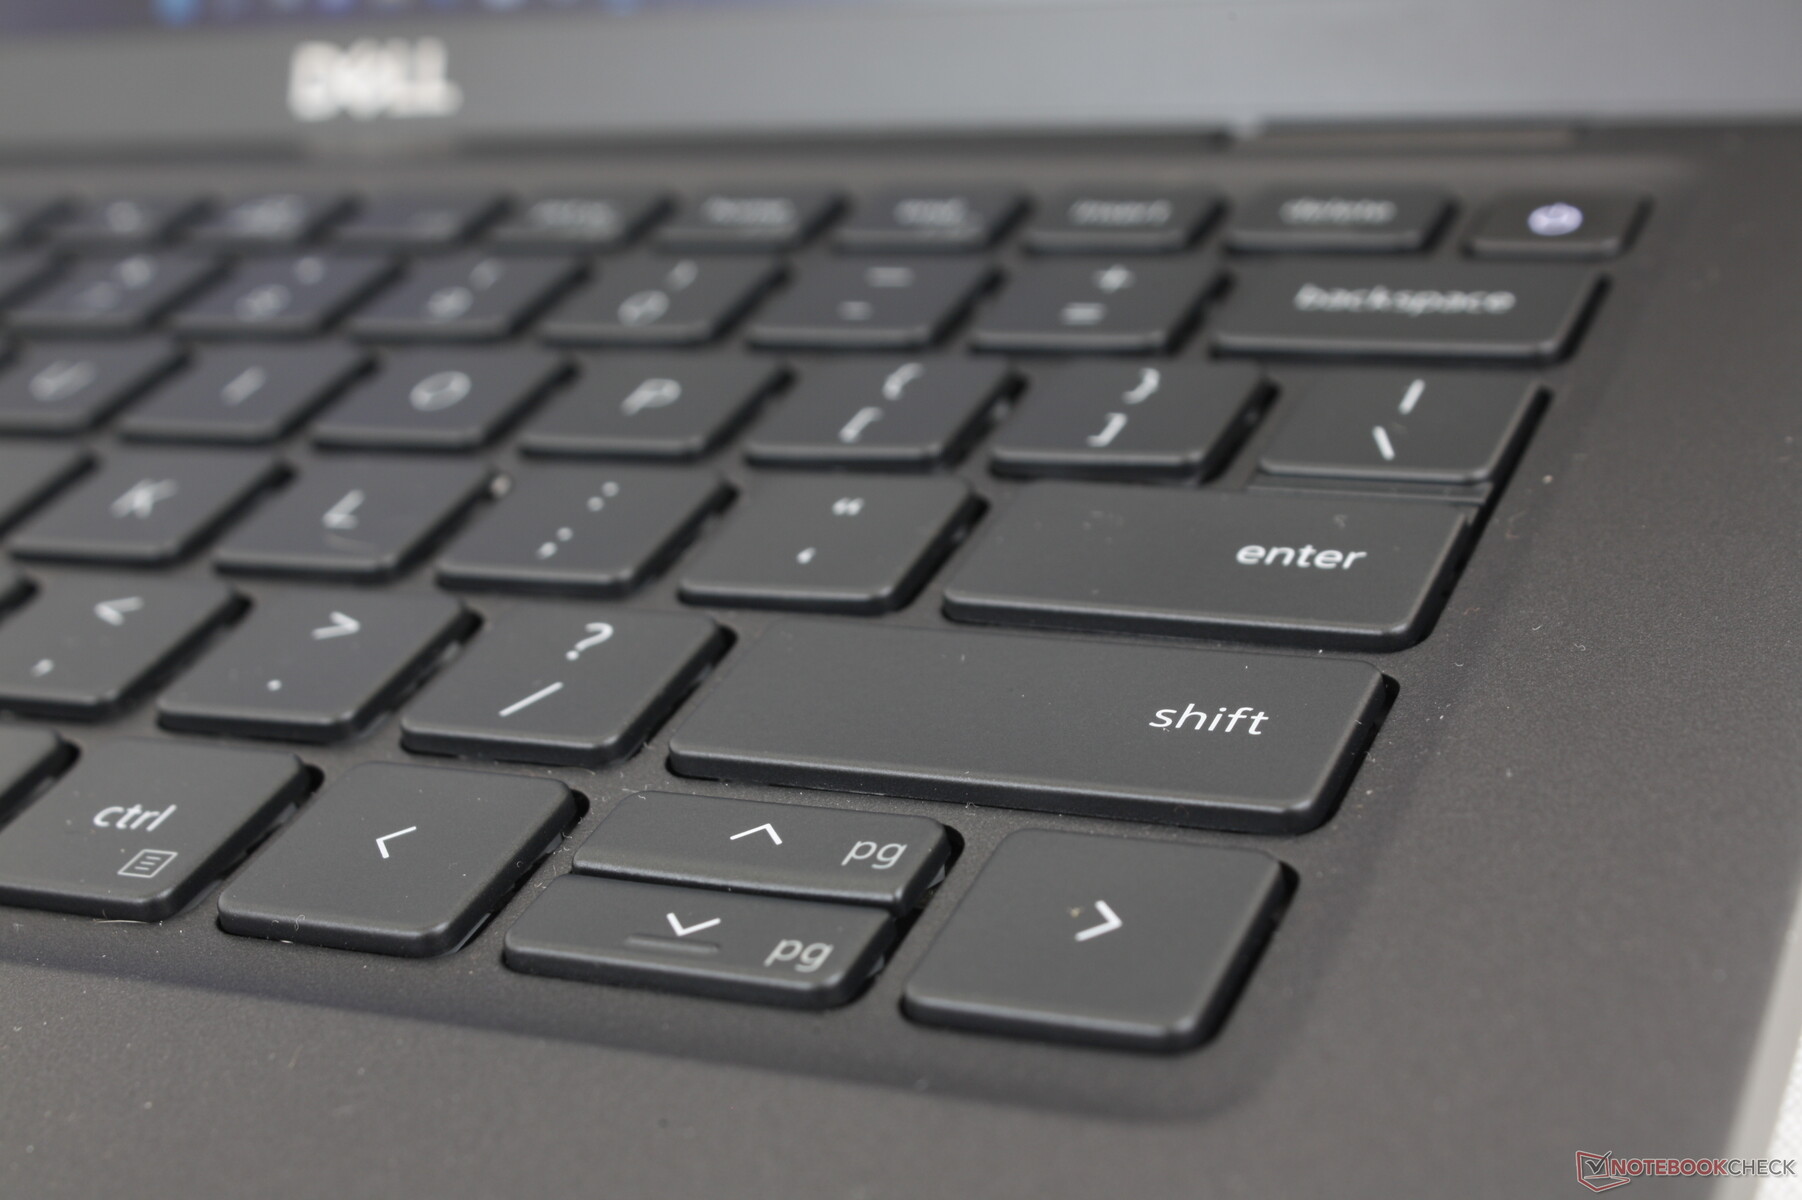
A Dell não fez alterações no teclado entre os sites Latitude 7310 e Latitude 7330. Na verdade, muitos dos novos modelos Latitude compartilham o mesmo design e layout de teclado, incluindo os modelos Latitude 7400 7410, 7310, e 7330. Achamos que as teclas mais firmes do Latitude são mais confortáveis para digitar do que as teclas mais leves do XPS 13. As teclas no LG Gram 14 ou Série HP EliteBook ter um feedback mais nítido ou mais aguçado.
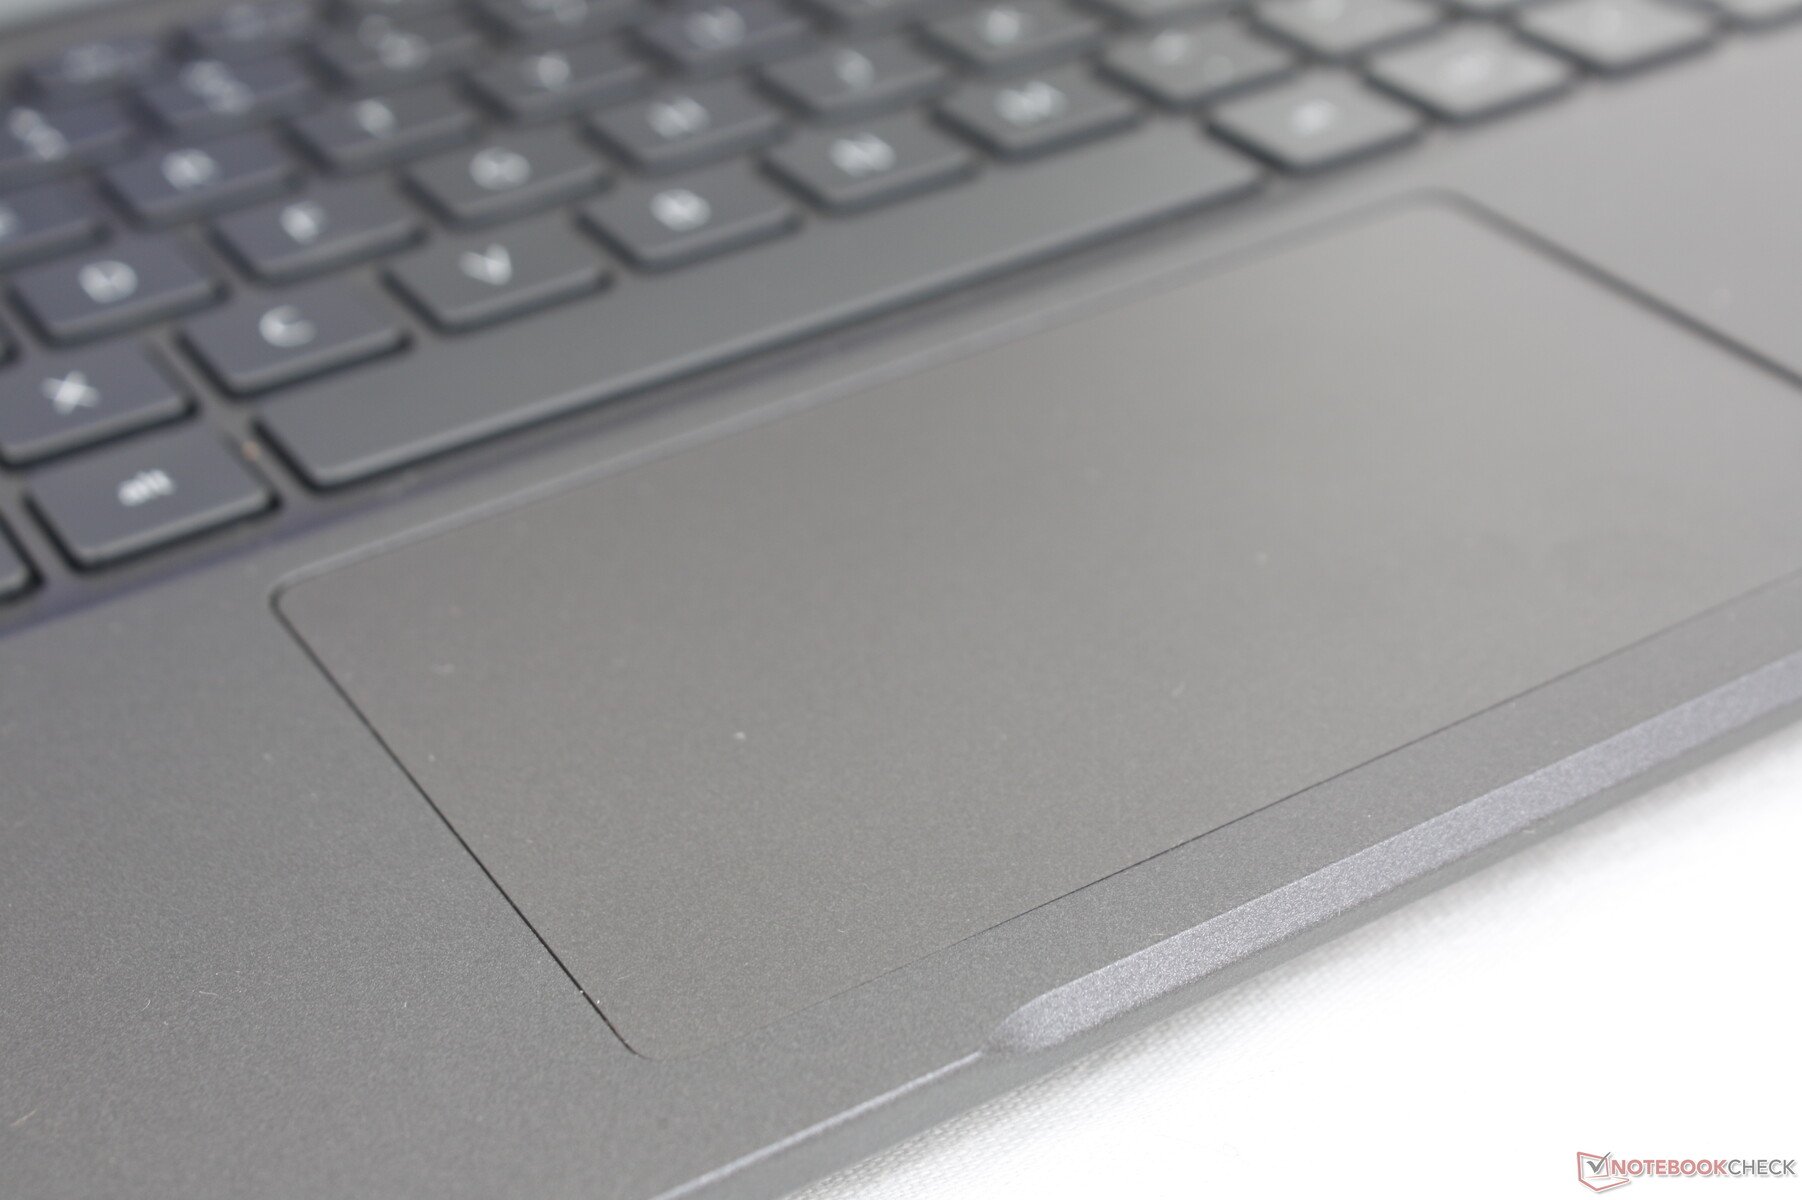
Touchpad
O tamanho do Clickpad não mudou em relação ao antigo Latitude 7310 em cerca de 10 x 6,1 cm. No entanto, gostaríamos que fosse mais alto, pois o movimento vertical do cursor e a rolagem multi-touch pode parecer um pouco apertado. As teclas integradas do mouse também são mais macias do que gostaríamos e se tornam cansativas de pressionar após um curto período de tempo.

Visor - Sem OLED ou Taxa de Atualização Rápida
Há quatro opções de exibição disponíveis, da pior para a melhor
- Sem toque, 250-nits, ~60% sRGB
- Toque, 300-nits, ~60% sRGB
- Sem toque, 400-nits, 100% sRGB, Luz Azul Baixa, Baixa Potência
- Sem toque, 400-nits, 100% sRGB, Luz Azul Baixa, Baixa Potência, Ultralight
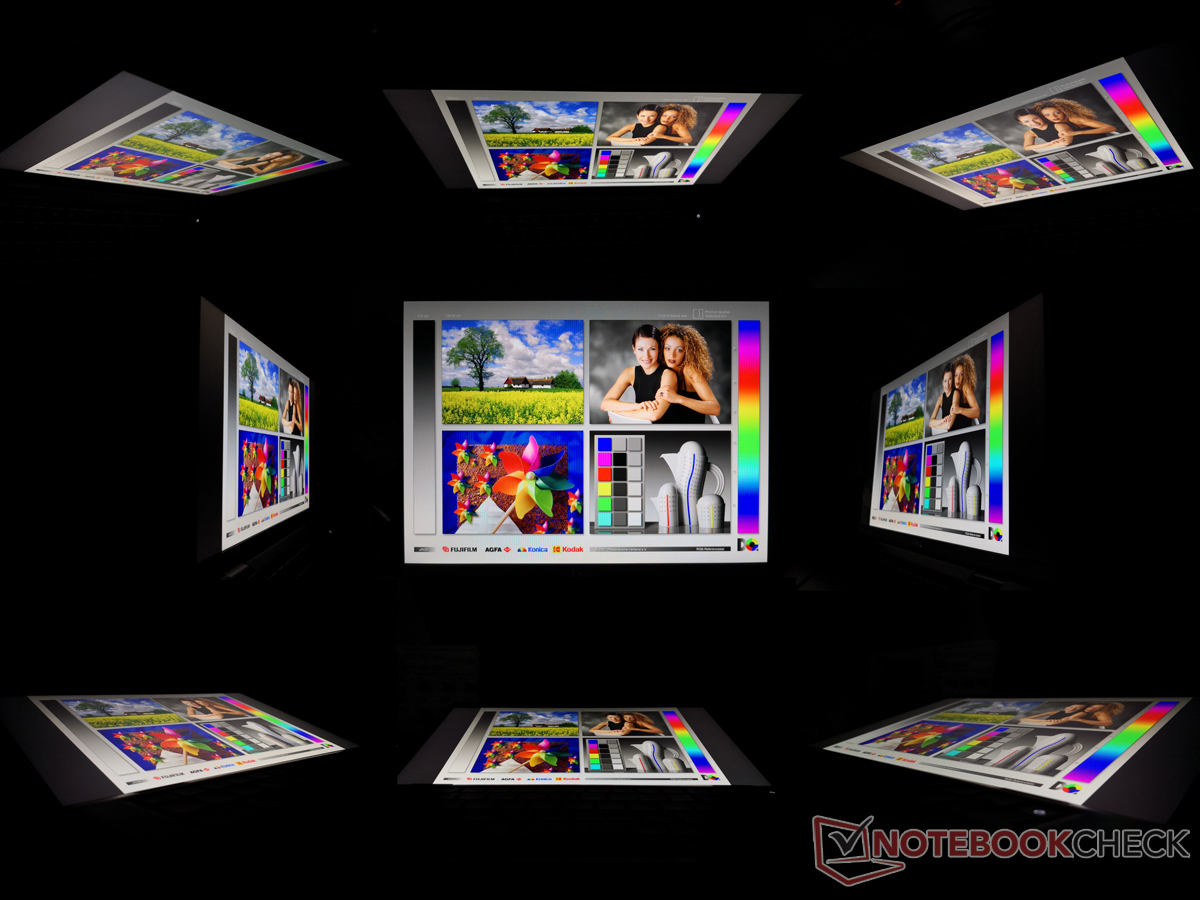
Todas as opções são FHD, WVA/IPS, e matte significando apenas 2K, 4K, OLED, ou alternativas brilhantes aqui. Recomendamos evitar o primeiro painel devido a sua fraca iluminação e sua faixa de cores muito estreita. Nossa unidade de teste específica vem equipada com a quarta opção acima.
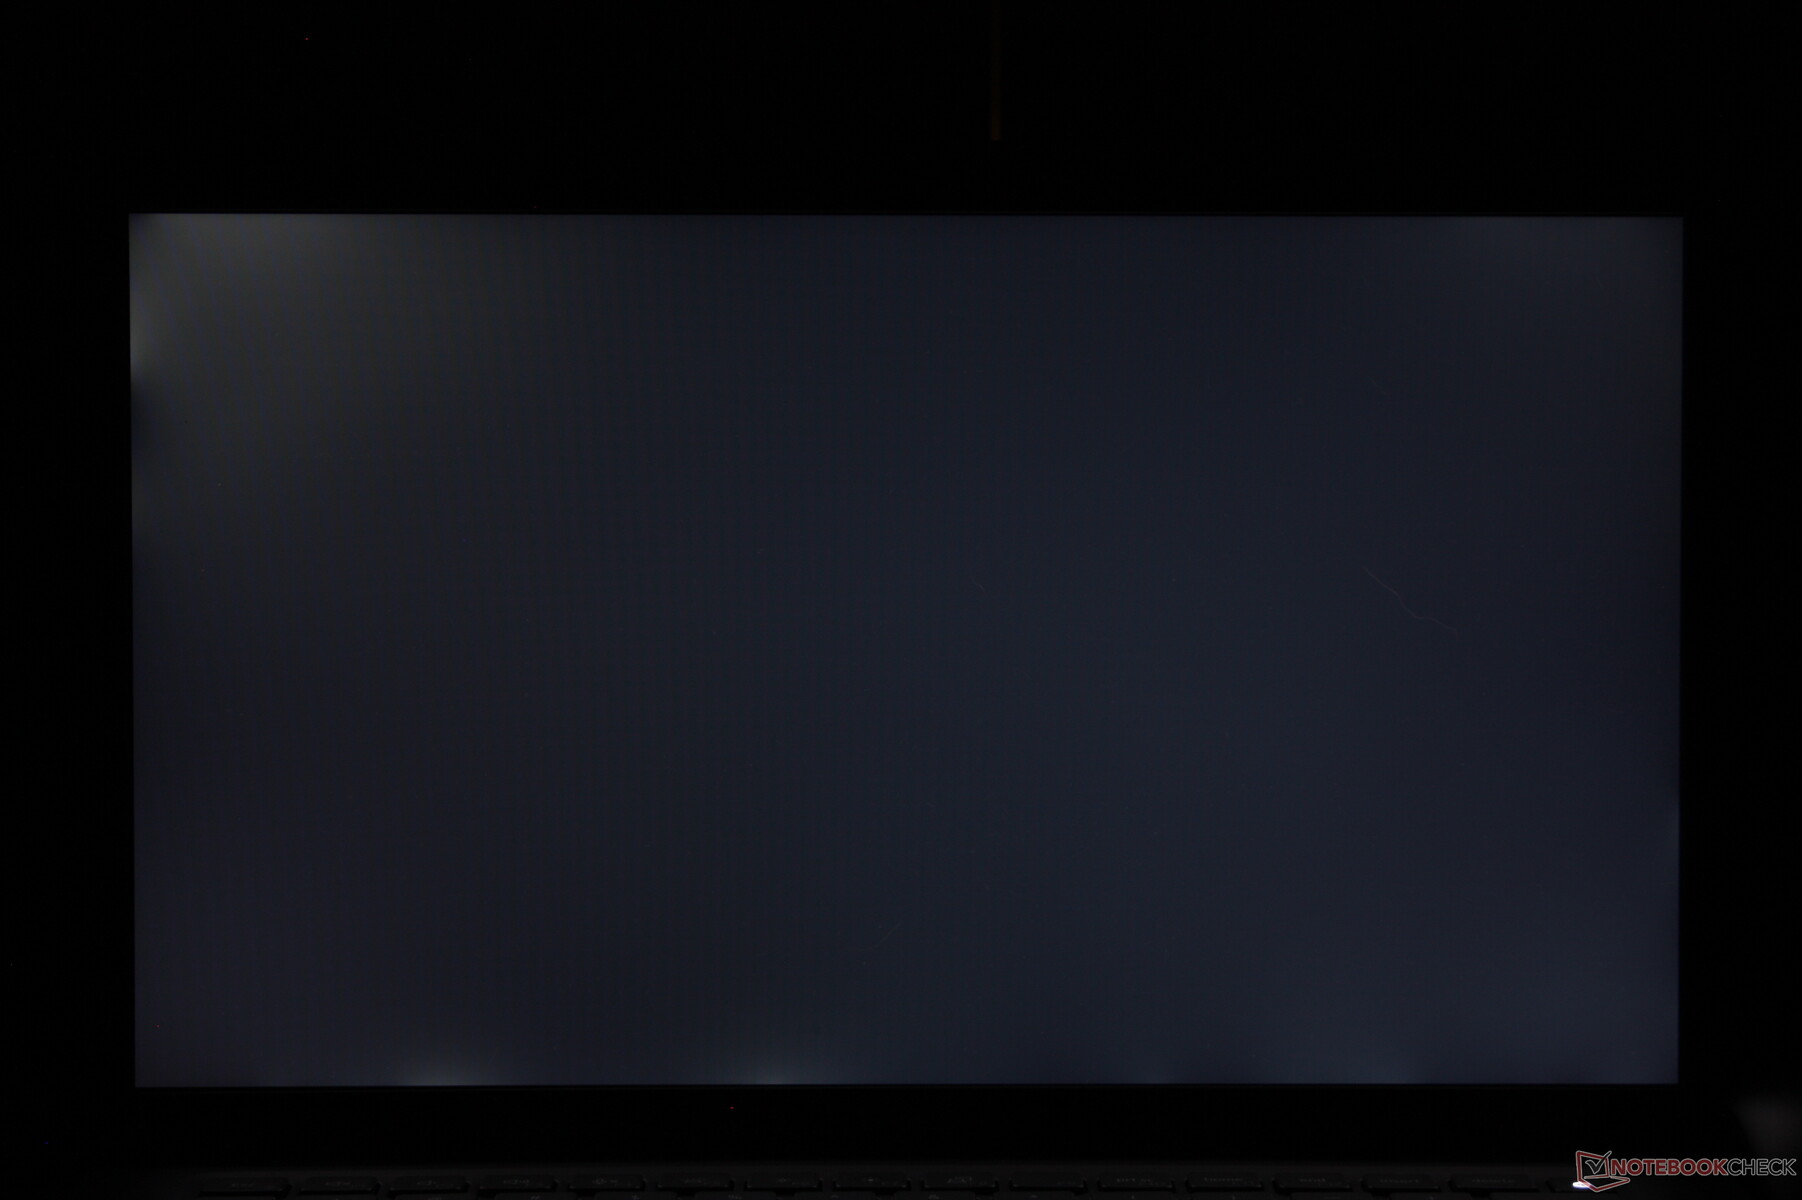
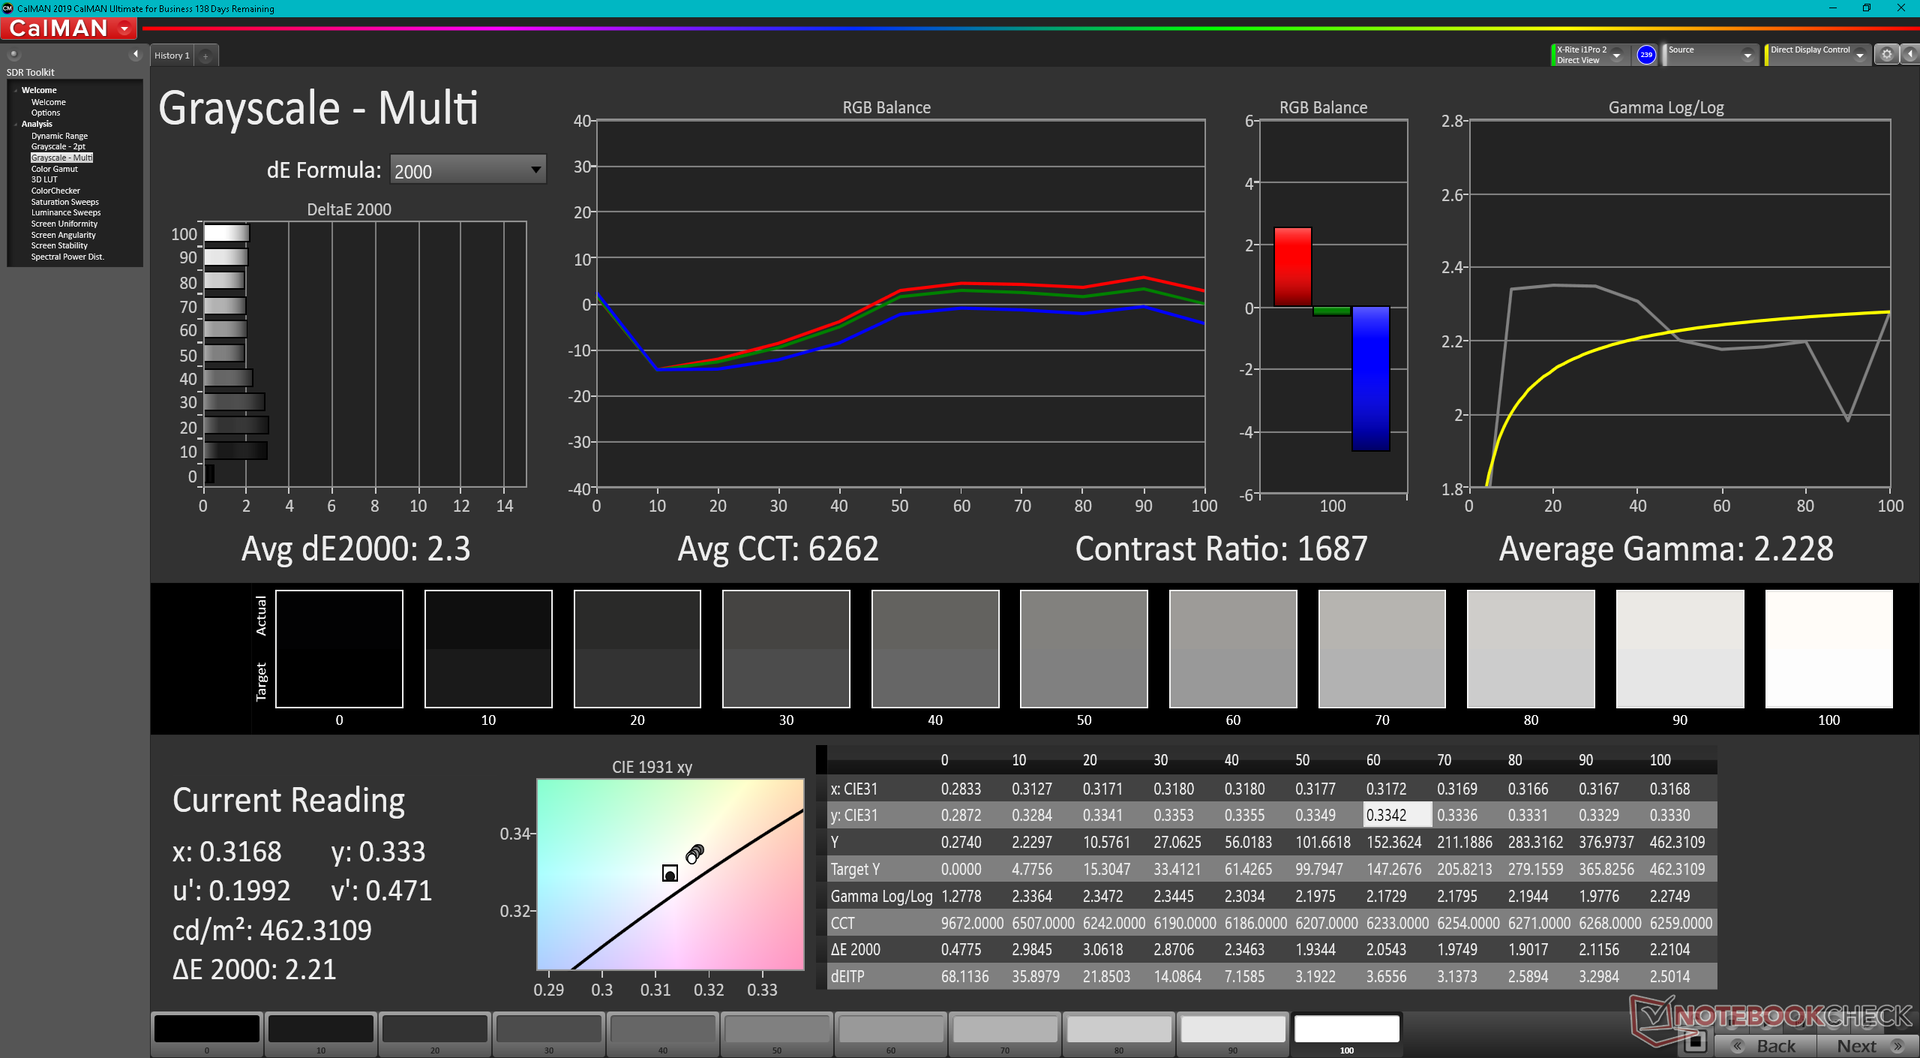
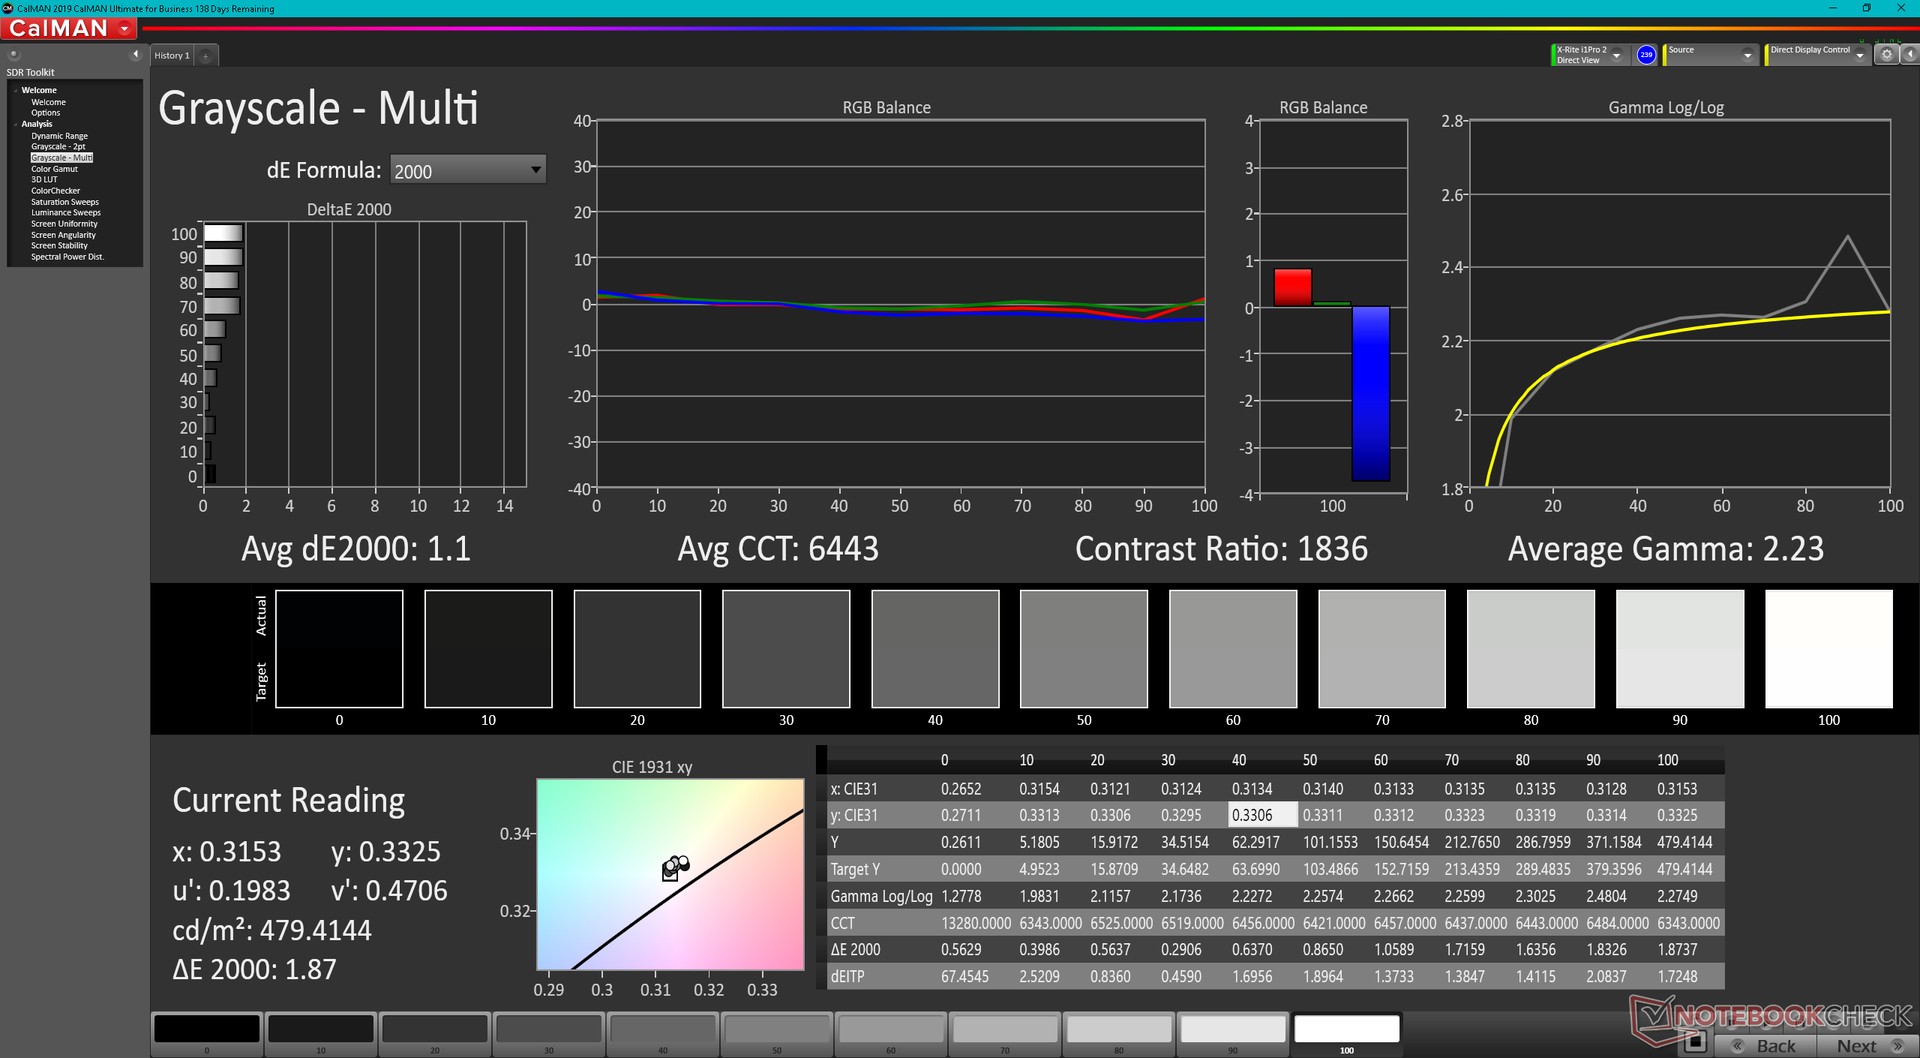
Nossas medidas independentes mostram uma cobertura sRGB ligeiramente menor de 93%, mas uma média ligeiramente mais brilhante de brilho máximo de 445 lêndeas. Ainda é uma tela de qualidade considerando sua alta relação de contraste de mais de 1000:1, mas esperamos que as futuras SKUs incluam OLED para tempos de resposta mais rápidos em preto e branco e cinza cinza ou pelo menos painéis com maior taxa de atualização para uma IU mais suave.
| |||||||||||||||||||||||||
iluminação: 89 %
iluminação com acumulador: 460.1 cd/m²
Contraste: 1484:1 (Preto: 0.31 cd/m²)
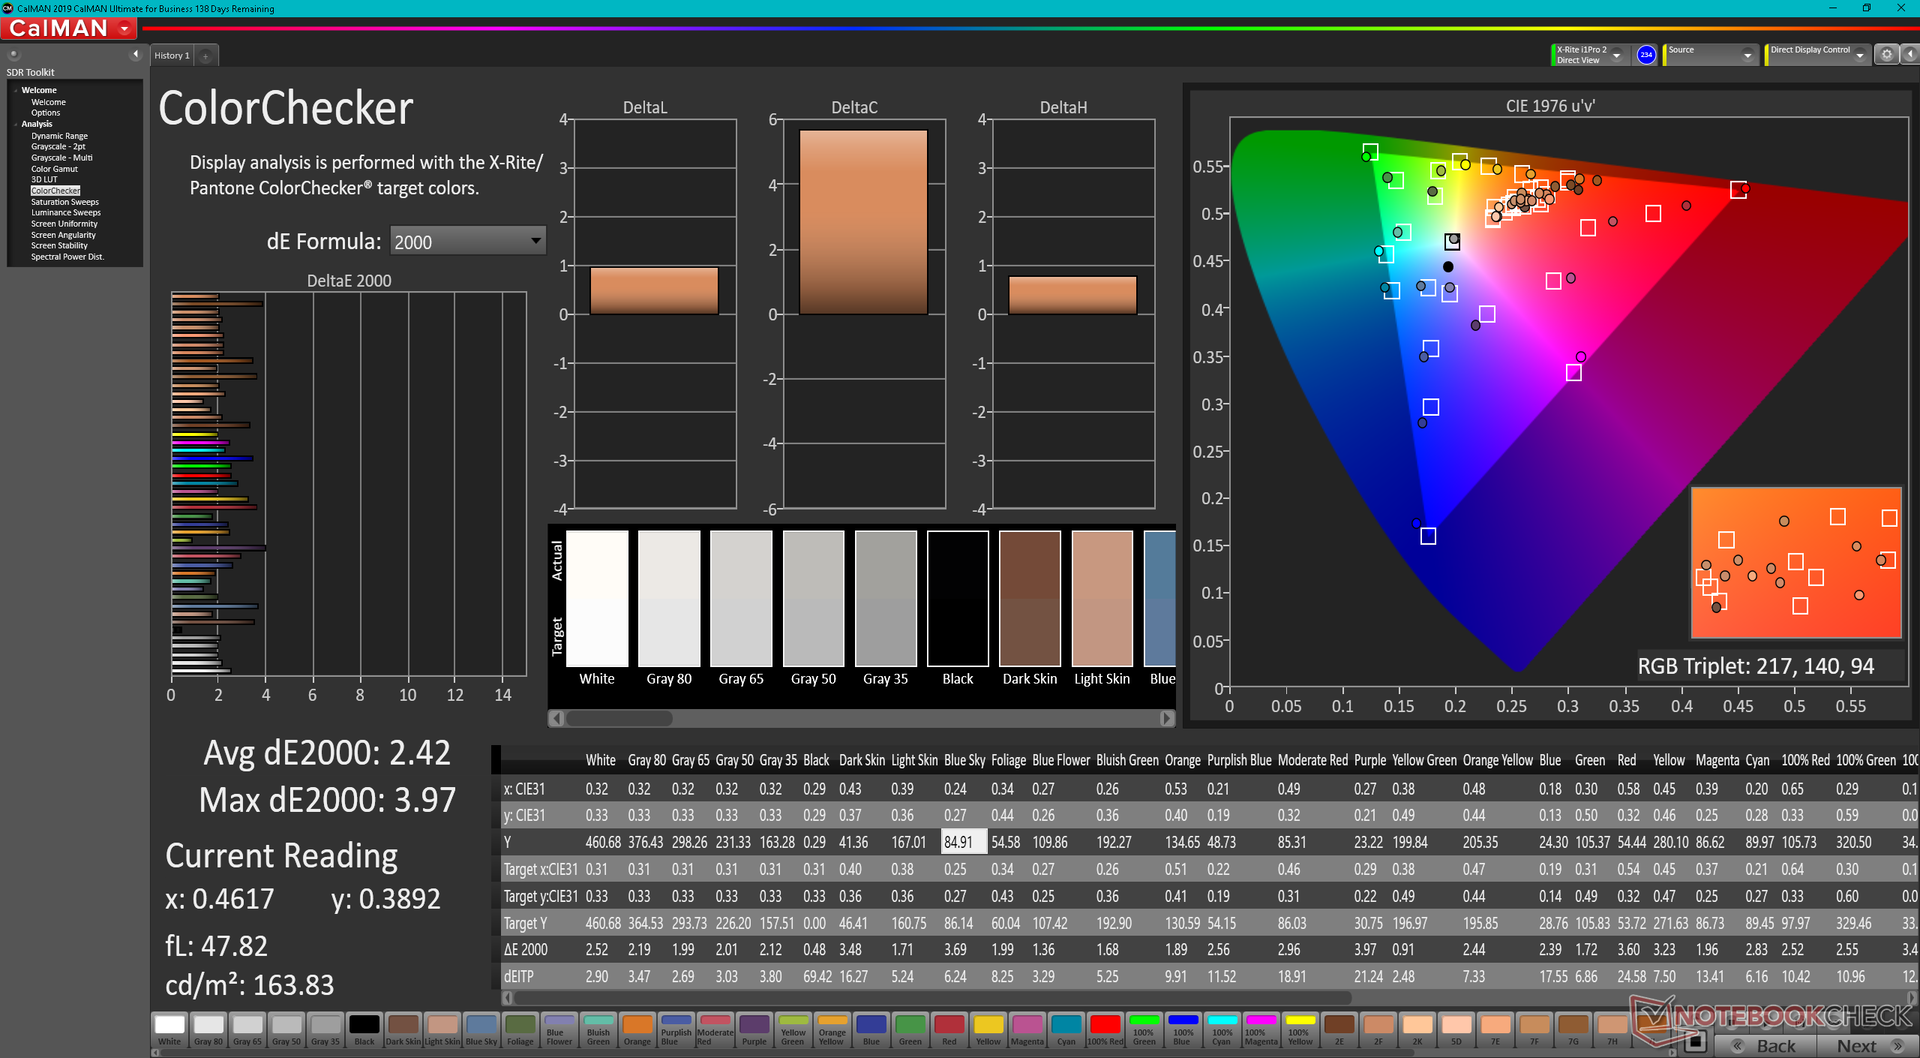
ΔE ColorChecker Calman: 2.42 | ∀{0.5-29.43 Ø4.71}
calibrated: 0.77
ΔE Greyscale Calman: 2.3 | ∀{0.09-98 Ø4.96}
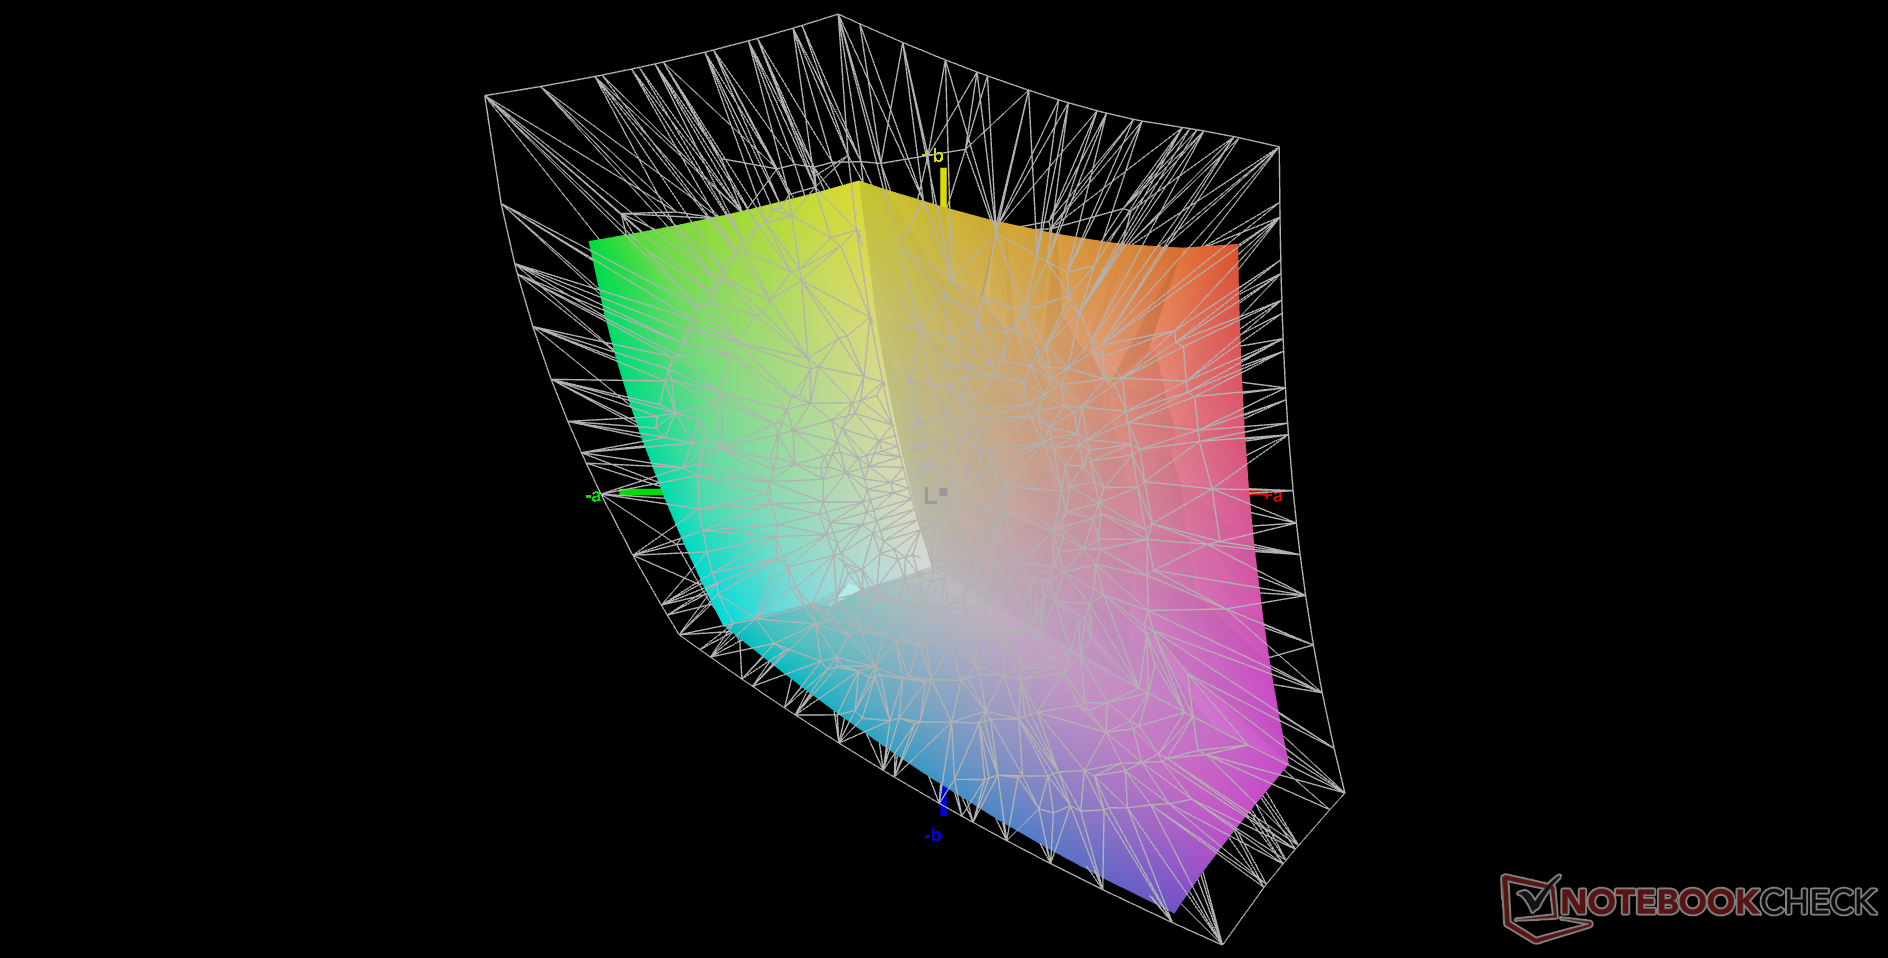
68.2% AdobeRGB 1998 (Argyll 3D)
93.5% sRGB (Argyll 3D)
66.1% Display P3 (Argyll 3D)
Gamma: 2.23
CCT: 6262 K
| Dell Latitude 13 7330 LG Philips 133WF9, IPS, 1920x1080, 13.3" | Lenovo ThinkPad X13 Yoga 20SX0004GE N133HCG-GR3, IPS, 1920x1080, 13.3" | Framework Laptop 13.5 12th Gen Intel BOE CQ NE135FBM-N41, IPS, 2256x1504, 13.5" | Razer Book 13 FHD Sharp LQ134N1JW48, IPS, 1920x1200, 13.4" | Dell Latitude 7310 AU Optronics B133HAN, IPS, 1920x1080, 13.3" | Microsoft Surface Laptop 4 13 i7 LQ135P1JX51, IPS, 2256x1504, 13.5" | |
|---|---|---|---|---|---|---|
| Display | 3% | 5% | 6% | 7% | 0% | |
| Display P3 Coverage (%) | 66.1 | 67.2 2% | 69.9 6% | 70.1 6% | 71.8 9% | 64.7 -2% |
| sRGB Coverage (%) | 93.5 | 98.1 5% | 99.4 6% | 99.3 6% | 99.3 6% | 97.2 4% |
| AdobeRGB 1998 Coverage (%) | 68.2 | 69 1% | 71.1 4% | 71.6 5% | 72.4 6% | 66.9 -2% |
| Response Times | -6% | 18% | -24% | 10% | -32% | |
| Response Time Grey 50% / Grey 80% * (ms) | 48.4 ? | 56 ? -16% | 34.7 ? 28% | 56.8 ? -17% | 40.8 ? 16% | 62.8 ? -30% |
| Response Time Black / White * (ms) | 29.6 ? | 28 ? 5% | 27.5 ? 7% | 38.8 ? -31% | 28.8 ? 3% | 39.8 ? -34% |
| PWM Frequency (Hz) | 2475 ? | 21930 ? | ||||
| Screen | 2% | -25% | -9% | -9% | -11% | |
| Brightness middle (cd/m²) | 460.1 | 401 -13% | 449.6 -2% | 545.3 19% | 332.7 -28% | 413 -10% |
| Brightness (cd/m²) | 445 | 383 -14% | 431 -3% | 507 14% | 329 -26% | 400 -10% |
| Brightness Distribution (%) | 89 | 91 2% | 90 1% | 88 -1% | 89 0% | 94 6% |
| Black Level * (cd/m²) | 0.31 | 0.16 48% | 0.31 -0% | 0.31 -0% | 0.25 19% | 0.29 6% |
| Contrast (:1) | 1484 | 2506 69% | 1450 -2% | 1759 19% | 1331 -10% | 1424 -4% |
| Colorchecker dE 2000 * | 2.42 | 2.6 -7% | 2.76 -14% | 1.39 43% | 2.15 11% | 2.8 -16% |
| Colorchecker dE 2000 max. * | 3.97 | 4.2 -6% | 7.96 -101% | 2.61 34% | 3.89 2% | 7.2 -81% |
| Colorchecker dE 2000 calibrated * | 0.77 | 0.9 -17% | 0.58 25% | 2.72 -253% | 1.09 -42% | 0.8 -4% |
| Greyscale dE 2000 * | 2.3 | 3.3 -43% | 5.2 -126% | 1.3 43% | 2.5 -9% | 1.9 17% |
| Gamma | 2.23 99% | 2.01 109% | 2.23 99% | 2.2 100% | 2.3 96% | 2.12 104% |
| CCT | 6262 104% | 6076 107% | 6475 100% | 6476 100% | 6347 102% | 6510 100% |
| Color Space (Percent of AdobeRGB 1998) (%) | 62.7 | 65.9 | 64.1 | 61.6 | ||
| Color Space (Percent of sRGB) (%) | 98.1 | 99.6 | 99.4 | 97.2 | ||
| Média Total (Programa/Configurações) | -0% /
1% | -1% /
-12% | -9% /
-8% | 3% /
-3% | -14% /
-11% |
* ... menor é melhor
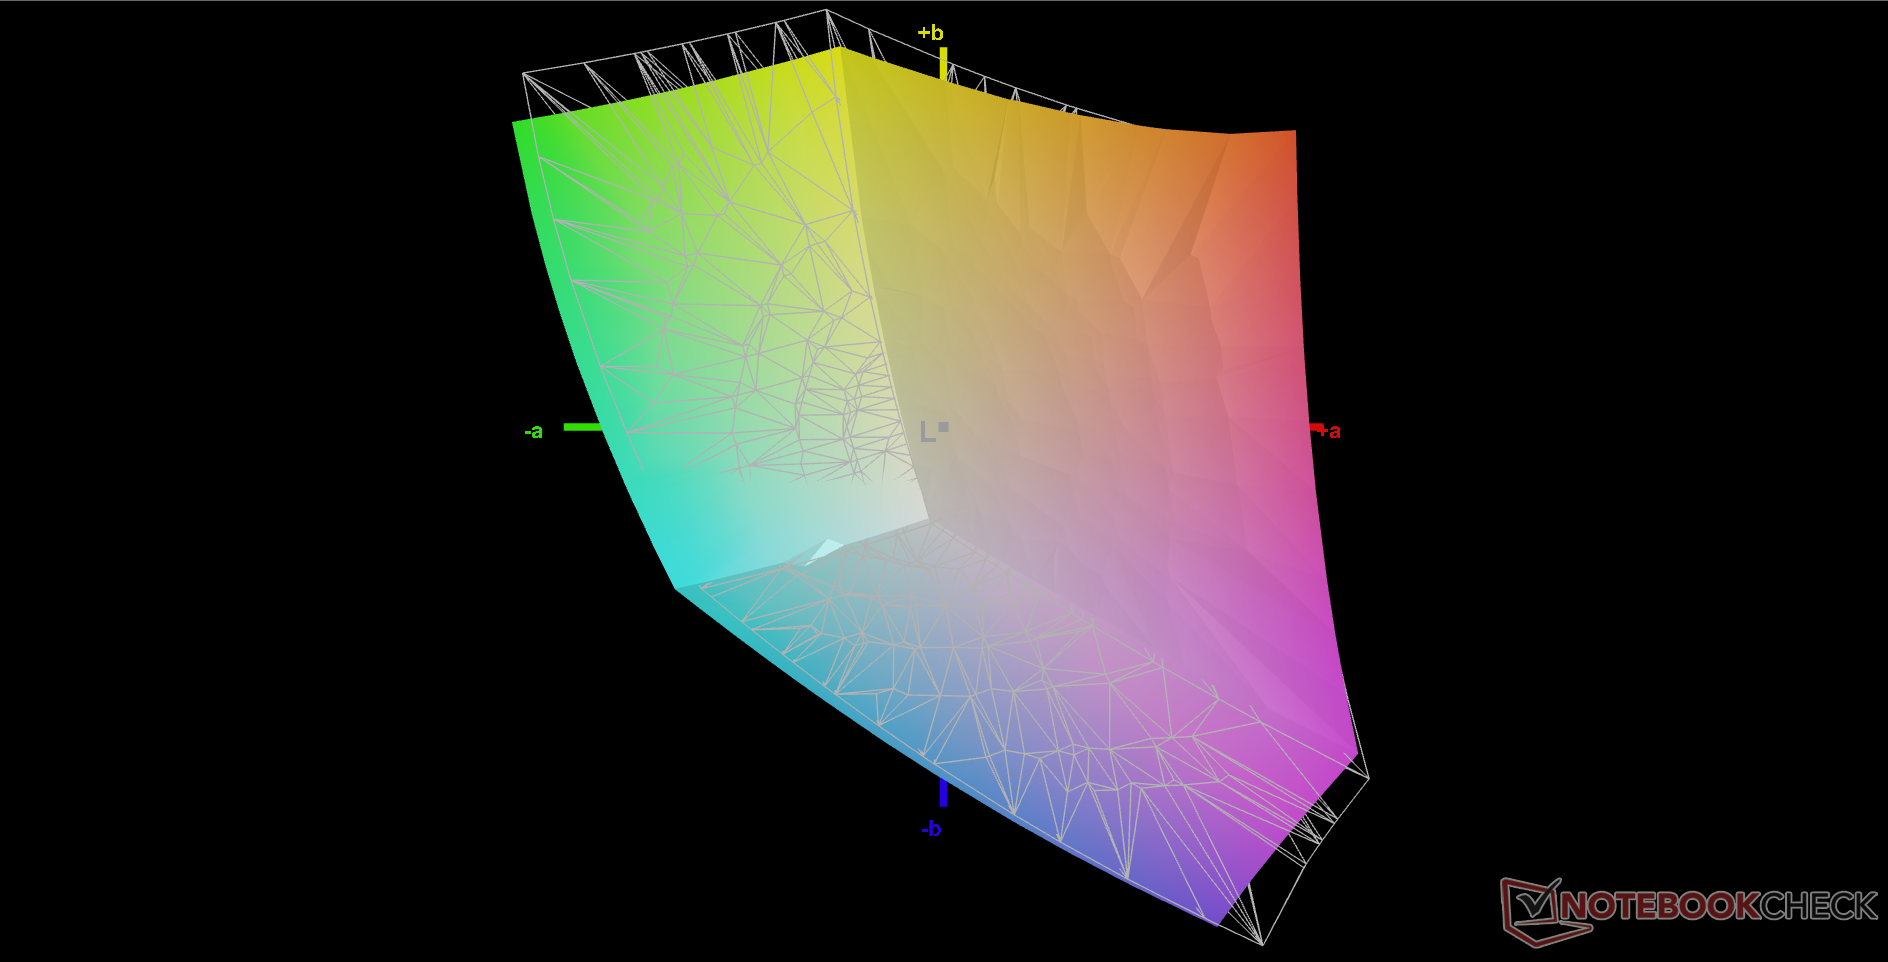
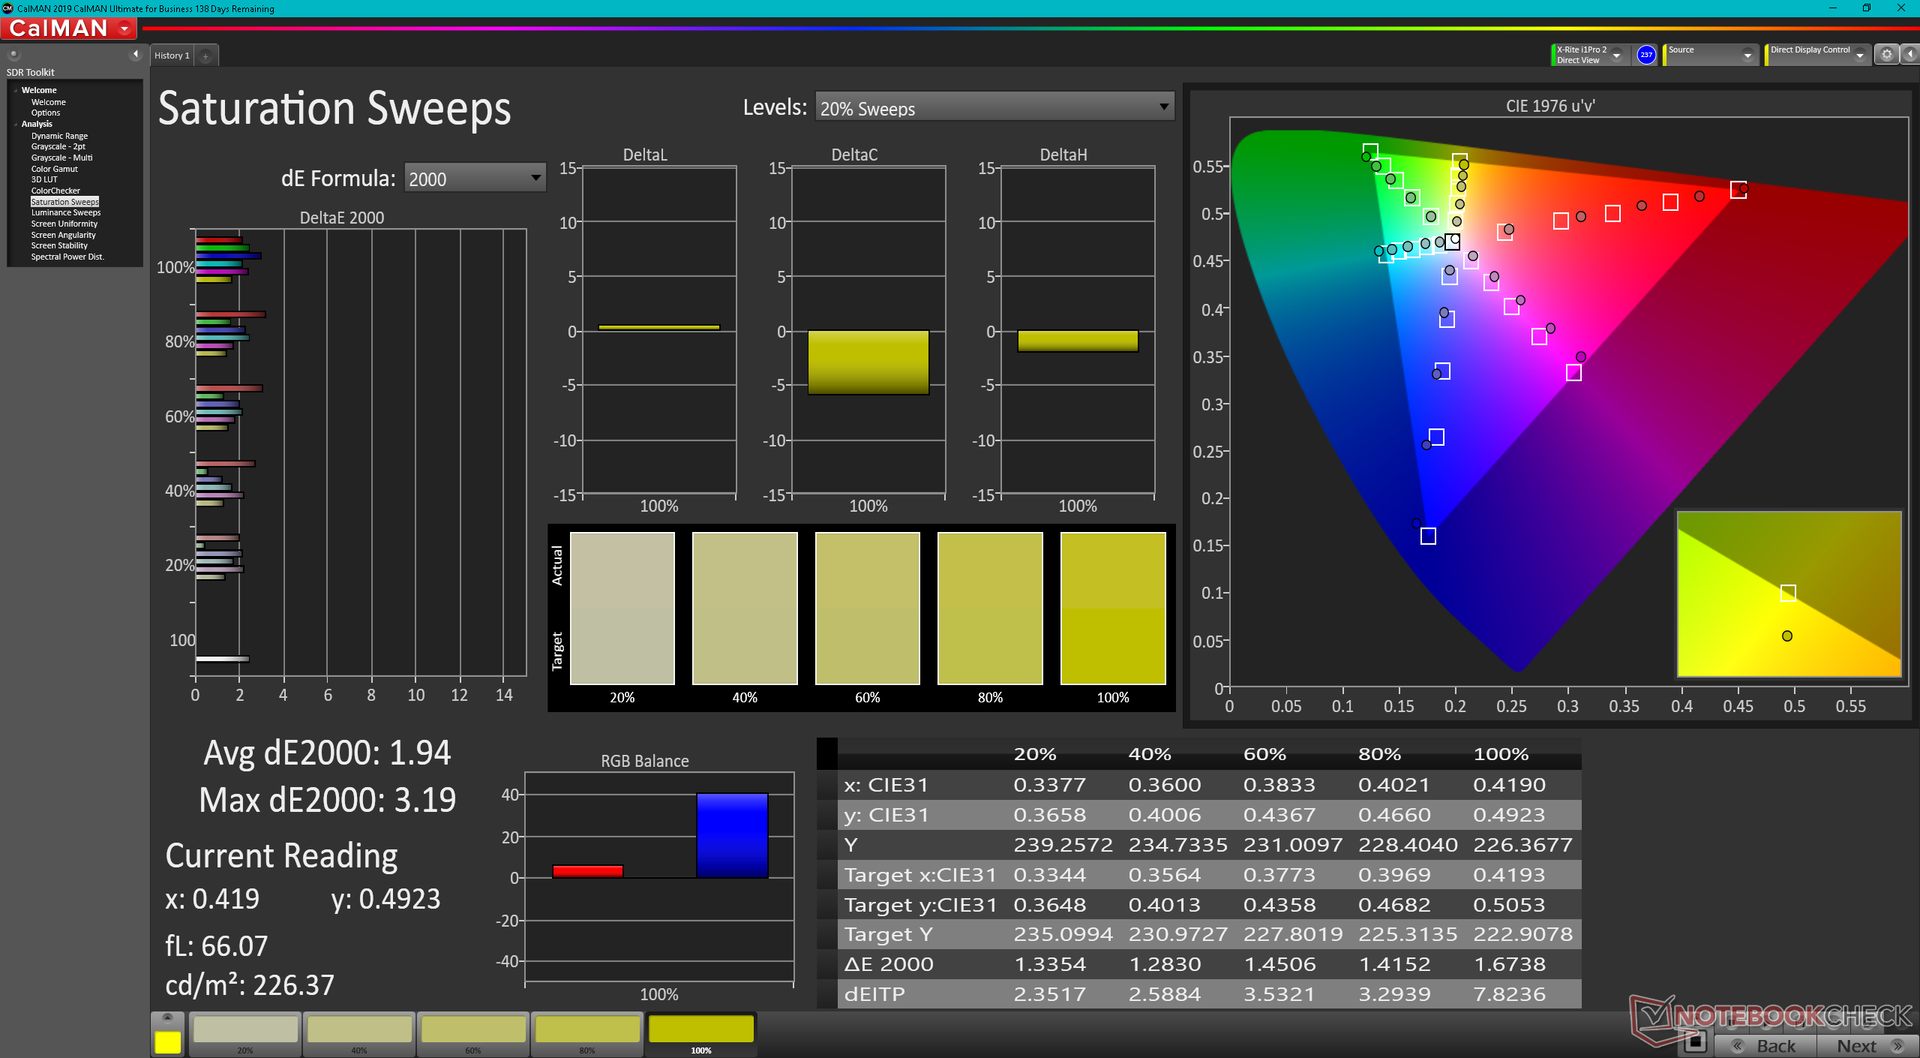
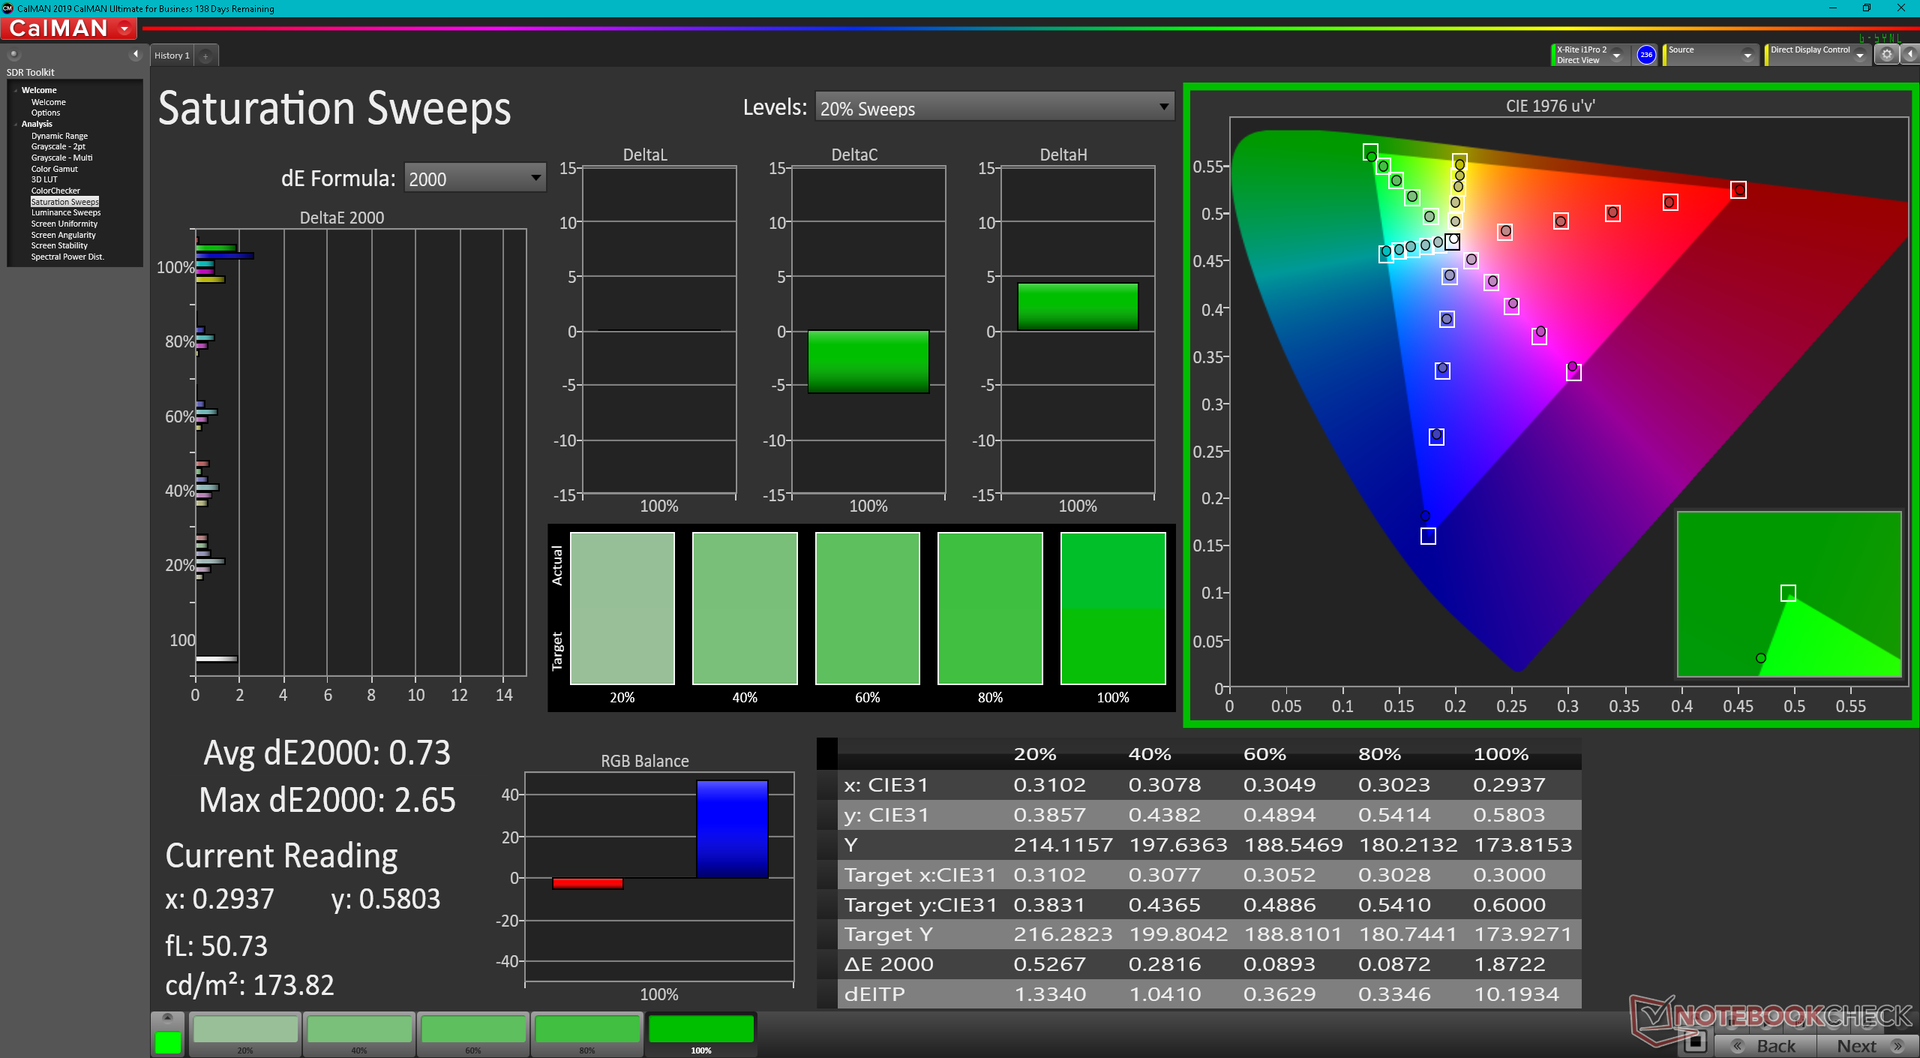
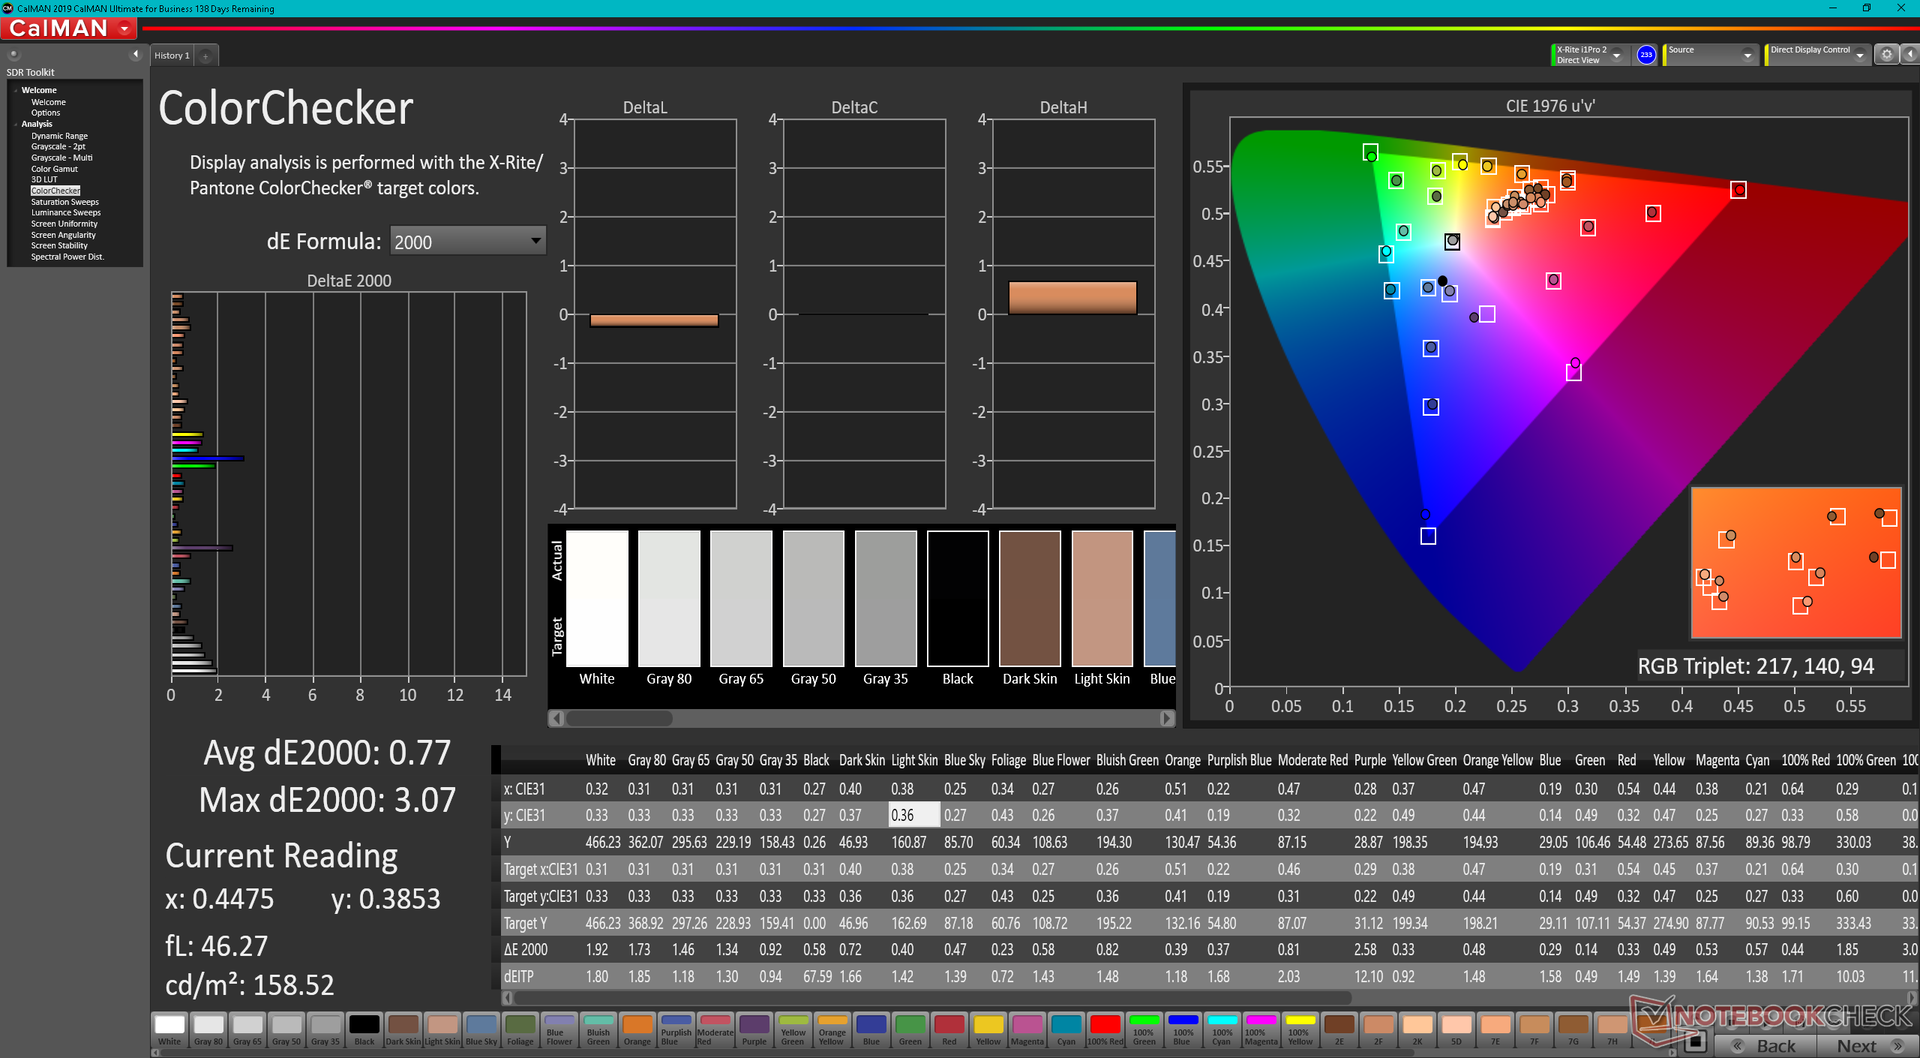
A exibição é bem calibrada fora da caixa com valores médios de escala de cinza e deltaE de apenas 2,3 e 2,42, respectivamente, como mostram nossos resultados CalMAN abaixo. Calibrá-lo ainda mais com um colorímetro X-Rite melhoraria os valores médios do DeltaE para menos de 1.
Exibir tempos de resposta
| ↔ Tempo de resposta preto para branco | ||
|---|---|---|
| 29.6 ms ... ascensão ↗ e queda ↘ combinadas | ↗ 14.8 ms ascensão | 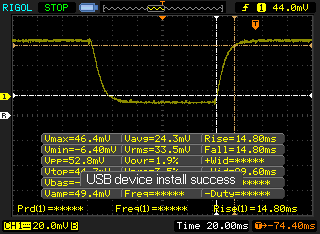 |
| ↘ 14.8 ms queda | ||
| A tela mostra taxas de resposta relativamente lentas em nossos testes e pode ser muito lenta para os jogadores. Em comparação, todos os dispositivos testados variam de 0.1 (mínimo) a 240 (máximo) ms. » 79 % de todos os dispositivos são melhores. Isso significa que o tempo de resposta medido é pior que a média de todos os dispositivos testados (19.8 ms). | ||
| ↔ Tempo de resposta 50% cinza a 80% cinza | ||
| 48.4 ms ... ascensão ↗ e queda ↘ combinadas | ↗ 23.6 ms ascensão | 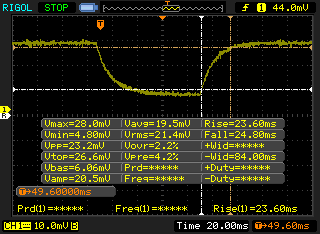 |
| ↘ 24.8 ms queda | ||
| A tela mostra taxas de resposta lentas em nossos testes e será insatisfatória para os jogadores. Em comparação, todos os dispositivos testados variam de 0.165 (mínimo) a 636 (máximo) ms. » 84 % de todos os dispositivos são melhores. Isso significa que o tempo de resposta medido é pior que a média de todos os dispositivos testados (31 ms). | ||
Cintilação da tela / PWM (modulação por largura de pulso)
| Tela tremeluzindo / PWM não detectado | 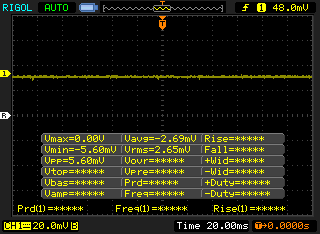 | ||
[pwm_comparison] Em comparação: 52 % de todos os dispositivos testados não usam PWM para escurecer a tela. Se PWM foi detectado, uma média de 7754 (mínimo: 5 - máximo: 343500) Hz foi medida. | |||
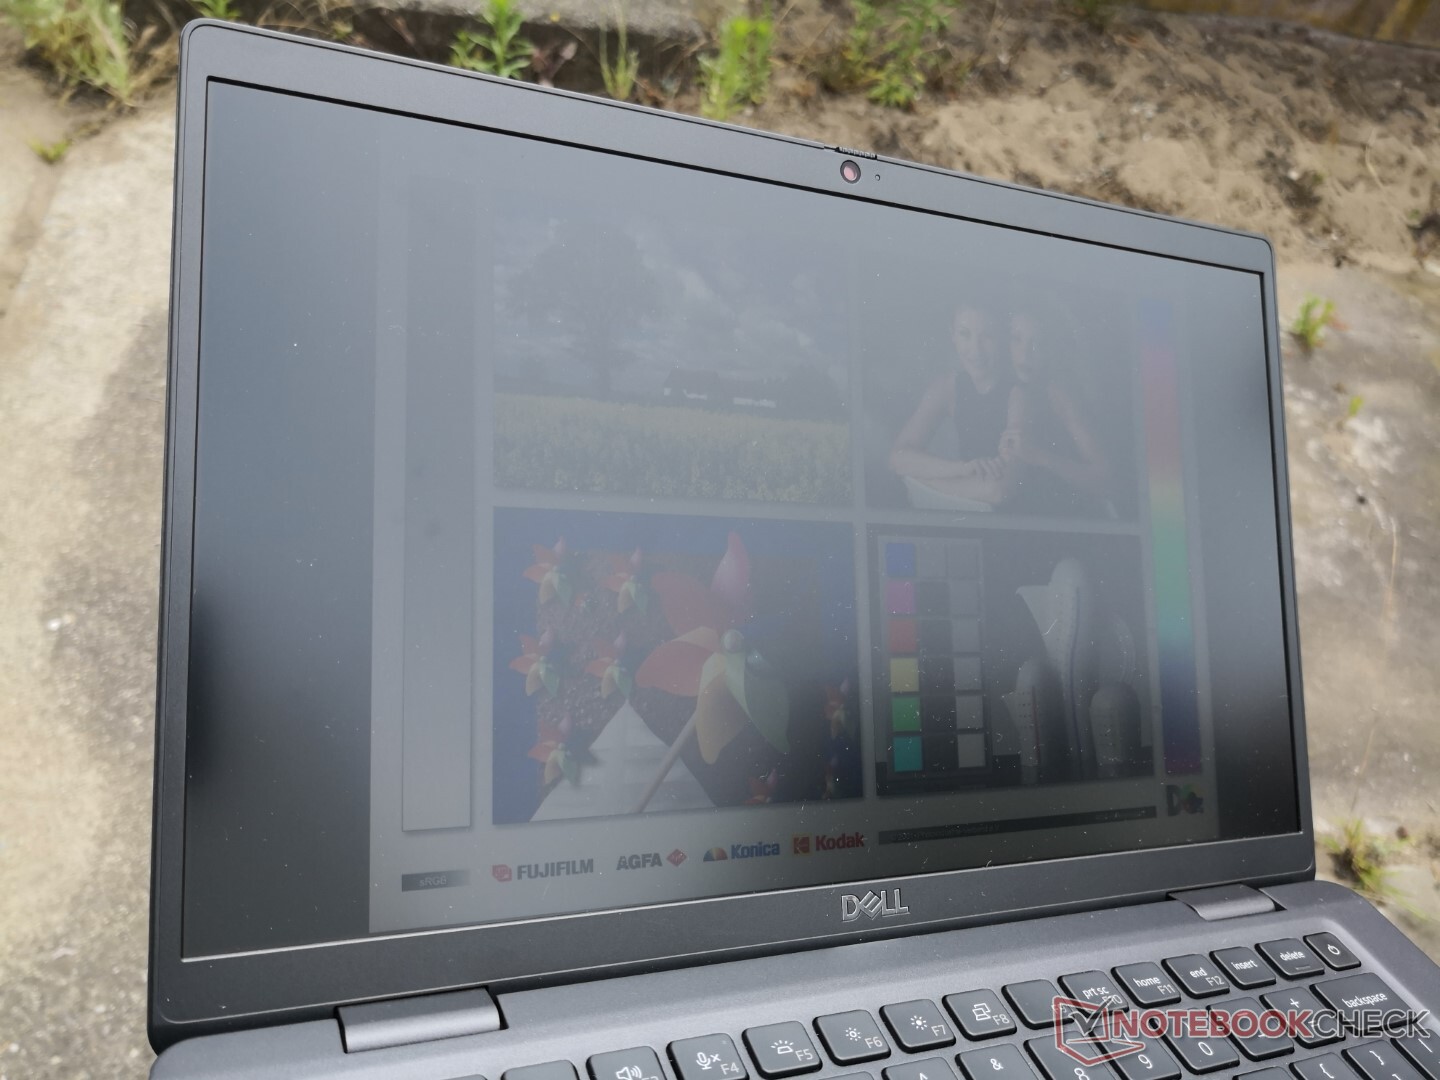
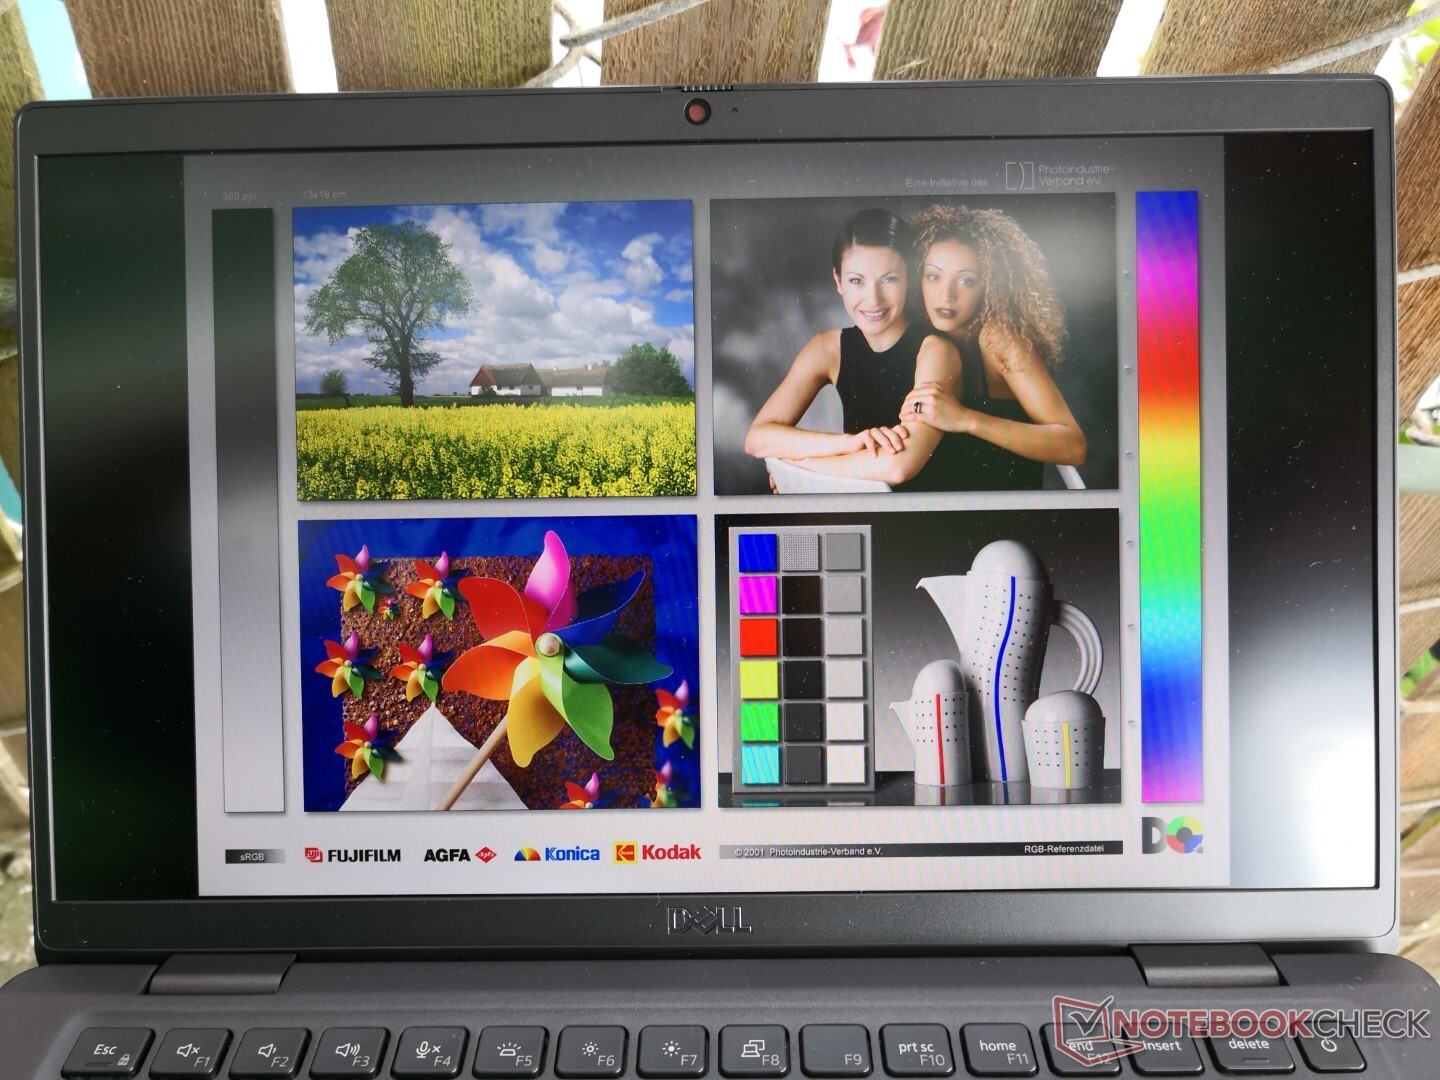
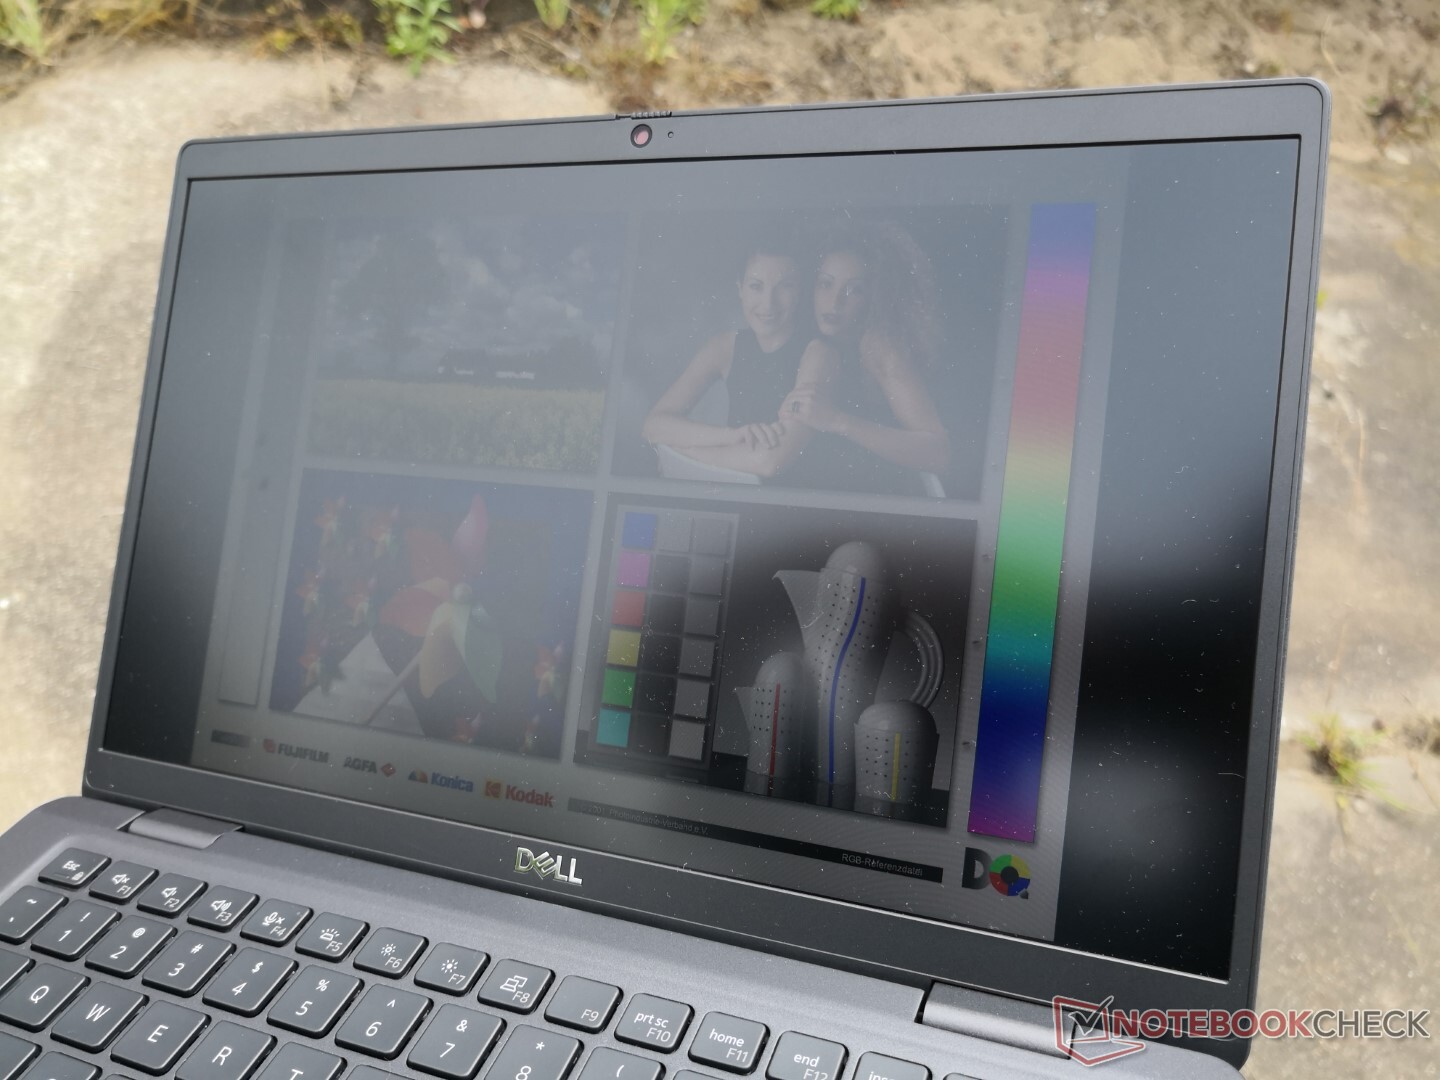
A visibilidade ao ar livre é bastante boa se trabalhar sob a sombra, devido ao display relativamente brilhante de ~450-nit e à cobertura fosca para reduzir o brilho. No entanto, ainda não é brilhante o suficiente para uma visão confortável em dias ensolarados ou brilhantes e nublados.
Desempenho - Core i7-1265U Impressiona
Condições de teste
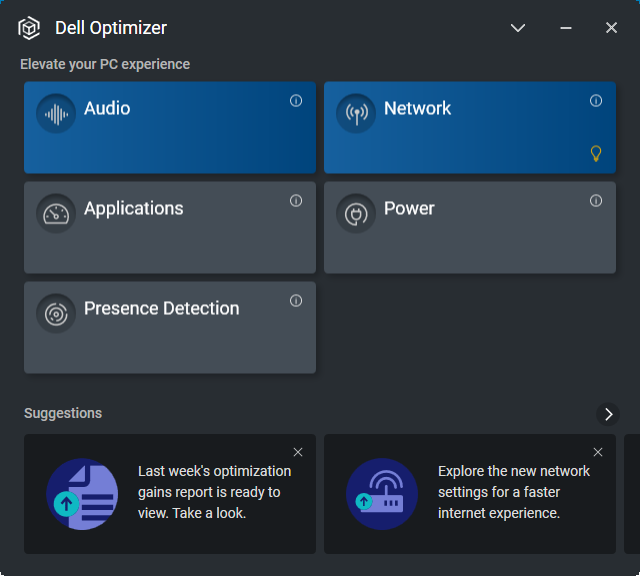
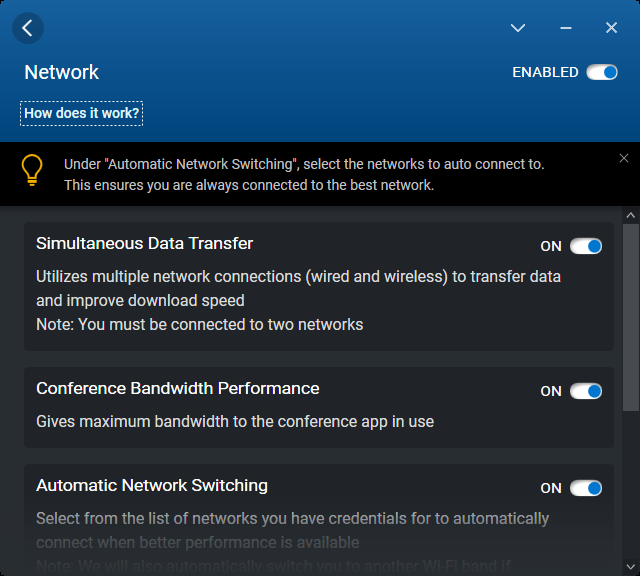
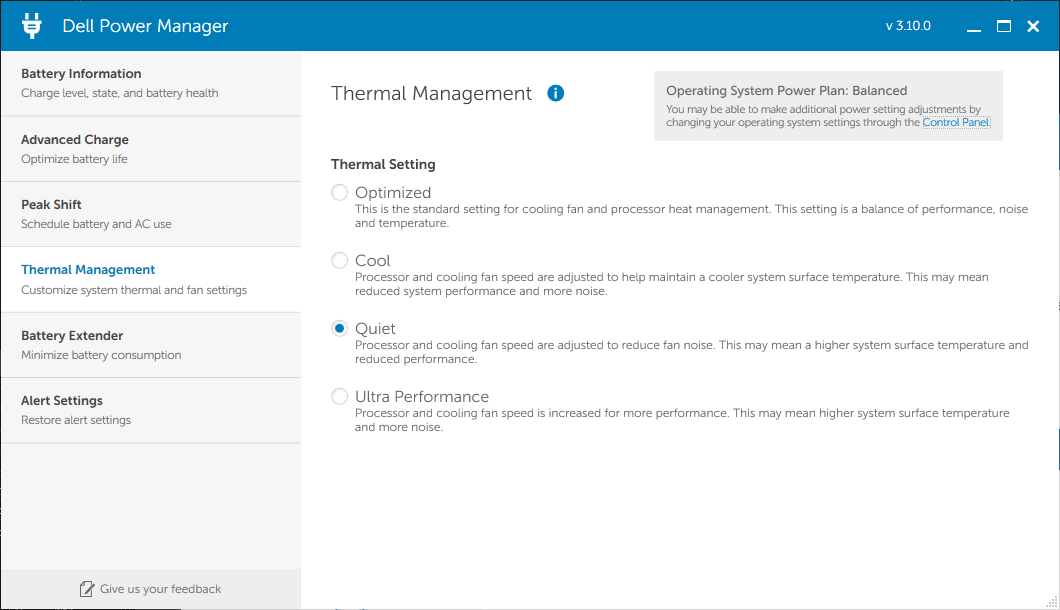
Definimos nossa unidade para o modo Performance e Ultra Performance com o Windows e o software Dell Power Manager, respectivamente, antes de executar quaisquer benchmarks abaixo. É recomendado que os proprietários se familiarizem com os aplicativos Dell Power Manager, Optimizer e Command pré-instalados, pois eles servem como hubs para alternar atualizações e recursos específicos do modelo.
Processador
Depois de ser desapontado com o Núcleo i5-1235Unossas esperanças não eram muito grandes para a Núcleo i7-1265U. Felizmente, a i7-1265U está provando ser um demônio muito rápido, apesar de pertencer à família U-series. O desempenho bruto de linha única e multi-linha é 20% e 60% maior do que a média do laptop em nosso banco de dados equipado com a última geração Núcleo i7-1165G7. Na verdade, a CPU está apenas cerca de 10 a 25 por cento atrás da mais exigente Núcleo i7-1260P. Algumas CPUs AMD de alta tecnologia como a Ryzen 7 5700U ou5800U podem combinar ou superar o Core i7-1265U em cargas de trabalho com múltiplas roscas, mas ainda ficam para trás em operações com uma única rosca
A sustentabilidade do desempenho é boa, mas definitivamente poderia ser melhor. O CineBench R15 xT em loop mostra uma pontuação inicial de 1379 pontos antes de cair e se estabilizar em cerca de 1000 pontos, representando um mergulho de desempenho de cerca de 27%. O potencial de resfriamento limitado da pequena solução de resfriamento provavelmente impede que a CPU funcione com taxas de relógio mais altas por períodos mais longos.
Cinebench R15 Multi Loop
Cinebench R23: Multi Core | Single Core
Cinebench R15: CPU Multi 64Bit | CPU Single 64Bit
Blender: v2.79 BMW27 CPU
7-Zip 18.03: 7z b 4 | 7z b 4 -mmt1
Geekbench 5.5: Multi-Core | Single-Core
HWBOT x265 Benchmark v2.2: 4k Preset
LibreOffice : 20 Documents To PDF
R Benchmark 2.5: Overall mean
| Cinebench R23 / Multi Core | |
| Framework Laptop 13.5 12th Gen Intel | |
| MSI Summit E14 Flip Evo A12MT | |
| Dell Latitude 13 7330 | |
| HP Pavilion Aero 13 be0097nr | |
| Asus ZenBook 13 OLED UM325UA | |
| Média Intel Core i7-1265U (4332 - 9219, n=10) | |
| Microsoft Surface Laptop 4 13 Ryzen 5 | |
| Razer Book 13 FHD | |
| Samsung Galaxy Book2 Pro 13 NP930XED-KA1DE | |
| Média Intel Core i7-1165G7 (2525 - 6862, n=64) | |
| Gateway Ultra Slim 14.1 GWTC51427 | |
| Dell Latitude 5320-TM4V2 | |
| Cinebench R23 / Single Core | |
| MSI Summit E14 Flip Evo A12MT | |
| Dell Latitude 13 7330 | |
| Framework Laptop 13.5 12th Gen Intel | |
| Média Intel Core i7-1265U (1144 - 1820, n=10) | |
| Gateway Ultra Slim 14.1 GWTC51427 | |
| Média Intel Core i7-1165G7 (1110 - 1539, n=59) | |
| HP Pavilion Aero 13 be0097nr | |
| Dell Latitude 5320-TM4V2 | |
| Asus ZenBook 13 OLED UM325UA | |
| Microsoft Surface Laptop 4 13 Ryzen 5 | |
| Samsung Galaxy Book2 Pro 13 NP930XED-KA1DE | |
Cinebench R23: Multi Core | Single Core
Cinebench R15: CPU Multi 64Bit | CPU Single 64Bit
Blender: v2.79 BMW27 CPU
7-Zip 18.03: 7z b 4 | 7z b 4 -mmt1
Geekbench 5.5: Multi-Core | Single-Core
HWBOT x265 Benchmark v2.2: 4k Preset
LibreOffice : 20 Documents To PDF
R Benchmark 2.5: Overall mean
* ... menor é melhor
AIDA64: FP32 Ray-Trace | FPU Julia | CPU SHA3 | CPU Queen | FPU SinJulia | FPU Mandel | CPU AES | CPU ZLib | FP64 Ray-Trace | CPU PhotoWorxx
| Performance rating | |
| Microsoft Surface Laptop 4 13 Ryzen 5 | |
| Framework Laptop 13.5 12th Gen Intel | |
| Dell Latitude 13 7330 | |
| Dell Latitude 7310 | |
| Lenovo ThinkPad X13 Yoga 20SX0004GE | |
| AIDA64 / FP32 Ray-Trace | |
| Microsoft Surface Laptop 4 13 Ryzen 5 | |
| Dell Latitude 13 7330 | |
| Framework Laptop 13.5 12th Gen Intel | |
| Dell Latitude 7310 | |
| Lenovo ThinkPad X13 Yoga 20SX0004GE | |
| AIDA64 / FPU Julia | |
| Microsoft Surface Laptop 4 13 Ryzen 5 | |
| Dell Latitude 13 7330 | |
| Framework Laptop 13.5 12th Gen Intel | |
| Dell Latitude 7310 | |
| Lenovo ThinkPad X13 Yoga 20SX0004GE | |
| AIDA64 / CPU SHA3 | |
| Dell Latitude 13 7330 | |
| Framework Laptop 13.5 12th Gen Intel | |
| Microsoft Surface Laptop 4 13 Ryzen 5 | |
| Lenovo ThinkPad X13 Yoga 20SX0004GE | |
| Dell Latitude 7310 | |
| AIDA64 / CPU Queen | |
| Framework Laptop 13.5 12th Gen Intel | |
| Microsoft Surface Laptop 4 13 Ryzen 5 | |
| Dell Latitude 13 7330 | |
| Dell Latitude 7310 | |
| Lenovo ThinkPad X13 Yoga 20SX0004GE | |
| AIDA64 / FPU SinJulia | |
| Microsoft Surface Laptop 4 13 Ryzen 5 | |
| Framework Laptop 13.5 12th Gen Intel | |
| Dell Latitude 13 7330 | |
| Dell Latitude 7310 | |
| Lenovo ThinkPad X13 Yoga 20SX0004GE | |
| AIDA64 / FPU Mandel | |
| Microsoft Surface Laptop 4 13 Ryzen 5 | |
| Dell Latitude 13 7330 | |
| Framework Laptop 13.5 12th Gen Intel | |
| Dell Latitude 7310 | |
| Lenovo ThinkPad X13 Yoga 20SX0004GE | |
| AIDA64 / CPU AES | |
| Framework Laptop 13.5 12th Gen Intel | |
| Dell Latitude 13 7330 | |
| Microsoft Surface Laptop 4 13 Ryzen 5 | |
| Lenovo ThinkPad X13 Yoga 20SX0004GE | |
| Dell Latitude 7310 | |
| AIDA64 / CPU ZLib | |
| Framework Laptop 13.5 12th Gen Intel | |
| Microsoft Surface Laptop 4 13 Ryzen 5 | |
| Dell Latitude 13 7330 | |
| Lenovo ThinkPad X13 Yoga 20SX0004GE | |
| Dell Latitude 7310 | |
| AIDA64 / FP64 Ray-Trace | |
| Microsoft Surface Laptop 4 13 Ryzen 5 | |
| Dell Latitude 13 7330 | |
| Framework Laptop 13.5 12th Gen Intel | |
| Dell Latitude 7310 | |
| Lenovo ThinkPad X13 Yoga 20SX0004GE | |
| AIDA64 / CPU PhotoWorxx | |
| Framework Laptop 13.5 12th Gen Intel | |
| Dell Latitude 13 7330 | |
| Dell Latitude 7310 | |
| Microsoft Surface Laptop 4 13 Ryzen 5 | |
| Lenovo ThinkPad X13 Yoga 20SX0004GE | |
Desempenho do sistema
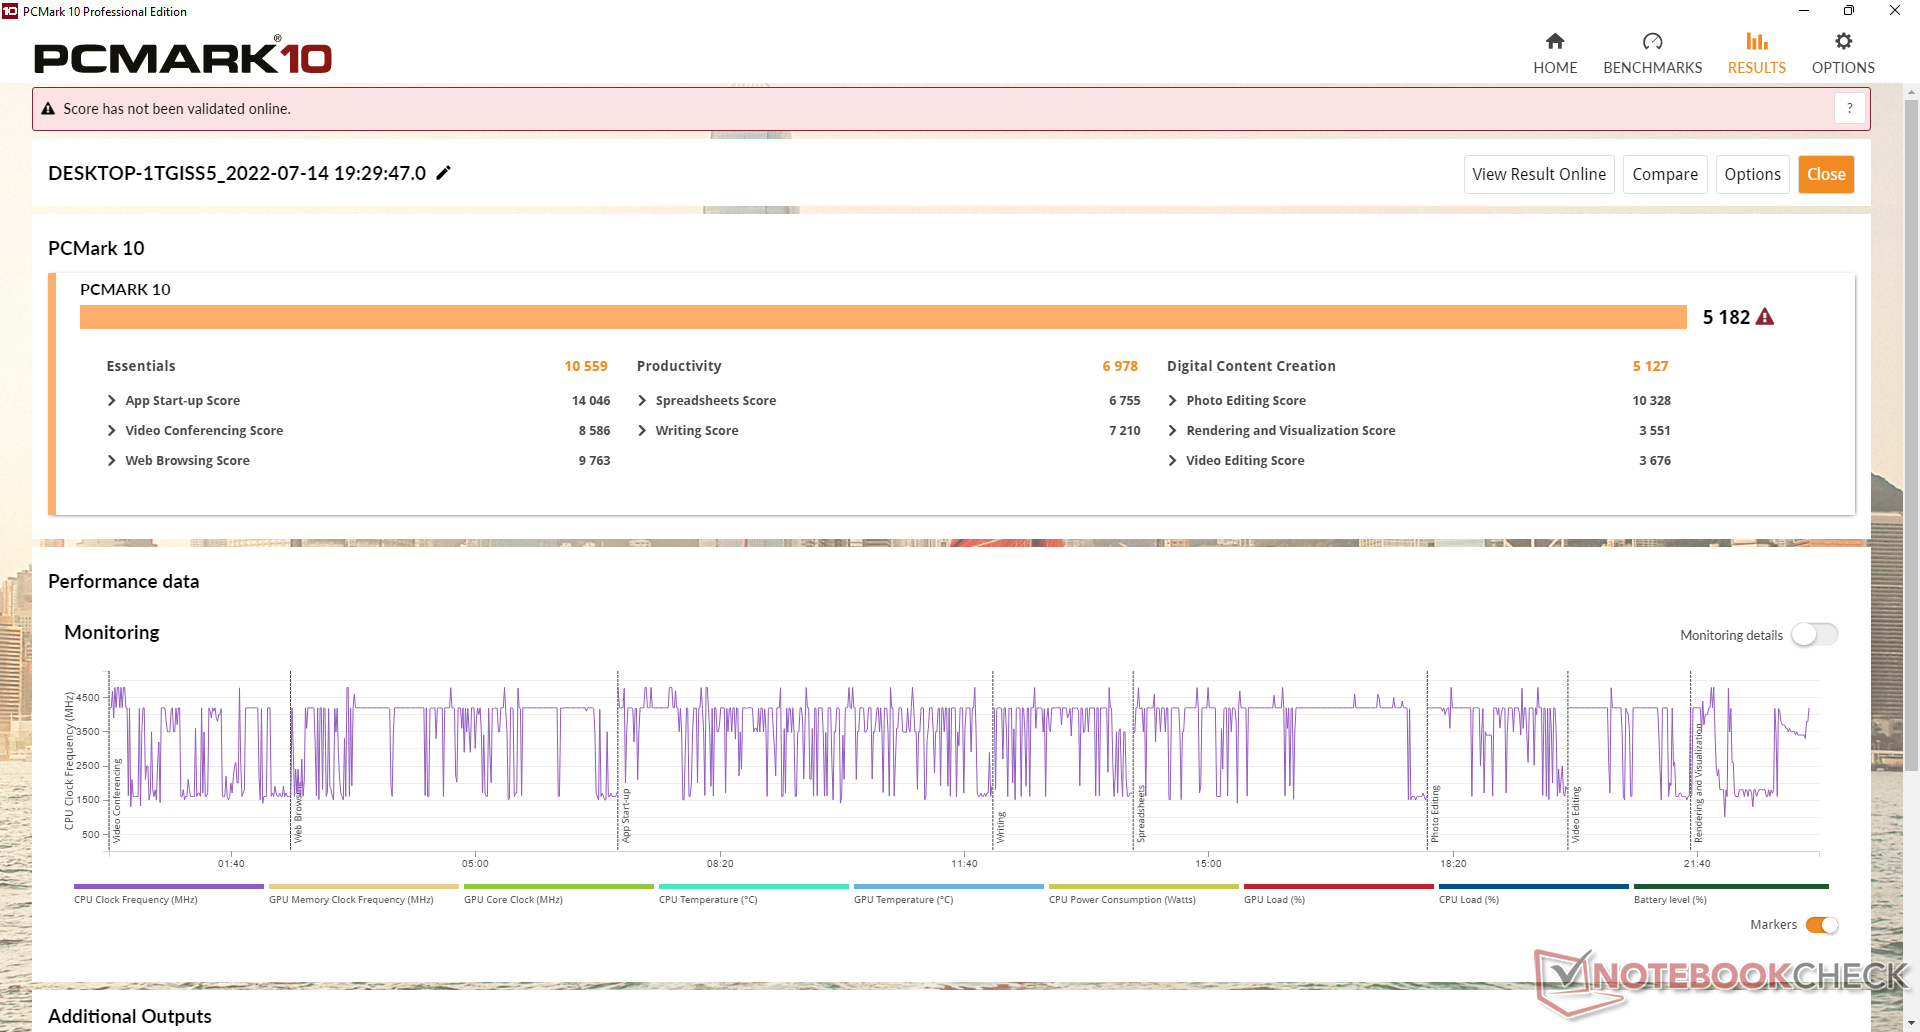
As pontuações PCMark são mais altas do que em muitos outros laptops comerciais rodando em CPUs de última geração ou mais antigas, tais como oMicrosoft Superfície Laptop 4 ou especialmente o Latitude 7310. OLivro Razer 13 chega muito perto devido a seu SSD mais rápido e desempenho gráfico integrado.
CrossMark: Overall | Productivity | Creativity | Responsiveness
| PCMark 10 / Score | |
| Framework Laptop 13.5 12th Gen Intel | |
| Média Intel Core i7-1265U, Intel Iris Xe Graphics G7 96EUs (4753 - 5766, n=7) | |
| Dell Latitude 13 7330 | |
| Razer Book 13 FHD | |
| Microsoft Surface Laptop 4 13 Ryzen 5 | |
| Dell Latitude 7310 | |
| Lenovo ThinkPad X13 Yoga 20SX0004GE | |
| PCMark 10 / Essentials | |
| Framework Laptop 13.5 12th Gen Intel | |
| Dell Latitude 13 7330 | |
| Média Intel Core i7-1265U, Intel Iris Xe Graphics G7 96EUs (9278 - 11418, n=7) | |
| Razer Book 13 FHD | |
| Lenovo ThinkPad X13 Yoga 20SX0004GE | |
| Dell Latitude 7310 | |
| Microsoft Surface Laptop 4 13 Ryzen 5 | |
| PCMark 10 / Productivity | |
| Dell Latitude 7310 | |
| Framework Laptop 13.5 12th Gen Intel | |
| Dell Latitude 13 7330 | |
| Lenovo ThinkPad X13 Yoga 20SX0004GE | |
| Razer Book 13 FHD | |
| Média Intel Core i7-1265U, Intel Iris Xe Graphics G7 96EUs (5828 - 7311, n=7) | |
| Microsoft Surface Laptop 4 13 Ryzen 5 | |
| PCMark 10 / Digital Content Creation | |
| Framework Laptop 13.5 12th Gen Intel | |
| Média Intel Core i7-1265U, Intel Iris Xe Graphics G7 96EUs (5127 - 6330, n=7) | |
| Razer Book 13 FHD | |
| Dell Latitude 13 7330 | |
| Microsoft Surface Laptop 4 13 Ryzen 5 | |
| Dell Latitude 7310 | |
| Lenovo ThinkPad X13 Yoga 20SX0004GE | |
| CrossMark / Overall | |
| Framework Laptop 13.5 12th Gen Intel | |
| Média Intel Core i7-1265U, Intel Iris Xe Graphics G7 96EUs (1301 - 1615, n=7) | |
| Dell Latitude 13 7330 | |
| CrossMark / Productivity | |
| Framework Laptop 13.5 12th Gen Intel | |
| Dell Latitude 13 7330 | |
| Média Intel Core i7-1265U, Intel Iris Xe Graphics G7 96EUs (1230 - 1586, n=7) | |
| CrossMark / Creativity | |
| Framework Laptop 13.5 12th Gen Intel | |
| Média Intel Core i7-1265U, Intel Iris Xe Graphics G7 96EUs (1413 - 1706, n=7) | |
| Dell Latitude 13 7330 | |
| CrossMark / Responsiveness | |
| Framework Laptop 13.5 12th Gen Intel | |
| Média Intel Core i7-1265U, Intel Iris Xe Graphics G7 96EUs (1193 - 1521, n=7) | |
| Dell Latitude 13 7330 | |
| PCMark 10 Score | 5182 pontos | |
Ajuda | ||
| AIDA64 / Memory Copy | |
| Média Intel Core i7-1265U (40212 - 72204, n=10) | |
| Framework Laptop 13.5 12th Gen Intel | |
| Dell Latitude 13 7330 | |
| Microsoft Surface Laptop 4 13 Ryzen 5 | |
| Dell Latitude 7310 | |
| Lenovo ThinkPad X13 Yoga 20SX0004GE | |
| AIDA64 / Memory Read | |
| Média Intel Core i7-1265U (41808 - 69493, n=10) | |
| Framework Laptop 13.5 12th Gen Intel | |
| Microsoft Surface Laptop 4 13 Ryzen 5 | |
| Dell Latitude 13 7330 | |
| Dell Latitude 7310 | |
| Lenovo ThinkPad X13 Yoga 20SX0004GE | |
| AIDA64 / Memory Write | |
| Média Intel Core i7-1265U (41382 - 76027, n=10) | |
| Framework Laptop 13.5 12th Gen Intel | |
| Dell Latitude 13 7330 | |
| Microsoft Surface Laptop 4 13 Ryzen 5 | |
| Dell Latitude 7310 | |
| Lenovo ThinkPad X13 Yoga 20SX0004GE | |
| AIDA64 / Memory Latency | |
| Microsoft Surface Laptop 4 13 Ryzen 5 | |
| Média Intel Core i7-1265U (74.6 - 112.4, n=10) | |
| Lenovo ThinkPad X13 Yoga 20SX0004GE | |
| Dell Latitude 7310 | |
| Framework Laptop 13.5 12th Gen Intel | |
| Dell Latitude 13 7330 | |
* ... menor é melhor
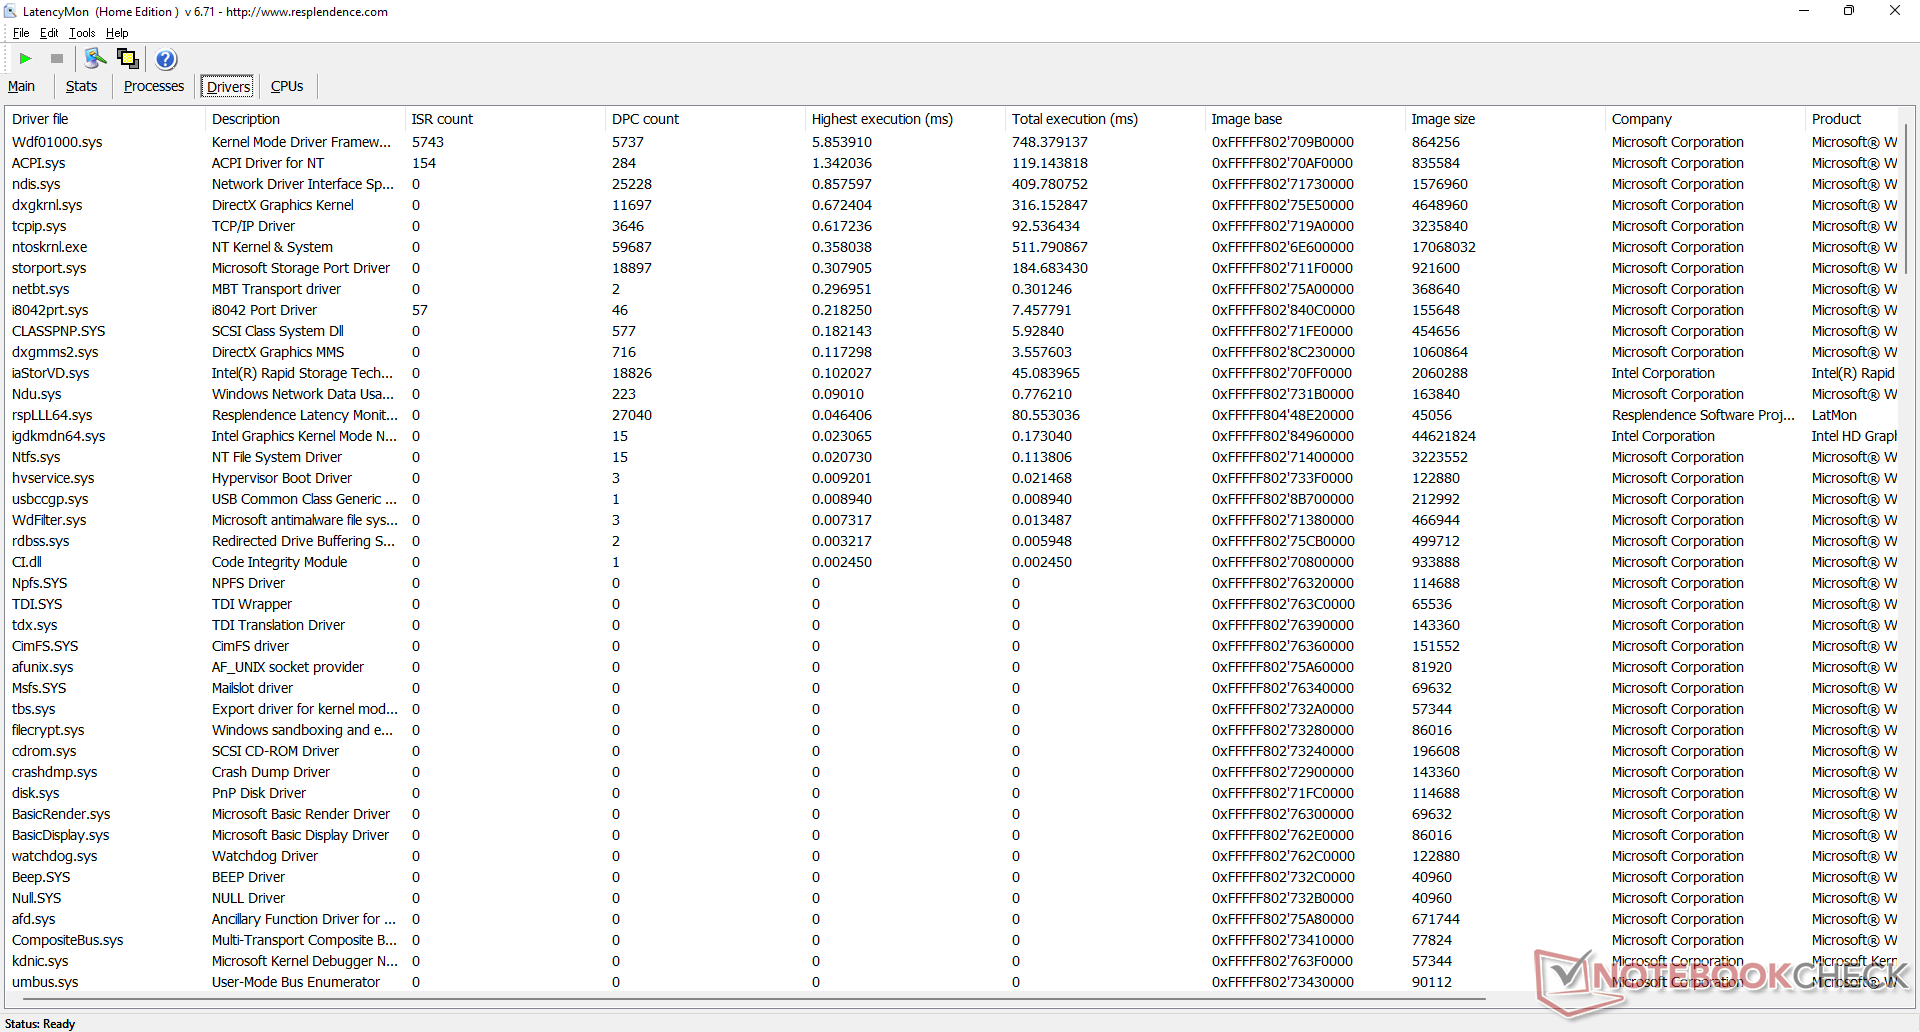
Latência do DPC
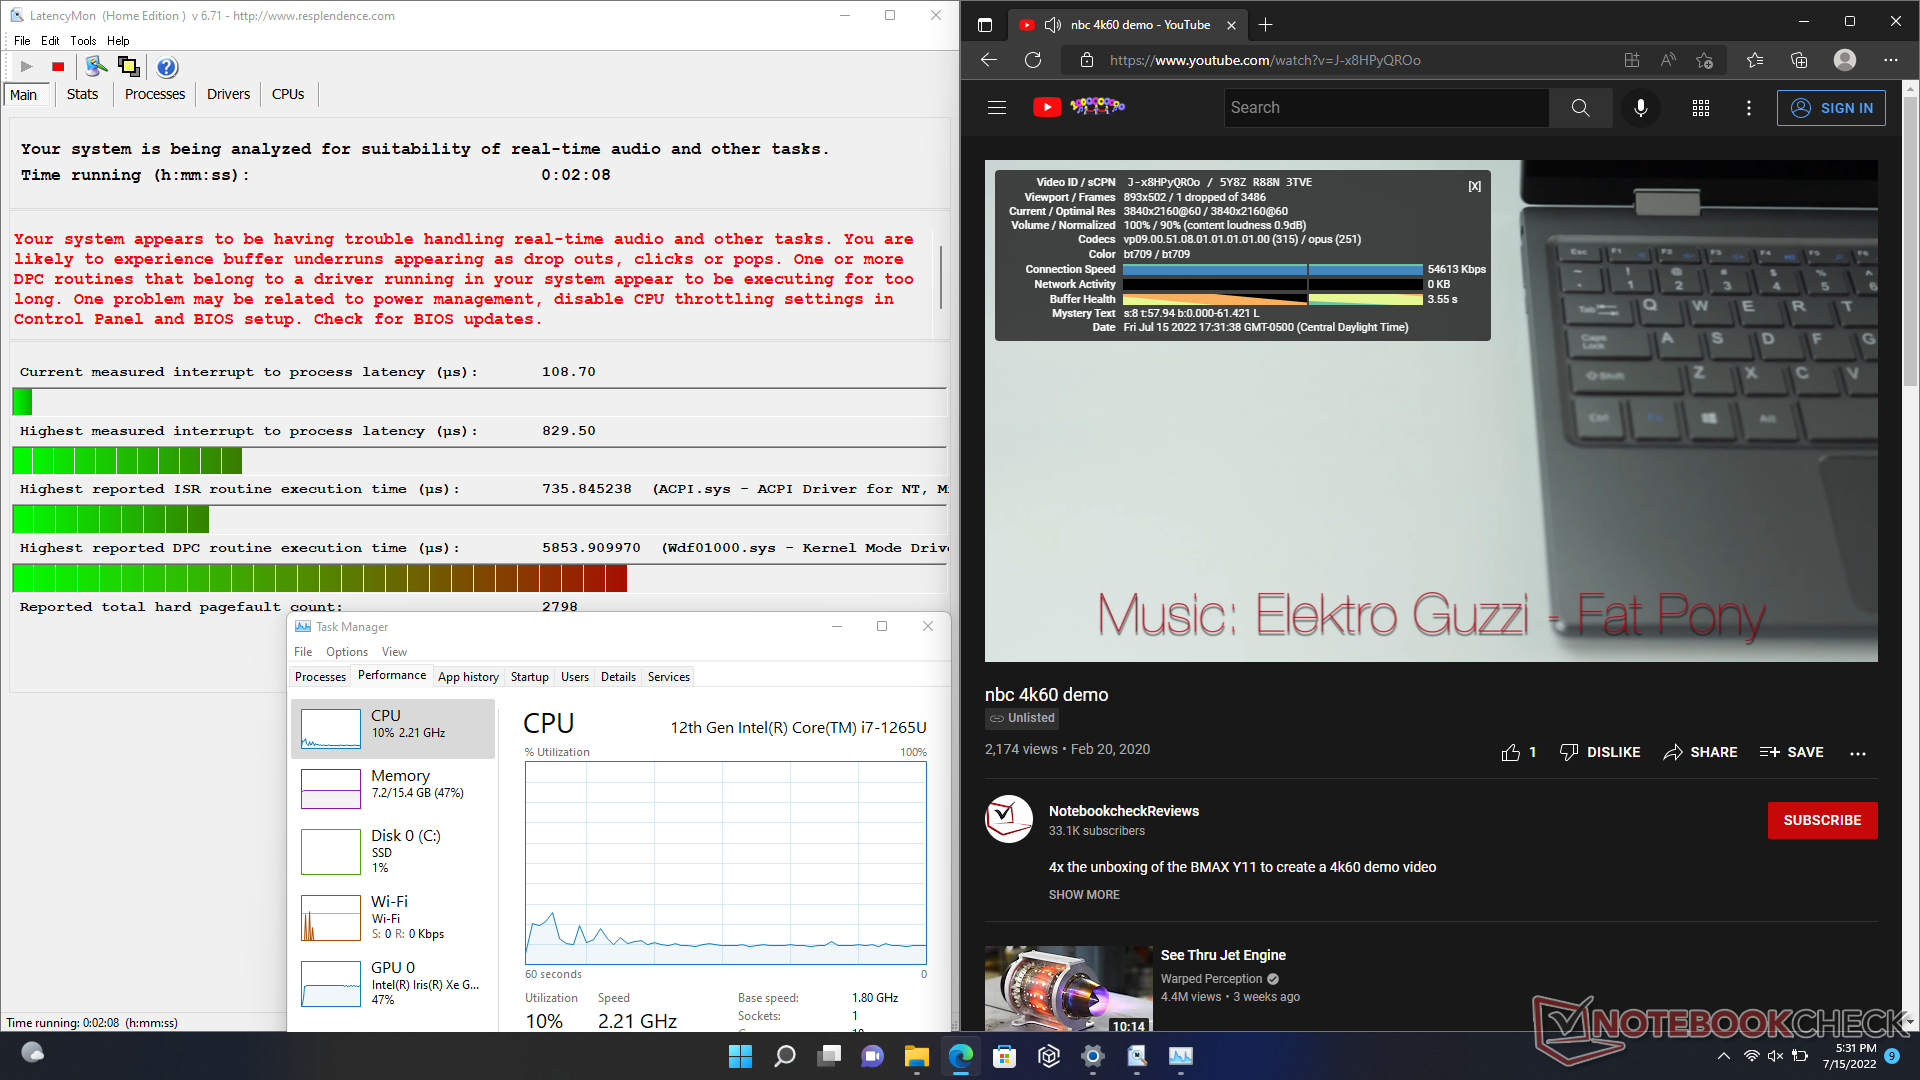
LatencyMon revela problemas de DPC ao abrir várias abas do navegador em nossa página inicial. a reprodução do vídeo de 4K a 60 FPS é perfeita com apenas um frame caído durante nossos 60 segundos de vídeo de teste.
| DPC Latencies / LatencyMon - interrupt to process latency (max), Web, Youtube, Prime95 | |
| Razer Book 13 FHD | |
| Framework Laptop 13.5 12th Gen Intel | |
| Lenovo ThinkPad X13 Yoga 20SX0004GE | |
| Microsoft Surface Laptop 4 13 Ryzen 5 | |
| Dell Latitude 13 7330 | |
| Dell Latitude 7310 | |
* ... menor é melhor
Dispositivos de armazenamento - Um só acionamento interno
A Dell gosta de enviar muitos de seus sub-portáteis com M.2 2230 SSDs mais curtos em comparação com os 2280 drives mais longos na maioria dos outros laptops. O 512 GB Kioxia A unidade PCIe3 x4 em nossa unidade de teste ficaria em 2400 MB/s por apenas um curto período antes do aceleramento para reduzir as taxas de transferência para apenas 1200 MB/s, como mostram os resultados de nosso teste de loop DiskSpd abaixo. É provável que o acionamento tenha limitações de temperatura quando estressado. Em comparação, oHP EliteBook 845 G9 é capaz de manter taxas de transferência significativamente mais rápidas por períodos mais longos com seu drive PCIe4 x4 incluído quando submetido às mesmas condições de teste.

| Drive Performance rating - Percent | |
| Lenovo ThinkPad X13 Yoga 20SX0004GE | |
| Framework Laptop 13.5 12th Gen Intel | |
| Dell Latitude 7310 | |
| Razer Book 13 FHD | |
| Dell Latitude 13 7330 | |
| Microsoft Surface Laptop 4 13 Ryzen 5 | |
* ... menor é melhor
Disk Throttling: DiskSpd Read Loop, Queue Depth 8
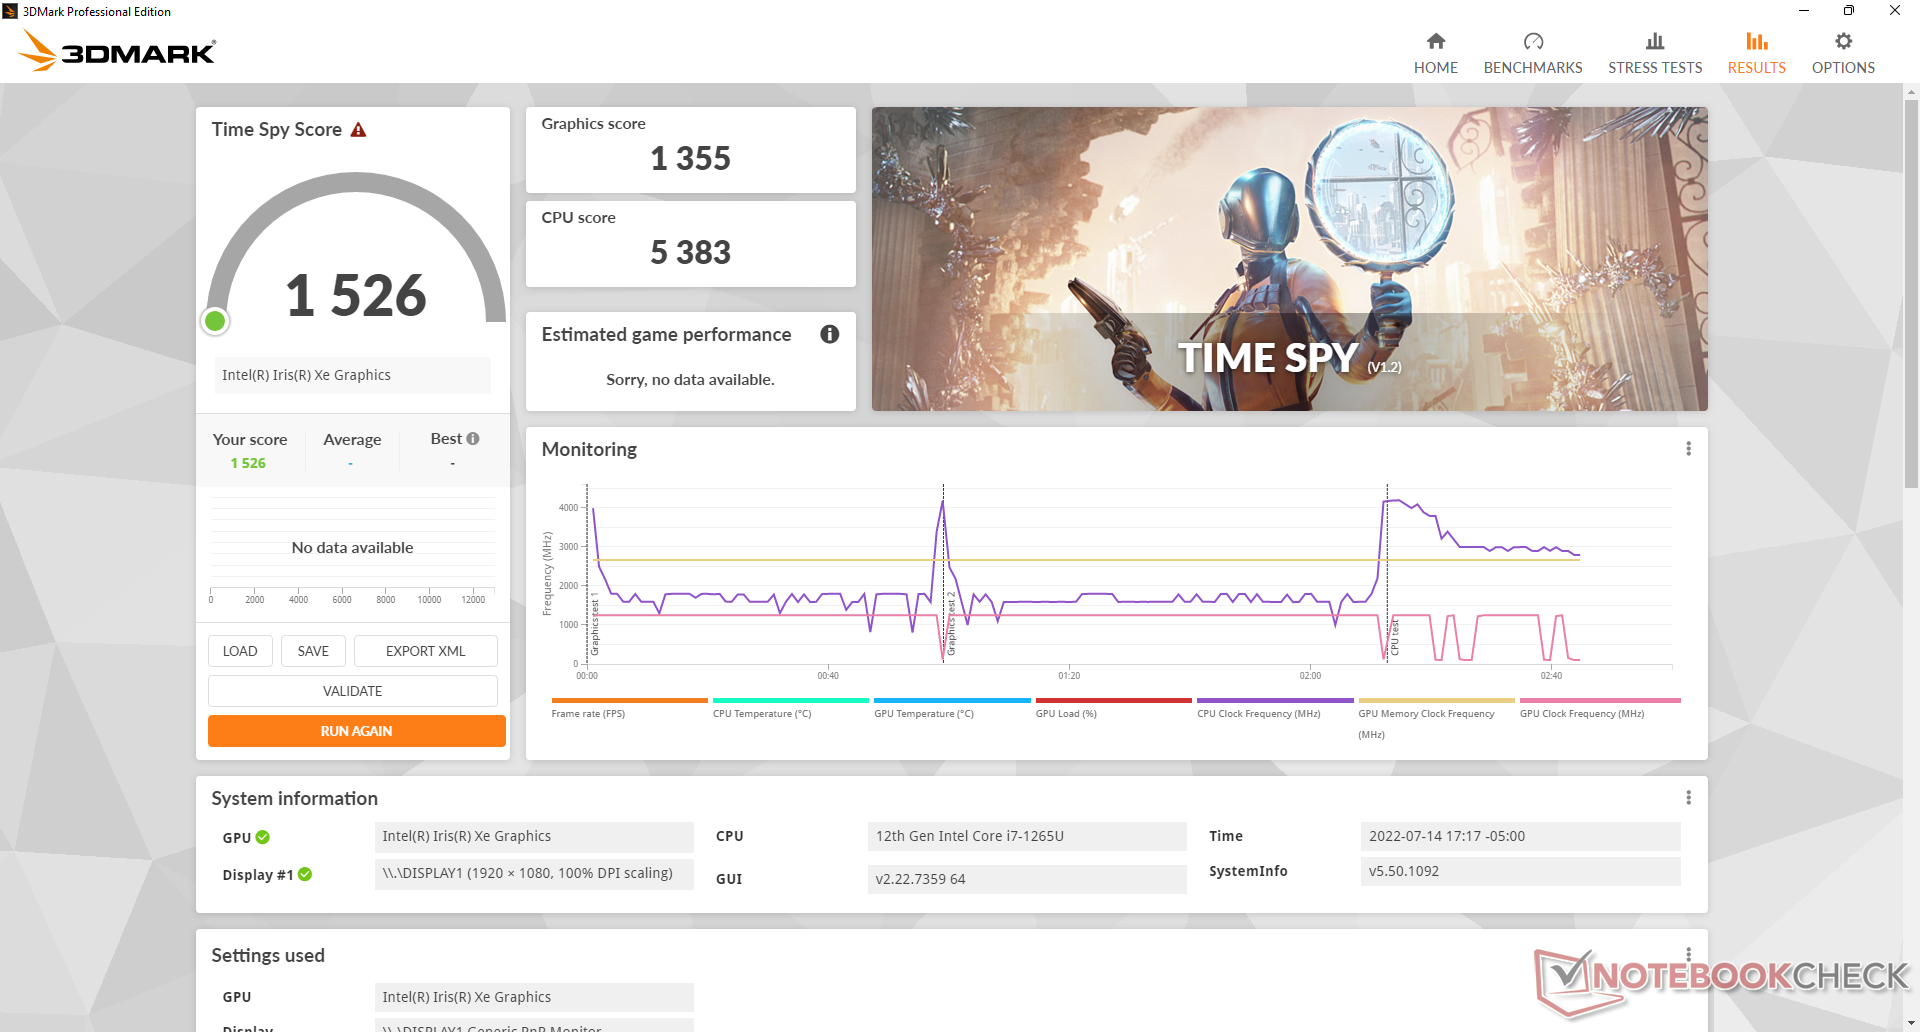
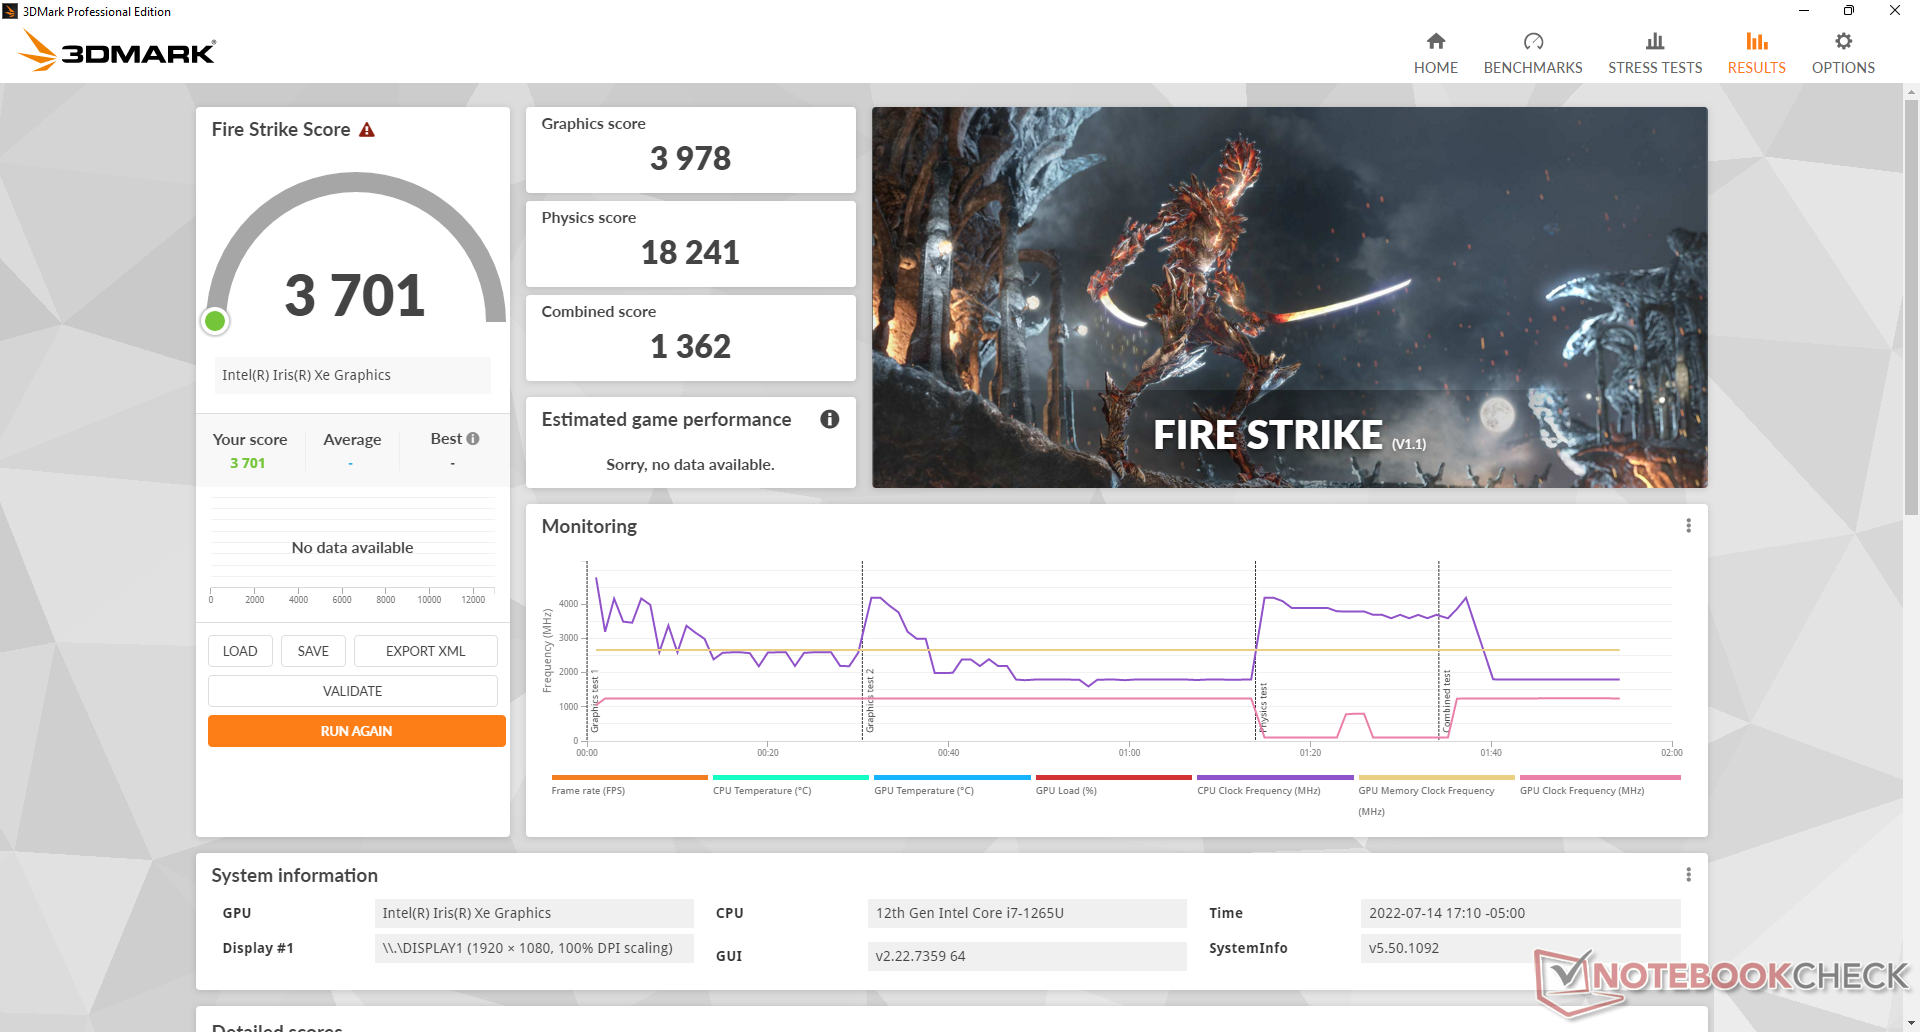
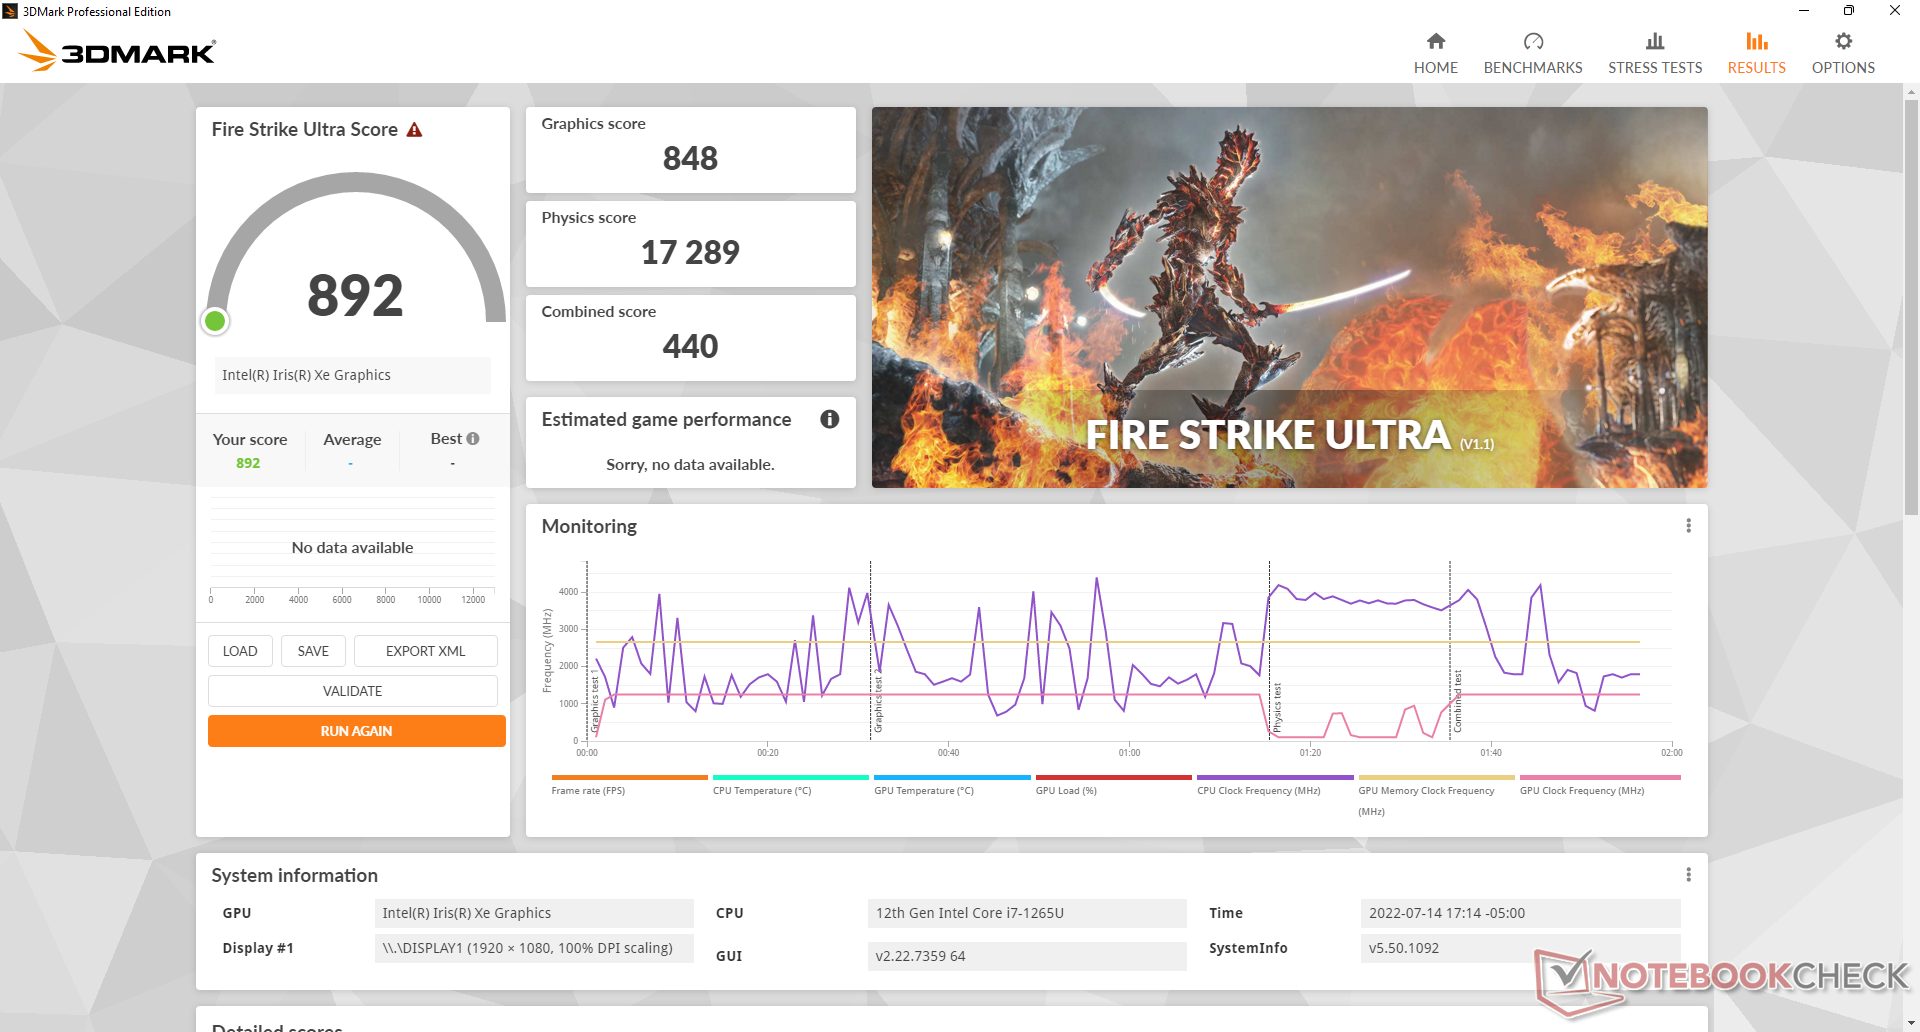
GPU Performance - Iris Xe Chugs Along
O desempenho gráfico é cerca de 5 a 20% mais lento do que a média do laptop em nosso banco de dados equipado com o mesmo Iris Xe 96 EUs GPU. Ainda é rápido para um chip gráfico integrado, mas certamente há opções mais rápidas disponíveis, tais como a Livro Razer 13 ou AMD-powered Asus Zenbook S 13 se a maximização do desempenho da GPU é uma prioridade.
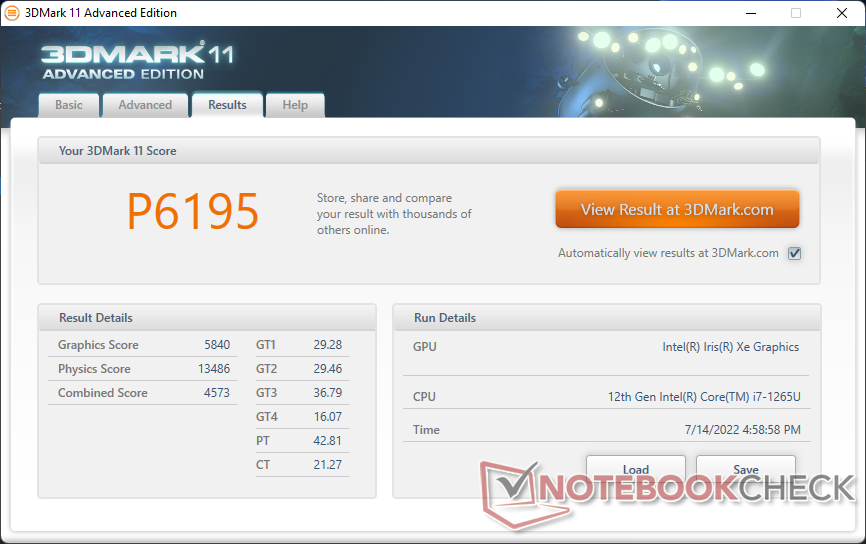
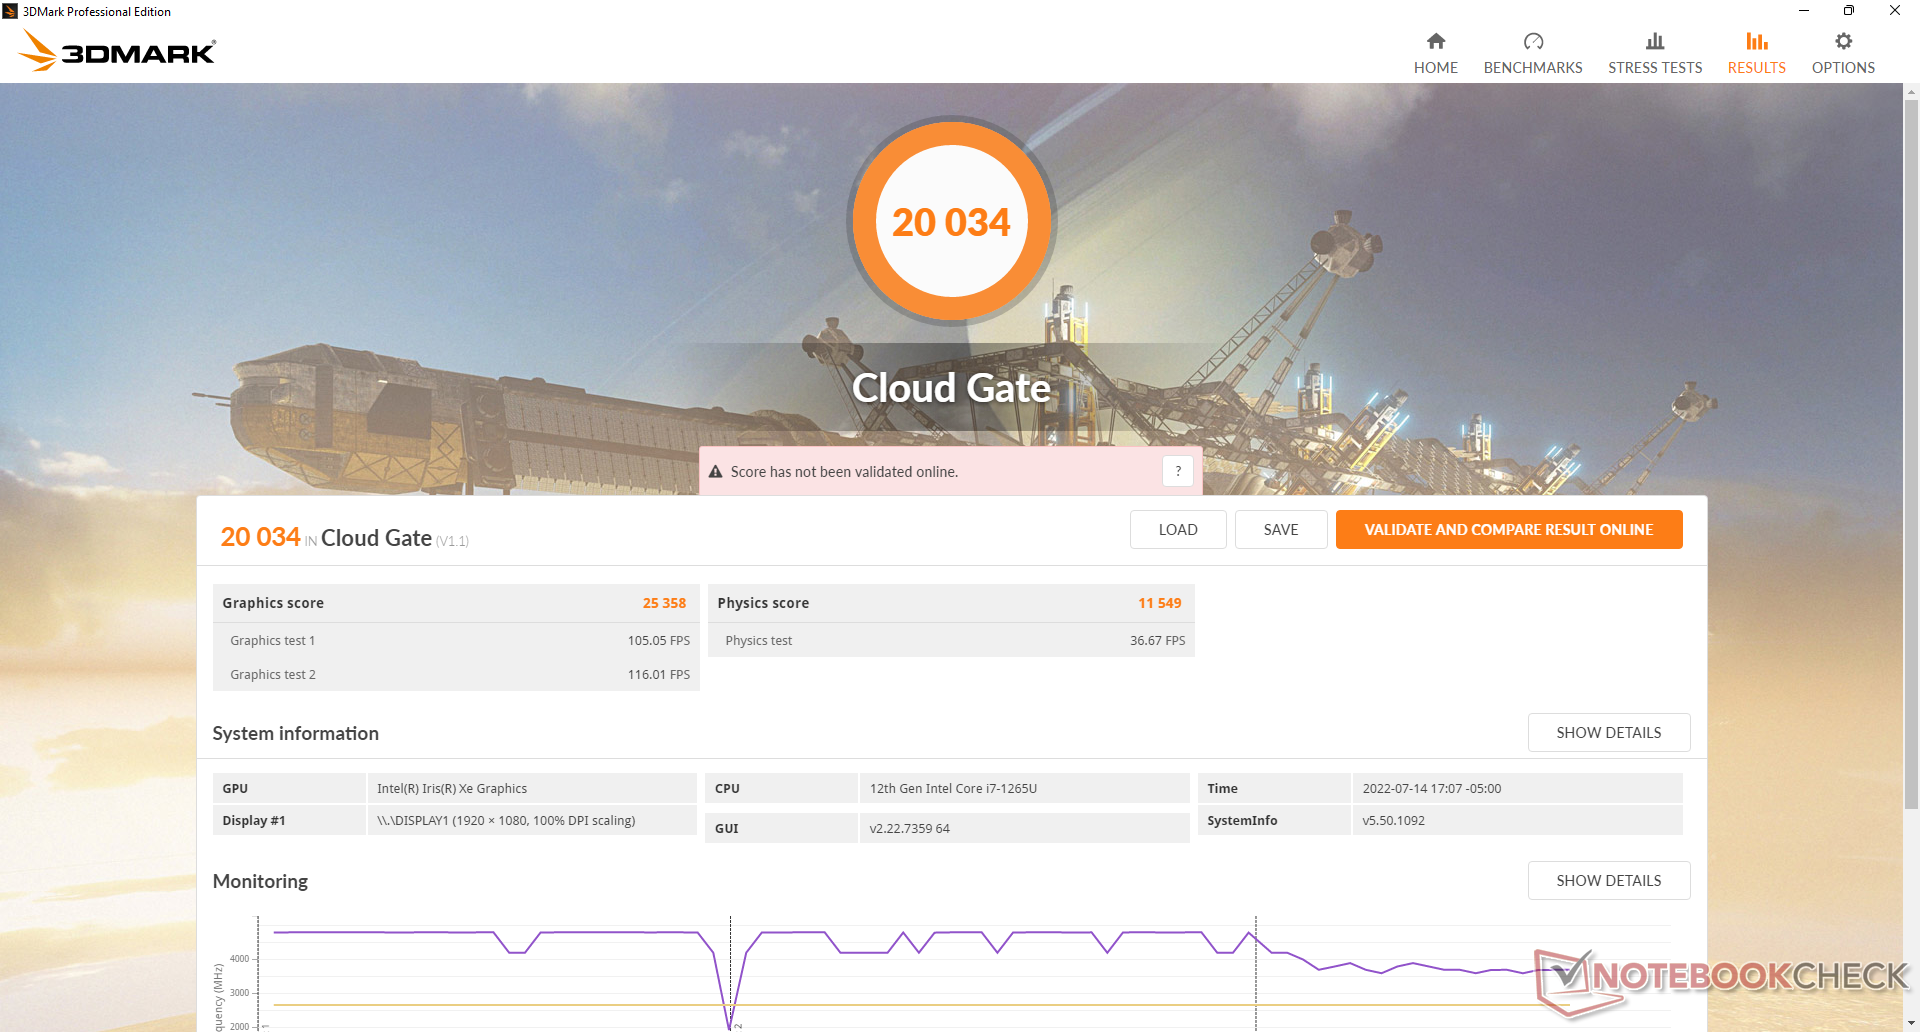
| 3DMark 11 Performance | 6195 pontos | |
| 3DMark Cloud Gate Standard Score | 20034 pontos | |
| 3DMark Fire Strike Score | 3701 pontos | |
| 3DMark Time Spy Score | 1526 pontos | |
Ajuda | ||
| Cyberpunk 2077 1.6 | |
| 1920x1080 Low Preset | |
| Framework Laptop 13.5 12th Gen Intel | |
| Média Intel Iris Xe Graphics G7 96EUs (13 - 25.9, n=42) | |
| Dell Latitude 13 7330 | |
| 1920x1080 Medium Preset | |
| Framework Laptop 13.5 12th Gen Intel | |
| Média Intel Iris Xe Graphics G7 96EUs (10.8 - 21.7, n=37) | |
| Dell Latitude 13 7330 | |
| 1920x1080 High Preset | |
| Framework Laptop 13.5 12th Gen Intel | |
| Média Intel Iris Xe Graphics G7 96EUs (9.8 - 16.9, n=34) | |
| Dell Latitude 13 7330 | |
Witcher 3 FPS Chart
| baixo | média | alto | ultra | |
|---|---|---|---|---|
| GTA V (2015) | 84.5 | 64.7 | 13.9 | 6.15 |
| The Witcher 3 (2015) | 71.6 | 47.3 | 23.6 | 11.9 |
| Dota 2 Reborn (2015) | 109.7 | 79.6 | 50.6 | 44.9 |
| Final Fantasy XV Benchmark (2018) | 32.9 | 17.5 | 12.9 | |
| X-Plane 11.11 (2018) | 47.3 | 33.8 | 30.3 | |
| Strange Brigade (2018) | 75.8 | 29.8 | 24.9 | 20 |
| Cyberpunk 2077 1.6 (2022) | 18.7 | 15.4 | 11.2 |
Emissões
Ruído do Sistema - Principalmente Silencioso
O ruído do ventilador tende a pairar entre um fundo silencioso de 23,4 dB(A) e 25,3 dB(A) quando a navegação na web ou o processamento de texto é quase inaudível na maioria dos ambientes. Entretanto, ele começa a captar rapidamente quando executando cargas mais exigentes como 3DMark 06 onde o ruído do ventilador pode chegar a 38 dB(A) para ser mais alto do que o que gravamos no ThinkPad X13 Yoga, Razer Book 13, ou mais antigo Latitude 7310. O ruído dos ventiladores cicla entre 37 e 39 dB(A) quando em funcionamento Witcher 3 em vez de permanecer estável, o que teria sido preferível.
Ao executar Prime95, o ruído do ventilador aumentaria para 43 dB(A) por apenas um curto período antes de cair rapidamente de volta à faixa de 39 dB(A).
Barulho
| Ocioso |
| 23.4 / 23.4 / 23.4 dB |
| Carga |
| 37.8 / 43 dB |
 | ||
30 dB silencioso 40 dB(A) audível 50 dB(A) ruidosamente alto |
||
min: | ||
| Dell Latitude 13 7330 Iris Xe G7 96EUs, i7-1265U, Toshiba KBG40ZNS512G NVMe | Lenovo ThinkPad X13 Yoga 20SX0004GE UHD Graphics 620, i7-10510U, Samsung SSD PM981a MZVLB512HBJQ | Framework Laptop 13.5 12th Gen Intel Iris Xe G7 96EUs, i7-1260P, WDC PC SN730 SDBPNTY-512G | Razer Book 13 FHD Iris Xe G7 96EUs, i7-1165G7, Samsung SSD PM981a MZVLB256HBHQ | Dell Latitude 7310 UHD Graphics 620, i7-10610U, Samsung SSD PM981a MZVLB512HBJQ | Microsoft Surface Laptop 4 13 Ryzen 5 Vega 7, R5 4680U, Samsung PM991 MZ9LQ256HBJQ | |
|---|---|---|---|---|---|---|
| Noise | -13% | -8% | -4% | -12% | -3% | |
| desligado / ambiente * (dB) | 23.4 | 29.3 -25% | 22.8 3% | 27 -15% | 29 -24% | 24.6 -5% |
| Idle Minimum * (dB) | 23.4 | 29.3 -25% | 23 2% | 27 -15% | 29 -24% | 24.6 -5% |
| Idle Average * (dB) | 23.4 | 29.3 -25% | 23 2% | 27 -15% | 29 -24% | 24.6 -5% |
| Idle Maximum * (dB) | 23.4 | 31.4 -34% | 23 2% | 27.1 -16% | 29 -24% | 24.6 -5% |
| Load Average * (dB) | 37.8 | 33 13% | 47.3 -25% | 29 23% | 30.1 20% | 39.5 -4% |
| Witcher 3 ultra * (dB) | 39.2 | 47.3 -21% | 33.3 15% | |||
| Load Maximum * (dB) | 43 | 34.9 19% | 49.8 -16% | 44.8 -4% | 41.3 4% | 39.5 8% |
* ... menor é melhor
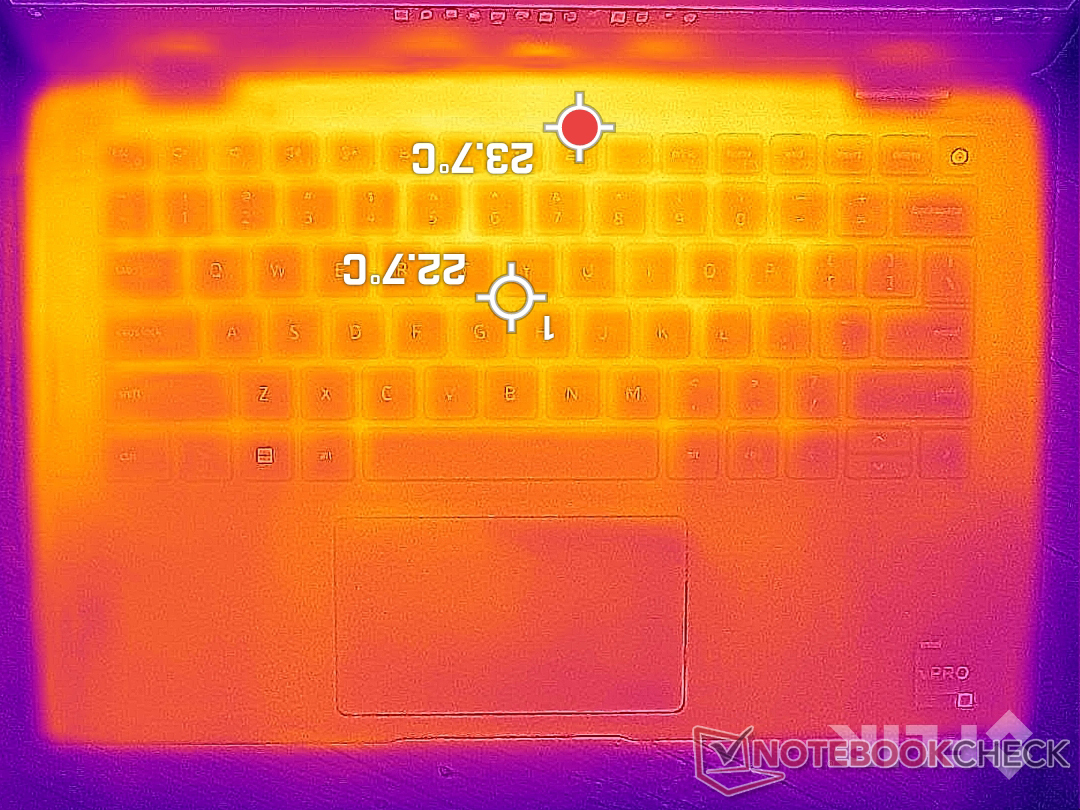
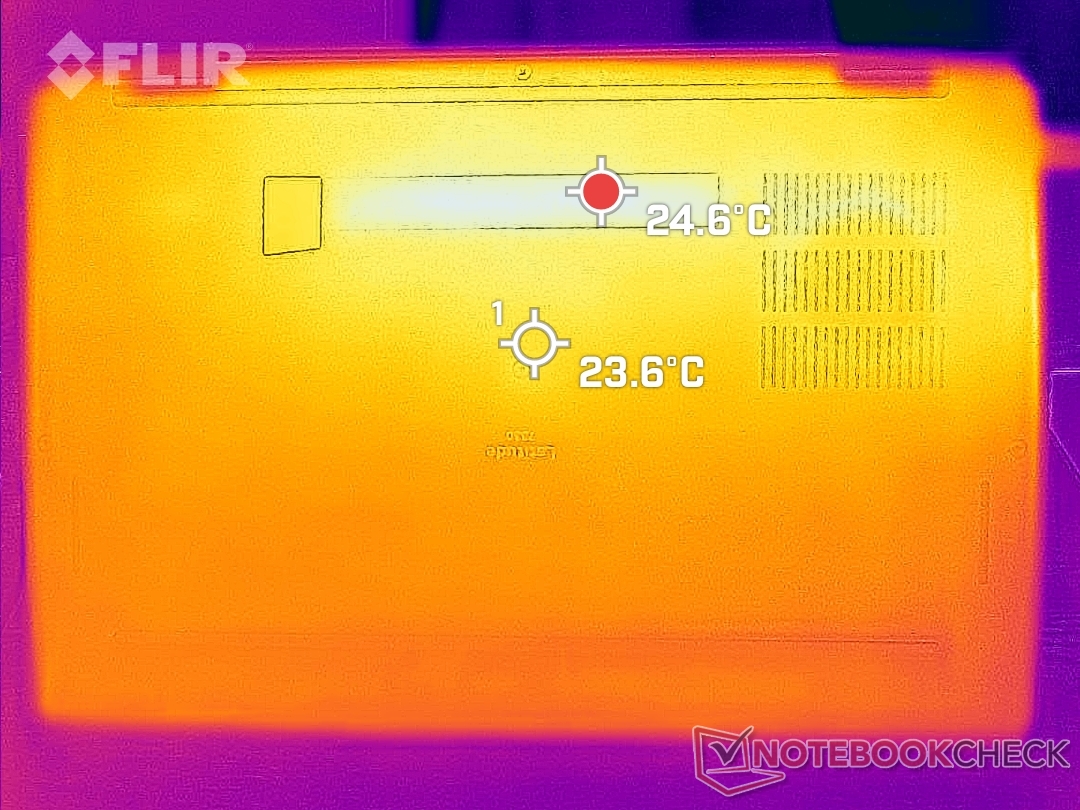
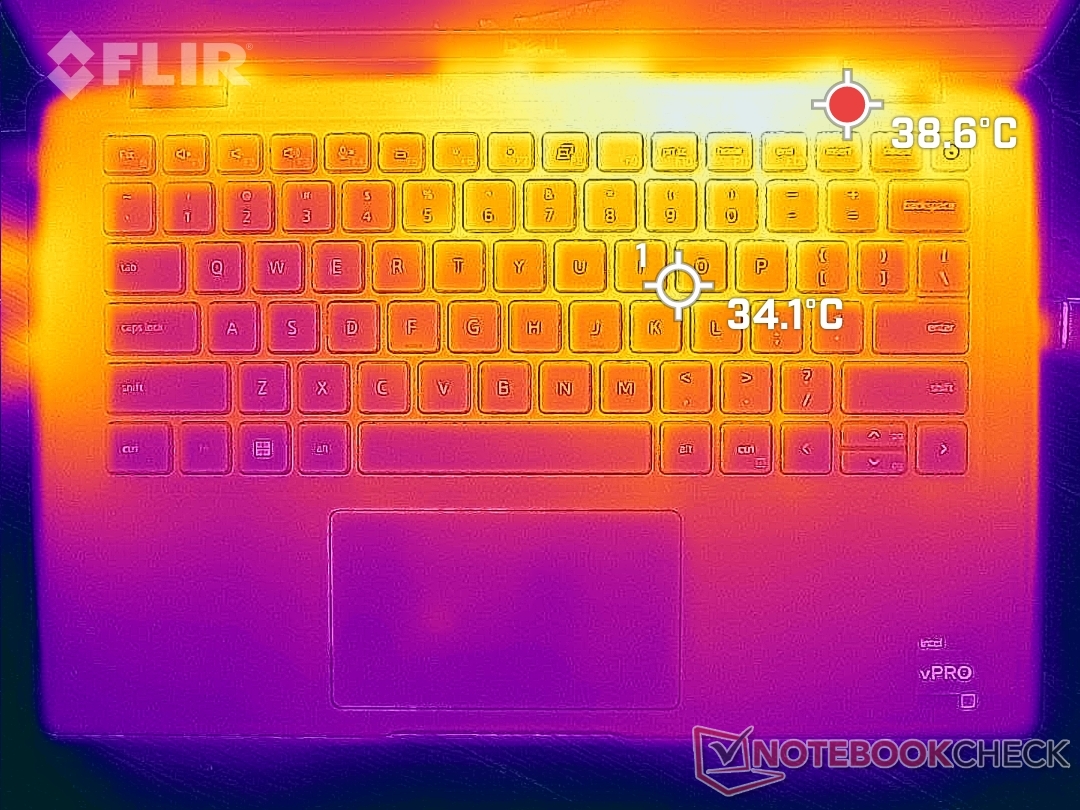
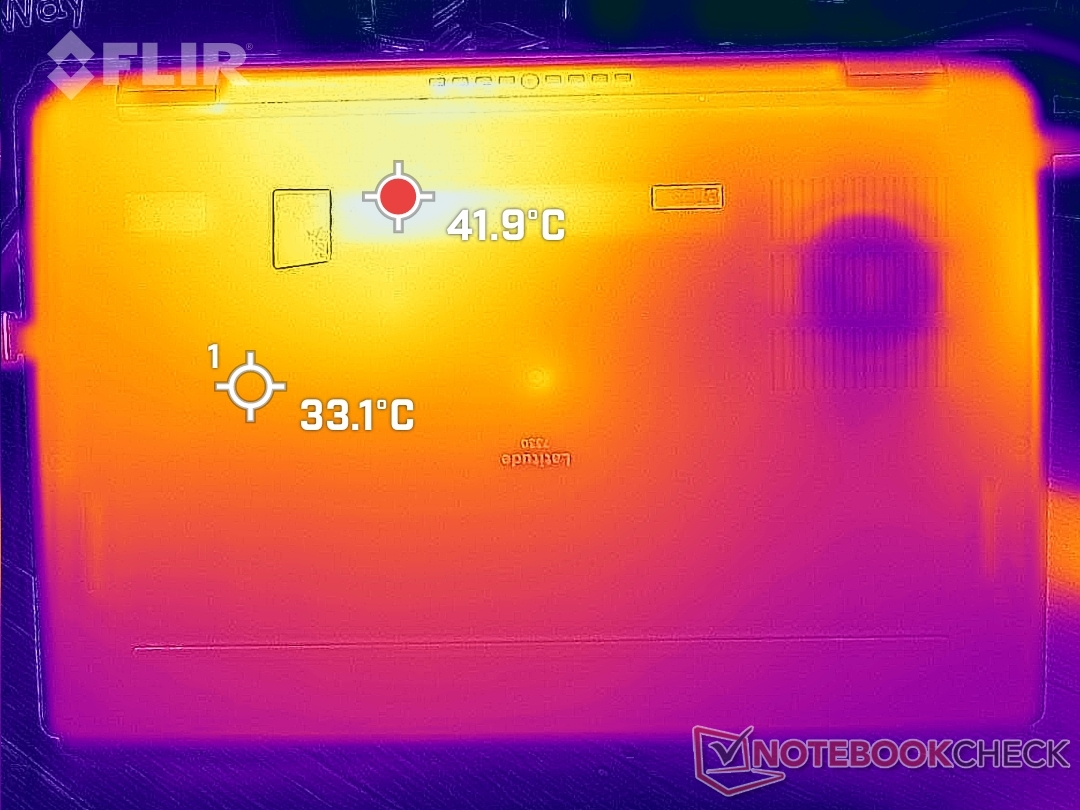
Temperatura
As temperaturas de superfície não são um problema no site Latitude 7330. Na pior das hipóteses, somos capazes de registrar pontos quentes de 39 C e 42 C nas superfícies superior e inferior, respectivamente, para serem mais frios do que os 46 C e 53 C que registramos no antigo Latitude 7310. Estes pontos quentes estão também na parte traseira do chassi, longe das teclas do teclado e dos apoios das palmas.
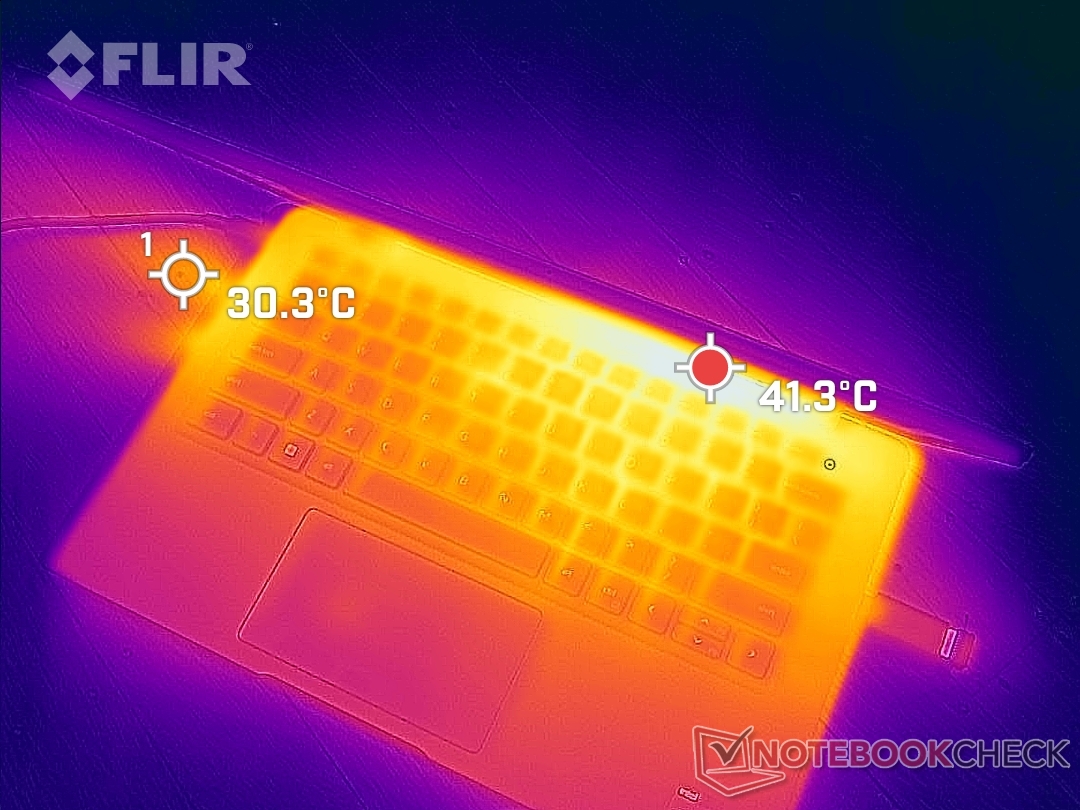
(+) A temperatura máxima no lado superior é 38.6 °C / 101 F, em comparação com a média de 34.3 °C / 94 F , variando de 21.2 a 62.5 °C para a classe Office.
(±) A parte inferior aquece até um máximo de 42 °C / 108 F, em comparação com a média de 36.8 °C / 98 F
(+) Em uso inativo, a temperatura média para o lado superior é 22.2 °C / 72 F, em comparação com a média do dispositivo de 29.5 °C / ### class_avg_f### F.
(+) Os apoios para as mãos e o touchpad são mais frios que a temperatura da pele, com um máximo de 23.2 °C / 73.8 F e, portanto, são frios ao toque.
(+) A temperatura média da área do apoio para as mãos de dispositivos semelhantes foi 27.5 °C / 81.5 F (+4.3 °C / 7.7 F).
| Dell Latitude 13 7330 Intel Core i7-1265U, Intel Iris Xe Graphics G7 96EUs | Lenovo ThinkPad X13 Yoga 20SX0004GE Intel Core i7-10510U, Intel UHD Graphics 620 | Framework Laptop 13.5 12th Gen Intel Intel Core i7-1260P, Intel Iris Xe Graphics G7 96EUs | Razer Book 13 FHD Intel Core i7-1165G7, Intel Iris Xe Graphics G7 96EUs | Dell Latitude 7310 Intel Core i7-10610U, Intel UHD Graphics 620 | Microsoft Surface Laptop 4 13 Ryzen 5 AMD Ryzen 5 4680U, AMD Radeon RX Vega 7 | |
|---|---|---|---|---|---|---|
| Heat | -31% | -4% | -3% | -22% | -9% | |
| Maximum Upper Side * (°C) | 38.6 | 43.8 -13% | 36.8 5% | 39.2 -2% | 45.2 -17% | 45.8 -19% |
| Maximum Bottom * (°C) | 42 | 65 -55% | 42.4 -1% | 44 -5% | 52.8 -26% | 45.5 -8% |
| Idle Upper Side * (°C) | 23.8 | 29.2 -23% | 24.2 -2% | 23 3% | 28.2 -18% | 24.9 -5% |
| Idle Bottom * (°C) | 24.6 | 32.7 -33% | 29 -18% | 26.8 -9% | 31.6 -28% | 25.7 -4% |
* ... menor é melhor
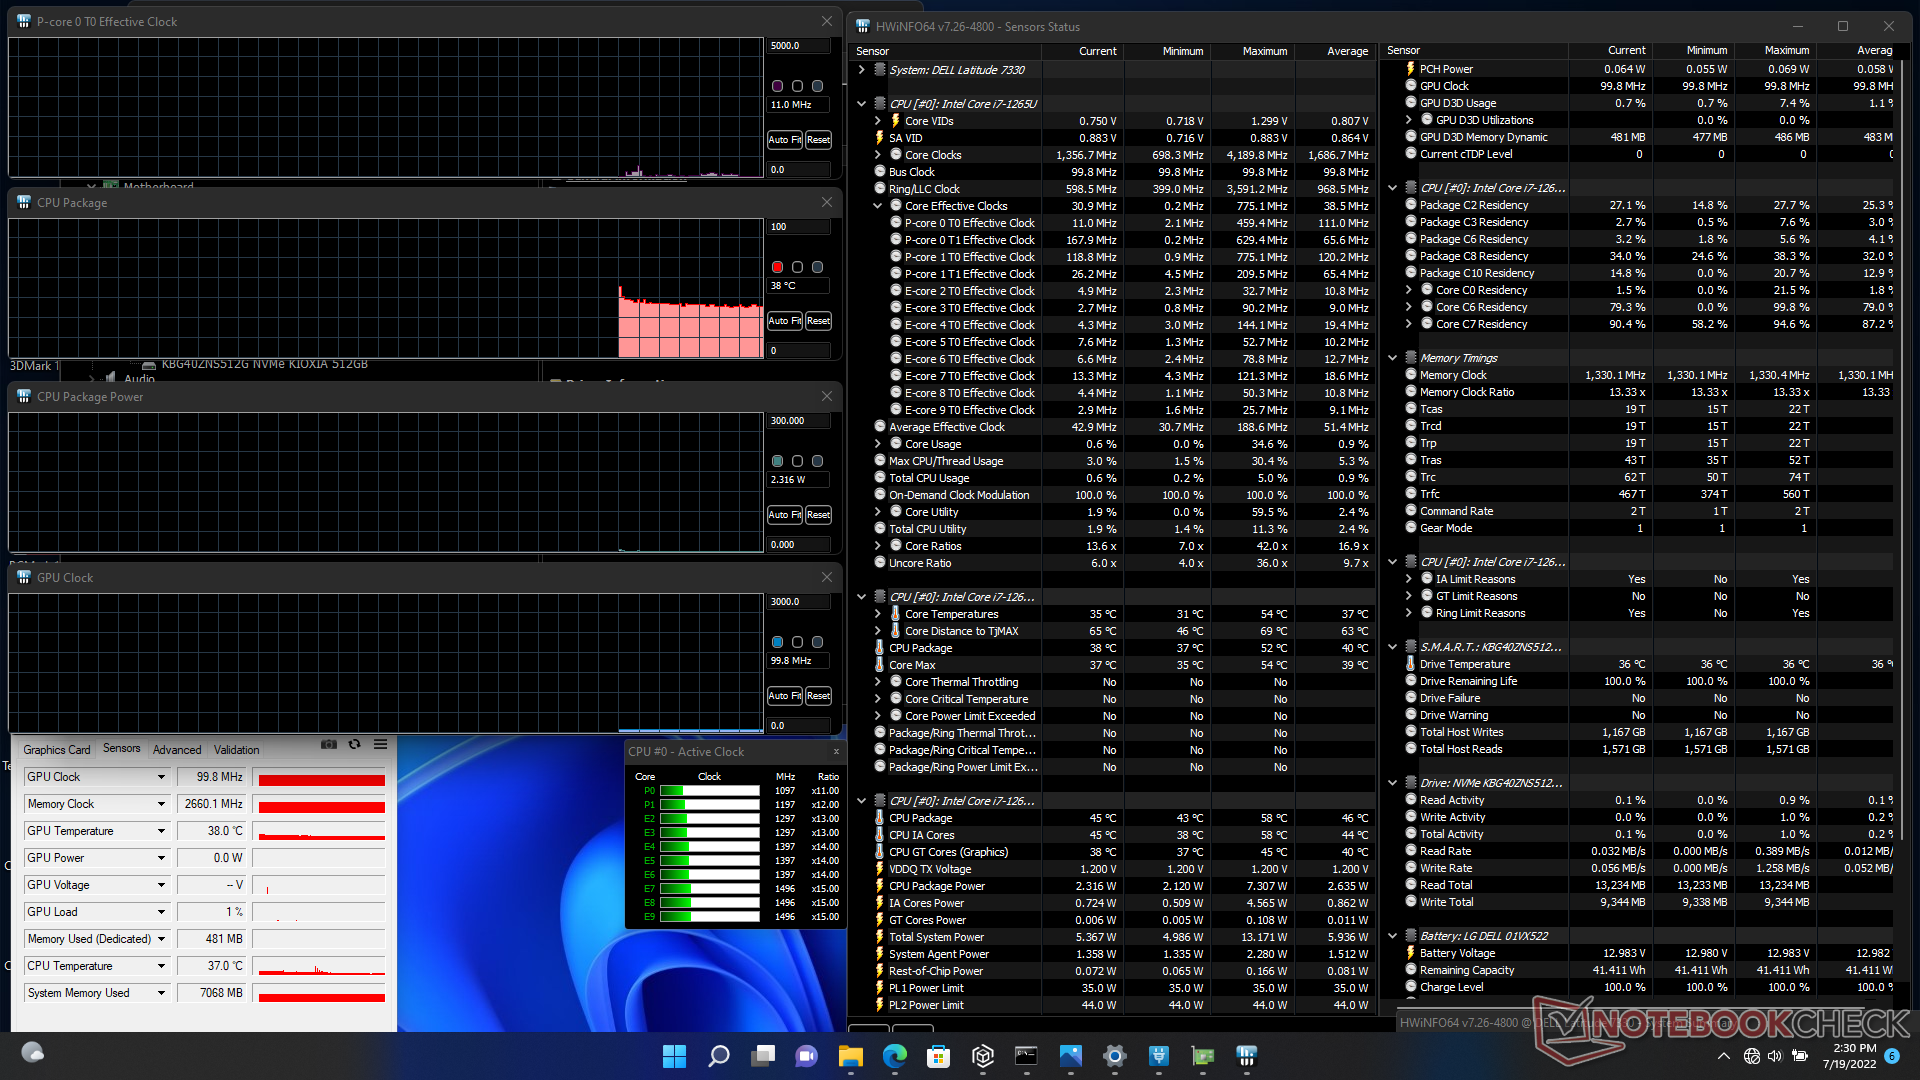
Teste de estresse
Ao rodar Prime95, as taxas de relógio da CPU aumentariam para 3,8 GHz durante os primeiros segundos, com um consumo de energia da placa e temperatura central de 44 W e 97 C, respectivamente. Após apenas alguns segundos, no entanto, as taxas de clock começariam a cair constantemente antes de estabilizarem na faixa de 2,1 a 2,5 GHz e 72 a 85 C. O consumo de energia da placa também cairia para a faixa de 23 a 25 W, uma vez que as altas taxas de relógios Turbo Boost são insustentáveis. Estes resultados estão correlacionados com nossas observações de loop do CineBench R15 acima. Repetindo este teste no Livro Razer 13 resultaria em uma temperatura central muito mais fria de 60ºC.
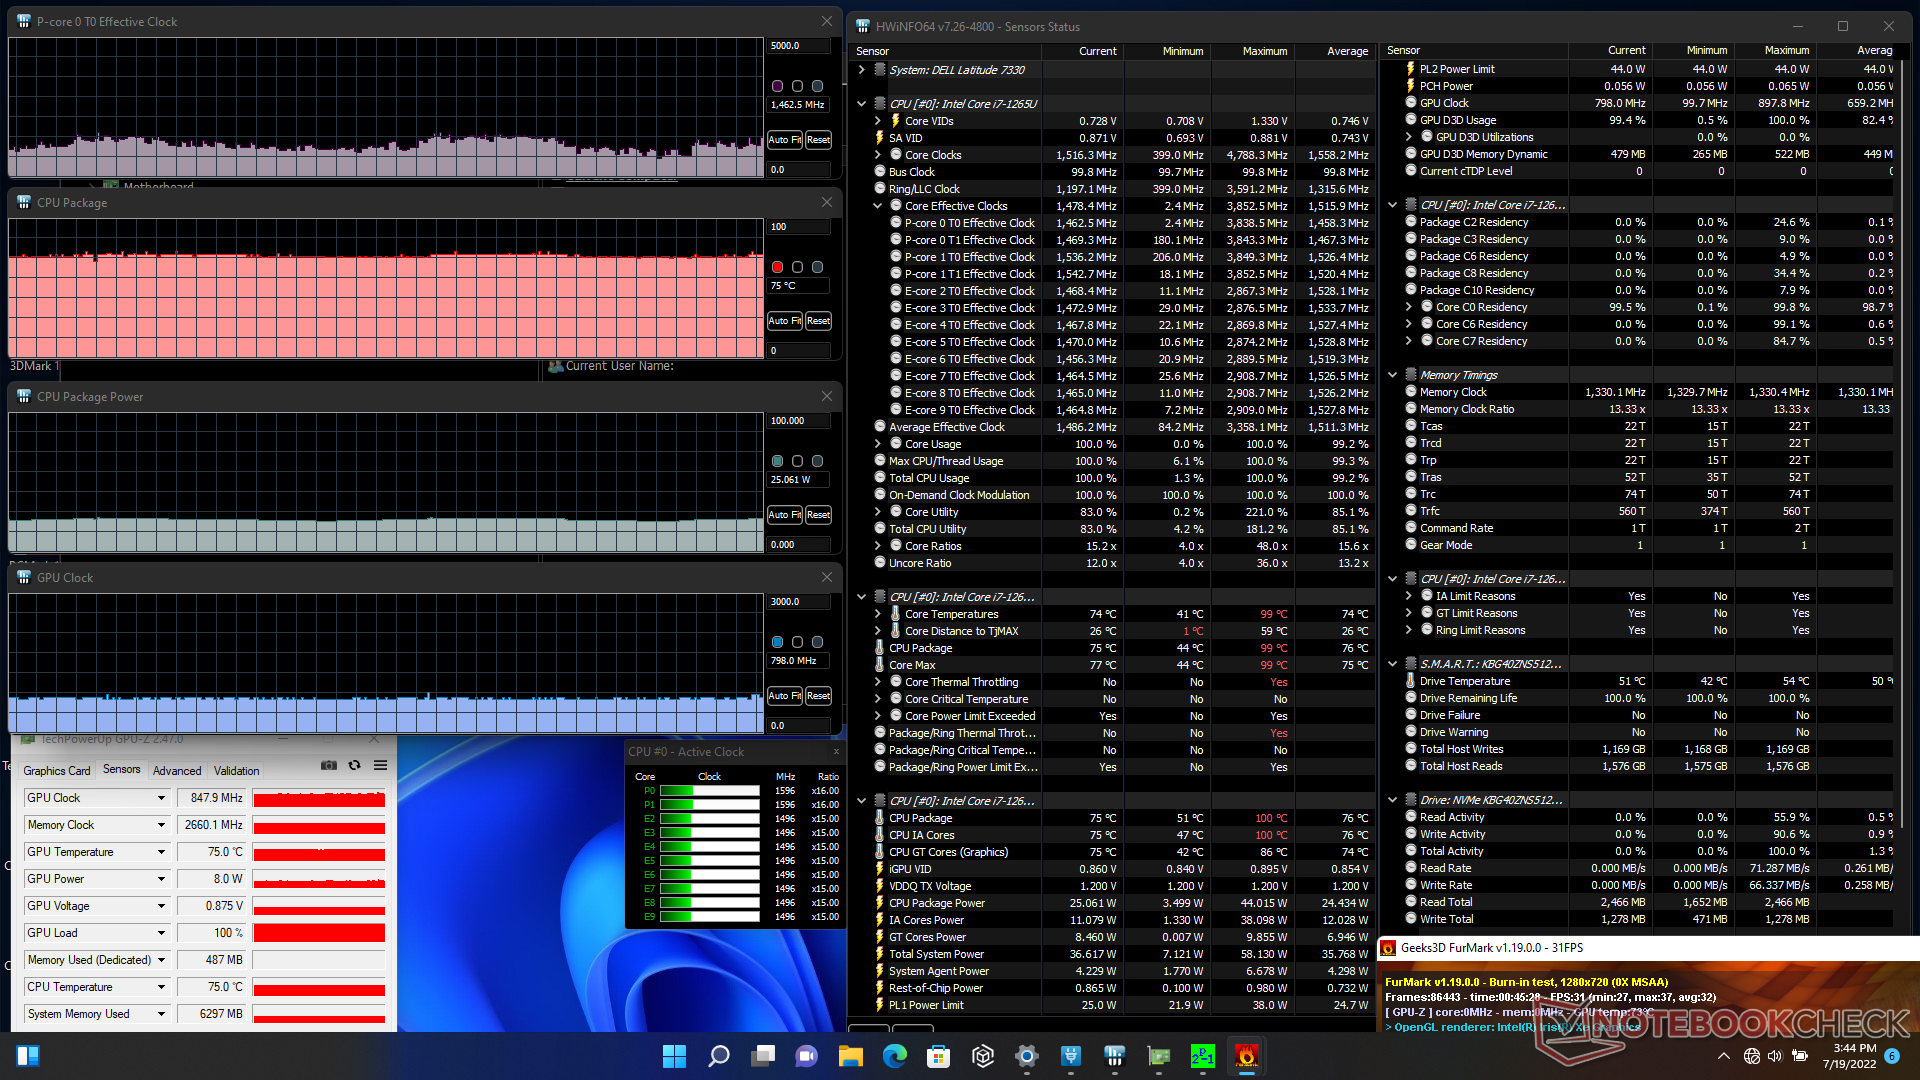
Rodando Witcher 3 para representar cargas elevadas resultaria em uma taxa de relógio GPU estável e temperatura de 1247 MHz e 83 C, respectivamente, em comparação com 1300 MHz e apenas 59 C no Razer acima mencionado. O processador no Latitude tem que funcionar mais quente para compensar a solução de resfriamento menor.
Funcionando com bateria limita o desempenho. Um teste 3DMark 11 com baterias retornaria pontuações de Física e Gráficos de 8511 e 4764 pontos, respectivamente, em comparação com 13486 e 5840 pontos quando em rede elétrica.
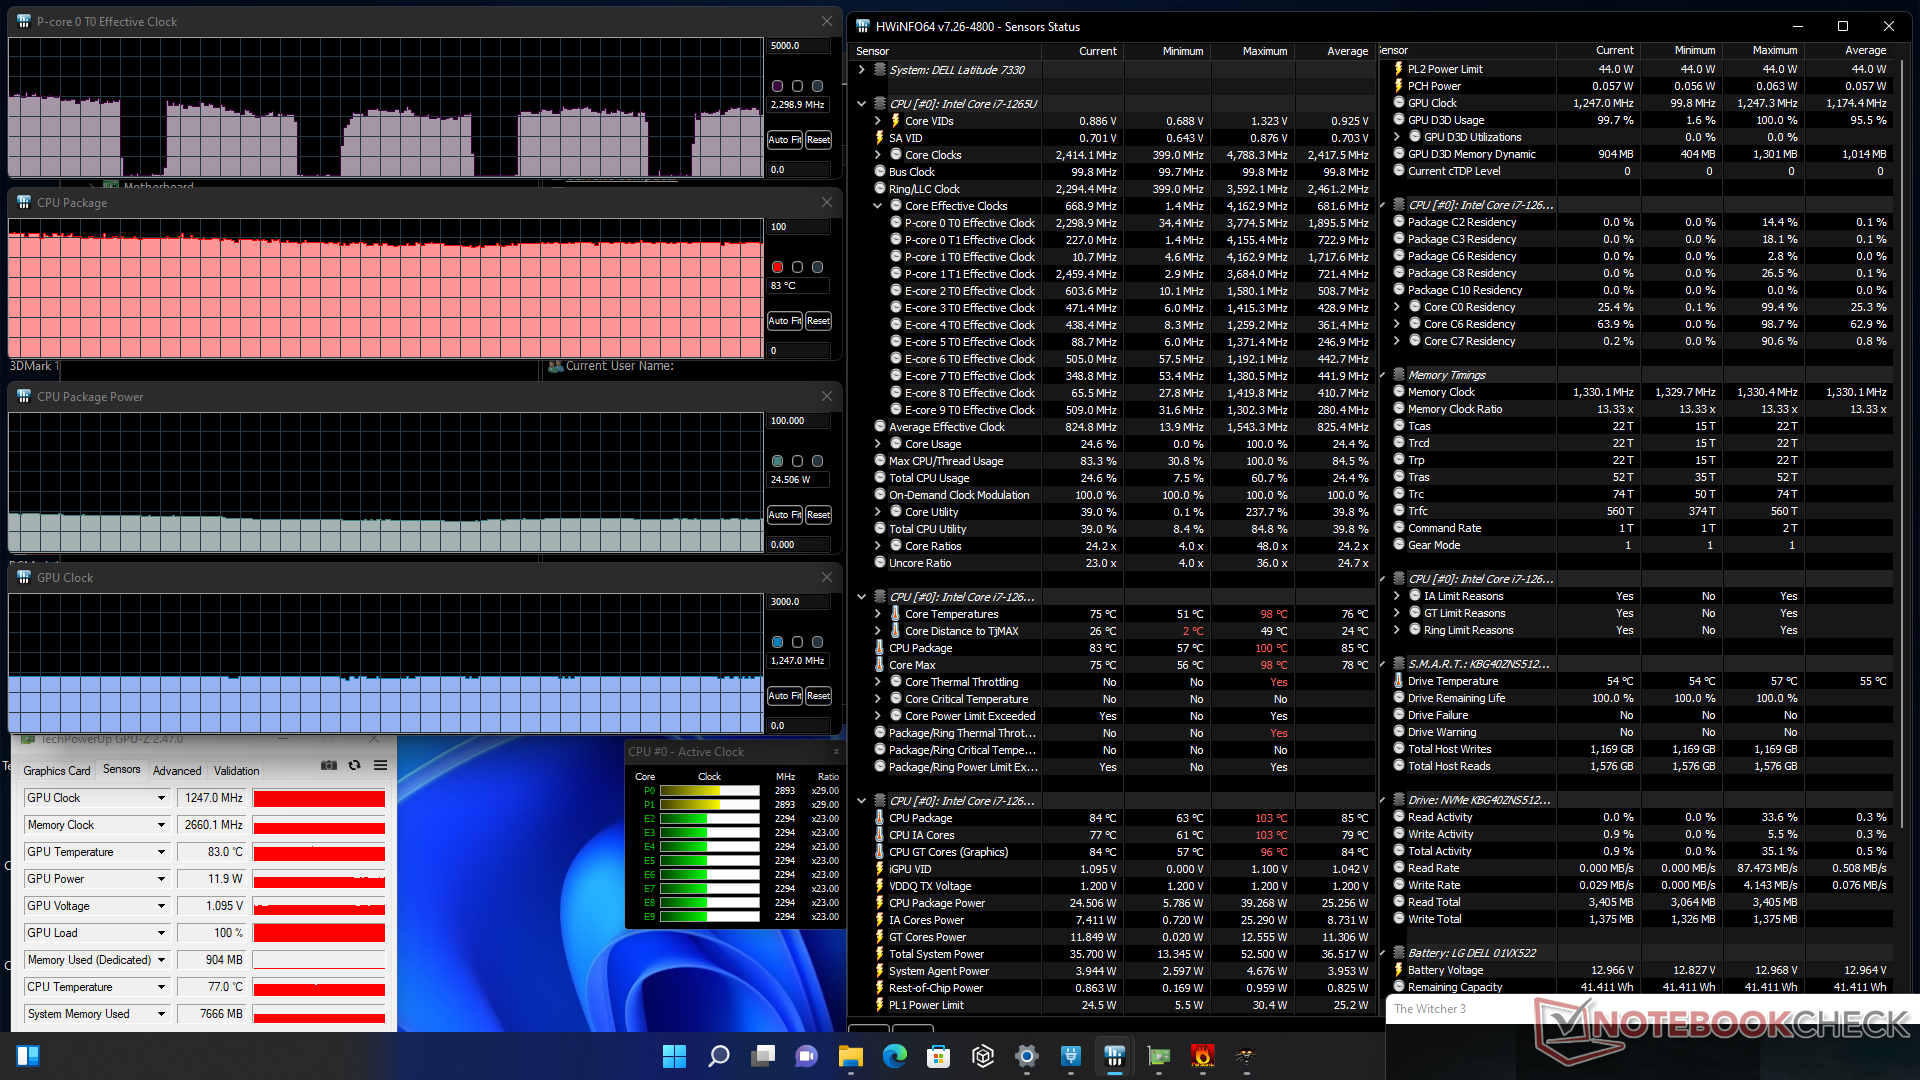
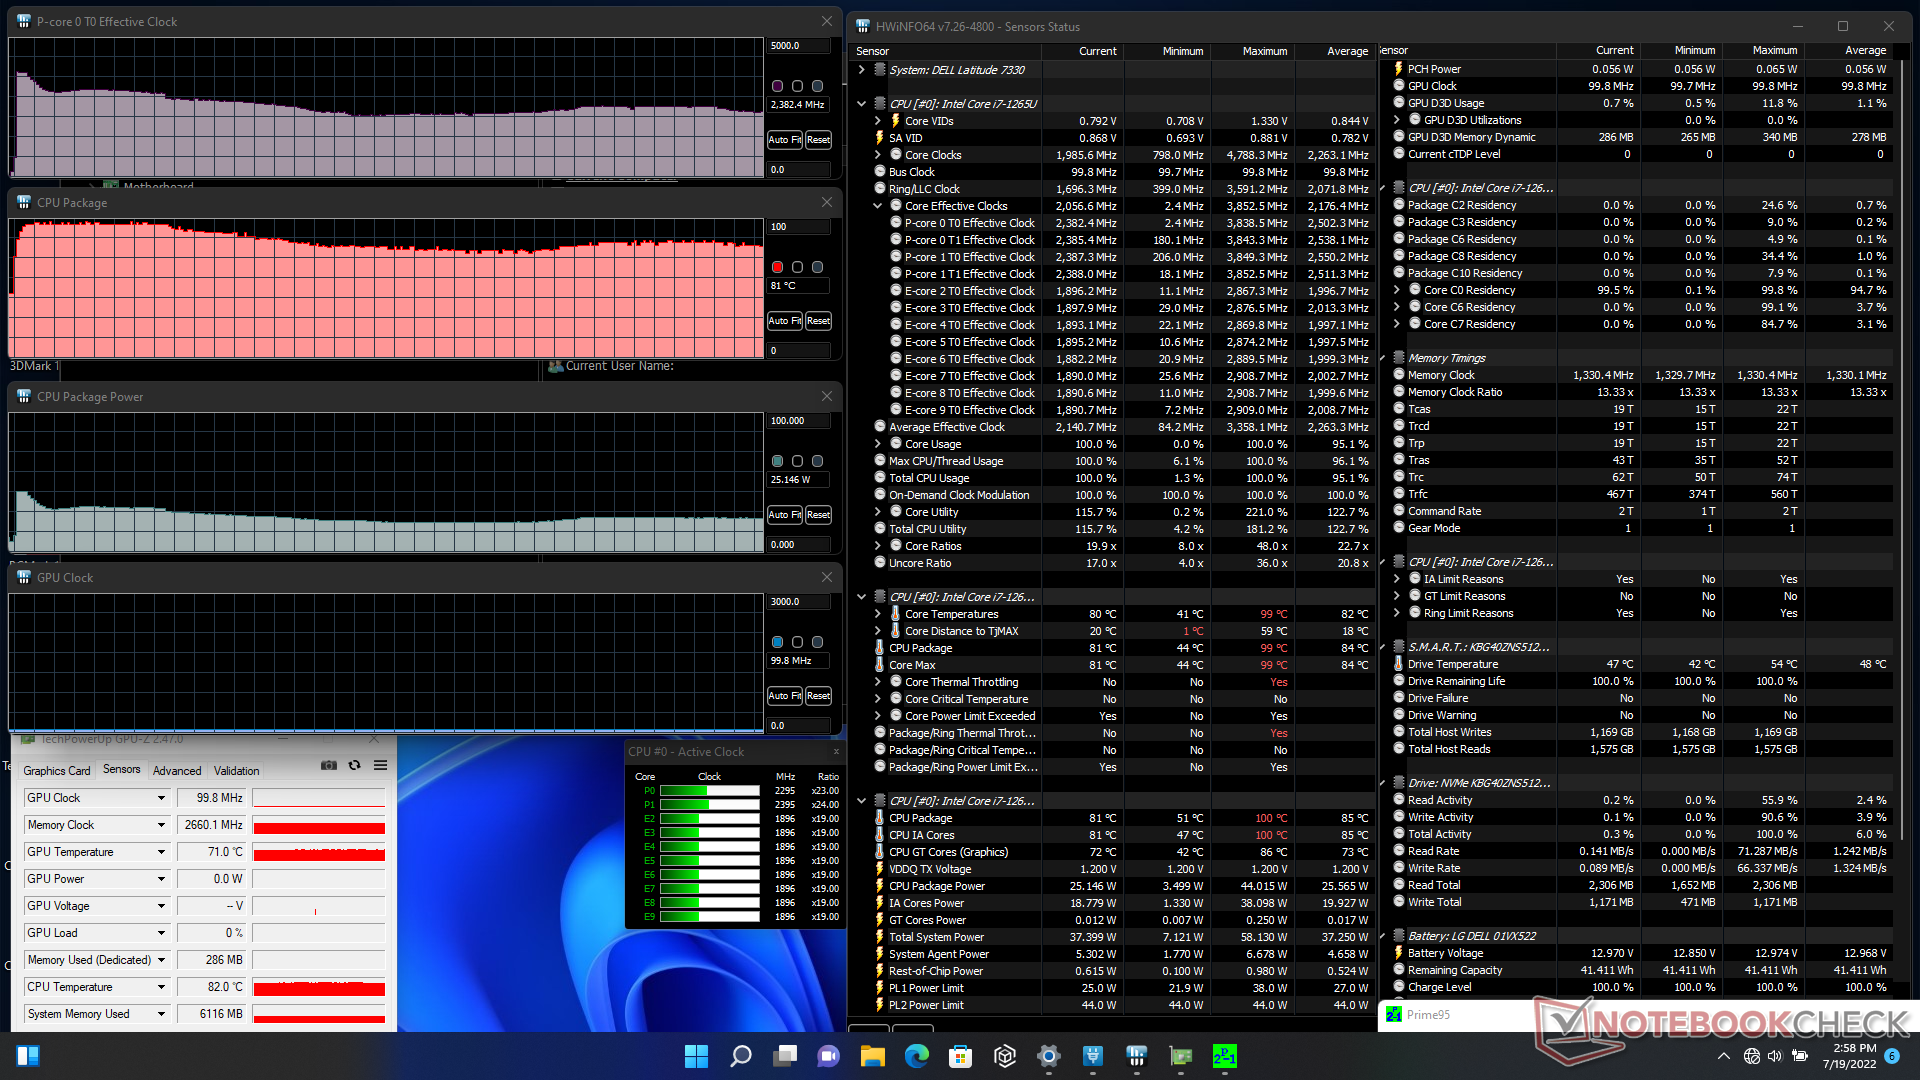
| Relógio CPU (GHz) | Relógio GPU (MHz) | Temperatura média da CPU (°C) | |
| System Idle | -- | -- | 38 |
| Prime95 Stress | 2.1 - 2.5 | -- | 72 - 85 |
| Prime95 + FurMark Stress | ~1.4 | 848 | 75 |
| Witcher 3 Stress | ~2.3 | 1247 | 83 |
Oradores
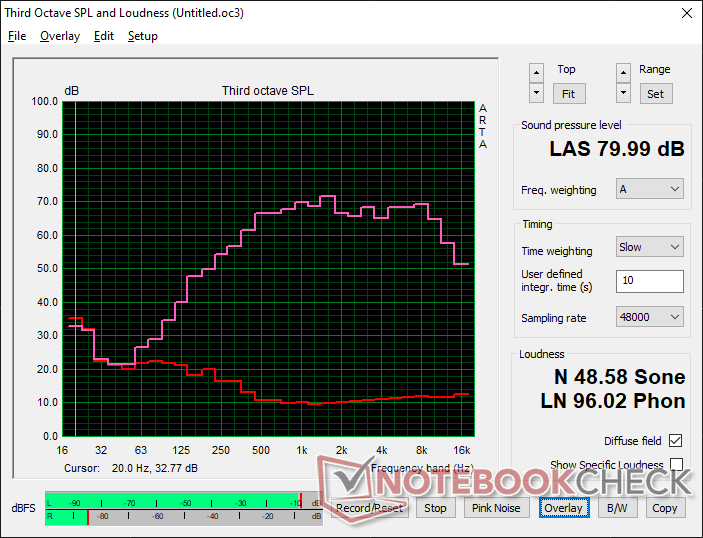
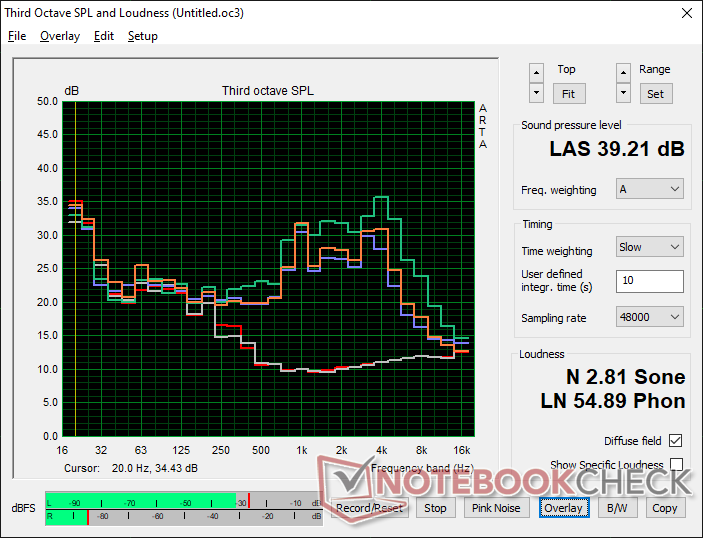
Dell Latitude 13 7330 análise de áudio
(±) | o volume do alto-falante é médio, mas bom (###valor### dB)
Graves 100 - 315Hz
(-) | quase nenhum baixo - em média 18.6% menor que a mediana
(±) | a linearidade dos graves é média (8.6% delta para a frequência anterior)
Médios 400 - 2.000 Hz
(+) | médios equilibrados - apenas 2.7% longe da mediana
(+) | médios são lineares (5.1% delta para frequência anterior)
Altos 2 - 16 kHz
(+) | agudos equilibrados - apenas 1.9% longe da mediana
(+) | os máximos são lineares (4.1% delta da frequência anterior)
Geral 100 - 16.000 Hz
(+) | o som geral é linear (14.8% diferença em relação à mediana)
Comparado com a mesma classe
» 13% de todos os dispositivos testados nesta classe foram melhores, 4% semelhantes, 83% piores
» O melhor teve um delta de 7%, a média foi 21%, o pior foi 53%
Comparado com todos os dispositivos testados
» 20% de todos os dispositivos testados foram melhores, 4% semelhantes, 76% piores
» O melhor teve um delta de 4%, a média foi 23%, o pior foi 134%
Apple MacBook Pro 16 2021 M1 Pro análise de áudio
(+) | os alto-falantes podem tocar relativamente alto (###valor### dB)
Graves 100 - 315Hz
(+) | bons graves - apenas 3.8% longe da mediana
(+) | o baixo é linear (5.2% delta para a frequência anterior)
Médios 400 - 2.000 Hz
(+) | médios equilibrados - apenas 1.3% longe da mediana
(+) | médios são lineares (2.1% delta para frequência anterior)
Altos 2 - 16 kHz
(+) | agudos equilibrados - apenas 1.9% longe da mediana
(+) | os máximos são lineares (2.7% delta da frequência anterior)
Geral 100 - 16.000 Hz
(+) | o som geral é linear (4.6% diferença em relação à mediana)
Comparado com a mesma classe
» 0% de todos os dispositivos testados nesta classe foram melhores, 0% semelhantes, 100% piores
» O melhor teve um delta de 5%, a média foi 17%, o pior foi 45%
Comparado com todos os dispositivos testados
» 0% de todos os dispositivos testados foram melhores, 0% semelhantes, 100% piores
» O melhor teve um delta de 4%, a média foi 23%, o pior foi 134%
Gestão de energia
Consumo de energia - Mais exigente
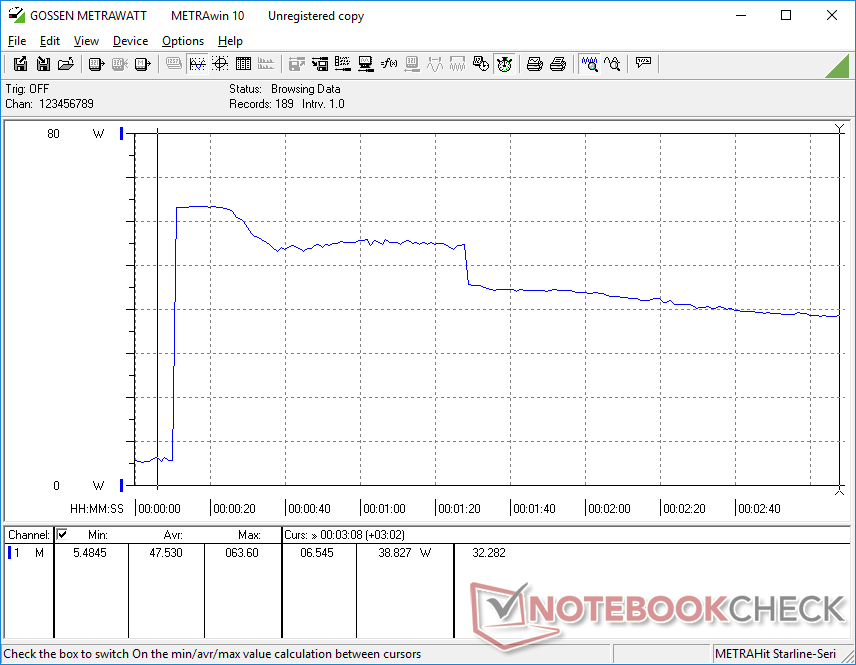
O consumo de energia é geralmente maior em relação aos laptops que funcionam com hardware da geração anterior, o que se alinha com nossas observações sobre a plataforma do Alder Lake como um todo. Rodando 3DMark06 e Prime95, por exemplo, consumiria 30% e 21% mais energia, respectivamente, do que no Core i7-1165G7 Razer Book 13. O desempenho pode ser maior, mas o desempenho por watt não é tão alto quanto esperávamos.
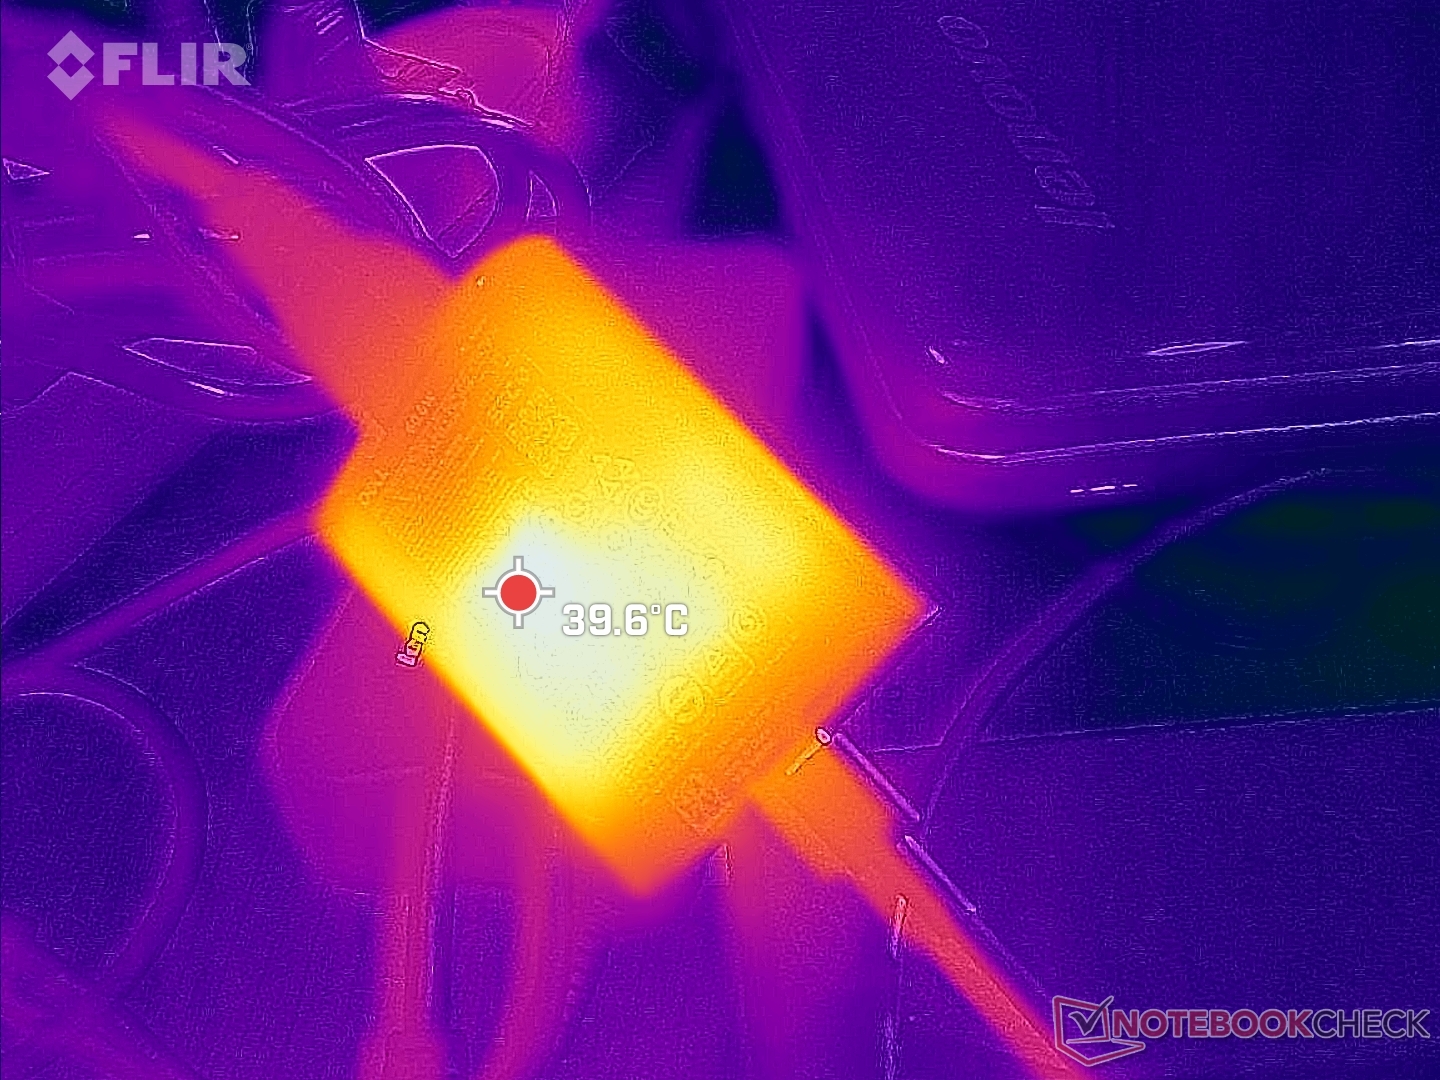
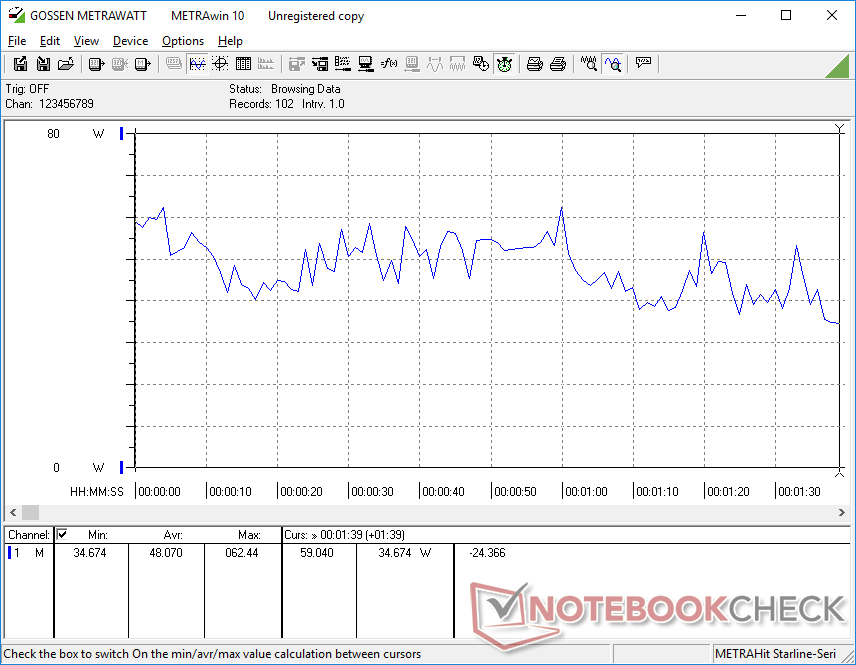
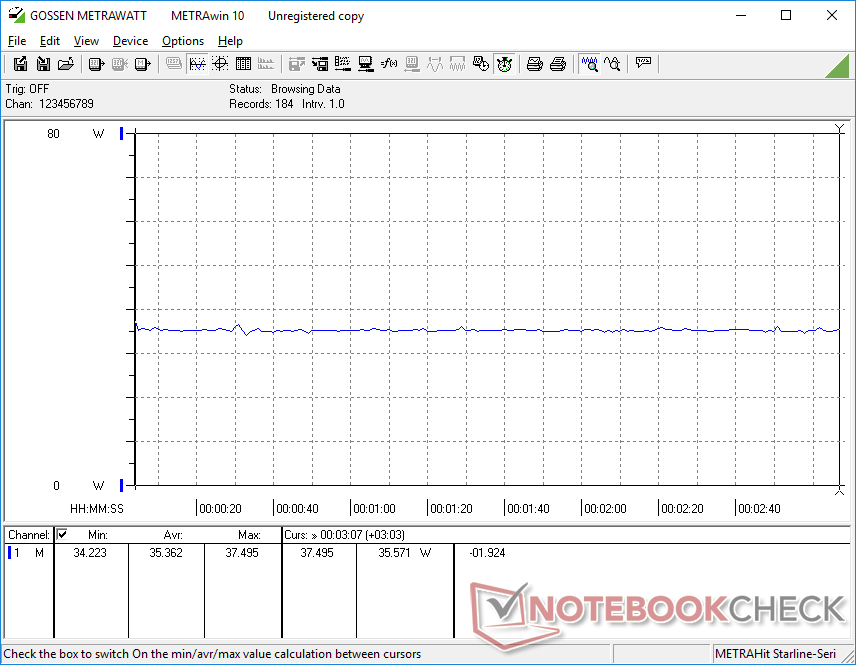
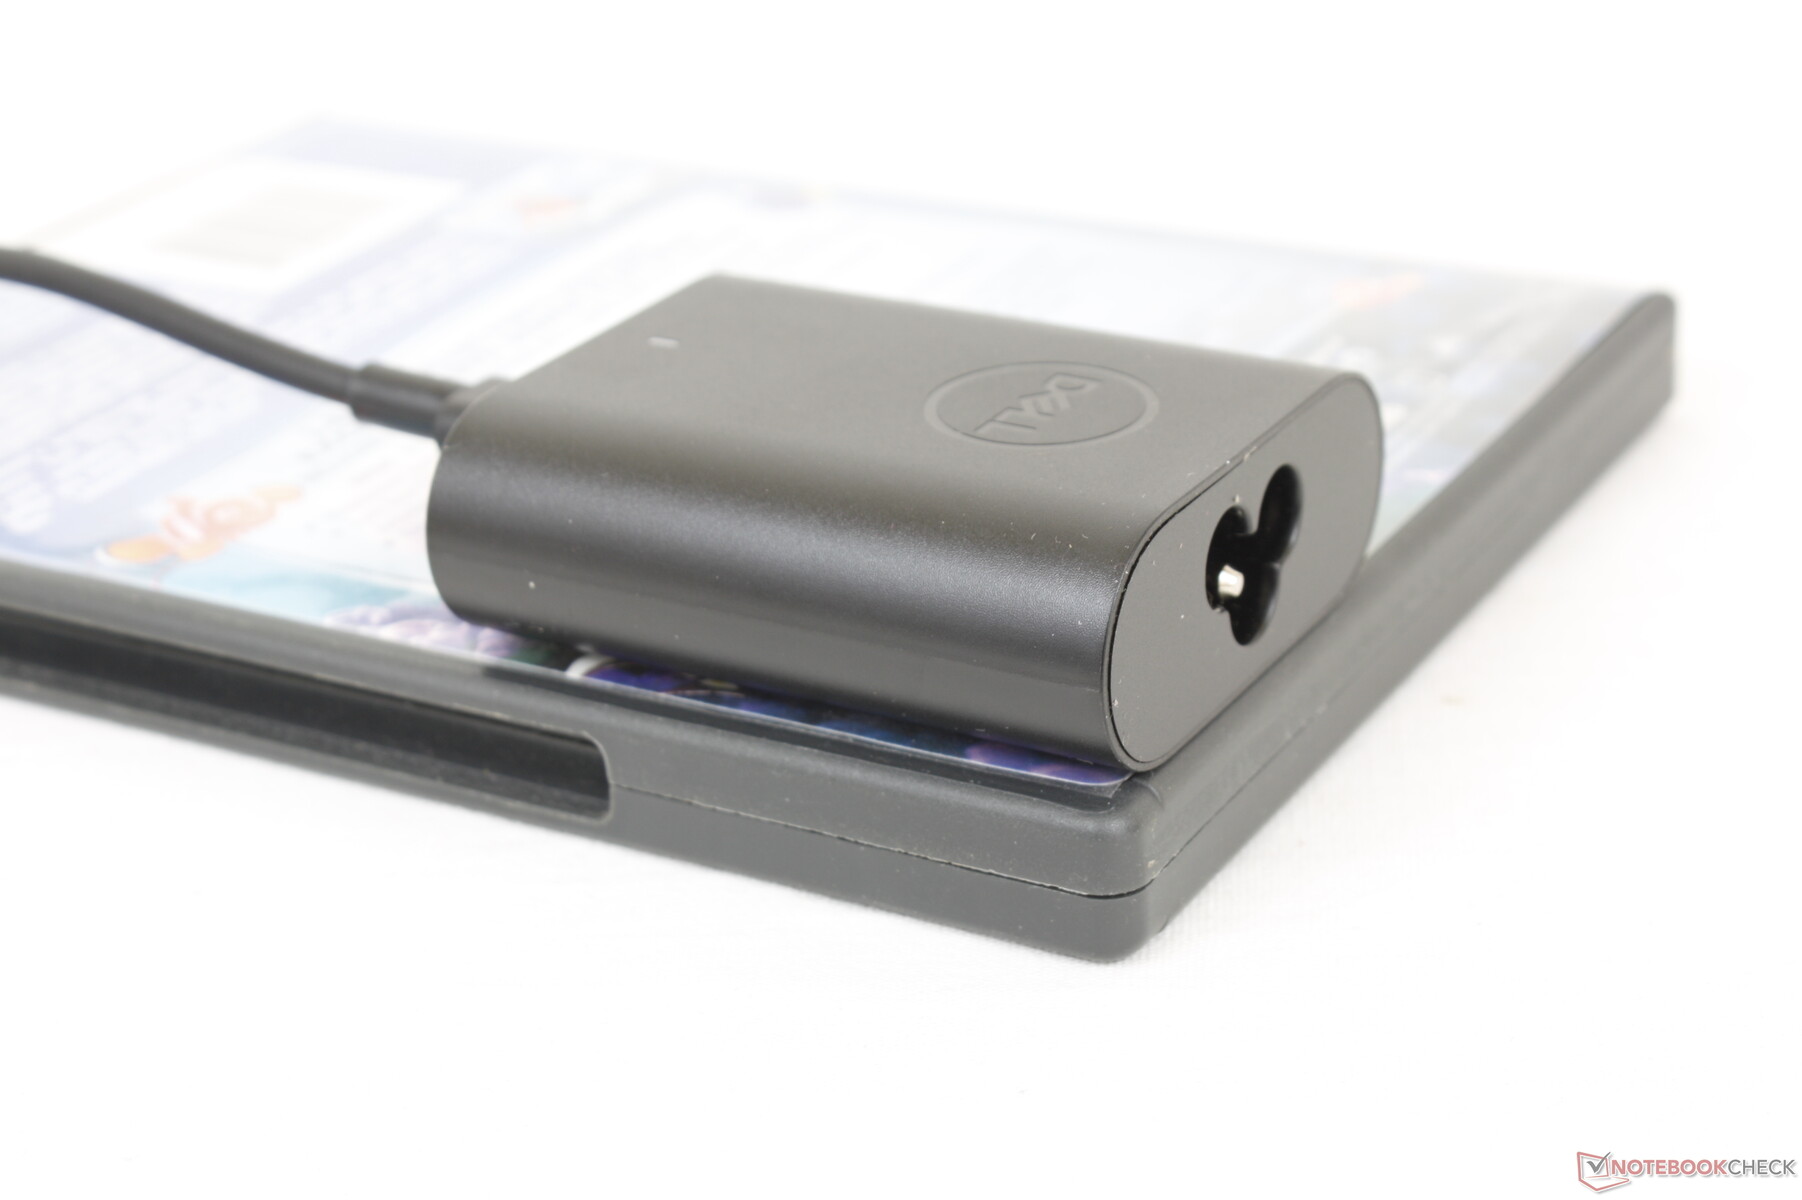
Somos capazes de registrar um consumo máximo de 63,6 W do muito pequeno (~6,6 x 5,5 x 2,2 cm) adaptador USB-C AC de 60 W. Esta taxa é apenas temporária, como mostra a captura de tela abaixo, devido às limitações térmicas da solução de resfriamento da CPU. O sistema ainda recarregará a uma taxa decente quando sob forte tensão de processamento.
Adaptadores maiores de 65 W ou 90 W AC também são opções, dependendo da configuração.

| desligado | |
| Ocioso | |
| Carga |
|
Key:
min: | |
| Dell Latitude 13 7330 i7-1265U, Iris Xe G7 96EUs, Toshiba KBG40ZNS512G NVMe, IPS, 1920x1080, 13.3" | Lenovo ThinkPad X13 Yoga 20SX0004GE i7-10510U, UHD Graphics 620, Samsung SSD PM981a MZVLB512HBJQ, IPS, 1920x1080, 13.3" | Framework Laptop 13.5 12th Gen Intel i7-1260P, Iris Xe G7 96EUs, WDC PC SN730 SDBPNTY-512G, IPS, 2256x1504, 13.5" | Razer Book 13 FHD i7-1165G7, Iris Xe G7 96EUs, Samsung SSD PM981a MZVLB256HBHQ, IPS, 1920x1200, 13.4" | Dell Latitude 7310 i7-10610U, UHD Graphics 620, Samsung SSD PM981a MZVLB512HBJQ, IPS, 1920x1080, 13.3" | Microsoft Surface Laptop 4 13 Ryzen 5 R5 4680U, Vega 7, Samsung PM991 MZ9LQ256HBJQ, IPS, 2256x1504, 13.5" | |
|---|---|---|---|---|---|---|
| Power Consumption | -3% | -44% | -2% | 13% | -8% | |
| Idle Minimum * (Watt) | 2.8 | 3.4 -21% | 5.3 -89% | 3.3 -18% | 2.7 4% | 3.4 -21% |
| Idle Average * (Watt) | 4.8 | 4.98 -4% | 8.4 -75% | 6.4 -33% | 4.4 8% | 6.3 -31% |
| Idle Maximum * (Watt) | 7.3 | 8.1 -11% | 11.2 -53% | 7 4% | 4.8 34% | 8.1 -11% |
| Load Average * (Watt) | 48.1 | 37.2 23% | 57.4 -19% | 37.3 22% | 33.4 31% | 36.2 25% |
| Witcher 3 ultra * (Watt) | 35.4 | 46.7 -32% | 36.4 -3% | |||
| Load Maximum * (Watt) | 63.6 | 63.3 -0% | 61.2 4% | 53.7 16% | 69.7 -10% | 64.1 -1% |
* ... menor é melhor
Power Consumption Witcher 3 / Stresstest
Power Consumption external Monitor
Vida útil da bateria
Os usuários têm a opção de configurar com uma bateria mais leve 41 Wh ou com uma bateria mais pesada mas mais duradoura 58 Wh. Somos capazes de espremer pouco mais de 8 horas de uso de WLAN no mundo real de nossa unidade de teste 41 Wh, que deve ser mais do que suficiente para a maioria dos usuários.
O carregamento da capacidade vazia à plena capacidade com o adaptador USB-C AC incluído leva entre 2 a 2,5 horas.
| Dell Latitude 13 7330 i7-1265U, Iris Xe G7 96EUs, 41 Wh | Lenovo ThinkPad X13 Yoga 20SX0004GE i7-10510U, UHD Graphics 620, 50 Wh | Framework Laptop 13.5 12th Gen Intel i7-1260P, Iris Xe G7 96EUs, 55 Wh | Razer Book 13 FHD i7-1165G7, Iris Xe G7 96EUs, 55 Wh | Dell Latitude 7310 i7-10610U, UHD Graphics 620, 52 Wh | Microsoft Surface Laptop 4 13 Ryzen 5 R5 4680U, Vega 7, 47.4 Wh | |
|---|---|---|---|---|---|---|
| Duração da bateria | 53% | -10% | 65% | 51% | 31% | |
| Reader / Idle (h) | 21.9 | 36.8 68% | 37.4 71% | |||
| WiFi v1.3 (h) | 8.3 | 8.2 -1% | 7.5 -10% | 14.8 78% | 12.6 52% | 10.9 31% |
| Load (h) | 1.4 | 2.9 107% | 2.1 50% | 1.8 29% |
Pro
Contra
Veredicto - Opções, Opções, Opções
O alto nível de configurações ajuda a diferenciar os Latitude 7330 de outros sub-portáteis comerciais. Características como um leitor MicroSD, conectividade 4G LTE, webcam 1080p, formato 2 em 1, fibra de carbono, tamanho da bateria e até mesmo adaptador AC são todos opcionais, dependendo das necessidades do comprador. Se suas cargas de trabalho diárias não requerem certas características, então elas podem ser simplesmente omitidas no checkout para um peso total mais leve. Outros laptops ultraleves como o LG Gram 13 ou a série Toshiba X30 têm muito menos opções configuráveis, como devido a suas escalas de produção menores em relação à série Latitude da Dell.
A série Latitude 7330 é grande em opções configuráveis e customizações para melhor atender às necessidades específicas do usuário. Sua relação de aspecto de 16:9 está começando a mostrar sua idade, entretanto.
As alternativas mais próximas à série Latitude 7330 são as HP EliteBook 830 G8 e modelos G9 que oferecem recursos como uma relação de aspecto 16:10 maior, webcam 5 MP mais nítida, módulos de RAM removíveis e opções de exibição significativamente mais brilhantes de 1000-nit, todos eles indisponíveis no Latitude 7330. Entretanto, eles são ligeiramente mais pesados que nossa Dell, mas seus atributos mais fortes podem valer o aumento de peso para alguns usuários.
Preço e Disponibilidade
O site Latitude 7330 ainda não está amplamente disponível na Amazon ou Best Buy. Comprando diretamente da Dell é recomendado onde os preços atualmente oscilam em torno de US$ 2.000,00.
Dell Latitude 13 7330
- 07/22/2022 v7 (old)
Allen Ngo
Price comparison

