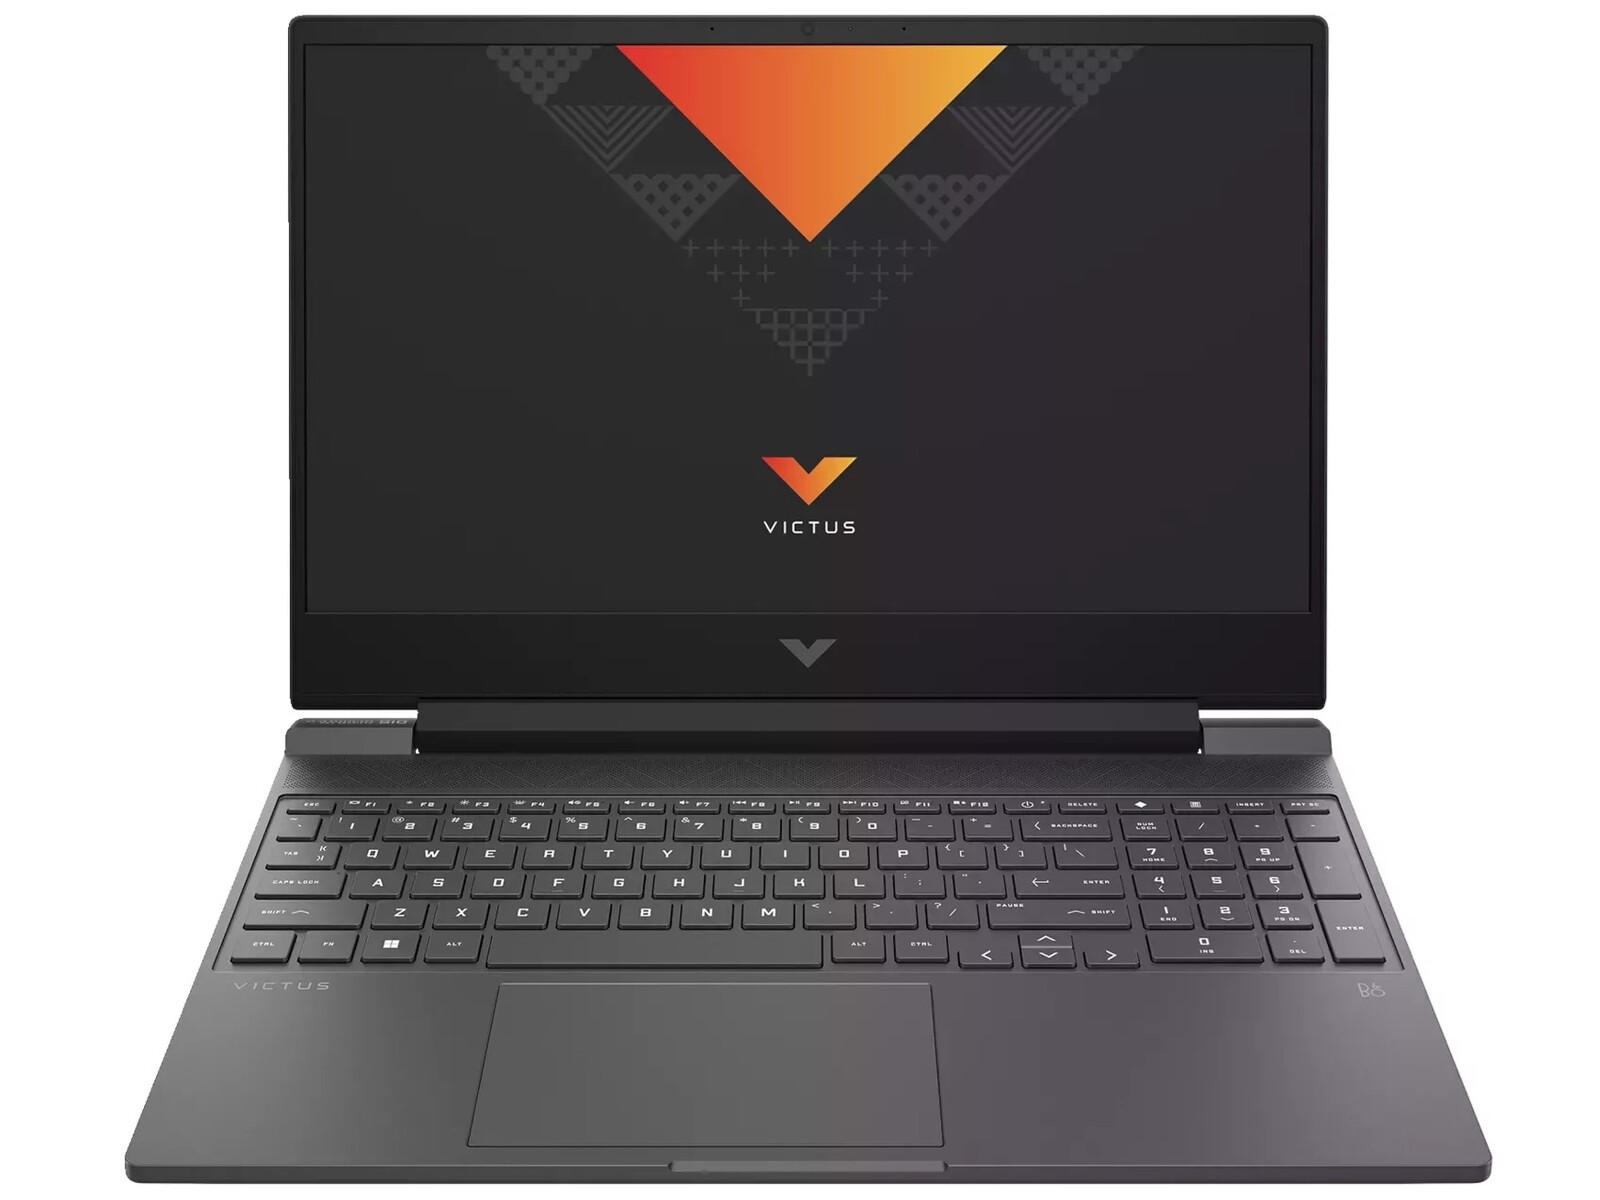
Análise do laptop para jogos HP Victus 15 com Raptor Lake e Ada Lovelace

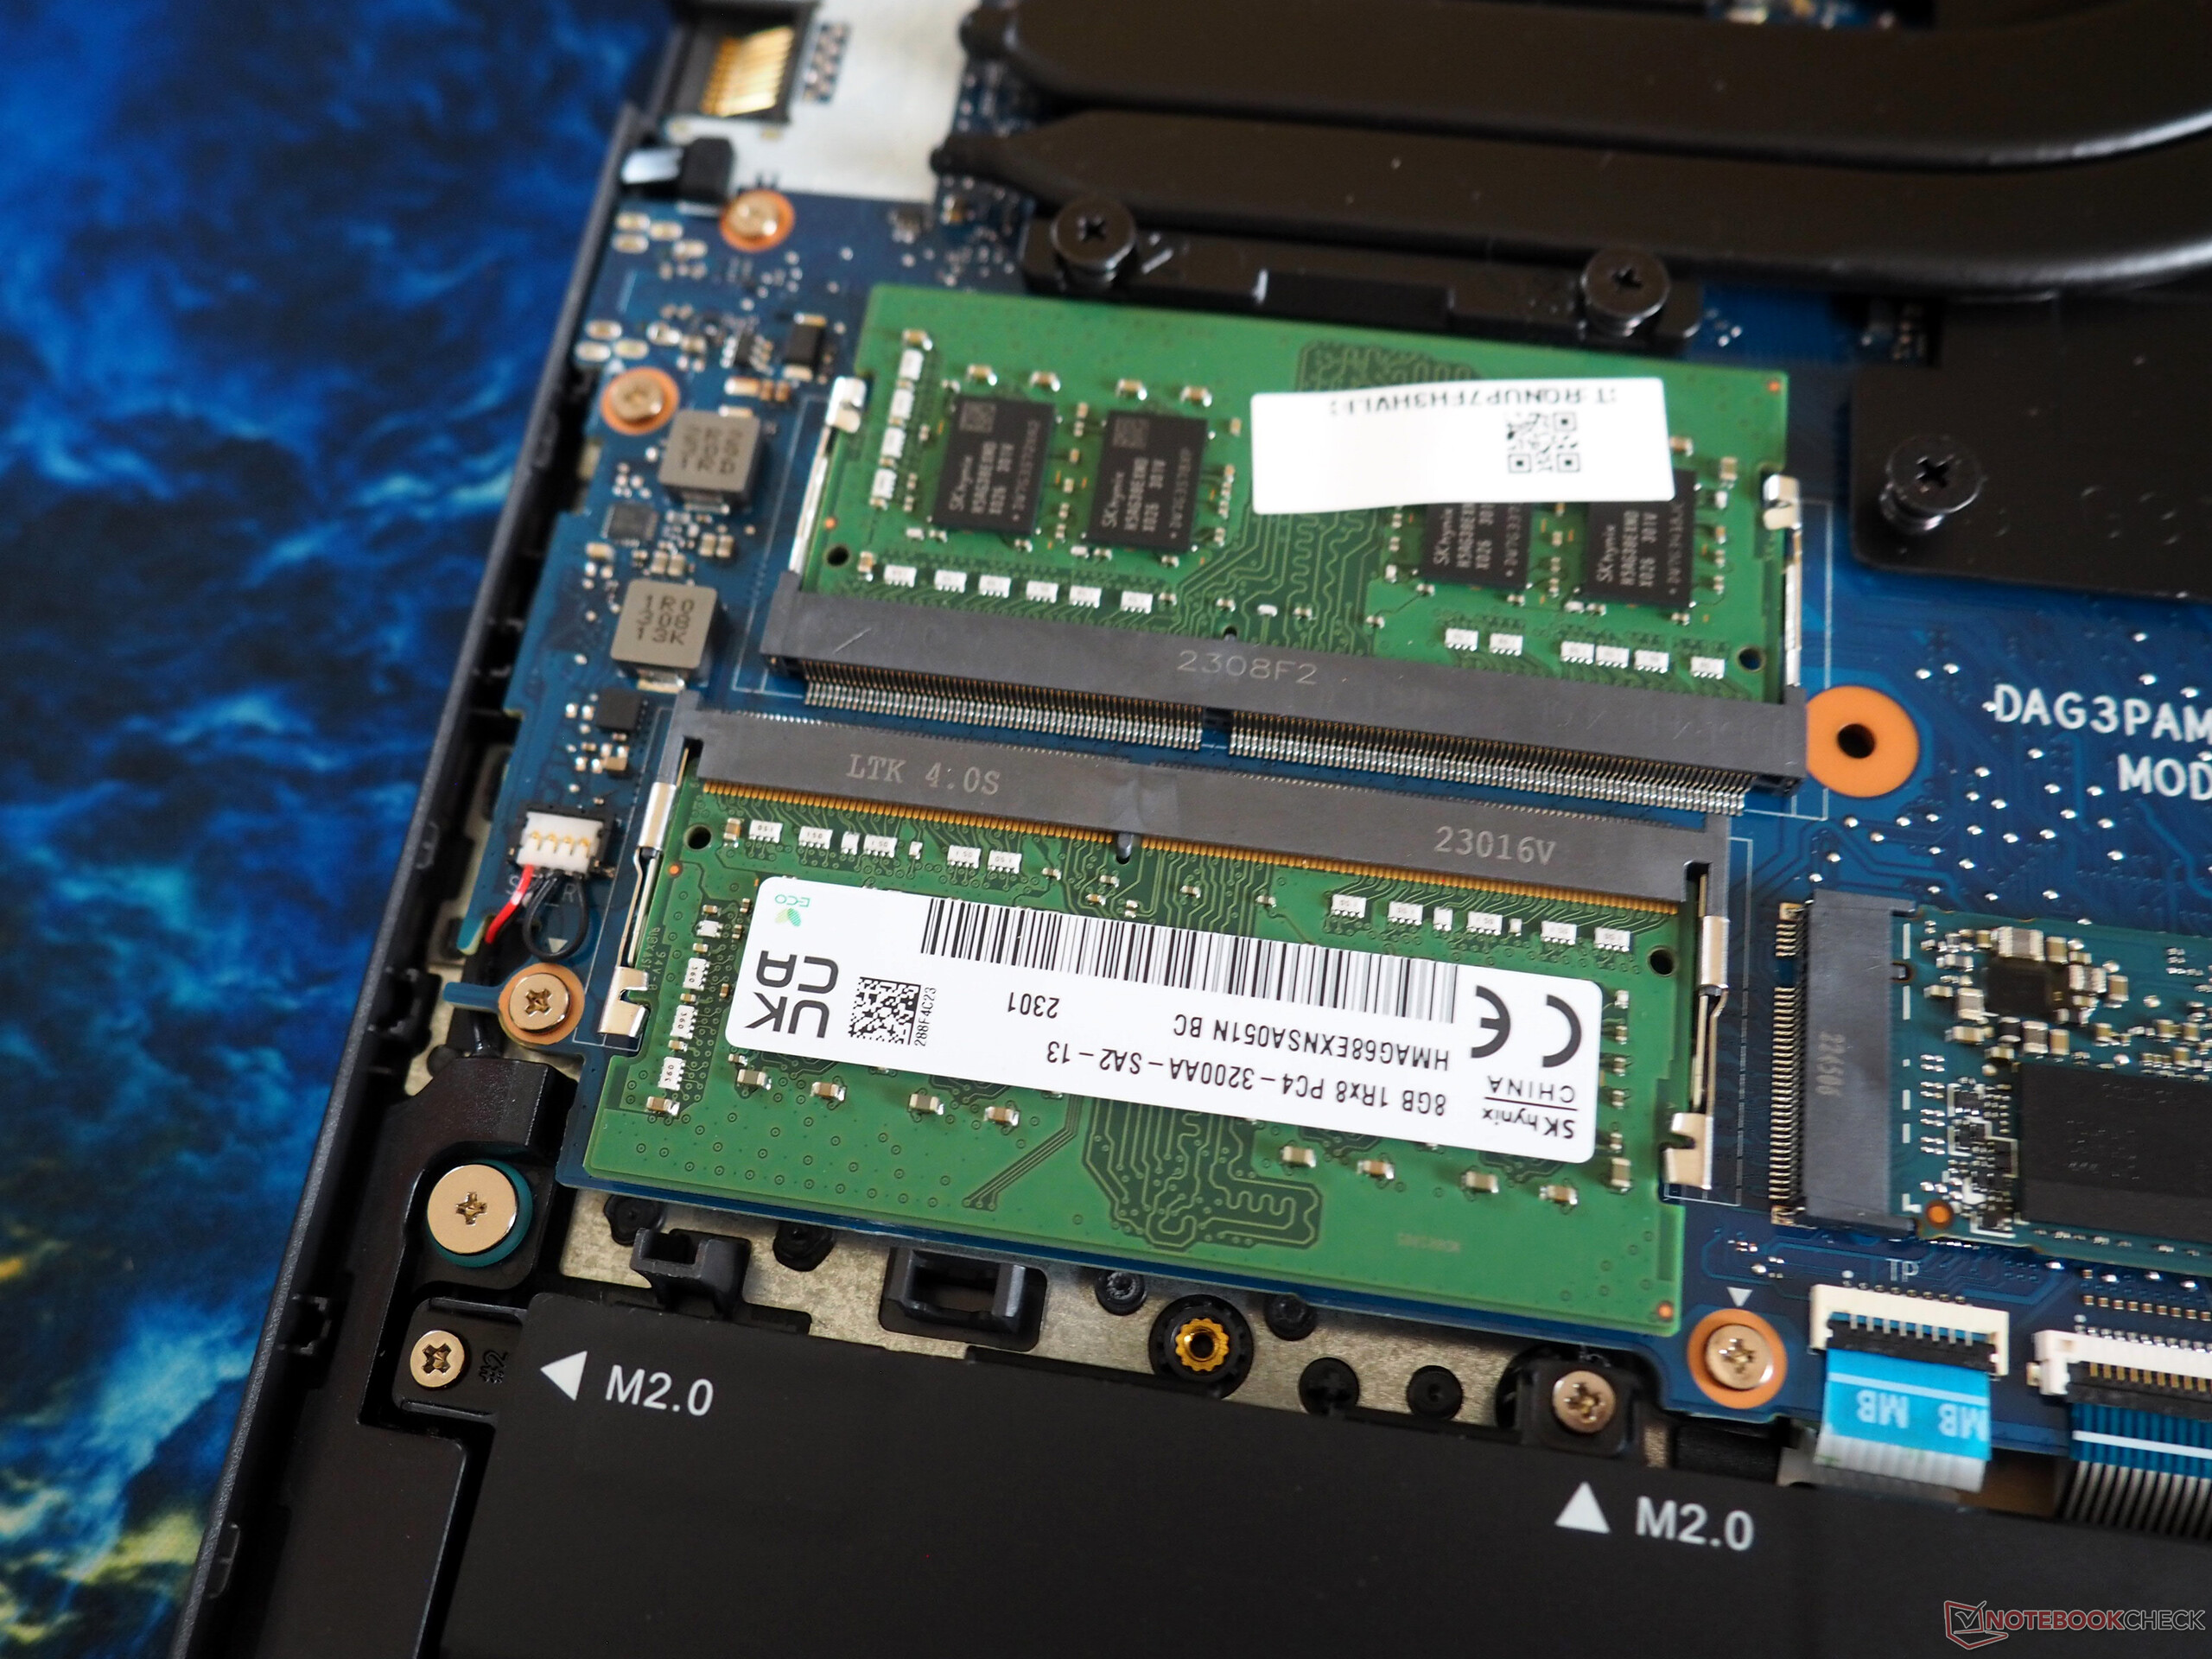
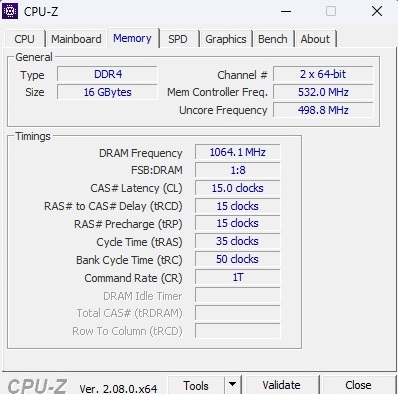
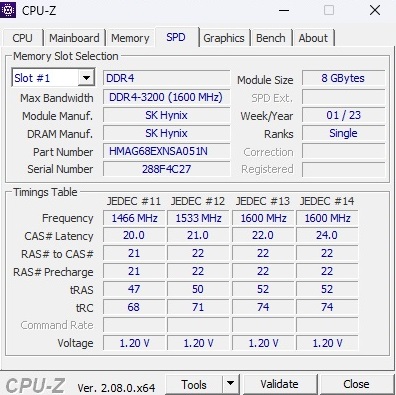
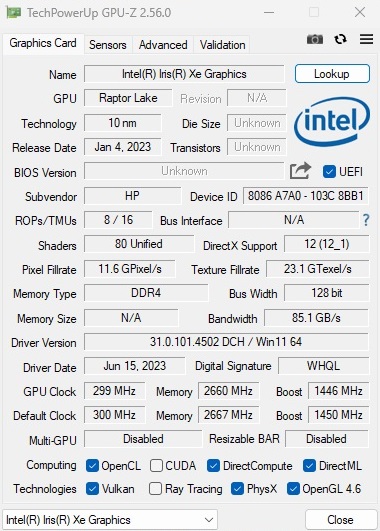
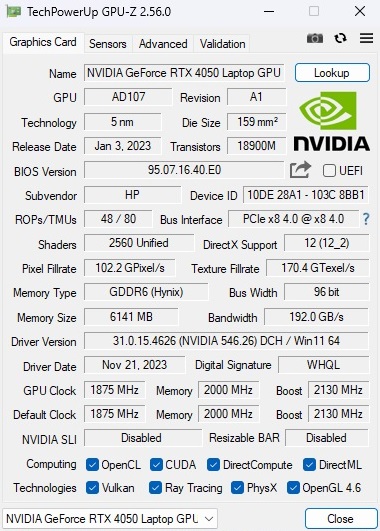
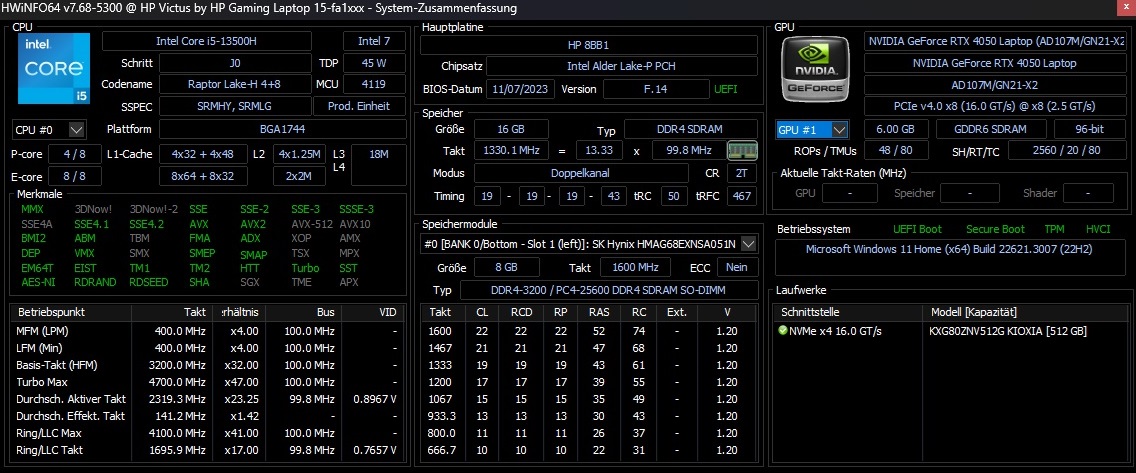
Enquanto os notebooks premium continuam a ficar mais caros a cada ano, o segmento econômico em 2024 oferece uma infinidade de produtos interessantes. Um exemplo disso é o Victus 15-fa1057ng, disponível por menos de US$ 1.000. Diferenciando-se de muitos concorrentes, ele apresenta uma GeForce RTX 4050 com 6 GB GDDR6 VRAM. Complementando isso, há um Core i5-13500H (12 núcleos, 16 threads), 16 GB de RAM DDR4-3.200 (2x 8 GB SO-DIMM) e um SSD M.2 baseado em PCIe de 512 GB. A saída visual é uma tela IPS Full HD fosca de 144 Hz, embora seja especificada com 250 nits e 45% NTSC - valores que consideramos desatualizados, mesmo para o setor de orçamento. O pacote é completado com o Windows 11 Home como sistema operacional (versões mais baratas com FreeDOS também estão disponíveis).
Os rivais do Victus 15 incluem outros laptops para jogos equipados com a RTX 4050 e as CPUs mais recentes, como o Dell G15 5530e o Acer Nitro V 15 ANV15-51 ou o Asus TUF A15 FA507todos eles estão listados nas tabelas para comparação.
Como o gabinete é praticamente idêntico ao antecessor com o Core i7-12700H e GeForce RTX 3050 Ti como o senhor sabe, este artigo incluirá uma breve explicação sobre a caixa, os recursos e as categorias de dispositivos de entrada.
Possíveis concorrentes em comparação
Avaliação | Data | Modelo | Peso | Altura | Size | Resolução | Preço |
|---|---|---|---|---|---|---|---|
| 84 % v7 (old) | 02/2024 | HP Victus 15-fa1057ng i5-13500H, GeForce RTX 4050 Laptop GPU | 2.3 kg | 24 mm | 15.60" | 1920x1080 | |
| 81 % v7 (old) | 01/2023 | HP Victus 15 fa0020nr i7-12700H, GeForce RTX 3050 Ti Laptop GPU | 2.3 kg | 23.6 mm | 15.60" | 1920x1080 | |
| 84.7 % v7 (old) | 01/2024 | Dell G15 5530, i5-13450HX RTX 4050 i5-13450HX, GeForce RTX 4050 Laptop GPU | 2.7 kg | 27 mm | 15.60" | 1920x1080 | |
| 82.8 % v7 (old) | 01/2024 | Acer Nitro V 15 ANV15-51-582S i5-13420H, GeForce RTX 4050 Laptop GPU | 2.1 kg | 23.5 mm | 15.60" | 1920x1080 | |
| 86.3 % v7 (old) | 06/2023 | Asus TUF A15 FA507 R7 7735HS, GeForce RTX 4050 Laptop GPU | 2.2 kg | 24.9 mm | 15.60" | 1920x1080 |
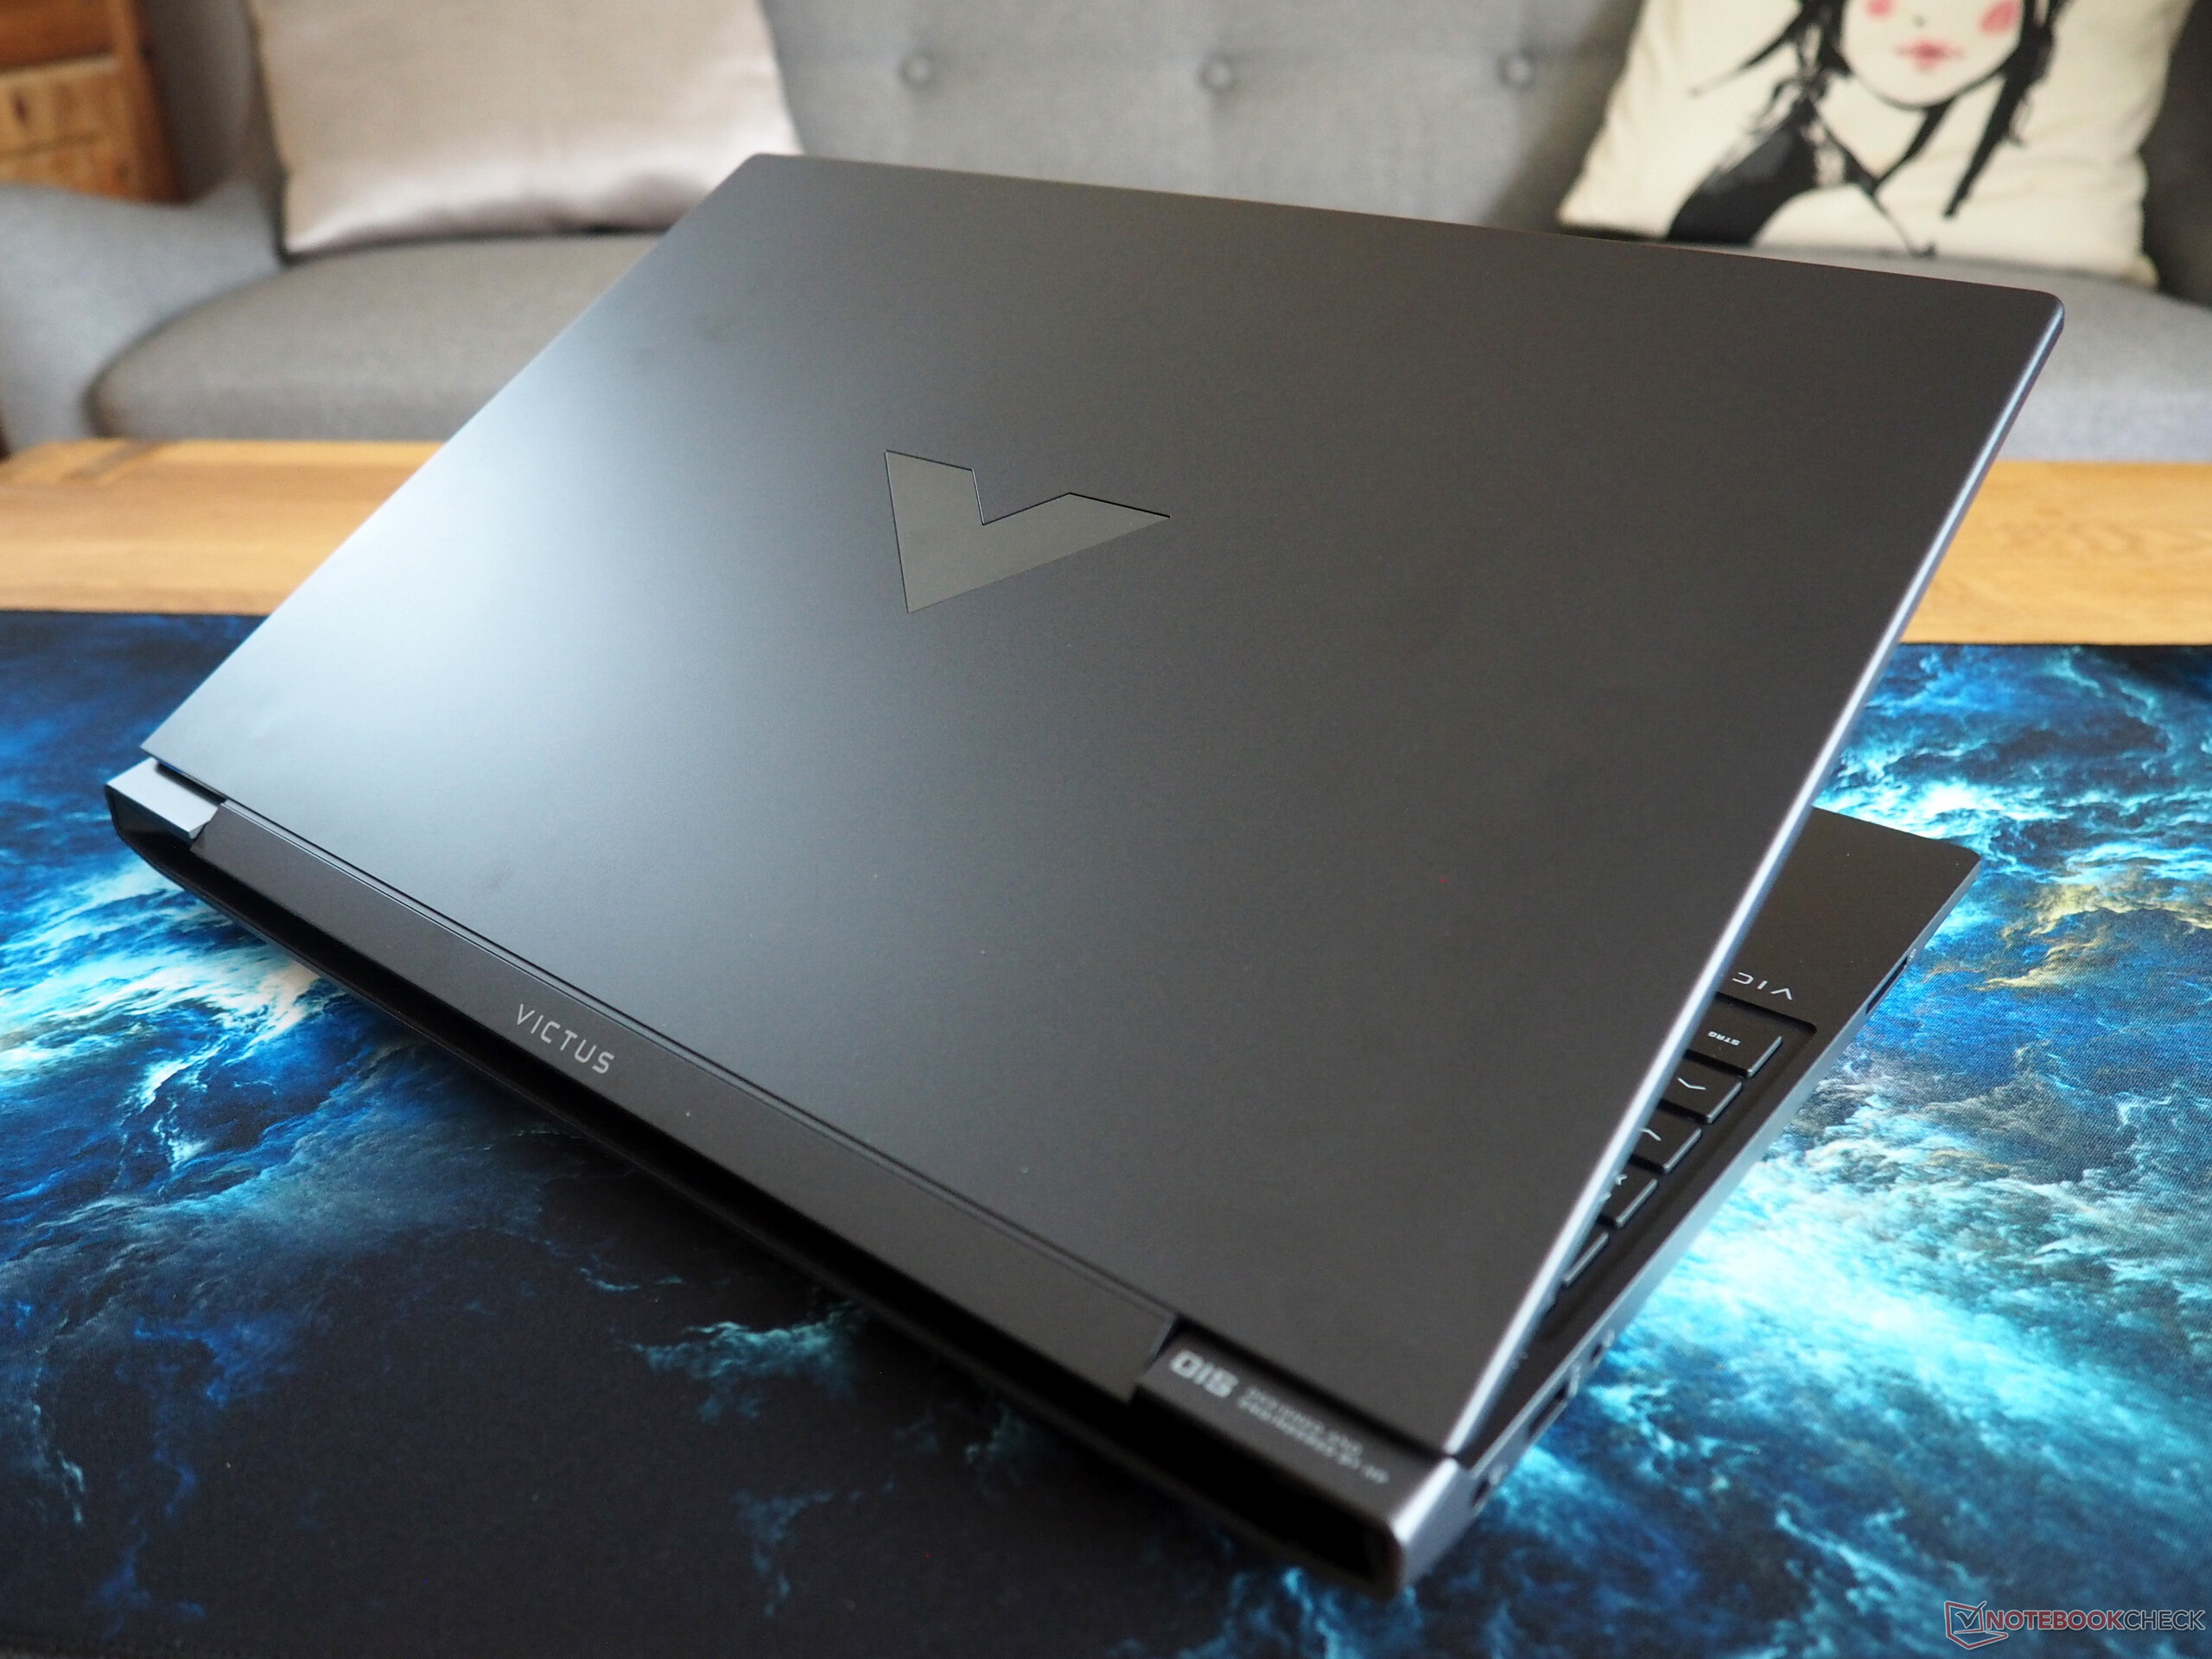
Caso
Os clientes recebem um gabinete de plástico robusto, como é comum nessa categoria de preço, embora ele possa apresentar algum ruído em determinadas áreas e não tenha o som e a sensação premium. Um novo design ou otimização pode ser benéfico para as dobradiças ligeiramente instáveis. A estabilidade geral é semelhante. Mais notavelmente, ao aplicar mais pressão, o apoio para as mãos pode se curvar substancialmente. O Victus 15 tem uma bela estética que combina recursos de design sutis e divertidos. As dimensões e o peso estão dentro da média, embora não sejam particularmente notáveis quando comparados aos concorrentes.
Conectividade
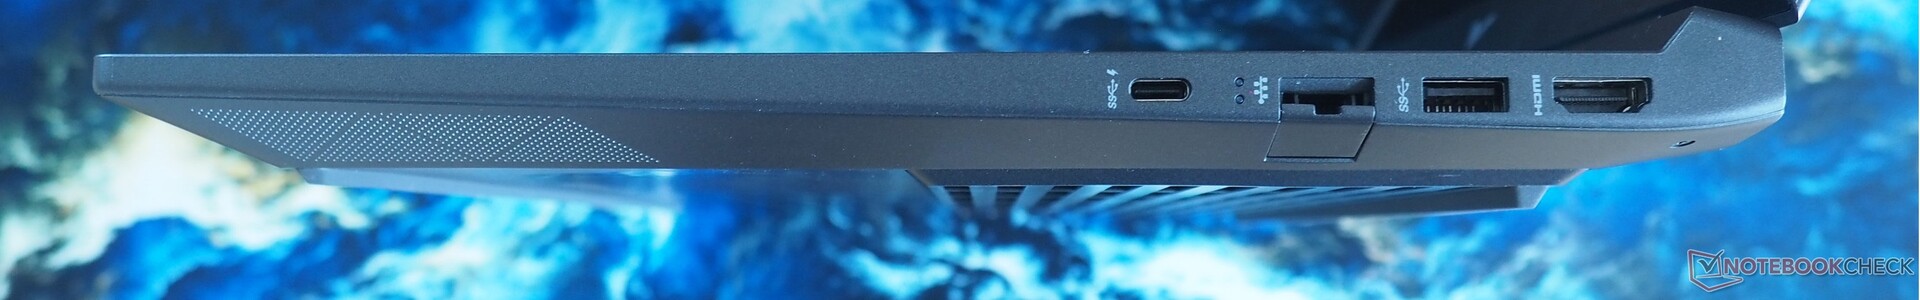
A gama de conectividade provoca reações variadas. Embora a ausência de um leitor de cartões seja notável, a HP se compromete com as portas USB contemporâneas. As portas USB disponíveis (2x Tipo A, 1x Tipo C incl. DisplayPort) estão limitadas a 5 Gbit/s. Felizmente, a porta HDMI é especificada como versão 2.1 pelo fabricante. Além disso, há um soquete de áudio e uma porta RJ45 (limitada a 1 Gbit LAN em vez de 2,5). Com a maioria das conexões situadas na parte traseira do gabinete, não há dificuldade em usar o mouse.
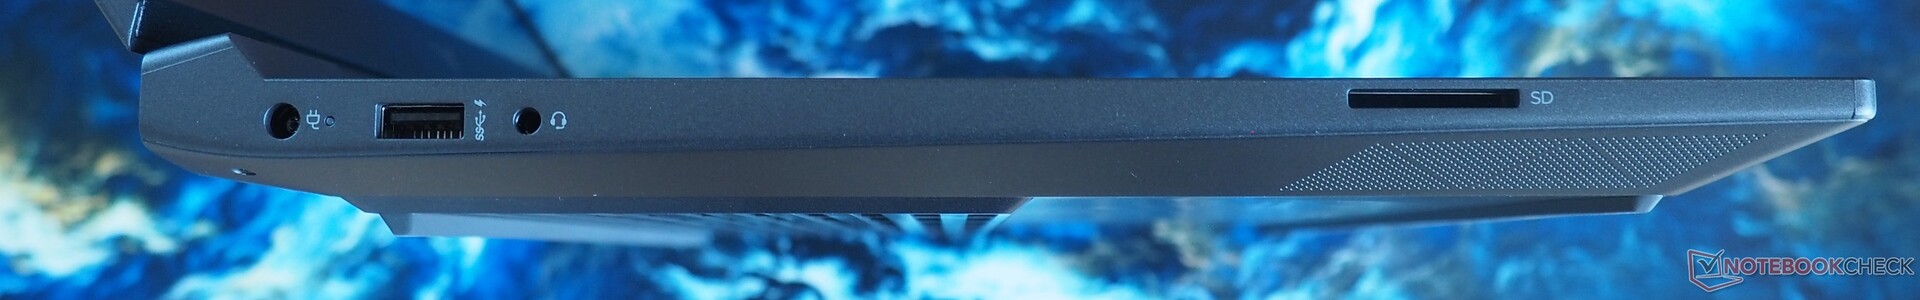
Leitor de cartão SD
A velocidade do leitor de cartão está dentro da faixa média. Registramos uma velocidade confiável de 80 MB/s ao transferir várias imagens jpg.
| SD Card Reader - average JPG Copy Test (av. of 3 runs) | |
| Média da turma Gaming (20.9 - 210, n=55, últimos 2 anos) | |
| HP Victus 15-fa1057ng (AV PRO microSD 128 GB V60) | |
| HP Victus 15 fa0020nr (Toshiba Exceria Pro SDXC 64 GB UHS-II) | |
Comunicação
O desempenho do Wi-Fi é um pouco fraco. Durante nosso teste de alcance, a uma distância de 3,28 pés do roteador de referência, o módulo MediaTek integrado ficou em último lugar no campo de comparação.
Webcam
O desempenho da webcam de 720p não é excepcional, deixando espaço para melhorias, principalmente em termos de nitidez da imagem.


Acessórios
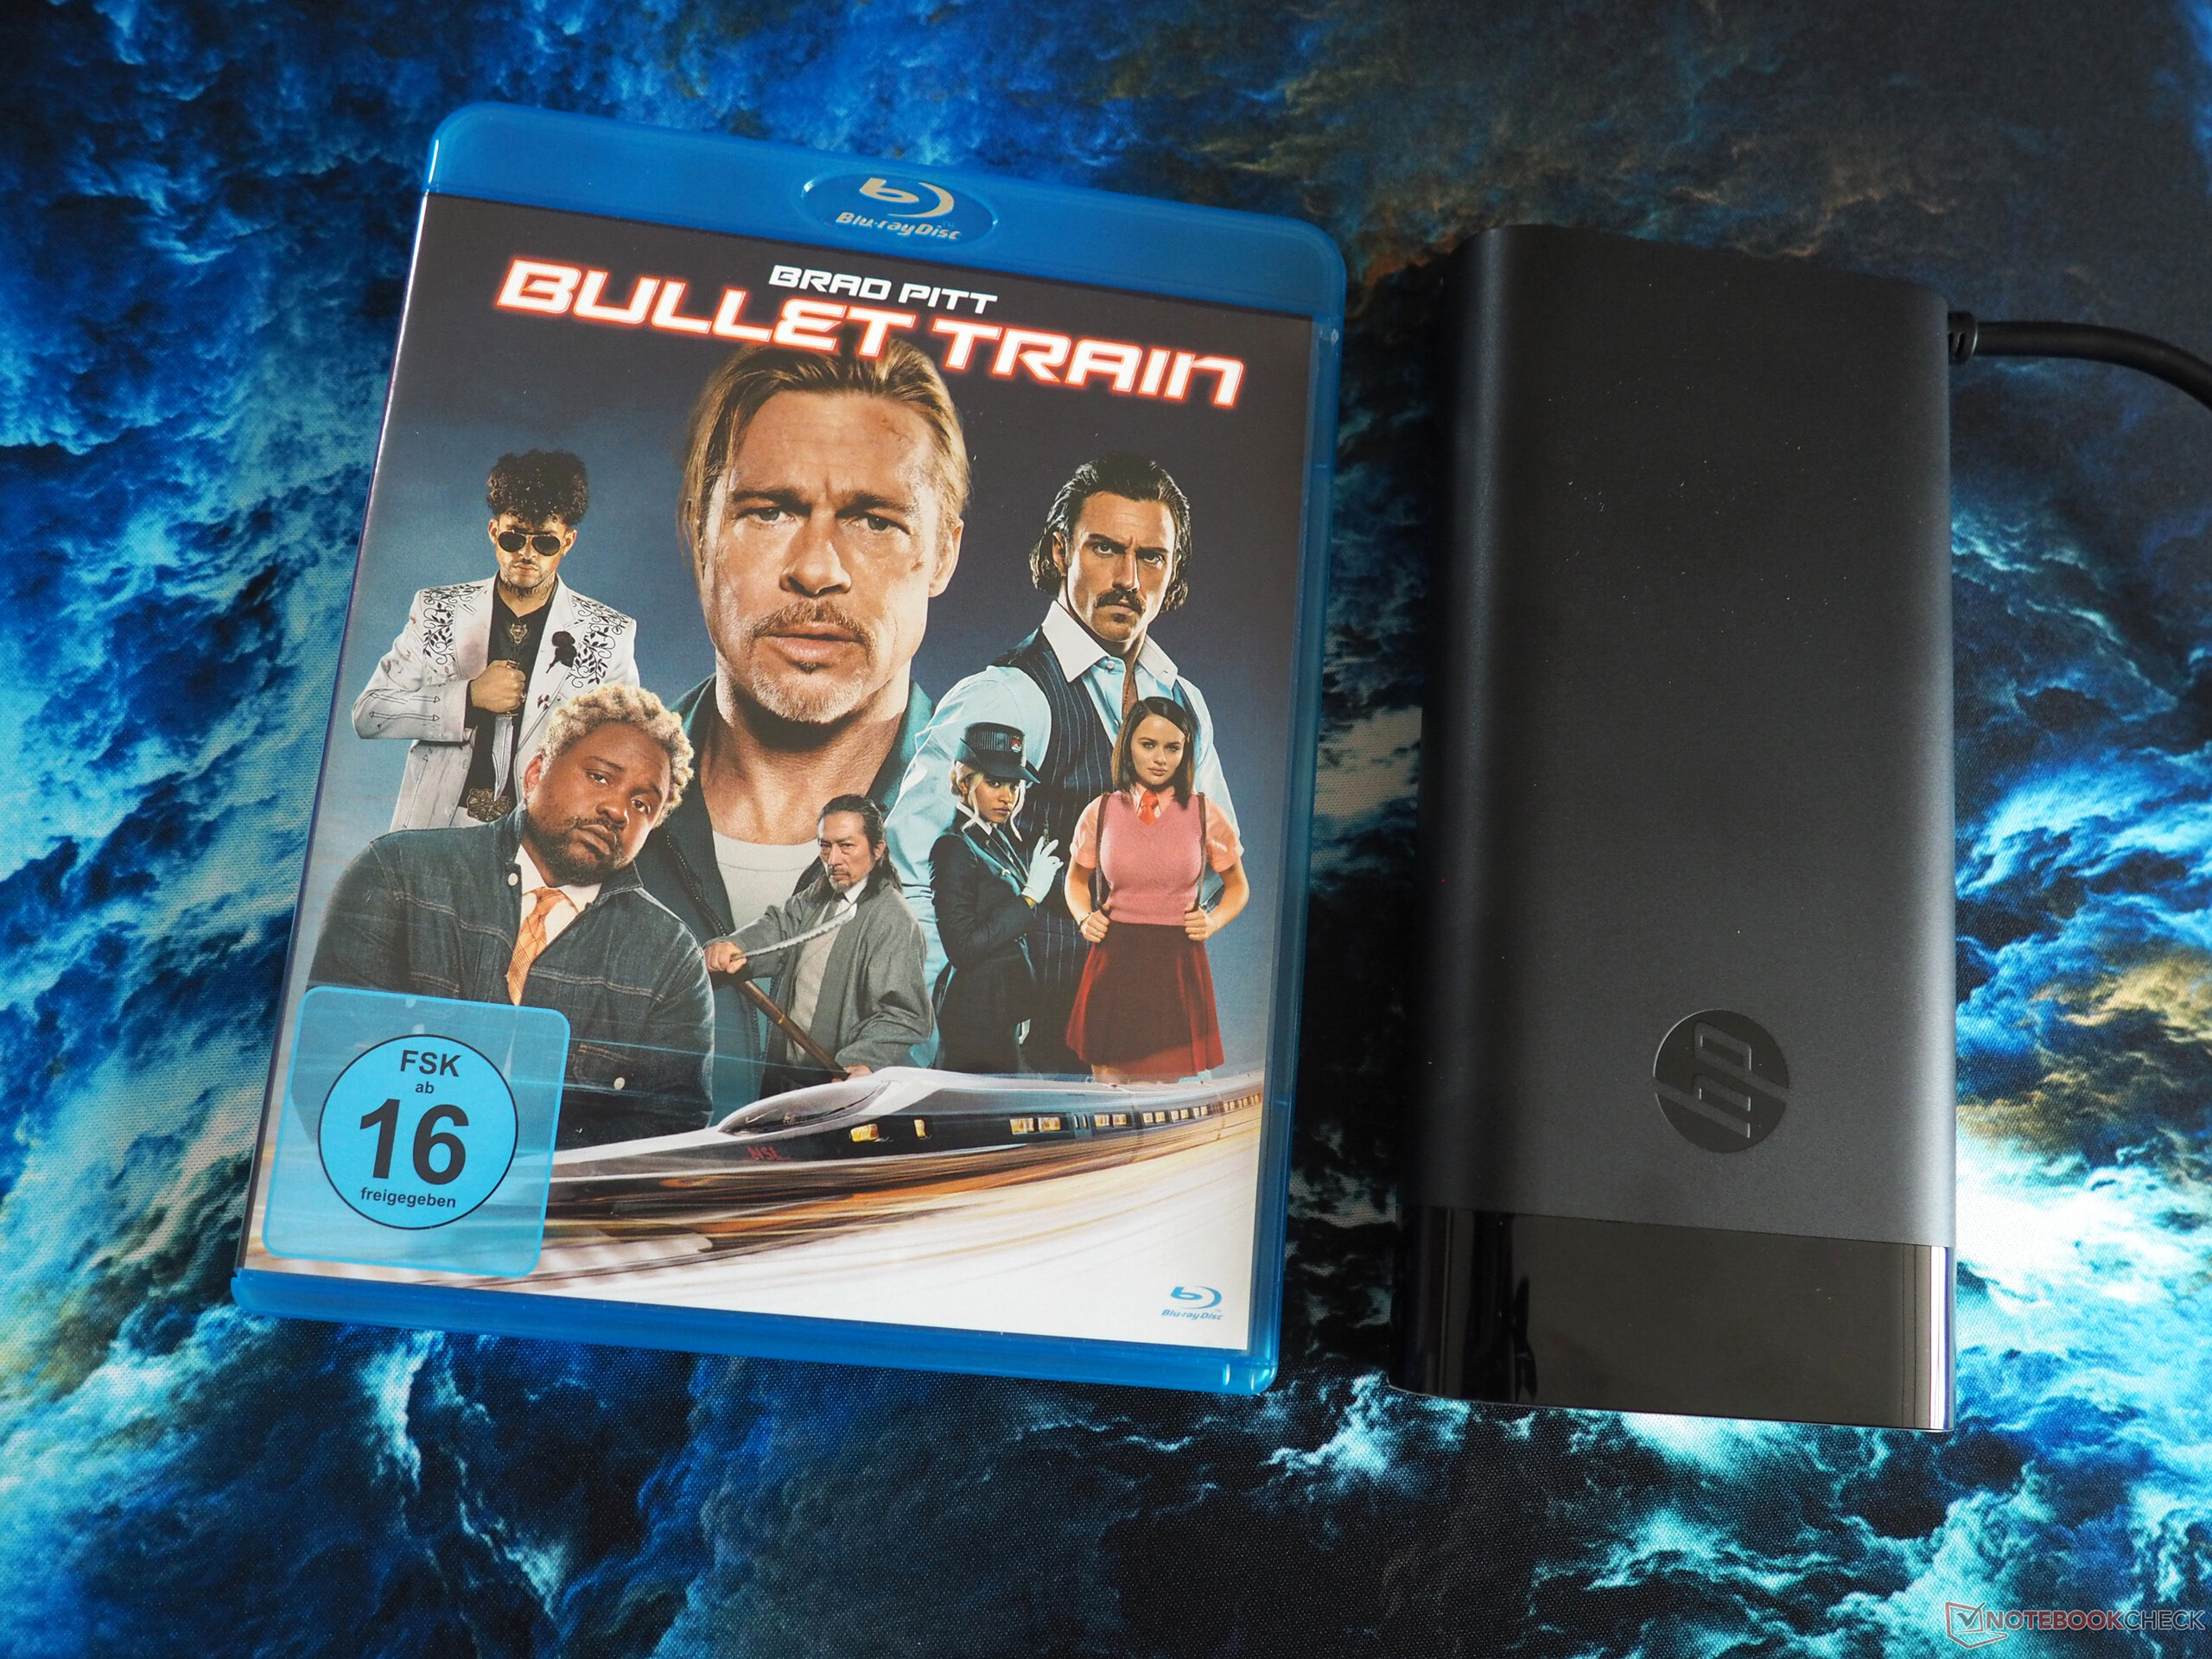
O laptop vem com alguns folhetos informativos e uma fonte de alimentação não muito volumosa de 200 watts.
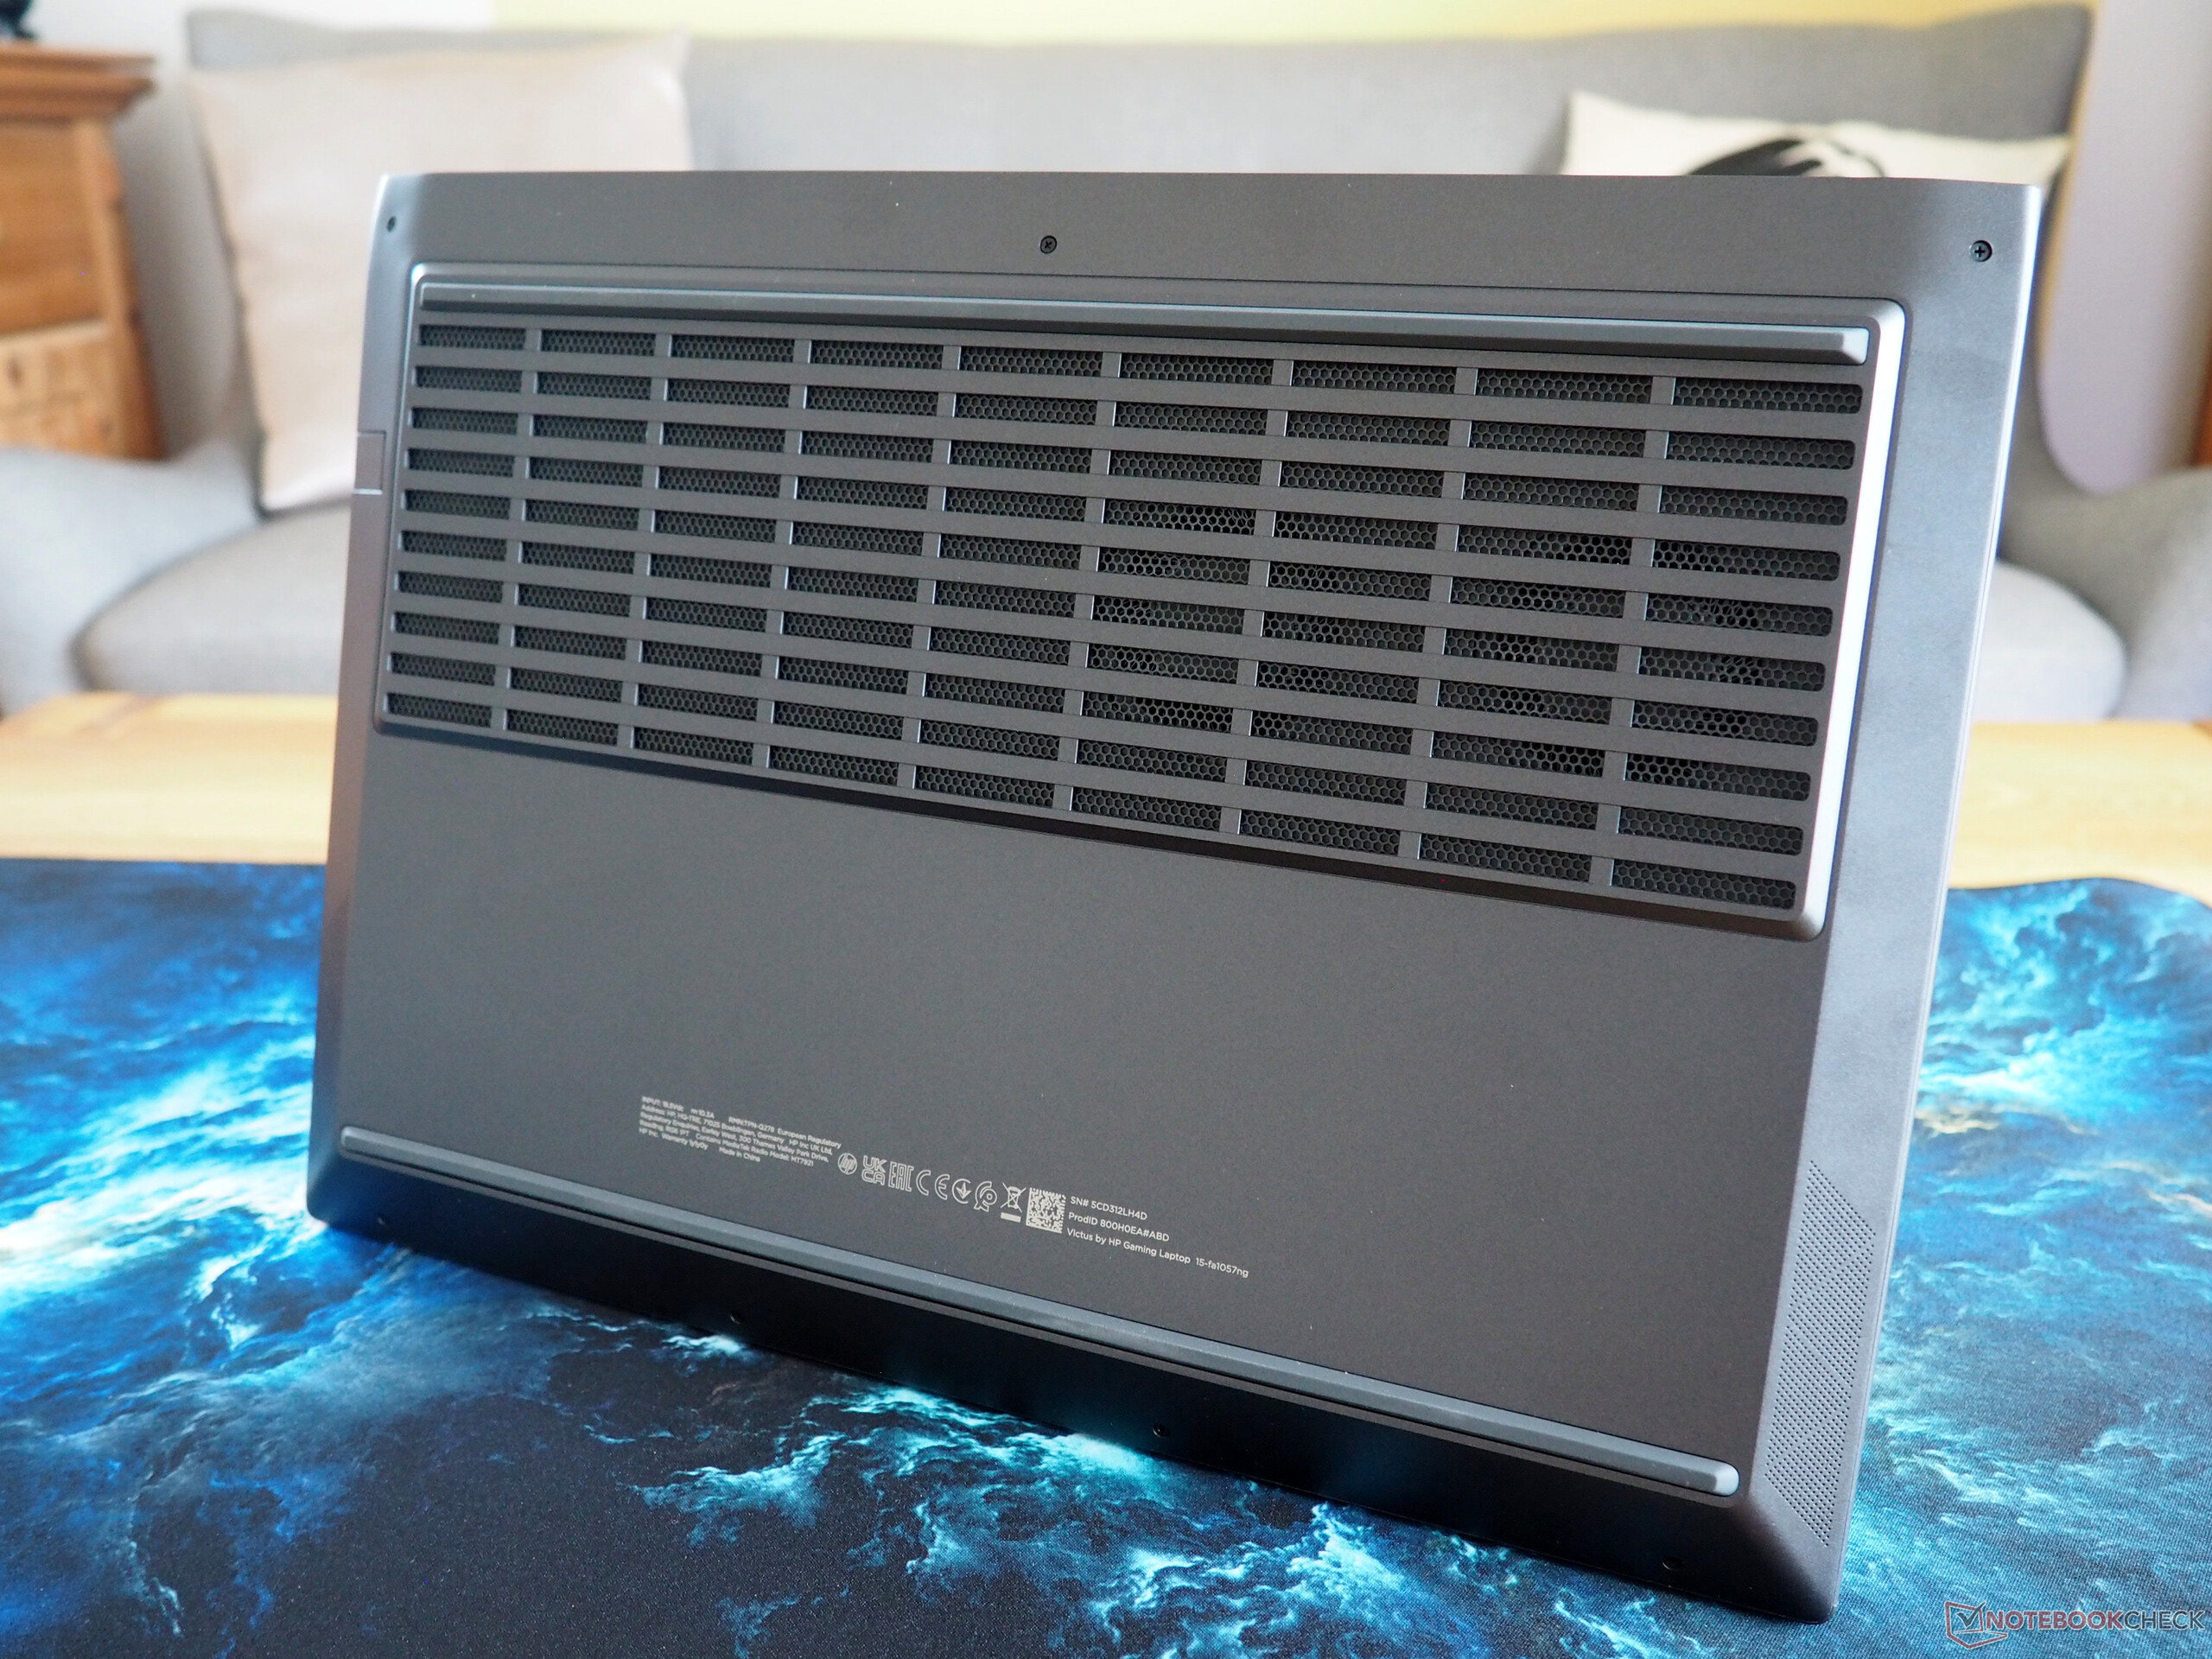
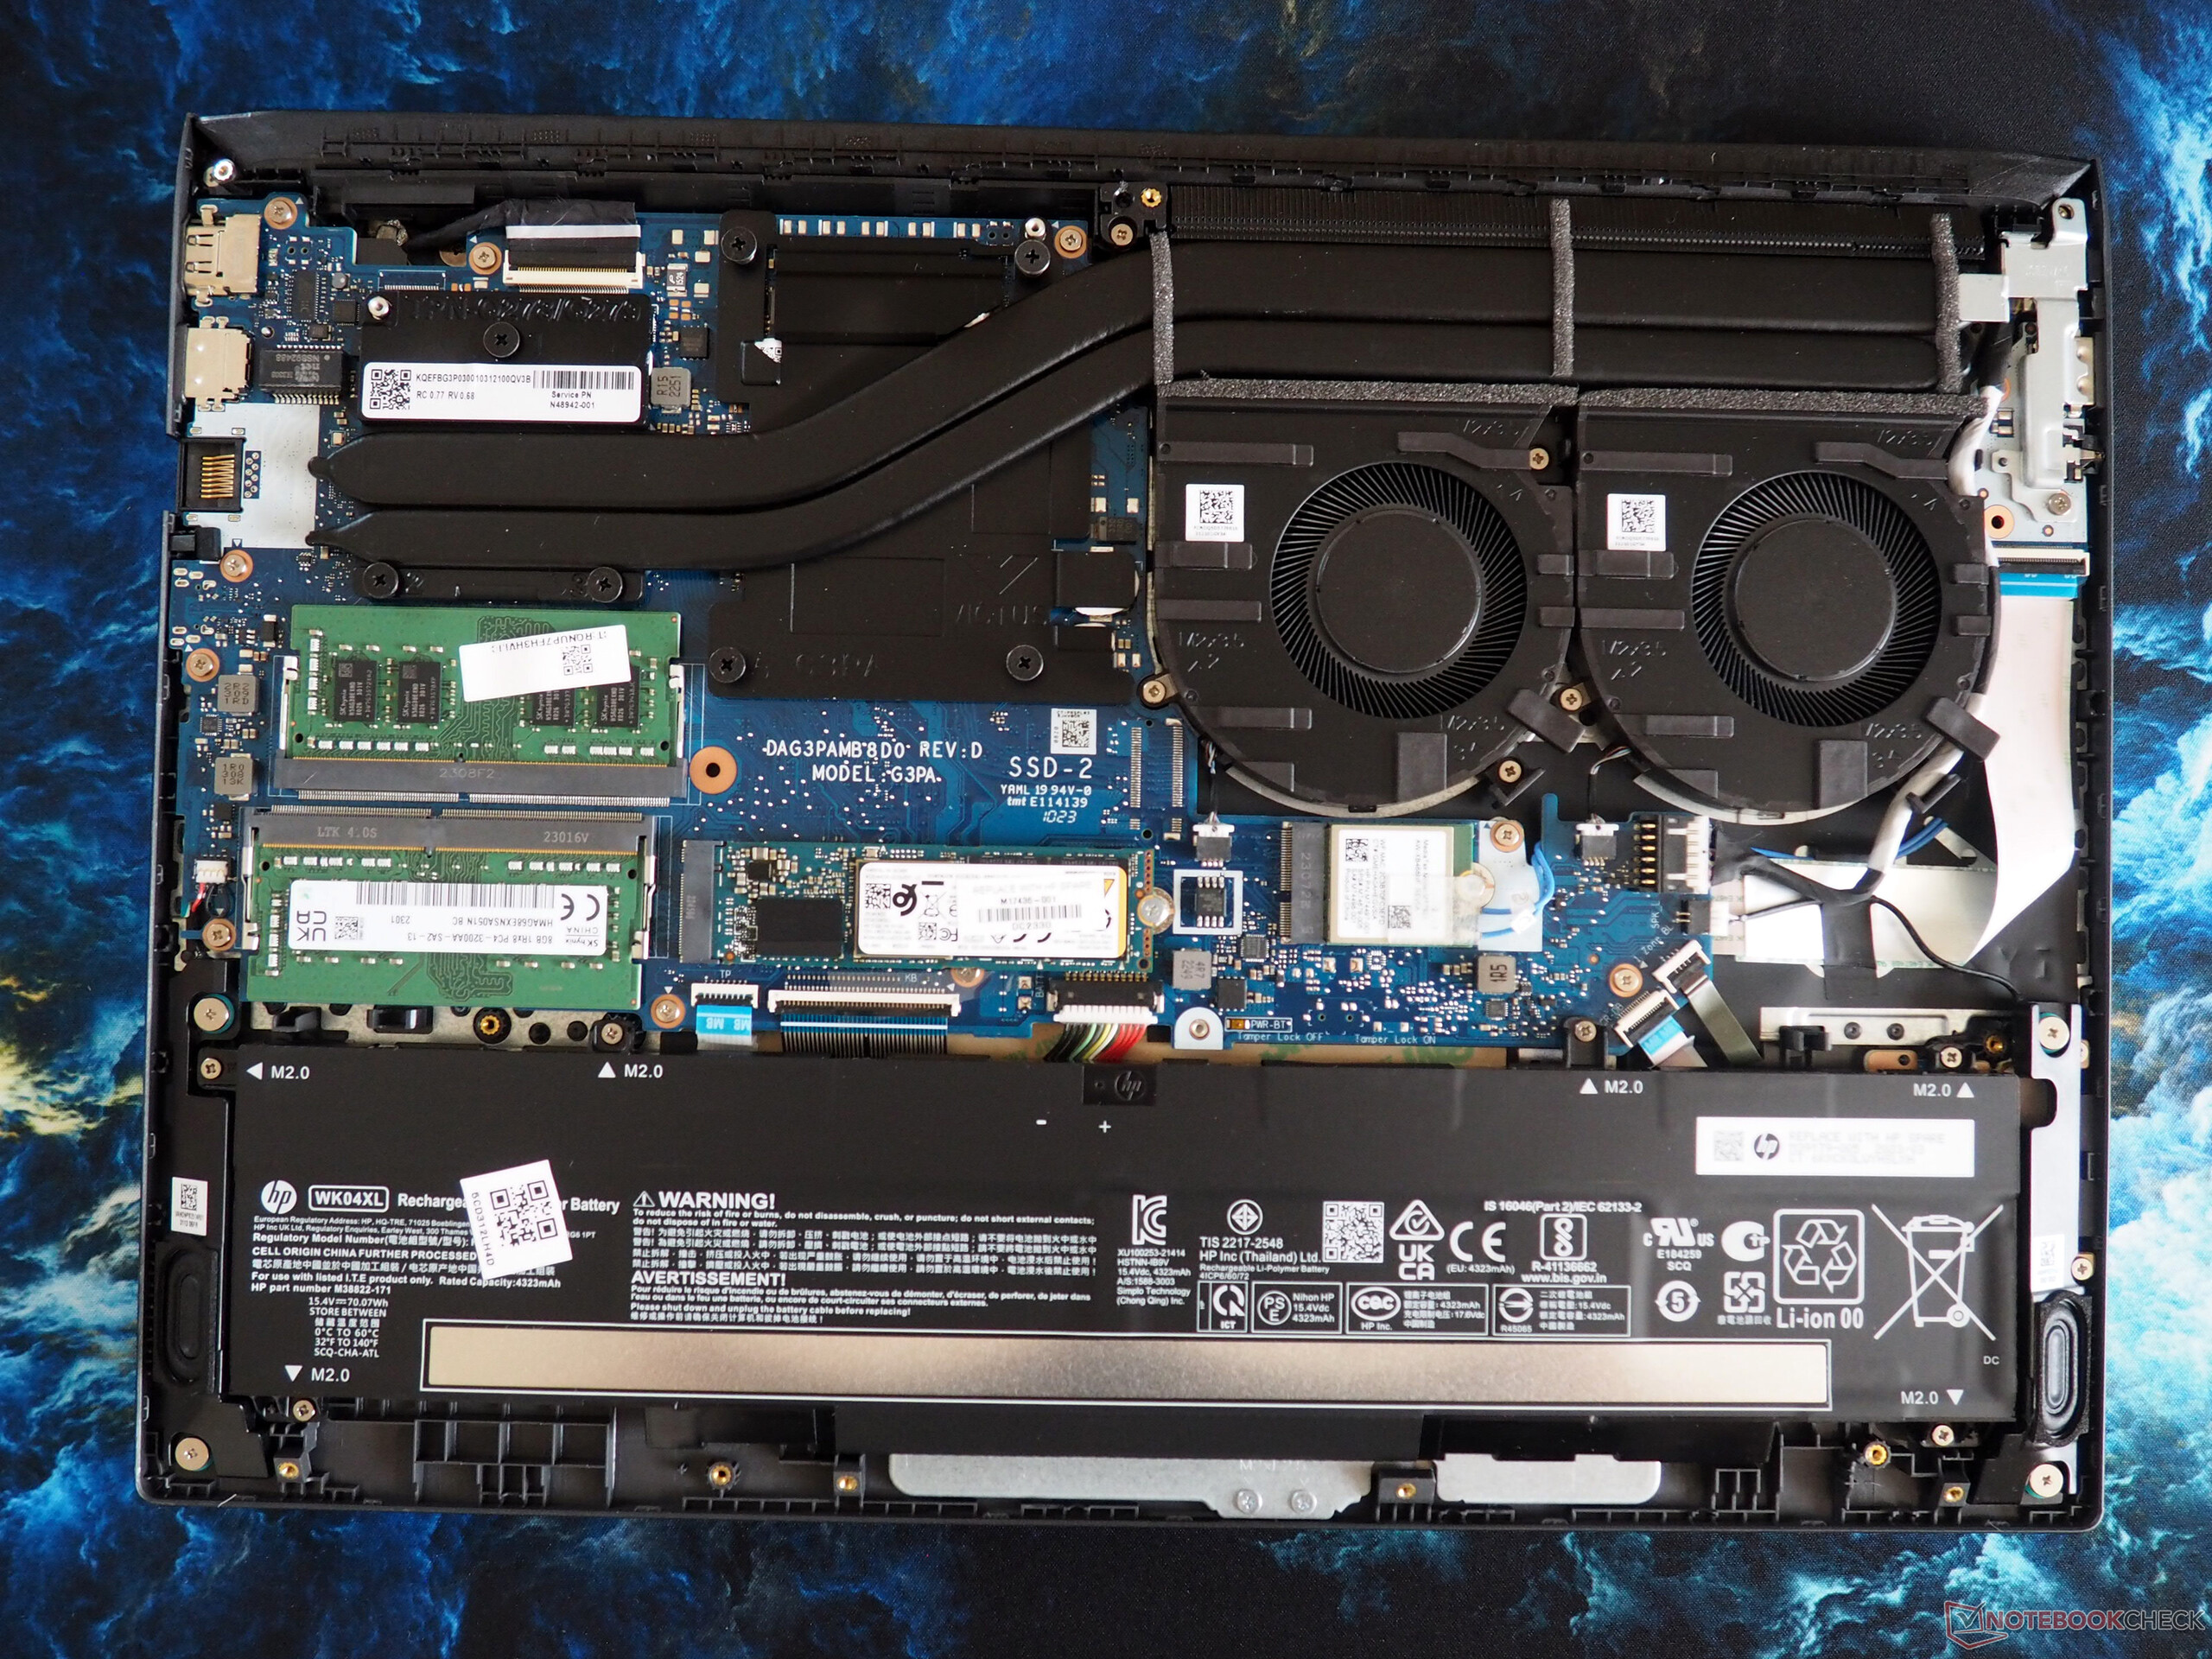
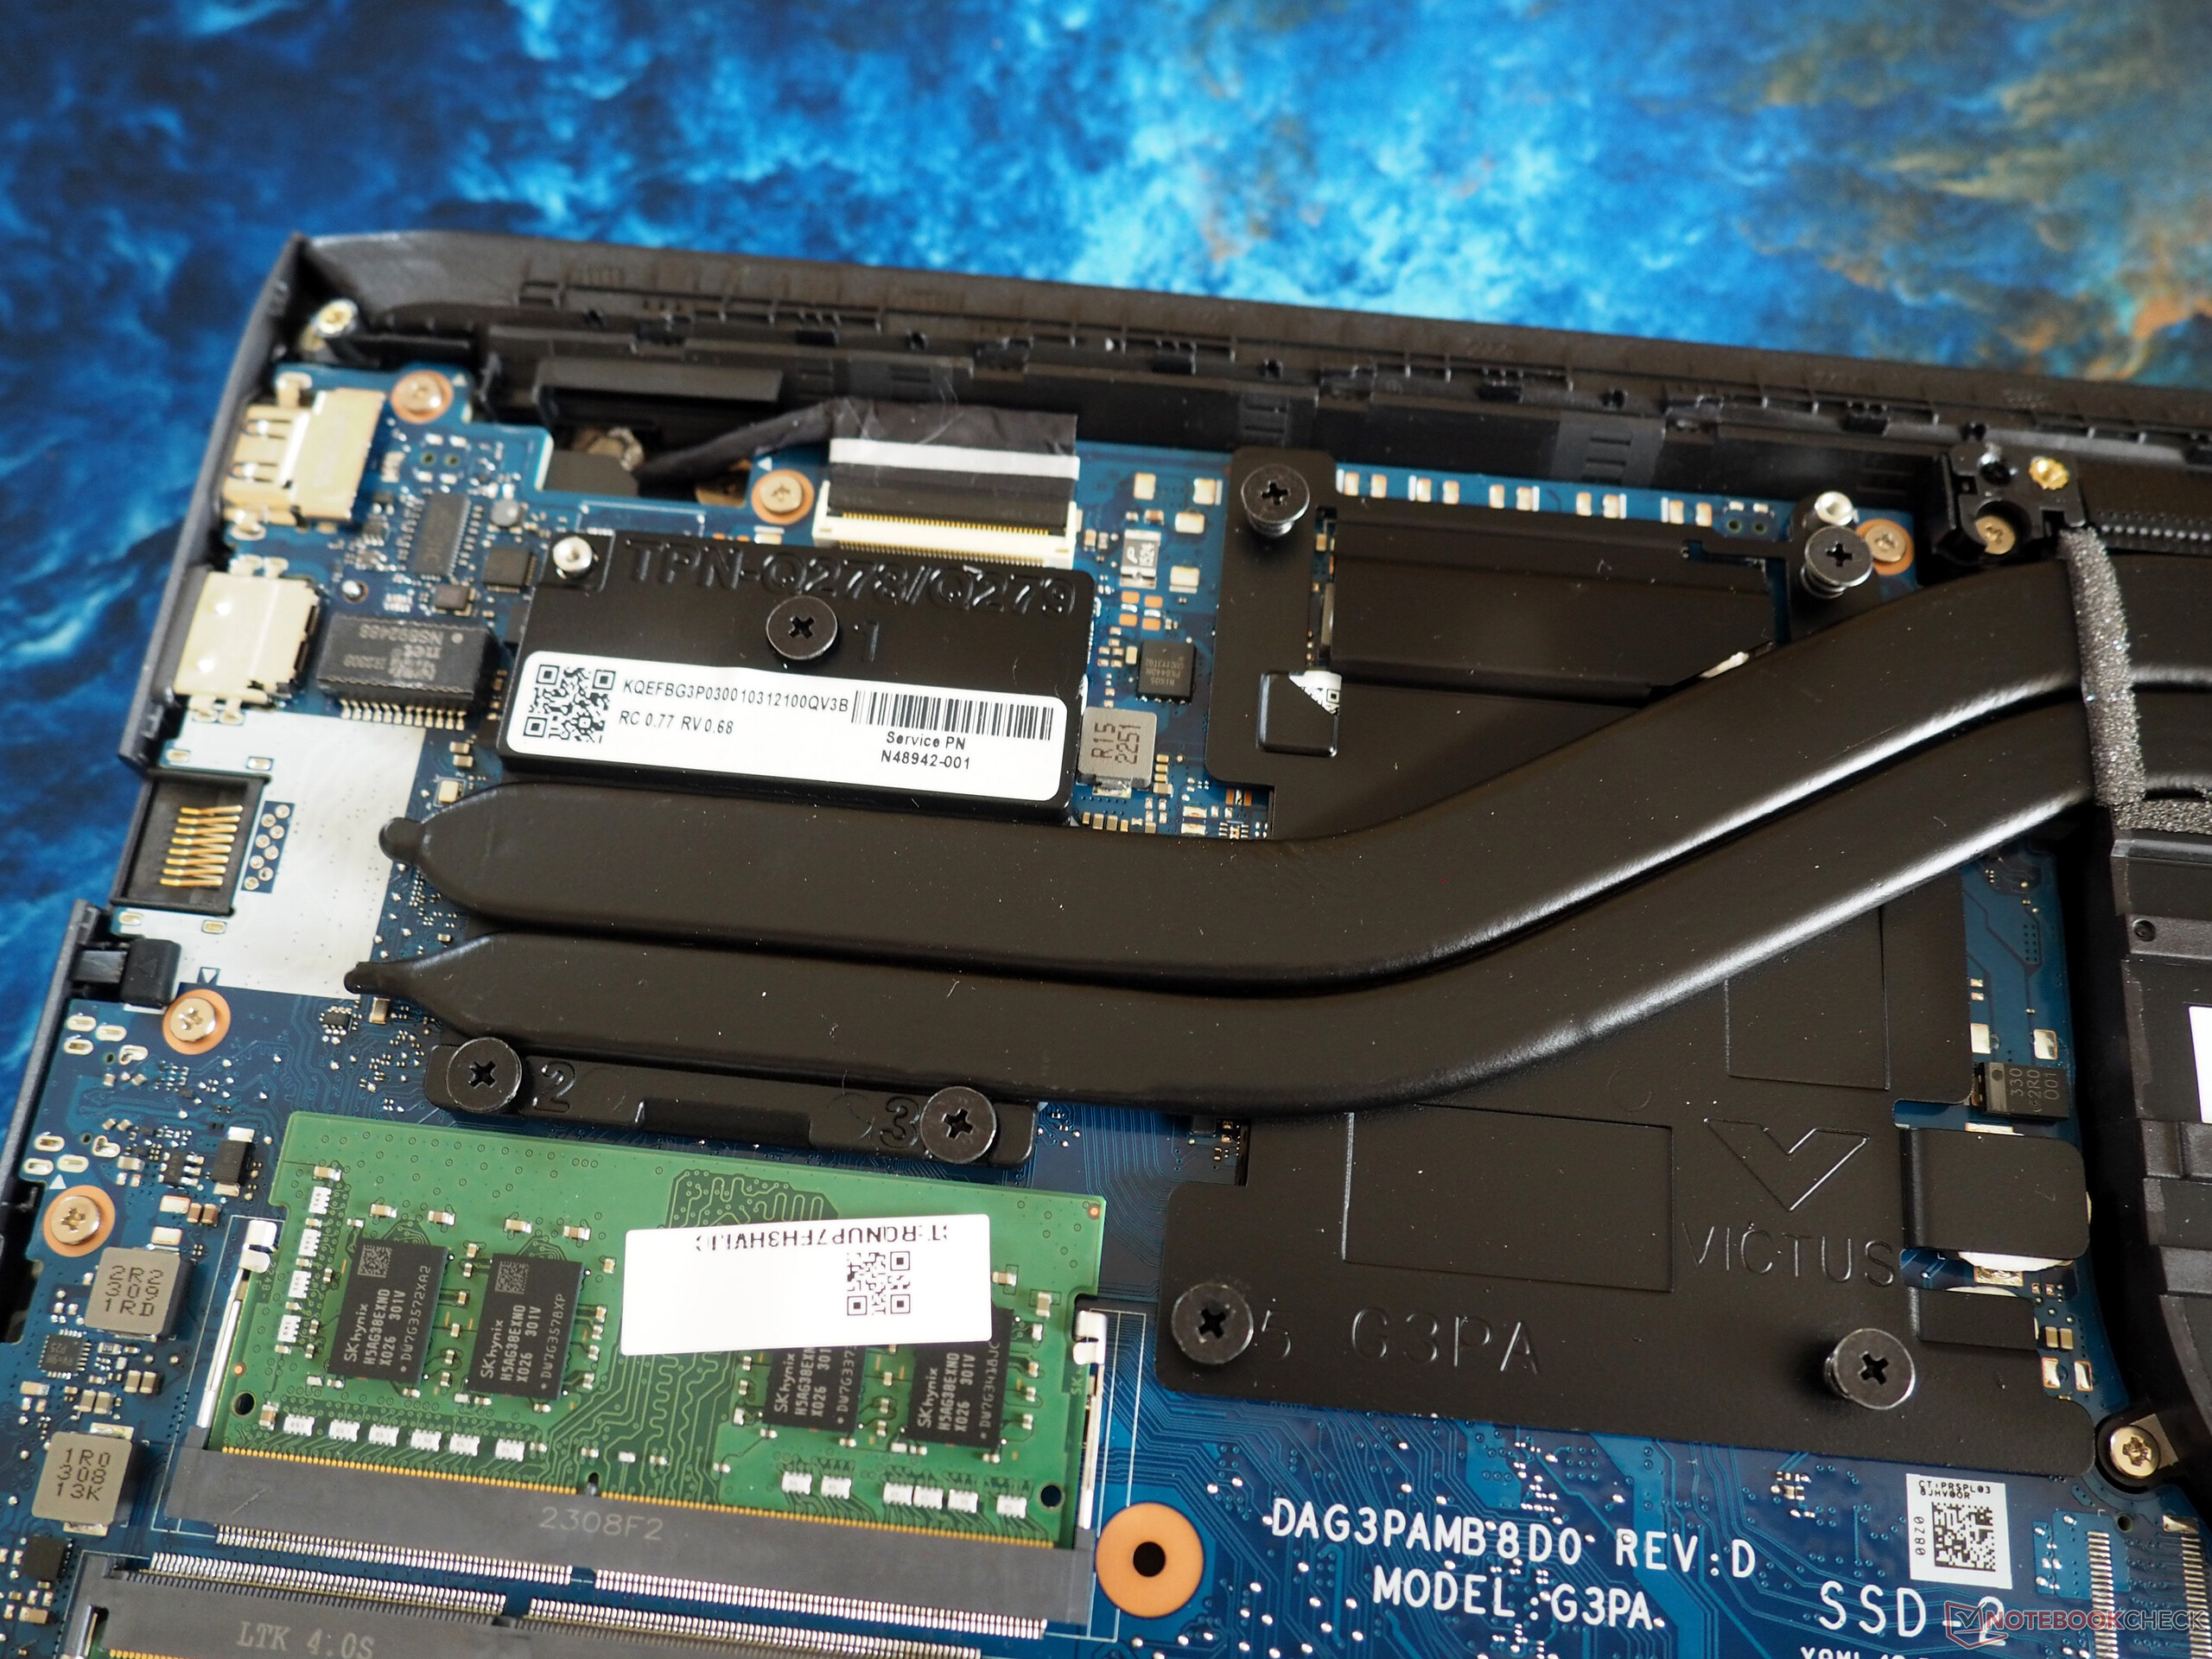
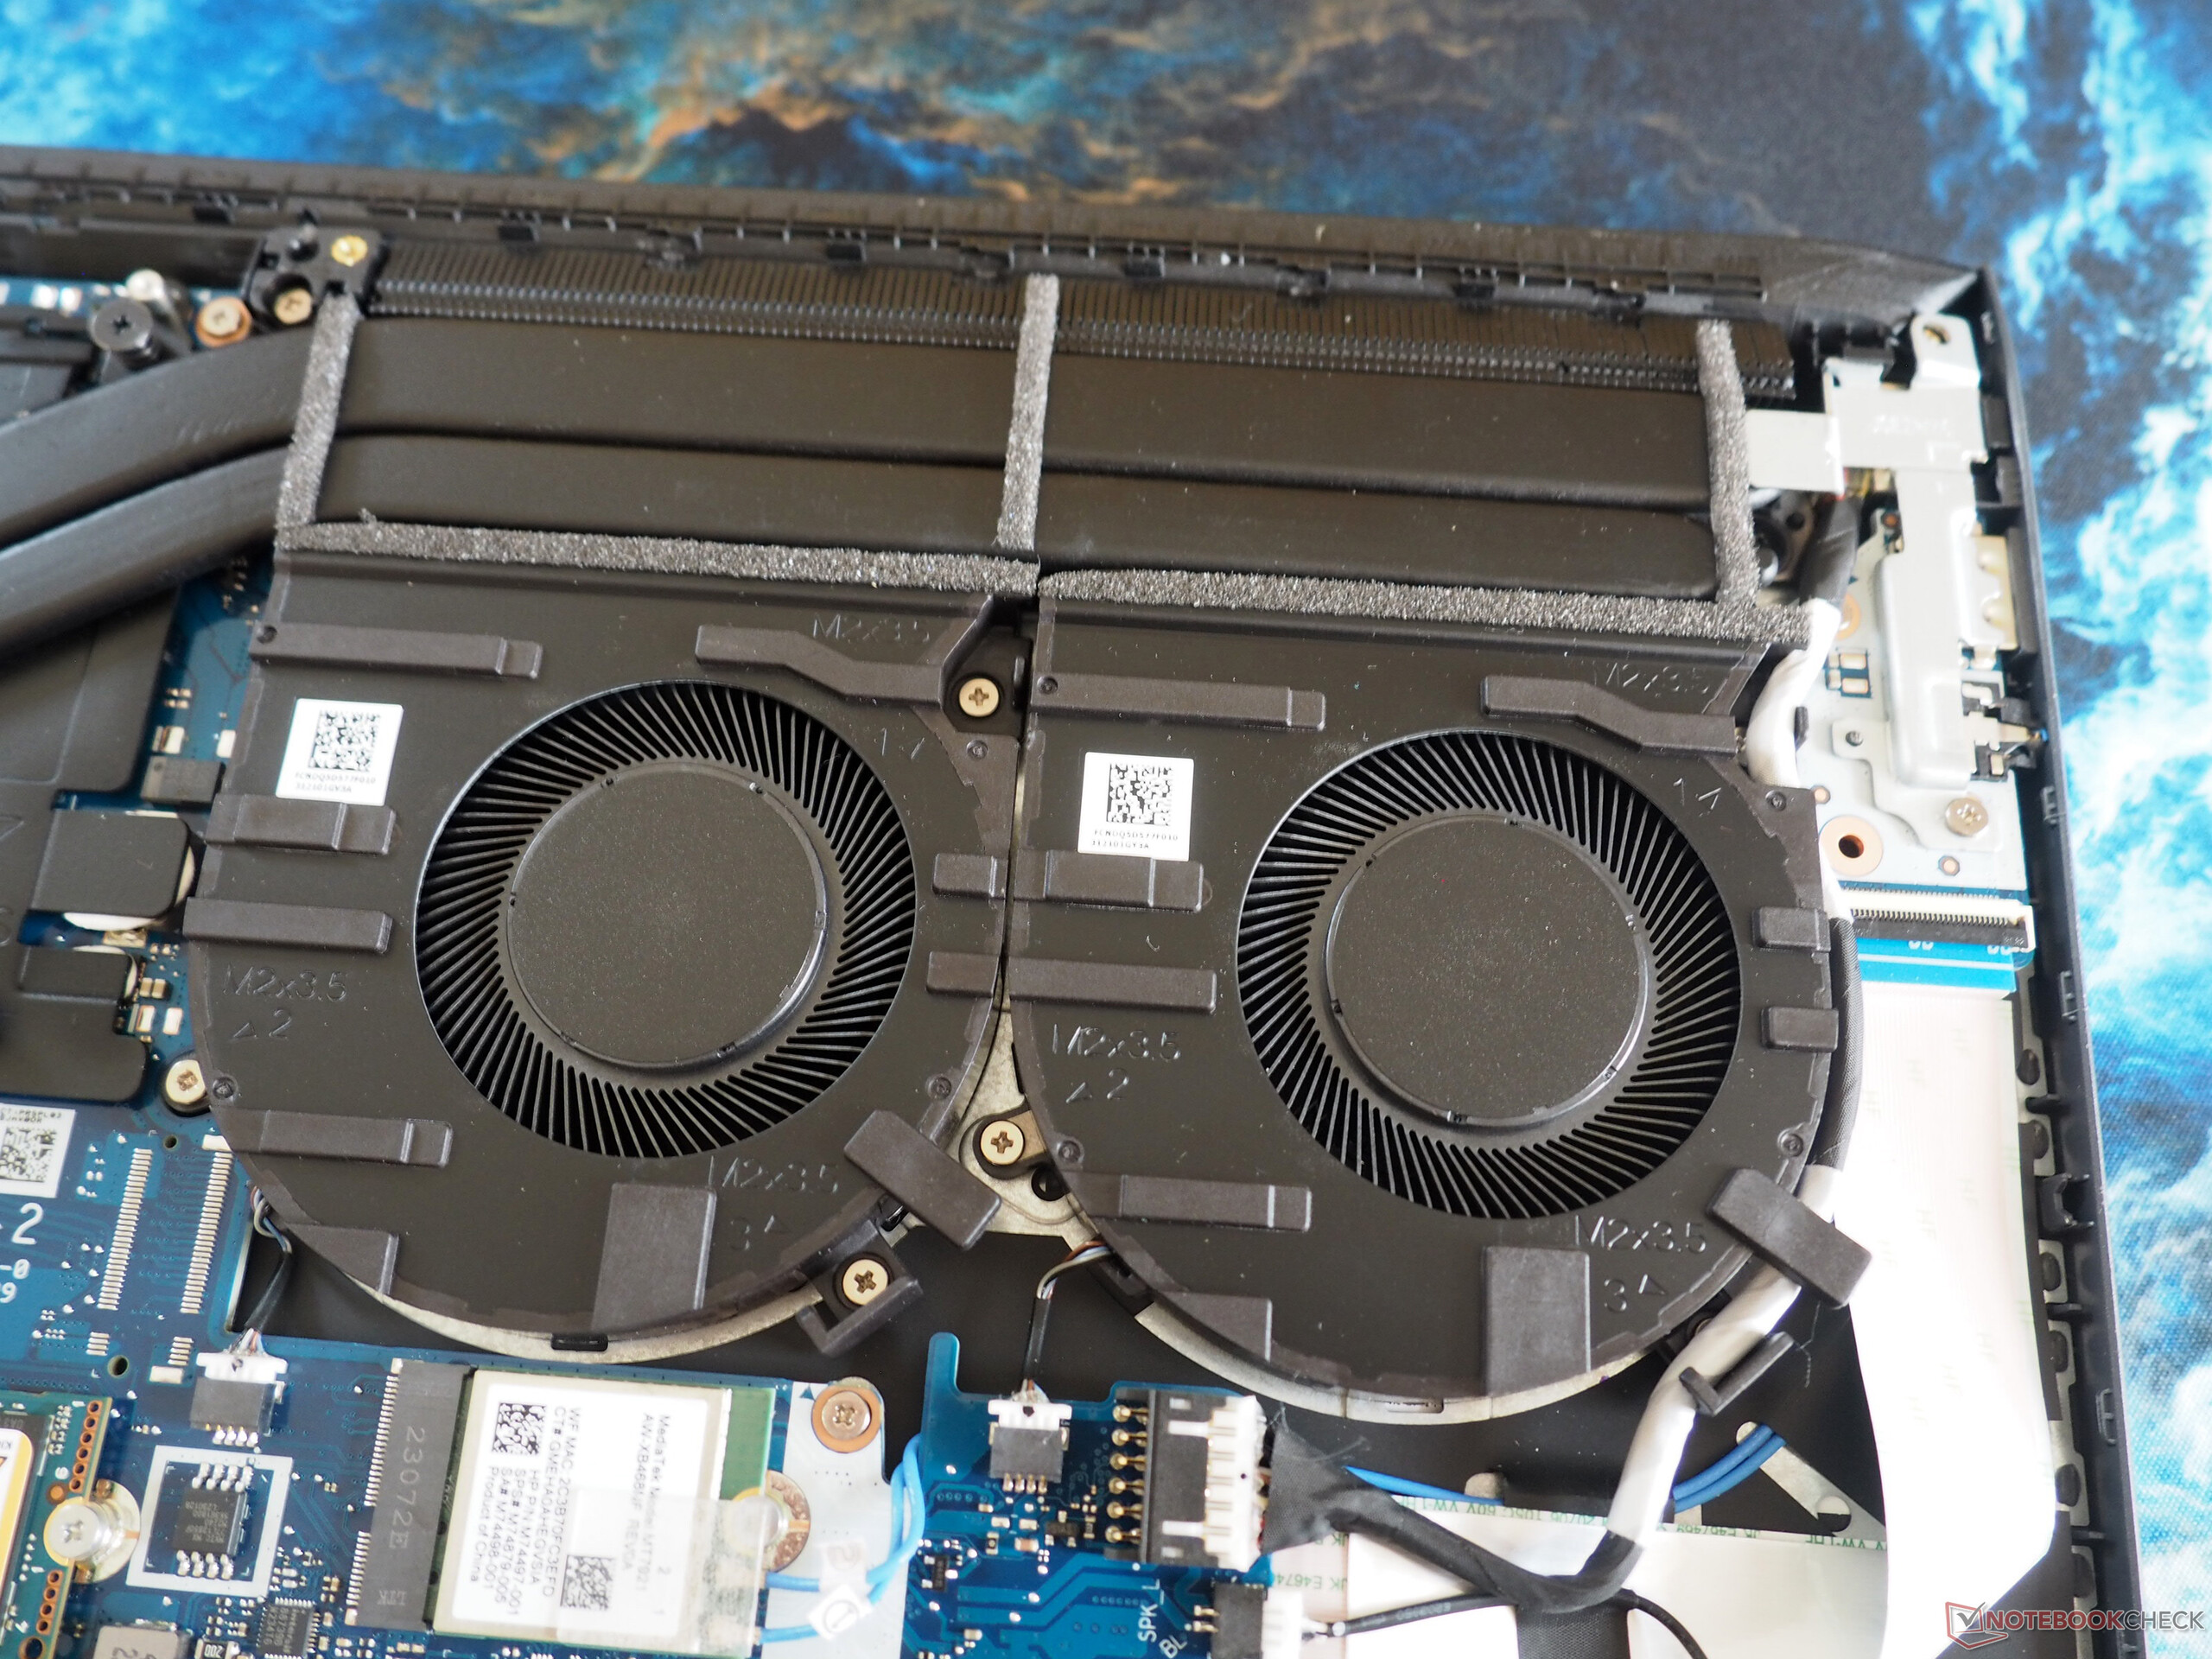
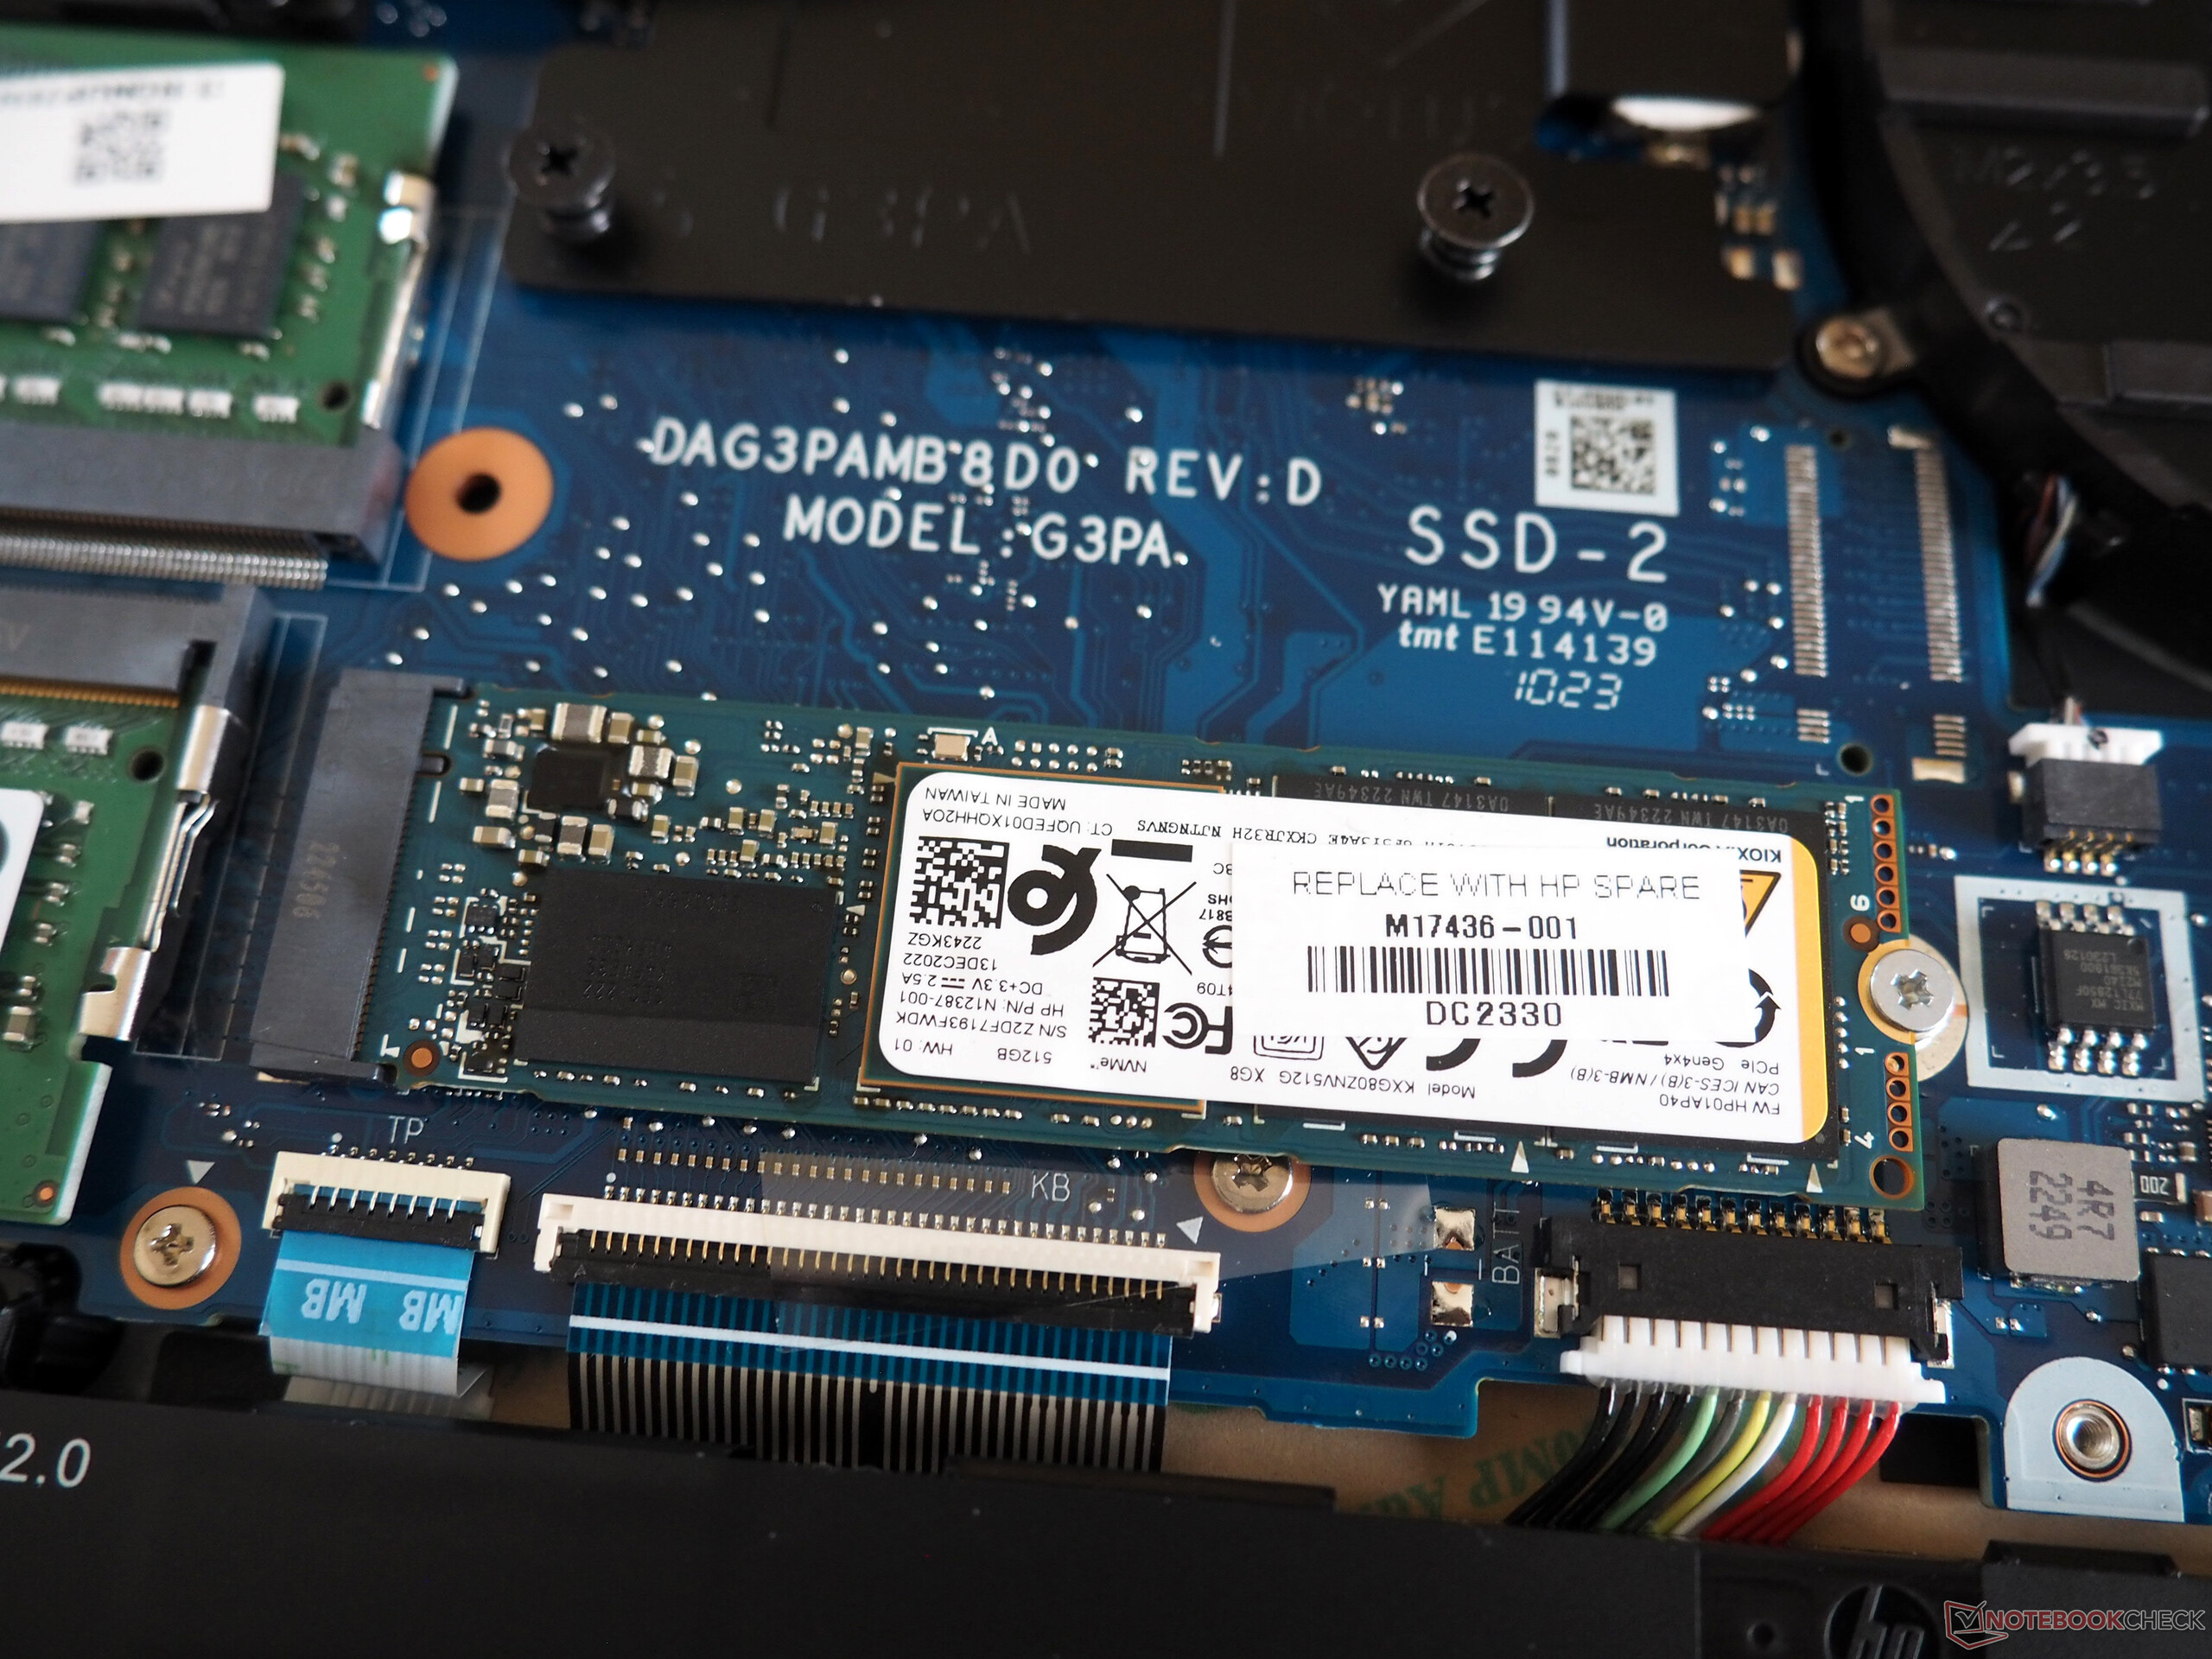
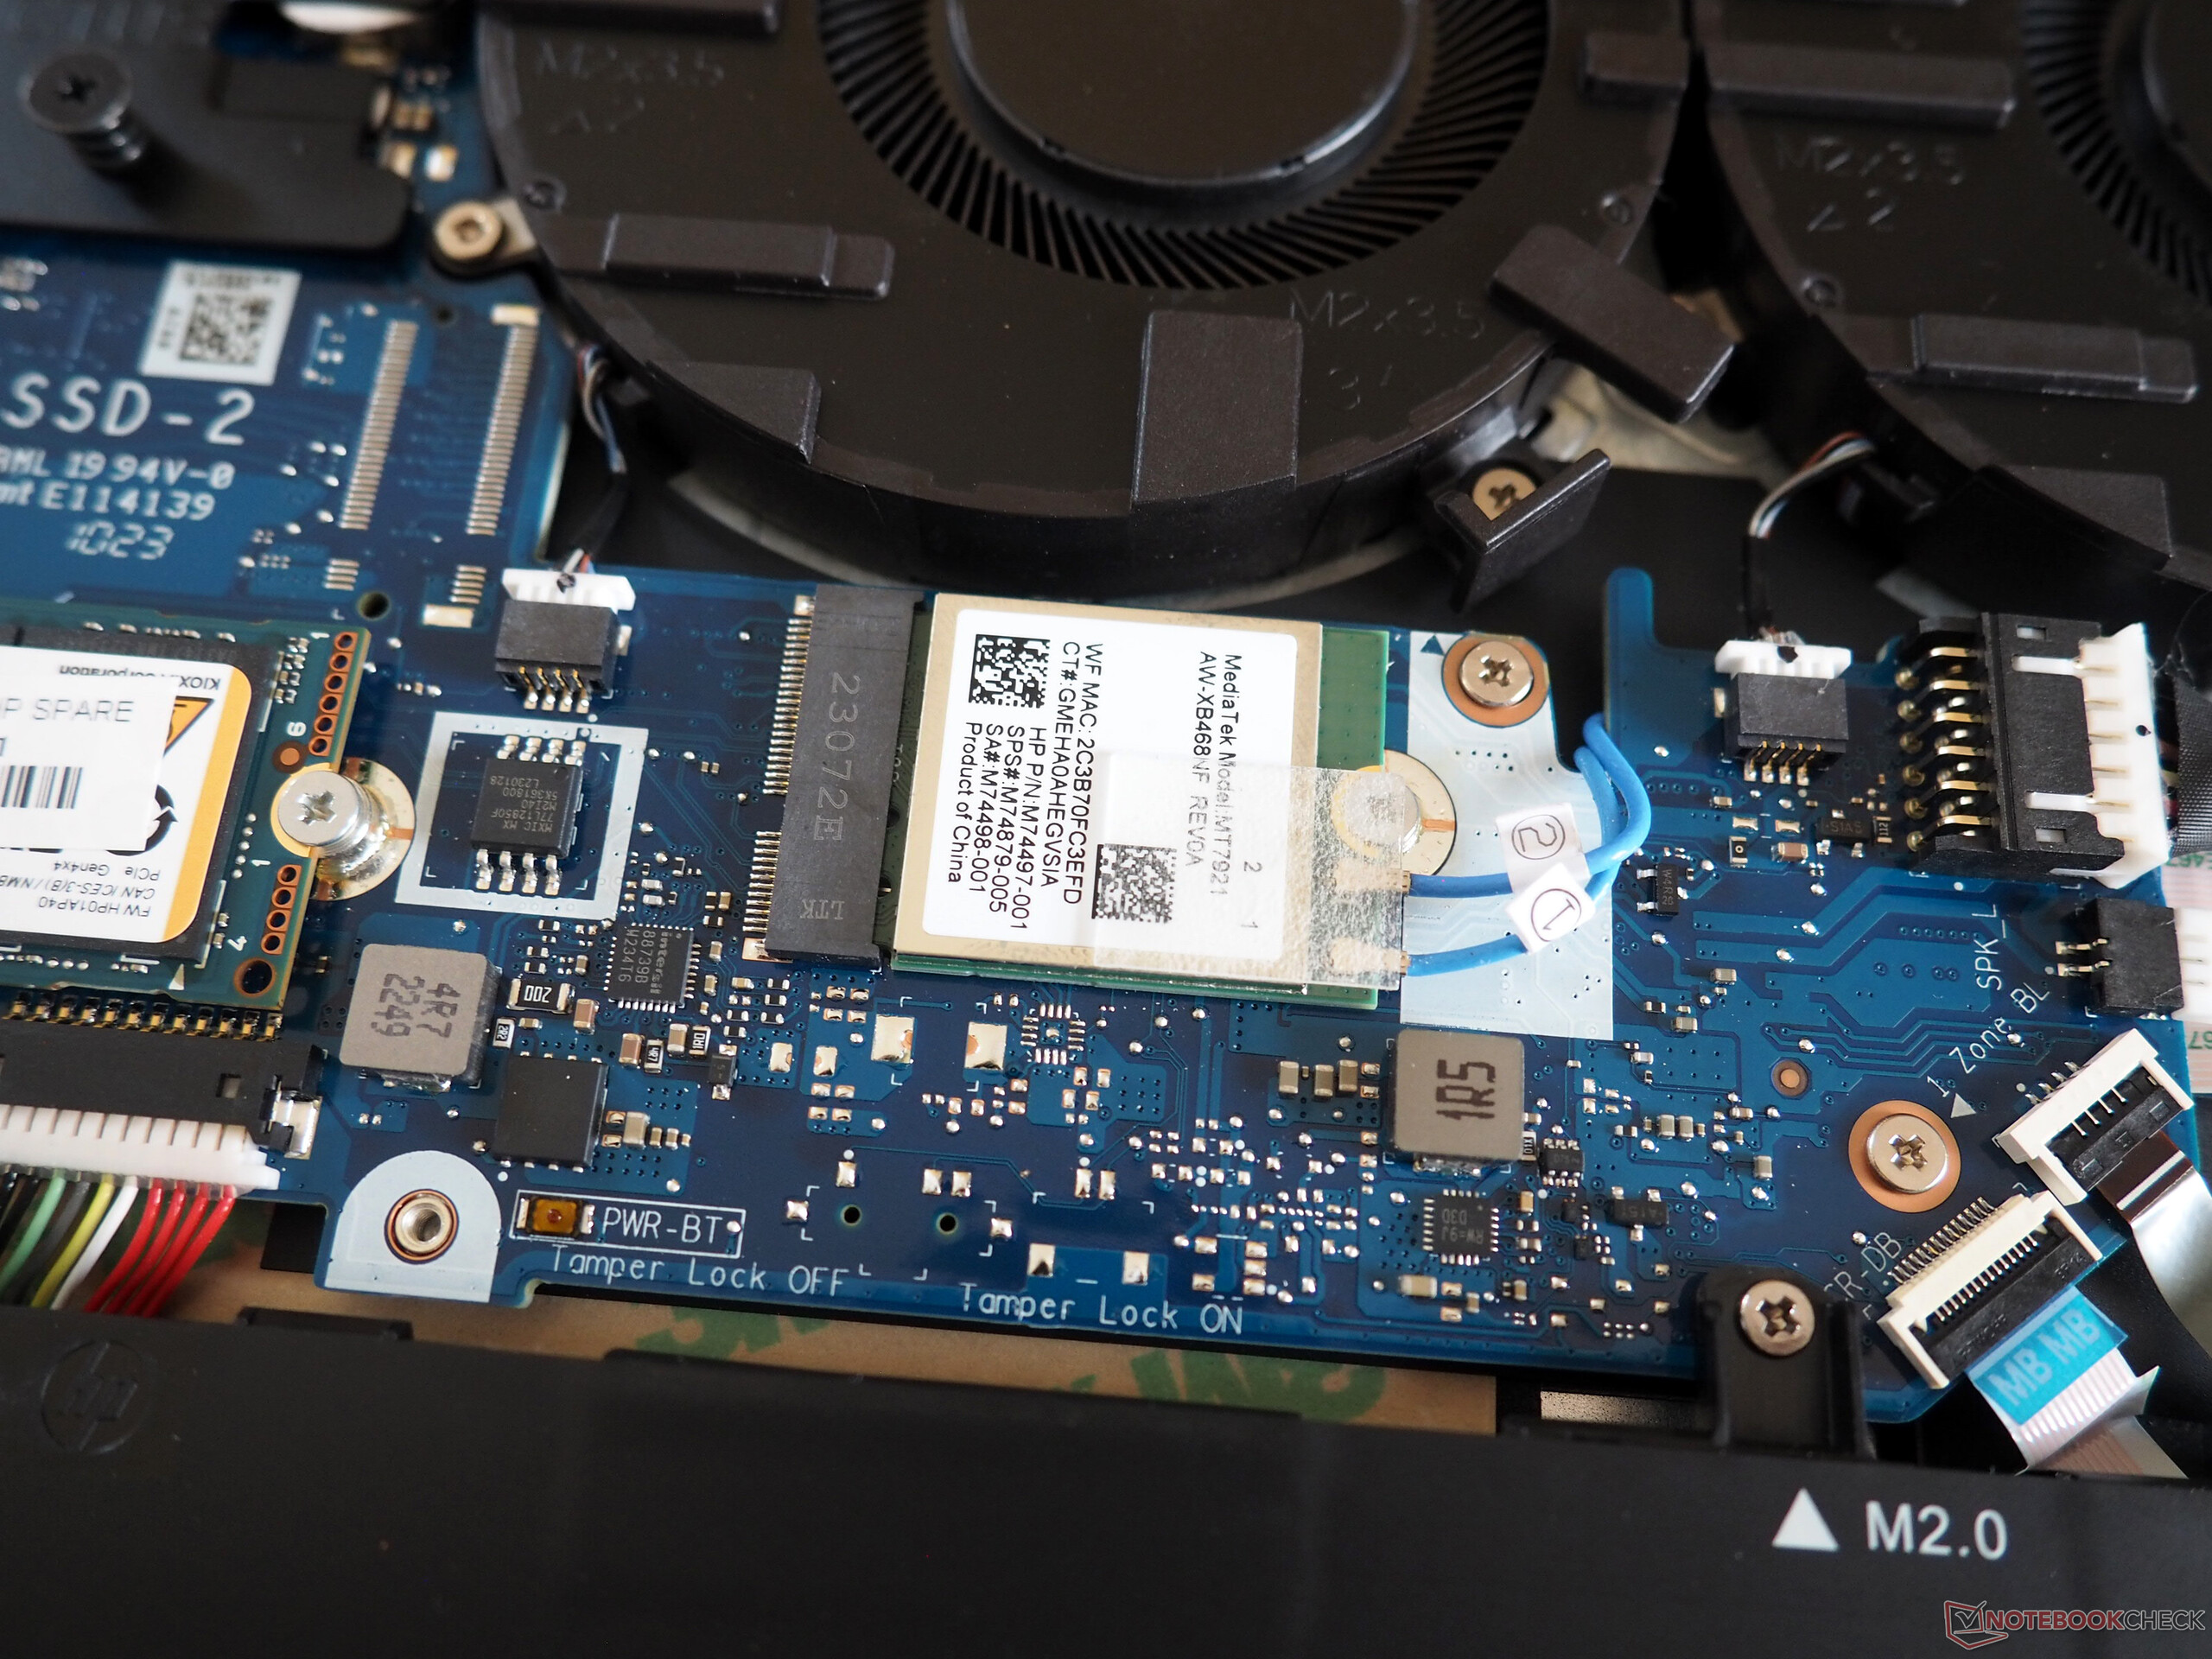
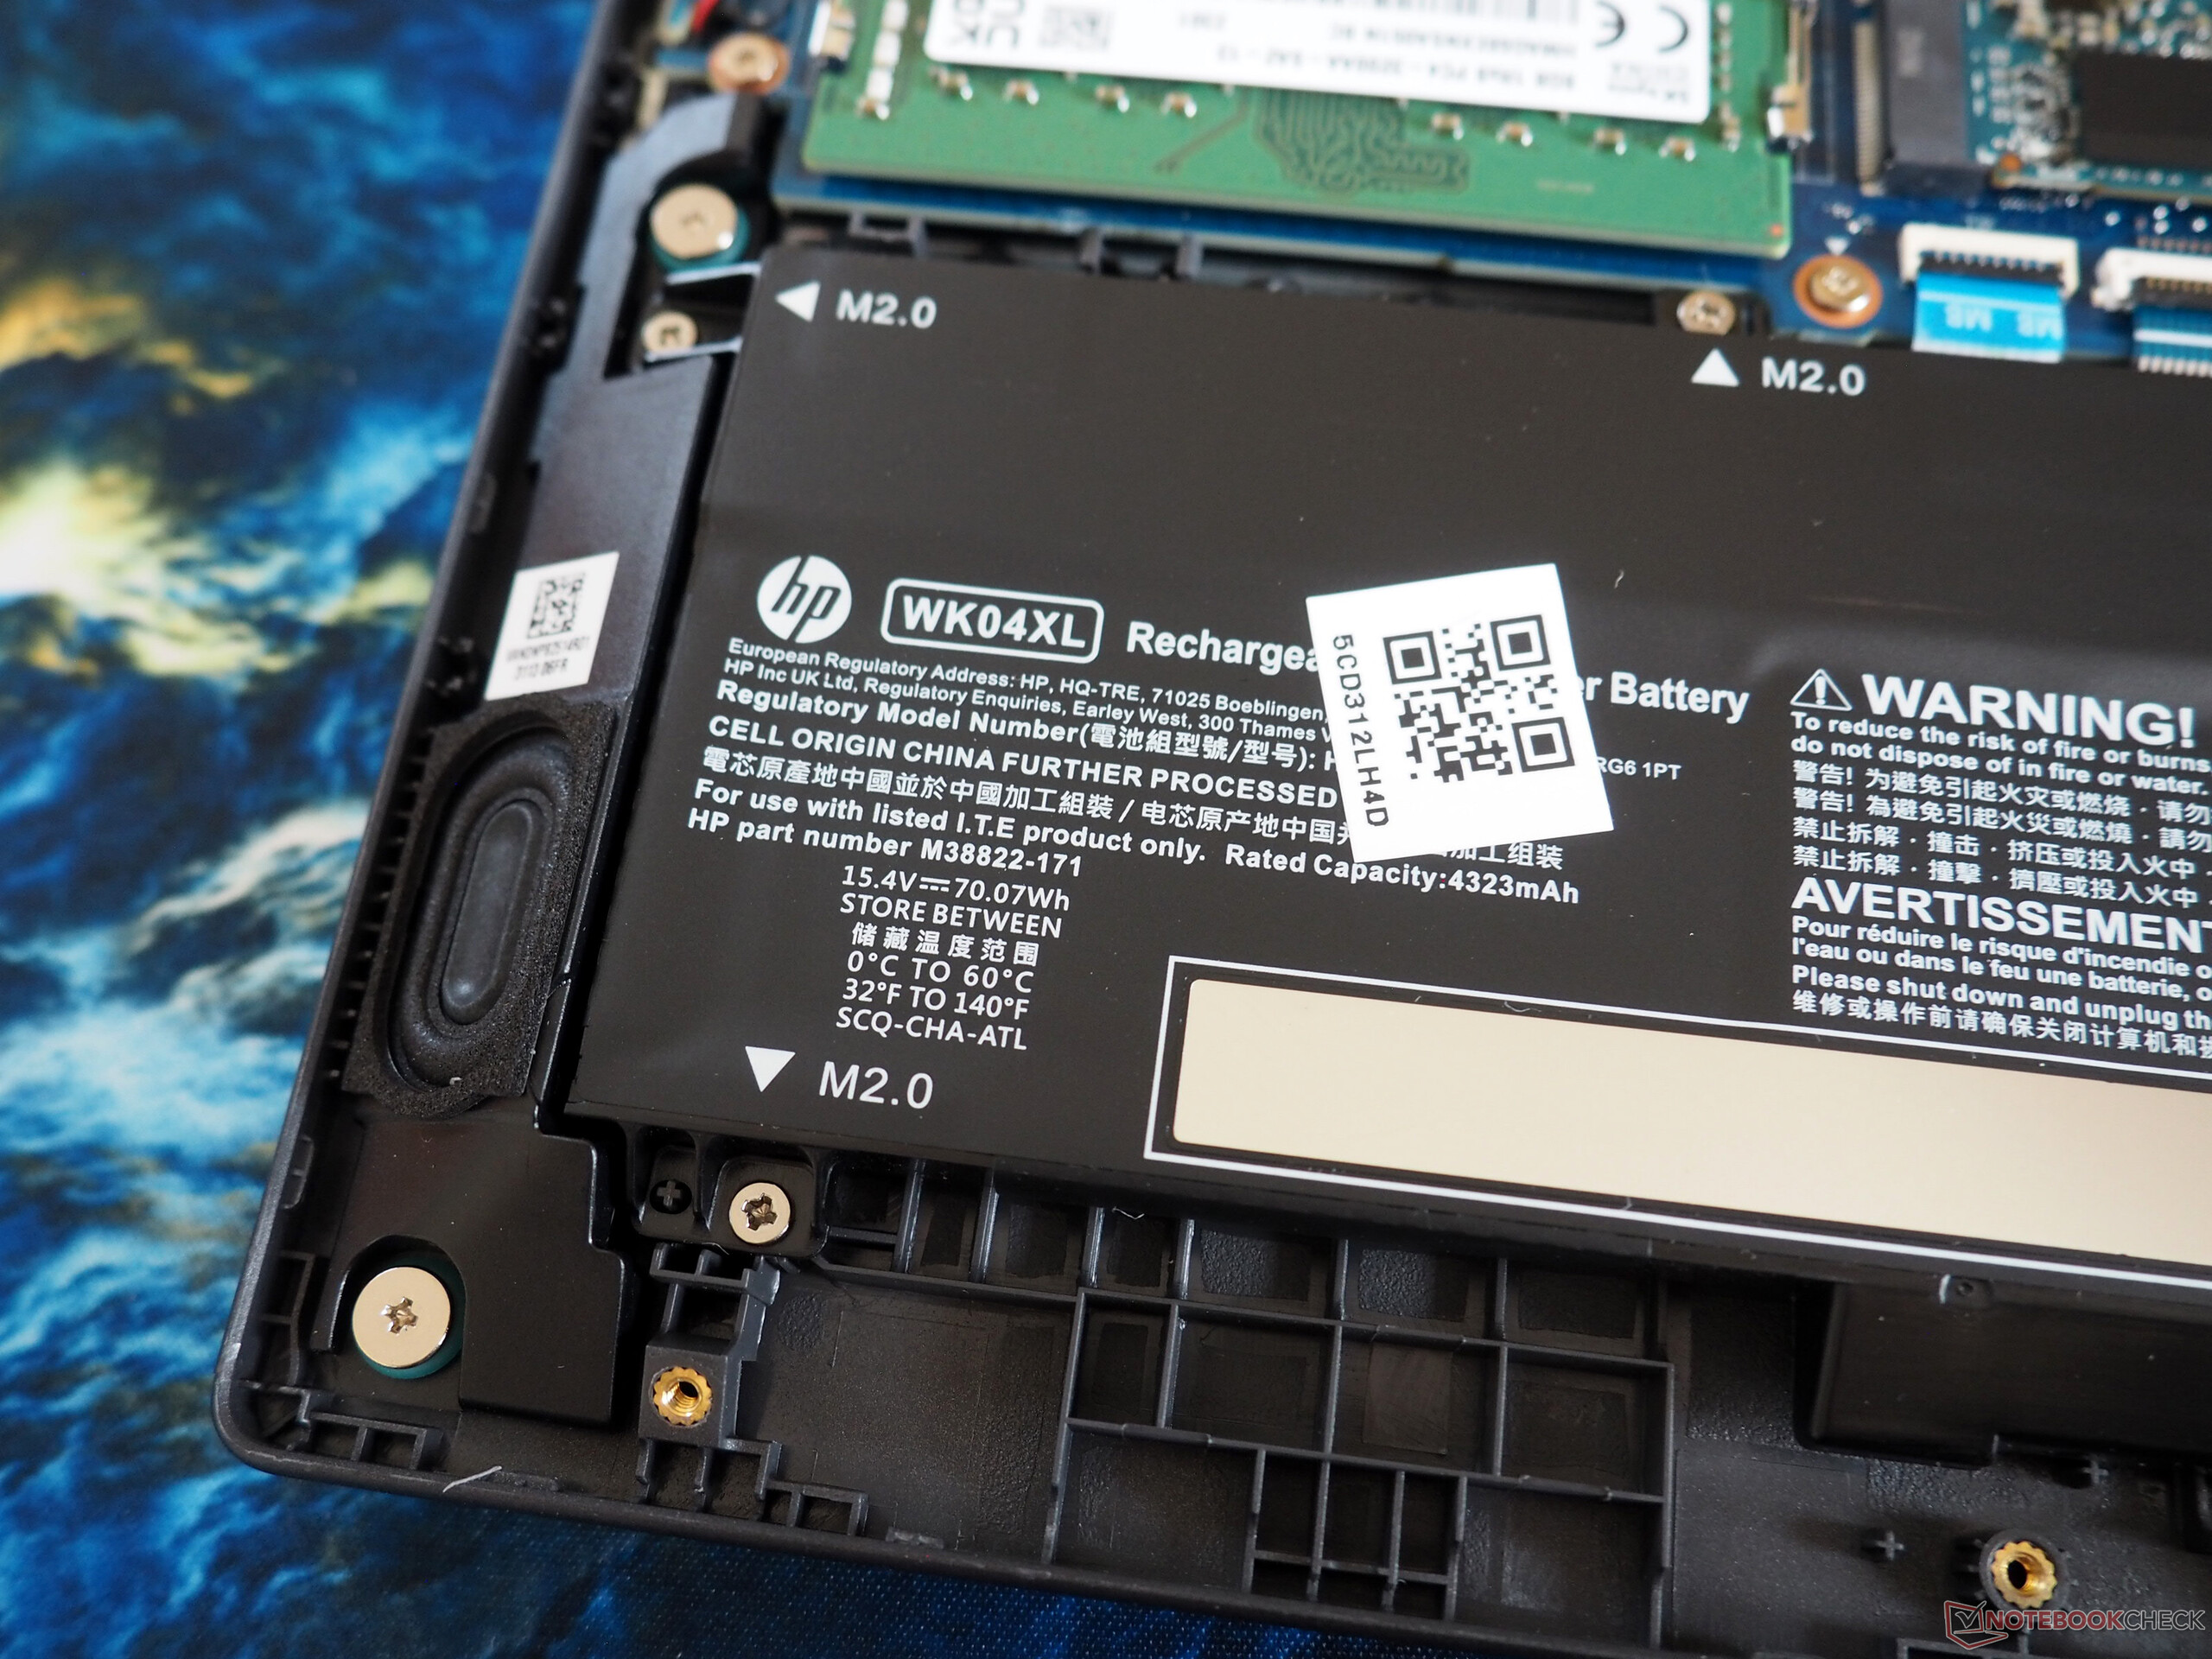
Manutenção
É necessário algum cuidado durante a manutenção. Embora os parafusos Phillips da placa de base possam ser removidos com relativa rapidez, afrouxar os clipes de retenção é um desafio, mesmo com uma ferramenta adequada. As imagens mostram o interior da caixa e que todos os componentes essenciais estão acessíveis.
Garantia
A garantia cobre apenas 12 meses.
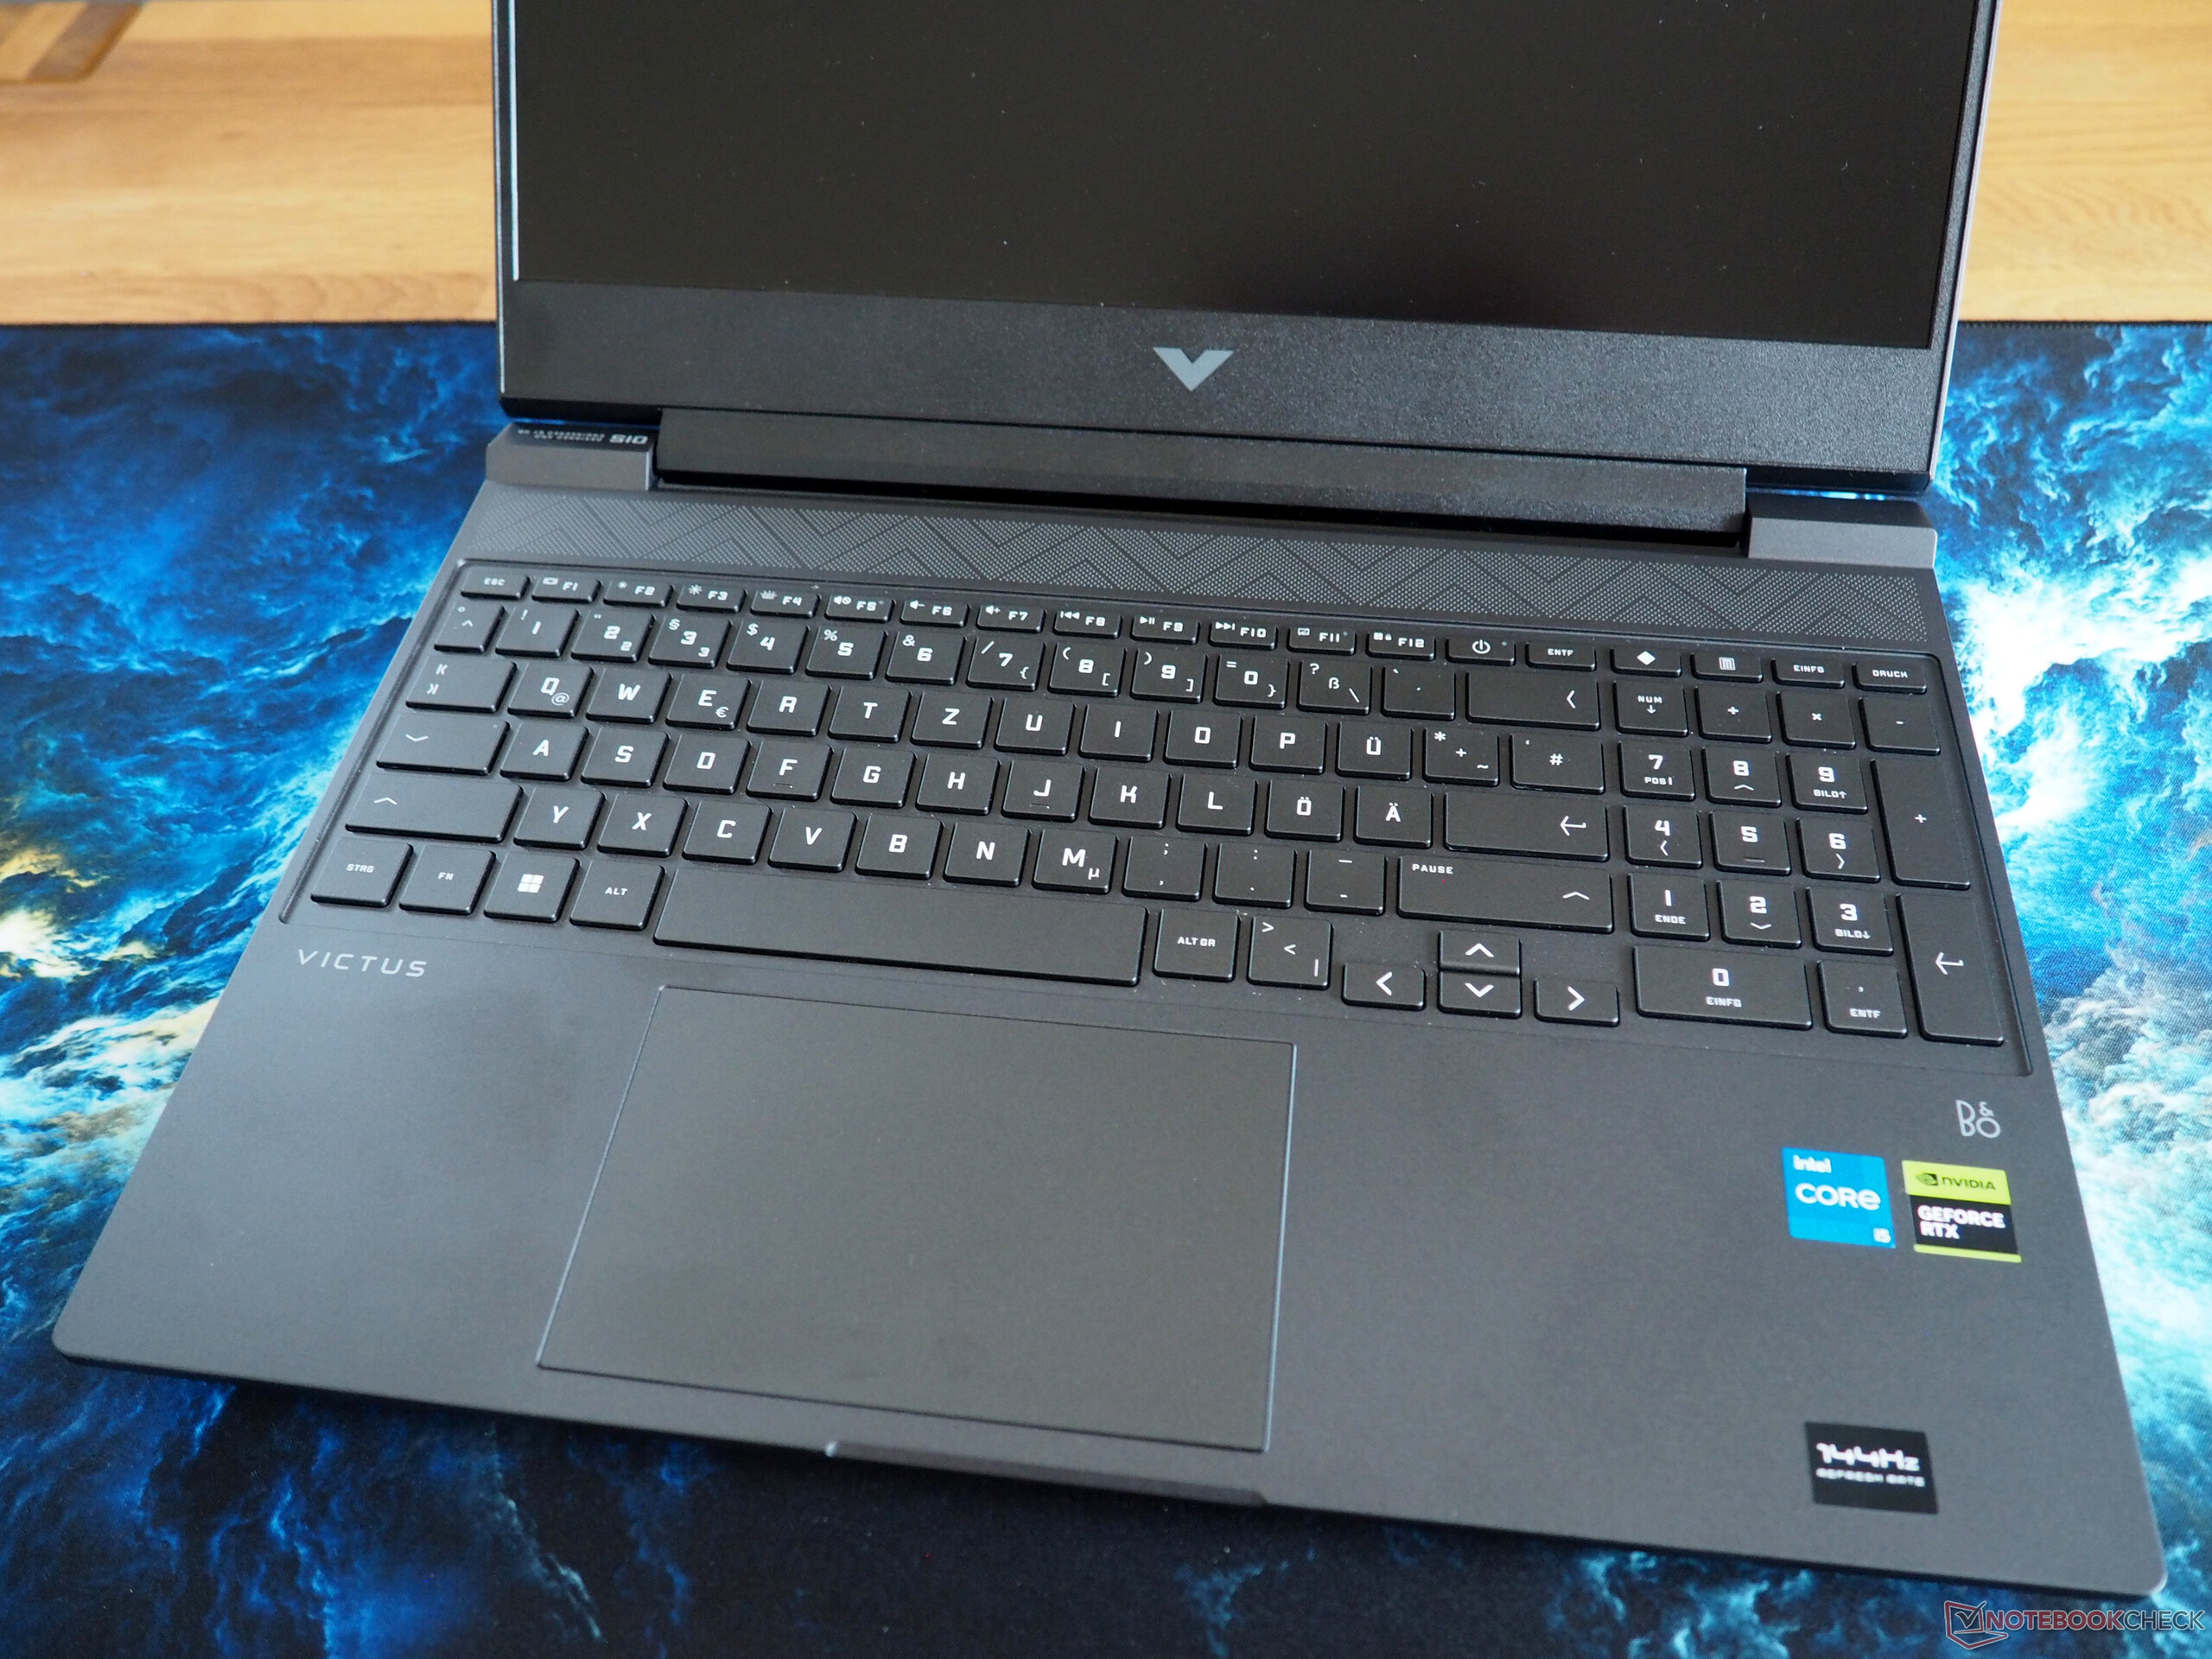
Dispositivos de entrada
Teclado
Em termos de teclado, o layout requer alguma adaptação. As setas direcionais compactas e a disposição não convencional da linha F (o botão liga/desliga não está na borda externa, Ins e Del não estão adjacentes etc.) também podem causar estranheza. No entanto, o teclado proporciona uma experiência de digitação satisfatória. A iluminação branca tem apenas duas configurações: ligada ou desligada, sem níveis de brilho ajustáveis.
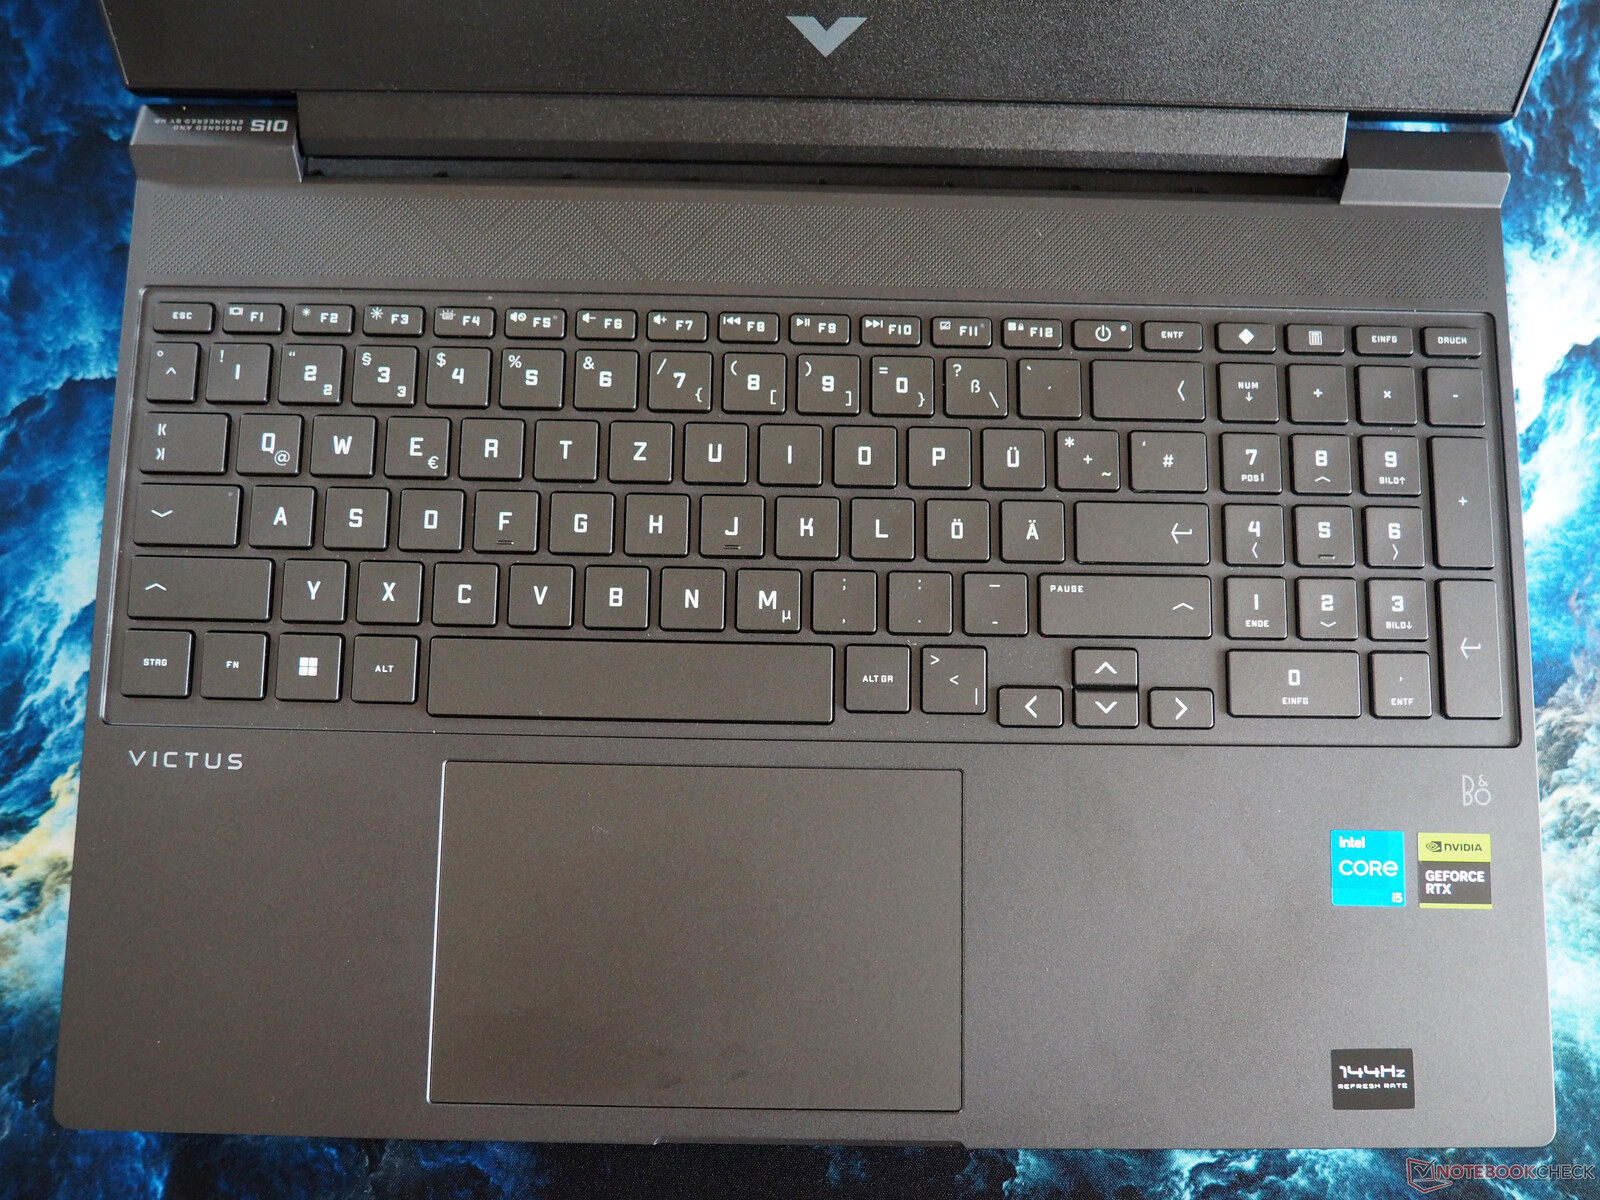
Touchpad
A qualidade do touchpad está alinhada com a da concorrência. As propriedades de deslizamento e a funcionalidade das superfícies de clique não são ruins nem excepcionalmente boas. Não houve problemas perceptíveis com o suporte a gestos. O tamanho é decente, com aproximadamente 4,92 x 3,15 polegadas.
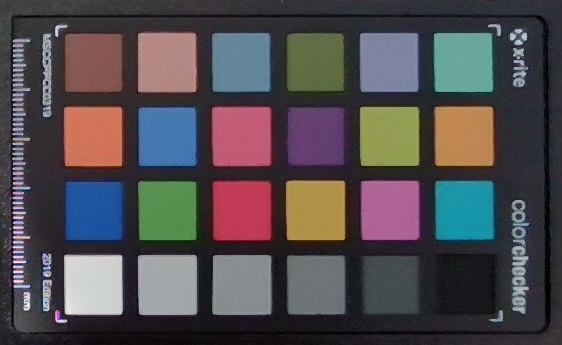
Tela
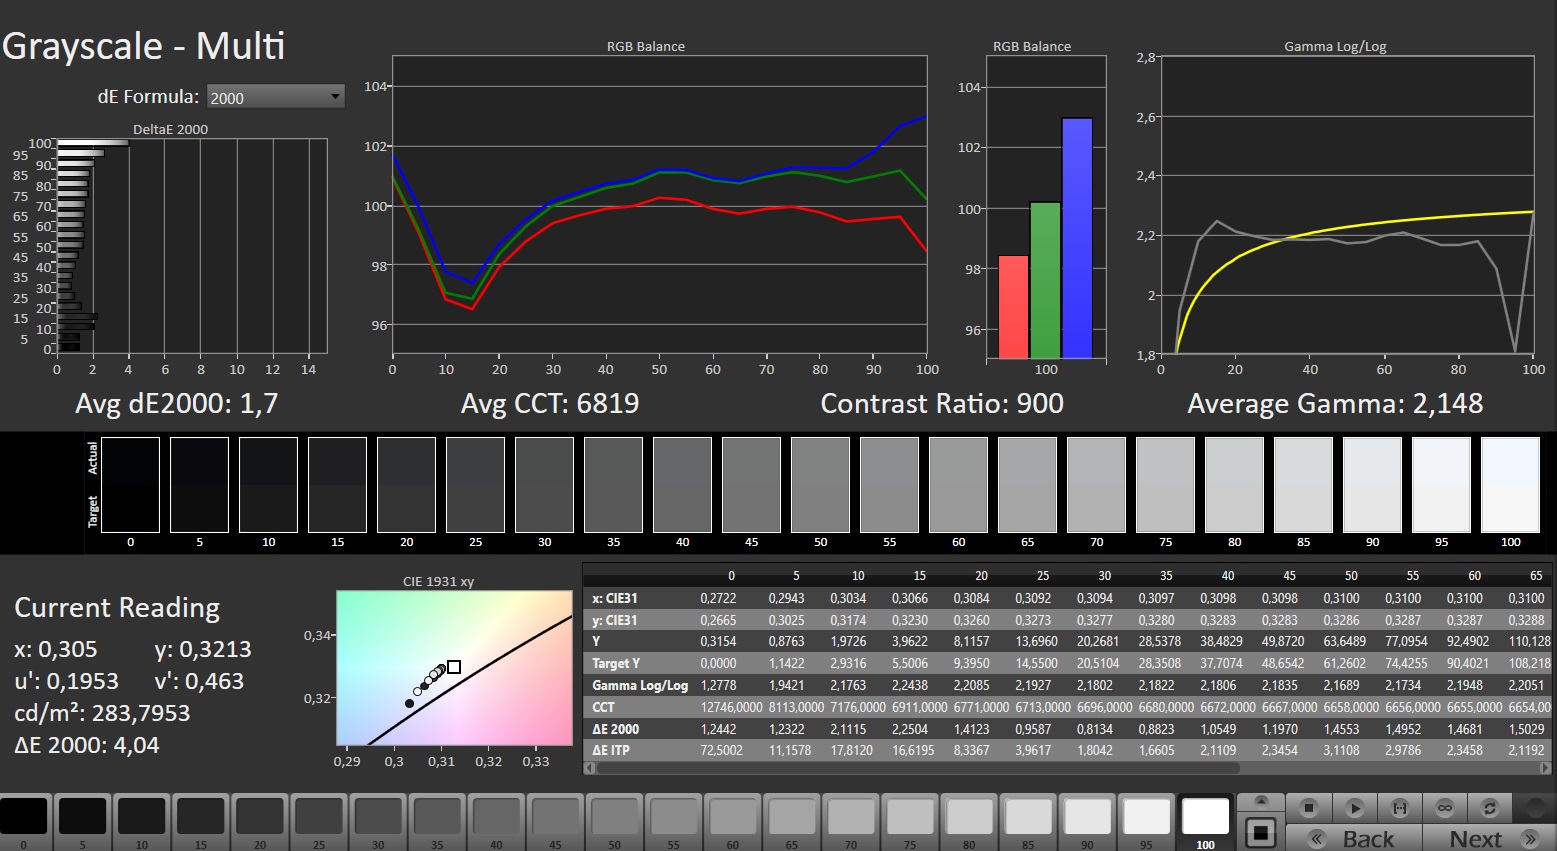
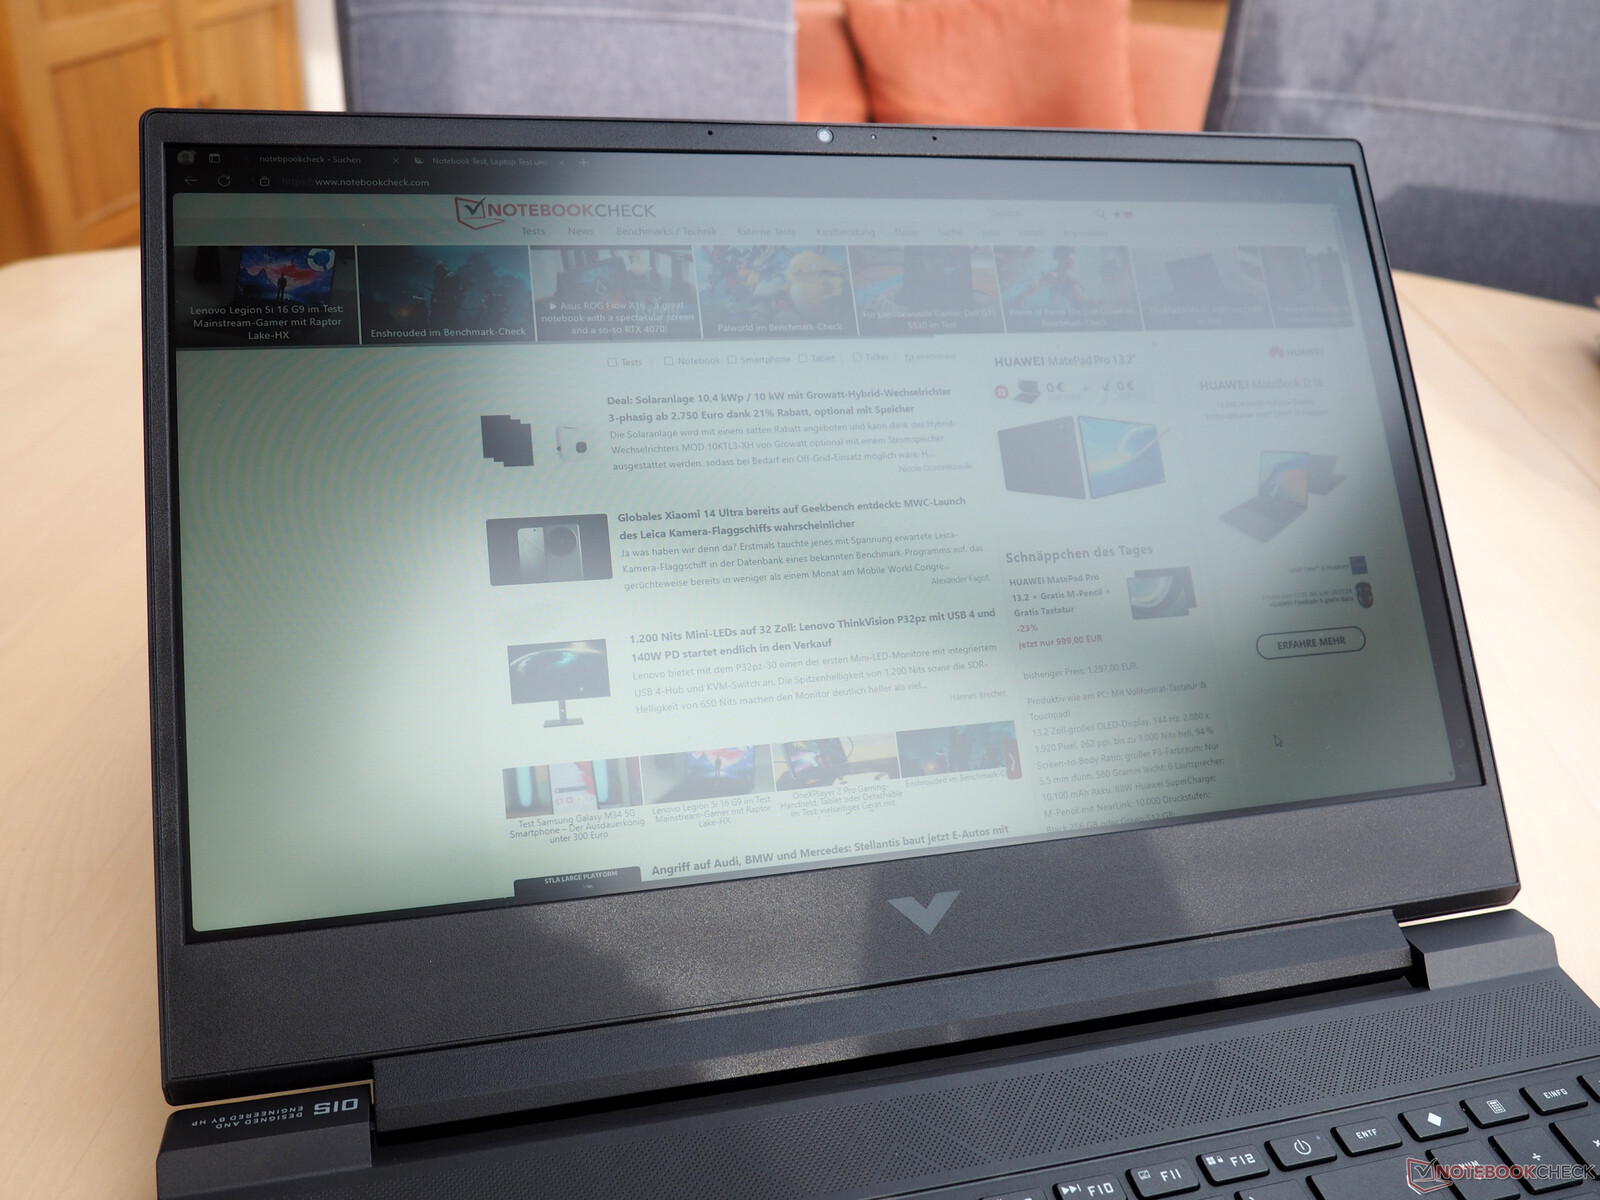
A tela de baixa qualidade prova ser a desvantagem mais significativa. Embora o nível de preto (0,28 cd/m²) e o contraste (975:1) ainda sejam decentes, a luminosidade deixa muito a desejar. Uma média de 249 cd/m² pode ser problemática mesmo em ambientes internos. O Victus 15 é totalmente inadequado para uso em ambientes externos.
| |||||||||||||||||||||||||
iluminação: 84 %
iluminação com acumulador: 273 cd/m²
Contraste: 975:1 (Preto: 0.28 cd/m²)
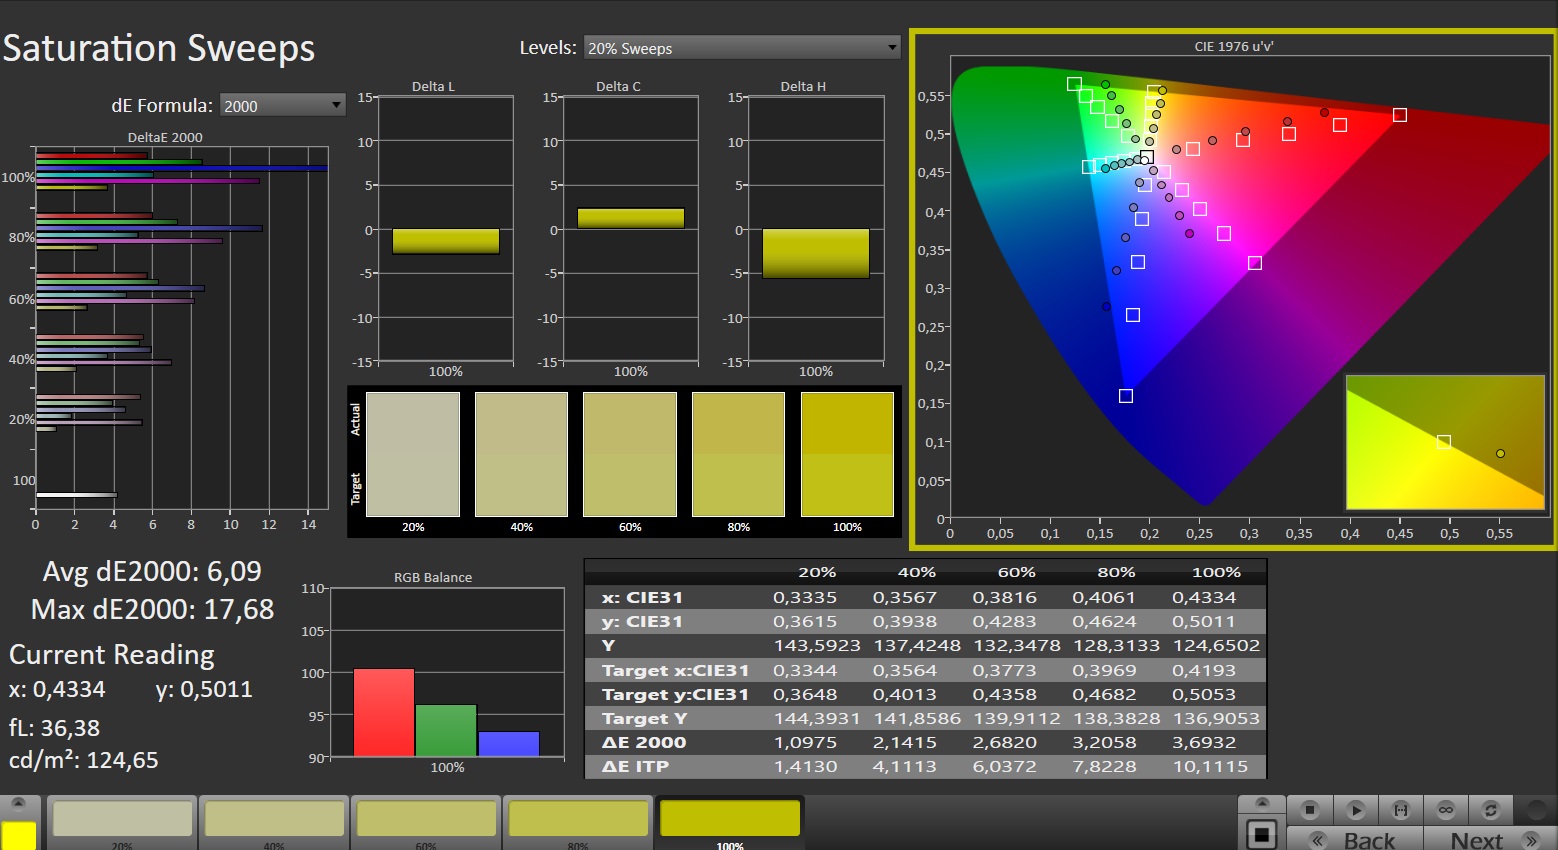
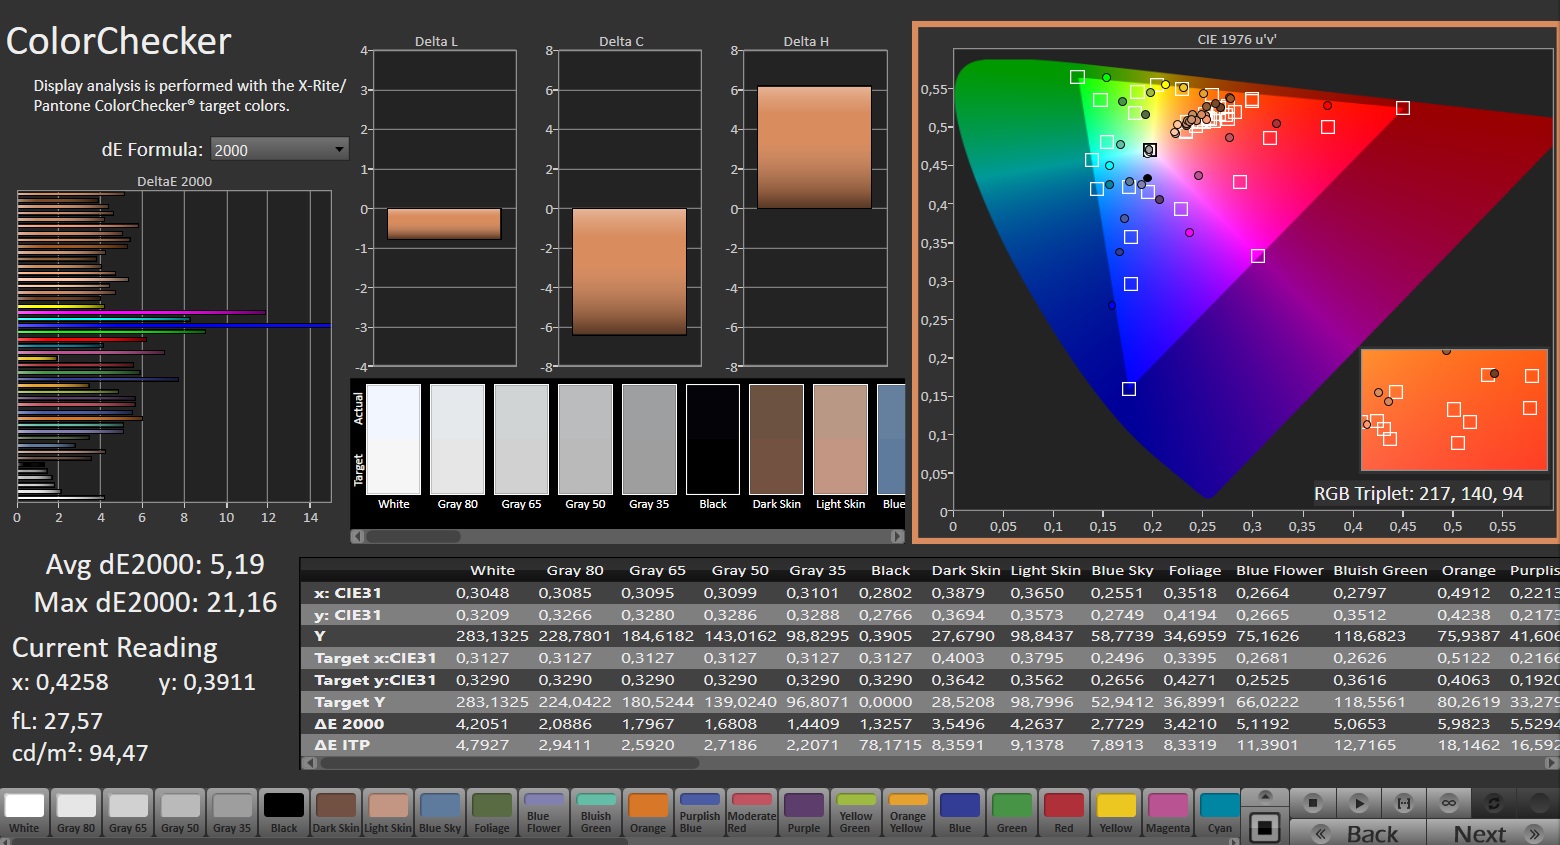
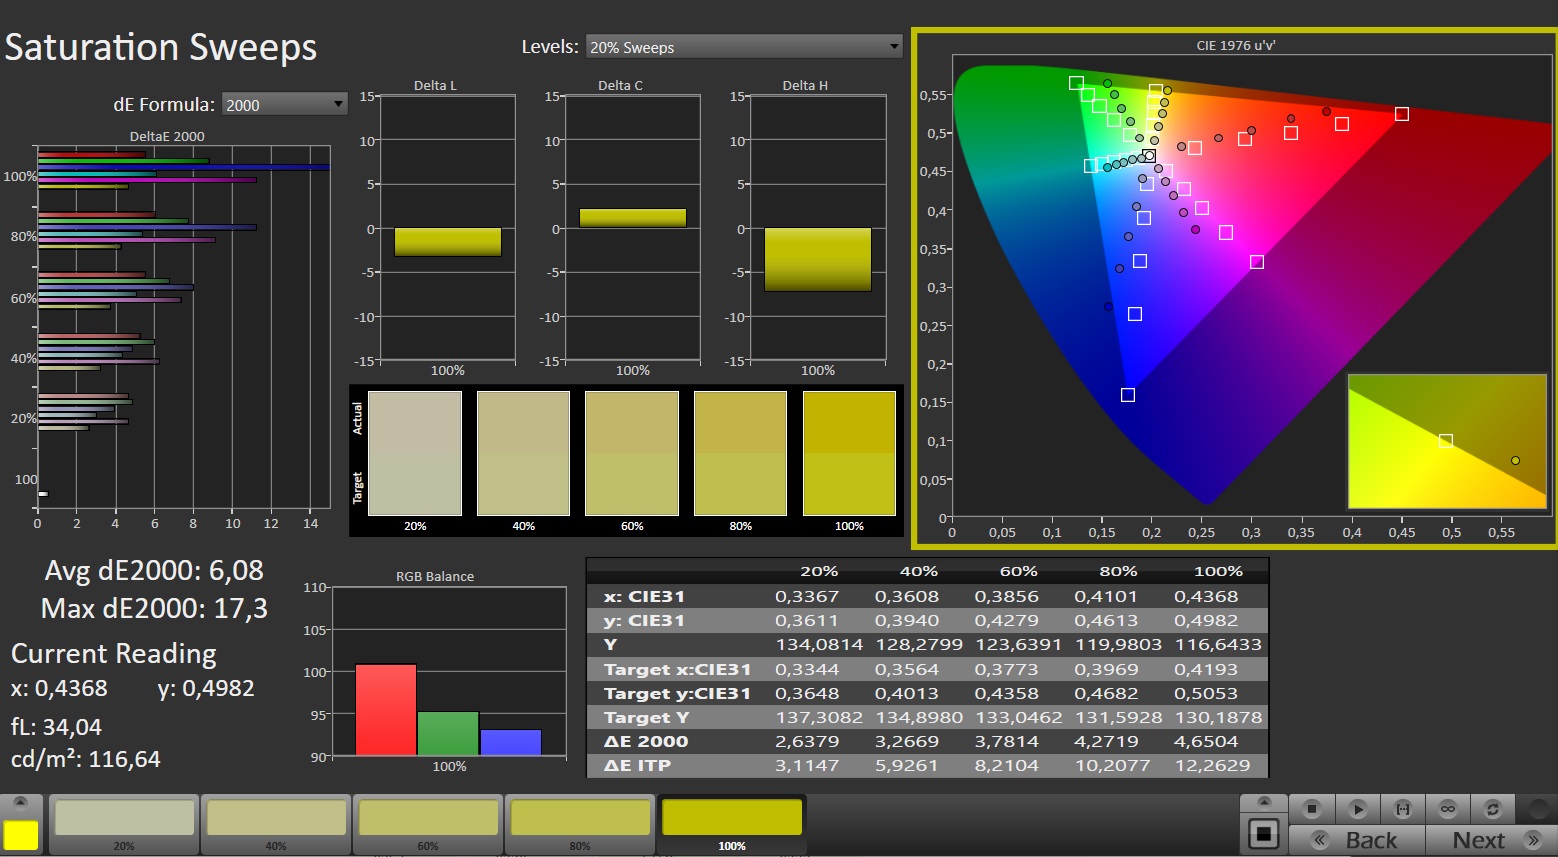
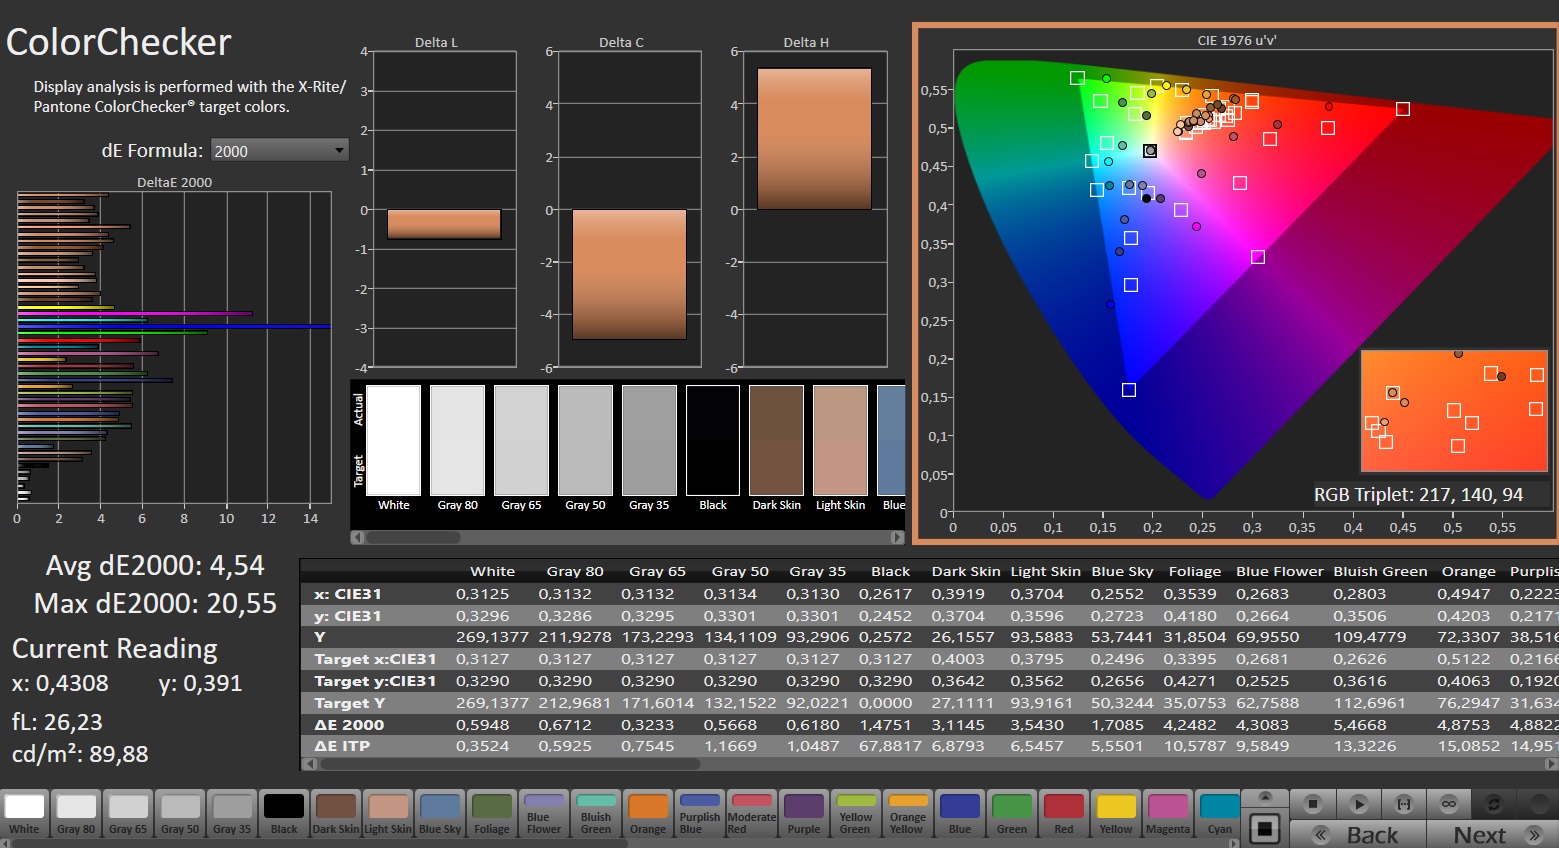
ΔE ColorChecker Calman: 5.19 | ∀{0.5-29.43 Ø4.73}
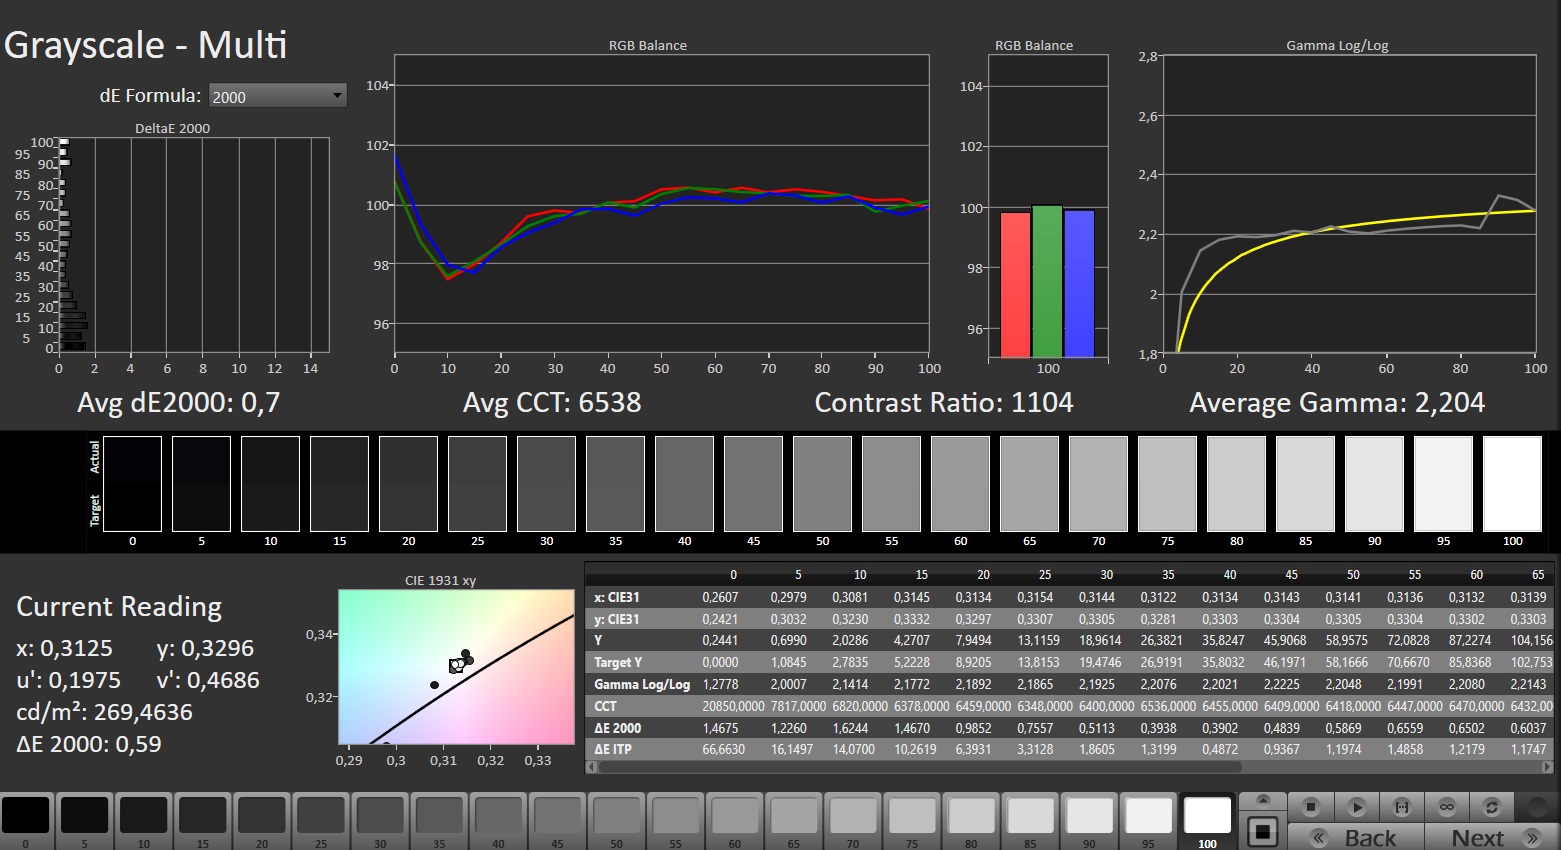
calibrated: 4.54
ΔE Greyscale Calman: 1.7 | ∀{0.09-98 Ø4.97}
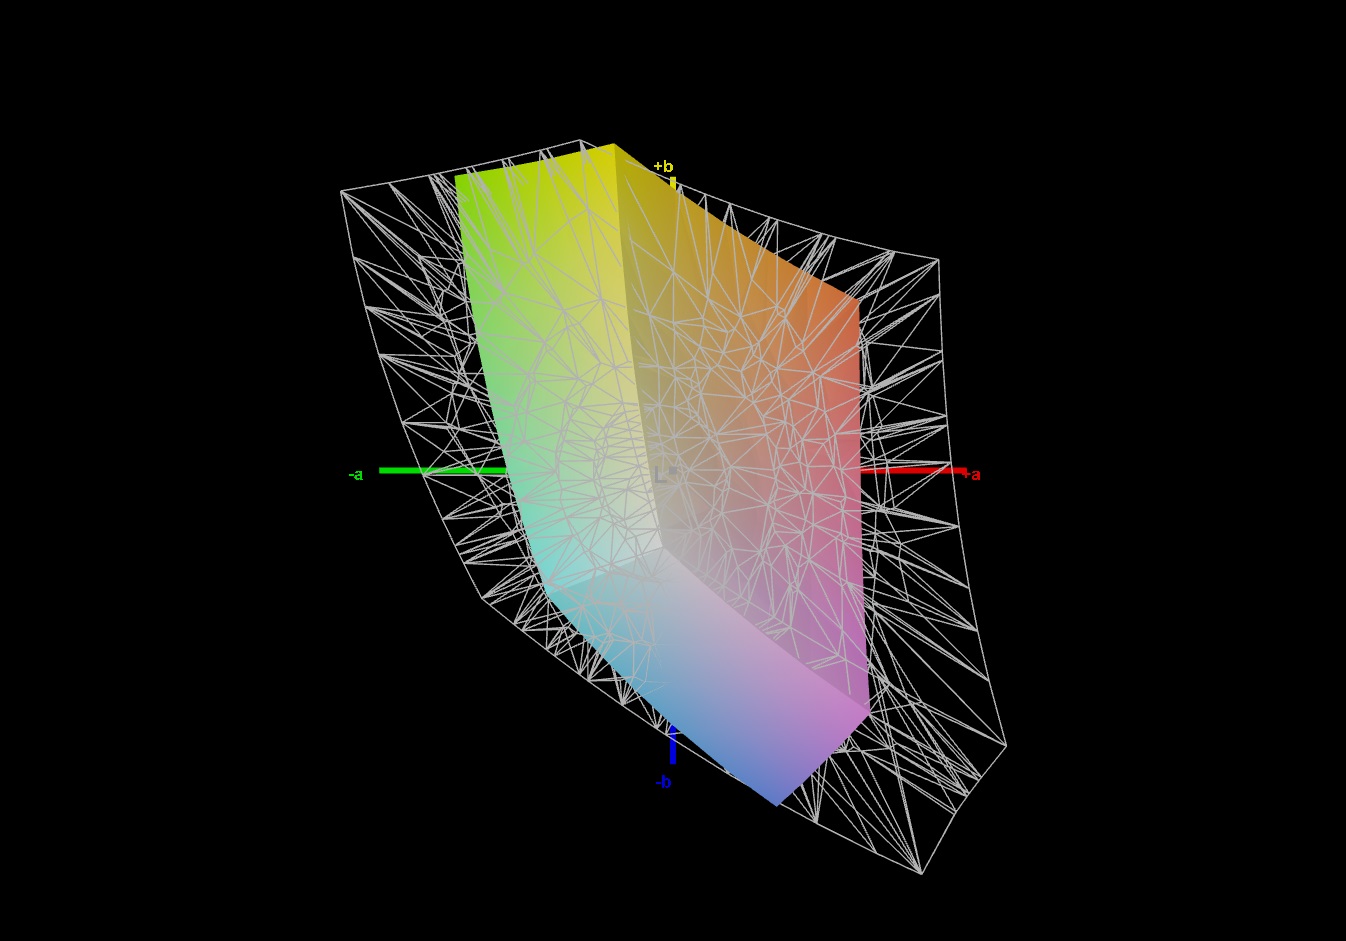
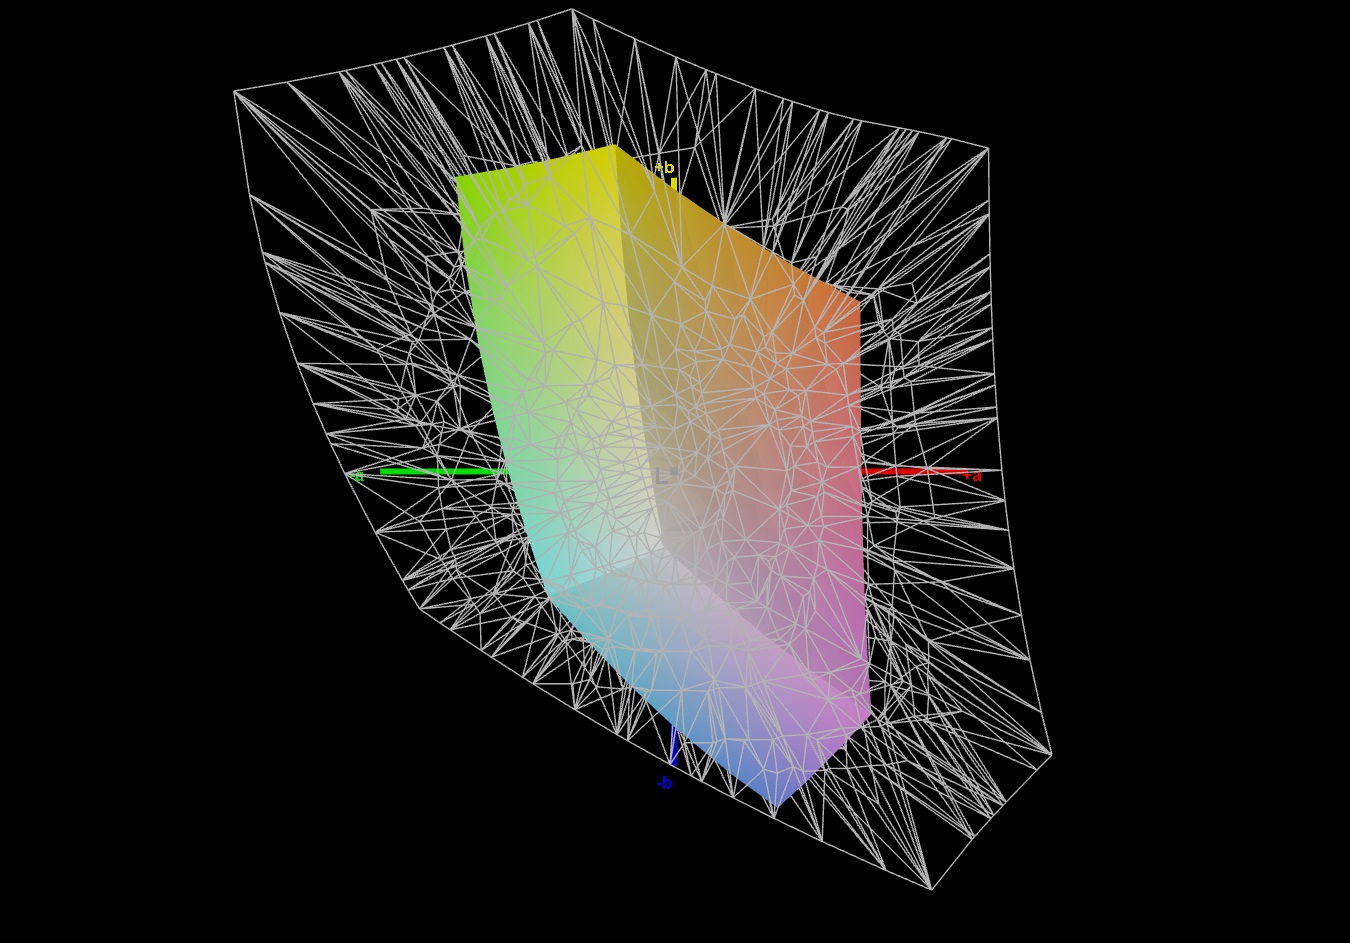
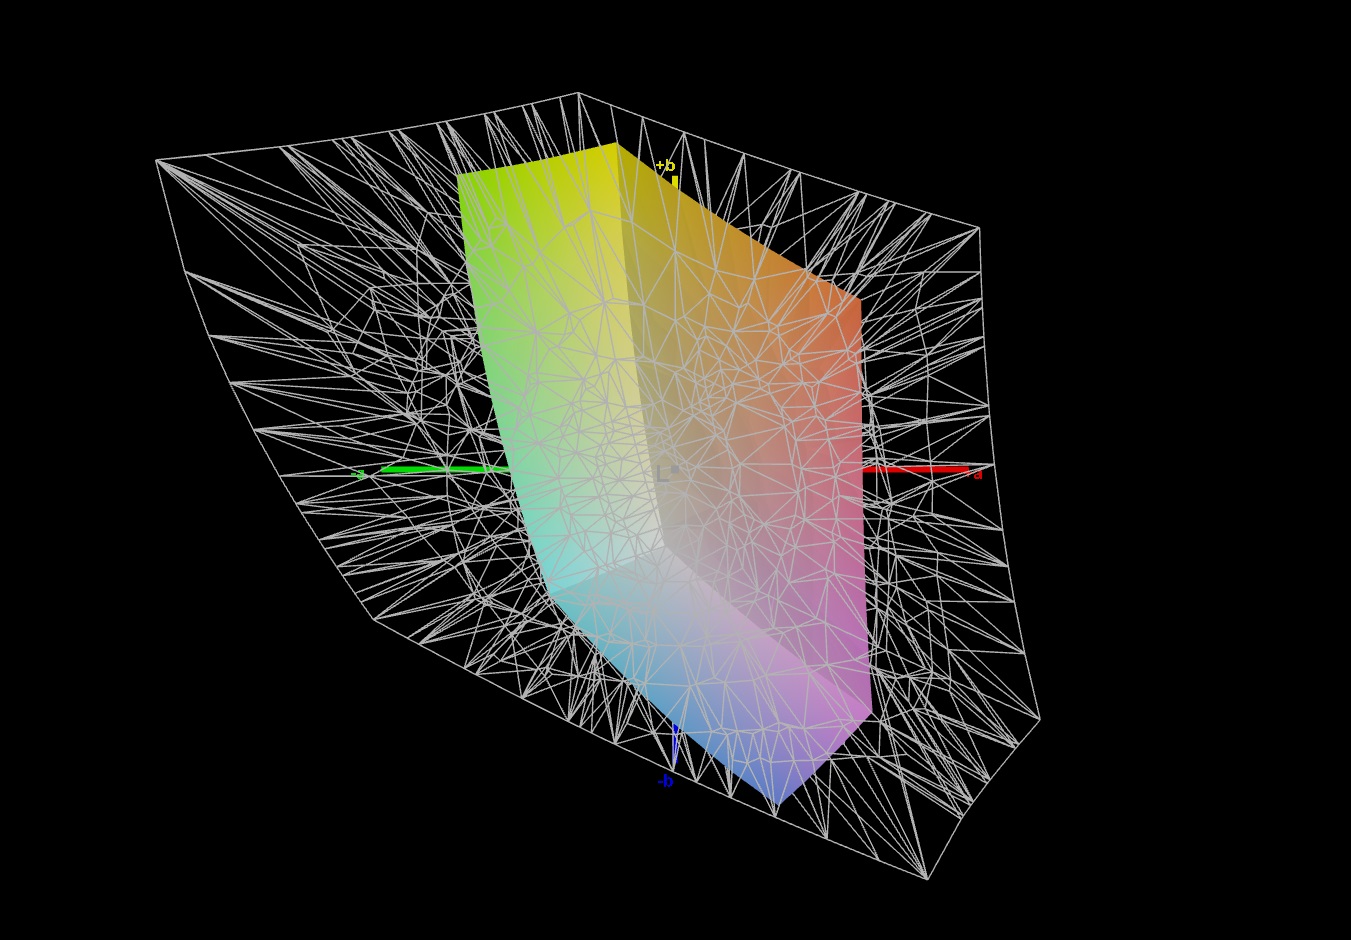
40.5% AdobeRGB 1998 (Argyll 3D)
57.9% sRGB (Argyll 3D)
39.2% Display P3 (Argyll 3D)
Gamma: 2.148
CCT: 6819 K
| HP Victus 15-fa1057ng BOE094D, IPS, 1920x1080, 15.6" | HP Victus 15 fa0020nr CMN1521, IPS, 1920x1080, 15.6" | Dell G15 5530, i5-13450HX RTX 4050 BOEhydis NV15NY9 (Dell 18PJX), IPS, 1920x1080, 15.6" | Acer Nitro V 15 ANV15-51-582S LG LP156WFJ-SPB4 (LGD0742), IPS, 1920x1080, 15.6" | Asus TUF A15 FA507 N156HMA-GA1, IPS, 1920x1080, 15.6" | |
|---|---|---|---|---|---|
| Display | 7% | 76% | 3% | 66% | |
| Display P3 Coverage (%) | 39.2 | 42 7% | 71.1 81% | 40 2% | 64.9 66% |
| sRGB Coverage (%) | 57.9 | 62.7 8% | 99.3 72% | 60 4% | 96.5 67% |
| AdobeRGB 1998 Coverage (%) | 40.5 | 43.4 7% | 71.4 76% | 41.4 2% | 66.6 64% |
| Response Times | -58% | 62% | -51% | -28% | |
| Response Time Grey 50% / Grey 80% * (ms) | 23.8 ? | 35.2 ? -48% | 8.5 ? 64% | 34.2 ? -44% | 30.4 ? -28% |
| Response Time Black / White * (ms) | 16.3 ? | 27.2 ? -67% | 6.7 ? 59% | 25.8 ? -58% | 20.8 ? -28% |
| PWM Frequency (Hz) | |||||
| Screen | 8% | 13% | -17% | 34% | |
| Brightness middle (cd/m²) | 273 | 284.3 4% | 389 42% | 292 7% | 288 5% |
| Brightness (cd/m²) | 249 | 262 5% | 374 50% | 263 6% | 271 9% |
| Brightness Distribution (%) | 84 | 87 4% | 89 6% | 80 -5% | 91 8% |
| Black Level * (cd/m²) | 0.28 | 0.17 39% | 0.35 -25% | 0.25 11% | 0.17 39% |
| Contrast (:1) | 975 | 1672 71% | 1111 14% | 1168 20% | 1694 74% |
| Colorchecker dE 2000 * | 5.19 | 4.52 13% | 3.08 41% | 7.15 -38% | 1.9 63% |
| Colorchecker dE 2000 max. * | 21.16 | 18.67 12% | 5.44 74% | 15.51 27% | 3.3 84% |
| Colorchecker dE 2000 calibrated * | 4.54 | 1.55 66% | 1.17 74% | 4.13 9% | 0.9 80% |
| Greyscale dE 2000 * | 1.7 | 4.1 -141% | 4.4 -159% | 4.9 -188% | 2.7 -59% |
| Gamma | 2.148 102% | 2.3 96% | 2.409 91% | 2.014 109% | 2.32 95% |
| CCT | 6819 95% | 6529 100% | 6350 102% | 7178 91% | 6535 99% |
| Média Total (Programa/Configurações) | -14% /
-1% | 50% /
34% | -22% /
-18% | 24% /
32% |
* ... menor é melhor
O dispositivo de 15 polegadas enfrenta críticas substanciais com relação ao espaço de cores. Com 58% de sRGB, o resultado é uma imagem sem brilho, limitando o apelo visual de filmes, fotos e jogos. Alguns concorrentes, como o Dell G15 ou o Asus TUF A15, têm um desempenho significativamente melhor nesse aspecto.
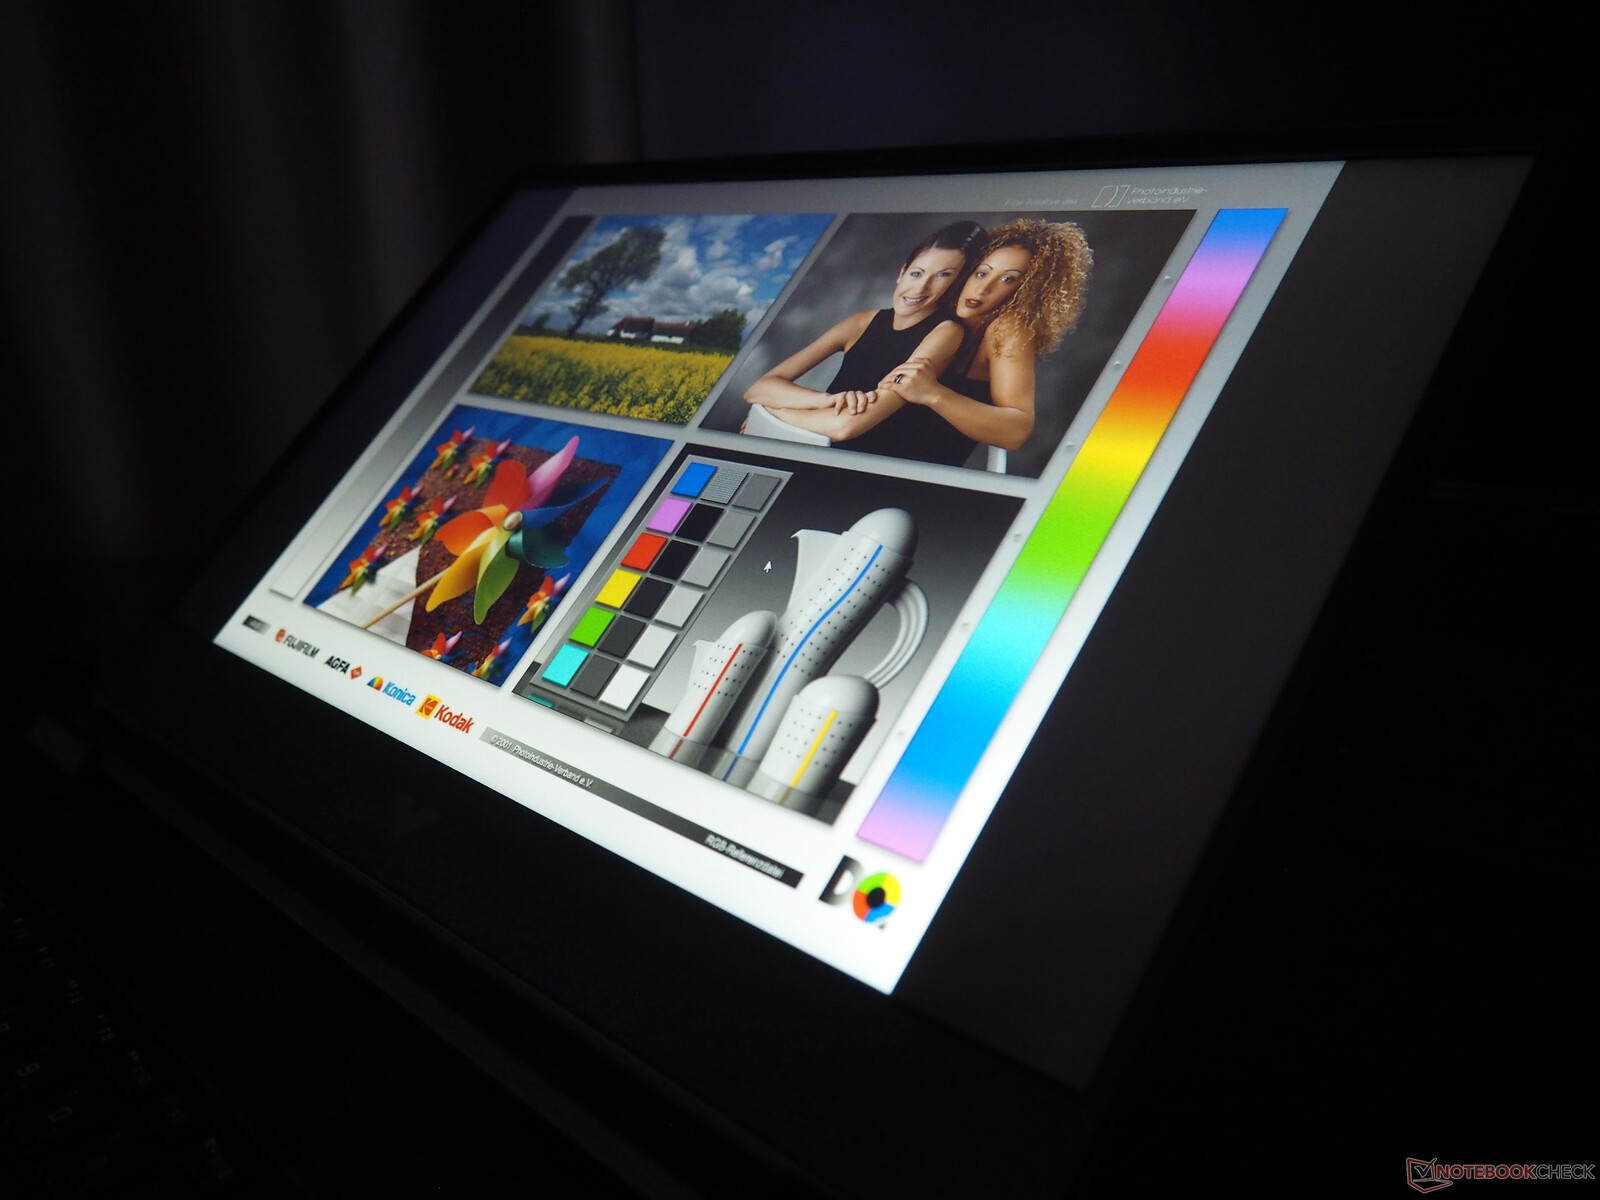
Enquanto isso, a estabilidade do ângulo de visão e o tempo de resposta estão de acordo com o padrão IPS típico.
Exibir tempos de resposta
| ↔ Tempo de resposta preto para branco | ||
|---|---|---|
| 16.3 ms ... ascensão ↗ e queda ↘ combinadas | ↗ 7.6 ms ascensão | 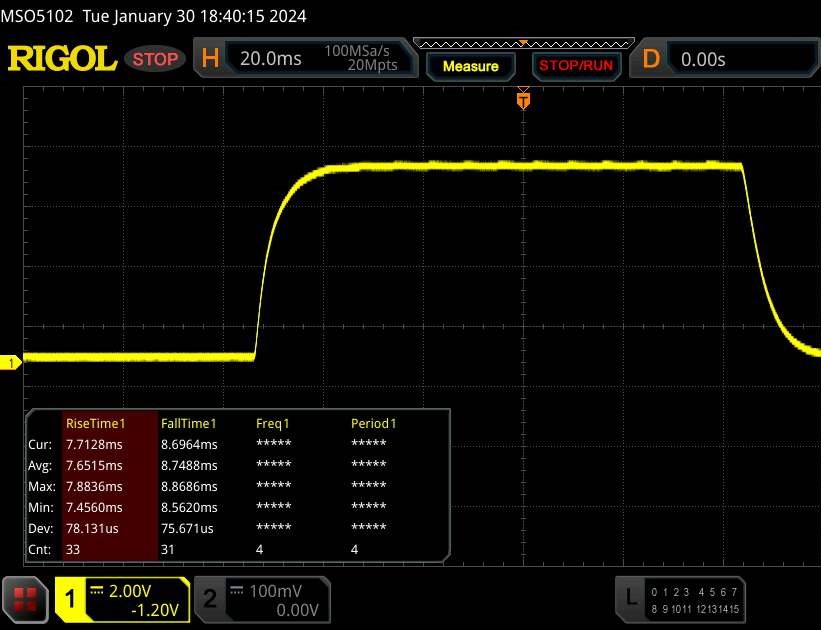 |
| ↘ 8.7 ms queda | ||
| A tela mostra boas taxas de resposta em nossos testes, mas pode ser muito lenta para jogadores competitivos. Em comparação, todos os dispositivos testados variam de 0.1 (mínimo) a 240 (máximo) ms. » 38 % de todos os dispositivos são melhores. Isso significa que o tempo de resposta medido é melhor que a média de todos os dispositivos testados (19.9 ms). | ||
| ↔ Tempo de resposta 50% cinza a 80% cinza | ||
| 23.8 ms ... ascensão ↗ e queda ↘ combinadas | ↗ 11.1 ms ascensão | 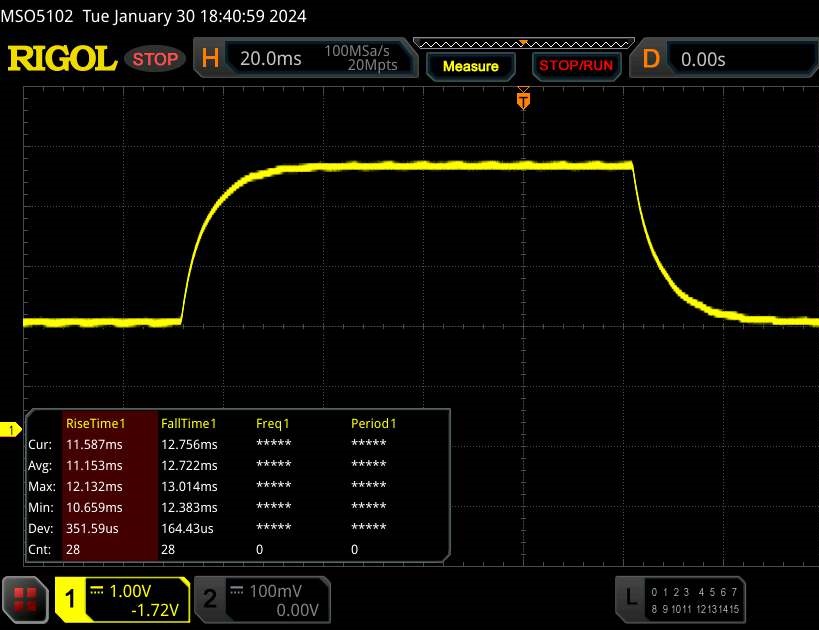 |
| ↘ 12.7 ms queda | ||
| A tela mostra boas taxas de resposta em nossos testes, mas pode ser muito lenta para jogadores competitivos. Em comparação, todos os dispositivos testados variam de 0.165 (mínimo) a 636 (máximo) ms. » 34 % de todos os dispositivos são melhores. Isso significa que o tempo de resposta medido é melhor que a média de todos os dispositivos testados (31.1 ms). | ||
Cintilação da tela / PWM (modulação por largura de pulso)
| Tela tremeluzindo / PWM não detectado | 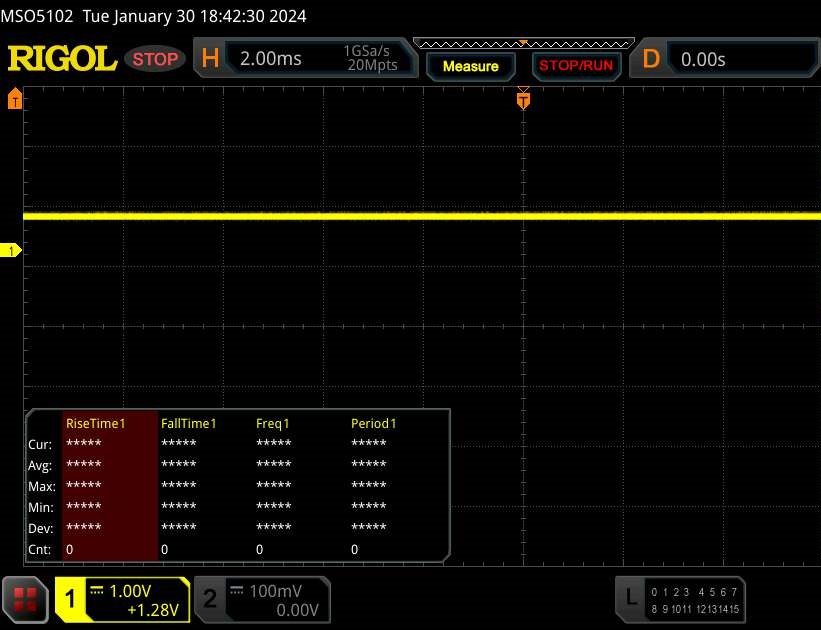 | ||
[pwm_comparison] Em comparação: 52 % de todos os dispositivos testados não usam PWM para escurecer a tela. Se PWM foi detectado, uma média de 7801 (mínimo: 5 - máximo: 343500) Hz foi medida. | |||
Desempenho
Nessa configuração, o Victus 15 é claramente um notebook de médio porte. Embora 16 GB de RAM sejam suficientes para jogos, o único SSD de 512 GB pode rapidamente ficar apertado, especialmente porque o modelo de 15 polegadas não oferece um segundo slot M.2.
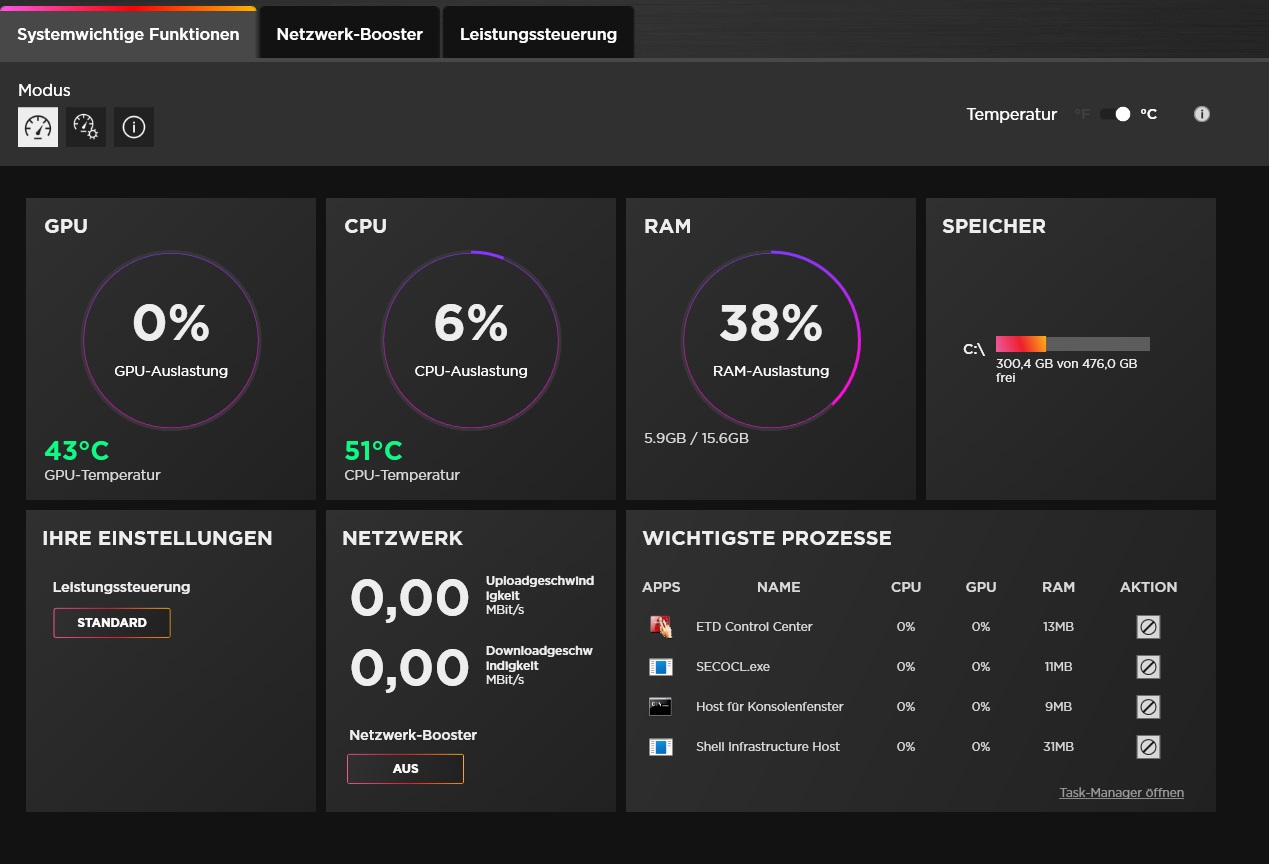
Condições de teste
O Omen Gaming Hub permite que os usuários influenciem o comportamento do sistema. Os vários modos de controle de energia afetam não apenas o volume, mas também o desempenho (consulte a tabela). Nossos testes foram todos realizados no modo "Standard", pois o ganho na taxa de quadros em "Performance" é, como costuma acontecer, desproporcional ao aumento do ruído. É interessante notar que o modo "Quiet" (Silencioso) resultou consistentemente em emissões de ruído mais altas do que o modo "Standard" (Padrão) no dispositivo de teste, apesar dos números mais baixos de FPS.
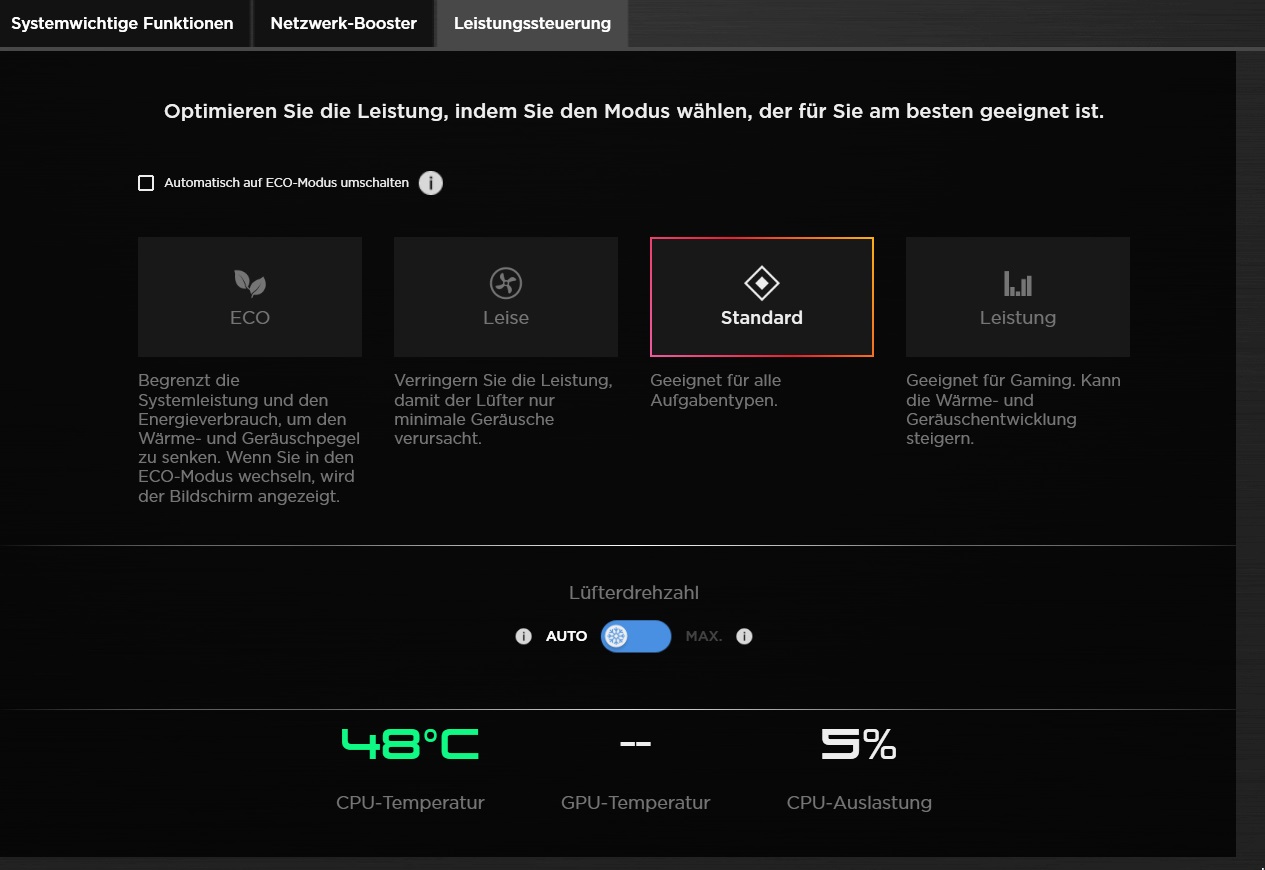
| Witcher 3 (FHD/Ultra) | Eco | Silencioso | Padrão | Desempenho |
| Ruído | 36 dB(A) | 46 dB(A) | 42 dB(A) | 48 dB(A) |
| Desempenho | 60 fps lock | 54 fps | 78 fps | 80 fps |
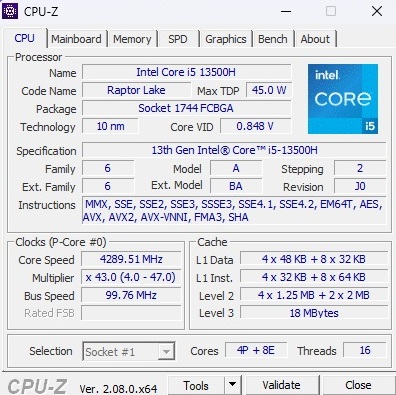
Processador
O Core i5-13500H faz parte da geração Raptor Lake da Intel, com quatro núcleos de desempenho com Hyper-Threading e oito núcleos de eficiência sem HT. Sua velocidade nos resultados de benchmark está entre o Core i5-13420H do Acer Nitro V 15 e o Core i5-13420H do Acer Nitro V 15 e o Core i5-13420H do Dell G15 Core i5-13450HX do Dell G15. O Ryzen 7 7735HS está mais ou menos no mesmo nível inicialmente, mas o Core i5 perde mais pontos e apresenta um desempenho menos consistente no teste de loop. A comparação com o antecessor é um pouco injusta, já que o Core i7 do antigo Victus pertence mais à faixa de alta qualidade.
Cinebench R15 Multi continuous test
| CPU Performance rating - Percent | |
| Média da turma Gaming | |
| Dell G15 5530, i5-13450HX RTX 4050 | |
| Média Intel Core i5-13500H | |
| HP Victus 15 fa0020nr -2! | |
| Asus TUF A15 FA507 -2! | |
| Acer Nitro V 15 ANV15-51-582S | |
| HP Victus 15-fa1057ng -4! | |
* ... menor é melhor
AIDA64: FP32 Ray-Trace | FPU Julia | CPU SHA3 | CPU Queen | FPU SinJulia | FPU Mandel | CPU AES | CPU ZLib | FP64 Ray-Trace | CPU PhotoWorxx
| Performance rating | |
| Média da turma Gaming | |
| Asus TUF A15 FA507 | |
| Dell G15 5530, i5-13450HX RTX 4050 | |
| Média Intel Core i5-13500H | |
| HP Victus 15 fa0020nr | |
| HP Victus 15-fa1057ng | |
| Acer Nitro V 15 ANV15-51-582S | |
| AIDA64 / FP32 Ray-Trace | |
| Média da turma Gaming (10227 - 85542, n=110, últimos 2 anos) | |
| Dell G15 5530, i5-13450HX RTX 4050 | |
| Asus TUF A15 FA507 | |
| Média Intel Core i5-13500H (11081 - 15390, n=6) | |
| HP Victus 15 fa0020nr | |
| HP Victus 15-fa1057ng | |
| Acer Nitro V 15 ANV15-51-582S | |
| AIDA64 / FPU Julia | |
| Média da turma Gaming (51376 - 238426, n=110, últimos 2 anos) | |
| Asus TUF A15 FA507 | |
| Dell G15 5530, i5-13450HX RTX 4050 | |
| Média Intel Core i5-13500H (56813 - 74251, n=6) | |
| HP Victus 15 fa0020nr | |
| Acer Nitro V 15 ANV15-51-582S | |
| HP Victus 15-fa1057ng | |
| AIDA64 / CPU SHA3 | |
| Média da turma Gaming (2180 - 9817, n=110, últimos 2 anos) | |
| Dell G15 5530, i5-13450HX RTX 4050 | |
| Asus TUF A15 FA507 | |
| Média Intel Core i5-13500H (2621 - 3623, n=6) | |
| HP Victus 15 fa0020nr | |
| Acer Nitro V 15 ANV15-51-582S | |
| HP Victus 15-fa1057ng | |
| AIDA64 / CPU Queen | |
| Média da turma Gaming (49785 - 173351, n=101, últimos 2 anos) | |
| Asus TUF A15 FA507 | |
| HP Victus 15 fa0020nr | |
| Dell G15 5530, i5-13450HX RTX 4050 | |
| Média Intel Core i5-13500H (77835 - 85727, n=6) | |
| HP Victus 15-fa1057ng | |
| Acer Nitro V 15 ANV15-51-582S | |
| AIDA64 / FPU SinJulia | |
| Média da turma Gaming (4424 - 33636, n=110, últimos 2 anos) | |
| Asus TUF A15 FA507 | |
| Dell G15 5530, i5-13450HX RTX 4050 | |
| HP Victus 15 fa0020nr | |
| Média Intel Core i5-13500H (7249 - 8086, n=6) | |
| HP Victus 15-fa1057ng | |
| Acer Nitro V 15 ANV15-51-582S | |
| AIDA64 / FPU Mandel | |
| Média da turma Gaming (25115 - 128721, n=110, últimos 2 anos) | |
| Asus TUF A15 FA507 | |
| Dell G15 5530, i5-13450HX RTX 4050 | |
| Média Intel Core i5-13500H (27820 - 38336, n=6) | |
| HP Victus 15 fa0020nr | |
| HP Victus 15-fa1057ng | |
| Acer Nitro V 15 ANV15-51-582S | |
| AIDA64 / CPU AES | |
| Média da turma Gaming (39258 - 247074, n=110, últimos 2 anos) | |
| Acer Nitro V 15 ANV15-51-582S | |
| Média Intel Core i5-13500H (62657 - 120493, n=6) | |
| Dell G15 5530, i5-13450HX RTX 4050 | |
| Asus TUF A15 FA507 | |
| HP Victus 15-fa1057ng | |
| HP Victus 15 fa0020nr | |
| AIDA64 / CPU ZLib | |
| Média da turma Gaming (574 - 2531, n=110, últimos 2 anos) | |
| Dell G15 5530, i5-13450HX RTX 4050 | |
| HP Victus 15-fa1057ng | |
| Média Intel Core i5-13500H (782 - 992, n=6) | |
| HP Victus 15 fa0020nr | |
| Acer Nitro V 15 ANV15-51-582S | |
| Asus TUF A15 FA507 | |
| AIDA64 / FP64 Ray-Trace | |
| Média da turma Gaming (5509 - 45446, n=110, últimos 2 anos) | |
| Dell G15 5530, i5-13450HX RTX 4050 | |
| Asus TUF A15 FA507 | |
| Média Intel Core i5-13500H (5955 - 8495, n=6) | |
| HP Victus 15 fa0020nr | |
| HP Victus 15-fa1057ng | |
| Acer Nitro V 15 ANV15-51-582S | |
| AIDA64 / CPU PhotoWorxx | |
| Média da turma Gaming (12271 - 89891, n=110, últimos 2 anos) | |
| Dell G15 5530, i5-13450HX RTX 4050 | |
| Média Intel Core i5-13500H (20212 - 37618, n=6) | |
| Asus TUF A15 FA507 | |
| HP Victus 15-fa1057ng | |
| Acer Nitro V 15 ANV15-51-582S | |
| HP Victus 15 fa0020nr | |
Desempenho do sistema
Quando se trata do desempenho do sistema, os concorrentes não têm quase nada em comum. A pontuação geral do PCMark 10 é muito semelhante em todos os casos, com diferenças mais perceptíveis na velocidade da RAM.
CrossMark: Overall | Productivity | Creativity | Responsiveness
WebXPRT 3: Overall
WebXPRT 4: Overall
Mozilla Kraken 1.1: Total
| PCMark 10 / Score | |
| Média da turma Gaming (5828 - 11574, n=96, últimos 2 anos) | |
| Asus TUF A15 FA507 | |
| Média Intel Core i5-13500H, NVIDIA GeForce RTX 4050 Laptop GPU (6812 - 7228, n=2) | |
| Dell G15 5530, i5-13450HX RTX 4050 | |
| HP Victus 15 fa0020nr | |
| HP Victus 15-fa1057ng | |
| Acer Nitro V 15 ANV15-51-582S | |
| PCMark 10 / Essentials | |
| Média da turma Gaming (8810 - 12600, n=100, últimos 2 anos) | |
| Asus TUF A15 FA507 | |
| HP Victus 15 fa0020nr | |
| Média Intel Core i5-13500H, NVIDIA GeForce RTX 4050 Laptop GPU (9521 - 10019, n=2) | |
| Dell G15 5530, i5-13450HX RTX 4050 | |
| HP Victus 15-fa1057ng | |
| Acer Nitro V 15 ANV15-51-582S | |
| PCMark 10 / Productivity | |
| Média da turma Gaming (6845 - 18766, n=98, últimos 2 anos) | |
| Asus TUF A15 FA507 | |
| HP Victus 15 fa0020nr | |
| Média Intel Core i5-13500H, NVIDIA GeForce RTX 4050 Laptop GPU (8890 - 8968, n=2) | |
| HP Victus 15-fa1057ng | |
| Dell G15 5530, i5-13450HX RTX 4050 | |
| Acer Nitro V 15 ANV15-51-582S | |
| PCMark 10 / Digital Content Creation | |
| Média da turma Gaming (7602 - 19657, n=98, últimos 2 anos) | |
| Média Intel Core i5-13500H, NVIDIA GeForce RTX 4050 Laptop GPU (10134 - 11405, n=2) | |
| Dell G15 5530, i5-13450HX RTX 4050 | |
| Asus TUF A15 FA507 | |
| HP Victus 15-fa1057ng | |
| HP Victus 15 fa0020nr | |
| Acer Nitro V 15 ANV15-51-582S | |
| CrossMark / Overall | |
| Média da turma Gaming (1366 - 2409, n=98, últimos 2 anos) | |
| Média Intel Core i5-13500H, NVIDIA GeForce RTX 4050 Laptop GPU (n=1) | |
| HP Victus 15 fa0020nr | |
| Asus TUF A15 FA507 | |
| CrossMark / Productivity | |
| Média da turma Gaming (1386 - 2254, n=98, últimos 2 anos) | |
| Média Intel Core i5-13500H, NVIDIA GeForce RTX 4050 Laptop GPU (n=1) | |
| HP Victus 15 fa0020nr | |
| Asus TUF A15 FA507 | |
| CrossMark / Creativity | |
| Média da turma Gaming (1343 - 2729, n=98, últimos 2 anos) | |
| Média Intel Core i5-13500H, NVIDIA GeForce RTX 4050 Laptop GPU (n=1) | |
| HP Victus 15 fa0020nr | |
| Asus TUF A15 FA507 | |
| CrossMark / Responsiveness | |
| Média Intel Core i5-13500H, NVIDIA GeForce RTX 4050 Laptop GPU (n=1) | |
| Média da turma Gaming (1226 - 2334, n=98, últimos 2 anos) | |
| HP Victus 15 fa0020nr | |
| Asus TUF A15 FA507 | |
| WebXPRT 3 / Overall | |
| Média da turma Gaming (242 - 532, n=101, últimos 2 anos) | |
| HP Victus 15 fa0020nr | |
| Asus TUF A15 FA507 | |
| Dell G15 5530, i5-13450HX RTX 4050 | |
| Dell G15 5530, i5-13450HX RTX 4050 | |
| HP Victus 15-fa1057ng | |
| Média Intel Core i5-13500H, NVIDIA GeForce RTX 4050 Laptop GPU (267 - 267, n=2) | |
| Acer Nitro V 15 ANV15-51-582S | |
| WebXPRT 4 / Overall | |
| Média da turma Gaming (176.4 - 354, n=101, últimos 2 anos) | |
| HP Victus 15 fa0020nr | |
| Acer Nitro V 15 ANV15-51-582S | |
| Média Intel Core i5-13500H, NVIDIA GeForce RTX 4050 Laptop GPU (n=1) | |
| Asus TUF A15 FA507 | |
| Mozilla Kraken 1.1 / Total | |
| Asus TUF A15 FA507 | |
| Acer Nitro V 15 ANV15-51-582S | |
| HP Victus 15-fa1057ng | |
| Média Intel Core i5-13500H, NVIDIA GeForce RTX 4050 Laptop GPU (530 - 545, n=2) | |
| HP Victus 15 fa0020nr | |
| Dell G15 5530, i5-13450HX RTX 4050 | |
| Dell G15 5530, i5-13450HX RTX 4050 | |
| Média da turma Gaming (391 - 590, n=106, últimos 2 anos) | |
* ... menor é melhor
| PCMark 10 Score | 6812 pontos | |
Ajuda | ||
| AIDA64 / Memory Copy | |
| Média da turma Gaming (21750 - 129946, n=110, últimos 2 anos) | |
| Dell G15 5530, i5-13450HX RTX 4050 | |
| Média Intel Core i5-13500H (36916 - 57830, n=6) | |
| Asus TUF A15 FA507 | |
| HP Victus 15-fa1057ng | |
| HP Victus 15 fa0020nr | |
| Acer Nitro V 15 ANV15-51-582S | |
| AIDA64 / Memory Read | |
| Média da turma Gaming (22956 - 118858, n=110, últimos 2 anos) | |
| Dell G15 5530, i5-13450HX RTX 4050 | |
| Média Intel Core i5-13500H (41676 - 65633, n=6) | |
| Asus TUF A15 FA507 | |
| HP Victus 15 fa0020nr | |
| HP Victus 15-fa1057ng | |
| Acer Nitro V 15 ANV15-51-582S | |
| AIDA64 / Memory Write | |
| Média da turma Gaming (22297 - 135096, n=110, últimos 2 anos) | |
| Dell G15 5530, i5-13450HX RTX 4050 | |
| Asus TUF A15 FA507 | |
| Média Intel Core i5-13500H (36826 - 60523, n=6) | |
| HP Victus 15-fa1057ng | |
| HP Victus 15 fa0020nr | |
| Acer Nitro V 15 ANV15-51-582S | |
| AIDA64 / Memory Latency | |
| Média da turma Gaming (75.3 - 259, n=110, últimos 2 anos) | |
| Dell G15 5530, i5-13450HX RTX 4050 | |
| Média Intel Core i5-13500H (86.2 - 96.1, n=6) | |
| Acer Nitro V 15 ANV15-51-582S | |
| HP Victus 15-fa1057ng | |
| Asus TUF A15 FA507 | |
| HP Victus 15 fa0020nr | |
* ... menor é melhor
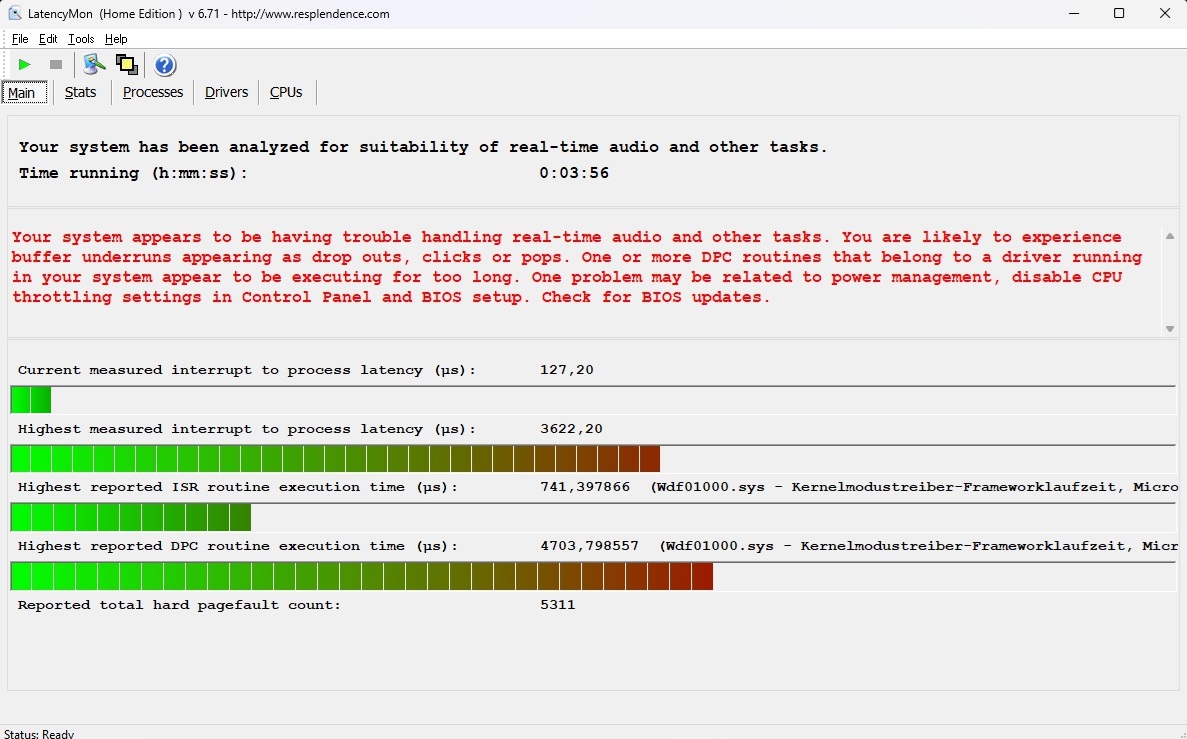
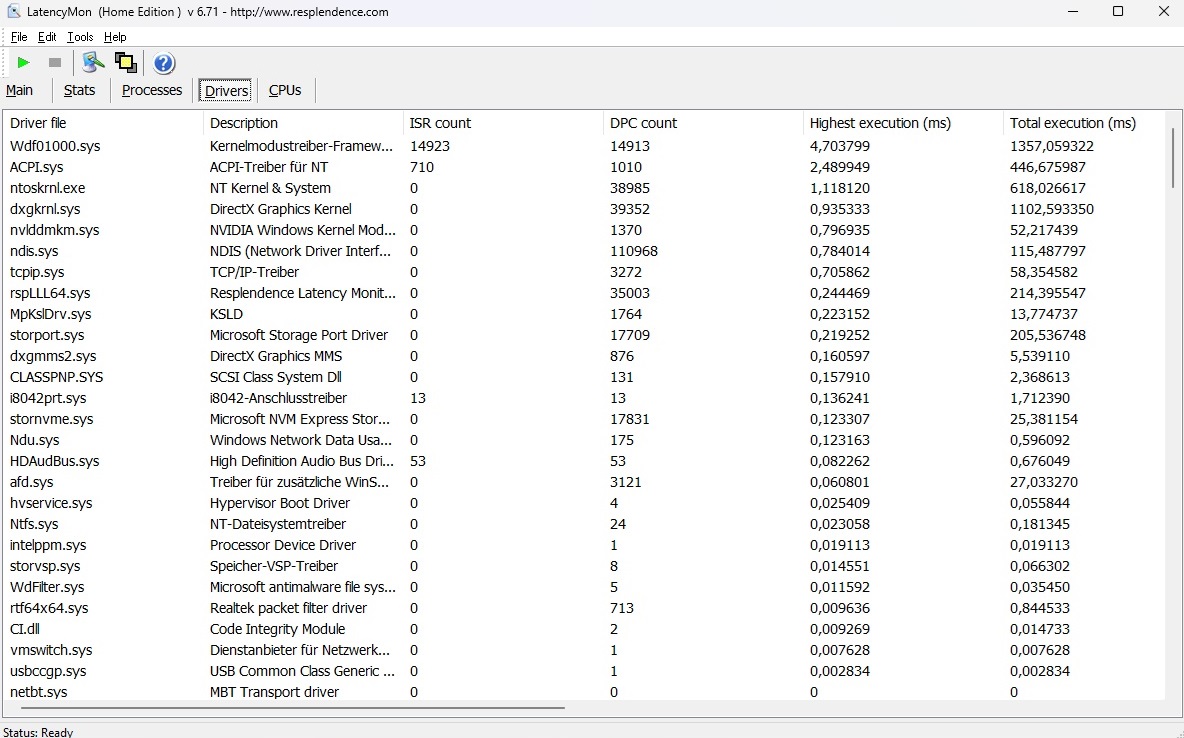
Latência DPC
Se o senhor pretende usar o sistema para edição de áudio e vídeo em tempo real, talvez deva considerar alternativas. De acordo com a ferramenta LatencyMon, as latências no estado de fábrica são bastante modestas, o que pode causar problemas em determinadas tarefas.
| DPC Latencies / LatencyMon - interrupt to process latency (max), Web, Youtube, Prime95 | |
| HP Victus 15-fa1057ng | |
| Dell G15 5530, i5-13450HX RTX 4050 | |
| HP Victus 15 fa0020nr | |
| Acer Nitro V 15 ANV15-51-582S | |
* ... menor é melhor
Dispositivos de armazenamento
O resfriamento do SSD também está abaixo do ideal. Embora a unidade Kioxia instalada inicialmente ofereça resultados louváveis nas primeiras execuções, ela sofre uma aceleração significativa ao longo do tempo, conforme demonstrado em nosso teste de loop.

* ... menor é melhor
Reading continuous performance: DiskSpd Read Loop, Queue Depth 8
Placa de vídeo
O desempenho das atuais placas de vídeo da Nvidia é altamente dependente do TDP escolhido. A HP escolheu 75 watts (incluindo Dynamic Boost) para o Victus 15, o que é relativamente baixo para a RTX 4050, mas só se reflete de forma limitada em muitos benchmarks. De modo geral, o desempenho 3D está alinhado com a média dessa placa de vídeo. O futuro da RTX 4050 não é muito promissor, pois 6 GB de VRAM e uma interface de 96 bits já podem se tornar fatores limitantes em títulos exigentes.
| 3DMark 11 Performance | 25418 pontos | |
| 3DMark Ice Storm Standard Score | 189586 pontos | |
| 3DMark Cloud Gate Standard Score | 55024 pontos | |
| 3DMark Fire Strike Score | 19211 pontos | |
| 3DMark Time Spy Score | 8149 pontos | |
Ajuda | ||
* ... menor é melhor
Desempenho em jogos
No entanto, o Victus 15 é rápido o suficiente para rodar sem problemas a maioria dos jogos atuais na resolução nativa de 1.920 x 1.080 com configurações altas ou máximas. Ele só enfrenta desafios em casos individuais, como Enshrouded. O fato de a RTX 4050 operar com um TDP máximo de 75 watts não tem nenhum efeito perceptível em comparação com notebooks com um TGP mais alto, semelhante aos testes sintéticos.
| The Witcher 3 - 1920x1080 Ultra Graphics & Postprocessing (HBAO+) | |
| Média da turma Gaming (95 - 240, n=8, últimos 2 anos) | |
| Dell G15 5530, i5-13450HX RTX 4050 | |
| Asus TUF A15 FA507 | |
| Acer Nitro V 15 ANV15-51-582S | |
| HP Victus 15-fa1057ng | |
| Média NVIDIA GeForce RTX 4050 Laptop GPU (18.5 - 94.7, n=40) | |
| HP Victus 15 fa0020nr | |
| Enshrouded - 1920x1080 Max. Quality AA:FX | |
| Medion Erazer Scout E20 | |
| Média NVIDIA GeForce RTX 4050 Laptop GPU (37.3 - 37.7, n=2) | |
| HP Victus 15-fa1057ng | |
| Média da turma Gaming (n=1últimos 2 anos) | |
| Palworld - 1920x1080 Epic Preset AA:TSR | |
| Medion Erazer Scout E20 | |
| Média NVIDIA GeForce RTX 4050 Laptop GPU (71.9 - 74.9, n=2) | |
| HP Victus 15-fa1057ng | |
| Média da turma Gaming (n=1últimos 2 anos) | |
| Prince of Persia The Lost Crown - 1920x1080 Ultra Preset AA:SM | |
| Medion Erazer Scout E20 | |
| Média NVIDIA GeForce RTX 4050 Laptop GPU (349 - 353, n=2) | |
| HP Victus 15-fa1057ng | |
| Média da turma Gaming (321 - 357, n=6, últimos 2 anos) | |
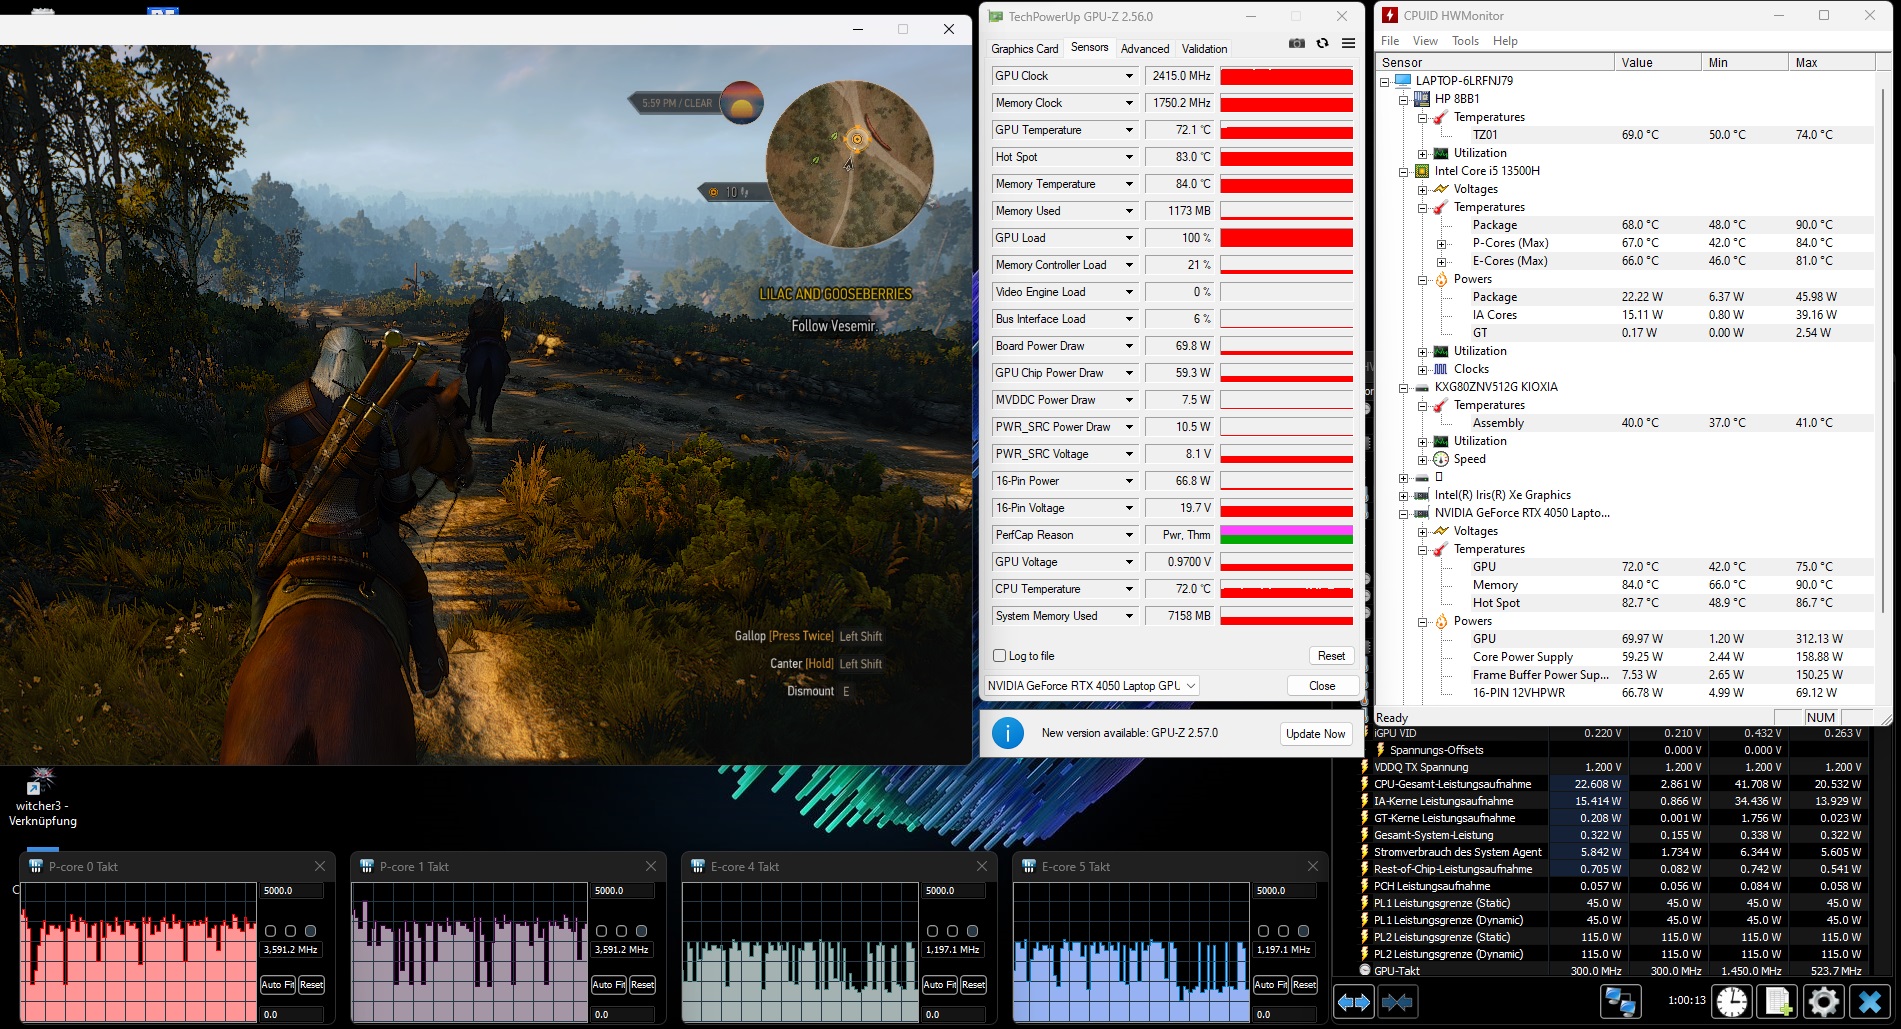
Testamos como o desempenho 3D se comporta em um período de tempo mais longo, especificamente 60 minutos com o jogo de interpretação de papéis O Witcher 3 (FHD/Ultra). A taxa de quadros permaneceu razoavelmente estável a longo prazo.
Witcher 3 FPS diagram
| baixo | média | alto | ultra | |
|---|---|---|---|---|
| GTA V (2015) | 172.4 | 160.7 | 89.1 | |
| The Witcher 3 (2015) | 78 | |||
| Dota 2 Reborn (2015) | 159.7 | 141.1 | 130.7 | 122.5 |
| Final Fantasy XV Benchmark (2018) | 105.1 | 80.3 | ||
| X-Plane 11.11 (2018) | 113 | 101.1 | 81.5 | |
| Strange Brigade (2018) | 197.1 | 159 | 139.1 | |
| Prince of Persia The Lost Crown (2024) | 352 | 350 | 349 | |
| Palworld (2024) | 93.3 | 72.5 | 71.9 | |
| Enshrouded (2024) | 45.8 | 45.1 | 37.3 |
Emissões
Ruído do sistema
Nós descreveríamos o desenvolvimento do ruído como esperado. Com 29-31 dB (ocioso) e 40-48 dB (carga), o laptop de 15 polegadas não é nem muito silencioso nem muito alto no modo "Padrão", mas atinge um nível médio que deve ser aceitável para a maioria dos compradores, mesmo sem um fone de ouvido.
Barulho
| Ocioso |
| 29 / 30 / 31 dB |
| Carga |
| 40 / 48 dB |
 | ||
30 dB silencioso 40 dB(A) audível 50 dB(A) ruidosamente alto |
||
min: | ||
| HP Victus 15-fa1057ng GeForce RTX 4050 Laptop GPU, i5-13500H | HP Victus 15 fa0020nr GeForce RTX 3050 Ti Laptop GPU, i7-12700H | Dell G15 5530, i5-13450HX RTX 4050 GeForce RTX 4050 Laptop GPU, i5-13450HX | Acer Nitro V 15 ANV15-51-582S GeForce RTX 4050 Laptop GPU, i5-13420H | Asus TUF A15 FA507 GeForce RTX 4050 Laptop GPU, R7 7735HS | |
|---|---|---|---|---|---|
| Noise | 7% | 4% | -4% | 15% | |
| desligado / ambiente * (dB) | 25 | 24.8 1% | 25 -0% | 25 -0% | 23.3 7% |
| Idle Minimum * (dB) | 29 | 26.2 10% | 25 14% | 25 14% | 23.3 20% |
| Idle Average * (dB) | 30 | 29.2 3% | 26 13% | 29 3% | 23.3 22% |
| Idle Maximum * (dB) | 31 | 29.4 5% | 30 3% | 30 3% | 23.3 25% |
| Load Average * (dB) | 40 | 29.9 25% | 38 5% | 49 -23% | 29.6 26% |
| Witcher 3 ultra * (dB) | 42 | 41.1 2% | 44 -5% | 49 -17% | 43 -2% |
| Load Maximum * (dB) | 48 | 45.5 5% | 50 -4% | 51 -6% | 43 10% |
* ... menor é melhor
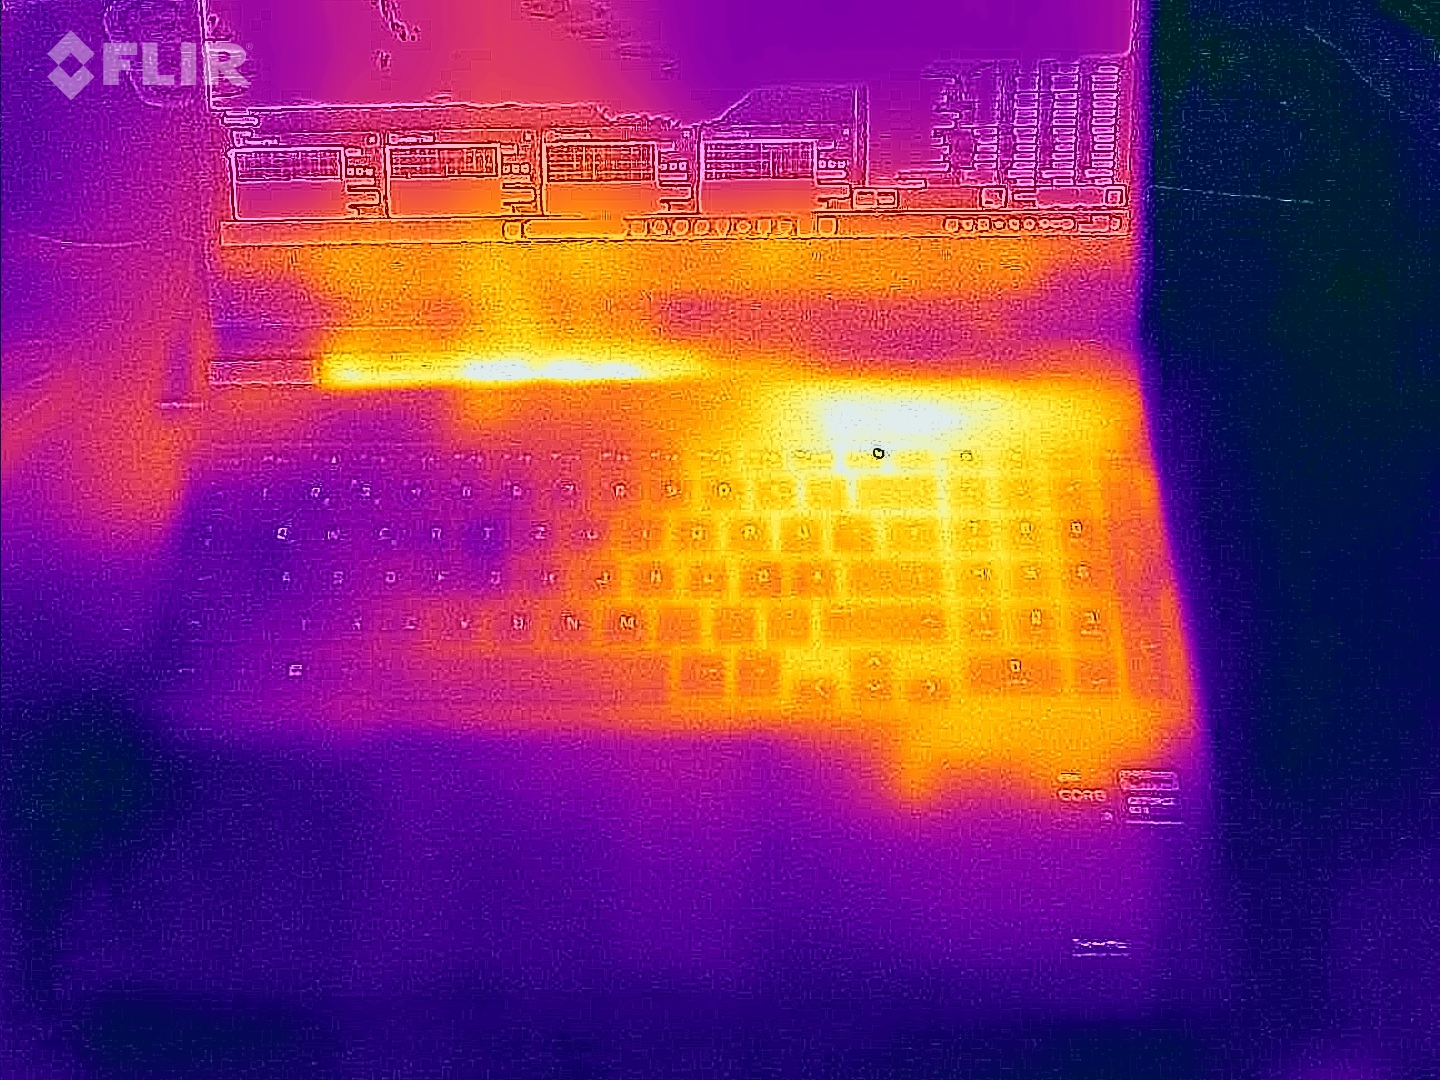
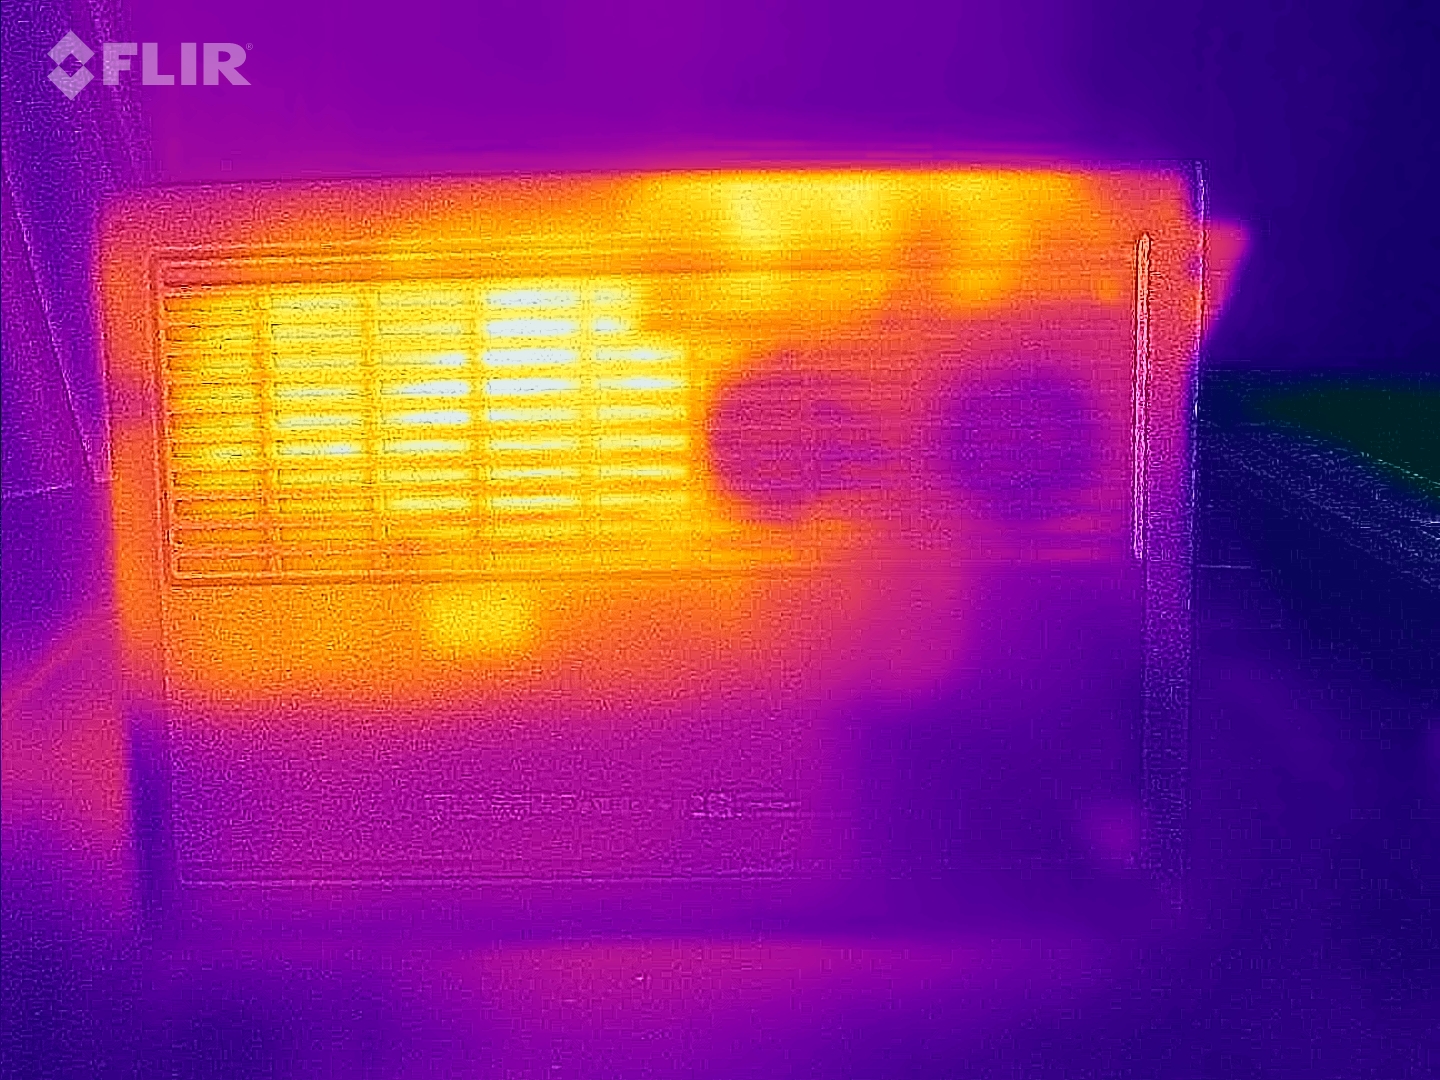
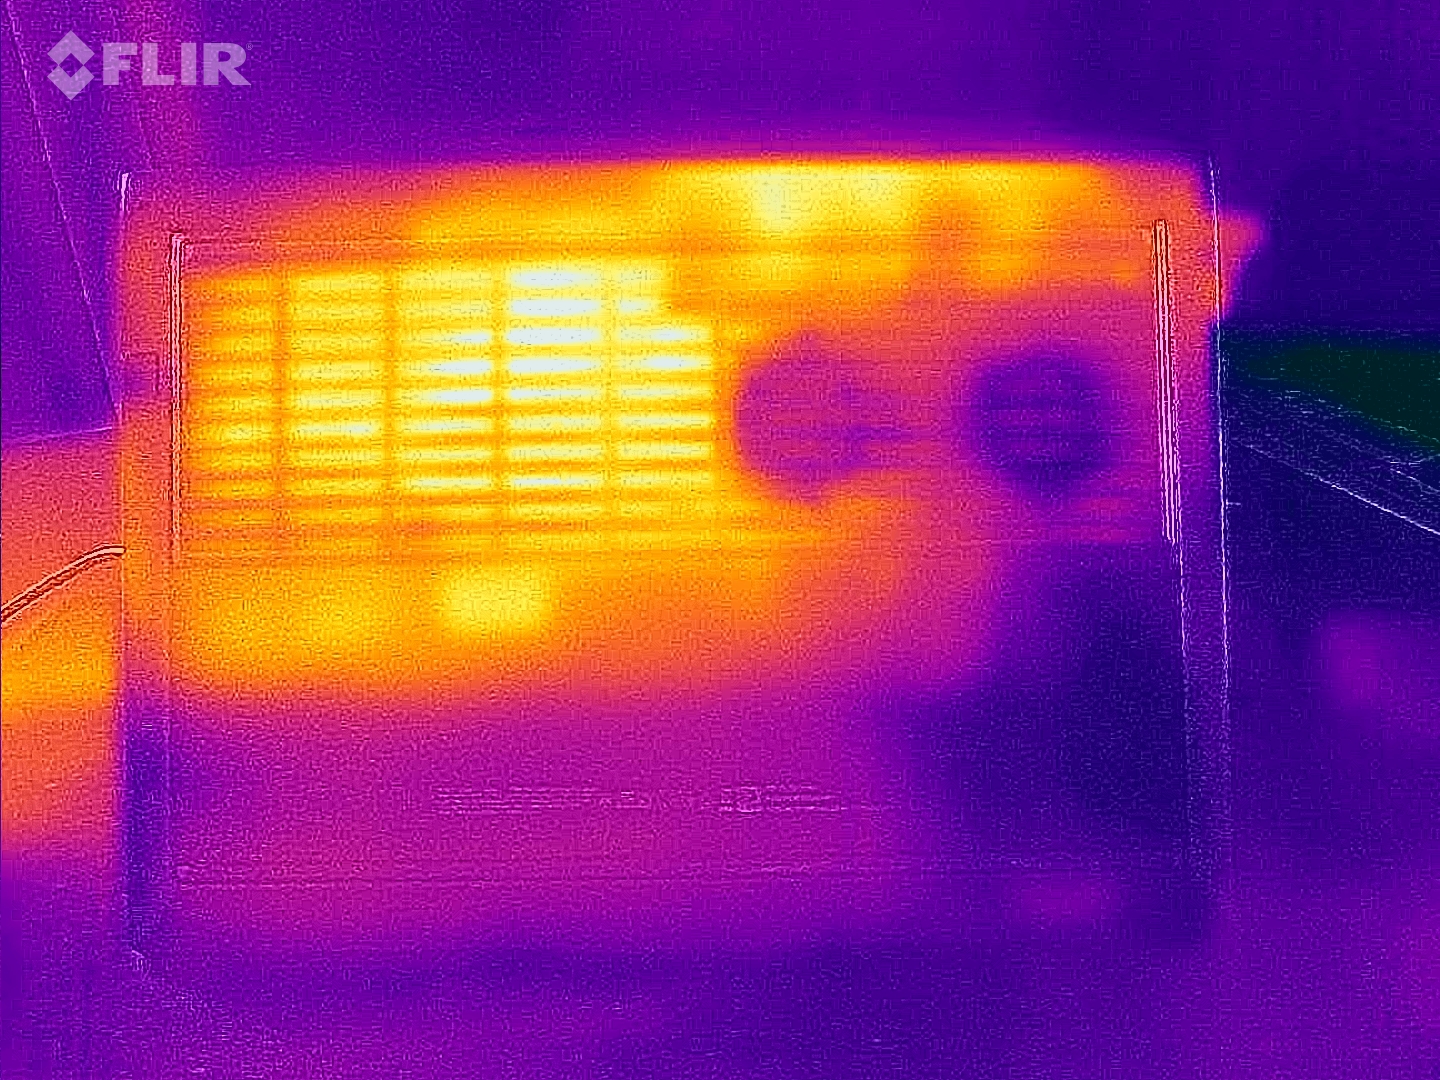
Temperatura
As temperaturas do gabinete são surpreendentemente baixas. Mesmo depois de uma hora de testes de estresse com as ferramentas Furmark e Prime95, o gabinete atinge uma temperatura de apenas 107,6 °F. Isso significa que o Victus 15 pode ser facilmente colocado no colo durante os jogos. A concorrência fica visivelmente mais quente em alguns casos.
(±) A temperatura máxima no lado superior é 42 °C / 108 F, em comparação com a média de 40.4 °C / 105 F , variando de 21.2 a 68.8 °C para a classe Gaming.
(±) A parte inferior aquece até um máximo de 42 °C / 108 F, em comparação com a média de 43.2 °C / 110 F
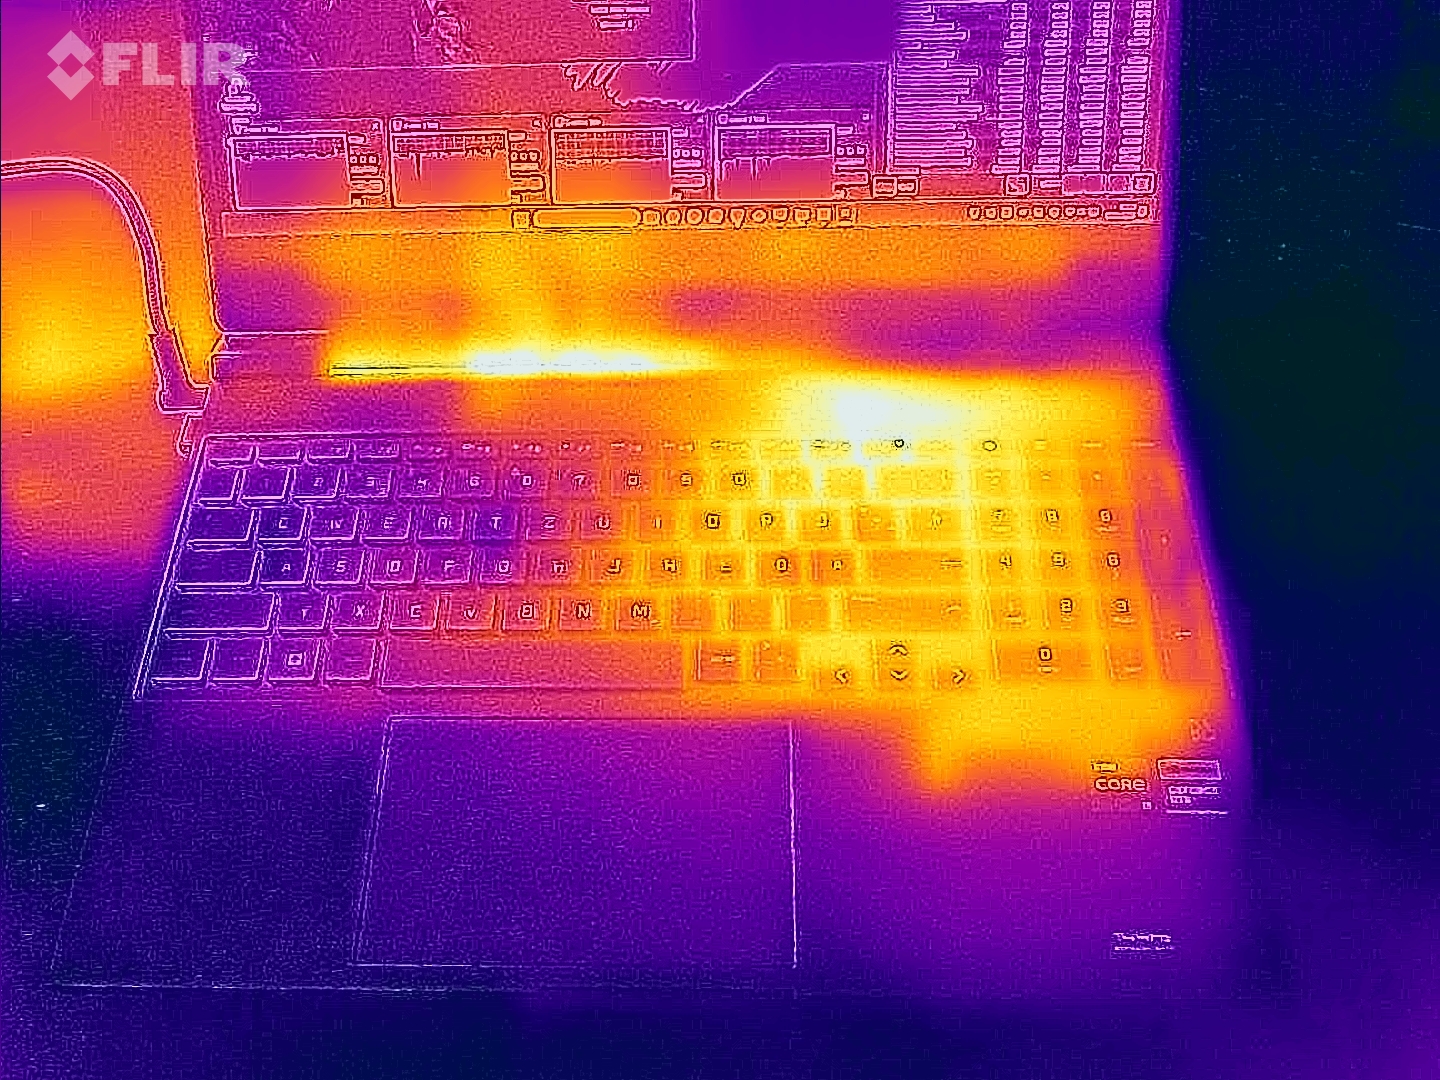
(+) Em uso inativo, a temperatura média para o lado superior é 23.6 °C / 74 F, em comparação com a média do dispositivo de 33.9 °C / ### class_avg_f### F.
(±) Jogando The Witcher 3, a temperatura média para o lado superior é 33.8 °C / 93 F, em comparação com a média do dispositivo de 33.9 °C / ## #class_avg_f### F.
(+) Os apoios para as mãos e o touchpad estão atingindo a temperatura máxima da pele (33 °C / 91.4 F) e, portanto, não estão quentes.
(-) A temperatura média da área do apoio para as mãos de dispositivos semelhantes foi 28.8 °C / 83.8 F (-4.2 °C / -7.6 F).
| HP Victus 15-fa1057ng GeForce RTX 4050 Laptop GPU, i5-13500H | HP Victus 15 fa0020nr GeForce RTX 3050 Ti Laptop GPU, i7-12700H | Dell G15 5530, i5-13450HX RTX 4050 GeForce RTX 4050 Laptop GPU, i5-13450HX | Acer Nitro V 15 ANV15-51-582S GeForce RTX 4050 Laptop GPU, i5-13420H | Asus TUF A15 FA507 GeForce RTX 4050 Laptop GPU, R7 7735HS | |
|---|---|---|---|---|---|
| Heat | 10% | -30% | -14% | -13% | |
| Maximum Upper Side * (°C) | 42 | 37.2 11% | 58 -38% | 46 -10% | 48.9 -16% |
| Maximum Bottom * (°C) | 42 | 35.4 16% | 57 -36% | 48 -14% | 44.6 -6% |
| Idle Upper Side * (°C) | 24 | 22.4 7% | 30 -25% | 27 -13% | 27.1 -13% |
| Idle Bottom * (°C) | 24 | 22.6 6% | 29 -21% | 28 -17% | 27.5 -15% |
* ... menor é melhor
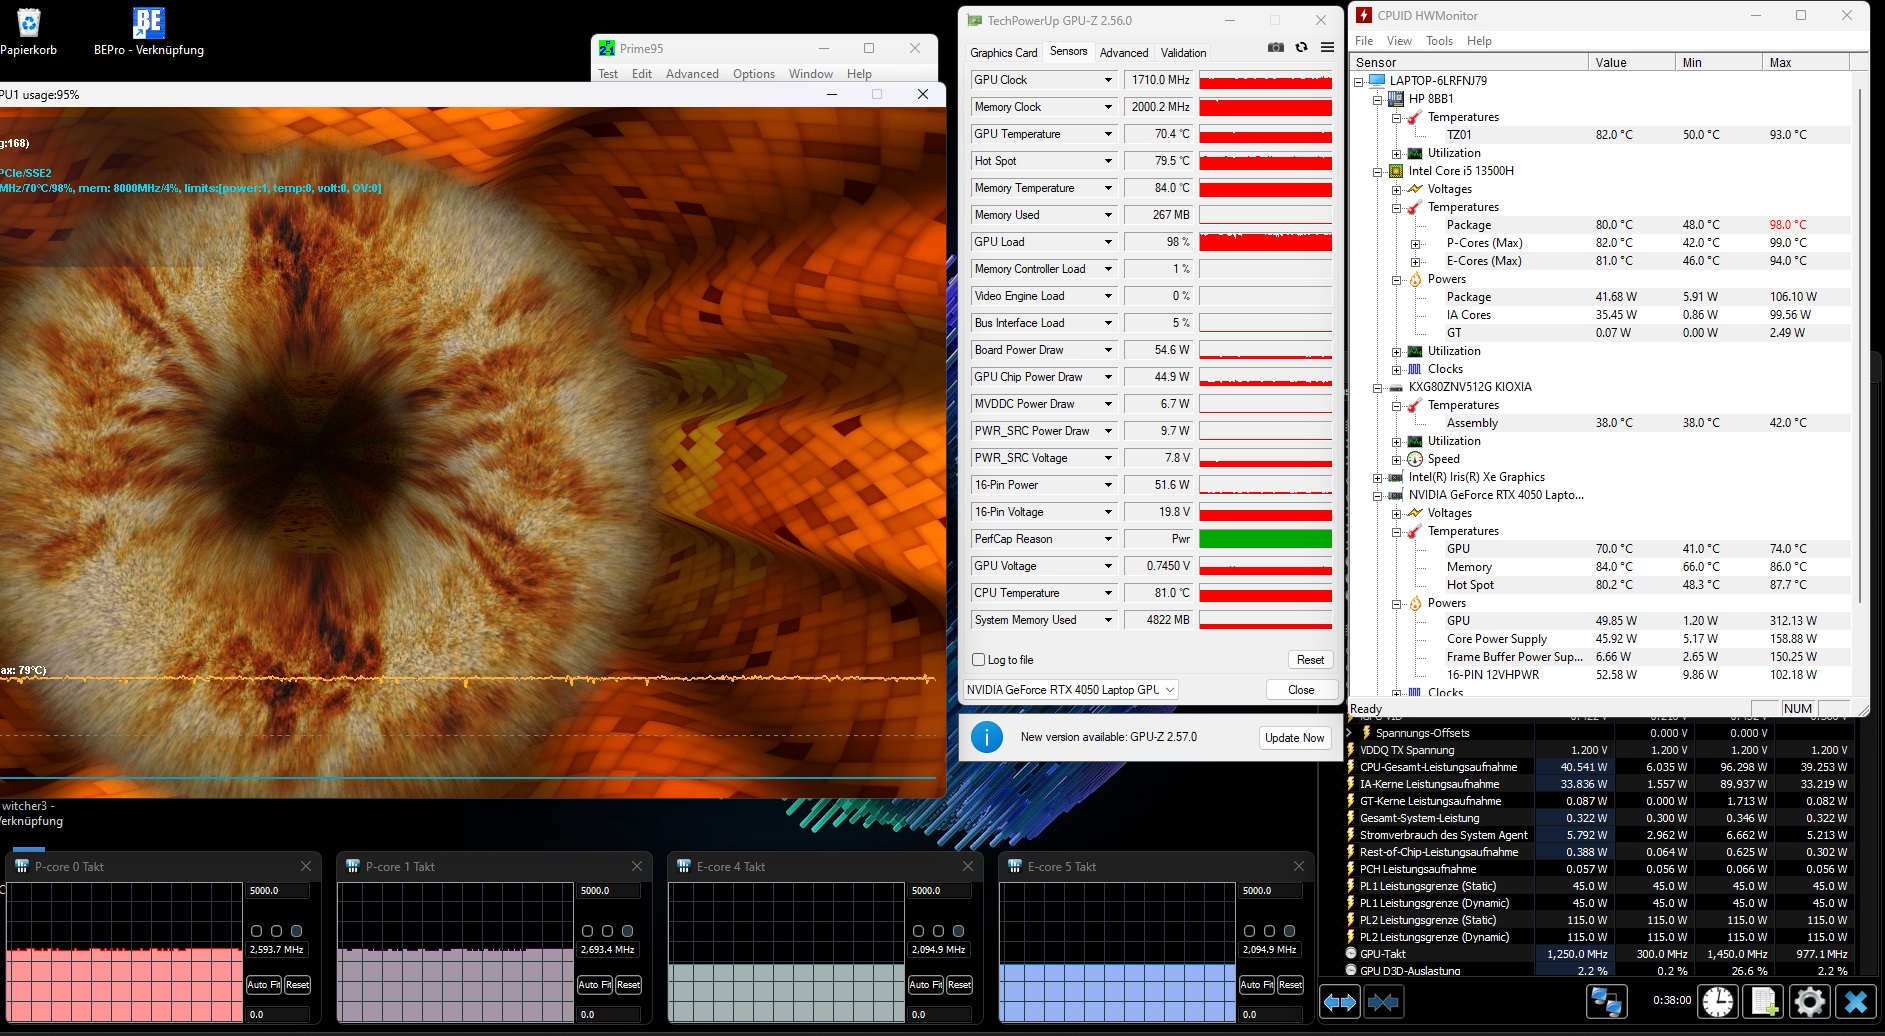
Teste de estresse
Os componentes não apresentaram surpresas indesejáveis. Após um longo período de carga total, a CPU se estabilizou em aproximadamente 176 °F, enquanto a GPU manteve uma média de 158 °F, o que também é totalmente aceitável para esse cenário.
Alto-falantes
Se possível, um fone de ouvido ou alto-falantes externos devem ser conectados para o aproveitamento da mídia. O sistema de áudio 2.0 do Victus 15 obteve apenas uma pontuação medíocre na análise de áudio, com deficiências perceptíveis na reprodução de graves e no volume máximo.
HP Victus 15-fa1057ng análise de áudio
(±) | o volume do alto-falante é médio, mas bom (###valor### dB)
Graves 100 - 315Hz
(-) | quase nenhum baixo - em média 26.2% menor que a mediana
(±) | a linearidade dos graves é média (12.8% delta para a frequência anterior)
Médios 400 - 2.000 Hz
(+) | médios equilibrados - apenas 1.7% longe da mediana
(+) | médios são lineares (4.1% delta para frequência anterior)
Altos 2 - 16 kHz
(+) | agudos equilibrados - apenas 3% longe da mediana
(+) | os máximos são lineares (3.7% delta da frequência anterior)
Geral 100 - 16.000 Hz
(±) | a linearidade do som geral é média (18.4% diferença em relação à mediana)
Comparado com a mesma classe
» 59% de todos os dispositivos testados nesta classe foram melhores, 9% semelhantes, 33% piores
» O melhor teve um delta de 6%, a média foi 18%, o pior foi 132%
Comparado com todos os dispositivos testados
» 41% de todos os dispositivos testados foram melhores, 8% semelhantes, 52% piores
» O melhor teve um delta de 4%, a média foi 24%, o pior foi 134%
HP Victus 15 fa0020nr análise de áudio
(±) | o volume do alto-falante é médio, mas bom (###valor### dB)
Graves 100 - 315Hz
(-) | quase nenhum baixo - em média 24.6% menor que a mediana
(±) | a linearidade dos graves é média (12.8% delta para a frequência anterior)
Médios 400 - 2.000 Hz
(+) | médios equilibrados - apenas 2.5% longe da mediana
(+) | médios são lineares (3.4% delta para frequência anterior)
Altos 2 - 16 kHz
(+) | agudos equilibrados - apenas 3.7% longe da mediana
(+) | os máximos são lineares (4.9% delta da frequência anterior)
Geral 100 - 16.000 Hz
(±) | a linearidade do som geral é média (19.7% diferença em relação à mediana)
Comparado com a mesma classe
» 69% de todos os dispositivos testados nesta classe foram melhores, 6% semelhantes, 25% piores
» O melhor teve um delta de 6%, a média foi 18%, o pior foi 132%
Comparado com todos os dispositivos testados
» 50% de todos os dispositivos testados foram melhores, 7% semelhantes, 43% piores
» O melhor teve um delta de 4%, a média foi 24%, o pior foi 134%
Gerenciamento de energia
Consumo de energia
O consumo moderado de energia é apreciado. Considerando o desempenho disponível, o consumo de 5 a 9 watts em modo inativo e de 72 a 176 watts em carga é razoável. A unidade de fonte de alimentação tem o tamanho adequado.
| desligado | |
| Ocioso | |
| Carga |
|
Key:
min: | |
| HP Victus 15-fa1057ng i5-13500H, GeForce RTX 4050 Laptop GPU | HP Victus 15 fa0020nr i7-12700H, GeForce RTX 3050 Ti Laptop GPU | Dell G15 5530, i5-13450HX RTX 4050 i5-13450HX, GeForce RTX 4050 Laptop GPU | Acer Nitro V 15 ANV15-51-582S i5-13420H, GeForce RTX 4050 Laptop GPU | Asus TUF A15 FA507 R7 7735HS, GeForce RTX 4050 Laptop GPU | Média da turma Gaming | |
|---|---|---|---|---|---|---|
| Power Consumption | -18% | -21% | 9% | -14% | -76% | |
| Idle Minimum * (Watt) | 5 | 5.1 -2% | 2 60% | 7 -40% | 8 -60% | 13.3 ? -166% |
| Idle Average * (Watt) | 9 | 15.1 -68% | 12 -33% | 8 11% | 12.1 -34% | 19 ? -111% |
| Idle Maximum * (Watt) | 22 | 18.9 14% | 27 -23% | 11 50% | 12.5 43% | 24.5 ? -11% |
| Load Average * (Watt) | 72 | 114.5 -59% | 100 -39% | 76 -6% | 74.9 -4% | 108.1 ? -50% |
| Witcher 3 ultra * (Watt) | 113 | 113.9 -1% | 161.9 -43% | 98.2 13% | 136.6 -21% | |
| Load Maximum * (Watt) | 176 | 165.8 6% | 262 -49% | 136 23% | 185 -5% | 254 ? -44% |
* ... menor é melhor
Power consumption Witcher 3 / stress test
Power consumption with external monitor
Tempos de execução
O laptop de 15 polegadas também não precisa se esconder atrás da concorrência em termos de tempo de execução - pelo contrário. A versão da HP durou cerca de 7,5 horas em nosso teste WLAN com o brilho reduzido a 150 cd/m² - um bom resultado para um portátil para jogos. Os valores do antecessor provavelmente são significativamente piores devido a um bug.
| HP Victus 15-fa1057ng i5-13500H, GeForce RTX 4050 Laptop GPU, 70 Wh | HP Victus 15 fa0020nr i7-12700H, GeForce RTX 3050 Ti Laptop GPU, 70 Wh | Dell G15 5530, i5-13450HX RTX 4050 i5-13450HX, GeForce RTX 4050 Laptop GPU, 86 Wh | Acer Nitro V 15 ANV15-51-582S i5-13420H, GeForce RTX 4050 Laptop GPU, 57 Wh | Asus TUF A15 FA507 R7 7735HS, GeForce RTX 4050 Laptop GPU, 90 Wh | Média da turma Gaming | |
|---|---|---|---|---|---|---|
| Duração da bateria | -72% | -5% | 25% | 56% | -7% | |
| WiFi v1.3 (h) | 7.5 | 2.1 -72% | 7.1 -5% | 9.4 25% | 11.7 56% | 7.01 ? -7% |
| Reader / Idle (h) | 2.6 | 21.5 | 8.71 ? | |||
| Load (h) | 1.1 | 1.7 | 1 | 1.47 ? | ||
| H.264 (h) | 12.5 | 8.26 ? |
Pro
Contra
Veredicto
O Victus 15-fa1057ng surge como um típico notebook econômico para jogos, atendendo a jogadores preocupados com o preço.
O invólucro de plástico, embora não exale um acabamento de alta qualidade, cumpre sua função de forma confiável, assim como os dispositivos de entrada. O hardware se alinha bem com a resolução Full HD, proporcionando uma experiência de jogo decente para a maioria dos títulos, embora a tela de 144 Hz não seja totalmente explorada. As emissões do processador Core i5-13500H e da GeForce RTX 4050 permanecem controláveis.
Uma vantagem é a duração significativamente maior da bateria.
Entretanto, os usuários precisam aceitar uma tela com precisão de cores e brilho limitados. Para aqueles que priorizam a qualidade da imagem, alternativas como o Dell G15 5530 ou o Asus TUF A15 FA507 em uma faixa de preço semelhante podem valer a pena considerar. Consequentemente, uma melhor qualidade de tela seria um aprimoramento significativo para o sucessor.
Preço e disponibilidade
O HP Victus 15, equipado com o Core i5-13500H, está disponível por aproximadamente US$ 690 em vários varejistas on-line (por exemplo, Amazon).
HP Victus 15-fa1057ng
- 01/31/2024 v7 (old)
Florian Glaser
Transparência
A seleção dos dispositivos a serem analisados é feita pela nossa equipe editorial. A amostra de teste foi fornecida ao autor como empréstimo pelo fabricante ou varejista para fins desta revisão. O credor não teve influência nesta revisão, nem o fabricante recebeu uma cópia desta revisão antes da publicação. Não houve obrigação de publicar esta revisão. Como empresa de mídia independente, a Notebookcheck não está sujeita à autoridade de fabricantes, varejistas ou editores.
É assim que o Notebookcheck está testando
Todos os anos, o Notebookcheck analisa de forma independente centenas de laptops e smartphones usando procedimentos padronizados para garantir que todos os resultados sejam comparáveis. Desenvolvemos continuamente nossos métodos de teste há cerca de 20 anos e definimos padrões da indústria no processo. Em nossos laboratórios de teste, equipamentos de medição de alta qualidade são utilizados por técnicos e editores experientes. Esses testes envolvem um processo de validação em vários estágios. Nosso complexo sistema de classificação é baseado em centenas de medições e benchmarks bem fundamentados, o que mantém a objetividade.Price comparison

