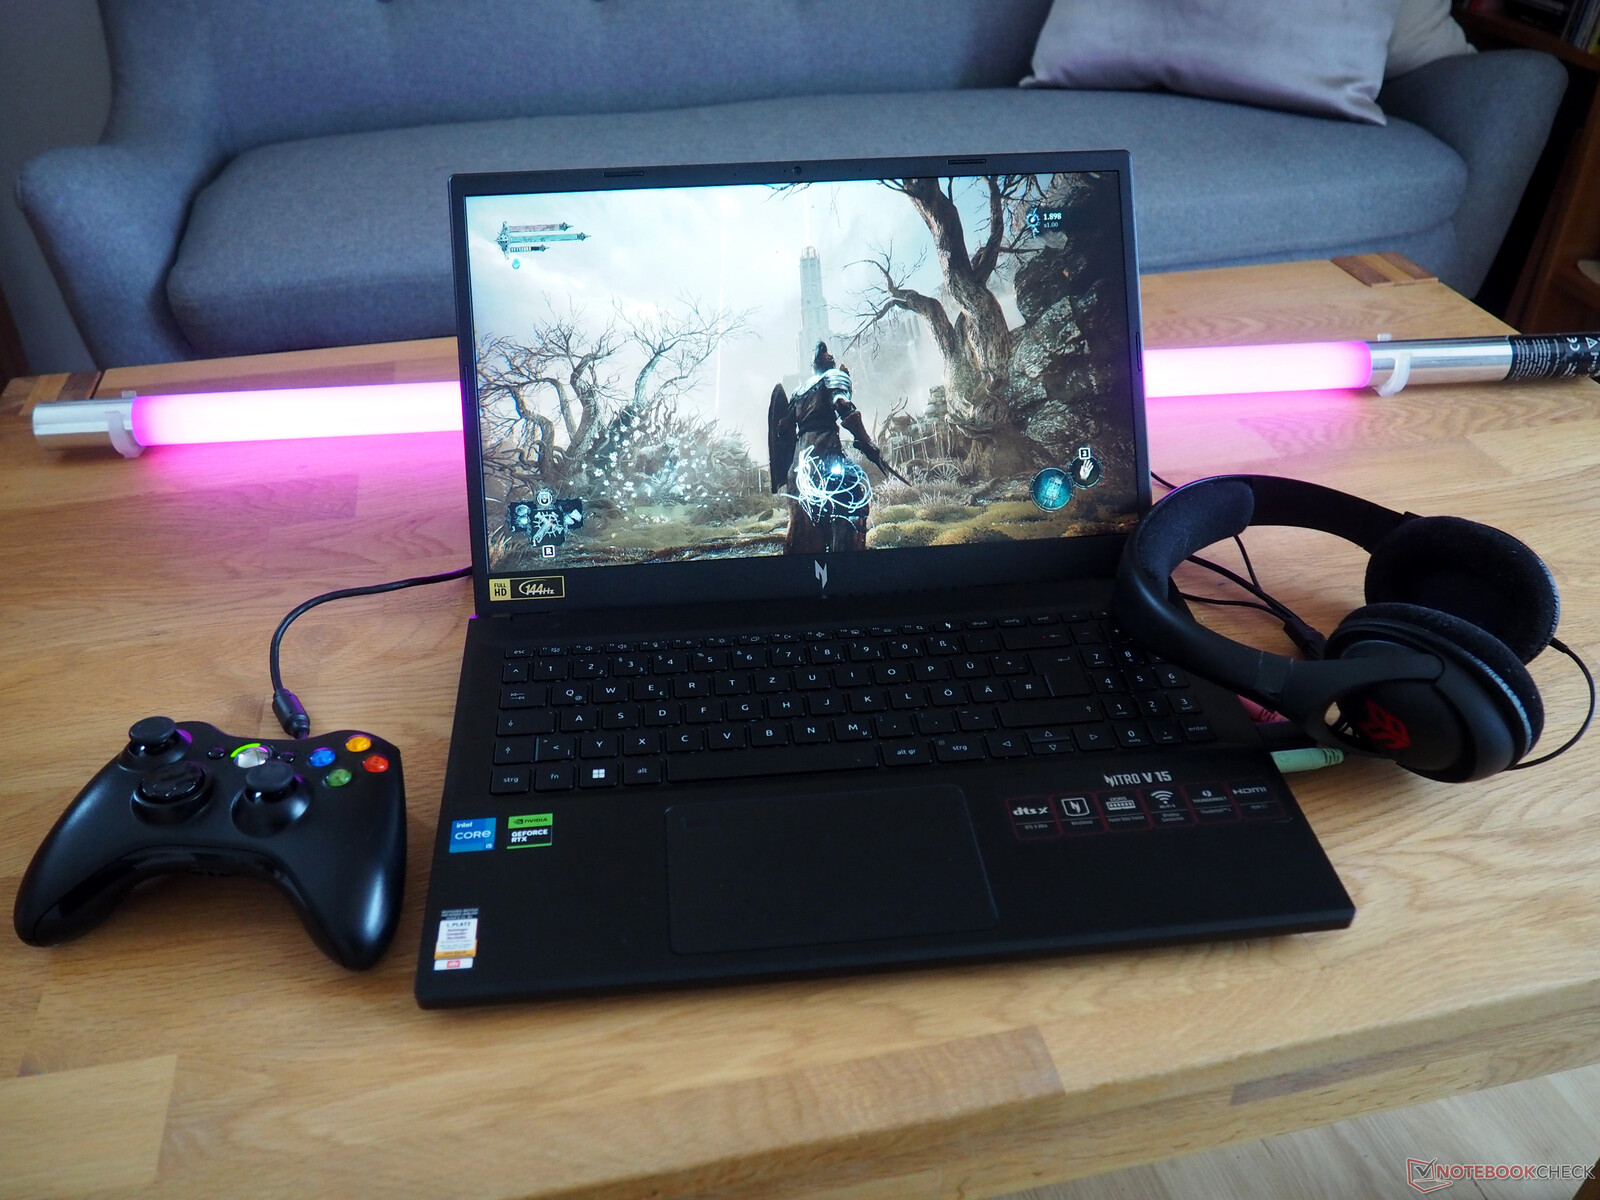
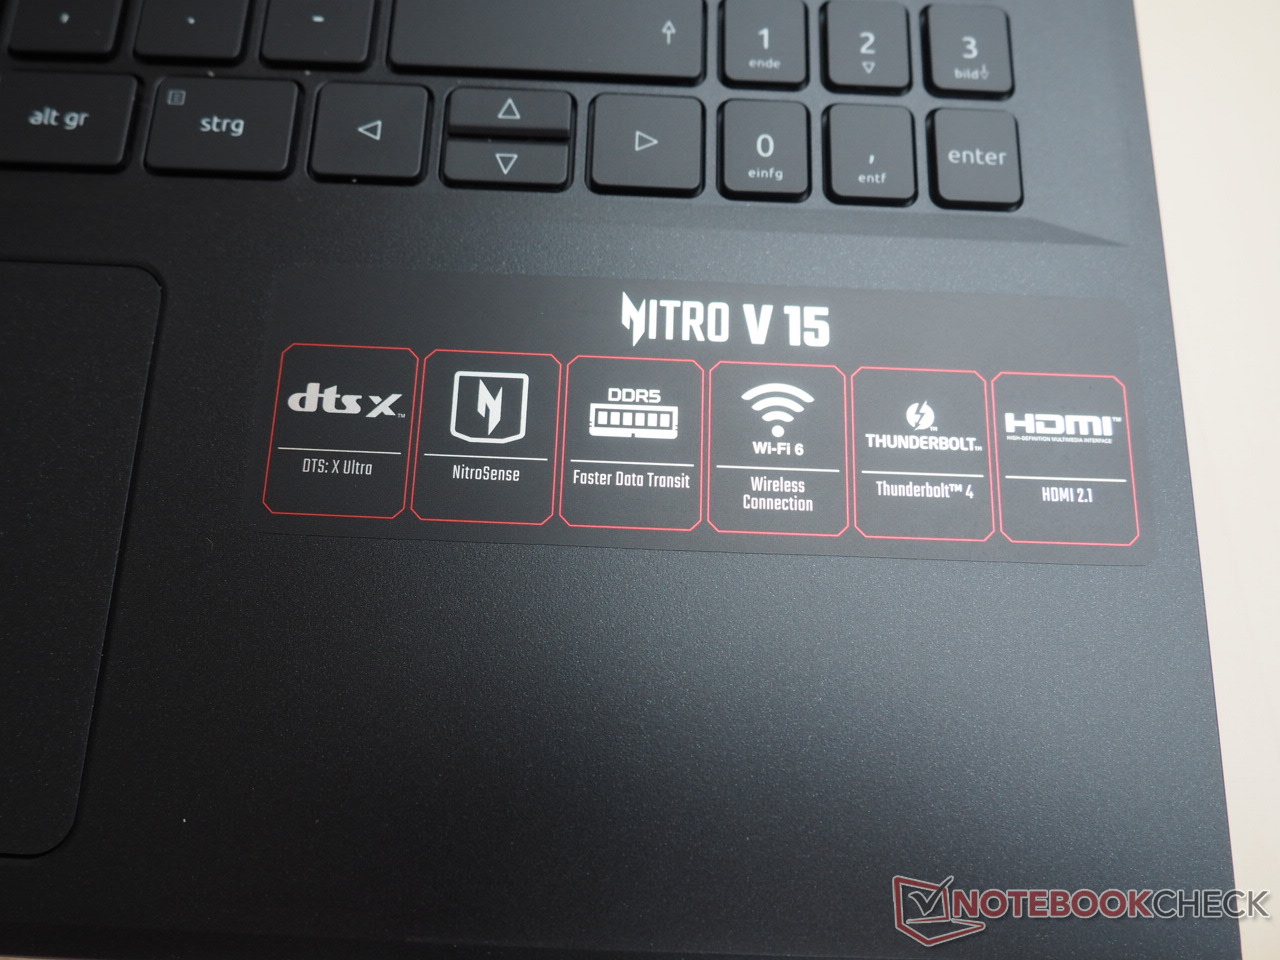
Análise do Acer Nitro V 15 ANV15-51: Laptop econômico para jogos com RTX 4050
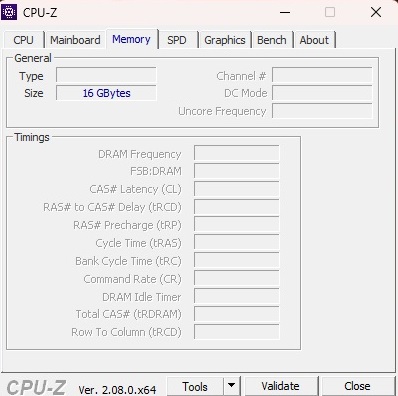
Duas variantes principais do Nitro V 15 estão disponíveis na Alemanha neste momento. Enquanto o modelo básico apresentado nesta análise custa cerca de 900 euros (US$ 980) e vem com um processador Core i5-13420H (12 threads) e um SSD de 512 GB, o modelo mais caro custará cerca de €200 (US$218) a mais e conta com um Core i7-13620H (16 threads) e uma unidade de 1 TB. Ambas as variantes são configuradas com os mesmos 16 GB de RAM DDR5 e uma placa de vídeo dedicada GeForce RTX 4050. Elas também usam uma tela IPS fosca com a resolução Full HD usual (1.920 x 1.080) e capacidade de 144 Hz.
O Nitro V 15 está competindo com outros notebooks econômicos para jogos de 15 polegadas com um GeForce RTX 4050, como o Medion Erazer Crawler E40e o Lenovo LOQ 15IRH8, o Asus TUF A15 FA507 e o Schenker XMG Apex 15 Late 23todos eles estão listados nas tabelas abaixo para fins de comparação.
Possíveis concorrentes em comparação
Avaliação | Data | Modelo | Peso | Altura | Size | Resolução | Preço |
|---|---|---|---|---|---|---|---|
| 82.8 % v7 (old) | 01/2024 | Acer Nitro V 15 ANV15-51-582S i5-13420H, GeForce RTX 4050 Laptop GPU | 2.1 kg | 23.5 mm | 15.60" | 1920x1080 | |
| 85.4 % v7 (old) | 12/2023 | Medion Erazer Crawler E40 - MD 62518 i5-13500H, GeForce RTX 4050 Laptop GPU | 2.3 kg | 28 mm | 15.60" | 1920x1080 | |
| 85.9 % v7 (old) | 10/2023 | Lenovo LOQ 15IRH8 Core i7 i7-13620H, GeForce RTX 4050 Laptop GPU | 2.4 kg | 25.2 mm | 15.60" | 2560x1440 | |
| 86.3 % v7 (old) | 06/2023 | Asus TUF A15 FA507 R7 7735HS, GeForce RTX 4050 Laptop GPU | 2.2 kg | 24.9 mm | 15.60" | 1920x1080 | |
| 86.2 % v7 (old) | 10/2023 | Schenker XMG Apex 15 (Late 23) R7 7840HS, GeForce RTX 4050 Laptop GPU | 2.2 kg | 26.7 mm | 15.60" | 2560x1440 |
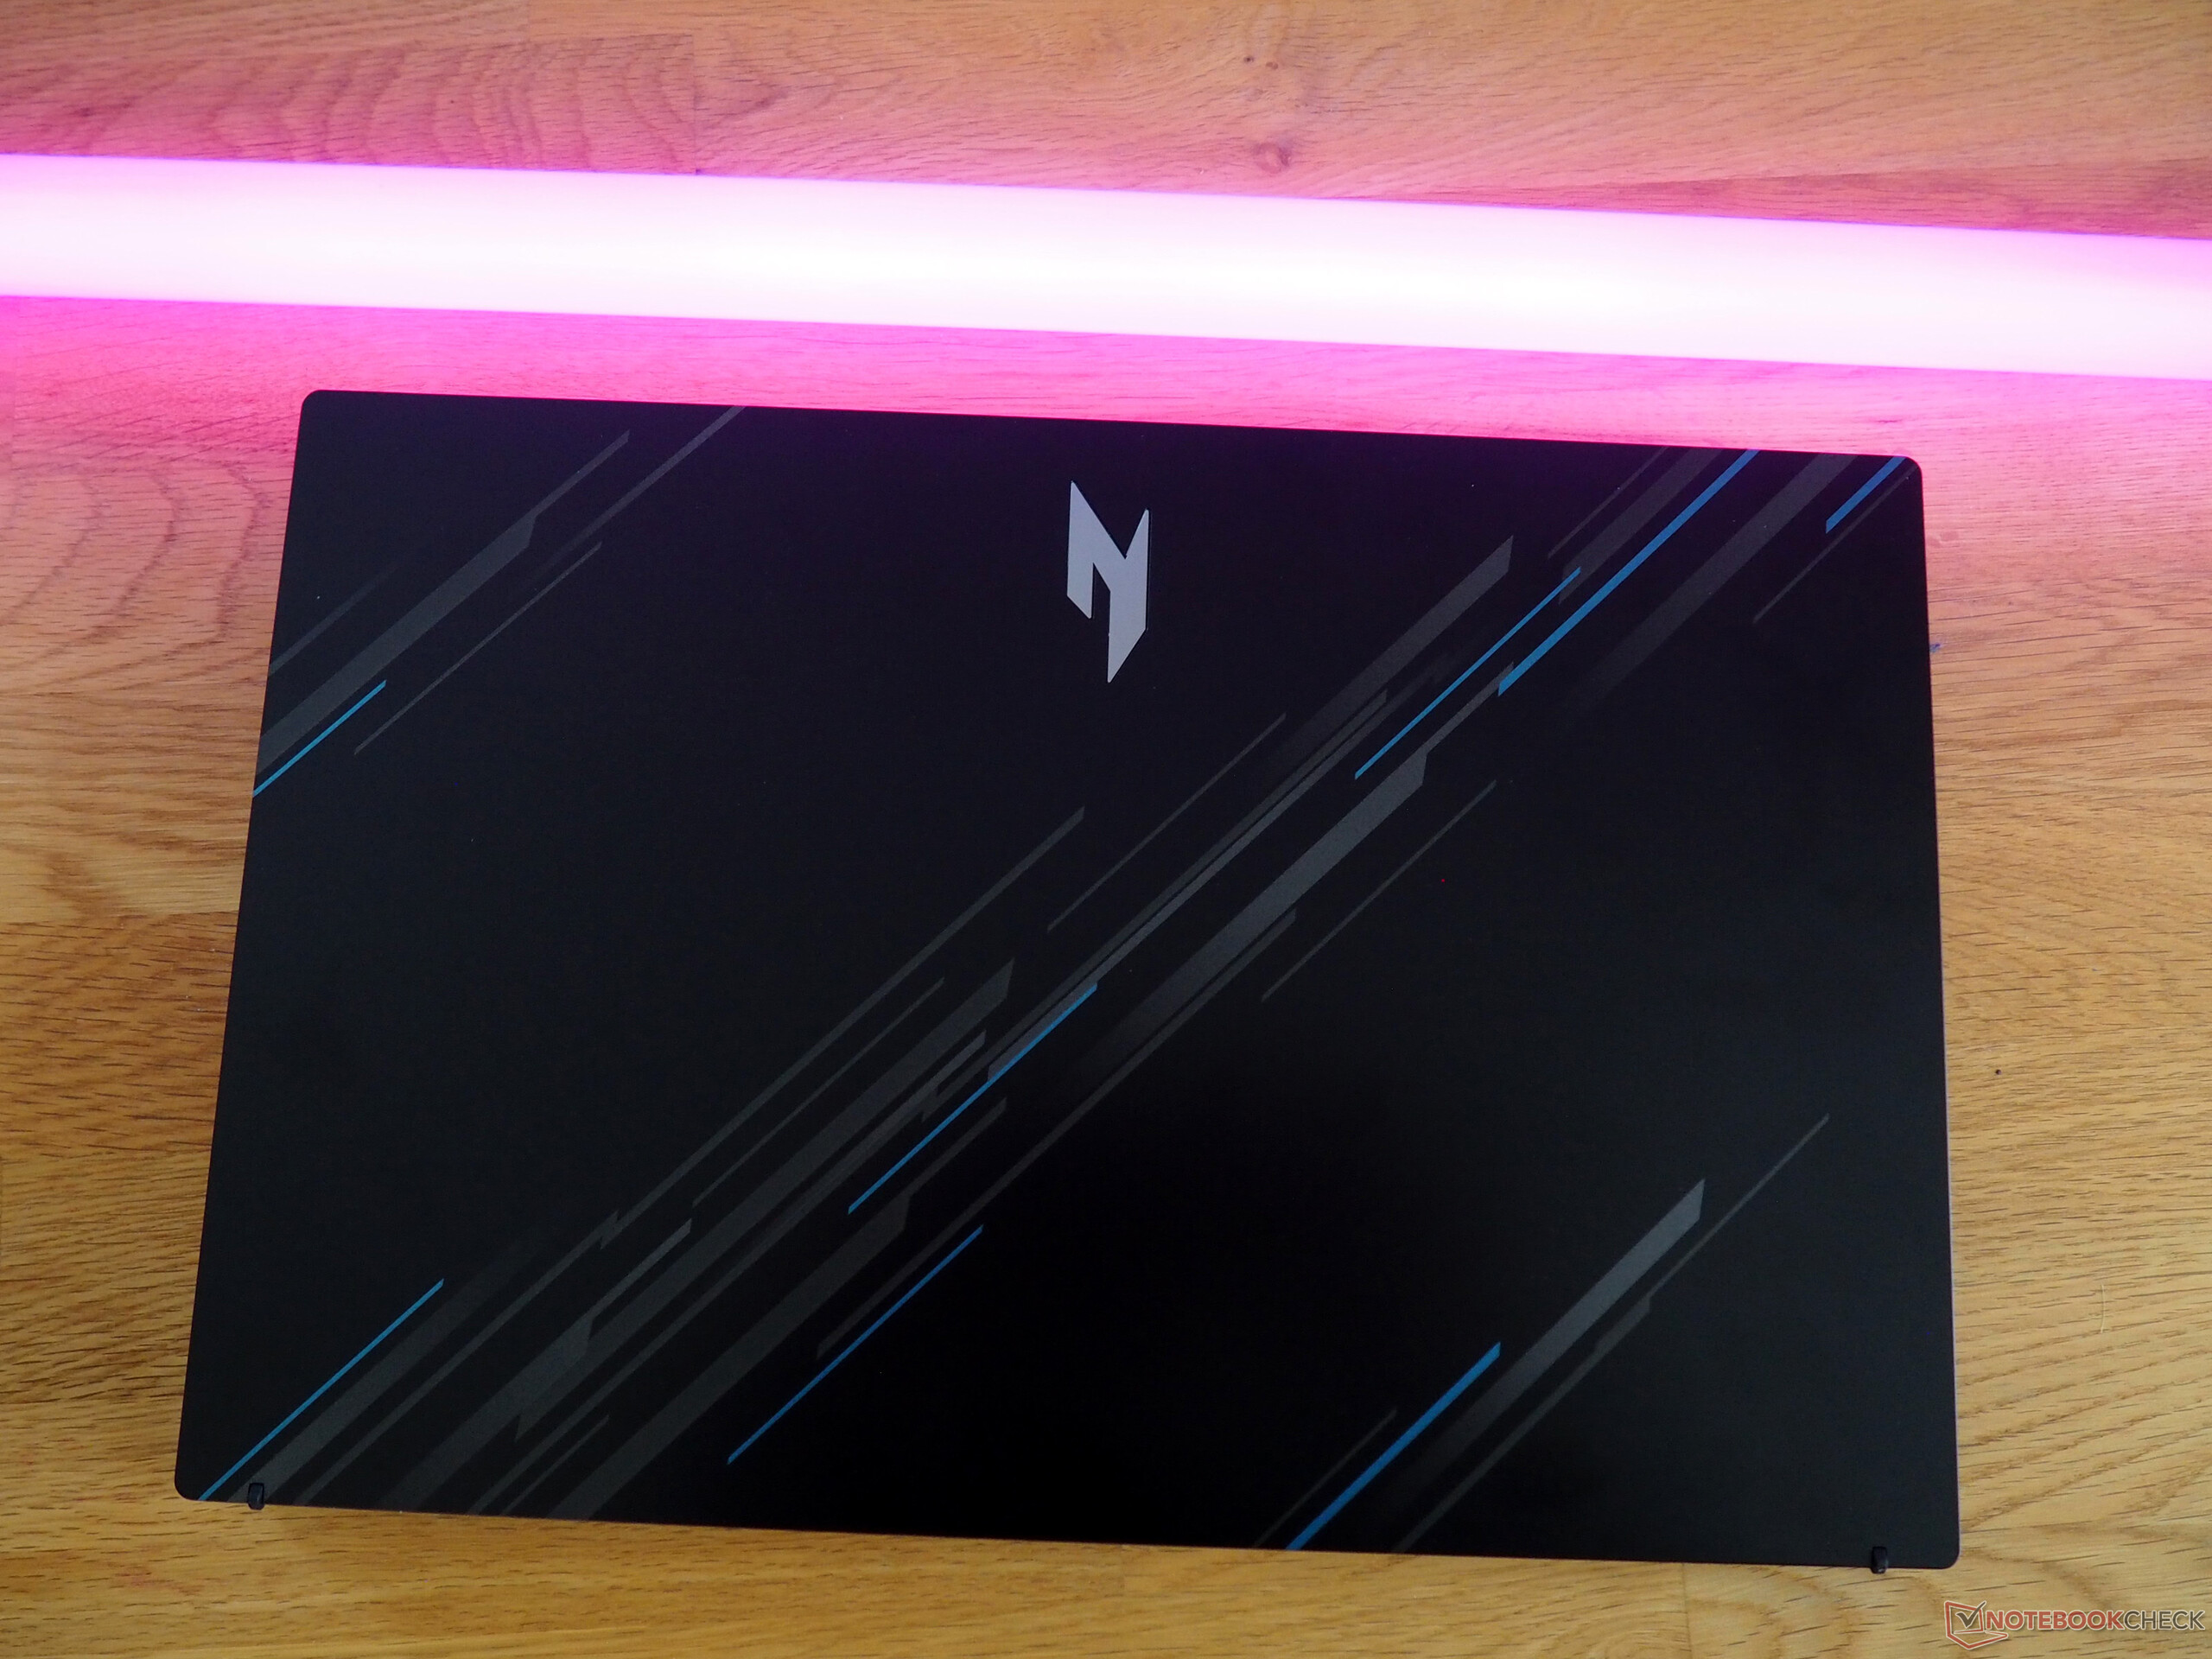
Caso
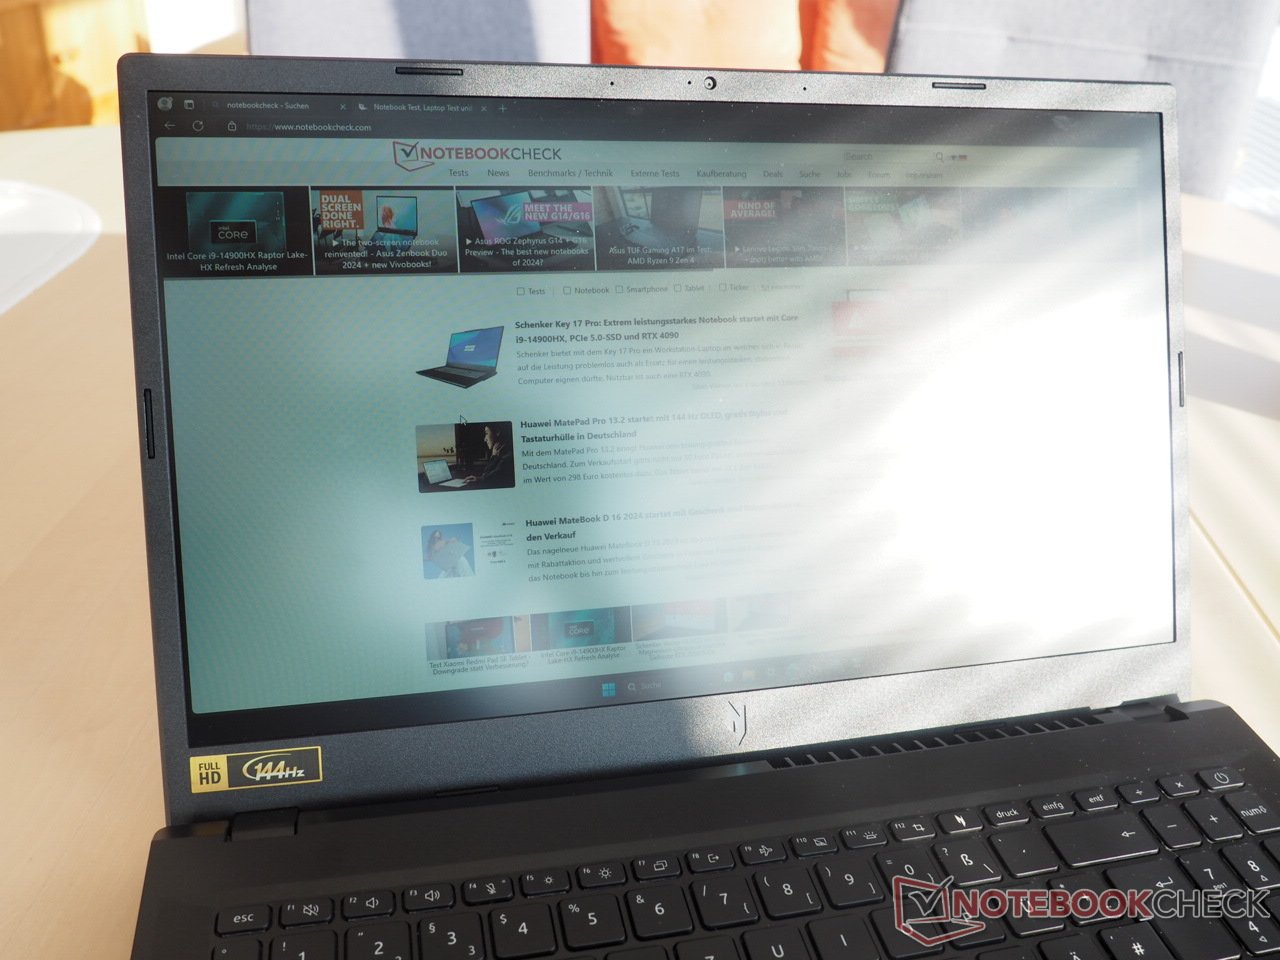
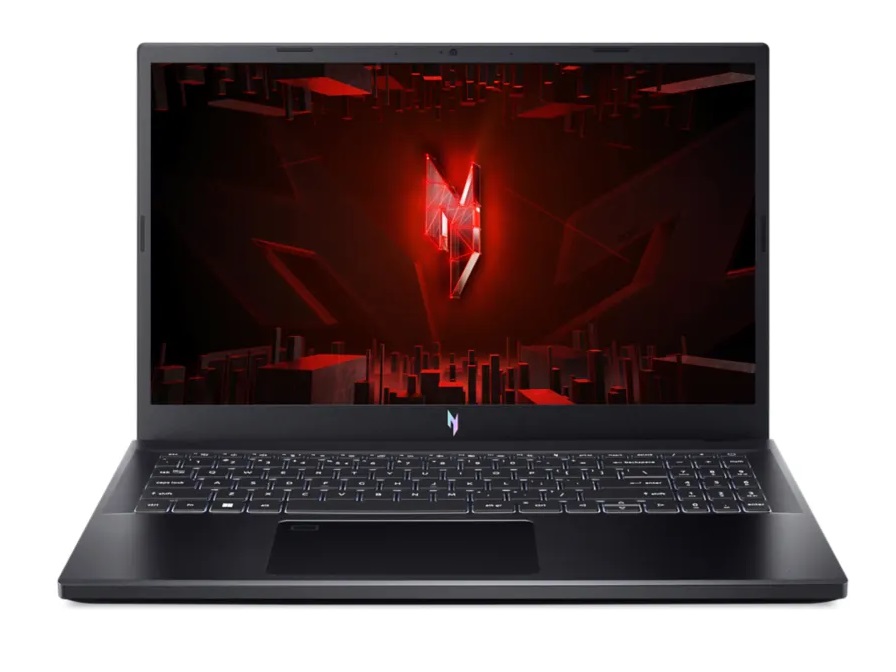
O V 15 é esteticamente agradável. O design azul-acinzentado na tampa, em particular, oferece uma lufada de ar fresco. Entretanto, o senhor não deve esperar muito do chassi em termos de qualidade. Como muitos outros dispositivos nessa faixa de preço, os compradores têm que se contentar com um chassi de plástico um pouco frágil e não muito resistente. Pelo menos o laptop de 15 polegadas tem um ajuste e um acabamento limpos, bem como um ângulo de abertura máximo sólido (aprox. 140°), embora suas dobradiças pudessem ser um pouco mais rígidas e menos "vacilantes".
Um dos maiores pontos fortes do Nitro é seu peso moderado: com cerca de 2,1 kg (4,6 lb), ele é o dispositivo mais leve em nossa comparação (os concorrentes pesam entre 2,2 e 2,4 kg, ou 4,8 e 6,2 lb). O dispositivo também não parece volumoso graças à sua silhueta esbelta.
Especificações
Interfaces
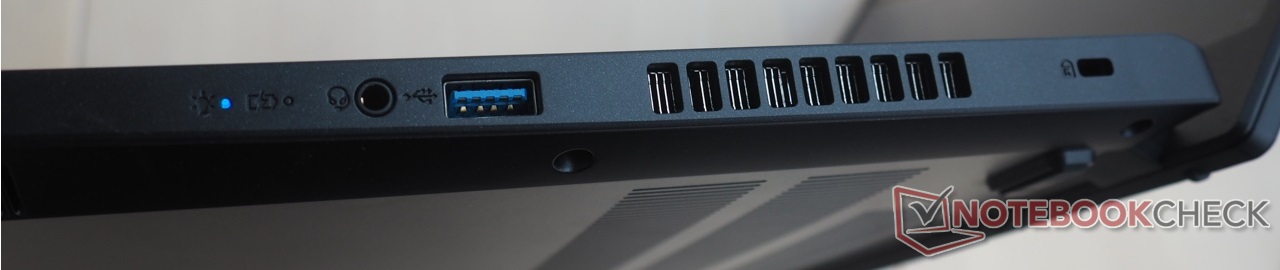
Se o senhor ignorar a falta de um leitor de cartão, a seleção de portas pode ser descrita como adequada. Embora tivéssemos gostado de ver mais uma porta USB-C, as três portas USB-A 3.0 e uma porta Thunderbolt 4 ainda são decentes para um laptop econômico para jogos. O Nitro V 15 também tem uma porta Ethernet dobrável, uma saída HDMI 2.1, um conector de áudio e um slot Kensington. As interfaces estão razoavelmente bem distribuídas pelo dispositivo. No entanto, algumas das portas poderiam ter sido colocadas um pouco mais para trás para facilitar o uso do mouse.

Conectividade
O desempenho do Wi-Fi é medíocre, na melhor das hipóteses. O módulo sem fio Intel integrado (Wi-Fi 6 AX203) não oferece desempenho de primeira linha ao enviar e receber dados, mas as velocidades que obtivemos são razoavelmente estáveis.
Webcam
Da mesma forma, o senhor só terá uma webcam padrão e comum com o laptop. Como costuma acontecer com as webcams de laptops, as imagens não têm nitidez e precisão de cores.


Acessórios
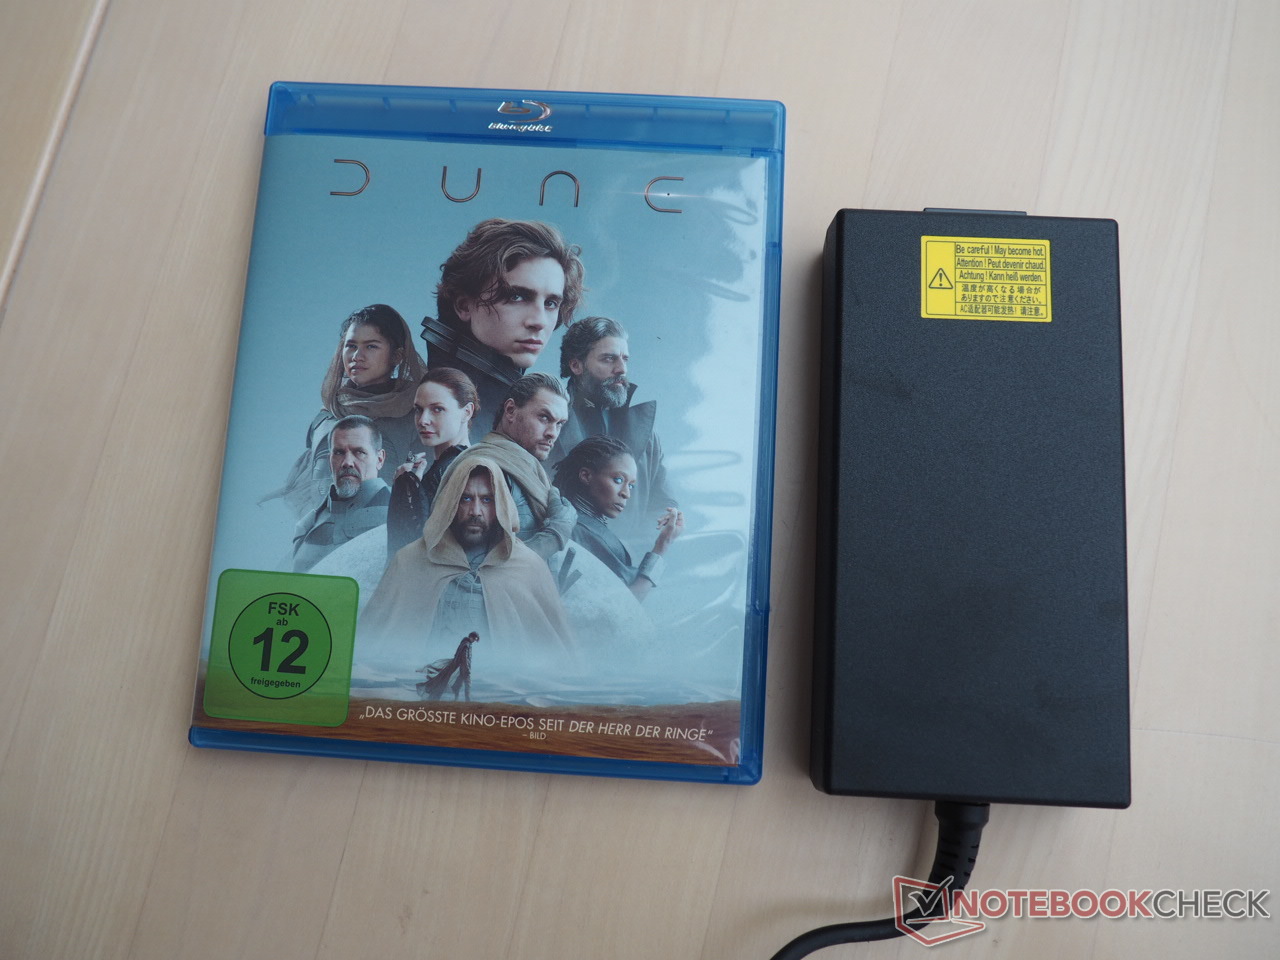
Além de vários documentos, o senhor também encontrará um adaptador CA de 135 watts agradavelmente compacto e leve na caixa.
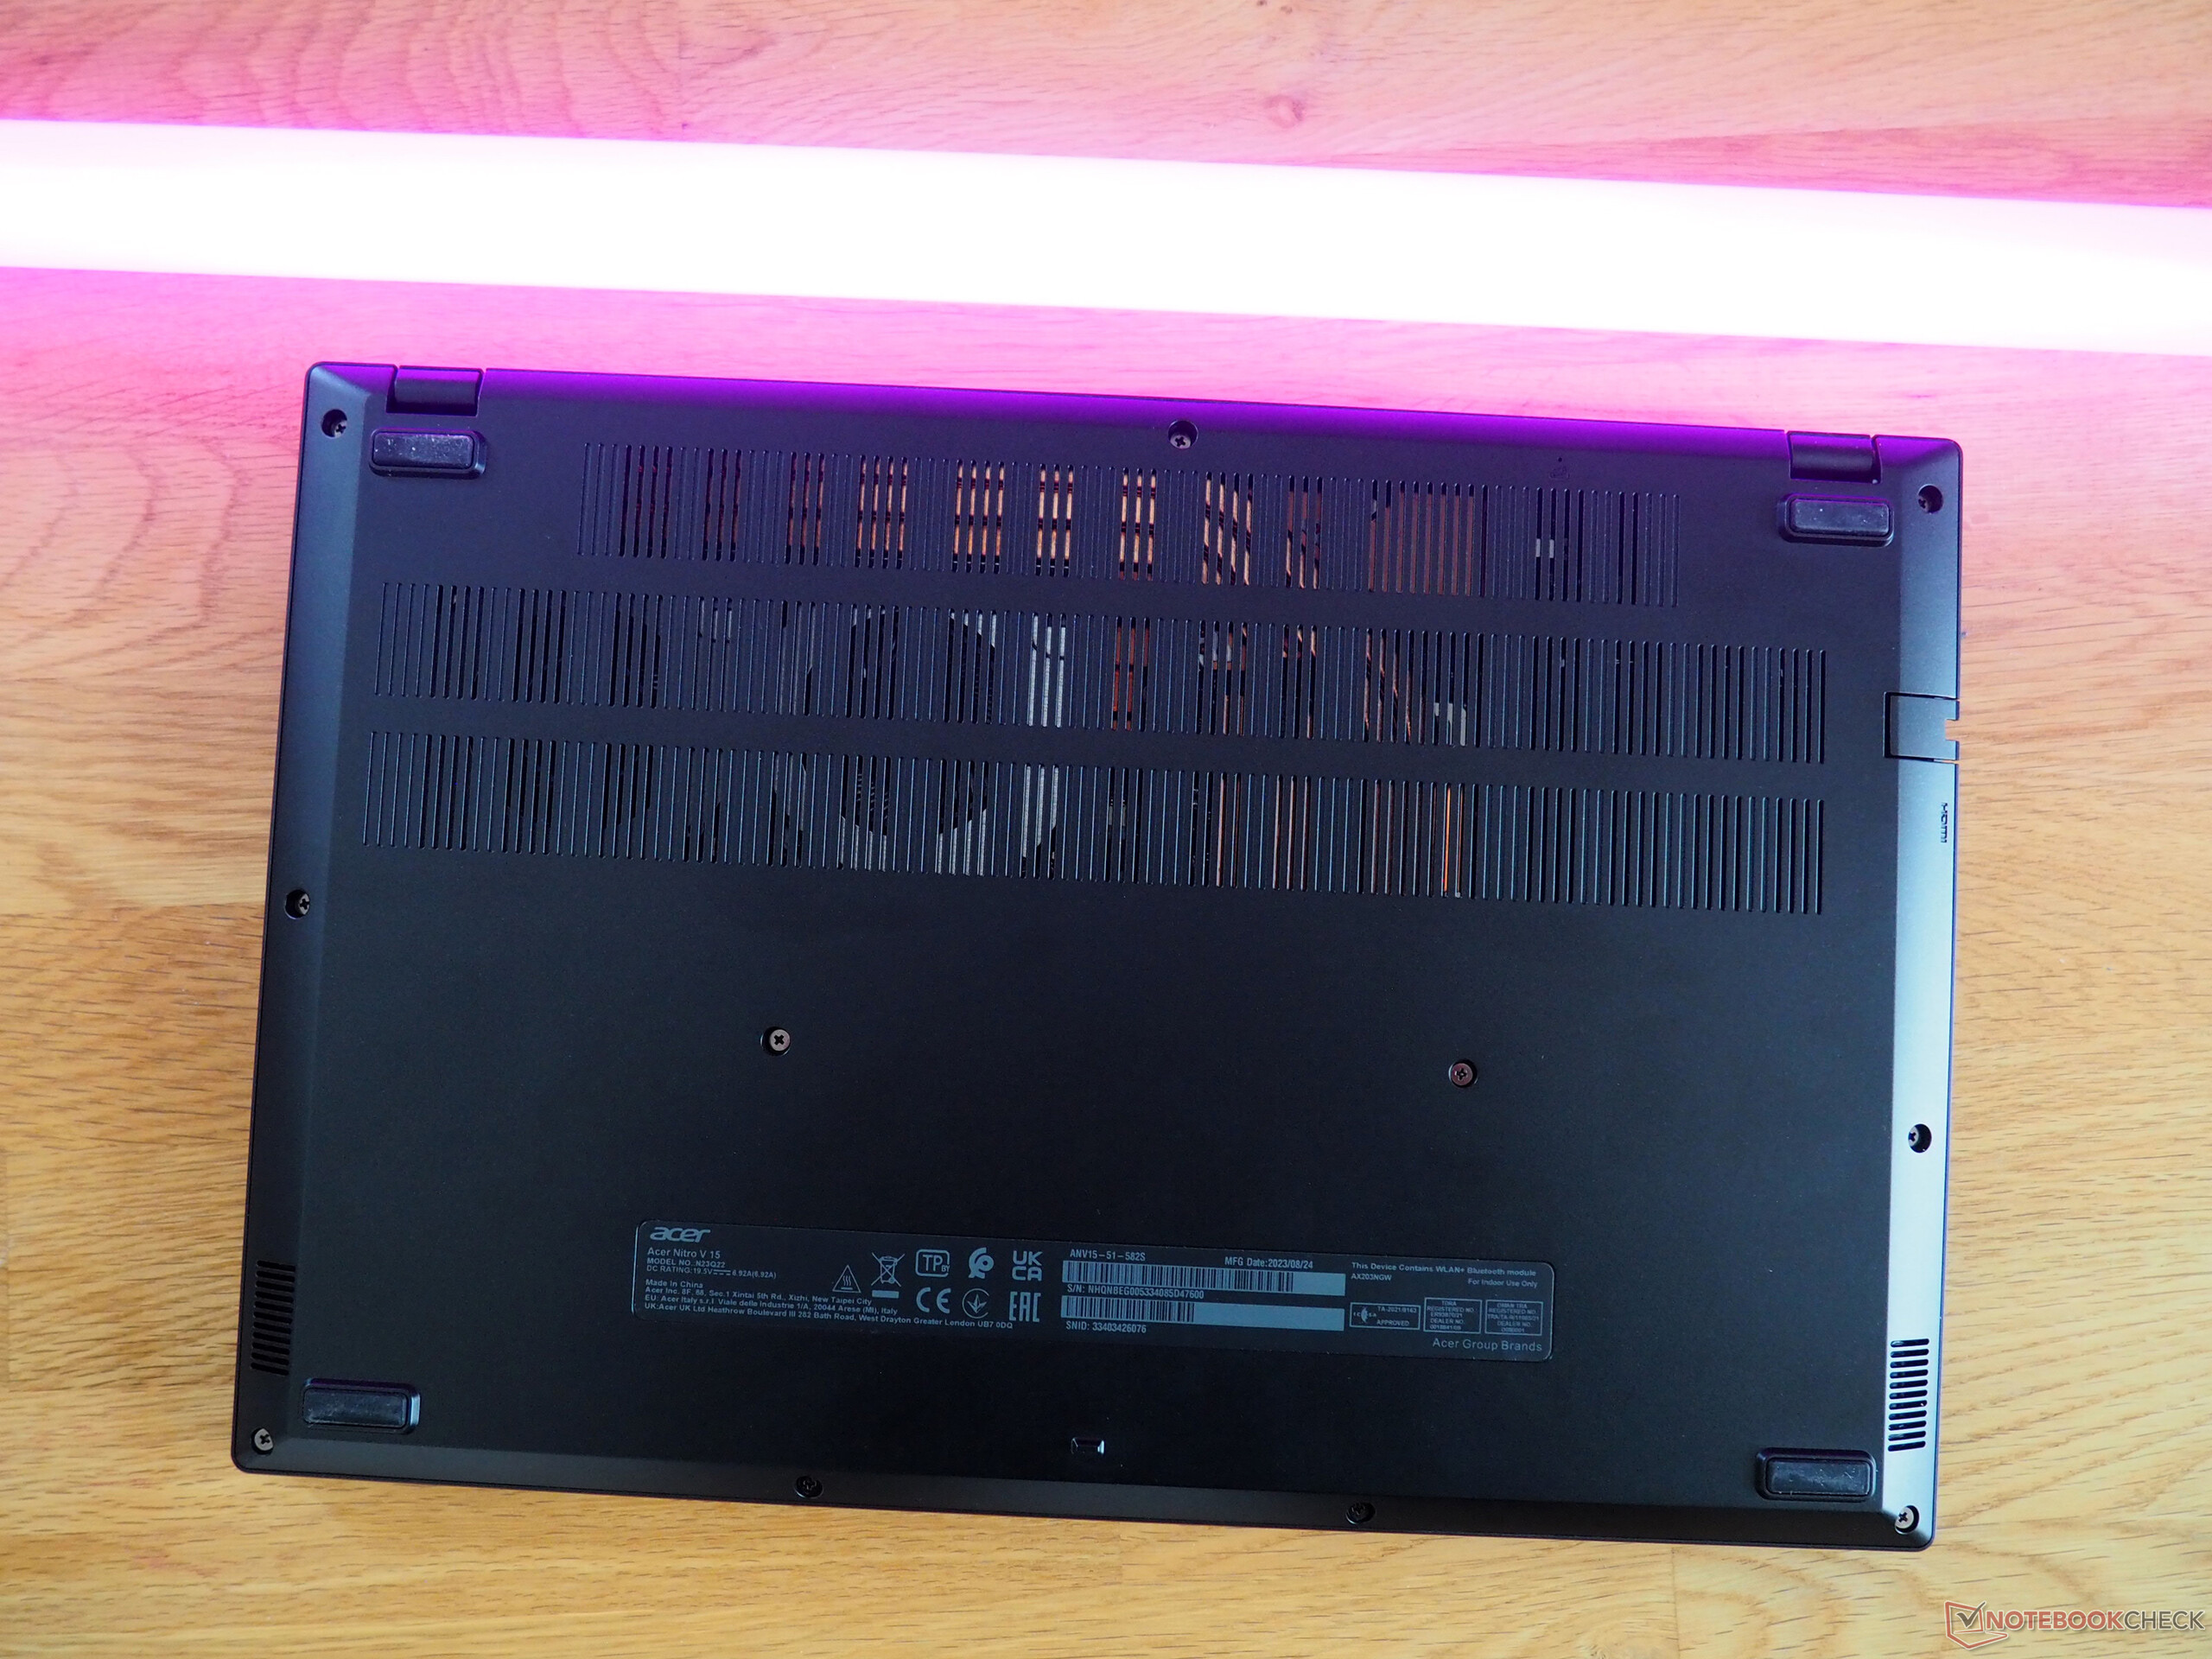
Manutenção
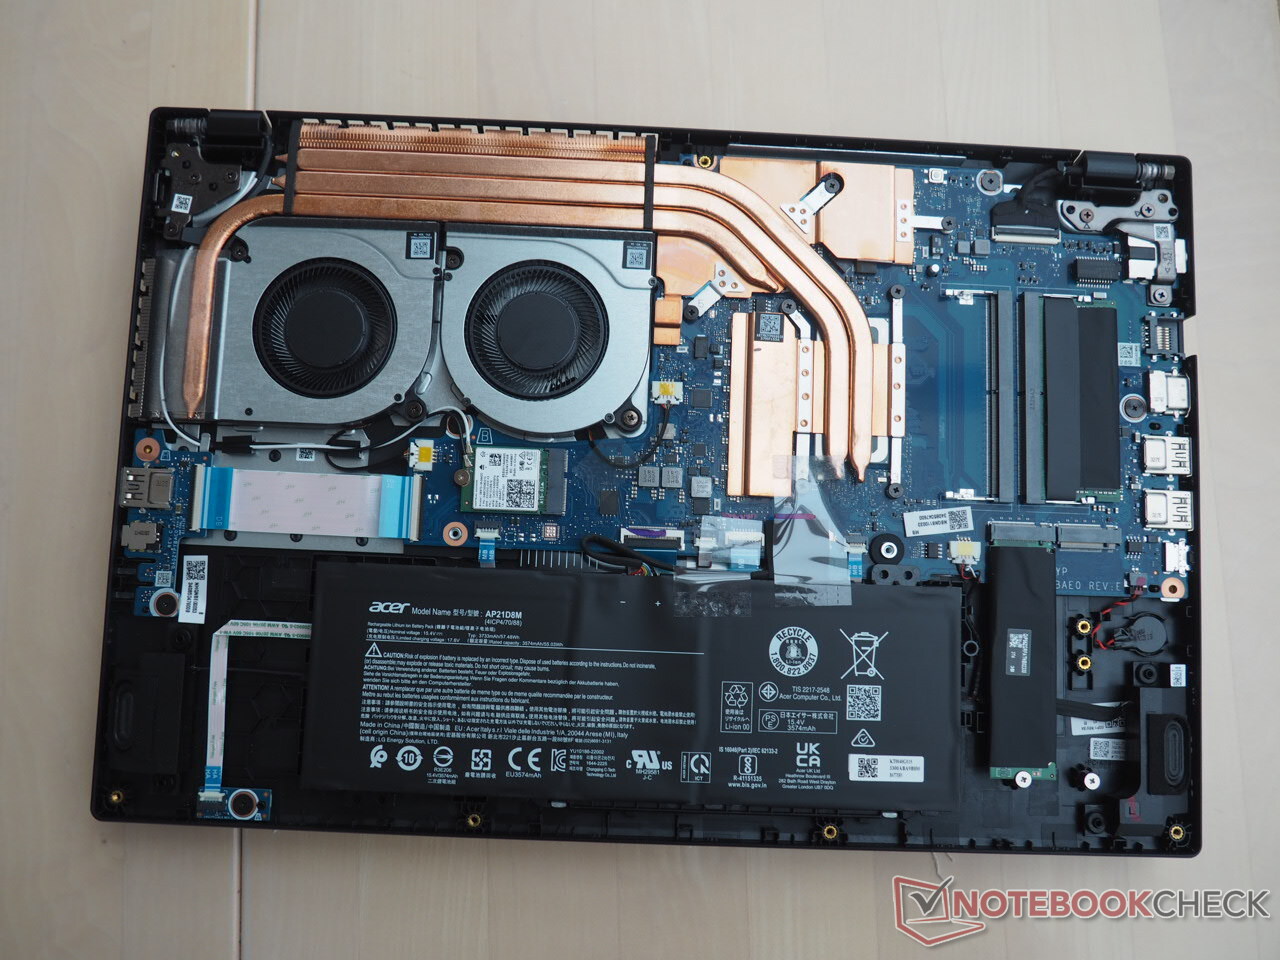
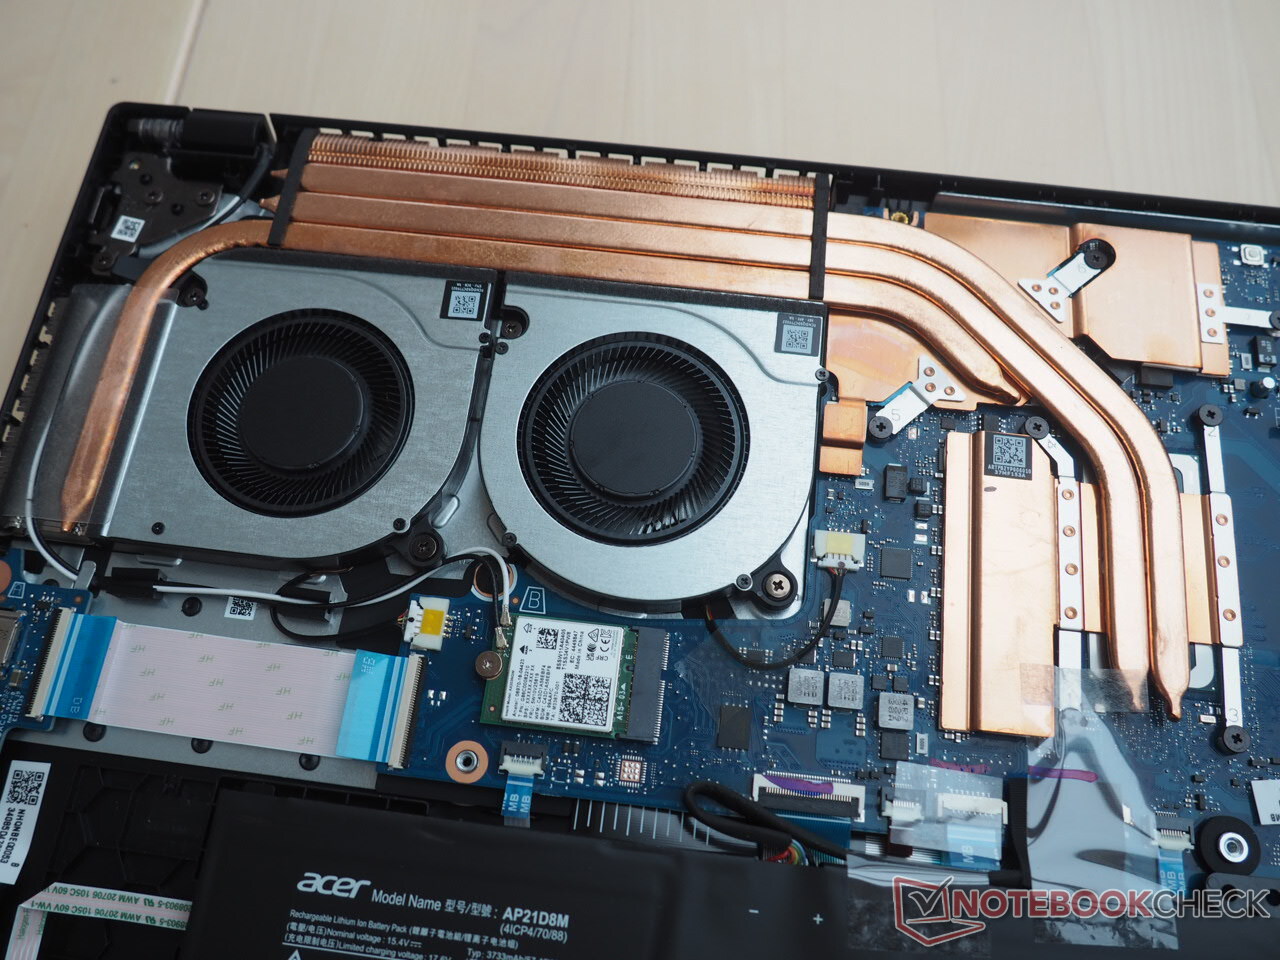
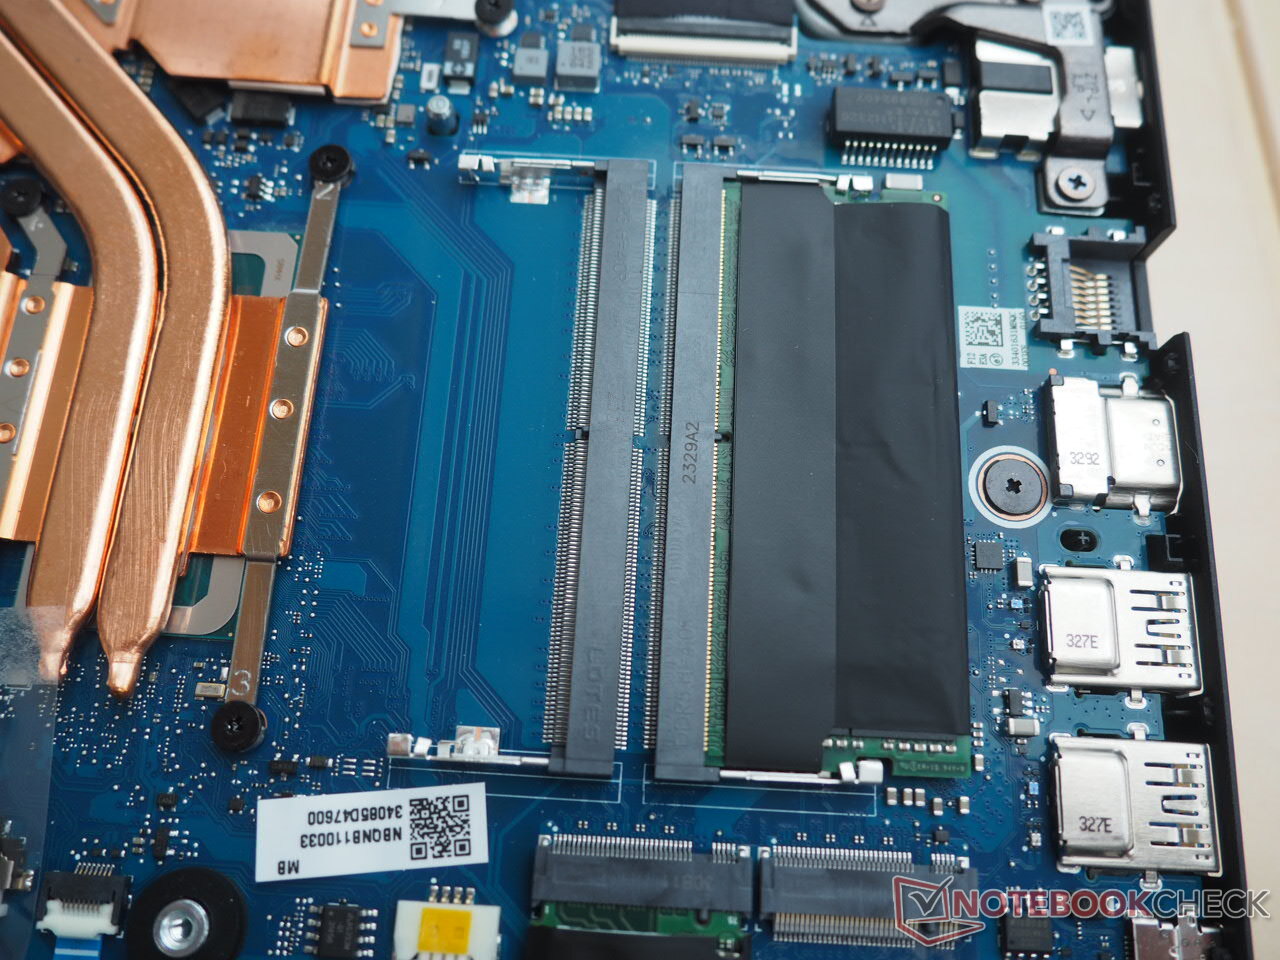
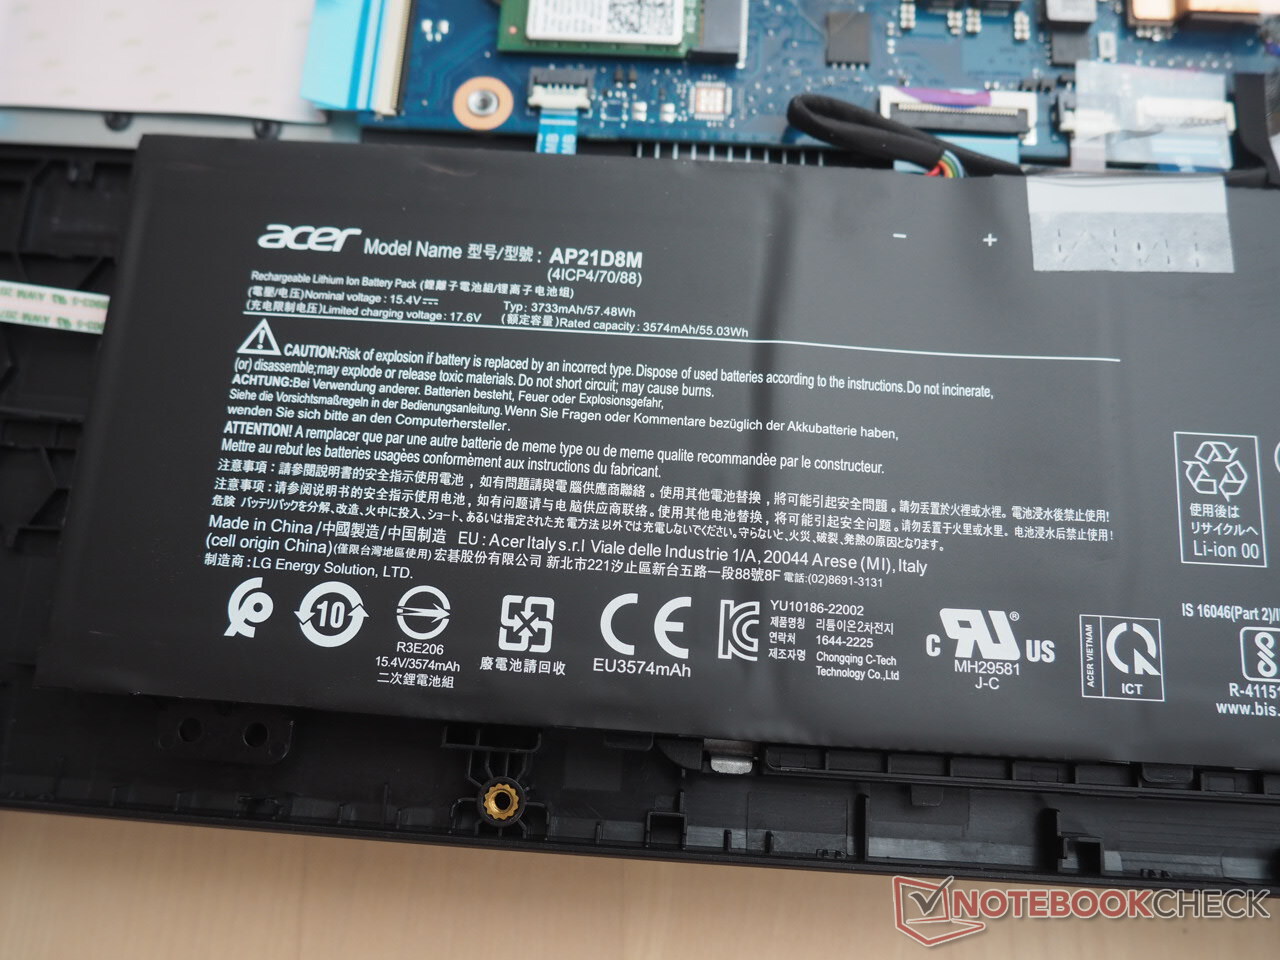
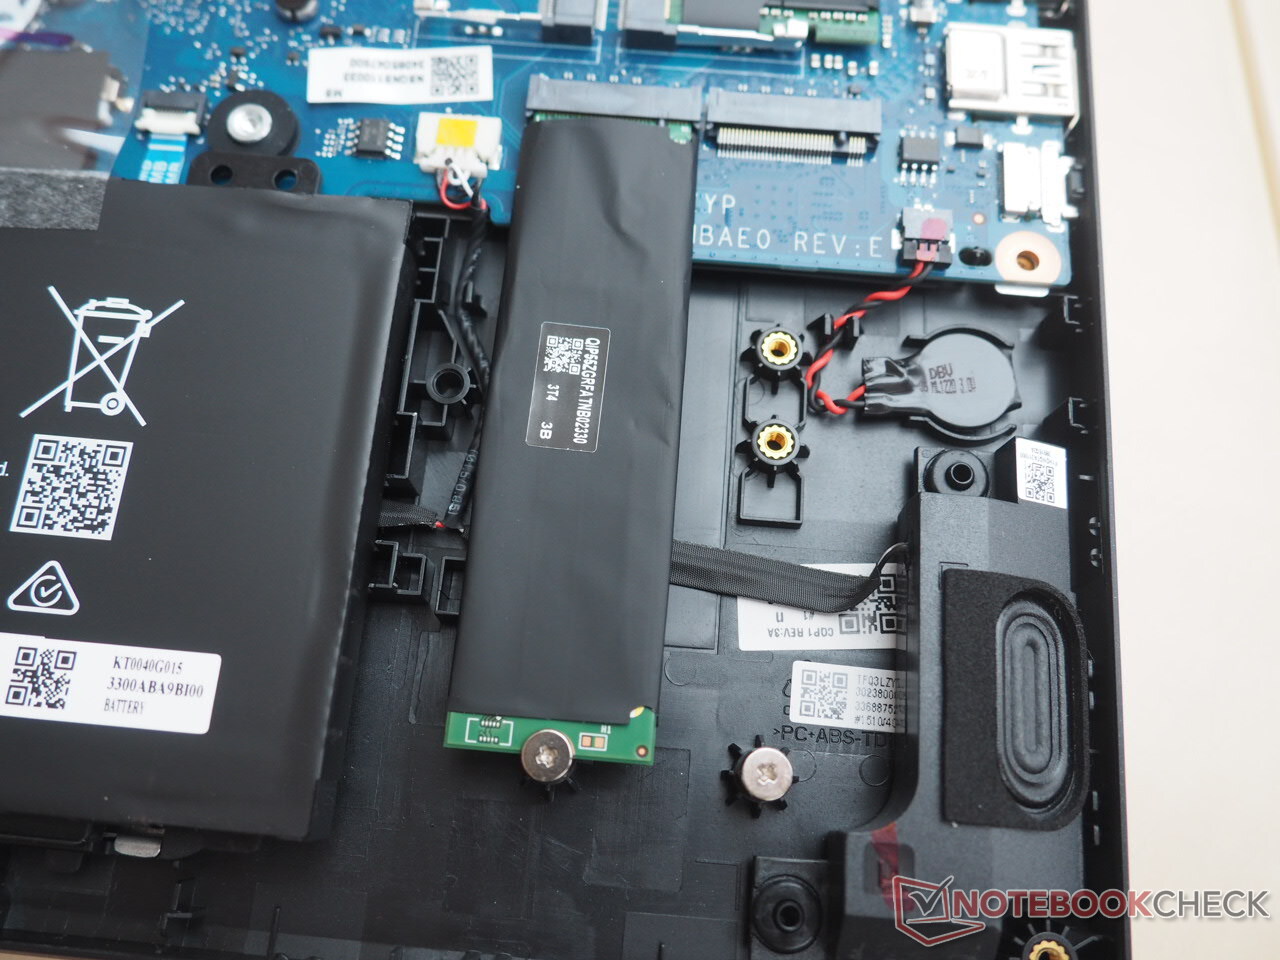
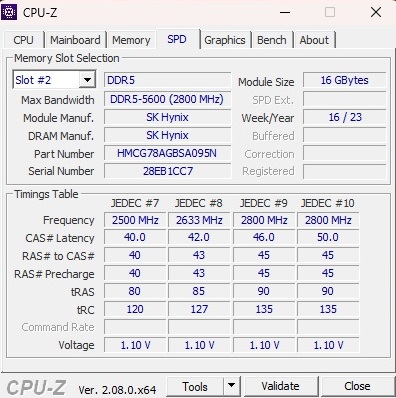
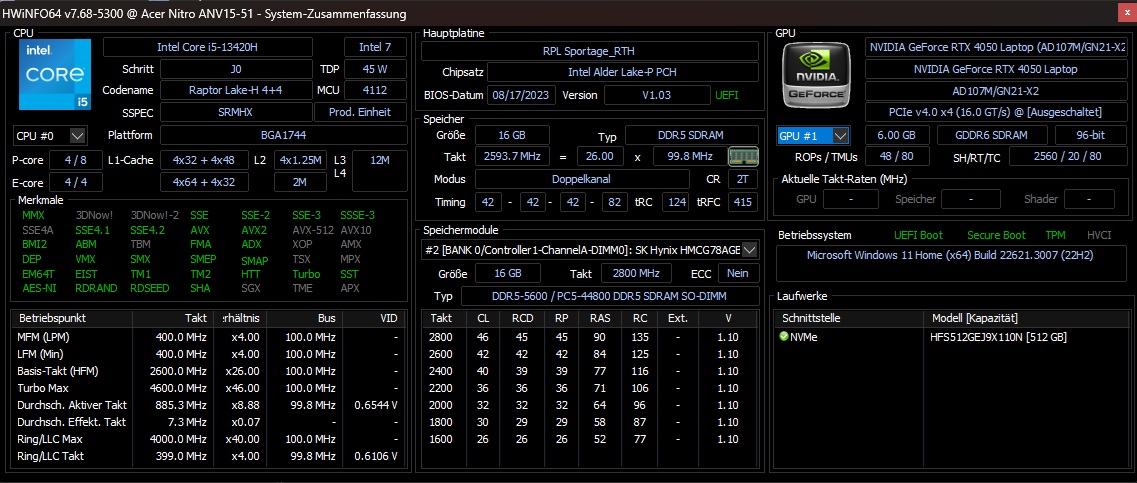
Uma vantagem do Nitro é a facilidade de manutenção. Apesar de a tampa inferior ser mantida com bastante firmeza, mesmo após a remoção dos onze parafusos do gabinete, ao entrar no laptop de 15 polegadas, o senhor terá acesso a um slot M.2 livre e a um slot de RAM vazio (veja as fotos). No entanto, a configuração de RAM única em nossa unidade de análise pode afetar negativamente o desempenho em algumas situações. Um aspecto a ser observado: a bateria não é parafusada e, teoricamente, pode cair do chassi quando o senhor abrir o laptop.
Garantia
A Acer oferece uma garantia de dois anos para o Nitro V 15 na Alemanha. No entanto, o período de garantia pode variar dependendo da região.
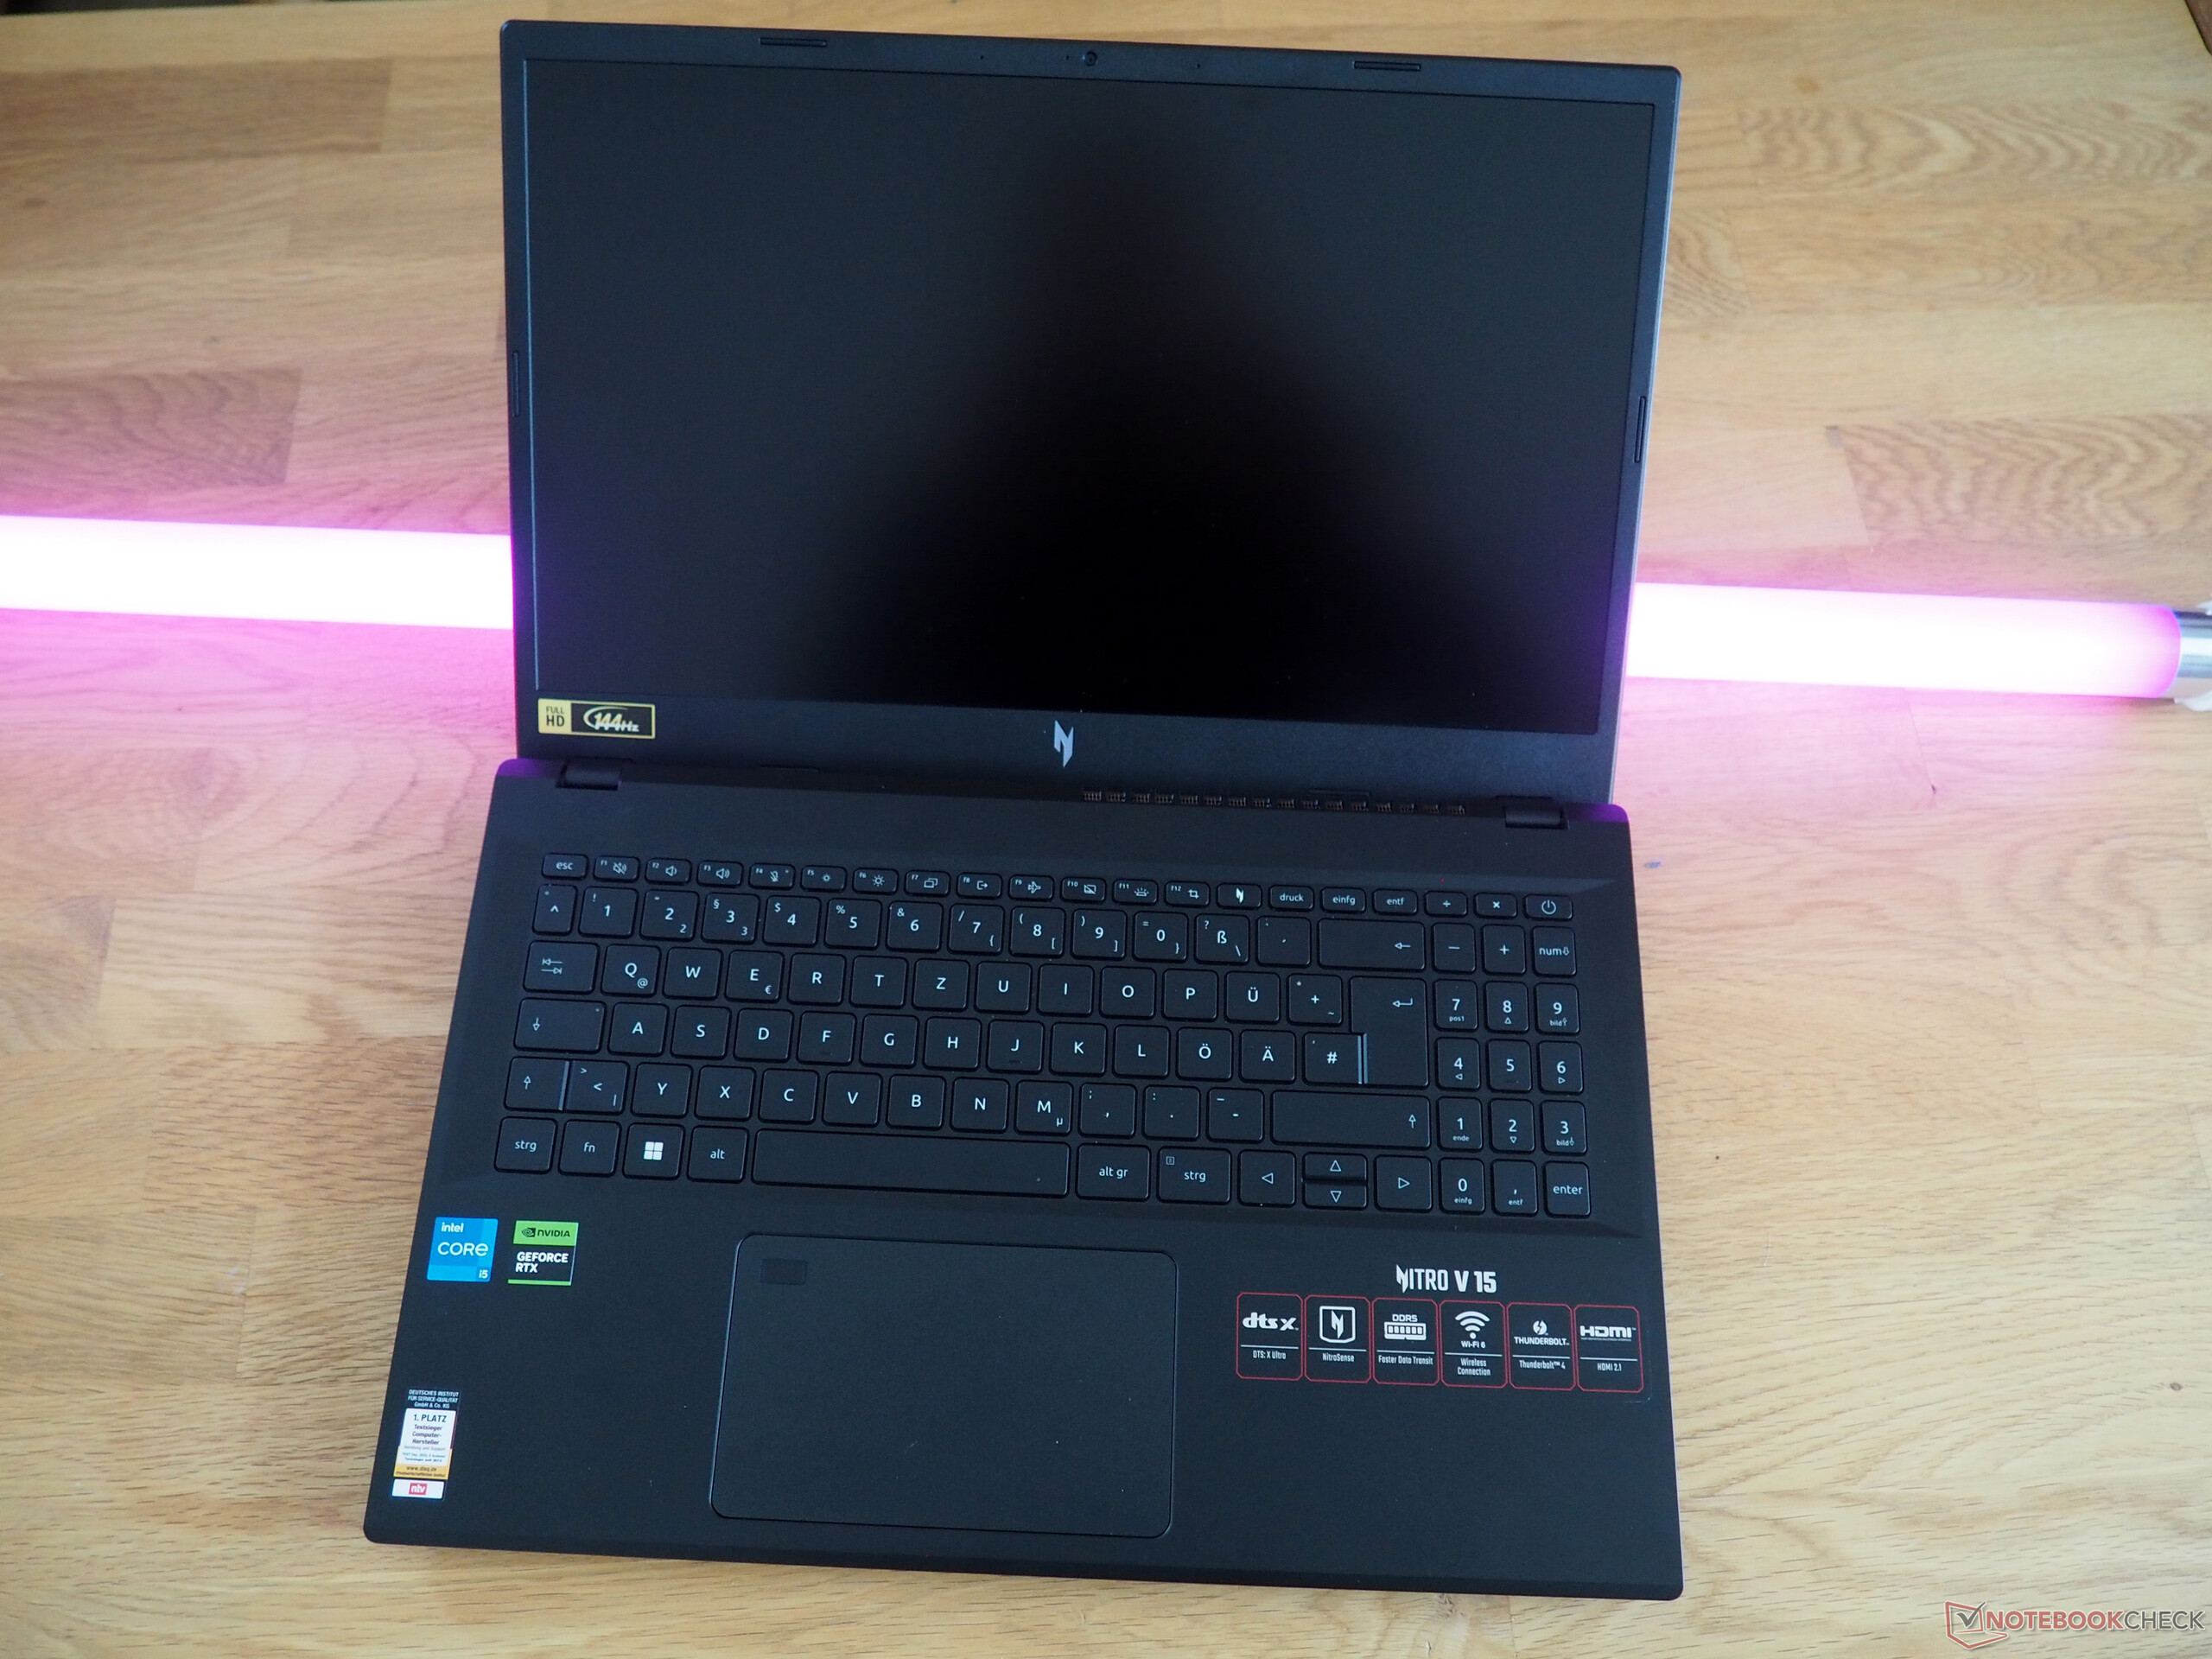
Dispositivos de entrada
Teclado
Os dispositivos de entrada não são ruins nem excelentes. Semelhante à maioria dos laptops com teclados convencionais, a digitação no Nitro parece um pouco mole devido à falta de feedback tátil. A Acer também poderia ter feito melhor com o layout. Por exemplo, há espaço suficiente para um teclado numérico padrão de quatro colunas em vez de um de três colunas. Da mesma forma, é uma pena que as teclas de seta não sejam ótimas e sejam pouco adequadas para jogos e que o botão liga/desliga não esteja localizado separadamente. O fato de as teclas de função serem quase insignificantes também não ajuda. Os aspectos positivos que merecem ser mencionados incluem a luz de fundo branca com brilho ajustável e o botão dedicado para abrir o software de ajuste (NitroSense).
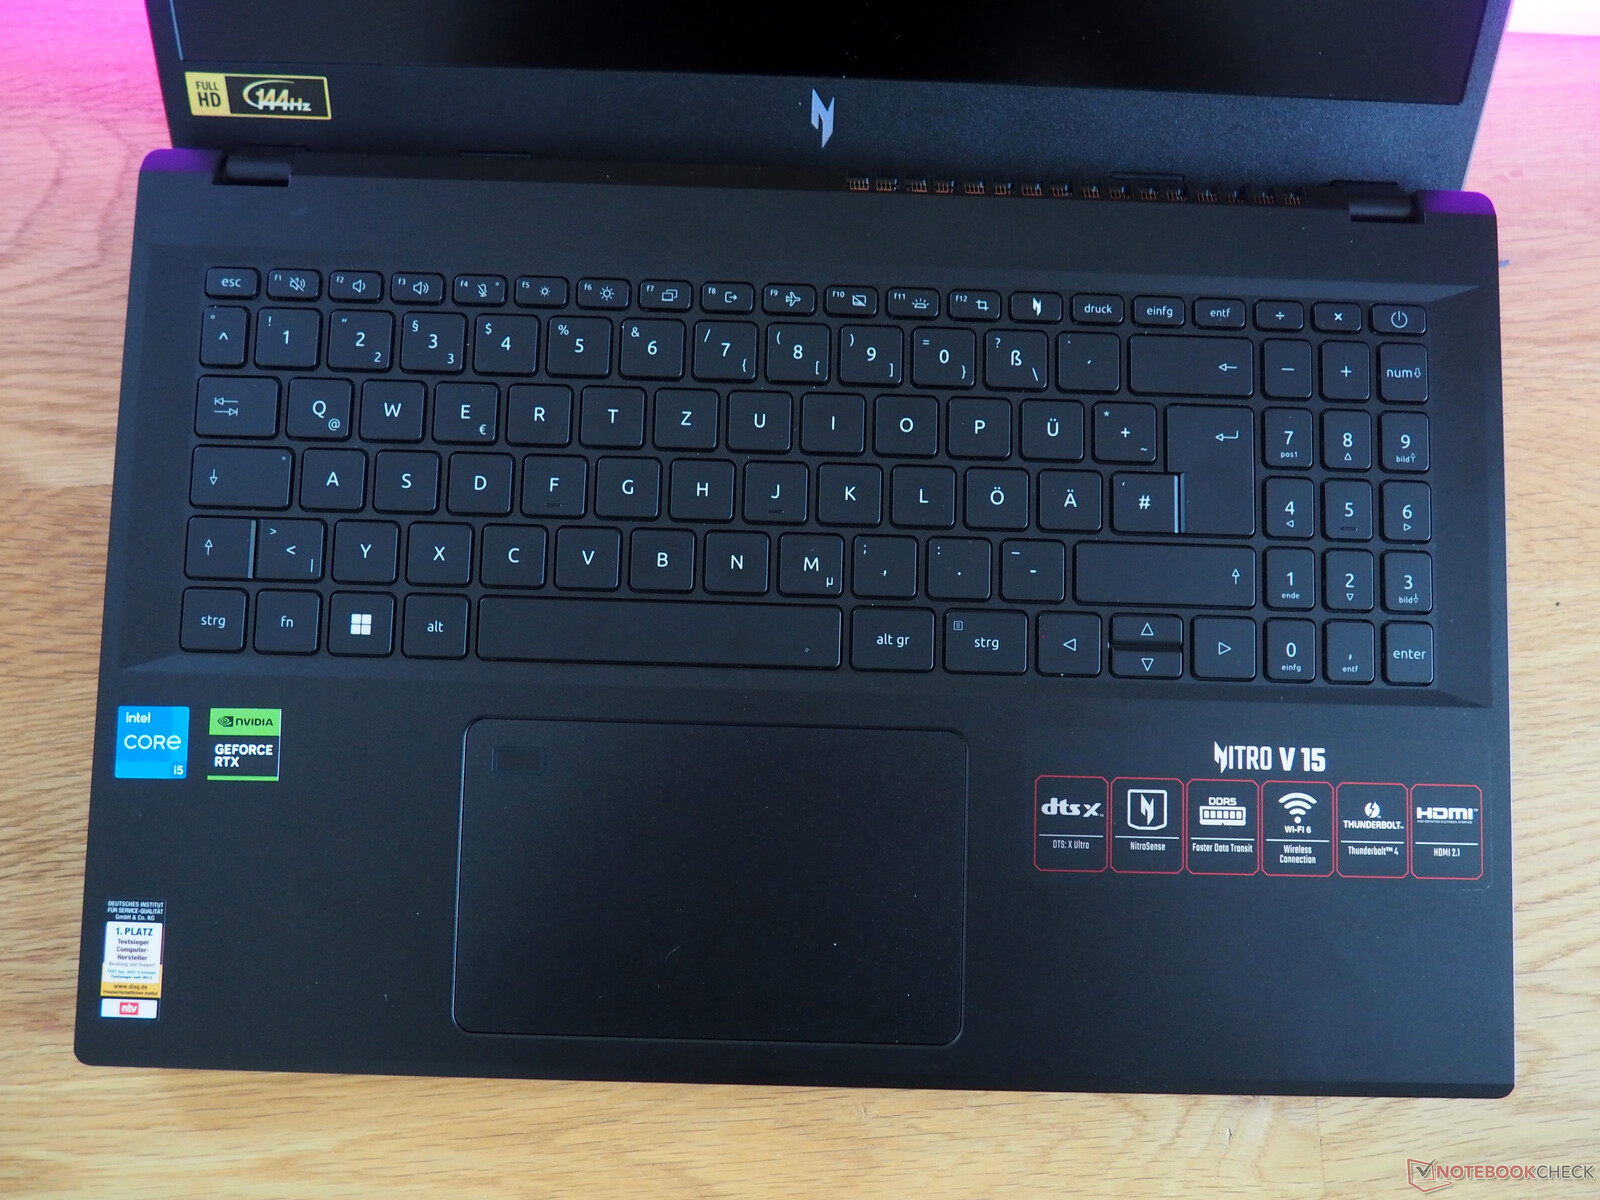
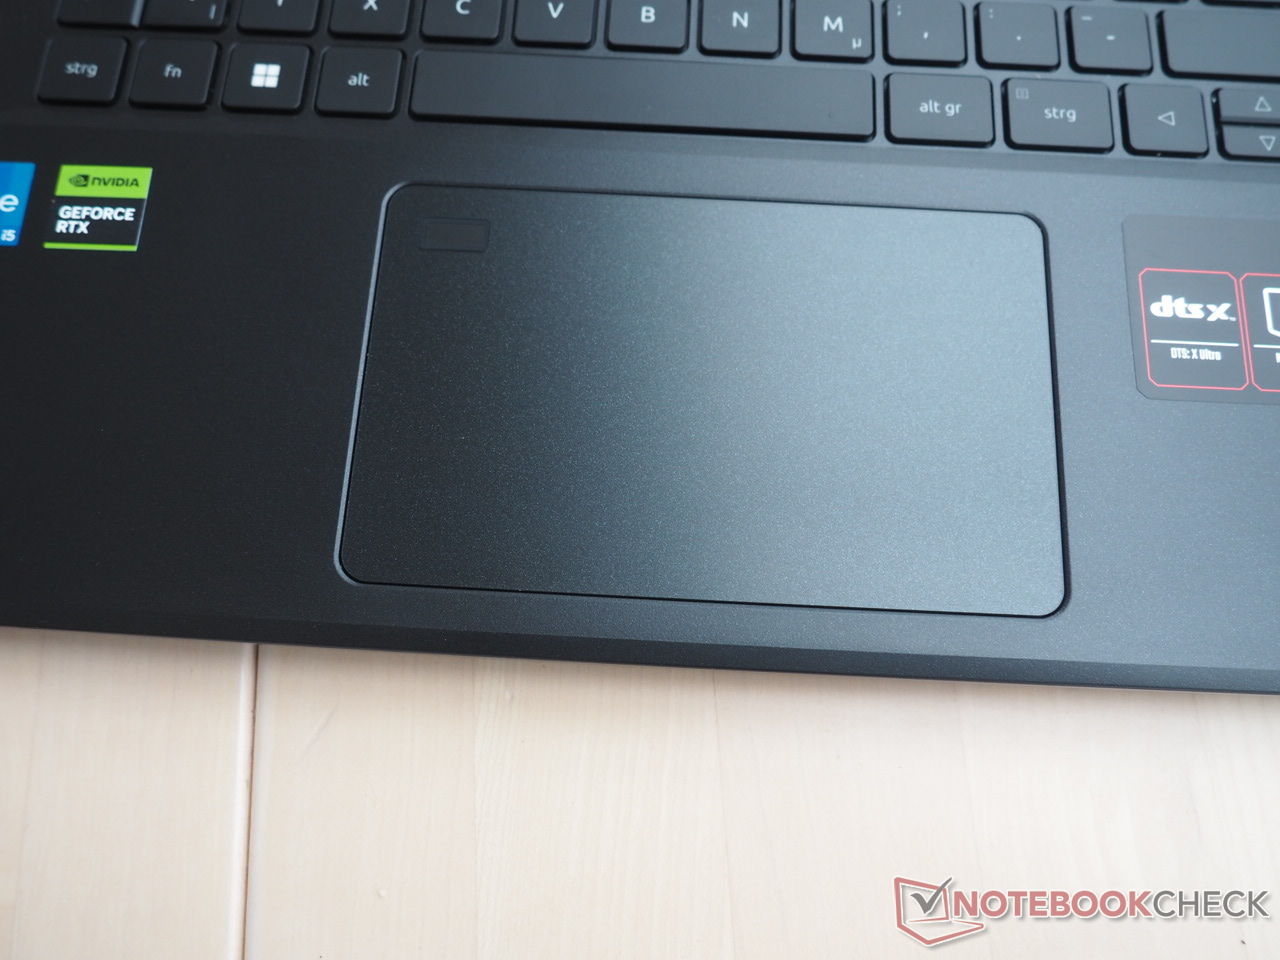
Touchpad
O touchpad se destaca principalmente pelo scanner de impressão digital embutido no canto superior esquerdo. O substituto do mouse é mediano em termos de qualidade. O nível de precisão e suavidade é razoável, mas não chega a ser surpreendente. A situação é semelhante com o suporte multitoque e a sensação das superfícies de clique. Dependendo da força com que o senhor pressiona o touchpad, ele infelizmente tem uma tendência a chacoalhar.
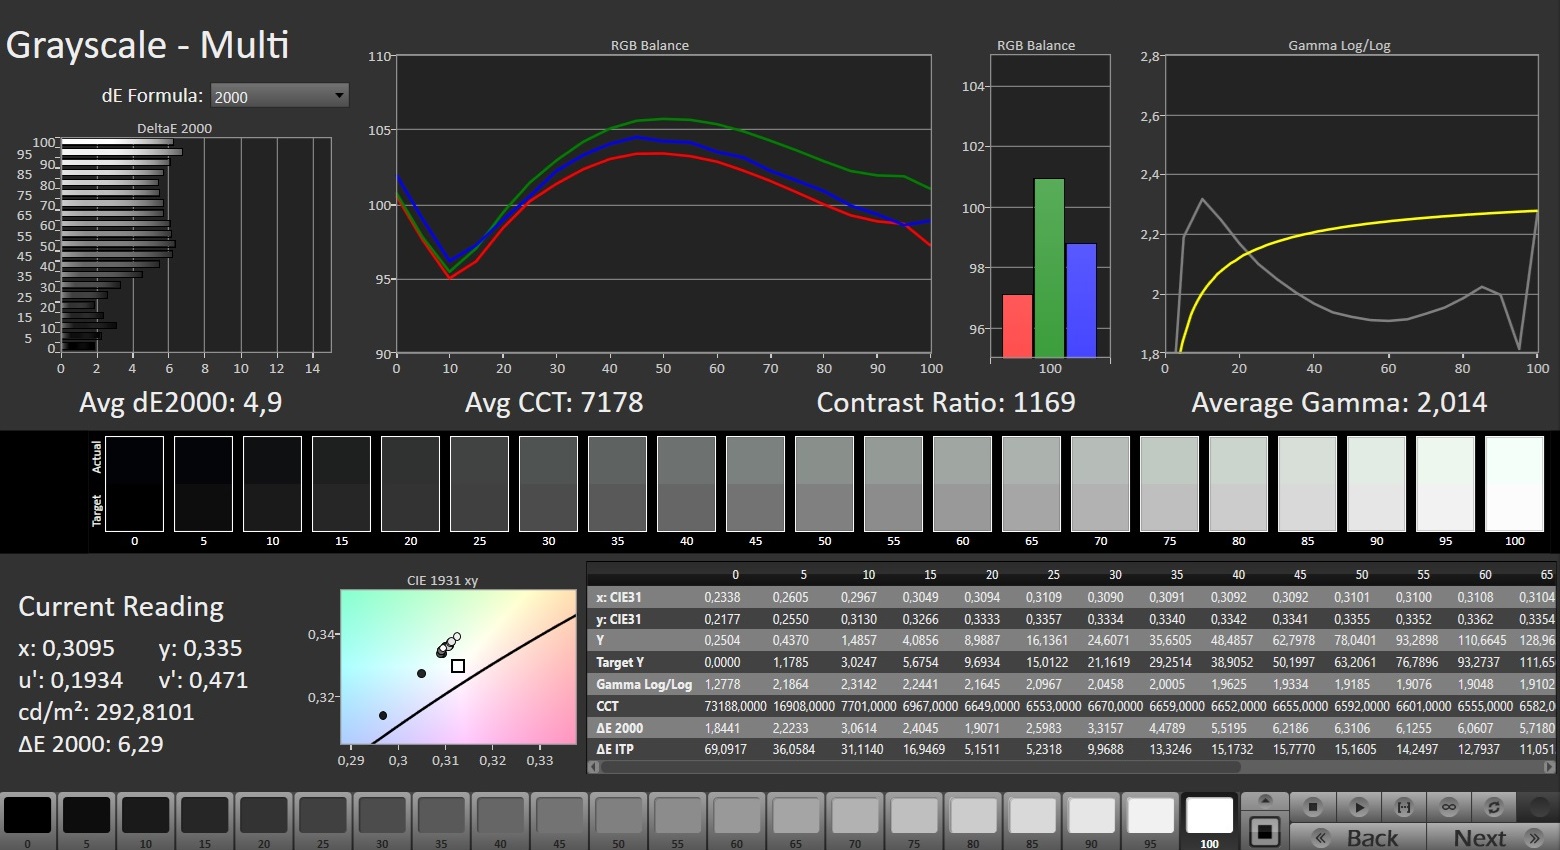
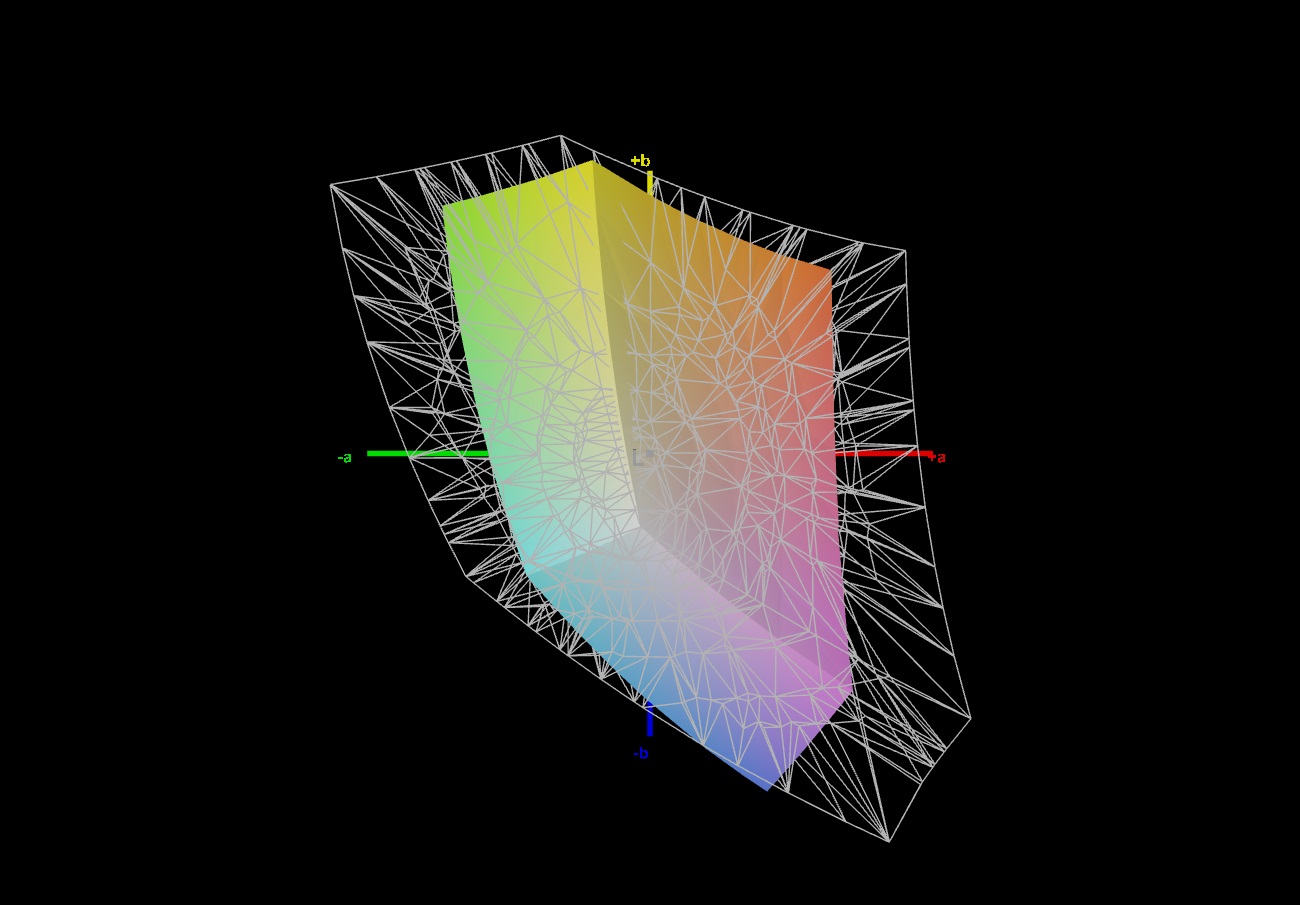
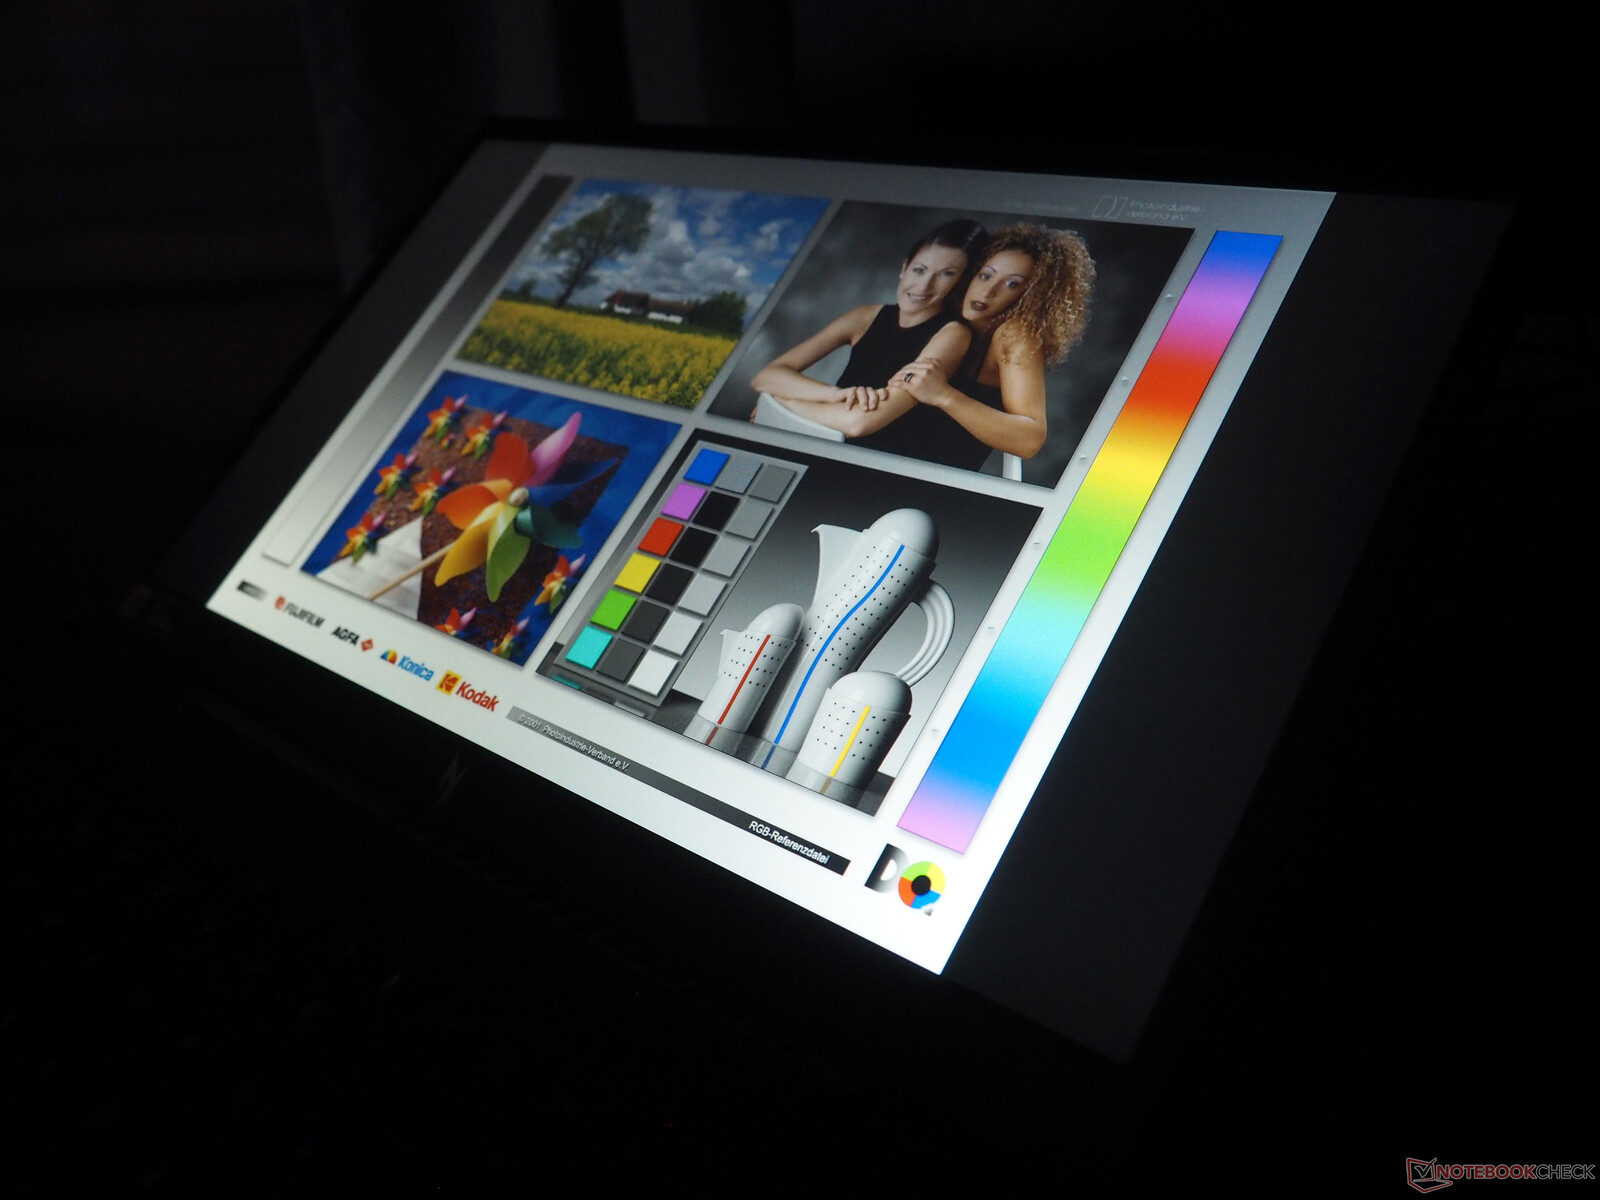
Tela
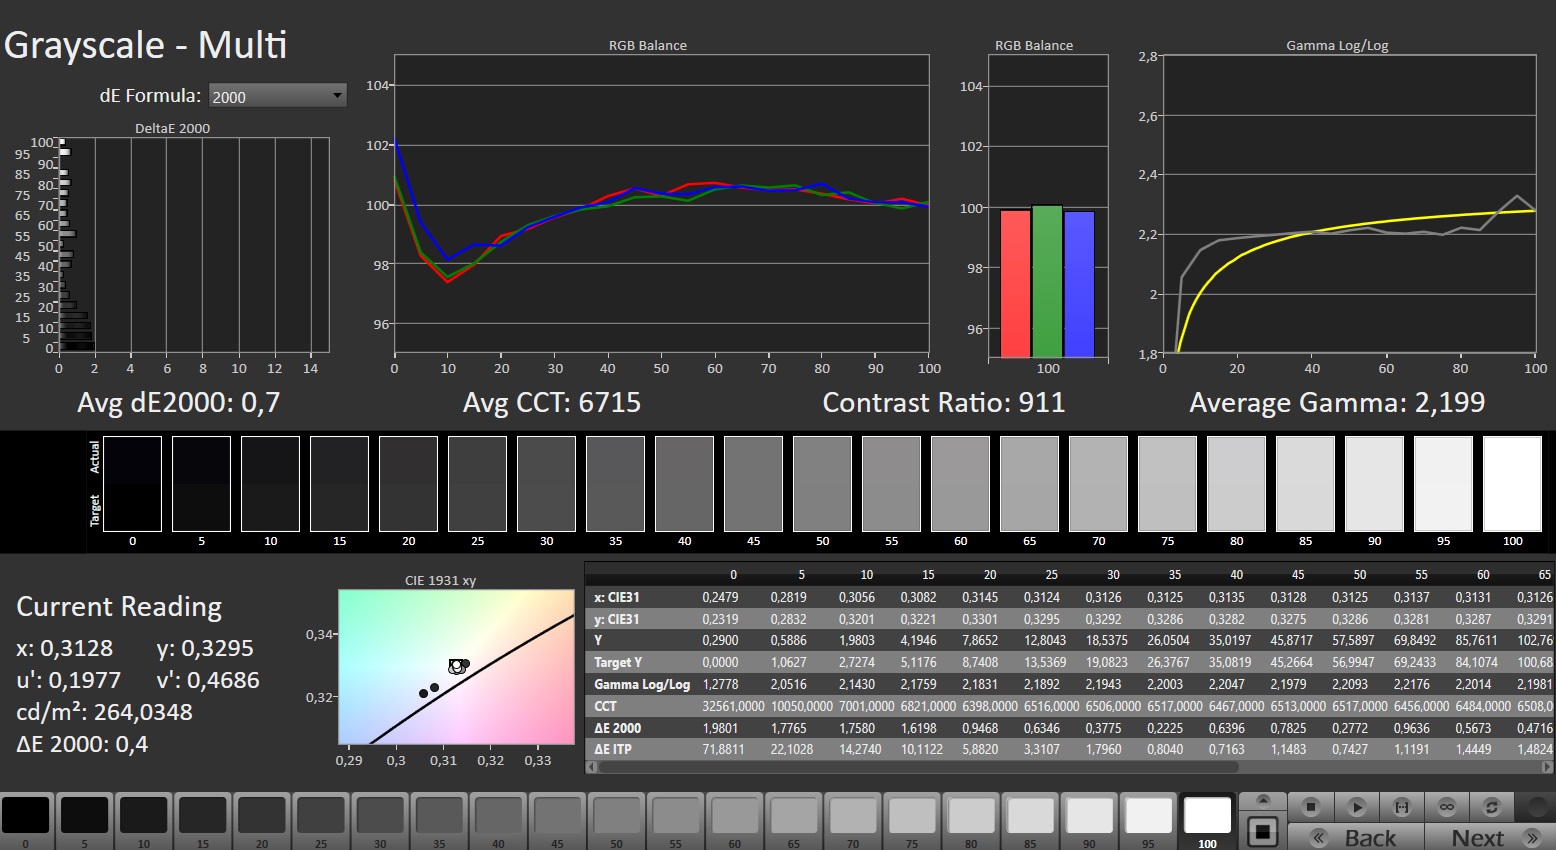
A tela de baixa qualidade do Nitro V 15 é um de seus maiores pontos fracos. À primeira vista, os resultados obtidos não parecem muito decepcionantes: o nível de preto de 0,25 cd/m² e a relação de contraste de 1168:1 são similares ao que o senhor pode obter dos concorrentes ou de um painel IPS típico. Isso também se aplica ao ângulo de visão.
| |||||||||||||||||||||||||
iluminação: 80 %
iluminação com acumulador: 292 cd/m²
Contraste: 1168:1 (Preto: 0.25 cd/m²)
ΔE ColorChecker Calman: 7.15 | ∀{0.5-29.43 Ø4.73}
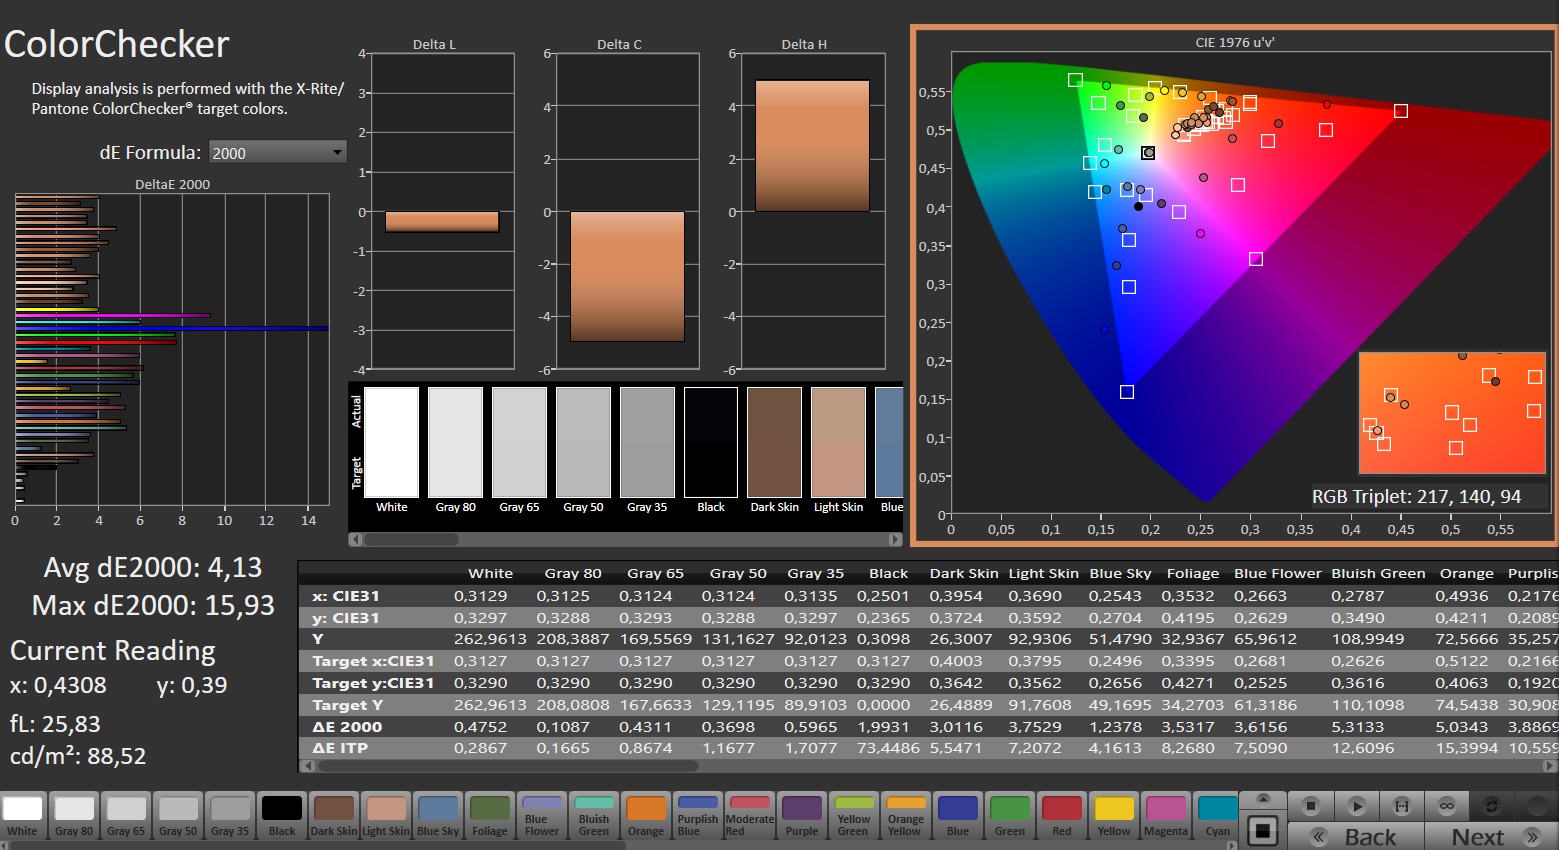
calibrated: 4.13
ΔE Greyscale Calman: 4.9 | ∀{0.09-98 Ø4.97}
41.4% AdobeRGB 1998 (Argyll 3D)
60% sRGB (Argyll 3D)
40% Display P3 (Argyll 3D)
Gamma: 2.014
CCT: 7178 K
| Acer Nitro V 15 ANV15-51-582S LG LP156WFJ-SPB4 (LGD0742), IPS, 1920x1080, 15.6" | Medion Erazer Crawler E40 - MD 62518 BOE HF NV156FHM-N4G, IPS, 1920x1080, 15.6" | Lenovo LOQ 15IRH8 Core i7 BOE CQ NE156QHM-NY4, IPS, 2560x1440, 15.6" | Asus TUF A15 FA507 N156HMA-GA1, IPS, 1920x1080, 15.6" | Schenker XMG Apex 15 (Late 23) BOE CQ NE156QHM-NY2, IPS, 2560x1440, 15.6" | |
|---|---|---|---|---|---|
| Display | 52% | 64% | 61% | 66% | |
| Display P3 Coverage (%) | 40 | 61.4 54% | 66.3 66% | 64.9 62% | 67.5 69% |
| sRGB Coverage (%) | 60 | 89.7 50% | 96.6 61% | 96.5 61% | 97.6 63% |
| AdobeRGB 1998 Coverage (%) | 41.4 | 63.2 53% | 67.7 64% | 66.6 61% | 68.9 66% |
| Response Times | 70% | 76% | 15% | 64% | |
| Response Time Grey 50% / Grey 80% * (ms) | 34.2 ? | 8 ? 77% | 5 ? 85% | 30.4 ? 11% | 13.2 ? 61% |
| Response Time Black / White * (ms) | 25.8 ? | 9.6 ? 63% | 8.41 ? 67% | 20.8 ? 19% | 8.8 ? 66% |
| PWM Frequency (Hz) | |||||
| Screen | 17% | 23% | 41% | 24% | |
| Brightness middle (cd/m²) | 292 | 364 25% | 373 28% | 288 -1% | 336 15% |
| Brightness (cd/m²) | 263 | 351 33% | 365 39% | 271 3% | 307 17% |
| Brightness Distribution (%) | 80 | 91 14% | 90 13% | 91 14% | 77 -4% |
| Black Level * (cd/m²) | 0.25 | 0.43 -72% | 0.33 -32% | 0.17 32% | 0.38 -52% |
| Contrast (:1) | 1168 | 847 -27% | 1130 -3% | 1694 45% | 884 -24% |
| Colorchecker dE 2000 * | 7.15 | 3.98 44% | 4.19 41% | 1.9 73% | 1.96 73% |
| Colorchecker dE 2000 max. * | 15.51 | 6.38 59% | 8.47 45% | 3.3 79% | 5.07 67% |
| Colorchecker dE 2000 calibrated * | 4.13 | 1.36 67% | 1.07 74% | 0.9 78% | 1.27 69% |
| Greyscale dE 2000 * | 4.9 | 4.39 10% | 5 -2% | 2.7 45% | 2.3 53% |
| Gamma | 2.014 109% | 2.58 85% | 1.93 114% | 2.32 95% | 2.017 109% |
| CCT | 7178 91% | 7316 89% | 7520 86% | 6535 99% | 6644 98% |
| Média Total (Programa/Configurações) | 46% /
32% | 54% /
39% | 39% /
42% | 51% /
39% |
* ... menor é melhor
Mas o senhor começará a notar algumas deficiências quando olhar mais de perto. Em primeiro lugar, o pico médio de brilho de 263 cd/m² é adequado apenas para uso em ambientes internos; o laptop de 15 polegadas não se sai bem em ambientes externos.
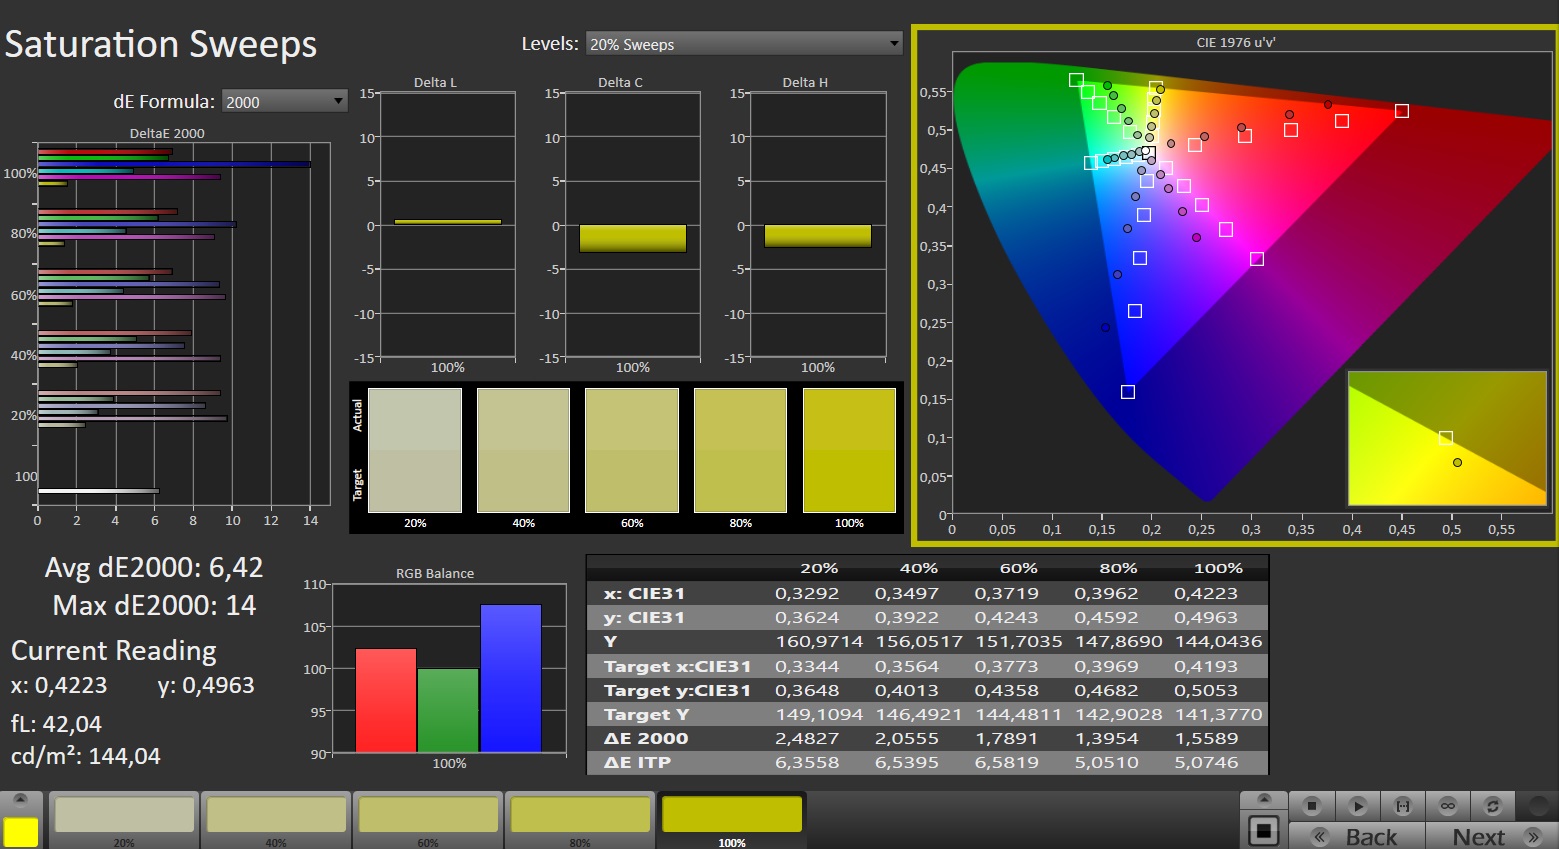
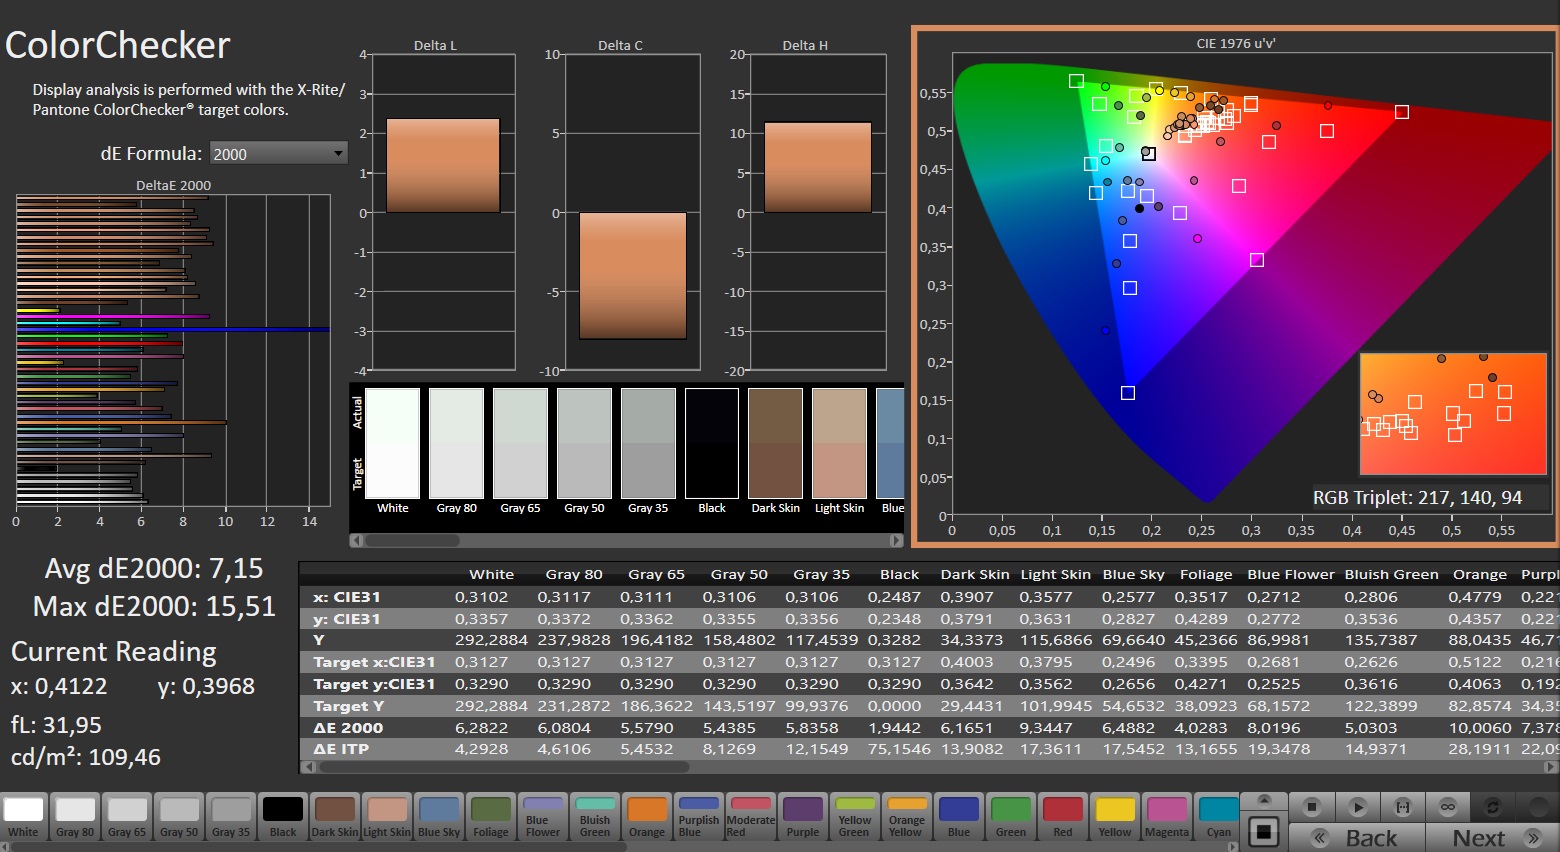
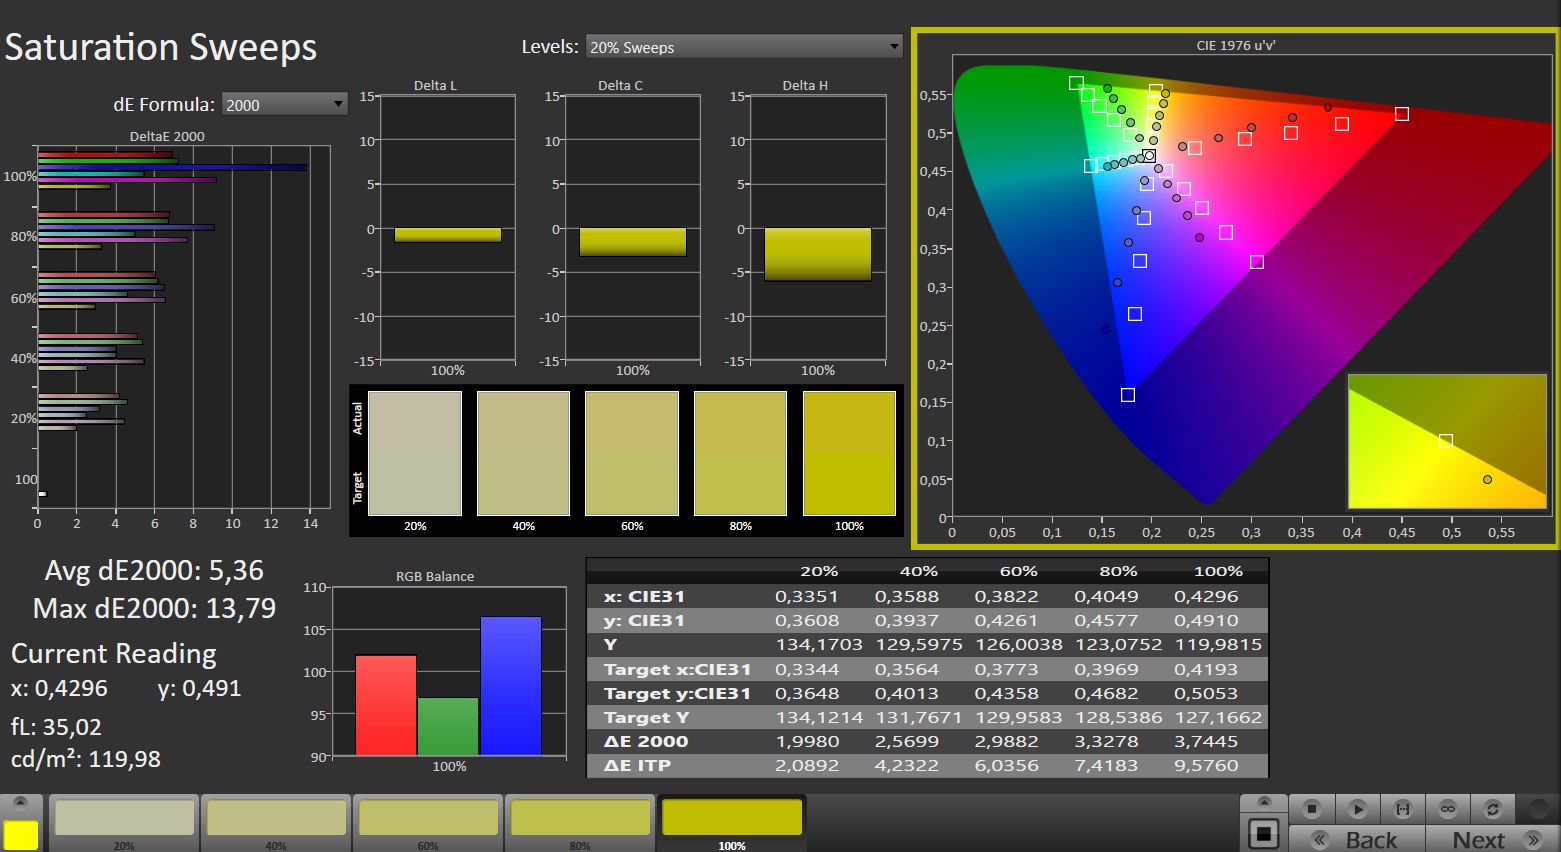
O Nitro V 15 também oferece uma cobertura de cores muito limitada: ter 60% de cobertura sRGB e cerca de 40% de cobertura AdobeRGB e DCI-P3 não será suficiente em 2024, mesmo para um notebook econômico para jogos.
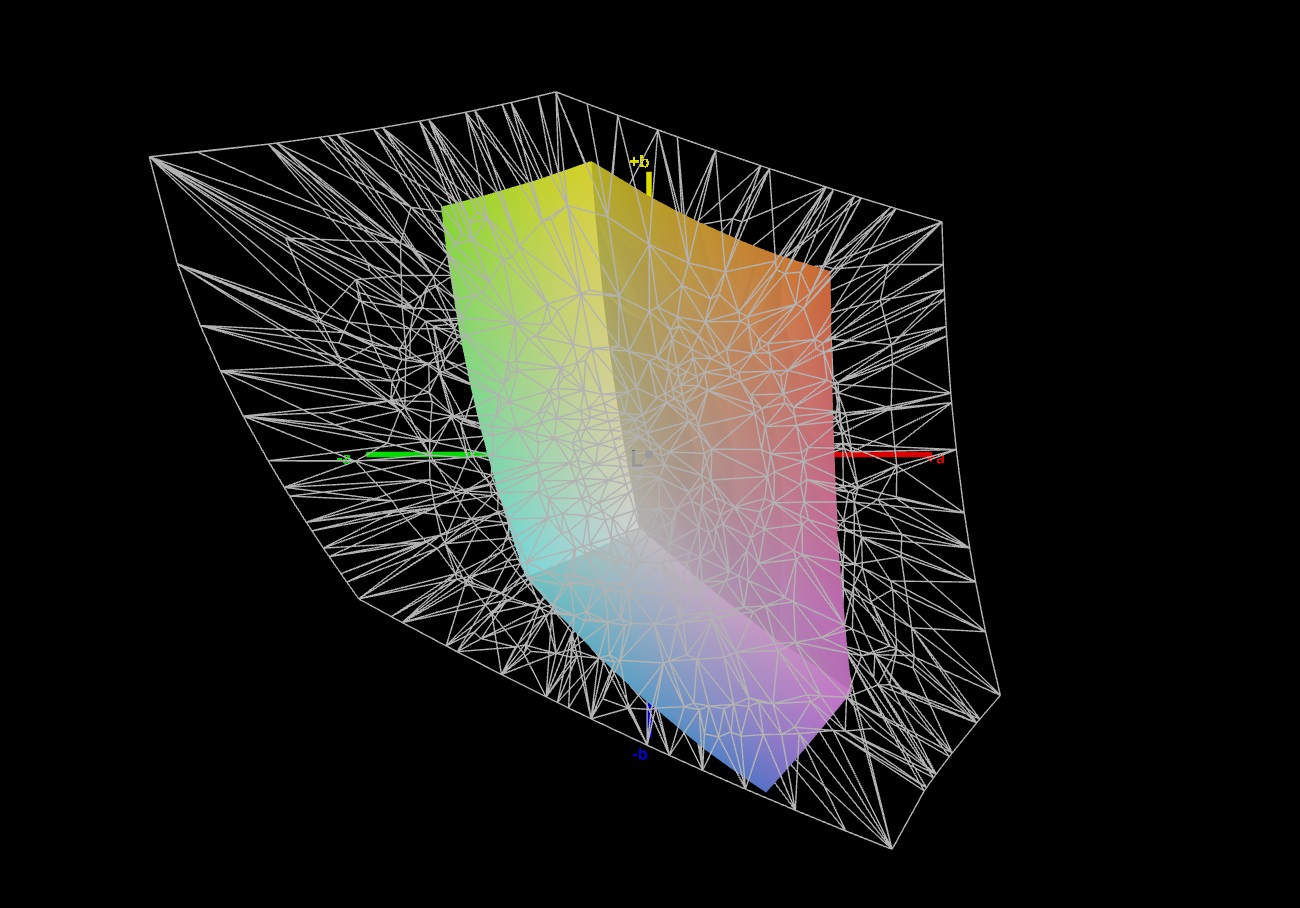
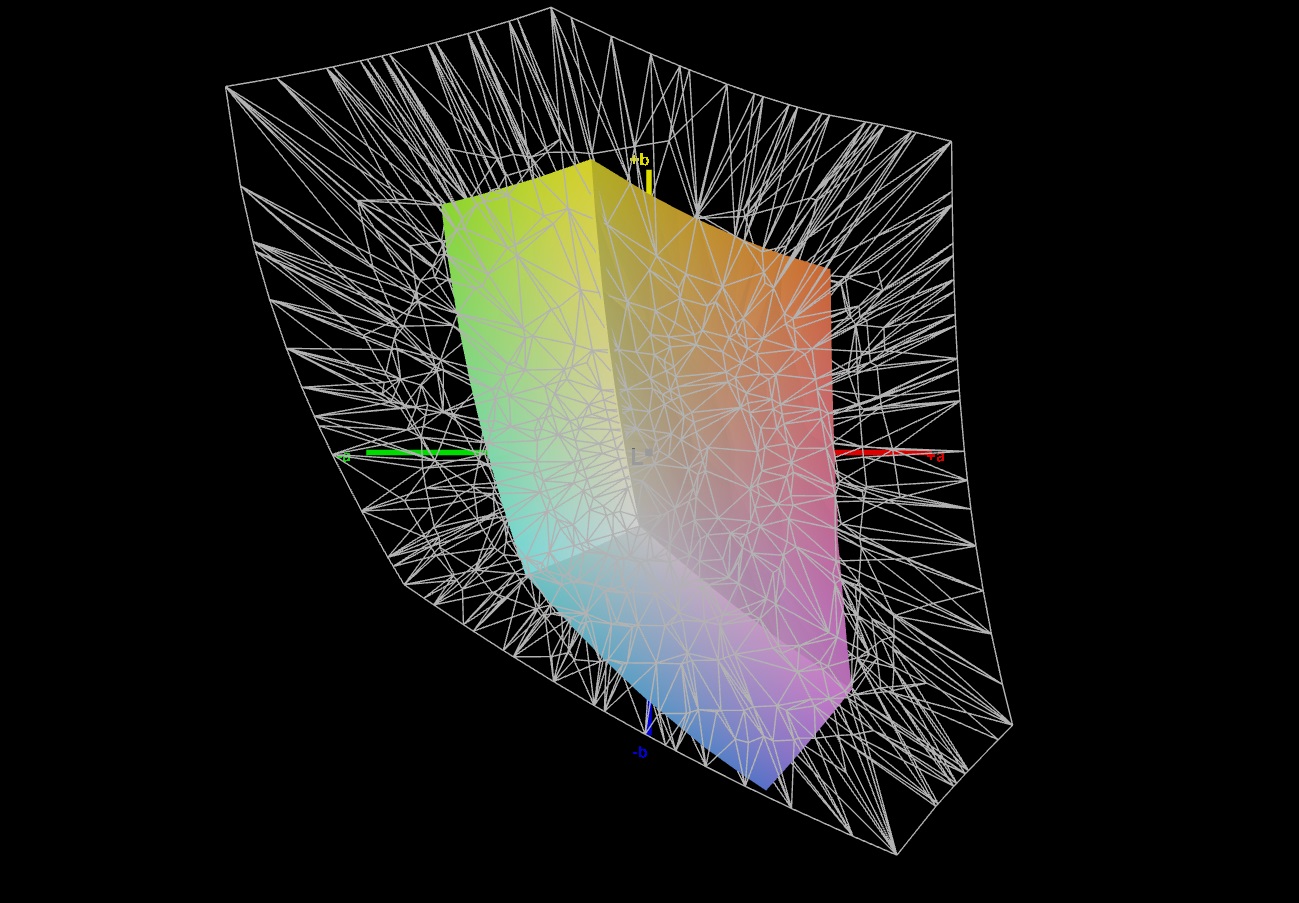
Os concorrentes demonstram como fazer as coisas muito melhor. O Acer Nitro também ficou em último lugar em precisão de cores e tempo de resposta.
Exibir tempos de resposta
| ↔ Tempo de resposta preto para branco | ||
|---|---|---|
| 25.8 ms ... ascensão ↗ e queda ↘ combinadas | ↗ 13.8 ms ascensão | 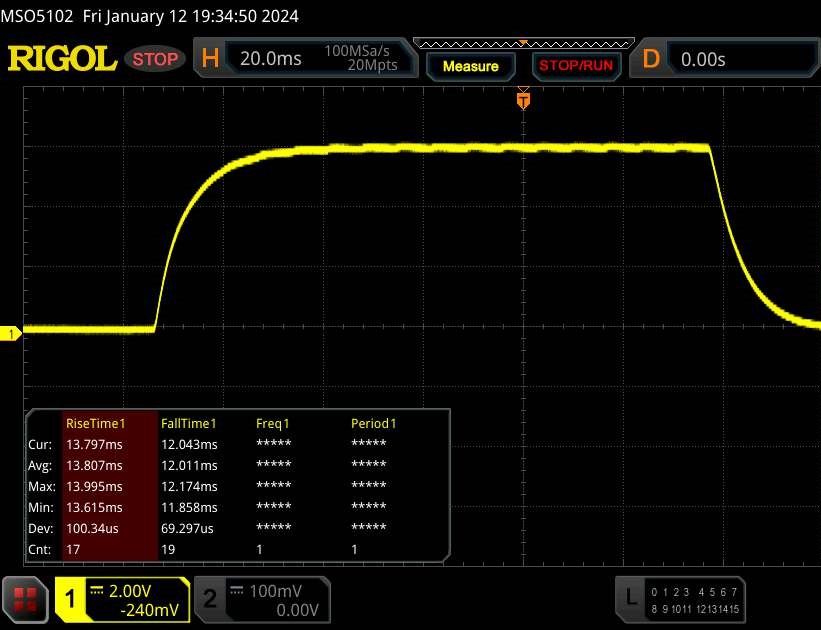 |
| ↘ 12 ms queda | ||
| A tela mostra taxas de resposta relativamente lentas em nossos testes e pode ser muito lenta para os jogadores. Em comparação, todos os dispositivos testados variam de 0.1 (mínimo) a 240 (máximo) ms. » 62 % de todos os dispositivos são melhores. Isso significa que o tempo de resposta medido é pior que a média de todos os dispositivos testados (19.9 ms). | ||
| ↔ Tempo de resposta 50% cinza a 80% cinza | ||
| 34.2 ms ... ascensão ↗ e queda ↘ combinadas | ↗ 15.8 ms ascensão | 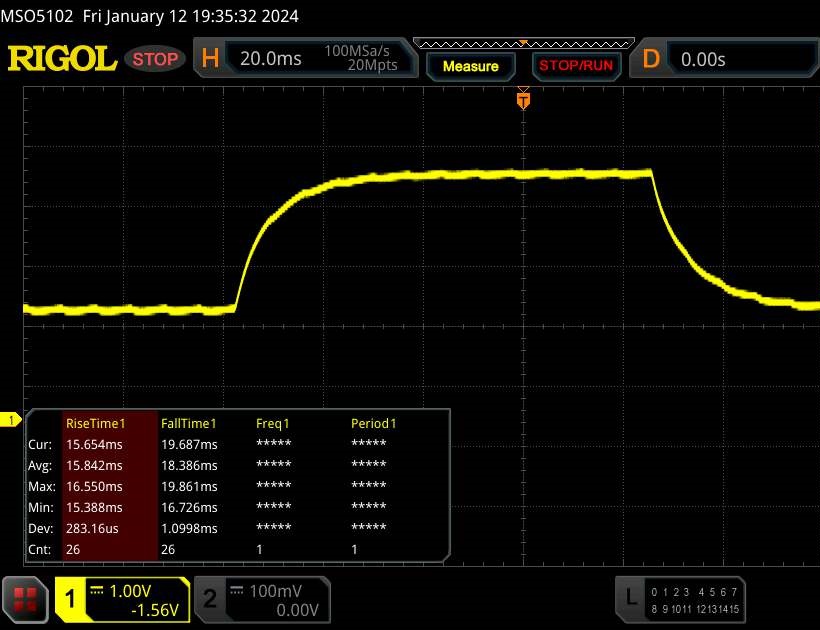 |
| ↘ 18.4 ms queda | ||
| A tela mostra taxas de resposta lentas em nossos testes e será insatisfatória para os jogadores. Em comparação, todos os dispositivos testados variam de 0.165 (mínimo) a 636 (máximo) ms. » 48 % de todos os dispositivos são melhores. Isso significa que o tempo de resposta medido é semelhante à média de todos os dispositivos testados (31.1 ms). | ||
Cintilação da tela / PWM (modulação por largura de pulso)
| Tela tremeluzindo / PWM não detectado | 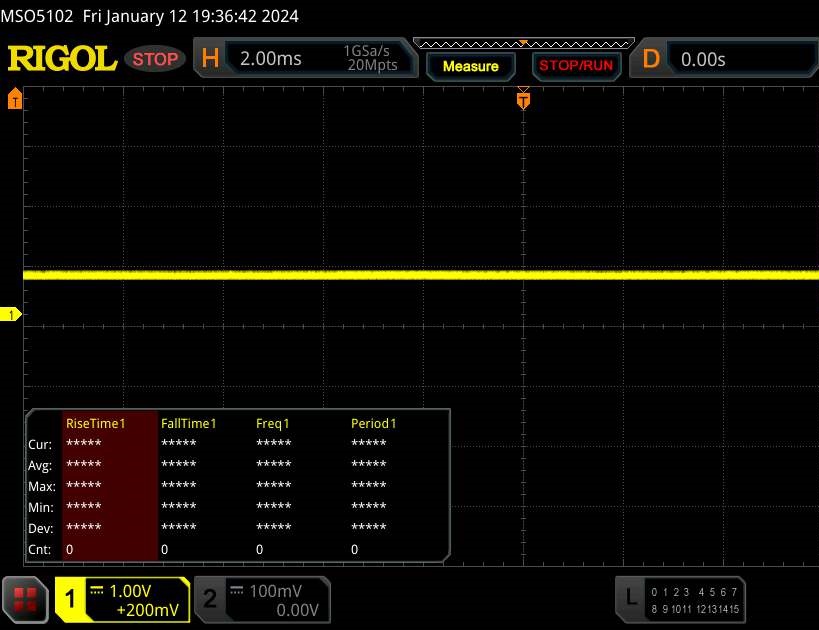 | ||
[pwm_comparison] Em comparação: 52 % de todos os dispositivos testados não usam PWM para escurecer a tela. Se PWM foi detectado, uma média de 7798 (mínimo: 5 - máximo: 343500) Hz foi medida. | |||
Desempenho
O Nitro V 15 é um dispositivo de médio porte em termos de desempenho da CPU e da GPU. Os 16 GB de RAM são bastante razoáveis considerando o preço do laptop, mas o SSD fica um pouco aquém com sua capacidade de apenas 512 GB.
Condições de teste
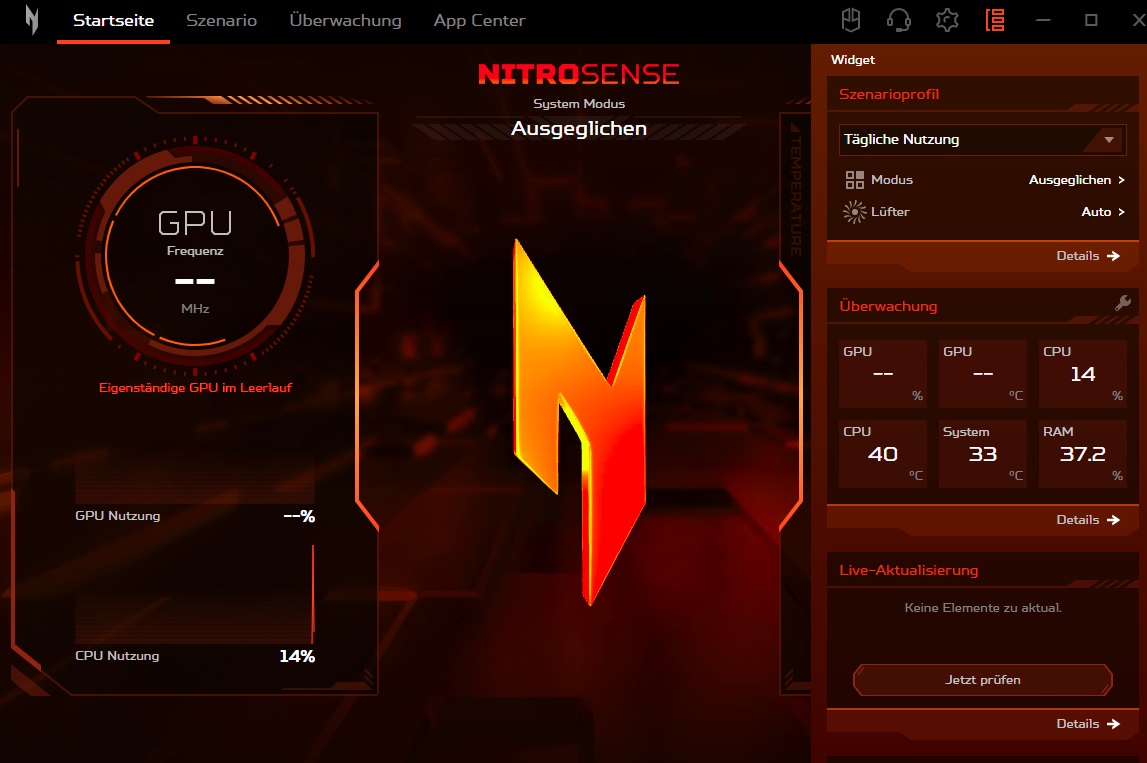
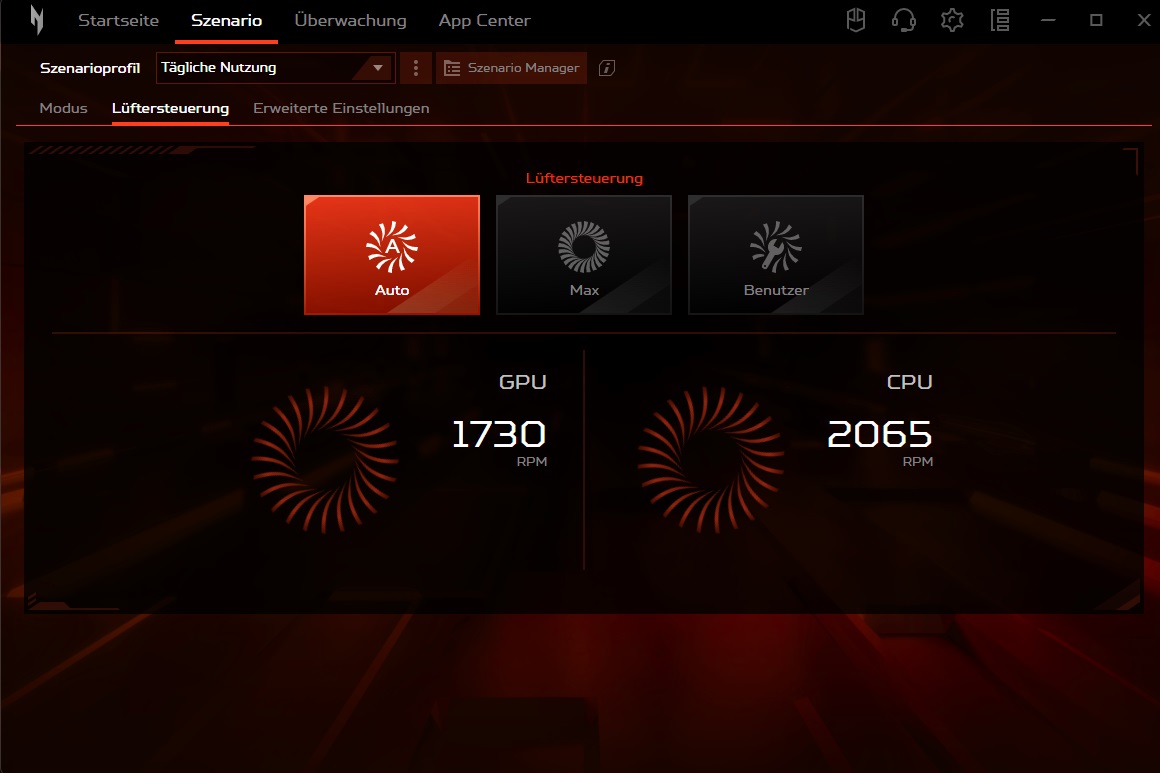
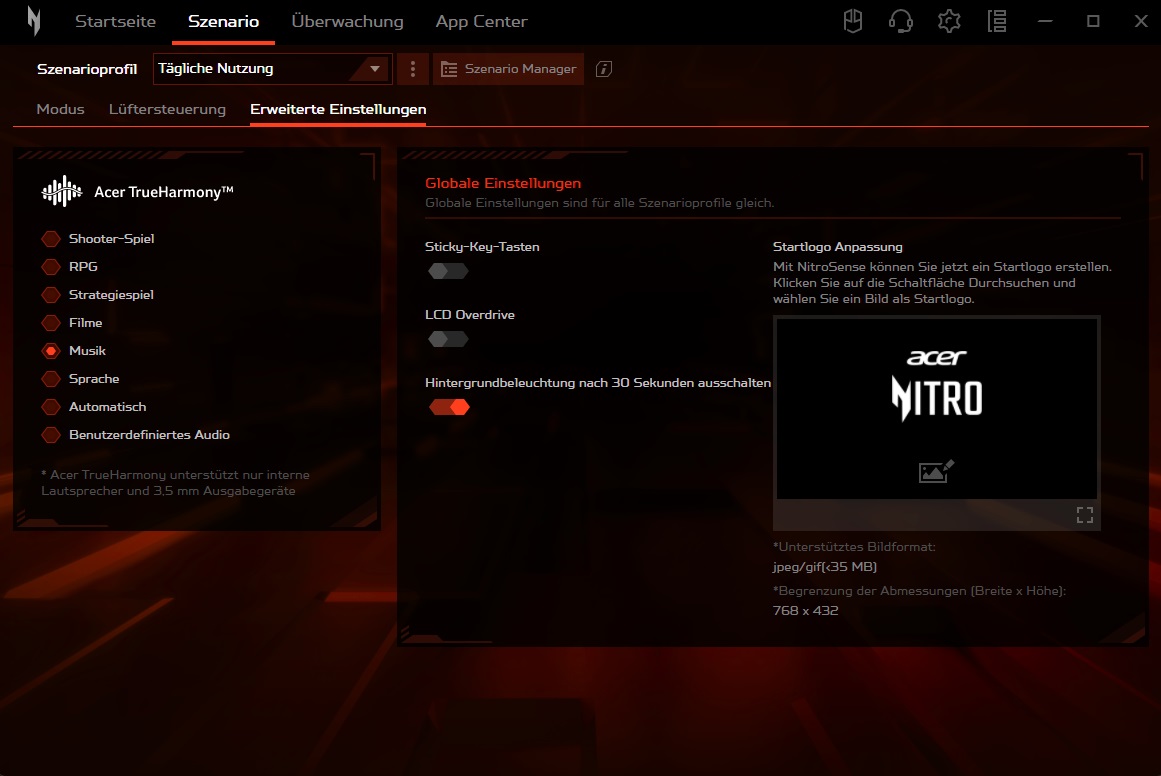
O aplicativo NitroSense pré-instalado permite que os usuários ajustem várias configurações do sistema. A guia "Scenario" (Cenário) é particularmente interessante para uso na vida real. Ela permite que o usuário mexa no plano de energia (menu "Mode") e no comportamento da ventoinha (menu "Fan Control"). Nossas medições foram realizadas no modo Balanced e com controle automático da ventoinha, já que o laptop funciona consideravelmente mais alto, mas não muito mais rápido, no modo Performance.
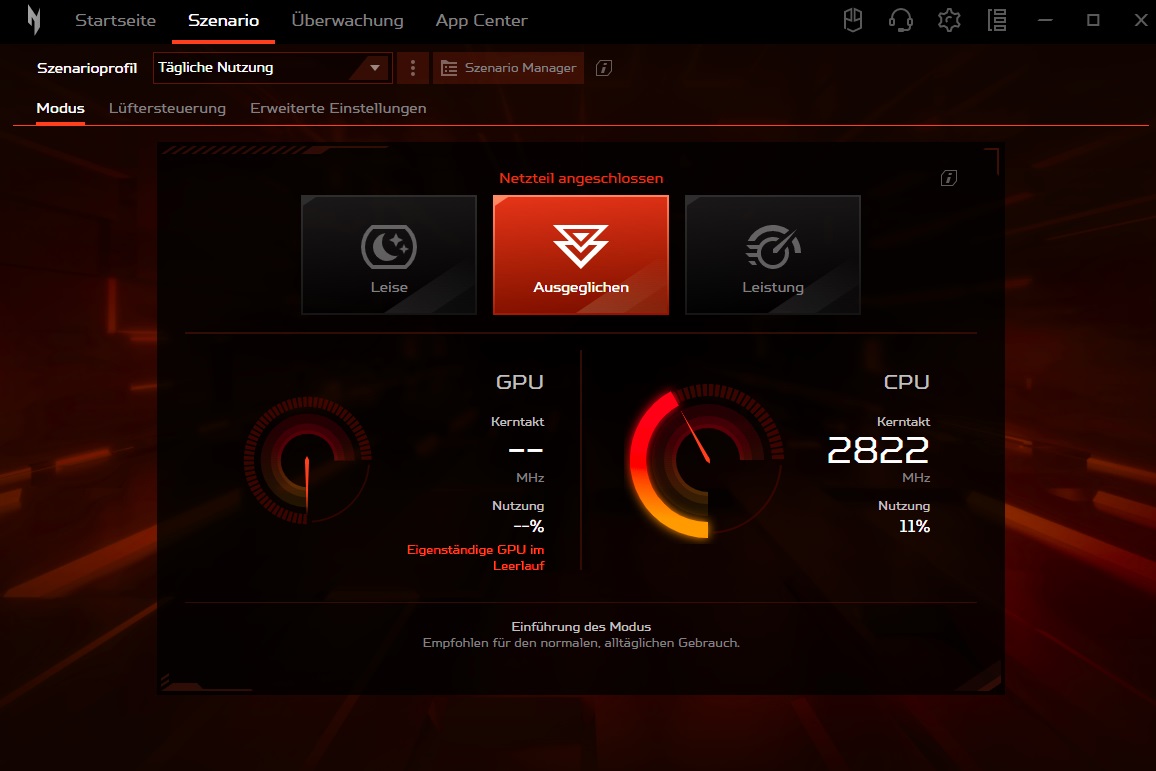
| NitroSense | Silencioso | Balanceado | Desempenho |
| CPU PL1 (HWiNFO) | 35 W | 45 W | 55 W |
| CPU PL2 (HWiNFO) | 64 W | 115 W | 115 W |
| Ruído (Witcher 3, FHD/Ultra) | 37 dB(A) | 49 dB(A) | 59 dB(A) |
| Desempenho (Witcher 3, FHD/Ultra) | ~62 FPS | ~78 FPS | ~82 FPS |
Processador
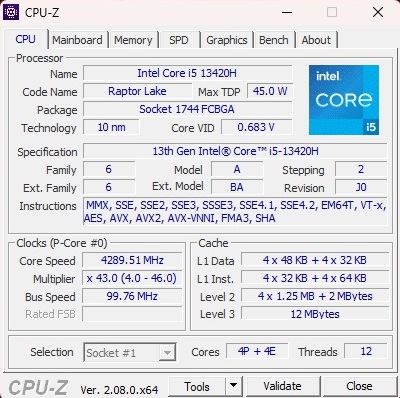
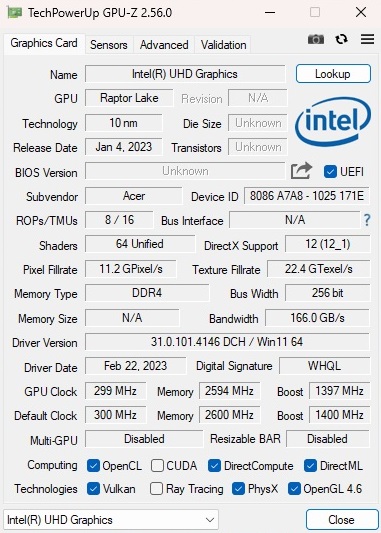
O Core i5-13420H é um processador da linha Raptor Lake da Intel (10 nm) que apresenta quatro núcleos de desempenho (com Hyper-Threading) e quatro núcleos de eficiência (sem HT). Em nossa série de benchmarks, a CPU não foi superada apenas por seus irmãos mais caros Core i5-13500H e Core i7-13620H, como esperado, mas também foi superada por seus concorrentes da AMD Ryzen 7 7735HS e Ryzen 7 7840HS. Dito isso, o desempenho da CPU é mais do que suficiente para jogos, pois a maioria dos jogos, como sabemos, é baseada em GPU.
Cinebench R15 Multi Sustained Load
* ... menor é melhor
AIDA64: FP32 Ray-Trace | FPU Julia | CPU SHA3 | CPU Queen | FPU SinJulia | FPU Mandel | CPU AES | CPU ZLib | FP64 Ray-Trace | CPU PhotoWorxx
| Performance rating | |
| Média da turma Gaming | |
| Schenker XMG Apex 15 (Late 23) | |
| Asus TUF A15 FA507 | |
| Medion Erazer Crawler E40 - MD 62518 | |
| Lenovo LOQ 15IRH8 Core i7 | |
| Acer Nitro V 15 ANV15-51-582S | |
| Média Intel Core i5-13420H | |
| AIDA64 / FP32 Ray-Trace | |
| Média da turma Gaming (10227 - 85542, n=110, últimos 2 anos) | |
| Schenker XMG Apex 15 (Late 23) | |
| Asus TUF A15 FA507 | |
| Medion Erazer Crawler E40 - MD 62518 | |
| Acer Nitro V 15 ANV15-51-582S | |
| Lenovo LOQ 15IRH8 Core i7 | |
| Média Intel Core i5-13420H (7922 - 12134, n=5) | |
| AIDA64 / FPU Julia | |
| Média da turma Gaming (51376 - 238426, n=110, últimos 2 anos) | |
| Schenker XMG Apex 15 (Late 23) | |
| Asus TUF A15 FA507 | |
| Medion Erazer Crawler E40 - MD 62518 | |
| Lenovo LOQ 15IRH8 Core i7 | |
| Acer Nitro V 15 ANV15-51-582S | |
| Média Intel Core i5-13420H (40587 - 59715, n=5) | |
| AIDA64 / CPU SHA3 | |
| Média da turma Gaming (2180 - 9817, n=110, últimos 2 anos) | |
| Schenker XMG Apex 15 (Late 23) | |
| Medion Erazer Crawler E40 - MD 62518 | |
| Asus TUF A15 FA507 | |
| Acer Nitro V 15 ANV15-51-582S | |
| Lenovo LOQ 15IRH8 Core i7 | |
| Média Intel Core i5-13420H (1724 - 2634, n=5) | |
| AIDA64 / CPU Queen | |
| Média da turma Gaming (49785 - 173351, n=101, últimos 2 anos) | |
| Schenker XMG Apex 15 (Late 23) | |
| Asus TUF A15 FA507 | |
| Medion Erazer Crawler E40 - MD 62518 | |
| Lenovo LOQ 15IRH8 Core i7 | |
| Média Intel Core i5-13420H (69803 - 74956, n=5) | |
| Acer Nitro V 15 ANV15-51-582S | |
| AIDA64 / FPU SinJulia | |
| Schenker XMG Apex 15 (Late 23) | |
| Média da turma Gaming (4424 - 33636, n=110, últimos 2 anos) | |
| Asus TUF A15 FA507 | |
| Medion Erazer Crawler E40 - MD 62518 | |
| Lenovo LOQ 15IRH8 Core i7 | |
| Acer Nitro V 15 ANV15-51-582S | |
| Média Intel Core i5-13420H (5485 - 6644, n=5) | |
| AIDA64 / FPU Mandel | |
| Média da turma Gaming (25115 - 128721, n=110, últimos 2 anos) | |
| Schenker XMG Apex 15 (Late 23) | |
| Asus TUF A15 FA507 | |
| Medion Erazer Crawler E40 - MD 62518 | |
| Lenovo LOQ 15IRH8 Core i7 | |
| Acer Nitro V 15 ANV15-51-582S | |
| Média Intel Core i5-13420H (19684 - 30163, n=5) | |
| AIDA64 / CPU AES | |
| Schenker XMG Apex 15 (Late 23) | |
| Média da turma Gaming (39258 - 247074, n=110, últimos 2 anos) | |
| Acer Nitro V 15 ANV15-51-582S | |
| Asus TUF A15 FA507 | |
| Medion Erazer Crawler E40 - MD 62518 | |
| Média Intel Core i5-13420H (35531 - 93100, n=5) | |
| Lenovo LOQ 15IRH8 Core i7 | |
| AIDA64 / CPU ZLib | |
| Média da turma Gaming (574 - 2531, n=110, últimos 2 anos) | |
| Schenker XMG Apex 15 (Late 23) | |
| Medion Erazer Crawler E40 - MD 62518 | |
| Lenovo LOQ 15IRH8 Core i7 | |
| Acer Nitro V 15 ANV15-51-582S | |
| Média Intel Core i5-13420H (509 - 746, n=5) | |
| Asus TUF A15 FA507 | |
| AIDA64 / FP64 Ray-Trace | |
| Média da turma Gaming (5509 - 45446, n=110, últimos 2 anos) | |
| Schenker XMG Apex 15 (Late 23) | |
| Asus TUF A15 FA507 | |
| Medion Erazer Crawler E40 - MD 62518 | |
| Lenovo LOQ 15IRH8 Core i7 | |
| Acer Nitro V 15 ANV15-51-582S | |
| Média Intel Core i5-13420H (4283 - 6627, n=5) | |
| AIDA64 / CPU PhotoWorxx | |
| Média da turma Gaming (12271 - 89891, n=110, últimos 2 anos) | |
| Medion Erazer Crawler E40 - MD 62518 | |
| Schenker XMG Apex 15 (Late 23) | |
| Lenovo LOQ 15IRH8 Core i7 | |
| Asus TUF A15 FA507 | |
| Acer Nitro V 15 ANV15-51-582S | |
| Média Intel Core i5-13420H (12330 - 37044, n=5) | |
Desempenho do sistema
O Nitro V 15 também não consegue se equiparar aos seus concorrentes em termos de desempenho do sistema, embora os diferenciais no PCMark 10 não sejam tão grandes quanto os dos testes de CPU.
CrossMark: Overall | Productivity | Creativity | Responsiveness
WebXPRT 3: Overall
WebXPRT 4: Overall
Mozilla Kraken 1.1: Total
| PCMark 10 / Score | |
| Média da turma Gaming (5828 - 11574, n=96, últimos 2 anos) | |
| Schenker XMG Apex 15 (Late 23) | |
| Lenovo LOQ 15IRH8 Core i7 | |
| Medion Erazer Crawler E40 - MD 62518 | |
| Asus TUF A15 FA507 | |
| Acer Nitro V 15 ANV15-51-582S | |
| Média Intel Core i5-13420H, NVIDIA GeForce RTX 4050 Laptop GPU (n=1) | |
| PCMark 10 / Essentials | |
| Lenovo LOQ 15IRH8 Core i7 | |
| Schenker XMG Apex 15 (Late 23) | |
| Média da turma Gaming (8810 - 12600, n=100, últimos 2 anos) | |
| Asus TUF A15 FA507 | |
| Medion Erazer Crawler E40 - MD 62518 | |
| Acer Nitro V 15 ANV15-51-582S | |
| Média Intel Core i5-13420H, NVIDIA GeForce RTX 4050 Laptop GPU (n=1) | |
| PCMark 10 / Productivity | |
| Média da turma Gaming (6845 - 18766, n=98, últimos 2 anos) | |
| Schenker XMG Apex 15 (Late 23) | |
| Lenovo LOQ 15IRH8 Core i7 | |
| Asus TUF A15 FA507 | |
| Medion Erazer Crawler E40 - MD 62518 | |
| Acer Nitro V 15 ANV15-51-582S | |
| Média Intel Core i5-13420H, NVIDIA GeForce RTX 4050 Laptop GPU (n=1) | |
| PCMark 10 / Digital Content Creation | |
| Média da turma Gaming (7602 - 19657, n=98, últimos 2 anos) | |
| Lenovo LOQ 15IRH8 Core i7 | |
| Schenker XMG Apex 15 (Late 23) | |
| Medion Erazer Crawler E40 - MD 62518 | |
| Asus TUF A15 FA507 | |
| Acer Nitro V 15 ANV15-51-582S | |
| Média Intel Core i5-13420H, NVIDIA GeForce RTX 4050 Laptop GPU (n=1) | |
| CrossMark / Overall | |
| Média da turma Gaming (1366 - 2409, n=98, últimos 2 anos) | |
| Lenovo LOQ 15IRH8 Core i7 | |
| Medion Erazer Crawler E40 - MD 62518 | |
| Schenker XMG Apex 15 (Late 23) | |
| Asus TUF A15 FA507 | |
| CrossMark / Productivity | |
| Média da turma Gaming (1386 - 2254, n=98, últimos 2 anos) | |
| Lenovo LOQ 15IRH8 Core i7 | |
| Medion Erazer Crawler E40 - MD 62518 | |
| Schenker XMG Apex 15 (Late 23) | |
| Asus TUF A15 FA507 | |
| CrossMark / Creativity | |
| Média da turma Gaming (1343 - 2729, n=98, últimos 2 anos) | |
| Lenovo LOQ 15IRH8 Core i7 | |
| Schenker XMG Apex 15 (Late 23) | |
| Medion Erazer Crawler E40 - MD 62518 | |
| Asus TUF A15 FA507 | |
| CrossMark / Responsiveness | |
| Lenovo LOQ 15IRH8 Core i7 | |
| Medion Erazer Crawler E40 - MD 62518 | |
| Média da turma Gaming (1226 - 2334, n=98, últimos 2 anos) | |
| Schenker XMG Apex 15 (Late 23) | |
| Asus TUF A15 FA507 | |
| WebXPRT 3 / Overall | |
| Média da turma Gaming (242 - 532, n=101, últimos 2 anos) | |
| Schenker XMG Apex 15 (Late 23) | |
| Asus TUF A15 FA507 | |
| Lenovo LOQ 15IRH8 Core i7 | |
| Medion Erazer Crawler E40 - MD 62518 | |
| Acer Nitro V 15 ANV15-51-582S | |
| Média Intel Core i5-13420H, NVIDIA GeForce RTX 4050 Laptop GPU (n=1) | |
| WebXPRT 4 / Overall | |
| Média da turma Gaming (176.4 - 354, n=101, últimos 2 anos) | |
| Lenovo LOQ 15IRH8 Core i7 | |
| Acer Nitro V 15 ANV15-51-582S | |
| Média Intel Core i5-13420H, NVIDIA GeForce RTX 4050 Laptop GPU (n=1) | |
| Medion Erazer Crawler E40 - MD 62518 | |
| Asus TUF A15 FA507 | |
| Mozilla Kraken 1.1 / Total | |
| Asus TUF A15 FA507 | |
| Acer Nitro V 15 ANV15-51-582S | |
| Média Intel Core i5-13420H, NVIDIA GeForce RTX 4050 Laptop GPU (n=1) | |
| Medion Erazer Crawler E40 - MD 62518 | |
| Schenker XMG Apex 15 (Late 23) | |
| Lenovo LOQ 15IRH8 Core i7 | |
| Média da turma Gaming (391 - 590, n=106, últimos 2 anos) | |
* ... menor é melhor
| PCMark 10 Score | 6569 pontos | |
Ajuda | ||
| AIDA64 / Memory Copy | |
| Média da turma Gaming (21750 - 129946, n=110, últimos 2 anos) | |
| Schenker XMG Apex 15 (Late 23) | |
| Medion Erazer Crawler E40 - MD 62518 | |
| Lenovo LOQ 15IRH8 Core i7 | |
| Asus TUF A15 FA507 | |
| Acer Nitro V 15 ANV15-51-582S | |
| Média Intel Core i5-13420H (22003 - 59609, n=5) | |
| AIDA64 / Memory Read | |
| Média da turma Gaming (22956 - 118858, n=110, últimos 2 anos) | |
| Medion Erazer Crawler E40 - MD 62518 | |
| Lenovo LOQ 15IRH8 Core i7 | |
| Schenker XMG Apex 15 (Late 23) | |
| Asus TUF A15 FA507 | |
| Acer Nitro V 15 ANV15-51-582S | |
| Média Intel Core i5-13420H (23499 - 68085, n=5) | |
| AIDA64 / Memory Write | |
| Schenker XMG Apex 15 (Late 23) | |
| Média da turma Gaming (22297 - 135096, n=110, últimos 2 anos) | |
| Medion Erazer Crawler E40 - MD 62518 | |
| Asus TUF A15 FA507 | |
| Lenovo LOQ 15IRH8 Core i7 | |
| Acer Nitro V 15 ANV15-51-582S | |
| Média Intel Core i5-13420H (21429 - 62529, n=5) | |
| AIDA64 / Memory Latency | |
| Lenovo LOQ 15IRH8 Core i7 | |
| Média da turma Gaming (75.3 - 259, n=110, últimos 2 anos) | |
| Média Intel Core i5-13420H (90.2 - 103.6, n=5) | |
| Medion Erazer Crawler E40 - MD 62518 | |
| Acer Nitro V 15 ANV15-51-582S | |
| Schenker XMG Apex 15 (Late 23) | |
| Asus TUF A15 FA507 | |
* ... menor é melhor
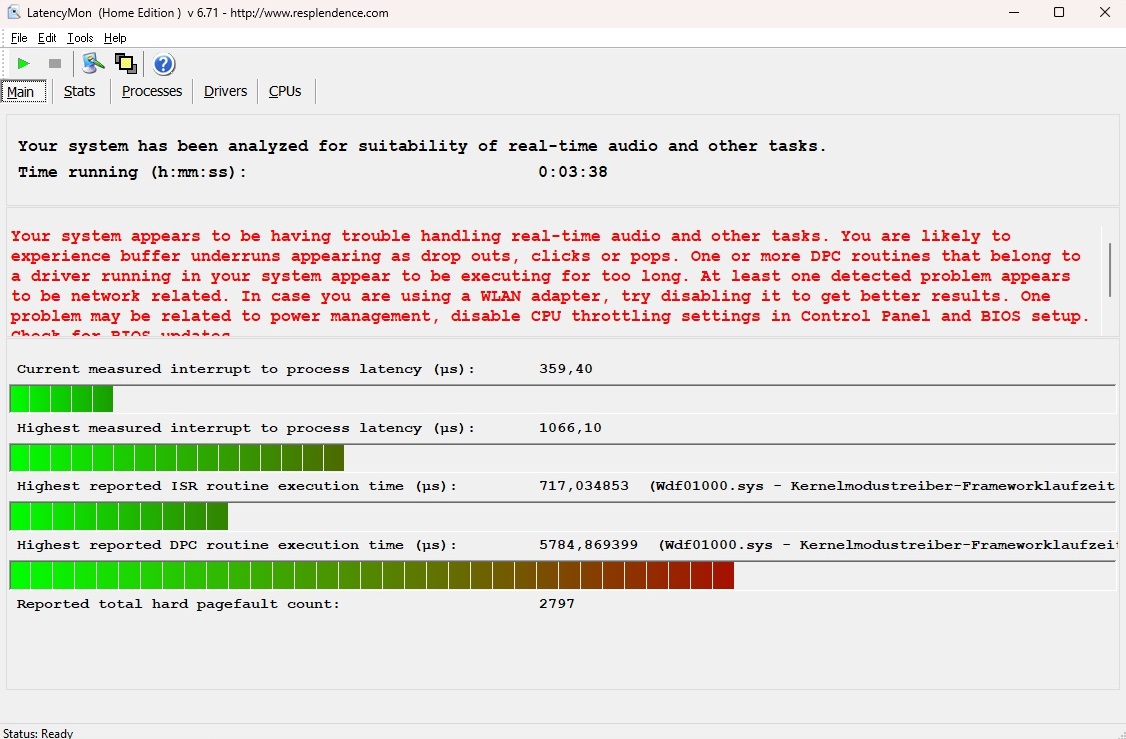
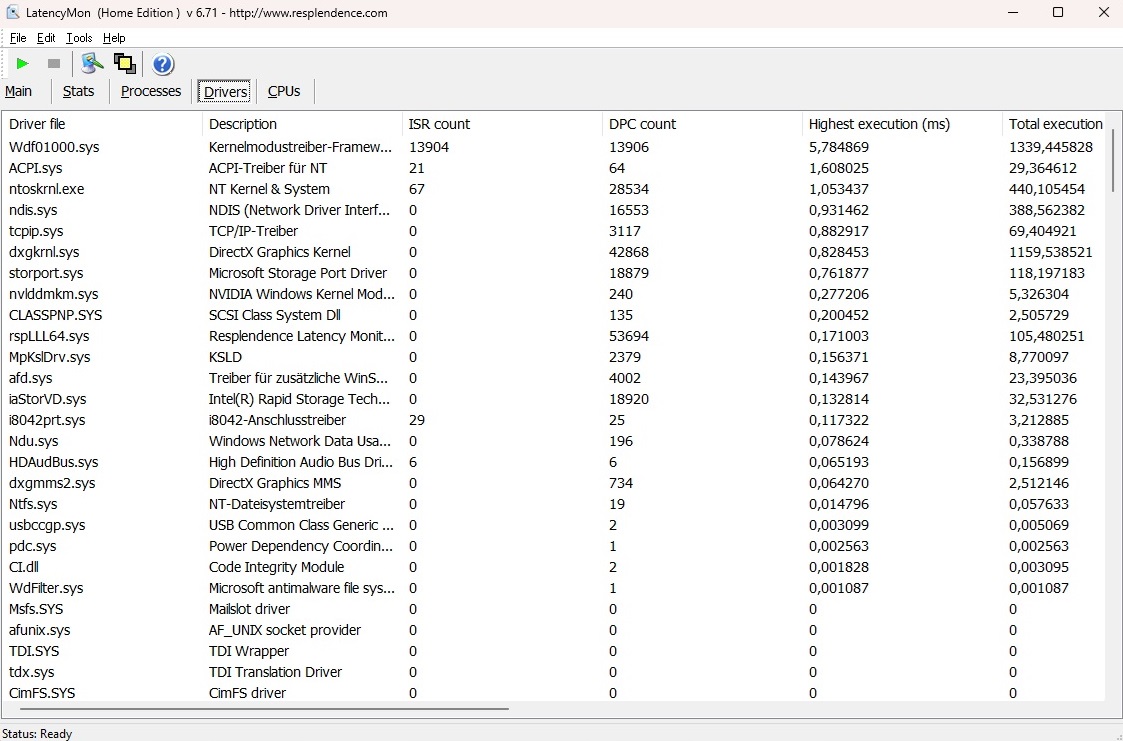
Latência DPC
De acordo com o LatencyMon, o Nitro V 15 é apenas parcialmente adequado para aplicativos sensíveis à latência, como edição de áudio e vídeo em tempo real. Entretanto, esse problema afeta muitos laptops e só é relevante para determinados usuários.
| DPC Latencies / LatencyMon - interrupt to process latency (max), Web, Youtube, Prime95 | |
| Acer Nitro V 15 ANV15-51-582S | |
| Medion Erazer Crawler E40 - MD 62518 | |
| Lenovo LOQ 15IRH8 Core i7 | |
| Schenker XMG Apex 15 (Late 23) | |
* ... menor é melhor
Armazenamento em massa
A unidade de armazenamento M.2 em nossa unidade de análise é fabricada pela SK hynix e oferece um sólido desempenho de leitura e gravação para um dispositivo NVMe. No entanto, semelhante ao SSD no Lenovo LOQ LOQ 15IRH8, ele sofre de um certo nível de quedas de desempenho e flutuações sob carga contínua.

* ... menor é melhor
Sustained Load Read: DiskSpd Read Loop, Queue Depth 8
Placa de vídeo
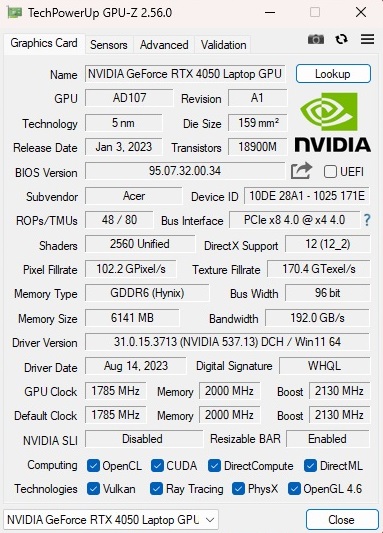
Embora os concorrentes tenham apresentado resultados ligeiramente melhores em benchmarks de gráficos sintéticos, a RTX 4050 no Nitro V 15 ainda oferece um nível de desempenho semelhante ao que vimos dessa GPU em média. O modelo de médio porte da geração Ada Lovelace oferece 2.560 unidades de sombreamento, mas não tem uma configuração de memória particularmente generosa, com apenas 6 GB de VRAM GDDR6 e uma interface de 96 bits. A Acer definiu o TGP em 75 watts (60 watts mais 15 watts de Dynamic Boost), o que é bastante baixo para um RTX 4050.
| 3DMark 11 Performance | 24506 pontos | |
| 3DMark Ice Storm Standard Score | 133723 pontos | |
| 3DMark Cloud Gate Standard Score | 50705 pontos | |
| 3DMark Fire Strike Score | 18795 pontos | |
| 3DMark Time Spy Score | 7944 pontos | |
Ajuda | ||
* ... menor é melhor
Desempenho em jogos
Desde que o senhor mantenha a resolução interna em Full HD (ou seja, 1080p) e não exagere nas configurações, a RTX 4050 também é capaz de lidar com jogos modernos. A maioria das configurações médias e altas não deve ser um problema; somente quando o usuário chega às configurações ultra, as coisas podem ficar apertadas às vezes (por exemplo, em Lords of the Fallen ou Avatar: Frontiers of Pandora). Semelhante ao que vimos nos benchmarks gráficos, outros notebooks RTX 4050 com TGP mais alto geralmente têm um desempenho melhor do que o Nitro.
| The Witcher 3 - 1920x1080 Ultra Graphics & Postprocessing (HBAO+) | |
| Média da turma Gaming (95 - 240, n=8, últimos 2 anos) | |
| Lenovo LOQ 15IRH8 Core i7 | |
| Schenker XMG Apex 15 (Late 23) | |
| Asus TUF A15 FA507 | |
| Medion Erazer Crawler E40 - MD 62518 | |
| Acer Nitro V 15 ANV15-51-582S | |
| Média NVIDIA GeForce RTX 4050 Laptop GPU (18.5 - 94.7, n=40) | |
| Avatar Frontiers of Pandora - 1920x1080 Ultra Preset AA:T | |
| Média da turma Gaming (n=1últimos 2 anos) | |
| Medion Erazer Scout E20 | |
| Acer Nitro V 15 ANV15-51-582S | |
| Média NVIDIA GeForce RTX 4050 Laptop GPU (35 - 35, n=2) | |
| The Finals - 1920x1080 Epic Preset | |
| Medion Erazer Scout E20 | |
| Média NVIDIA GeForce RTX 4050 Laptop GPU (91.8 - 99.2, n=2) | |
| Acer Nitro V 15 ANV15-51-582S | |
| Média da turma Gaming (n=1últimos 2 anos) | |
| EA Sports WRC - 1920x1080 Ultra Preset AA:Epic AF:16x | |
| Medion Erazer Scout E20 | |
| Média NVIDIA GeForce RTX 4050 Laptop GPU (61 - 67.3, n=2) | |
| Acer Nitro V 15 ANV15-51-582S | |
| Média da turma Gaming (n=1últimos 2 anos) | |
| Assassin's Creed Mirage - 1920x1080 Ultra High Preset (Adaptive Quality Off) | |
| XMG Focus 15 E23 | |
| Média NVIDIA GeForce RTX 4050 Laptop GPU (63 - 70, n=2) | |
| Acer Nitro V 15 ANV15-51-582S | |
| Ready or Not - 1920x1080 Epic Preset | |
| Medion Erazer Scout E20 | |
| Média NVIDIA GeForce RTX 4050 Laptop GPU (95.1 - 107.1, n=2) | |
| Acer Nitro V 15 ANV15-51-582S | |
| Lords of the Fallen - 1920x1080 Ultra Preset | |
| XMG Focus 15 E23 | |
| Média NVIDIA GeForce RTX 4050 Laptop GPU (27.3 - 32.1, n=2) | |
| Acer Nitro V 15 ANV15-51-582S | |
| Counter-Strike 2 - 1920x1080 Very High Preset | |
| Média da turma Gaming (26.2 - 275, n=6, últimos 2 anos) | |
| Medion Erazer Scout E20 | |
| Média NVIDIA GeForce RTX 4050 Laptop GPU (80.9 - 110.2, n=2) | |
| Acer Nitro V 15 ANV15-51-582S | |
| Total War Pharaoh - 1920x1080 Ultra Preset | |
| Média da turma Gaming (42.9 - 161.4, n=2, últimos 2 anos) | |
| XMG Focus 15 E23 | |
| Média NVIDIA GeForce RTX 4050 Laptop GPU (59.7 - 101, n=3) | |
| Acer Nitro V 15 ANV15-51-582S | |
Não encontramos nenhum problema grave durante nosso teste de estabilidade (executando The Witcher 3 em FHD/Ultra por uma hora). Embora a taxa de quadros tenha diminuído ligeiramente no decorrer do teste, não houve nenhuma queda incomum de desempenho ou algo semelhante.
Witcher 3 FPS chart
| baixo | média | alto | ultra | |
|---|---|---|---|---|
| GTA V (2015) | 177.3 | 158.2 | 86.9 | |
| The Witcher 3 (2015) | 78 | |||
| Dota 2 Reborn (2015) | 153.7 | 143.6 | 136.5 | 120.3 |
| Final Fantasy XV Benchmark (2018) | 104.3 | 76.5 | ||
| X-Plane 11.11 (2018) | 114.3 | 94.5 | 77 | |
| Far Cry 5 (2018) | 128 | 118 | 102 | |
| Strange Brigade (2018) | 189.5 | 155.2 | 135.2 | |
| Counter-Strike 2 (2023) | 127 | 112.4 | 80.9 | |
| Assassin's Creed Mirage (2023) | 89 | 84 | 63 | |
| Total War Pharaoh (2023) | 147 | 84.1 | 59.7 | |
| Lords of the Fallen (2023) | 54.1 | 38.6 | 27.3 | |
| EA Sports WRC (2023) | 71.2 | 66.6 | 61 | |
| Avatar Frontiers of Pandora (2023) | 55 | 47 | 35 | |
| The Finals (2023) | 130.2 | 113.7 | 91.8 | |
| Ready or Not (2023) | 148.3 | 134.2 | 95.1 |
Emissões
Emissões de ruído
Em relação à quantidade de calor gerada, o Nitro V 15 é desnecessariamente barulhento ao executar aplicativos 3D. Medimos cerca de 49 dB(A) de ruído durante os jogos (modo balanceado), o que é claramente audível e pode ser alto o suficiente para incomodar alguns usuários. Dito isso, o laptop não é muito diferente dos concorrentes nesse aspecto. No modo inativo, as duas ventoinhas internas estão completamente paradas ou funcionando com um nível de ruído moderado de 29 a 30 dB(A).
Barulho
| Ocioso |
| 25 / 29 / 30 dB |
| Carga |
| 49 / 51 dB |
 | ||
30 dB silencioso 40 dB(A) audível 50 dB(A) ruidosamente alto |
||
min: | ||
| Acer Nitro V 15 ANV15-51-582S GeForce RTX 4050 Laptop GPU, i5-13420H | Medion Erazer Crawler E40 - MD 62518 GeForce RTX 4050 Laptop GPU, i5-13500H | Lenovo LOQ 15IRH8 Core i7 GeForce RTX 4050 Laptop GPU, i7-13620H | Asus TUF A15 FA507 GeForce RTX 4050 Laptop GPU, R7 7735HS | Schenker XMG Apex 15 (Late 23) GeForce RTX 4050 Laptop GPU, R7 7840HS | |
|---|---|---|---|---|---|
| Noise | 4% | -0% | 18% | 3% | |
| desligado / ambiente * (dB) | 25 | 23 8% | 23.69 5% | 23.3 7% | 24 4% |
| Idle Minimum * (dB) | 25 | 23 8% | 29.03 -16% | 23.3 7% | 25 -0% |
| Idle Average * (dB) | 29 | 23 21% | 29.03 -0% | 23.3 20% | 29 -0% |
| Idle Maximum * (dB) | 30 | 28.02 7% | 29.03 3% | 23.3 22% | 33 -10% |
| Load Average * (dB) | 49 | 50.21 -2% | 48.7 1% | 29.6 40% | 36 27% |
| Witcher 3 ultra * (dB) | 49 | 51.46 -5% | 48.5 1% | 43 12% | 48 2% |
| Load Maximum * (dB) | 51 | 56.79 -11% | 48.7 5% | 43 16% | 53 -4% |
* ... menor é melhor
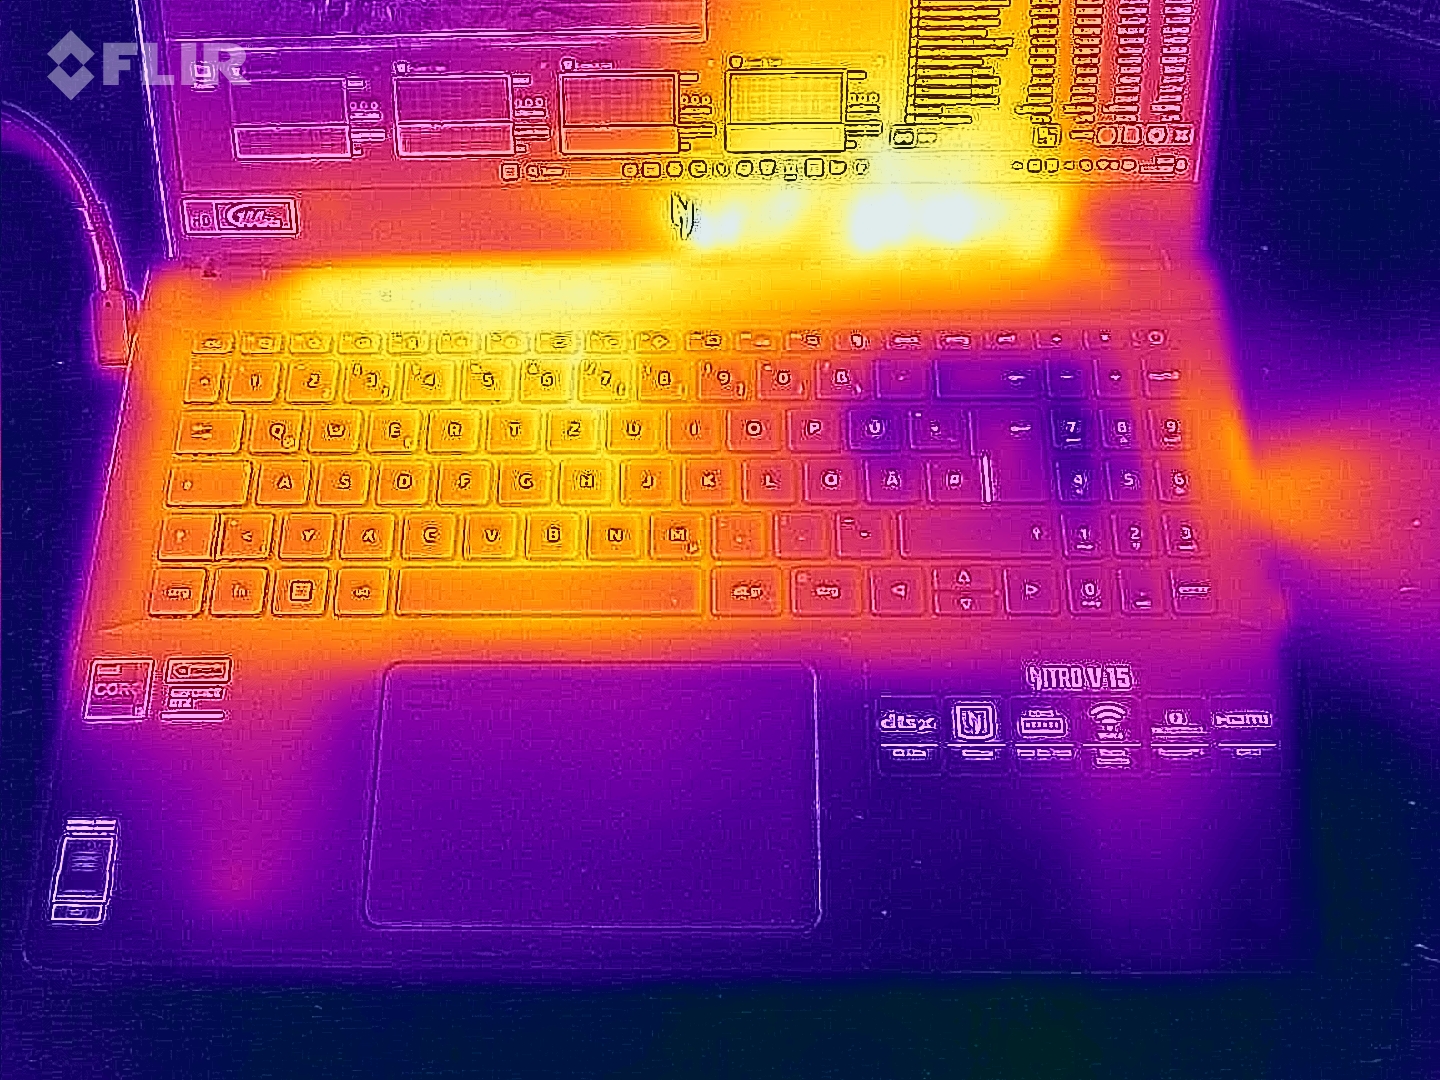
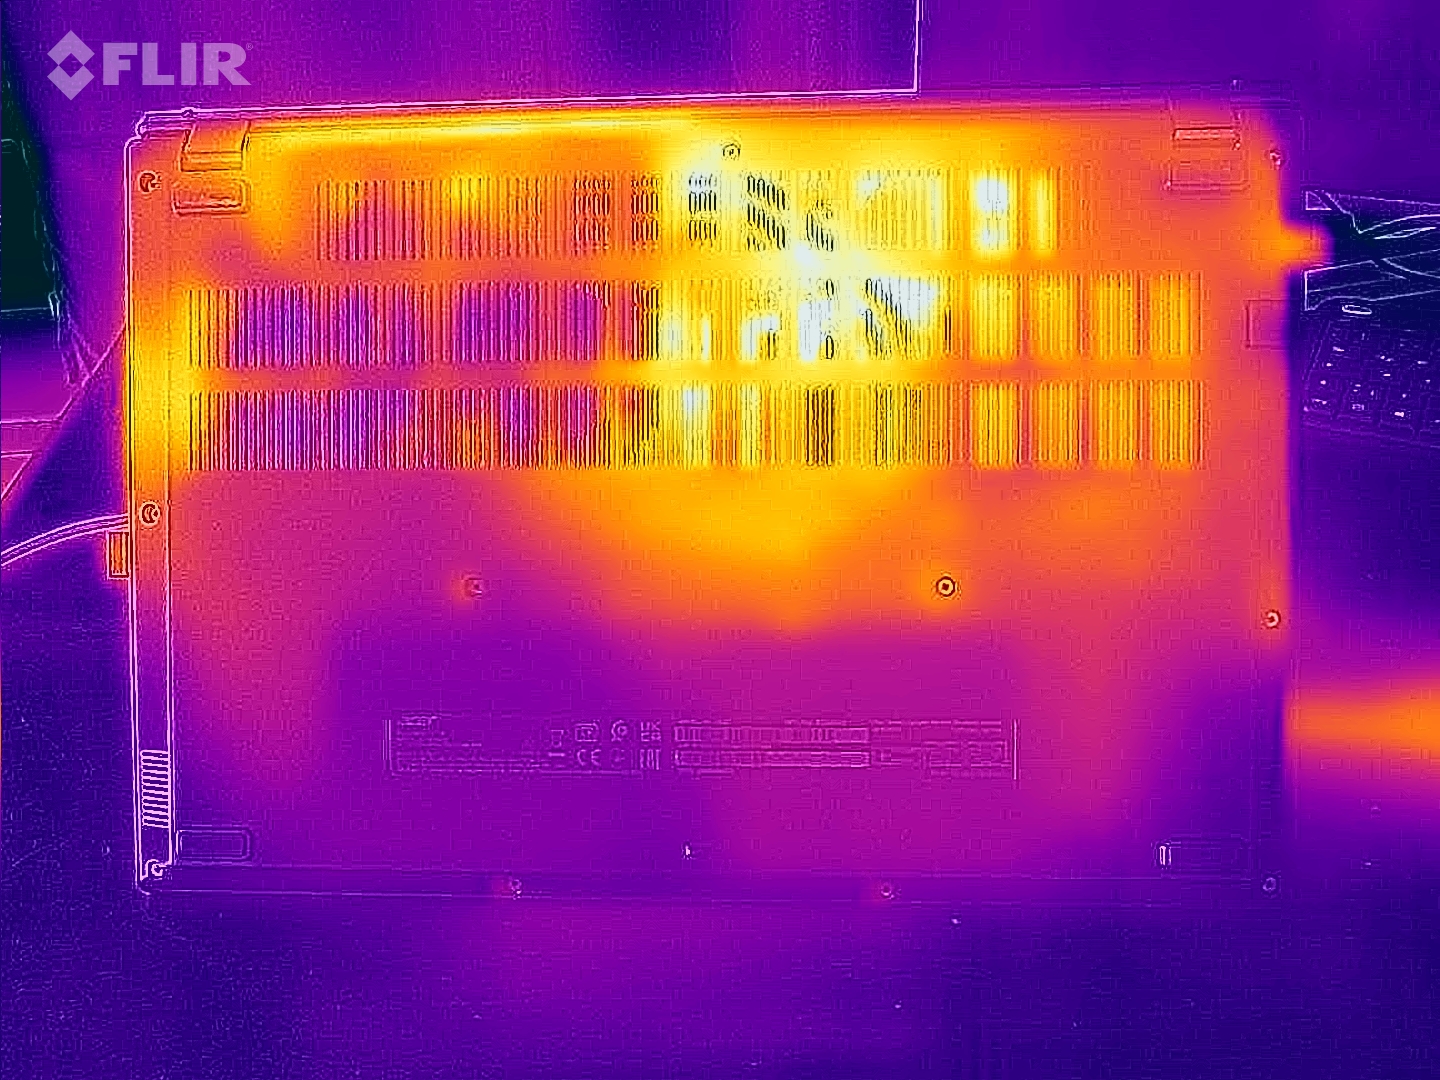
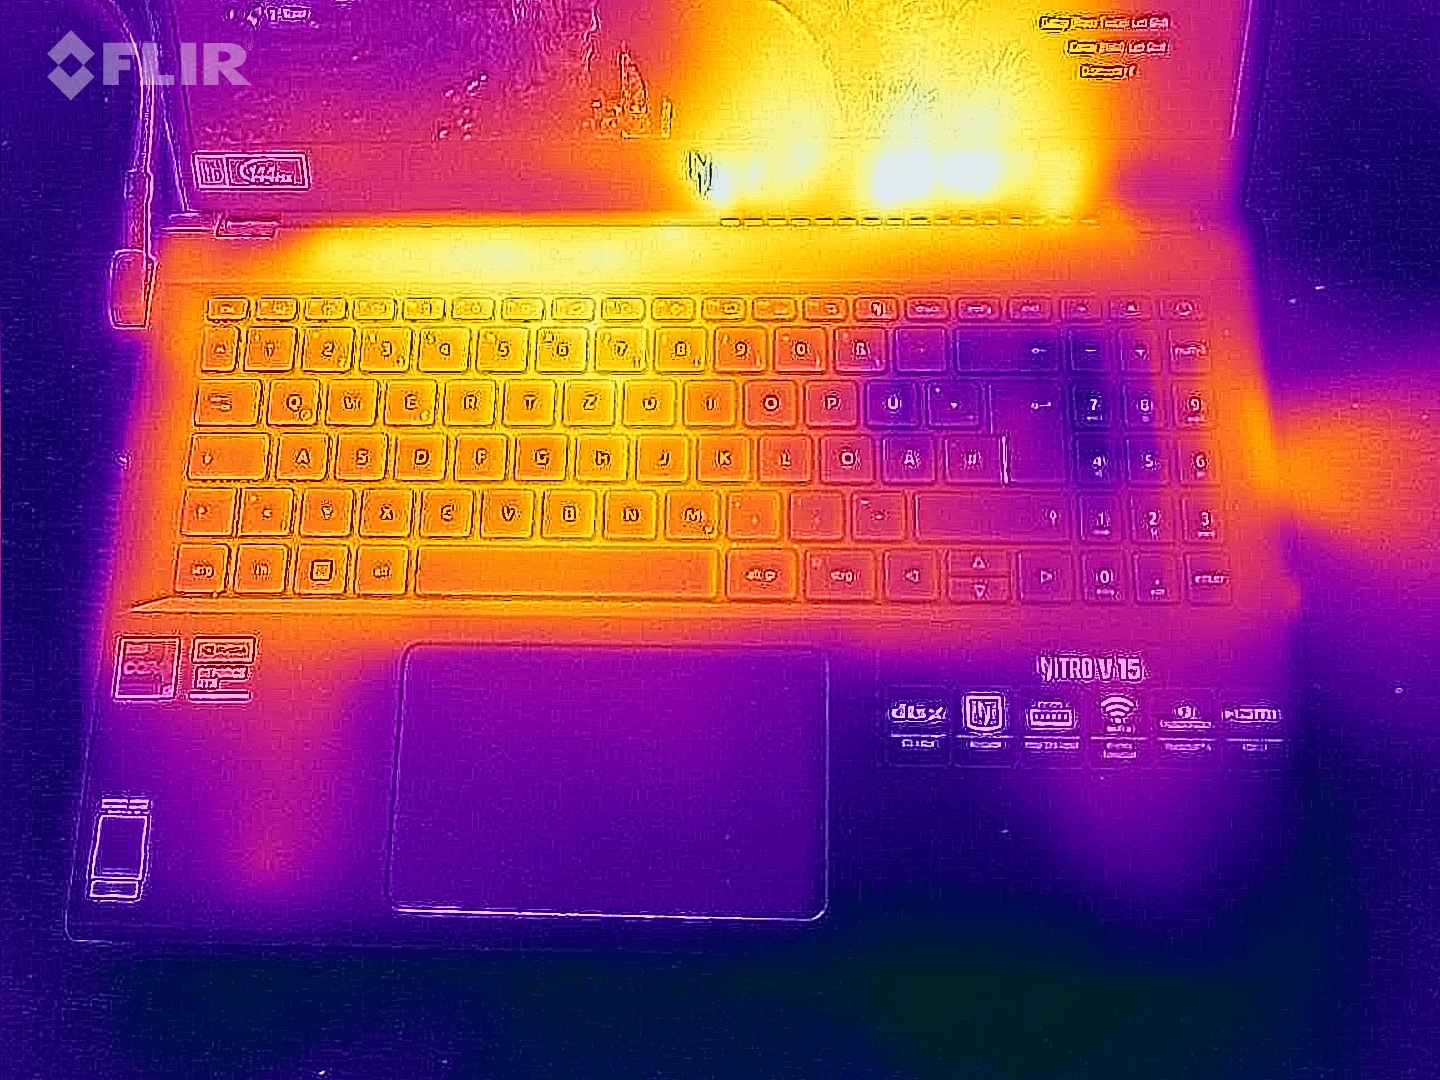
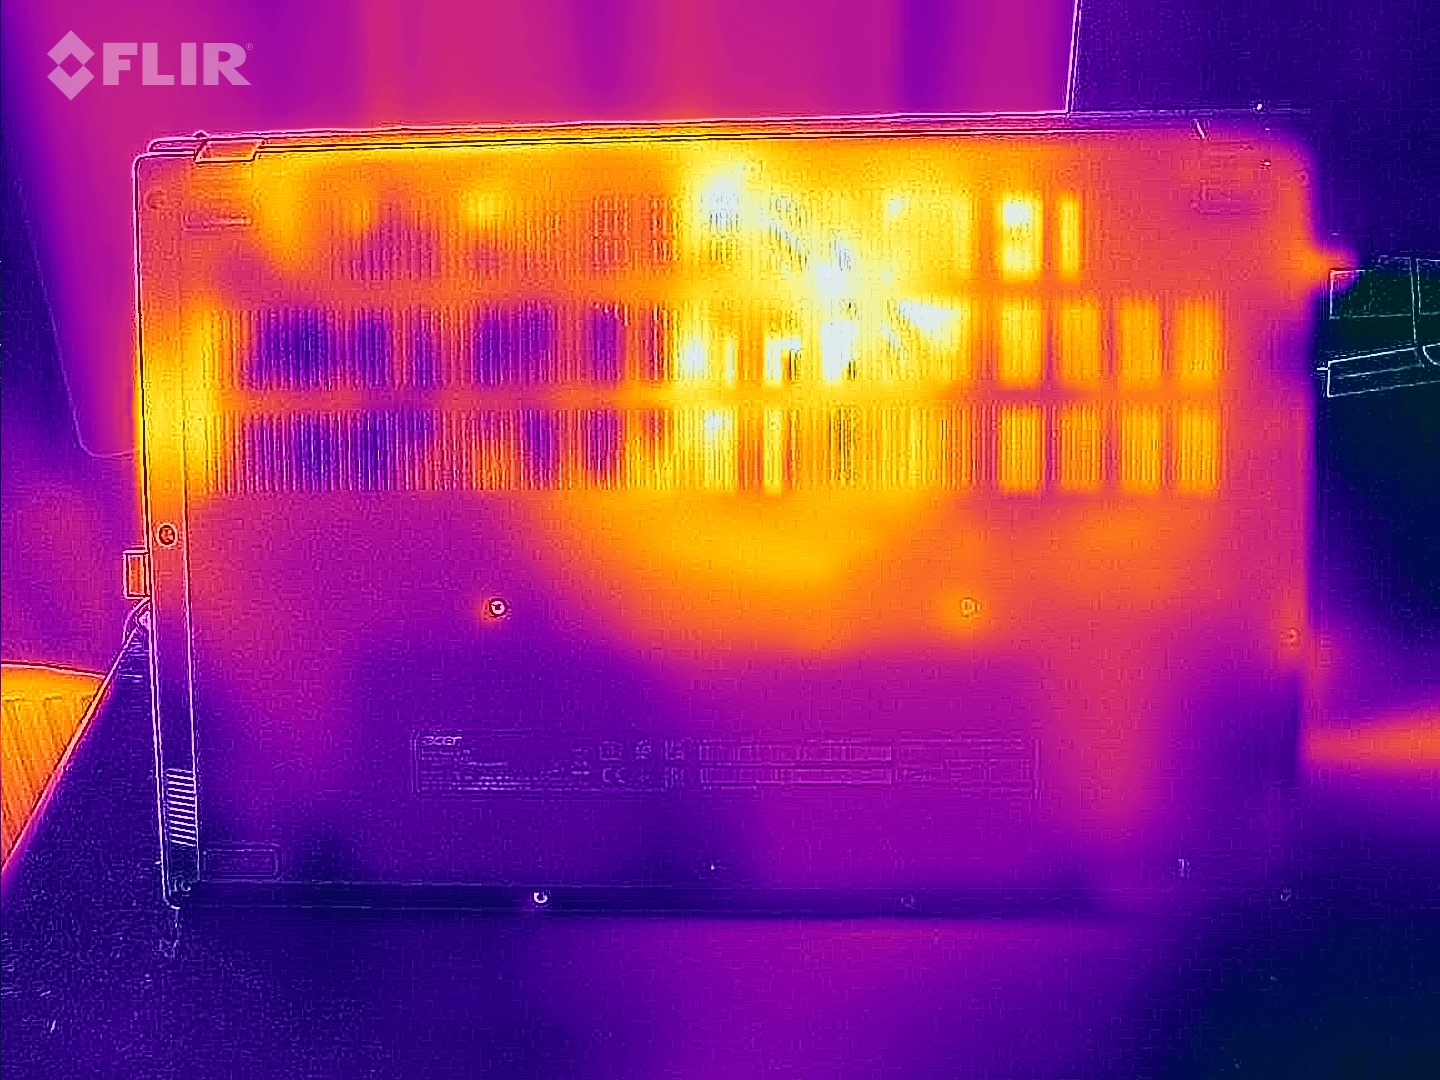
Temperatura
O Nitro V 15 não esquenta muito. Mesmo após 60 minutos de testes de estresse (executando FurMark e Prime95), a superfície do notebook ainda permaneceu abaixo da marca de 50°C (122°F). Todo o chassi é mantido bem e frio quando ocioso - nosso termômetro só registrou temperaturas entre 22 e 28°C (71,6 e 82,4°F).
(-) A temperatura máxima no lado superior é 46 °C / 115 F, em comparação com a média de 40.4 °C / 105 F , variando de 21.2 a 68.8 °C para a classe Gaming.
(-) A parte inferior aquece até um máximo de 48 °C / 118 F, em comparação com a média de 43.2 °C / 110 F
(+) Em uso inativo, a temperatura média para o lado superior é 25.1 °C / 77 F, em comparação com a média do dispositivo de 33.9 °C / ### class_avg_f### F.
(-) Jogando The Witcher 3, a temperatura média para o lado superior é 39.4 °C / 103 F, em comparação com a média do dispositivo de 33.9 °C / ## #class_avg_f### F.
(±) Os apoios para as mãos e o touchpad podem ficar muito quentes ao toque, com um máximo de 36 °C / 96.8 F.
(-) A temperatura média da área do apoio para as mãos de dispositivos semelhantes foi 28.8 °C / 83.8 F (-7.2 °C / -13 F).
| Acer Nitro V 15 ANV15-51-582S GeForce RTX 4050 Laptop GPU, i5-13420H | Medion Erazer Crawler E40 - MD 62518 GeForce RTX 4050 Laptop GPU, i5-13500H | Lenovo LOQ 15IRH8 Core i7 GeForce RTX 4050 Laptop GPU, i7-13620H | Asus TUF A15 FA507 GeForce RTX 4050 Laptop GPU, R7 7735HS | Schenker XMG Apex 15 (Late 23) GeForce RTX 4050 Laptop GPU, R7 7840HS | |
|---|---|---|---|---|---|
| Heat | 14% | -20% | 1% | -13% | |
| Maximum Upper Side * (°C) | 46 | 36 22% | 46.4 -1% | 48.9 -6% | 52 -13% |
| Maximum Bottom * (°C) | 48 | 36 25% | 59.2 -23% | 44.6 7% | 47 2% |
| Idle Upper Side * (°C) | 27 | 26 4% | 34.4 -27% | 27.1 -0% | 33 -22% |
| Idle Bottom * (°C) | 28 | 27 4% | 36.2 -29% | 27.5 2% | 33 -18% |
* ... menor é melhor
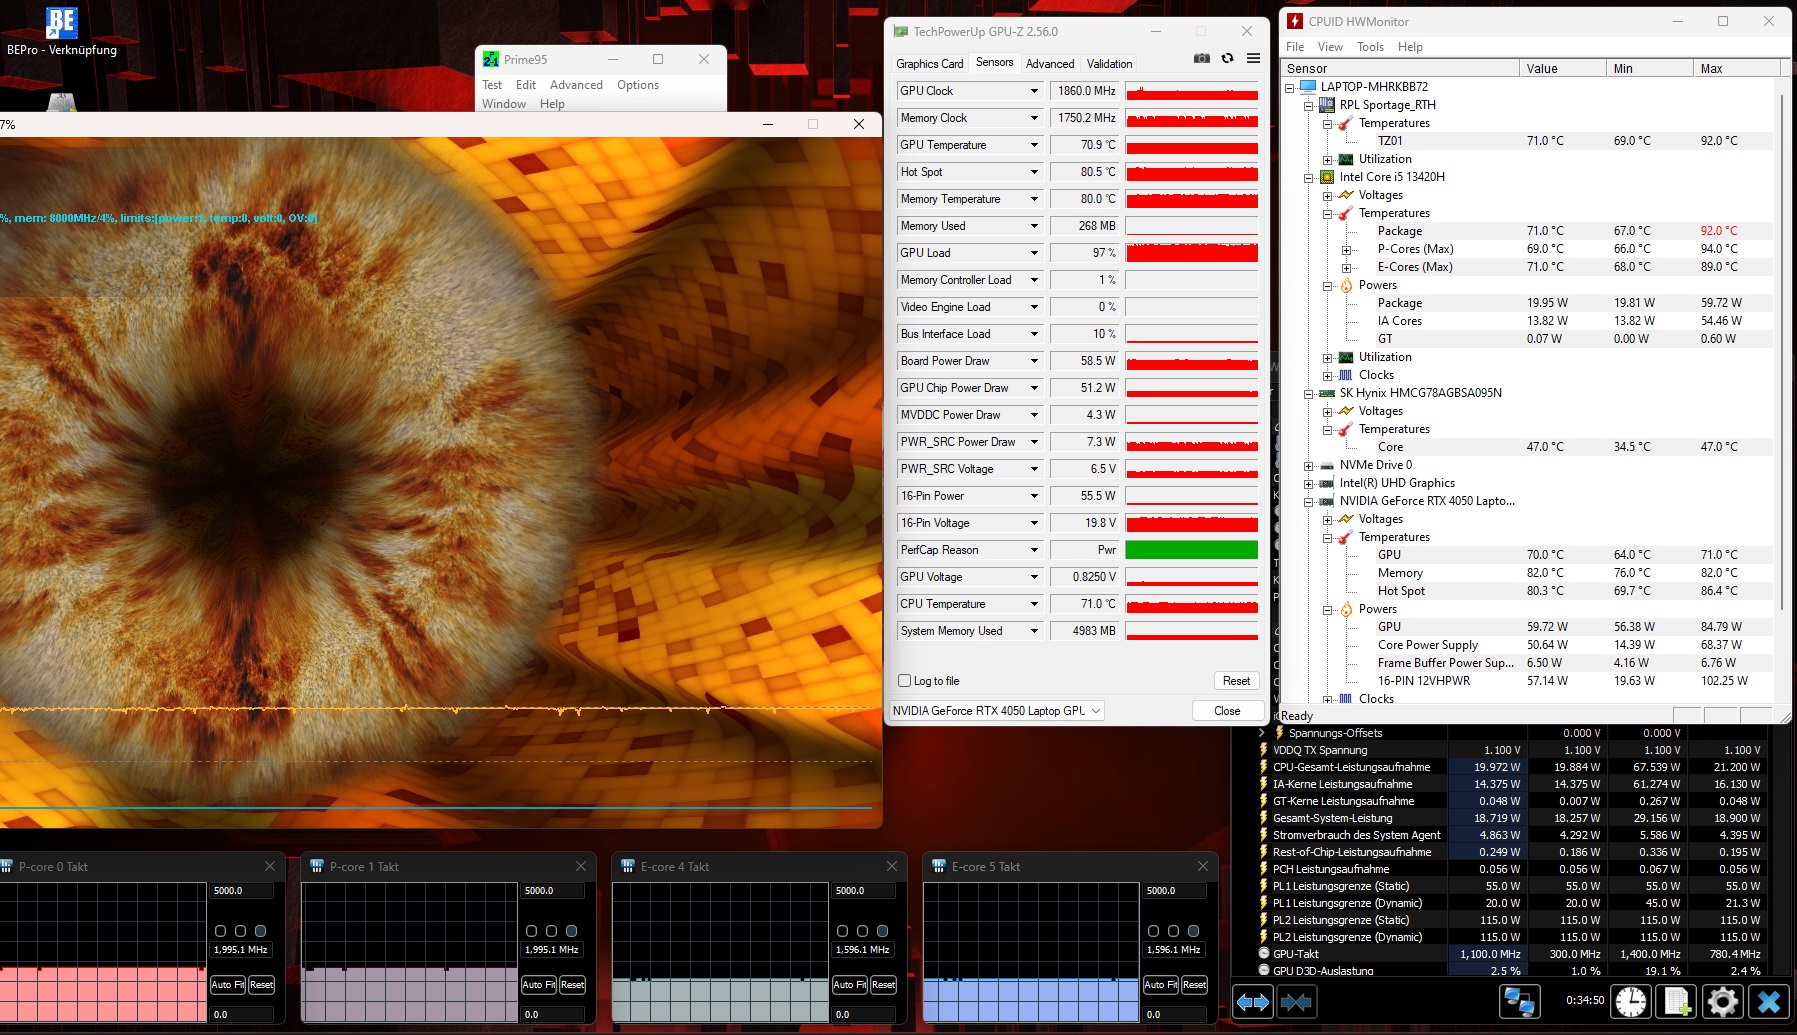
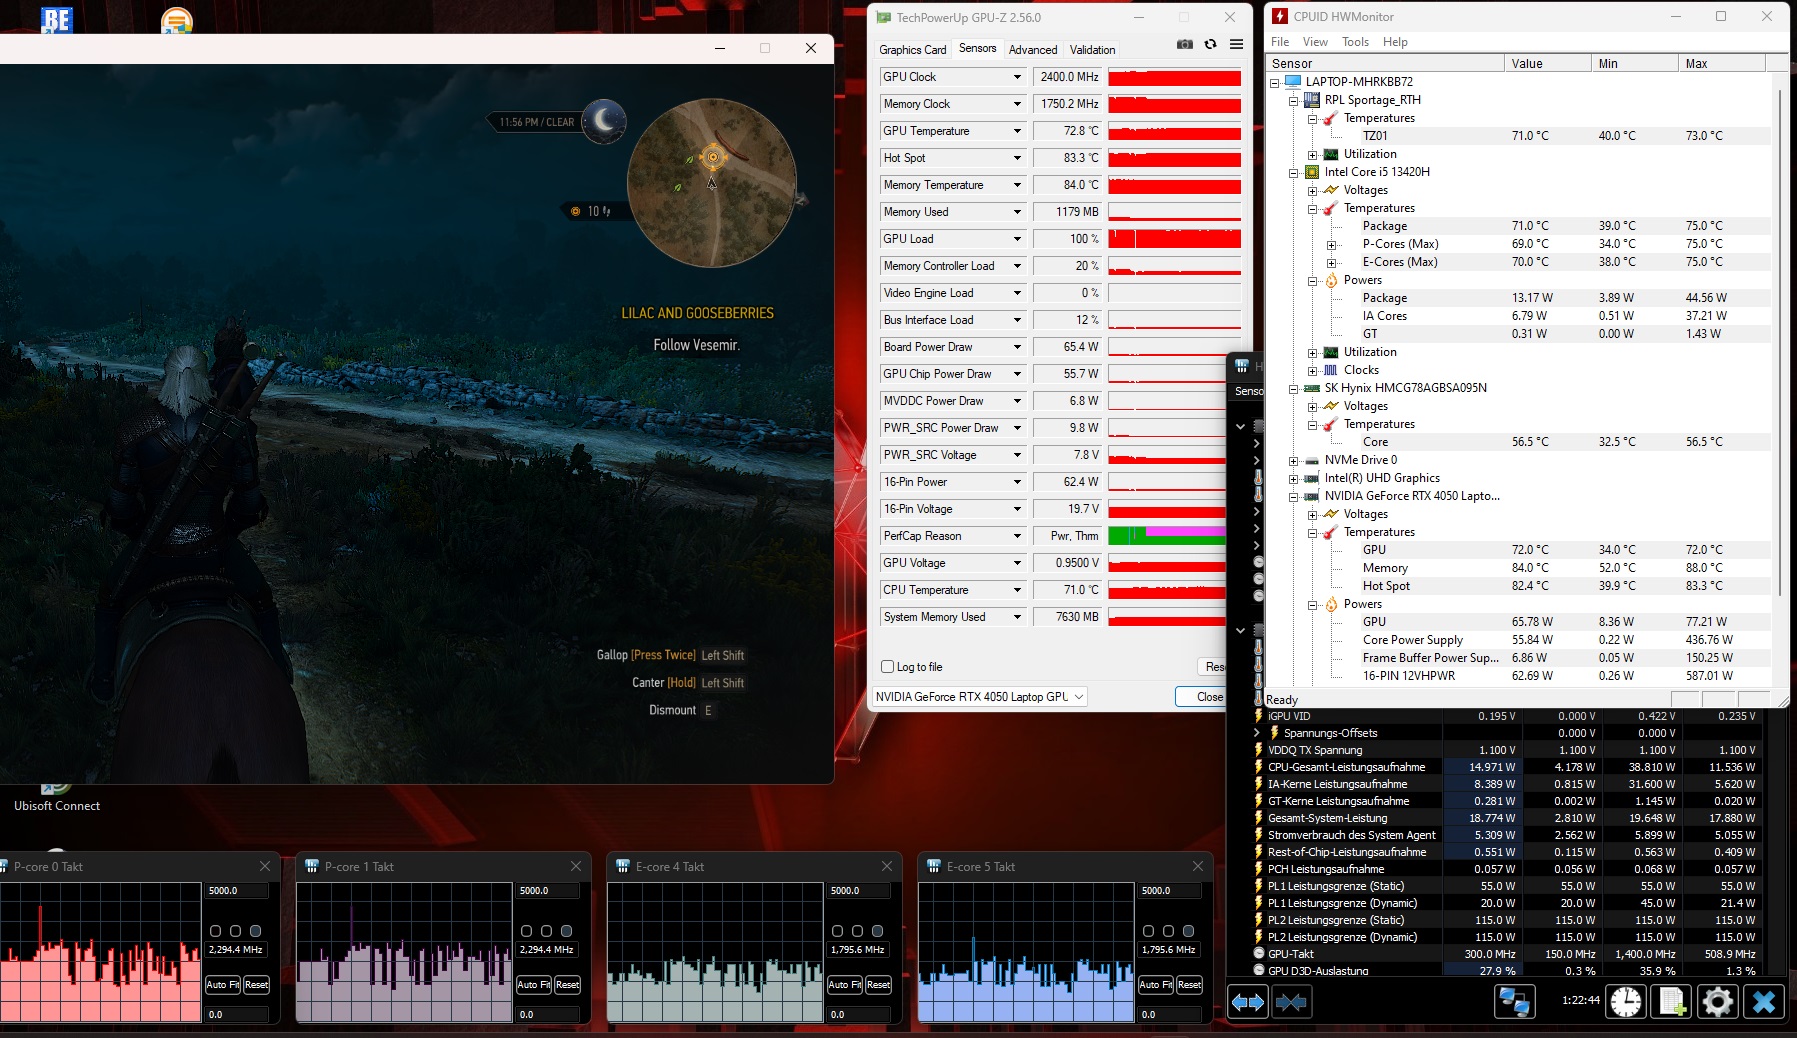
Teste de estresse
Os componentes do laptop também não superaquecem com carga total. A CPU e a GPU funcionaram a uma temperatura média de 71°C (159,8°F), o que é um valor relativamente bom que não é motivo de preocupação ou crítica. O teste de 60 minutos em Witcher 3 também produziu resultados semelhantes.
Alto-falantes
O Nitro V 15 oferece um som decente a bom para um notebook, mas, como geralmente acontece, faltam graves. No entanto, o volume máximo de 83 dB(A) é muito bom.
Acer Nitro V 15 ANV15-51-582S análise de áudio
(+) | os alto-falantes podem tocar relativamente alto (###valor### dB)
Graves 100 - 315Hz
(-) | quase nenhum baixo - em média 26.5% menor que a mediana
(±) | a linearidade dos graves é média (13.9% delta para a frequência anterior)
Médios 400 - 2.000 Hz
(+) | médios equilibrados - apenas 3.2% longe da mediana
(+) | médios são lineares (4.2% delta para frequência anterior)
Altos 2 - 16 kHz
(+) | agudos equilibrados - apenas 1.6% longe da mediana
(+) | os máximos são lineares (3.3% delta da frequência anterior)
Geral 100 - 16.000 Hz
(±) | a linearidade do som geral é média (15.9% diferença em relação à mediana)
Comparado com a mesma classe
» 38% de todos os dispositivos testados nesta classe foram melhores, 7% semelhantes, 56% piores
» O melhor teve um delta de 6%, a média foi 18%, o pior foi 132%
Comparado com todos os dispositivos testados
» 25% de todos os dispositivos testados foram melhores, 5% semelhantes, 70% piores
» O melhor teve um delta de 4%, a média foi 24%, o pior foi 134%
Asus TUF A15 FA507 análise de áudio
(±) | o volume do alto-falante é médio, mas bom (###valor### dB)
Graves 100 - 315Hz
(±) | graves reduzidos - em média 13.7% menor que a mediana
(+) | o baixo é linear (6.2% delta para a frequência anterior)
Médios 400 - 2.000 Hz
(±) | médios mais altos - em média 7.6% maior que a mediana
(±) | a linearidade dos médios é média (7.3% delta para frequência anterior)
Altos 2 - 16 kHz
(+) | agudos equilibrados - apenas 2.1% longe da mediana
(±) | a linearidade dos máximos é média (7.5% delta para frequência anterior)
Geral 100 - 16.000 Hz
(±) | a linearidade do som geral é média (17.2% diferença em relação à mediana)
Comparado com a mesma classe
» 46% de todos os dispositivos testados nesta classe foram melhores, 11% semelhantes, 42% piores
» O melhor teve um delta de 6%, a média foi 18%, o pior foi 132%
Comparado com todos os dispositivos testados
» 32% de todos os dispositivos testados foram melhores, 8% semelhantes, 60% piores
» O melhor teve um delta de 4%, a média foi 24%, o pior foi 134%
Gerenciamento de energia
Consumo de energia
Graças em parte à comutação de gráficos, o laptop de 15 polegadas requer uma quantidade bastante baixa de energia. Ele tem o menor consumo de energia em nossa comparação, consumindo apenas de 7 a 11 watts em modo inativo e de 76 a 136 watts em aplicativos 3D. Alguns dos outros dispositivos da comparação consomem muito mais energia.
| desligado | |
| Ocioso | |
| Carga |
|
Key:
min: | |
| Acer Nitro V 15 ANV15-51-582S GeForce RTX 4050 Laptop GPU, i5-13420H | Medion Erazer Crawler E40 - MD 62518 GeForce RTX 4050 Laptop GPU, i5-13500H | Lenovo LOQ 15IRH8 Core i7 GeForce RTX 4050 Laptop GPU, i7-13620H | Asus TUF A15 FA507 GeForce RTX 4050 Laptop GPU, R7 7735HS | Schenker XMG Apex 15 (Late 23) GeForce RTX 4050 Laptop GPU, R7 7840HS | Média da turma Gaming | |
|---|---|---|---|---|---|---|
| Power Consumption | -50% | -107% | -26% | -20% | -96% | |
| Idle Minimum * (Watt) | 7 | 10 -43% | 18.52 -165% | 8 -14% | 6 14% | 13.3 ? -90% |
| Idle Average * (Watt) | 8 | 15.3 -91% | 22.54 -182% | 12.1 -51% | 11 -38% | 19 ? -138% |
| Idle Maximum * (Watt) | 11 | 15.5 -41% | 29.79 -171% | 12.5 -14% | 14 -27% | 24.5 ? -123% |
| Load Average * (Watt) | 76 | 88 -16% | 94.5 -24% | 74.9 1% | 65 14% | 108.1 ? -42% |
| Witcher 3 ultra * (Watt) | 98.2 | 155 -58% | 154.4 -57% | 136.6 -39% | 136.5 -39% | |
| Load Maximum * (Watt) | 136 | 202.47 -49% | 190.4 -40% | 185 -36% | 195 -43% | 254 ? -87% |
* ... menor é melhor
Power consumption Witcher 3 / Stresstest
Power consumption with external monitor
Duração da bateria
Por outro lado, o Nitro V 15 é capaz de proporcionar uma excelente duração da bateria e faz isso apesar de sua bateria ter uma capacidade bastante modesta de 57 Wh. Em nosso teste de Wi-Fi (brilho reduzido para 150 cd/m²), o notebook Acer durou cerca de 9,5 horas, um resultado altamente respeitável para essa classe de laptop.
| Acer Nitro V 15 ANV15-51-582S i5-13420H, GeForce RTX 4050 Laptop GPU, 57 Wh | Medion Erazer Crawler E40 - MD 62518 i5-13500H, GeForce RTX 4050 Laptop GPU, 54 Wh | Lenovo LOQ 15IRH8 Core i7 i7-13620H, GeForce RTX 4050 Laptop GPU, 60 Wh | Asus TUF A15 FA507 R7 7735HS, GeForce RTX 4050 Laptop GPU, 90 Wh | Schenker XMG Apex 15 (Late 23) R7 7840HS, GeForce RTX 4050 Laptop GPU, 62.32 Wh | Média da turma Gaming | |
|---|---|---|---|---|---|---|
| Duração da bateria | -43% | -37% | -9% | -30% | -33% | |
| Reader / Idle (h) | 21.5 | 8.4 -61% | 8.71 ? -59% | |||
| WiFi v1.3 (h) | 9.4 | 4.1 -56% | 5.9 -37% | 11.7 24% | 7.1 -24% | 7.01 ? -25% |
| Load (h) | 1.7 | 1.2 -29% | 1 -41% | 1.6 -6% | 1.47 ? -14% | |
| H.264 (h) | 3.9 | 6.1 | 12.5 | 8.3 | 8.26 ? |
Pro
Contra
Veredicto
Os pontos fortes e as falhas do Acer Nitro V 15 ficaram evidentes durante nossos testes.
Embora o laptop tenha um design elegante, um chassi relativamente compacto e uma duração de bateria impressionante, a tela não está à altura dos padrões atuais (especialmente no que diz respeito à cobertura de cores e ao brilho).
O desempenho do Core i5-13420H e do GeForce RTX 4050 é mais ou menos o que se pode esperar de um laptop que custa cerca de € 1.000 (US$ 1.085).
Os jogadores que se preocupam com o preço estão recebendo uma plataforma de jogos sólida capaz de gerar taxas de quadros utilizáveis - pelo menos em Full HD.
Convenientemente, o laptop tem um slot de RAM livre e um segundo slot M.2 pronto para futuras atualizações. A seleção de portas também está atualizada graças ao Thunderbolt 4, embora ainda haja espaço para melhorias em alguns pontos.
Os concorrentes mencionados na análise, como o Lenovo LOQ 15IRH8 e o Asus TUF A15 FA507, receberam pontuações gerais ligeiramente mais altas devido às suas telas superiores.
Preço e disponibilidade
O Acer Nitro V 15 ANV15-51-582S com um Core i5-13420H e GeForce RTX 4050 está disponível em várias lojas on-line (por exemplo, notebooksbilliger.de) por cerca de 900 euros. Na Amazon US, o modelo com o Core i7-13620H mais rápido pode ser adquirido por cerca de US$950.
Acer Nitro V 15 ANV15-51-582S
- 01/16/2024 v7 (old)
Florian Glaser
Transparência
A seleção dos dispositivos a serem analisados é feita pela nossa equipe editorial. A amostra de teste foi fornecida ao autor como empréstimo pelo fabricante ou varejista para fins desta revisão. O credor não teve influência nesta revisão, nem o fabricante recebeu uma cópia desta revisão antes da publicação. Não houve obrigação de publicar esta revisão. Como empresa de mídia independente, a Notebookcheck não está sujeita à autoridade de fabricantes, varejistas ou editores.
É assim que o Notebookcheck está testando
Todos os anos, o Notebookcheck analisa de forma independente centenas de laptops e smartphones usando procedimentos padronizados para garantir que todos os resultados sejam comparáveis. Desenvolvemos continuamente nossos métodos de teste há cerca de 20 anos e definimos padrões da indústria no processo. Em nossos laboratórios de teste, equipamentos de medição de alta qualidade são utilizados por técnicos e editores experientes. Esses testes envolvem um processo de validação em vários estágios. Nosso complexo sistema de classificação é baseado em centenas de medições e benchmarks bem fundamentados, o que mantém a objetividade.Price comparison

