Revisão do laptop HP Victus 15: Caro para um jogador de orçamento
A série HP Victus consiste em laptops para jogos de baixo custo para contrastar com a série Omen mais avançada do fabricante. Como tal, os modelos Victus têm especificações mais baixas e opções configuráveis limitadas, a fim de manter os preços baixos e competitivos. Dois modelos compõem a série até o momento: Os modelos Victus de 15,6 polegadas e 16,1 polegadas Vitória 16.
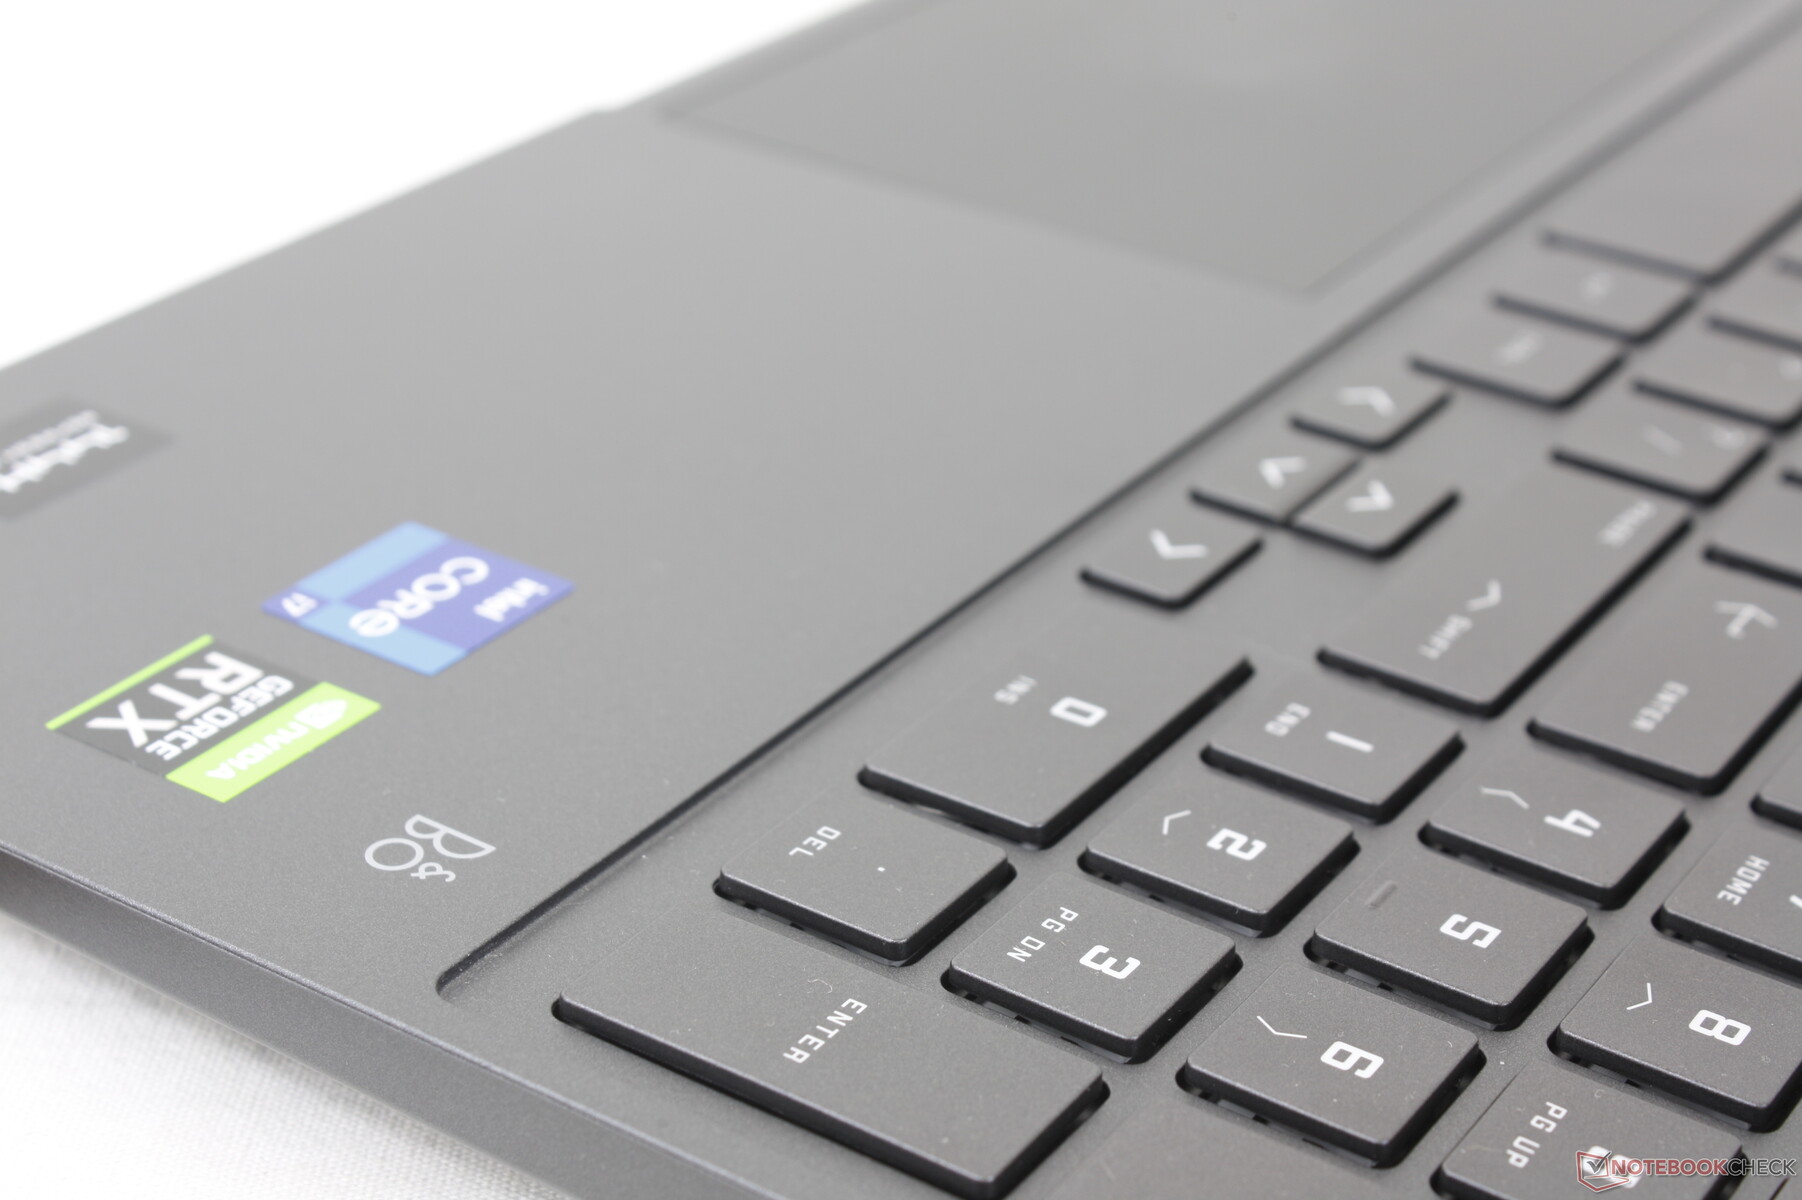
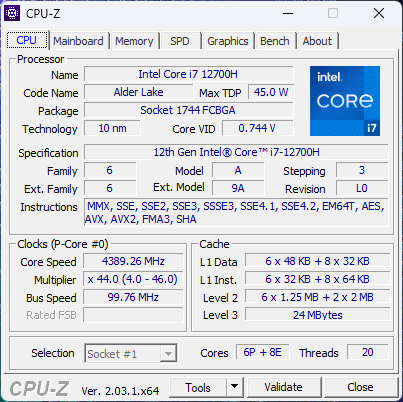
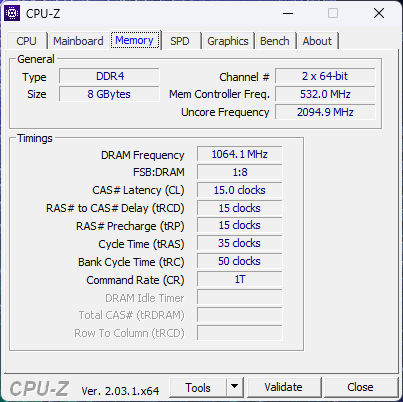
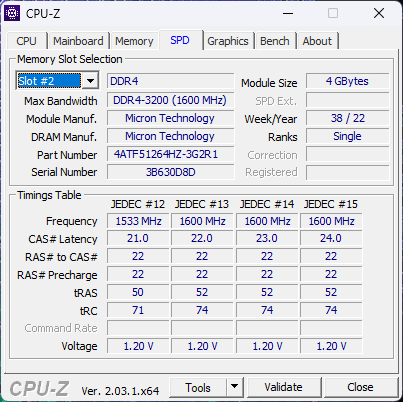
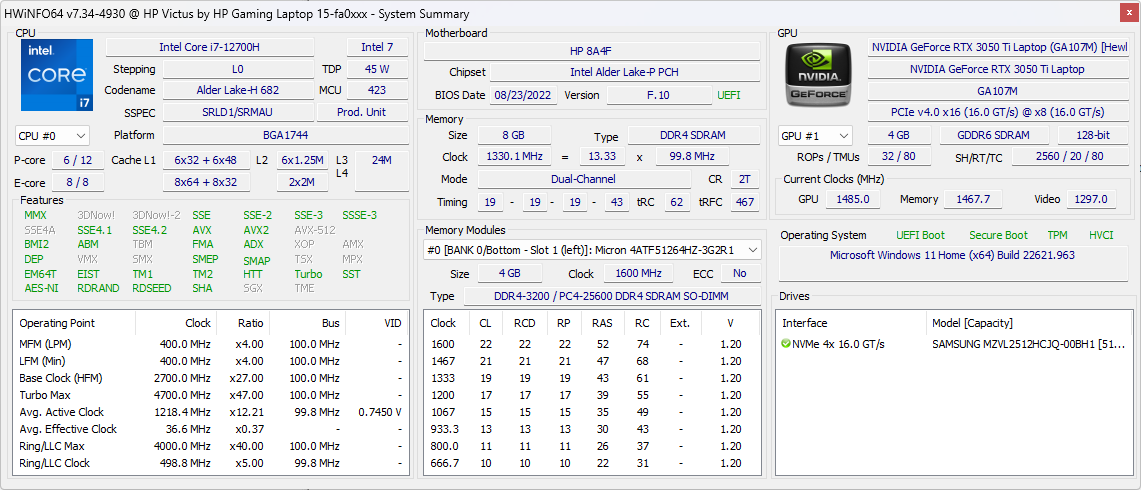
Nossa unidade de teste é a Victus 15 equipada com uma CPU Intel 12th gen Core i7-12700H, GeForce RTX 3050 Ti, 144 Hz 1080p IPS display, e apenas 8 GB de RAM por aproximadamente $1200 a $1300 USD varejo. SKUs menores estão disponíveis com a tela Core i7-12650H, AMD Ryzen 7 5800H, RTX 3050, ou 60 Hz 1080p por várias centenas de dólares a menos, mas nossa CPU e configuração GPU é a mais alta para este modelo.
Os concorrentes ao Victus 15 incluem outros laptops de 15,6 polegadas de nível básico, como o Dell G5 15, Lenovo IdeaPad Gaming 3, MSI GF ou Série GPou o Série Asus TUF.
Mais análises da HP:
Possíveis concorrentes em comparação
Avaliação | Data | Modelo | Peso | Altura | Size | Resolução | Preço |
|---|---|---|---|---|---|---|---|
| 81 % v7 (old) | 01/2023 | HP Victus 15 fa0020nr i7-12700H, GeForce RTX 3050 Ti Laptop GPU | 2.3 kg | 23.6 mm | 15.60" | 1920x1080 | |
| 82.8 % v7 (old) | 01/2021 | HP Omen 15-en0375ng R7 4800H, GeForce RTX 2060 Mobile | 2.2 kg | 23 mm | 15.60" | 1920x1080 | |
| 82.7 % v7 (old) | 10/2021 | Dell G15 5515 R7 5800H, GeForce RTX 3050 Ti Laptop GPU | 2.4 kg | 24.9 mm | 15.60" | 1920x1080 | |
| 84.9 % v7 (old) | 08/2022 | Asus TUF Dash F15 FX517ZC i7-12650H, GeForce RTX 3050 4GB Laptop GPU | 1.9 kg | 20.7 mm | 15.60" | 2560x1440 | |
| 78.2 % v7 (old) | 04/2022 | MSI Bravo 15 B5DD-010US R5 5600H, Radeon RX 5500M | 2.3 kg | 24.95 mm | 15.60" | 1920x1080 | |
| 87.5 % v7 (old) | 11/2022 | Lenovo Legion 5 15IAH7H 82RB i7-12700H, GeForce RTX 3060 Laptop GPU | 2.4 kg | 19.99 mm | 15.60" | 1920x1080 |
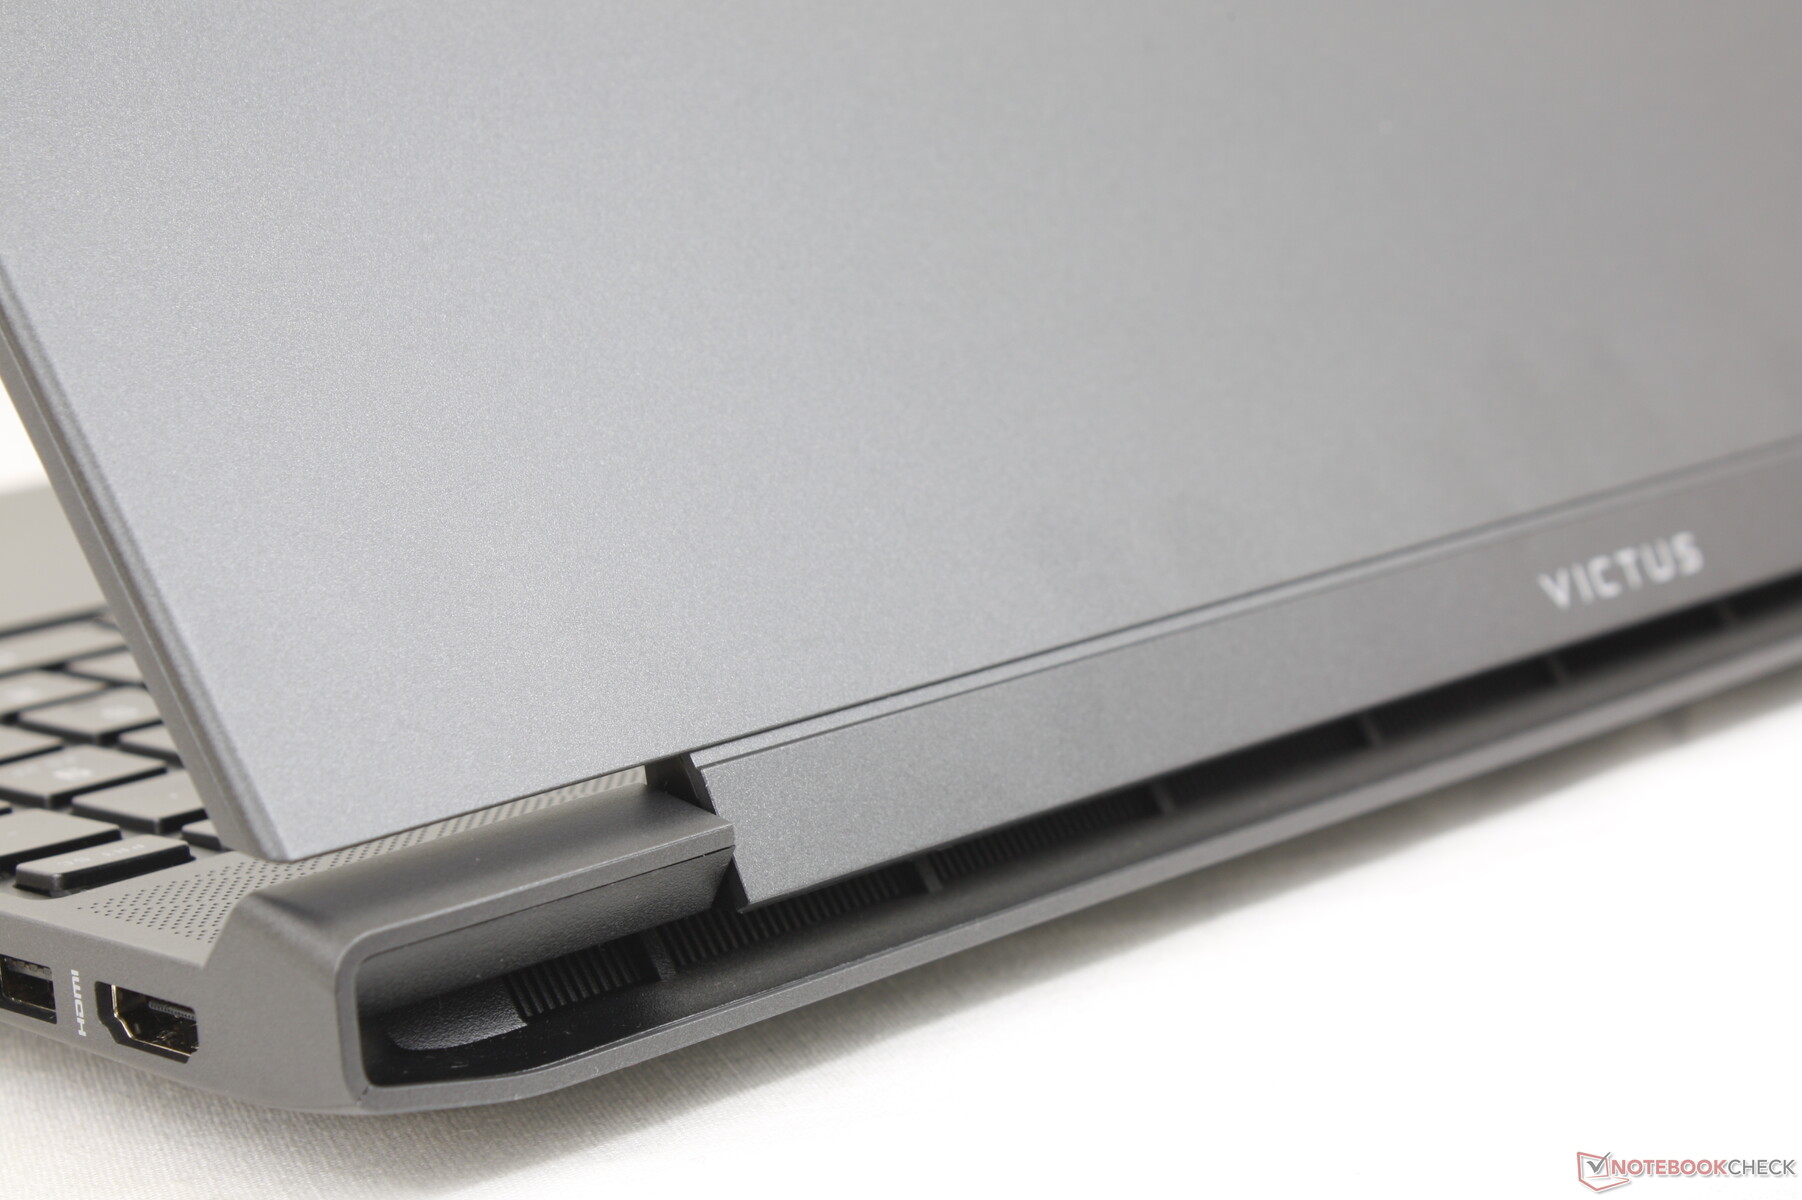
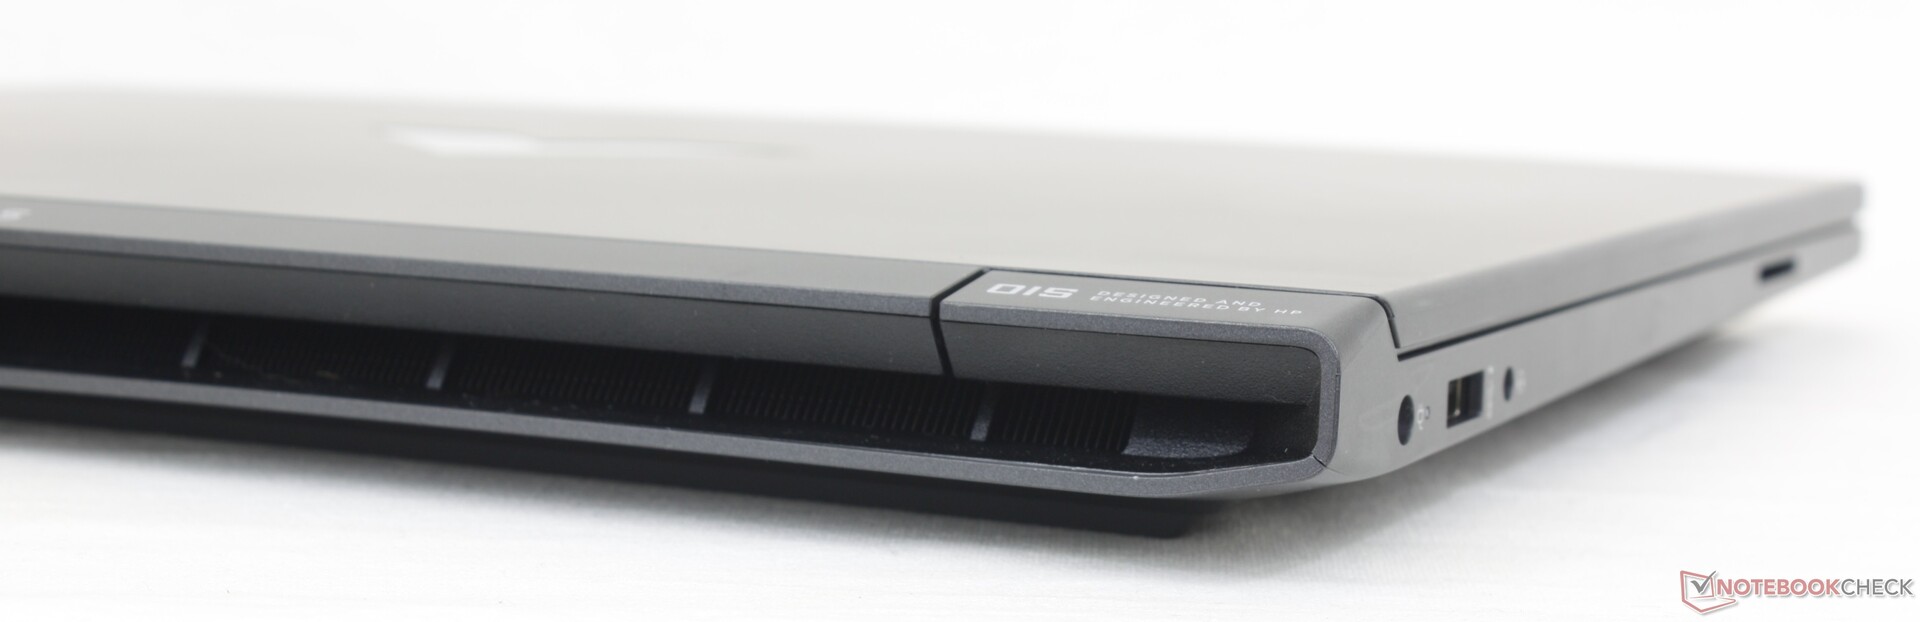
Estojo - Boa aparência em um orçamento
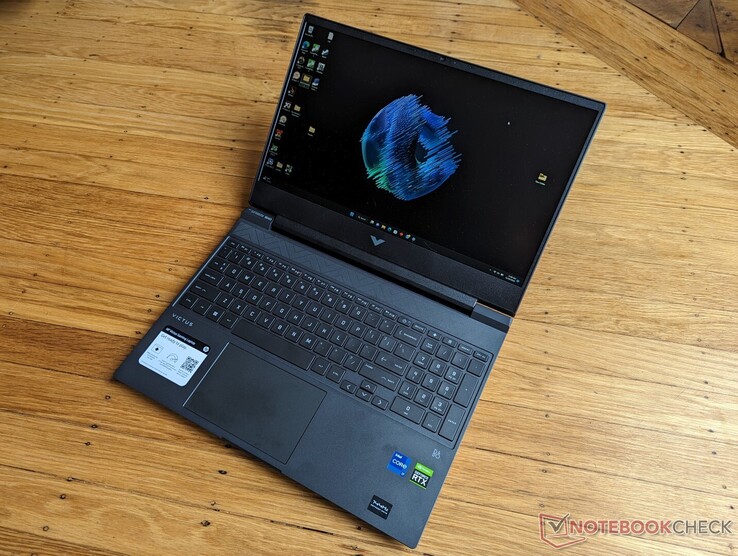
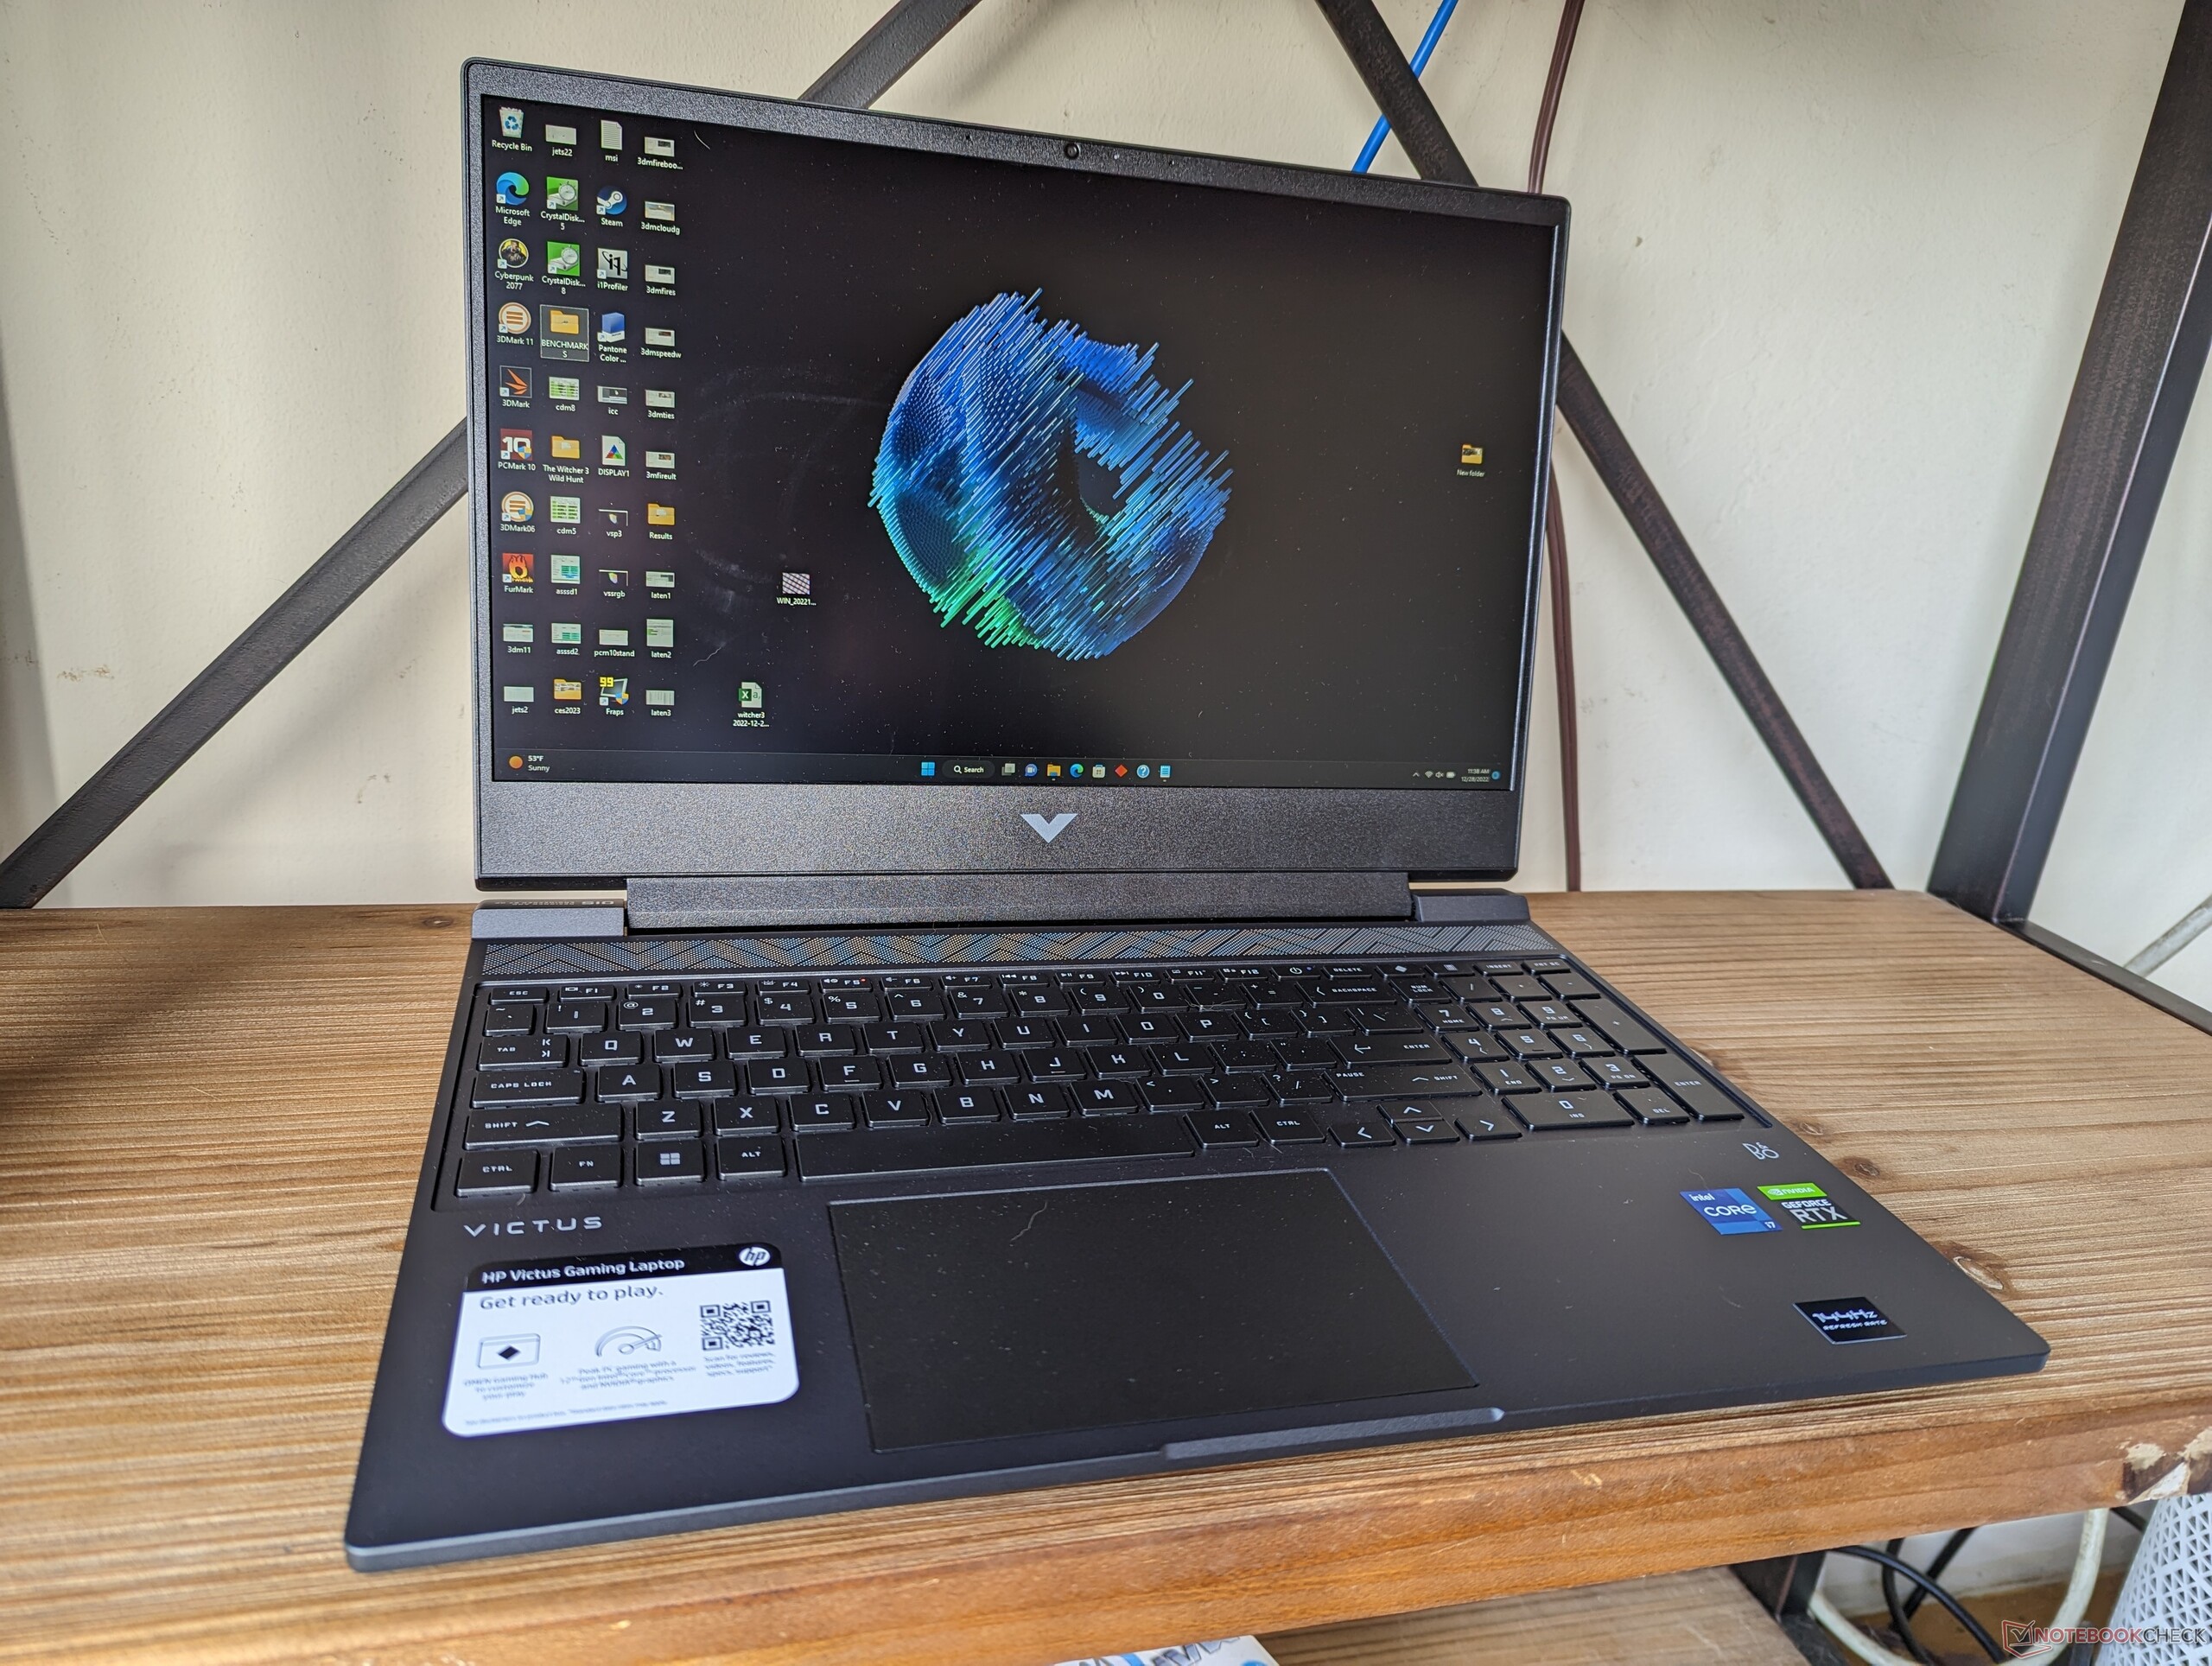
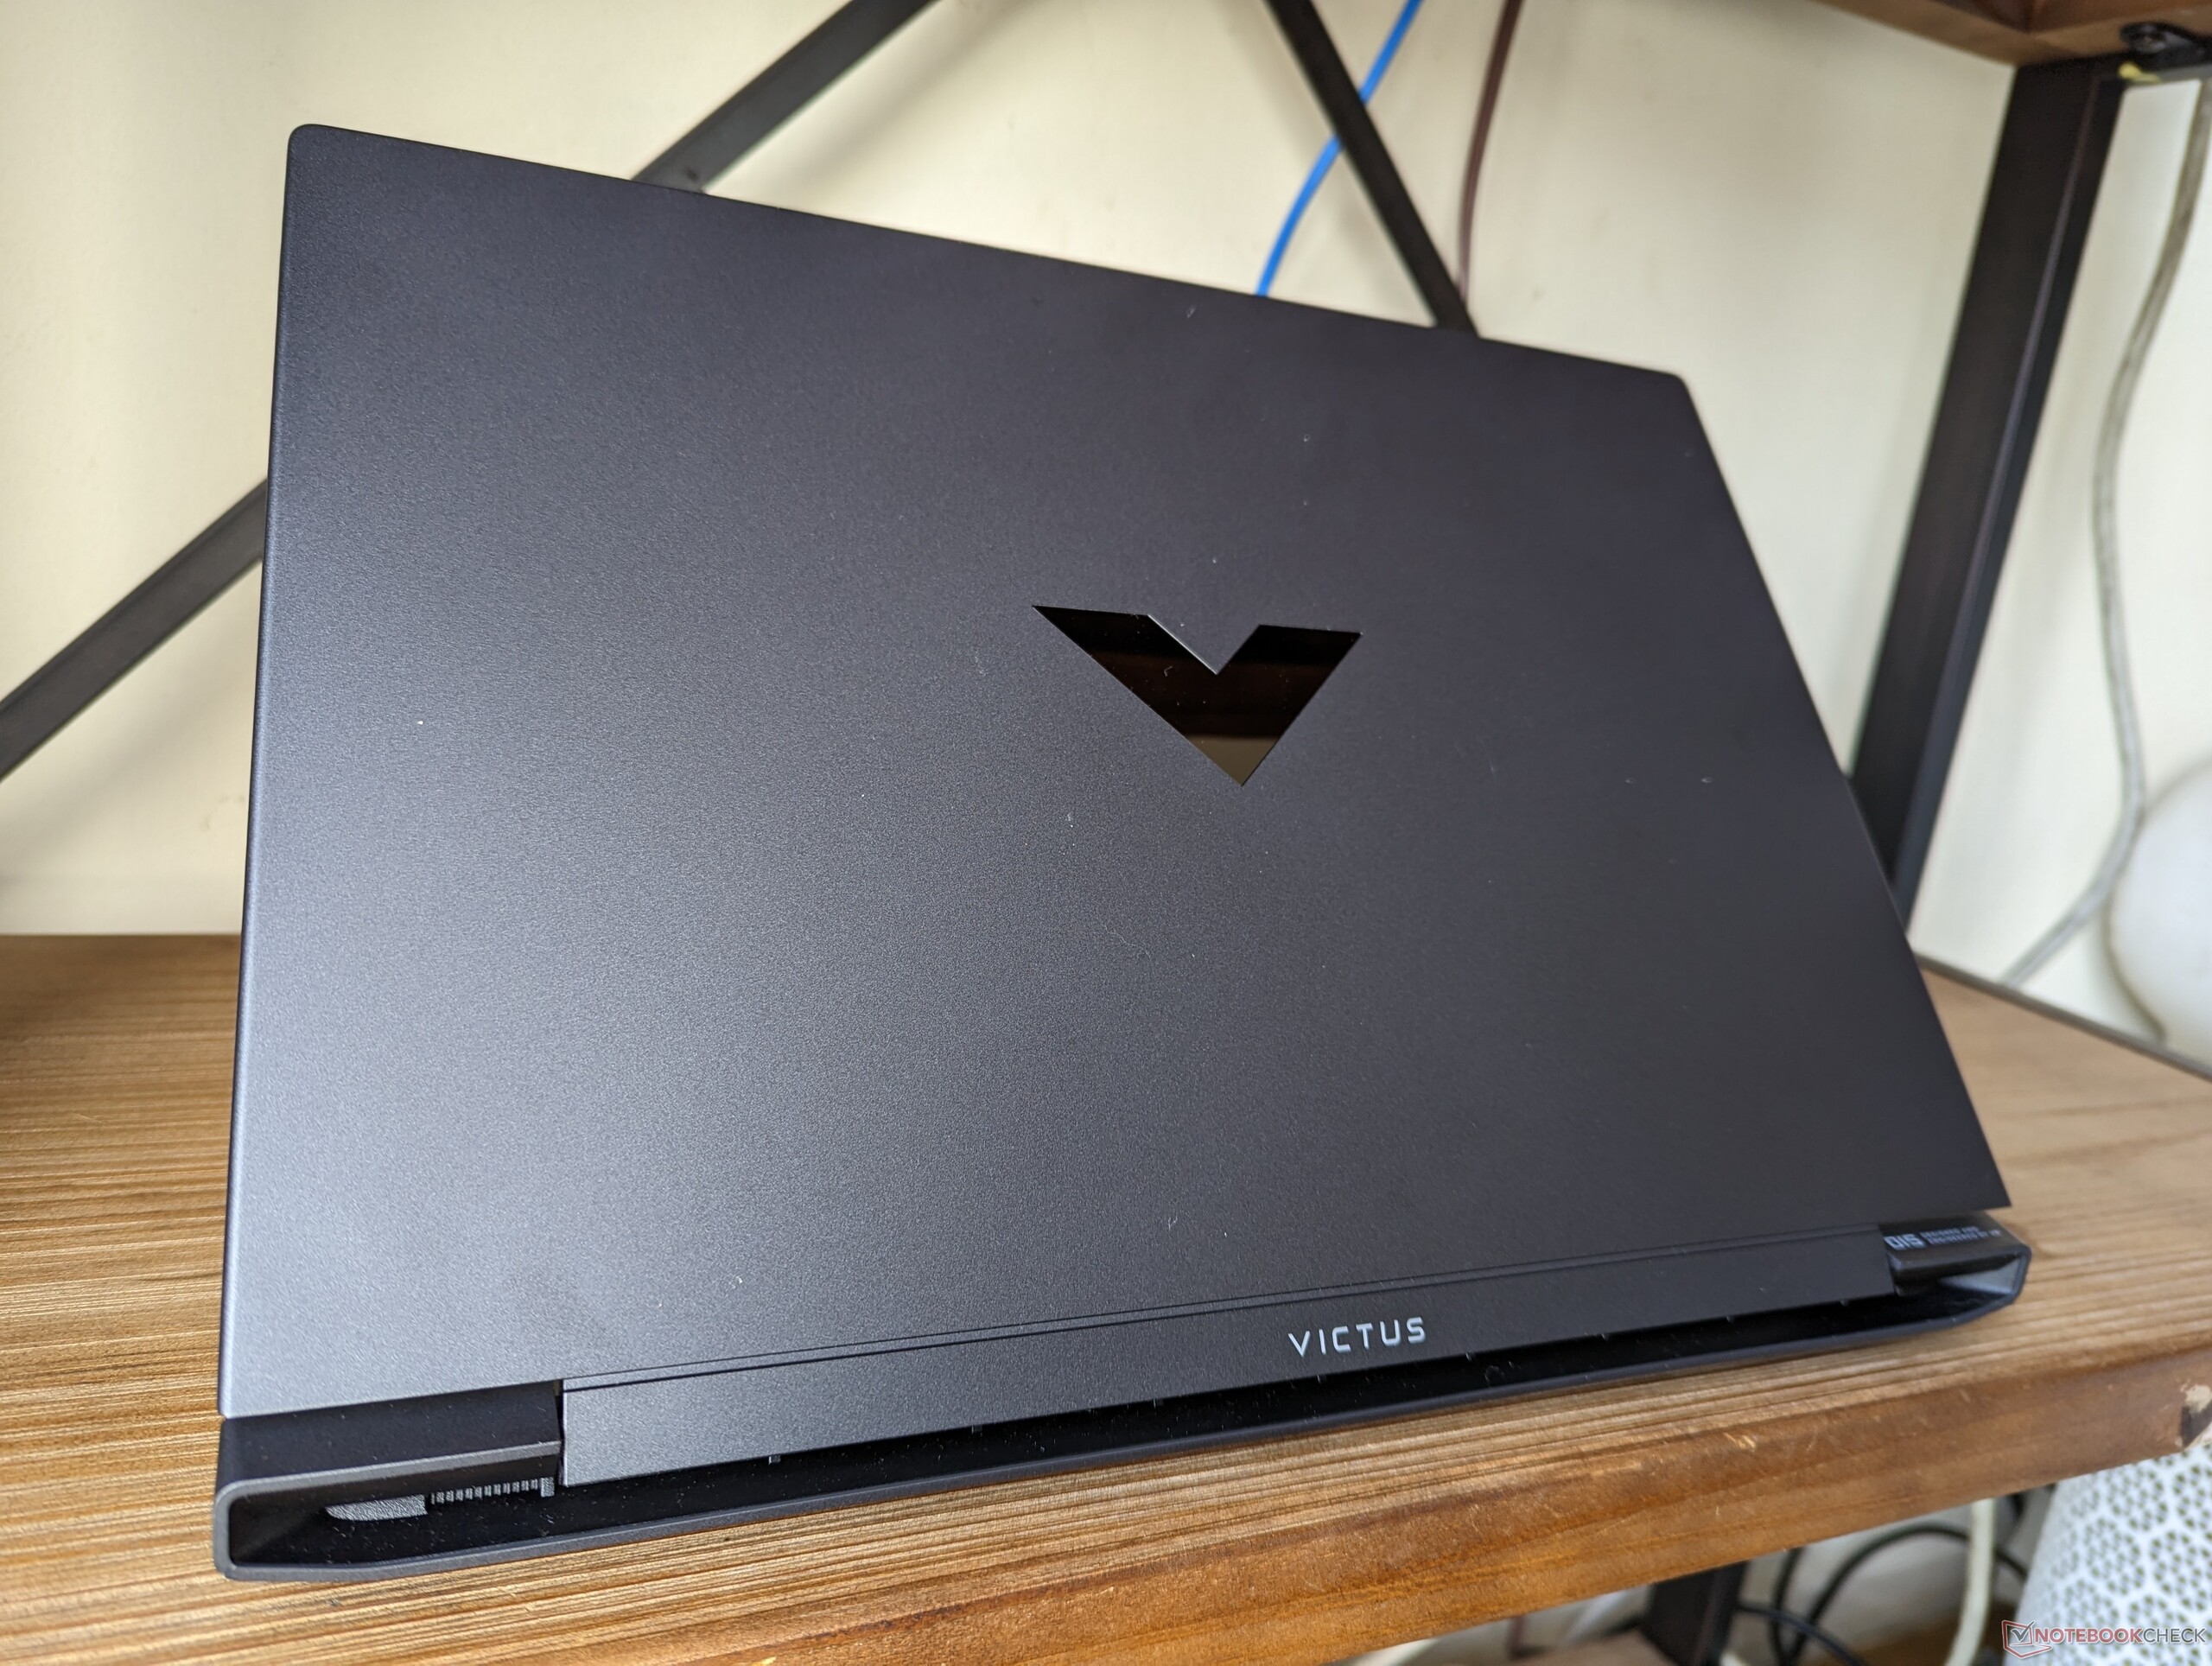
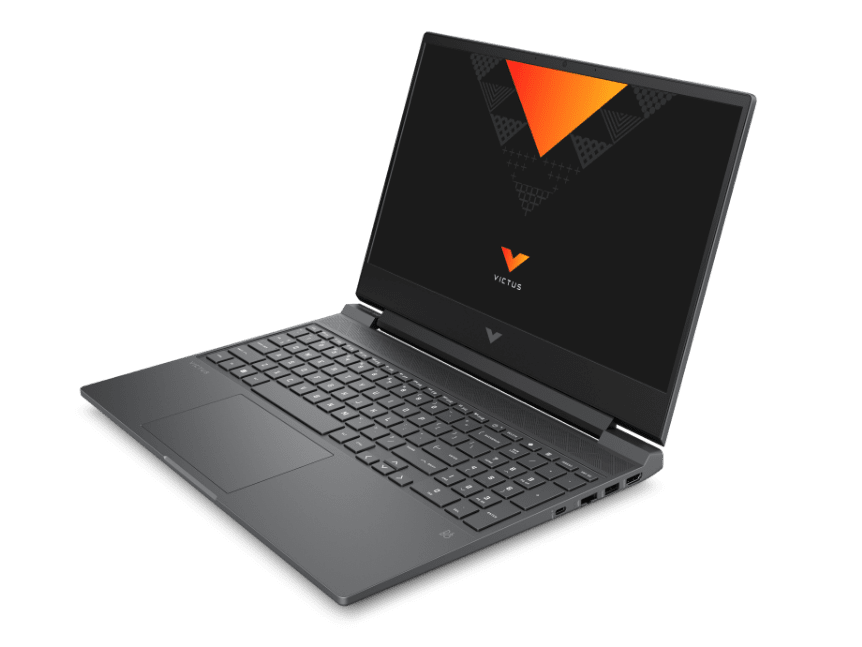
O chassi consiste de contornos mais nítidos e uma traseira maior para contrastar o aspecto mais simples e quadrado do Omen 15 ou 16. É um design inofensivo, todo preto, sem nenhum dos sotaques superficiais desnecessários ou estética "gamer" óbvia que outros laptops para jogos de nível básico tendem a ter.
A rigidez do chassi é um passo abaixo da série Omen, especialmente no que diz respeito às dobradiças. O visor tende a ranger ao ajustar os ângulos e as dobradiças não se sentem muito robustas quando são abertas até o fim. Caso contrário, a base é muito boa para um sistema de orçamento com apenas pequenas deformações quando se tenta torcê-la.
O sistema é tanto maior e mais pesado do que o mais caro Omen 15 mesmo que o Victus 15 seja um laptop mais lento. Felizmente, não é tão volumoso quanto o concorrente Dell G15, mas ainda está no lado pesado com 2,3 kg. O Asus TUF Dash F15 é várias centenas de gramas mais leve em comparação.
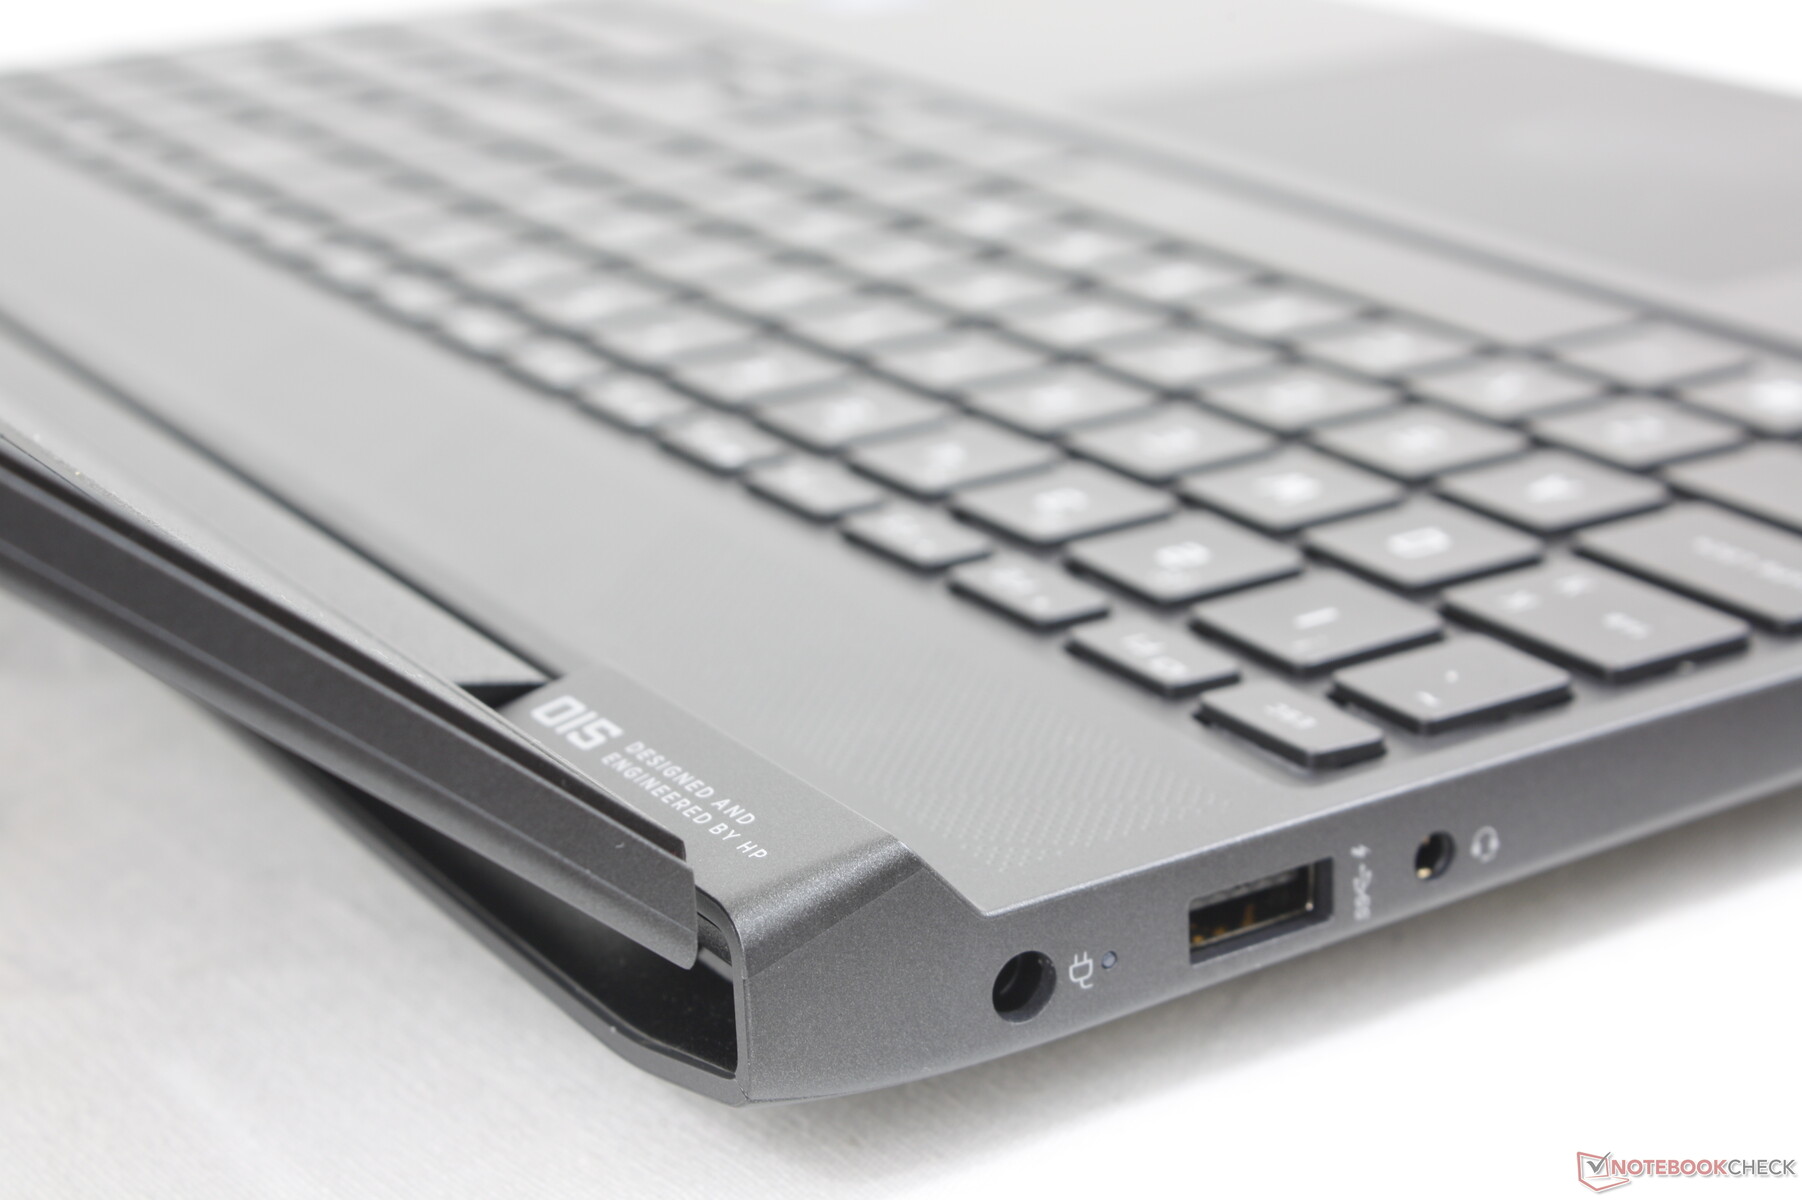
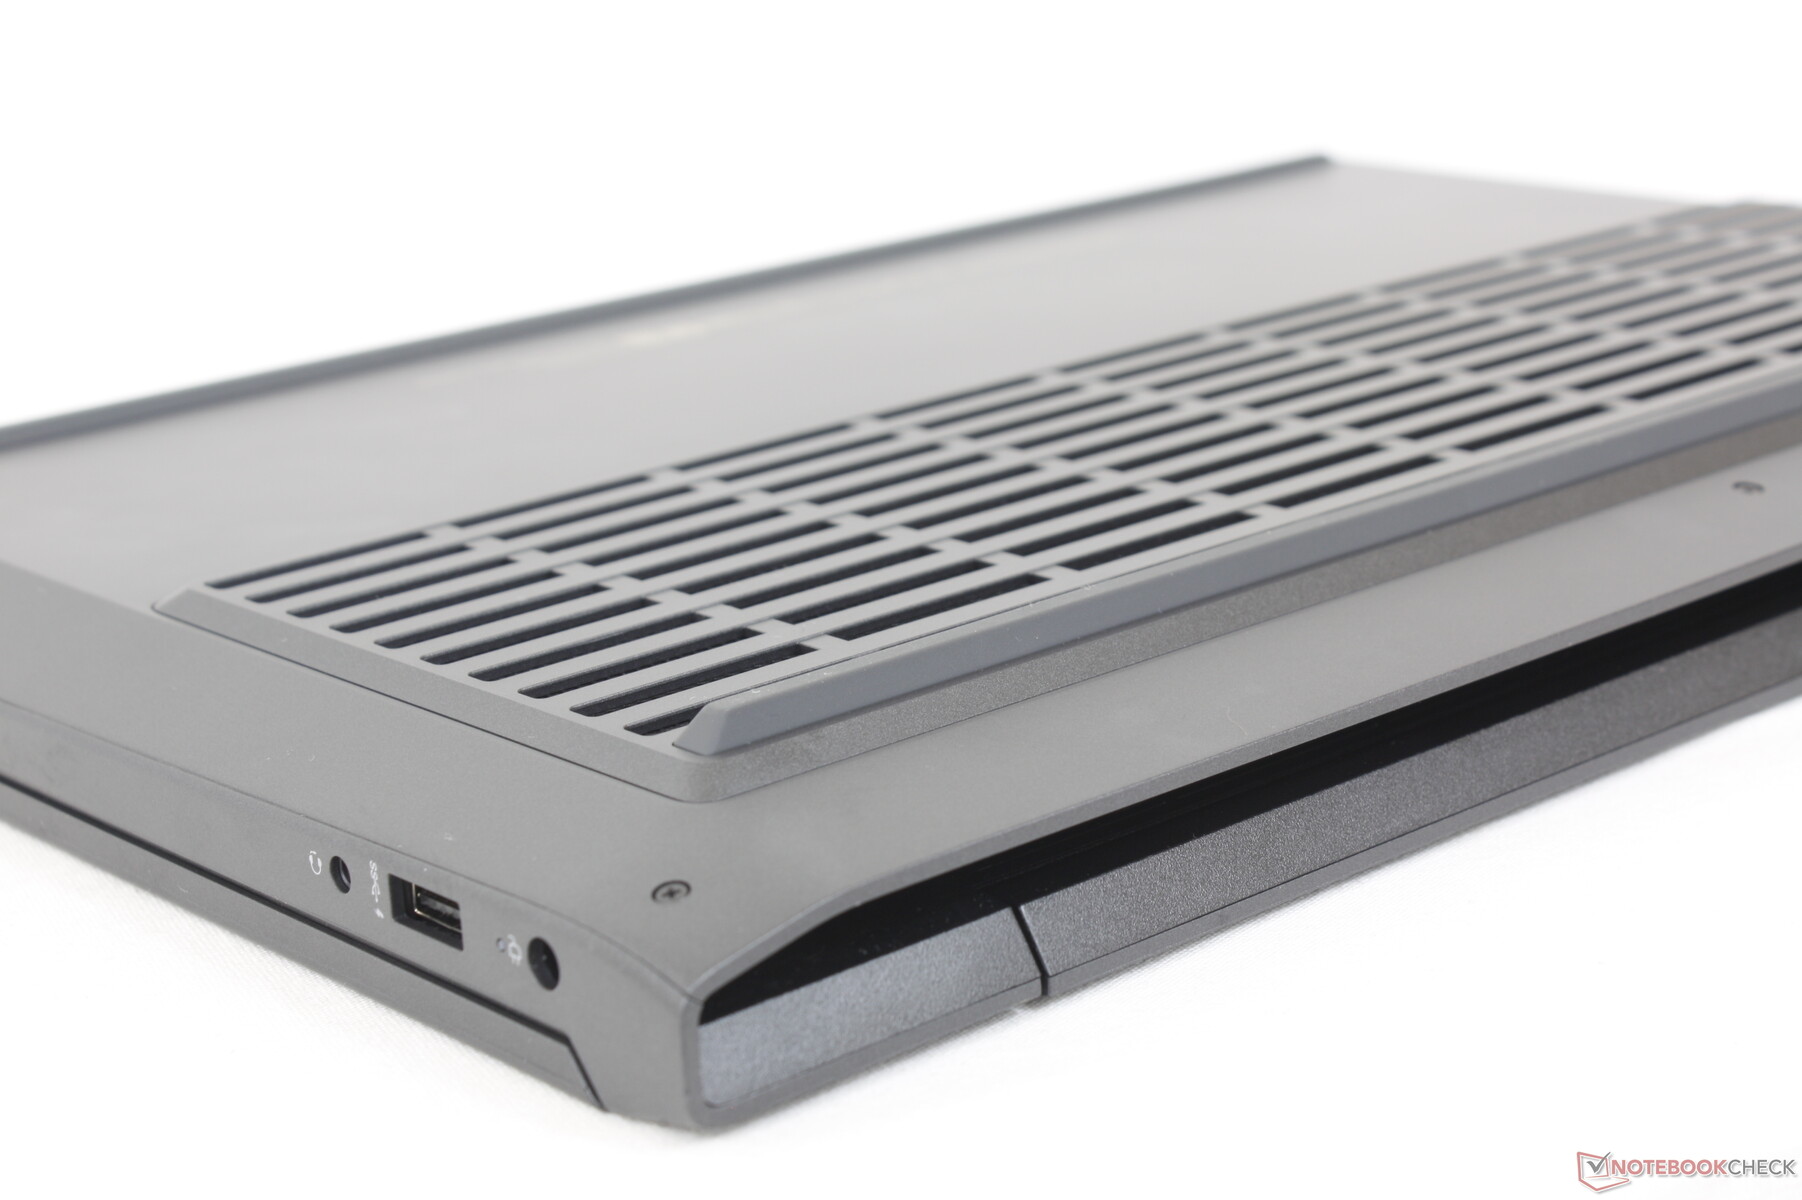
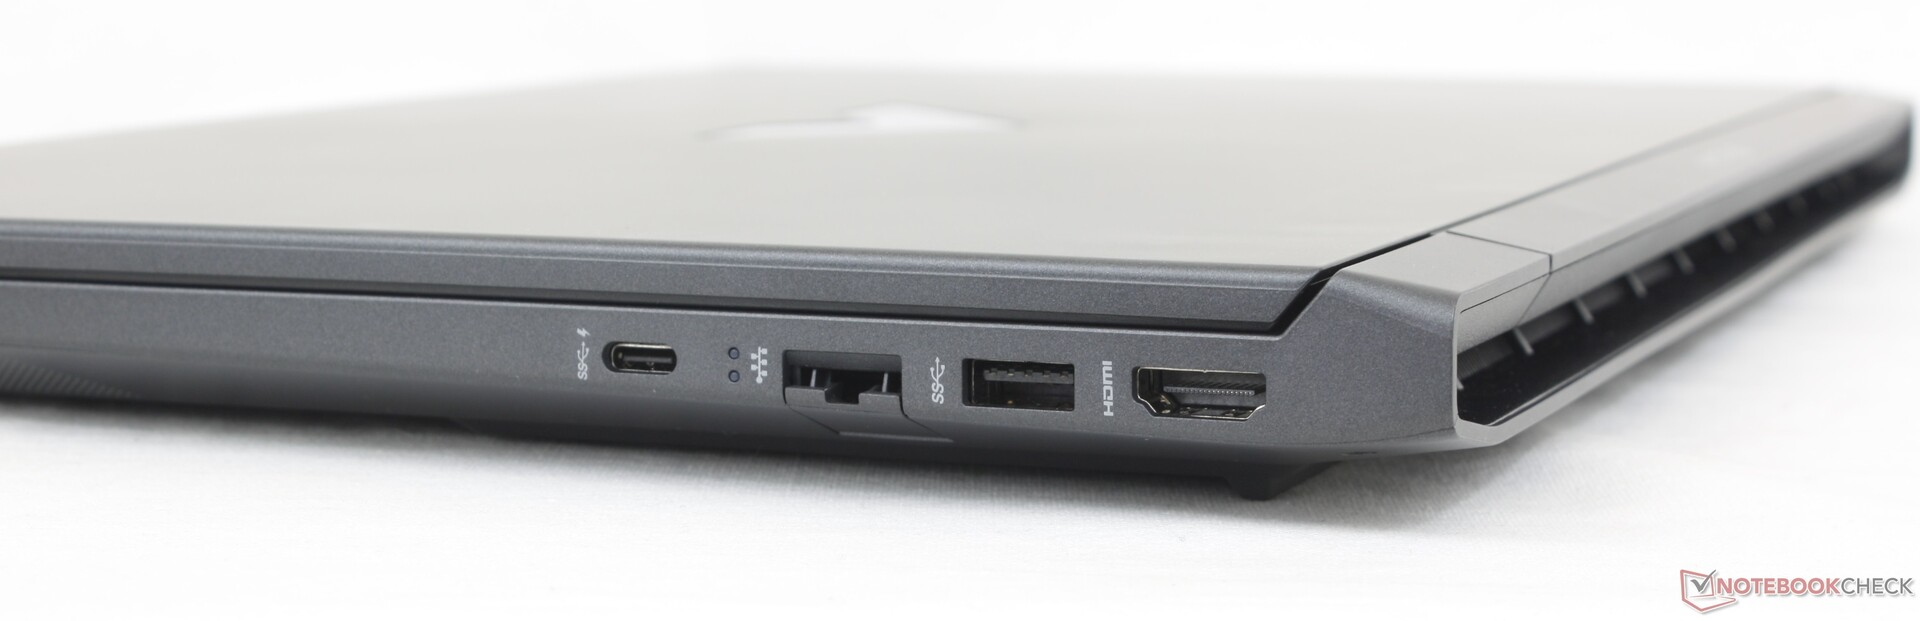
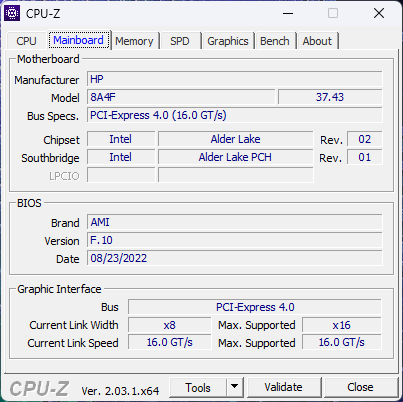
Conectividade - Sem suporte de relâmpagos
Todas as portas do Omen 15 estão presentes no Victus 15, com exceção de uma porta USB-A. O Thunderbolt não é suportado aqui, o que provavelmente economizará custos.
O posicionamento das portas é indiscutivelmente melhor do que na Dell G15 ou Lenovo Legion 5 15 já que não há portas ao longo da parte traseira do HP para facilitar o acesso.
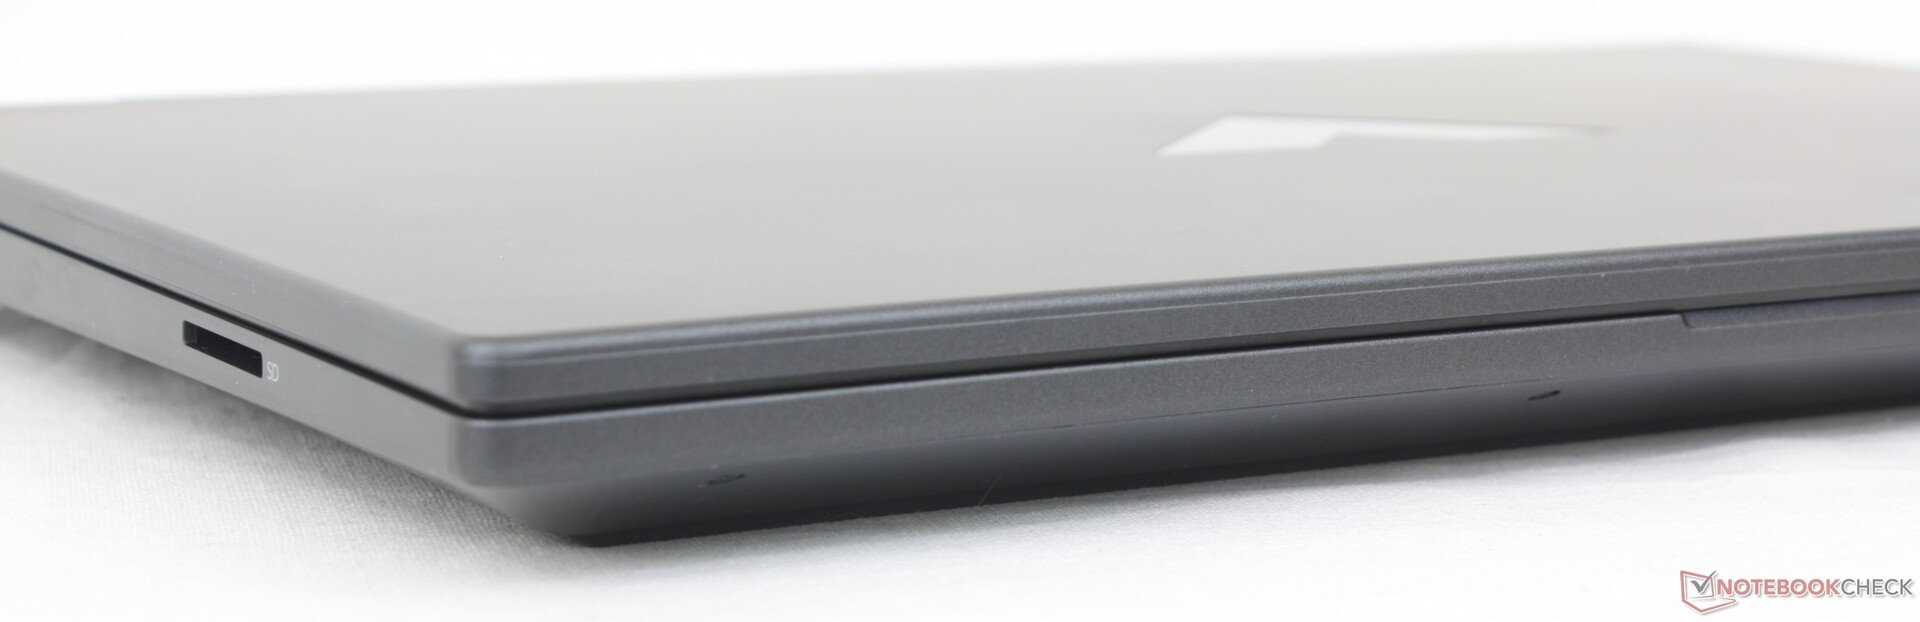
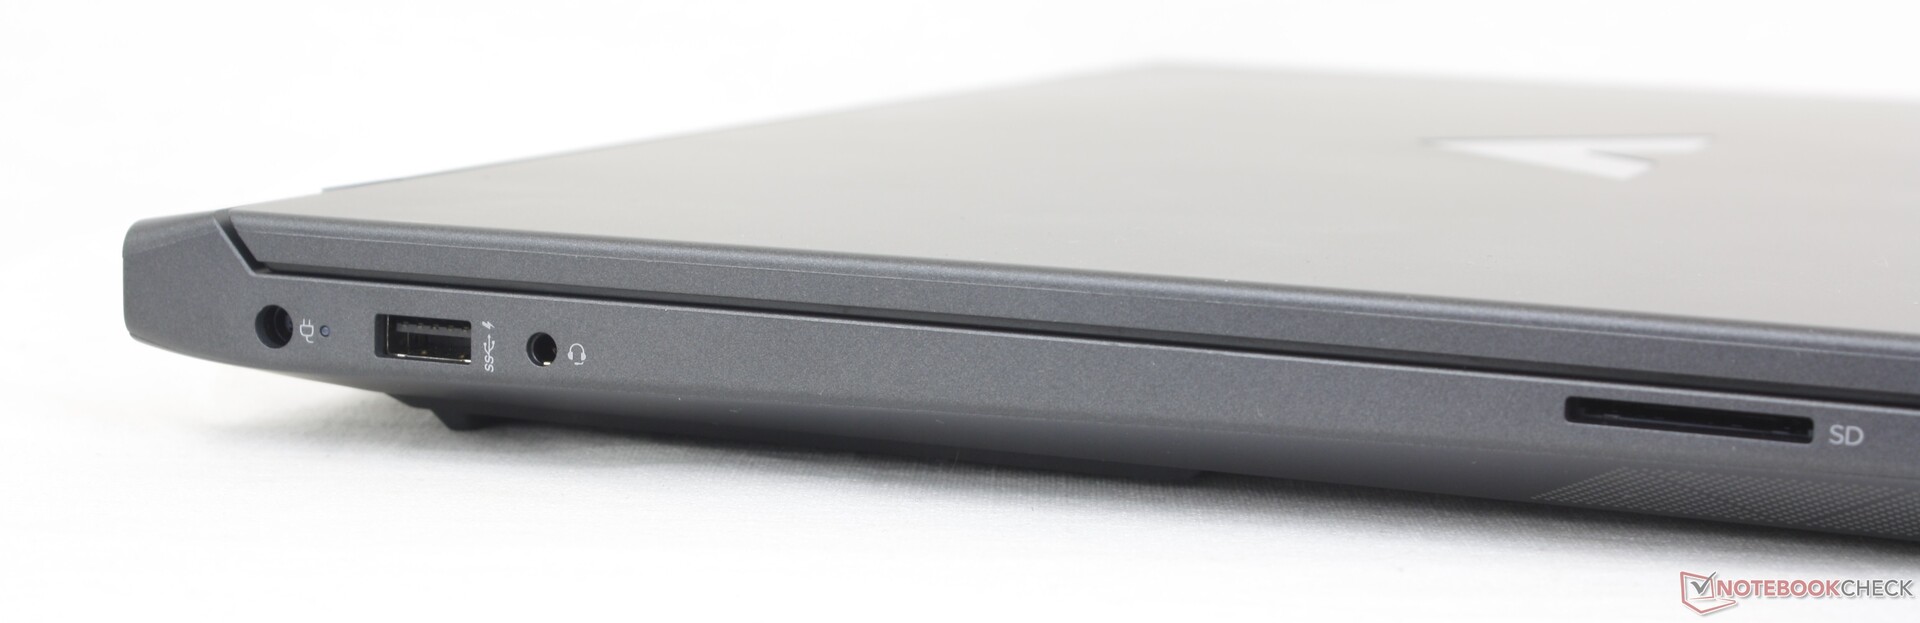
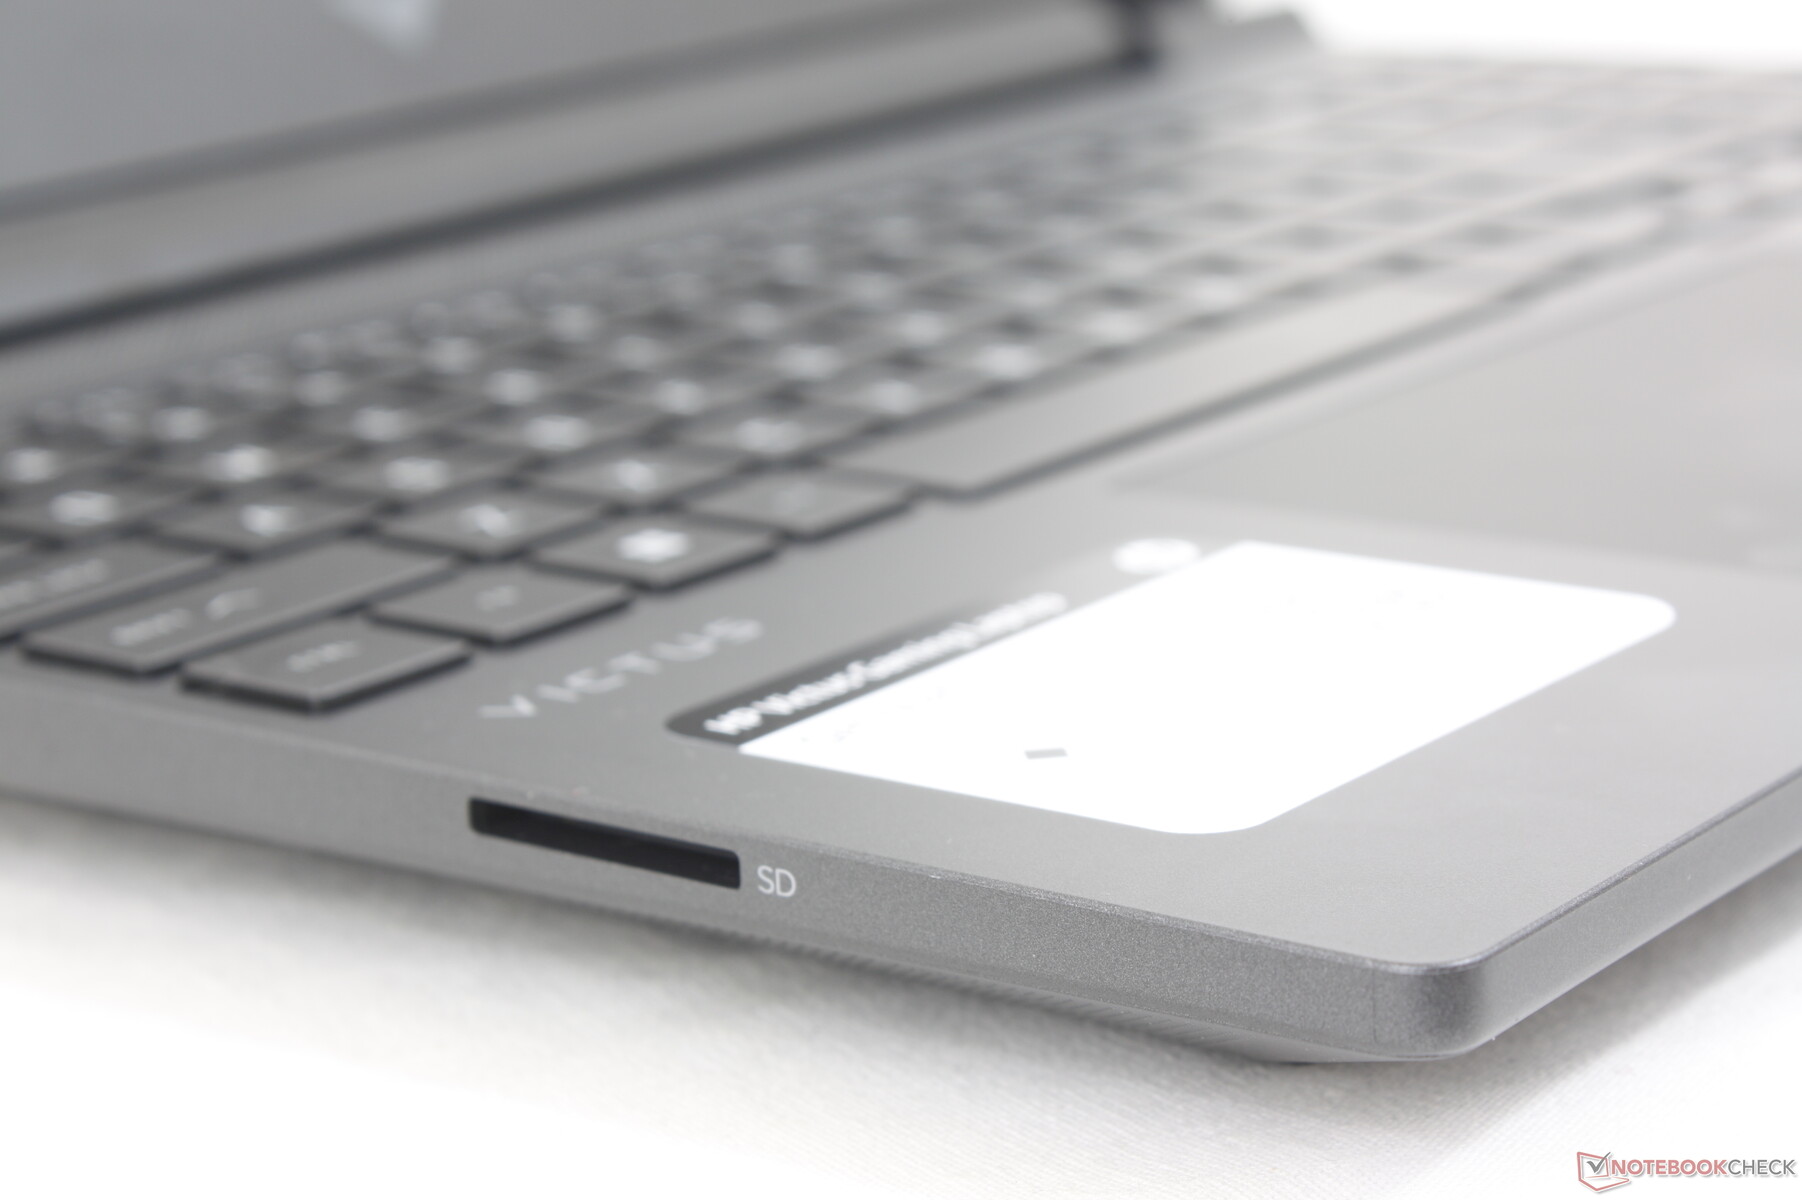
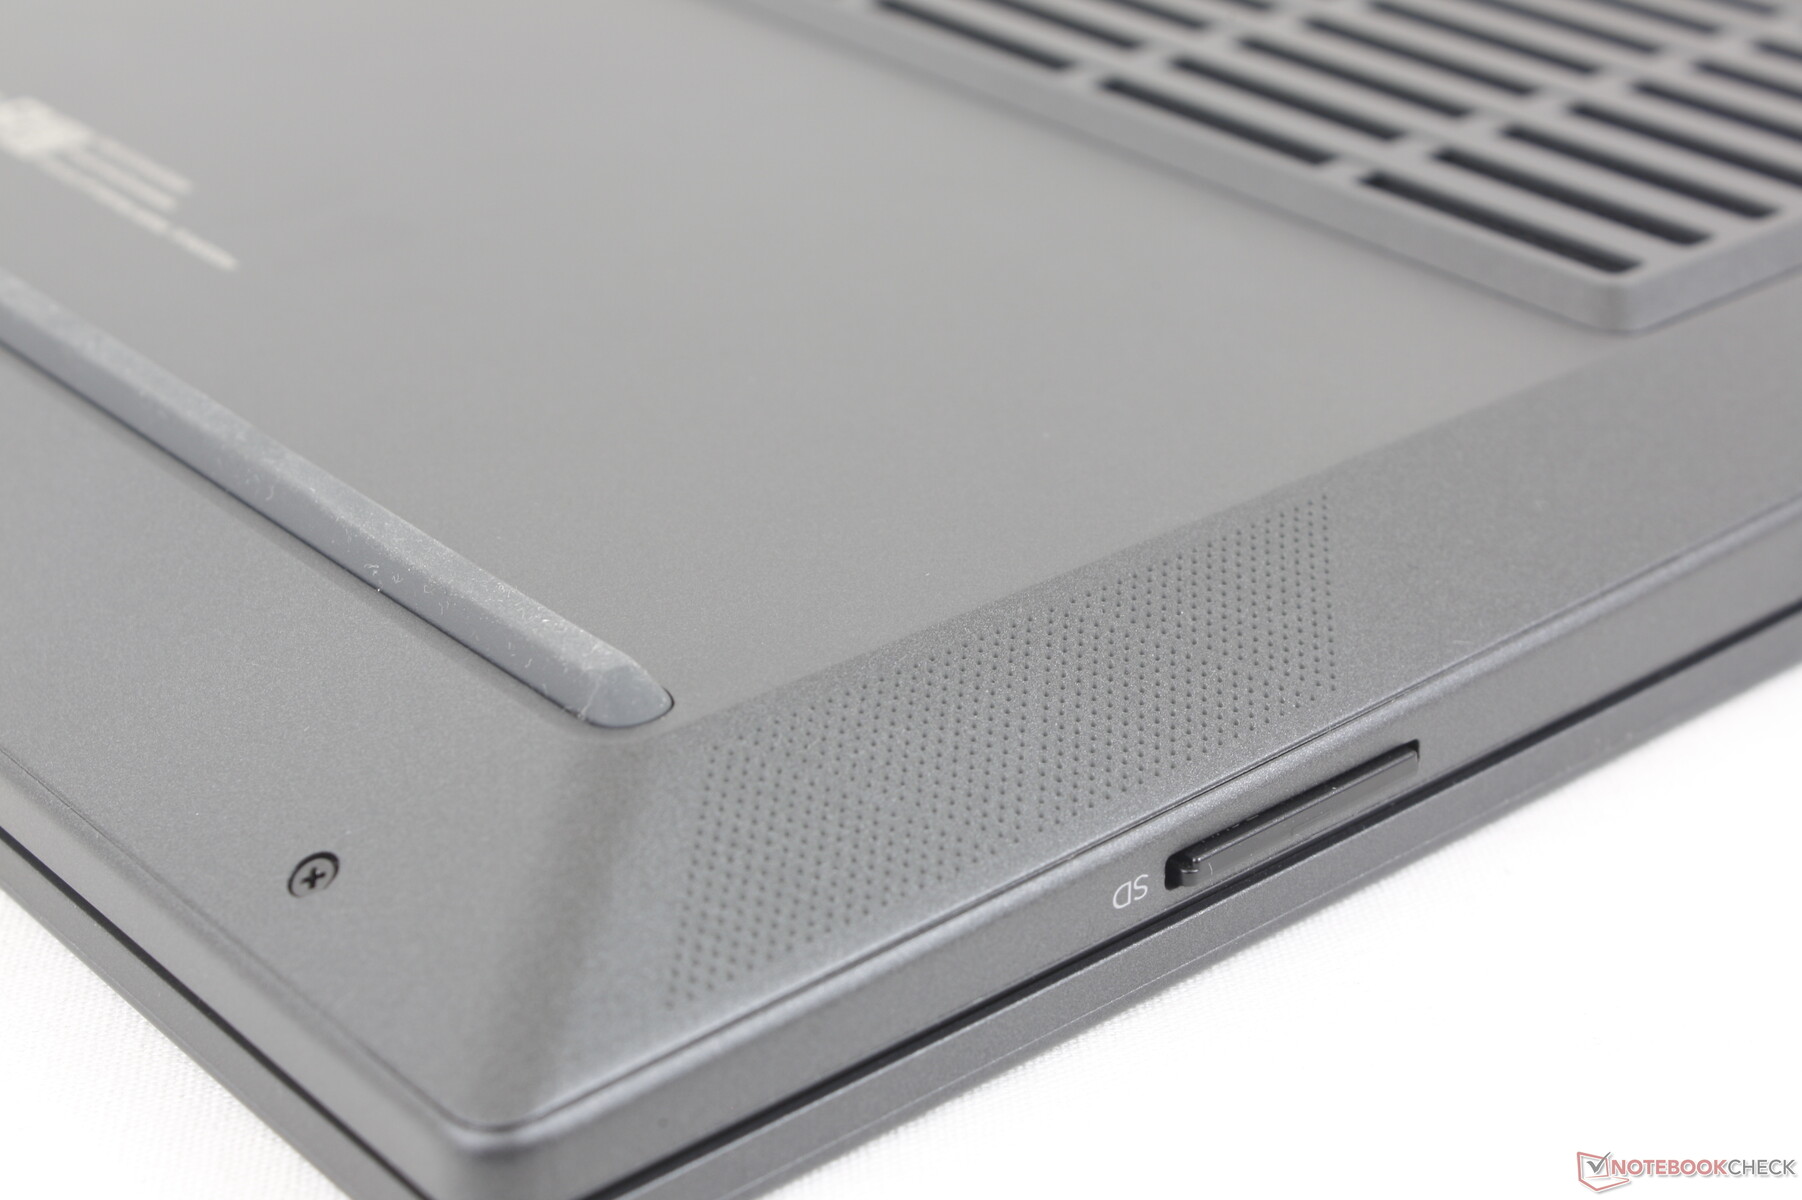
Leitor de cartões SD
Estamos surpresos de ver um leitor de cartões SD integrado, já que muitos laptops para jogos orçamentários o omitem. As taxas de transferência são apenas metade da velocidade dos leitores de cartões no Alienware x15 ou Lâmina Razermas é melhor do que não ter nenhum leitor de cartões.
| SD Card Reader | |
| average JPG Copy Test (av. of 3 runs) | |
| Alienware x15 R2 P111F (AV PRO microSD 128 GB V60) | |
| Razer Blade 17 (i7-12800H, RTX 3070 Ti) | |
| MSI GE67 HX 12UGS (Toshiba Exceria Pro SDXC 64 GB UHS-II) | |
| HP Victus 15 fa0020nr (Toshiba Exceria Pro SDXC 64 GB UHS-II) | |
| HP Omen 15-en0375ng (Toshiba Exceria Pro SDXC 64 GB UHS-II) | |
| HP Omen 15-ek0456ng (Toshiba Exceria Pro SDXC 64 GB UHS-II) | |
| maximum AS SSD Seq Read Test (1GB) | |
| Alienware x15 R2 P111F (AV PRO microSD 128 GB V60) | |
| Razer Blade 17 (i7-12800H, RTX 3070 Ti) | |
| HP Omen 15-en0375ng (Toshiba Exceria Pro SDXC 64 GB UHS-II) | |
| HP Victus 15 fa0020nr (Toshiba Exceria Pro SDXC 64 GB UHS-II) | |
| MSI GE67 HX 12UGS (Toshiba Exceria Pro SDXC 64 GB UHS-II) | |
| HP Omen 15-ek0456ng (Toshiba Exceria Pro SDXC 64 GB UHS-II) | |
Comunicação
Um MediaTek MT7921 está incluído para conectividade 2x2 Wi-Fi 6 e Bluetooth 5.2. Um Intel AX211 é opcional, com um custo adicional para Wi-Fi 6E. No entanto, as taxas de transferência são estáveis em nossos testes, embora o desempenho esteja atrasado em relação à maioria dos outros laptops com uma solução Intel AX.
| Networking | |
| iperf3 transmit AX12 | |
| Dell G15 5515 | |
| MSI Bravo 15 B5DD-010US | |
| HP Omen 15-en0375ng | |
| iperf3 receive AX12 | |
| Dell G15 5515 | |
| MSI Bravo 15 B5DD-010US | |
| HP Omen 15-en0375ng | |
| iperf3 receive AXE11000 6GHz | |
| Lenovo Legion 5 15IAH7H 82RB | |
| iperf3 receive AXE11000 | |
| Asus TUF Dash F15 FX517ZC | |
| Lenovo Legion 5 15IAH7H 82RB | |
| HP Victus 15 fa0020nr | |
| iperf3 transmit AXE11000 | |
| Asus TUF Dash F15 FX517ZC | |
| Lenovo Legion 5 15IAH7H 82RB | |
| HP Victus 15 fa0020nr | |
| iperf3 transmit AXE11000 6GHz | |
| Lenovo Legion 5 15IAH7H 82RB | |
Webcam
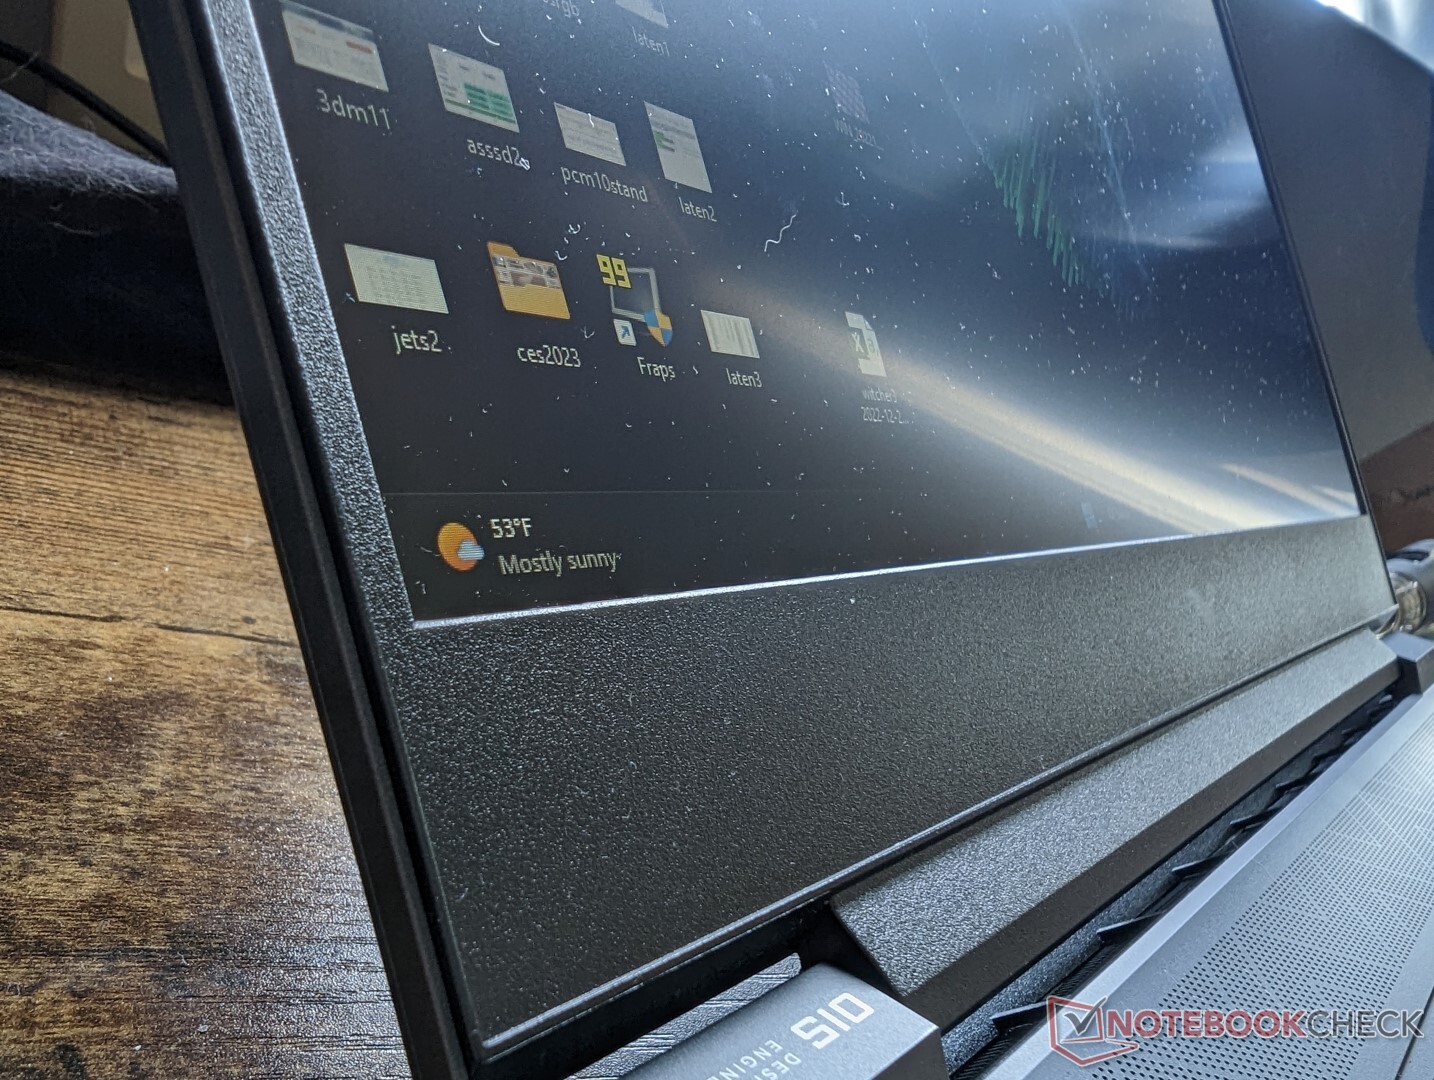
A webcam é o sensor básico de 1 MP sem infravermelho ou até mesmo obturador de privacidade. A HP tem algumas das melhores webcams para laptop como vistas no último Spectre e Modelos EliteBook e, portanto, a webcam desfocada em nossa Victus é claramente uma medida de redução de custos.


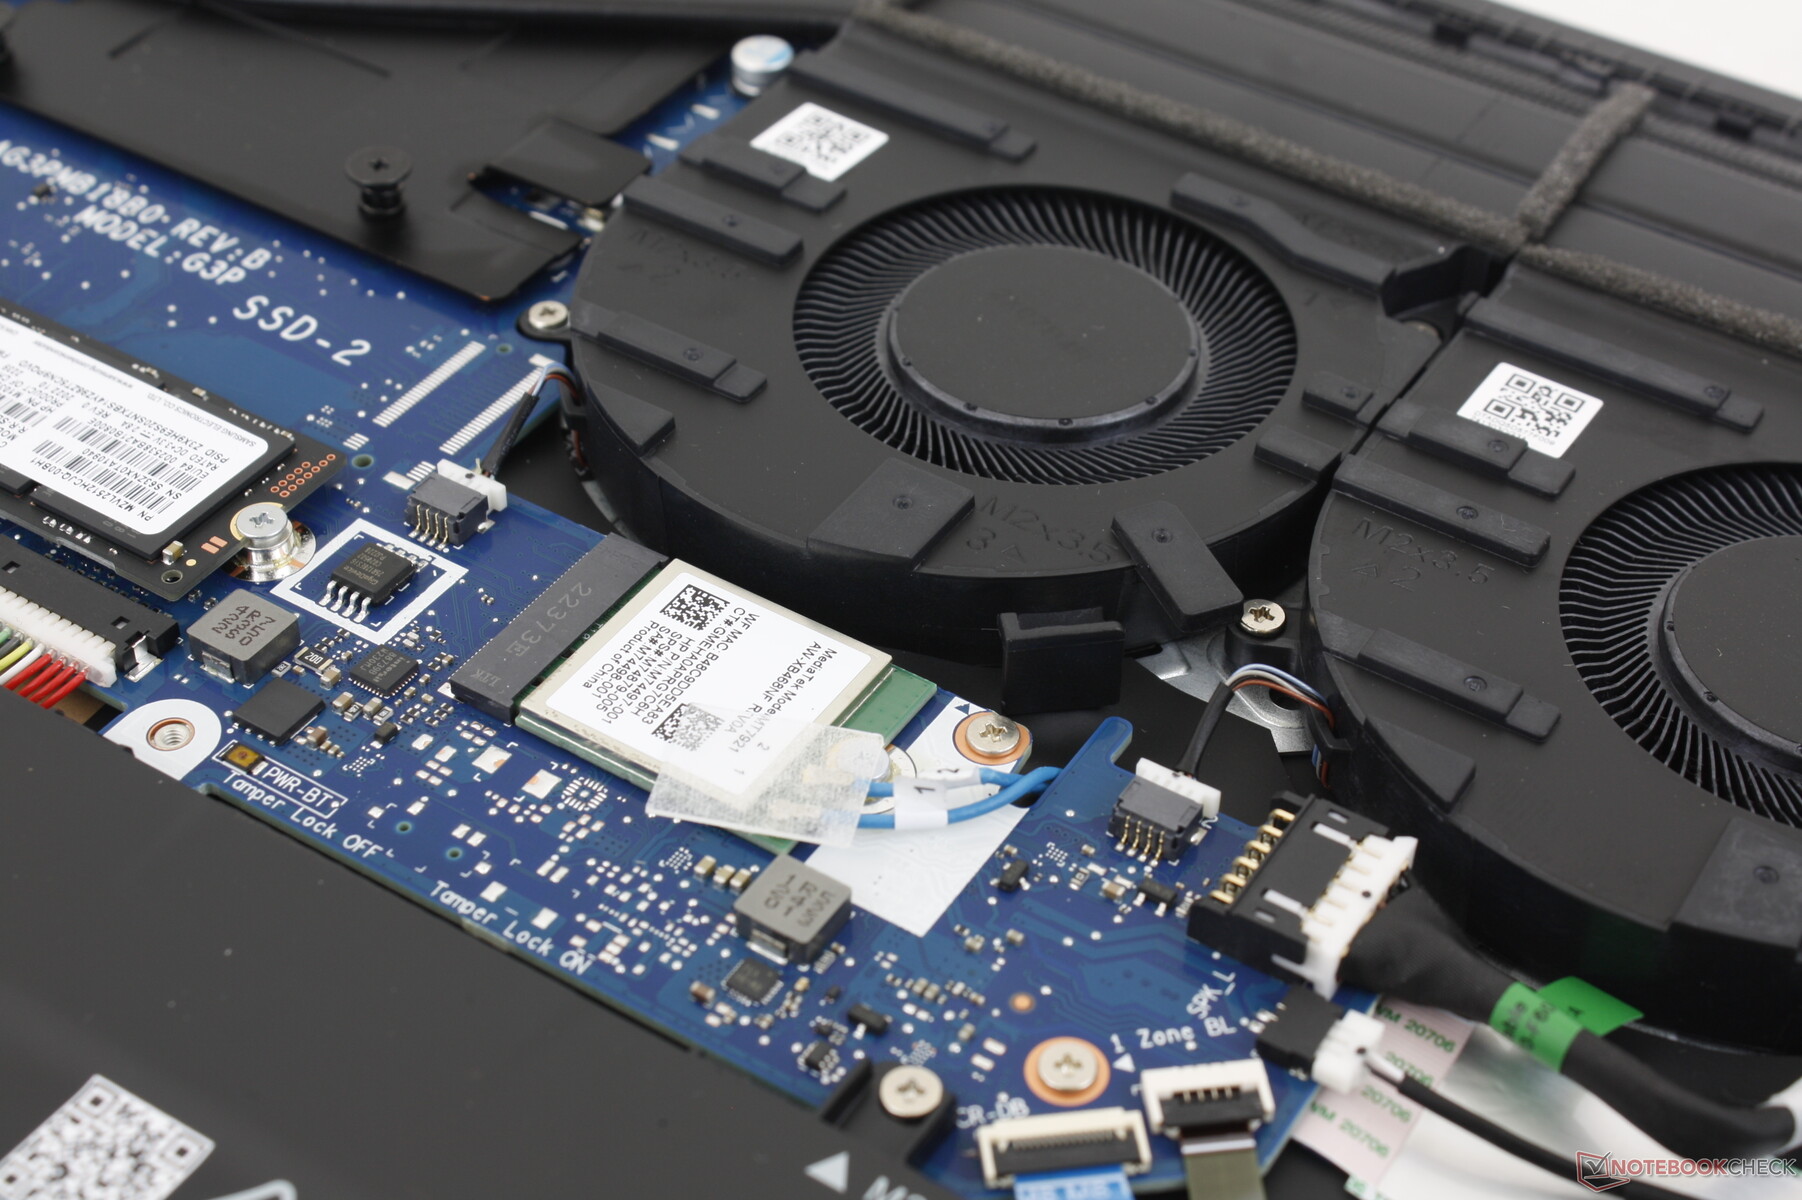
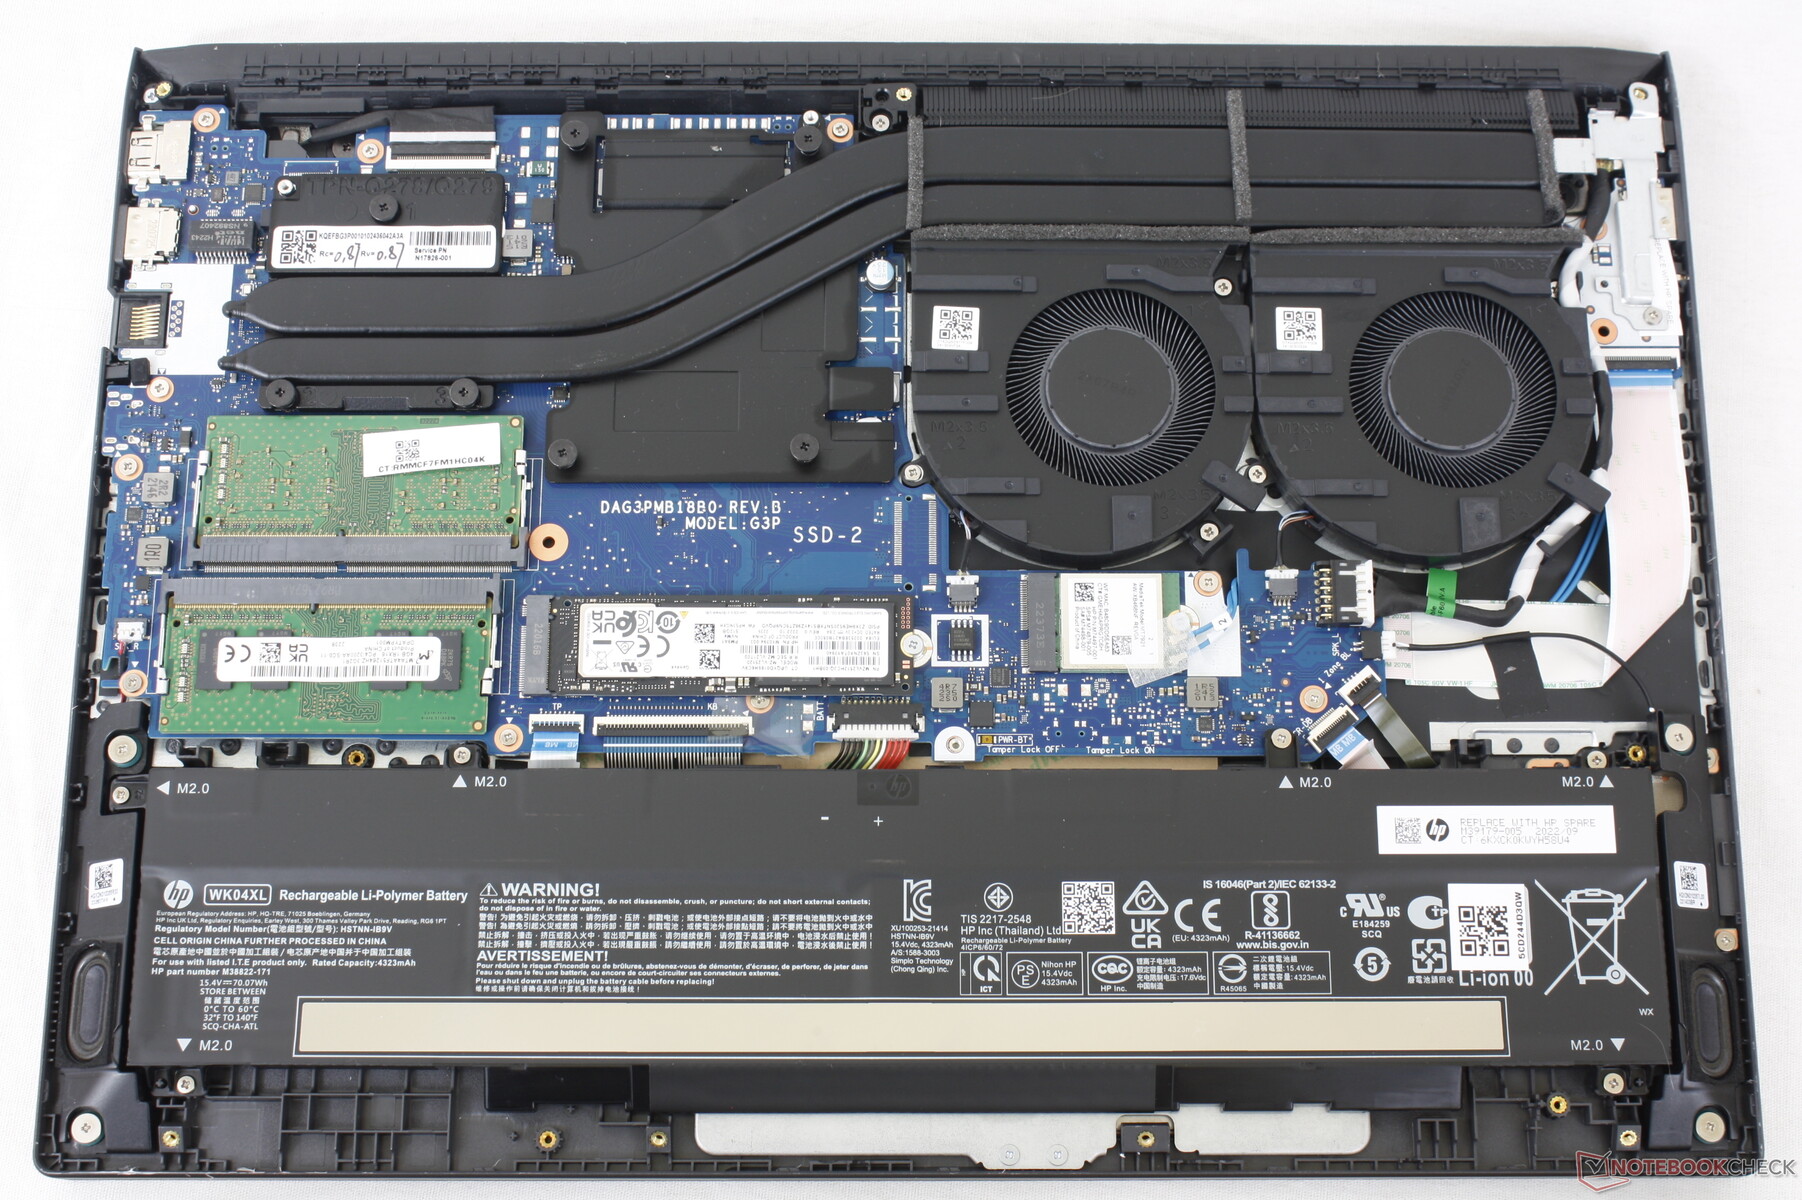
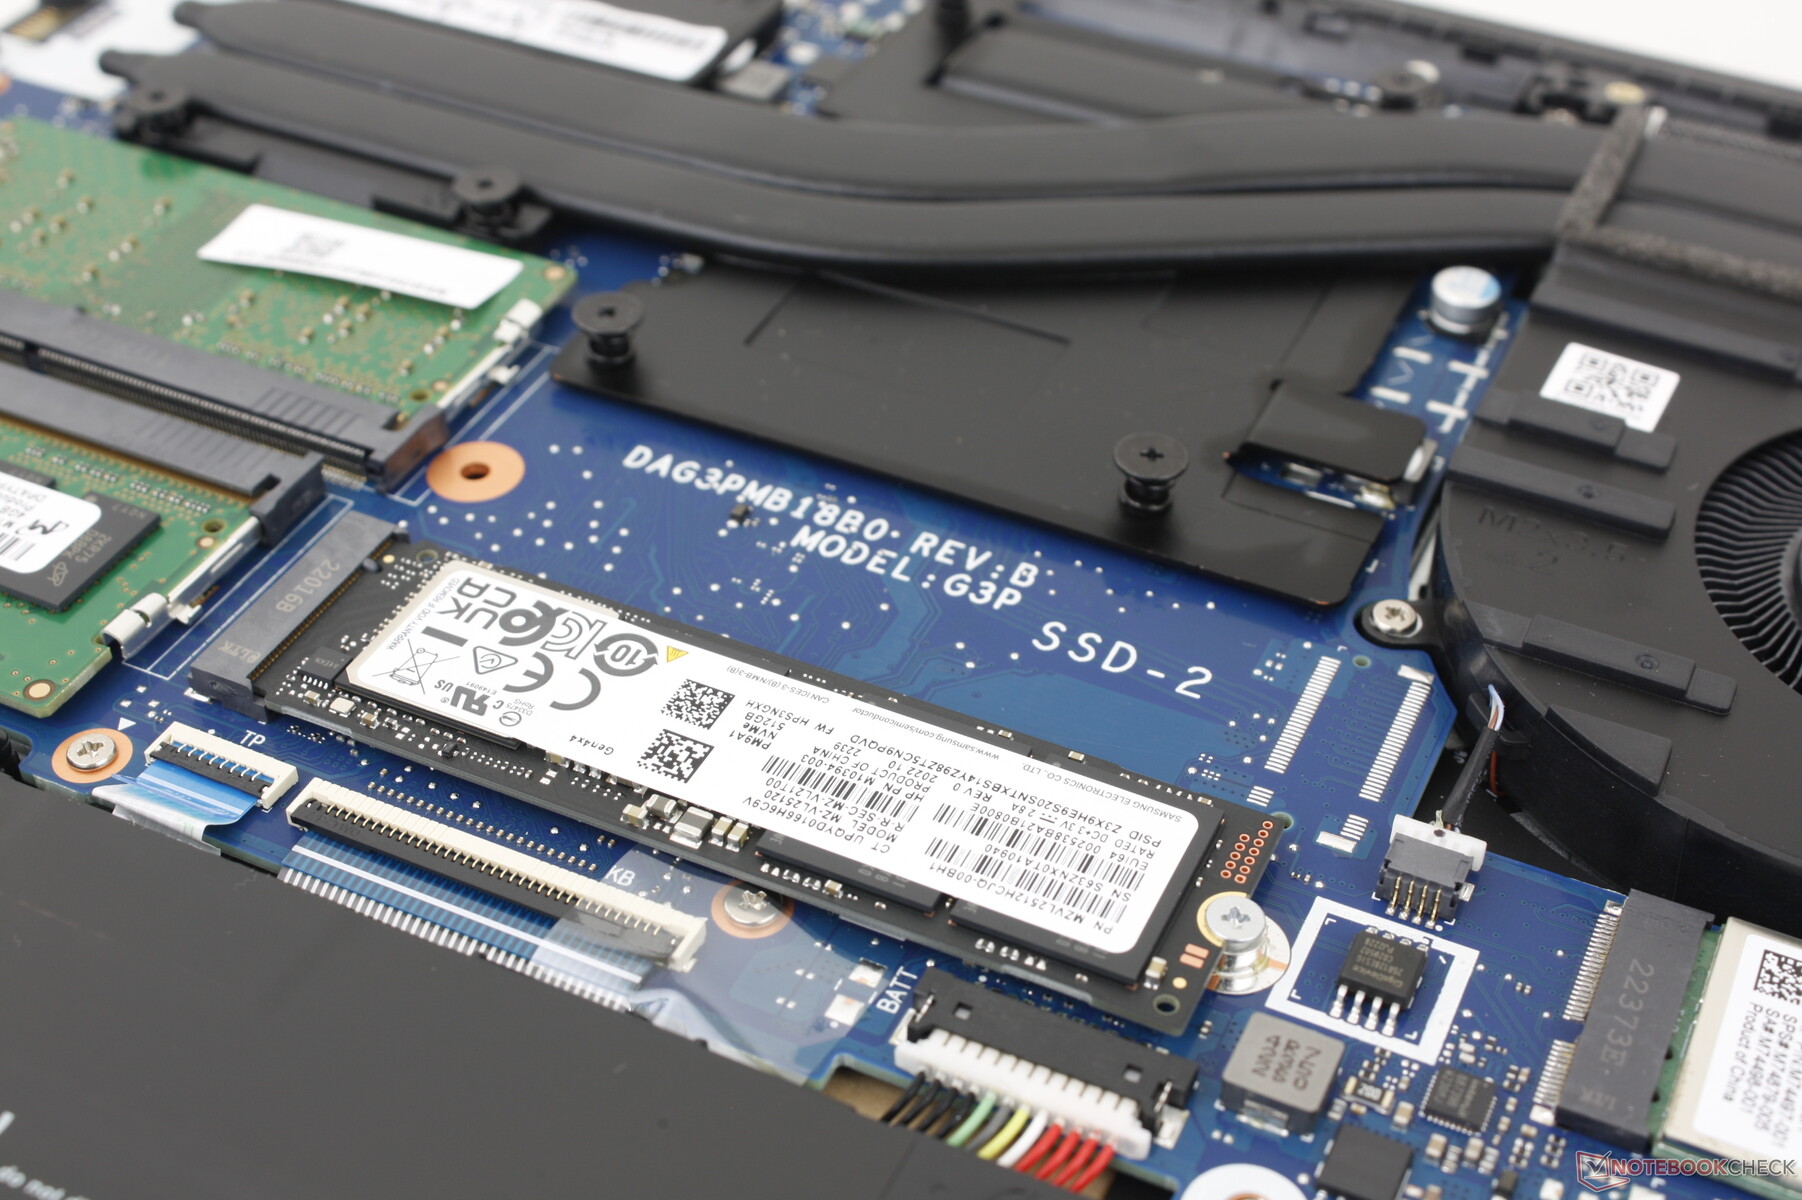
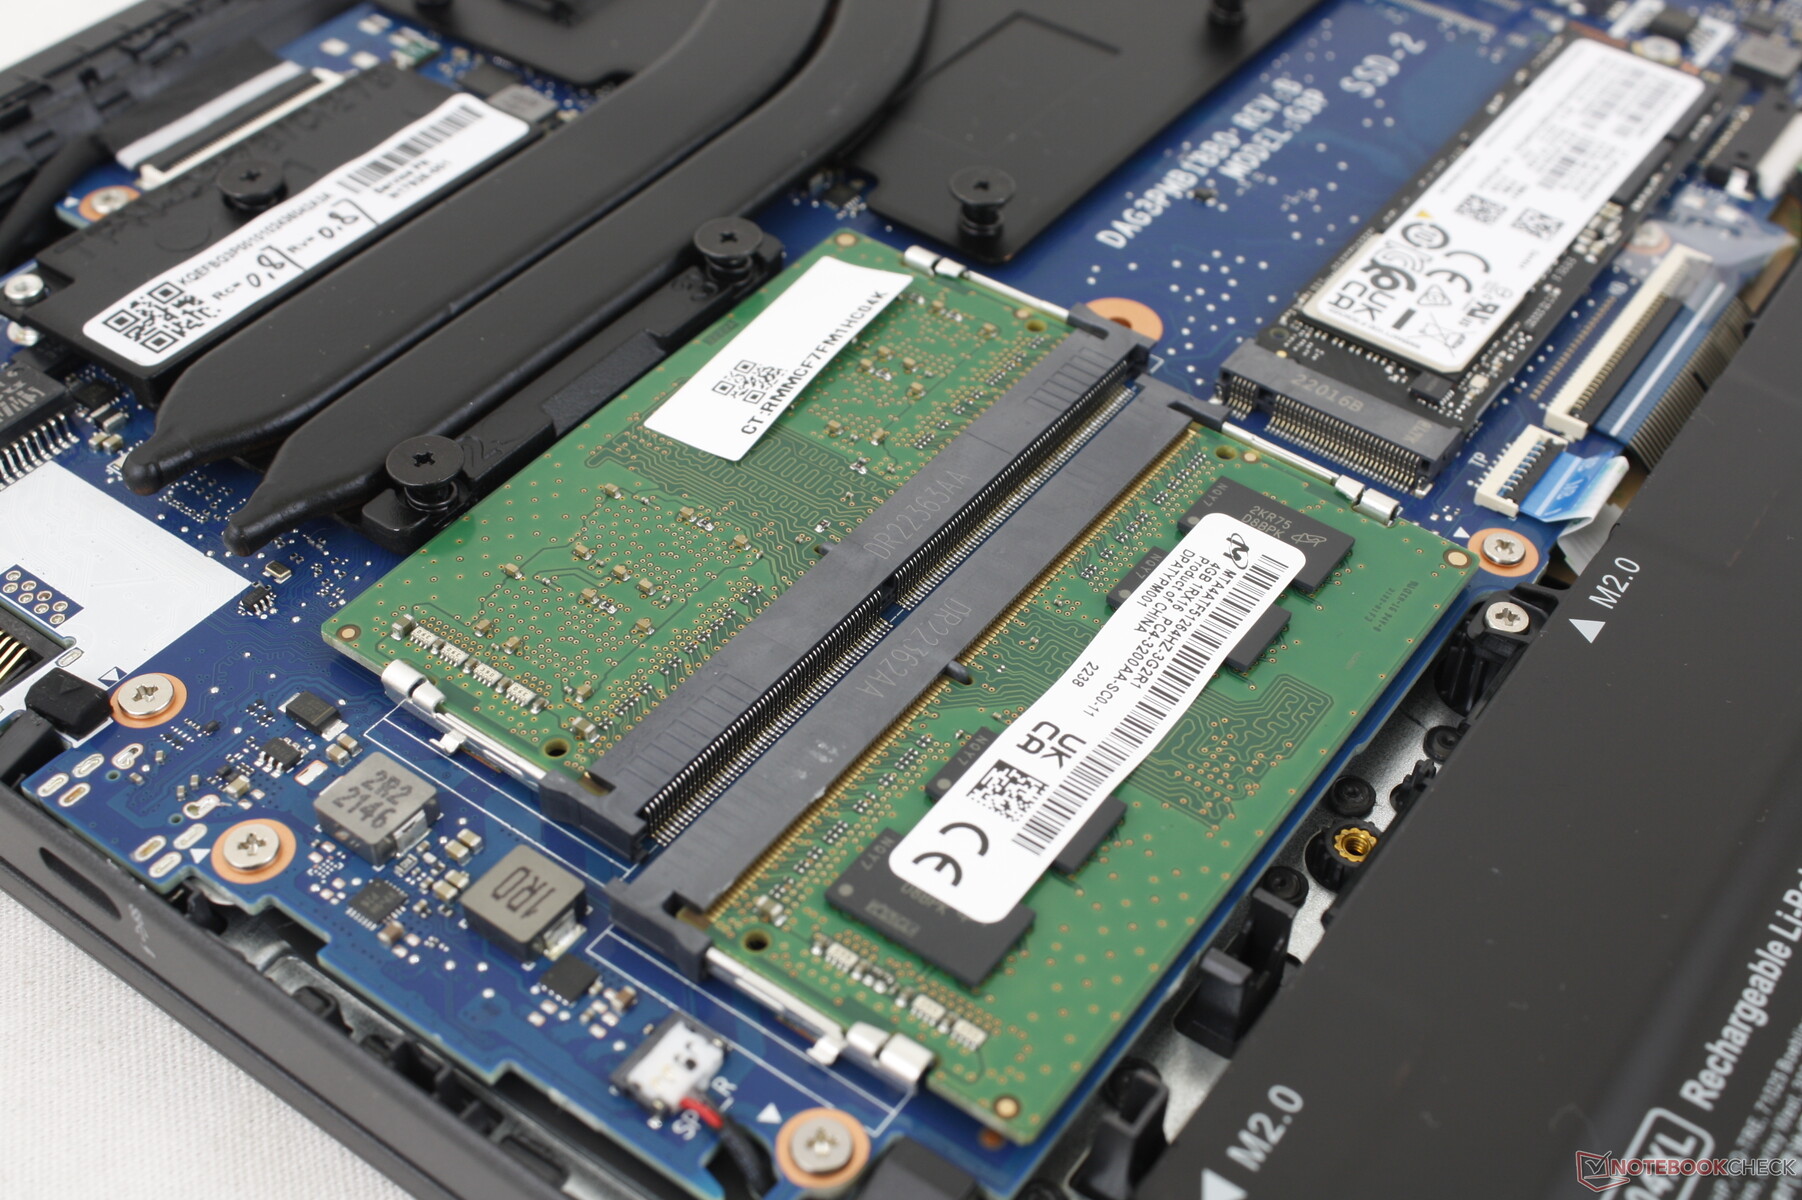
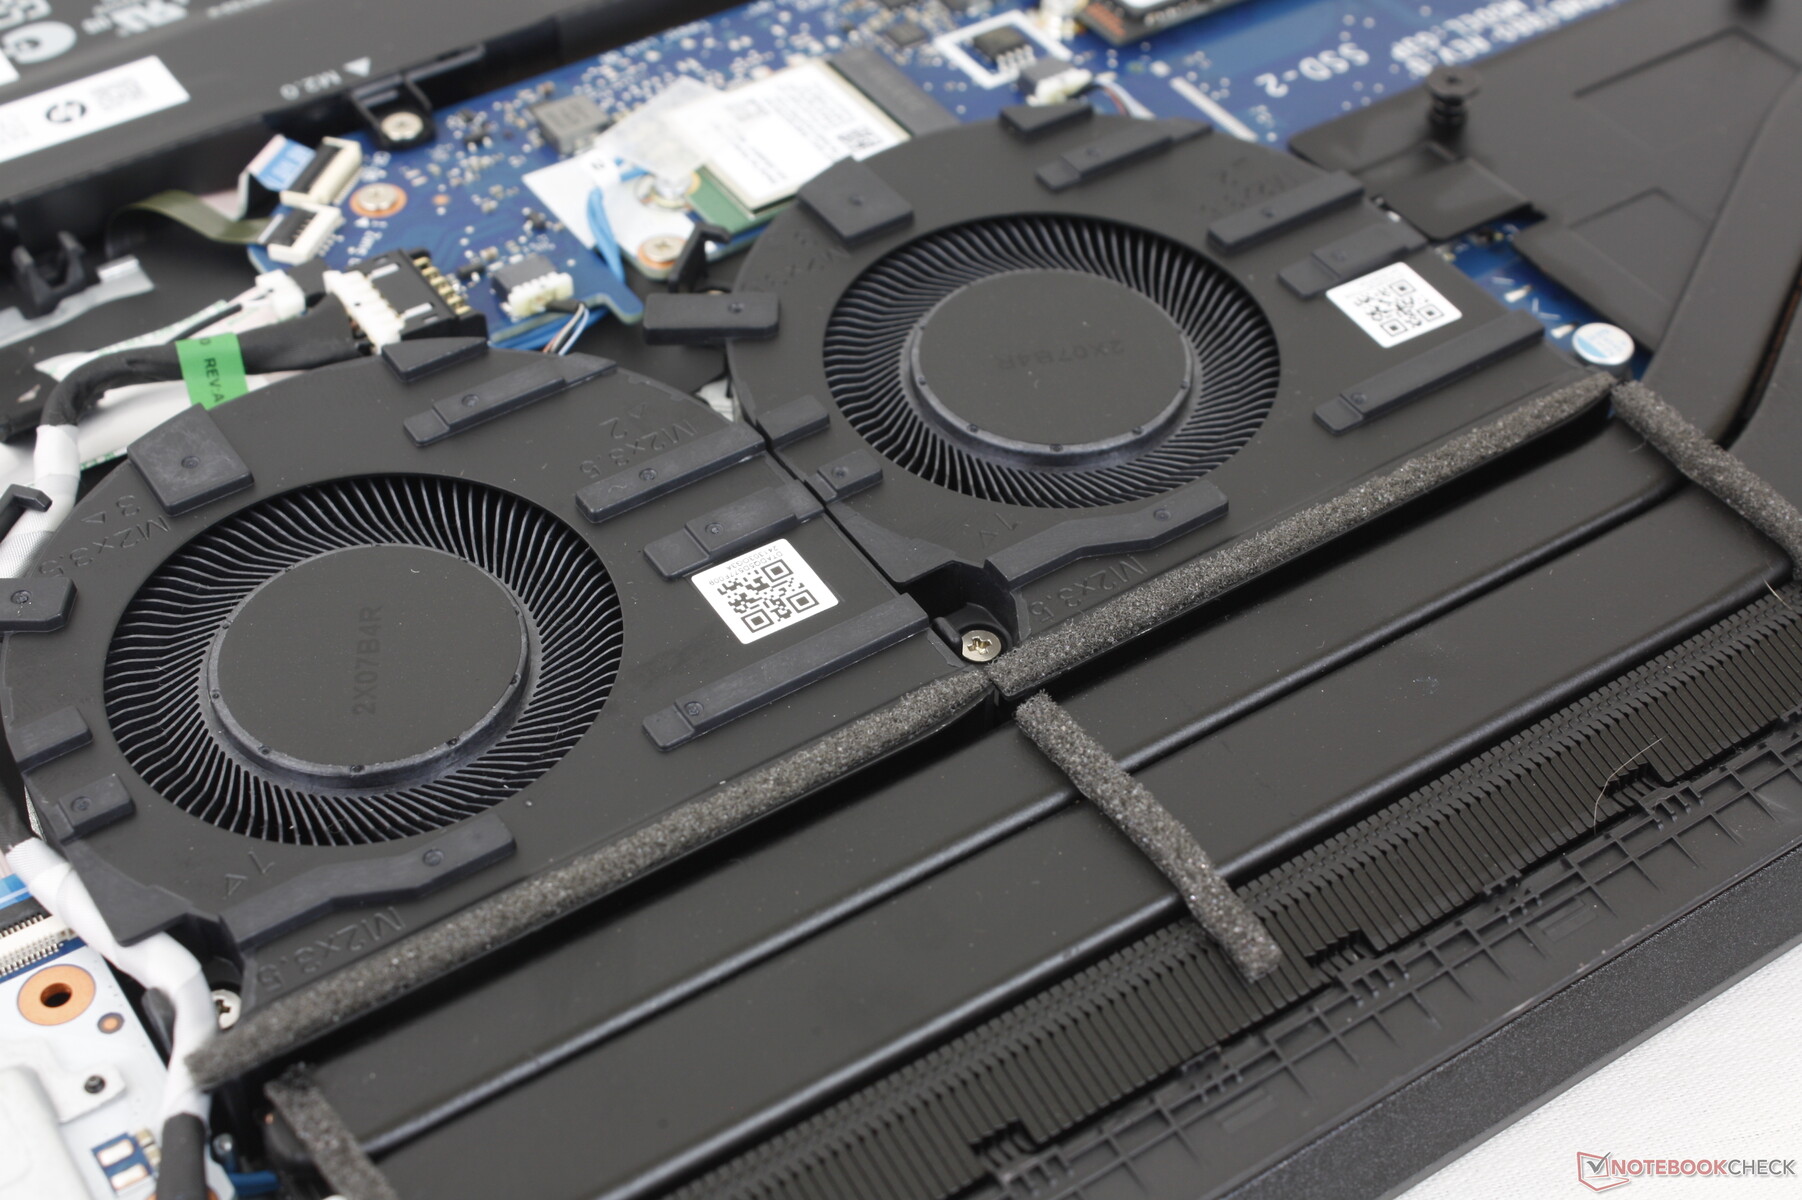
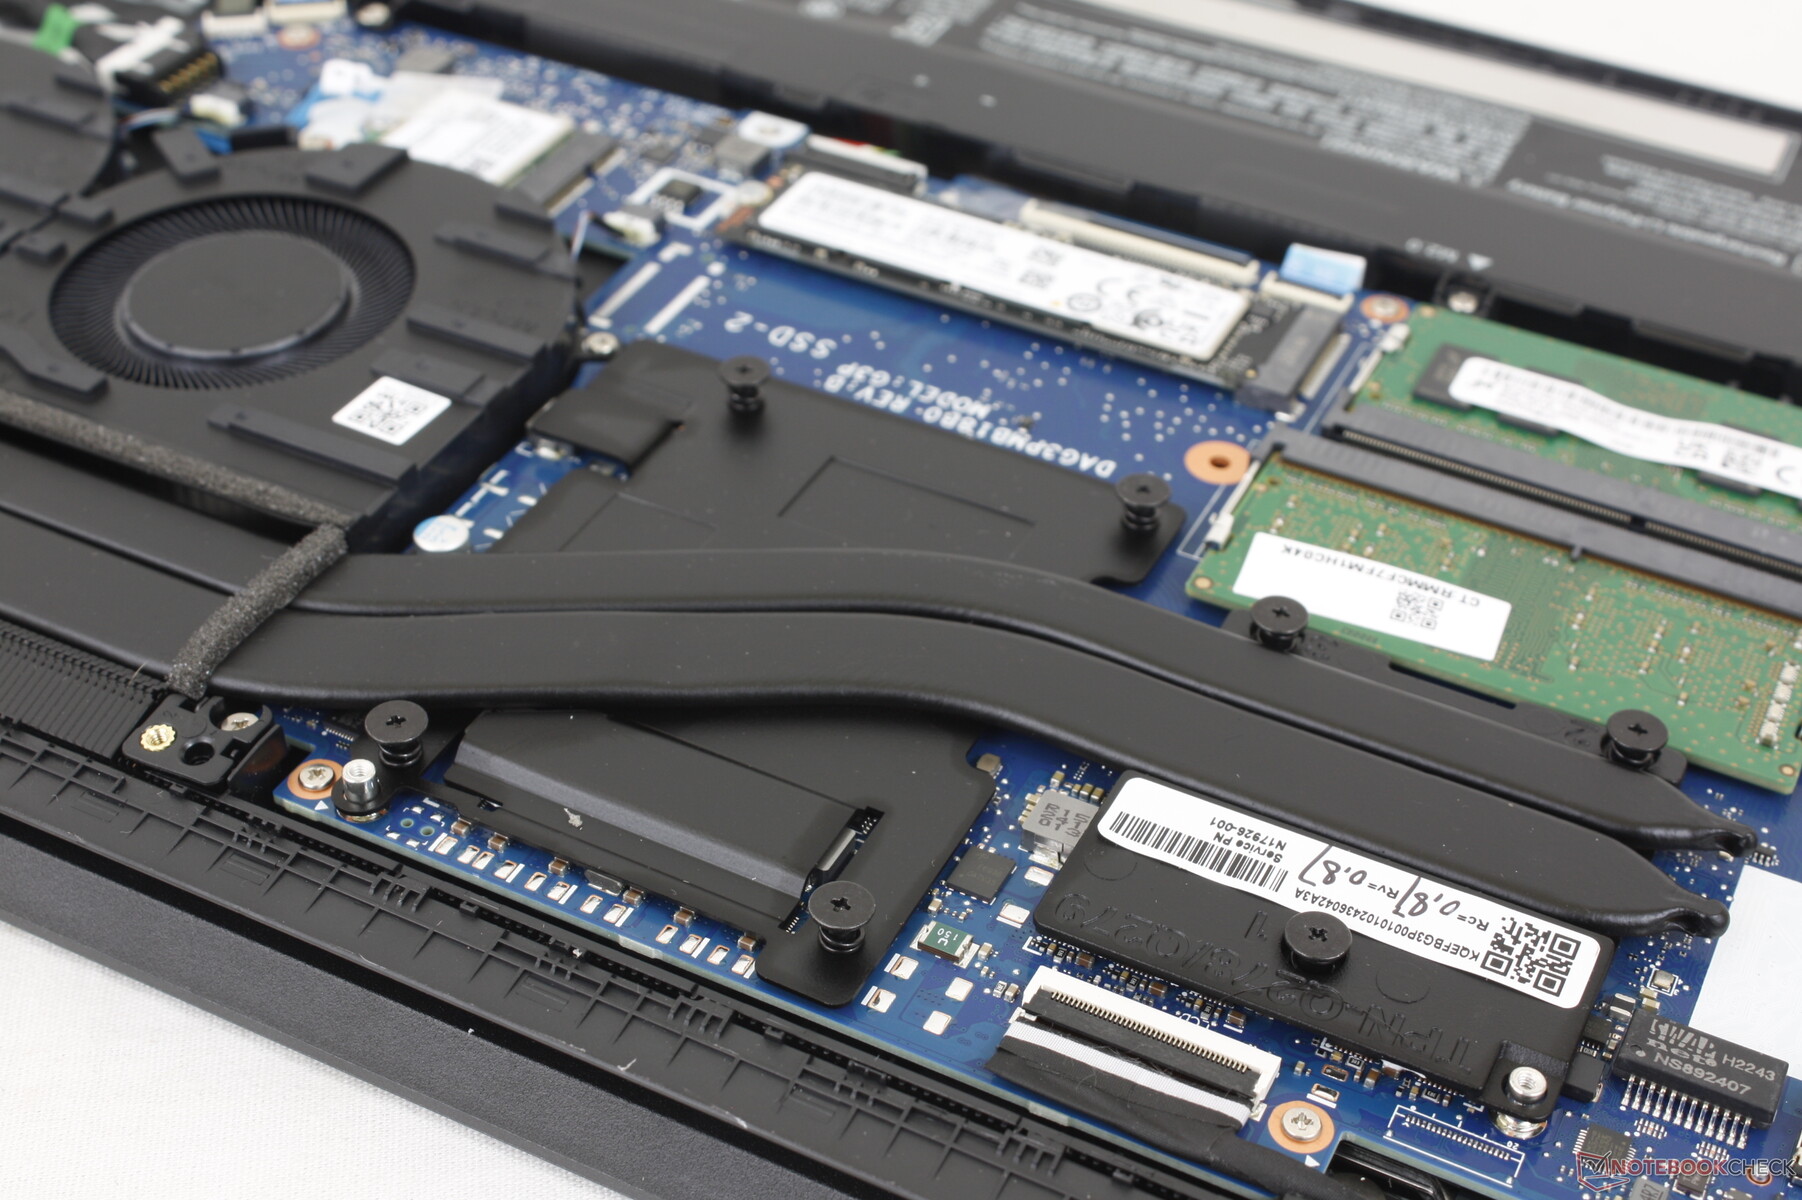
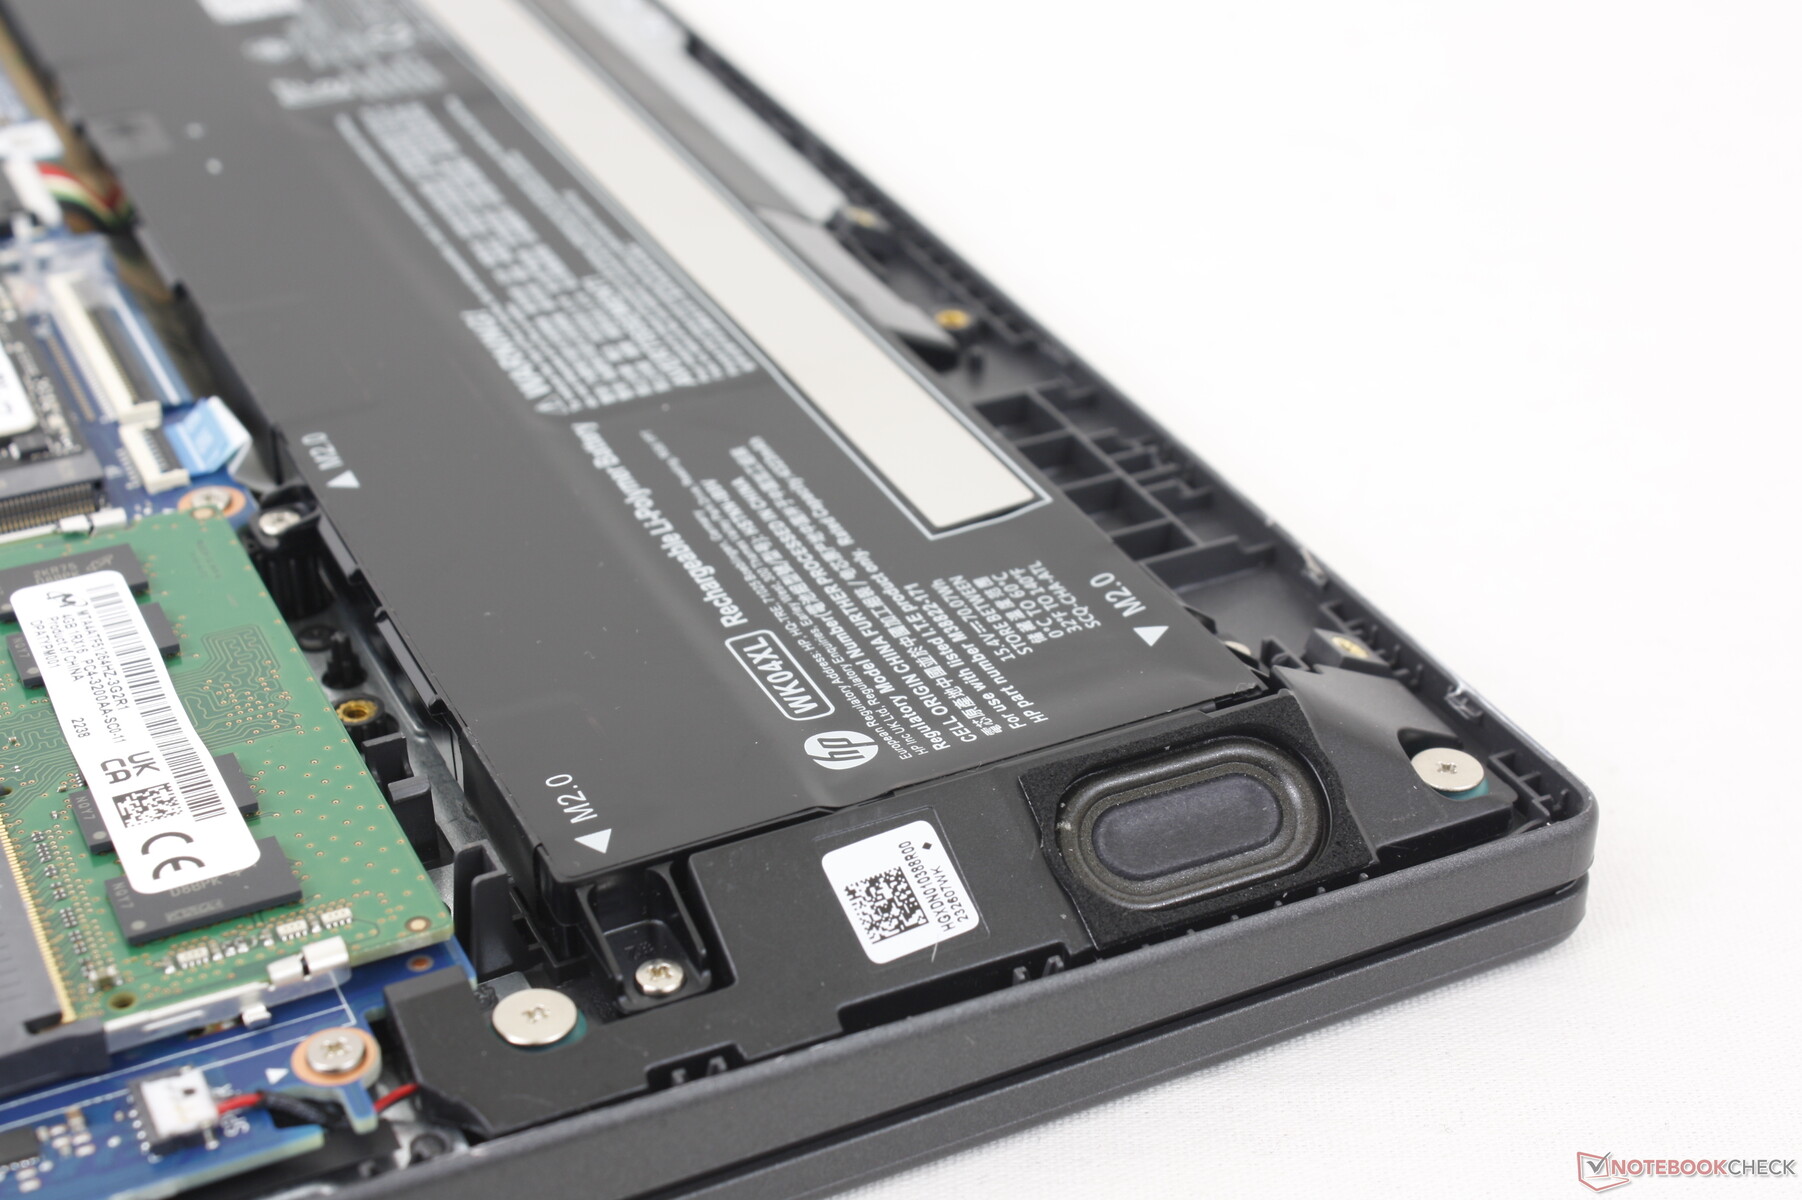
Manutenção
O painel inferior é fixado por sete parafusos Philips para uma manutenção relativamente fácil. Os proprietários têm acesso direto ao único slot M.2 PCIe4 x4 2280, módulo WLAN removível e 2x slots SODIMM. O concorrente Asus TUF Dash F15 FX517ZC suporta até dois SSDs M.2 enquanto nosso HP pode suportar apenas um.
Acessórios e Garantia
Não há extras na caixa de varejo além do adaptador AC e da papelada. A habitual garantia limitada de um ano do fabricante se aplica se comprada nos EUA.
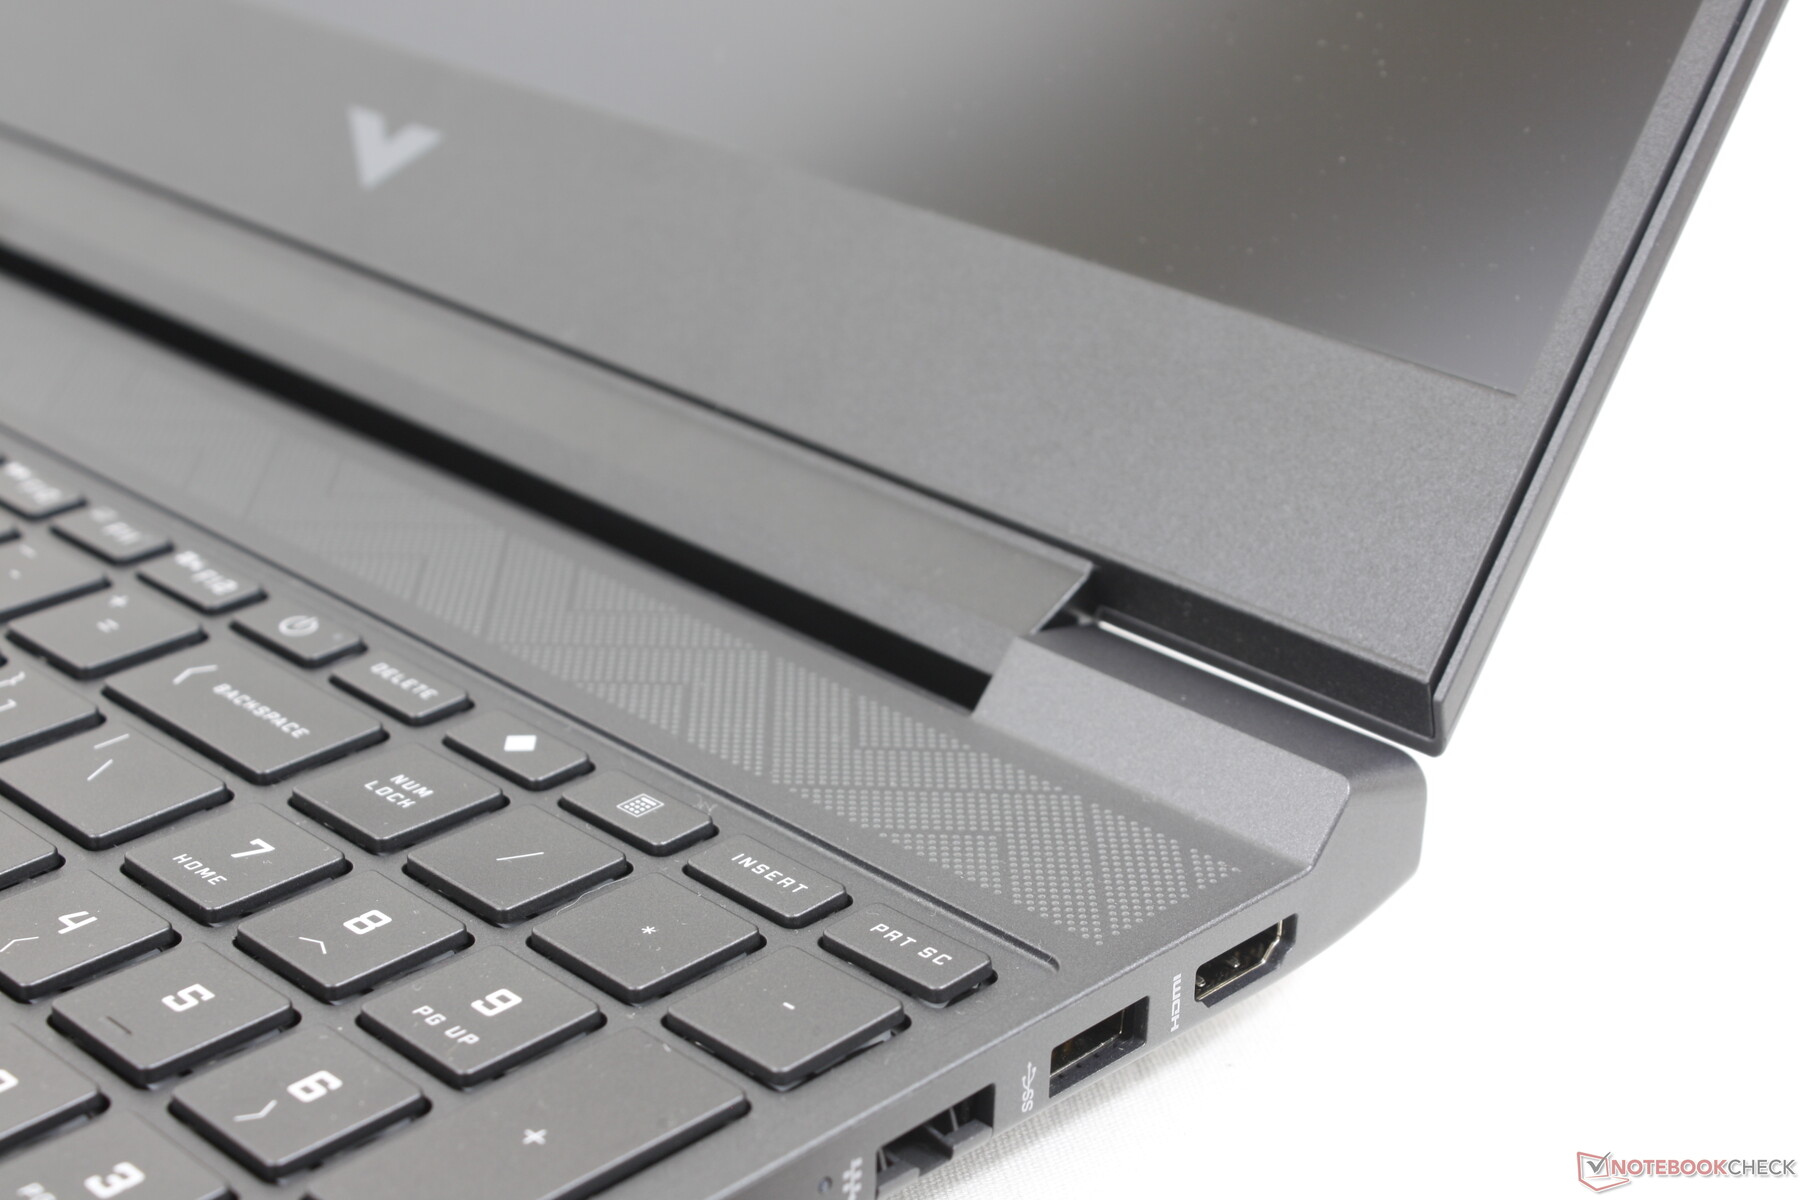
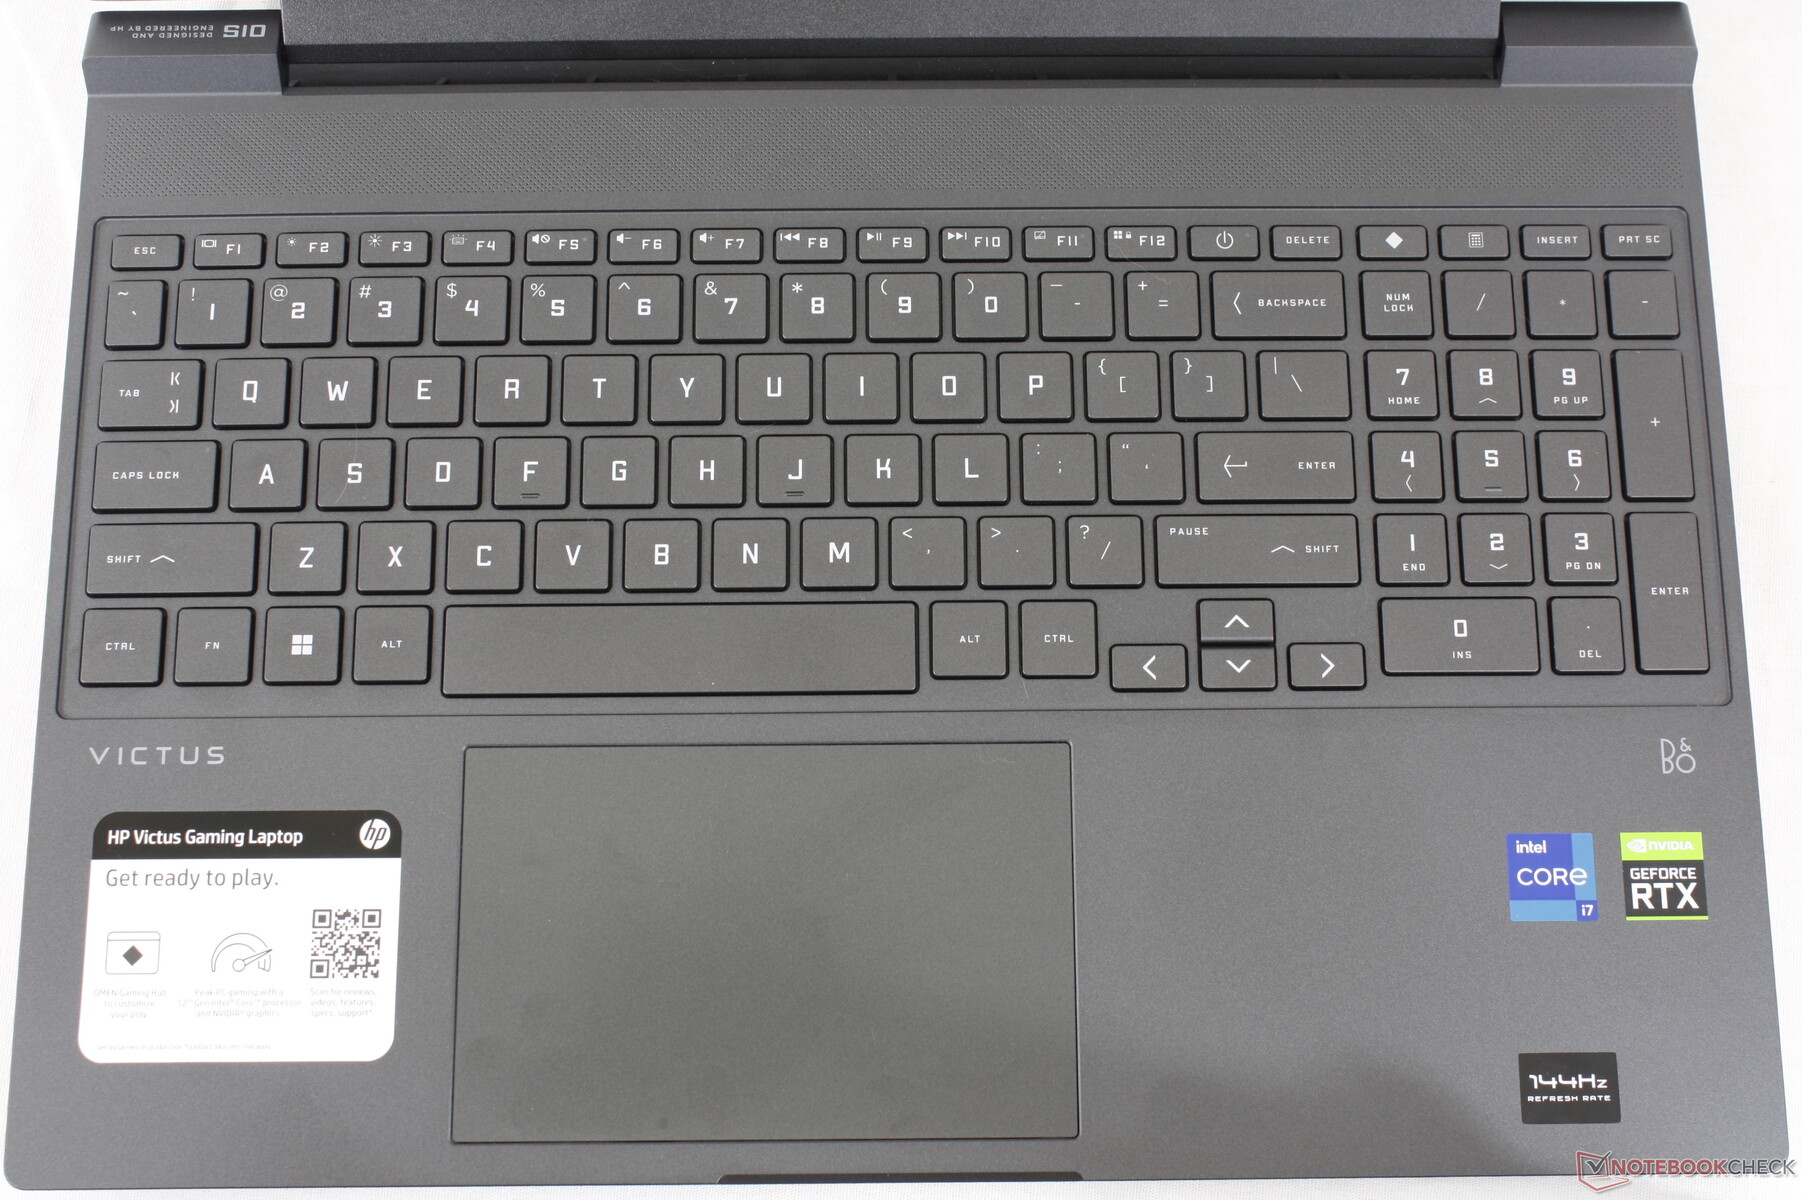
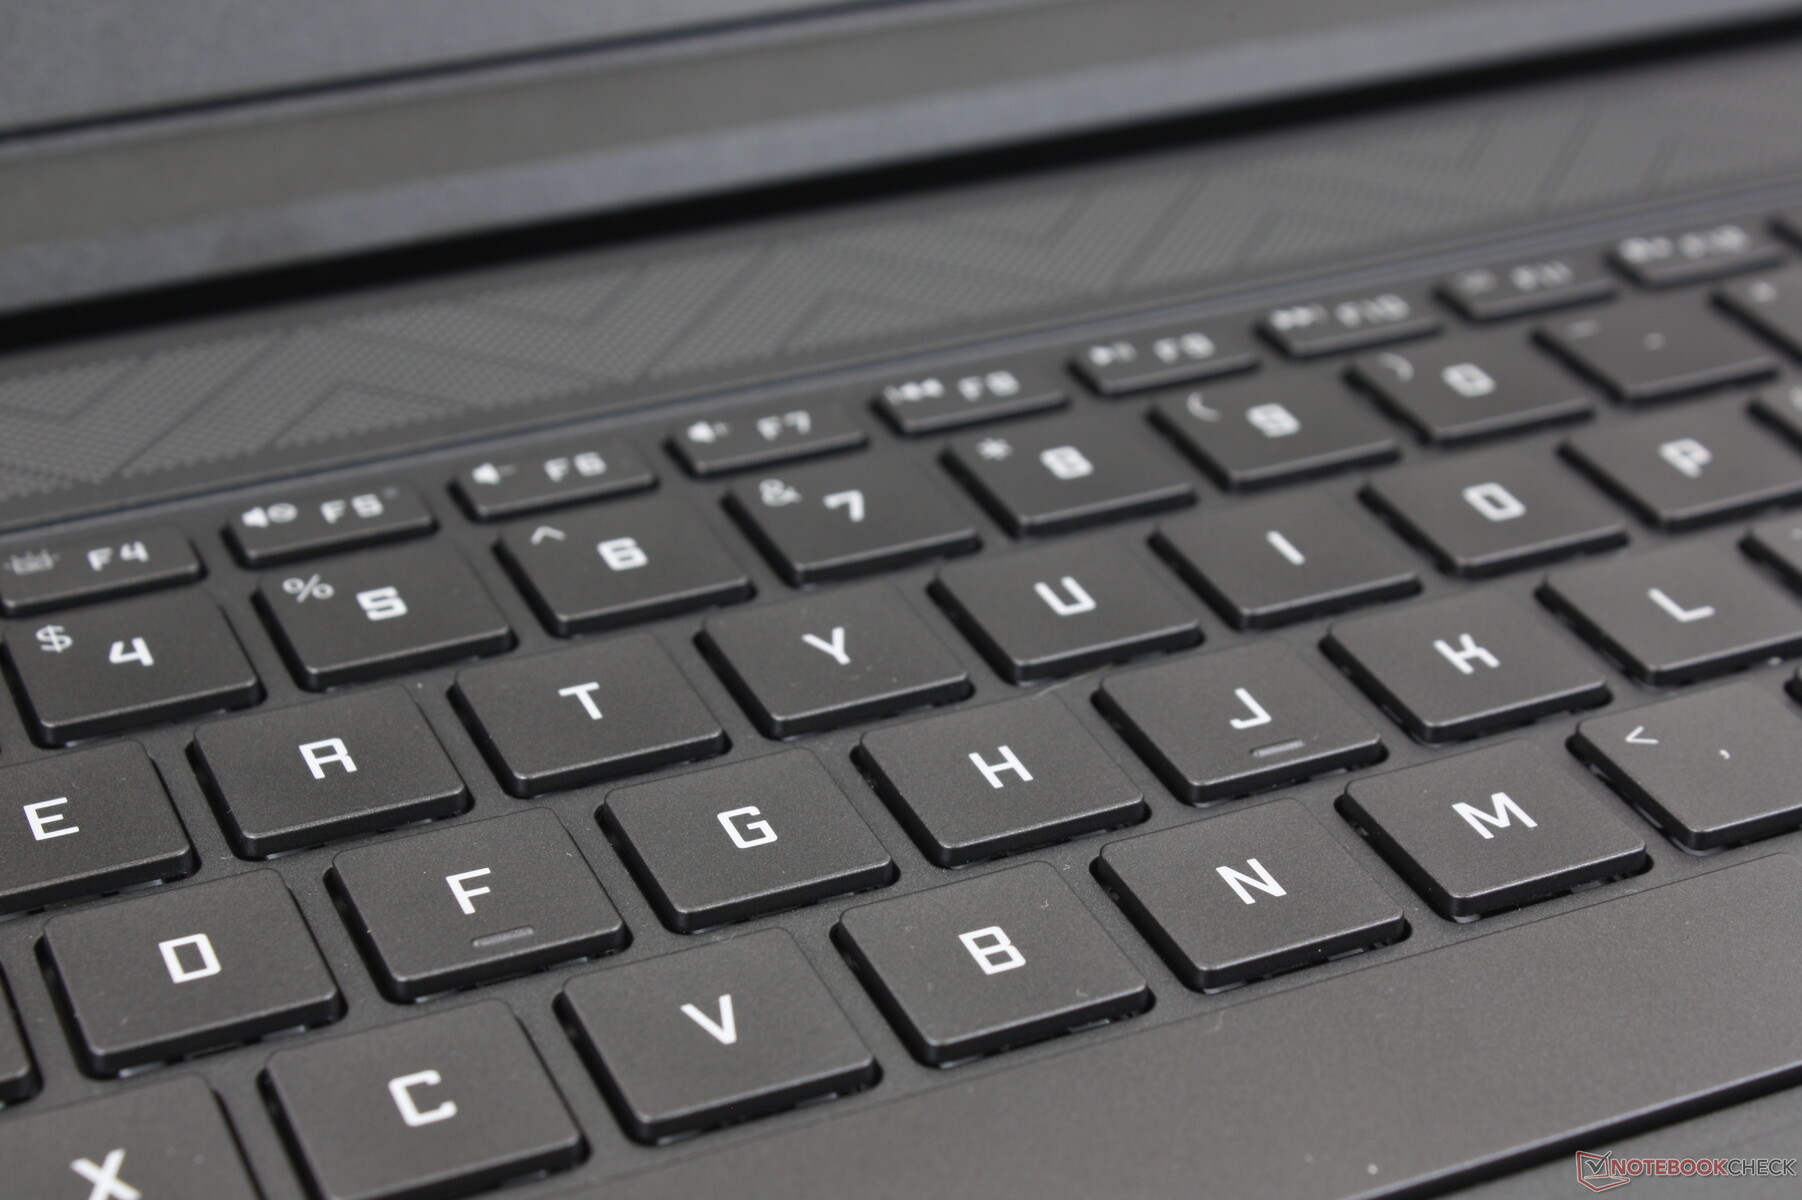
Dispositivos de Entrada - Teclado Espaçoso e ClickPad
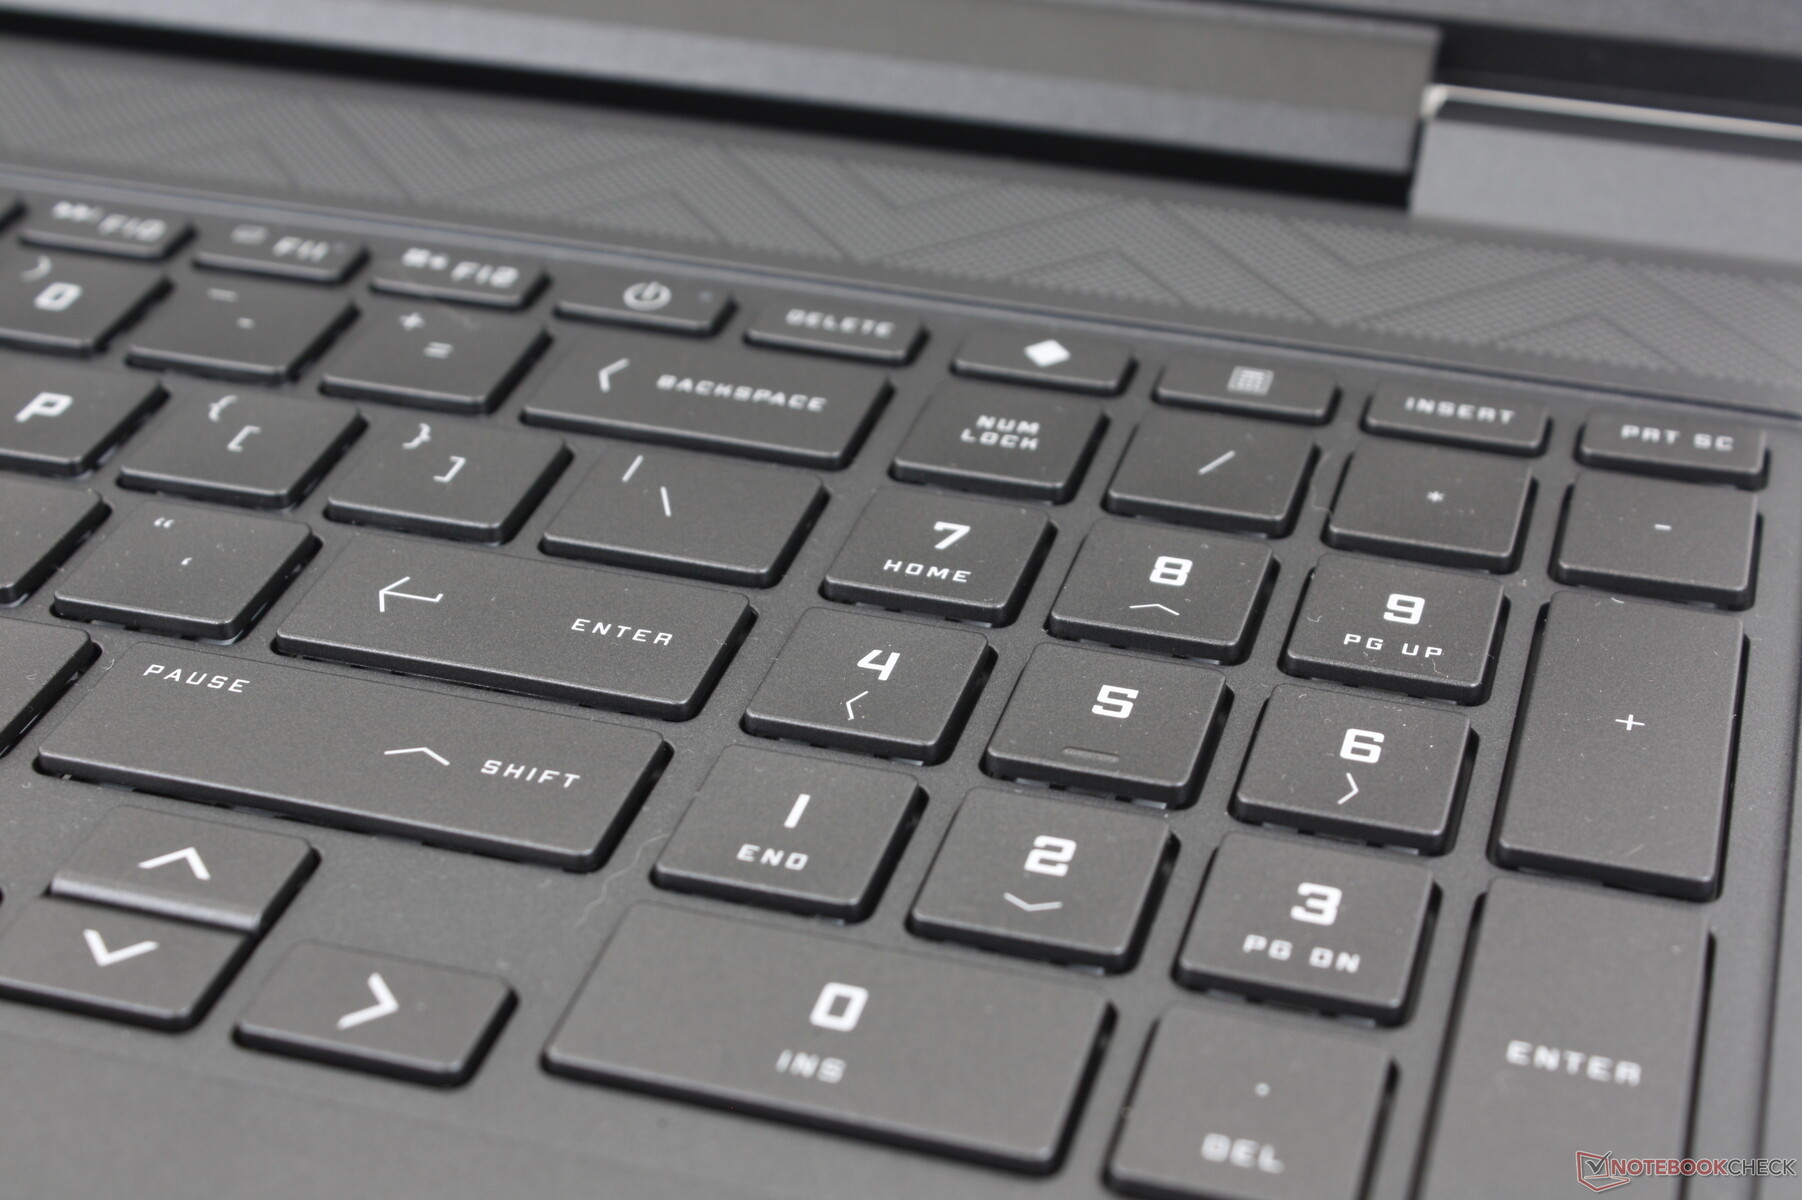
Teclado
Mais laptops para jogos estão começando a integrar numpads e o Victus 15 não é exceção. Apreciamos especialmente que as teclas numpad não são mais estreitas do que as teclas QWERTY principais, ao contrário dos numpads apertados no Dell G15 ou Asus TUF Dash F15
O feedback das teclas ao digitar é ligeiramente mais suave e, portanto, mais silencioso no Victus. As teclas Enter e Backspace, no entanto, são um pouco suaves demais e poderiam ter se beneficiado de um feedback mais firme.
Uma luz de fundo branca de zona única vem como padrão para iluminar todas as teclas e símbolos, enquanto a maioria dos outros laptops de jogos tem opções RGB. Não há sequer uma definição de iluminação de fundo aqui - ou está ligada ou desligada sem nada no meio.
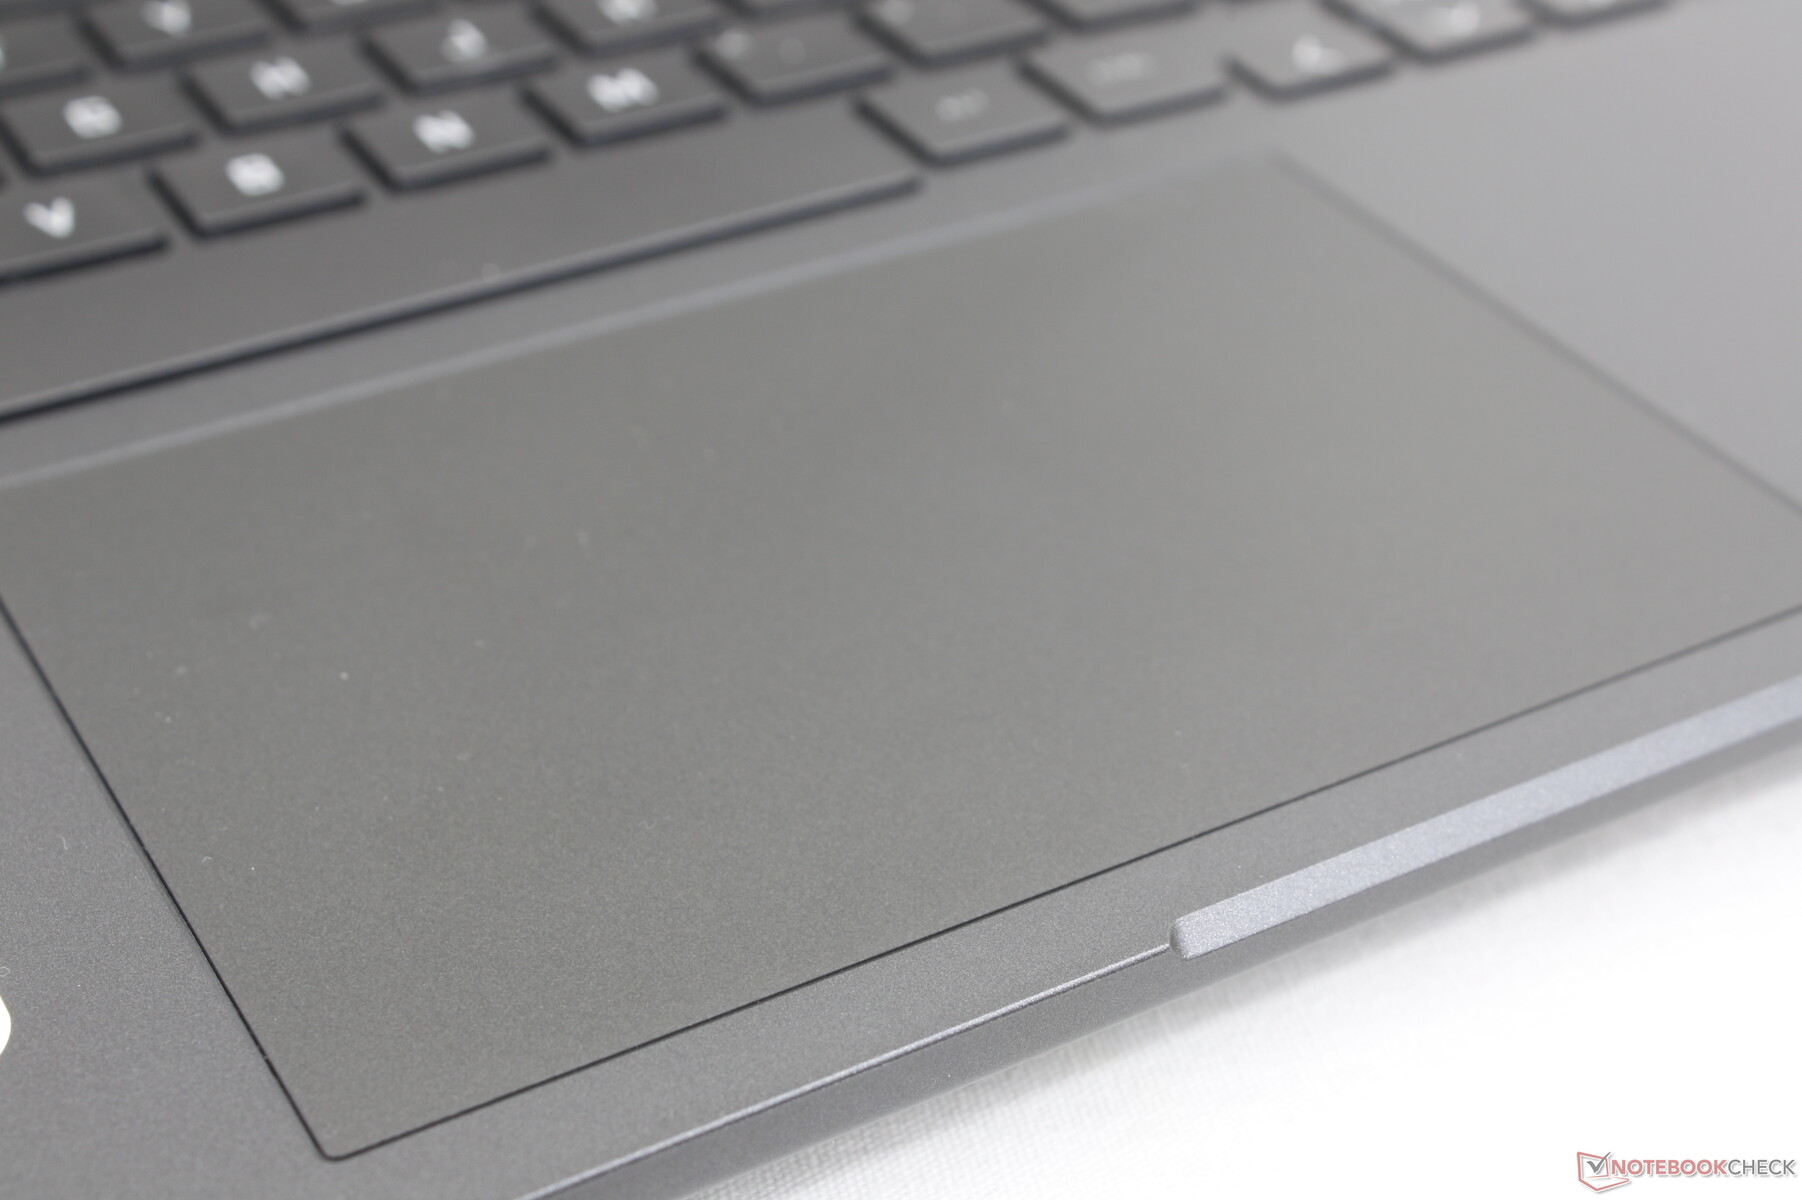
Touchpad
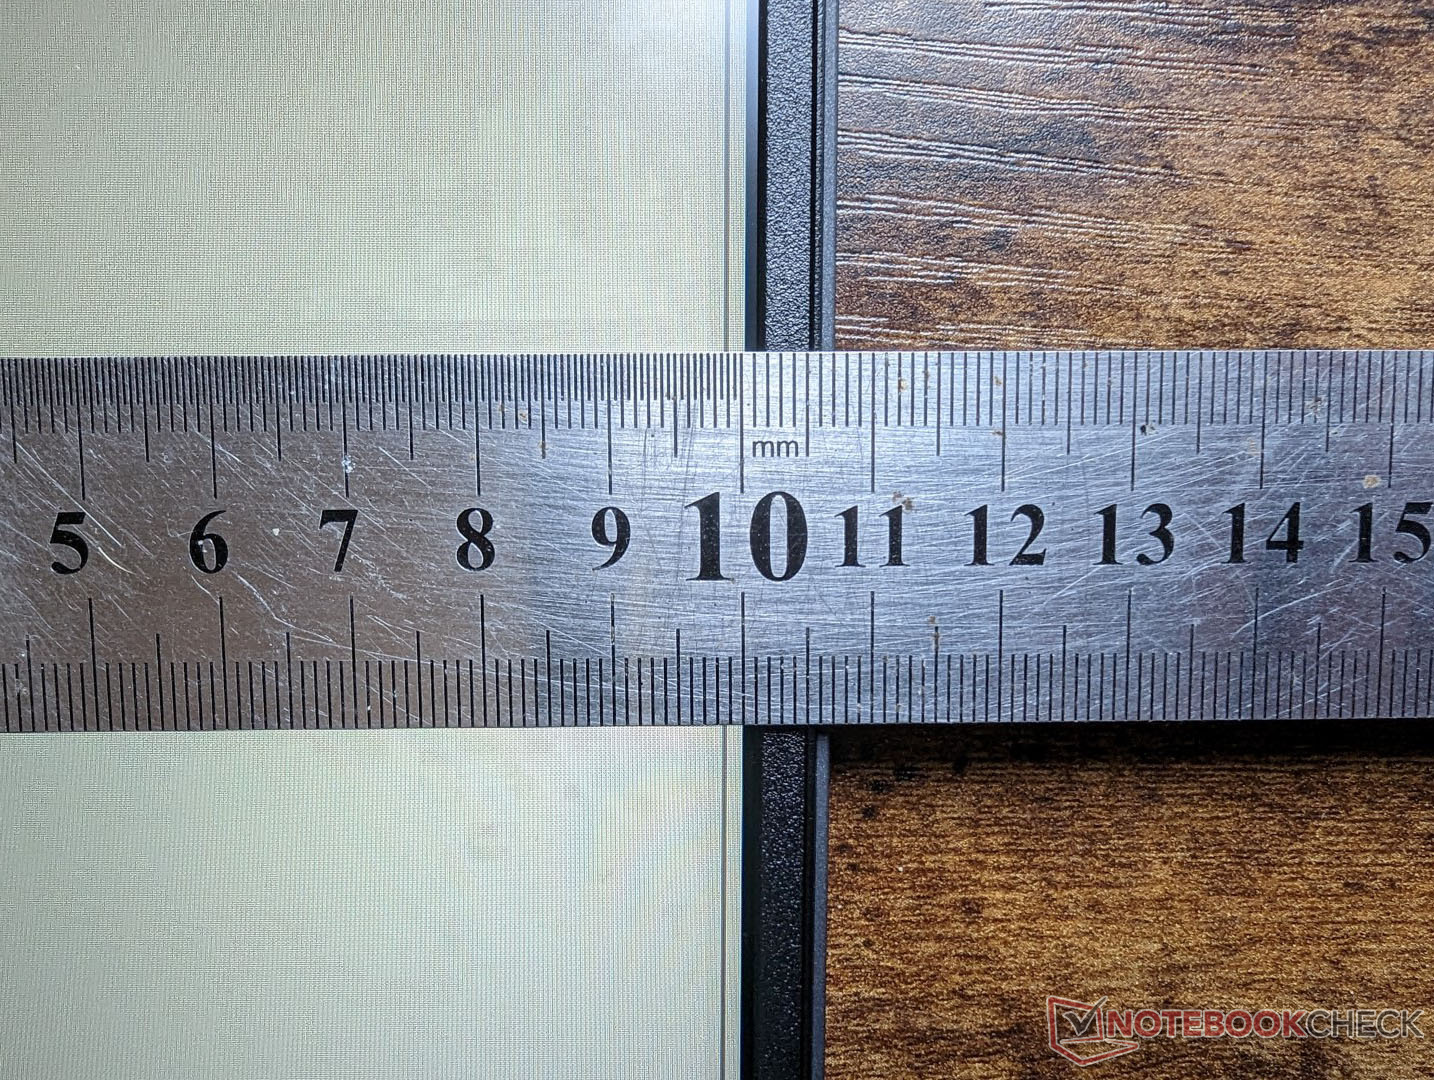
O espaçoso clickpad é um pouco maior que o do Legion 5 15 (12,5 x 8 cm vs. 12,5 x 7,5 cm). A tração é suave na superfície do plástico com apenas um pouco de aderência em velocidades mais lentas para entradas mais precisas. As teclas integradas também são clicáveis e não muito esponjosas.
Os dois maiores inconvenientes do clickpad são seu alto feedback quando pressionado e sua tendência geral de acumular impressões digitais. Espere que o descanso da palma da mão, as teclas e o clickpad pareçam brilhantes e gordurosos em um curto período de tempo.
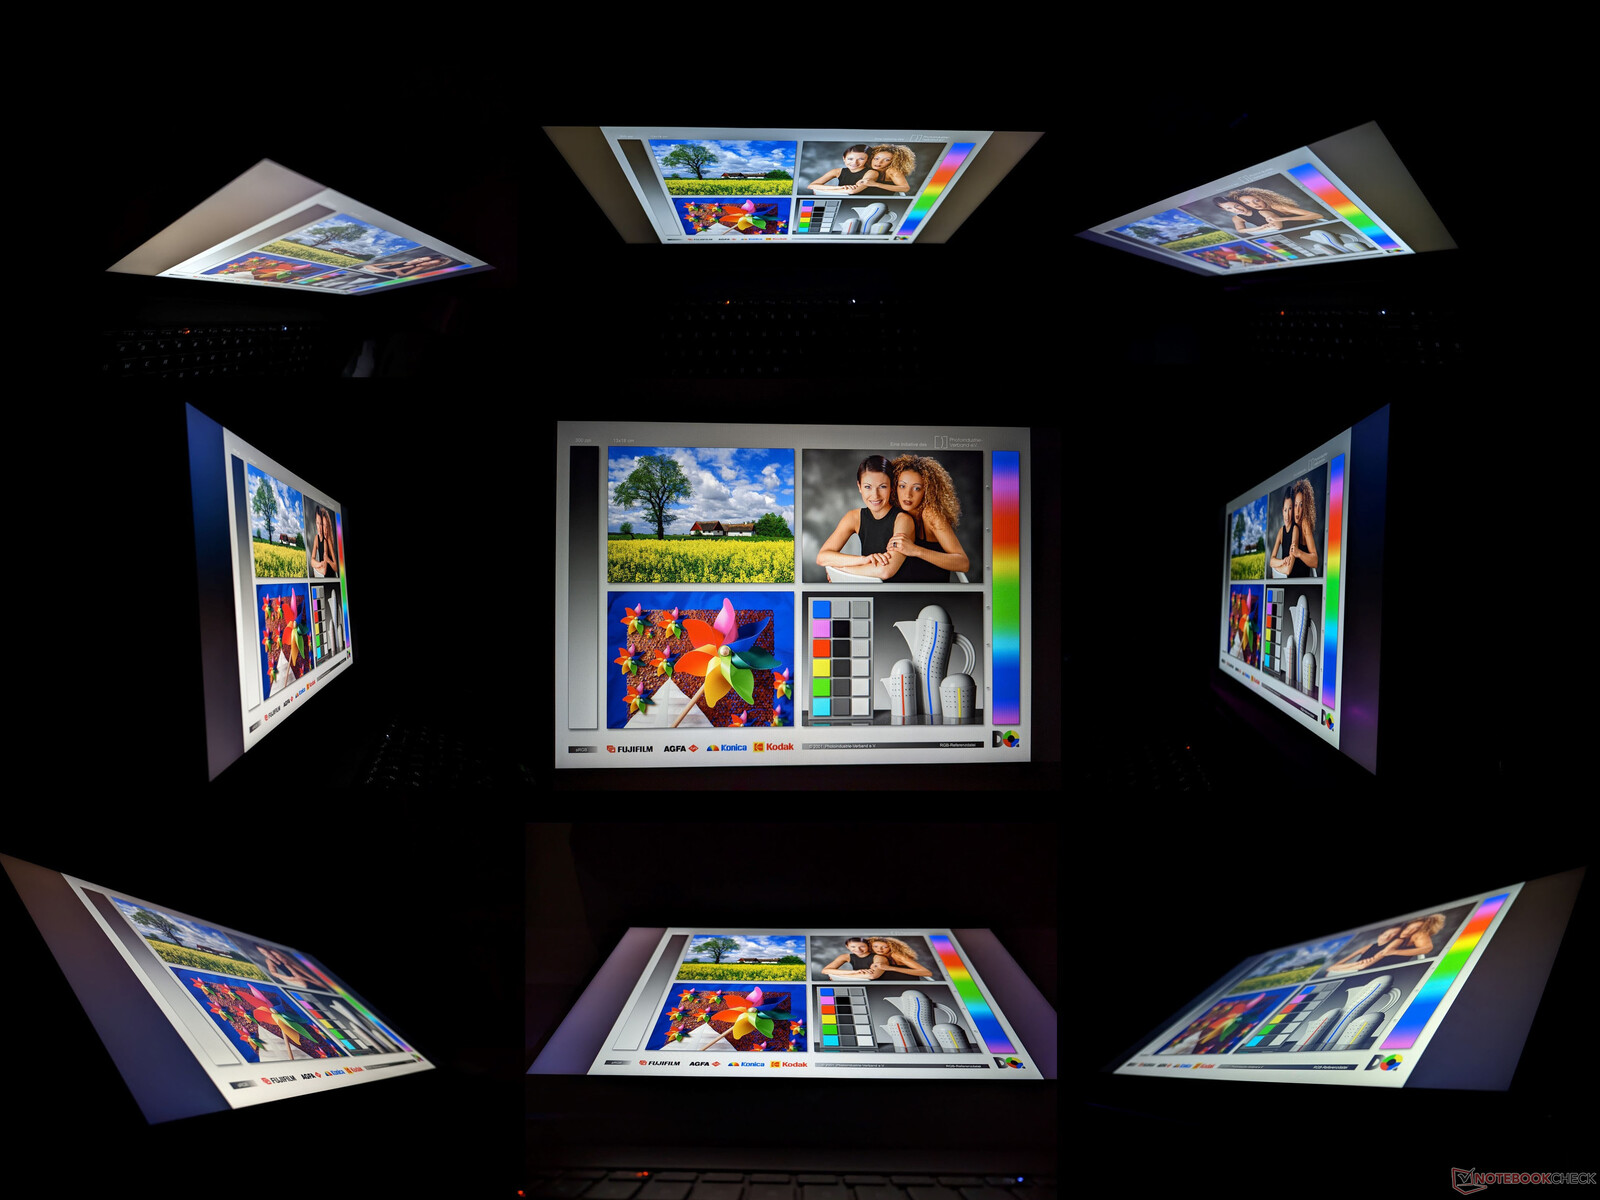
Exibição - 1080p apenas
Quatro opções de exibição estão disponíveis como a seguir:
- 1920 x 1080, 60 Hz, 250 lêndeas, TN
- 1920 x 1080, 60 Hz, 250 lêndeas, IPS
- 1920 x 1080, 144 Hz, 250 lêndeas, IPS
- 1920 x 1080, 60 Hz, 300 lêndeas, IPS
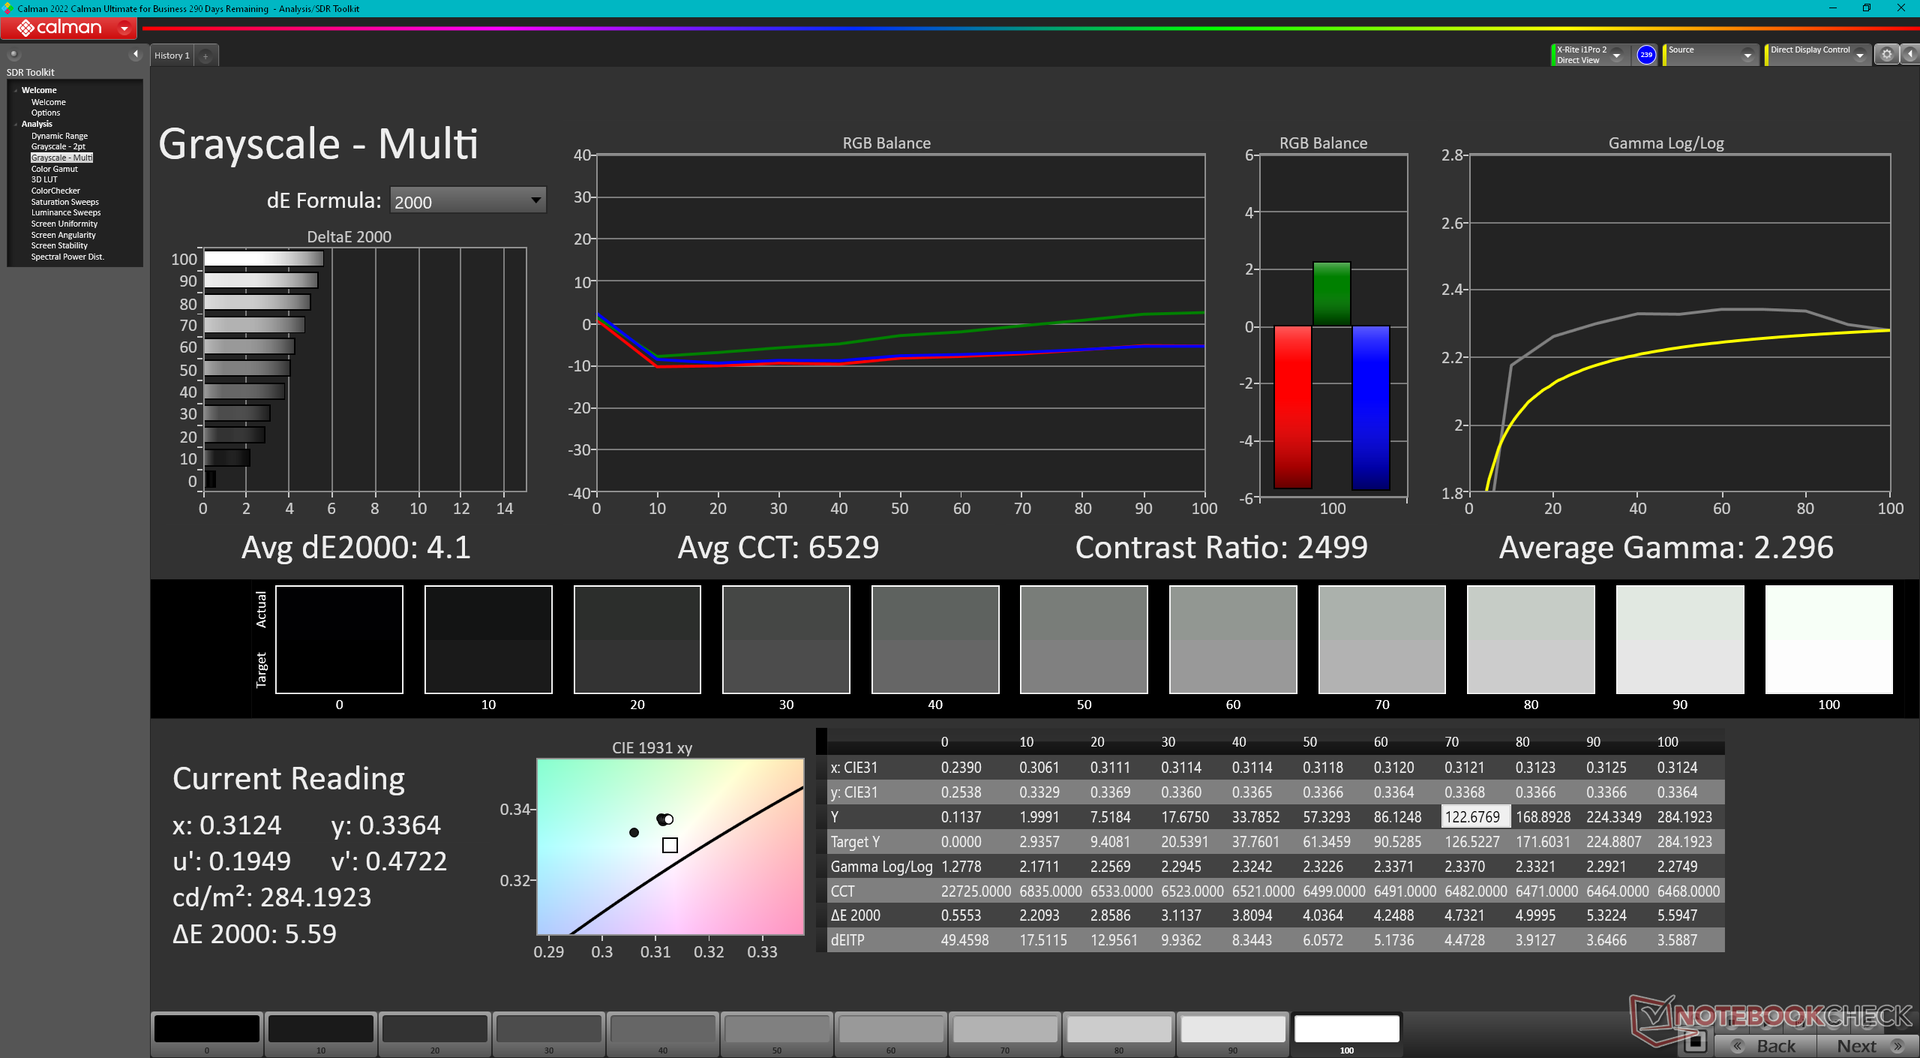
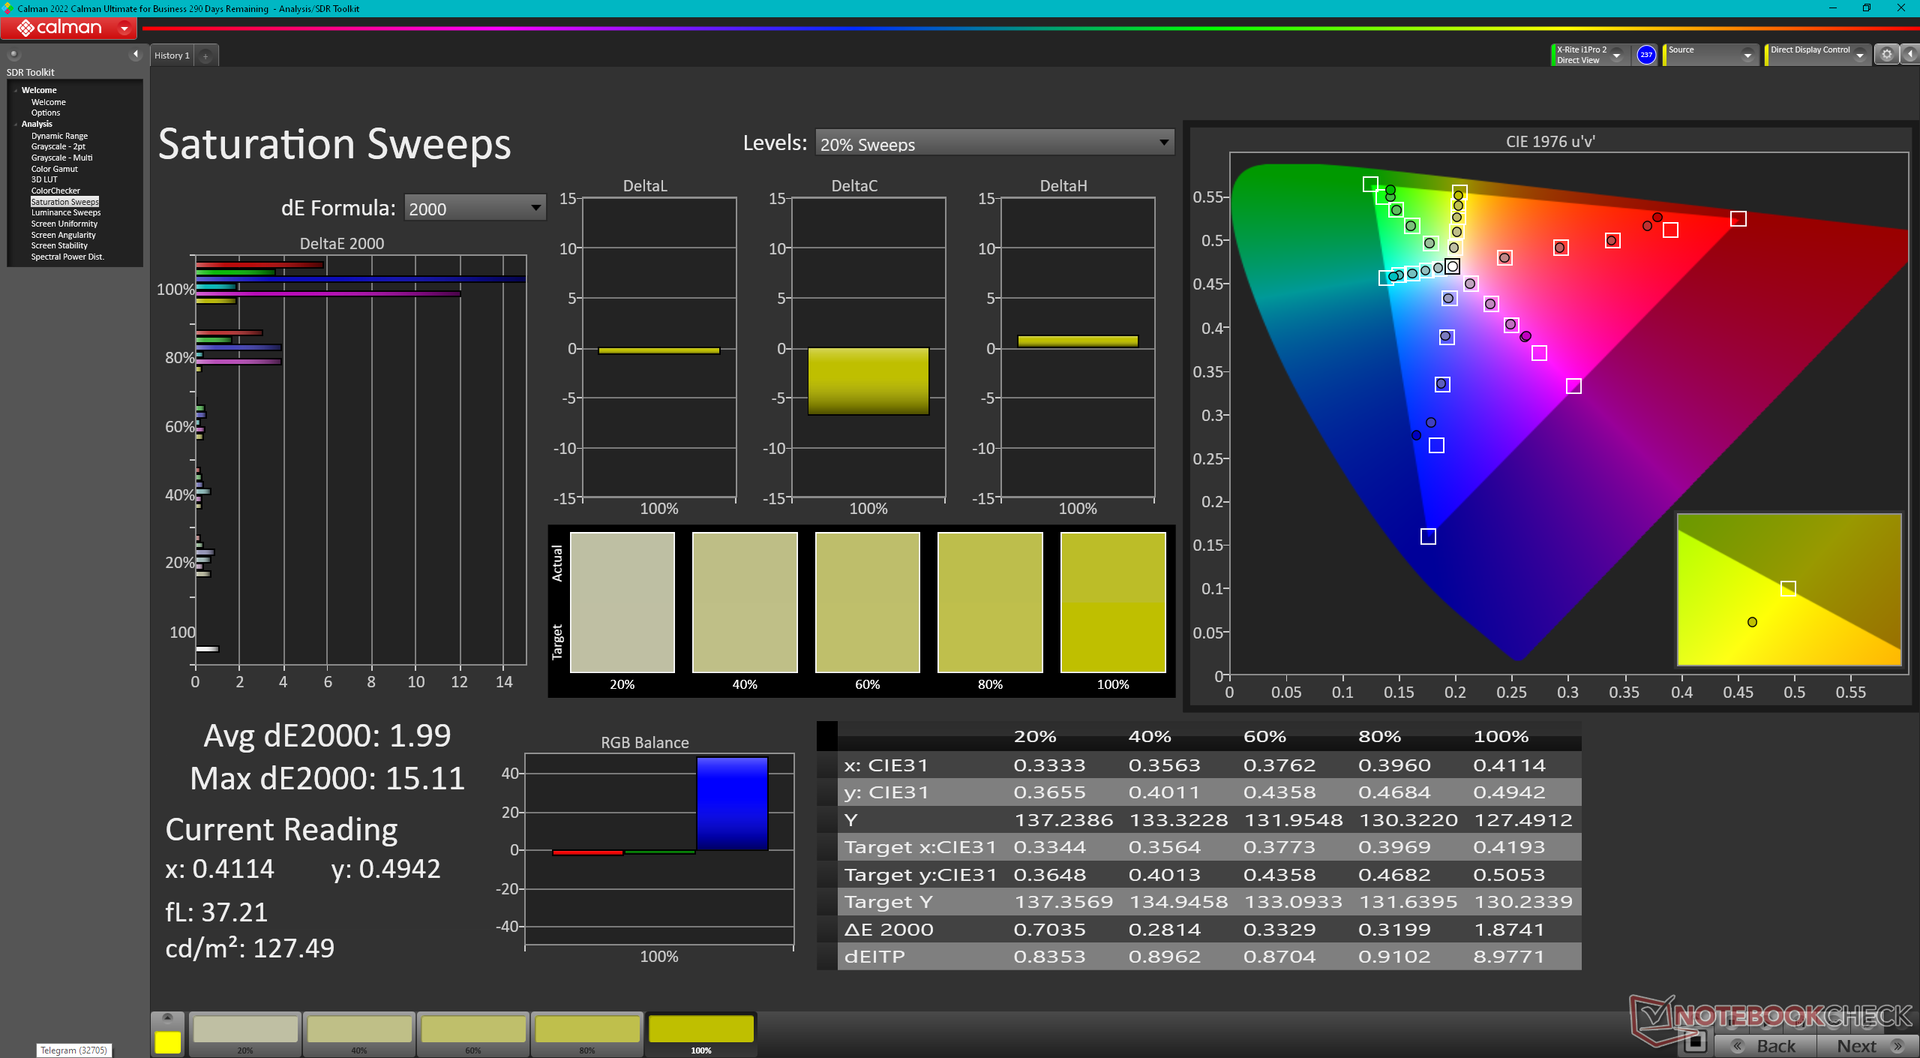
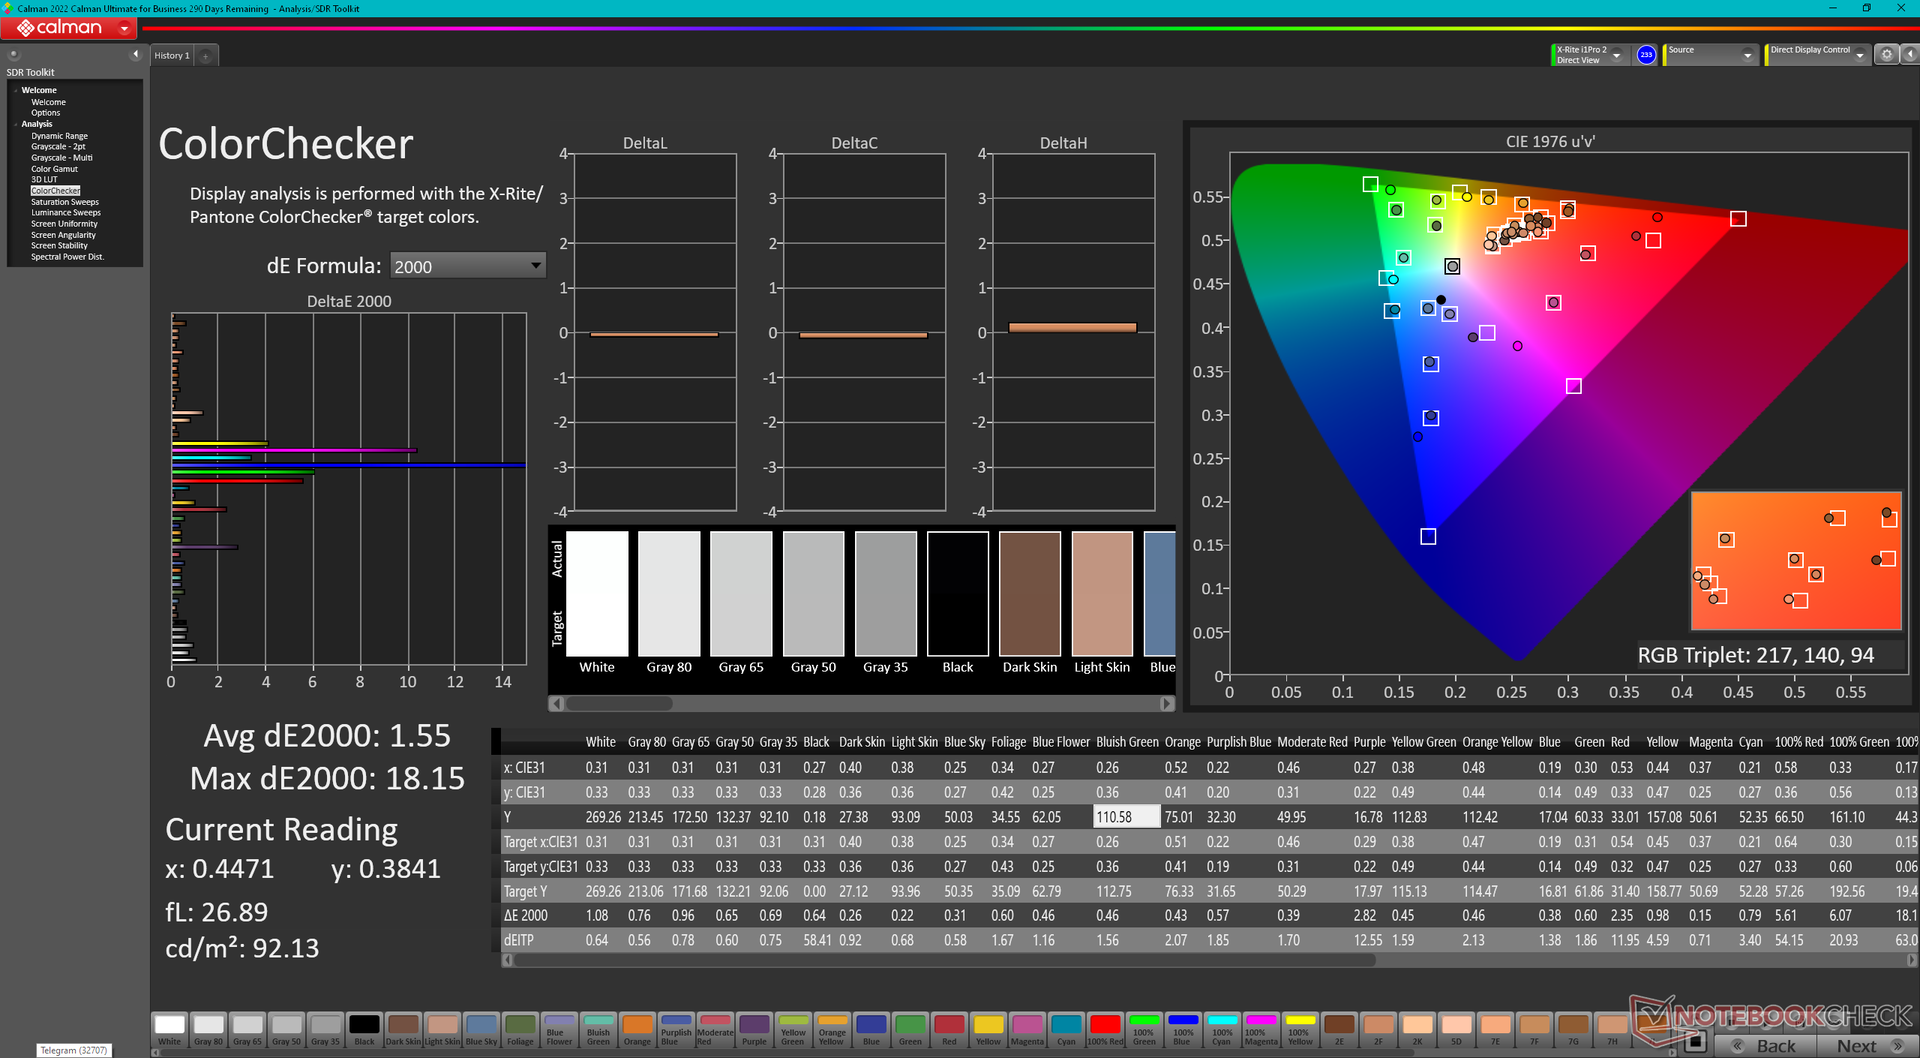
Todas as opções são mate sem painéis OLED ou de maior resolução à escolha. Nossa unidade de revisão específica vem com a opção ousada acima para uma experiência mais suave para o usuário, mas as cores ruins e os tempos médios de resposta são os principais fatores diferenciadores que separam os laptops Victus 15 dos laptops mais caros para jogos com telas melhores. O Série Omen 16a SRGB, por exemplo, oferece cobertura completa de sRGB e tempos de resposta mais rápidos.
A relação de contraste é pelo menos muito boa para um laptop com um orçamento de cerca de 1500:1. Mesmo assim, as cores e o conteúdo não aparecem devido à gama limitada do painel.


| |||||||||||||||||||||||||
iluminação: 87 %
iluminação com acumulador: 284.3 cd/m²
Contraste: 1672:1 (Preto: 0.17 cd/m²)
ΔE ColorChecker Calman: 4.52 | ∀{0.5-29.43 Ø4.71}
calibrated: 1.55
ΔE Greyscale Calman: 4.1 | ∀{0.09-98 Ø4.96}
43.4% AdobeRGB 1998 (Argyll 3D)
62.7% sRGB (Argyll 3D)
42% Display P3 (Argyll 3D)
Gamma: 2.3
CCT: 6529 K
| HP Victus 15 fa0020nr CMN1521, IPS, 1920x1080, 15.6" | HP Omen 15-en0375ng BOE0852, IPS, 1920x1080, 15.6" | Dell G15 5515 BOE092A, IPS, 1920x1080, 15.6" | Asus TUF Dash F15 FX517ZC BOE CQ NE156QHM-NY1, IPS, 2560x1440, 15.6" | MSI Bravo 15 B5DD-010US Chi Mei N156HRA-EA1, IPS, 1920x1080, 15.6" | Lenovo Legion 5 15IAH7H 82RB CSOT MNF601CA1-3, IPS, 1920x1080, 15.6" | |
|---|---|---|---|---|---|---|
| Display | -7% | -8% | 94% | 0% | 62% | |
| Display P3 Coverage (%) | 42 | 39.12 -7% | 39.1 -7% | 95.8 128% | 42.1 0% | 69.1 65% |
| sRGB Coverage (%) | 62.7 | 57.6 -8% | 56.9 -9% | 99.9 59% | 62.8 0% | 99.5 59% |
| AdobeRGB 1998 Coverage (%) | 43.4 | 40.42 -7% | 40.4 -7% | 85.1 96% | 43.6 0% | 70 61% |
| Response Times | 19% | 33% | 69% | 22% | 57% | |
| Response Time Grey 50% / Grey 80% * (ms) | 35.2 ? | 30.4 ? 14% | 25.2 ? 28% | 8.4 ? 76% | 25.6 ? 27% | 14.8 ? 58% |
| Response Time Black / White * (ms) | 27.2 ? | 20.8 ? 24% | 16.8 ? 38% | 10.4 ? 62% | 22.8 ? 16% | 12 ? 56% |
| PWM Frequency (Hz) | 200 ? | 200 ? | ||||
| Screen | -31% | -43% | -9% | -37% | -3% | |
| Brightness middle (cd/m²) | 284.3 | 297 4% | 278 -2% | 354.2 25% | 265.1 -7% | 363.5 28% |
| Brightness (cd/m²) | 262 | 275 5% | 262 0% | 330 26% | 245 -6% | 350 34% |
| Brightness Distribution (%) | 87 | 88 1% | 83 -5% | 88 1% | 87 0% | 89 2% |
| Black Level * (cd/m²) | 0.17 | 0.33 -94% | 0.36 -112% | 0.32 -88% | 0.35 -106% | 0.39 -129% |
| Contrast (:1) | 1672 | 900 -46% | 772 -54% | 1107 -34% | 757 -55% | 932 -44% |
| Colorchecker dE 2000 * | 4.52 | 4.54 -0% | 5.74 -27% | 4.06 10% | 4.68 -4% | 3.68 19% |
| Colorchecker dE 2000 max. * | 18.67 | 18.92 -1% | 19.63 -5% | 8.81 53% | 19.96 -7% | 8.92 52% |
| Colorchecker dE 2000 calibrated * | 1.55 | 4.66 -201% | 4.7 -203% | 3.7 -139% | 0.53 66% | |
| Greyscale dE 2000 * | 4.1 | 2.1 49% | 3.1 24% | 6.7 -63% | 4.5 -10% | 6.5 -59% |
| Gamma | 2.3 96% | 2.066 106% | 2.011 109% | 2.12 104% | 2.22 99% | 2.2 100% |
| CCT | 6529 100% | 6291 103% | 6207 105% | 6731 97% | 6632 98% | 5995 108% |
| Color Space (Percent of AdobeRGB 1998) (%) | 40 | |||||
| Color Space (Percent of sRGB) (%) | 58 | |||||
| Média Total (Programa/Configurações) | -6% /
-19% | -6% /
-24% | 51% /
27% | -5% /
-21% | 39% /
19% |
* ... menor é melhor
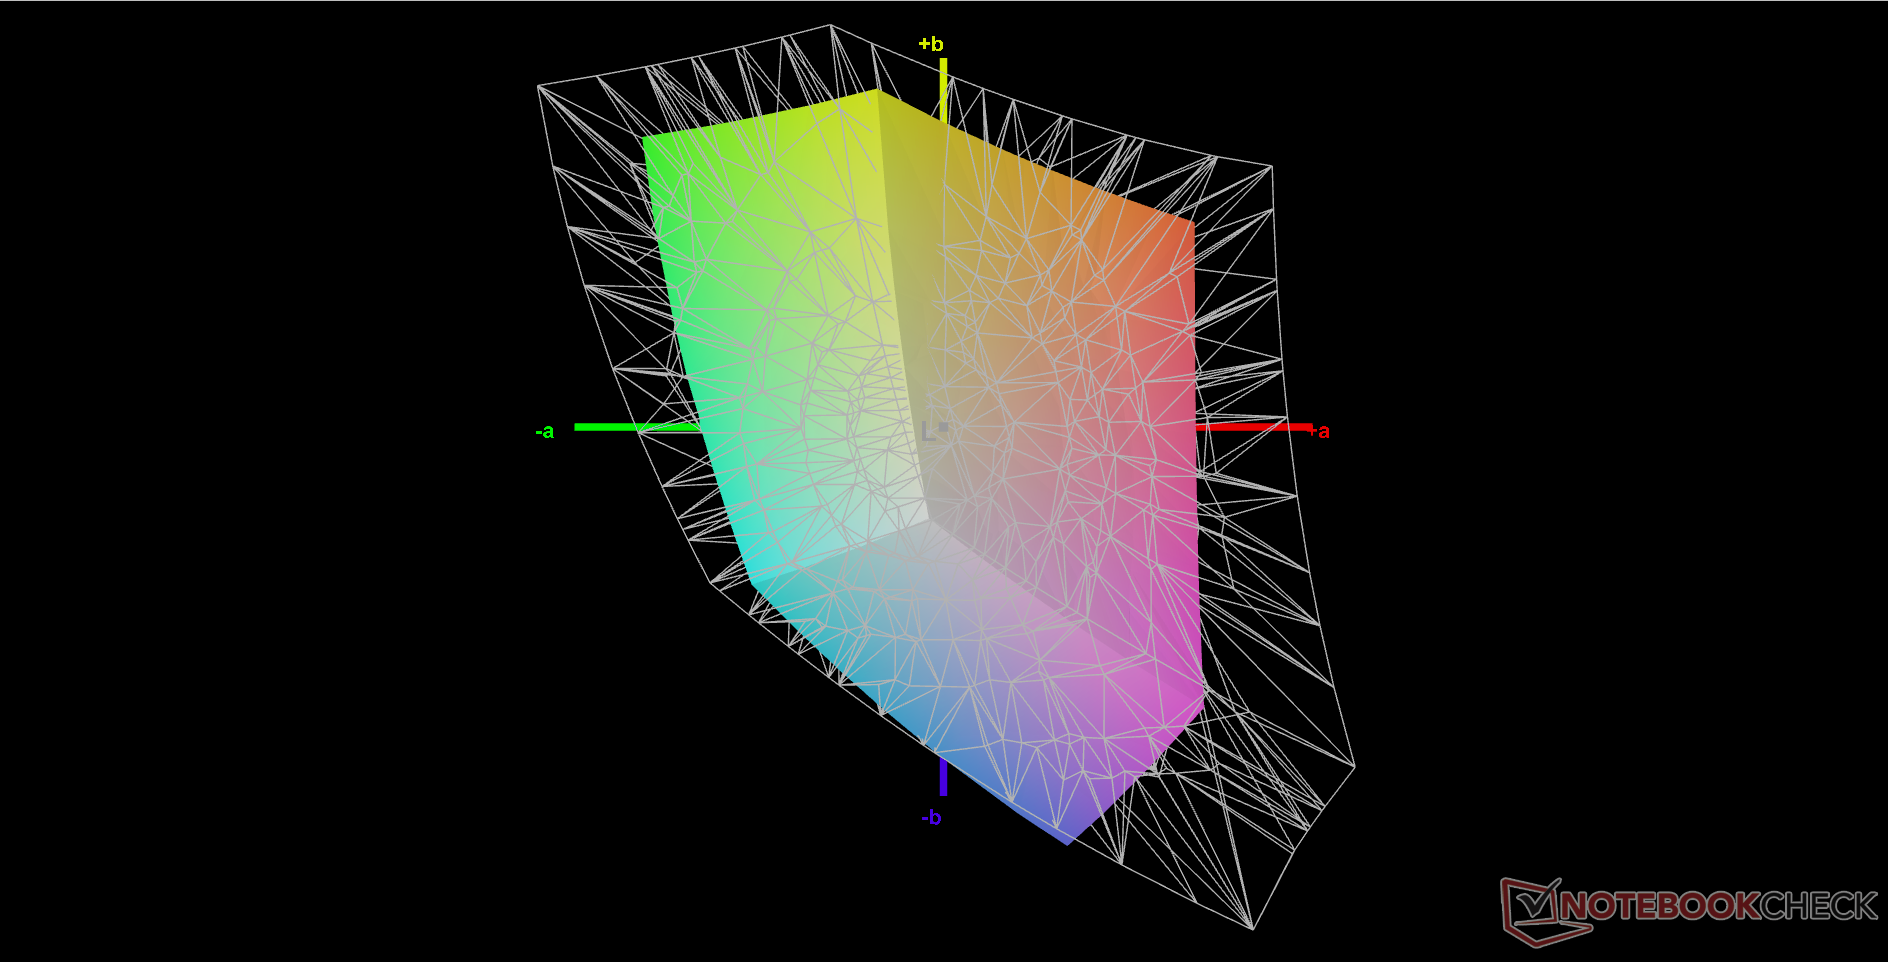
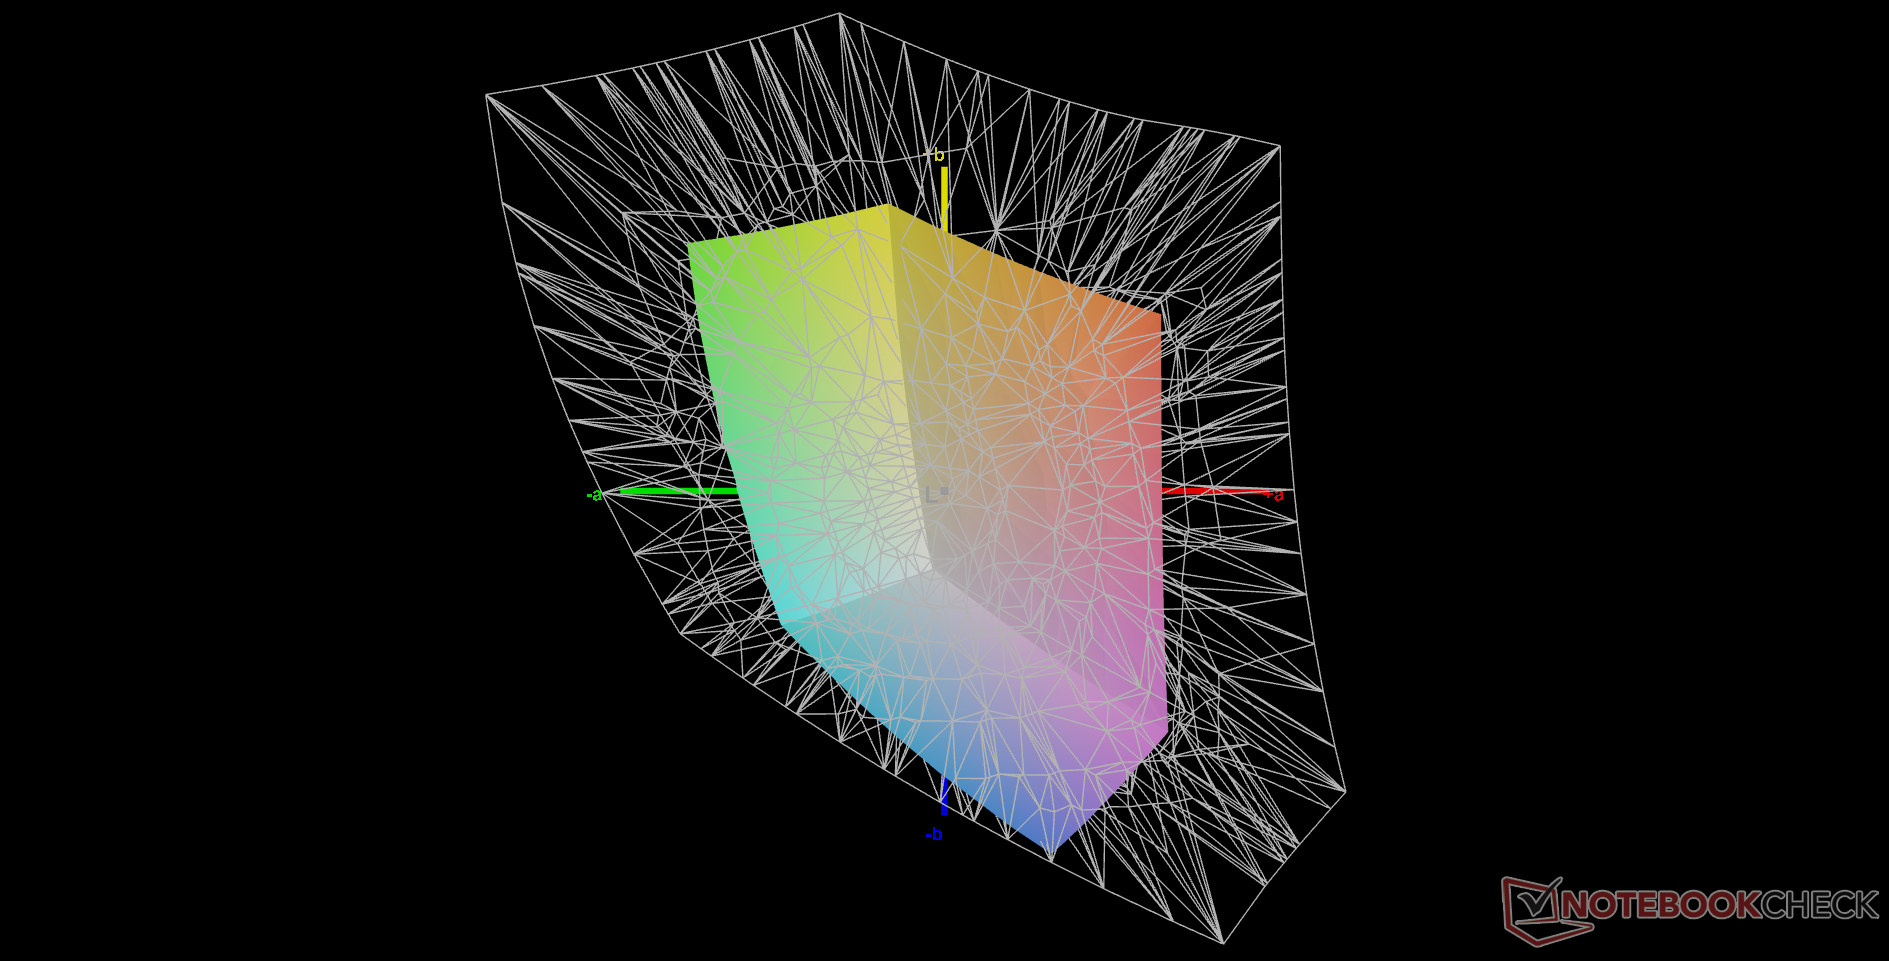
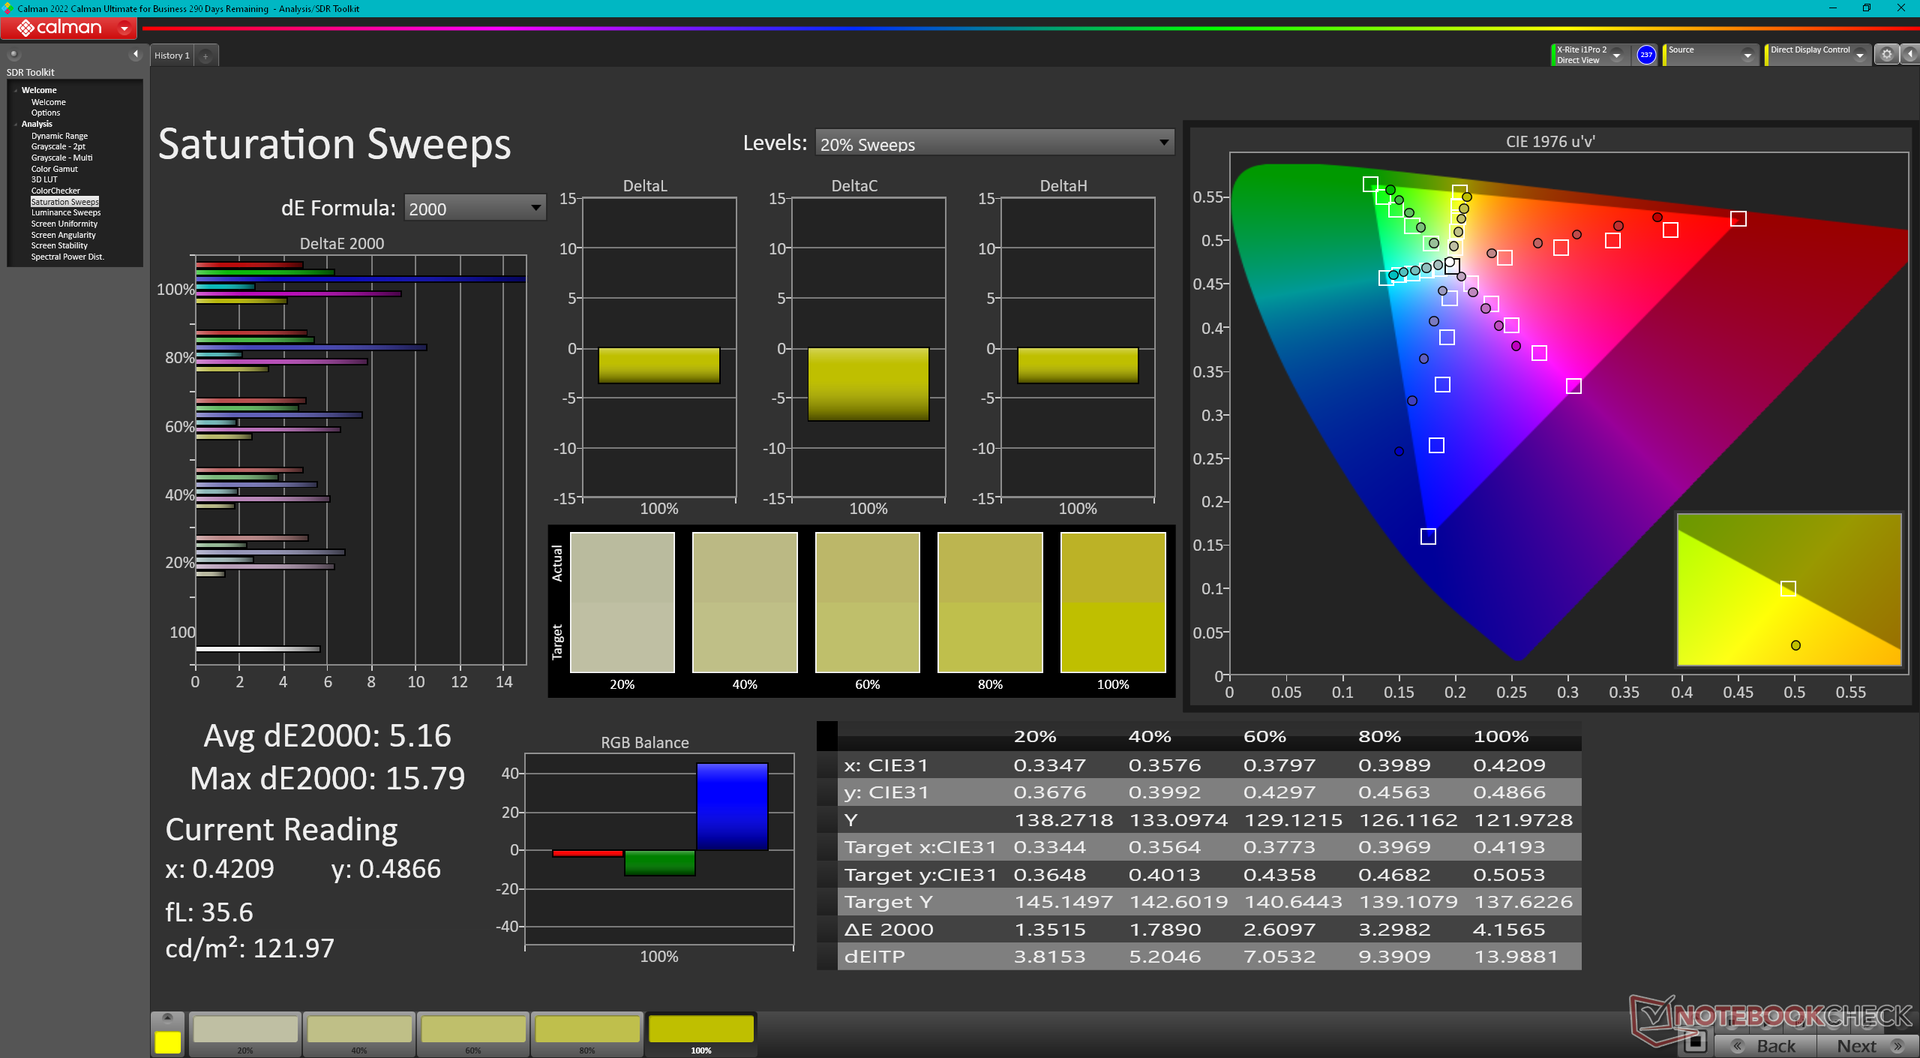
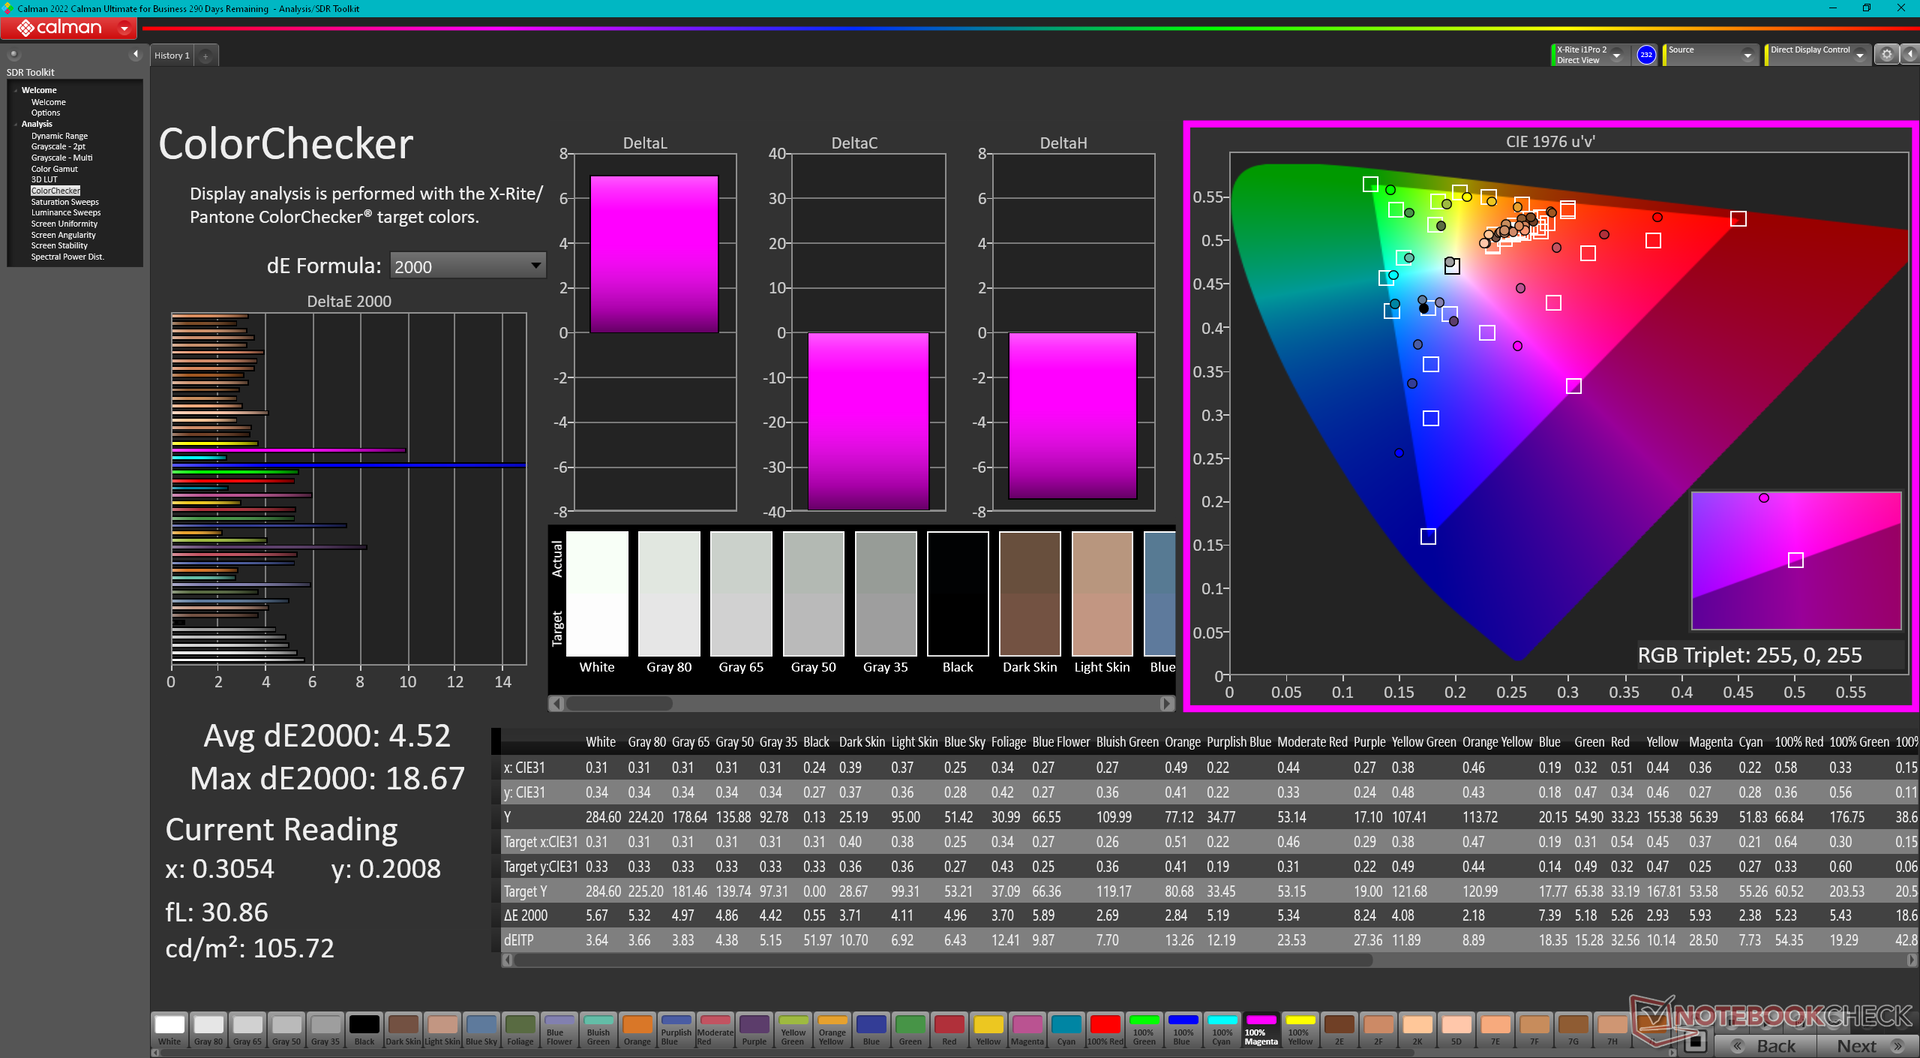
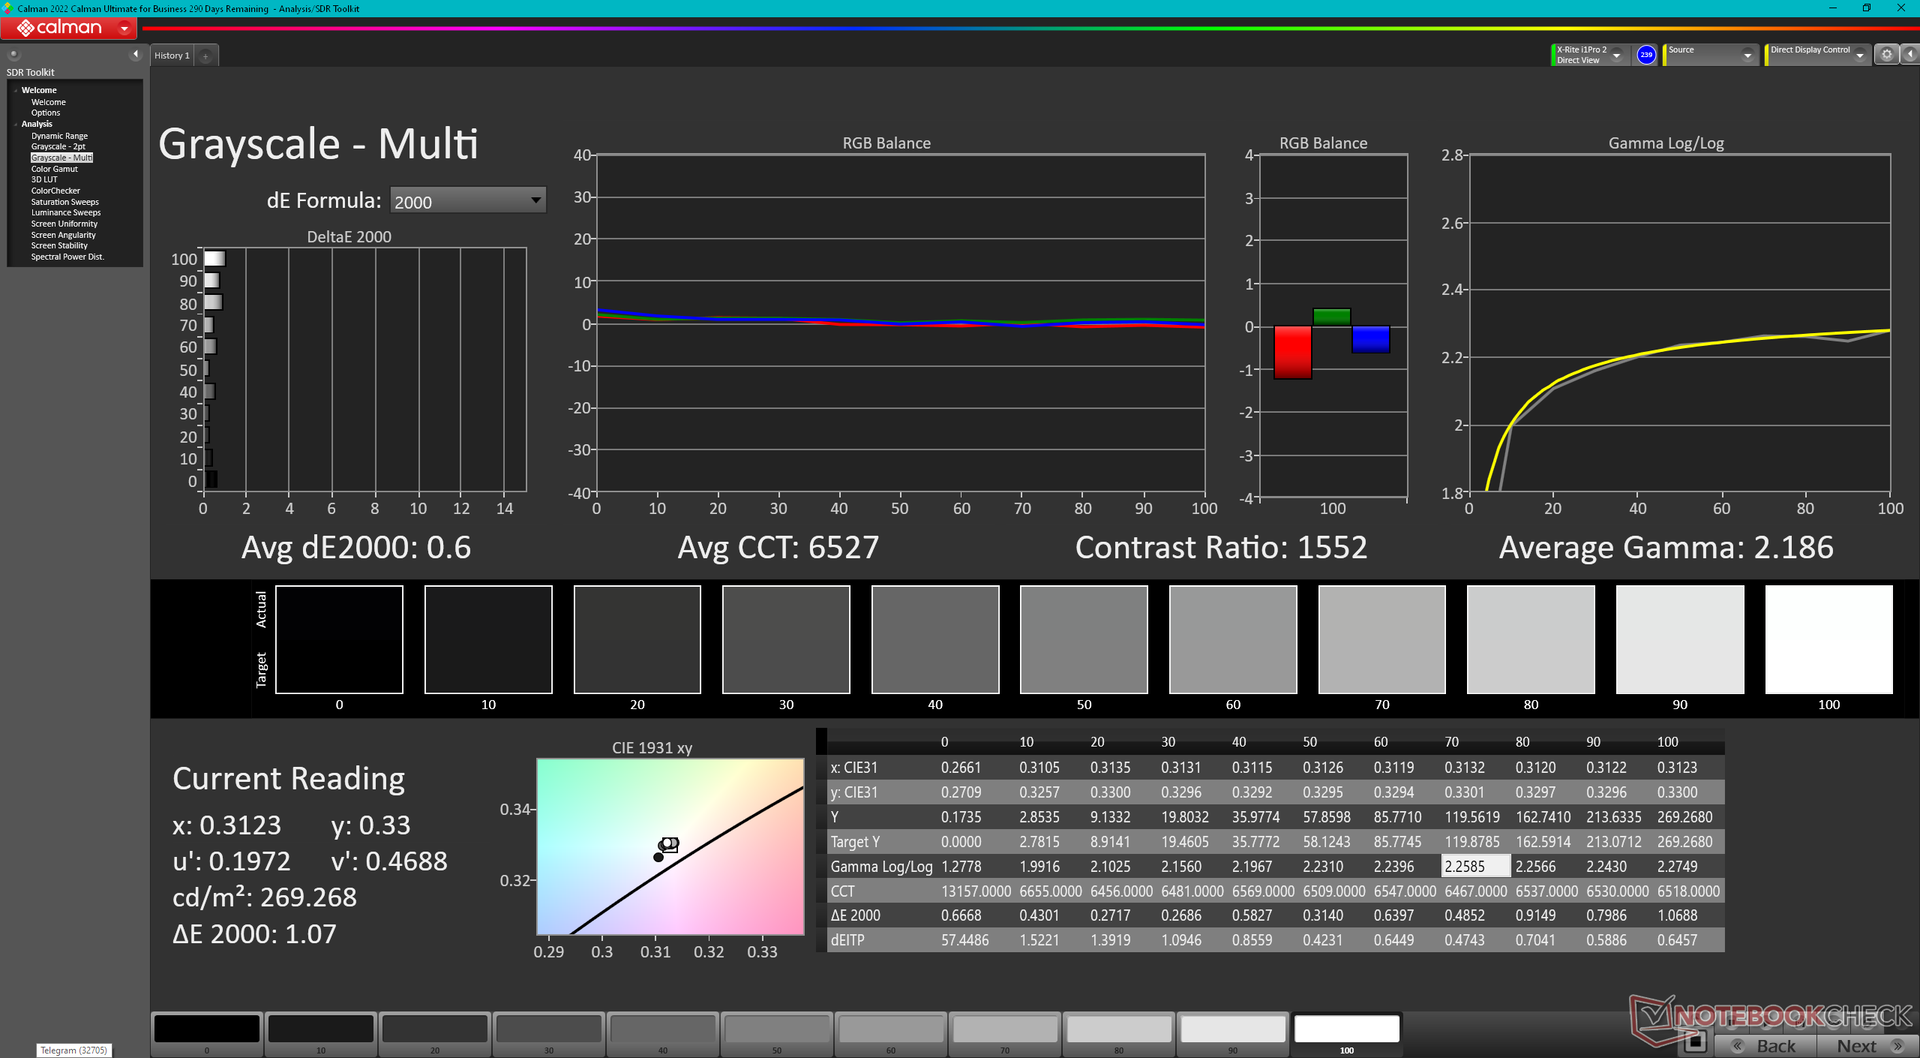
O display não é calibrado fora da caixa com valores médios de escala de cinza e deltaE de cor tão altos quanto 4,1 e 4,52, respectivamente. Calibrar nós mesmos o painel reduziria estes valores para apenas 0,6 e 1,55, respectivamente, mas os níveis de saturação mais altos ainda são muito imprecisos devido à estreita cobertura sRGB mencionada acima. Nossas capturas de tela Calman abaixo mostram as cores azul e magenta em particular para ser muito mais imprecisas do que outras.
Recomendamos aplicar nosso perfil de ICM calibrado acima que pode ajudar a melhorar a precisão das cores em níveis de saturação mais baixos.
Exibir tempos de resposta
| ↔ Tempo de resposta preto para branco | ||
|---|---|---|
| 27.2 ms ... ascensão ↗ e queda ↘ combinadas | ↗ 15.6 ms ascensão | 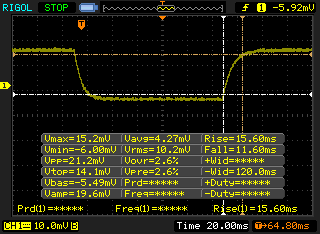 |
| ↘ 11.6 ms queda | ||
| A tela mostra taxas de resposta relativamente lentas em nossos testes e pode ser muito lenta para os jogadores. Em comparação, todos os dispositivos testados variam de 0.1 (mínimo) a 240 (máximo) ms. » 69 % de todos os dispositivos são melhores. Isso significa que o tempo de resposta medido é pior que a média de todos os dispositivos testados (19.8 ms). | ||
| ↔ Tempo de resposta 50% cinza a 80% cinza | ||
| 35.2 ms ... ascensão ↗ e queda ↘ combinadas | ↗ 18 ms ascensão | 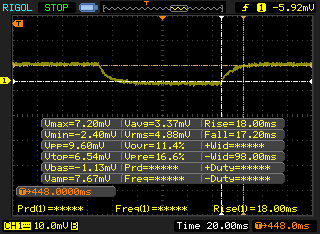 |
| ↘ 17.2 ms queda | ||
| A tela mostra taxas de resposta lentas em nossos testes e será insatisfatória para os jogadores. Em comparação, todos os dispositivos testados variam de 0.165 (mínimo) a 636 (máximo) ms. » 49 % de todos os dispositivos são melhores. Isso significa que o tempo de resposta medido é pior que a média de todos os dispositivos testados (31 ms). | ||
Cintilação da tela / PWM (modulação por largura de pulso)
| Tela tremeluzindo / PWM não detectado | 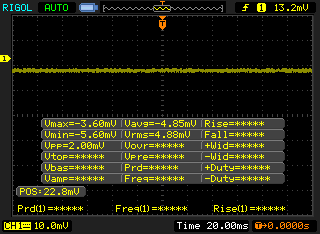 | ||
[pwm_comparison] Em comparação: 52 % de todos os dispositivos testados não usam PWM para escurecer a tela. Se PWM foi detectado, uma média de 7757 (mínimo: 5 - máximo: 343500) Hz foi medida. | |||
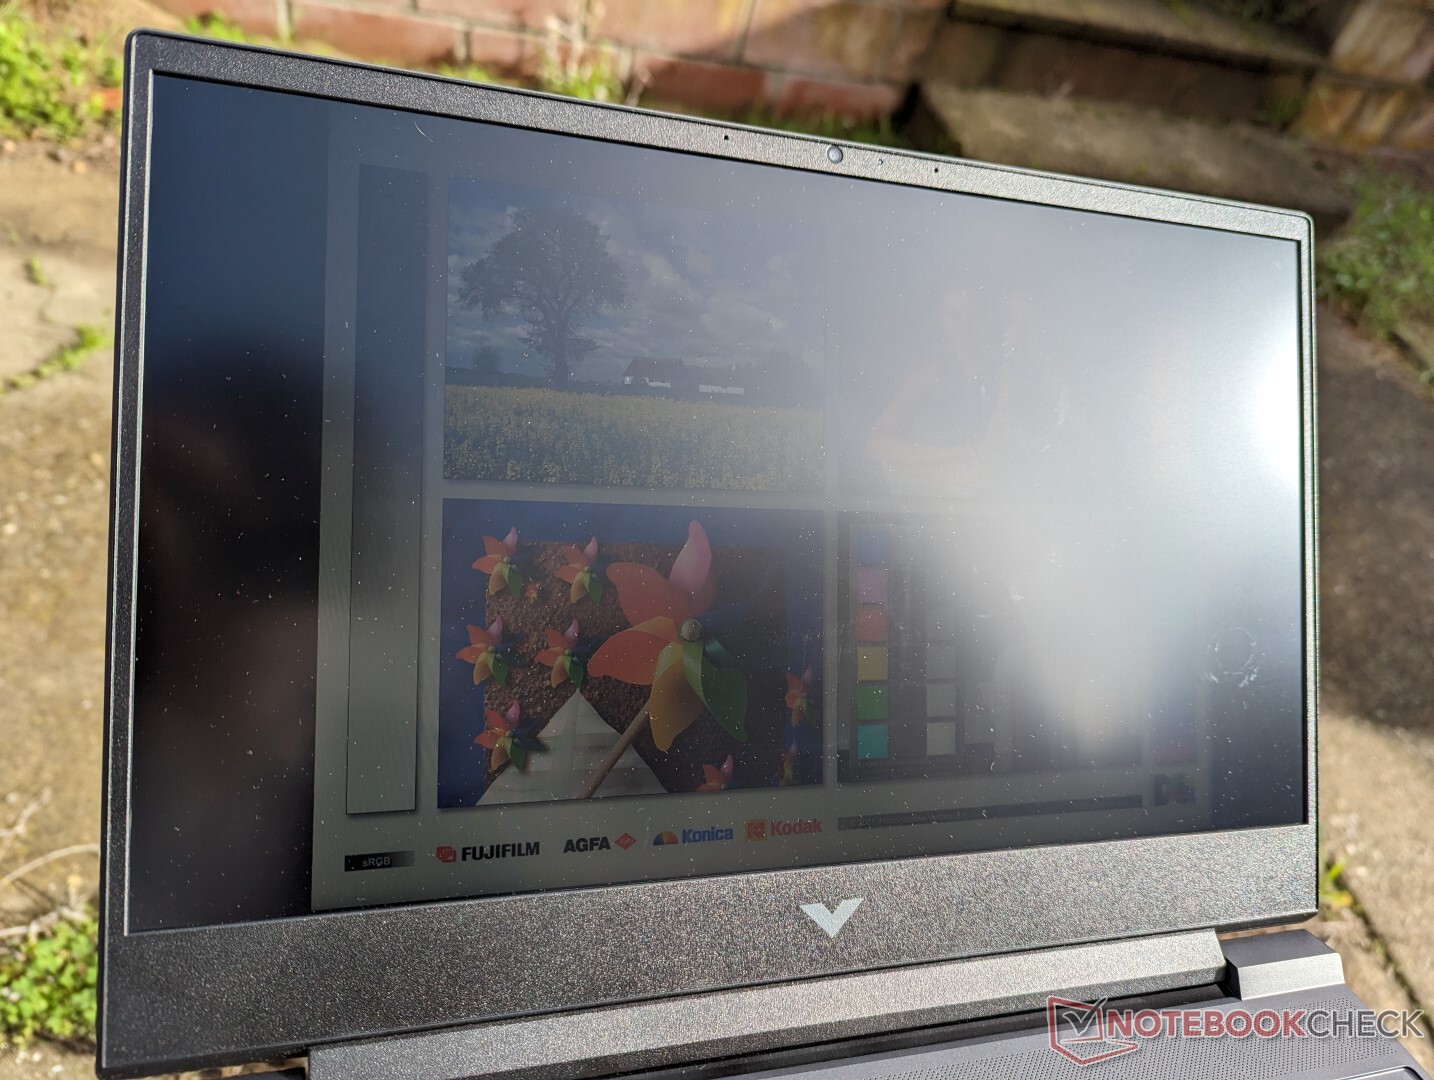
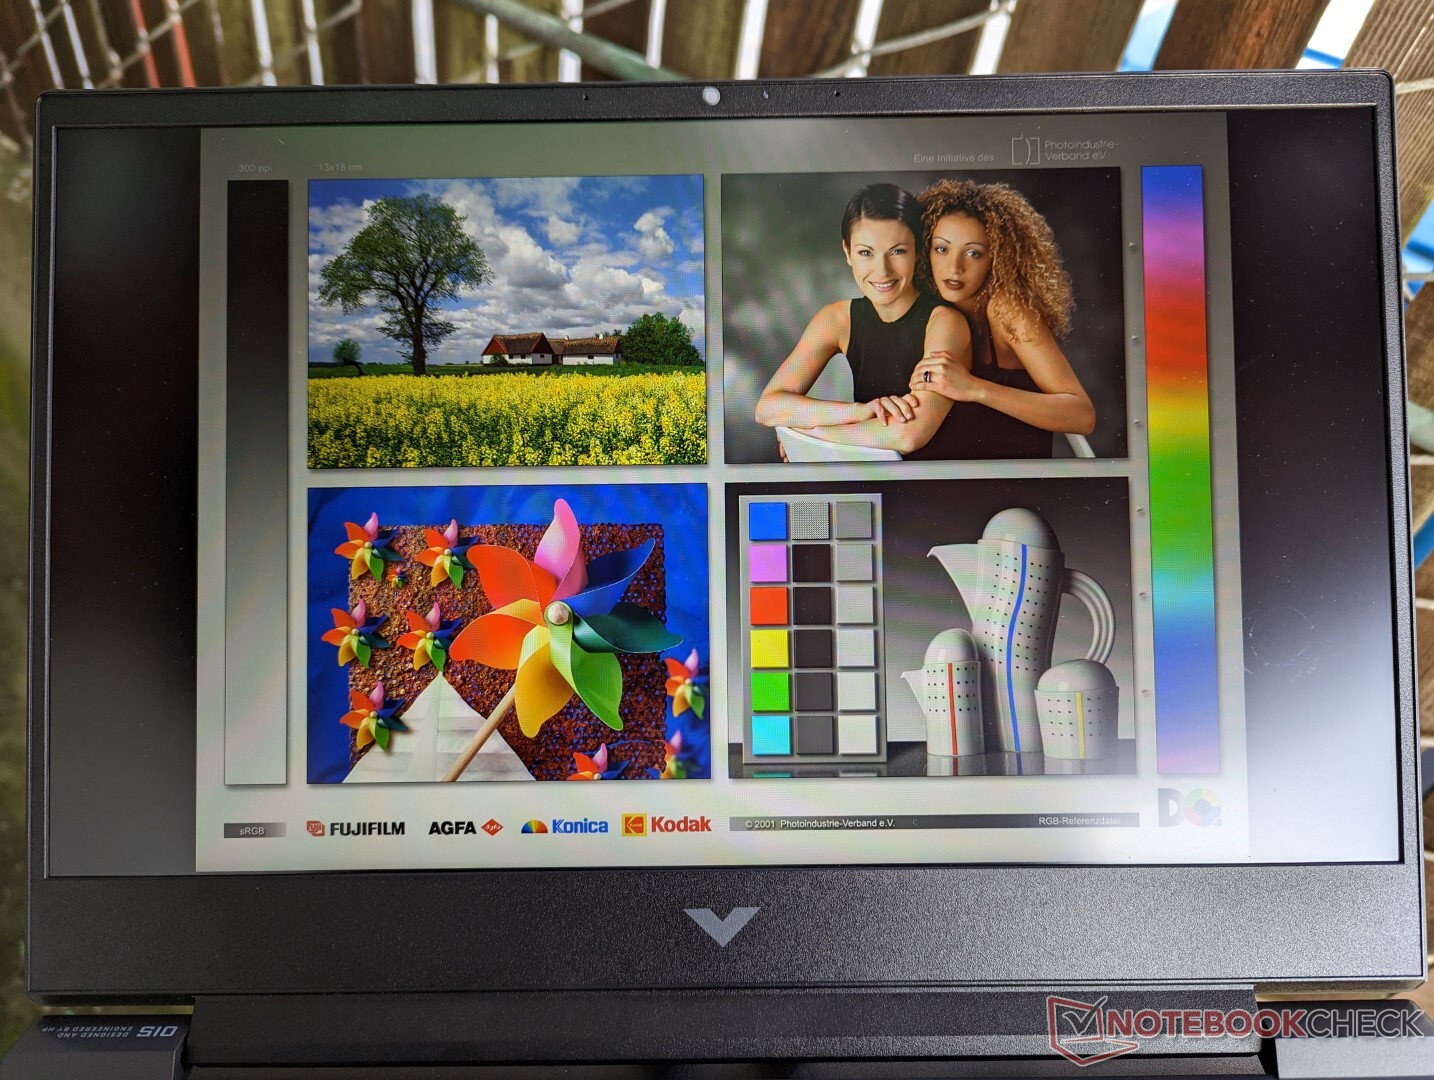
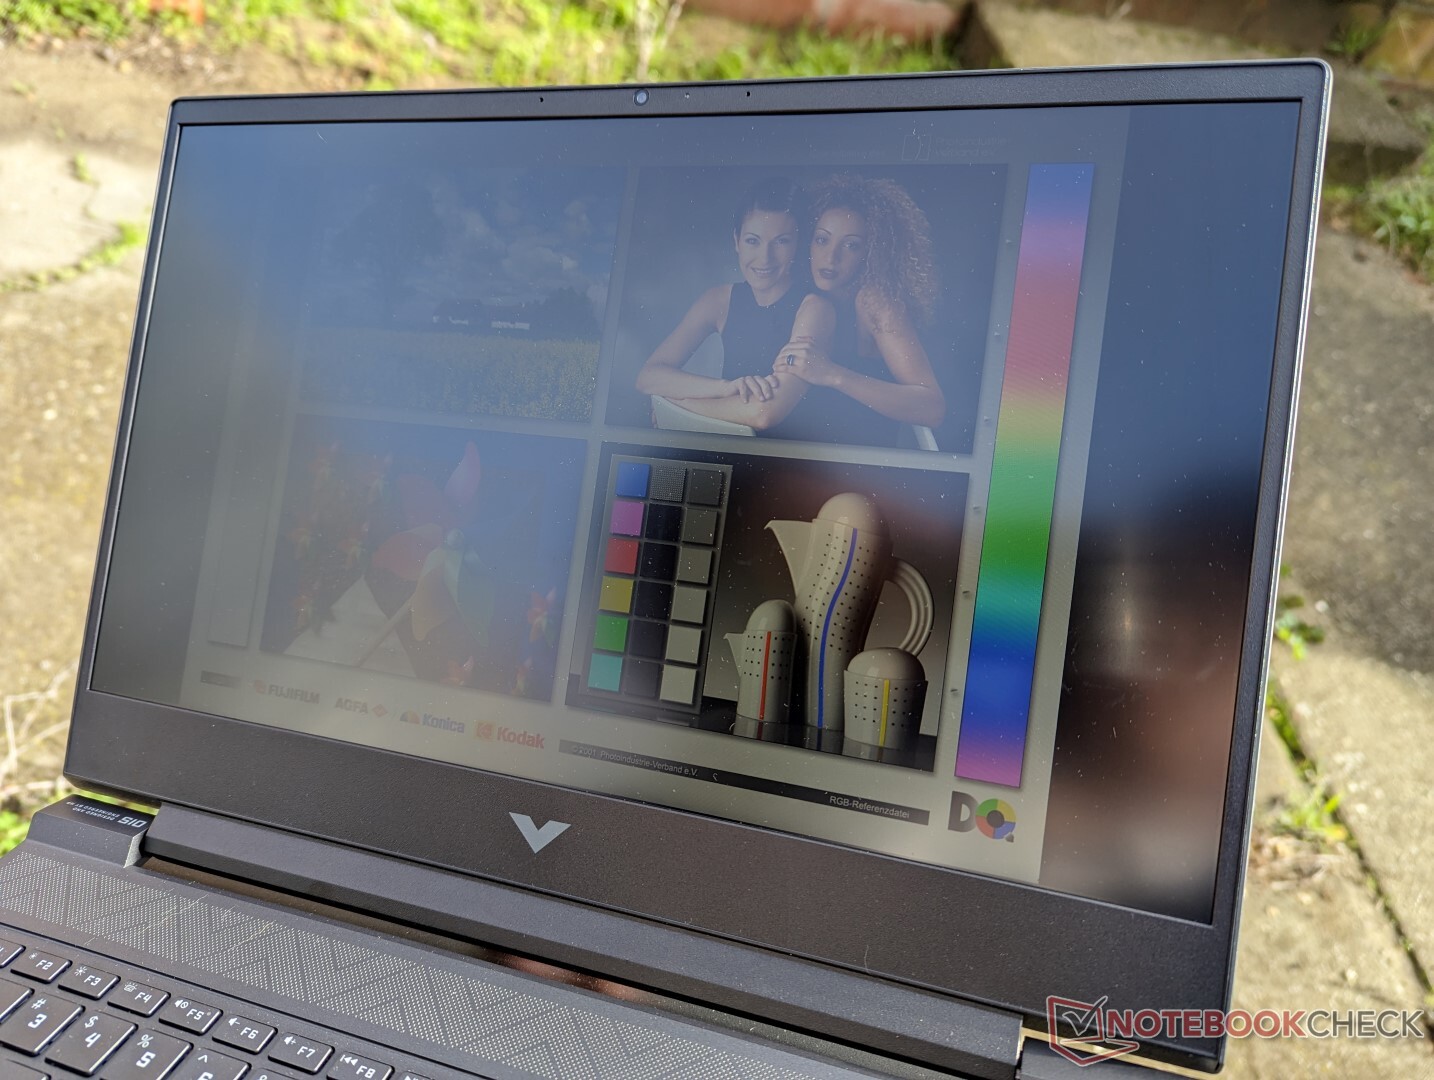
O painel fosco não é brilhante o suficiente para uma visão confortável ao ar livre. O brilho está sempre presente e as cores se tornam desbotadas como resultado. Você terá que investir em um laptop de jogo mais caro com visores mais brilhantes como o Lâmina Razer 15 para um tempo mais fácil ao ar livre.
Desempenho - Intel Alder Lake-H 12th Gen
Condições de teste
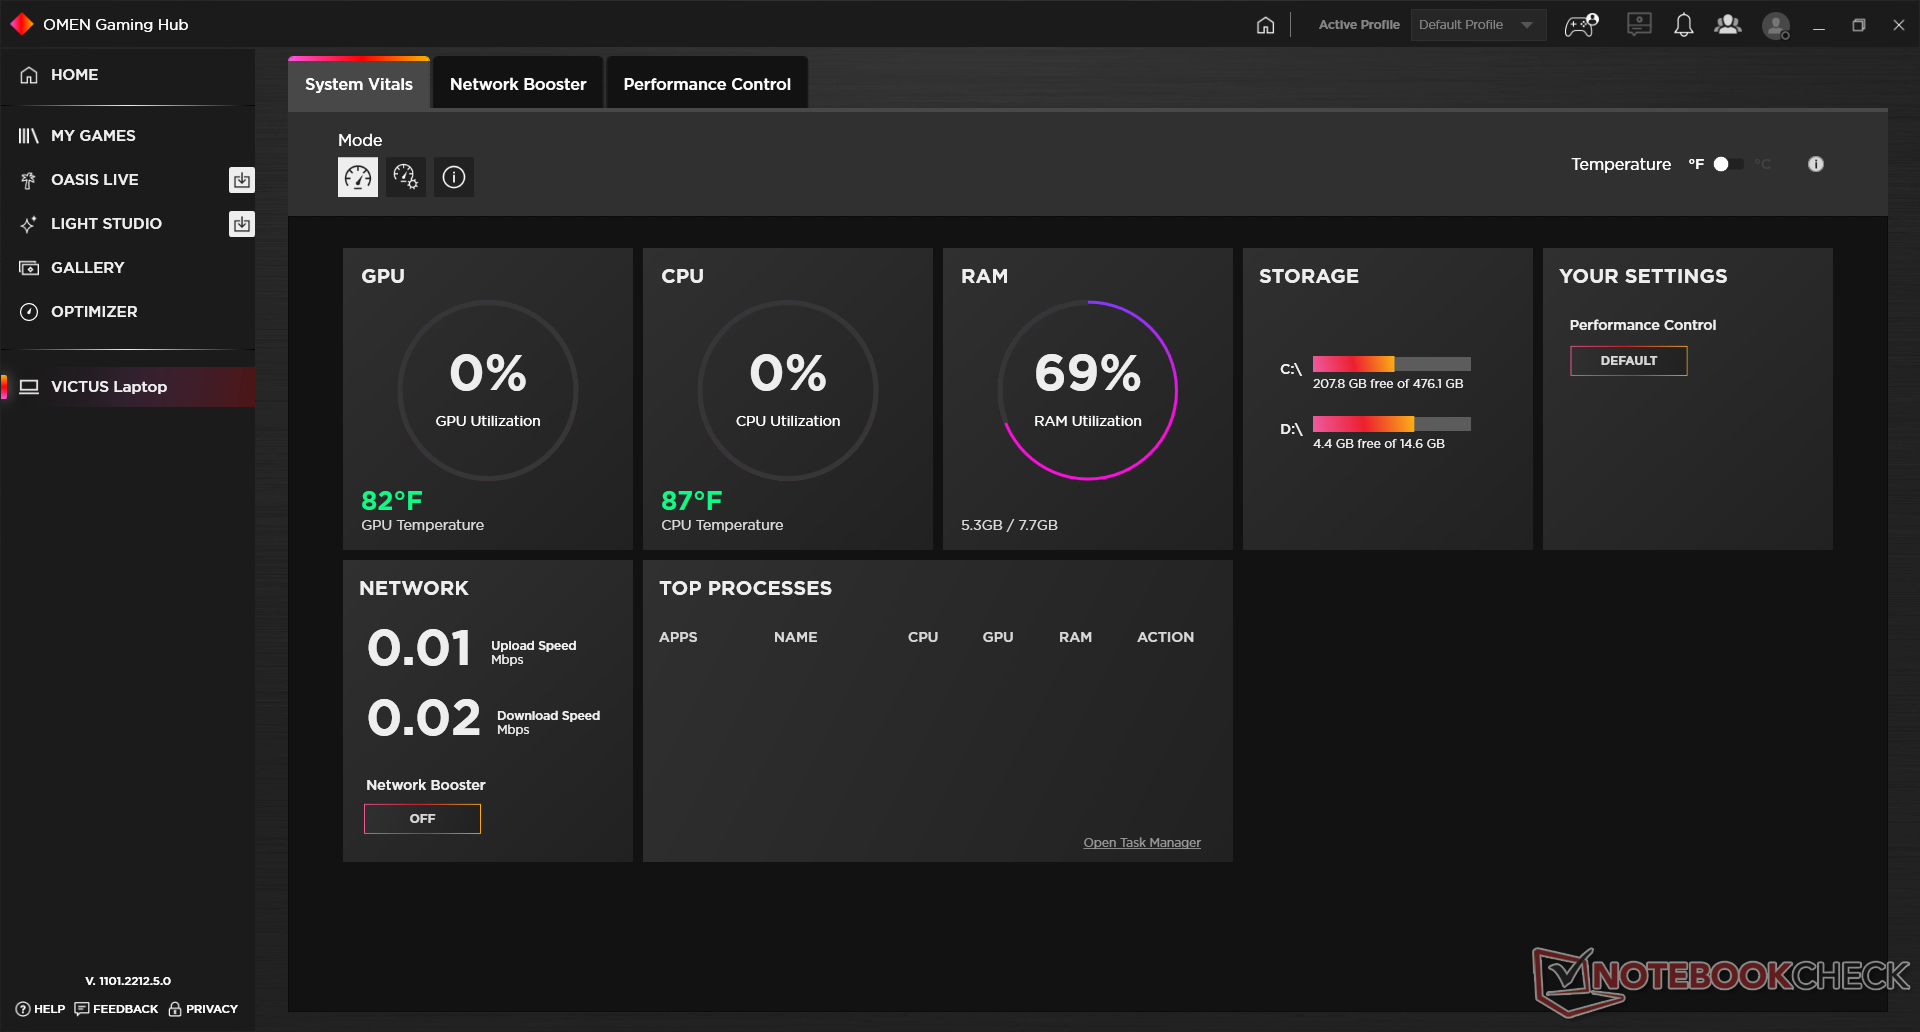
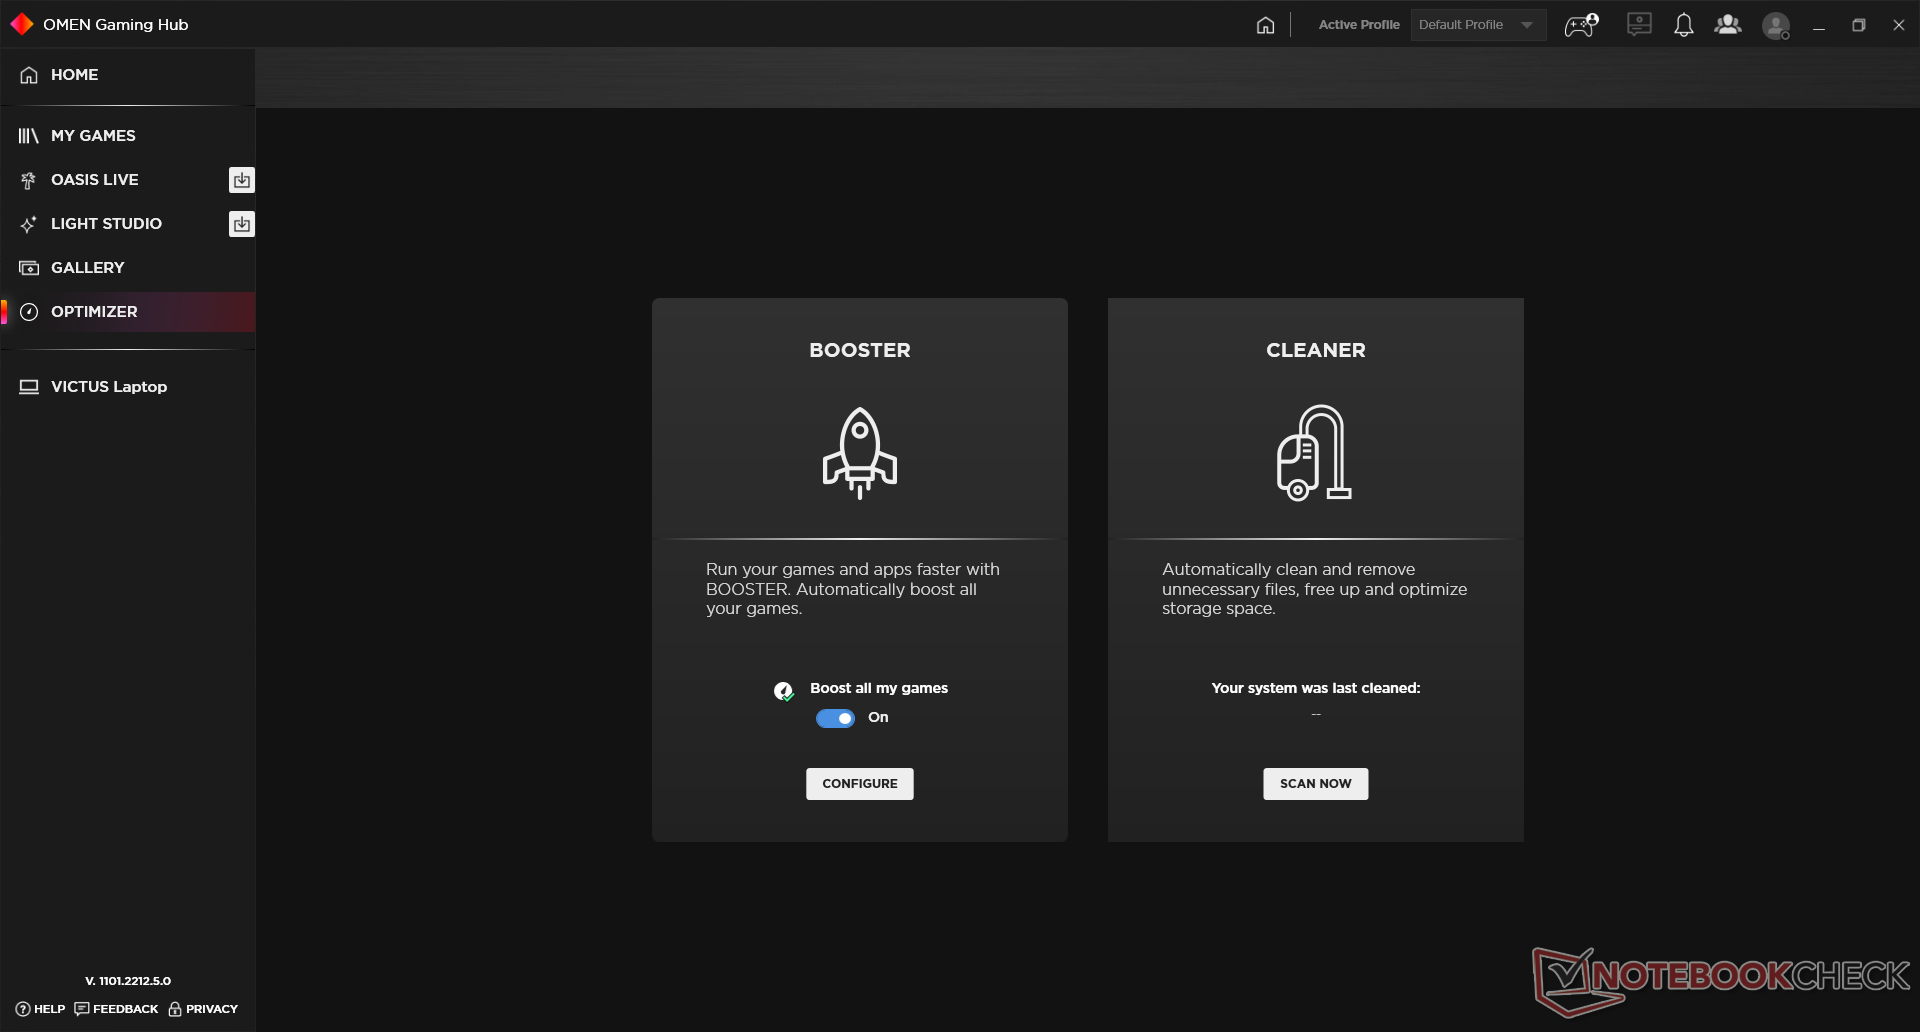
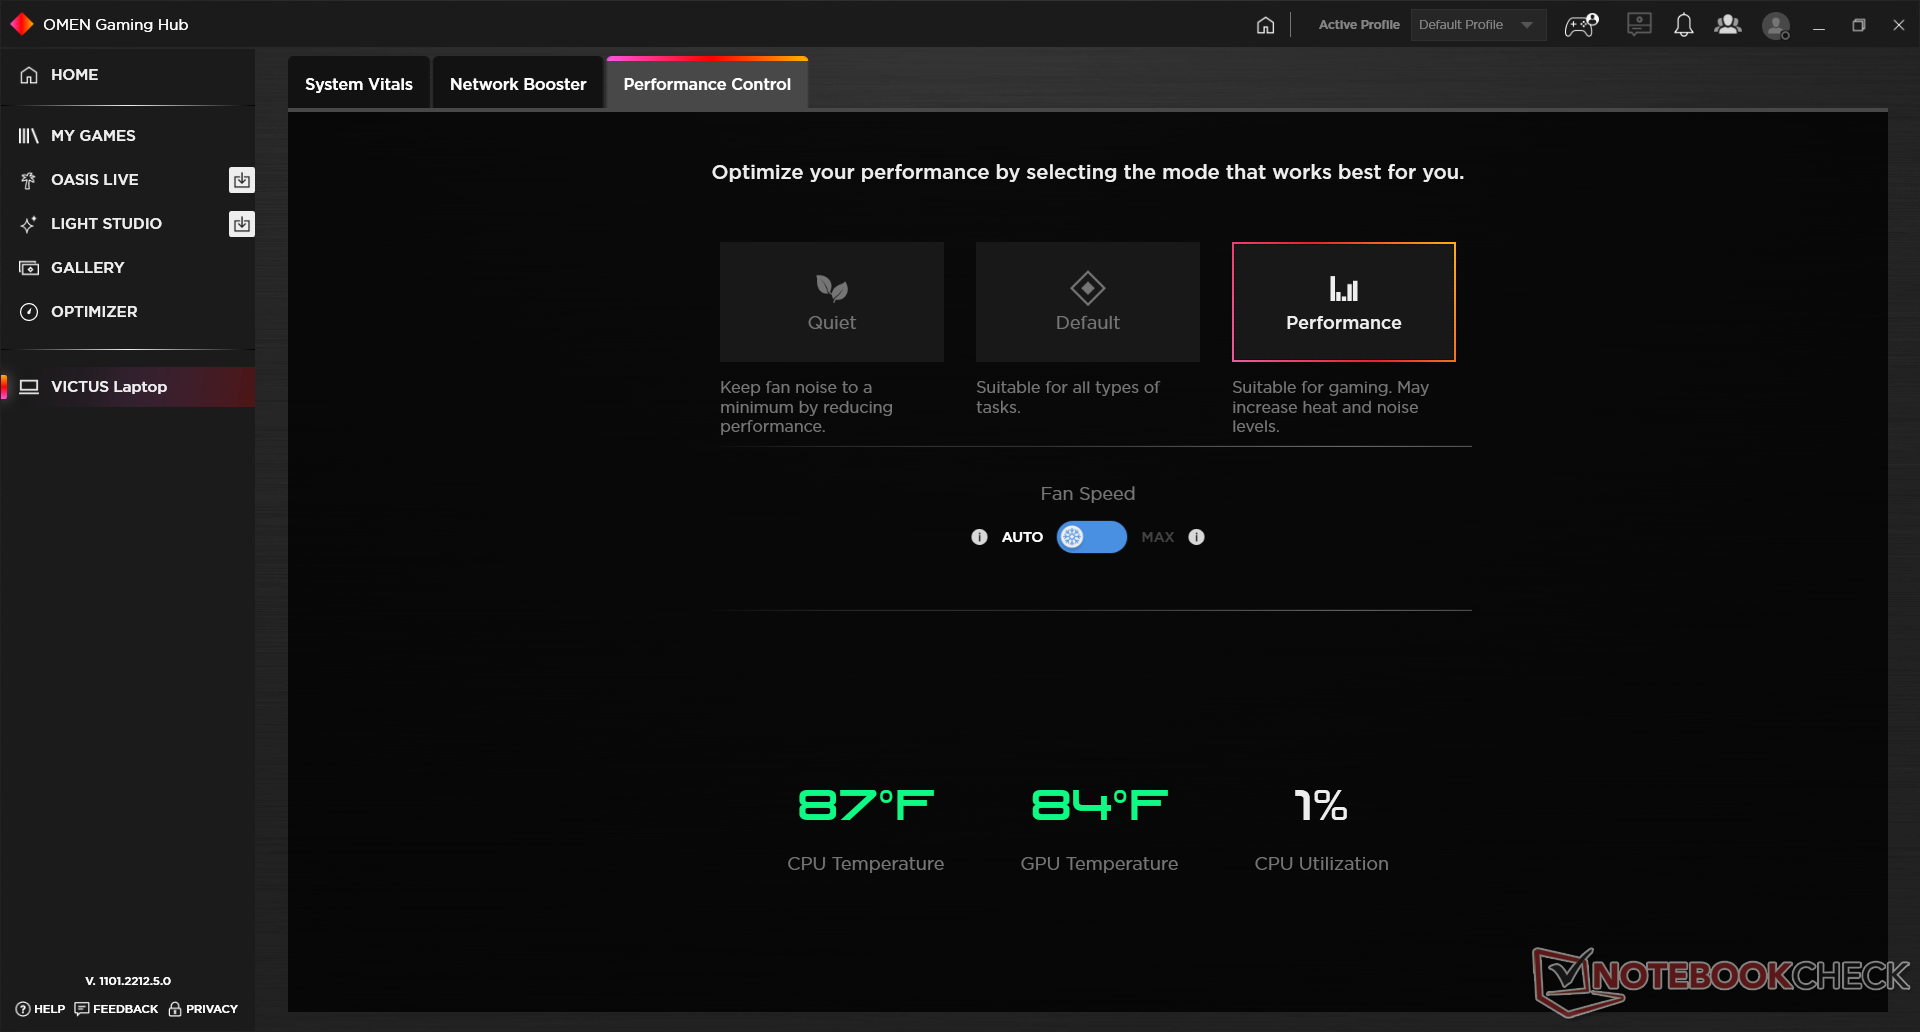
Configuramos nossa unidade para o modo Performance via Windows e o software Omen Gaming Hub pré-instalado antes de executar quaisquer benchmarks abaixo. Também nos certificamos de ativar tanto o modo HP Boost quanto a GPU Nvidia, conforme mostrado pelas capturas de tela abaixo. O fato de haver tantas configurações de potência individuais escondidas sob vários menus pode ser frustrante, especialmente se você estiver constantemente alternando entre níveis de desempenho mais baixos e mais altos.

Processador - Turbo Boost limitado
O desempenho da CPU é bom, mas a sustentabilidade do desempenho poderia ser melhor. O desempenho cairia em até 28% ao rodar o CineBench R15 xT em um loop, como mostra o gráfico de comparação abaixo. Esta queda ocorreria mesmo ao rodar o sistema no modo Performance com HP Boost ativo, o que é decepcionante de se ver em um laptop para jogos. O Lenovo Legion 5 15que navega com o mesmo Núcleo i7-12700H CPU como nossa Victus 15, pode oferecer 46 por cento mais rápido desempenho multi-tarefa porque sua CPU não estrangula quase tão forte.
Optando pelo menos caro AMD Ryzen 5800H A SKU da Victus 15 resultará em um déficit de desempenho de cerca de 20 a 25% quando comparada ao nosso Core i7-12700H.
Cinebench R15 Multi Loop
Cinebench R23: Multi Core | Single Core
Cinebench R20: CPU (Multi Core) | CPU (Single Core)
Cinebench R15: CPU Multi 64Bit | CPU Single 64Bit
Blender: v2.79 BMW27 CPU
7-Zip 18.03: 7z b 4 | 7z b 4 -mmt1
Geekbench 5.5: Multi-Core | Single-Core
HWBOT x265 Benchmark v2.2: 4k Preset
LibreOffice : 20 Documents To PDF
R Benchmark 2.5: Overall mean
| HWBOT x265 Benchmark v2.2 / 4k Preset | |
| MSI GE67 HX 12UGS | |
| Lenovo Legion 5 15IAH7H 82RB | |
| Alienware x15 R2 P111F | |
| Média Intel Core i7-12700H (4.67 - 21.8, n=64) | |
| Razer Blade 17 (i7-12800H, RTX 3070 Ti) | |
| HP Victus 15 fa0020nr | |
| Asus ROG Strix G15 G513QY | |
| Dell G15 5515 | |
| Asus TUF Dash F15 FX517ZC | |
| HP Omen 15-en0375ng | |
| MSI Bravo 15 B5DD-010US | |
| HP Omen 15-ek0456ng | |
* ... menor é melhor
AIDA64: FP32 Ray-Trace | FPU Julia | CPU SHA3 | CPU Queen | FPU SinJulia | FPU Mandel | CPU AES | CPU ZLib | FP64 Ray-Trace | CPU PhotoWorxx
| Performance rating | |
| Lenovo Legion 5 15IAH7H 82RB | |
| Dell G15 5515 | |
| HP Omen 15-en0375ng | |
| Média Intel Core i7-12700H | |
| HP Victus 15 fa0020nr | |
| MSI Bravo 15 B5DD-010US | |
| Asus TUF Dash F15 FX517ZC | |
| AIDA64 / FP32 Ray-Trace | |
| Lenovo Legion 5 15IAH7H 82RB | |
| HP Omen 15-en0375ng | |
| Dell G15 5515 | |
| HP Victus 15 fa0020nr | |
| Média Intel Core i7-12700H (2585 - 17957, n=64) | |
| MSI Bravo 15 B5DD-010US | |
| Asus TUF Dash F15 FX517ZC | |
| AIDA64 / FPU Julia | |
| Dell G15 5515 | |
| Lenovo Legion 5 15IAH7H 82RB | |
| HP Omen 15-en0375ng | |
| MSI Bravo 15 B5DD-010US | |
| HP Victus 15 fa0020nr | |
| Média Intel Core i7-12700H (12439 - 90760, n=64) | |
| Asus TUF Dash F15 FX517ZC | |
| AIDA64 / CPU SHA3 | |
| Lenovo Legion 5 15IAH7H 82RB | |
| Média Intel Core i7-12700H (833 - 4242, n=64) | |
| Dell G15 5515 | |
| HP Victus 15 fa0020nr | |
| HP Omen 15-en0375ng | |
| MSI Bravo 15 B5DD-010US | |
| Asus TUF Dash F15 FX517ZC | |
| AIDA64 / CPU Queen | |
| Lenovo Legion 5 15IAH7H 82RB | |
| HP Victus 15 fa0020nr | |
| HP Omen 15-en0375ng | |
| Média Intel Core i7-12700H (57923 - 103202, n=63) | |
| Dell G15 5515 | |
| MSI Bravo 15 B5DD-010US | |
| Asus TUF Dash F15 FX517ZC | |
| AIDA64 / FPU SinJulia | |
| HP Omen 15-en0375ng | |
| Dell G15 5515 | |
| Lenovo Legion 5 15IAH7H 82RB | |
| MSI Bravo 15 B5DD-010US | |
| Média Intel Core i7-12700H (3249 - 9939, n=64) | |
| HP Victus 15 fa0020nr | |
| Asus TUF Dash F15 FX517ZC | |
| AIDA64 / FPU Mandel | |
| Dell G15 5515 | |
| Lenovo Legion 5 15IAH7H 82RB | |
| HP Omen 15-en0375ng | |
| MSI Bravo 15 B5DD-010US | |
| HP Victus 15 fa0020nr | |
| Média Intel Core i7-12700H (7135 - 44760, n=64) | |
| Asus TUF Dash F15 FX517ZC | |
| AIDA64 / CPU AES | |
| Lenovo Legion 5 15IAH7H 82RB | |
| Dell G15 5515 | |
| MSI Bravo 15 B5DD-010US | |
| Média Intel Core i7-12700H (31839 - 144360, n=64) | |
| HP Omen 15-en0375ng | |
| HP Victus 15 fa0020nr | |
| Asus TUF Dash F15 FX517ZC | |
| AIDA64 / CPU ZLib | |
| Lenovo Legion 5 15IAH7H 82RB | |
| Média Intel Core i7-12700H (305 - 1171, n=64) | |
| HP Omen 15-en0375ng | |
| HP Victus 15 fa0020nr | |
| Dell G15 5515 | |
| Asus TUF Dash F15 FX517ZC | |
| MSI Bravo 15 B5DD-010US | |
| AIDA64 / FP64 Ray-Trace | |
| Lenovo Legion 5 15IAH7H 82RB | |
| HP Omen 15-en0375ng | |
| Dell G15 5515 | |
| HP Victus 15 fa0020nr | |
| Média Intel Core i7-12700H (1437 - 9692, n=64) | |
| MSI Bravo 15 B5DD-010US | |
| Asus TUF Dash F15 FX517ZC | |
| AIDA64 / CPU PhotoWorxx | |
| Lenovo Legion 5 15IAH7H 82RB | |
| Média Intel Core i7-12700H (12863 - 52207, n=64) | |
| Asus TUF Dash F15 FX517ZC | |
| HP Omen 15-en0375ng | |
| MSI Bravo 15 B5DD-010US | |
| HP Victus 15 fa0020nr | |
| Dell G15 5515 | |
Desempenho do sistema
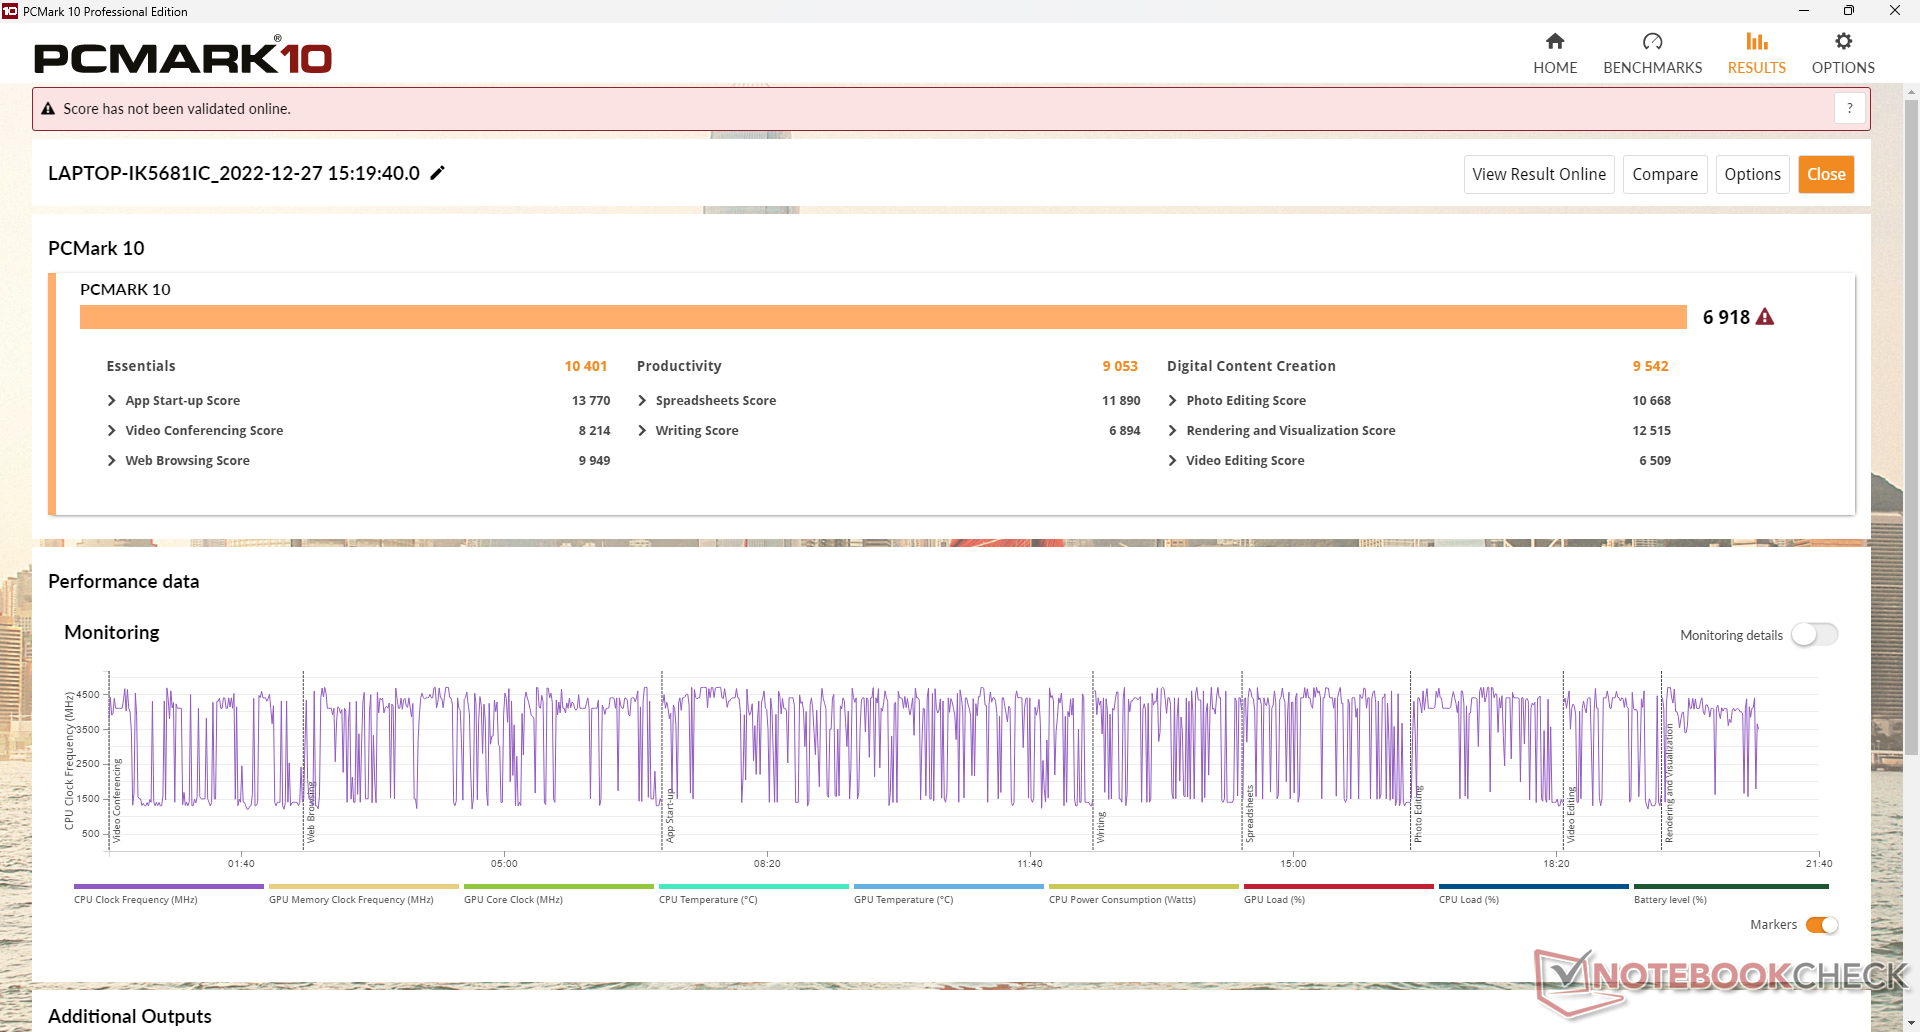
Os resultados da PCMark são mais altos do que muitos outros laptops de jogos mais antigos ou mais baratos devido à CPU Intel de 12ª geração muito mais rápida e ao SSD PCIe4 x4 NVMe. No entanto, ele ainda fica atrás dos laptops com a GPU RTX 3060 mais rápida, como a Lenovo Legion 5 15.
CrossMark: Overall | Productivity | Creativity | Responsiveness
| PCMark 10 / Score | |
| Lenovo Legion 5 15IAH7H 82RB | |
| HP Victus 15 fa0020nr | |
| Asus TUF Dash F15 FX517ZC | |
| Média Intel Core i7-12700H, NVIDIA GeForce RTX 3050 Ti Laptop GPU (6623 - 7075, n=5) | |
| MSI Bravo 15 B5DD-010US | |
| Dell G15 5515 | |
| HP Omen 15-en0375ng | |
| PCMark 10 / Essentials | |
| Lenovo Legion 5 15IAH7H 82RB | |
| Asus TUF Dash F15 FX517ZC | |
| HP Victus 15 fa0020nr | |
| Média Intel Core i7-12700H, NVIDIA GeForce RTX 3050 Ti Laptop GPU (9540 - 10970, n=5) | |
| MSI Bravo 15 B5DD-010US | |
| Dell G15 5515 | |
| HP Omen 15-en0375ng | |
| PCMark 10 / Productivity | |
| Lenovo Legion 5 15IAH7H 82RB | |
| Asus TUF Dash F15 FX517ZC | |
| HP Victus 15 fa0020nr | |
| Média Intel Core i7-12700H, NVIDIA GeForce RTX 3050 Ti Laptop GPU (8530 - 9555, n=5) | |
| MSI Bravo 15 B5DD-010US | |
| Dell G15 5515 | |
| HP Omen 15-en0375ng | |
| PCMark 10 / Digital Content Creation | |
| Lenovo Legion 5 15IAH7H 82RB | |
| HP Victus 15 fa0020nr | |
| Média Intel Core i7-12700H, NVIDIA GeForce RTX 3050 Ti Laptop GPU (8855 - 9542, n=5) | |
| Asus TUF Dash F15 FX517ZC | |
| HP Omen 15-en0375ng | |
| MSI Bravo 15 B5DD-010US | |
| Dell G15 5515 | |
| CrossMark / Overall | |
| Lenovo Legion 5 15IAH7H 82RB | |
| Asus TUF Dash F15 FX517ZC | |
| Média Intel Core i7-12700H, NVIDIA GeForce RTX 3050 Ti Laptop GPU (1654 - 1872, n=5) | |
| HP Victus 15 fa0020nr | |
| CrossMark / Productivity | |
| Lenovo Legion 5 15IAH7H 82RB | |
| Asus TUF Dash F15 FX517ZC | |
| Média Intel Core i7-12700H, NVIDIA GeForce RTX 3050 Ti Laptop GPU (1595 - 1792, n=5) | |
| HP Victus 15 fa0020nr | |
| CrossMark / Creativity | |
| Lenovo Legion 5 15IAH7H 82RB | |
| Asus TUF Dash F15 FX517ZC | |
| Média Intel Core i7-12700H, NVIDIA GeForce RTX 3050 Ti Laptop GPU (1699 - 1993, n=5) | |
| HP Victus 15 fa0020nr | |
| CrossMark / Responsiveness | |
| Lenovo Legion 5 15IAH7H 82RB | |
| Asus TUF Dash F15 FX517ZC | |
| Média Intel Core i7-12700H, NVIDIA GeForce RTX 3050 Ti Laptop GPU (1383 - 1768, n=5) | |
| HP Victus 15 fa0020nr | |
| PCMark 10 Score | 6918 pontos | |
Ajuda | ||
| AIDA64 / Memory Copy | |
| Média Intel Core i7-12700H (25615 - 80511, n=64) | |
| Lenovo Legion 5 15IAH7H 82RB | |
| Asus TUF Dash F15 FX517ZC | |
| MSI Bravo 15 B5DD-010US | |
| HP Victus 15 fa0020nr | |
| HP Omen 15-en0375ng | |
| Dell G15 5515 | |
| AIDA64 / Memory Read | |
| Lenovo Legion 5 15IAH7H 82RB | |
| Média Intel Core i7-12700H (25586 - 79442, n=64) | |
| Asus TUF Dash F15 FX517ZC | |
| MSI Bravo 15 B5DD-010US | |
| HP Victus 15 fa0020nr | |
| HP Omen 15-en0375ng | |
| Dell G15 5515 | |
| AIDA64 / Memory Write | |
| Lenovo Legion 5 15IAH7H 82RB | |
| Média Intel Core i7-12700H (23679 - 88660, n=64) | |
| Asus TUF Dash F15 FX517ZC | |
| HP Omen 15-en0375ng | |
| HP Victus 15 fa0020nr | |
| MSI Bravo 15 B5DD-010US | |
| Dell G15 5515 | |
| AIDA64 / Memory Latency | |
| Lenovo Legion 5 15IAH7H 82RB | |
| HP Omen 15-en0375ng | |
| HP Victus 15 fa0020nr | |
| Média Intel Core i7-12700H (76.2 - 133.9, n=62) | |
| Dell G15 5515 | |
| MSI Bravo 15 B5DD-010US | |
| Asus TUF Dash F15 FX517ZC | |
* ... menor é melhor
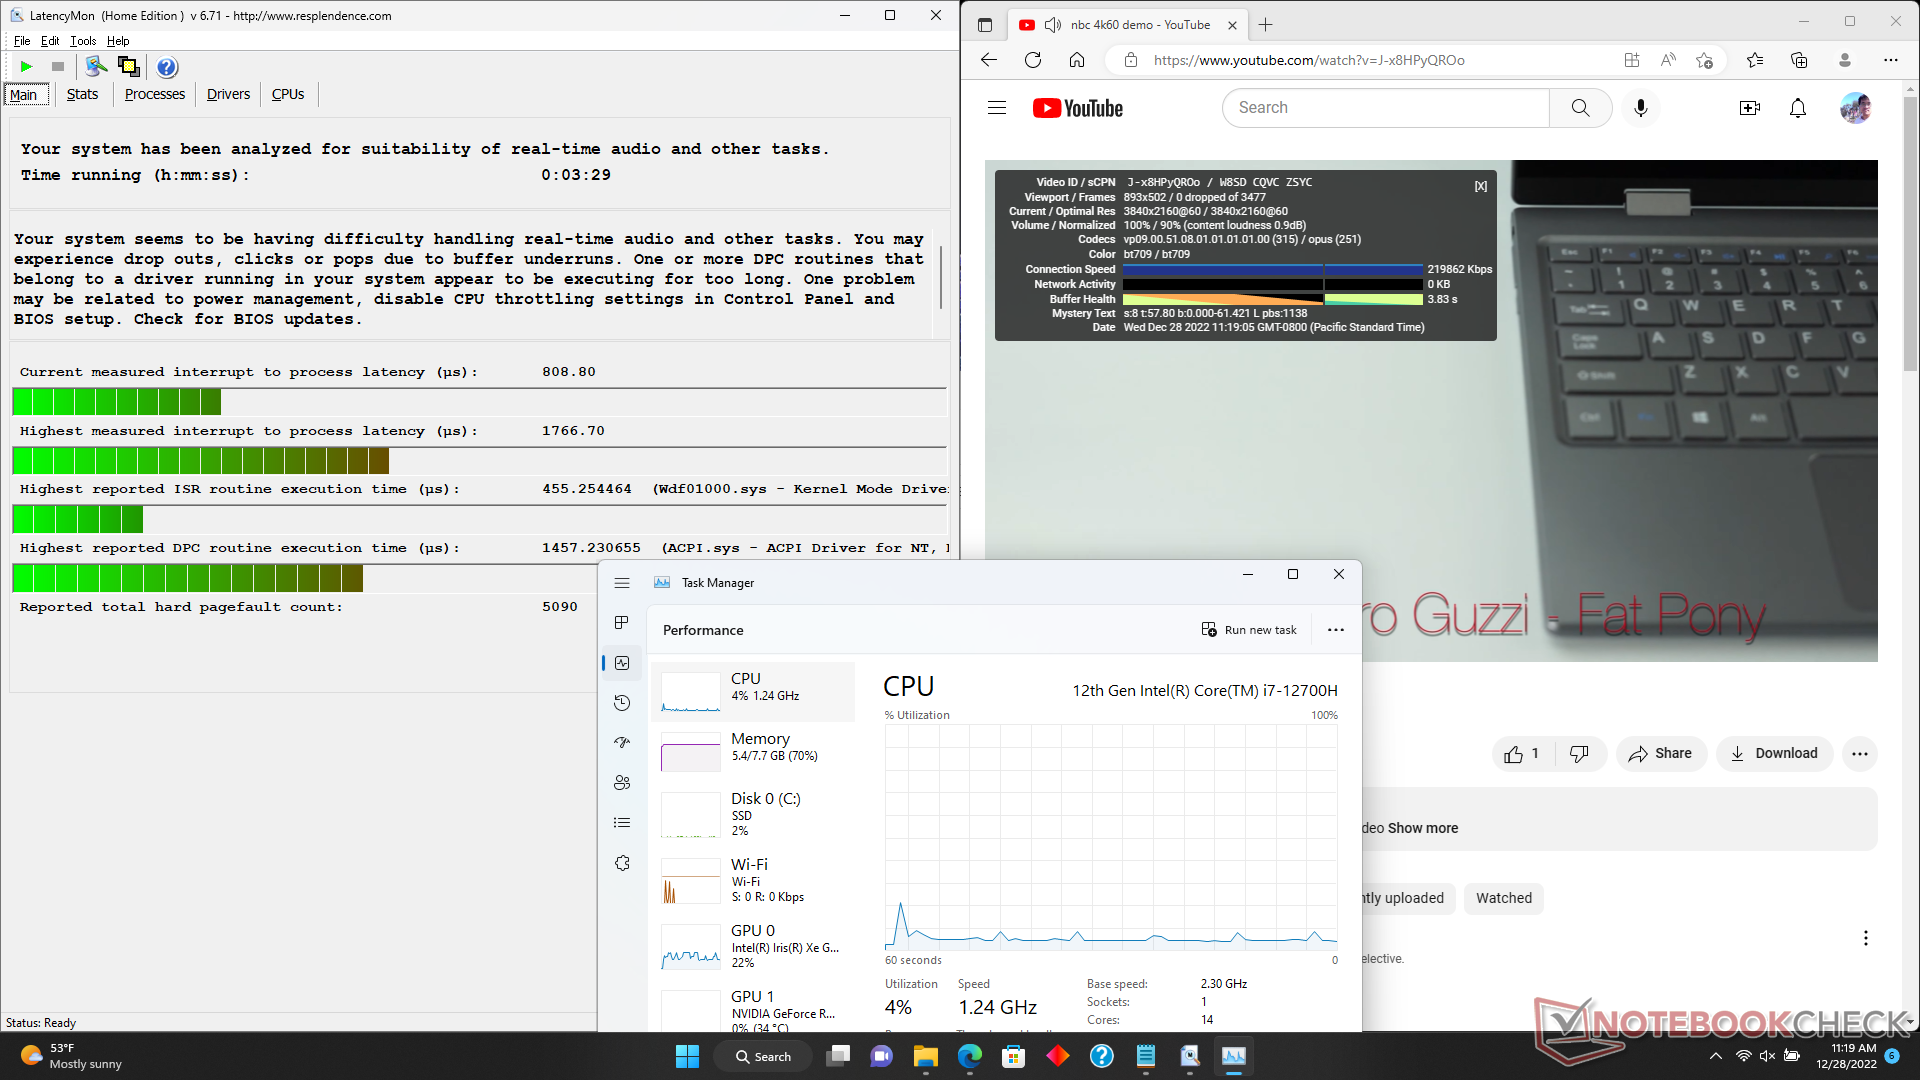
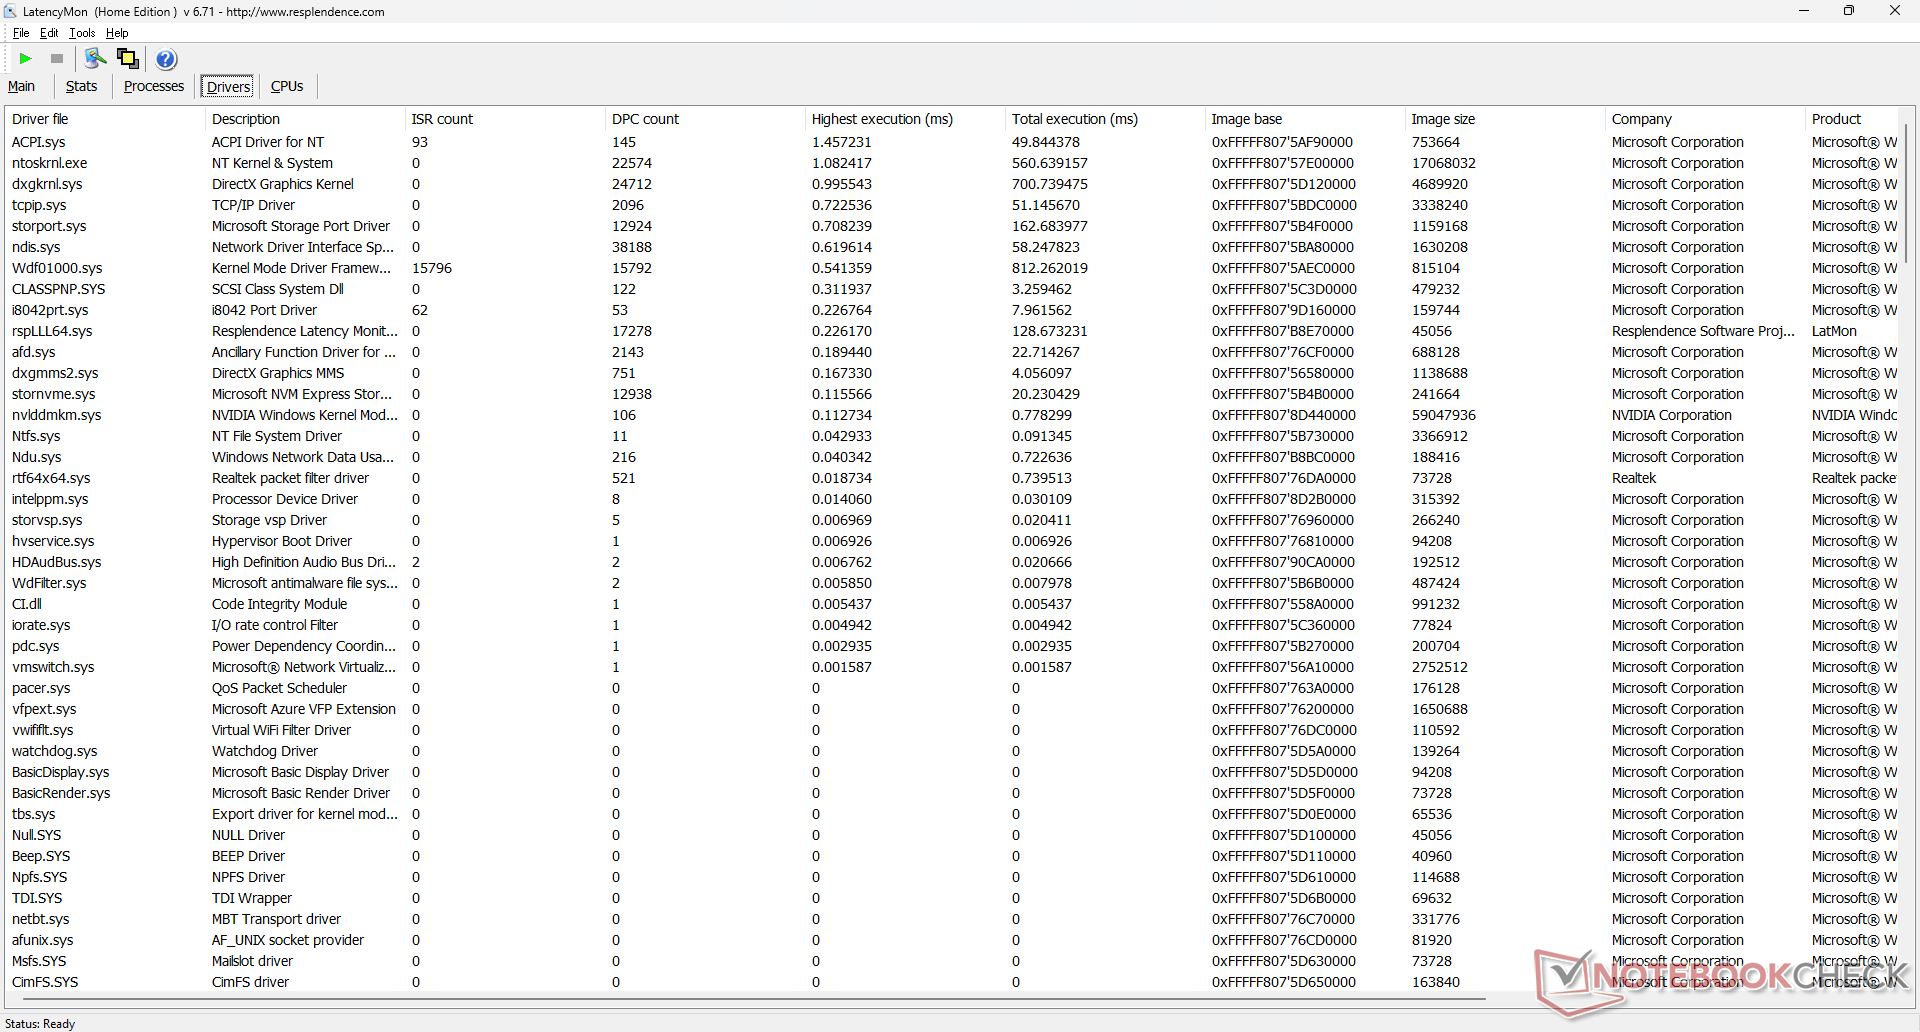
Latência do DPC
LatencyMon revela problemas de DPC ao abrir várias abas do navegador em nossa página inicial. a reprodução de vídeo de 4K a 60 FPS é perfeita e sem queda de quadros.
| DPC Latencies / LatencyMon - interrupt to process latency (max), Web, Youtube, Prime95 | |
| HP Victus 15 fa0020nr | |
| MSI Bravo 15 B5DD-010US | |
| Asus TUF Dash F15 FX517ZC | |
| Lenovo Legion 5 15IAH7H 82RB | |
| HP Omen 15-en0375ng | |
| Dell G15 5515 | |
* ... menor é melhor
Dispositivos de armazenamento - Um só acionamento
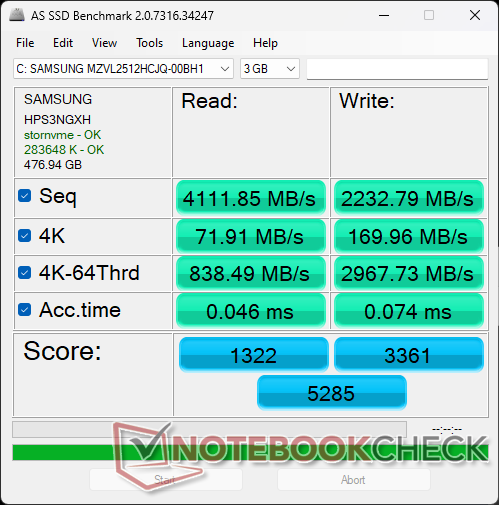
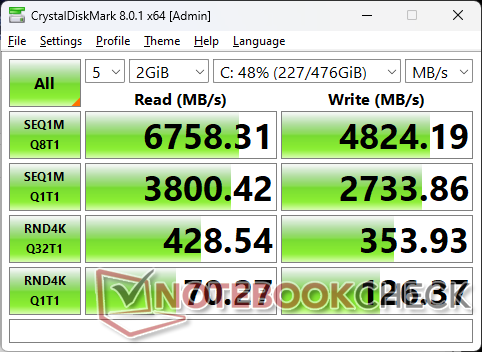
Nossa unidade de teste inclui um rápido Samsung PM9A1 PCIe4 x4 NVMe SSD prometendo taxas de leitura e escrita sequenciais de até 6900 MB/s e 5000 MB/s, respectivamente. No entanto, o desempenho acelera após cerca de 5 minutos de estresse, como mostram os resultados do nosso teste de loop DiskSpd abaixo. Embora seja preferível a aceleração zero, é improvável que a perda de desempenho retardada tenha impacto na experiência do usuário.

| Drive Performance rating - Percent | |
| Lenovo Legion 5 15IAH7H 82RB | |
| HP Victus 15 fa0020nr | |
| HP Omen 15-en0375ng | |
| Asus TUF Dash F15 FX517ZC | |
| Dell G15 5515 | |
| MSI Bravo 15 B5DD-010US | |
* ... menor é melhor
Disk Throttling: DiskSpd Read Loop, Queue Depth 8
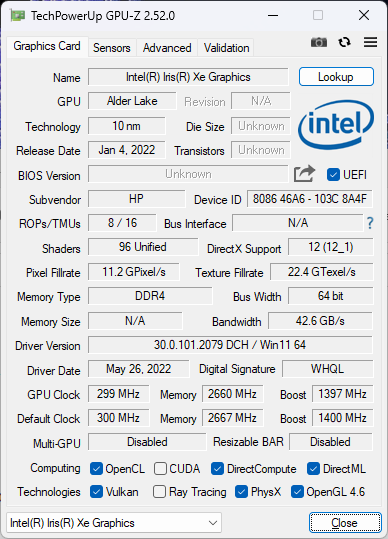
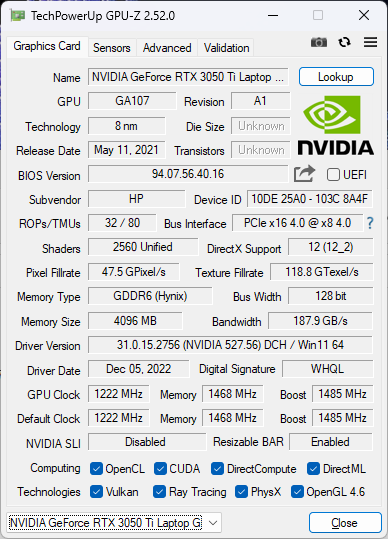
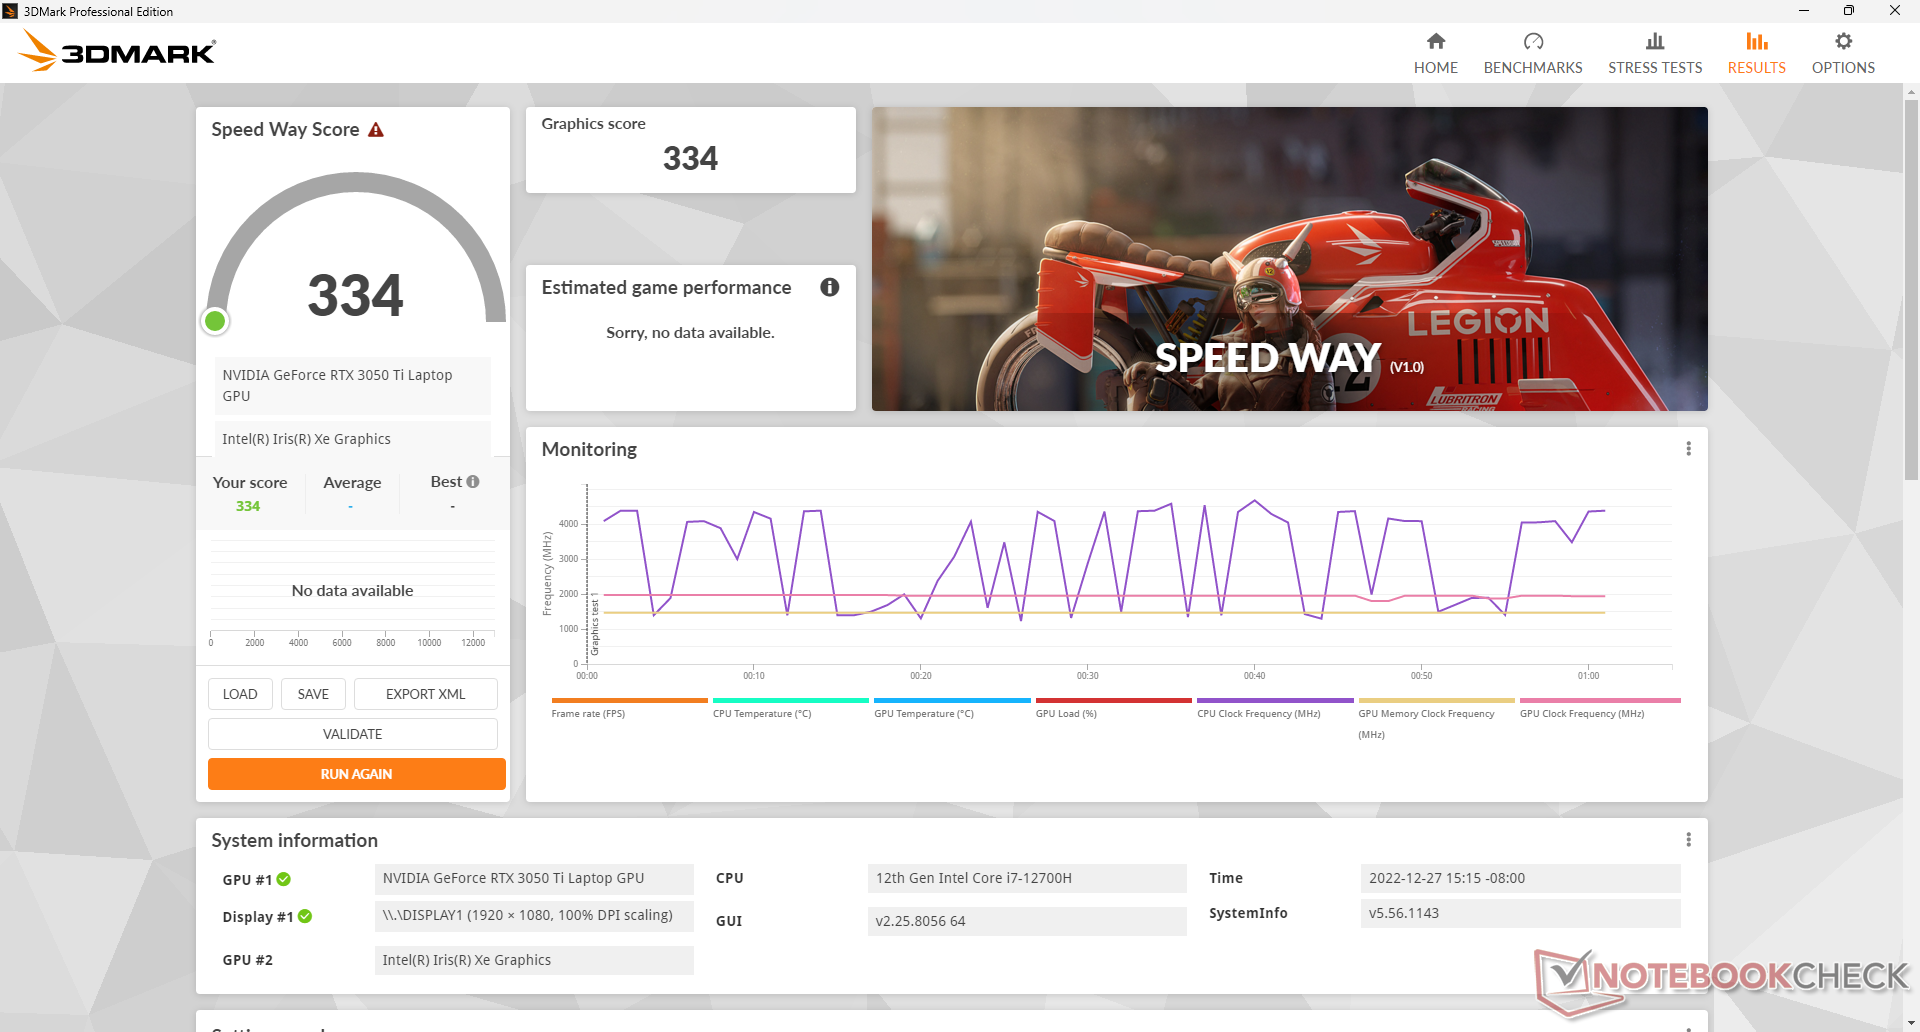
GPU Performance - TGP 75 W
O desempenho gráfico é comparável ao dos mais antigos GeForce GTX 1660 Ti ou móvel RTX 2060 enquanto é cerca de 10% mais rápido que o padrão móvel RTX 3050. A série RTX 3050 tem sido um tanto decepcionante desde que os concorrentes Radeon RX 6600M varejistas por aproximadamente o mesmo preço, mas com um desempenho até 50% mais rápido. Mesmo assim, a maioria dos títulos permanece jogável com a resolução nativa de 1080p, incluindo o Cyberpunk 2077.
Estamos surpresos ao ver que a maioria dos jogos ainda pode funcionar muito bem, apesar de nossa limitada RAM de 8 GB de sistema. As taxas médias de quadros estão onde esperamos que sejam relativas a outros laptops com a mesma GPU, exceto em títulos muito exigentes como o Cyberpunk 2077, onde o desempenho pode ser cerca de 10% mais lento se em configurações Ultra
Recursos gráficos avançados como Optimus 2.0, G-Sync integrado, ou MUX não são suportados nesta máquina de orçamento. Não há GeForce RTX 3060 opções ou superiores.
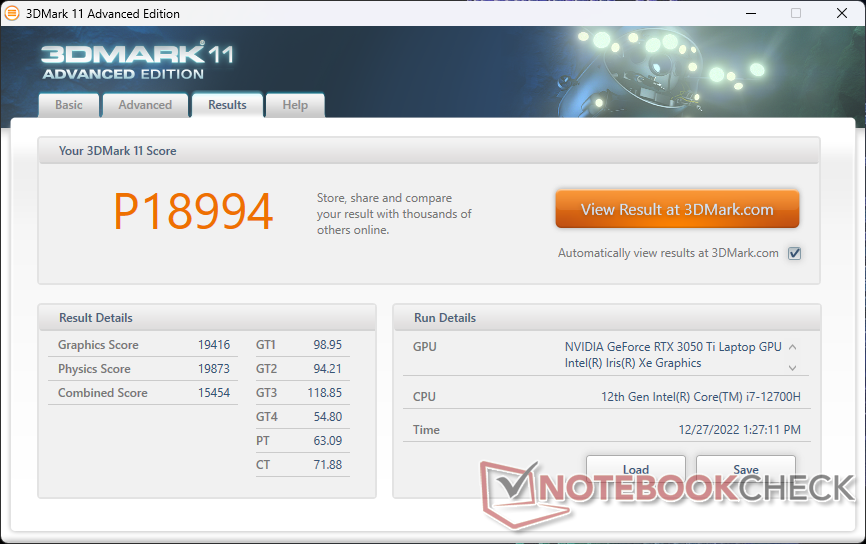
| 3DMark 11 Performance | 18994 pontos | |
| 3DMark Cloud Gate Standard Score | 50957 pontos | |
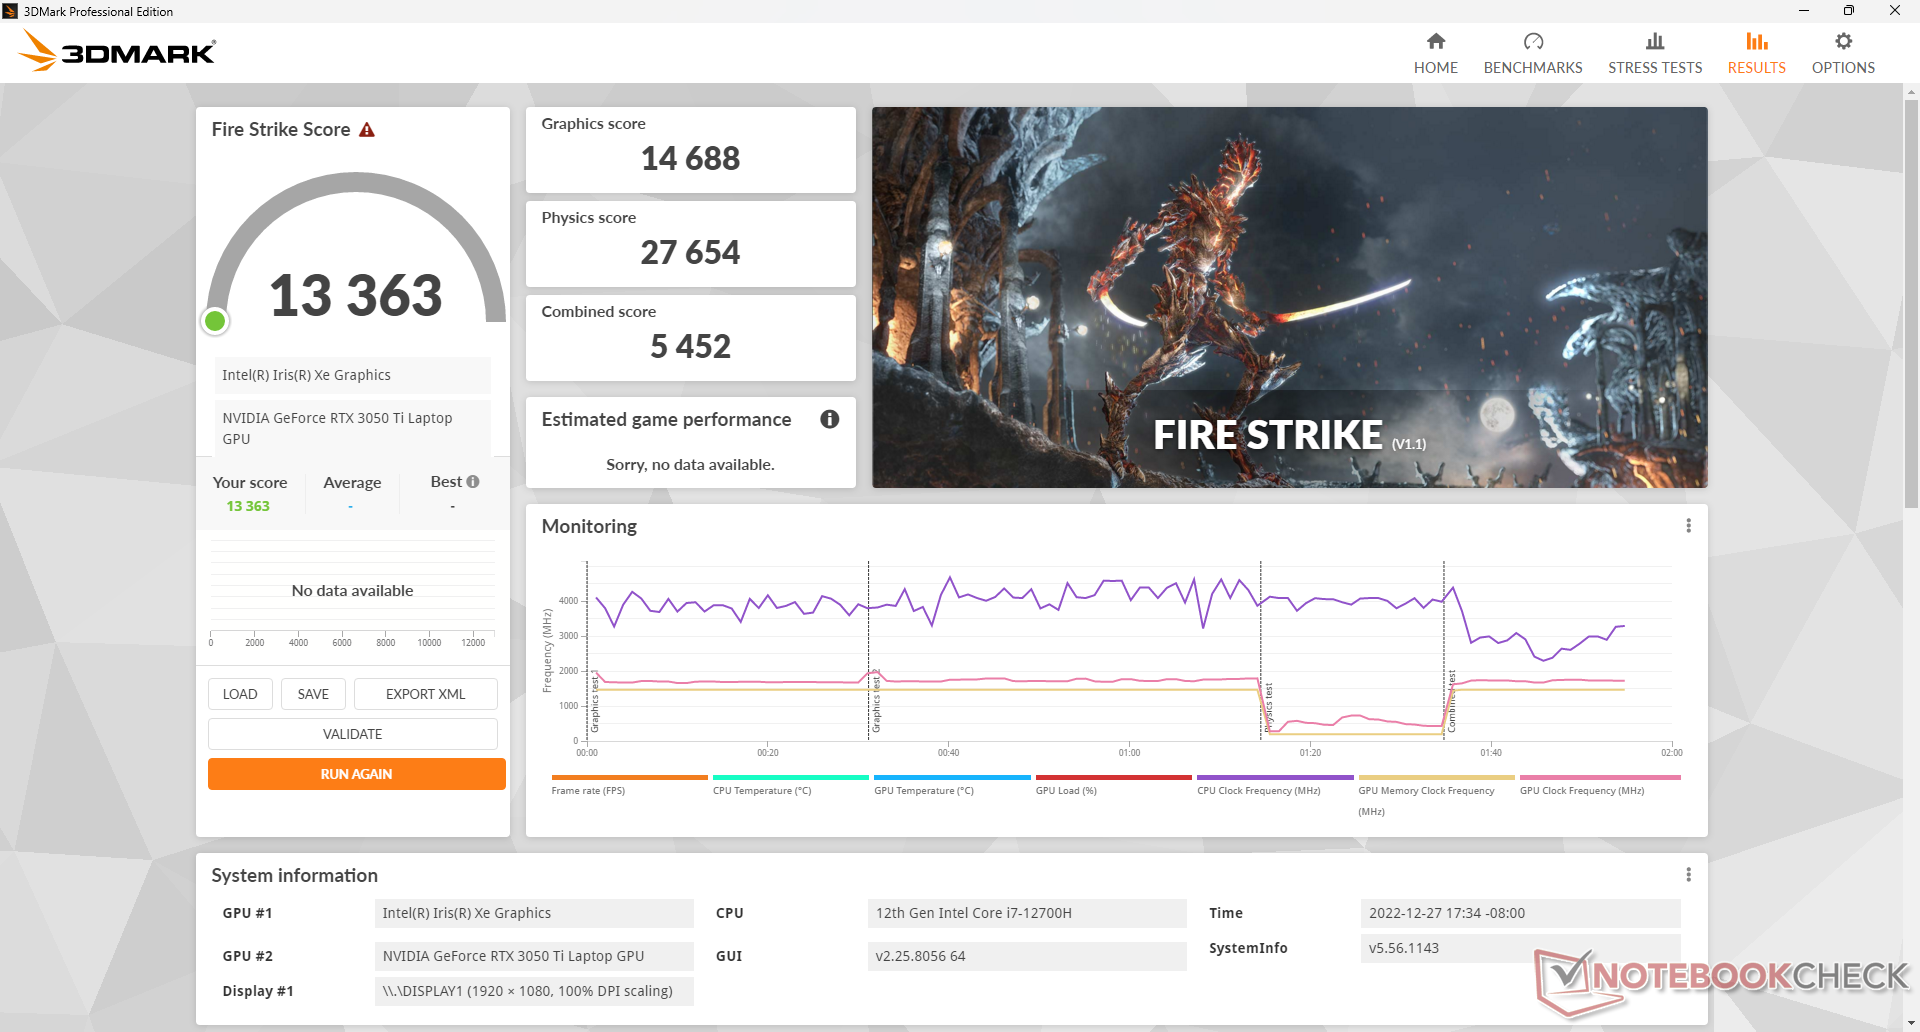
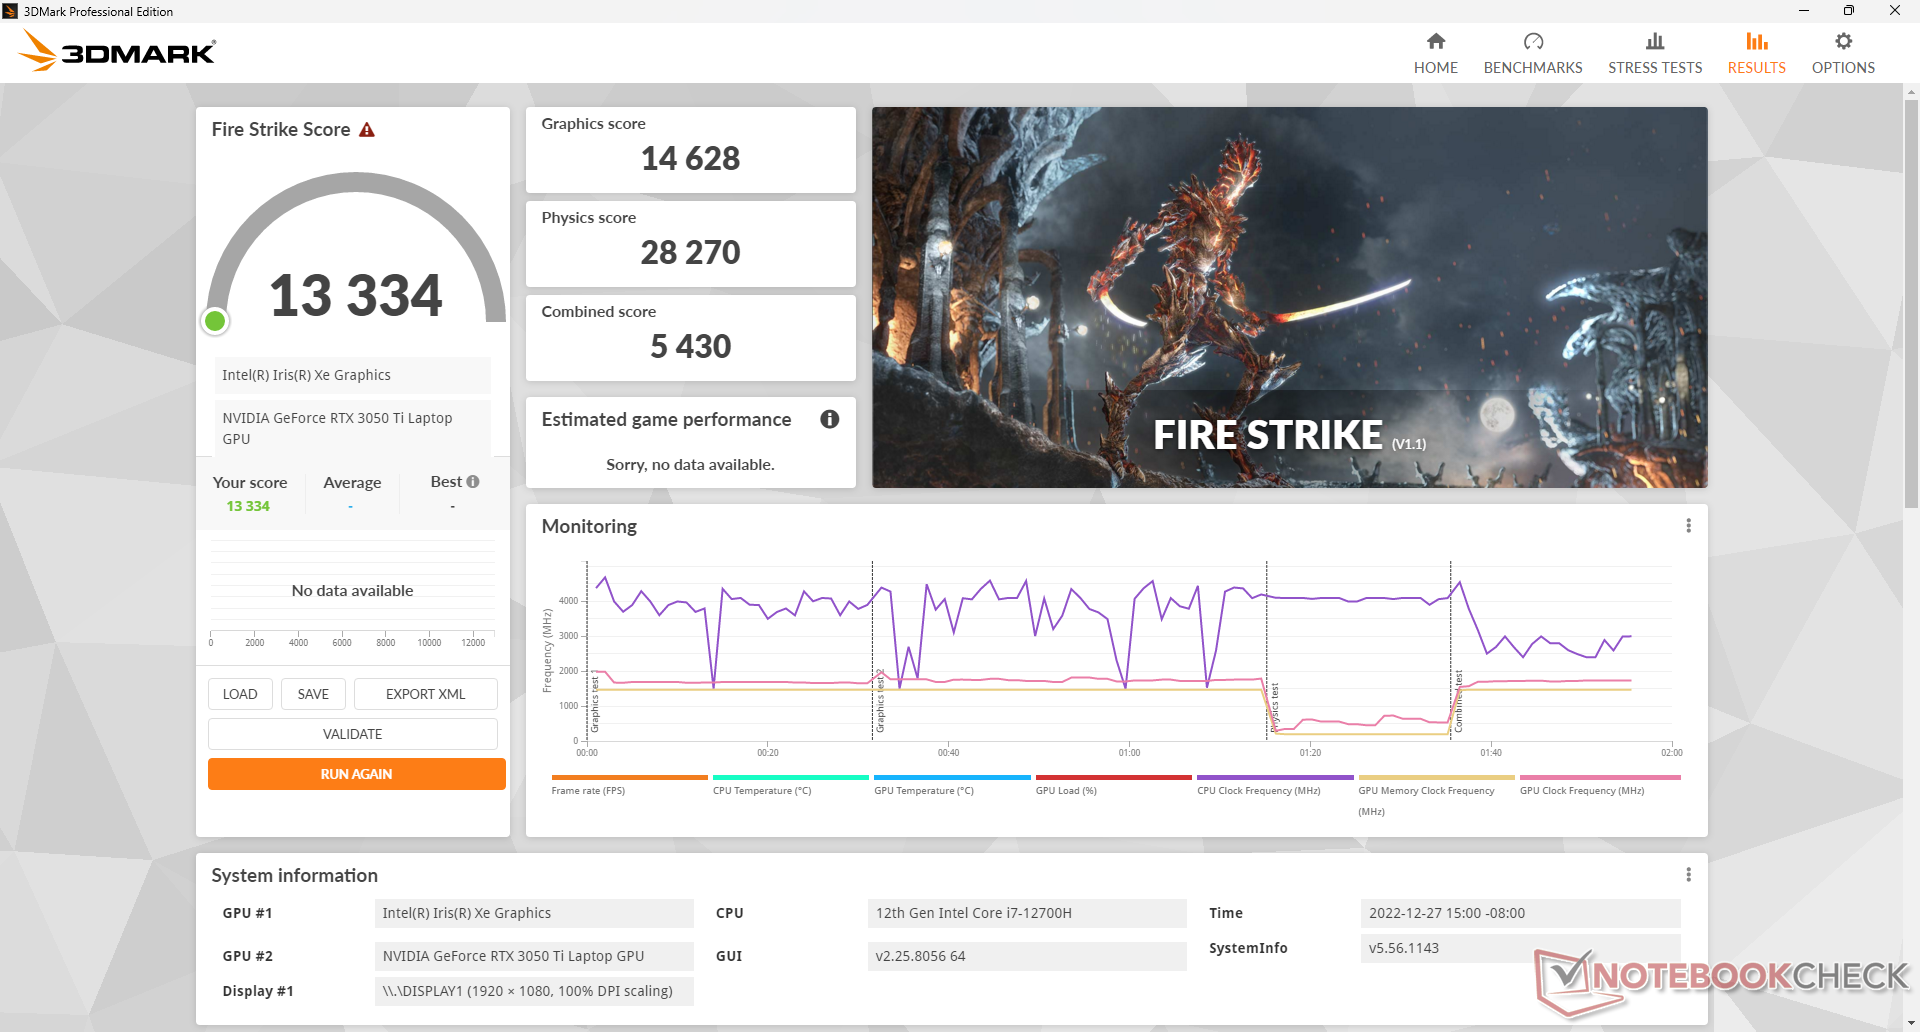
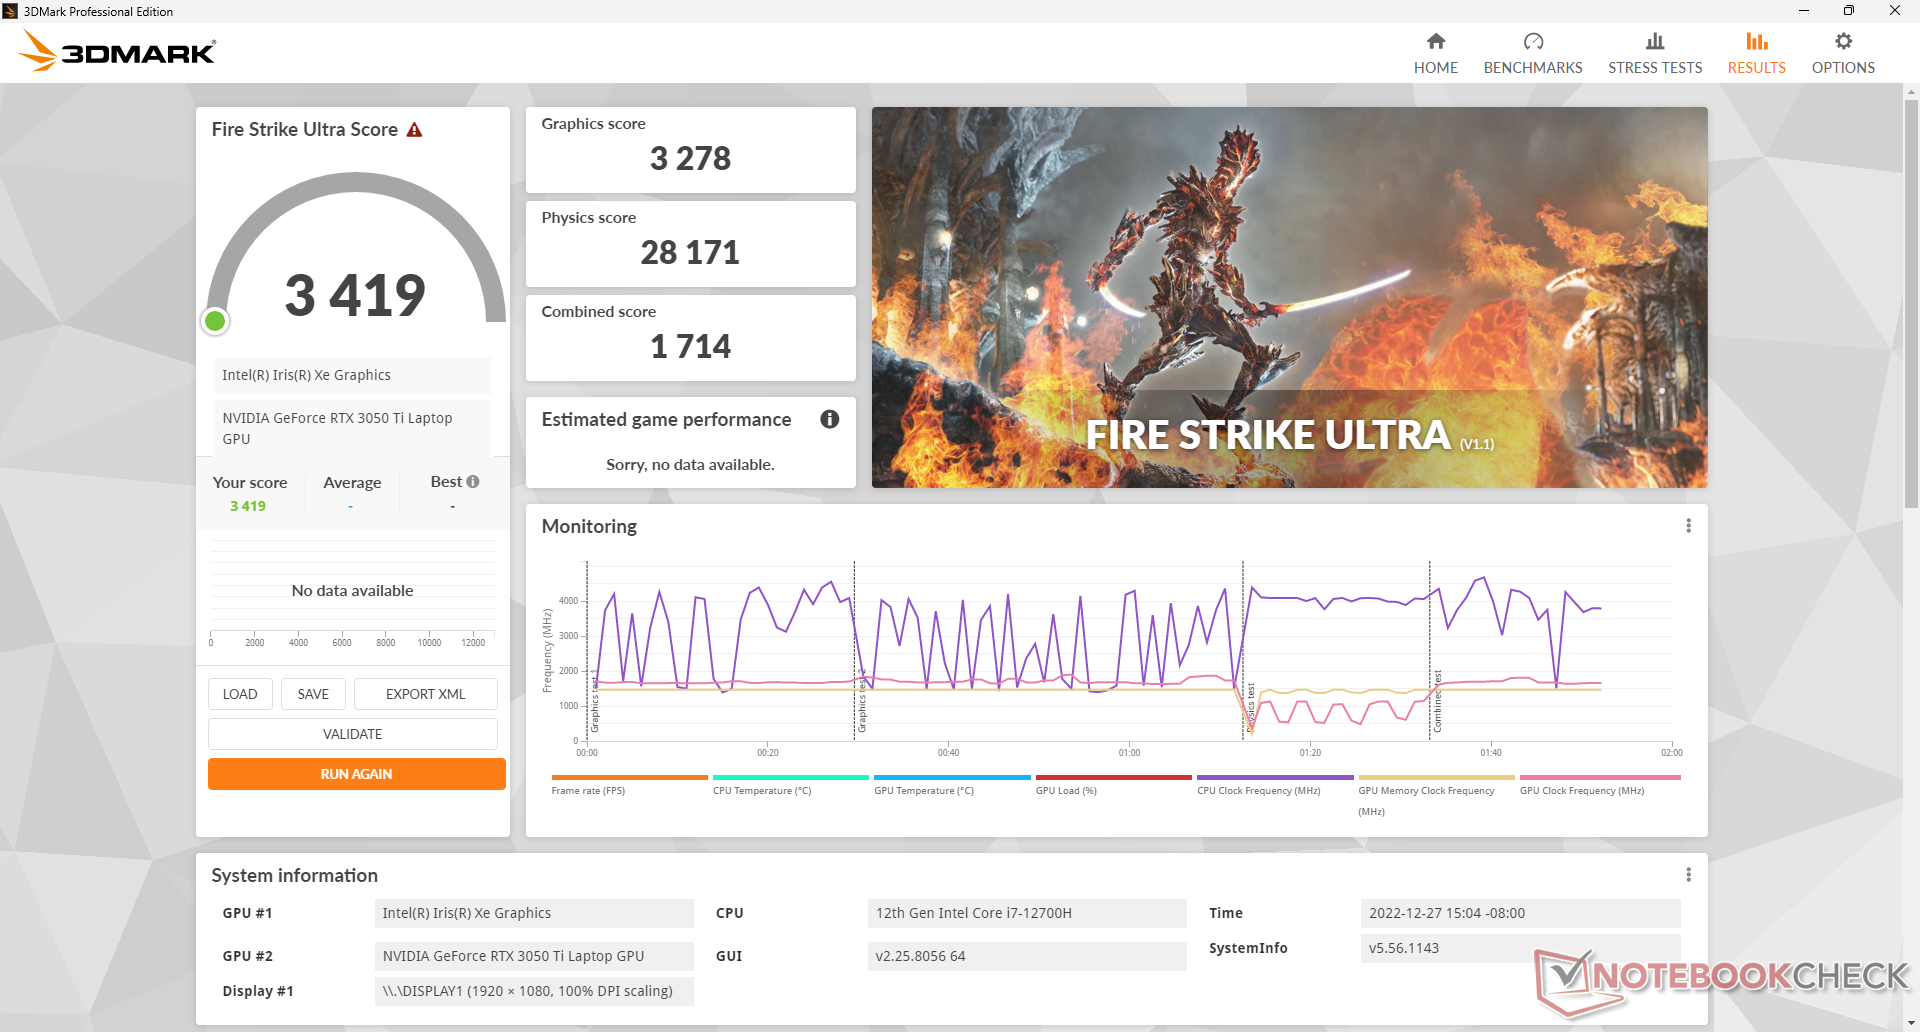
| 3DMark Fire Strike Score | 13334 pontos | |
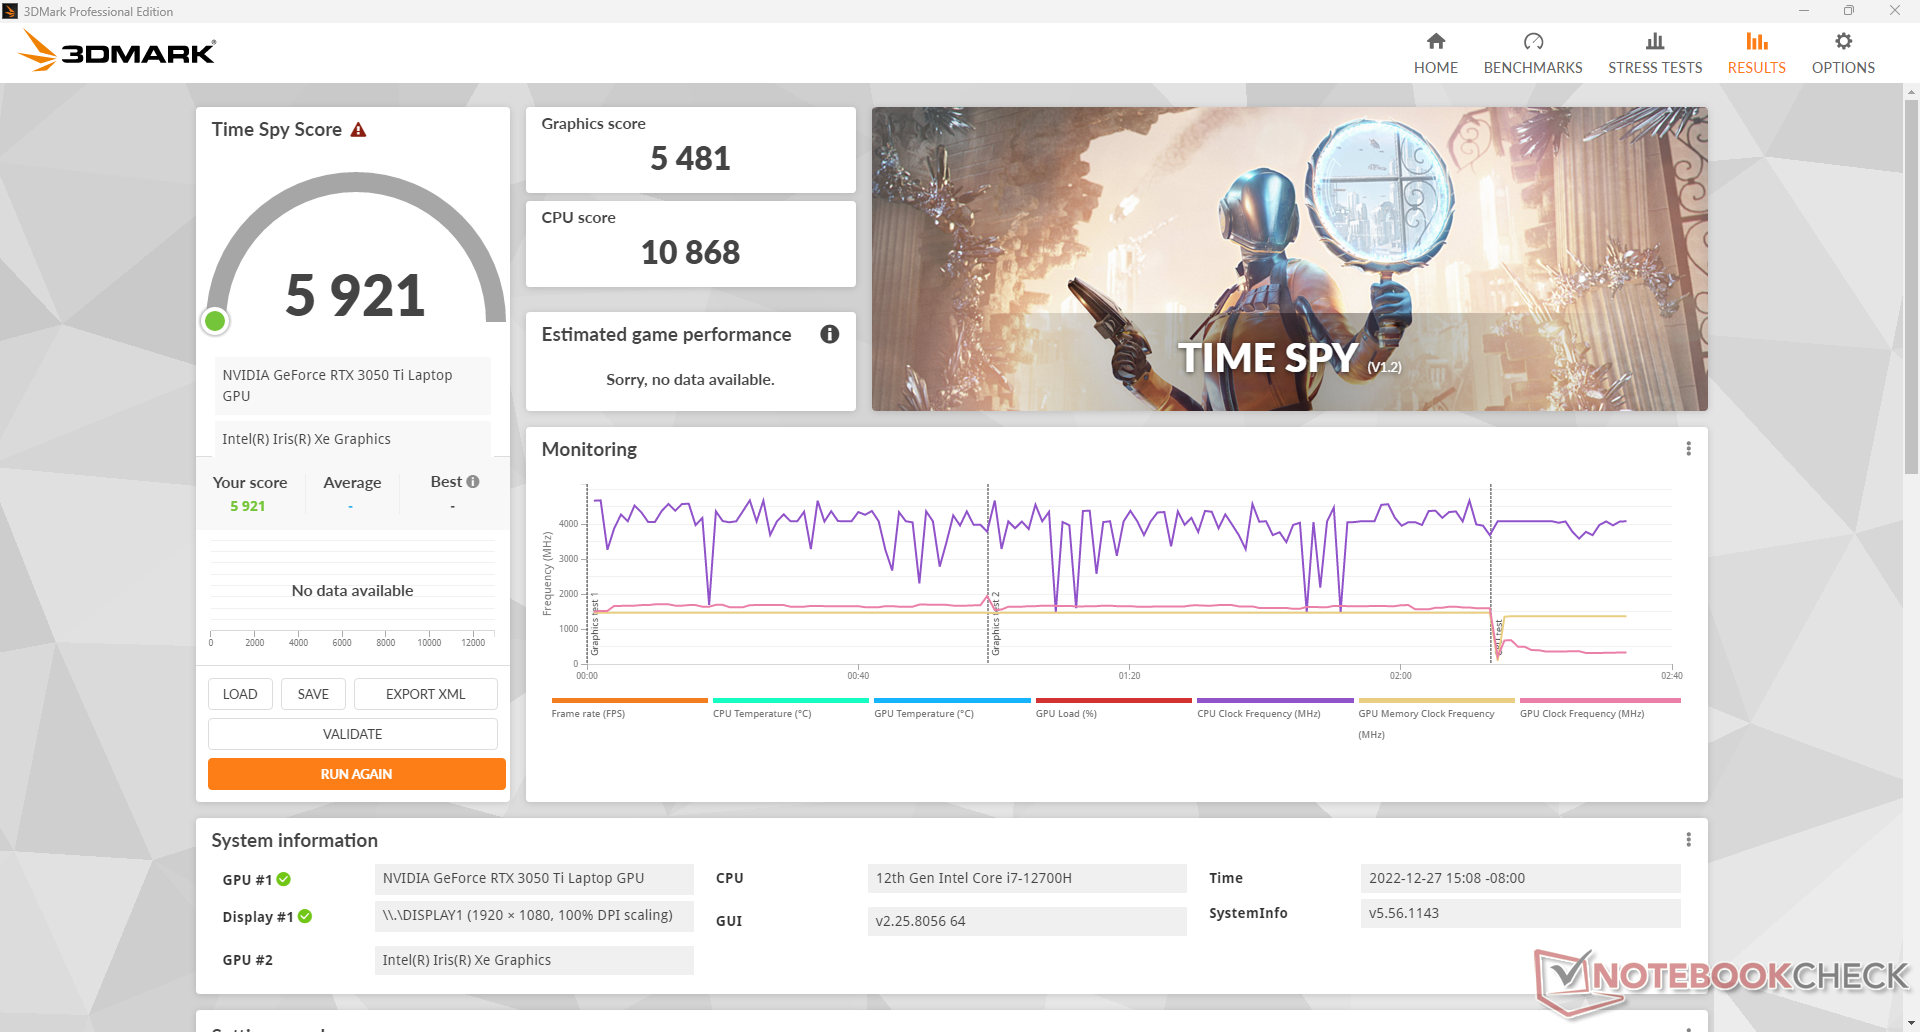
| 3DMark Time Spy Score | 5921 pontos | |
Ajuda | ||
| Blender | |
| v3.3 Classroom OPTIX/RTX | |
| Média NVIDIA GeForce RTX 3050 Ti Laptop GPU (48 - 60, n=7) | |
| HP Victus 15 fa0020nr | |
| Lenovo Legion 5 15IAH7H 82RB | |
| v3.3 Classroom CUDA | |
| Média NVIDIA GeForce RTX 3050 Ti Laptop GPU (83 - 104, n=7) | |
| HP Victus 15 fa0020nr | |
| Lenovo Legion 5 15IAH7H 82RB | |
| v3.3 Classroom CPU | |
| Média NVIDIA GeForce RTX 3050 Ti Laptop GPU (379 - 557, n=7) | |
| HP Victus 15 fa0020nr | |
| Lenovo Legion 5 15IAH7H 82RB | |
* ... menor é melhor
| The Witcher 3 - 1920x1080 Ultra Graphics & Postprocessing (HBAO+) | |
| Média da turma Gaming (104.7 - 240, n=7, últimos 2 anos) | |
| Média NVIDIA GeForce RTX 3060 Laptop GPU (58.2 - 91.5, n=48) | |
| Média NVIDIA GeForce RTX 2060 Mobile (50.6 - 74, n=40) | |
| HP Victus 15 fa0020nr | |
| Média NVIDIA GeForce RTX 3050 Ti Laptop GPU (19 - 58.5, n=29) | |
| Média NVIDIA GeForce RTX 3050 4GB Laptop GPU (31.5 - 55.8, n=21) | |
| Cyberpunk 2077 1.6 - 1920x1080 Ultra Preset | |
| Média NVIDIA GeForce RTX 3060 Laptop GPU (40 - 78.8, n=16) | |
| Média NVIDIA GeForce RTX 3050 Ti Laptop GPU (31 - 50.5, n=9) | |
| HP Victus 15 fa0020nr | |
| Média NVIDIA GeForce RTX 3050 4GB Laptop GPU (25.3 - 36.5, n=7) | |
Witcher 3 FPS Chart
| baixo | média | alto | ultra | |
|---|---|---|---|---|
| GTA V (2015) | 179.5 | 173 | 144.7 | 73.1 |
| The Witcher 3 (2015) | 284.4 | 186.2 | 106.5 | 54.7 |
| Dota 2 Reborn (2015) | 161.7 | 140.3 | 132.2 | 123.8 |
| Final Fantasy XV Benchmark (2018) | 138.1 | 81.7 | 54.7 | |
| X-Plane 11.11 (2018) | 127.1 | 115.6 | 92.9 | |
| Strange Brigade (2018) | 297 | 138.8 | 112.2 | 97.4 |
| Cyberpunk 2077 1.6 (2022) | 78.3 | 65.7 | 46.9 | 36.8 |
Emissões
Ruído do sistema - Mais alto no modo silencioso
O ruído do ventilador está ligado às três configurações de desempenho da HP: Silencioso, Padrão e Desempenho. Estranhamente, o ruído do ventilador é mais alto no modo Silencioso do que no Default (29,2 dB(A) vs. 26,2 dB(A)) quando ocioso na área de trabalho que suspeitamos ser provavelmente um bug. Independentemente disso, é decepcionante que os ventiladores estejam sempre ativos não importa a carga na tela e, portanto, o sistema nunca é verdadeiramente silencioso.
A boa notícia é que embora o ruído dos ventiladores seja relativamente alto durante cargas mais baixas, ele é mais silencioso do que muitos outros laptops de jogos quando se corre com cargas mais altas, como jogos. O ruído do ventilador se estabilizaria em pouco mais de 41 dB(A) ao rodar Witcher 3 no modo Performance, comparado a 48 dB(A) e 44 dB(A) no HP Omen 15 e Dell G5 15, respectivamente. Os ventiladores são mais letárgicos e levam mais tempo para aumentar a velocidade também.
Nossa unidade de teste também sofreria de leve lamentação da bobina ou ruído eletrônico.
Barulho
| Ocioso |
| 26.2 / 29.2 / 29.4 dB |
| Carga |
| 29.9 / 45.5 dB |
 | ||
30 dB silencioso 40 dB(A) audível 50 dB(A) ruidosamente alto |
||
min: | ||
| HP Victus 15 fa0020nr GeForce RTX 3050 Ti Laptop GPU, i7-12700H, Samsung PM9A1 MZVL2512HCJQ | HP Omen 15-en0375ng GeForce RTX 2060 Mobile, R7 4800H, WDC PC SN730 SDBPNTY-512G | Dell G15 5515 GeForce RTX 3050 Ti Laptop GPU, R7 5800H, Samsung PM991a MZ9LQ512HBLU-00BD1 | Asus TUF Dash F15 FX517ZC GeForce RTX 3050 4GB Laptop GPU, i7-12650H, Intel SSD 670p SSDPEKNU512GZ | MSI Bravo 15 B5DD-010US Radeon RX 5500M, R5 5600H, Kingston OM8PCP3512F-AB | Lenovo Legion 5 15IAH7H 82RB GeForce RTX 3060 Laptop GPU, i7-12700H | |
|---|---|---|---|---|---|---|
| Noise | -12% | -6% | -11% | -9% | 1% | |
| desligado / ambiente * (dB) | 24.8 | 24 3% | 24 3% | 23.9 4% | 24.5 1% | 23.3 6% |
| Idle Minimum * (dB) | 26.2 | 24 8% | 25 5% | 24 8% | 24.5 6% | 23.5 10% |
| Idle Average * (dB) | 29.2 | 25 14% | 26 11% | 24 18% | 32.8 -12% | 23.5 20% |
| Idle Maximum * (dB) | 29.4 | 37 -26% | 30 -2% | 32.3 -10% | 32.8 -12% | 26.8 9% |
| Load Average * (dB) | 29.9 | 45 -51% | 44 -47% | 43.7 -46% | 34.5 -15% | 29.3 2% |
| Witcher 3 ultra * (dB) | 41.1 | 48 -17% | 44 -7% | 53.4 -30% | 42.5 -3% | 51.4 -25% |
| Load Maximum * (dB) | 45.5 | 51 -12% | 48 -5% | 53.6 -18% | 58.5 -29% | 53 -16% |
* ... menor é melhor
Temperatura
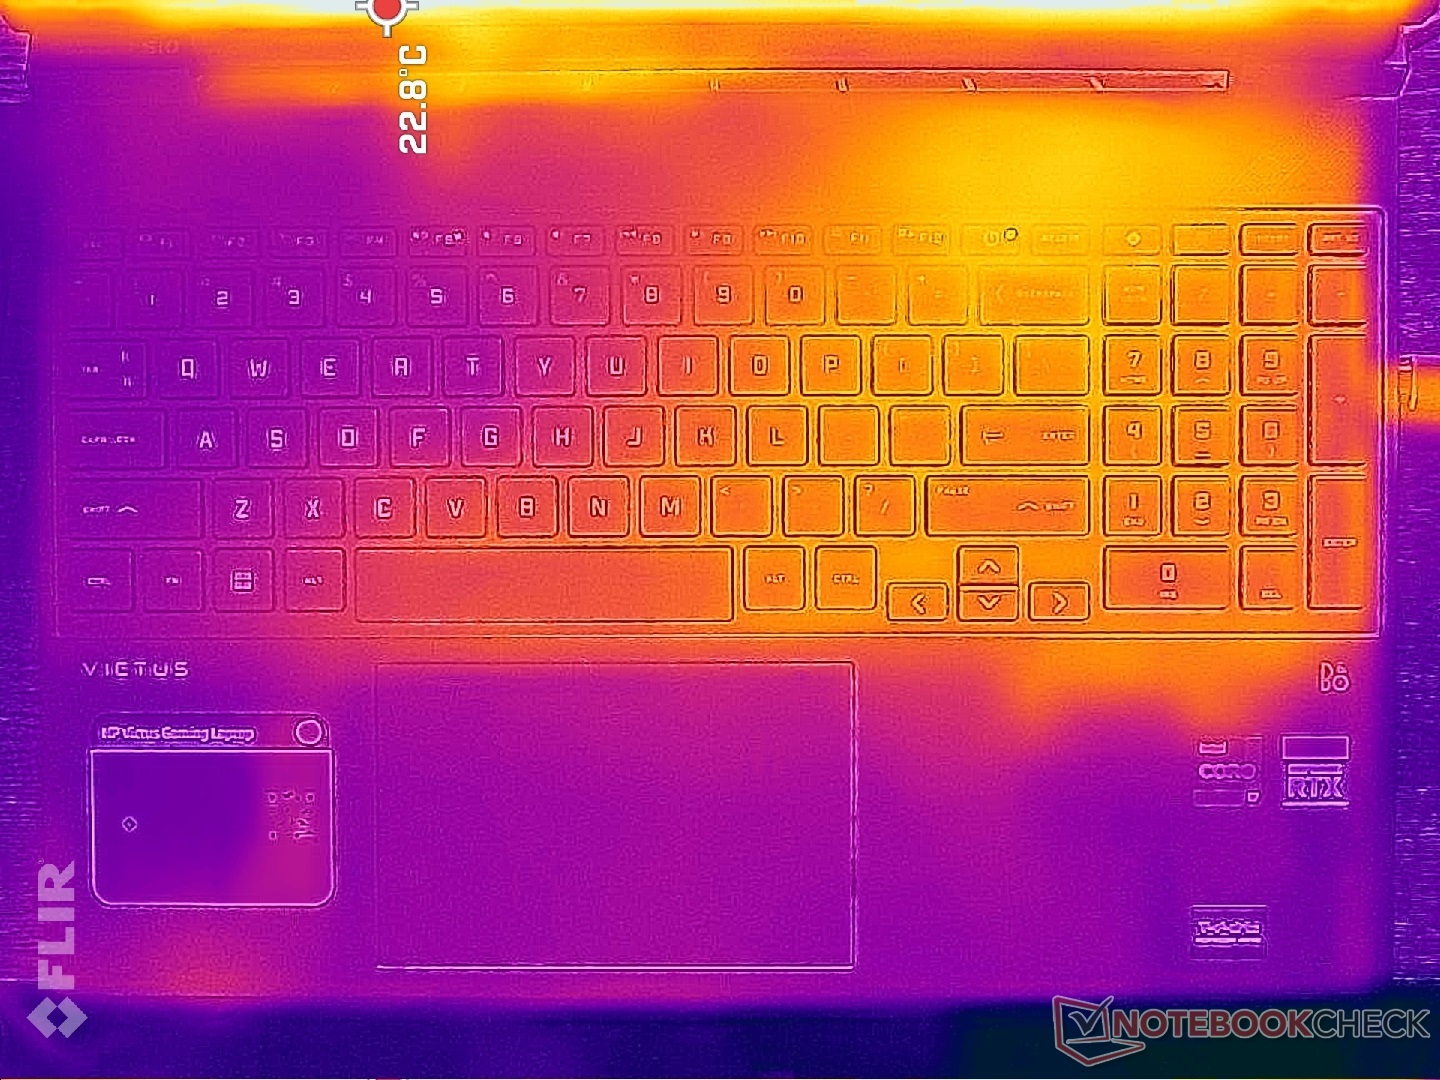
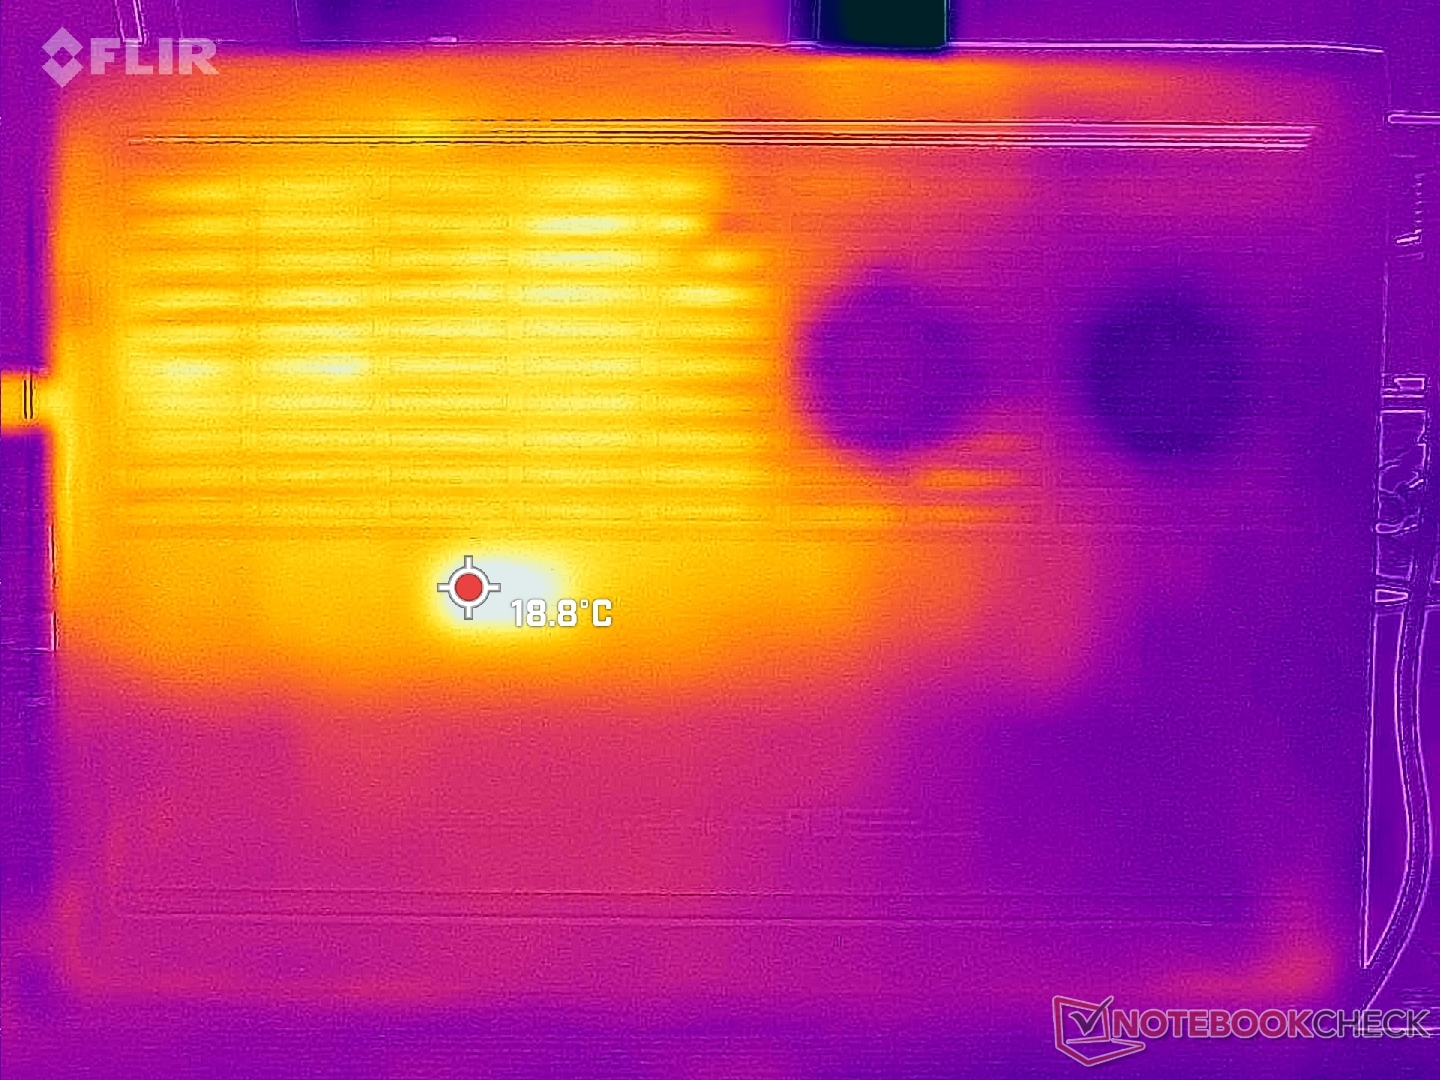
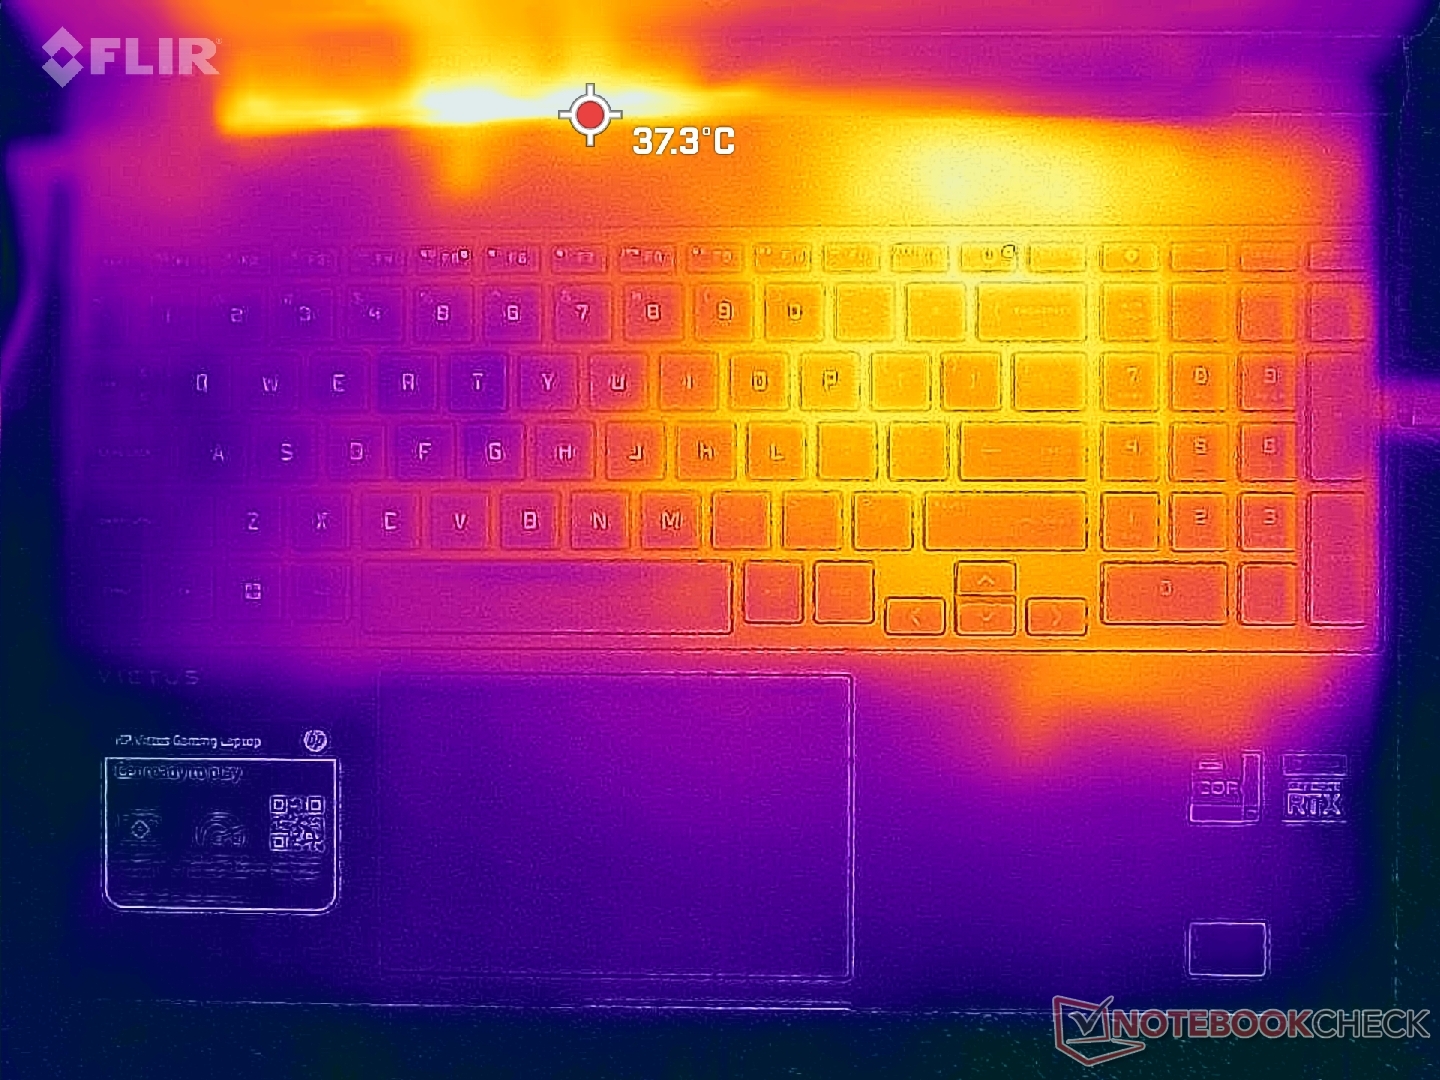
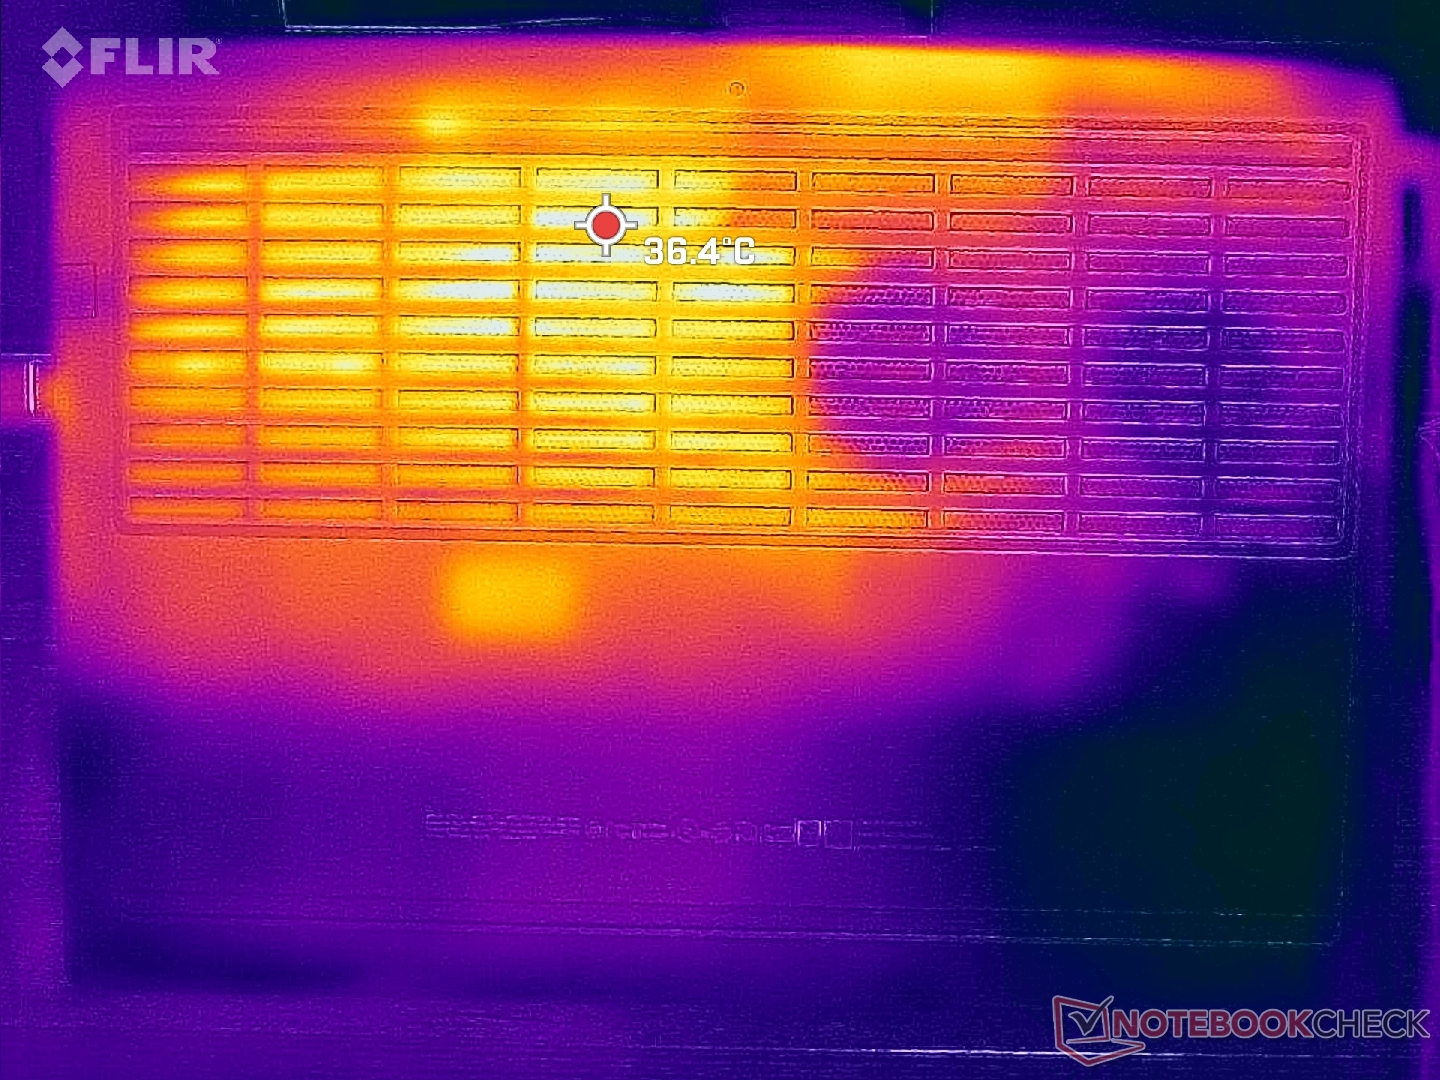
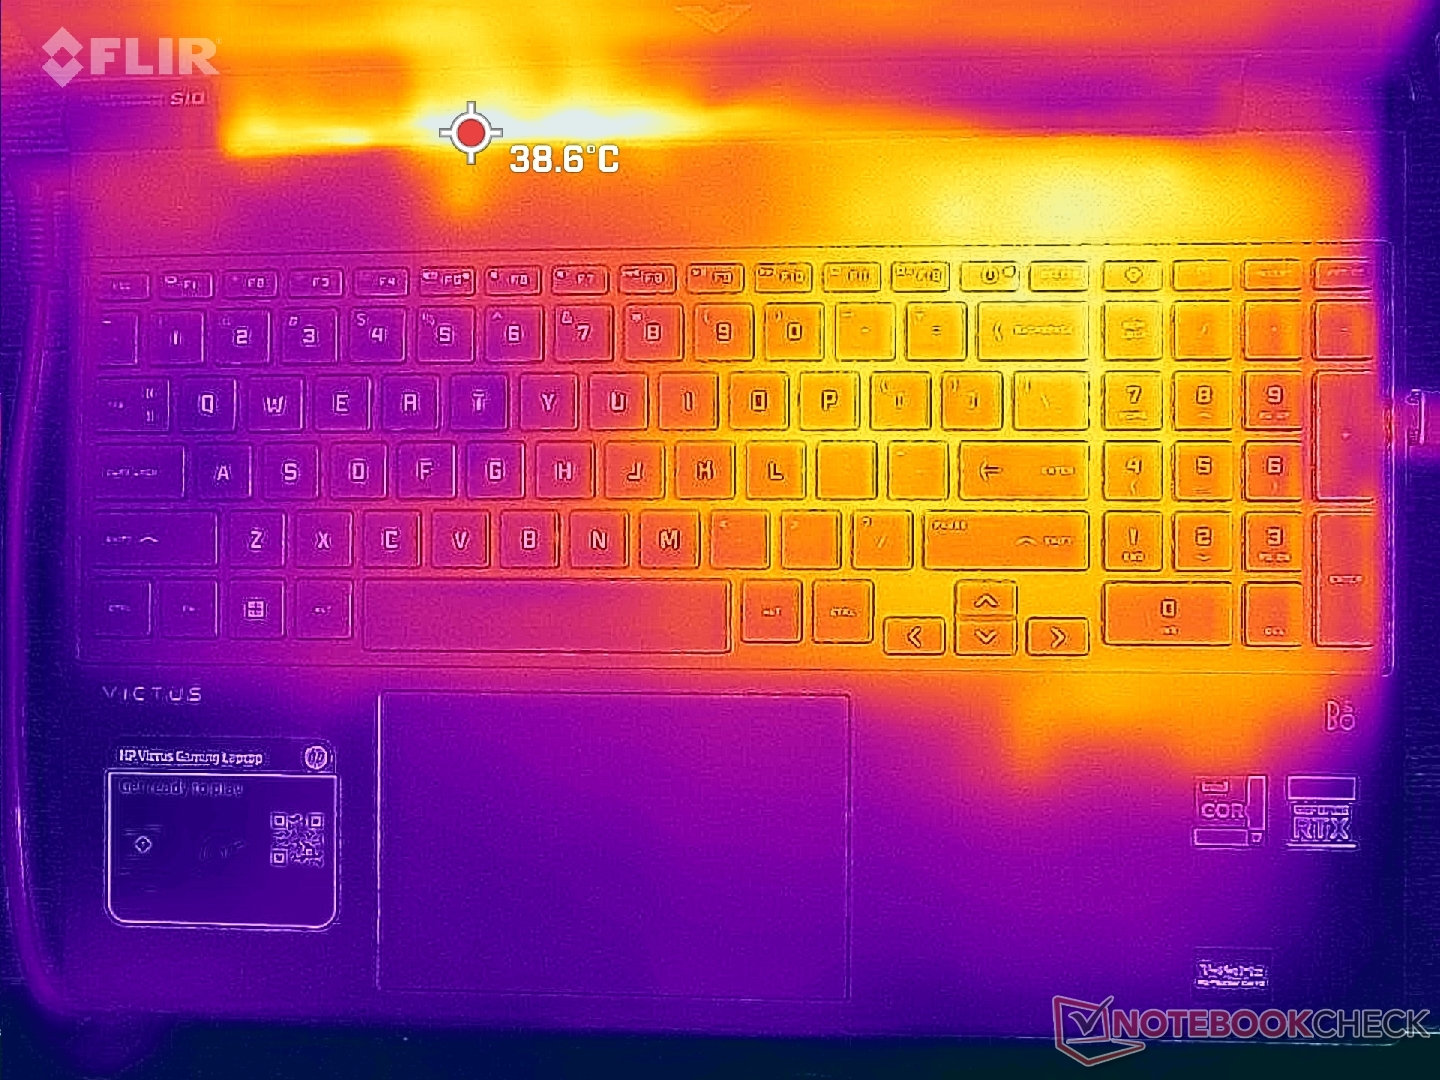
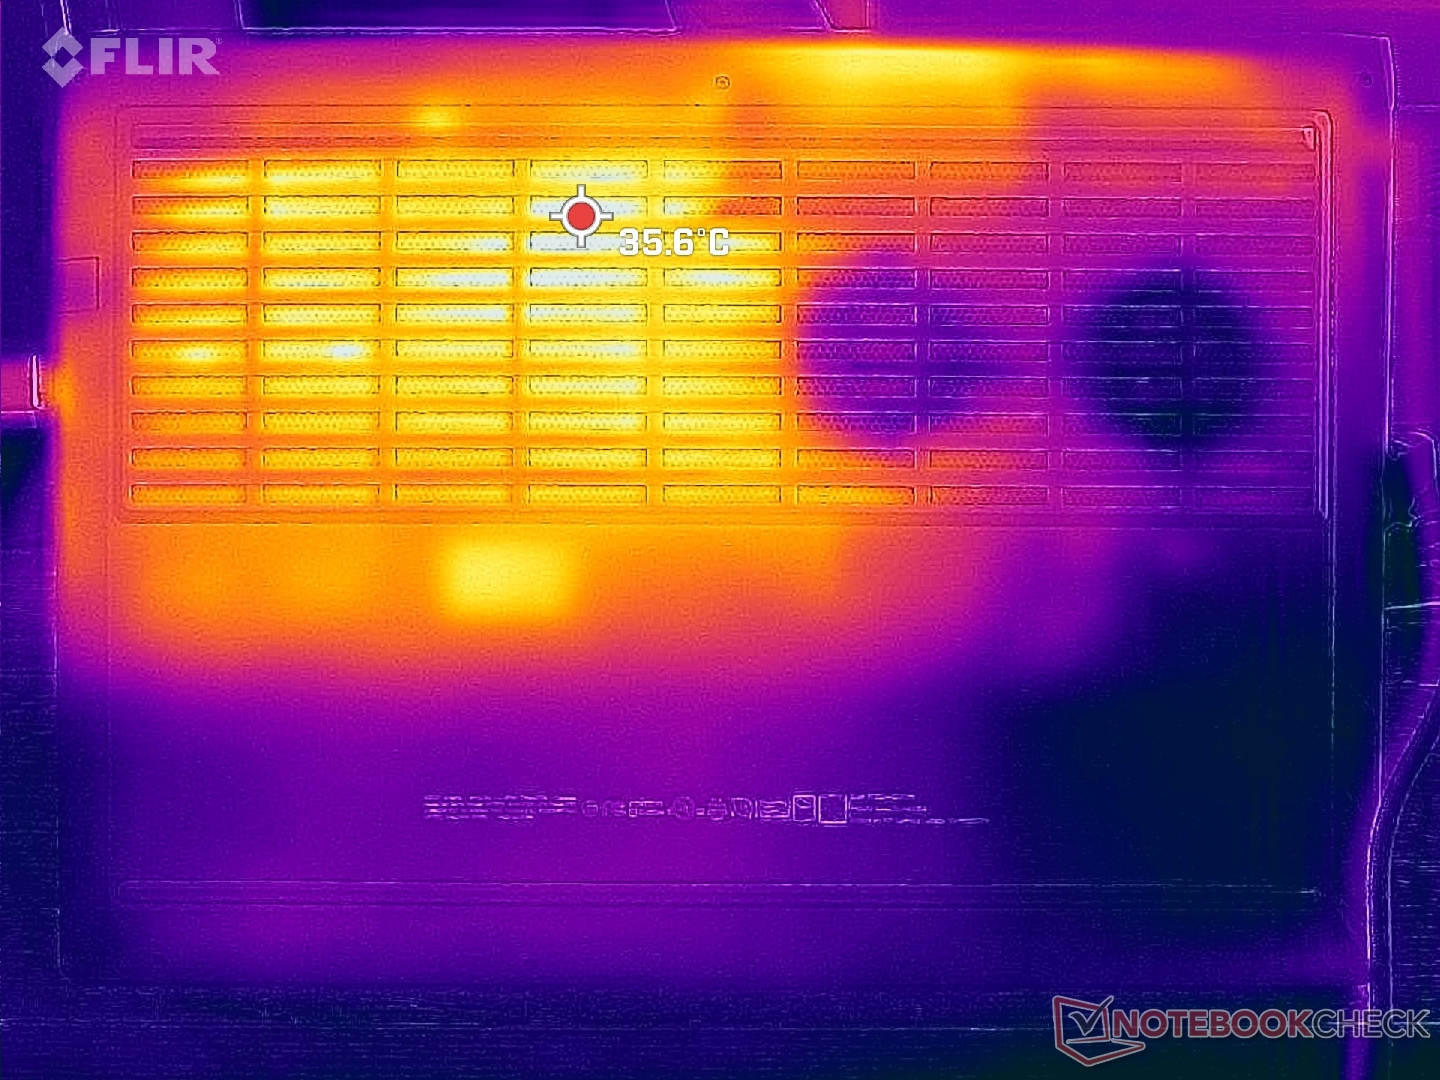
A solução de resfriamento não é simétrica, ao contrário da maioria dos laptops para jogos. Assim, uma metade do chassi Victus 15 será sempre mais quente do que a outra metade, como mostram nossos mapas de temperatura abaixo. Felizmente, os pontos quentes não são tão ruins a pouco mais de 38 C na parte superior ou 36 C na parte inferior, em comparação com quase 50 C na parte inferior Dell G5 15 equipado com a mesma GPU Nvidia. A palma da mão descansa e deixa a metade do teclado relativamente fria, não importa a carga na tela.
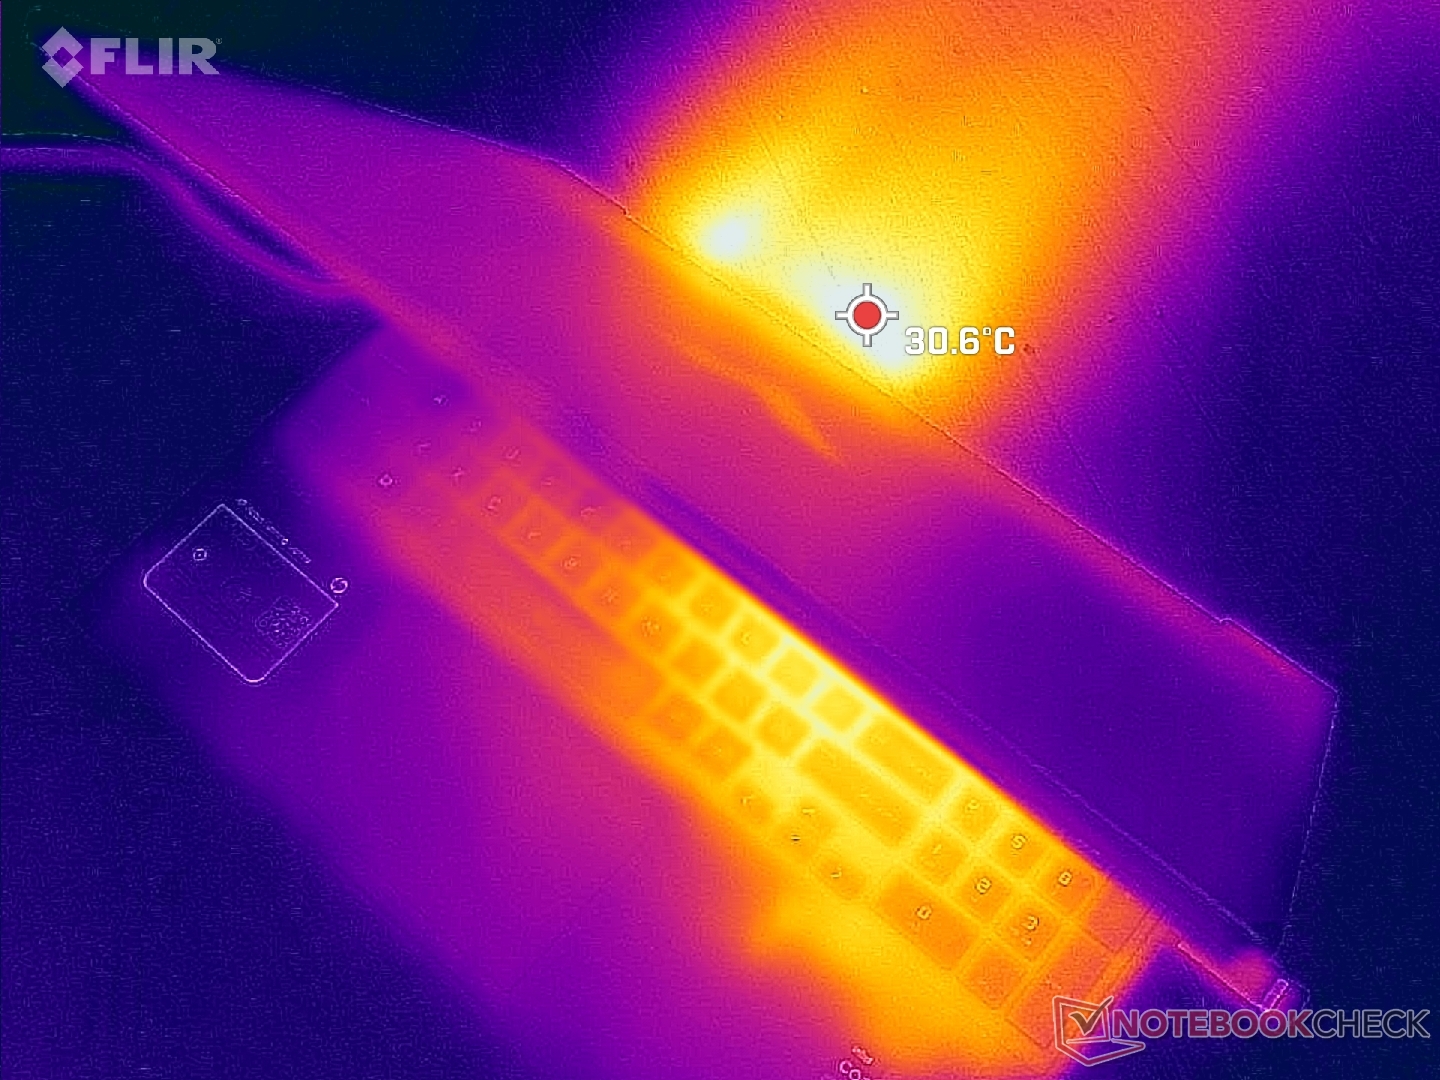
(+) A temperatura máxima no lado superior é 37.2 °C / 99 F, em comparação com a média de 40.4 °C / 105 F , variando de 21.2 a 68.8 °C para a classe Gaming.
(+) A parte inferior aquece até um máximo de 35.4 °C / 96 F, em comparação com a média de 43.2 °C / 110 F
(+) Em uso inativo, a temperatura média para o lado superior é 20.4 °C / 69 F, em comparação com a média do dispositivo de 33.9 °C / ### class_avg_f### F.
(+) Jogando The Witcher 3, a temperatura média para o lado superior é 27.2 °C / 81 F, em comparação com a média do dispositivo de 33.9 °C / ## #class_avg_f### F.
(+) Os apoios para as mãos e o touchpad são mais frios que a temperatura da pele, com um máximo de 23.2 °C / 73.8 F e, portanto, são frios ao toque.
(+) A temperatura média da área do apoio para as mãos de dispositivos semelhantes foi 28.8 °C / 83.8 F (+5.6 °C / 10 F).
| HP Victus 15 fa0020nr Intel Core i7-12700H, NVIDIA GeForce RTX 3050 Ti Laptop GPU | HP Omen 15-en0375ng AMD Ryzen 7 4800H, NVIDIA GeForce RTX 2060 Mobile | Dell G15 5515 AMD Ryzen 7 5800H, NVIDIA GeForce RTX 3050 Ti Laptop GPU | Asus TUF Dash F15 FX517ZC Intel Core i7-12650H, NVIDIA GeForce RTX 3050 4GB Laptop GPU | MSI Bravo 15 B5DD-010US AMD Ryzen 5 5600H, AMD Radeon RX 5500M | Lenovo Legion 5 15IAH7H 82RB Intel Core i7-12700H, NVIDIA GeForce RTX 3060 Laptop GPU | |
|---|---|---|---|---|---|---|
| Heat | -30% | -26% | -11% | -43% | -22% | |
| Maximum Upper Side * (°C) | 37.2 | 42 -13% | 50 -34% | 43.4 -17% | 52.2 -40% | 37.8 -2% |
| Maximum Bottom * (°C) | 35.4 | 54 -53% | 49 -38% | 44.4 -25% | 48.6 -37% | 51 -44% |
| Idle Upper Side * (°C) | 22.4 | 28 -25% | 26 -16% | 21.2 5% | 38 -70% | 25.8 -15% |
| Idle Bottom * (°C) | 22.6 | 29 -28% | 26 -15% | 24 -6% | 28.4 -26% | 28.8 -27% |
* ... menor é melhor
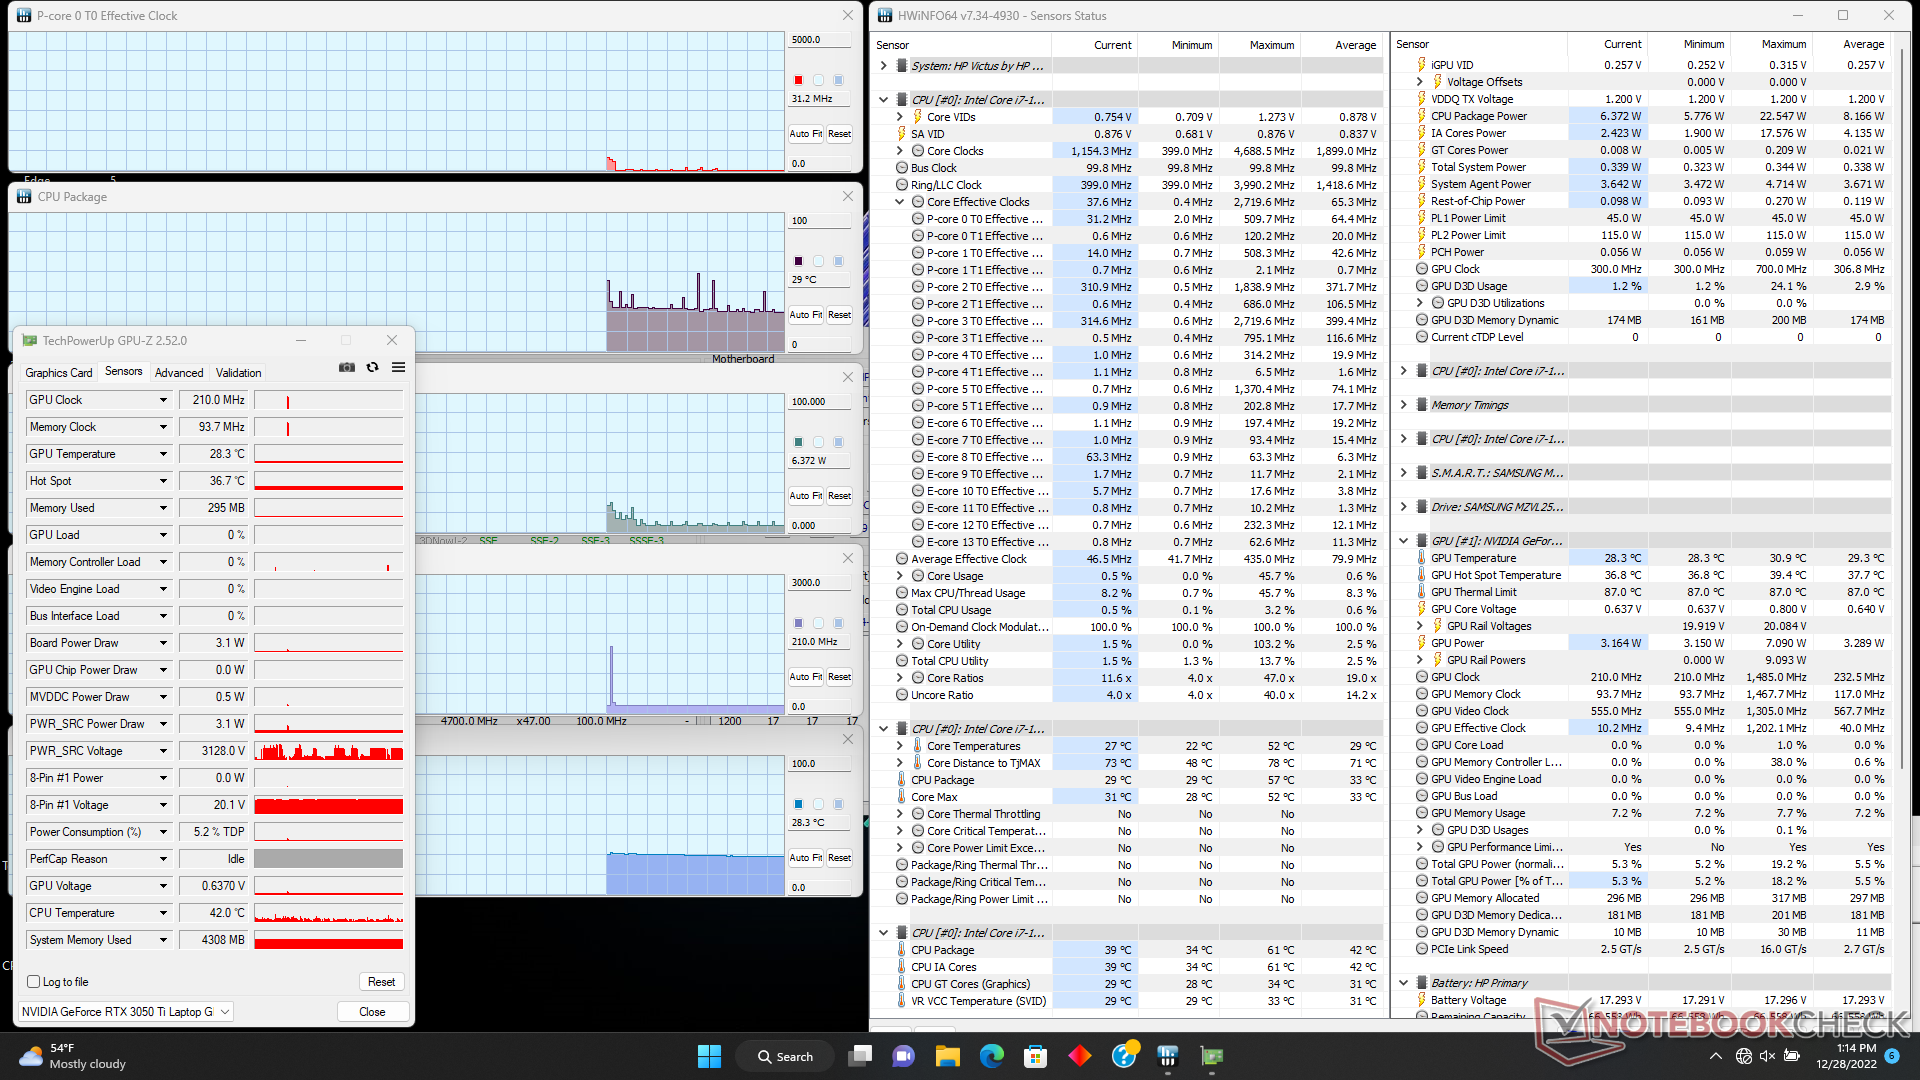
Teste de estresse
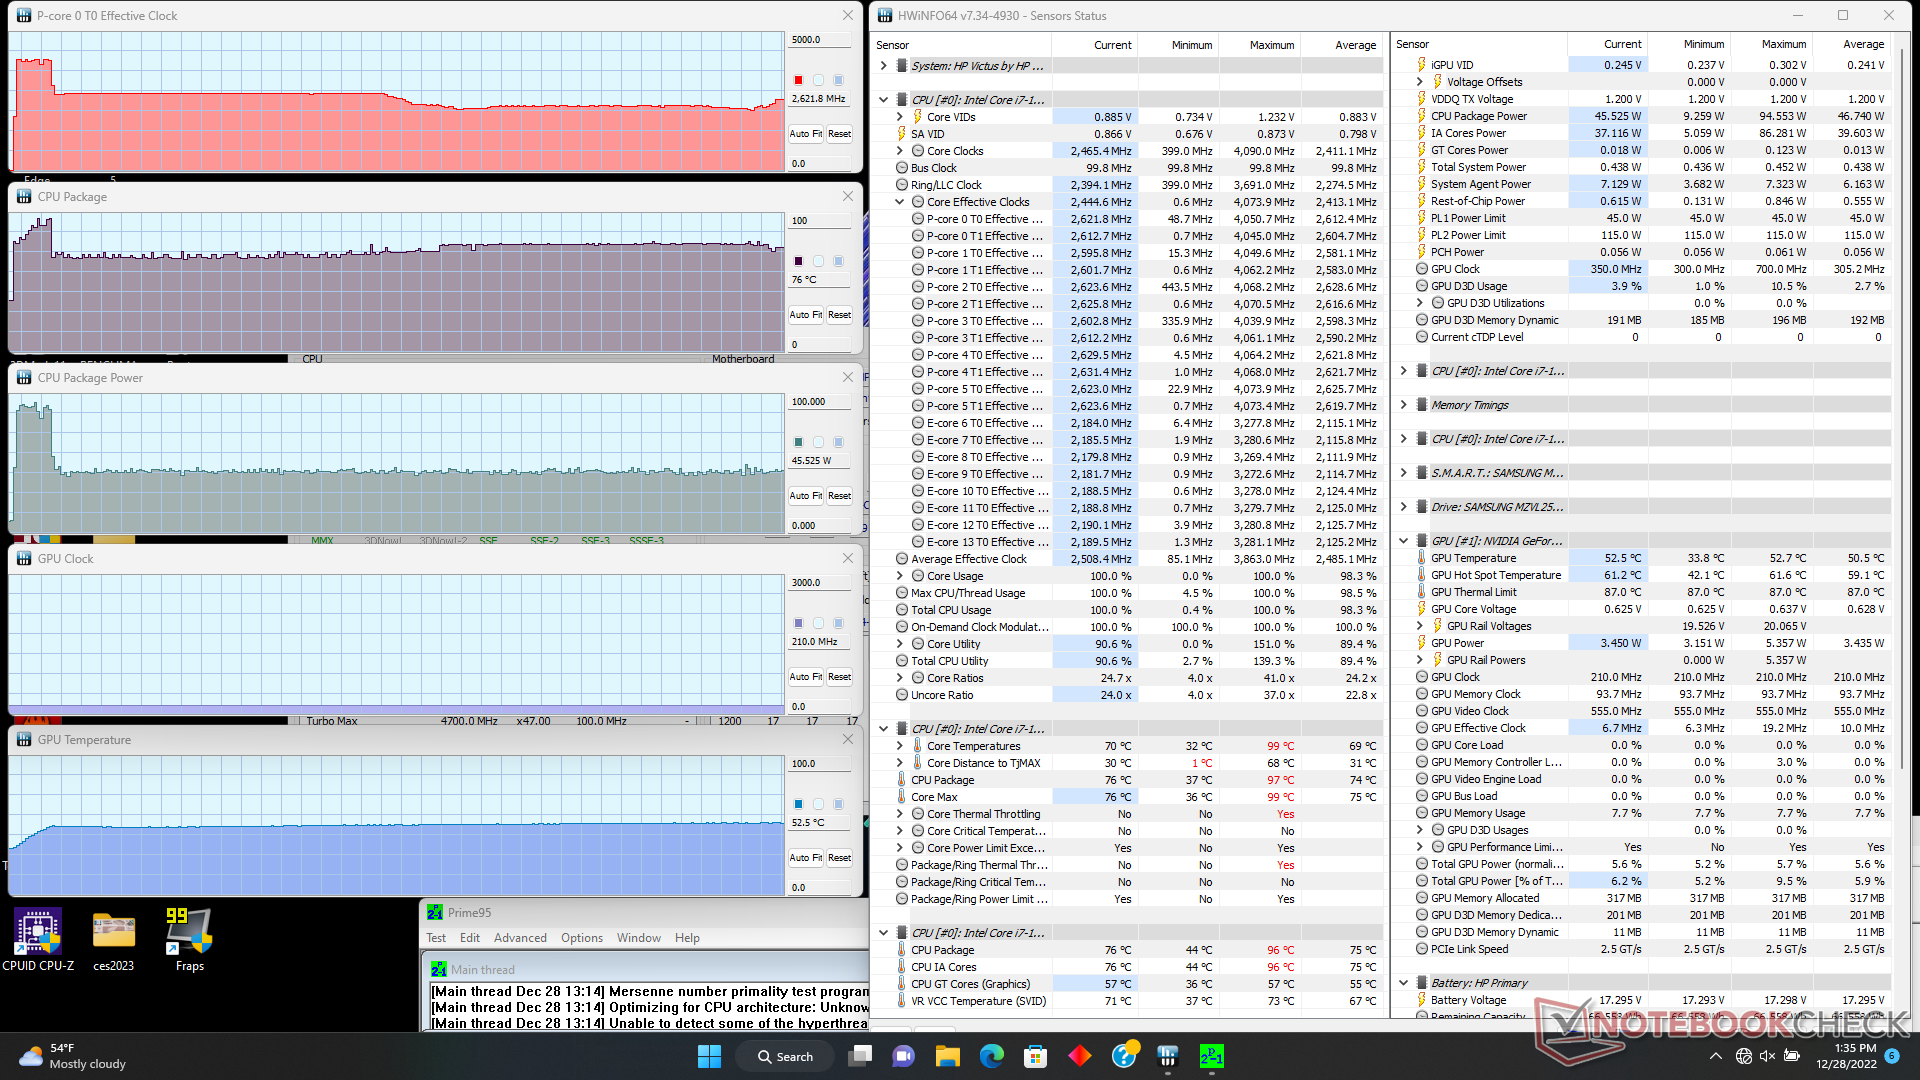
Ao rodar Prime95 para enfatizar a CPU, as taxas de clock e o consumo de energia da placa podem ser observados aumentando para até 4,1 GHz e 93 W, respectivamente. Uma vez que a temperatura central atinja 97 C cerca de 30 segundos depois, no entanto, as taxas de clock e o consumo de energia da placa cairiam para apenas ~2,4 GHz e 45 W, respectivamente, a fim de manter uma temperatura central mais fria de cerca de 76 C. Em comparação, repetindo este mesmo teste na Lenovo Legion 5 15 com a mesma CPU resultaria em uma taxa de relógio estável mais rápida de 3,6 GHz e uma temperatura central mais quente de 97 C. A Victus 15 está, portanto, jogando-a de forma conservadora, mesmo quando ajustada a seus ajustes de maior desempenho.
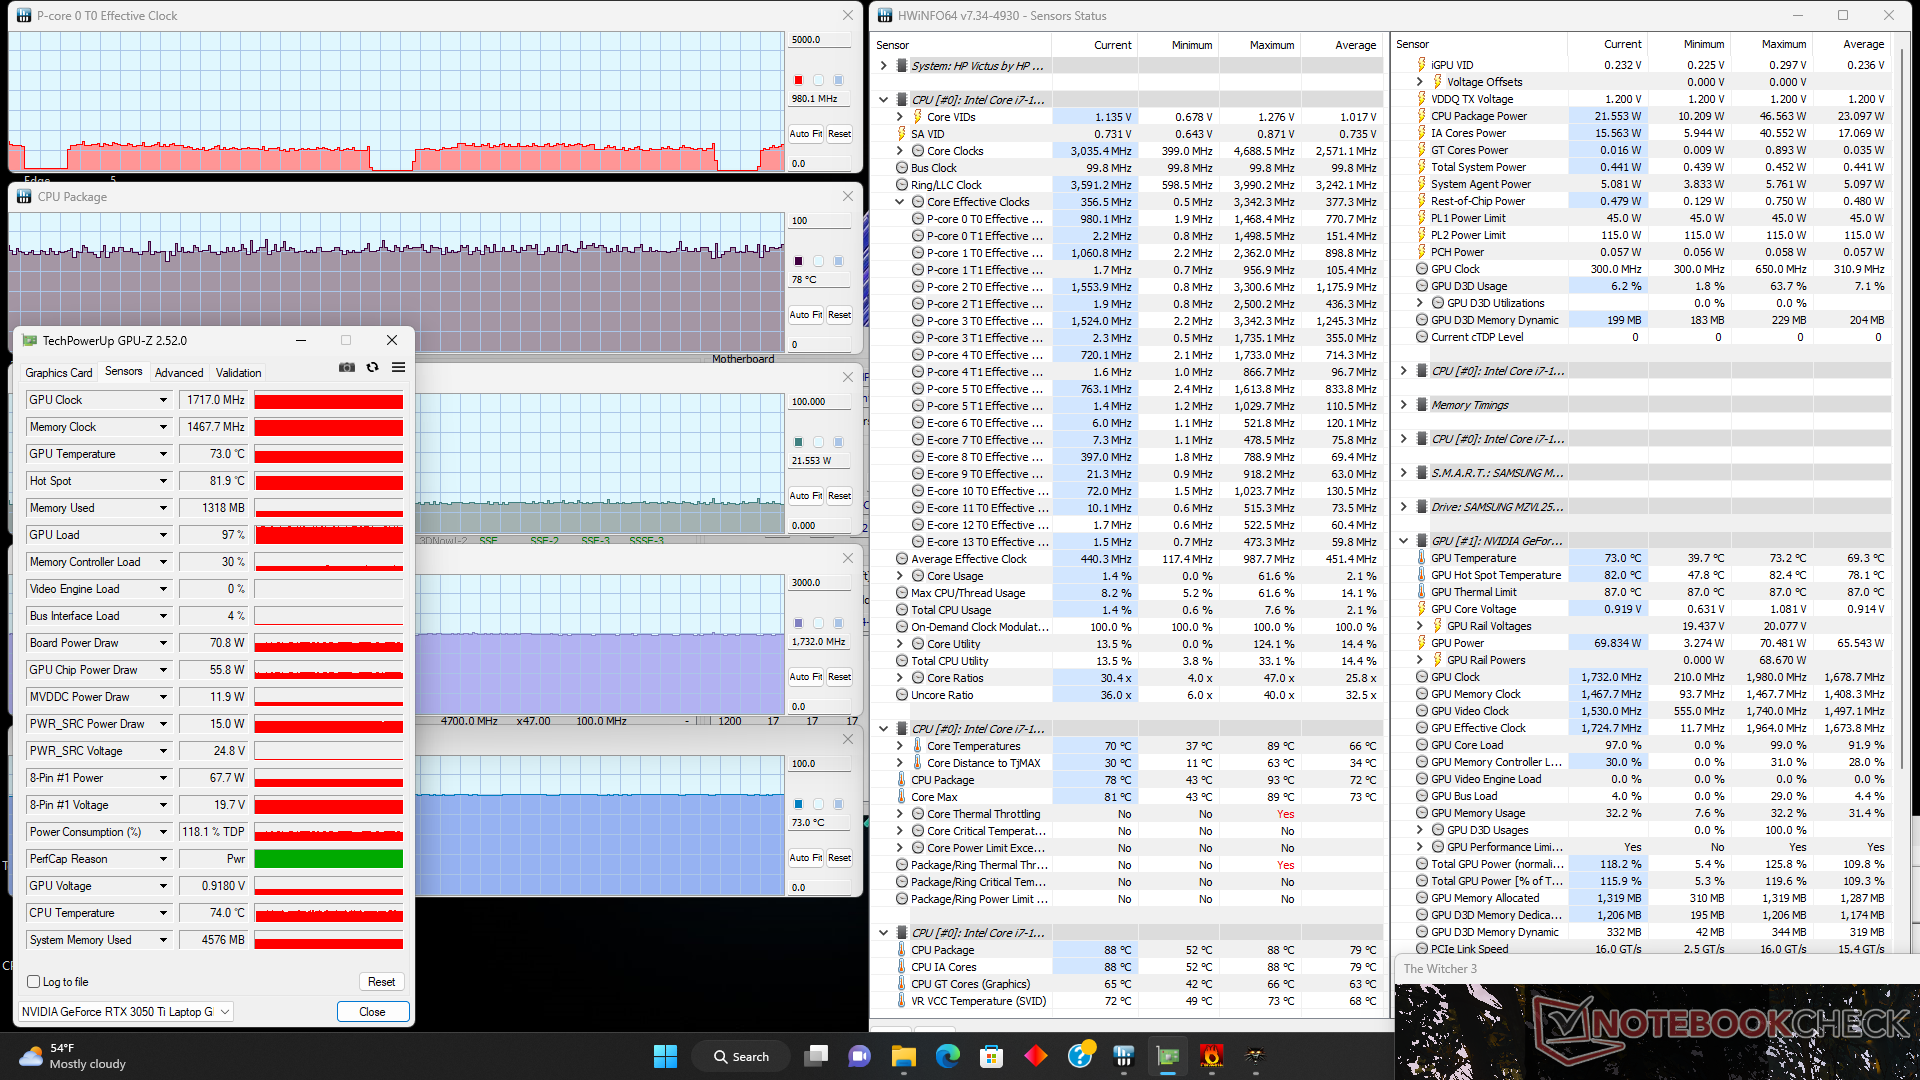
A taxa de clock GPU, temperatura e consumo de energia da placa se estabilizariam em 1717 MHz, 73 C e 71 W, respectivamente, quando em funcionamento Witcher 3. O TGP é classificado para 75 W e, portanto, a potência de 71 W no mundo real chega bem perto. A repetição deste teste no Dell G5 com a mesma GPU resultaria em valores ligeiramente mais altos em toda a linha (relógio com núcleo de 1845 MHz, relógio com memória de 1500 MHz, 79 C, e desenho de 80 W). As temperaturas geralmente mais baixas do núcleo do HP quando sob carga contribuem para suas temperaturas de superfície mais frias mencionadas acima.
Funcionando com bateria limita o desempenho. Um teste 3DMark Fire Strike em baterias retornaria pontuações de Física e Gráficos de 22703 e 9496 pontos, respectivamente, em comparação com 28270 e 14628 pontos quando em rede elétrica.
| Relógio CPU (GHz) | Relógio GPU (MHz) | Temperatura média da CPU (°C) | Temperatura média da GPU (°C) | |
| System Idle | -- | -- | 29 | 28 |
| Prime95 Stress | 2.2 - 2.6 | -- | 76 | 53 |
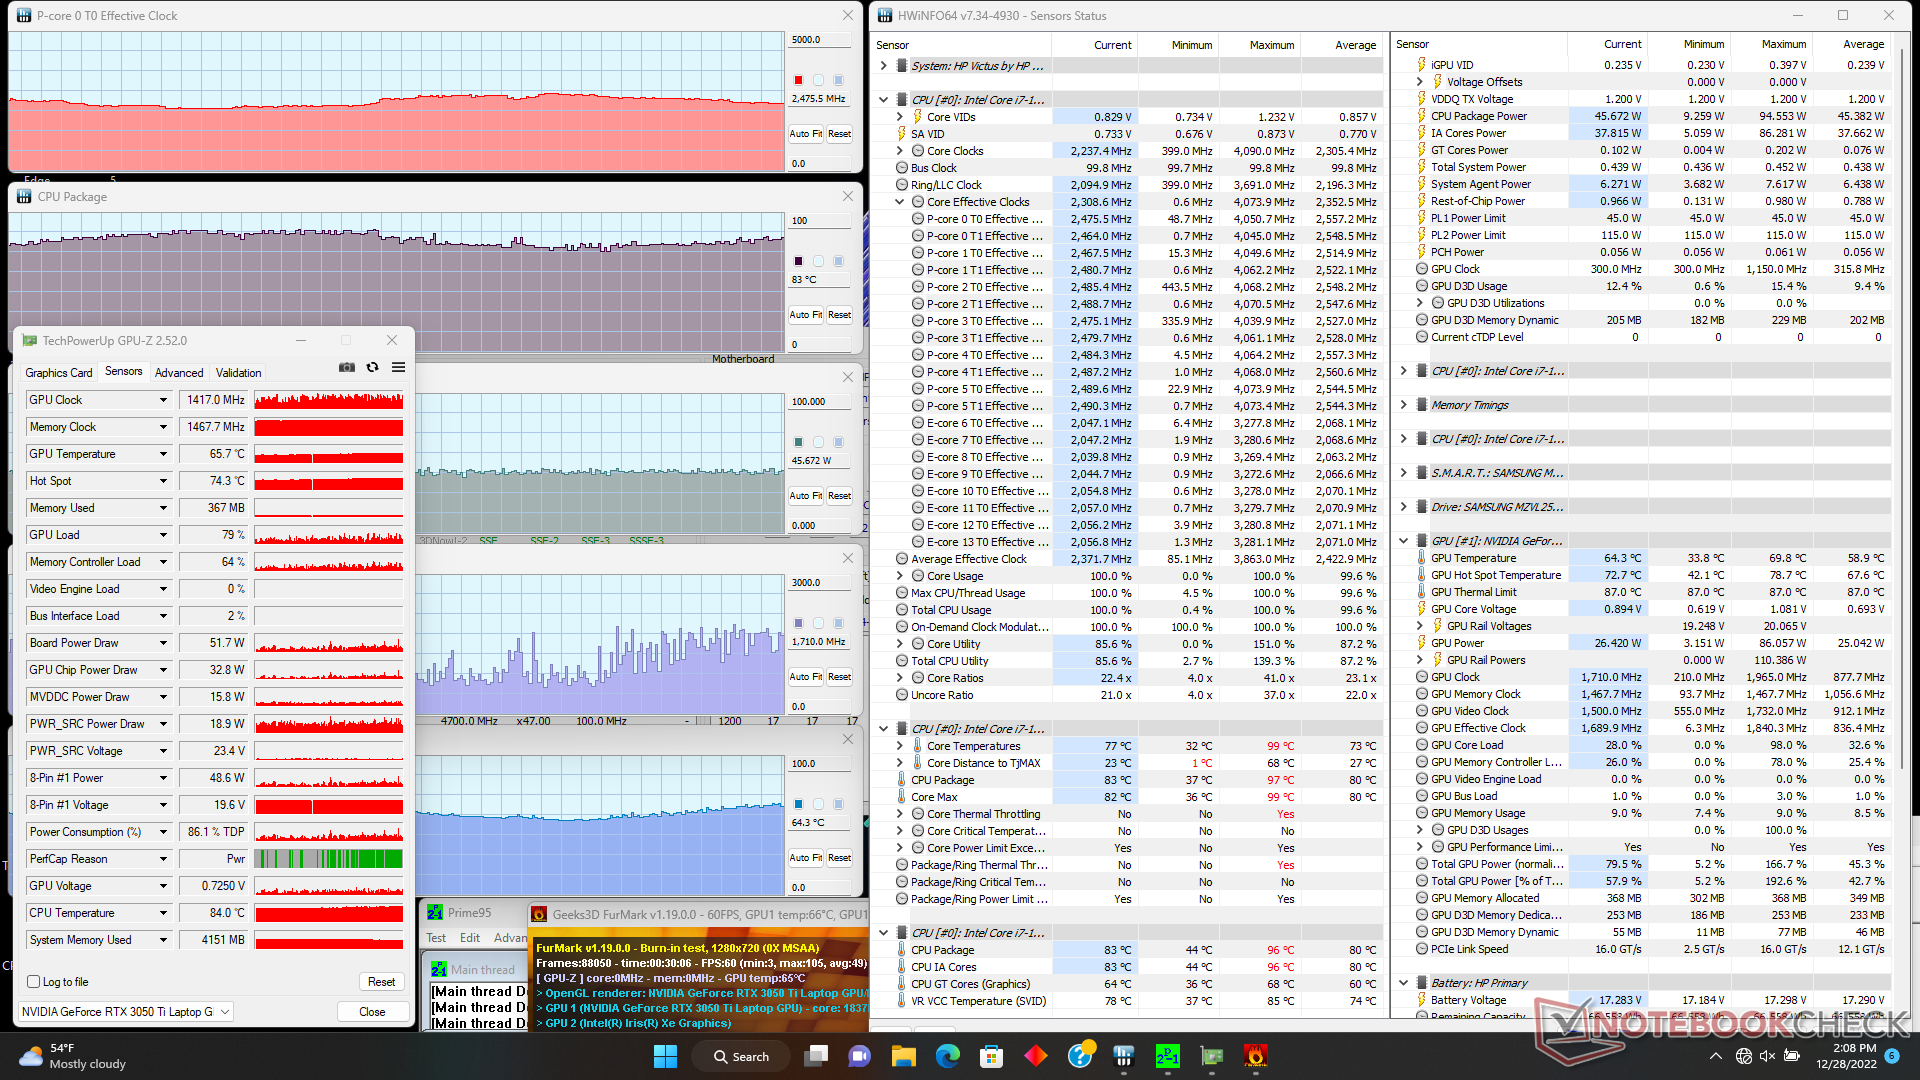
| Prime95 + FurMark Stress | 2.2 - 2.8 | ~1417 - 1710 | 70 - 90 | 54 - 69 |
| Witcher 3 Estresse | ~1.0 | 1717 | 78 | 73 |
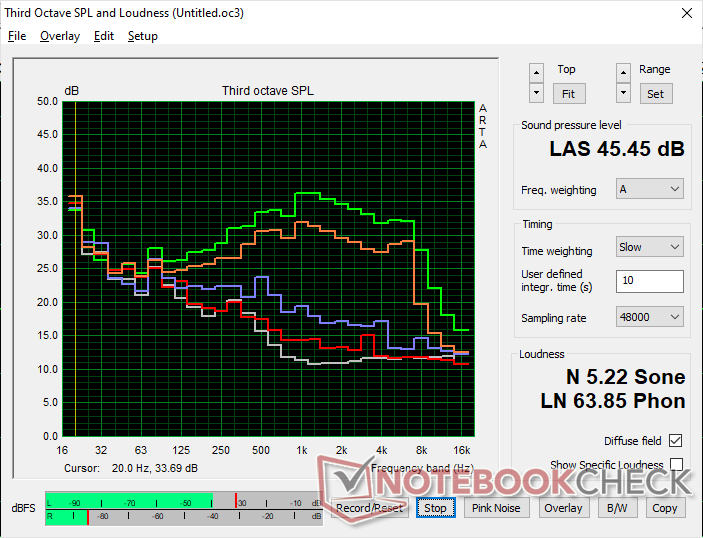
Oradores
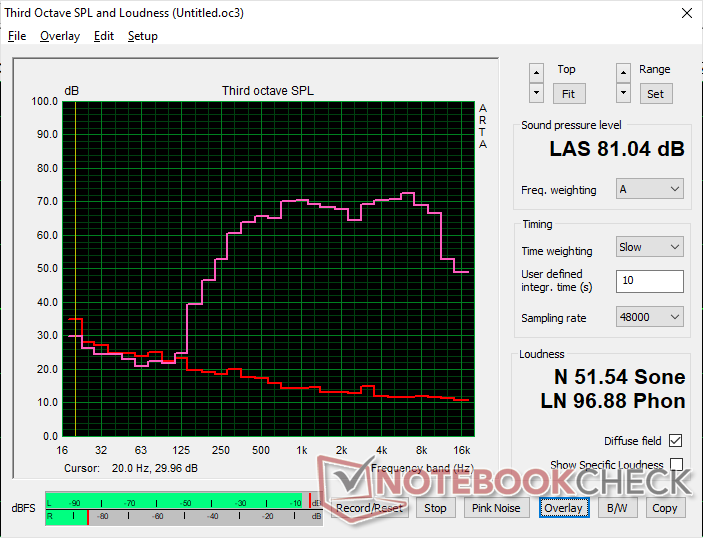
HP Victus 15 fa0020nr análise de áudio
(±) | o volume do alto-falante é médio, mas bom (###valor### dB)
Graves 100 - 315Hz
(-) | quase nenhum baixo - em média 24.6% menor que a mediana
(±) | a linearidade dos graves é média (12.8% delta para a frequência anterior)
Médios 400 - 2.000 Hz
(+) | médios equilibrados - apenas 2.5% longe da mediana
(+) | médios são lineares (3.4% delta para frequência anterior)
Altos 2 - 16 kHz
(+) | agudos equilibrados - apenas 3.7% longe da mediana
(+) | os máximos são lineares (4.9% delta da frequência anterior)
Geral 100 - 16.000 Hz
(±) | a linearidade do som geral é média (19.7% diferença em relação à mediana)
Comparado com a mesma classe
» 69% de todos os dispositivos testados nesta classe foram melhores, 6% semelhantes, 25% piores
» O melhor teve um delta de 6%, a média foi 18%, o pior foi 132%
Comparado com todos os dispositivos testados
» 50% de todos os dispositivos testados foram melhores, 7% semelhantes, 43% piores
» O melhor teve um delta de 4%, a média foi 23%, o pior foi 134%
Apple MacBook Pro 16 2021 M1 Pro análise de áudio
(+) | os alto-falantes podem tocar relativamente alto (###valor### dB)
Graves 100 - 315Hz
(+) | bons graves - apenas 3.8% longe da mediana
(+) | o baixo é linear (5.2% delta para a frequência anterior)
Médios 400 - 2.000 Hz
(+) | médios equilibrados - apenas 1.3% longe da mediana
(+) | médios são lineares (2.1% delta para frequência anterior)
Altos 2 - 16 kHz
(+) | agudos equilibrados - apenas 1.9% longe da mediana
(+) | os máximos são lineares (2.7% delta da frequência anterior)
Geral 100 - 16.000 Hz
(+) | o som geral é linear (4.6% diferença em relação à mediana)
Comparado com a mesma classe
» 0% de todos os dispositivos testados nesta classe foram melhores, 0% semelhantes, 100% piores
» O melhor teve um delta de 5%, a média foi 17%, o pior foi 45%
Comparado com todos os dispositivos testados
» 0% de todos os dispositivos testados foram melhores, 0% semelhantes, 100% piores
» O melhor teve um delta de 4%, a média foi 23%, o pior foi 134%
Gestão de energia
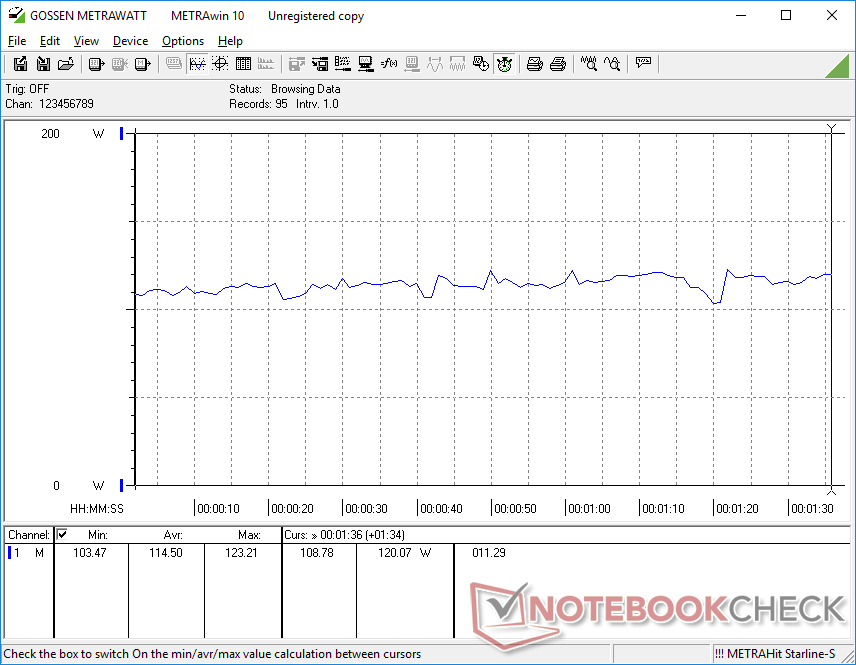
Consumo de energia - Similar a GeForce RTX 2060
A manipulação na área de trabalho consome entre 5 W e 19 W, dependendo do perfil de potência, do nível de brilho e da configuração Optimus. Quando se joga, o consumo geral se torna muito próximo do Omen 15 com o RTX 2060 mais antigo. É decepcionante que o desempenho por watt do RTX 3050 Ti não seja muito melhor que o RTX 2060, apesar de ser uma geração à parte e com níveis de desempenho semelhantes.
Laptops com o concorrente Radeon RX 6600M como o MSI Alfa 15 pode consumir cerca de 15% mais energia do que nosso HP quando se joga, mas o apreciável ganho de 30% a 50% no desempenho gráfico faz dele um bom tradeoff.
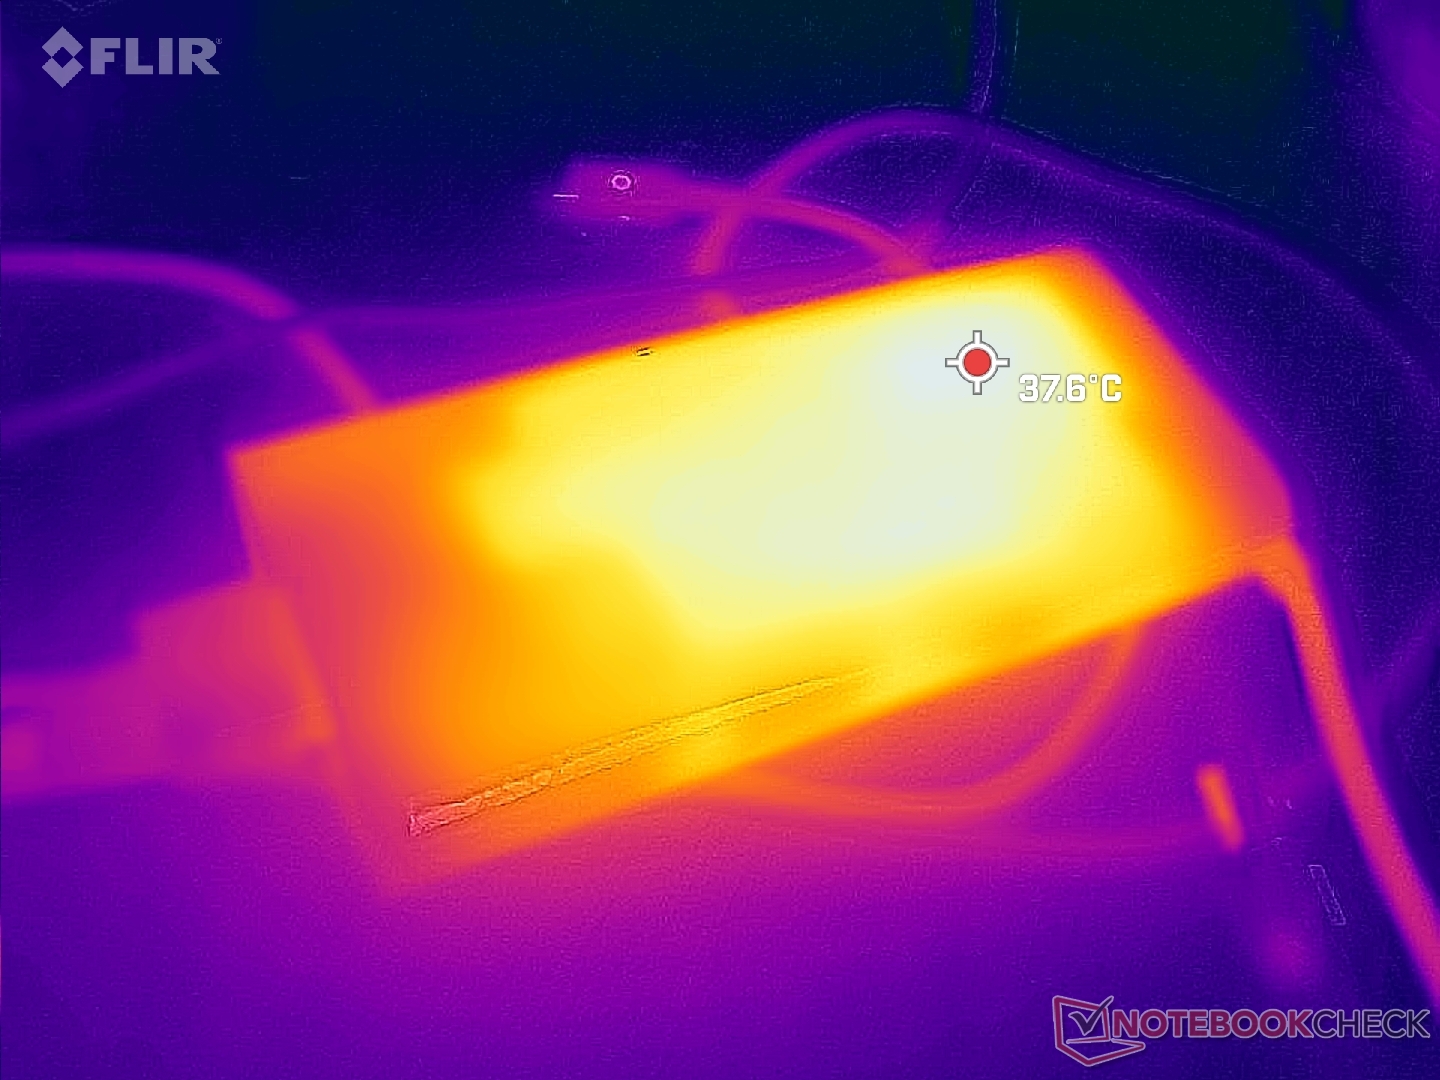
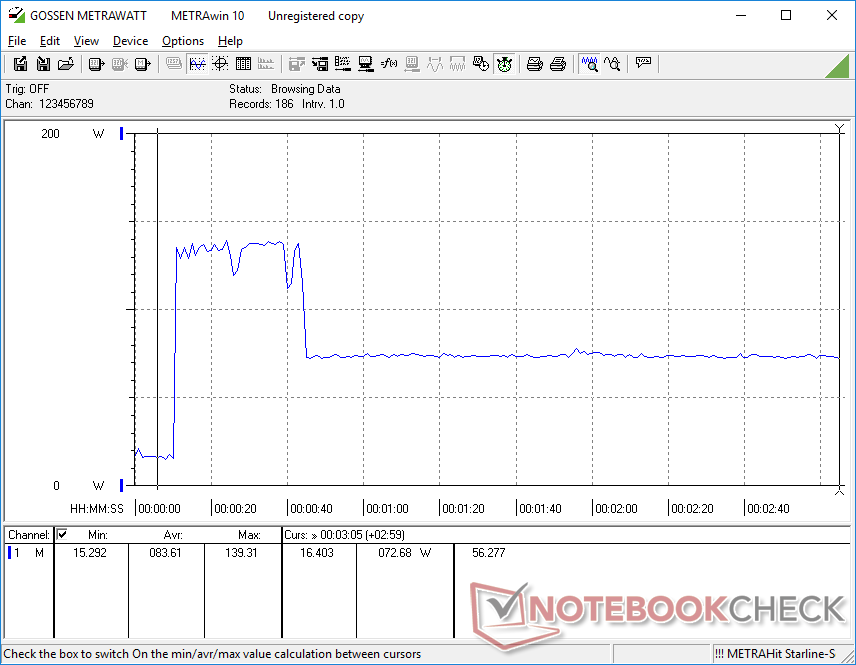
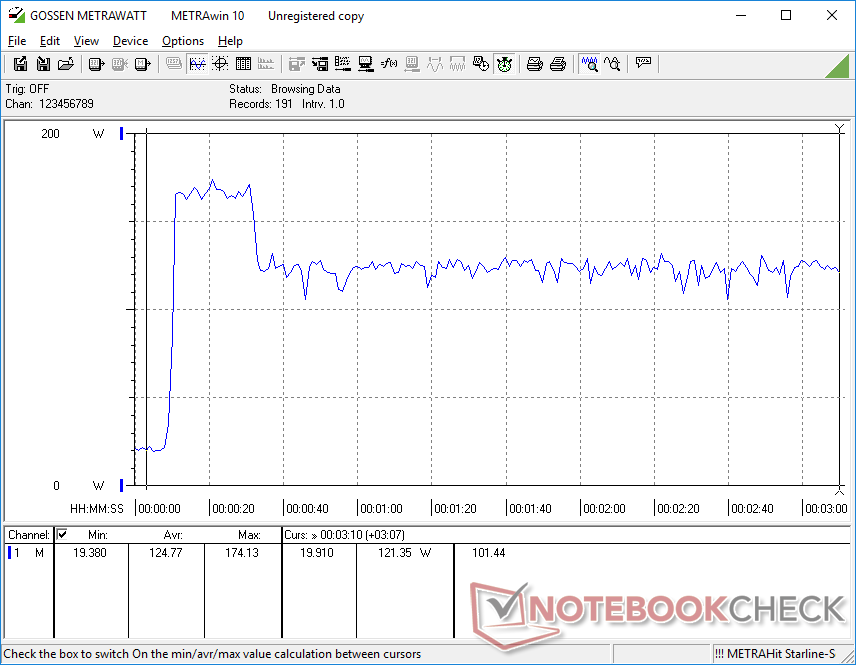
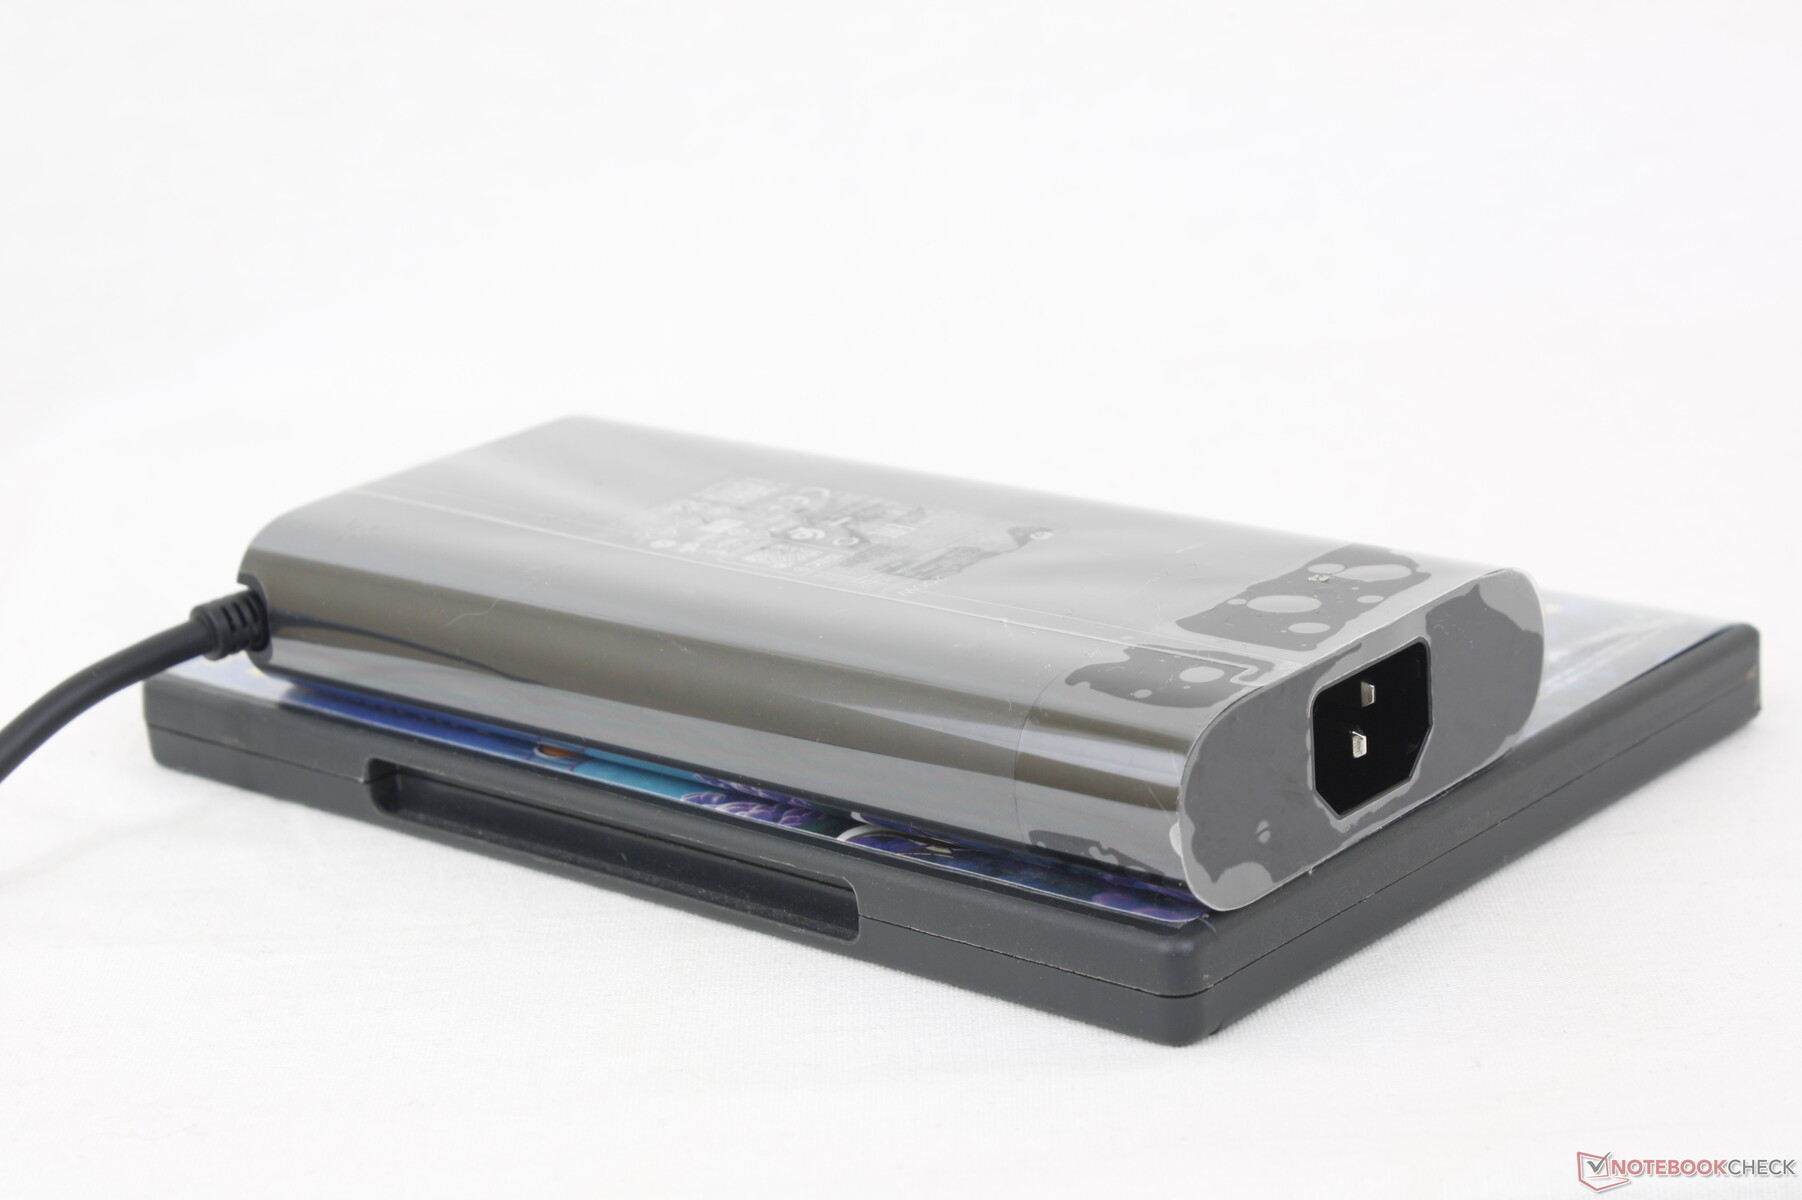
Somos capazes de medir um consumo máximo de 175 W a partir do adaptador AC de tamanho médio (~16,5 x 7,8 x 2,5 cm) 200 W quando em utilização máxima, como mostra a captura de tela abaixo. Esta taxa é temporária, pois a solução de resfriamento não pode resfriar suficientemente a CPU para uso indefinido do Turbo Boost.
| desligado | |
| Ocioso | |
| Carga |
|
Key:
min: | |
| HP Victus 15 fa0020nr i7-12700H, GeForce RTX 3050 Ti Laptop GPU, Samsung PM9A1 MZVL2512HCJQ, IPS, 1920x1080, 15.6" | HP Omen 15-en0375ng R7 4800H, GeForce RTX 2060 Mobile, WDC PC SN730 SDBPNTY-512G, IPS, 1920x1080, 15.6" | Dell G15 5515 R7 5800H, GeForce RTX 3050 Ti Laptop GPU, Samsung PM991a MZ9LQ512HBLU-00BD1, IPS, 1920x1080, 15.6" | Asus TUF Dash F15 FX517ZC i7-12650H, GeForce RTX 3050 4GB Laptop GPU, Intel SSD 670p SSDPEKNU512GZ, IPS, 2560x1440, 15.6" | MSI Bravo 15 B5DD-010US R5 5600H, Radeon RX 5500M, Kingston OM8PCP3512F-AB, IPS, 1920x1080, 15.6" | Lenovo Legion 5 15IAH7H 82RB i7-12700H, GeForce RTX 3060 Laptop GPU, , IPS, 1920x1080, 15.6" | |
|---|---|---|---|---|---|---|
| Power Consumption | 7% | 7% | -29% | 15% | -106% | |
| Idle Minimum * (Watt) | 5.1 | 4 22% | 5 2% | 9.2 -80% | 6.6 -29% | 19.8 -288% |
| Idle Average * (Watt) | 15.1 | 9 40% | 9 40% | 15.9 -5% | 9.8 35% | 26.2 -74% |
| Idle Maximum * (Watt) | 18.9 | 22 -16% | 20 -6% | 29.5 -56% | 10.8 43% | 48.2 -155% |
| Load Average * (Watt) | 114.5 | 102 11% | 94 18% | 124.8 -9% | 70.5 38% | 102.9 10% |
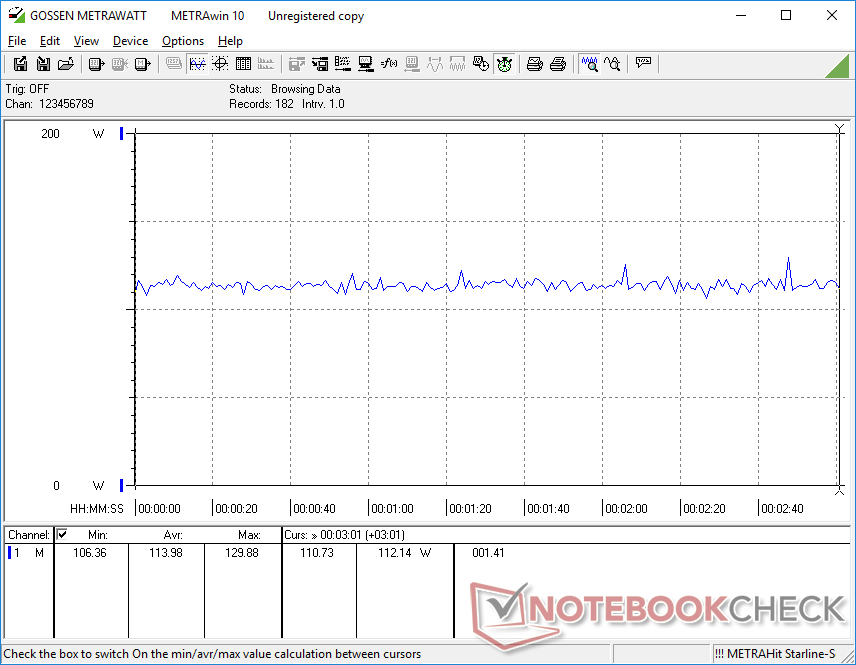
| Witcher 3 ultra * (Watt) | 113.9 | 119 -4% | 123 -8% | 129.2 -13% | 103.2 9% | 186.7 -64% |
| Load Maximum * (Watt) | 165.8 | 182 -10% | 172 -4% | 178.4 -8% | 175 -6% | 268 -62% |
* ... menor é melhor
Power Consumption Witcher 3 / Stresstest
Power Consumption external Monitor
Vida útil da bateria - Pobre em todas as configurações
Os tempos de execução são tão ruins que suspeitamos que possa haver um bug de software com nossa configuração ou modelo como um todo. Só somos capazes de espremer apenas 2,5 horas de vida útil da bateria quando simplesmente ociosos no desktop na configuração de brilho mais baixa com o iGPU ativo e WLAN desativado. Repetimos o teste apenas para ter certeza e os resultados não iriam melhorar. O Gerente de Tarefas também não mostraria nenhuma aplicação em particular sendo um porco de recursos. O concorrente Dell G5 ouMSI Bravo 15 pode durar várias horas mais, apesar de ter baterias internas menores
A carga de vazio a cheio leva entre 1,5 a 2 horas. O sistema não pode ser recarregado via USB-C.
| HP Victus 15 fa0020nr i7-12700H, GeForce RTX 3050 Ti Laptop GPU, 70 Wh | HP Omen 15-en0375ng R7 4800H, GeForce RTX 2060 Mobile, 70.9 Wh | Dell G15 5515 R7 5800H, GeForce RTX 3050 Ti Laptop GPU, 56 Wh | Asus TUF Dash F15 FX517ZC i7-12650H, GeForce RTX 3050 4GB Laptop GPU, 76 Wh | MSI Bravo 15 B5DD-010US R5 5600H, Radeon RX 5500M, 53 Wh | Lenovo Legion 5 15IAH7H 82RB i7-12700H, GeForce RTX 3060 Laptop GPU, 80 Wh | |
|---|---|---|---|---|---|---|
| Duração da bateria | 378% | 245% | 90% | 148% | 117% | |
| Reader / Idle (h) | 2.6 | 20 669% | 13.5 419% | 9.2 254% | 8.1 212% | |
| WiFi v1.3 (h) | 2.1 | 10.5 400% | 8 281% | 4 90% | 6.3 200% | 5 138% |
| Load (h) | 1.1 | 1.8 64% | 1.5 36% | 1 -9% | 1.1 0% | |
| H.264 (h) | 8.8 |
Pro
Contra
Veredicto - Preço e Buggy
Por US$1200 a US$1300, a HP Victus 15 não oferece o suficiente para sua faixa de preço. A Lenovo concorrente Legion 5 15 está atualmente disponível com o CPU AMD Ryzen 6800H e muito mais rápido GeForce RTX 3060 GPU por $1280 USD, o que envergonha nosso modelo HP. Para que nosso modelo HP seja competitivo, ele teria que ser vendido a varejo por US$ 1000 ou menos, especialmente porque o GeForce RTX 3050 Ti tem um desempenho tão semelhante ao antigo RTX 2060 e GTX 1660 Ti.
O HP Victus 15 teria sido um sólido laptop para jogos se tivesse sido vendido por US$ 1.000 ou menos. Por US$ 1200 ou mais, no entanto, sua GPU GeForce RTX 3050 Ti simplesmente não o corta quando as alternativas RTX 3060 estão disponíveis
.
Além disso, os bugs notáveis amorteceram nossa experiência geral mesmo após a atualização para os últimos drivers e versões de software da HP no momento da publicação. É mais fácil perdoar pequenos bugs aqui e ali, mas aspectos cruciais como a vida útil da bateria e o ruído dos ventiladores devem ser isentos de problemas fora da caixa.
Há algumas coisas que o Victus 15 acerta. Seu projeto geral é visualmente atraente, por exemplo, enquanto as atualizações de SSD e RAM são relativamente simples. O numpad de tamanho normal é ótimo e as temperaturas centrais são bem baixas. No entanto, o baixo desempenho por dólar e os bugs prejudicam muito um sistema que de outra forma seria atraente.
Preço e Disponibilidade
HP Victus 15 fa0020nr
- 12/31/2022 v7 (old)
Allen Ngo
Price comparison

