Breve Análise do Aorus 15G XB: Máquina de jogos de sucesso com teclado mecânico
Avaliação | Data | Modelo | Peso | Altura | Size | Resolução | Preço |
|---|---|---|---|---|---|---|---|
| 86.5 % v7 (old) | 08/2020 | Aorus 15G XB i7-10875H, GeForce RTX 2070 Super Max-Q | 2.3 kg | 25 mm | 15.60" | 1920x1080 | |
| 84.4 % v7 (old) | 07/2020 | Asus ROG Strix Scar 15 G532LWS i9-10980HK, GeForce RTX 2070 Super Mobile | 2.4 kg | 24.9 mm | 15.60" | 1920x1080 | |
| 84.8 % v7 (old) | 08/2020 | Alienware m15 R3 P87F i7-10750H, GeForce RTX 2070 Mobile | 2.3 kg | 19.9 mm | 15.60" | 1920x1080 | |
v (old) | 04/2020 | Acer Predator Triton 500 PT515-52-70N3 i7-10750H, GeForce RTX 2080 Super Max-Q | 2.1 kg | 18 mm | 15.60" | 1920x1080 | |
| 86 % v7 (old) | 05/2020 | Razer Blade 15 RZ09-0328 i7-10750H, GeForce RTX 2070 Max-Q | 2.1 kg | 19.9 mm | 15.60" | 3840x2160 | |
| 82.8 % v7 (old) | 12/2019 | Schenker XMG Neo 15 XNE15M19 i7-9750H, GeForce RTX 2070 Max-Q | 2.1 kg | 22 mm | 15.60" | 1920x1080 |
| SD Card Reader | |
| average JPG Copy Test (av. of 3 runs) | |
| Aorus 15G XB (Toshiba Exceria Pro SDXC 64 GB UHS-II) | |
| Alienware m15 R3 P87F (Toshiba Exceria Pro M501 UHS-II) | |
| Média da turma Gaming (20.9 - 210, n=54, últimos 2 anos) | |
| maximum AS SSD Seq Read Test (1GB) | |
| Aorus 15G XB (Toshiba Exceria Pro SDXC 64 GB UHS-II) | |
| Alienware m15 R3 P87F (Toshiba Exceria Pro M501 UHS-II) | |
| Média da turma Gaming (25.5 - 261, n=51, últimos 2 anos) | |


")
")
| |||||||||||||||||||||||||
iluminação: 89 %
iluminação com acumulador: 264 cd/m²
Contraste: 880:1 (Preto: 0.3 cd/m²)
ΔE ColorChecker Calman: 1.21 | ∀{0.5-29.43 Ø4.71}
calibrated: 0.92
ΔE Greyscale Calman: 1.6 | ∀{0.09-98 Ø4.96}
90% sRGB (Argyll 1.6.3 3D)
68% AdobeRGB 1998 (Argyll 1.6.3 3D)
68% AdobeRGB 1998 (Argyll 3D)
97.8% sRGB (Argyll 3D)
67.2% Display P3 (Argyll 3D)
Gamma: 2.192
CCT: 6340 K
| Aorus 15G XB Sharp LQ156M1JW03, IGZO, 1920x1080, 15.6" | Asus ROG Strix Scar 15 G532LWS AU Optronics B156HAN12.0, IPS, 1920x1080, 15.6" | Alienware m15 R3 P87F AU Optronics B156HAN, IPS, 1920x1080, 15.6" | Acer Predator Triton 500 PT515-52-70N3 AUO B156HAN12.0 (AUO7A8C), IPS, 1920x1080, 15.6" | Razer Blade 15 RZ09-0328 Samsung SDCA029, AMOLED, 3840x2160, 15.6" | Schenker XMG Neo 15 XNE15M19 NV156FHM-N4G (BOE084D), IPS, 1920x1080, 15.6" | |
|---|---|---|---|---|---|---|
| Display | 4% | 2% | 4% | 31% | -6% | |
| Display P3 Coverage (%) | 67.2 | 69.9 4% | 68.6 2% | 70.3 5% | 99.9 49% | 64 -5% |
| sRGB Coverage (%) | 97.8 | 99.6 2% | 98.9 1% | 99.5 2% | 100 2% | 90.3 -8% |
| AdobeRGB 1998 Coverage (%) | 68 | 71.4 5% | 69.8 3% | 72.2 6% | 97.4 43% | 65.4 -4% |
| Response Times | 14% | 40% | 9% | 80% | 17% | |
| Response Time Grey 50% / Grey 80% * (ms) | 16 ? | 14.4 ? 10% | 4 ? 75% | 14.4 ? 10% | 2.7 ? 83% | 9.6 ? 40% |
| Response Time Black / White * (ms) | 11.2 ? | 9.2 ? 18% | 10.8 ? 4% | 10.4 ? 7% | 2.6 ? 77% | 12 ? -7% |
| PWM Frequency (Hz) | 23580 ? | 59.5 ? | ||||
| Screen | -0% | -28% | -51% | -48% | -38% | |
| Brightness middle (cd/m²) | 264 | 307.2 16% | 326.7 24% | 320 21% | 366.7 39% | 313 19% |
| Brightness (cd/m²) | 248 | 301 21% | 316 27% | 318 28% | 371 50% | 295 19% |
| Brightness Distribution (%) | 89 | 91 2% | 87 -2% | 88 -1% | 91 2% | 89 0% |
| Black Level * (cd/m²) | 0.3 | 0.21 30% | 0.33 -10% | 0.24 20% | 0.3 -0% | |
| Contrast (:1) | 880 | 1463 66% | 990 13% | 1333 51% | 1043 19% | |
| Colorchecker dE 2000 * | 1.21 | 1.85 -53% | 2.4 -98% | 4.03 -233% | 5.21 -331% | 3.33 -175% |
| Colorchecker dE 2000 max. * | 3.07 | 3.92 -28% | 6.06 -97% | 8.43 -175% | 7.92 -158% | 6.25 -104% |
| Colorchecker dE 2000 calibrated * | 0.92 | 1.26 -37% | 1.51 -64% | 0.98 -7% | 1.77 -92% | |
| Greyscale dE 2000 * | 1.6 | 2 -25% | 3.2 -100% | 5.94 -271% | 2 -25% | 3.1 -94% |
| Gamma | 2.192 100% | 2.15 102% | 2.13 103% | 2.42 91% | 2.17 101% | 2.51 88% |
| CCT | 6340 103% | 6479 100% | 7129 91% | 6751 96% | 6514 100% | 6930 94% |
| Color Space (Percent of AdobeRGB 1998) (%) | 68 | 65 -4% | 63.7 -6% | 66 -3% | 86.6 27% | 59 -13% |
| Color Space (Percent of sRGB) (%) | 90 | 99.7 11% | 99.2 10% | 99 10% | 100 11% | 90 0% |
| Média Total (Programa/Configurações) | 6% /
2% | 5% /
-14% | -13% /
-33% | 21% /
-10% | -9% /
-25% |
* ... menor é melhor
Exibir tempos de resposta
| ↔ Tempo de resposta preto para branco | ||
|---|---|---|
| 11.2 ms ... ascensão ↗ e queda ↘ combinadas | ↗ 6.8 ms ascensão | 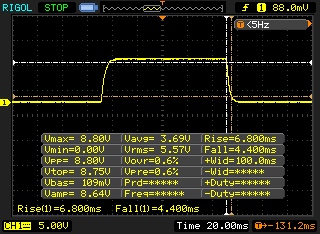 |
| ↘ 4.4 ms queda | ||
| A tela mostra boas taxas de resposta em nossos testes, mas pode ser muito lenta para jogadores competitivos. Em comparação, todos os dispositivos testados variam de 0.1 (mínimo) a 240 (máximo) ms. » 30 % de todos os dispositivos são melhores. Isso significa que o tempo de resposta medido é melhor que a média de todos os dispositivos testados (19.8 ms). | ||
| ↔ Tempo de resposta 50% cinza a 80% cinza | ||
| 16 ms ... ascensão ↗ e queda ↘ combinadas | ↗ 8.4 ms ascensão | 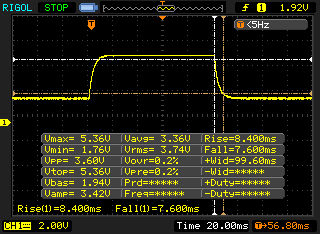 |
| ↘ 7.6 ms queda | ||
| A tela mostra boas taxas de resposta em nossos testes, mas pode ser muito lenta para jogadores competitivos. Em comparação, todos os dispositivos testados variam de 0.165 (mínimo) a 636 (máximo) ms. » 30 % de todos os dispositivos são melhores. Isso significa que o tempo de resposta medido é melhor que a média de todos os dispositivos testados (31 ms). | ||
Cintilação da tela / PWM (modulação por largura de pulso)
| Tela tremeluzindo/PWM detectado | 23580 Hz | ≤ 24 % configuração de brilho | 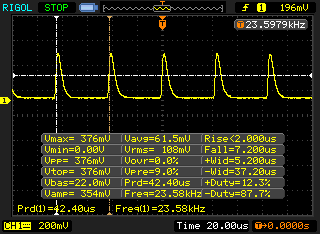 |
A luz de fundo da tela pisca em 23580 Hz (pior caso, por exemplo, utilizando PWM) Cintilação detectada em uma configuração de brilho de 24 % e abaixo. Não deve haver cintilação ou PWM acima desta configuração de brilho. A frequência de 23580 Hz é bastante alta, então a maioria dos usuários sensíveis ao PWM não deve notar nenhuma oscilação. [pwm_comparison] Em comparação: 52 % de todos os dispositivos testados não usam PWM para escurecer a tela. Se PWM foi detectado, uma média de 7754 (mínimo: 5 - máximo: 343500) Hz foi medida. | |||

| R Benchmark 2.5 - Overall mean | |
| Alienware m15 R3 P87F | |
| Acer Predator Triton 500 PT515-52-70N3 | |
| Aorus 15G XB | |
| Asus ROG Strix Scar 15 G532LWS | |
| Média da turma Gaming (0.3439 - 0.759, n=106, últimos 2 anos) | |
* ... menor é melhor
| PCMark 8 Home Score Accelerated v2 | 4719 pontos | |
| PCMark 8 Creative Score Accelerated v2 | 4518 pontos | |
| PCMark 8 Work Score Accelerated v2 | 6081 pontos | |
| PCMark 10 Score | 5393 pontos | |
Ajuda | ||
| PCMark 8 | |
| Home Score Accelerated v2 | |
| Alienware m15 R3 P87F | |
| Média da turma Gaming (n=1últimos 2 anos) | |
| Asus ROG Strix Scar 15 G532LWS | |
| Aorus 15G XB | |
| Razer Blade 15 RZ09-0328 | |
| Work Score Accelerated v2 | |
| Asus ROG Strix Scar 15 G532LWS | |
| Alienware m15 R3 P87F | |
| Aorus 15G XB | |
| Razer Blade 15 RZ09-0328 | |
| Média da turma Gaming (n=1últimos 2 anos) | |
| DPC Latencies / LatencyMon - interrupt to process latency (max), Web, Youtube, Prime95 | |
| Acer Predator Triton 500 PT515-52-70N3 | |
| Aorus 15G XB | |
| Asus ROG Strix Scar 15 G532LWS | |
| Alienware m15 R3 P87F | |
| Razer Blade 15 RZ09-0328 | |
* ... menor é melhor

| Aorus 15G XB Samsung SSD PM981a MZVLB512HBJQ | Asus ROG Strix Scar 15 G532LWS 2x Intel SSD 660p 1TB SSDPEKNW010T8 (RAID 0) | Alienware m15 R3 P87F 2x Micron 2200S 512 GB (RAID 0) | Acer Predator Triton 500 PT515-52-70N3 Samsung SSD PM981a MZVLB512HBJQ | Razer Blade 15 RZ09-0328 Lite-On CA5-8D512 | Schenker XMG Neo 15 XNE15M19 Seagate FireCuda 510 SSD ZP1000GM30001 | |
|---|---|---|---|---|---|---|
| CrystalDiskMark 5.2 / 6 | 4% | -3% | 9% | 6% | -14% | |
| Write 4K (MB/s) | 121.6 | 128.4 6% | 67.3 -45% | 131.7 8% | 118.7 -2% | 108.7 -11% |
| Read 4K (MB/s) | 44.37 | 53.7 21% | 41.47 -7% | 47.34 7% | 52.4 18% | 41.4 -7% |
| Write Seq (MB/s) | 2617 | 1875 -28% | 2239 -14% | 2884 10% | 2247 -14% | 1083 -59% |
| Read Seq (MB/s) | 1297 | 2315 78% | 2112 63% | 2303 78% | 2234 72% | 917 -29% |
| Write 4K Q32T1 (MB/s) | 499 | 427.2 -14% | 488.9 -2% | 423.9 -15% | 515 3% | 468.5 -6% |
| Read 4K Q32T1 (MB/s) | 557 | 440.7 -21% | 557 0% | 487.7 -12% | 584 5% | 530 -5% |
| Write Seq Q32T1 (MB/s) | 2978 | 2793 -6% | 2654 -11% | 2822 -5% | 2235 -25% | 3057 3% |
| Read Seq Q32T1 (MB/s) | 3360 | 3101 -8% | 3137 -7% | 3478 4% | 3171 -6% | 3422 2% |
| AS SSD | -8% | -78% | 2% | -23% | 15% | |
| Seq Read (MB/s) | 1795 | 1982 10% | 2058 15% | 2767 54% | 2021 13% | 2341 30% |
| Seq Write (MB/s) | 2724 | 1444 -47% | 2316 -15% | 2613 -4% | 2090 -23% | 2575 -5% |
| 4K Read (MB/s) | 49.67 | 50.3 1% | 39.72 -20% | 47.55 -4% | 47.71 -4% | 51 3% |
| 4K Write (MB/s) | 109.3 | 120.1 10% | 62.9 -42% | 98.9 -10% | 101.1 -8% | 118.6 9% |
| 4K-64 Read (MB/s) | 1284 | 1016 -21% | 1334 4% | 1205 -6% | 856 -33% | 1637 27% |
| 4K-64 Write (MB/s) | 1962 | 1351 -31% | 1271 -35% | 2007 2% | 1041 -47% | 2442 24% |
| Access Time Read * (ms) | 0.063 | 0.044 30% | 0.062 2% | 0.065 -3% | 0.052 17% | 0.066 -5% |
| Access Time Write * (ms) | 0.034 | 0.109 -221% | 0.388 -1041% | 0.038 -12% | 0.111 -226% | 0.028 18% |
| Score Read (Points) | 1513 | 1264 -16% | 1580 4% | 1529 1% | 1105 -27% | 1922 27% |
| Score Write (Points) | 2344 | 1615 -31% | 1565 -33% | 2367 1% | 1351 -42% | 2818 20% |
| Score Total (Points) | 4685 | 3510 -25% | 3968 -15% | 4677 0% | 3037 -35% | 5738 22% |
| Copy ISO MB/s (MB/s) | 1533 | 3474 127% | 1685 10% | 2474 61% | ||
| Copy Program MB/s (MB/s) | 528 | 751 42% | 669 27% | 679 29% | ||
| Copy Game MB/s (MB/s) | 1042 | 1684 62% | 1493 43% | 1037 0% | ||
| Média Total (Programa/Configurações) | -2% /
-4% | -41% /
-51% | 6% /
5% | -9% /
-12% | 1% /
3% |
* ... menor é melhor
Continuous load read: DiskSpd Read Loop, Queue Depth 8
| 3DMark 11 Performance | 23892 pontos | |
| 3DMark Cloud Gate Standard Score | 49906 pontos | |
| 3DMark Fire Strike Score | 18883 pontos | |
| 3DMark Time Spy Score | 7590 pontos | |
Ajuda | ||
| The Witcher 3 - 1920x1080 Ultra Graphics & Postprocessing (HBAO+) | |
| Média da turma Gaming (104.7 - 240, n=7, últimos 2 anos) | |
| Asus ROG Strix Scar 15 G532LWS | |
| Acer Predator Triton 500 PT515-52-70N3 | |
| Alienware m15 R3 P87F | |
| Aorus 15G XB | |
| Razer Blade 15 RZ09-0328 | |
| Schenker XMG Neo 15 XNE15M19 | |
| BioShock Infinite - 1920x1080 Ultra Preset, DX11 (DDOF) | |
| Aorus 15G XB | |
| Shadow of the Tomb Raider - 1920x1080 Highest Preset AA:T | |
| Média da turma Gaming (96 - 116, n=2, últimos 2 anos) | |
| Asus ROG Strix Scar 15 G532LWS | |
| Acer Predator Triton 500 PT515-52-70N3 | |
| Aorus 15G XB | |
| Alienware m15 R3 P87F | |
| Razer Blade 15 RZ09-0328 | |
| Call of Duty Modern Warfare 2019 - 1920x1080 Maximum Settings AA:T2X Filmic SM | |
| Acer Predator Triton 500 PT515-52-70N3 | |
| Aorus 15G XB | |
| Schenker XMG Neo 15 XNE15M19 | |
| Doom Eternal - 1920x1080 Ultra Preset | |
| Acer Predator Triton 500 PT515-52-70N3 | |
| Aorus 15G XB | |
| Red Dead Redemption 2 - 1920x1080 Maximum Settings | |
| Acer Predator Triton 500 PT515-52-70N3 | |
| Aorus 15G XB | |
| baixo | média | alto | ultra | |
|---|---|---|---|---|
| BioShock Infinite (2013) | 420.2 | 359.5 | 329.8 | 166.5 |
| The Witcher 3 (2015) | 323.7 | 232 | 136.2 | 75.5 |
| Shadow of the Tomb Raider (2018) | 133 | 112 | 106 | 96 |
| Total War: Three Kingdoms (2019) | 255.2 | 122.8 | 77.6 | 54.8 |
| Call of Duty Modern Warfare 2019 (2019) | 160.9 | 116.2 | 97.8 | 84.2 |
| Star Wars Jedi Fallen Order (2019) | 108 | 98.2 | 92.1 | |
| Red Dead Redemption 2 (2019) | 132.8 | 86.6 | 60.2 | 39.4 |
| Doom Eternal (2020) | 232.3 | 152 | 135.1 | 130.2 |
| Gears Tactics (2020) | 272.4 | 165.8 | 109.2 | 79 |
| F1 2020 (2020) | 258 | 163 | 145 | 104 |
| Death Stranding (2020) | 164.3 | 114.5 | 104.3 | 101.8 |
Barulho
| Ocioso |
| 32 / 34 / 38 dB |
| Carga |
| 48 / 54 dB |
 | ||
30 dB silencioso 40 dB(A) audível 50 dB(A) ruidosamente alto |
||
min: | ||
| Aorus 15G XB i7-10875H, GeForce RTX 2070 Super Max-Q | Asus ROG Strix Scar 15 G532LWS i9-10980HK, GeForce RTX 2070 Super Mobile | Alienware m15 R3 P87F i7-10750H, GeForce RTX 2070 Mobile | Acer Predator Triton 500 PT515-52-70N3 i7-10750H, GeForce RTX 2080 Super Max-Q | Razer Blade 15 RZ09-0328 i7-10750H, GeForce RTX 2070 Max-Q | Schenker XMG Neo 15 XNE15M19 i7-9750H, GeForce RTX 2070 Max-Q | Média da turma Gaming | |
|---|---|---|---|---|---|---|---|
| Noise | -1% | 8% | 0% | 6% | -2% | 12% | |
| desligado / ambiente * (dB) | 25 | 26.5 -6% | 26.3 -5% | 30 -20% | 28.4 -14% | 31 -24% | 24.1 ? 4% |
| Idle Minimum * (dB) | 32 | 27.1 15% | 26.7 17% | 30 6% | 28.4 11% | 31 3% | 26 ? 19% |
| Idle Average * (dB) | 34 | 32.2 5% | 26.7 21% | 33 3% | 28.4 16% | 34 -0% | 27.4 ? 19% |
| Idle Maximum * (dB) | 38 | 34 11% | 30.7 19% | 36 5% | 31.7 17% | 37 3% | 30.1 ? 21% |
| Load Average * (dB) | 48 | 52.4 -9% | 40.2 16% | 50 -4% | 47.7 1% | 47 2% | 43.6 ? 9% |
| Witcher 3 ultra * (dB) | 50 | 57.5 -15% | 51 -2% | 48 4% | 47.5 5% | 50 -0% | |
| Load Maximum * (dB) | 54 | 57.5 -6% | 59.7 -11% | 50 7% | 49.5 8% | 54 -0% | 54.2 ? -0% |
* ... menor é melhor
(±) A temperatura máxima no lado superior é 44 °C / 111 F, em comparação com a média de 40.4 °C / 105 F , variando de 21.2 a 68.8 °C para a classe Gaming.
(-) A parte inferior aquece até um máximo de 63 °C / 145 F, em comparação com a média de 43.2 °C / 110 F
(+) Em uso inativo, a temperatura média para o lado superior é 26.1 °C / 79 F, em comparação com a média do dispositivo de 33.9 °C / ### class_avg_f### F.
(±) Jogando The Witcher 3, a temperatura média para o lado superior é 34.4 °C / 94 F, em comparação com a média do dispositivo de 33.9 °C / ## #class_avg_f### F.
(+) Os apoios para as mãos e o touchpad são mais frios que a temperatura da pele, com um máximo de 29 °C / 84.2 F e, portanto, são frios ao toque.
(±) A temperatura média da área do apoio para as mãos de dispositivos semelhantes foi 28.8 °C / 83.8 F (-0.2 °C / -0.4 F).
| Aorus 15G XB i7-10875H, GeForce RTX 2070 Super Max-Q | Asus ROG Strix Scar 15 G532LWS i9-10980HK, GeForce RTX 2070 Super Mobile | Alienware m15 R3 P87F i7-10750H, GeForce RTX 2070 Mobile | Acer Predator Triton 500 PT515-52-70N3 i7-10750H, GeForce RTX 2080 Super Max-Q | Razer Blade 15 RZ09-0328 i7-10750H, GeForce RTX 2070 Max-Q | Schenker XMG Neo 15 XNE15M19 i7-9750H, GeForce RTX 2070 Max-Q | Média da turma Gaming | |
|---|---|---|---|---|---|---|---|
| Heat | -5% | -33% | 2% | -8% | -16% | -3% | |
| Maximum Upper Side * (°C) | 44 | 46.2 -5% | 55.8 -27% | 44 -0% | 49.6 -13% | 60 -36% | 45.2 ? -3% |
| Maximum Bottom * (°C) | 63 | 55.2 12% | 62 2% | 50 21% | 50.2 20% | 66 -5% | 48.1 ? 24% |
| Idle Upper Side * (°C) | 27 | 31.4 -16% | 43.4 -61% | 29 -7% | 32.2 -19% | 30 -11% | 31 ? -15% |
| Idle Bottom * (°C) | 29 | 32.2 -11% | 42 -45% | 31 -7% | 34.6 -19% | 32 -10% | 34.2 ? -18% |
* ... menor é melhor
Aorus 15G XB análise de áudio
(+) | os alto-falantes podem tocar relativamente alto (###valor### dB)
Graves 100 - 315Hz
(-) | quase nenhum baixo - em média 22.8% menor que a mediana
(±) | a linearidade dos graves é média (13.4% delta para a frequência anterior)
Médios 400 - 2.000 Hz
(±) | médios mais altos - em média 6.8% maior que a mediana
(+) | médios são lineares (6.4% delta para frequência anterior)
Altos 2 - 16 kHz
(+) | agudos equilibrados - apenas 1.7% longe da mediana
(+) | os máximos são lineares (5.3% delta da frequência anterior)
Geral 100 - 16.000 Hz
(±) | a linearidade do som geral é média (18.4% diferença em relação à mediana)
Comparado com a mesma classe
» 59% de todos os dispositivos testados nesta classe foram melhores, 9% semelhantes, 32% piores
» O melhor teve um delta de 6%, a média foi 18%, o pior foi 132%
Comparado com todos os dispositivos testados
» 41% de todos os dispositivos testados foram melhores, 8% semelhantes, 51% piores
» O melhor teve um delta de 4%, a média foi 23%, o pior foi 134%
| desligado | |
| Ocioso | |
| Carga |
|
Key:
min: | |
| Aorus 15G XB i7-10875H, GeForce RTX 2070 Super Max-Q | Asus ROG Strix Scar 15 G532LWS i9-10980HK, GeForce RTX 2070 Super Mobile | Alienware m15 R3 P87F i7-10750H, GeForce RTX 2070 Mobile | Acer Predator Triton 500 PT515-52-70N3 i7-10750H, GeForce RTX 2080 Super Max-Q | Razer Blade 15 RZ09-0328 i7-10750H, GeForce RTX 2070 Max-Q | Schenker XMG Neo 15 XNE15M19 i7-9750H, GeForce RTX 2070 Max-Q | Média da turma Gaming | |
|---|---|---|---|---|---|---|---|
| Power Consumption | 2% | -69% | 18% | 11% | 22% | 6% | |
| Idle Minimum * (Watt) | 16 | 8 50% | 34 -113% | 11 31% | 11.1 31% | 11 31% | 13 ? 19% |
| Idle Average * (Watt) | 20 | 9.8 51% | 48.6 -143% | 15 25% | 13.7 31% | 15 25% | 19 ? 5% |
| Idle Maximum * (Watt) | 30 | 25.8 14% | 58.2 -94% | 25 17% | 33.4 -11% | 21 30% | 24.6 ? 18% |
| Load Average * (Watt) | 102 | 169 -66% | 129.4 -27% | 95 7% | 104.4 -2% | 94 8% | 110.7 ? -9% |
| Witcher 3 ultra * (Watt) | 156 | 201 -29% | 214.5 -38% | 140 10% | 159.9 -3% | 143 8% | |
| Load Maximum * (Watt) | 256 | 271.6 -6% | 257.3 -1% | 211 18% | 203.8 20% | 173 32% | 259 ? -1% |
* ... menor é melhor
| Aorus 15G XB i7-10875H, GeForce RTX 2070 Super Max-Q, 94 Wh | Asus ROG Strix Scar 15 G532LWS i9-10980HK, GeForce RTX 2070 Super Mobile, 66 Wh | Alienware m15 R3 P87F i7-10750H, GeForce RTX 2070 Mobile, 86 Wh | Acer Predator Triton 500 PT515-52-70N3 i7-10750H, GeForce RTX 2080 Super Max-Q, 84 Wh | Razer Blade 15 RZ09-0328 i7-10750H, GeForce RTX 2070 Max-Q, 65 Wh | Schenker XMG Neo 15 XNE15M19 i7-9750H, GeForce RTX 2070 Max-Q, 62 Wh | Média da turma Gaming | |
|---|---|---|---|---|---|---|---|
| Duração da bateria | -29% | -60% | -24% | -43% | -31% | -11% | |
| Reader / Idle (h) | 9.7 | 8.1 -16% | 5 -48% | 8.3 -14% | 7.3 -25% | 8.27 ? -15% | |
| H.264 (h) | 7.7 | 8.32 ? 8% | |||||
| WiFi v1.3 (h) | 7 | 4.9 -30% | 2.8 -60% | 6.3 -10% | 4 -43% | 5.7 -19% | 7.11 ? 2% |
| Load (h) | 2.5 | 1.5 -40% | 0.7 -72% | 1.3 -48% | 1.3 -48% | 1.502 ? -40% |
Pro
Contra
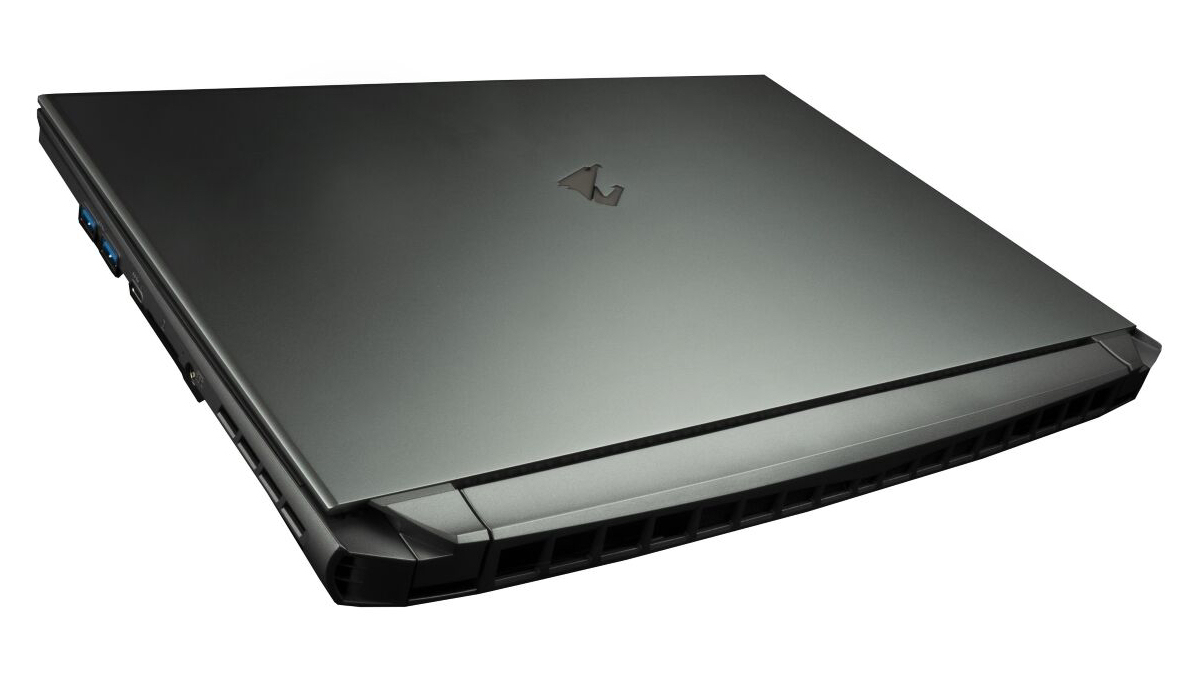
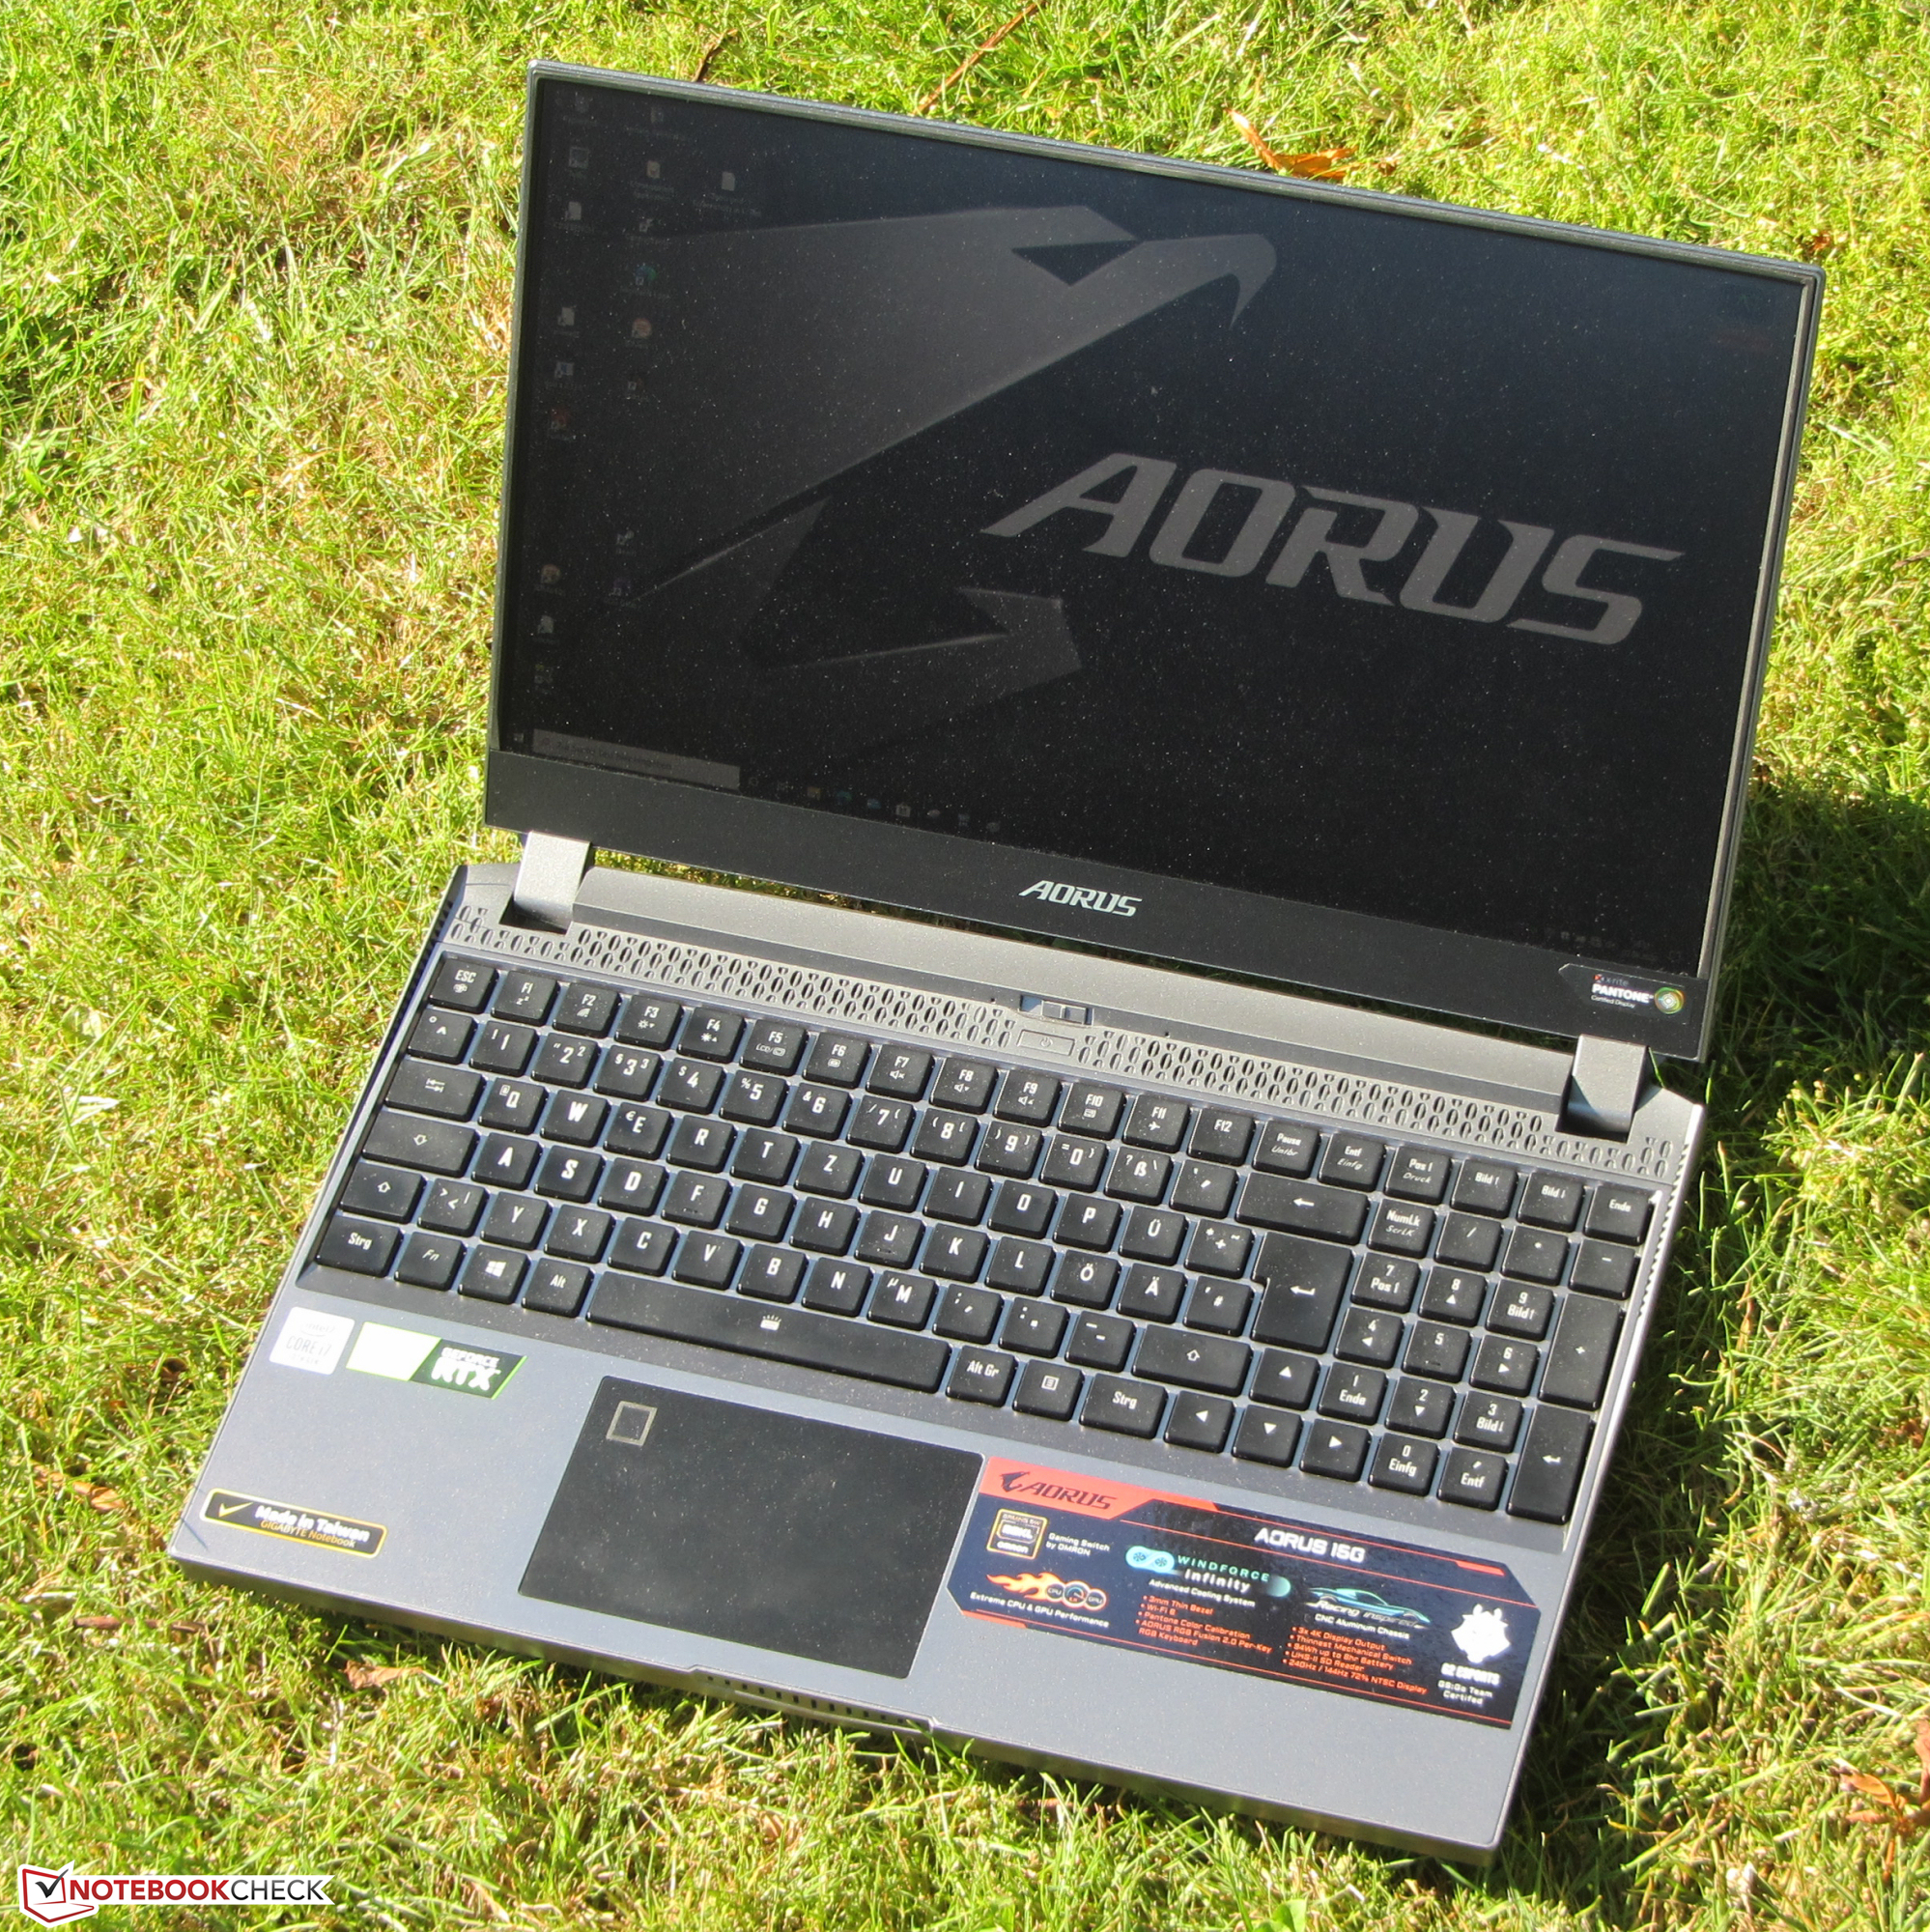
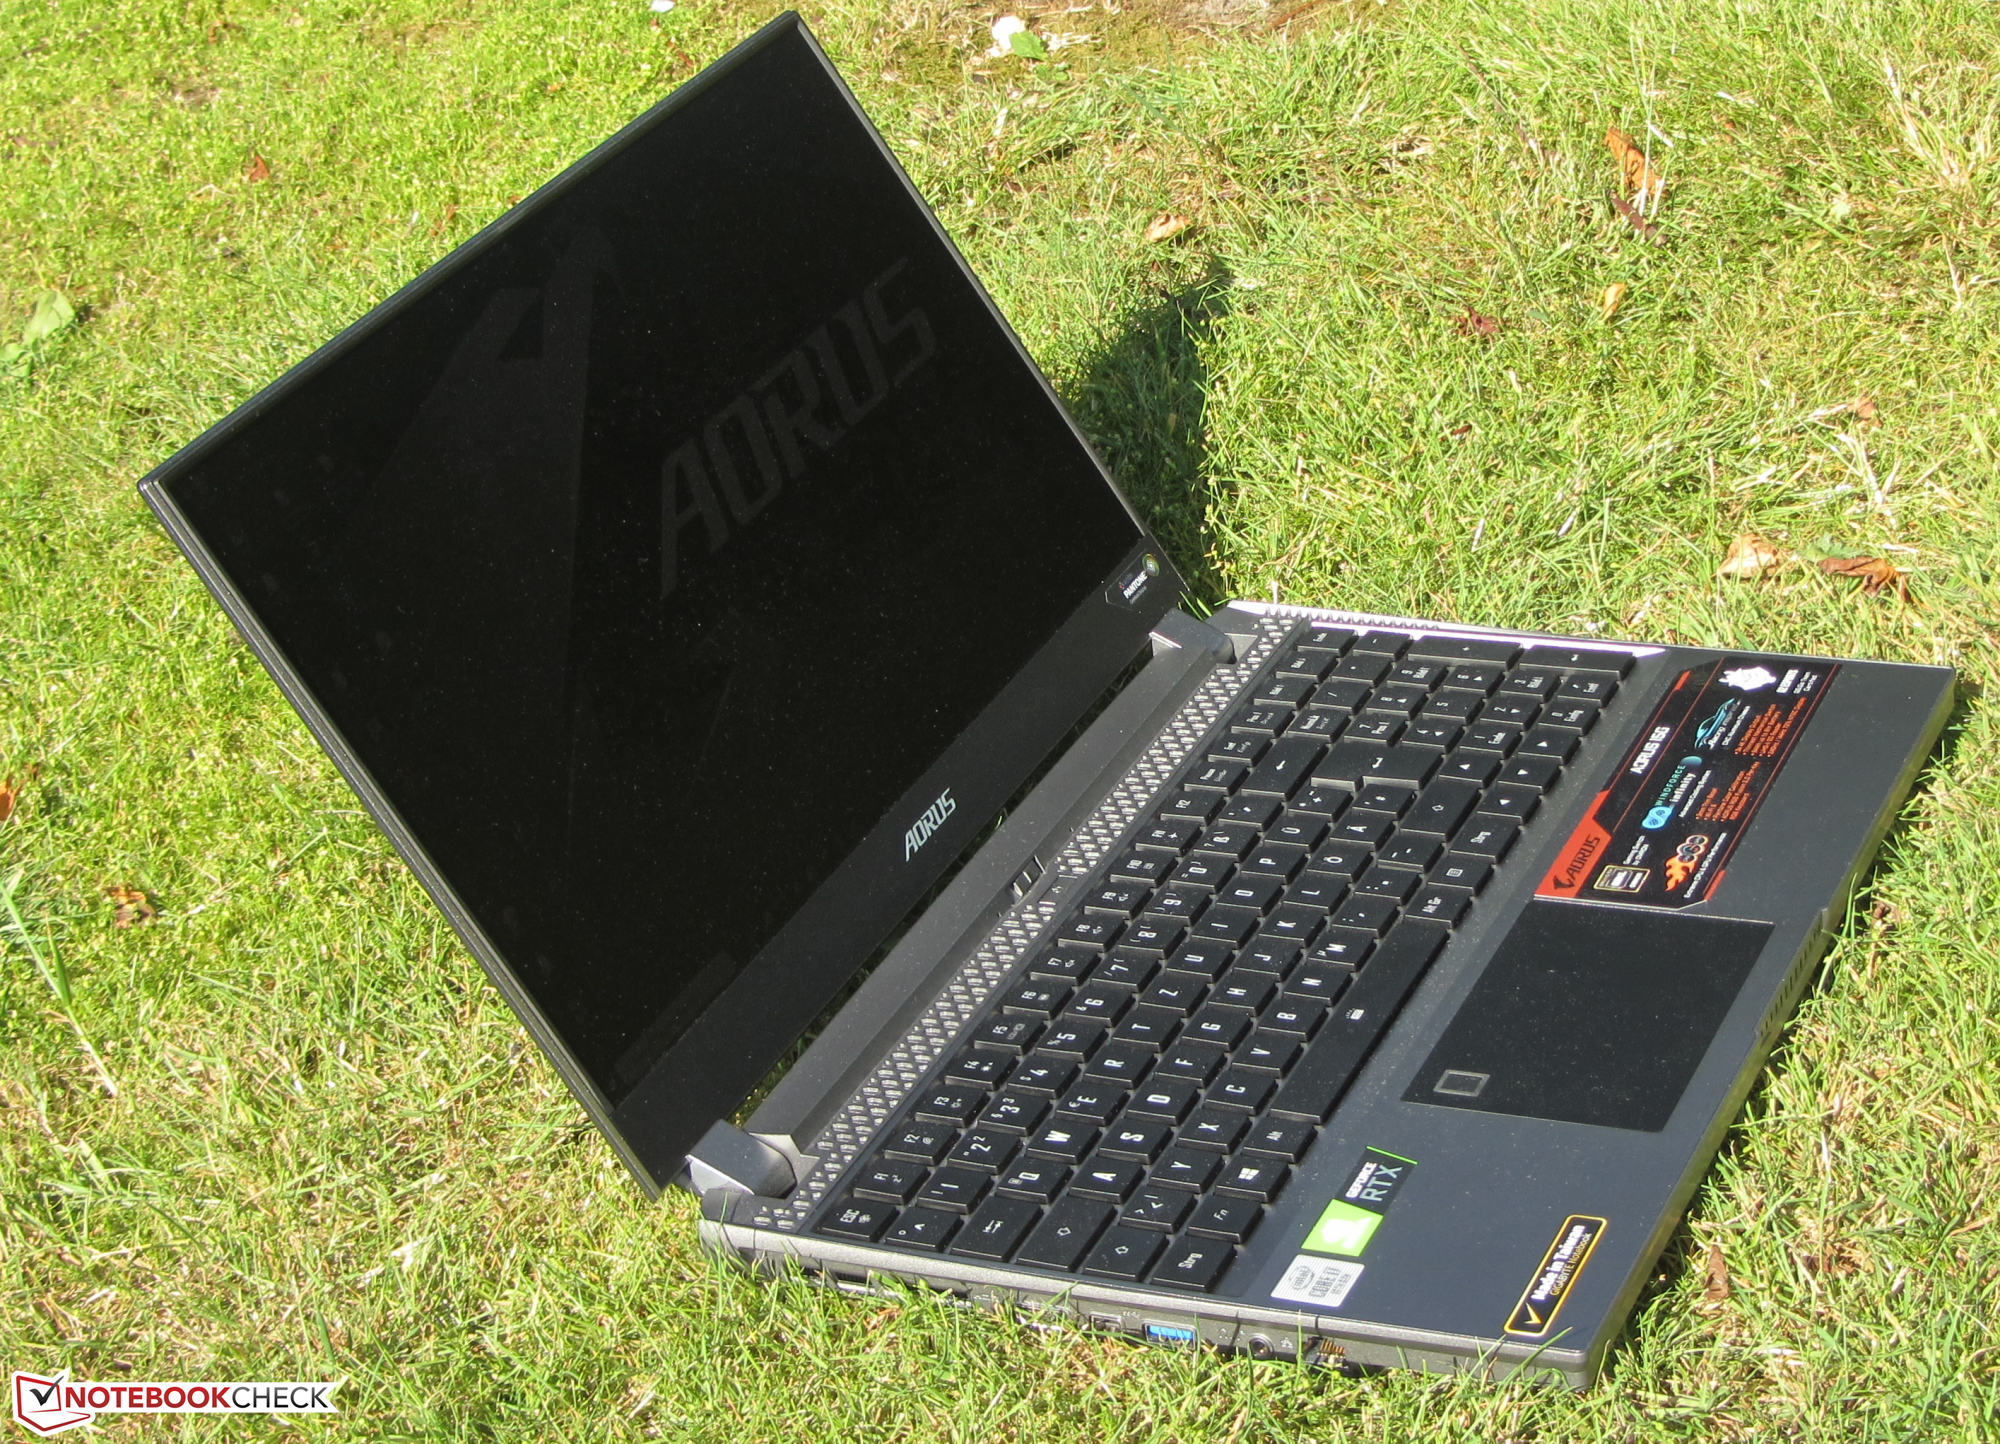
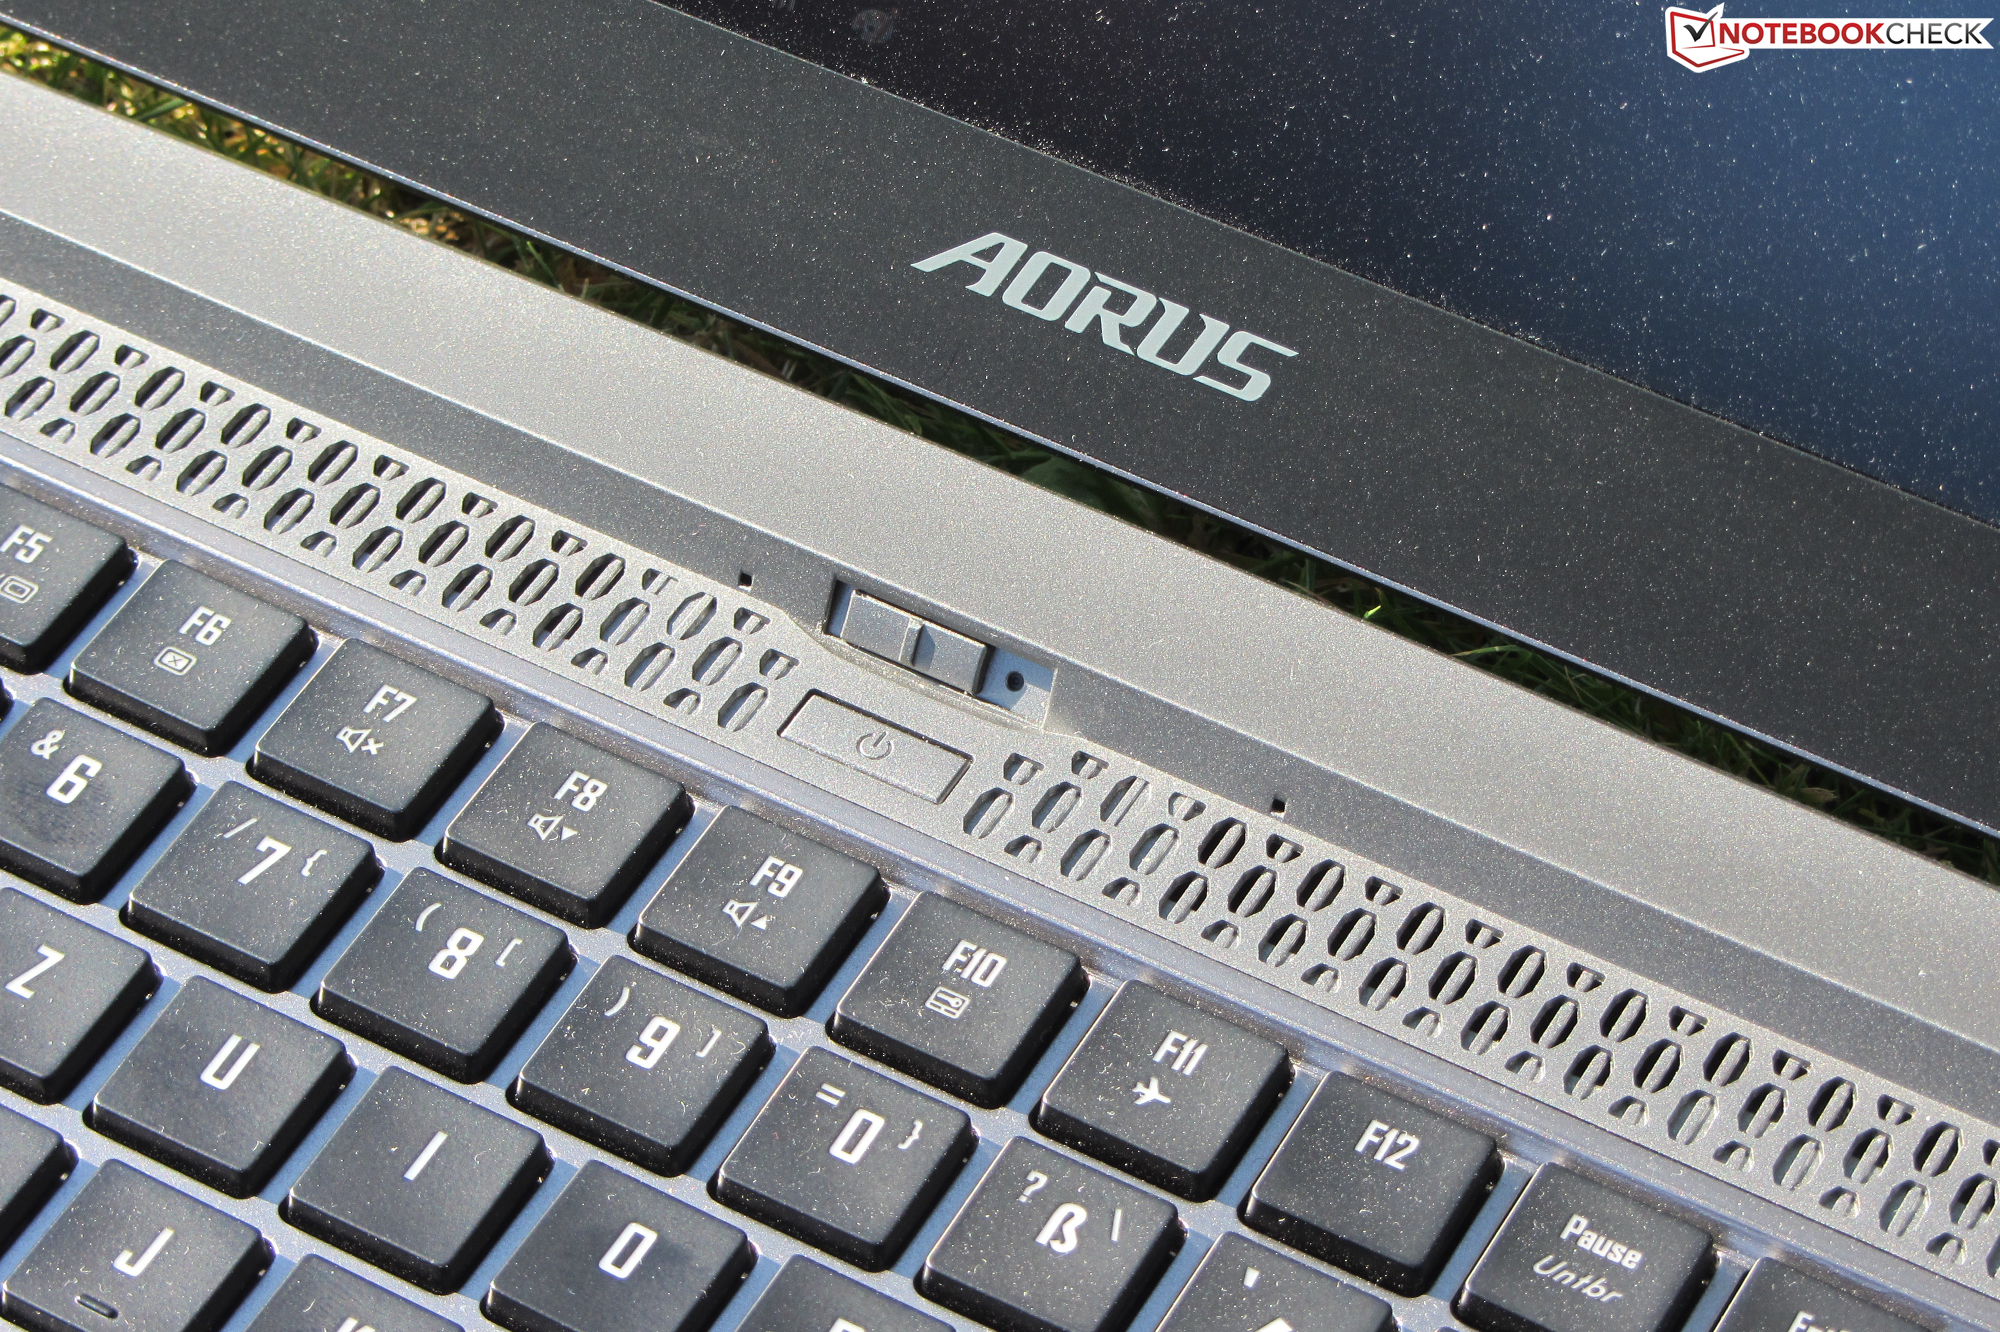
O mais recente lançamento da Gigabyte pode ser considerado um sucesso. A elegante carcaça de metal do Aorus 15G XB deixou uma impressão de alta qualidade tanto visual quanto tátil. Os marcos finos da tela contribuem enormemente para a atratividade do portátil.
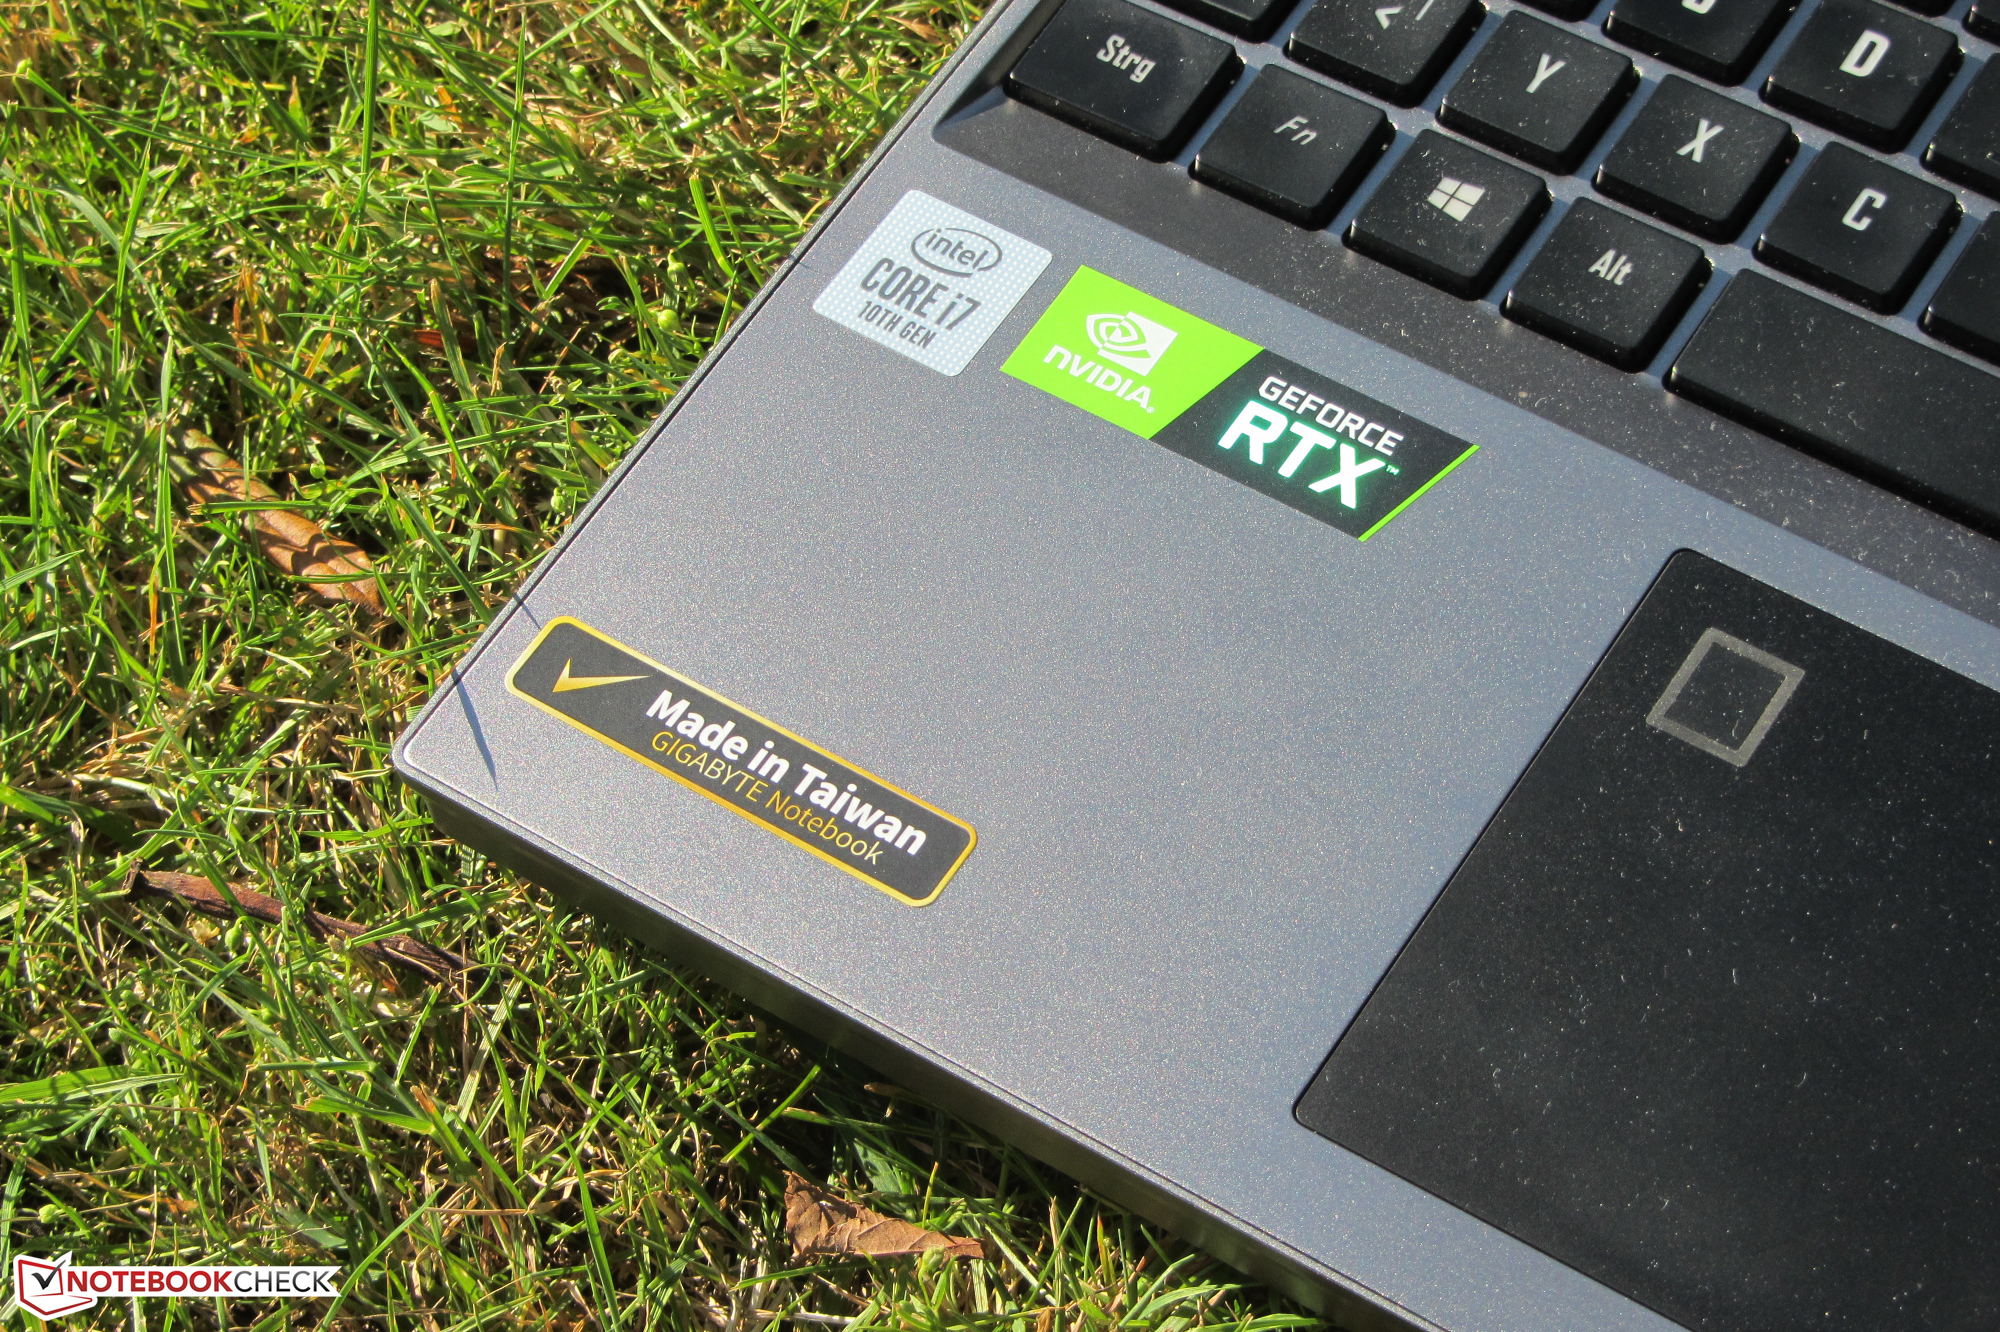
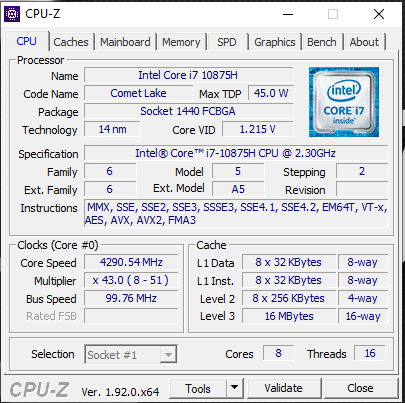
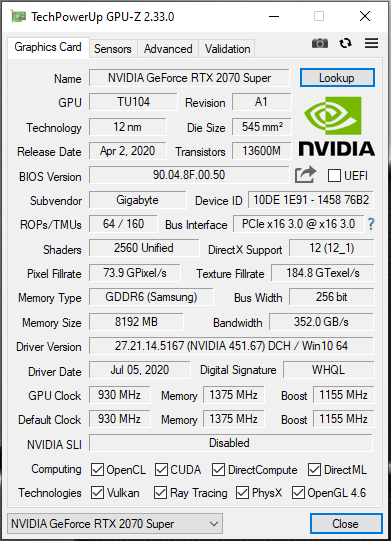
A combinação de um processador Core i7-8550U octa-core e GPU GeForce RTX 2070 Super Max-Q é perfeita. Ele roda todos os jogos de computador modernos sem problemas na tela Full HD, e as configurações de qualidade máxima sempre podem ser selecionadas aqui.
O Aorus 15G XB atende aos requisitos de um poderoso dispositivo para jogos moderno e deve satisfazer muitos jogadores.
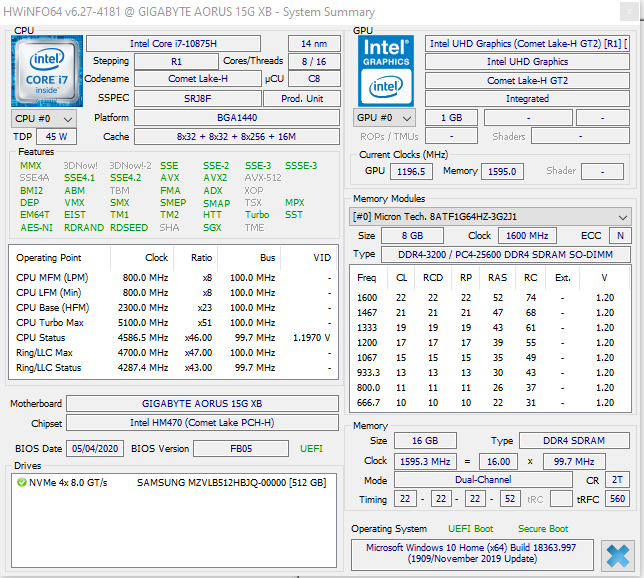
O Core i7 chama a atenção com seu bom desempenho. Os resultados de benchmark alcançados estão entre os melhores que medimos com este processador até agora. No entanto, tudo isto tem um preço: Os ventiladores aumentam bastante sua atividade, e o portátil aquece consideravelmente em algumas partes.
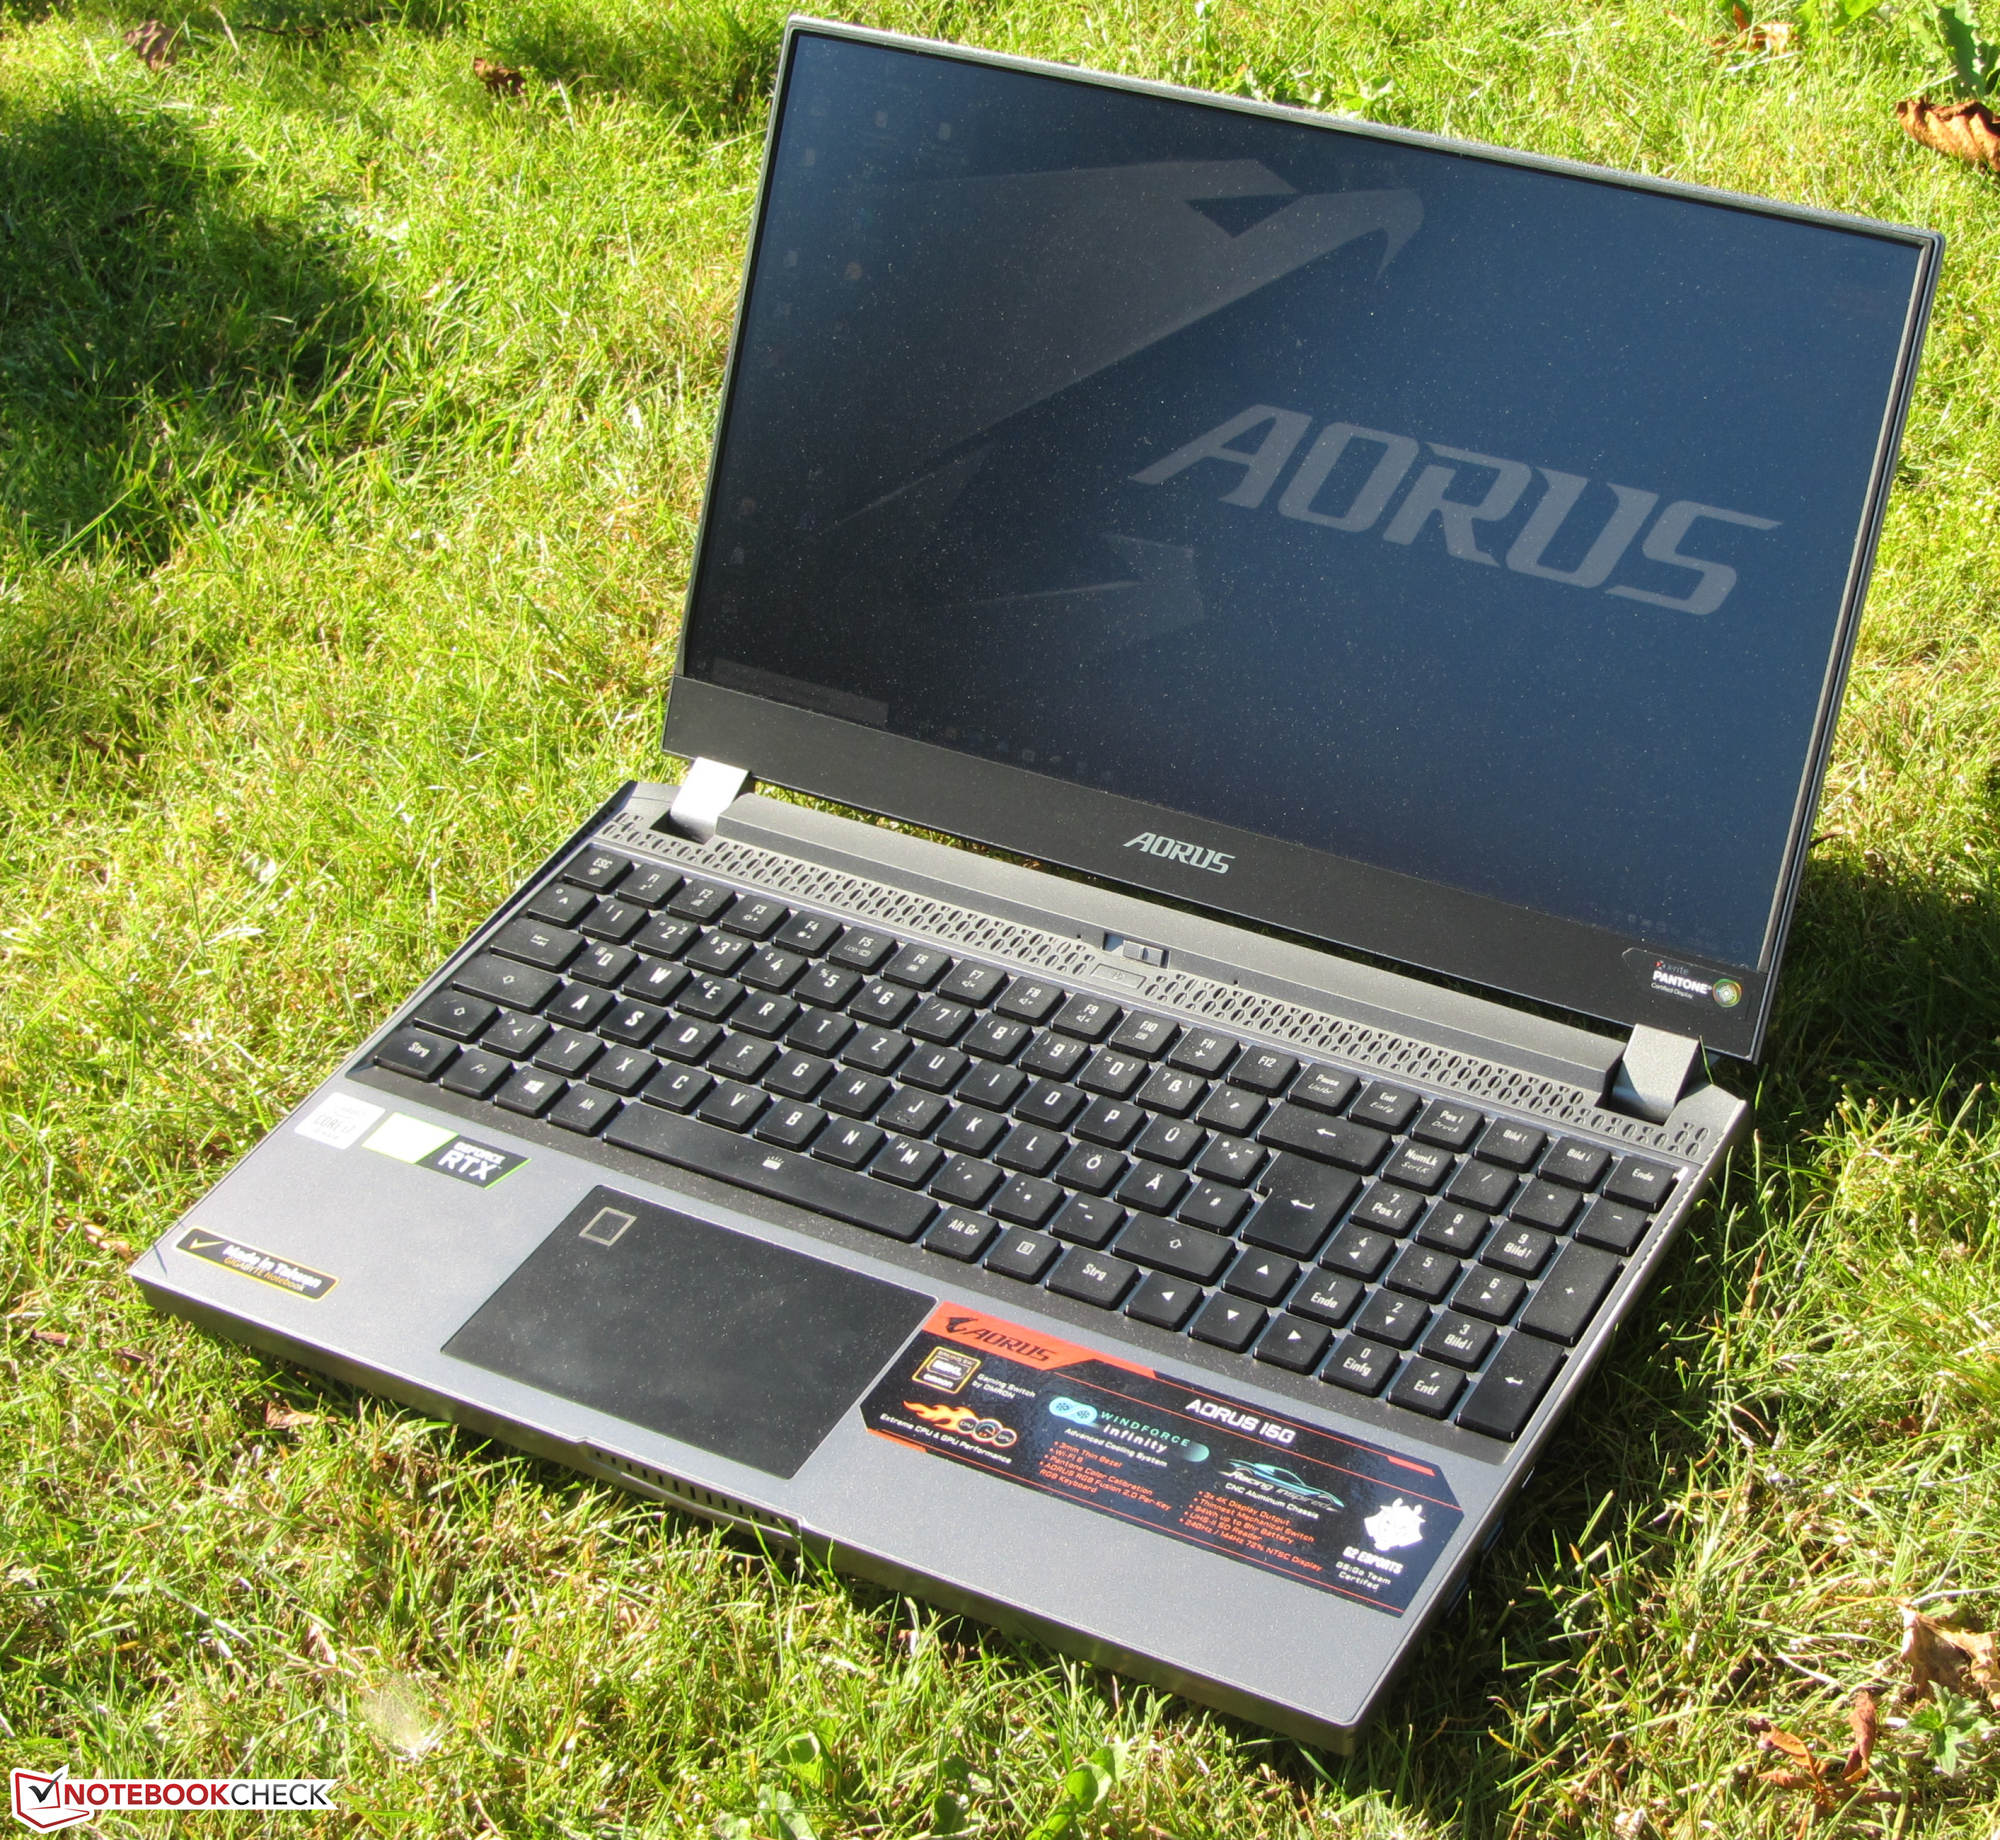
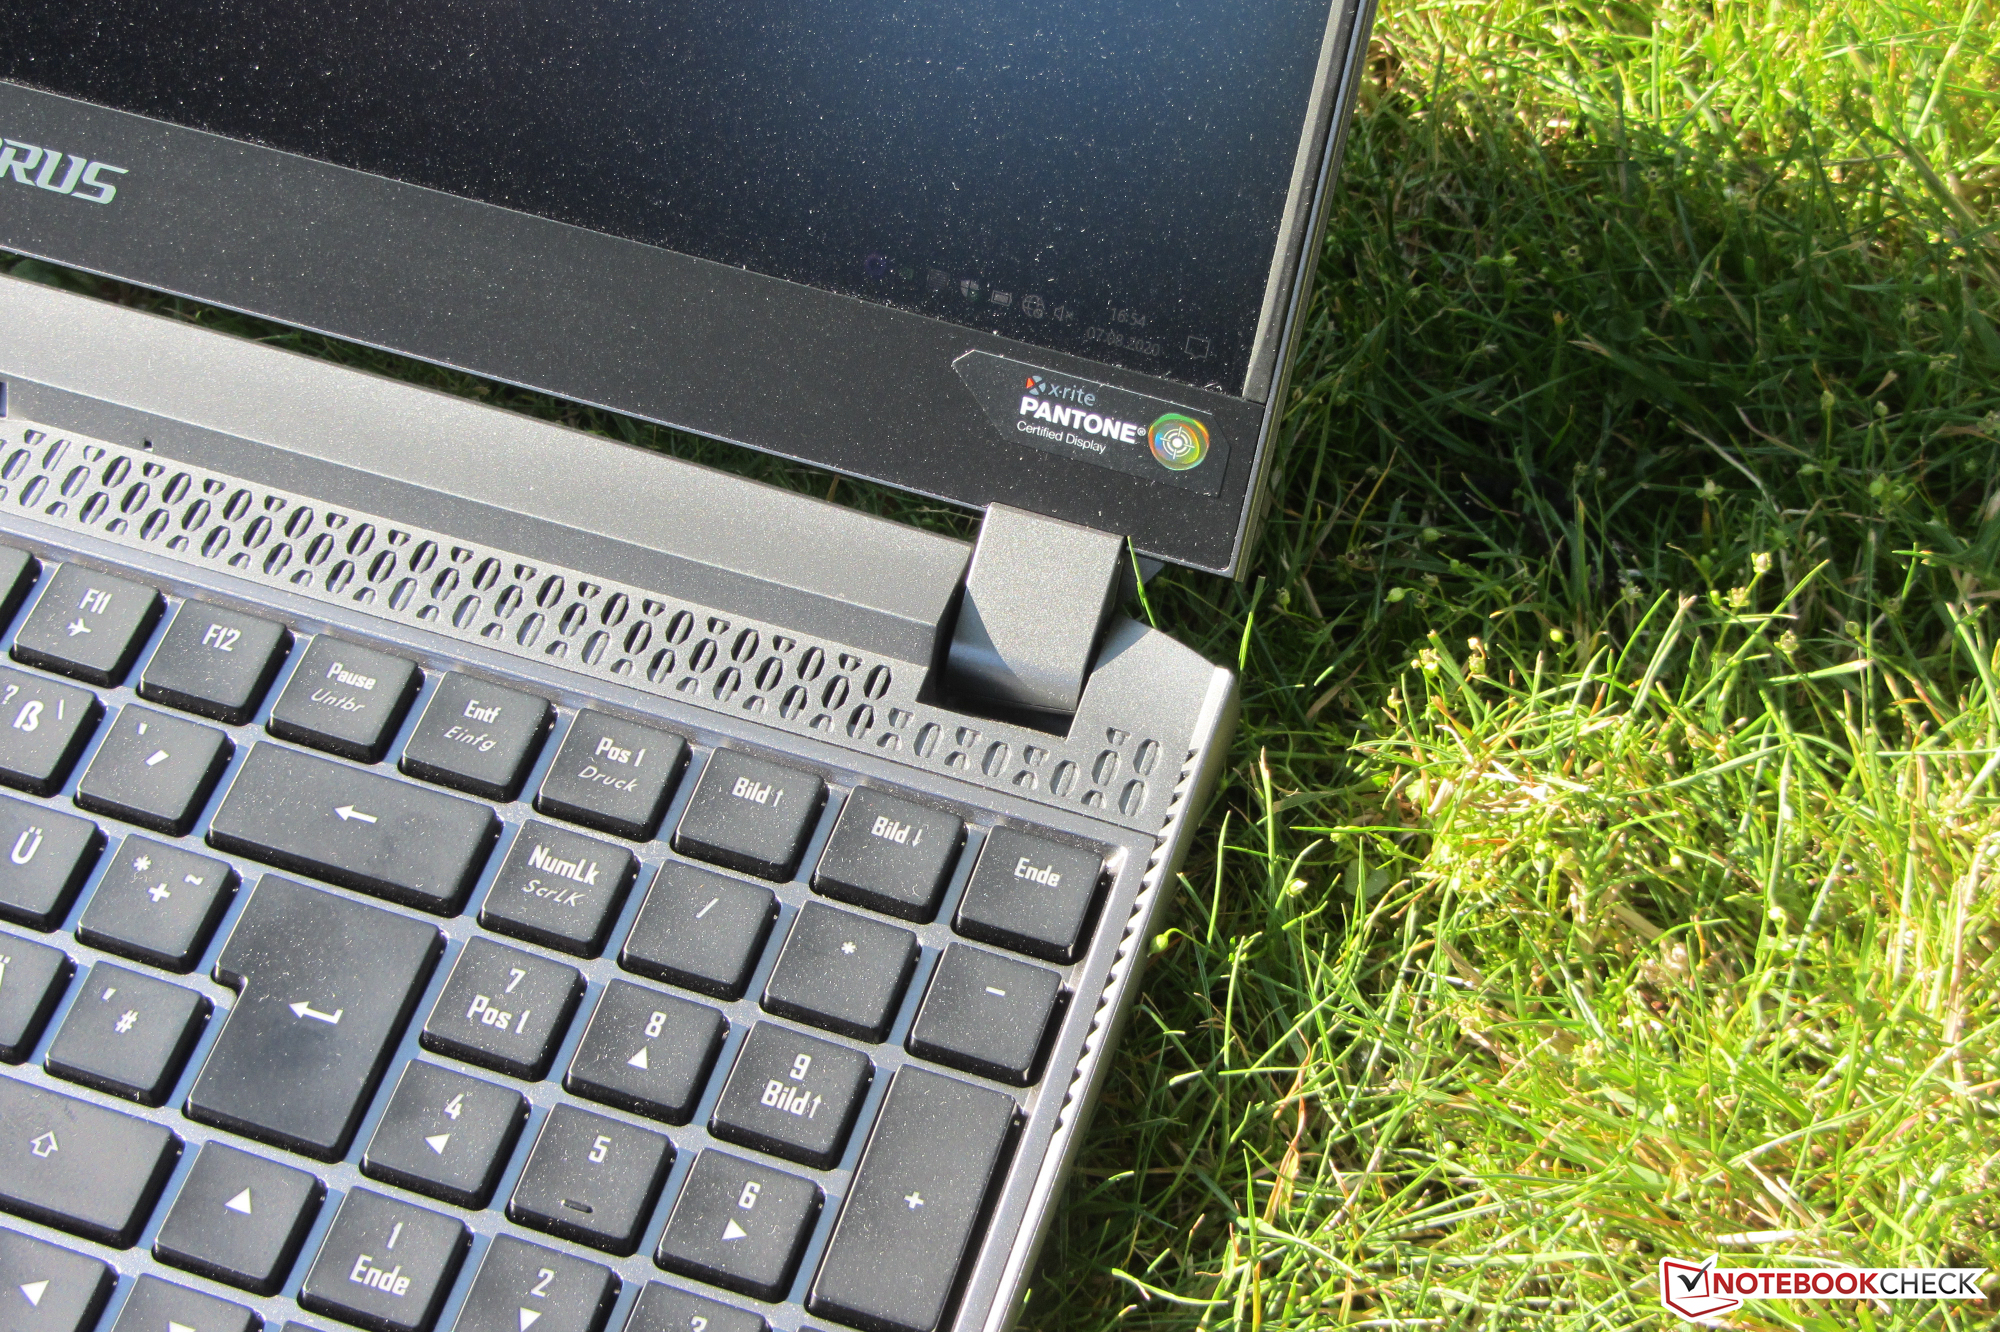
O monitor IGZO de 240 Hz da Sharp ganha pontos com ângulos de visão estáveis, tempos de resposta rápidos, boa cobertura do espaço de cores e - graças a uma certificação X-Rite Pantone - uma reprodução de cores naturais. O brilho e o contraste, por outro lado, poderiam ser melhores.
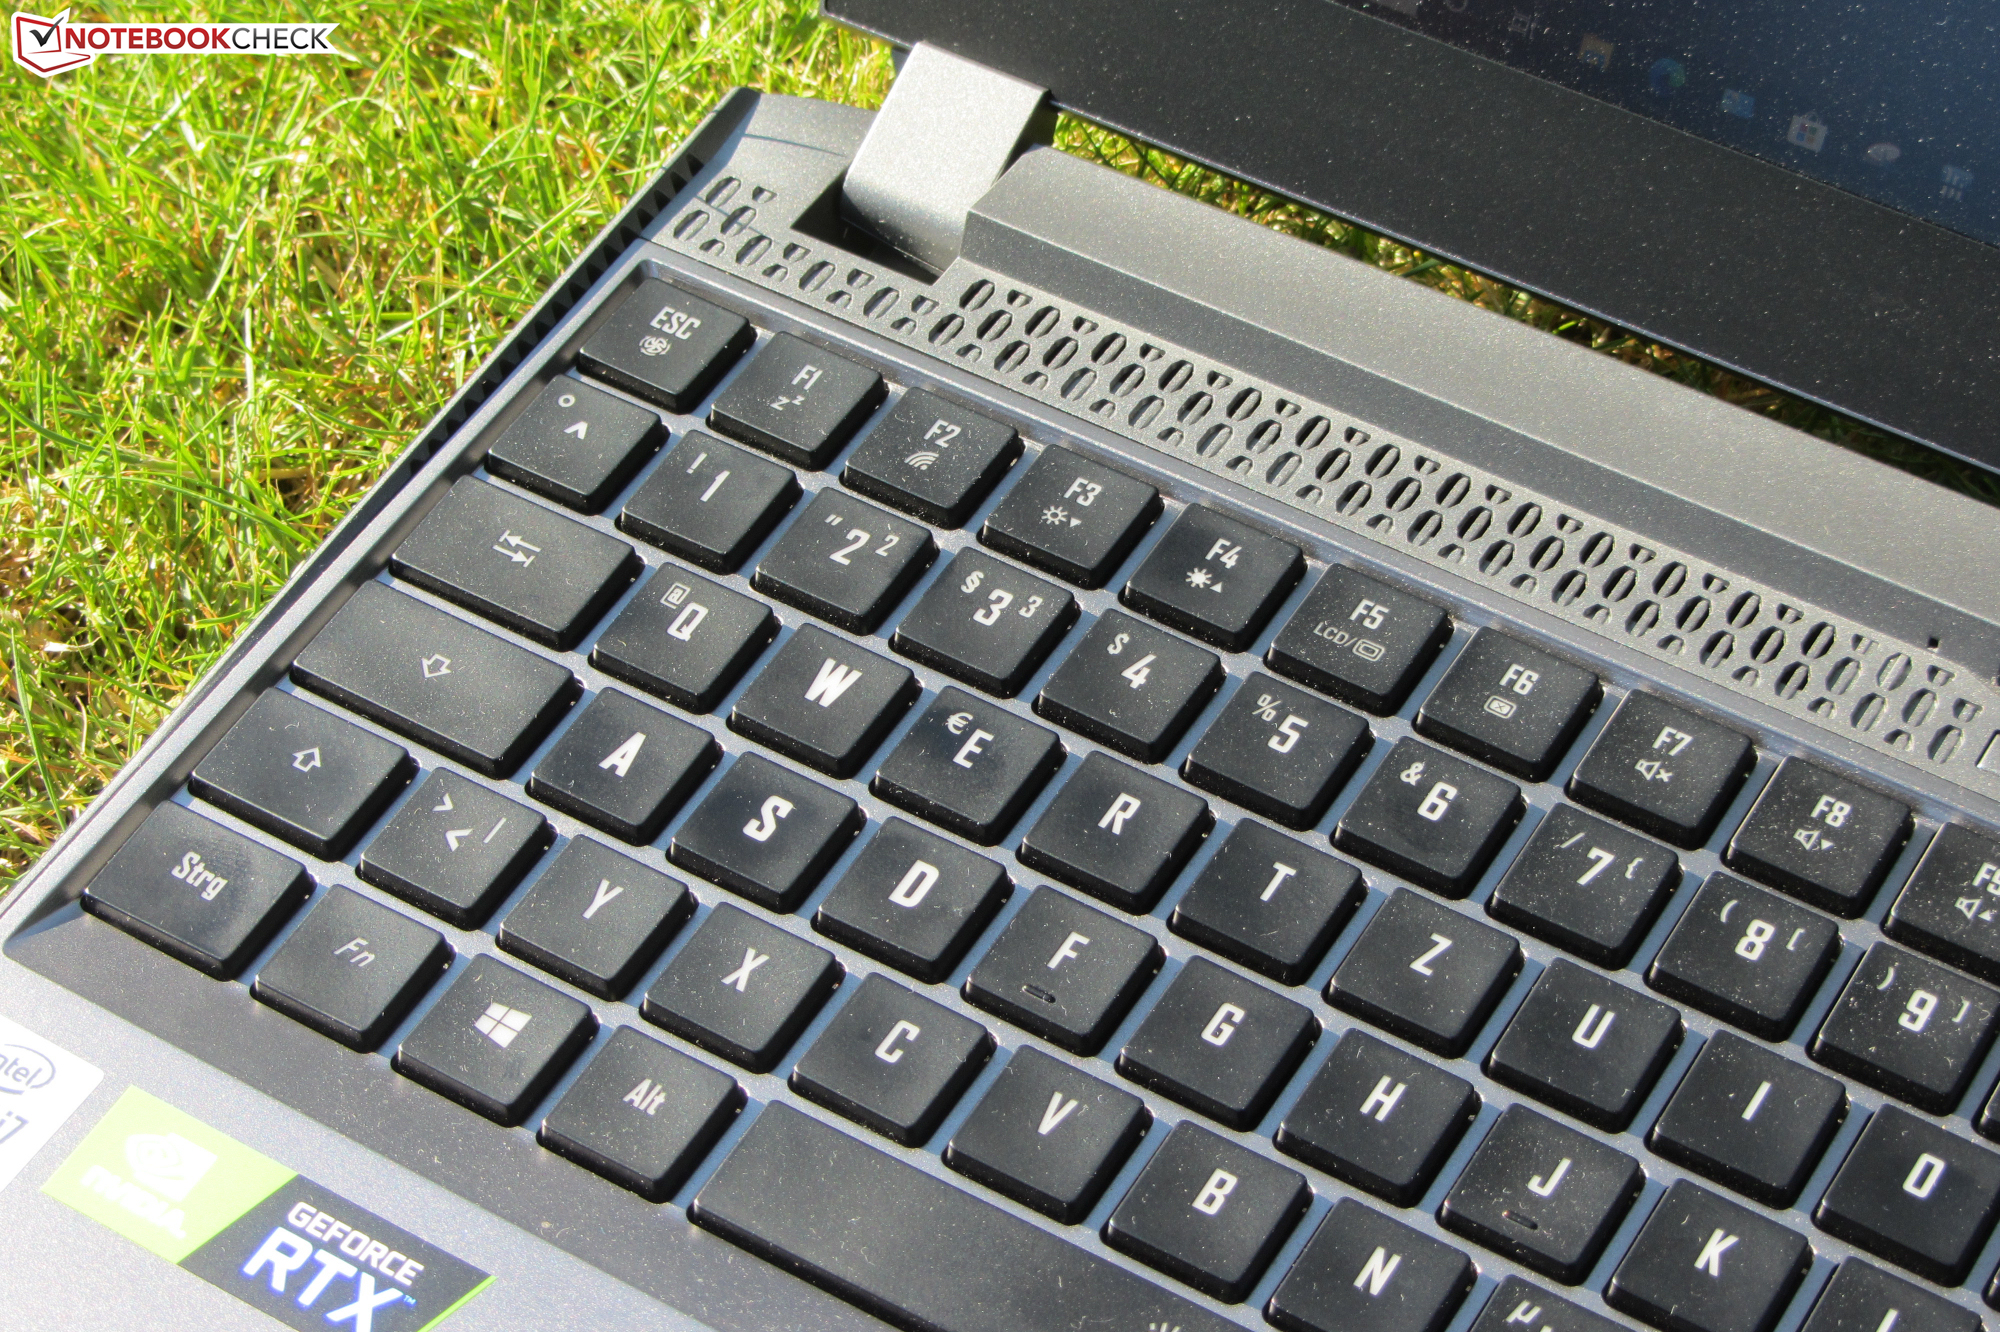
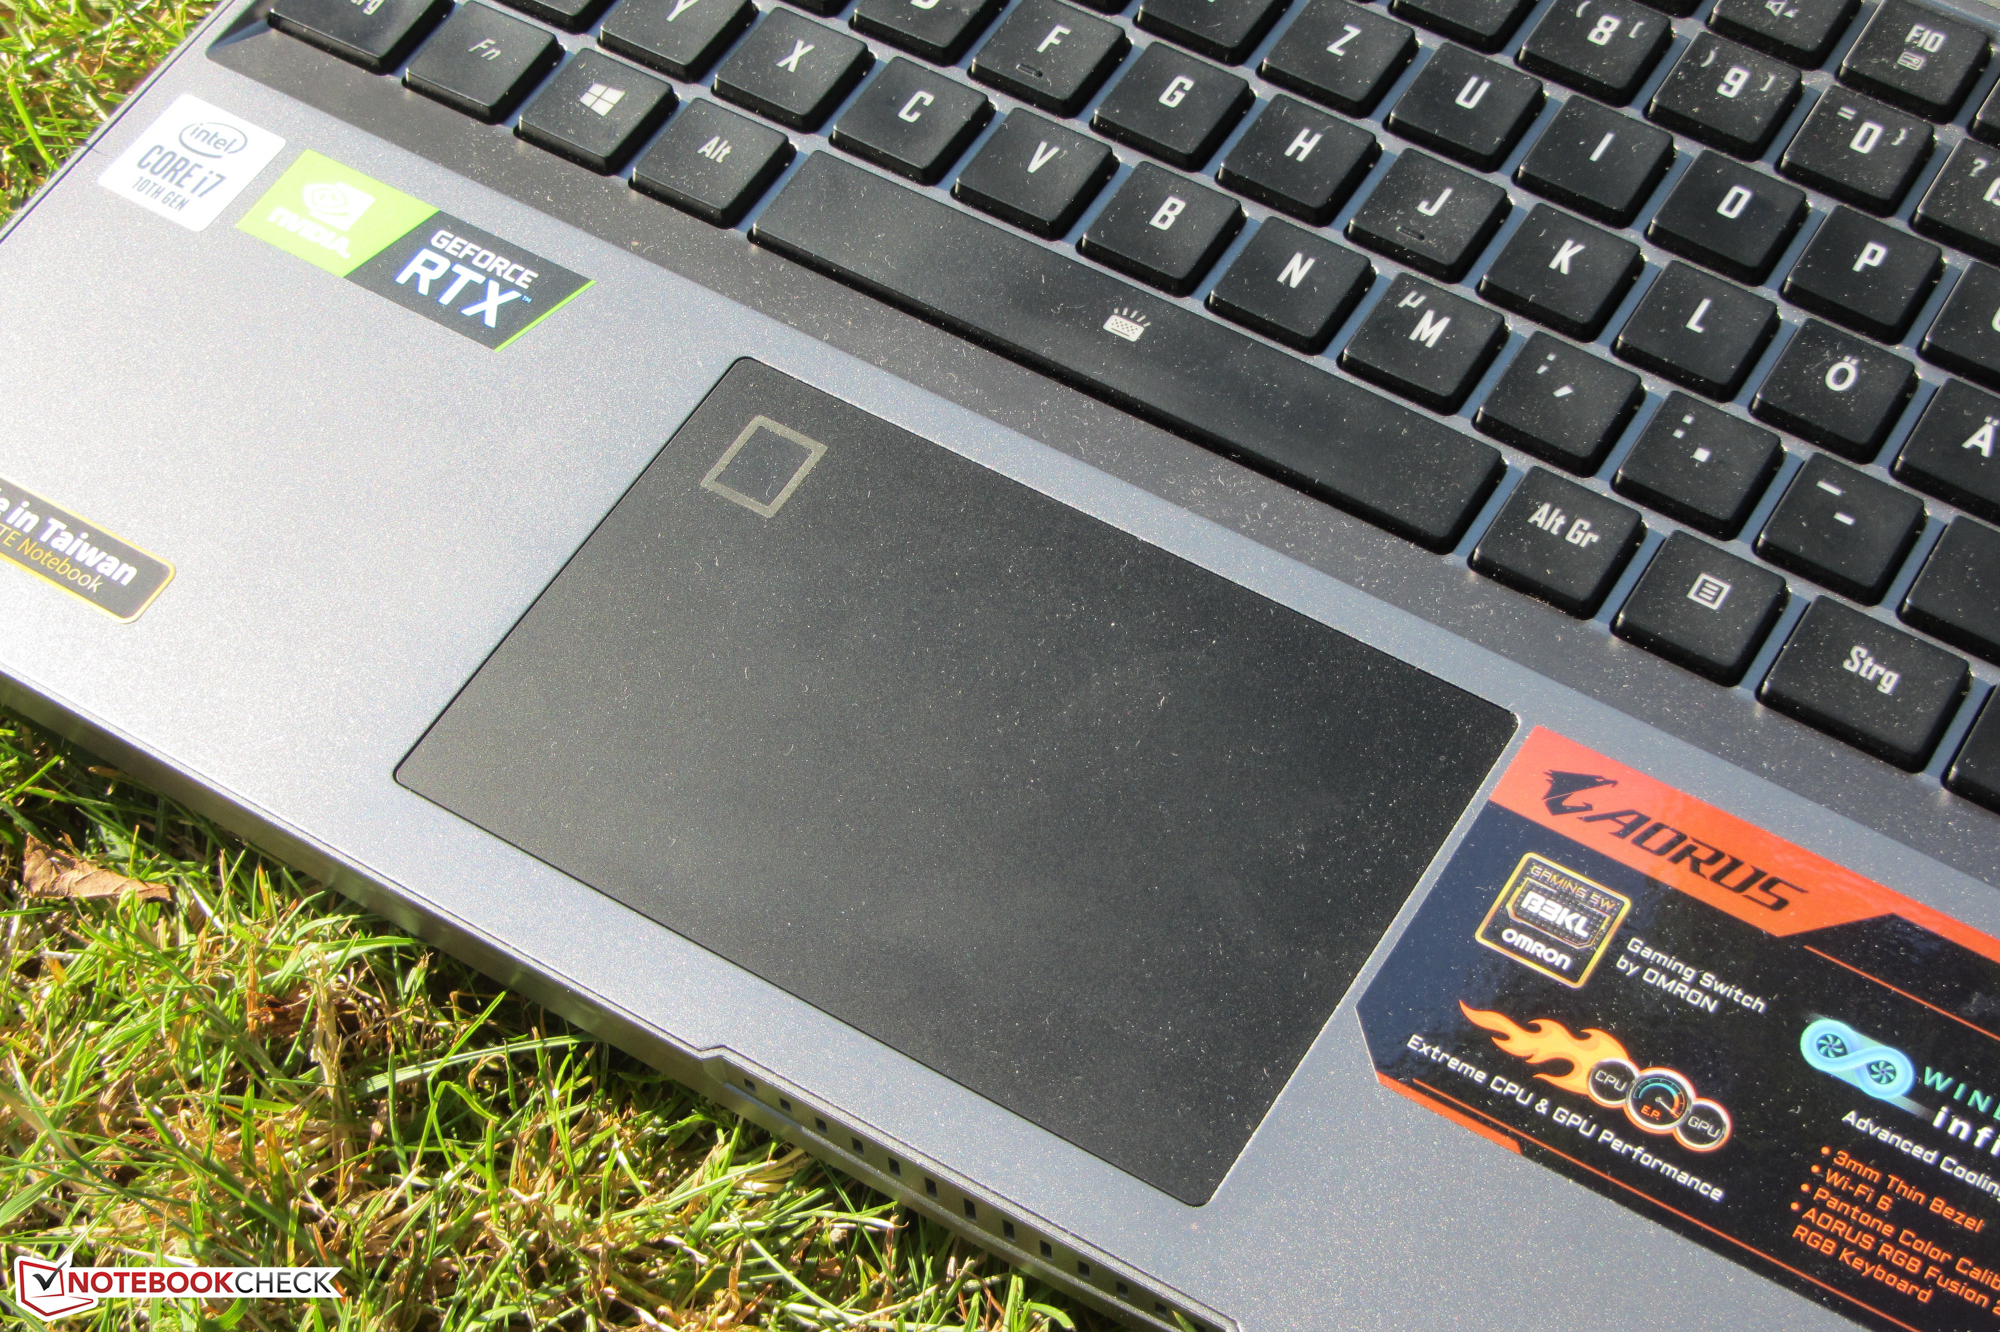
O teclado mecânico (com iluminação RGB) é um recurso incomum no portátil. Em suma, causou boa impressão e será um importante critério de compra para muitos compradores em potencial. Aqueles que nunca usaram esse teclado antes, primeiro terão que se acostumar com esse tipo de experiência de digitação.
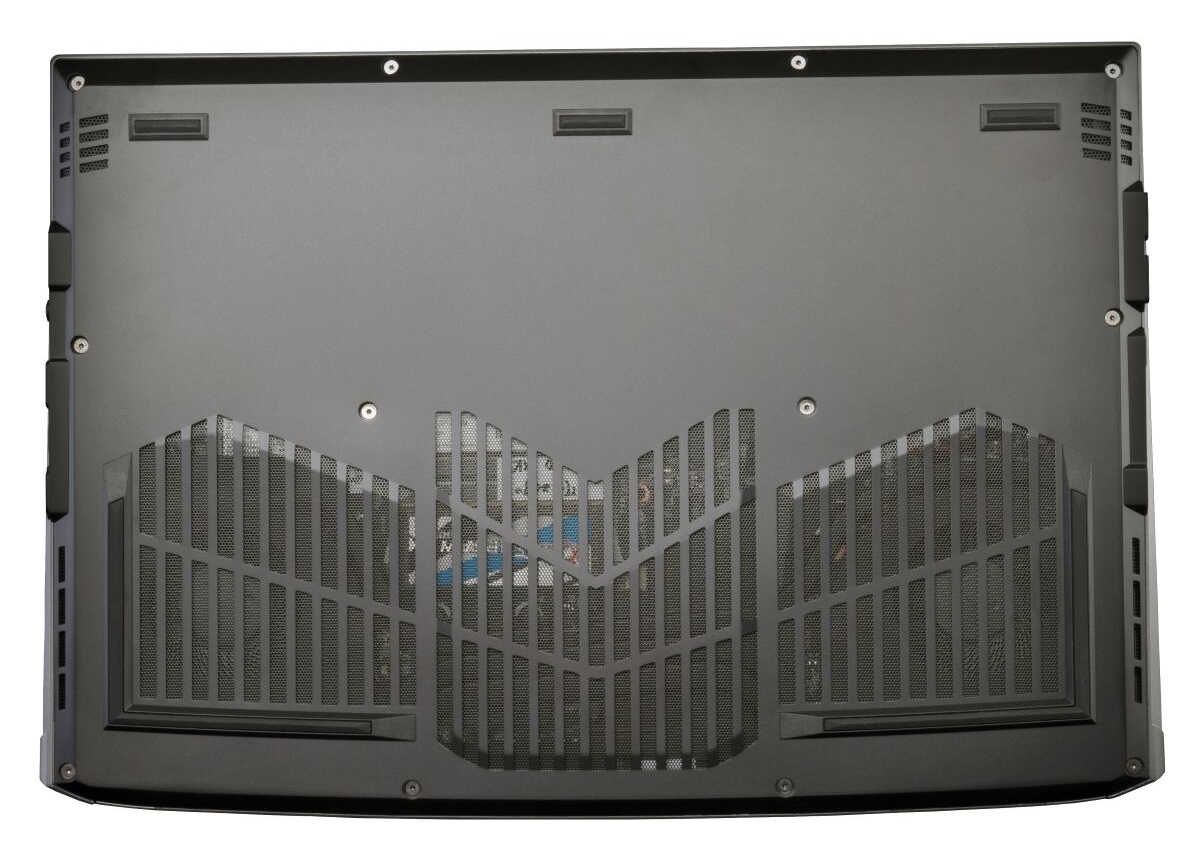
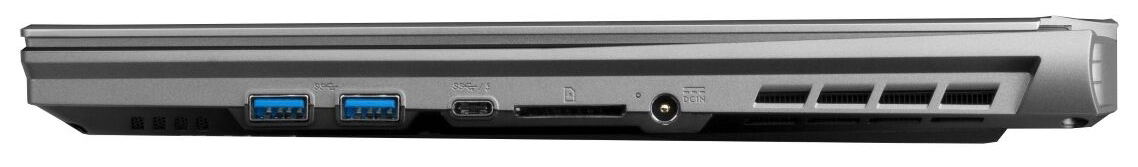
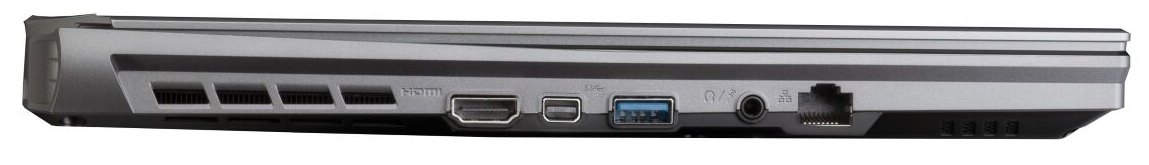
O espaço de armazenamento oferecido pelo rápido SSD NVMe de 512 GB será um pouco apertado para jogadores apaixonados. Um segundo SSD no formato M.2 2280 (NVMe ou SATA) pode ser instalado aqui, se necessário. O processo é bastante fácil de realizar, já que a tampa inferior do portátil pode ser removida sem problemas. Além disso, a duração da bateria é extremamente boa para um portátil de jogos. Isso é complementado por uma configuração de portas bem completa que inclui uma porta Thunderbolt 3 entre outras conexões.
Aorus 15G XB
- 08/11/2020 v7 (old)
Sascha Mölck
Price comparison
