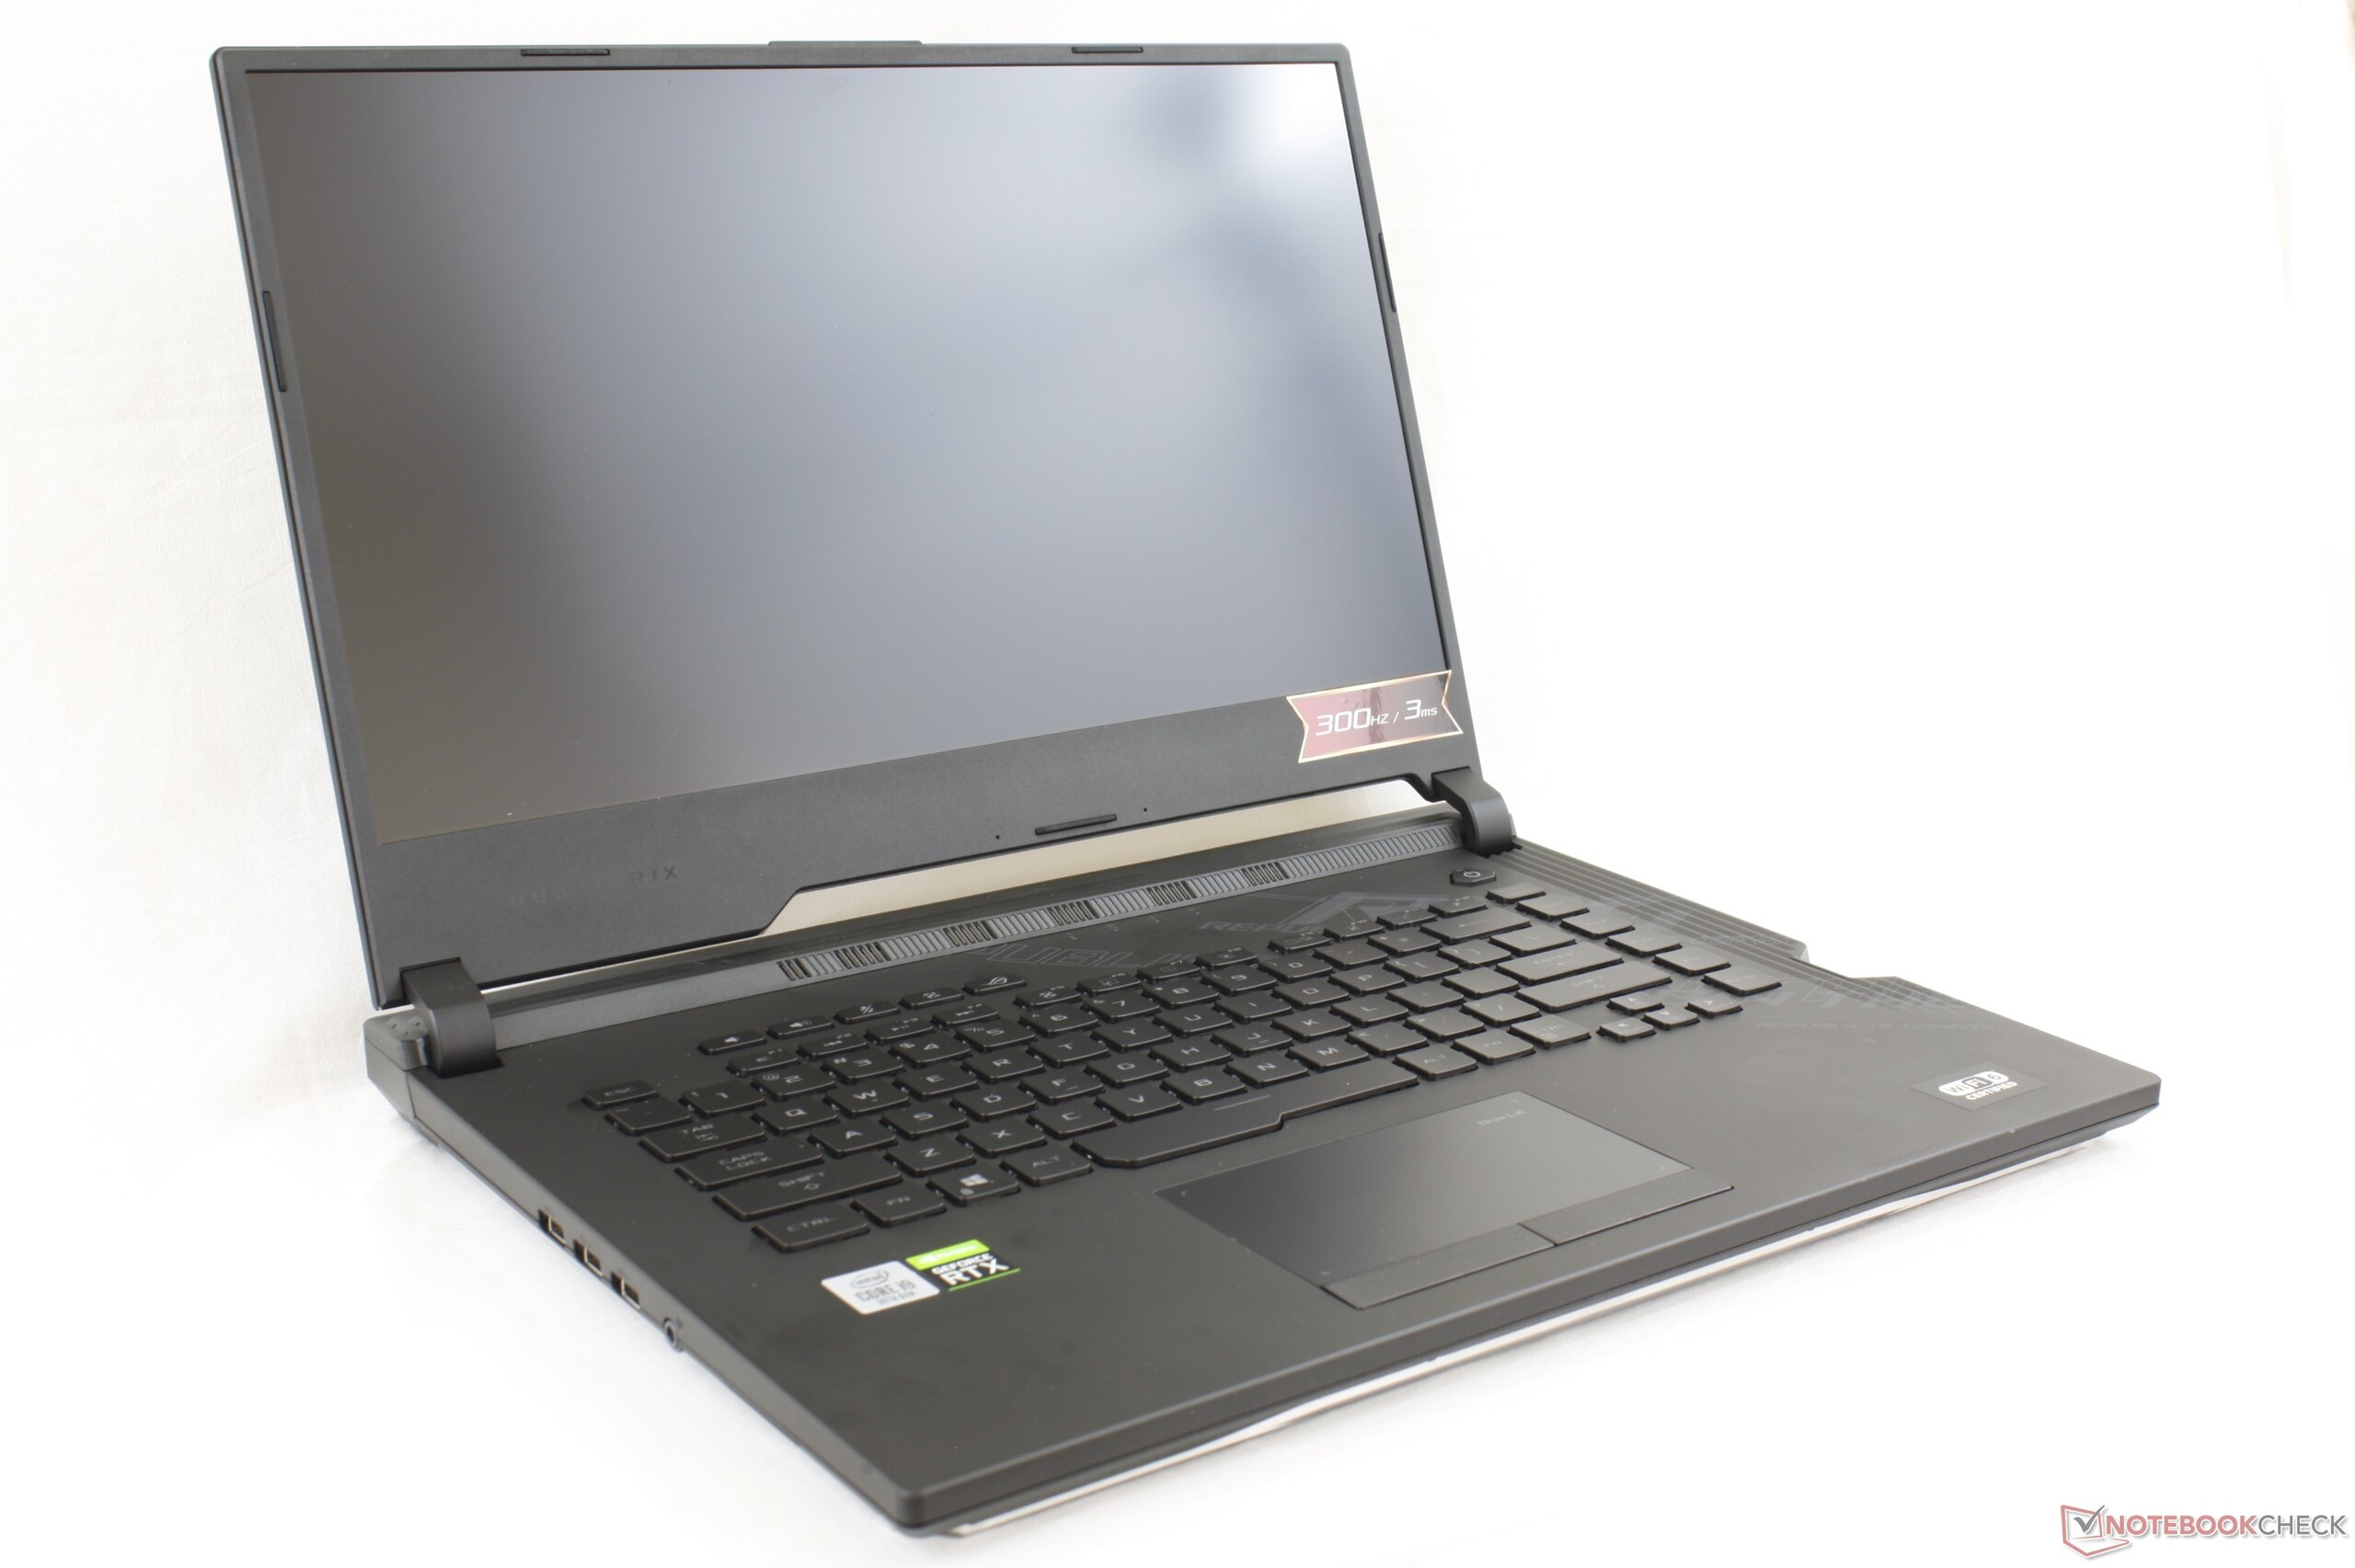
Breve Análise do Portátil Asus ROG Strix Scar 15 G532LWS: GeForce Supercharged
Avaliação | Data | Modelo | Peso | Altura | Size | Resolução | Preço |
|---|---|---|---|---|---|---|---|
| 84.4 % v7 (old) | 07/2020 | Asus ROG Strix Scar 15 G532LWS i9-10980HK, GeForce RTX 2070 Super Mobile | 2.4 kg | 24.9 mm | 15.60" | 1920x1080 | |
| 84.6 % v7 (old) | 07/2020 | MSI GE66 Raider 10SFS i9-10980HK, GeForce RTX 2070 Super Mobile | 2.4 kg | 23 mm | 15.60" | 1920x1080 | |
v (old) | 04/2020 | Acer Predator Triton 500 PT515-52-70N3 i7-10750H, GeForce RTX 2080 Super Max-Q | 2.1 kg | 18 mm | 15.60" | 1920x1080 | |
| 86 % v7 (old) | 05/2020 | Razer Blade 15 RZ09-0328 i7-10750H, GeForce RTX 2070 Max-Q | 2.1 kg | 19.9 mm | 15.60" | 3840x2160 | |
| 82.3 % v7 (old) | 09/2019 | HP Omen X 2S 15-dg0075cl i7-9750H, GeForce RTX 2070 Max-Q | 2.4 kg | 19.8 mm | 15.60" | 1920x1080 | |
| 82.1 % v7 (old) | Asus Strix Scar III G531GW-AZ062T i7-9750H, GeForce RTX 2070 Mobile | 2.4 kg | 25 mm | 15.60" | 1920x1080 |
| |||||||||||||||||||||||||
iluminação: 91 %
iluminação com acumulador: 307.2 cd/m²
Contraste: 1463:1 (Preto: 0.21 cd/m²)
ΔE ColorChecker Calman: 1.85 | ∀{0.5-29.43 Ø4.73}
calibrated: 1.26
ΔE Greyscale Calman: 2 | ∀{0.09-98 Ø4.97}
99.7% sRGB (Argyll 1.6.3 3D)
65% AdobeRGB 1998 (Argyll 1.6.3 3D)
71.4% AdobeRGB 1998 (Argyll 3D)
99.6% sRGB (Argyll 3D)
69.9% Display P3 (Argyll 3D)
Gamma: 2.15
CCT: 6479 K
| Asus ROG Strix Scar 15 G532LWS AU Optronics B156HAN12.0, IPS, 15.6", 1920x1080 | MSI GE66 Raider 10SFS Sharp LQ156M1JW03 (SHP14C5), IPS-Level, 15.6", 1920x1080 | Acer Predator Triton 500 PT515-52-70N3 AUO B156HAN12.0 (AUO7A8C), IPS, 15.6", 1920x1080 | Razer Blade 15 RZ09-0328 Samsung SDCA029, AMOLED, 15.6", 3840x2160 | HP Omen X 2S 15-dg0075cl AU Optronics AUO82ED, IPS, 15.6", 1920x1080 | Asus Strix Scar III G531GW-AZ062T Sharp LQ156M1JW09 (SHP14D3), IPS, 15.6", 1920x1080 | |
|---|---|---|---|---|---|---|
| Display | -2% | 1% | 26% | -6% | -4% | |
| Display P3 Coverage (%) | 69.9 | 68 -3% | 70.3 1% | 99.9 43% | 66.2 -5% | 66.2 -5% |
| sRGB Coverage (%) | 99.6 | 99 -1% | 99.5 0% | 100 0% | 92.3 -7% | 97.1 -3% |
| AdobeRGB 1998 Coverage (%) | 71.4 | 69.8 -2% | 72.2 1% | 97.4 36% | 67.2 -6% | 67.6 -5% |
| Response Times | -14% | -7% | 77% | -12% | -1% | |
| Response Time Grey 50% / Grey 80% * (ms) | 14.4 ? | 16.4 ? -14% | 14.4 ? -0% | 2.7 ? 81% | 15.2 ? -6% | 15 ? -4% |
| Response Time Black / White * (ms) | 9.2 ? | 10.4 ? -13% | 10.4 ? -13% | 2.6 ? 72% | 10.8 ? -17% | 9 ? 2% |
| PWM Frequency (Hz) | 23580 ? | 59.5 ? | 250 ? | |||
| Screen | 1% | -38% | -26% | -59% | -50% | |
| Brightness middle (cd/m²) | 307.2 | 291 -5% | 320 4% | 366.7 19% | 324.8 6% | 309 1% |
| Brightness (cd/m²) | 301 | 278 -8% | 318 6% | 371 23% | 316 5% | 284 -6% |
| Brightness Distribution (%) | 91 | 91 0% | 88 -3% | 91 0% | 84 -8% | 88 -3% |
| Black Level * (cd/m²) | 0.21 | 0.25 -19% | 0.24 -14% | 0.26 -24% | 0.42 -100% | |
| Contrast (:1) | 1463 | 1164 -20% | 1333 -9% | 1249 -15% | 736 -50% | |
| Colorchecker dE 2000 * | 1.85 | 1.19 36% | 4.03 -118% | 5.21 -182% | 4.96 -168% | 3.99 -116% |
| Colorchecker dE 2000 max. * | 3.92 | 3.04 22% | 8.43 -115% | 7.92 -102% | 8.95 -128% | 8.3 -112% |
| Colorchecker dE 2000 calibrated * | 1.26 | 0.98 22% | 3.23 -156% | 1.12 11% | ||
| Greyscale dE 2000 * | 2 | 1.9 5% | 5.94 -197% | 2 -0% | 5 -150% | 5.43 -172% |
| Gamma | 2.15 102% | 2.216 99% | 2.42 91% | 2.17 101% | 2.21 100% | 2.57 86% |
| CCT | 6479 100% | 7018 93% | 6751 96% | 6514 100% | 7742 84% | 7767 84% |
| Color Space (Percent of AdobeRGB 1998) (%) | 65 | 70 8% | 66 2% | 86.6 33% | 59.8 -8% | 63 -3% |
| Color Space (Percent of sRGB) (%) | 99.7 | 92 -8% | 99 -1% | 100 0% | 91.8 -8% | 97 -3% |
| Média Total (Programa/Configurações) | -5% /
-1% | -15% /
-27% | 26% /
2% | -26% /
-43% | -18% /
-36% |
* ... menor é melhor
Exibir tempos de resposta
| ↔ Tempo de resposta preto para branco | ||
|---|---|---|
| 9.2 ms ... ascensão ↗ e queda ↘ combinadas | ↗ 4.8 ms ascensão | 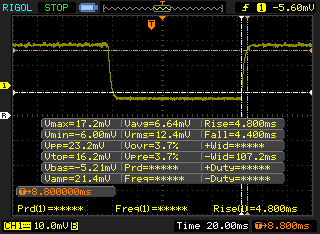 |
| ↘ 4.4 ms queda | ||
| A tela mostra taxas de resposta rápidas em nossos testes e deve ser adequada para jogos. Em comparação, todos os dispositivos testados variam de 0.1 (mínimo) a 240 (máximo) ms. » 25 % de todos os dispositivos são melhores. Isso significa que o tempo de resposta medido é melhor que a média de todos os dispositivos testados (19.9 ms). | ||
| ↔ Tempo de resposta 50% cinza a 80% cinza | ||
| 14.4 ms ... ascensão ↗ e queda ↘ combinadas | ↗ 6.8 ms ascensão | 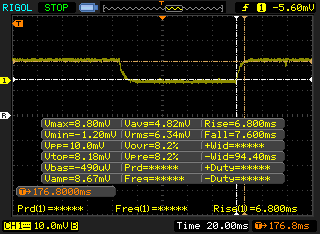 |
| ↘ 7.6 ms queda | ||
| A tela mostra boas taxas de resposta em nossos testes, mas pode ser muito lenta para jogadores competitivos. Em comparação, todos os dispositivos testados variam de 0.165 (mínimo) a 636 (máximo) ms. » 28 % de todos os dispositivos são melhores. Isso significa que o tempo de resposta medido é melhor que a média de todos os dispositivos testados (31.1 ms). | ||
Cintilação da tela / PWM (modulação por largura de pulso)
| Tela tremeluzindo / PWM não detectado | 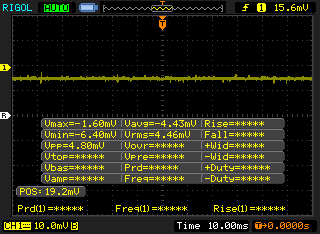 | ||
[pwm_comparison] Em comparação: 52 % de todos os dispositivos testados não usam PWM para escurecer a tela. Se PWM foi detectado, uma média de 7801 (mínimo: 5 - máximo: 343500) Hz foi medida. | |||
Cinebench R15: CPU Multi 64Bit | CPU Single 64Bit
Blender: v2.79 BMW27 CPU
7-Zip 18.03: 7z b 4 -mmt1 | 7z b 4
Geekbench 5.5: Single-Core | Multi-Core
HWBOT x265 Benchmark v2.2: 4k Preset
LibreOffice : 20 Documents To PDF
R Benchmark 2.5: Overall mean
| Cinebench R20 / CPU (Multi Core) | |
| Intel Core i9-10900K | |
| Eluktronics RP-15 | |
| Eurocom Sky X4C i9-9900KS | |
| Média Intel Core i9-10980HK (3526 - 4487, n=13) | |
| Asus ROG Strix Scar 15 G532LWS | |
| Gigabyte Aero 15 OLED XB-8DE51B0SP | |
| MSI GE65 Raider 9SF-049US | |
| Acer Nitro 5 AN515-44-R5FT | |
| Asus ROG Strix G15 G512LI | |
| Asus Strix Scar III G531GW-AZ062T | |
| Lenovo Legion 5 15IMH05H | |
| Cinebench R20 / CPU (Single Core) | |
| Intel Core i9-10900K | |
| Gigabyte Aero 15 OLED XB-8DE51B0SP | |
| Eurocom Sky X4C i9-9900KS | |
| Asus ROG Strix Scar 15 G532LWS | |
| Eluktronics RP-15 | |
| Média Intel Core i9-10980HK (465 - 507, n=13) | |
| MSI GE65 Raider 9SF-049US | |
| Lenovo Legion 5 15IMH05H | |
| Asus ROG Strix G15 G512LI | |
| Acer Nitro 5 AN515-44-R5FT | |
| Asus Strix Scar III G531GW-AZ062T | |
| Cinebench R15 / CPU Multi 64Bit | |
| Intel Core i9-10900K | |
| Eluktronics RP-15 | |
| Eurocom Sky X4C i9-9900KS | |
| Gigabyte Aero 15 OLED XB-8DE51B0SP | |
| Média Intel Core i9-10980HK (1606 - 1862, n=15) | |
| Asus ROG Strix Scar 15 G532LWS | |
| MSI GE65 Raider 9SF-049US | |
| Acer Nitro 5 AN515-44-R5FT | |
| Asus ROG Strix G15 G512LI | |
| Asus Strix Scar III G531GW-AZ062T | |
| Lenovo Legion 5 15IMH05H | |
| Cinebench R15 / CPU Single 64Bit | |
| Intel Core i9-10900K | |
| Eurocom Sky X4C i9-9900KS | |
| Gigabyte Aero 15 OLED XB-8DE51B0SP | |
| Asus ROG Strix Scar 15 G532LWS | |
| Média Intel Core i9-10980HK (198 - 219, n=15) | |
| MSI GE65 Raider 9SF-049US | |
| Asus ROG Strix G15 G512LI | |
| Eluktronics RP-15 | |
| Lenovo Legion 5 15IMH05H | |
| Asus Strix Scar III G531GW-AZ062T | |
| Acer Nitro 5 AN515-44-R5FT | |
| Blender / v2.79 BMW27 CPU | |
| Lenovo Legion 5 15IMH05H | |
| Asus Strix Scar III G531GW-AZ062T | |
| Asus ROG Strix G15 G512LI | |
| Acer Nitro 5 AN515-44-R5FT | |
| Gigabyte Aero 15 OLED XB-8DE51B0SP | |
| Asus ROG Strix Scar 15 G532LWS | |
| Média Intel Core i9-10980HK (239 - 299, n=13) | |
| Eluktronics RP-15 | |
| Eurocom Sky X4C i9-9900KS | |
| Intel Core i9-10900K | |
| 7-Zip 18.03 / 7z b 4 -mmt1 | |
| Intel Core i9-10900K | |
| Eurocom Sky X4C i9-9900KS | |
| Asus ROG Strix Scar 15 G532LWS | |
| Gigabyte Aero 15 OLED XB-8DE51B0SP | |
| Média Intel Core i9-10980HK (5081 - 5542, n=13) | |
| Asus Strix Scar III G531GW-AZ062T | |
| Asus ROG Strix G15 G512LI | |
| Lenovo Legion 5 15IMH05H | |
| Eluktronics RP-15 | |
| Acer Nitro 5 AN515-44-R5FT | |
| 7-Zip 18.03 / 7z b 4 | |
| Intel Core i9-10900K | |
| Eurocom Sky X4C i9-9900KS | |
| Eluktronics RP-15 | |
| Asus ROG Strix Scar 15 G532LWS | |
| Gigabyte Aero 15 OLED XB-8DE51B0SP | |
| Média Intel Core i9-10980HK (43786 - 49275, n=13) | |
| Acer Nitro 5 AN515-44-R5FT | |
| Asus ROG Strix G15 G512LI | |
| Asus Strix Scar III G531GW-AZ062T | |
| Lenovo Legion 5 15IMH05H | |
| Geekbench 5.5 / Single-Core | |
| Intel Core i9-10900K | |
| Eurocom Sky X4C i9-9900KS | |
| Asus ROG Strix Scar 15 G532LWS | |
| Gigabyte Aero 15 OLED XB-8DE51B0SP | |
| Média Intel Core i9-10980HK (1283 - 1401, n=12) | |
| Lenovo Legion 5 15IMH05H | |
| Eluktronics RP-15 | |
| Asus ROG Strix G15 G512LI | |
| Acer Nitro 5 AN515-44-R5FT | |
| Geekbench 5.5 / Multi-Core | |
| Intel Core i9-10900K | |
| Eurocom Sky X4C i9-9900KS | |
| Eluktronics RP-15 | |
| Asus ROG Strix Scar 15 G532LWS | |
| Média Intel Core i9-10980HK (7634 - 8666, n=12) | |
| Gigabyte Aero 15 OLED XB-8DE51B0SP | |
| Asus ROG Strix G15 G512LI | |
| Acer Nitro 5 AN515-44-R5FT | |
| Lenovo Legion 5 15IMH05H | |
| HWBOT x265 Benchmark v2.2 / 4k Preset | |
| Intel Core i9-10900K | |
| Eurocom Sky X4C i9-9900KS | |
| Eluktronics RP-15 | |
| Gigabyte Aero 15 OLED XB-8DE51B0SP | |
| Asus ROG Strix Scar 15 G532LWS | |
| Média Intel Core i9-10980HK (12 - 14.6, n=13) | |
| Asus ROG Strix G15 G512LI | |
| Acer Nitro 5 AN515-44-R5FT | |
| Asus Strix Scar III G531GW-AZ062T | |
| Lenovo Legion 5 15IMH05H | |
| LibreOffice / 20 Documents To PDF | |
| Intel Core i9-10900K | |
| Acer Nitro 5 AN515-44-R5FT | |
| Eluktronics RP-15 | |
| Média Intel Core i9-10980HK (44 - 89, n=13) | |
| Lenovo Legion 5 15IMH05H | |
| Gigabyte Aero 15 OLED XB-8DE51B0SP | |
| Asus ROG Strix G15 G512LI | |
| Asus ROG Strix Scar 15 G532LWS | |
| R Benchmark 2.5 / Overall mean | |
| Lenovo Legion 5 15IMH05H | |
| Acer Nitro 5 AN515-44-R5FT | |
| Asus ROG Strix G15 G512LI | |
| Média Intel Core i9-10980HK (0.561 - 0.596, n=13) | |
| Eluktronics RP-15 | |
| Asus ROG Strix Scar 15 G532LWS | |
| Gigabyte Aero 15 OLED XB-8DE51B0SP | |
| Intel Core i9-10900K | |
* ... menor é melhor
| PCMark 8 | |
| Home Score Accelerated v2 | |
| HP Omen X 2S 15-dg0075cl | |
| Asus ROG Strix Scar 15 G532LWS | |
| Média Intel Core i9-10980HK, NVIDIA GeForce RTX 2070 Super Mobile (n=1) | |
| Asus Strix Scar III G531GW-AZ062T | |
| Razer Blade 15 RZ09-0328 | |
| Work Score Accelerated v2 | |
| Asus ROG Strix Scar 15 G532LWS | |
| Média Intel Core i9-10980HK, NVIDIA GeForce RTX 2070 Super Mobile (n=1) | |
| HP Omen X 2S 15-dg0075cl | |
| Asus Strix Scar III G531GW-AZ062T | |
| Razer Blade 15 RZ09-0328 | |
| PCMark 8 Home Score Accelerated v2 | 5020 pontos | |
| PCMark 8 Work Score Accelerated v2 | 6456 pontos | |
| PCMark 10 Score | 6236 pontos | |
Ajuda | ||
| DPC Latencies / LatencyMon - interrupt to process latency (max), Web, Youtube, Prime95 | |
| Acer Predator Triton 500 PT515-52-70N3 | |
| Asus ROG Strix Scar 15 G532LWS | |
| MSI GE66 Raider 10SFS | |
| Razer Blade 15 RZ09-0328 | |
* ... menor é melhor
| Asus ROG Strix Scar 15 G532LWS 2x Intel SSD 660p 1TB SSDPEKNW010T8 (RAID 0) | MSI GE66 Raider 10SFS WDC PC SN730 SDBPNTY-1T00 | Razer Blade 15 RZ09-0328 Lite-On CA5-8D512 | Asus Strix Scar III G531GW-AZ062T Intel SSD 660p SSDPEKNW512G8 | MSI Bravo 15 A4DCR Samsung PM981a MZVLB1T0HBLR | |
|---|---|---|---|---|---|
| AS SSD | 47% | -11% | -70% | 44% | |
| Seq Read (MB/s) | 1982 | 2979 50% | 2021 2% | 1163 -41% | 2730 38% |
| Seq Write (MB/s) | 1444 | 2581 79% | 2090 45% | 919 -36% | 2513 74% |
| 4K Read (MB/s) | 50.3 | 47.33 -6% | 47.71 -5% | 48.88 -3% | 61.4 22% |
| 4K Write (MB/s) | 120.1 | 140 17% | 101.1 -16% | 90.1 -25% | 156.1 30% |
| 4K-64 Read (MB/s) | 1016 | 1710 68% | 856 -16% | 323.8 -68% | 1780 75% |
| 4K-64 Write (MB/s) | 1351 | 2188 62% | 1041 -23% | 403.8 -70% | 1920 42% |
| Access Time Read * (ms) | 0.044 | 0.05 -14% | 0.052 -18% | 0.24 -445% | 0.063 -43% |
| Access Time Write * (ms) | 0.109 | 0.026 76% | 0.111 -2% | 0.046 58% | 0.025 77% |
| Score Read (Points) | 1264 | 2055 63% | 1105 -13% | 489 -61% | 2114 67% |
| Score Write (Points) | 1615 | 2586 60% | 1351 -16% | 586 -64% | 2327 44% |
| Score Total (Points) | 3510 | 5673 62% | 3037 -13% | 1332 -62% | 5518 57% |
| Copy ISO MB/s (MB/s) | 3474 | 2474 -29% | 1269 -63% | ||
| Copy Program MB/s (MB/s) | 751 | 679 -10% | 452.8 -40% | ||
| Copy Game MB/s (MB/s) | 1684 | 1037 -38% | 755 -55% | ||
| CrystalDiskMark 5.2 / 6 | 11% | 5% | -32% | 8% | |
| Write 4K (MB/s) | 128.4 | 158.2 23% | 118.7 -8% | 133.3 4% | 118.3 -8% |
| Read 4K (MB/s) | 53.7 | 50.7 -6% | 52.4 -2% | 55.3 3% | 43.73 -19% |
| Write Seq (MB/s) | 1875 | 1790 -5% | 2247 20% | 980 -48% | 2854 52% |
| Read Seq (MB/s) | 2315 | 2469 7% | 2234 -3% | 1406 -39% | 2302 -1% |
| Write 4K Q32T1 (MB/s) | 427.2 | 503 18% | 515 21% | 286.3 -33% | 418.5 -2% |
| Read 4K Q32T1 (MB/s) | 440.7 | 579 31% | 584 33% | 331.5 -25% | 517 17% |
| Write Seq Q32T1 (MB/s) | 2793 | 3102 11% | 2235 -20% | 976 -65% | 3008 8% |
| Read Seq Q32T1 (MB/s) | 3101 | 3413 10% | 3171 2% | 1520 -51% | 3568 15% |
| Write 4K Q8T8 (MB/s) | 748 | ||||
| Read 4K Q8T8 (MB/s) | 344.6 | ||||
| Média Total (Programa/Configurações) | 29% /
32% | -3% /
-5% | -51% /
-56% | 26% /
29% |
* ... menor é melhor

Disk Throttling: DiskSpd Read Loop, Queue Depth 8
| 3DMark 11 | |
| 1280x720 Performance GPU | |
| MSI RTX 2080 Ti Gaming X Trio | |
| Nvidia GeForce RTX 2080 Super | |
| MSI GE63 Raider 8SG | |
| Asus Strix Scar 17 G732LXS | |
| Asus ROG Strix Scar 15 G532LWS | |
| Média NVIDIA GeForce RTX 2070 Super Mobile (28207 - 31050, n=8) | |
| MSI GS66 10SGS | |
| Schenker XMG Pro 15 | |
| Dell G5 15 SE 5505 P89F | |
| Razer Blade 15 RZ09-0328 | |
| Eluktronics RP-15 | |
| Acer Predator 15 G9-593-751X | |
| Maingear Vector 15 | |
| Asus ROG Strix G15 G512LI | |
| Asus Zephyrus S GX531GM | |
| 1280x720 Performance Combined | |
| MSI RTX 2080 Ti Gaming X Trio | |
| Asus Strix Scar 17 G732LXS | |
| Asus ROG Strix Scar 15 G532LWS | |
| Média NVIDIA GeForce RTX 2070 Super Mobile (9419 - 17440, n=8) | |
| Eluktronics RP-15 | |
| MSI GS66 10SGS | |
| Nvidia GeForce RTX 2080 Super | |
| Dell G5 15 SE 5505 P89F | |
| Asus ROG Strix G15 G512LI | |
| Schenker XMG Pro 15 | |
| Maingear Vector 15 | |
| Razer Blade 15 RZ09-0328 | |
| MSI GE63 Raider 8SG | |
| Acer Predator 15 G9-593-751X | |
| Asus Zephyrus S GX531GM | |
| 3DMark 11 Performance | 25360 pontos | |
| 3DMark Cloud Gate Standard Score | 50766 pontos | |
| 3DMark Fire Strike Score | 19498 pontos | |
| 3DMark Time Spy Score | 8531 pontos | |
Ajuda | ||
| Shadow of the Tomb Raider - 1920x1080 Highest Preset AA:T | |
| Intel Core i9-10900K | |
| Eurocom Sky X4C i9-9900KS | |
| Asus Strix Scar 17 G732LXS | |
| Nvidia GeForce RTX 2080 Super | |
| MSI GE66 Raider 10SFS | |
| Asus ROG Strix Scar 15 G532LWS | |
| Média NVIDIA GeForce RTX 2070 Super Mobile (100 - 108, n=3) | |
| Gigabyte Aero 15 OLED XB-8DE51B0SP | |
| Acer Predator Triton 500 PT515-52-70N3 | |
| MSI GE65 Raider 9SF-049US | |
| Razer Blade 15 RZ09-0328 | |
| HP Omen X 2S 15-dg0075cl | |
| Lenovo Legion 5 15IMH05H | |
| Asus Strix Scar III G531GW-AZ062T | |
| Eluktronics RP-15 | |
| Dell G5 15 SE 5505 P89F | |
| Acer Nitro 5 AN515-44-R5FT | |
| Dell XPS 15 9500 Core i7 4K UHD | |
| Asus Zephyrus S GX531GM | |
| MSI Bravo 15 A4DCR | |
| The Witcher 3 - 1920x1080 Ultra Graphics & Postprocessing (HBAO+) | |
| Intel Core i9-10900K | |
| MSI RTX 2080 Ti Gaming X Trio | |
| Nvidia GeForce RTX 2080 Super | |
| Eurocom Sky X4C i9-9900KS | |
| Asus Strix Scar 17 G732LXS | |
| Média NVIDIA GeForce RTX 2070 Super Mobile (76.3 - 94.6, n=8) | |
| Asus ROG Strix Scar 15 G532LWS | |
| MSI GE66 Raider 10SFS | |
| Acer Predator Triton 500 PT515-52-70N3 | |
| Gigabyte Aero 15 OLED XB-8DE51B0SP | |
| MSI GE65 Raider 9SF-049US | |
| Schenker XMG Pro 15 | |
| Asus Strix Scar III G531GW-AZ062T | |
| HP Omen X 2S 15-dg0075cl | |
| Lenovo Legion 5 15IMH05H | |
| Dell G5 15 SE 5505 P89F | |
| Eluktronics RP-15 | |
| Razer Blade 15 RZ09-0328 | |
| Maingear Vector 15 | |
| Acer Predator 15 G9-593-751X | |
| Asus ROG Strix G15 G512LI | |
| Asus Zephyrus S GX531GM | |
| Acer Nitro 5 AN515-44-R5FT | |
| MSI Bravo 15 A4DCR | |
| Dell XPS 15 9500 Core i7 4K UHD | |
| baixo | média | alto | ultra | |
|---|---|---|---|---|
| The Witcher 3 (2015) | 368.7 | 256.5 | 168 | 85.7 |
| Dota 2 Reborn (2015) | 156 | 145 | 135 | 129 |
| X-Plane 11.11 (2018) | 118 | 103 | 86.5 | |
| Shadow of the Tomb Raider (2018) | 153 | 120 | 115 | 104 |
| Asus ROG Strix Scar 15 G532LWS GeForce RTX 2070 Super Mobile, i9-10980HK, 2x Intel SSD 660p 1TB SSDPEKNW010T8 (RAID 0) | MSI GE66 Raider 10SFS GeForce RTX 2070 Super Mobile, i9-10980HK, WDC PC SN730 SDBPNTY-1T00 | Acer Predator Triton 500 PT515-52-70N3 GeForce RTX 2080 Super Max-Q, i7-10750H, Samsung SSD PM981a MZVLB512HBJQ | Razer Blade 15 RZ09-0328 GeForce RTX 2070 Max-Q, i7-10750H, Lite-On CA5-8D512 | HP Omen X 2S 15-dg0075cl GeForce RTX 2070 Max-Q, i7-9750H, WDC PC SN720 SDAPNTW-1T00 | Asus Strix Scar III G531GW-AZ062T GeForce RTX 2070 Mobile, i7-9750H, Intel SSD 660p SSDPEKNW512G8 | |
|---|---|---|---|---|---|---|
| Noise | -7% | 0% | 7% | 4% | 3% | |
| desligado / ambiente * (dB) | 26.5 | 30 -13% | 30 -13% | 28.4 -7% | 29 -9% | 30 -13% |
| Idle Minimum * (dB) | 27.1 | 30 -11% | 30 -11% | 28.4 -5% | 30.5 -13% | 30.6 -13% |
| Idle Average * (dB) | 32.2 | 35 -9% | 33 -2% | 28.4 12% | 31.5 2% | 30.6 5% |
| Idle Maximum * (dB) | 34 | 44 -29% | 36 -6% | 31.7 7% | 31.5 7% | 37.7 -11% |
| Load Average * (dB) | 52.4 | 53 -1% | 50 5% | 47.7 9% | 40.6 23% | 36.5 30% |
| Witcher 3 ultra * (dB) | 57.5 | 53 8% | 48 17% | 47.5 17% | 49.5 14% | 52.1 9% |
| Load Maximum * (dB) | 57.5 | 55 4% | 50 13% | 49.5 14% | 53.4 7% | 48.1 16% |
* ... menor é melhor
Barulho
| Ocioso |
| 27.1 / 32.2 / 34 dB |
| Carga |
| 52.4 / 57.5 dB |
 | ||
30 dB silencioso 40 dB(A) audível 50 dB(A) ruidosamente alto |
||
min: | ||
(-) A temperatura máxima no lado superior é 46.2 °C / 115 F, em comparação com a média de 40.4 °C / 105 F , variando de 21.2 a 68.8 °C para a classe Gaming.
(-) A parte inferior aquece até um máximo de 55.2 °C / 131 F, em comparação com a média de 43.2 °C / 110 F
(+) Em uso inativo, a temperatura média para o lado superior é 29.1 °C / 84 F, em comparação com a média do dispositivo de 33.9 °C / ### class_avg_f### F.
(±) Jogando The Witcher 3, a temperatura média para o lado superior é 36.3 °C / 97 F, em comparação com a média do dispositivo de 33.9 °C / ## #class_avg_f### F.
(+) Os apoios para as mãos e o touchpad são mais frios que a temperatura da pele, com um máximo de 27.6 °C / 81.7 F e, portanto, são frios ao toque.
(±) A temperatura média da área do apoio para as mãos de dispositivos semelhantes foi 28.8 °C / 83.8 F (+1.2 °C / 2.1 F).
Asus ROG Strix Scar 15 G532LWS análise de áudio
(+) | os alto-falantes podem tocar relativamente alto (###valor### dB)
Graves 100 - 315Hz
(±) | graves reduzidos - em média 9.7% menor que a mediana
(±) | a linearidade dos graves é média (7.8% delta para a frequência anterior)
Médios 400 - 2.000 Hz
(±) | médios mais altos - em média 6.4% maior que a mediana
(+) | médios são lineares (4.8% delta para frequência anterior)
Altos 2 - 16 kHz
(+) | agudos equilibrados - apenas 1.9% longe da mediana
(+) | os máximos são lineares (5.5% delta da frequência anterior)
Geral 100 - 16.000 Hz
(+) | o som geral é linear (14.4% diferença em relação à mediana)
Comparado com a mesma classe
» 27% de todos os dispositivos testados nesta classe foram melhores, 7% semelhantes, 66% piores
» O melhor teve um delta de 6%, a média foi 18%, o pior foi 132%
Comparado com todos os dispositivos testados
» 18% de todos os dispositivos testados foram melhores, 4% semelhantes, 78% piores
» O melhor teve um delta de 4%, a média foi 24%, o pior foi 134%
Apple MacBook 12 (Early 2016) 1.1 GHz análise de áudio
(+) | os alto-falantes podem tocar relativamente alto (###valor### dB)
Graves 100 - 315Hz
(±) | graves reduzidos - em média 11.3% menor que a mediana
(±) | a linearidade dos graves é média (14.2% delta para a frequência anterior)
Médios 400 - 2.000 Hz
(+) | médios equilibrados - apenas 2.4% longe da mediana
(+) | médios são lineares (5.5% delta para frequência anterior)
Altos 2 - 16 kHz
(+) | agudos equilibrados - apenas 2% longe da mediana
(+) | os máximos são lineares (4.5% delta da frequência anterior)
Geral 100 - 16.000 Hz
(+) | o som geral é linear (10.2% diferença em relação à mediana)
Comparado com a mesma classe
» 7% de todos os dispositivos testados nesta classe foram melhores, 2% semelhantes, 91% piores
» O melhor teve um delta de 5%, a média foi 18%, o pior foi 53%
Comparado com todos os dispositivos testados
» 5% de todos os dispositivos testados foram melhores, 1% semelhantes, 94% piores
» O melhor teve um delta de 4%, a média foi 24%, o pior foi 134%
| desligado | |
| Ocioso | |
| Carga |
|
Key:
min: | |
| Asus ROG Strix Scar 15 G532LWS i9-10980HK, GeForce RTX 2070 Super Mobile, 2x Intel SSD 660p 1TB SSDPEKNW010T8 (RAID 0), IPS, 1920x1080, 15.6" | MSI GE66 Raider 10SFS i9-10980HK, GeForce RTX 2070 Super Mobile, WDC PC SN730 SDBPNTY-1T00, IPS-Level, 1920x1080, 15.6" | Acer Predator Triton 500 PT515-52-70N3 i7-10750H, GeForce RTX 2080 Super Max-Q, Samsung SSD PM981a MZVLB512HBJQ, IPS, 1920x1080, 15.6" | Razer Blade 15 RZ09-0328 i7-10750H, GeForce RTX 2070 Max-Q, Lite-On CA5-8D512, AMOLED, 3840x2160, 15.6" | HP Omen X 2S 15-dg0075cl i7-9750H, GeForce RTX 2070 Max-Q, WDC PC SN720 SDAPNTW-1T00, IPS, 1920x1080, 15.6" | Asus Strix Scar III G531GW-AZ062T i7-9750H, GeForce RTX 2070 Mobile, Intel SSD 660p SSDPEKNW512G8, IPS, 1920x1080, 15.6" | |
|---|---|---|---|---|---|---|
| Power Consumption | 4% | 1% | -4% | -175% | 1% | |
| Idle Minimum * (Watt) | 8 | 6 25% | 11 -38% | 11.1 -39% | 46 -475% | 11.4 -43% |
| Idle Average * (Watt) | 9.8 | 14 -43% | 15 -53% | 13.7 -40% | 59 -502% | 13.5 -38% |
| Idle Maximum * (Watt) | 25.8 | 25 3% | 25 3% | 33.4 -29% | 65.5 -154% | 21.6 16% |
| Load Average * (Watt) | 169 | 108 36% | 95 44% | 104.4 38% | 99.8 41% | 106 37% |
| Witcher 3 ultra * (Watt) | 201 | 195 3% | 140 30% | 159.9 20% | 154.1 23% | 186 7% |
| Load Maximum * (Watt) | 271.6 | 280 -3% | 211 22% | 203.8 25% | 222.7 18% | 196 28% |
* ... menor é melhor
| Asus ROG Strix Scar 15 G532LWS i9-10980HK, GeForce RTX 2070 Super Mobile, 66 Wh | MSI GE66 Raider 10SFS i9-10980HK, GeForce RTX 2070 Super Mobile, 99.99 Wh | Acer Predator Triton 500 PT515-52-70N3 i7-10750H, GeForce RTX 2080 Super Max-Q, 84 Wh | Razer Blade 15 RZ09-0328 i7-10750H, GeForce RTX 2070 Max-Q, 65 Wh | HP Omen X 2S 15-dg0075cl i7-9750H, GeForce RTX 2070 Max-Q, 72 Wh | Asus Strix Scar III G531GW-AZ062T i7-9750H, GeForce RTX 2070 Mobile, 66 Wh | |
|---|---|---|---|---|---|---|
| Duração da bateria | 13% | 6% | -18% | -41% | 14% | |
| Reader / Idle (h) | 8.1 | 7.6 -6% | 8.3 2% | 3.7 -54% | ||
| WiFi v1.3 (h) | 4.9 | 6.1 24% | 6.3 29% | 4 -18% | 2.2 -55% | 5.6 14% |
| Load (h) | 1.5 | 1.8 20% | 1.3 -13% | 1.3 -13% |
Pro
Contra
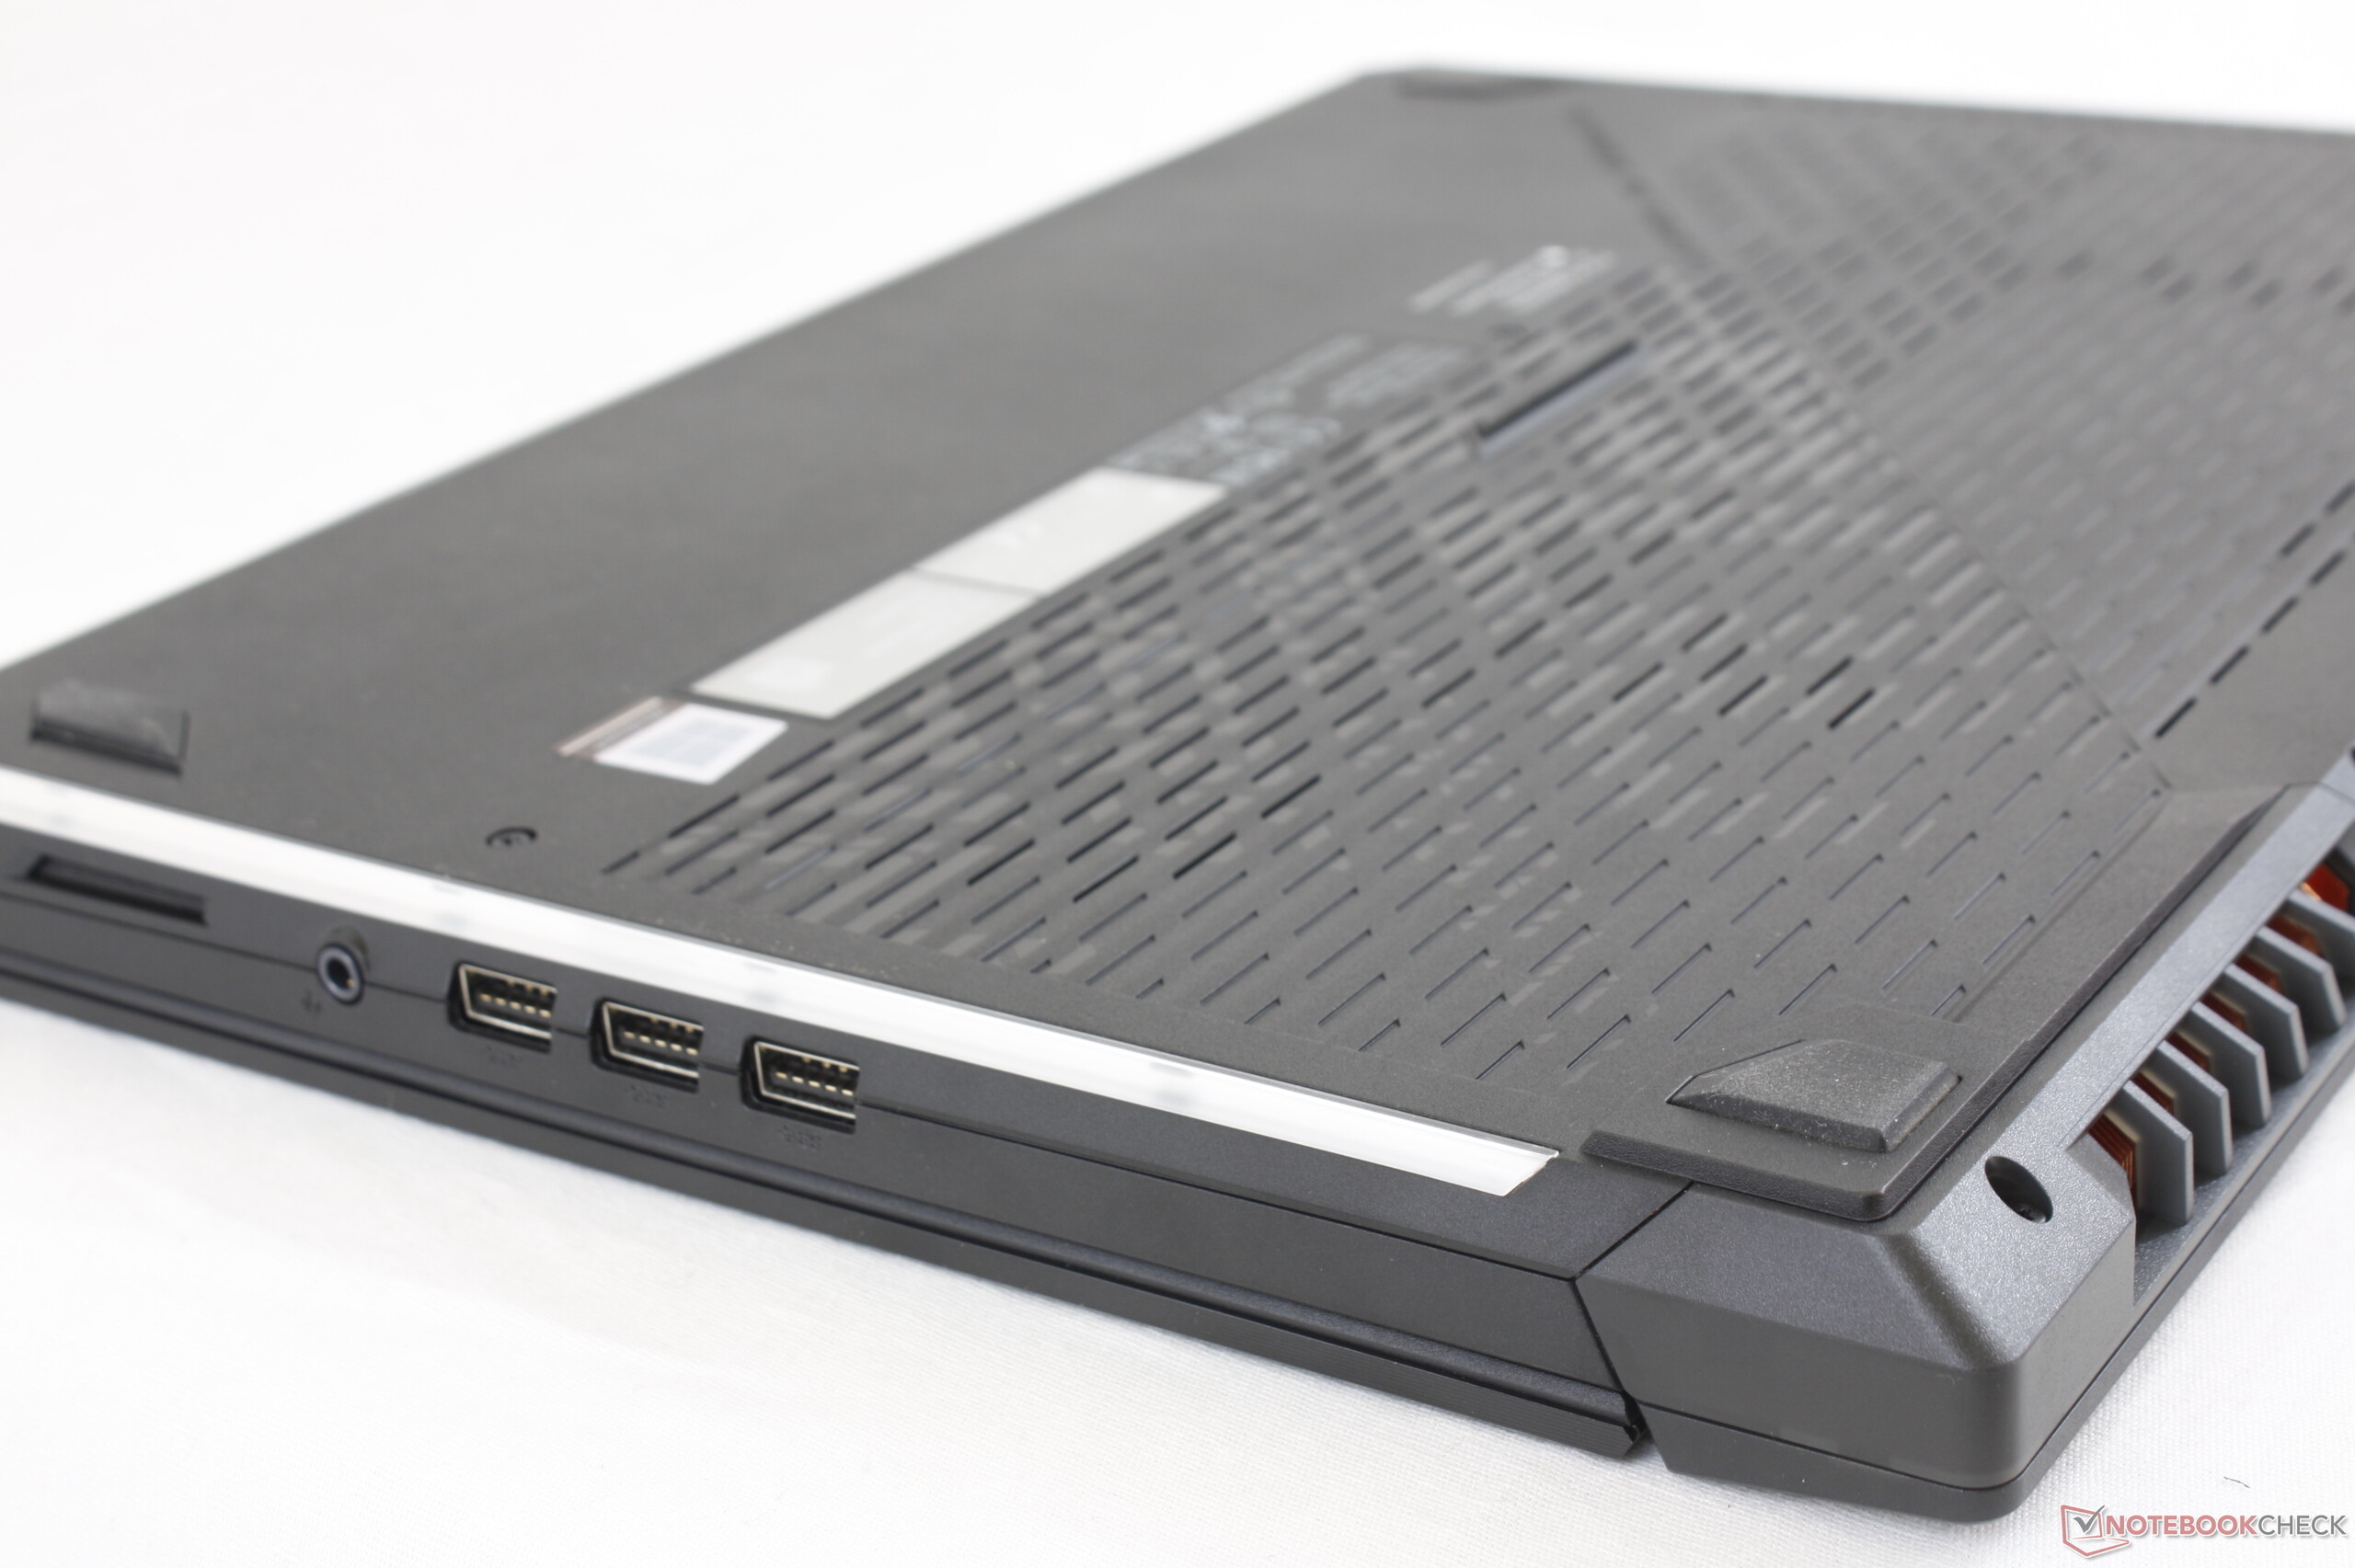
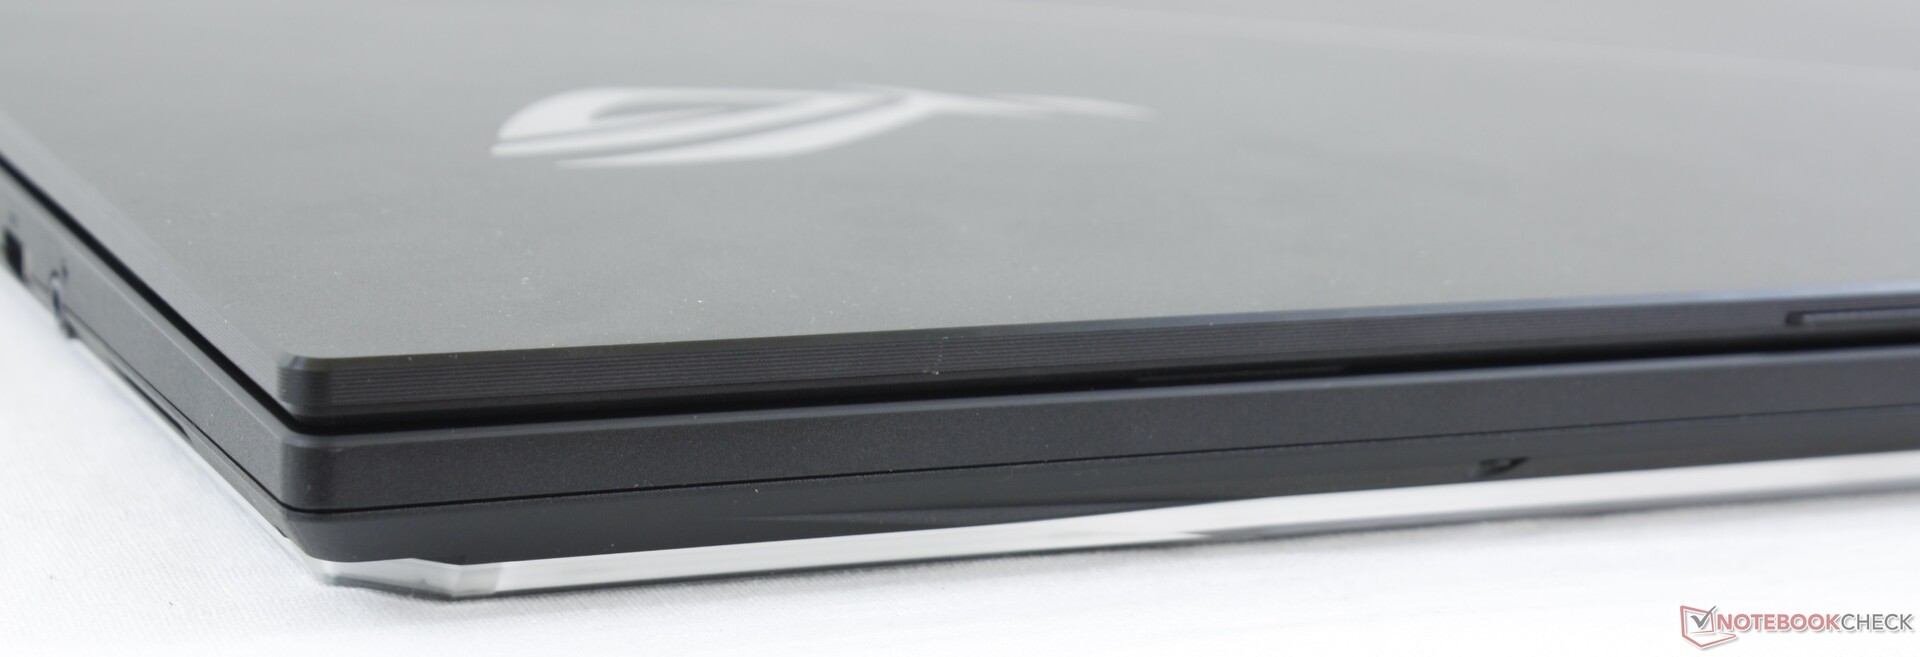
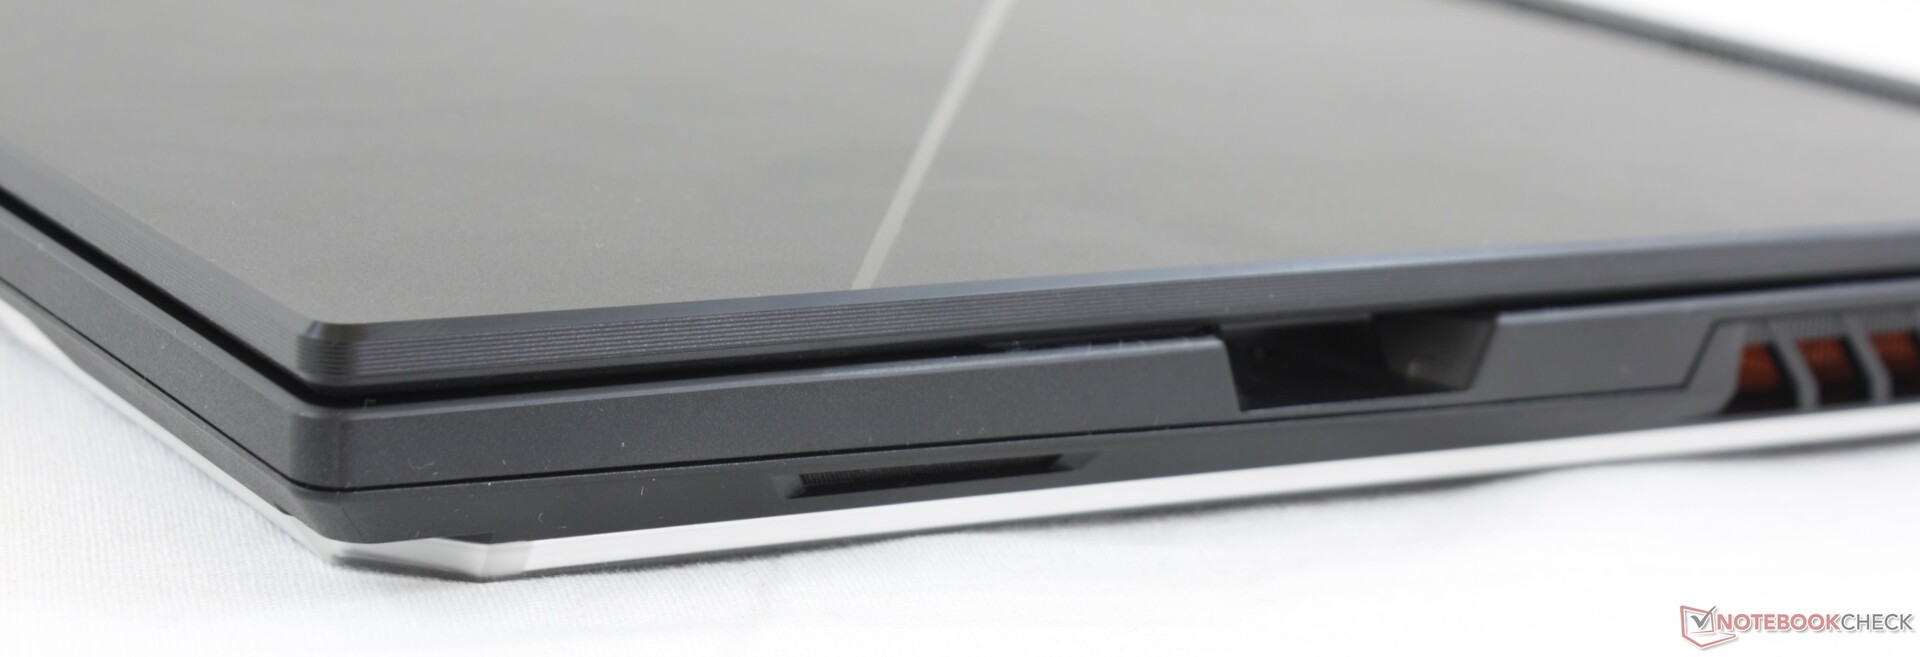
Se você valoriza ter três slots de armazenamento M.2, o Asus ROG G532 é um dos poucos portáteis para jogos de 15,6 polegadas disponíveis com esse recurso. No entanto, o sistema ainda sofre das mesmas desvantagens do modelo do ano passado, já que o chassi permanece idêntico. O MSI GE66, que foi lançado há alguns meses para desafiar o ROG G532, é menor e ainda consegue carregar uma bateria maior e as mesmas opções de hardware Core i9, RTX 2070 Super e 15,6 polegadas a 300 Hz. O desempenho do nosso Asus não deve ser subestimado, mas será necessário mais do que apenas velocidade e suporte do Keystone, se você quiser acompanhar os últimos designs dos concorrentes.
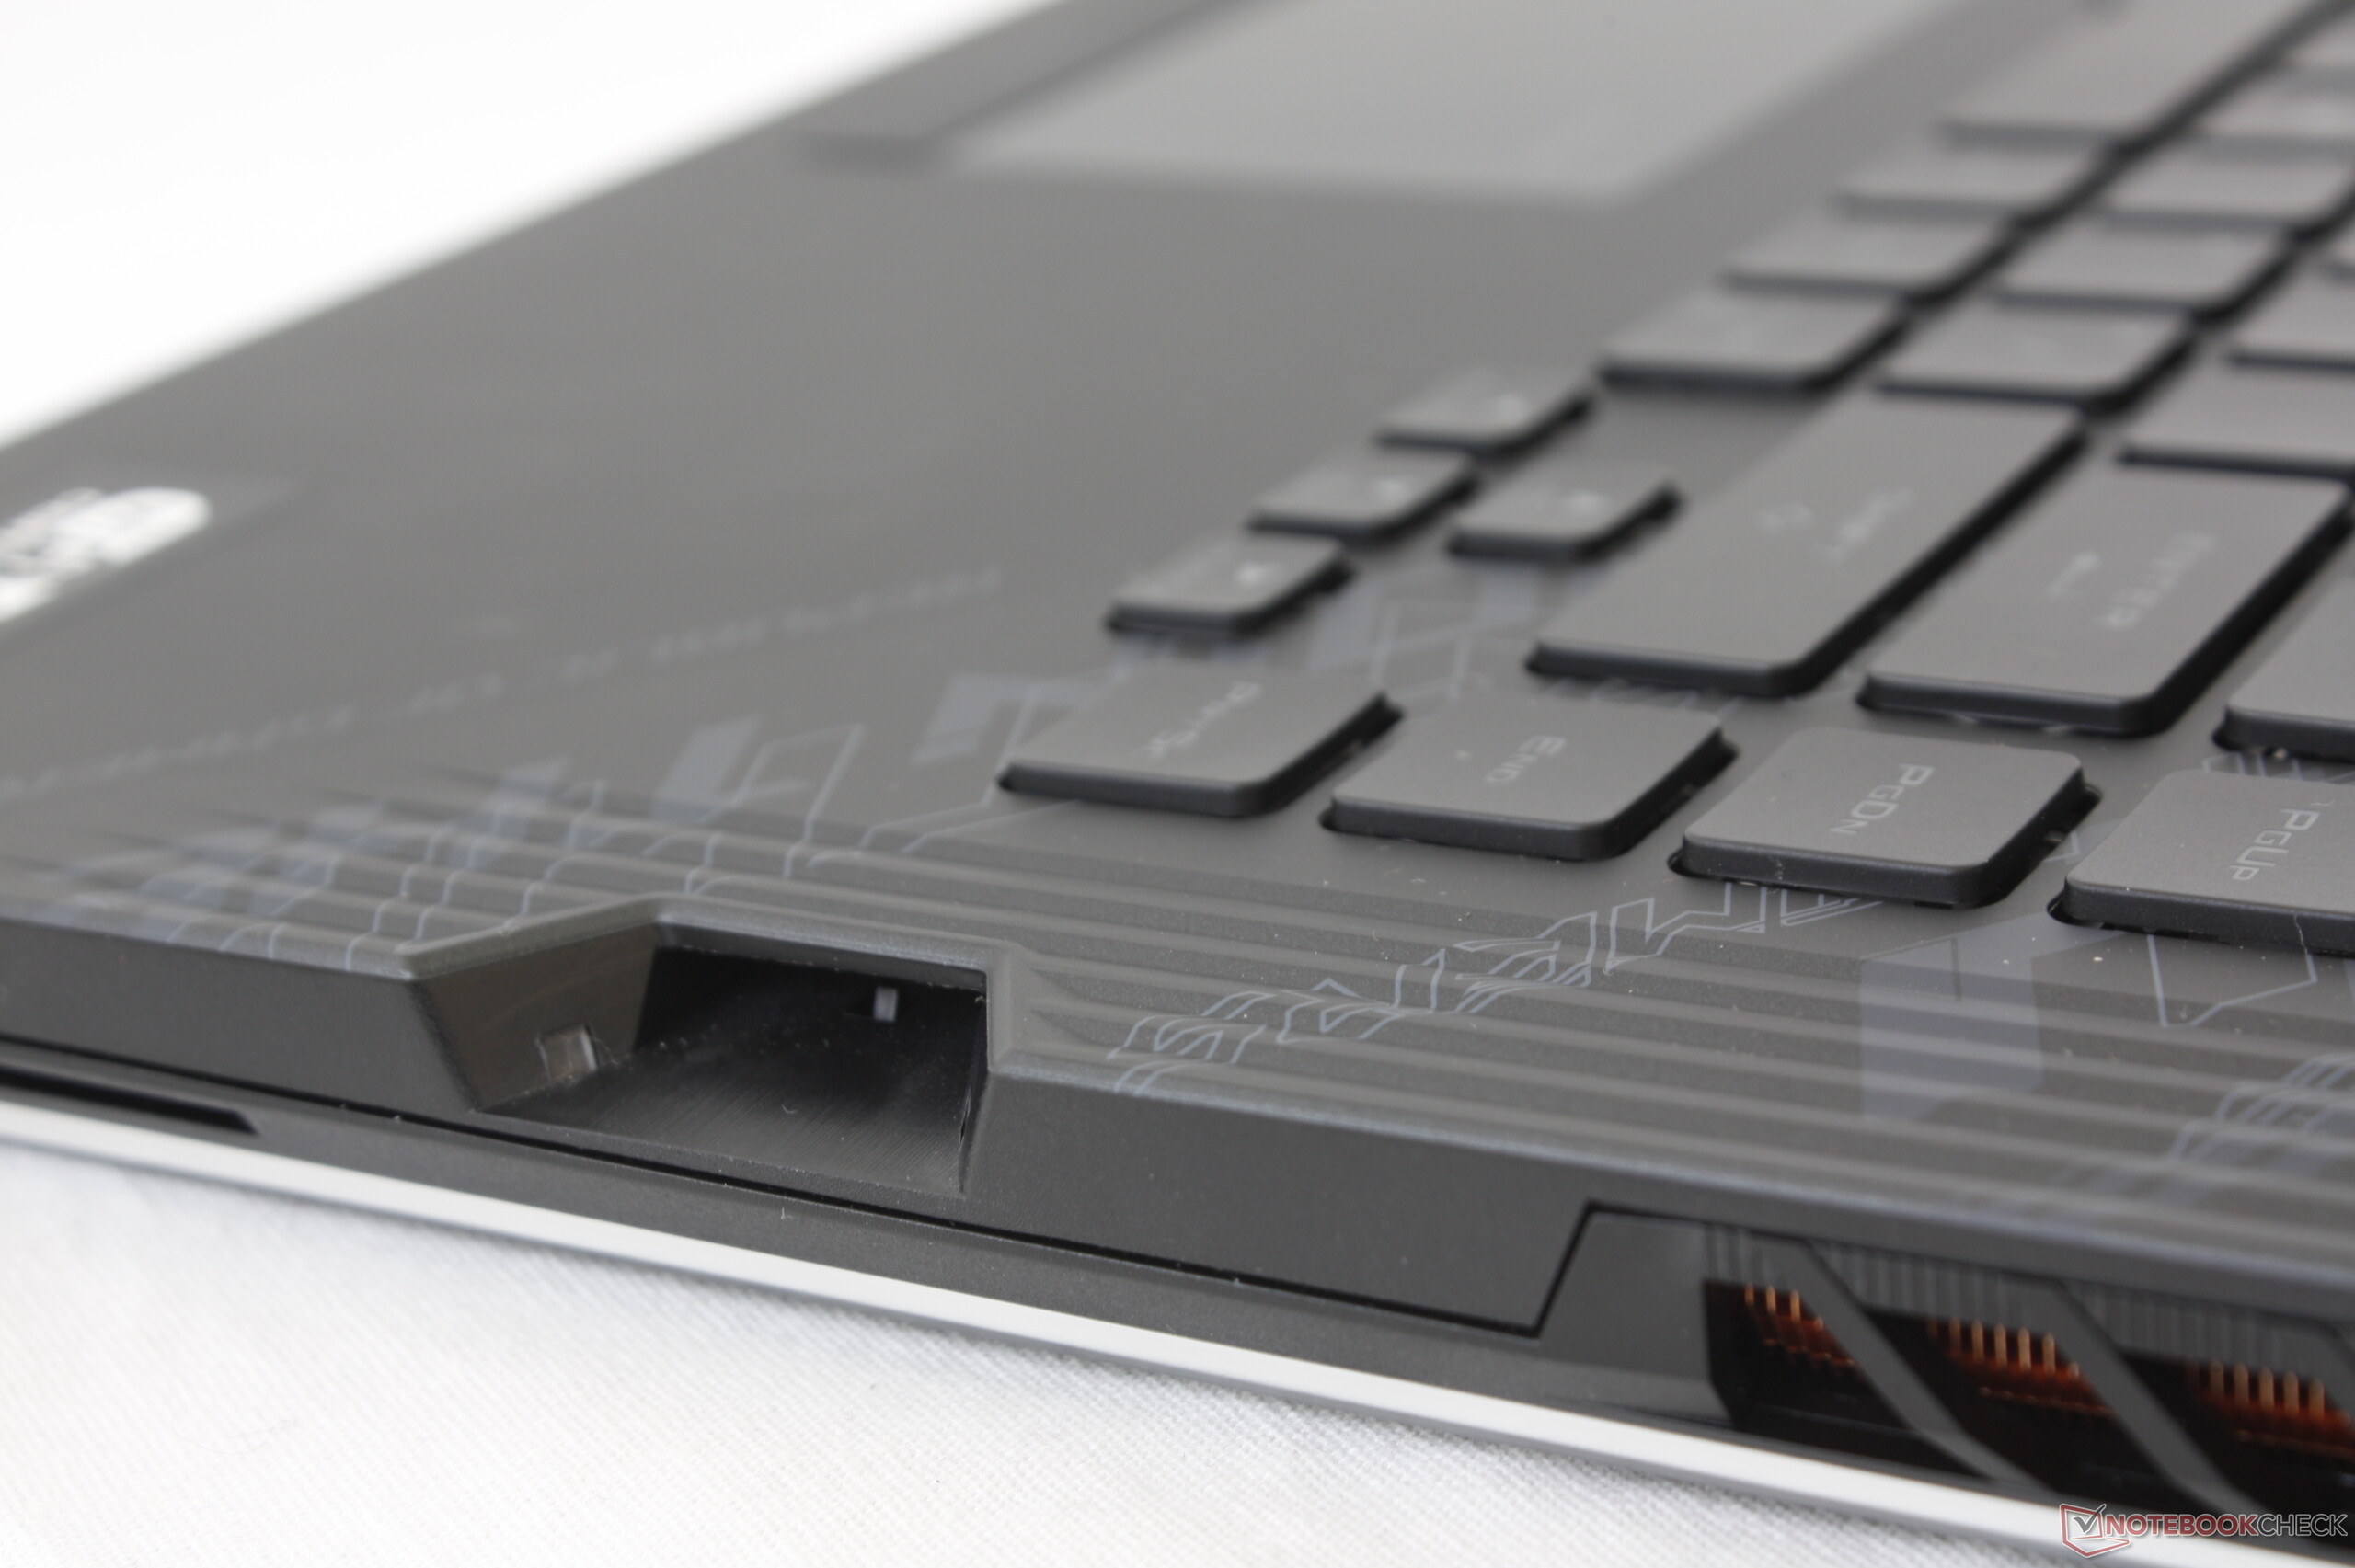
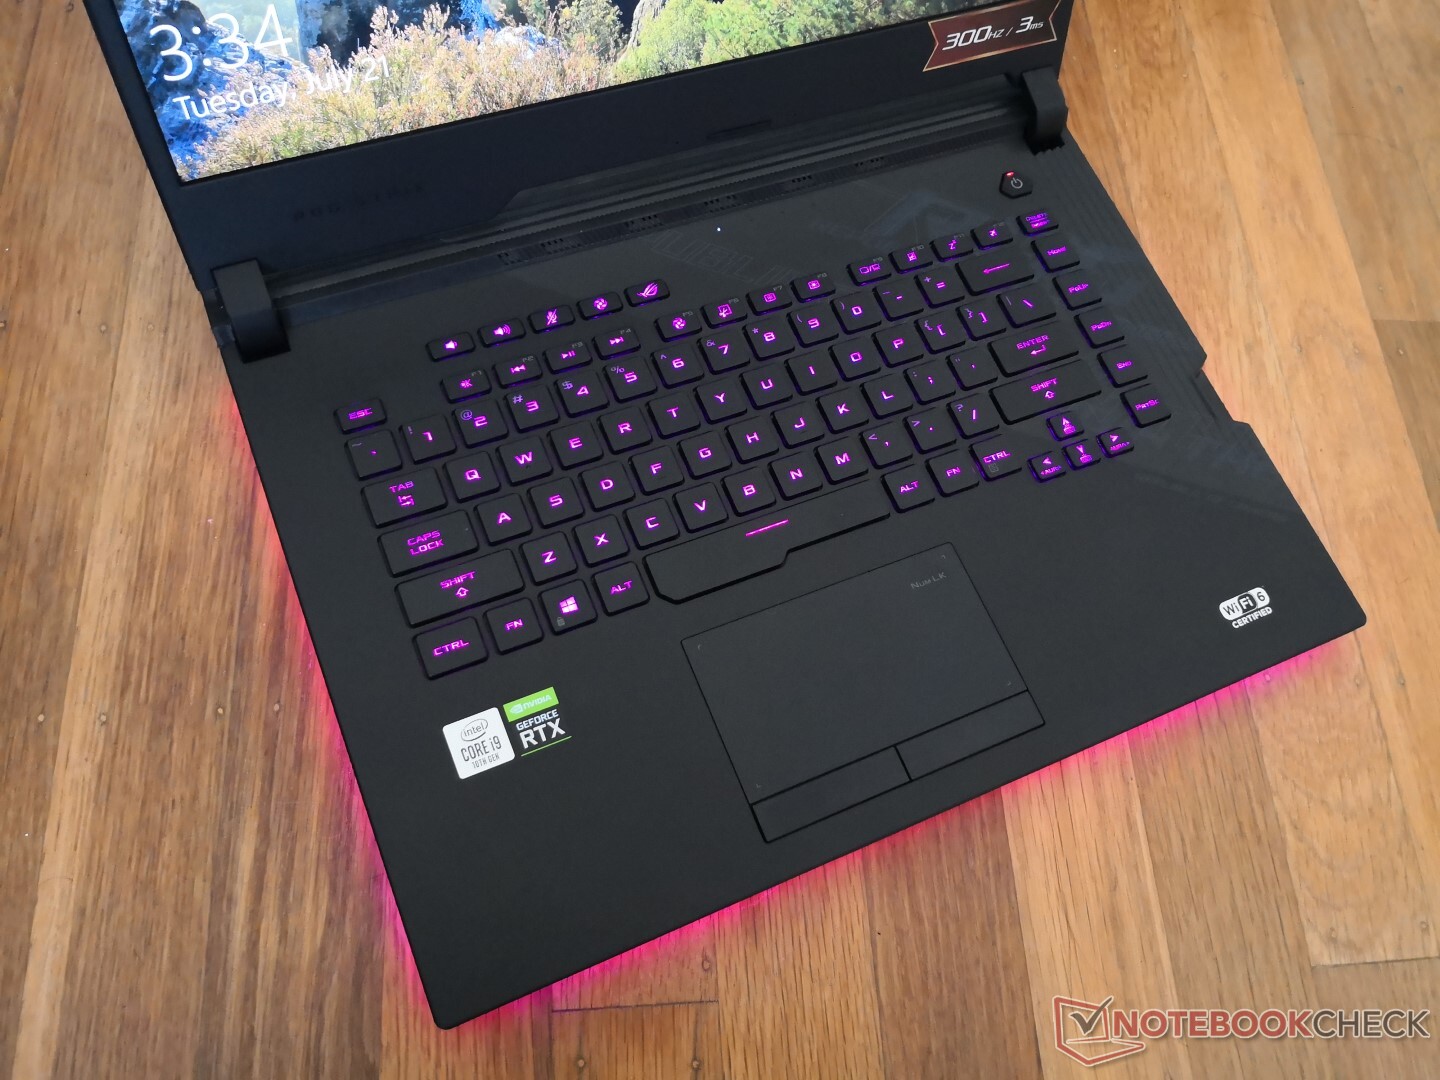
Internamente, o Asus ROG Strix Scar 15 G532LWS vem equipado com alguns dos mais recentes processadores e telas de taxa de atualização rápida que você pode encontrar. Externamente, no entanto, o marco inferior grosso e o tamanho grande estão começando a mostrar sua idade. Os projetos futuros devem se concentrar em reduzir o ruído do ventilador ao jogar para obter uma vantagem única sobre a concorrência ou encolher o chassi para melhor corresponder às alternativas.
Asus ROG Strix Scar 15 G532LWS
- 07/23/2020 v7 (old)
Allen Ngo
Price comparison
