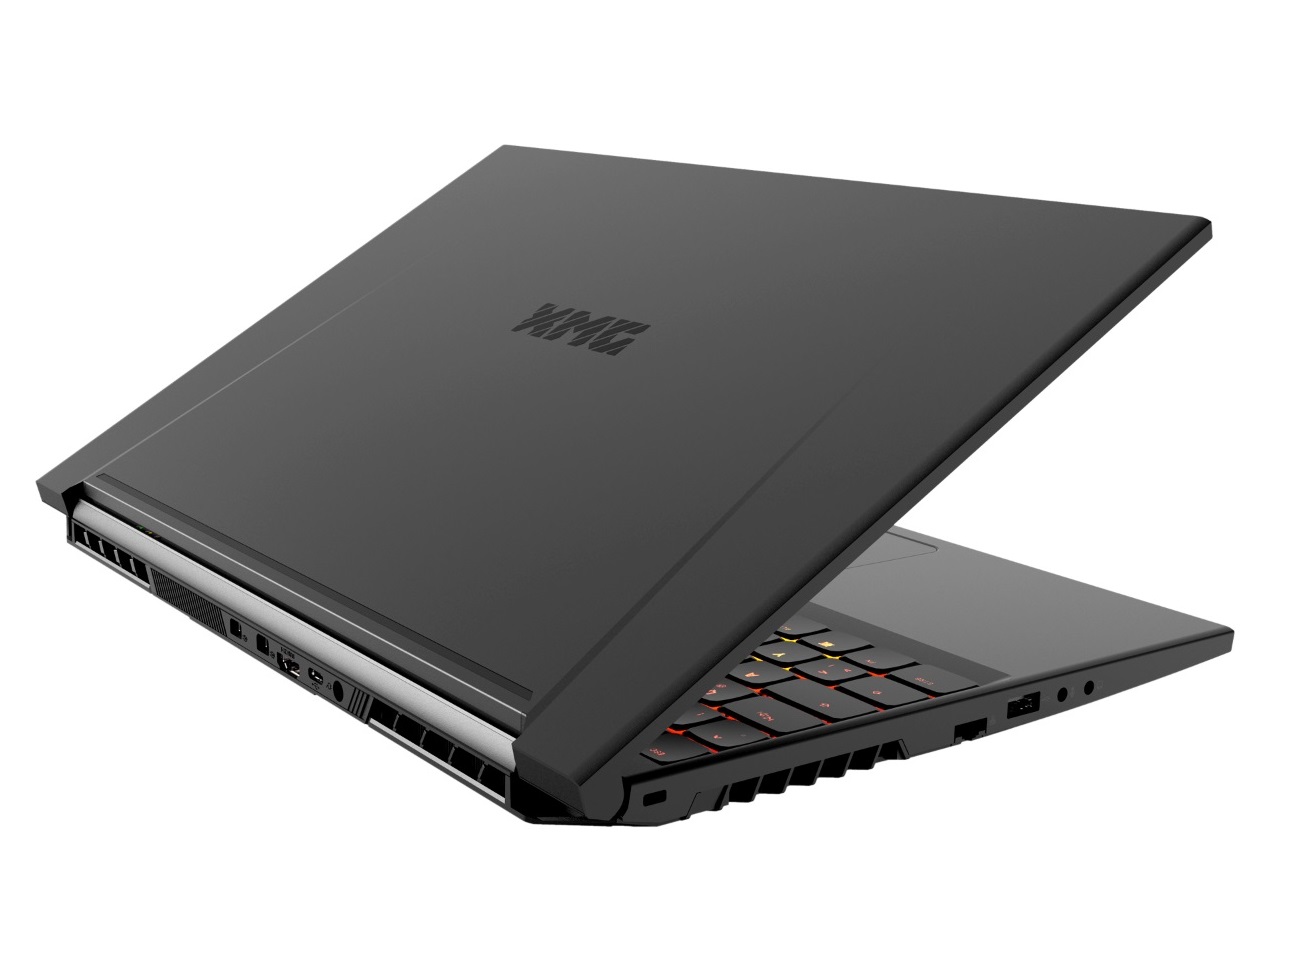
Breve Análise do Portátil Schenker XMG Neo 15 (Tongfang GK5CQ7Z): Um portátil de jogos com marcos finos
Avaliação | Data | Modelo | Peso | Altura | Size | Resolução | Preço |
|---|---|---|---|---|---|---|---|
| 82.8 % v7 (old) | 12/2019 | Schenker XMG Neo 15 XNE15M19 i7-9750H, GeForce RTX 2070 Max-Q | 2.1 kg | 22 mm | 15.60" | 1920x1080 | |
| 84 % v7 (old) | 08/2019 | Acer Predator Triton 500 PT515-51-71PZ i7-9750H, GeForce RTX 2070 Max-Q | 2.1 kg | 18 mm | 15.60" | 1920x1080 | |
| 84 % v7 (old) | 05/2019 | Gigabyte Aero 15 Classic-XA i7-9750H, GeForce RTX 2070 Max-Q | 2.1 kg | 19 mm | 15.60" | 1920x1080 | |
| 82.3 % v7 (old) | 09/2019 | HP Omen X 2S 15-dg0075cl i7-9750H, GeForce RTX 2070 Max-Q | 2.4 kg | 19.8 mm | 15.60" | 1920x1080 | |
| 84.8 % v7 (old) | Lenovo Legion Y740-15ICHg i7-9750H, GeForce RTX 2070 Max-Q | 2.3 kg | 25 mm | 15.60" | 1920x1080 |
| SD Card Reader | |
| average JPG Copy Test (av. of 3 runs) | |
| Média da turma Gaming (20.9 - 210, n=54, últimos 2 anos) | |
| Schenker XMG Neo 15 XNE15M19 (Toshiba Exceria Pro SDXC 64 GB UHS-II) | |
| maximum AS SSD Seq Read Test (1GB) | |
| Média da turma Gaming (25.5 - 261, n=51, últimos 2 anos) | |
| Schenker XMG Neo 15 XNE15M19 (Toshiba Exceria Pro SDXC 64 GB UHS-II) | |
| Networking | |
| iperf3 transmit AX12 | |
| Schenker XMG Neo 15 XNE15M19 | |
| iperf3 receive AX12 | |
| Schenker XMG Neo 15 XNE15M19 | |
| |||||||||||||||||||||||||
iluminação: 89 %
iluminação com acumulador: 313 cd/m²
Contraste: 1043:1 (Preto: 0.3 cd/m²)
ΔE ColorChecker Calman: 3.33 | ∀{0.5-29.43 Ø4.73}
calibrated: 1.77
ΔE Greyscale Calman: 3.1 | ∀{0.09-98 Ø4.97}
90% sRGB (Argyll 1.6.3 3D)
59% AdobeRGB 1998 (Argyll 1.6.3 3D)
65.4% AdobeRGB 1998 (Argyll 3D)
90.3% sRGB (Argyll 3D)
64% Display P3 (Argyll 3D)
Gamma: 2.51
CCT: 6930 K
| Schenker XMG Neo 15 XNE15M19 NV156FHM-N4G (BOE084D), IPS, 1920x1080 | Acer Predator Triton 500 PT515-51-71PZ NV156FHM-N4K (BOE082A), IPS, 1920x1080 | Gigabyte Aero 15 Classic-XA Sharp LQ156M1JW03 (SHP14C5), IGZO, 1920x1080 | HP Omen X 2S 15-dg0075cl AU Optronics AUO82ED, IPS, 1920x1080 | Lenovo Legion Y740-15ICHg BOE NV156FHM-N4J, IPS, 1920x1080 | |
|---|---|---|---|---|---|
| Display | 2% | 3% | 3% | 3% | |
| Display P3 Coverage (%) | 64 | 64.6 1% | 65.3 2% | 66.2 3% | 67.7 6% |
| sRGB Coverage (%) | 90.3 | 92.6 3% | 95.5 6% | 92.3 2% | 91.6 1% |
| AdobeRGB 1998 Coverage (%) | 65.4 | 66 1% | 66.5 2% | 67.2 3% | 67.1 3% |
| Response Times | 27% | -26% | -24% | -41% | |
| Response Time Grey 50% / Grey 80% * (ms) | 9.6 ? | 5.2 ? 46% | 15.2 ? -58% | 15.2 ? -58% | 19 ? -98% |
| Response Time Black / White * (ms) | 12 ? | 11.2 ? 7% | 11.2 ? 7% | 10.8 ? 10% | 10 ? 17% |
| PWM Frequency (Hz) | 23580 ? | ||||
| Screen | 4% | 1% | -18% | 19% | |
| Brightness middle (cd/m²) | 313 | 288 -8% | 266 -15% | 324.8 4% | 477 52% |
| Brightness (cd/m²) | 295 | 265 -10% | 248 -16% | 316 7% | 431 46% |
| Brightness Distribution (%) | 89 | 84 -6% | 89 0% | 84 -6% | 84 -6% |
| Black Level * (cd/m²) | 0.3 | 0.22 27% | 0.31 -3% | 0.26 13% | 0.175 42% |
| Contrast (:1) | 1043 | 1309 26% | 858 -18% | 1249 20% | 2726 161% |
| Colorchecker dE 2000 * | 3.33 | 3.22 3% | 2.78 17% | 4.96 -49% | 4.17 -25% |
| Colorchecker dE 2000 max. * | 6.25 | 6.26 -0% | 5.96 5% | 8.95 -43% | 6.97 -12% |
| Colorchecker dE 2000 calibrated * | 1.77 | 1.5 15% | 0.91 49% | 3.23 -82% | 2.51 -42% |
| Greyscale dE 2000 * | 3.1 | 3.43 -11% | 3.58 -15% | 5 -61% | 3.49 -13% |
| Gamma | 2.51 88% | 2.41 91% | 2.46 89% | 2.21 100% | 2.5 88% |
| CCT | 6930 94% | 7290 89% | 7186 90% | 7742 84% | 7076 92% |
| Color Space (Percent of AdobeRGB 1998) (%) | 59 | 60 2% | 62 5% | 59.8 1% | 60 2% |
| Color Space (Percent of sRGB) (%) | 90 | 93 3% | 96 7% | 91.8 2% | 91 1% |
| Média Total (Programa/Configurações) | 11% /
6% | -7% /
-2% | -13% /
-15% | -6% /
8% |
* ... menor é melhor
Exibir tempos de resposta
| ↔ Tempo de resposta preto para branco | ||
|---|---|---|
| 12 ms ... ascensão ↗ e queda ↘ combinadas | ↗ 6.8 ms ascensão | 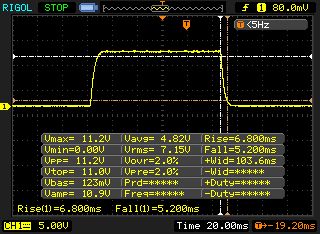 |
| ↘ 5.2 ms queda | ||
| A tela mostra boas taxas de resposta em nossos testes, mas pode ser muito lenta para jogadores competitivos. Em comparação, todos os dispositivos testados variam de 0.1 (mínimo) a 240 (máximo) ms. » 31 % de todos os dispositivos são melhores. Isso significa que o tempo de resposta medido é melhor que a média de todos os dispositivos testados (19.9 ms). | ||
| ↔ Tempo de resposta 50% cinza a 80% cinza | ||
| 9.6 ms ... ascensão ↗ e queda ↘ combinadas | ↗ 4.8 ms ascensão | 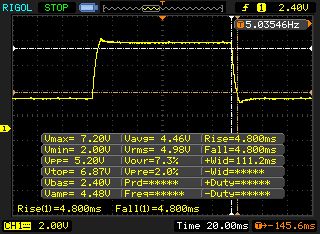 |
| ↘ 4.8 ms queda | ||
| A tela mostra taxas de resposta rápidas em nossos testes e deve ser adequada para jogos. Em comparação, todos os dispositivos testados variam de 0.165 (mínimo) a 636 (máximo) ms. » 23 % de todos os dispositivos são melhores. Isso significa que o tempo de resposta medido é melhor que a média de todos os dispositivos testados (31.1 ms). | ||
Cintilação da tela / PWM (modulação por largura de pulso)
| Tela tremeluzindo / PWM não detectado | 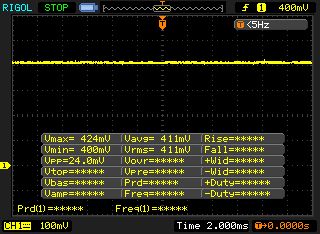 | ||
[pwm_comparison] Em comparação: 52 % de todos os dispositivos testados não usam PWM para escurecer a tela. Se PWM foi detectado, uma média de 7794 (mínimo: 5 - máximo: 343500) Hz foi medida. | |||
| Cinebench R20 | |
| CPU (Single Core) | |
| Média da turma Gaming (442 - 895, n=111, últimos 2 anos) | |
| Acer Predator Triton 500 PT515-51-71PZ | |
| Lenovo Legion Y740-15ICHg | |
| HP Omen X 2S 15-dg0075cl | |
| Schenker XMG Neo 15 XNE15M19 | |
| Gigabyte Aero 15 Classic-XA | |
| CPU (Multi Core) | |
| Média da turma Gaming (4029 - 16108, n=111, últimos 2 anos) | |
| Lenovo Legion Y740-15ICHg | |
| Acer Predator Triton 500 PT515-51-71PZ | |
| Gigabyte Aero 15 Classic-XA | |
| Schenker XMG Neo 15 XNE15M19 | |
| HP Omen X 2S 15-dg0075cl | |
| Cinebench R15 | |
| CPU Single 64Bit | |
| Média da turma Gaming (188.8 - 343, n=111, últimos 2 anos) | |
| Schenker XMG Neo 15 XNE15M19 | |
| Acer Predator Triton 500 PT515-51-71PZ | |
| Lenovo Legion Y740-15ICHg | |
| HP Omen X 2S 15-dg0075cl | |
| Gigabyte Aero 15 Classic-XA | |
| CPU Multi 64Bit | |
| Média da turma Gaming (1578 - 6271, n=111, últimos 2 anos) | |
| Acer Predator Triton 500 PT515-51-71PZ | |
| Lenovo Legion Y740-15ICHg | |
| Schenker XMG Neo 15 XNE15M19 | |
| Gigabyte Aero 15 Classic-XA | |
| HP Omen X 2S 15-dg0075cl | |
| PCMark 10 - Score | |
| Média da turma Gaming (5828 - 11574, n=95, últimos 2 anos) | |
| HP Omen X 2S 15-dg0075cl | |
| Lenovo Legion Y740-15ICHg | |
| Acer Predator Triton 500 PT515-51-71PZ | |
| Gigabyte Aero 15 Classic-XA | |
| Schenker XMG Neo 15 XNE15M19 | |
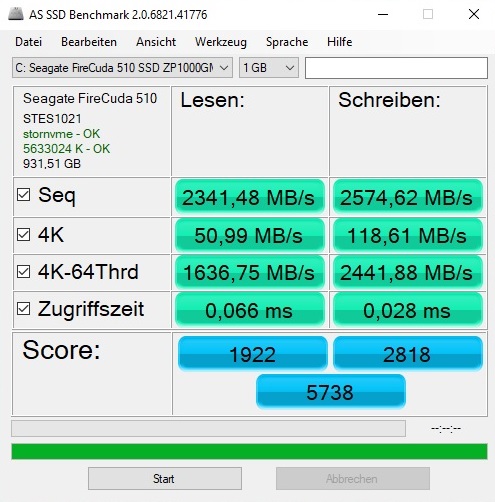
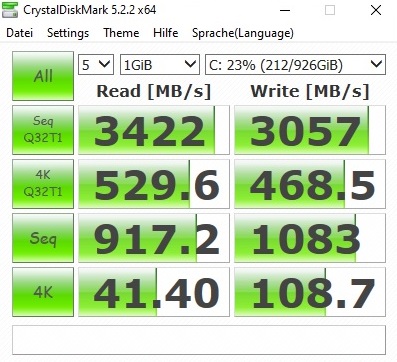
| Schenker XMG Neo 15 XNE15M19 Seagate FireCuda 510 SSD ZP1000GM30001 | Acer Predator Triton 500 PT515-51-71PZ WDC PC SN720 SDAPNTW-512G | Gigabyte Aero 15 Classic-XA Intel SSD 760p SSDPEKKW512G8 | HP Omen X 2S 15-dg0075cl WDC PC SN720 SDAPNTW-1T00 | Lenovo Legion Y740-15ICHg WDC PC SN520 SDAPMUW-128G | |
|---|---|---|---|---|---|
| CrystalDiskMark 5.2 / 6 | 22% | 22% | 27% | -32% | |
| Write 4K (MB/s) | 108.7 | 108.8 0% | 115.5 6% | 137.4 26% | 134.2 23% |
| Read 4K (MB/s) | 41.4 | 40.31 -3% | 58 40% | 41.37 0% | 37.72 -9% |
| Write Seq (MB/s) | 1083 | 2488 130% | 1555 44% | 2500 131% | 389.2 -64% |
| Read Seq (MB/s) | 917 | 1916 109% | 2590 182% | 1576 72% | 1030 12% |
| Write 4K Q32T1 (MB/s) | 468.5 | 382.4 -18% | 369.3 -21% | 446.7 -5% | 238.9 -49% |
| Read 4K Q32T1 (MB/s) | 530 | 421.8 -20% | 441.7 -17% | 522 -2% | 343.9 -35% |
| Write Seq Q32T1 (MB/s) | 3057 | 2542 -17% | 1547 -49% | 2796 -9% | 789 -74% |
| Read Seq Q32T1 (MB/s) | 3422 | 3320 -3% | 2969 -13% | 3415 0% | 1502 -56% |

| 3DMark 11 Performance | 18275 pontos | |
| 3DMark Cloud Gate Standard Score | 34619 pontos | |
| 3DMark Fire Strike Score | 15226 pontos | |
| 3DMark Time Spy Score | 6358 pontos | |
Ajuda | ||
| 3DMark | |
| 2560x1440 Port Royal Graphics | |
| Lenovo Legion Y740-15ICHg | |
| Schenker XMG Neo 15 XNE15M19 | |
| Gigabyte Aero 15 Classic-XA | |
| Acer Predator Triton 500 PT515-51-71PZ | |
| HP Omen X 2S 15-dg0075cl | |
| 1920x1080 Fire Strike Graphics | |
| Acer Predator Triton 500 PT515-51-71PZ | |
| Schenker XMG Neo 15 XNE15M19 | |
| Gigabyte Aero 15 Classic-XA | |
| Lenovo Legion Y740-15ICHg | |
| HP Omen X 2S 15-dg0075cl | |
| 2560x1440 Time Spy Graphics | |
| Lenovo Legion Y740-15ICHg | |
| Acer Predator Triton 500 PT515-51-71PZ | |
| Gigabyte Aero 15 Classic-XA | |
| HP Omen X 2S 15-dg0075cl | |
| Schenker XMG Neo 15 XNE15M19 | |
| 3DMark 11 - 1280x720 Performance GPU | |
| Acer Predator Triton 500 PT515-51-71PZ | |
| Gigabyte Aero 15 Classic-XA | |
| Lenovo Legion Y740-15ICHg | |
| Schenker XMG Neo 15 XNE15M19 | |
| HP Omen X 2S 15-dg0075cl | |
| The Witcher 3 - 1920x1080 Ultra Graphics & Postprocessing (HBAO+) | |
| Média da turma Gaming (95 - 240, n=8, últimos 2 anos) | |
| Schenker XMG Neo 15 (Overboost) | |
| Schenker XMG Neo 15 XNE15M19 | |
| Call of Duty Modern Warfare 2019 - 1920x1080 Maximum Settings AA:T2X Filmic SM | |
| Schenker XMG Neo 15 (Overboost) | |
| Schenker XMG Neo 15 XNE15M19 | |
| GRID 2019 - 1920x1080 Ultra High Preset | |
| Schenker XMG Neo 15 (Overboost) | |
| Schenker XMG Neo 15 XNE15M19 | |
| Ghost Recon Breakpoint - 1920x1080 Ultra Preset AA:T | |
| Schenker XMG Neo 15 (Overboost) | |
| Schenker XMG Neo 15 XNE15M19 | |
| FIFA 20 - 1920x1080 Ultra Preset AA:4xMS | |
| Schenker XMG Neo 15 (Overboost) | |
| Schenker XMG Neo 15 XNE15M19 | |
| Borderlands 3 - 1920x1080 Badass Overall Quality (DX11) | |
| Schenker XMG Neo 15 (Overboost) | |
| Schenker XMG Neo 15 XNE15M19 | |
| Control - 1920x1080 High Quality Preset | |
| Schenker XMG Neo 15 (Overboost) | |
| Schenker XMG Neo 15 XNE15M19 | |
| Apex Legends - 1920x1080 Maximum Settings AA:TS AF:16x | |
| Schenker XMG Neo 15 (Overboost) | |
| Schenker XMG Neo 15 XNE15M19 | |
| Rage 2 - 1920x1080 Ultra Preset (Resolution Scale Off) | |
| Schenker XMG Neo 15 (Overboost) | |
| Schenker XMG Neo 15 XNE15M19 | |
| baixo | média | alto | ultra | |
|---|---|---|---|---|
| The Witcher 3 (2015) | 113 | 60.4 | ||
| Apex Legends (2019) | 124 | 123 | ||
| Rage 2 (2019) | 85.5 | 83.2 | ||
| F1 2019 (2019) | 147 | 105 | ||
| Control (2019) | 59.3 | |||
| Borderlands 3 (2019) | 69.3 | 53 | ||
| FIFA 20 (2019) | 203 | 195 | ||
| Ghost Recon Breakpoint (2019) | 78 | 57 | ||
| GRID 2019 (2019) | 107 | 65.1 | ||
| Call of Duty Modern Warfare 2019 (2019) | 96.9 | 83.2 | ||
| Star Wars Jedi Fallen Order (2019) | 91.8 | 84.4 |
Barulho
| Ocioso |
| 31 / 34 / 37 dB |
| Carga |
| 47 / 54 dB |
 | ||
30 dB silencioso 40 dB(A) audível 50 dB(A) ruidosamente alto |
||
min: | ||
| Schenker XMG Neo 15 XNE15M19 i7-9750H, GeForce RTX 2070 Max-Q | Acer Predator Triton 500 PT515-51-71PZ i7-9750H, GeForce RTX 2070 Max-Q | Gigabyte Aero 15 Classic-XA i7-9750H, GeForce RTX 2070 Max-Q | HP Omen X 2S 15-dg0075cl i7-9750H, GeForce RTX 2070 Max-Q | Lenovo Legion Y740-15ICHg i7-9750H, GeForce RTX 2070 Max-Q | Média da turma Gaming | |
|---|---|---|---|---|---|---|
| Noise | 2% | -1% | 7% | 9% | 14% | |
| desligado / ambiente * (dB) | 31 | 30 3% | 30 3% | 29 6% | 30 3% | 24.1 ? 22% |
| Idle Minimum * (dB) | 31 | 30 3% | 31 -0% | 30.5 2% | 31.3 -1% | 25.8 ? 17% |
| Idle Average * (dB) | 34 | 33 3% | 34 -0% | 31.5 7% | 31.3 8% | 27.4 ? 19% |
| Idle Maximum * (dB) | 37 | 39 -5% | 39 -5% | 31.5 15% | 31.3 15% | 30 ? 19% |
| Load Average * (dB) | 47 | 45 4% | 46 2% | 40.6 14% | 42 11% | 43 ? 9% |
| Witcher 3 ultra * (dB) | 50 | 49 2% | 53 -6% | 49.5 1% | 42.1 16% | |
| Load Maximum * (dB) | 54 | 51 6% | 55 -2% | 53.4 1% | 46.5 14% | 54 ? -0% |
* ... menor é melhor
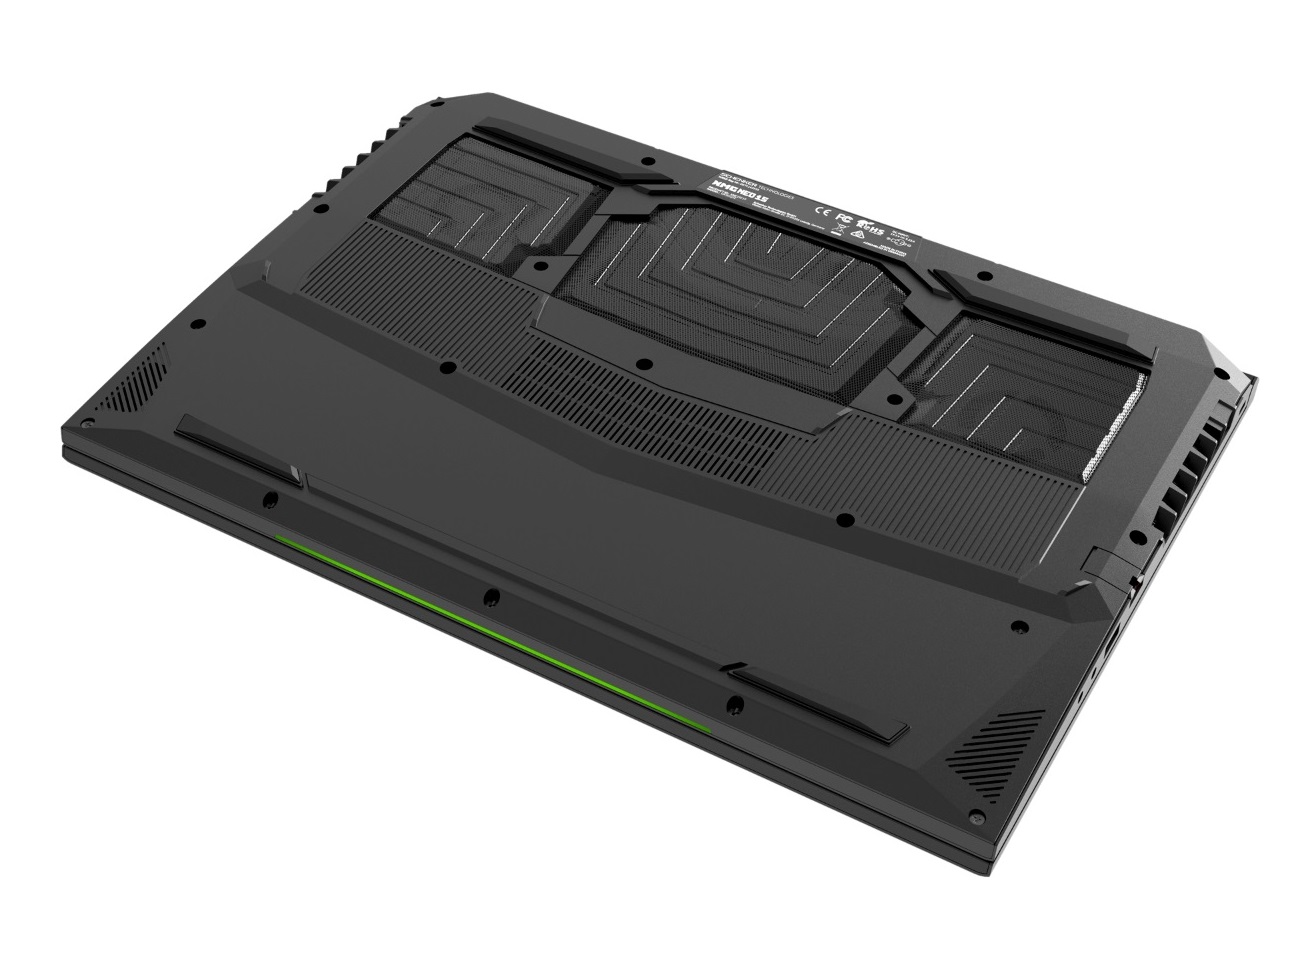
(-) A temperatura máxima no lado superior é 60 °C / 140 F, em comparação com a média de 40.4 °C / 105 F , variando de 21.2 a 68.8 °C para a classe Gaming.
(-) A parte inferior aquece até um máximo de 66 °C / 151 F, em comparação com a média de 43.2 °C / 110 F
(+) Em uso inativo, a temperatura média para o lado superior é 27.2 °C / 81 F, em comparação com a média do dispositivo de 33.9 °C / ### class_avg_f### F.
(-) Jogando The Witcher 3, a temperatura média para o lado superior é 46.8 °C / 116 F, em comparação com a média do dispositivo de 33.9 °C / ## #class_avg_f### F.
(-) Os apoios para as mãos e o touchpad podem ficar muito quentes ao toque, com um máximo de 43 °C / 109.4 F.
(-) A temperatura média da área do apoio para as mãos de dispositivos semelhantes foi 28.8 °C / 83.8 F (-14.2 °C / -25.6 F).
| Schenker XMG Neo 15 XNE15M19 i7-9750H, GeForce RTX 2070 Max-Q | Acer Predator Triton 500 PT515-51-71PZ i7-9750H, GeForce RTX 2070 Max-Q | Gigabyte Aero 15 Classic-XA i7-9750H, GeForce RTX 2070 Max-Q | HP Omen X 2S 15-dg0075cl i7-9750H, GeForce RTX 2070 Max-Q | Lenovo Legion Y740-15ICHg i7-9750H, GeForce RTX 2070 Max-Q | Média da turma Gaming | |
|---|---|---|---|---|---|---|
| Heat | 11% | 2% | -11% | -0% | 10% | |
| Maximum Upper Side * (°C) | 60 | 49 18% | 58 3% | 48.8 19% | 43.9 27% | 45.2 ? 25% |
| Maximum Bottom * (°C) | 66 | 59 11% | 64 3% | 55 17% | 47.6 28% | 48 ? 27% |
| Idle Upper Side * (°C) | 30 | 28 7% | 30 -0% | 41 -37% | 38.6 -29% | 31.1 ? -4% |
| Idle Bottom * (°C) | 32 | 29 9% | 31 3% | 45.6 -43% | 40.8 -27% | 34.2 ? -7% |
* ... menor é melhor
Schenker XMG Neo 15 XNE15M19 análise de áudio
(±) | o volume do alto-falante é médio, mas bom (###valor### dB)
Graves 100 - 315Hz
(-) | quase nenhum baixo - em média 27.4% menor que a mediana
(±) | a linearidade dos graves é média (11% delta para a frequência anterior)
Médios 400 - 2.000 Hz
(+) | médios equilibrados - apenas 3.6% longe da mediana
(±) | a linearidade dos médios é média (9.2% delta para frequência anterior)
Altos 2 - 16 kHz
(+) | agudos equilibrados - apenas 2.3% longe da mediana
(+) | os máximos são lineares (4.5% delta da frequência anterior)
Geral 100 - 16.000 Hz
(±) | a linearidade do som geral é média (20.8% diferença em relação à mediana)
Comparado com a mesma classe
» 75% de todos os dispositivos testados nesta classe foram melhores, 4% semelhantes, 21% piores
» O melhor teve um delta de 6%, a média foi 18%, o pior foi 132%
Comparado com todos os dispositivos testados
» 56% de todos os dispositivos testados foram melhores, 8% semelhantes, 36% piores
» O melhor teve um delta de 4%, a média foi 24%, o pior foi 134%
Acer Predator Triton 500 PT515-51-71PZ análise de áudio
(±) | o volume do alto-falante é médio, mas bom (###valor### dB)
Graves 100 - 315Hz
(±) | graves reduzidos - em média 12.2% menor que a mediana
(±) | a linearidade dos graves é média (12.6% delta para a frequência anterior)
Médios 400 - 2.000 Hz
(+) | médios equilibrados - apenas 4.5% longe da mediana
(+) | médios são lineares (4.7% delta para frequência anterior)
Altos 2 - 16 kHz
(+) | agudos equilibrados - apenas 2.2% longe da mediana
(+) | os máximos são lineares (3.2% delta da frequência anterior)
Geral 100 - 16.000 Hz
(+) | o som geral é linear (14.8% diferença em relação à mediana)
Comparado com a mesma classe
» 29% de todos os dispositivos testados nesta classe foram melhores, 7% semelhantes, 64% piores
» O melhor teve um delta de 6%, a média foi 18%, o pior foi 132%
Comparado com todos os dispositivos testados
» 20% de todos os dispositivos testados foram melhores, 4% semelhantes, 76% piores
» O melhor teve um delta de 4%, a média foi 24%, o pior foi 134%
| desligado | |
| Ocioso | |
| Carga |
|
Key:
min: | |
| Schenker XMG Neo 15 XNE15M19 i7-9750H, GeForce RTX 2070 Max-Q | Acer Predator Triton 500 PT515-51-71PZ i7-9750H, GeForce RTX 2070 Max-Q | Gigabyte Aero 15 Classic-XA i7-9750H, GeForce RTX 2070 Max-Q | HP Omen X 2S 15-dg0075cl i7-9750H, GeForce RTX 2070 Max-Q | Lenovo Legion Y740-15ICHg i7-9750H, GeForce RTX 2070 Max-Q | Média da turma Gaming | |
|---|---|---|---|---|---|---|
| Power Consumption | 10% | -38% | -144% | -38% | -25% | |
| Idle Minimum * (Watt) | 11 | 7 36% | 21 -91% | 46 -318% | 22.2 -102% | 13.2 ? -20% |
| Idle Average * (Watt) | 15 | 12 20% | 23 -53% | 59 -293% | 24.9 -66% | 18.9 ? -26% |
| Idle Maximum * (Watt) | 21 | 22 -5% | 32 -52% | 65.5 -212% | 30.6 -46% | 24.3 ? -16% |
| Load Average * (Watt) | 94 | 86 9% | 97 -3% | 99.8 -6% | 101 -7% | 108 ? -15% |
| Witcher 3 ultra * (Watt) | 143 | 144 -1% | 148 -3% | 154.1 -8% | 143 -0% | |
| Load Maximum * (Watt) | 173 | 177 -2% | 213 -23% | 222.7 -29% | 186 -8% | 254 ? -47% |
* ... menor é melhor
| Schenker XMG Neo 15 XNE15M19 i7-9750H, GeForce RTX 2070 Max-Q, 62 Wh | Acer Predator Triton 500 PT515-51-71PZ i7-9750H, GeForce RTX 2070 Max-Q, Wh | Gigabyte Aero 15 Classic-XA i7-9750H, GeForce RTX 2070 Max-Q, 94.24 Wh | HP Omen X 2S 15-dg0075cl i7-9750H, GeForce RTX 2070 Max-Q, 72 Wh | Lenovo Legion Y740-15ICHg i7-9750H, GeForce RTX 2070 Max-Q, 57 Wh | Média da turma Gaming | |
|---|---|---|---|---|---|---|
| Duração da bateria | 38% | 60% | -37% | -47% | 18% | |
| Reader / Idle (h) | 7.3 | 11.1 52% | 9.1 25% | 3.7 -49% | 8.71 ? 19% | |
| WiFi v1.3 (h) | 5.7 | 8 40% | 7 23% | 2.2 -61% | 3 -47% | 7.02 ? 23% |
| Load (h) | 1.3 | 1.6 23% | 3 131% | 1.3 0% | 1.47 ? 13% | |
| H.264 (h) | 6.8 | 8.26 ? |
Pro
Contra
Verdict - A laptop that should appeal to almost every gamer
No geral, o Schenker XMG Neo 15 XNE15M19 é um bom portátil para jogos, além de suas altas temperaturas de superfície e ventiladores barulhentos durante os jogos. Nossa unidade de teste oferece um hardware poderoso, porém balanceado, que deve agradar a maioria dos jogadores.
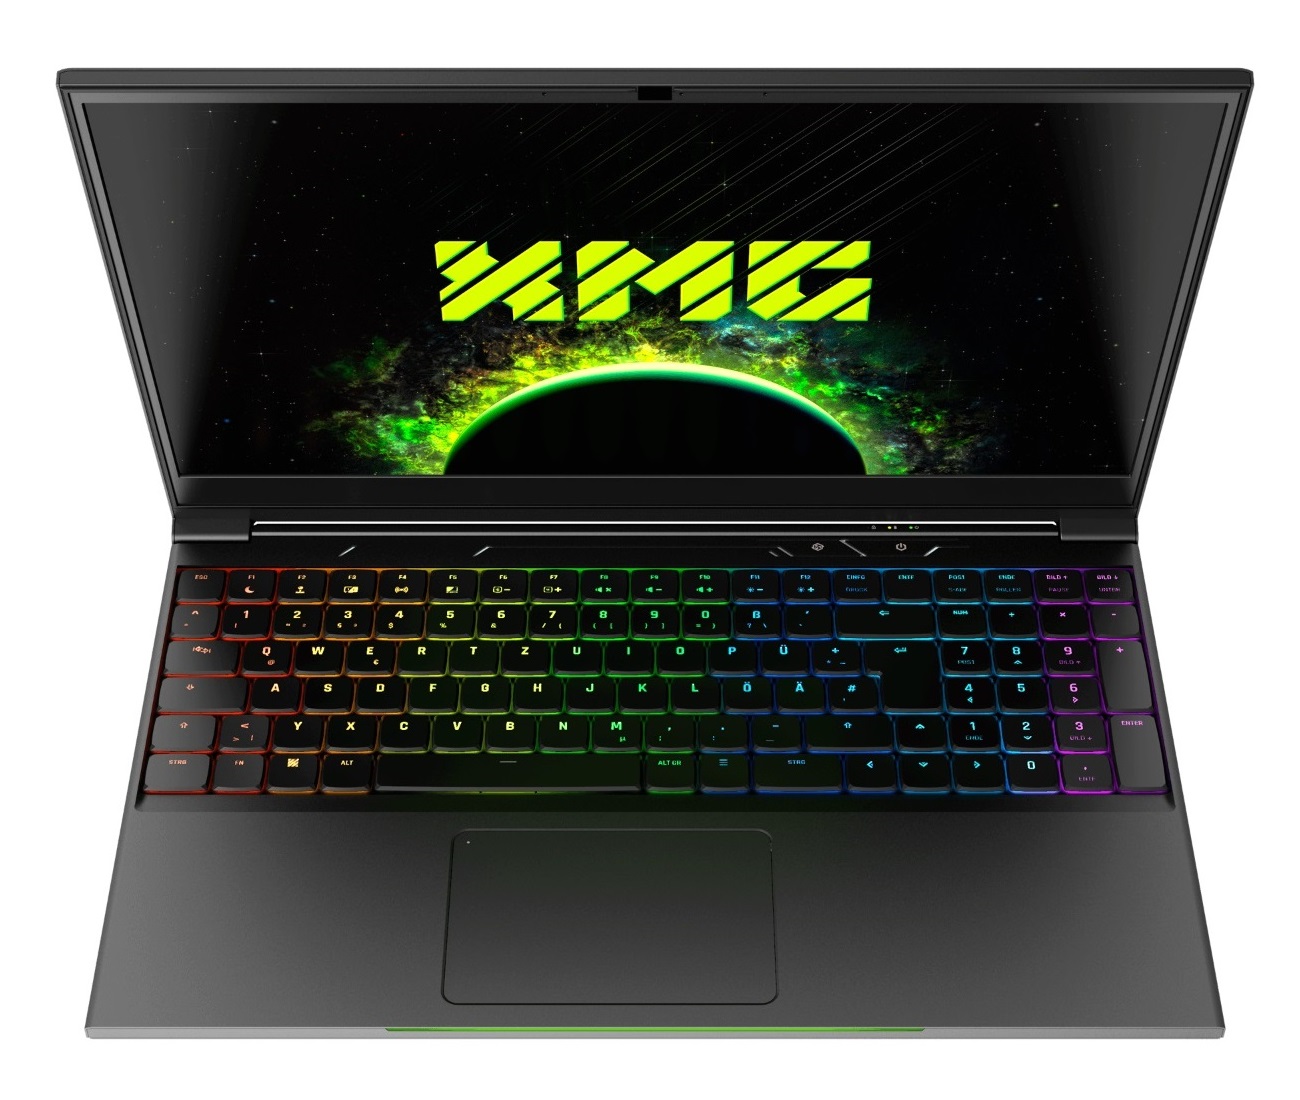
A combinação do Core i7-9750H e da RTX 2070 Max-Q permite que o dispositivo rode todos os jogos modernos sem problemas em sua tela de 144 Hz. Da mesma forma, o chassi de metal compacto e o teclado mecânico do Neo 15 com luz de fundo RGB são outras razões para considerá-lo como seu próximo portátil para jogos. A capacidade de configurar o dispositivo individualmente também é um bônus.
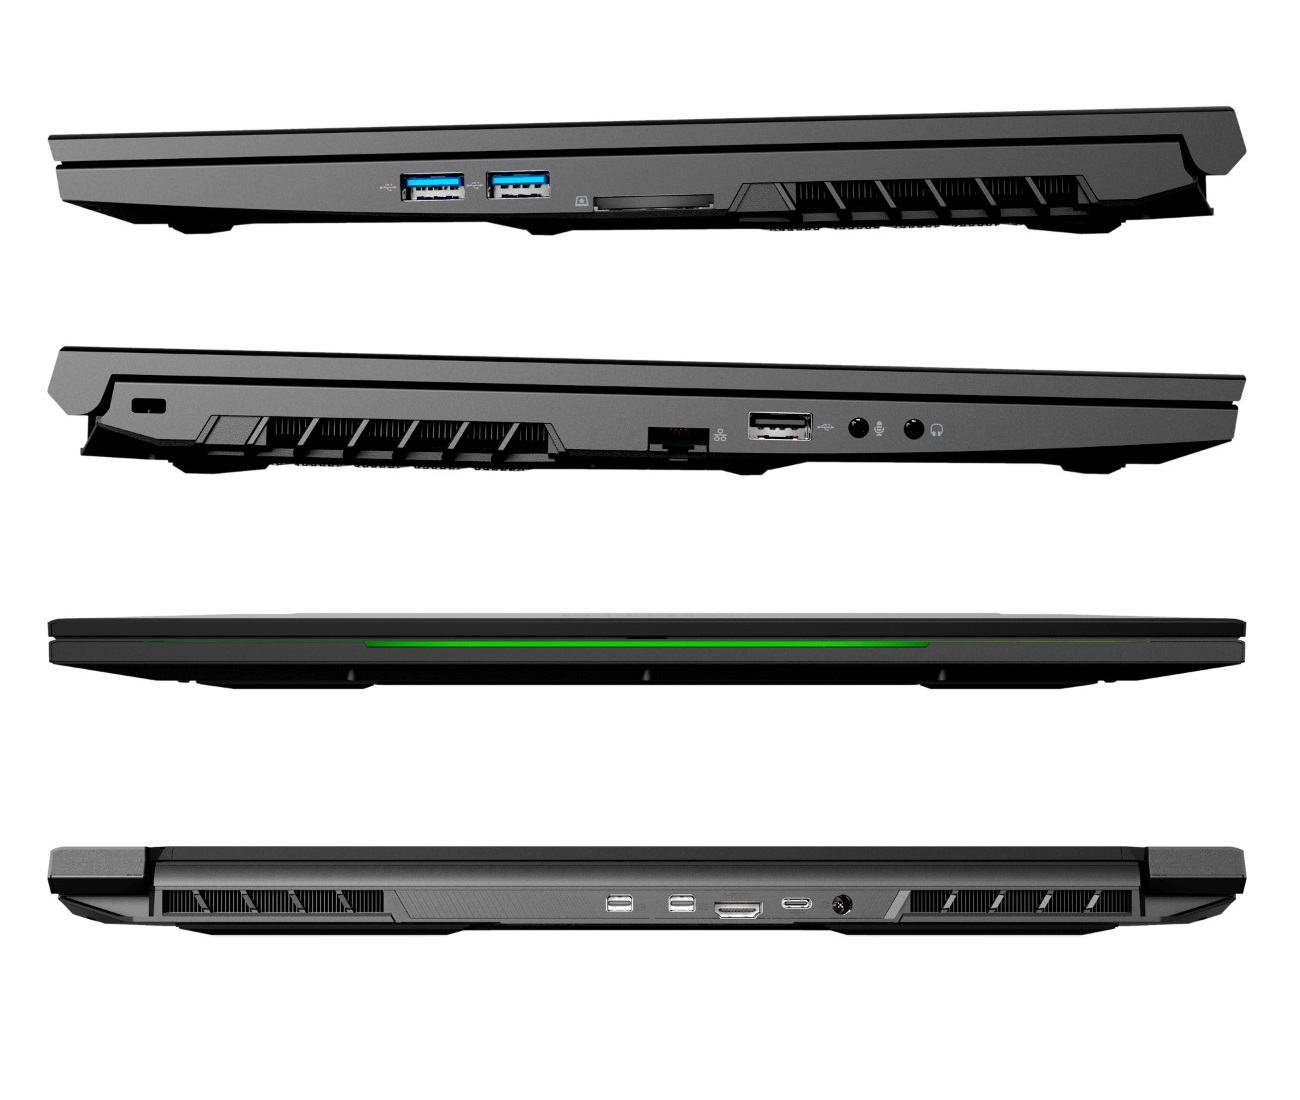
Teria sido bom se a Schenker incluísse uma porta Thunderbolt 3 e alto-falantes melhores. No entanto, esses não devem ser motivos para criticar o XMG Neo 15 XNE15M19, pois se destaca em outras áreas.
Schenker XMG Neo 15 XNE15M19
- 05/14/2020 v7 (old)
Florian Glaser
Price comparison