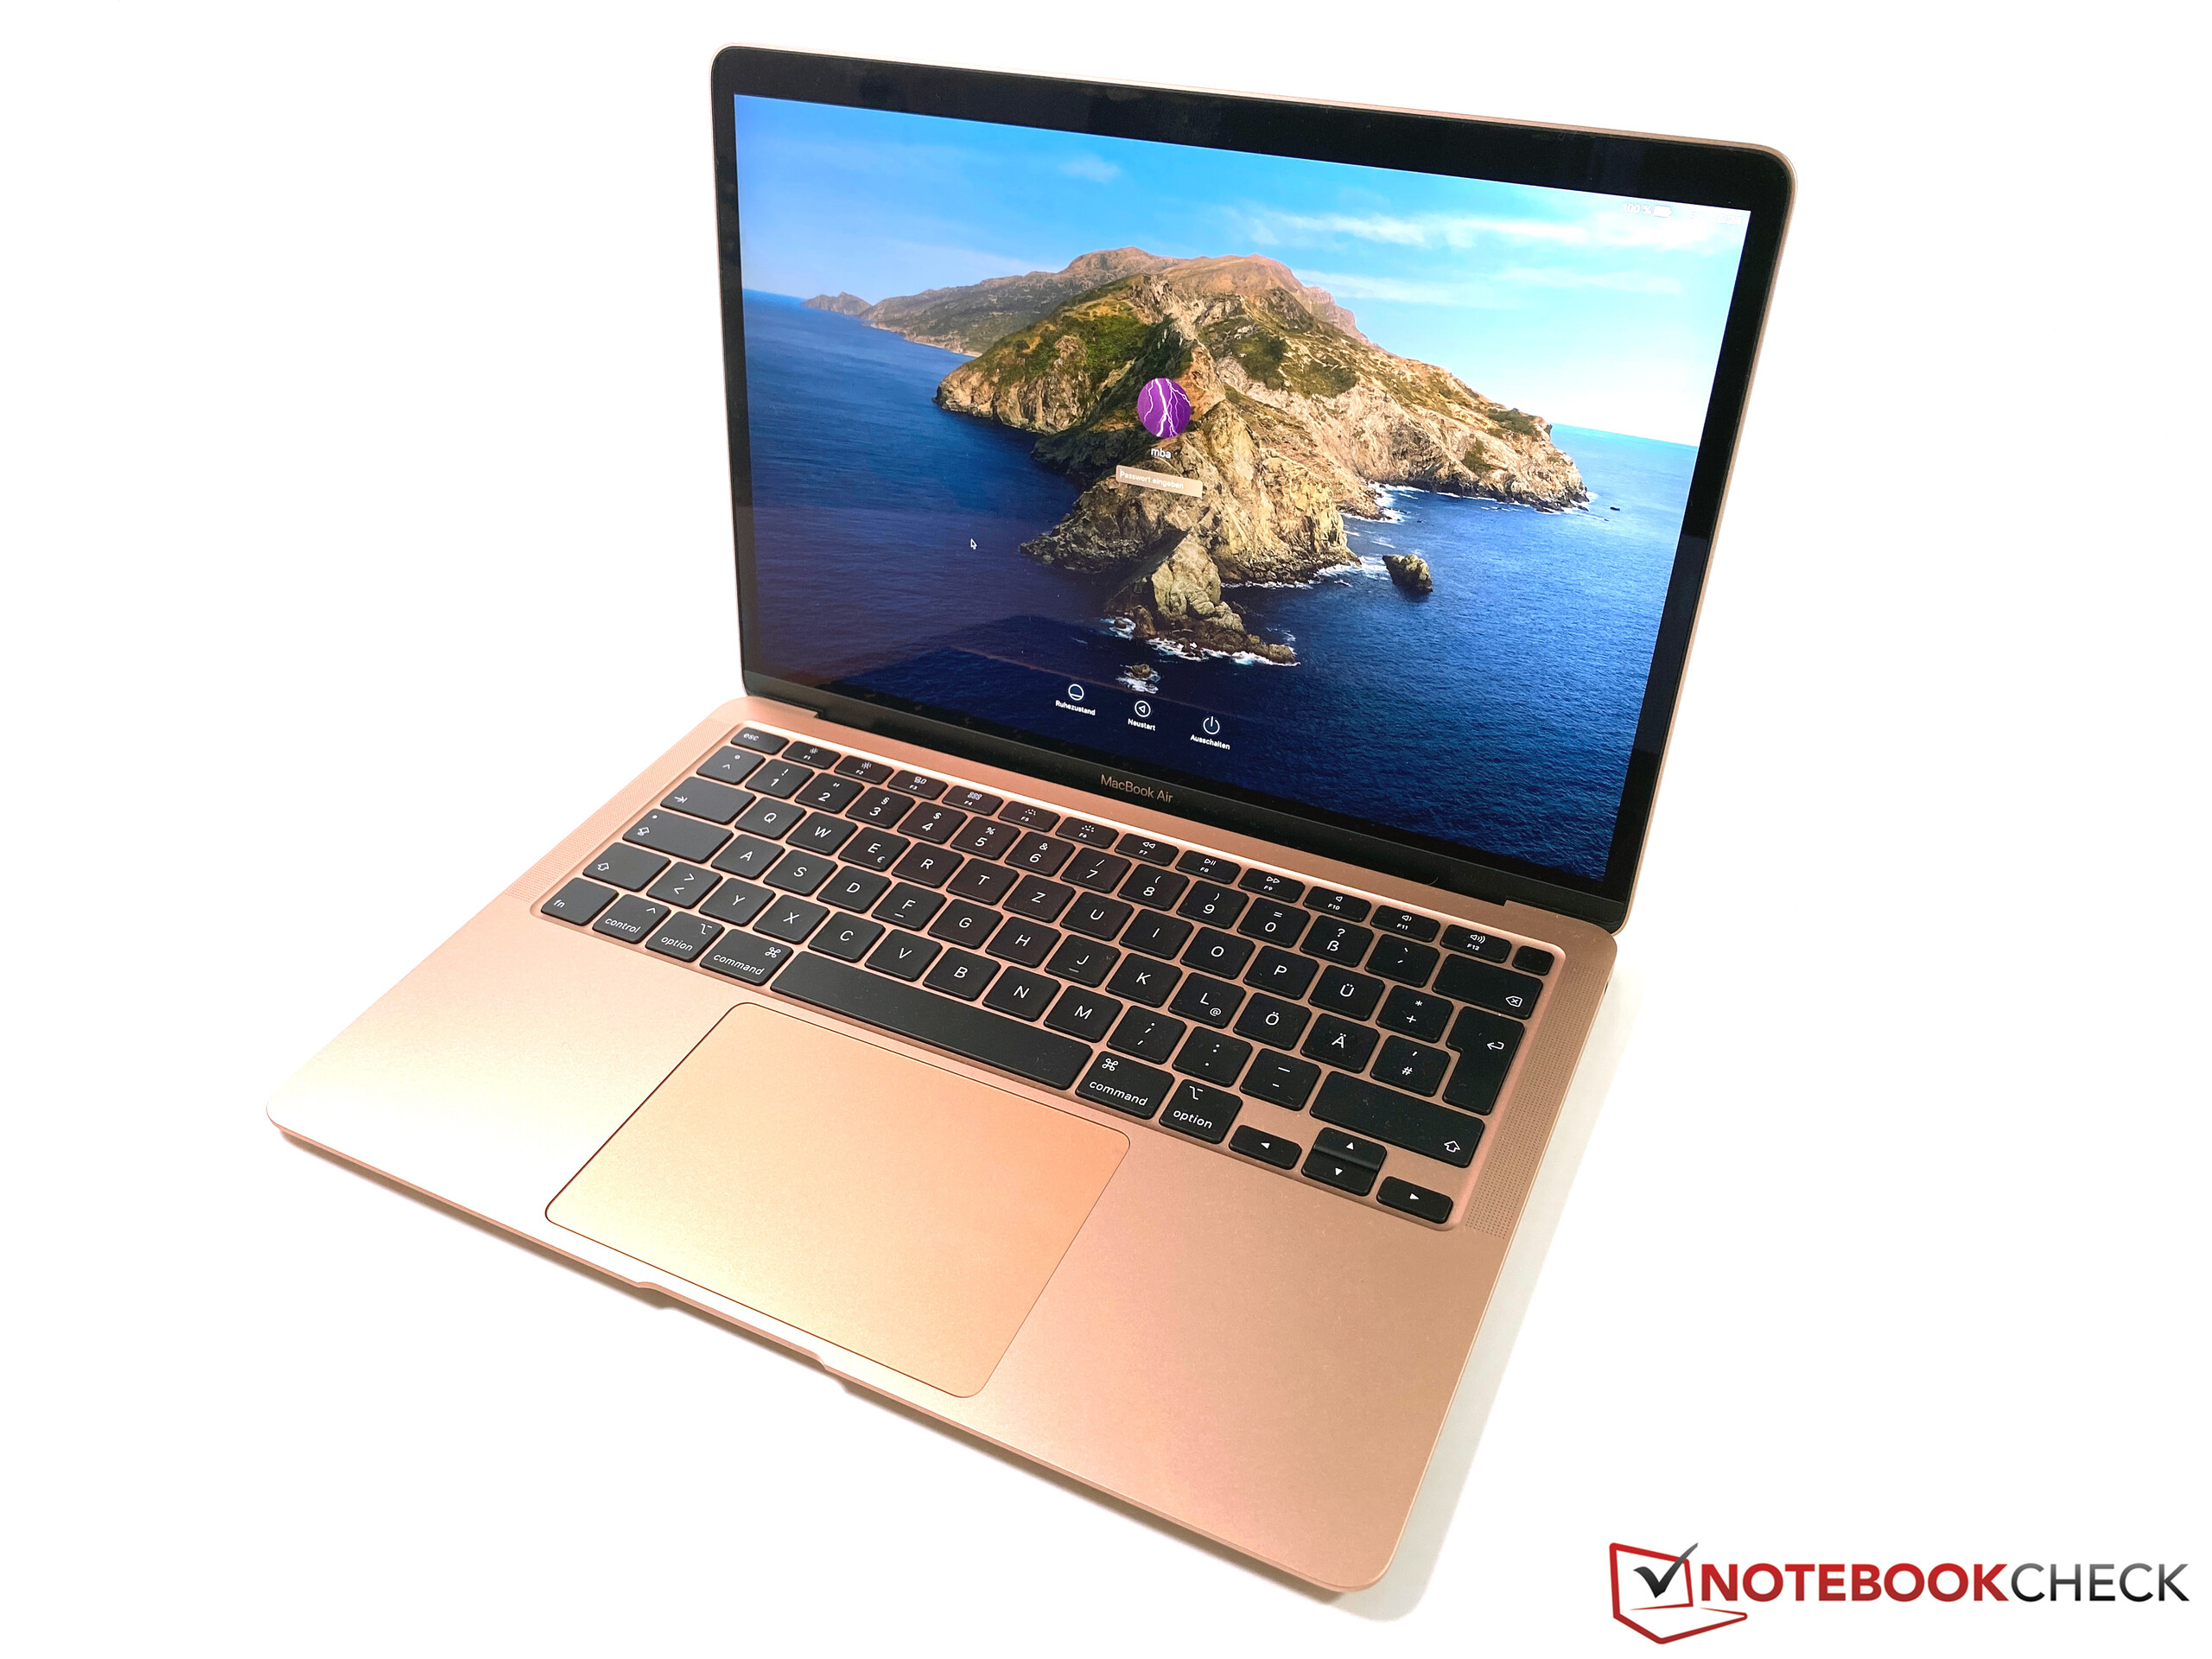
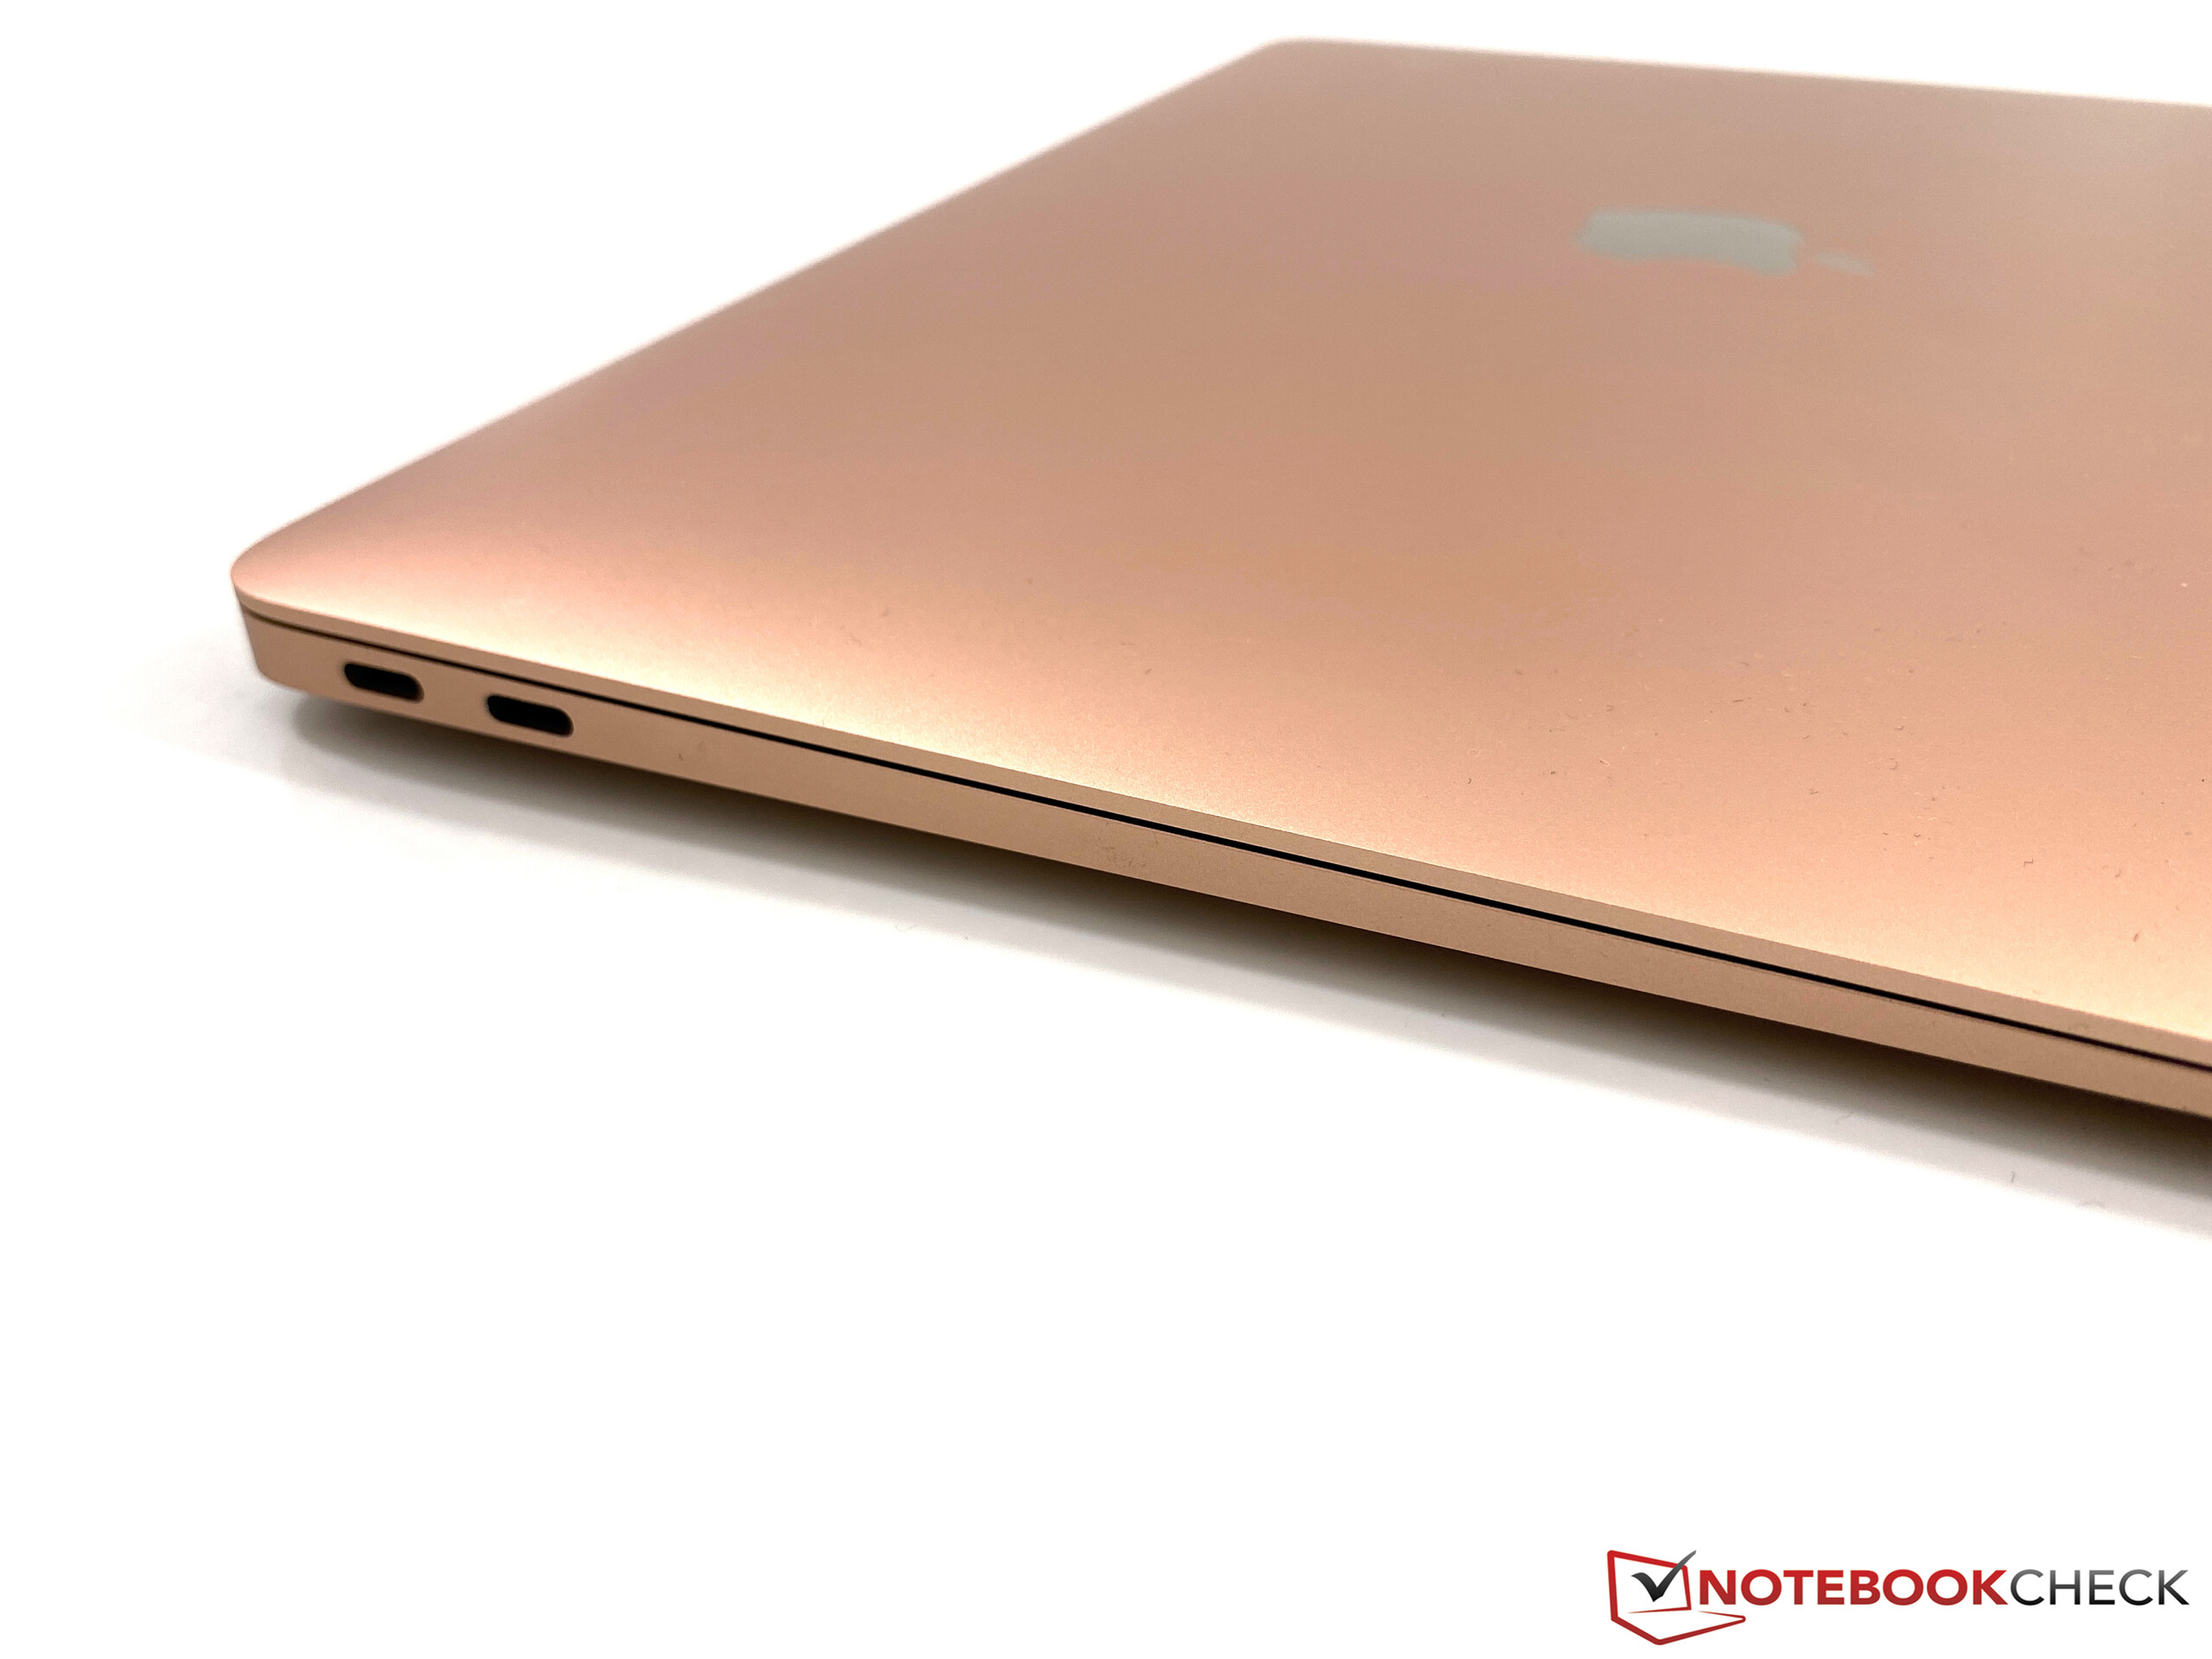
Breve Análise do Apple MacBook Air 2020: O Core i3 é a melhor escolha?
Avaliação | Data | Modelo | Peso | Altura | Size | Resolução | Preço |
|---|---|---|---|---|---|---|---|
| 89.6 % v7 (old) | 05/2020 | Apple MacBook Air 2020 i3 i3-1000NG4, Iris Plus Graphics G4 (Ice Lake 48 EU) | 1.3 kg | 16.1 mm | 13.30" | 2560x1600 | |
| 88 % v7 (old) | 04/2020 | Apple MacBook Air 2020 i5 i5-1030NG7, Iris Plus Graphics G7 (Ice Lake 64 EU) | 1.3 kg | 16.1 mm | 13.30" | 2560x1600 | |
| 85.6 % v7 (old) | 08/2019 | Apple Macbook Air 2019 i5-8210Y, UHD Graphics 617 | 1.3 kg | 15.6 mm | 13.30" | 2560x1600 | |
| 88.8 % v7 (old) | 03/2020 | Dell XPS 13 9300 i5 FHD i5-1035G1, UHD Graphics G1 (Ice Lake 32 EU) | 1.2 kg | 14.8 mm | 13.40" | 1920x1200 | |
| 87 % v7 (old) | 02/2020 | Acer Swift 3 SF313-52-71Y7 i7-1065G7, Iris Plus Graphics G7 (Ice Lake 64 EU) | 1.2 kg | 16.6 mm | 13.50" | 2256x1504 | |
| 84 % v7 (old) | 03/2020 | Microsoft Surface Laptop 3 13 Core i5-1035G7 i5-1035G7, Iris Plus Graphics G7 (Ice Lake 64 EU) | 1.3 kg | 14.5 mm | 13.50" | 2256x1504 |
| |||||||||||||||||||||||||
iluminação: 95 %
iluminação com acumulador: 414 cd/m²
Contraste: 1224:1 (Preto: 0.34 cd/m²)
ΔE ColorChecker Calman: 0.9 | ∀{0.5-29.43 Ø4.73}
calibrated: 0.6
ΔE Greyscale Calman: 1 | ∀{0.09-98 Ø4.97}
97.6% sRGB (Argyll 1.6.3 3D)
63.9% AdobeRGB 1998 (Argyll 1.6.3 3D)
71.6% AdobeRGB 1998 (Argyll 3D)
98% sRGB (Argyll 3D)
70.3% Display P3 (Argyll 3D)
Gamma: 2.2
CCT: 6629 K
| Apple MacBook Air 2020 i3 APPA042, IPS, 2560x1600, 13.3" | Apple MacBook Air 2020 i5 APPA042, IPS, 2560x1600, 13.3" | Apple Macbook Air 2019 APPA041, IPS, 2560x1600, 13.3" | Dell XPS 13 9300 i5 FHD SHP14CB, IPS, 1920x1200, 13.4" | Acer Swift 3 SF313-52-71Y7 BOE, NE135FBM-N41, IPS, 2256x1504, 13.5" | Microsoft Surface Laptop 3 13 Core i5-1035G7 Sharp LQ135P1JX51, IPS, 2256x1504, 13.5" | |
|---|---|---|---|---|---|---|
| Display | 0% | -3% | 2% | 0% | -4% | |
| Display P3 Coverage (%) | 70.3 | 70.4 0% | 67.4 -4% | 71.5 2% | 70.1 0% | 65.7 -7% |
| sRGB Coverage (%) | 98 | 97.7 0% | 94.7 -3% | 99.4 1% | 99.8 2% | 98.6 1% |
| AdobeRGB 1998 Coverage (%) | 71.6 | 71.7 0% | 69.1 -3% | 73.5 3% | 71.2 -1% | 67.8 -5% |
| Response Times | -4% | -7% | -37% | -26% | -50% | |
| Response Time Grey 50% / Grey 80% * (ms) | 38.4 ? | 38.7 ? -1% | 42.4 ? -10% | 60 ? -56% | 55 ? -43% | 59.2 ? -54% |
| Response Time Black / White * (ms) | 28.4 ? | 30.44 ? -7% | 29.6 ? -4% | 33.2 ? -17% | 31 ? -9% | 41.6 ? -46% |
| PWM Frequency (Hz) | 119000 ? | 117000 ? | 111100 ? | 2500 ? | 208 ? | 21740 ? |
| Screen | -45% | -27% | -97% | -95% | -17% | |
| Brightness middle (cd/m²) | 416 | 430 3% | 421 1% | 619 49% | 474 14% | 403.4 -3% |
| Brightness (cd/m²) | 403 | 405 0% | 393 -2% | 591 47% | 426 6% | 397 -1% |
| Brightness Distribution (%) | 95 | 89 -6% | 88 -7% | 91 -4% | 82 -14% | 89 -6% |
| Black Level * (cd/m²) | 0.34 | 0.32 6% | 0.34 -0% | 0.35 -3% | 0.29 15% | 0.34 -0% |
| Contrast (:1) | 1224 | 1344 10% | 1238 1% | 1769 45% | 1634 33% | 1186 -3% |
| Colorchecker dE 2000 * | 0.9 | 1.8 -100% | 1.5 -67% | 3 -233% | 2.38 -164% | 0.94 -4% |
| Colorchecker dE 2000 max. * | 1.4 | 4.6 -229% | 3.8 -171% | 8.2 -486% | 5.88 -320% | 2.92 -109% |
| Colorchecker dE 2000 calibrated * | 0.6 | 1.6 -167% | 1 -67% | 2.69 -348% | 0.99 -65% | |
| Greyscale dE 2000 * | 1 | 1.1 -10% | 1.2 -20% | 5.2 -420% | 3.75 -275% | 0.9 10% |
| Gamma | 2.2 100% | 2.21 100% | 2.14 103% | 2.37 93% | 2.13 103% | |
| CCT | 6629 98% | 6644 98% | 6694 97% | 6340 103% | 6466 101% | 6620 98% |
| Color Space (Percent of AdobeRGB 1998) (%) | 63.9 | 64.2 0% | 61.3 -4% | 66.9 5% | 65 2% | 62.3 -3% |
| Color Space (Percent of sRGB) (%) | 97.6 | 97.6 0% | 94.6 -3% | 99.3 2% | 100 2% | 98.7 1% |
| Média Total (Programa/Configurações) | -16% /
-31% | -12% /
-20% | -44% /
-71% | -40% /
-69% | -24% /
-18% |
* ... menor é melhor
Exibir tempos de resposta
| ↔ Tempo de resposta preto para branco | ||
|---|---|---|
| 28.4 ms ... ascensão ↗ e queda ↘ combinadas | ↗ 16 ms ascensão | 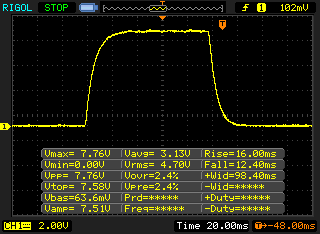 |
| ↘ 12.4 ms queda | ||
| A tela mostra taxas de resposta relativamente lentas em nossos testes e pode ser muito lenta para os jogadores. Em comparação, todos os dispositivos testados variam de 0.1 (mínimo) a 240 (máximo) ms. » 75 % de todos os dispositivos são melhores. Isso significa que o tempo de resposta medido é pior que a média de todos os dispositivos testados (19.9 ms). | ||
| ↔ Tempo de resposta 50% cinza a 80% cinza | ||
| 38.4 ms ... ascensão ↗ e queda ↘ combinadas | ↗ 20.4 ms ascensão | 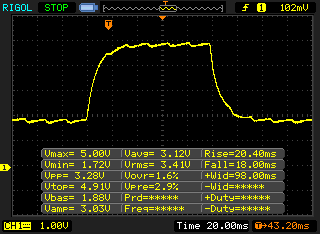 |
| ↘ 18 ms queda | ||
| A tela mostra taxas de resposta lentas em nossos testes e será insatisfatória para os jogadores. Em comparação, todos os dispositivos testados variam de 0.165 (mínimo) a 636 (máximo) ms. » 57 % de todos os dispositivos são melhores. Isso significa que o tempo de resposta medido é pior que a média de todos os dispositivos testados (31.1 ms). | ||
Cintilação da tela / PWM (modulação por largura de pulso)
| Tela tremeluzindo/PWM detectado | 119000 Hz | ≤ 75 % configuração de brilho | 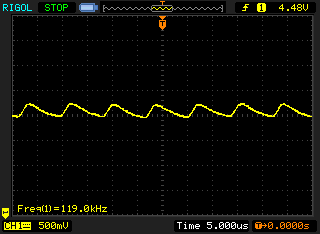 |
A luz de fundo da tela pisca em 119000 Hz (pior caso, por exemplo, utilizando PWM) Cintilação detectada em uma configuração de brilho de 75 % e abaixo. Não deve haver cintilação ou PWM acima desta configuração de brilho. A frequência de 119000 Hz é bastante alta, então a maioria dos usuários sensíveis ao PWM não deve notar nenhuma oscilação. [pwm_comparison] Em comparação: 52 % de todos os dispositivos testados não usam PWM para escurecer a tela. Se PWM foi detectado, uma média de 7798 (mínimo: 5 - máximo: 343500) Hz foi medida. | |||
Cinebench R15: CPU Single 64Bit | CPU Multi 64Bit
Blender: v2.79 BMW27 CPU
7-Zip 18.03: 7z b 4 -mmt1 | 7z b 4
Geekbench 5.5: Single-Core | Multi-Core
HWBOT x265 Benchmark v2.2: 4k Preset
LibreOffice : 20 Documents To PDF
R Benchmark 2.5: Overall mean
| Cinebench R20 / CPU (Single Core) | |
| Média da turma Subnotebook (128 - 832, n=58, últimos 2 anos) | |
| Acer Swift 3 SF313-52-71Y7 | |
| Microsoft Surface Laptop 3 13 Core i5-1035G7 | |
| Dell XPS 13 9300 i5 FHD | |
| Apple MacBook Air 2020 i5 | |
| Apple MacBook Air 2020 i5 | |
| Apple MacBook Air 2020 i3 | |
| Média Intel Core i3-1000NG4 (n=1) | |
| Apple Macbook Air 2019 | |
| Cinebench R20 / CPU (Multi Core) | |
| Média da turma Subnotebook (579 - 8541, n=58, últimos 2 anos) | |
| Microsoft Surface Laptop 3 13 Core i5-1035G7 | |
| Dell XPS 13 9300 i5 FHD | |
| Acer Swift 3 SF313-52-71Y7 | |
| Apple MacBook Air 2020 i5 | |
| Apple MacBook Air 2020 i5 | |
| Apple Macbook Air 2019 | |
| Apple MacBook Air 2020 i3 | |
| Média Intel Core i3-1000NG4 (n=1) | |
| Cinebench R15 / CPU Single 64Bit | |
| Média da turma Subnotebook (72.4 - 322, n=58, últimos 2 anos) | |
| Acer Swift 3 SF313-52-71Y7 | |
| Microsoft Surface Laptop 3 13 Core i5-1035G7 | |
| Dell XPS 13 9300 i5 FHD | |
| Apple MacBook Air 2020 i3 | |
| Média Intel Core i3-1000NG4 (n=1) | |
| Apple MacBook Air 2020 i5 | |
| Apple Macbook Air 2019 | |
| Cinebench R15 / CPU Multi 64Bit | |
| Média da turma Subnotebook (327 - 3345, n=58, últimos 2 anos) | |
| Microsoft Surface Laptop 3 13 Core i5-1035G7 | |
| Dell XPS 13 9300 i5 FHD | |
| Dell XPS 13 9300 i5 FHD | |
| Acer Swift 3 SF313-52-71Y7 | |
| Apple MacBook Air 2020 i5 | |
| Apple MacBook Air 2020 i3 | |
| Média Intel Core i3-1000NG4 (n=1) | |
| Apple Macbook Air 2019 | |
| Blender / v2.79 BMW27 CPU | |
| Apple MacBook Air 2020 i3 | |
| Média Intel Core i3-1000NG4 (n=1) | |
| Apple Macbook Air 2019 | |
| Apple MacBook Air 2020 i5 | |
| Acer Swift 3 SF313-52-71Y7 | |
| Microsoft Surface Laptop 3 13 Core i5-1035G7 | |
| Dell XPS 13 9300 i5 FHD | |
| Média da turma Subnotebook (159 - 2271, n=59, últimos 2 anos) | |
| 7-Zip 18.03 / 7z b 4 -mmt1 | |
| Média da turma Subnotebook (2643 - 6699, n=60, últimos 2 anos) | |
| Acer Swift 3 SF313-52-71Y7 | |
| Microsoft Surface Laptop 3 13 Core i5-1035G7 | |
| Dell XPS 13 9300 i5 FHD | |
| Apple MacBook Air 2020 i5 | |
| Apple MacBook Air 2020 i3 | |
| Média Intel Core i3-1000NG4 (n=1) | |
| Apple Macbook Air 2019 | |
| 7-Zip 18.03 / 7z b 4 | |
| Média da turma Subnotebook (11668 - 77867, n=58, últimos 2 anos) | |
| Microsoft Surface Laptop 3 13 Core i5-1035G7 | |
| Dell XPS 13 9300 i5 FHD | |
| Acer Swift 3 SF313-52-71Y7 | |
| Apple MacBook Air 2020 i5 | |
| Apple Macbook Air 2019 | |
| Apple MacBook Air 2020 i3 | |
| Média Intel Core i3-1000NG4 (n=1) | |
| Geekbench 5.5 / Single-Core | |
| Média da turma Subnotebook (726 - 2224, n=49, últimos 2 anos) | |
| Acer Swift 3 SF313-52-71Y7 | |
| Dell XPS 13 9300 i5 FHD | |
| Apple MacBook Air 2020 i5 | |
| Apple MacBook Air 2020 i5 | |
| Apple MacBook Air 2020 i3 | |
| Média Intel Core i3-1000NG4 (n=1) | |
| Geekbench 5.5 / Multi-Core | |
| Média da turma Subnotebook (2557 - 17218, n=49, últimos 2 anos) | |
| Acer Swift 3 SF313-52-71Y7 | |
| Dell XPS 13 9300 i5 FHD | |
| Apple MacBook Air 2020 i5 | |
| Apple MacBook Air 2020 i5 | |
| Apple MacBook Air 2020 i3 | |
| Média Intel Core i3-1000NG4 (n=1) | |
| HWBOT x265 Benchmark v2.2 / 4k Preset | |
| Média da turma Subnotebook (0.97 - 25.1, n=58, últimos 2 anos) | |
| Acer Swift 3 SF313-52-71Y7 | |
| Microsoft Surface Laptop 3 13 Core i5-1035G7 | |
| Dell XPS 13 9300 i5 FHD | |
| Apple MacBook Air 2020 i5 | |
| Apple Macbook Air 2019 | |
| Apple MacBook Air 2020 i3 | |
| Média Intel Core i3-1000NG4 (n=1) | |
| LibreOffice / 20 Documents To PDF | |
| Apple MacBook Air 2020 i5 | |
| Apple MacBook Air 2020 i3 | |
| Média Intel Core i3-1000NG4 (n=1) | |
| Média da turma Subnotebook (39.9 - 220, n=57, últimos 2 anos) | |
| R Benchmark 2.5 / Overall mean | |
| Apple MacBook Air 2020 i5 | |
| Apple MacBook Air 2020 i5 | |
| Apple MacBook Air 2020 i3 | |
| Média Intel Core i3-1000NG4 (n=1) | |
| Dell XPS 13 9300 i5 FHD | |
| Acer Swift 3 SF313-52-71Y7 | |
| Média da turma Subnotebook (0.4024 - 1.456, n=59, últimos 2 anos) | |
* ... menor é melhor
| PCMark 8 Home Score Accelerated v2 | 2701 pontos | |
| PCMark 8 Creative Score Accelerated v2 | 3619 pontos | |
| PCMark 10 Score | 2229 pontos | |
Ajuda | ||

| Unigine Valley 1.0 - 1920x1080 Extreme HD Preset OpenGL AA:x8 | |
| Média da turma Subnotebook (4.7 - 26.2, n=5, últimos 2 anos) | |
| Apple MacBook Air 2020 i5 | |
| Média Intel Iris Plus Graphics G4 (Ice Lake 48 EU) (7.1 - 9.3, n=2) | |
| Apple MacBook Air 2020 i3 | |
| Unigine Heaven 4.0 - Extreme Preset OpenGL | |
| Média da turma Subnotebook (7 - 35.7, n=4, últimos 2 anos) | |
| Média Intel Iris Plus Graphics G4 (Ice Lake 48 EU) (8.1 - 11.8, n=2) | |
| Apple MacBook Air 2020 i5 | |
| Apple MacBook Air 2020 i3 | |
| 3DMark 06 Standard Score | 6413 pontos | |
| 3DMark Vantage P Result | 5516 pontos | |
| 3DMark 11 Performance | 1980 pontos | |
| 3DMark Fire Strike Score | 839 pontos | |
Ajuda | ||
| baixo | média | alto | ultra | |
|---|---|---|---|---|
| BioShock Infinite (2013) | 34 | 22.6 | 20.3 | 9.1 |
| The Witcher 3 (2015) | 9.1 | |||
| Dota 2 Reborn (2015) | 48.2 | 23.4 | 14.7 | 14.1 |
| Rise of the Tomb Raider (2016) | 10.2 | |||
| Overwatch (2016) | 8 | |||
| Rocket League (2017) | 53.2 | 22.7 | ||
| X-Plane 11.11 (2018) | 17.8 | 9.32 | 9.16 | |
| Shadow of the Tomb Raider (2018) | 9 |
Barulho
| Ocioso |
| 29 / 29 / 29 dB |
| Carga |
| 31.6 / 39.4 dB |
 | ||
30 dB silencioso 40 dB(A) audível 50 dB(A) ruidosamente alto |
||
min: | ||
| Apple MacBook Air 2020 i3 Iris Plus Graphics G4 (Ice Lake 48 EU), i3-1000NG4, Apple SSD AP0256 | Apple MacBook Air 2020 i5 Iris Plus Graphics G7 (Ice Lake 64 EU), i5-1030NG7, Apple SSD AP0512 | Apple Macbook Air 2019 UHD Graphics 617, i5-8210Y, Apple SSD AP0256 | Dell XPS 13 9300 i5 FHD UHD Graphics G1 (Ice Lake 32 EU), i5-1035G1, Toshiba XG6 KXG60ZNV512G | Acer Swift 3 SF313-52-71Y7 Iris Plus Graphics G7 (Ice Lake 64 EU), i7-1065G7, Intel SSD 660p 1TB SSDPEKNW010T8 | Microsoft Surface Laptop 3 13 Core i5-1035G7 Iris Plus Graphics G7 (Ice Lake 64 EU), i5-1035G7, SK hynix BC501 HFM256GDGTNG | |
|---|---|---|---|---|---|---|
| Noise | -12% | -3% | 3% | 0% | 3% | |
| desligado / ambiente * (dB) | 29 | 30 -3% | 29.5 -2% | 29.3 -1% | 30.3 -4% | 28.5 2% |
| Idle Minimum * (dB) | 29 | 30 -3% | 29.5 -2% | 29.3 -1% | 30.3 -4% | 28.5 2% |
| Idle Average * (dB) | 29 | 30 -3% | 29.5 -2% | 29.3 -1% | 30.3 -4% | 28.5 2% |
| Idle Maximum * (dB) | 29 | 30 -3% | 29.5 -2% | 29.3 -1% | 30.3 -4% | 28.5 2% |
| Load Average * (dB) | 31.6 | 45.5 -44% | 34 -8% | 30 5% | 31.7 -0% | 28.5 10% |
| Load Maximum * (dB) | 39.4 | 45.8 -16% | 41 -4% | 32.4 18% | 32.7 17% | 40.4 -3% |
| Witcher 3 ultra * (dB) | 40.4 |
* ... menor é melhor
(±) A temperatura máxima no lado superior é 44.3 °C / 112 F, em comparação com a média de 35.9 °C / 97 F , variando de 21.4 a 59 °C para a classe Subnotebook.
(±) A parte inferior aquece até um máximo de 40.9 °C / 106 F, em comparação com a média de 39.2 °C / 103 F
(+) Em uso inativo, a temperatura média para o lado superior é 23.4 °C / 74 F, em comparação com a média do dispositivo de 30.8 °C / ### class_avg_f### F.
(+) Os apoios para as mãos e o touchpad são mais frios que a temperatura da pele, com um máximo de 29.1 °C / 84.4 F e, portanto, são frios ao toque.
(±) A temperatura média da área do apoio para as mãos de dispositivos semelhantes foi 28.2 °C / 82.8 F (-0.9 °C / -1.6 F).
| desligado | |
| Ocioso | |
| Carga |
|
Key:
min: | |
| Apple MacBook Air 2020 i3 i3-1000NG4, Iris Plus Graphics G4 (Ice Lake 48 EU), Apple SSD AP0256, IPS, 2560x1600, 13.3" | Apple MacBook Air 2020 i5 i5-1030NG7, Iris Plus Graphics G7 (Ice Lake 64 EU), Apple SSD AP0512, IPS, 2560x1600, 13.3" | Dell XPS 13 9300 i5 FHD i5-1035G1, UHD Graphics G1 (Ice Lake 32 EU), Toshiba XG6 KXG60ZNV512G, IPS, 1920x1200, 13.4" | Acer Swift 3 SF313-52-71Y7 i7-1065G7, Iris Plus Graphics G7 (Ice Lake 64 EU), Intel SSD 660p 1TB SSDPEKNW010T8, IPS, 2256x1504, 13.5" | Microsoft Surface Laptop 3 13 Core i5-1035G7 i5-1035G7, Iris Plus Graphics G7 (Ice Lake 64 EU), SK hynix BC501 HFM256GDGTNG, IPS, 2256x1504, 13.5" | Média Intel Iris Plus Graphics G4 (Ice Lake 48 EU) | Média da turma Subnotebook | |
|---|---|---|---|---|---|---|---|
| Power Consumption | -15% | -43% | 11% | -64% | -32% | -55% | |
| Idle Minimum * (Watt) | 2.1 | 2.4 -14% | 3.4 -62% | 1.8 14% | 4.4 -110% | 3.26 ? -55% | 3.79 ? -80% |
| Idle Average * (Watt) | 6.2 | 6.8 -10% | 6 3% | 4.6 26% | 7.5 -21% | 7.28 ? -17% | 6.57 ? -6% |
| Idle Maximum * (Watt) | 7 | 10.5 -50% | 10.2 -46% | 6.1 13% | 7.8 -11% | 8.66 ? -24% | 7.94 ? -13% |
| Load Average * (Watt) | 24.7 | 25.7 -4% | 36.6 -48% | 27.4 -11% | 41.9 -70% | 34.4 ? -39% | 41.8 ? -69% |
| Load Maximum * (Watt) | 30.6 | 30.4 1% | 49.3 -61% | 27 12% | 63.9 -109% | 38.9 ? -27% | 64.1 ? -109% |
| Witcher 3 ultra * (Watt) | 24.5 | 40.8 |
* ... menor é melhor
| Apple MacBook Air 2020 i3 i3-1000NG4, Iris Plus Graphics G4 (Ice Lake 48 EU), 49.9 Wh | Apple MacBook Air 2020 i5 i5-1030NG7, Iris Plus Graphics G7 (Ice Lake 64 EU), 49.9 Wh | Apple Macbook Air 2019 i5-8210Y, UHD Graphics 617, 49.9 Wh | Dell XPS 13 9300 i5 FHD i5-1035G1, UHD Graphics G1 (Ice Lake 32 EU), 52 Wh | Acer Swift 3 SF313-52-71Y7 i7-1065G7, Iris Plus Graphics G7 (Ice Lake 64 EU), 54.5 Wh | Microsoft Surface Laptop 3 13 Core i5-1035G7 i5-1035G7, Iris Plus Graphics G7 (Ice Lake 64 EU), 45 Wh | Média da turma Subnotebook | |
|---|---|---|---|---|---|---|---|
| Duração da bateria | -5% | 5% | 18% | -6% | -25% | 34% | |
| H.264 (h) | 11.1 | 10.7 -4% | 14.4 30% | 10.5 -5% | 15.6 ? 41% | ||
| WiFi v1.3 (h) | 11 | 10.3 -6% | 11.5 5% | 11.7 6% | 10.3 -6% | 8.3 -25% | 14 ? 27% |
| Load (h) | 2.9 | 3.4 | 2.3 | 1.9 | 1.946 ? | ||
| Reader / Idle (h) | 21.4 | 34.4 | 28.6 ? |
Pro
Contra
Veredicto – O Core i3 é a melhor opção para tarefas cotidianas
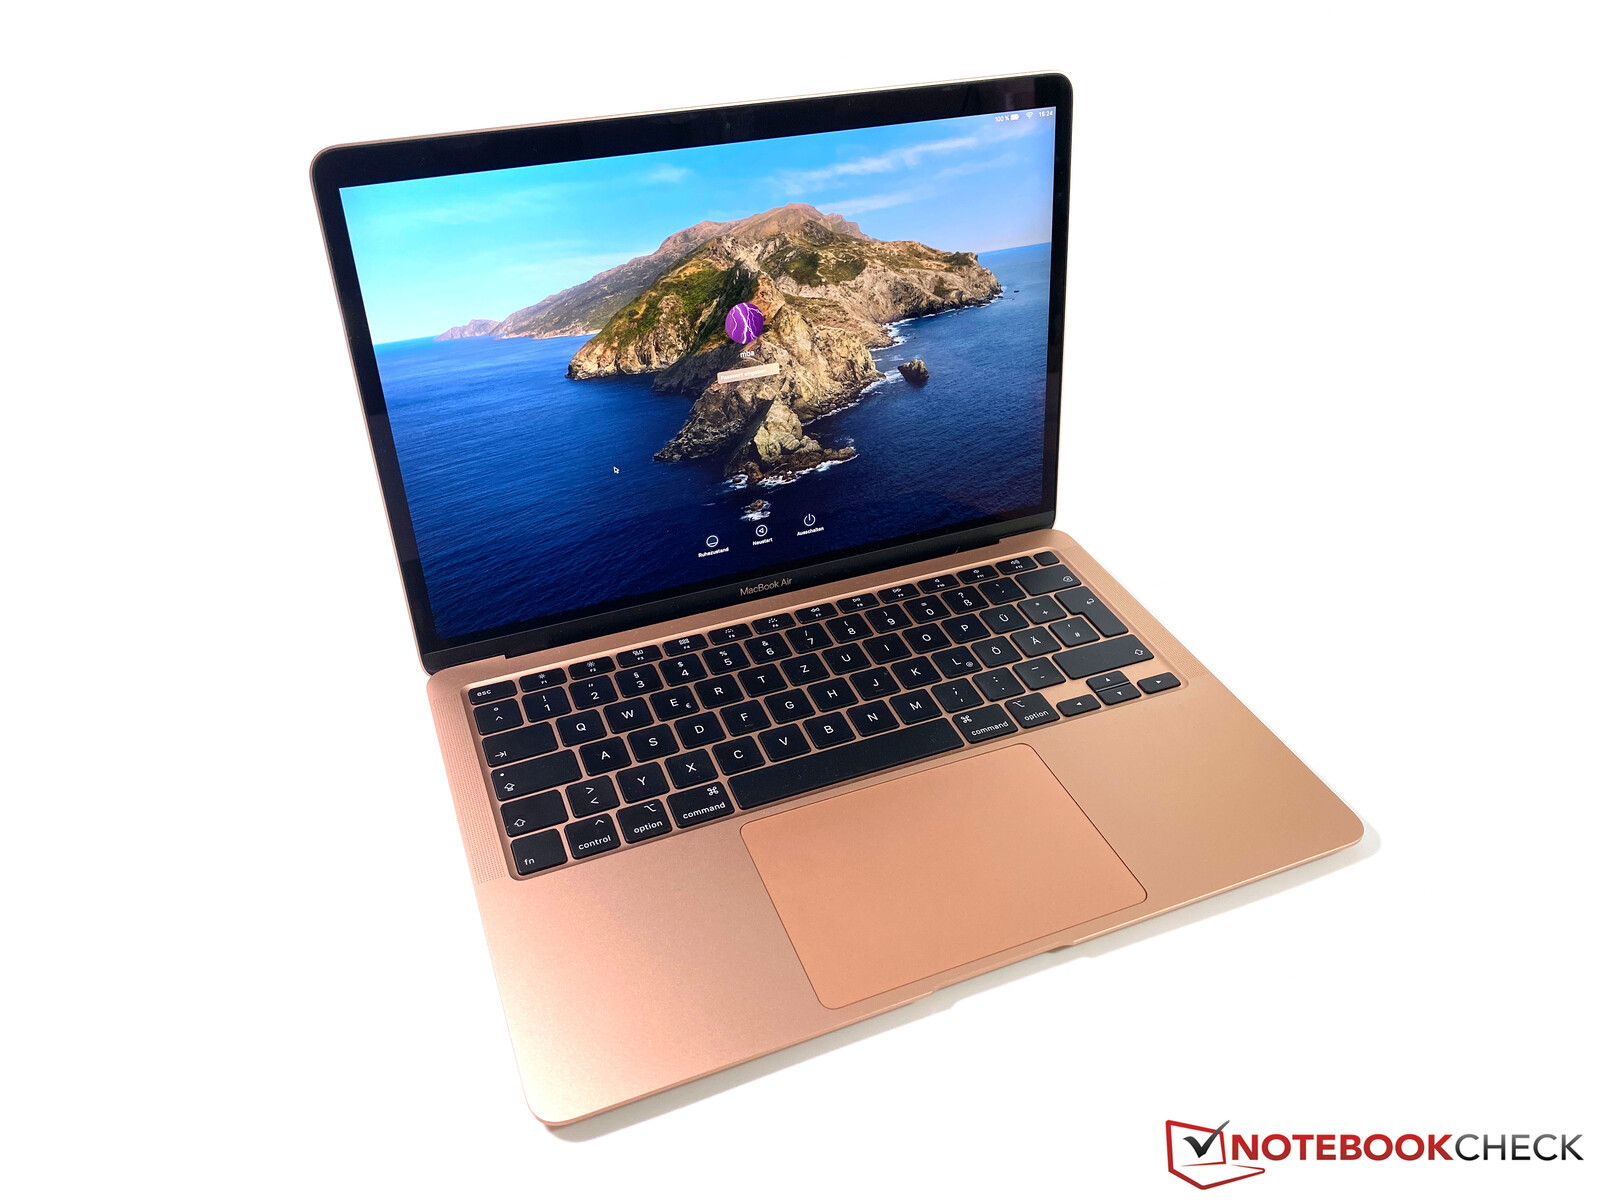
Com todas as discussões sobre o desempenho das novas CPUs quad-core, você não deve esquecer que o MacBook Air ainda é principalmente um dispositivo para usuários casuais com cargas de trabalho leves. Isso inclui coisas básicas como escrever e-mails, reprodução de vídeos ou navegação na web. O MacBook Air é ótimo para isto, também graças ao rápido armazenamento SSD. Devido à configuração limitada do TDP, o MacBook Air de nível básico é igual ao supostamente mais rápido quad-core i5 quando se trata do desempenho de núcleo único, o que ainda é importante para as tarefas diárias. Também existem vantagens visíveis em termos de emissões e, especialmente, o ventilador é muito mais silencioso com uma velocidade máxima mais lenta. Isso significa que o i3 MacBook Air é mais silencioso por períodos mais longos, mesmo quando você o estressa.
O MacBook Air com o processador i3 de núcleo duplo é o melhor dispositivo para cargas de trabalho básicas. A impressão subjetiva do desempenho é muito boa nesses cenários, o ventilador é mais silencioso e você ainda pode desfrutar da boa tela e do teclado aprimorado.
Ainda existem desvantagens, porque o nível geral de desempenho é muito baixo. Isso não seria um grande problema, mas por que a Apple não consegue criar um dispositivo completamente resfriado de forma passiva? Um MacBook Air silencioso seria ótimo, mas temos a suspeita de que a Apple limita o Air de propósito. Esta etapa pode ser reservada para futuros modelos com os SoCs ARM altamente especulados.
O preço é outro problema, porque você pode obter portáteis com muito mais desempenho por 1.200 Euros. Ainda assim, graças à carcaça de alta qualidade, ao bom painel e à boa otimização para o macOS, o MacBook Air é um pacote muito bem equilibrado para suas tarefas básicas. Se você precisa de mais desempenho ou se já sabe que vai estressar muito os componentes, no entanto, acreditamos que você deve pular os modelos quad-core mais caros do Air e comprar um MacBook Pro 13 (ou algo similarmente poderoso).
Apple MacBook Air 2020 i3
- 05/13/2020 v7 (old)
Andreas Osthoff
Price comparison
