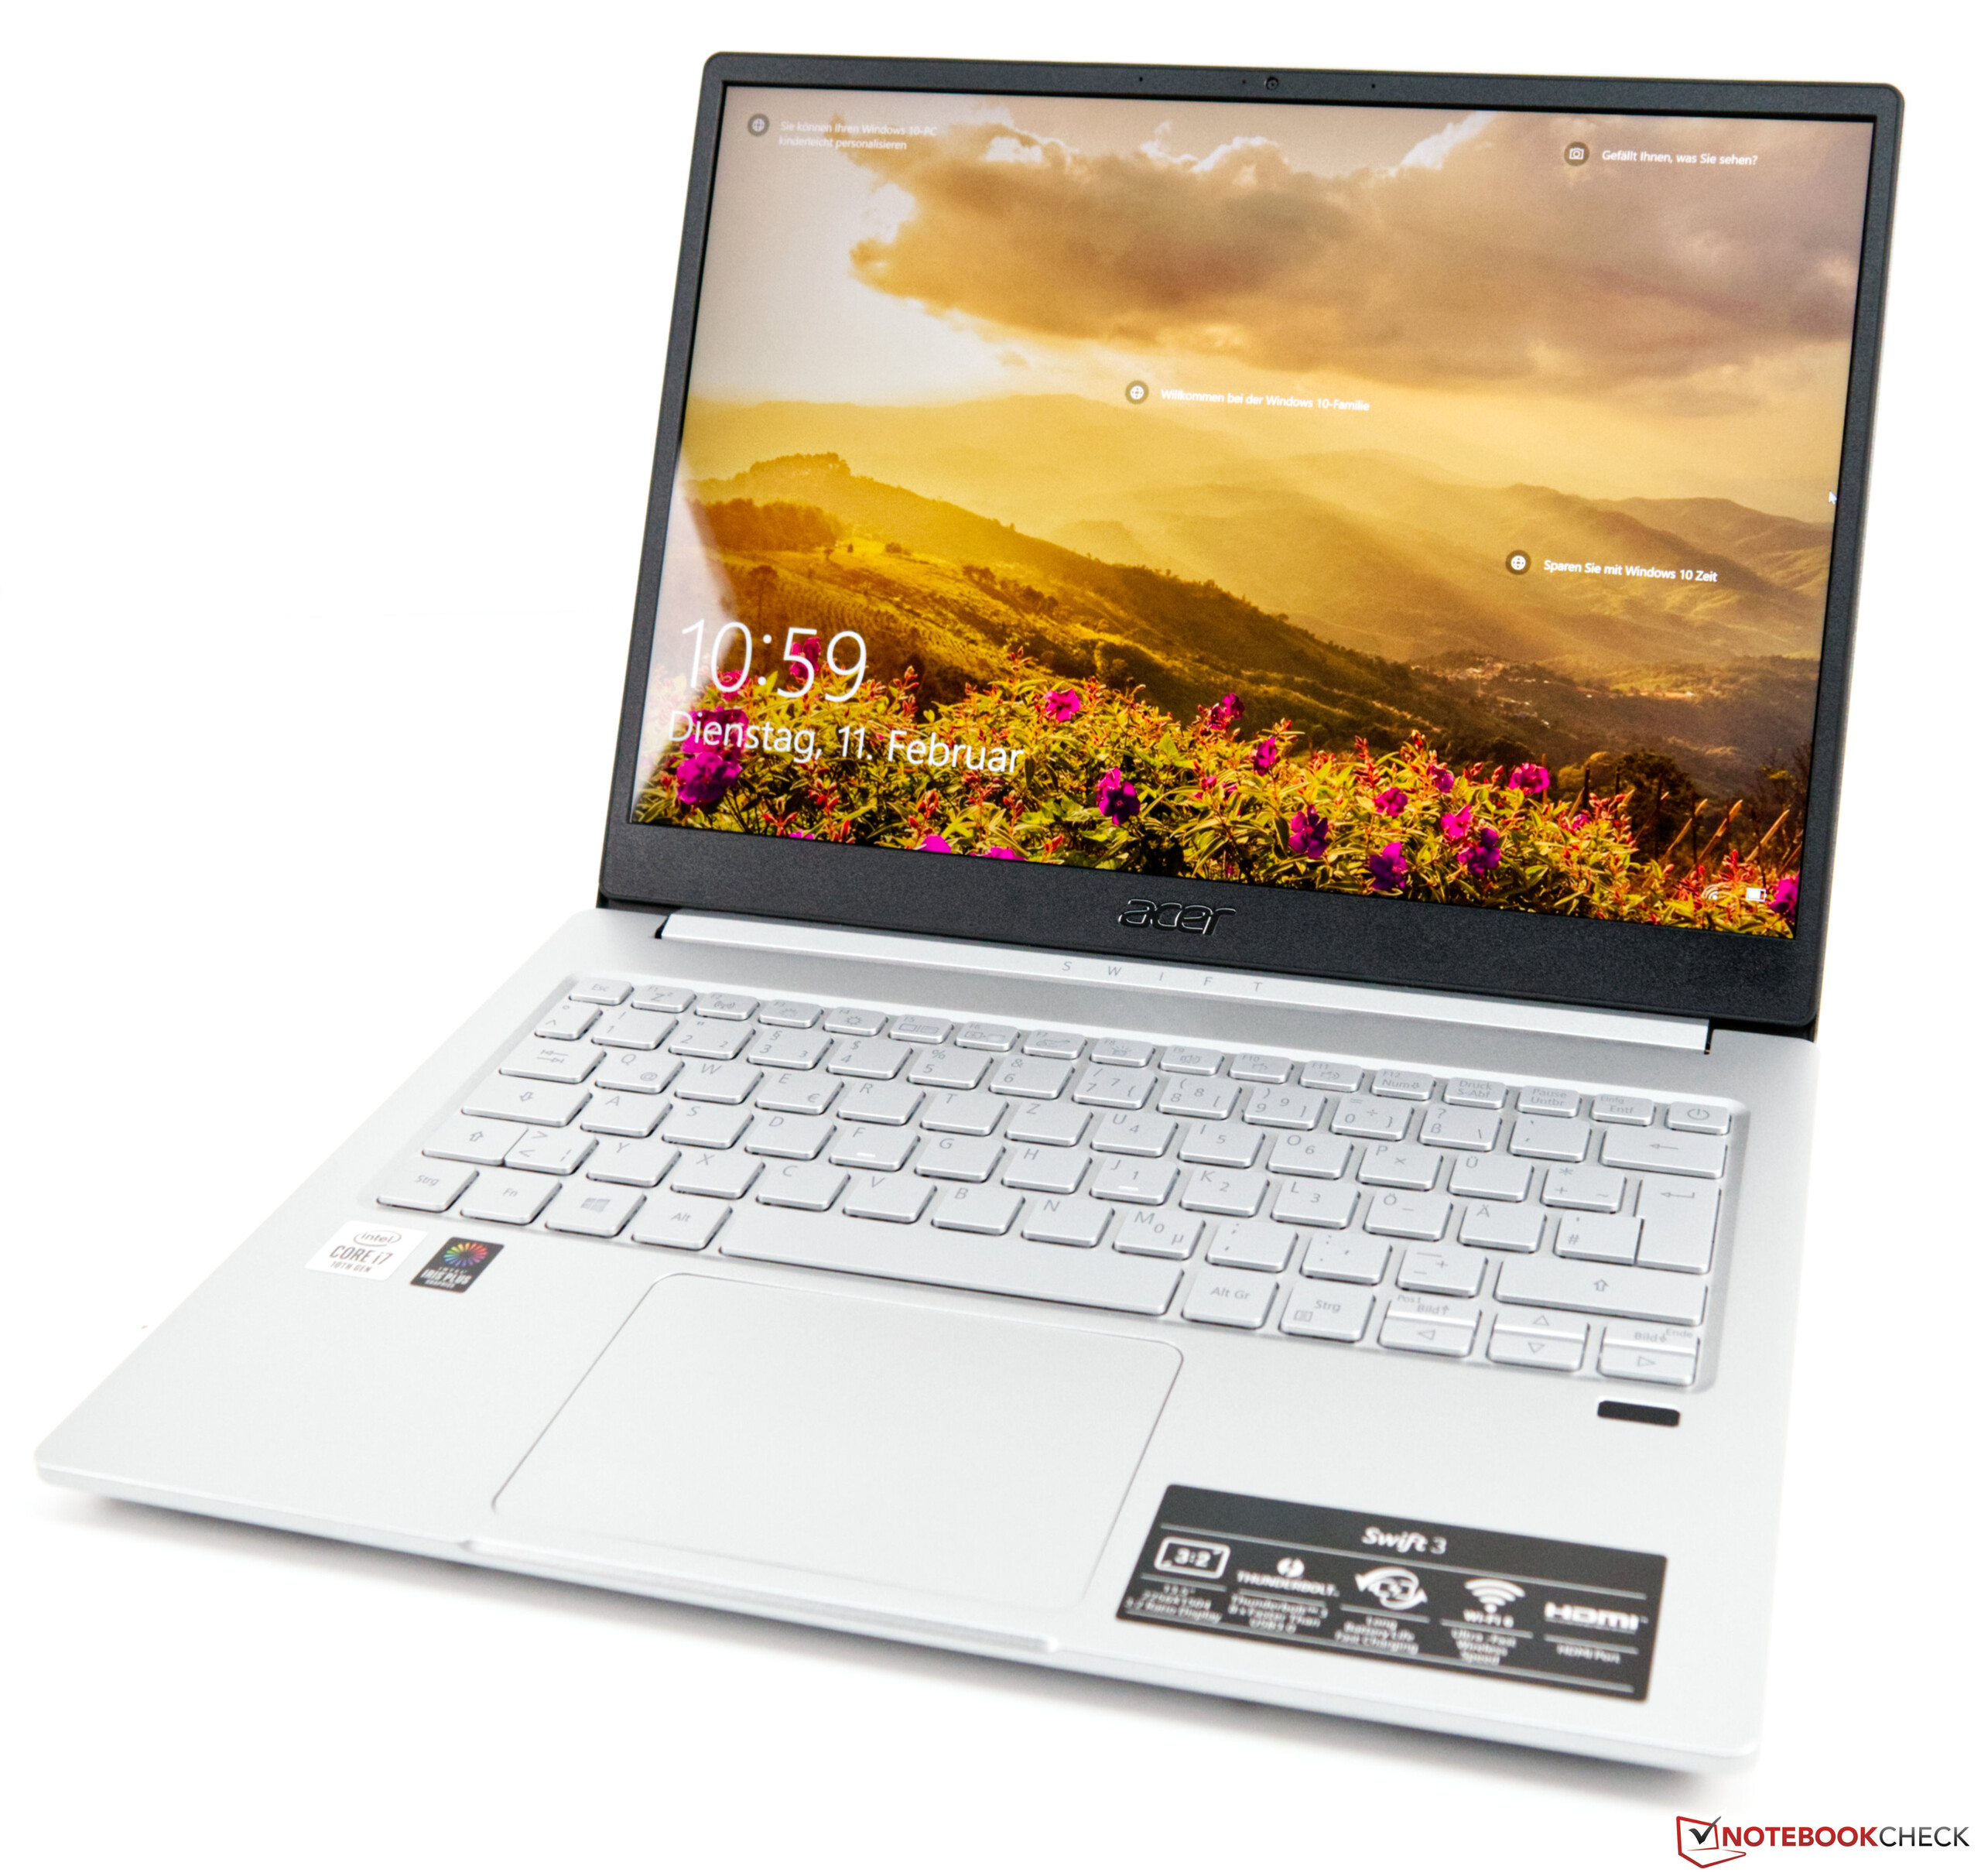
Em Análise o Acer Swift 3 SF313 com Processador Ice Lake
Avaliação | Data | Modelo | Peso | Altura | Size | Resolução | Preço |
|---|---|---|---|---|---|---|---|
| 87 % v7 (old) | 02/2020 | Acer Swift 3 SF313-52-71Y7 i7-1065G7, Iris Plus Graphics G7 (Ice Lake 64 EU) | 1.2 kg | 16.6 mm | 13.50" | 2256x1504 | |
| 88.2 % v7 (old) | 10/2019 | Lenovo Yoga C940-14IIL i7-1065G7, Iris Plus Graphics G7 (Ice Lake 64 EU) | 1.4 kg | 14.95 mm | 14.00" | 1920x1080 | |
| 85.7 % v6 (old) | 01/2019 | Acer Swift 3 SF313-51-59SZ i5-8250U, UHD Graphics 620 | 1.3 kg | 16 mm | 13.30" | 1920x1080 | |
| 88 % v6 (old) | 02/2019 | Dell XPS 13 9380 2019 i5-8265U, UHD Graphics 620 | 1.2 kg | 11.6 mm | 13.30" | 3840x2160 | |
| 86 % v7 (old) | 07/2019 | Lenovo ThinkBook 13s-20R90071GE i5-8265U, UHD Graphics 620 | 1.3 kg | 15.9 mm | 13.30" | 1920x1080 | |
| 84.5 % v7 (old) | 08/2019 | HP Envy 13-aq0003ng i7-8565U, GeForce MX250 | 1.2 kg | 14.7 mm | 13.30" | 1920x1080 |
| |||||||||||||||||||||||||
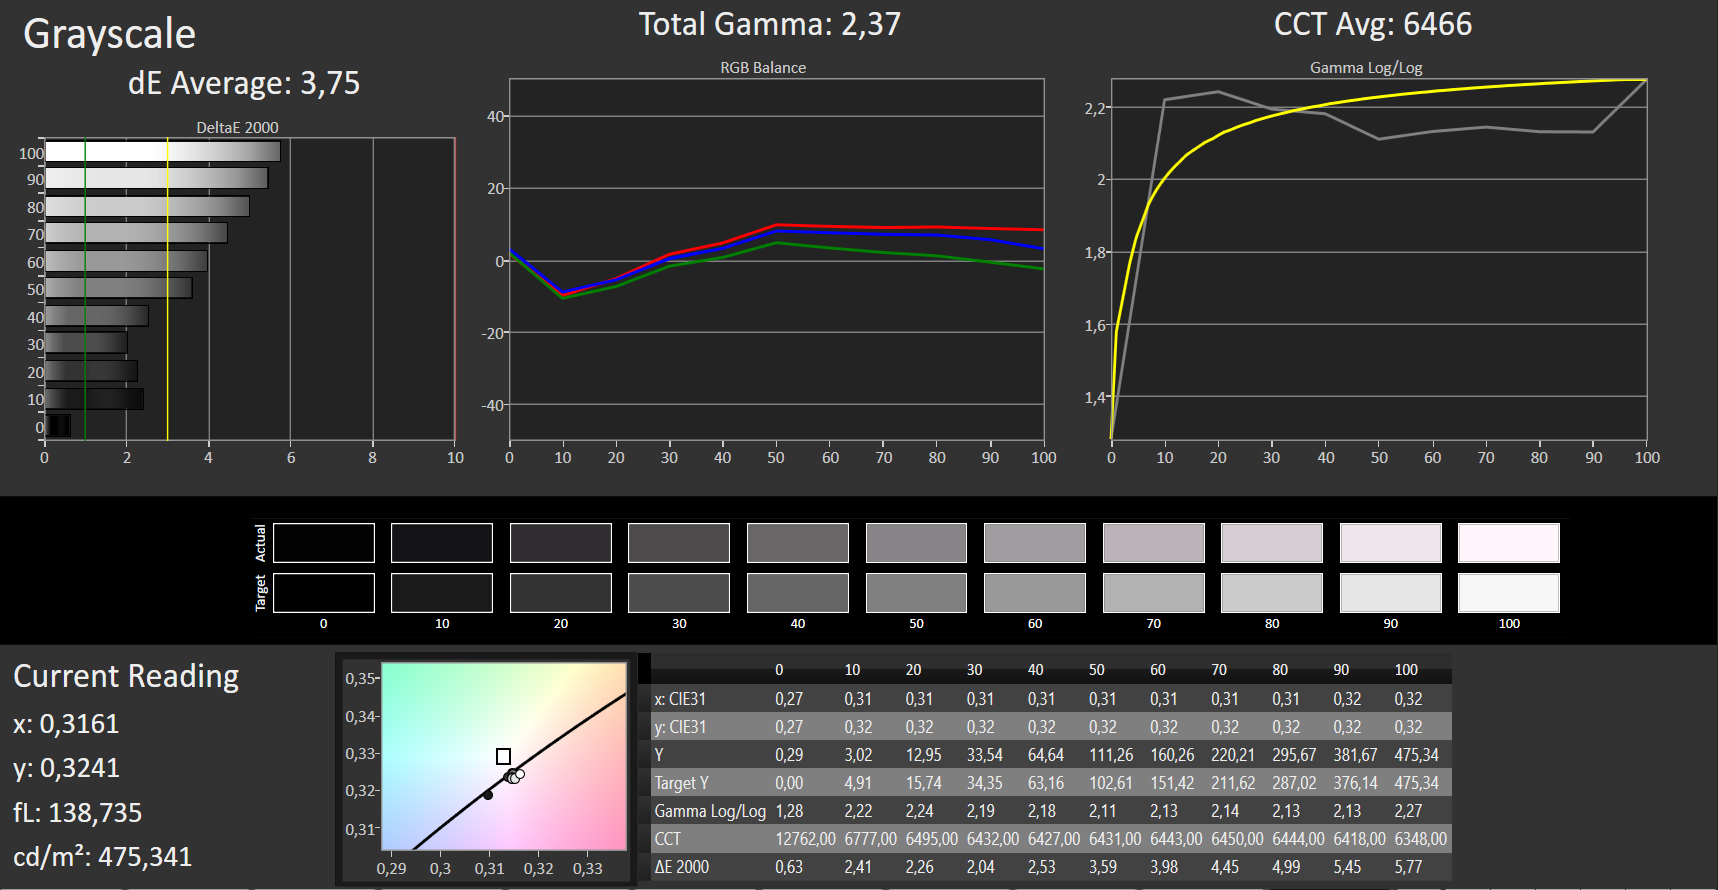
iluminação: 82 %
iluminação com acumulador: 466 cd/m²
Contraste: 1634:1 (Preto: 0.29 cd/m²)
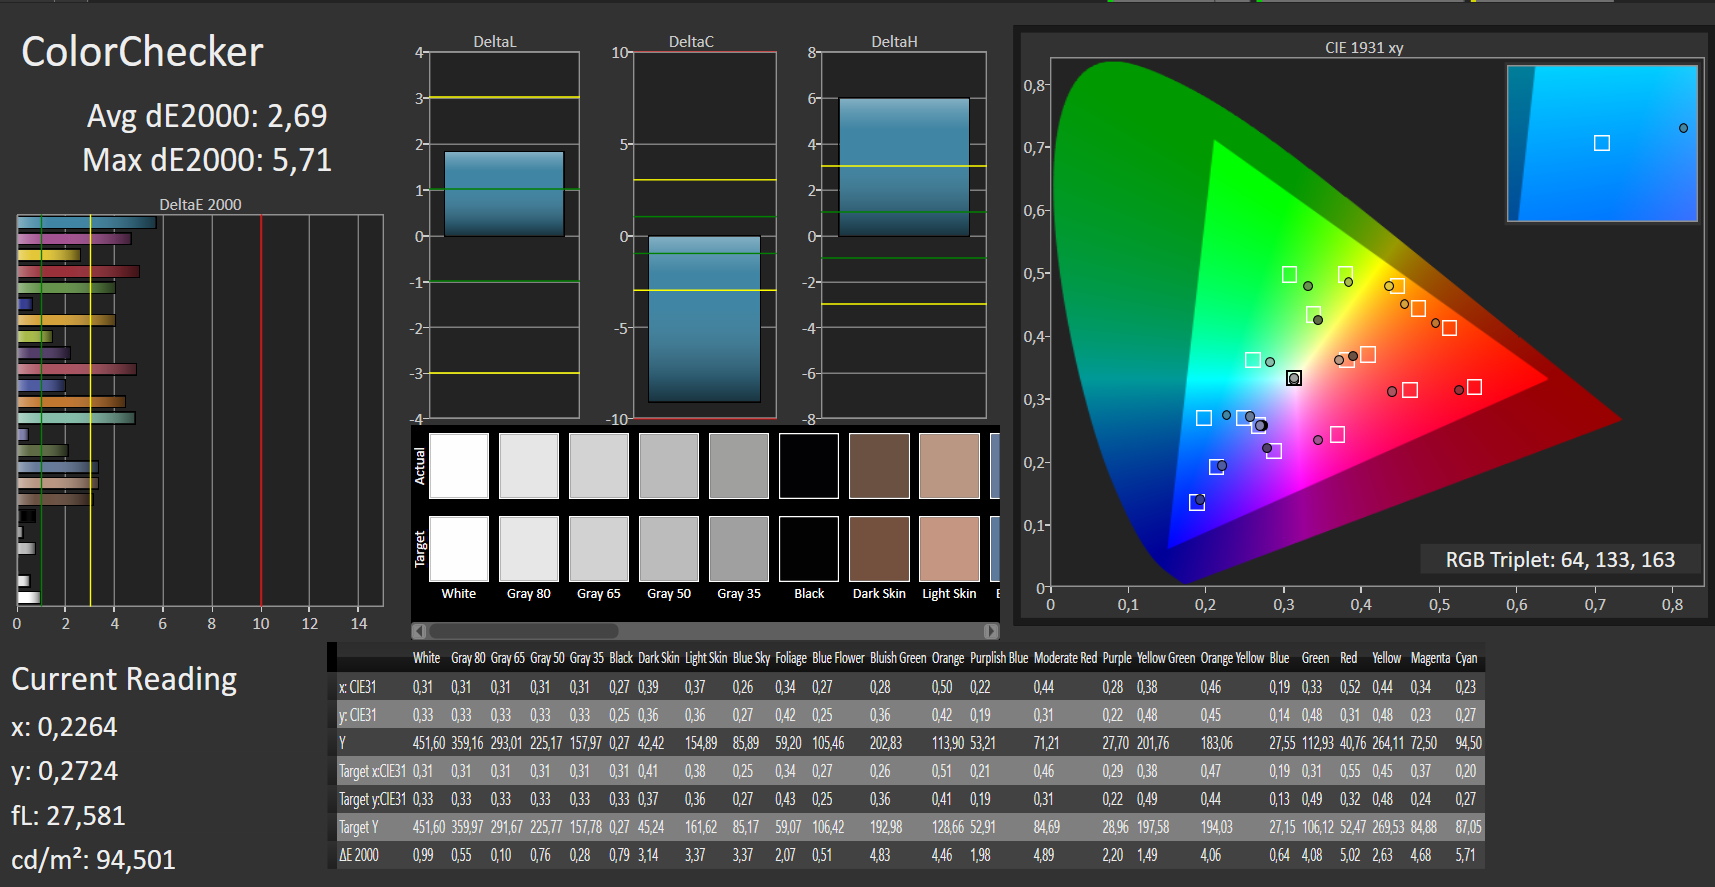
ΔE ColorChecker Calman: 2.38 | ∀{0.5-29.43 Ø4.73}
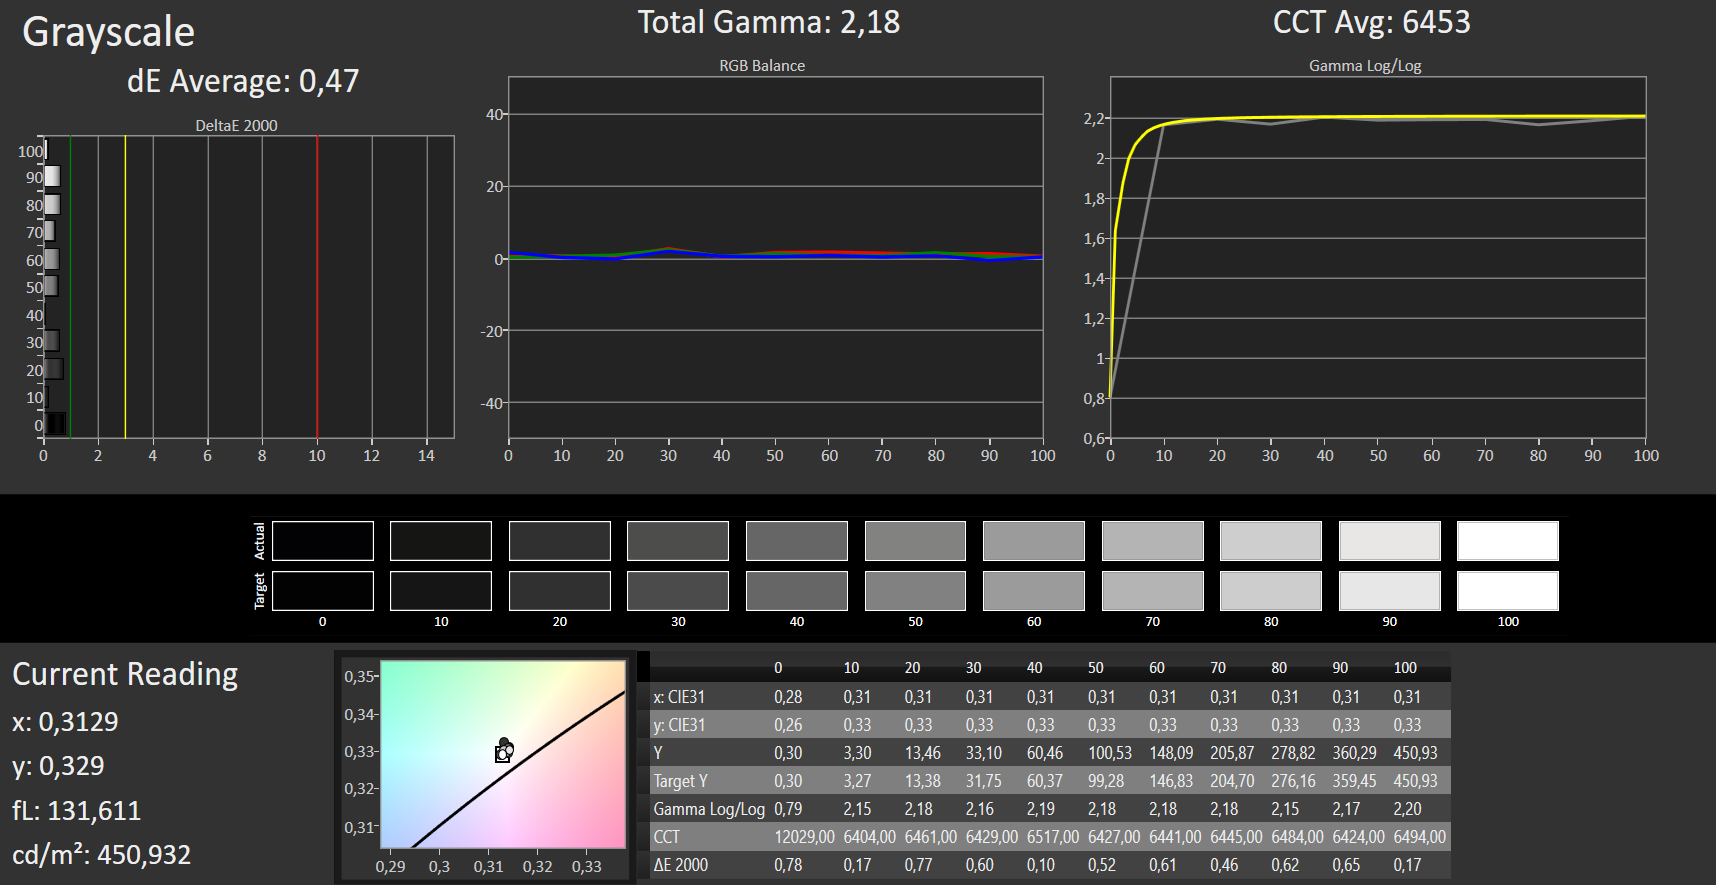
calibrated: 2.69
ΔE Greyscale Calman: 3.75 | ∀{0.09-98 Ø4.97}
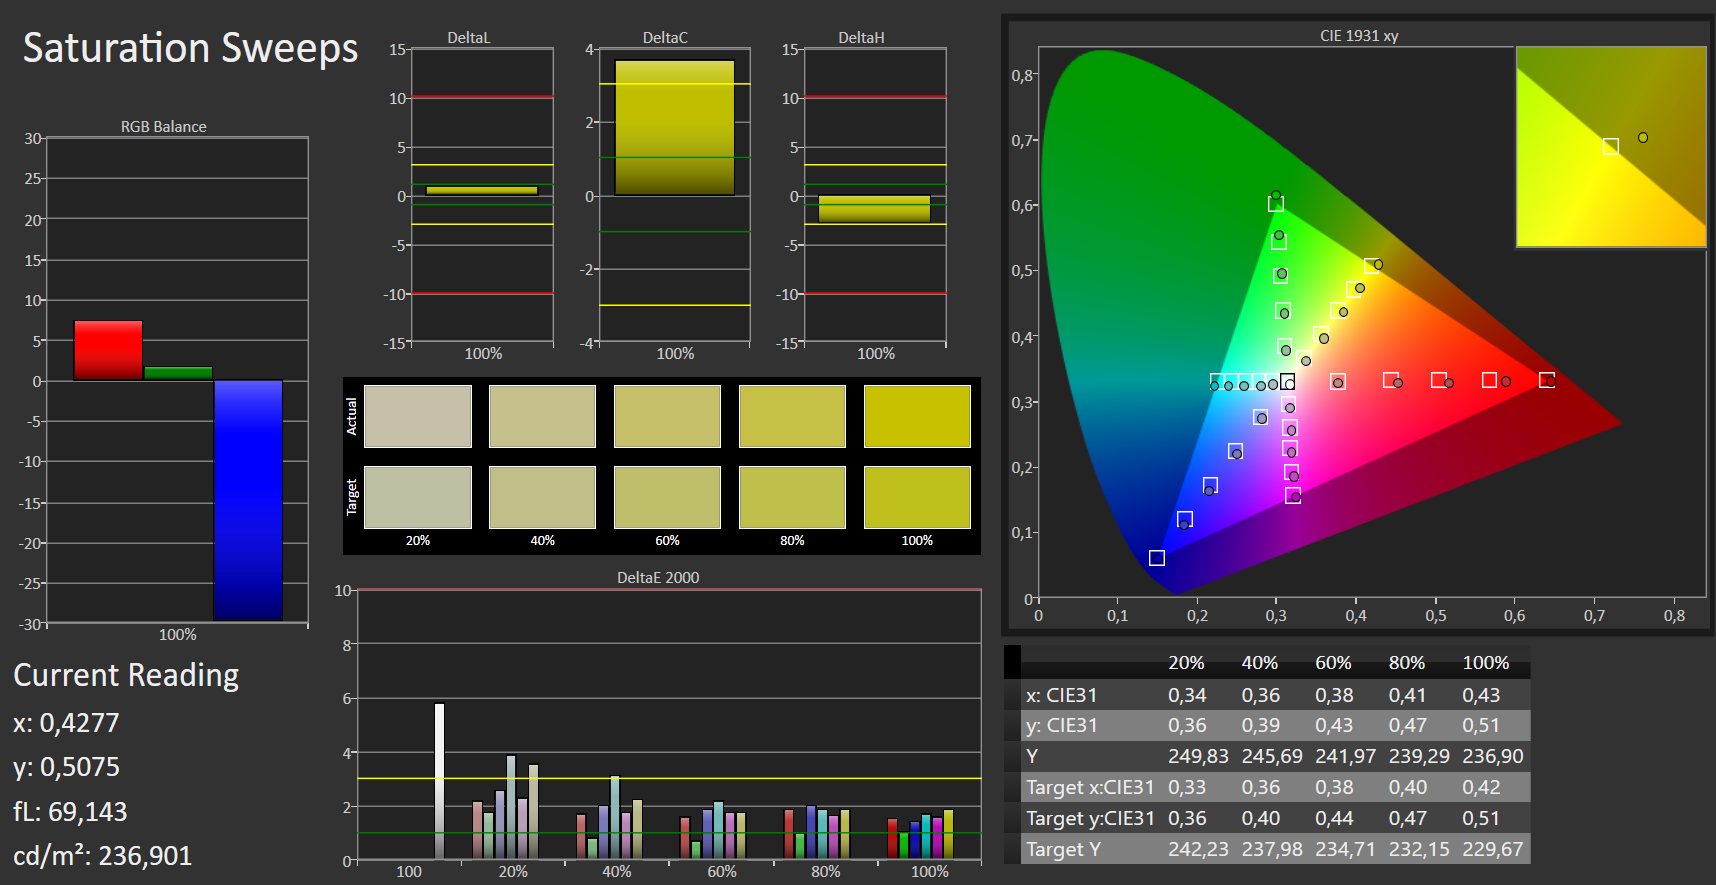
100% sRGB (Argyll 1.6.3 3D)
65% AdobeRGB 1998 (Argyll 1.6.3 3D)
71.2% AdobeRGB 1998 (Argyll 3D)
99.8% sRGB (Argyll 3D)
70.1% Display P3 (Argyll 3D)
Gamma: 2.37
CCT: 6466 K
| Acer Swift 3 SF313-52-71Y7 BOE, NE135FBM-N41, IPS, 2256x1504, 13.5" | Lenovo Yoga C940-14IIL LP140WF9-SPE2, IPS LED, 1920x1080, 14" | Acer Swift 3 SF313-51-59SZ BOE NV133FHM-N62, IPS, 1920x1080, 13.3" | Dell XPS 13 9380 2019 ID: AUO 282B B133ZAN Dell: 90NTH, IPS, 3840x2160, 13.3" | Lenovo ThinkBook 13s-20R90071GE N133HCE-EN2, a-Si IPS LED, 1920x1080, 13.3" | HP Envy 13-aq0003ng InfoVision M133NVF3 R2, IPS, 1920x1080, 13.3" | |
|---|---|---|---|---|---|---|
| Display | -4% | -9% | -8% | -3% | -8% | |
| Display P3 Coverage (%) | 70.1 | 66 -6% | 67 -4% | 64.7 -8% | 67 -4% | 64.4 -8% |
| sRGB Coverage (%) | 99.8 | 97.9 -2% | 88 -12% | 93.1 -7% | 99.1 -1% | 91.7 -8% |
| AdobeRGB 1998 Coverage (%) | 71.2 | 67.3 -5% | 64.3 -10% | 65.3 -8% | 69.2 -3% | 65.2 -8% |
| Response Times | 7% | 2% | -11% | 17% | 34% | |
| Response Time Grey 50% / Grey 80% * (ms) | 55 ? | 49.6 ? 10% | 44 ? 20% | 58 ? -5% | 40.4 ? 27% | 31 ? 44% |
| Response Time Black / White * (ms) | 31 ? | 30 ? 3% | 36 ? -16% | 36 ? -16% | 28.8 ? 7% | 24 ? 23% |
| PWM Frequency (Hz) | 208 ? | 500 ? | 25000 ? | 4000 ? | ||
| Screen | 4% | -40% | -16% | -1% | 0% | |
| Brightness middle (cd/m²) | 474 | 384 -19% | 300 -37% | 404 -15% | 319 -33% | 768 62% |
| Brightness (cd/m²) | 426 | 363 -15% | 277 -35% | 389 -9% | 309 -27% | 778 83% |
| Brightness Distribution (%) | 82 | 90 10% | 87 6% | 85 4% | 92 12% | 82 0% |
| Black Level * (cd/m²) | 0.29 | 0.17 41% | 0.26 10% | 0.37 -28% | 0.28 3% | 0.48 -66% |
| Contrast (:1) | 1634 | 2259 38% | 1154 -29% | 1092 -33% | 1139 -30% | 1600 -2% |
| Colorchecker dE 2000 * | 2.38 | 3.5 -47% | 5.96 -150% | 3.72 -56% | 2.4 -1% | 3.49 -47% |
| Colorchecker dE 2000 max. * | 5.88 | 5.5 6% | 10.6 -80% | 7.38 -26% | 6.3 -7% | 7.41 -26% |
| Colorchecker dE 2000 calibrated * | 2.69 | 1 63% | 2.47 8% | 2.06 23% | 0.6 78% | 2.07 23% |
| Greyscale dE 2000 * | 3.75 | 4.6 -23% | 7.64 -104% | 4.44 -18% | 3.8 -1% | 4.09 -9% |
| Gamma | 2.37 93% | 2.32 95% | 2.44 90% | 2.34 94% | 2.16 102% | 2.54 87% |
| CCT | 6466 101% | 6884 94% | 6877 95% | 7095 92% | 7335 89% | 6452 101% |
| Color Space (Percent of AdobeRGB 1998) (%) | 65 | 62 -5% | 57 -12% | 60 -8% | 63.5 -2% | 60 -8% |
| Color Space (Percent of sRGB) (%) | 100 | 97.7 -2% | 88 -12% | 93 -7% | 99.1 -1% | 92 -8% |
| Média Total (Programa/Configurações) | 2% /
3% | -16% /
-29% | -12% /
-14% | 4% /
1% | 9% /
3% |
* ... menor é melhor

Exibir tempos de resposta
| ↔ Tempo de resposta preto para branco | ||
|---|---|---|
| 31 ms ... ascensão ↗ e queda ↘ combinadas | ↗ 17 ms ascensão | 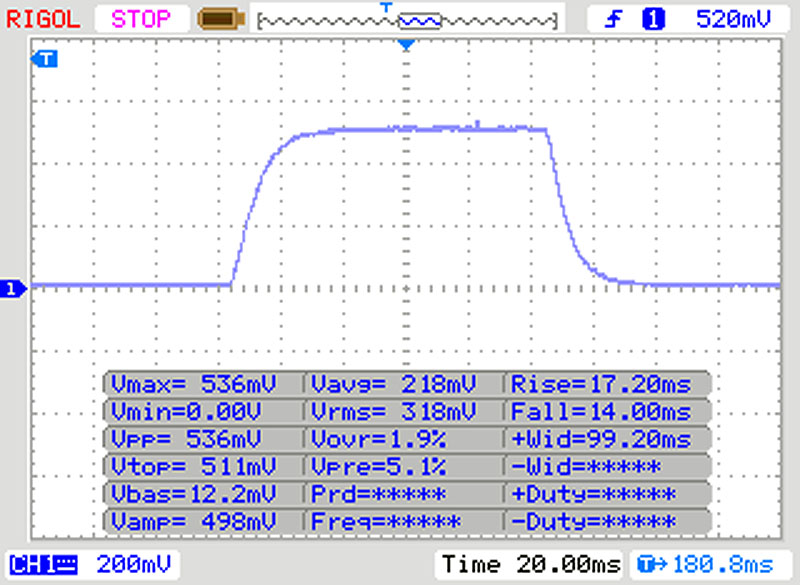 |
| ↘ 14 ms queda | ||
| A tela mostra taxas de resposta lentas em nossos testes e será insatisfatória para os jogadores. Em comparação, todos os dispositivos testados variam de 0.1 (mínimo) a 240 (máximo) ms. » 84 % de todos os dispositivos são melhores. Isso significa que o tempo de resposta medido é pior que a média de todos os dispositivos testados (19.9 ms). | ||
| ↔ Tempo de resposta 50% cinza a 80% cinza | ||
| 55 ms ... ascensão ↗ e queda ↘ combinadas | ↗ 25 ms ascensão | 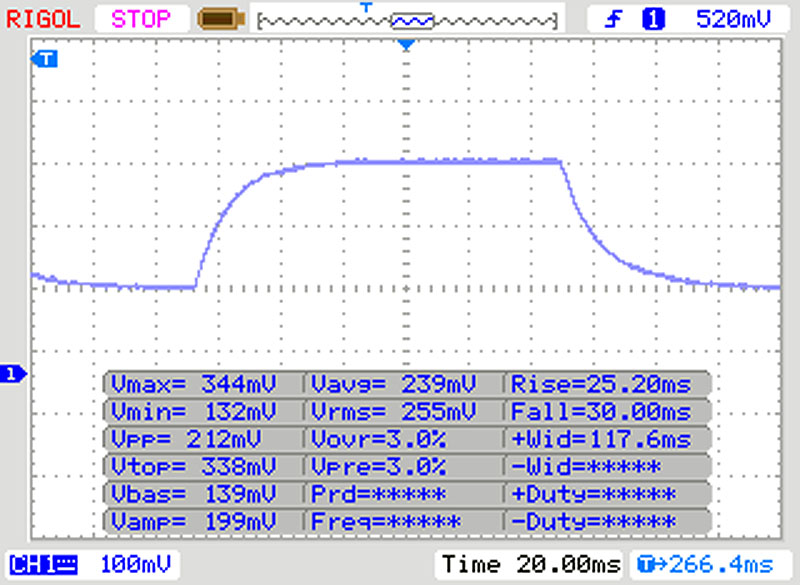 |
| ↘ 30 ms queda | ||
| A tela mostra taxas de resposta lentas em nossos testes e será insatisfatória para os jogadores. Em comparação, todos os dispositivos testados variam de 0.165 (mínimo) a 636 (máximo) ms. » 92 % de todos os dispositivos são melhores. Isso significa que o tempo de resposta medido é pior que a média de todos os dispositivos testados (31.1 ms). | ||
Cintilação da tela / PWM (modulação por largura de pulso)
| Tela tremeluzindo/PWM detectado | 208 Hz | ≤ 90 % configuração de brilho | 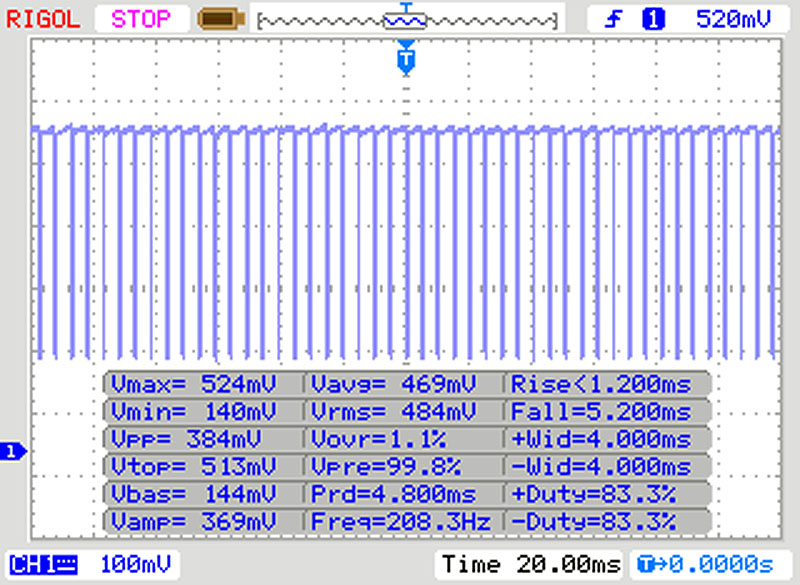 |
A luz de fundo da tela pisca em 208 Hz (pior caso, por exemplo, utilizando PWM) Cintilação detectada em uma configuração de brilho de 90 % e abaixo. Não deve haver cintilação ou PWM acima desta configuração de brilho. A frequência de 208 Hz é relativamente baixa, portanto, usuários sensíveis provavelmente notarão cintilação e sentirão fadiga ocular na configuração de brilho indicada e abaixo. [pwm_comparison] Em comparação: 52 % de todos os dispositivos testados não usam PWM para escurecer a tela. Se PWM foi detectado, uma média de 7798 (mínimo: 5 - máximo: 343500) Hz foi medida. | |||
* ... menor é melhor
| PCMark 8 Home Score Accelerated v2 | 3759 pontos | |
| PCMark 8 Creative Score Accelerated v2 | 5979 pontos | |
| PCMark 8 Work Score Accelerated v2 | 4802 pontos | |
| PCMark 10 Score | 3975 pontos | |
Ajuda | ||
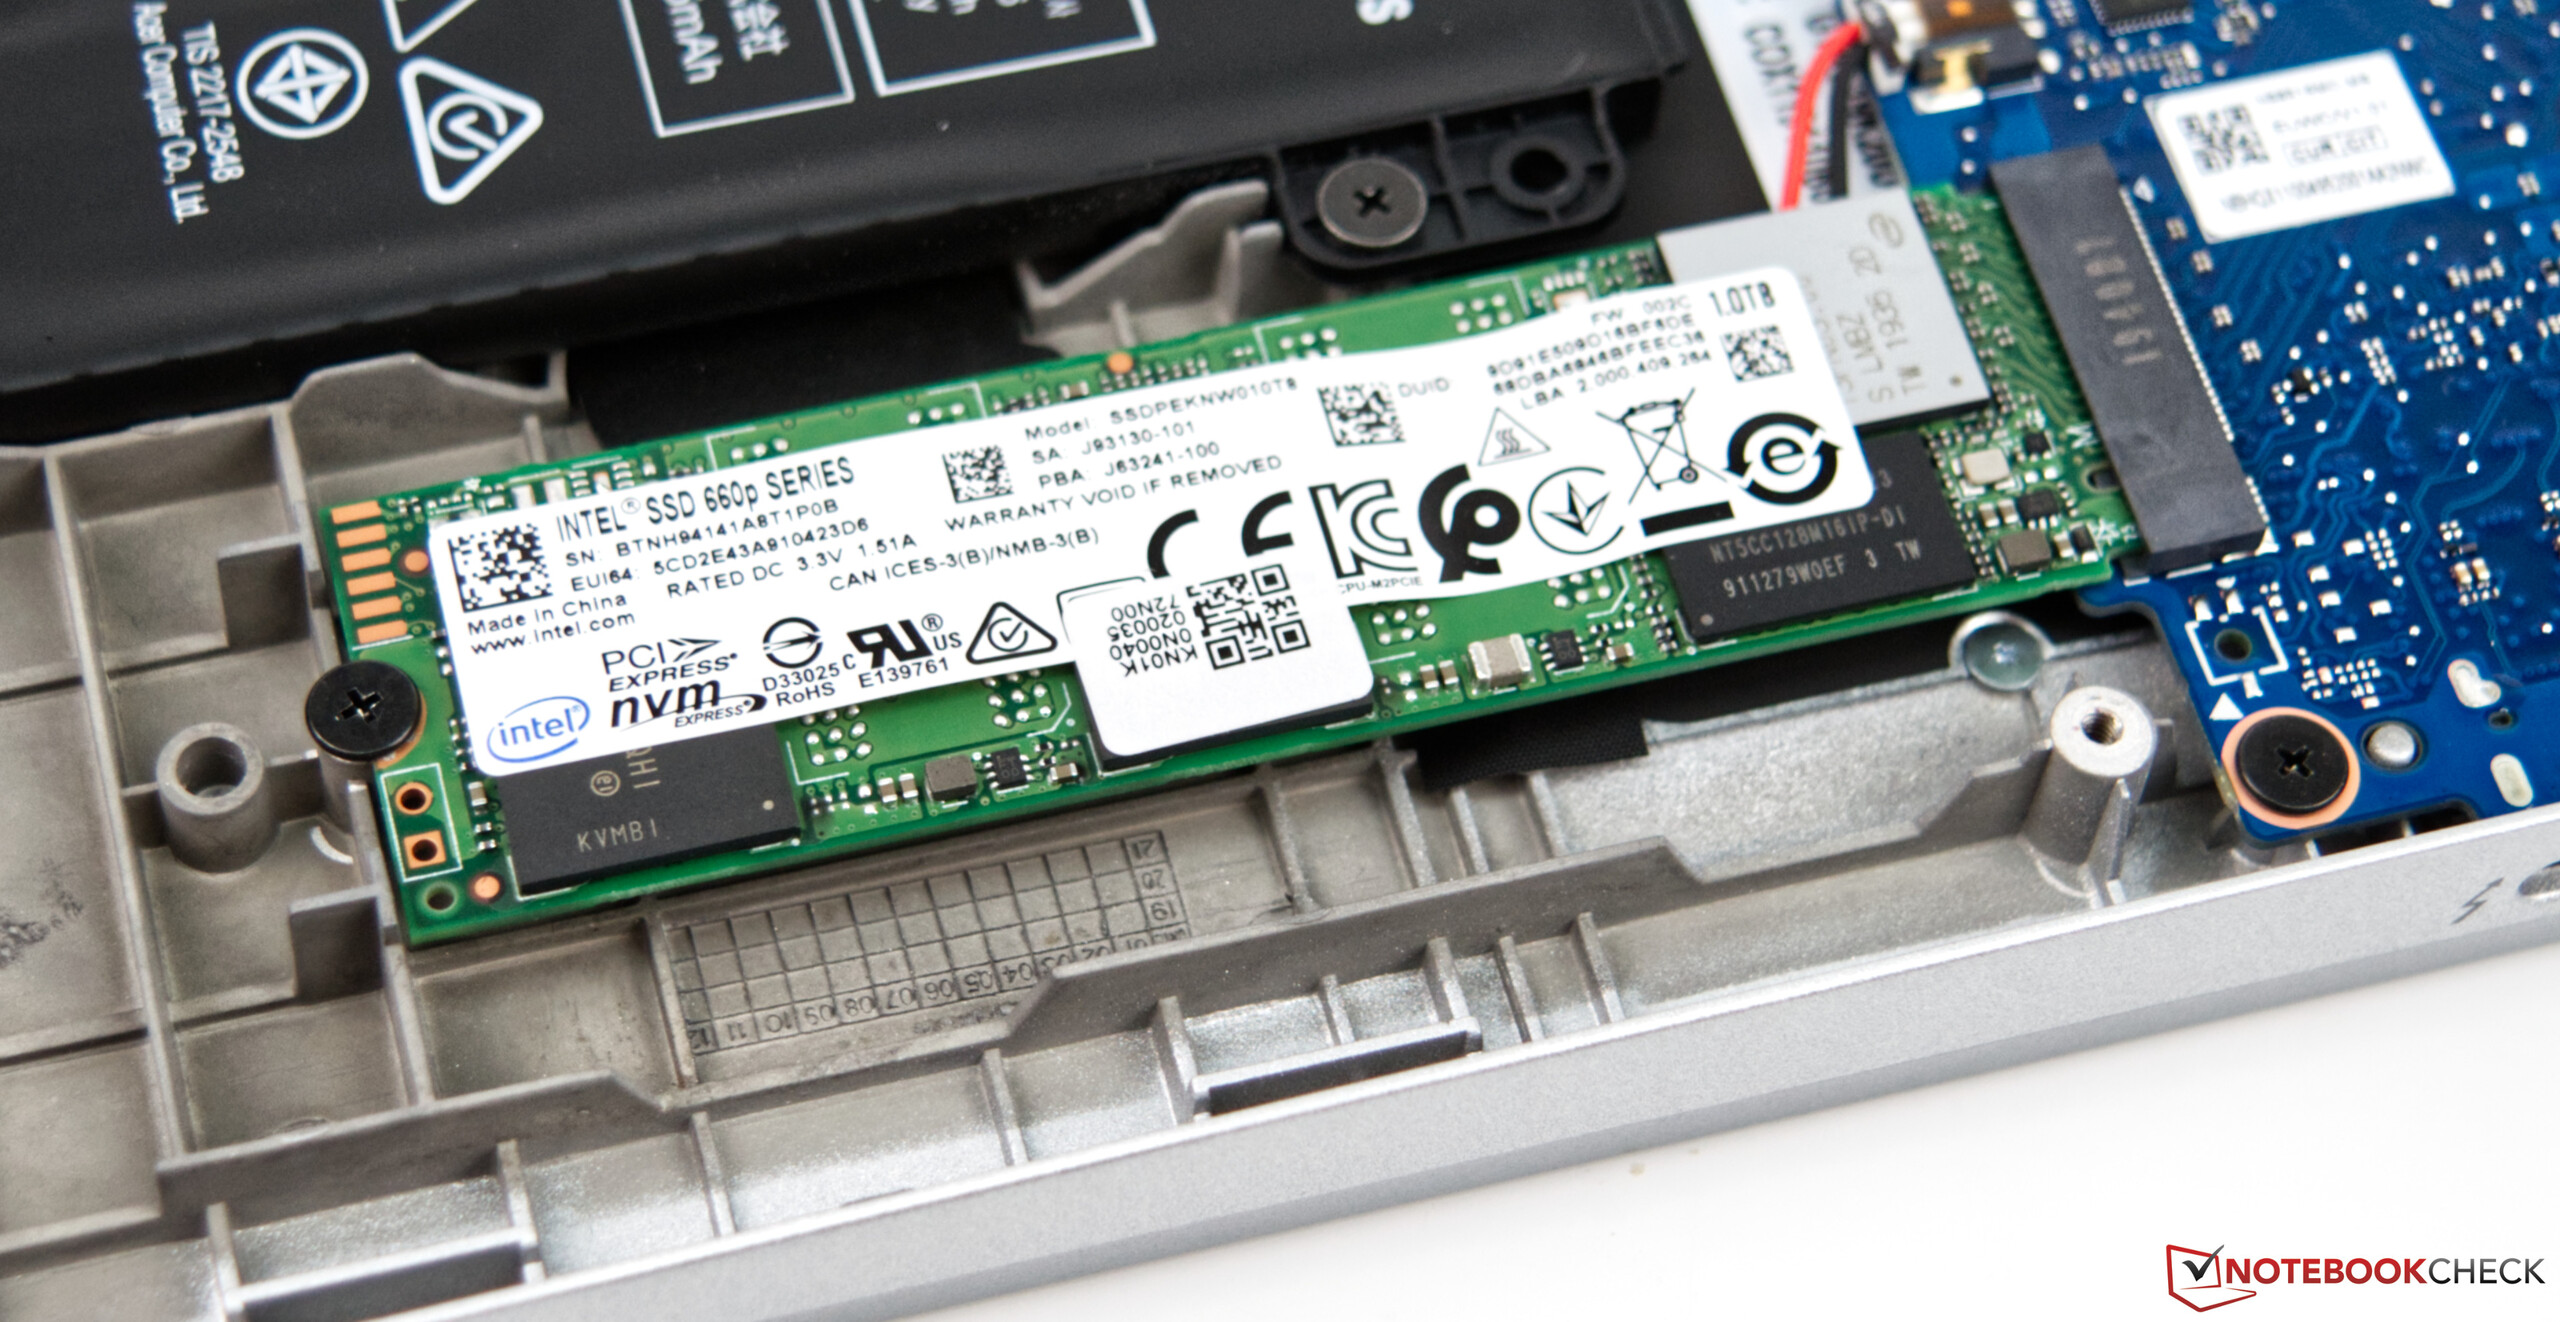
| Acer Swift 3 SF313-52-71Y7 Intel SSD 660p 1TB SSDPEKNW010T8 | Lenovo Yoga C940-14IIL Samsung SSD PM981 MZVLB512HAJQ | Acer Swift 3 SF313-51-59SZ Kingston RBUSNS8154P3256GJ1 | Dell XPS 13 9380 2019 SK hynix PC401 HFS256GD9TNG | Lenovo ThinkBook 13s-20R90071GE SK hynix BC501 HFM512GDHTNG-8310A | HP Envy 13-aq0003ng Toshiba KBG30ZMV512G | Média Intel SSD 660p 1TB SSDPEKNW010T8 | |
|---|---|---|---|---|---|---|---|
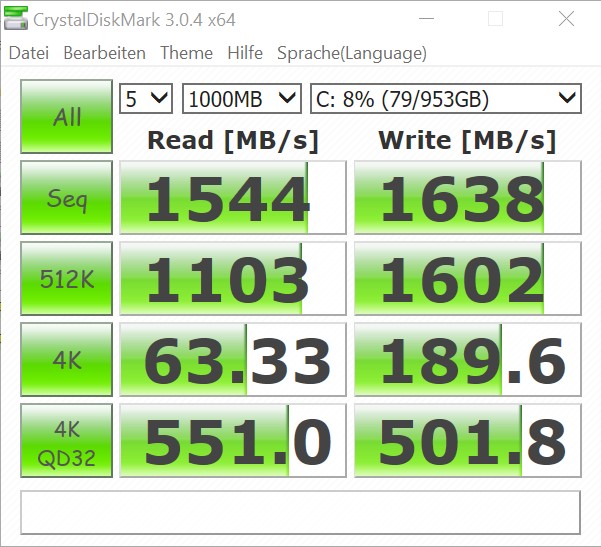
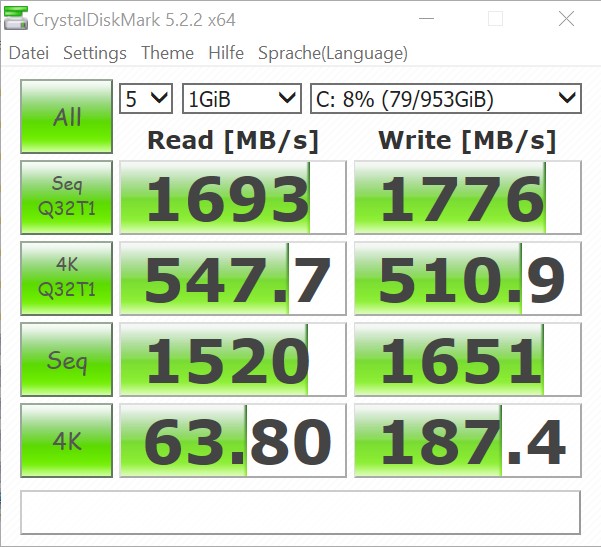
| CrystalDiskMark 5.2 / 6 | 8% | -7% | -36% | -34% | -42% | -11% | |
| Write 4K (MB/s) | 187.4 | 128.4 -31% | 113.7 -39% | 84.6 -55% | 89.3 -52% | 106.2 -43% | 144.5 ? -23% |
| Read 4K (MB/s) | 63.8 | 46.37 -27% | 40.6 -36% | 38.52 -40% | 37.4 -41% | 44.89 -30% | 54.1 ? -15% |
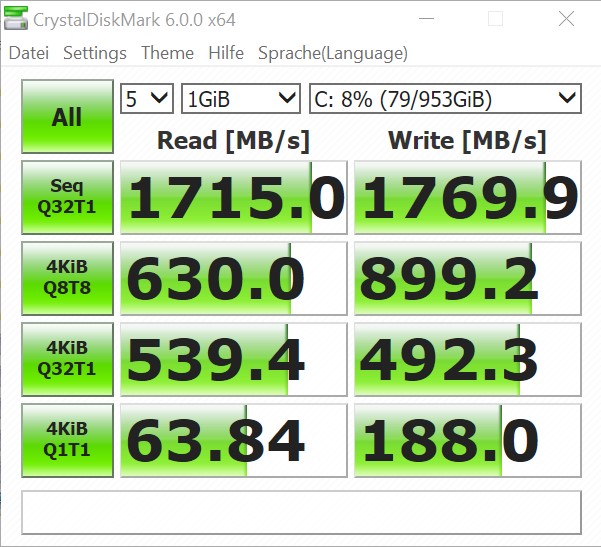
| Write Seq (MB/s) | 1776 | 1863 5% | 845 -52% | 557 -69% | 608 -66% | 639 -64% | 1445 ? -19% |
| Read Seq (MB/s) | 1693 | 2340 38% | 1137 -33% | 1393 -18% | 1019 -40% | 849 -50% | 1446 ? -15% |
| Write 4K Q32T1 (MB/s) | 492.3 | 451.1 -8% | 868 76% | 339.5 -31% | 487.9 -1% | 217.4 -56% | 427 ? -13% |
| Read 4K Q32T1 (MB/s) | 539 | 415.3 -23% | 1580 193% | 255.4 -53% | 284.8 -47% | 322.1 -40% | 456 ? -15% |
| Write Seq Q32T1 (MB/s) | 1770 | 2985 69% | 345.6 -80% | 558 -68% | 872 -51% | 865 -51% | 1650 ? -7% |
| Read Seq Q32T1 (MB/s) | 1715 | 2565 50% | 411.7 -76% | 2541 48% | 1635 -5% | 1630 -5% | 1728 ? 1% |
| Write 4K Q8T8 (MB/s) | 899 | 451.4 -50% | 647 -28% | 387.3 -57% | 880 ? -2% | ||
| Read 4K Q8T8 (MB/s) | 630 | 1004 59% | 685 9% | 757 20% | 629 ? 0% | ||
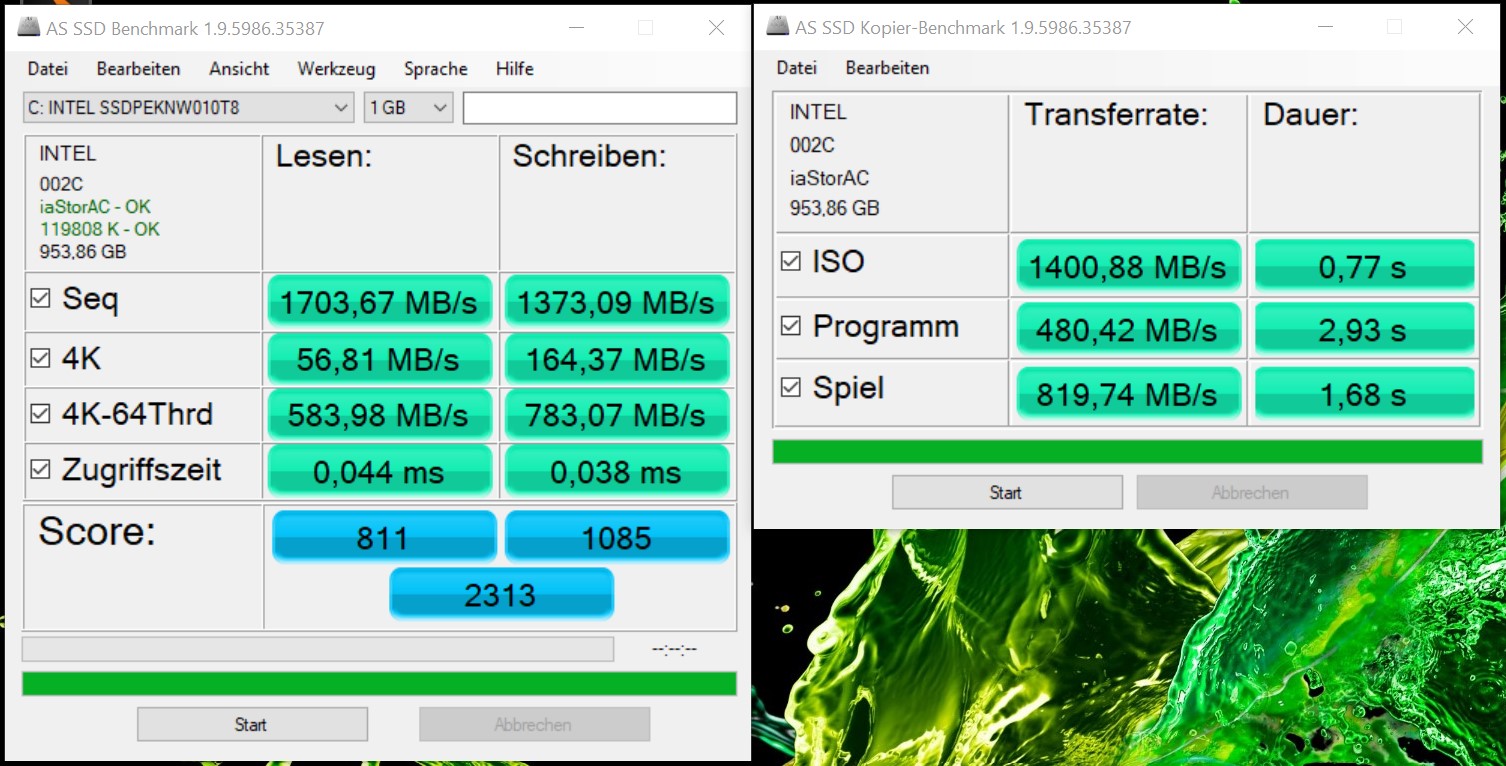
| AS SSD | 35% | -26% | -33% | -18% | -72% | -14% | |
| Seq Read (MB/s) | 1703 | 2525 48% | 1403 -18% | 2035 19% | 1264 -26% | 1295 -24% | 1456 ? -15% |
| Seq Write (MB/s) | 1373 | 1253 -9% | 836 -39% | 658 -52% | 518 -62% | 593 -57% | 1404 ? 2% |
| 4K Read (MB/s) | 56.8 | 59.1 4% | 42.19 -26% | 39.74 -30% | 40.31 -29% | 45.58 -20% | 48.7 ? -14% |
| 4K Write (MB/s) | 164.4 | 134.1 -18% | 99.7 -39% | 105.7 -36% | 119.1 -28% | 118.8 -28% | 131.6 ? -20% |
| 4K-64 Read (MB/s) | 584 | 1010 73% | 738 26% | 461 -21% | 772 32% | 604 3% | 586 ? 0% |
| 4K-64 Write (MB/s) | 783 | 1461 87% | 606 -23% | 300.1 -62% | 672 -14% | 272.4 -65% | 788 ? 1% |
| Access Time Read * (ms) | 0.044 | 0.052 -18% | 0.074 -68% | 0.061 -39% | 0.046 -5% | 0.147 -234% | 0.07236 ? -64% |
| Access Time Write * (ms) | 0.038 | 0.029 24% | 0.045 -18% | 0.051 -34% | 0.031 18% | 0.168 -342% | 0.07731 ? -103% |
| Score Read (Points) | 811 | 1322 63% | 921 14% | 704 -13% | 939 16% | 779 -4% | 780 ? -4% |
| Score Write (Points) | 1085 | 1721 59% | 789 -27% | 471 -57% | 843 -22% | 450 -59% | 1060 ? -2% |
| Score Total (Points) | 2313 | 3670 59% | 2163 -6% | 1479 -36% | 2234 -3% | 1607 -31% | 2252 ? -3% |
| Copy ISO MB/s (MB/s) | 1401 | 2016 44% | 586 -58% | 893 -36% | 943 -33% | 593 -58% | 1469 ? 5% |
| Copy Program MB/s (MB/s) | 480.4 | 542 13% | 315.2 -34% | 287.9 -40% | 292.2 -39% | 277.6 -42% | 484 ? 1% |
| Copy Game MB/s (MB/s) | 820 | 1278 56% | 478.5 -42% | 618 -25% | 374.1 -54% | 452.7 -45% | 997 ? 22% |
| Média Total (Programa/Configurações) | 22% /
24% | -17% /
-18% | -35% /
-34% | -26% /
-25% | -57% /
-61% | -13% /
-13% |
* ... menor é melhor

| 3DMark 11 Performance | 4308 pontos | |
| 3DMark Ice Storm Standard Score | 63796 pontos | |
| 3DMark Cloud Gate Standard Score | 11959 pontos | |
| 3DMark Fire Strike Score | 2508 pontos | |
| 3DMark Fire Strike Extreme Score | 1252 pontos | |
Ajuda | ||
| baixo | média | alto | ultra | |
|---|---|---|---|---|
| BioShock Infinite (2013) | 91.6 | 58.6 | 50.9 | 19.4 |
| Dota 2 Reborn (2015) | 82.7 | 52.7 | 32.8 | 30 |
| Rise of the Tomb Raider (2016) | 38.9 | 23.4 | 13.6 | |
| Rocket League (2017) | 100 | 52.8 | 39.6 | |
| X-Plane 11.11 (2018) | 28.2 | 12.5 | 12.1 | |
| Borderlands 3 (2019) | 26.7 | 11.7 | 7.73 |
Barulho
| Ocioso |
| 30.3 / 30.3 / 30.3 dB |
| Carga |
| 31.7 / 32.7 dB |
 | ||
30 dB silencioso 40 dB(A) audível 50 dB(A) ruidosamente alto |
||
min: | ||
| Acer Swift 3 SF313-52-71Y7 Iris Plus Graphics G7 (Ice Lake 64 EU), i7-1065G7, Intel SSD 660p 1TB SSDPEKNW010T8 | Lenovo Yoga C940-14IIL Iris Plus Graphics G7 (Ice Lake 64 EU), i7-1065G7, Samsung SSD PM981 MZVLB512HAJQ | Acer Swift 3 SF313-51-59SZ UHD Graphics 620, i5-8250U, Kingston RBUSNS8154P3256GJ1 | Dell XPS 13 9380 2019 UHD Graphics 620, i5-8265U, SK hynix PC401 HFS256GD9TNG | Lenovo ThinkBook 13s-20R90071GE UHD Graphics 620, i5-8265U, SK hynix BC501 HFM512GDHTNG-8310A | HP Envy 13-aq0003ng GeForce MX250, i7-8565U, Toshiba KBG30ZMV512G | |
|---|---|---|---|---|---|---|
| Noise | 1% | -2% | -3% | 1% | -3% | |
| desligado / ambiente * (dB) | 30.3 | 29.3 3% | 30.4 -0% | 30.4 -0% | 28.8 5% | 30 1% |
| Idle Minimum * (dB) | 30.3 | 29.3 3% | 30.4 -0% | 30.4 -0% | 28.8 5% | 30 1% |
| Idle Average * (dB) | 30.3 | 29.3 3% | 30.4 -0% | 30.4 -0% | 28.8 5% | 30 1% |
| Idle Maximum * (dB) | 30.3 | 29.3 3% | 30.7 -1% | 30.4 -0% | 29.7 2% | 30 1% |
| Load Average * (dB) | 31.7 | 33.3 -5% | 33.7 -6% | 31.7 -0% | 30.7 3% | |
| Load Maximum * (dB) | 32.7 | 33.3 -2% | 34 -4% | 38.1 -17% | 38.3 -17% | 39.5 -21% |
* ... menor é melhor
(+) A temperatura máxima no lado superior é 33.5 °C / 92 F, em comparação com a média de 35.9 °C / 97 F , variando de 21.4 a 59 °C para a classe Subnotebook.
(+) A parte inferior aquece até um máximo de 35.6 °C / 96 F, em comparação com a média de 39.2 °C / 103 F
(+) Em uso inativo, a temperatura média para o lado superior é 23.9 °C / 75 F, em comparação com a média do dispositivo de 30.8 °C / ### class_avg_f### F.
(+) Os apoios para as mãos e o touchpad são mais frios que a temperatura da pele, com um máximo de 26.1 °C / 79 F e, portanto, são frios ao toque.
(+) A temperatura média da área do apoio para as mãos de dispositivos semelhantes foi 28.2 °C / 82.8 F (+2.1 °C / 3.8 F).
| Acer Swift 3 SF313-52-71Y7 Iris Plus Graphics G7 (Ice Lake 64 EU), i7-1065G7, Intel SSD 660p 1TB SSDPEKNW010T8 | Lenovo Yoga C940-14IIL Iris Plus Graphics G7 (Ice Lake 64 EU), i7-1065G7, Samsung SSD PM981 MZVLB512HAJQ | Acer Swift 3 SF313-51-59SZ UHD Graphics 620, i5-8250U, Kingston RBUSNS8154P3256GJ1 | Dell XPS 13 9380 2019 UHD Graphics 620, i5-8265U, SK hynix PC401 HFS256GD9TNG | Lenovo ThinkBook 13s-20R90071GE UHD Graphics 620, i5-8265U, SK hynix BC501 HFM512GDHTNG-8310A | HP Envy 13-aq0003ng GeForce MX250, i7-8565U, Toshiba KBG30ZMV512G | |
|---|---|---|---|---|---|---|
| Heat | -11% | -12% | -22% | -10% | -20% | |
| Maximum Upper Side * (°C) | 33.5 | 41 -22% | 40.4 -21% | 47.2 -41% | 40.3 -20% | 41 -22% |
| Maximum Bottom * (°C) | 35.6 | 44.6 -25% | 42.1 -18% | 43.3 -22% | 44.6 -25% | 42.9 -21% |
| Idle Upper Side * (°C) | 24.9 | 24.4 2% | 26.2 -5% | 27.6 -11% | 24.3 2% | 29.3 -18% |
| Idle Bottom * (°C) | 25.4 | 25 2% | 26 -2% | 28.6 -13% | 24.4 4% | 30.2 -19% |
* ... menor é melhor
Acer Swift 3 SF313-52-71Y7 análise de áudio
(-) | alto-falantes não muito altos (###valor### dB)
Graves 100 - 315Hz
(-) | quase nenhum baixo - em média 26.5% menor que a mediana
(±) | a linearidade dos graves é média (9.8% delta para a frequência anterior)
Médios 400 - 2.000 Hz
(+) | médios equilibrados - apenas 3.7% longe da mediana
(±) | a linearidade dos médios é média (8.8% delta para frequência anterior)
Altos 2 - 16 kHz
(±) | máximos mais altos - em média 5% maior que a mediana
(+) | os máximos são lineares (5.7% delta da frequência anterior)
Geral 100 - 16.000 Hz
(±) | a linearidade do som geral é média (27.4% diferença em relação à mediana)
Comparado com a mesma classe
» 89% de todos os dispositivos testados nesta classe foram melhores, 3% semelhantes, 8% piores
» O melhor teve um delta de 5%, a média foi 18%, o pior foi 53%
Comparado com todos os dispositivos testados
» 83% de todos os dispositivos testados foram melhores, 4% semelhantes, 13% piores
» O melhor teve um delta de 4%, a média foi 24%, o pior foi 134%
Lenovo Yoga C940-14IIL análise de áudio
(±) | o volume do alto-falante é médio, mas bom (###valor### dB)
Graves 100 - 315Hz
(±) | graves reduzidos - em média 6% menor que a mediana
(±) | a linearidade dos graves é média (9.9% delta para a frequência anterior)
Médios 400 - 2.000 Hz
(+) | médios equilibrados - apenas 3.9% longe da mediana
(+) | médios são lineares (3.6% delta para frequência anterior)
Altos 2 - 16 kHz
(±) | máximos reduzidos - em média 7.6% menor que a mediana
(+) | os máximos são lineares (6.1% delta da frequência anterior)
Geral 100 - 16.000 Hz
(±) | a linearidade do som geral é média (16.9% diferença em relação à mediana)
Comparado com a mesma classe
» 31% de todos os dispositivos testados nesta classe foram melhores, 7% semelhantes, 61% piores
» O melhor teve um delta de 6%, a média foi 20%, o pior foi 57%
Comparado com todos os dispositivos testados
» 30% de todos os dispositivos testados foram melhores, 8% semelhantes, 62% piores
» O melhor teve um delta de 4%, a média foi 24%, o pior foi 134%
| desligado | |
| Ocioso | |
| Carga |
|
Key:
min: | |
| Acer Swift 3 SF313-52-71Y7 i7-1065G7, Iris Plus Graphics G7 (Ice Lake 64 EU), Intel SSD 660p 1TB SSDPEKNW010T8, IPS, 2256x1504, 13.5" | Lenovo Yoga C940-14IIL i7-1065G7, Iris Plus Graphics G7 (Ice Lake 64 EU), Samsung SSD PM981 MZVLB512HAJQ, IPS LED, 1920x1080, 14" | Acer Swift 3 SF313-51-59SZ i5-8250U, UHD Graphics 620, Kingston RBUSNS8154P3256GJ1, IPS, 1920x1080, 13.3" | Dell XPS 13 9380 2019 i5-8265U, UHD Graphics 620, SK hynix PC401 HFS256GD9TNG, IPS, 3840x2160, 13.3" | Lenovo ThinkBook 13s-20R90071GE i5-8265U, UHD Graphics 620, SK hynix BC501 HFM512GDHTNG-8310A, a-Si IPS LED, 1920x1080, 13.3" | HP Envy 13-aq0003ng i7-8565U, GeForce MX250, Toshiba KBG30ZMV512G, IPS, 1920x1080, 13.3" | Média Intel Iris Plus Graphics G7 (Ice Lake 64 EU) | Média da turma Subnotebook | |
|---|---|---|---|---|---|---|---|---|
| Power Consumption | -77% | -48% | -88% | -42% | -98% | -71% | -75% | |
| Idle Minimum * (Watt) | 1.8 | 3.2 -78% | 3.4 -89% | 4.8 -167% | 3.1 -72% | 3.9 -117% | 3.91 ? -117% | 3.78 ? -110% |
| Idle Average * (Watt) | 4.6 | 7 -52% | 5.8 -26% | 8.6 -87% | 5.87 -28% | 7.8 -70% | 7.33 ? -59% | 6.6 ? -43% |
| Idle Maximum * (Watt) | 6.1 | 8.9 -46% | 8.8 -44% | 10.4 -70% | 6.6 -8% | 10.8 -77% | 9.16 ? -50% | 7.93 ? -30% |
| Load Average * (Watt) | 27.4 | 47.6 -74% | 34 -24% | 37.9 -38% | 35.3 -29% | 53 -93% | 39.2 ? -43% | 41.8 ? -53% |
| Load Maximum * (Watt) | 27 | 63.1 -134% | 42 -56% | 48.5 -80% | 46.5 -72% | 62.7 -132% | 49.8 ? -84% | 64.7 ? -140% |
* ... menor é melhor

| Acer Swift 3 SF313-52-71Y7 i7-1065G7, Iris Plus Graphics G7 (Ice Lake 64 EU), 54.5 Wh | Lenovo Yoga C940-14IIL i7-1065G7, Iris Plus Graphics G7 (Ice Lake 64 EU), 60 Wh | Acer Swift 3 SF313-51-59SZ i5-8250U, UHD Graphics 620, 48.8 Wh | Dell XPS 13 9380 2019 i5-8265U, UHD Graphics 620, 52 Wh | Lenovo ThinkBook 13s-20R90071GE i5-8265U, UHD Graphics 620, 45 Wh | HP Envy 13-aq0003ng i7-8565U, GeForce MX250, 53.2 Wh | Média da turma Subnotebook | |
|---|---|---|---|---|---|---|---|
| Duração da bateria | -8% | -10% | -12% | -16% | -17% | 25% | |
| Reader / Idle (h) | 21.4 | 18.6 -13% | 17.2 -20% | 27.8 ? 30% | |||
| H.264 (h) | 10.5 | 13.2 26% | 8.3 -21% | 10.8 3% | 15.8 ? 50% | ||
| WiFi v1.3 (h) | 10.3 | 10.6 3% | 9.6 -7% | 8.3 -19% | 9.1 -12% | 8.5 -17% | 14 ? 36% |
| Load (h) | 2.3 | 1.1 -52% | 2.3 0% | 2.4 4% | 1.4 -39% | 1.942 ? -16% |
Pro
Contra
Verdict – A Good Subnotebook with some Minor Flaws
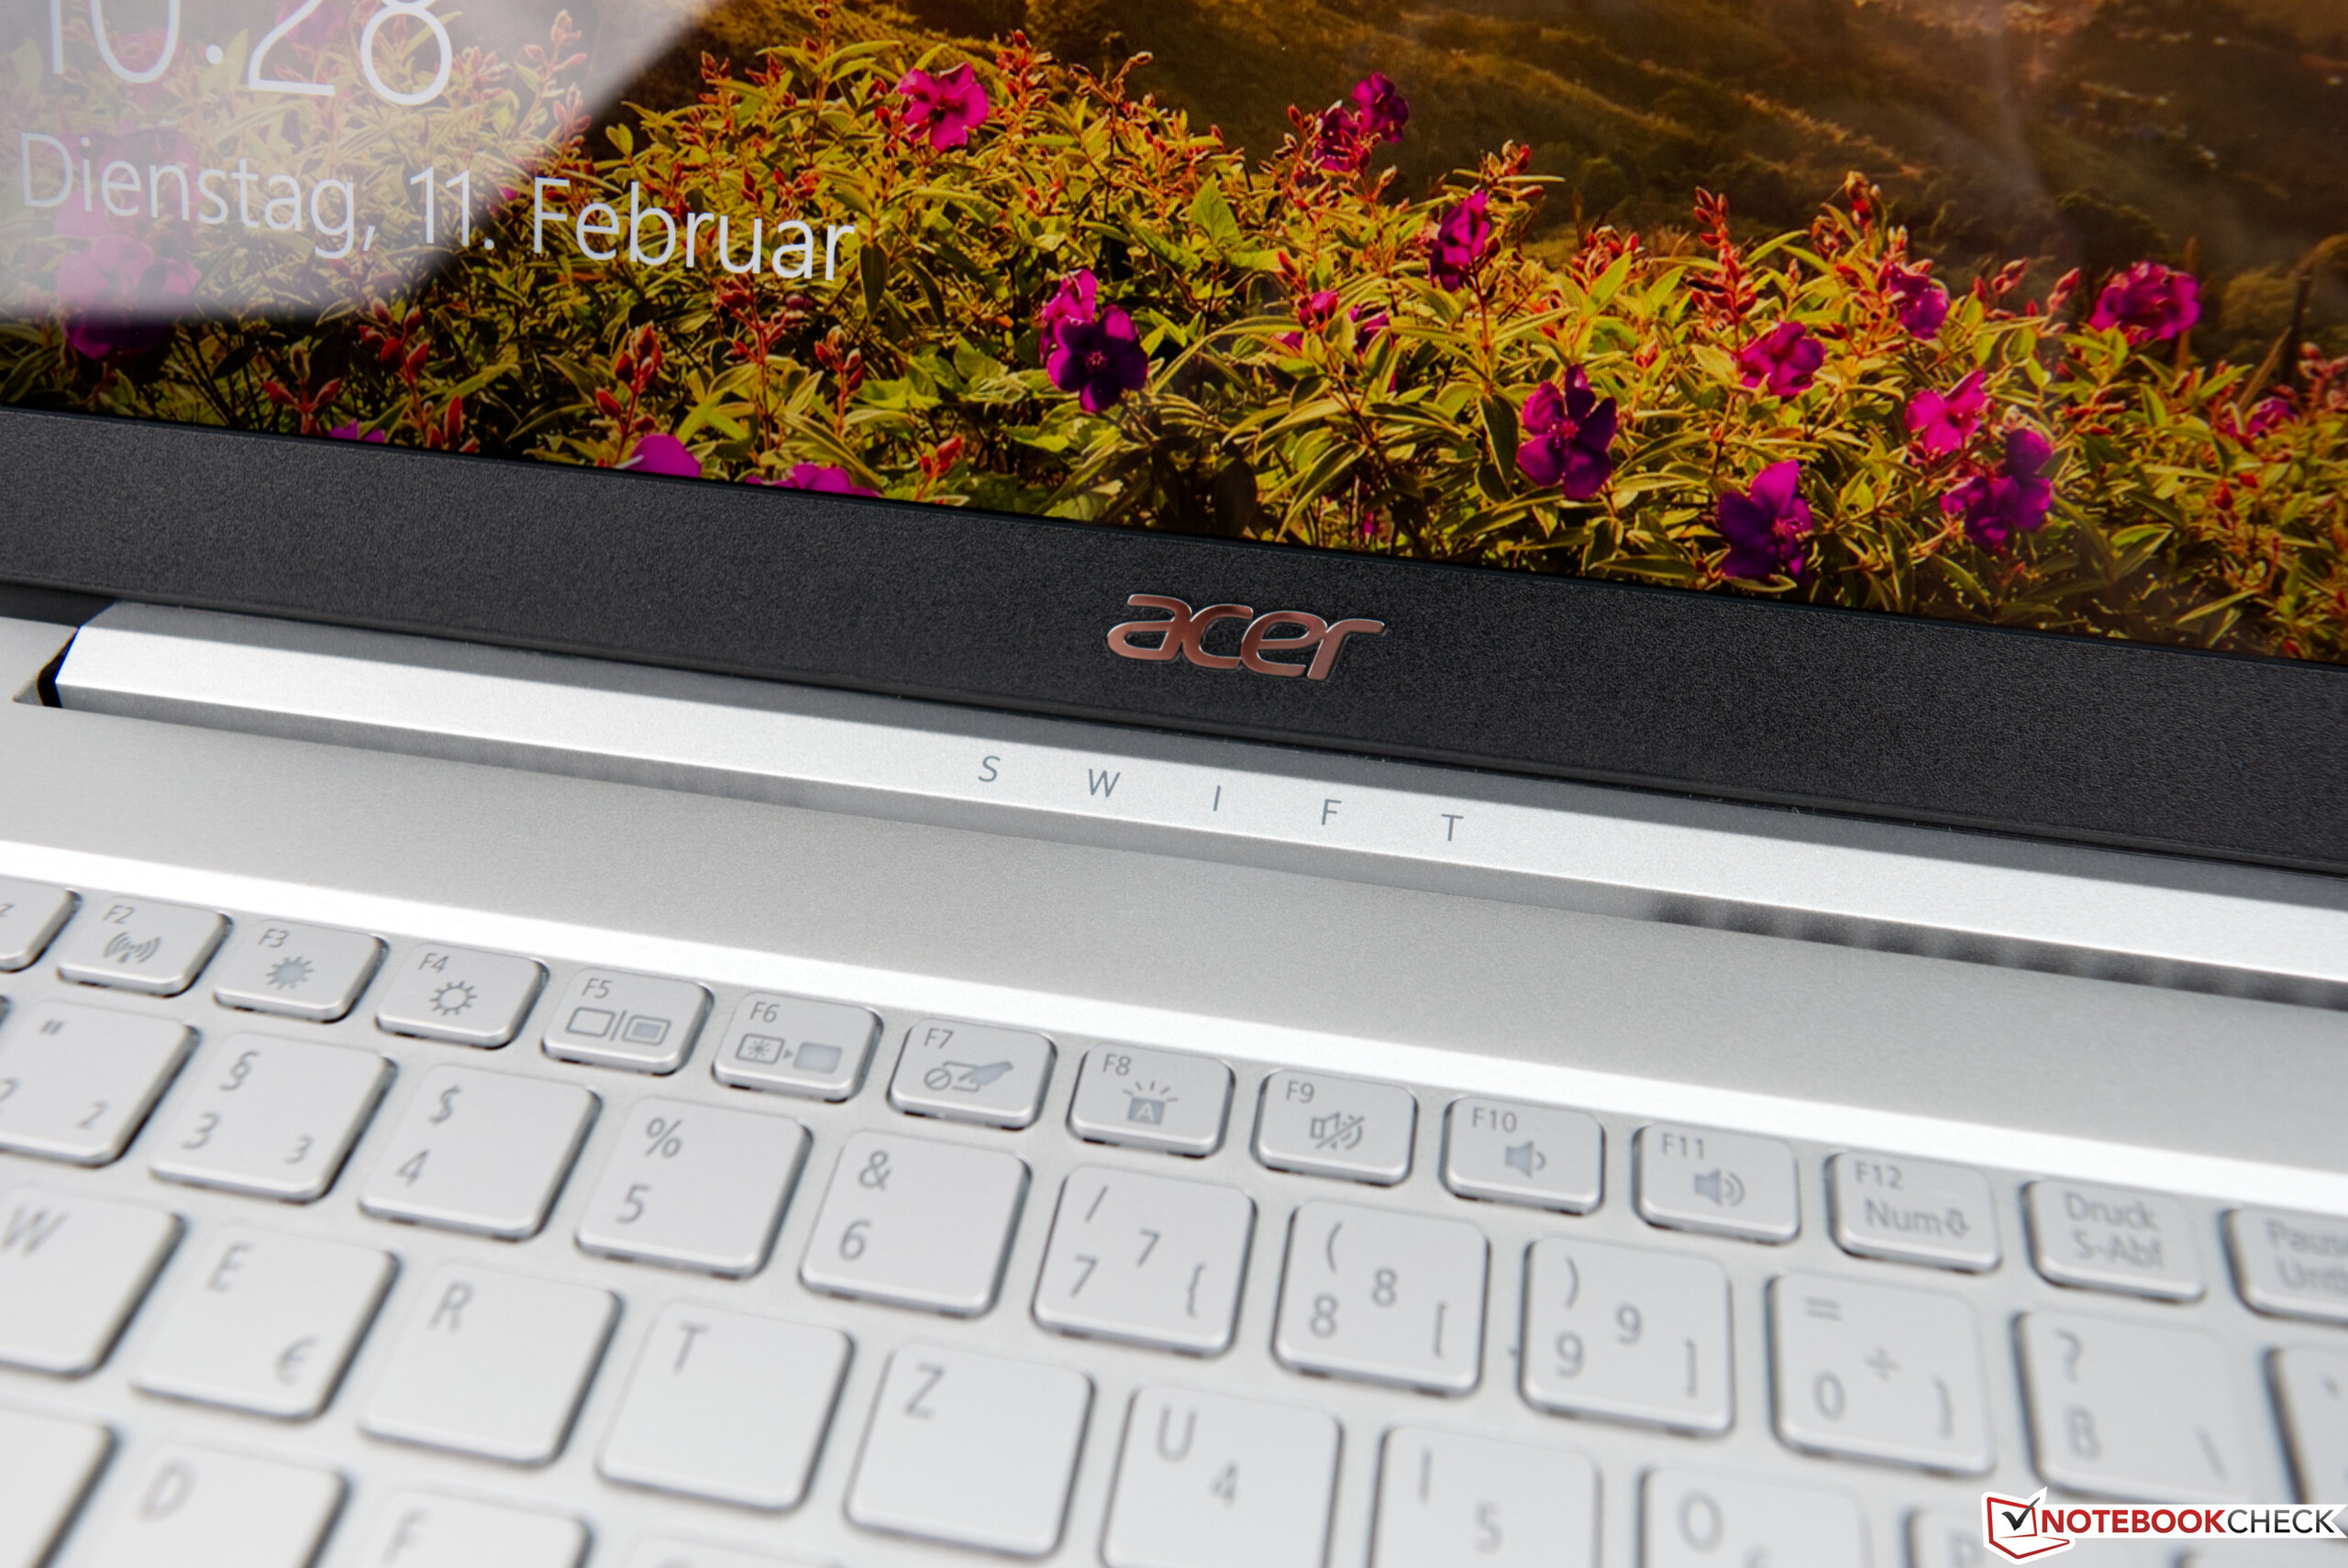
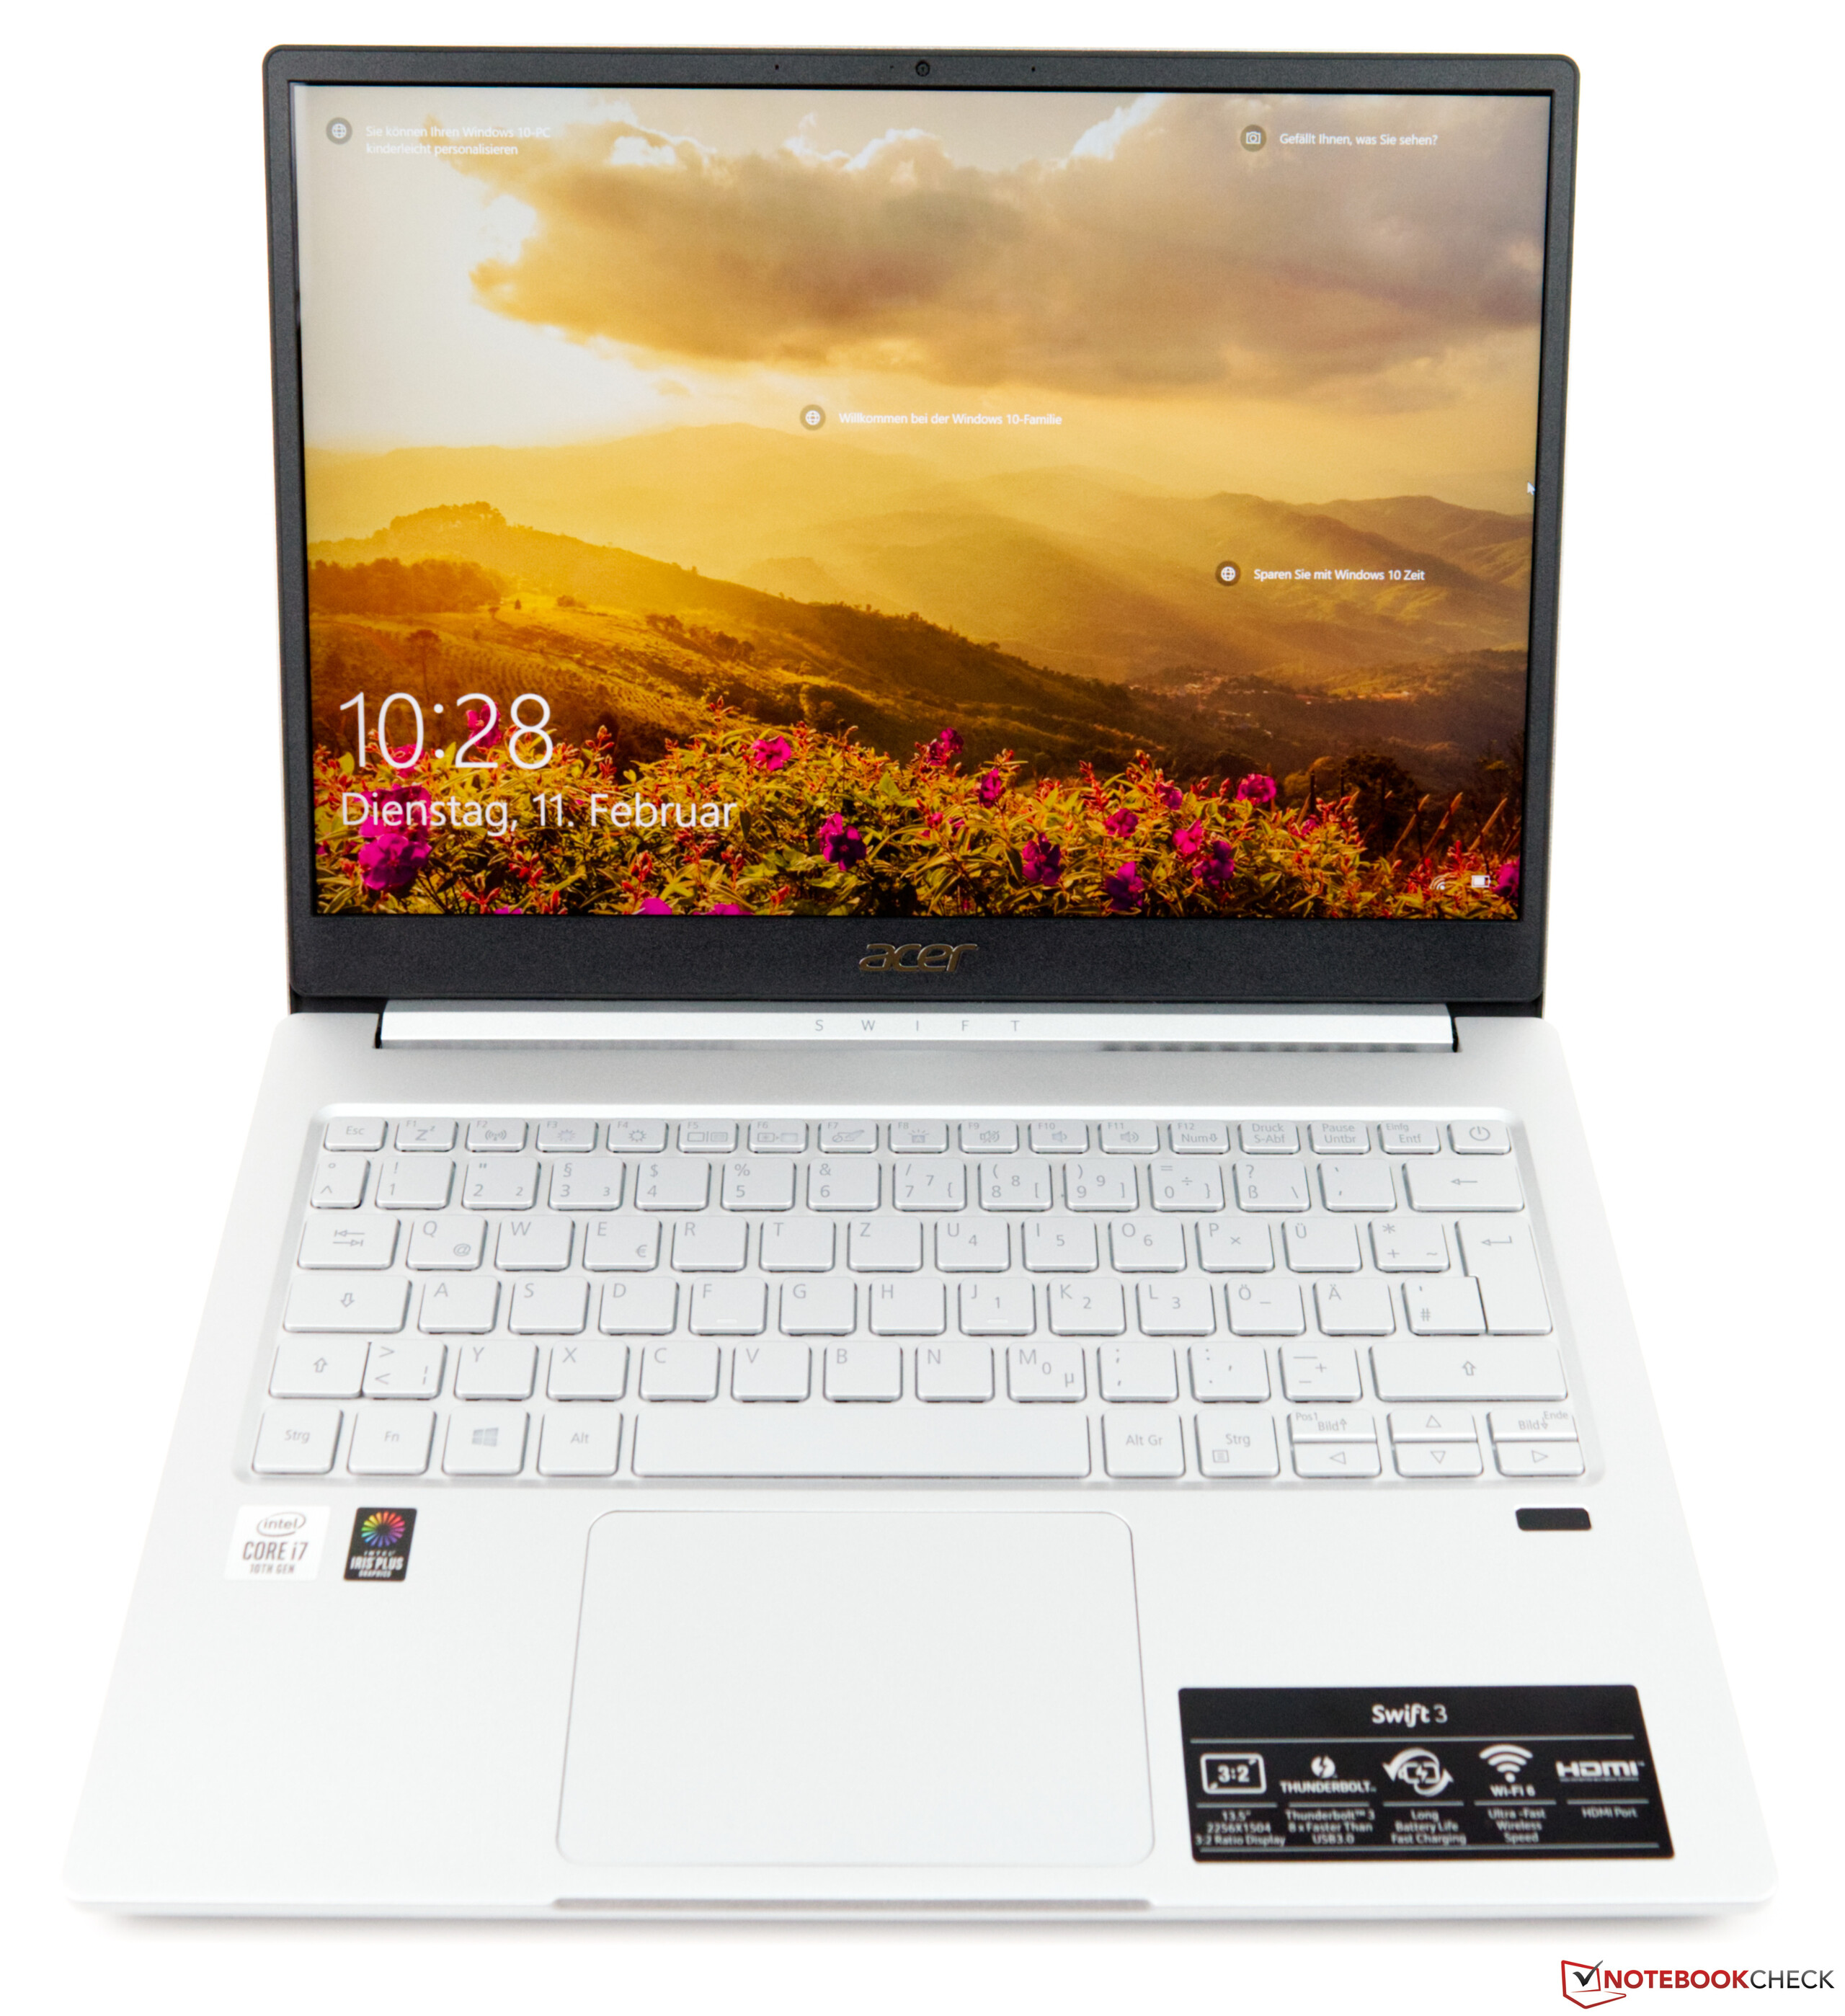
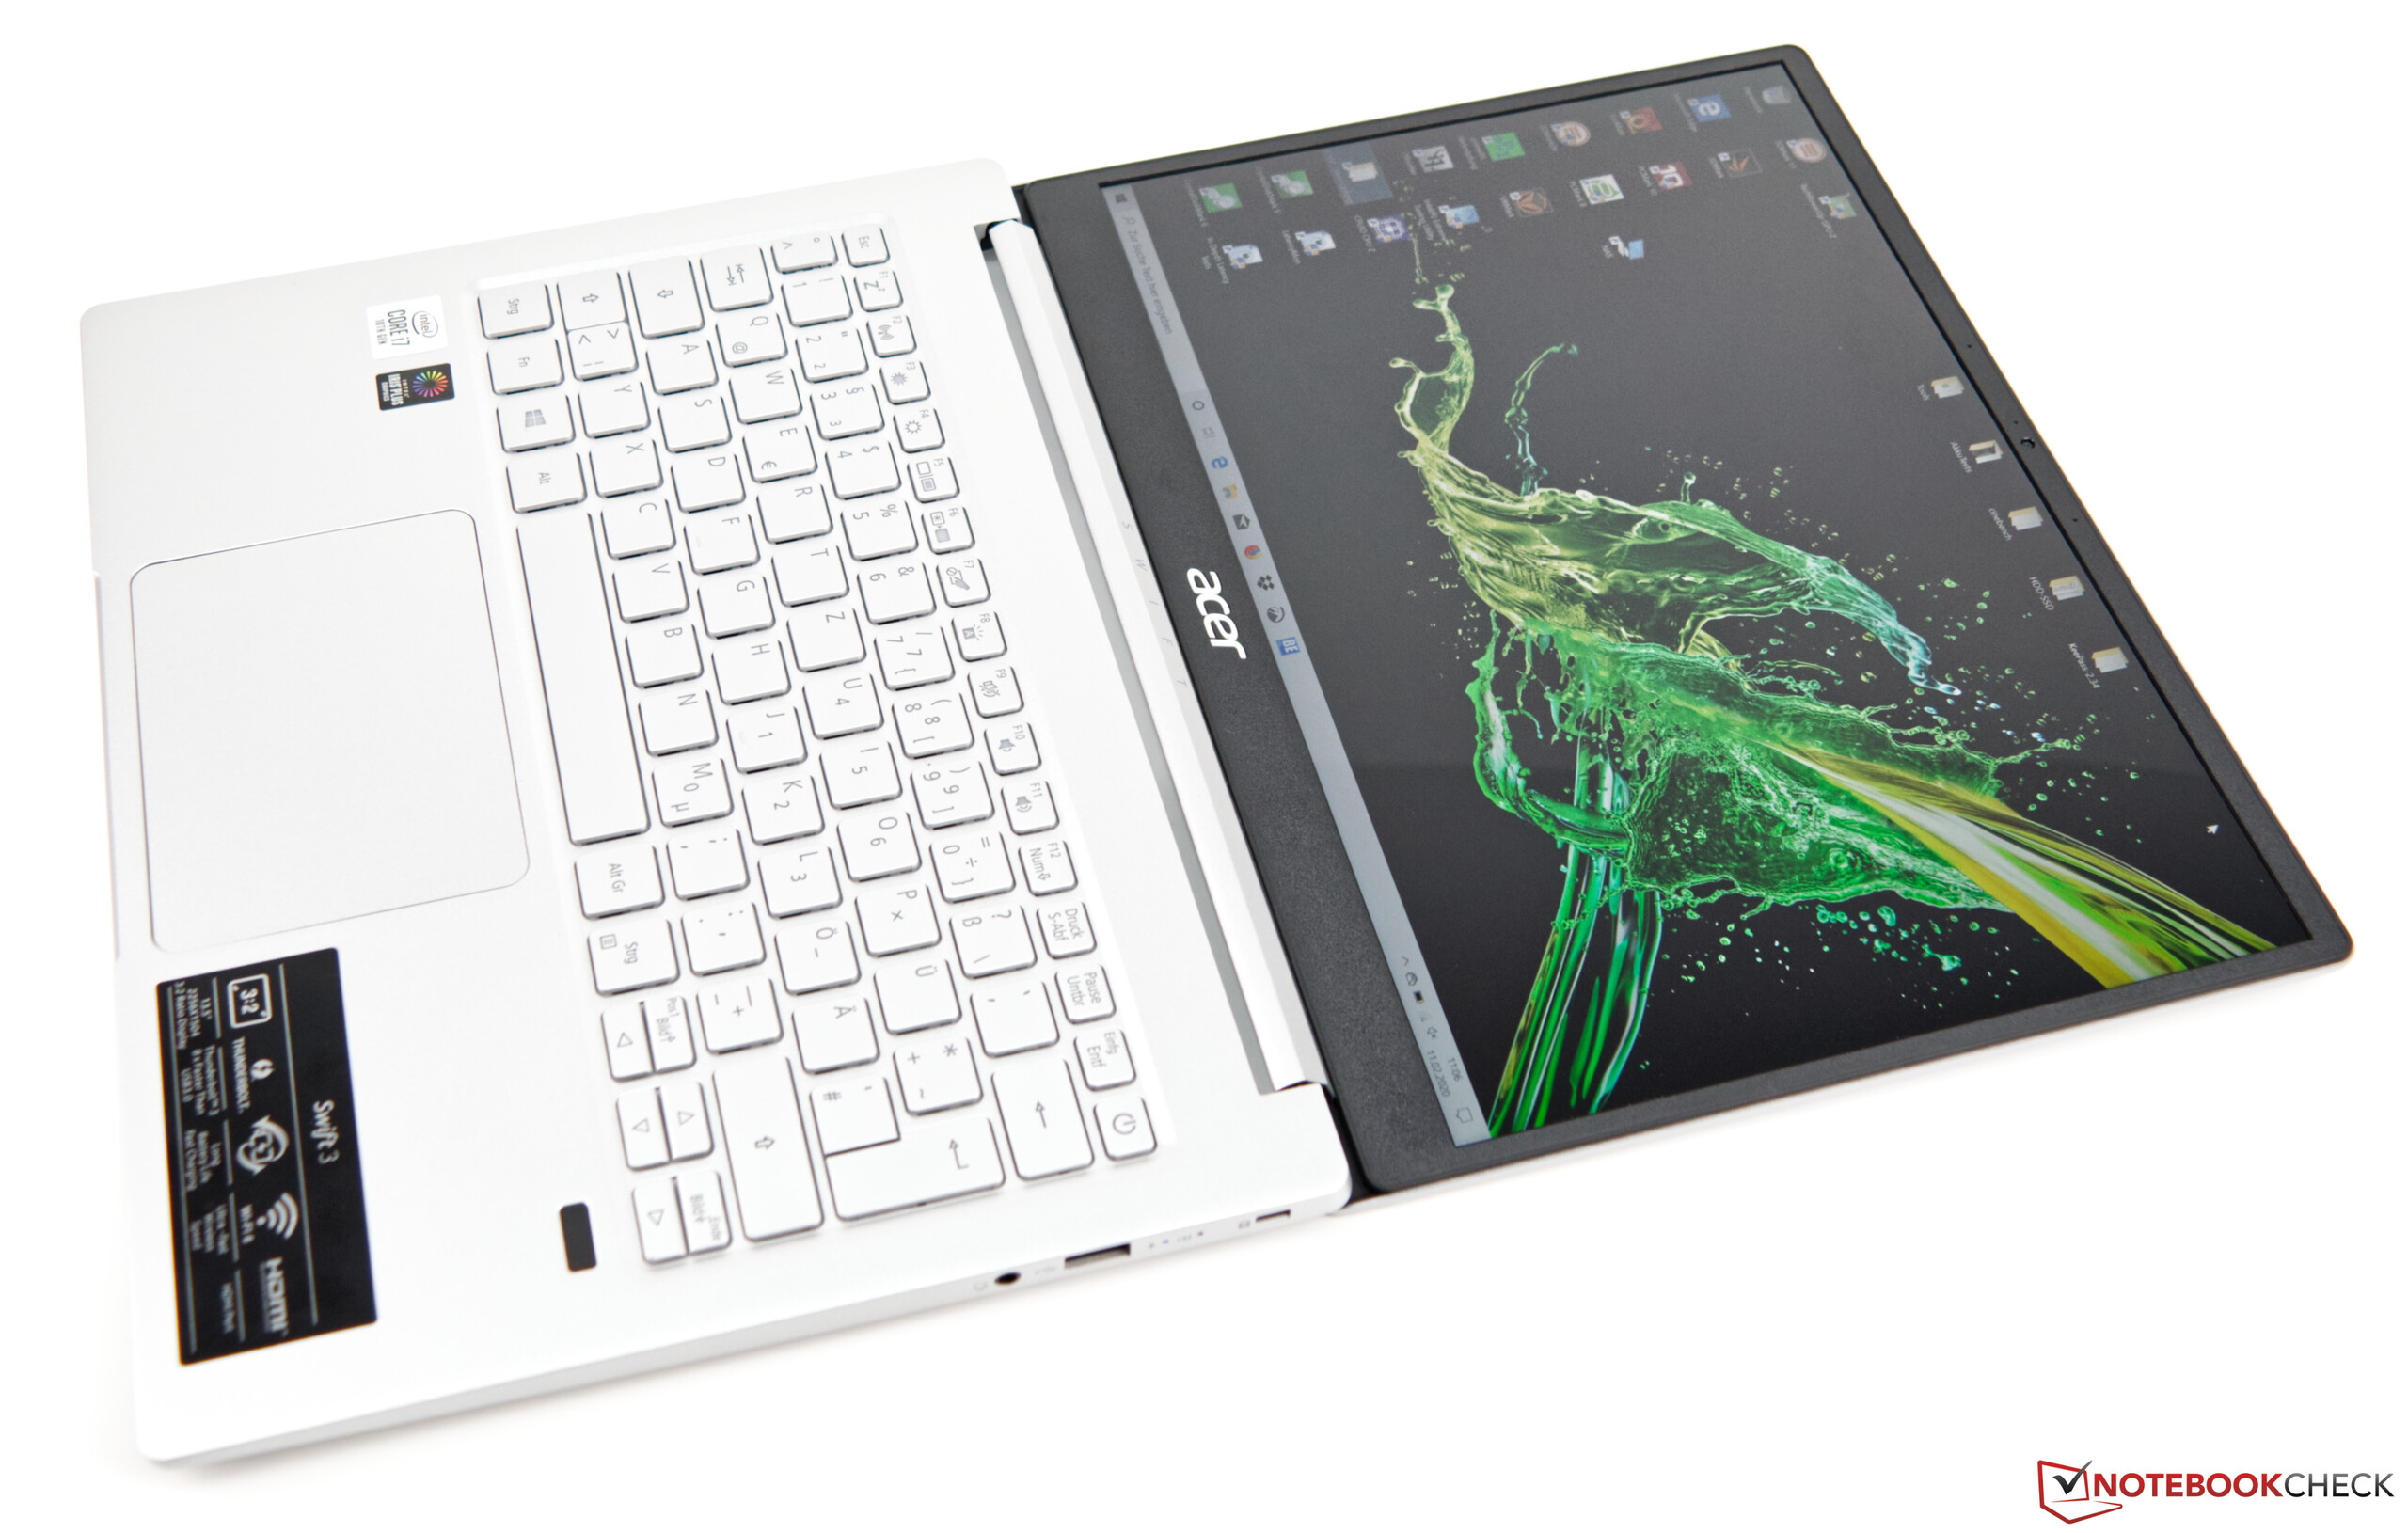
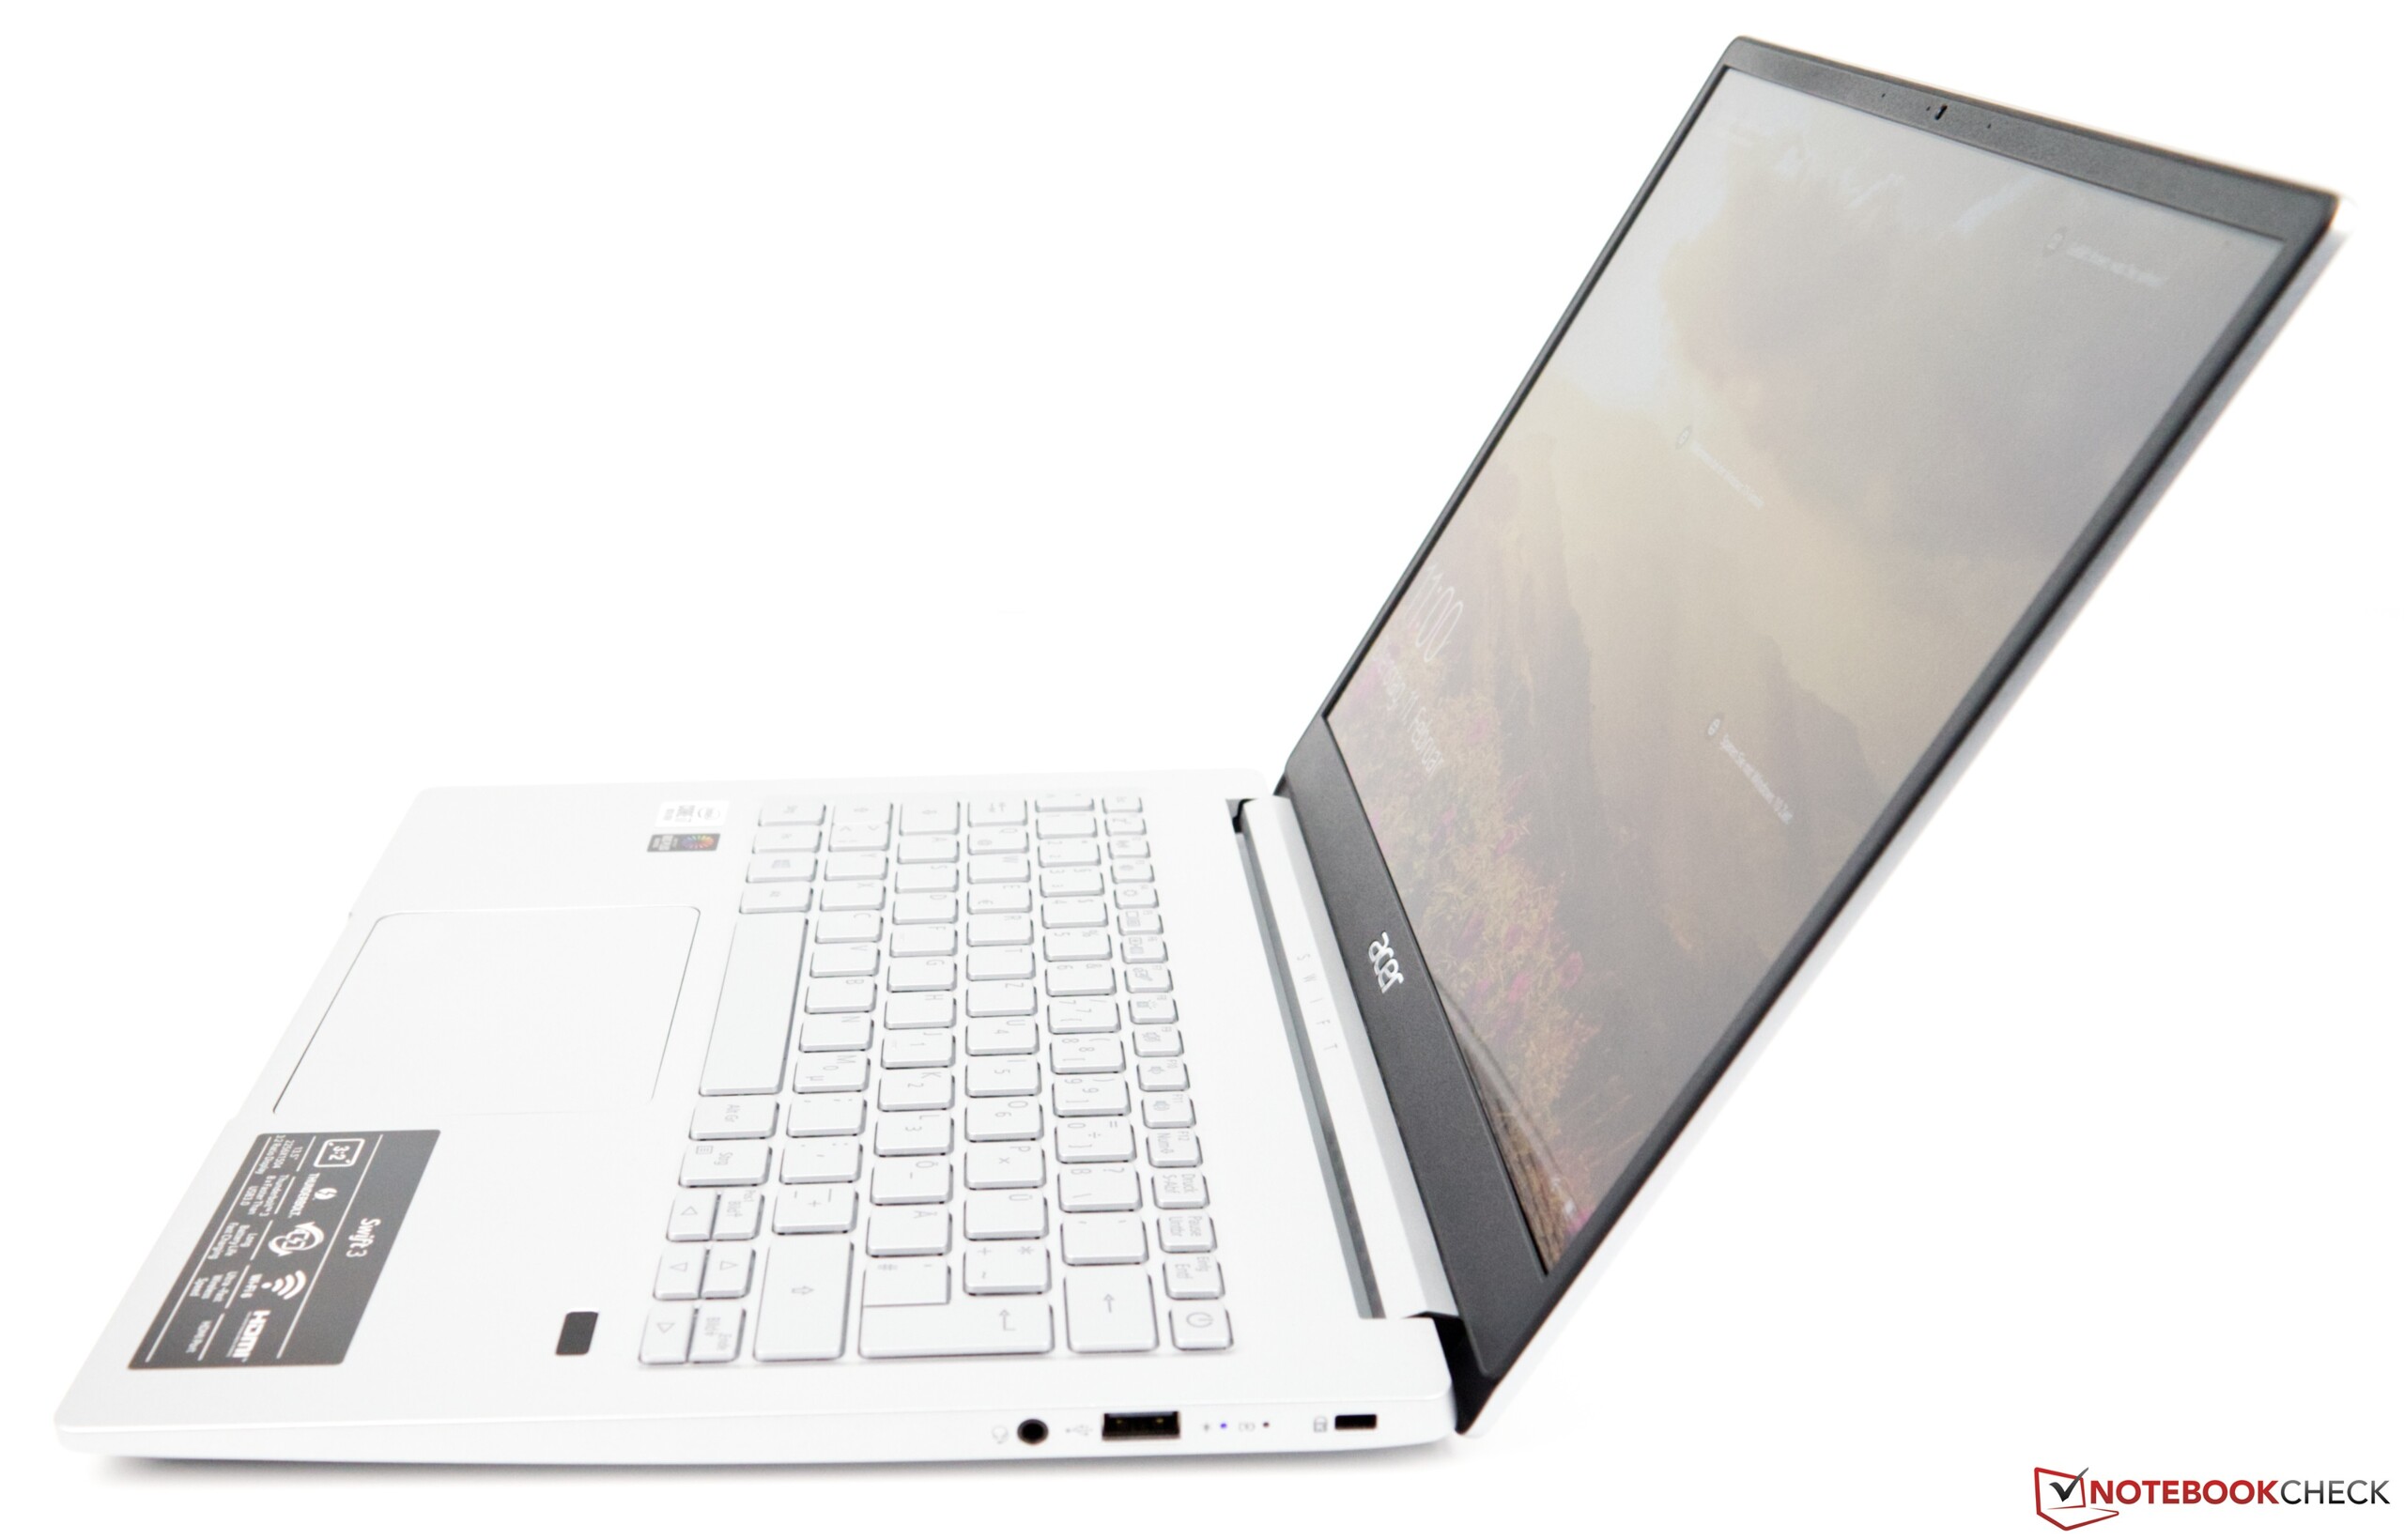
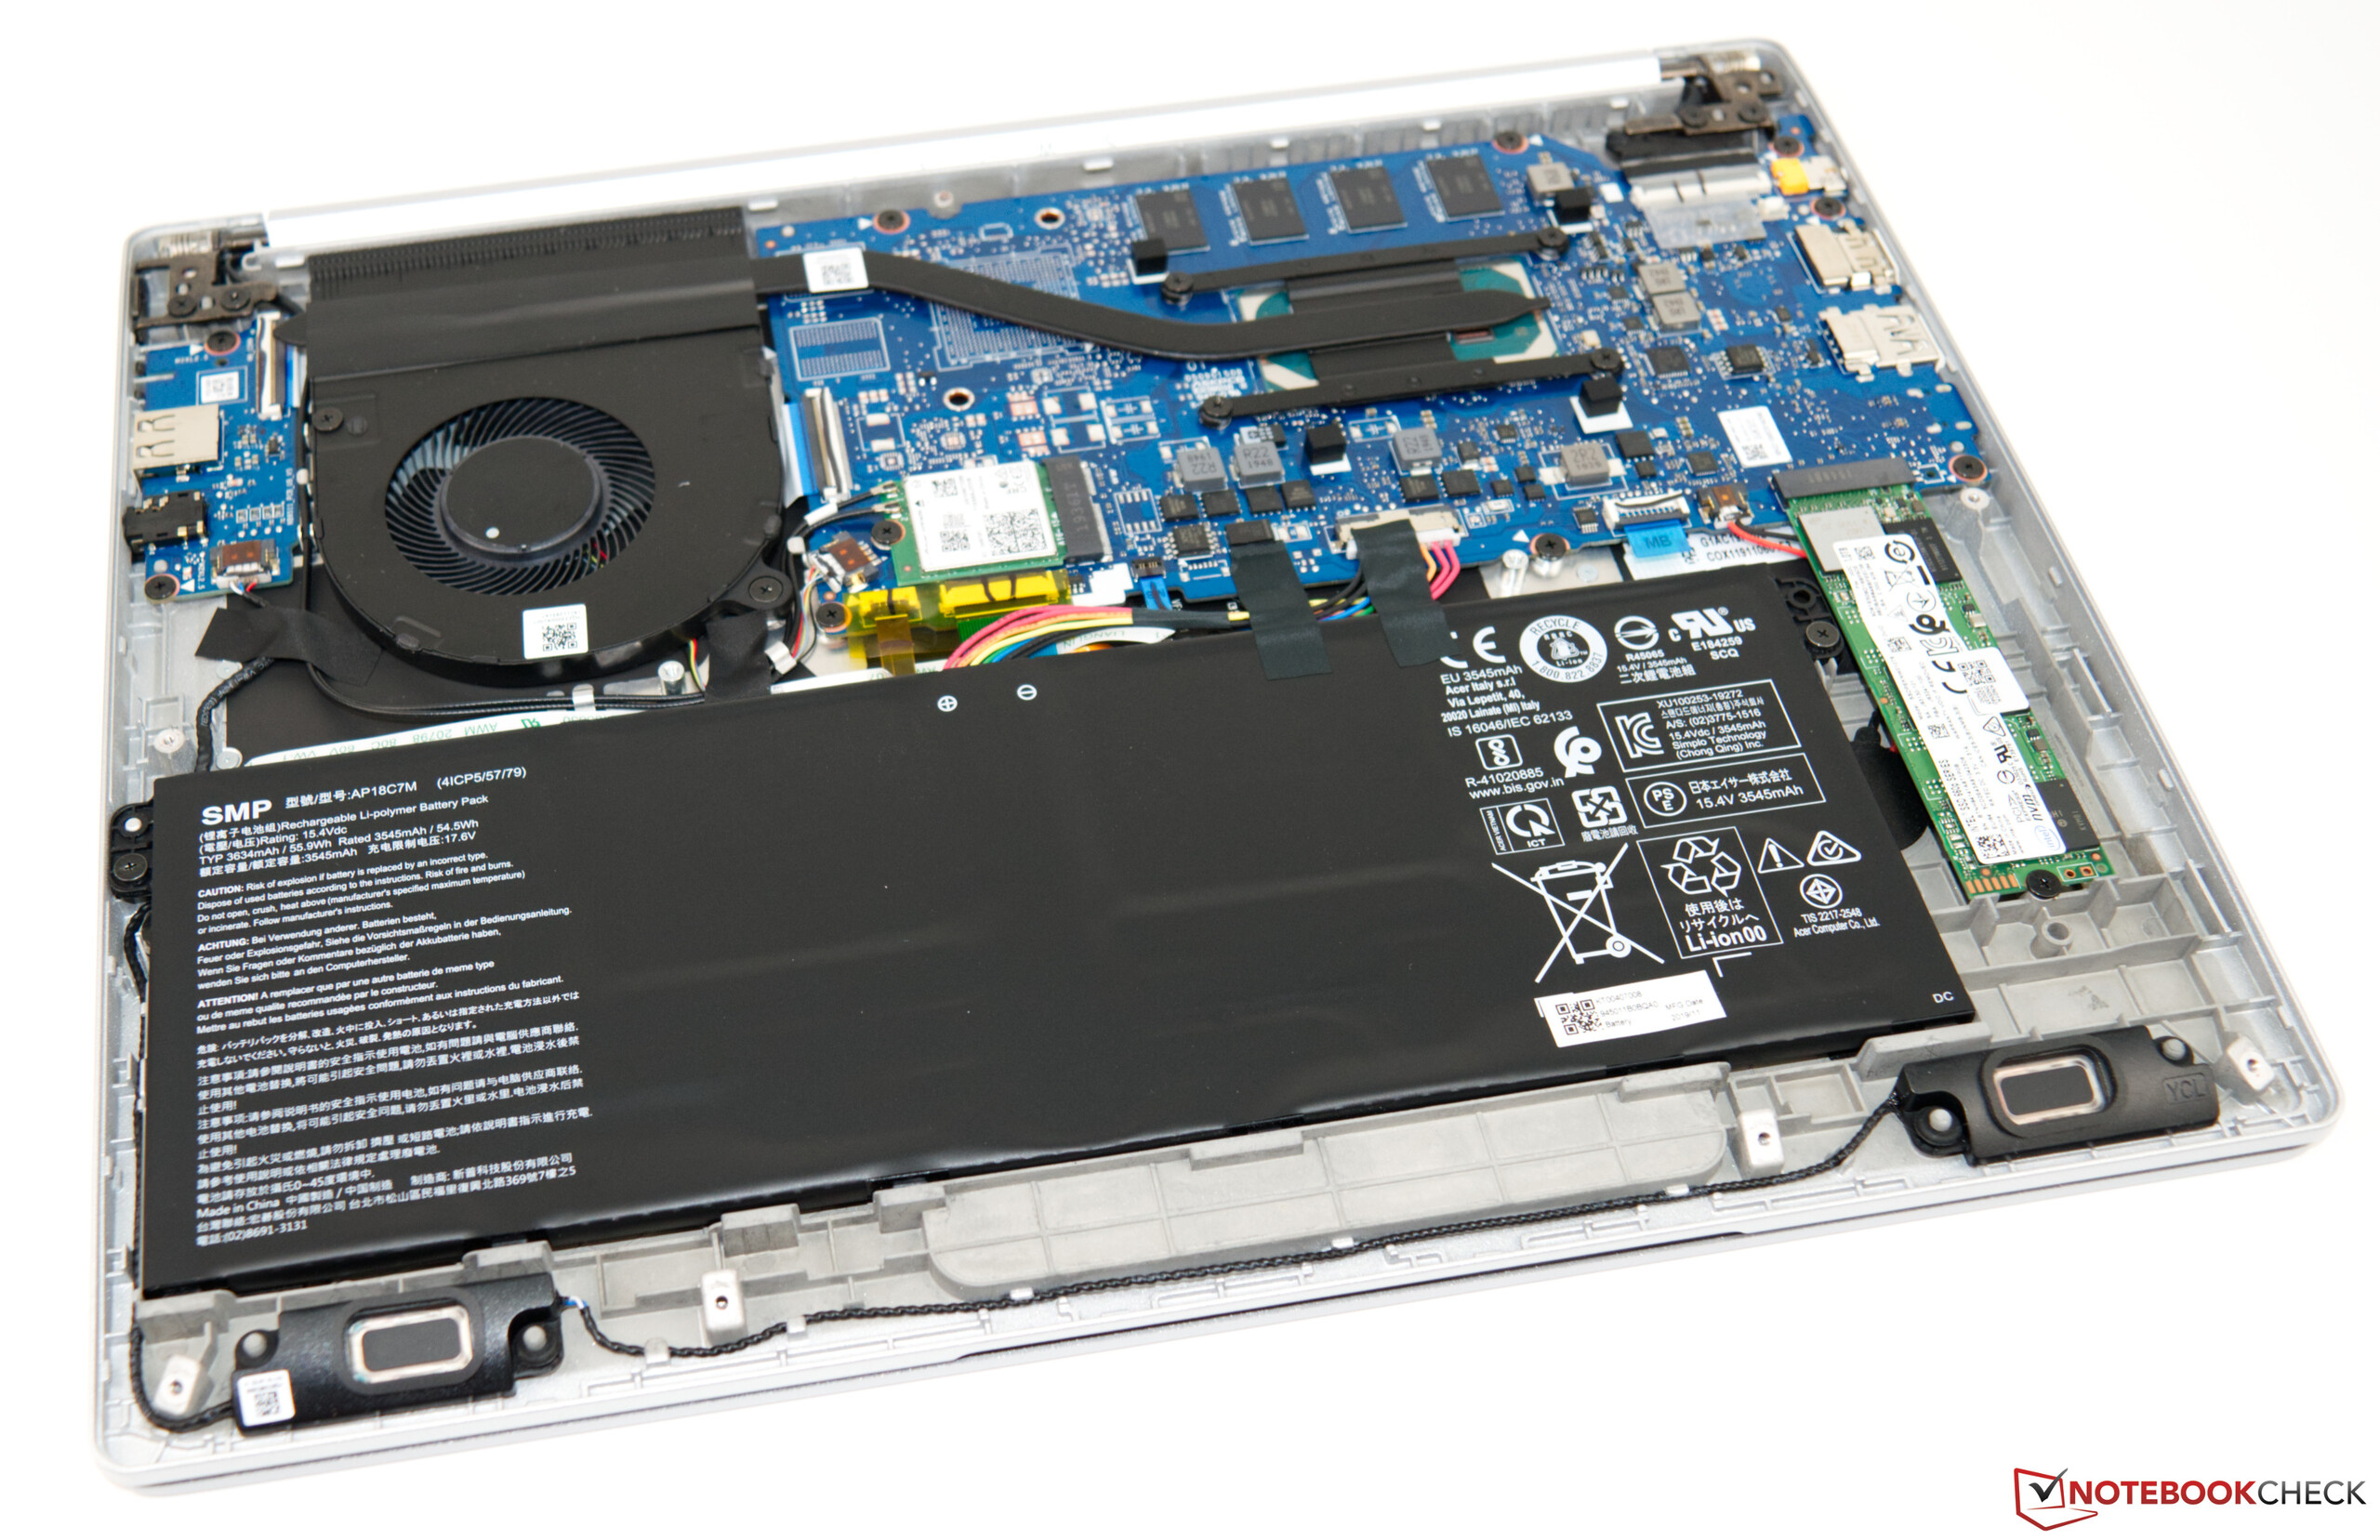
O novo Swift 3 SF313 da Acer é um dispositivo melhorado, no geral. Não foi apenas redesenhado para ter um melhor visual, mas também recebeu uma reforma interna muito grande. O mais recente SoC Ice Lake da Intel fornece uma pequena melhoria no desempenho, que, na verdade, esperávamos que fosse maior. O Intel Core i7-1065G7 se desempenhou muito bem e melhor que seus antecessores Kaby Lake. No entanto, quando comparado com outros dispositivos equipados similarmente, o Swift 3 fica para trás. Ele ganha pontos com seu ótimo design e sua qualidade de construção robusta. A brilhante tela IPS definitivamente certamente continuará sendo uma experiência memorável, e seu formato 3:2 combina muito bem com o conceito geral do Swift.
O Acer Swift 3 SF313 oferece um desempenho decente, longa duração da bateria, e uma ótima tela sem apertar demais o roçamento
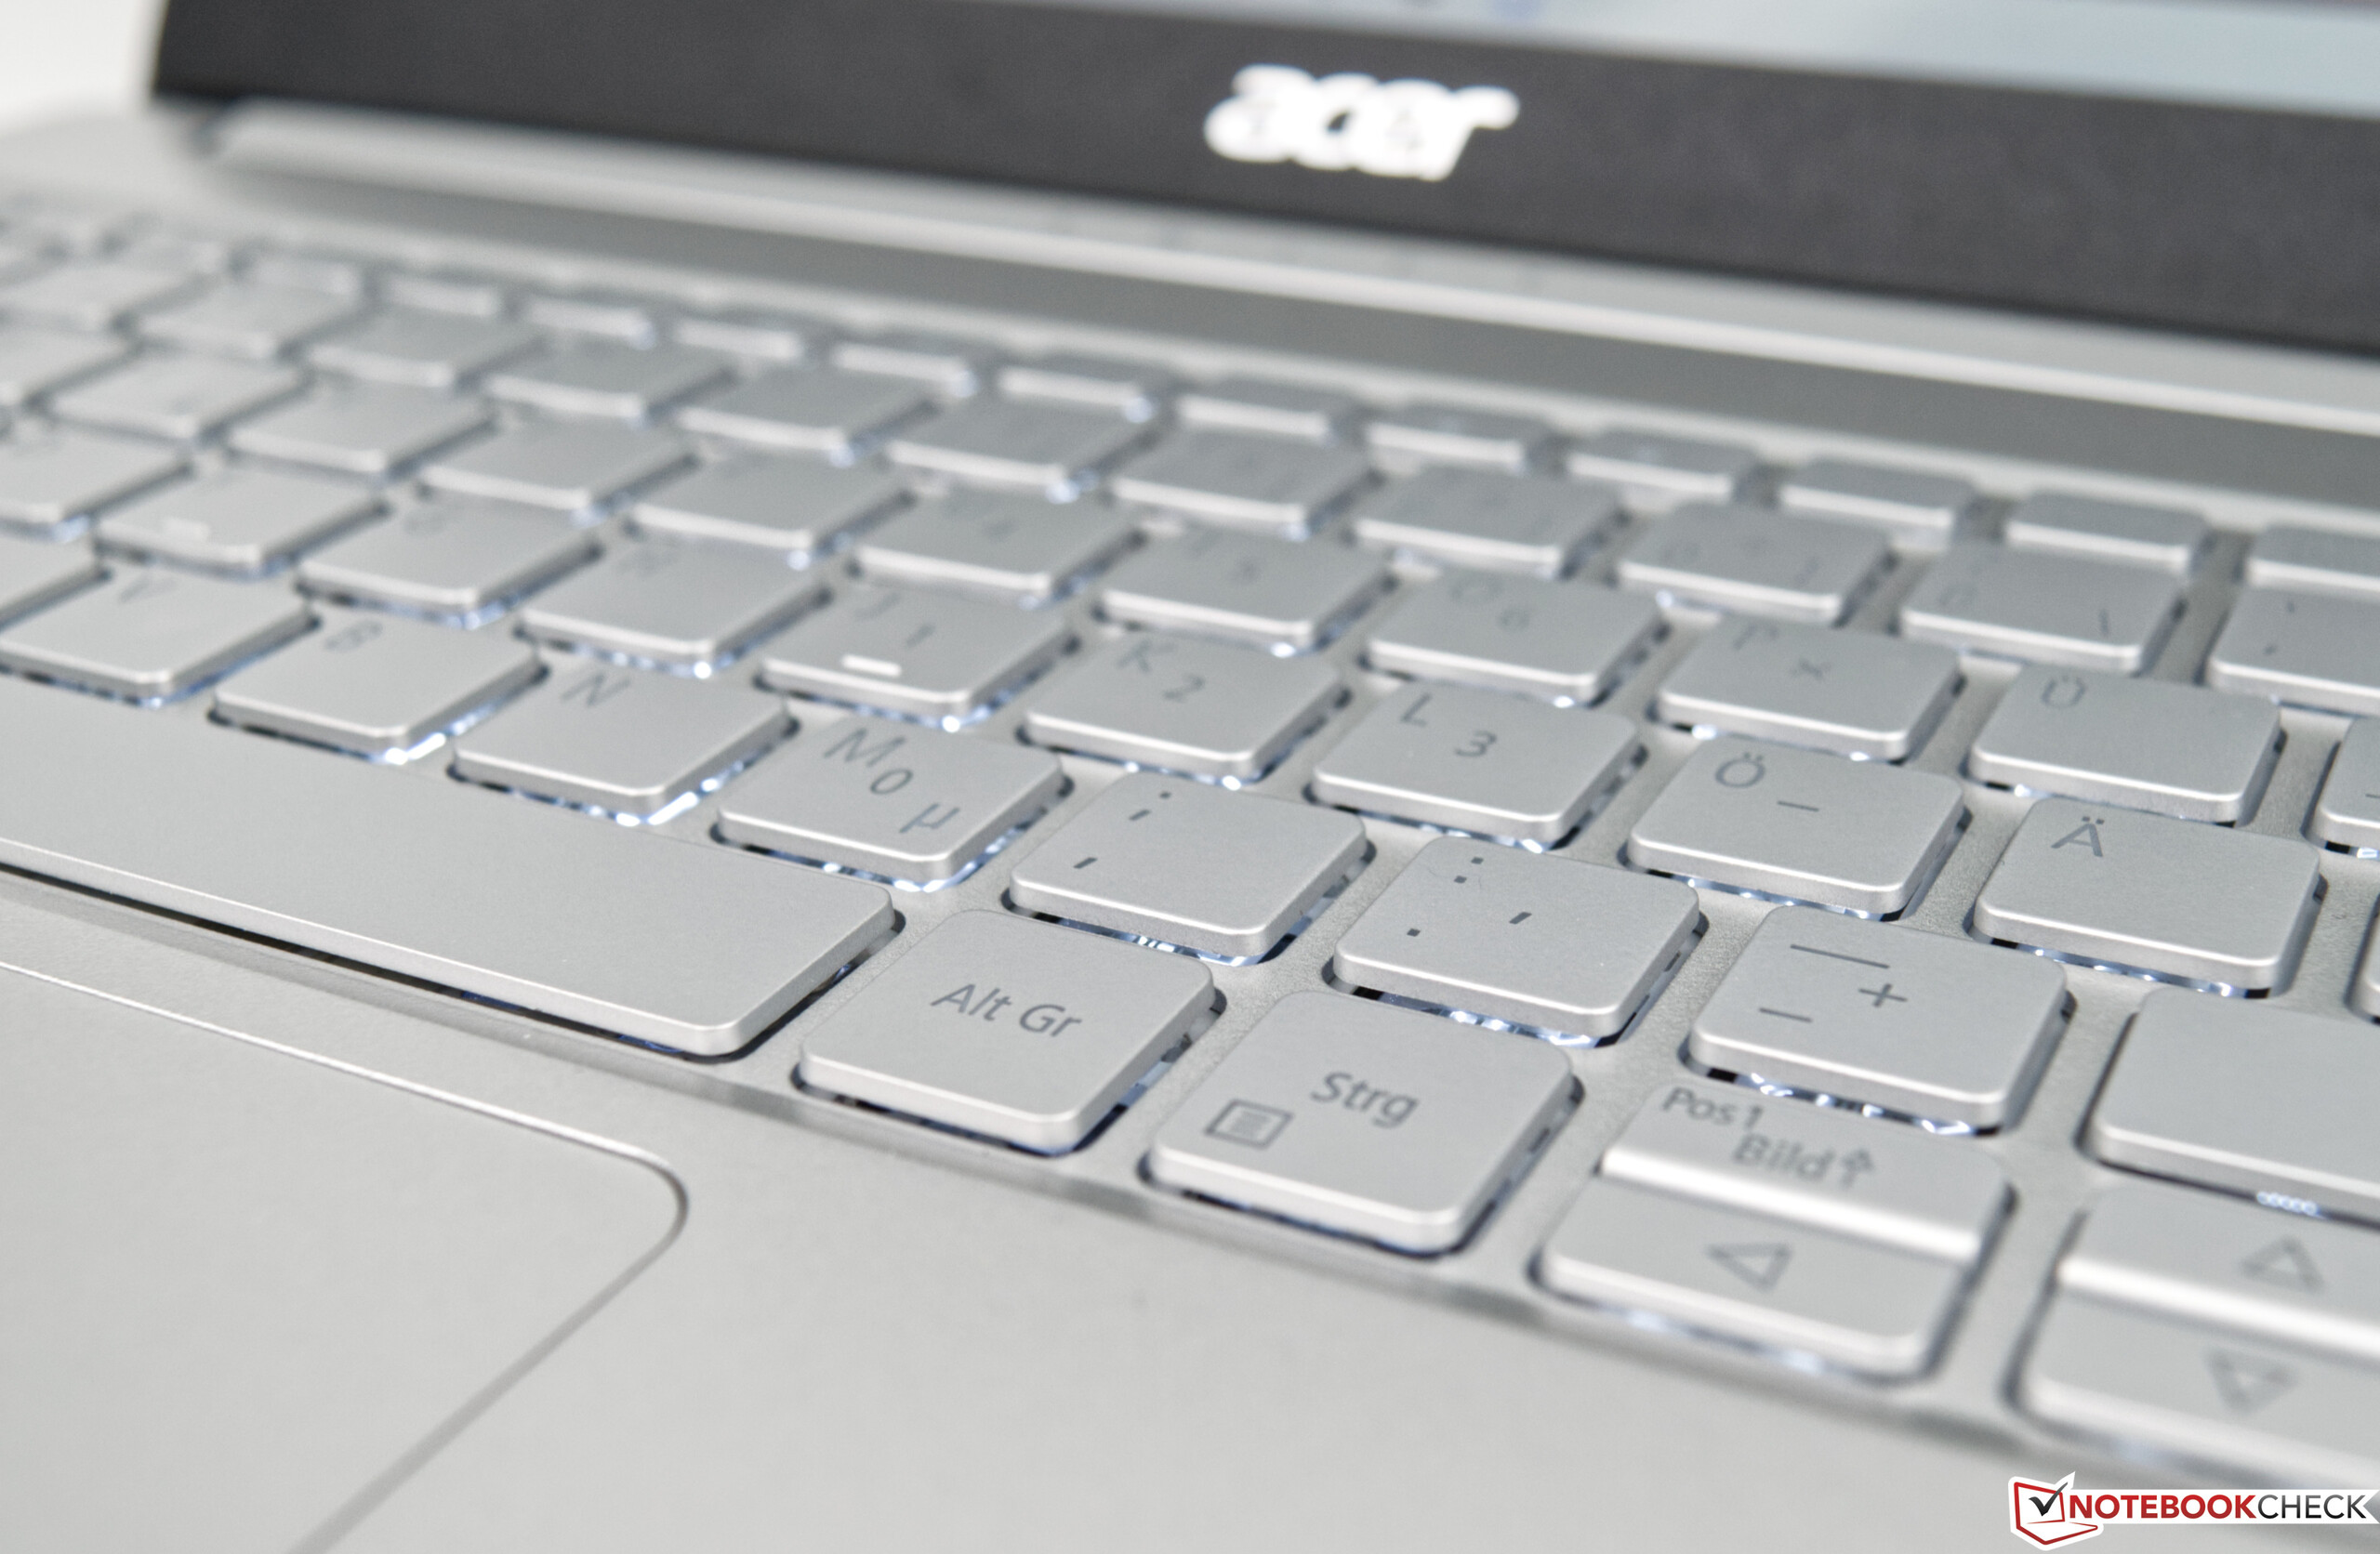
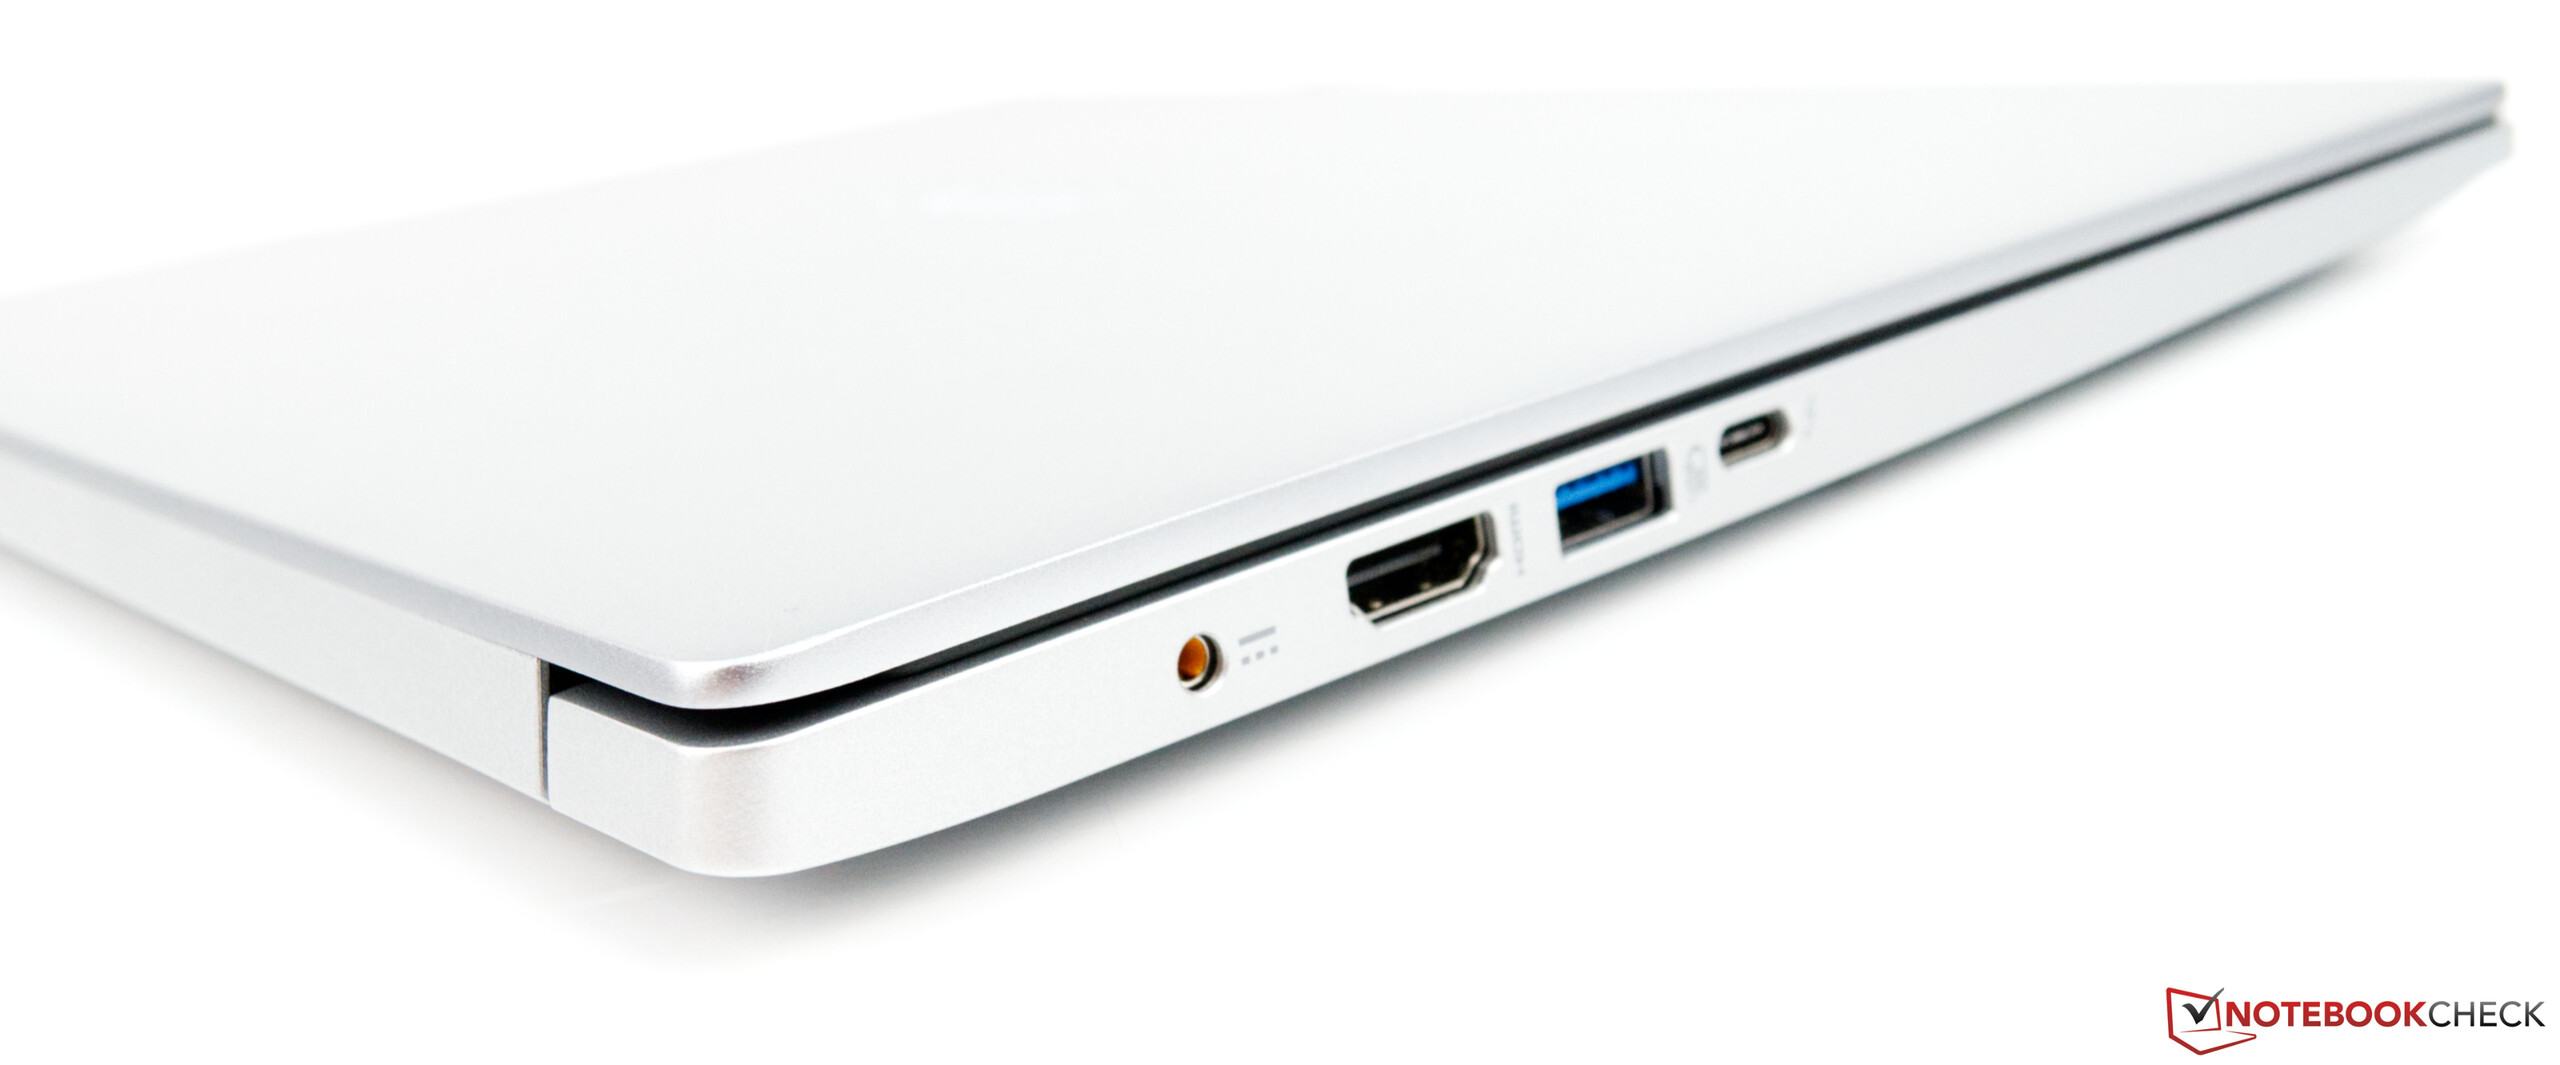
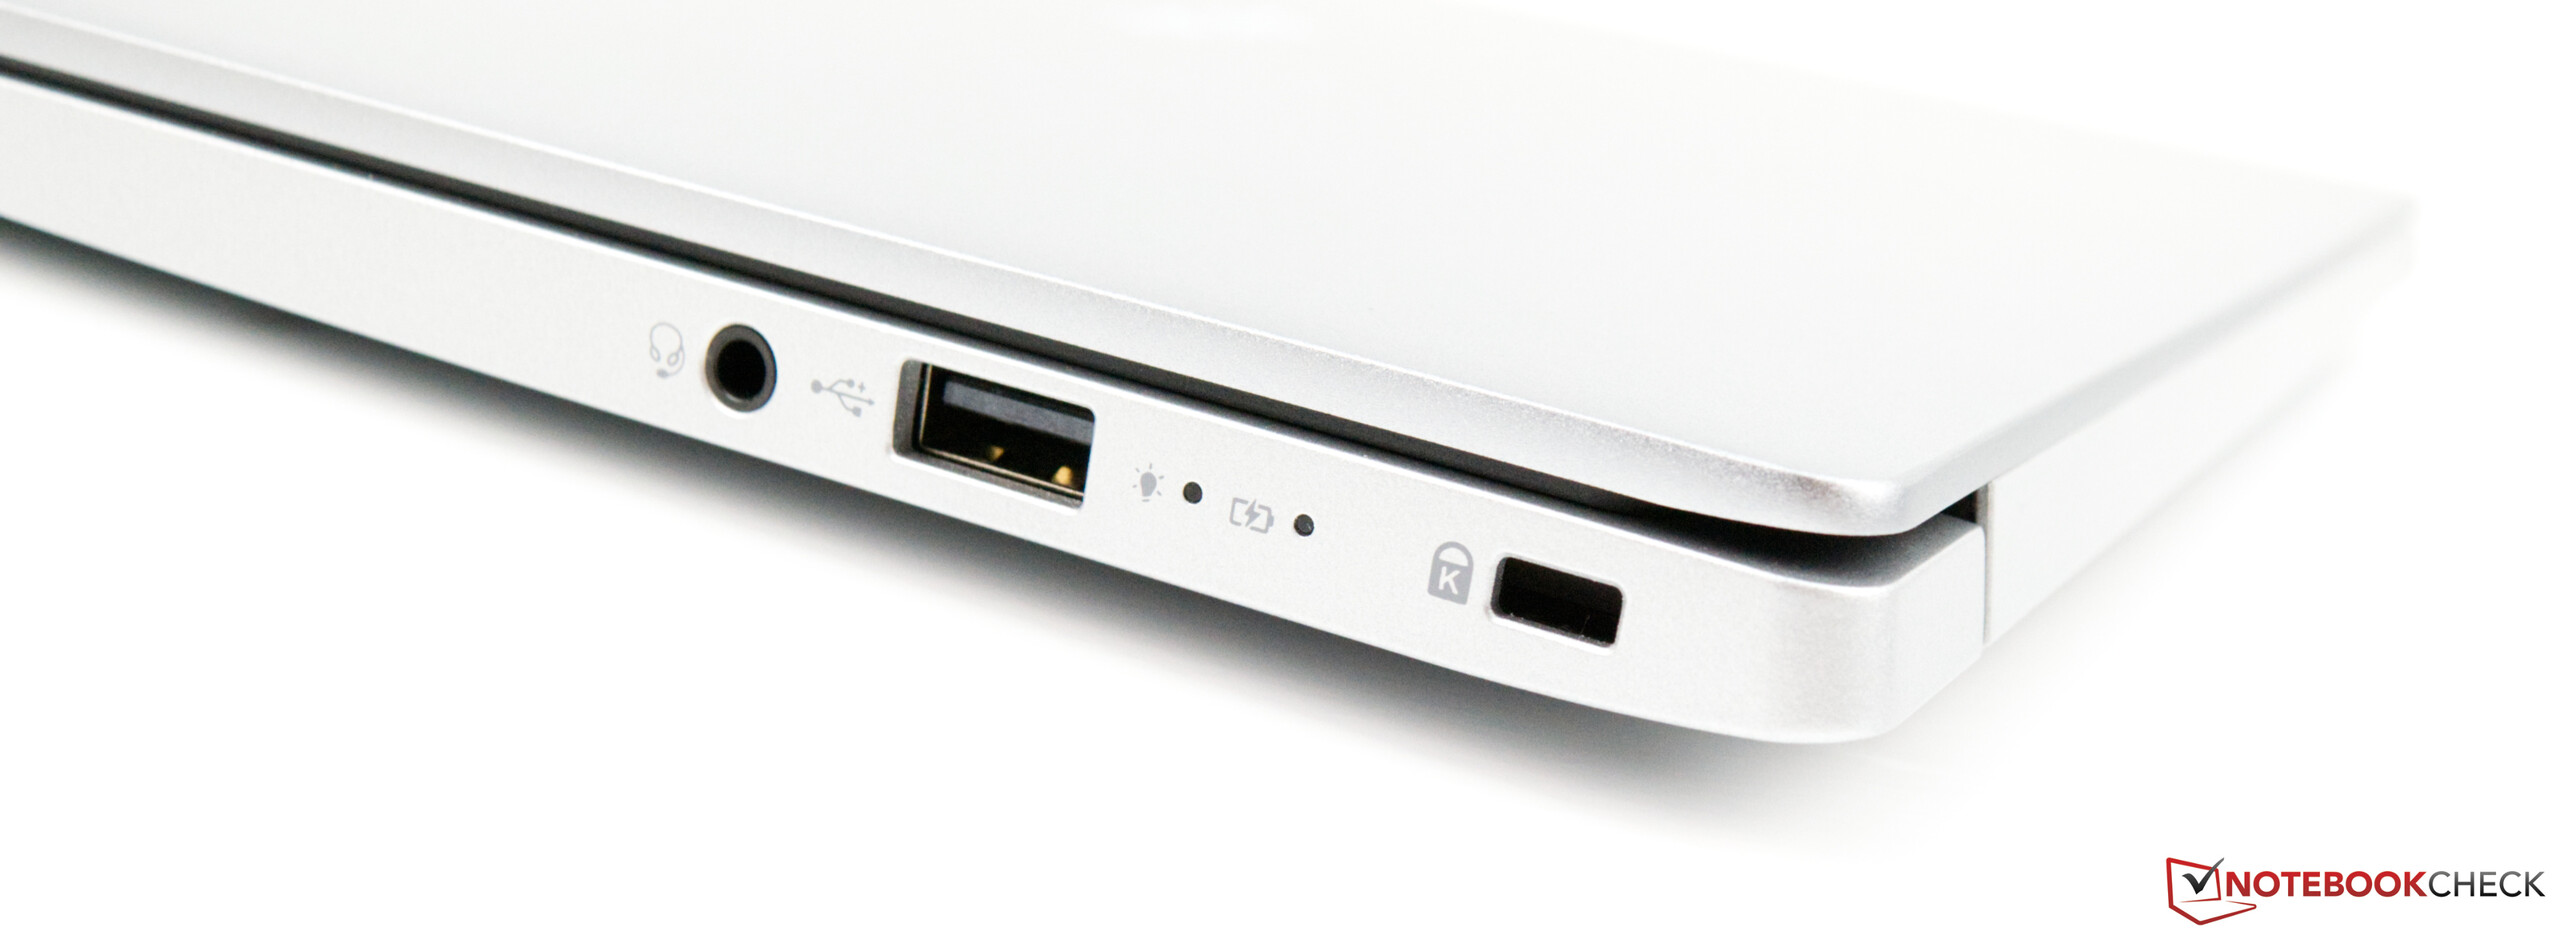
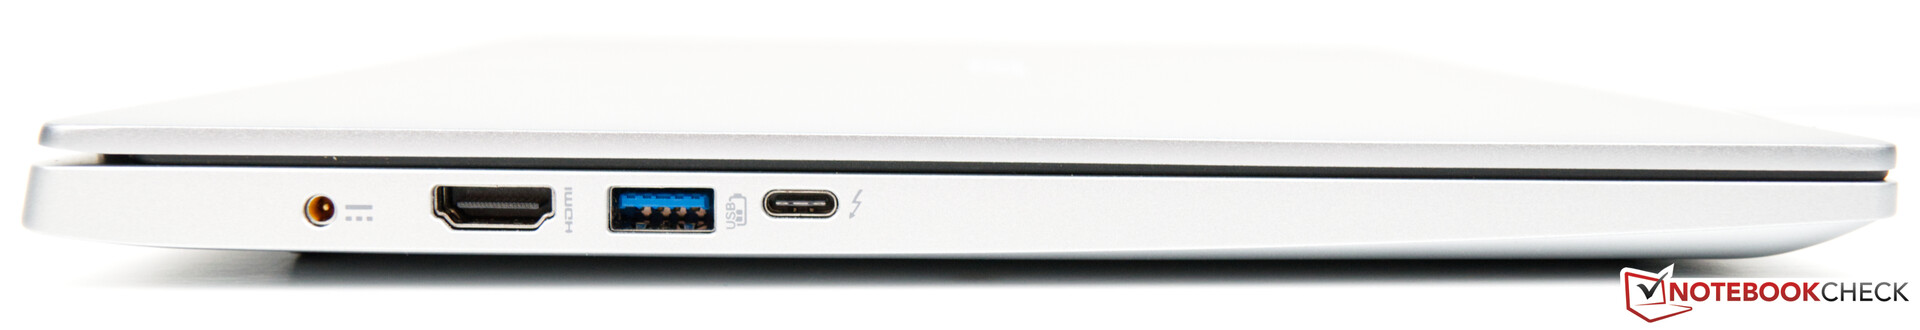
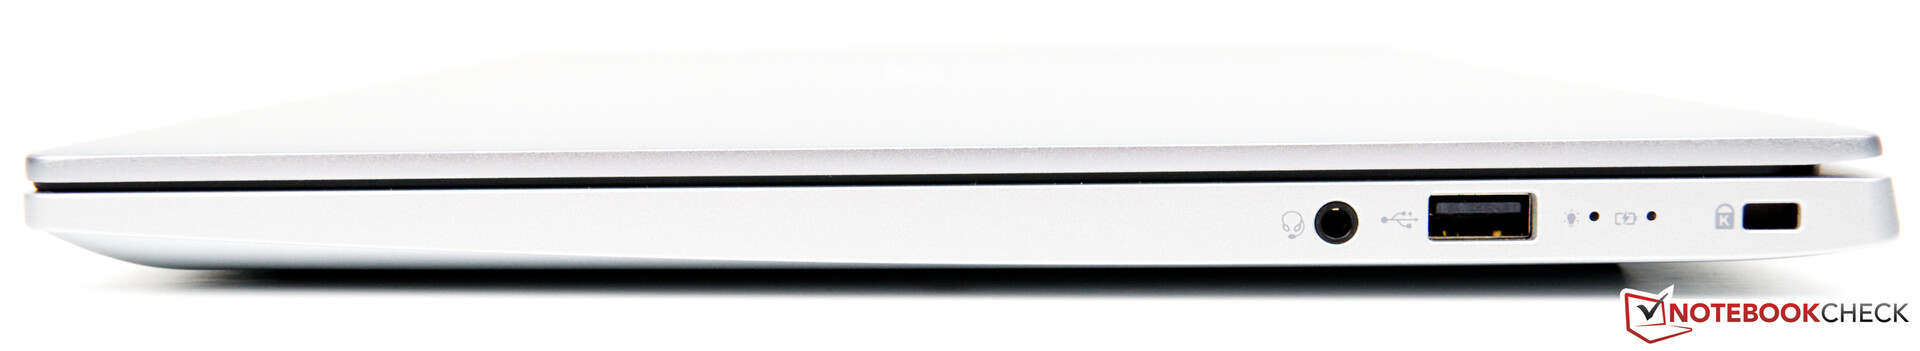
Suas falhas incluem o pobre desempenho do Wi-Fi e o teclado, que foi muito difícil de enxergar durante o dia devido à sua iluminação de fundo branca. Dito isso, ao desabilitar a luz de fundo em ambientes claros melhorou um pouco a legibilidade do teclado. A conectividade é moderna embora uma segunda porta USB-C não teria machucado ninguém. Também não teríamos reclamado do leitor de cartões ou uma opção LTE.
Em resumo, o Swift 3 é uma melhoria sobre seu predecessor resultando em um subportátil sólido que também faz um excelente trabalho como dispositivos multimídia. A opção de poder adicionar um dispositivo de armazenamento secundário e atualizar a teria tornado o dispositivo ainda melhor do que já é.

Acer’s new Swift 3 SF313 is an overall improved device. It was not just redesigned to look better, but has received a major internal overhaul as well. Intel’s latest Ice Lake SoC makes for a small performance improvement, which, truth be told, we would have expected to be bigger. The Intel Core i7-1065G7 performed very well and better than its Kaby Lake predecessors. However, when compared to other similarly equipped devices, the Swift 3 fell behind. It scored with its great design and its robust build quality. The bright IPS display will definitely remain a memorable experience, and its 3:2 aspect ratio fit the Swift’s overall concept very well.
The Acer Swift 3 SF313 offers decent performance, long battery life, and a great display without stretching the budget too much.
Its flaws include the poor Wi-Fi performance and the keyboard, which was very hard to read in daylight due to its white backlight. That said, disabling the backlight in bright environments did improve upon the keyboard’s legibility somewhat. Connectivity is modern albeit a second USB-C port would not have hurt anyone. We would have also not complained about a card reader or an LTE option.
All things considered the Swift 3 is an improvement over its predecessor resulting in an all-over solid subnotebook that also does a great job as a multimedia device. Adding a secondary storage device and making the RAM upgradeable would have made the device even better than it already is.
Acer Swift 3 SF313-52-71Y7
- 02/17/2020 v7 (old)
Sebastian Bade
Price comparison
