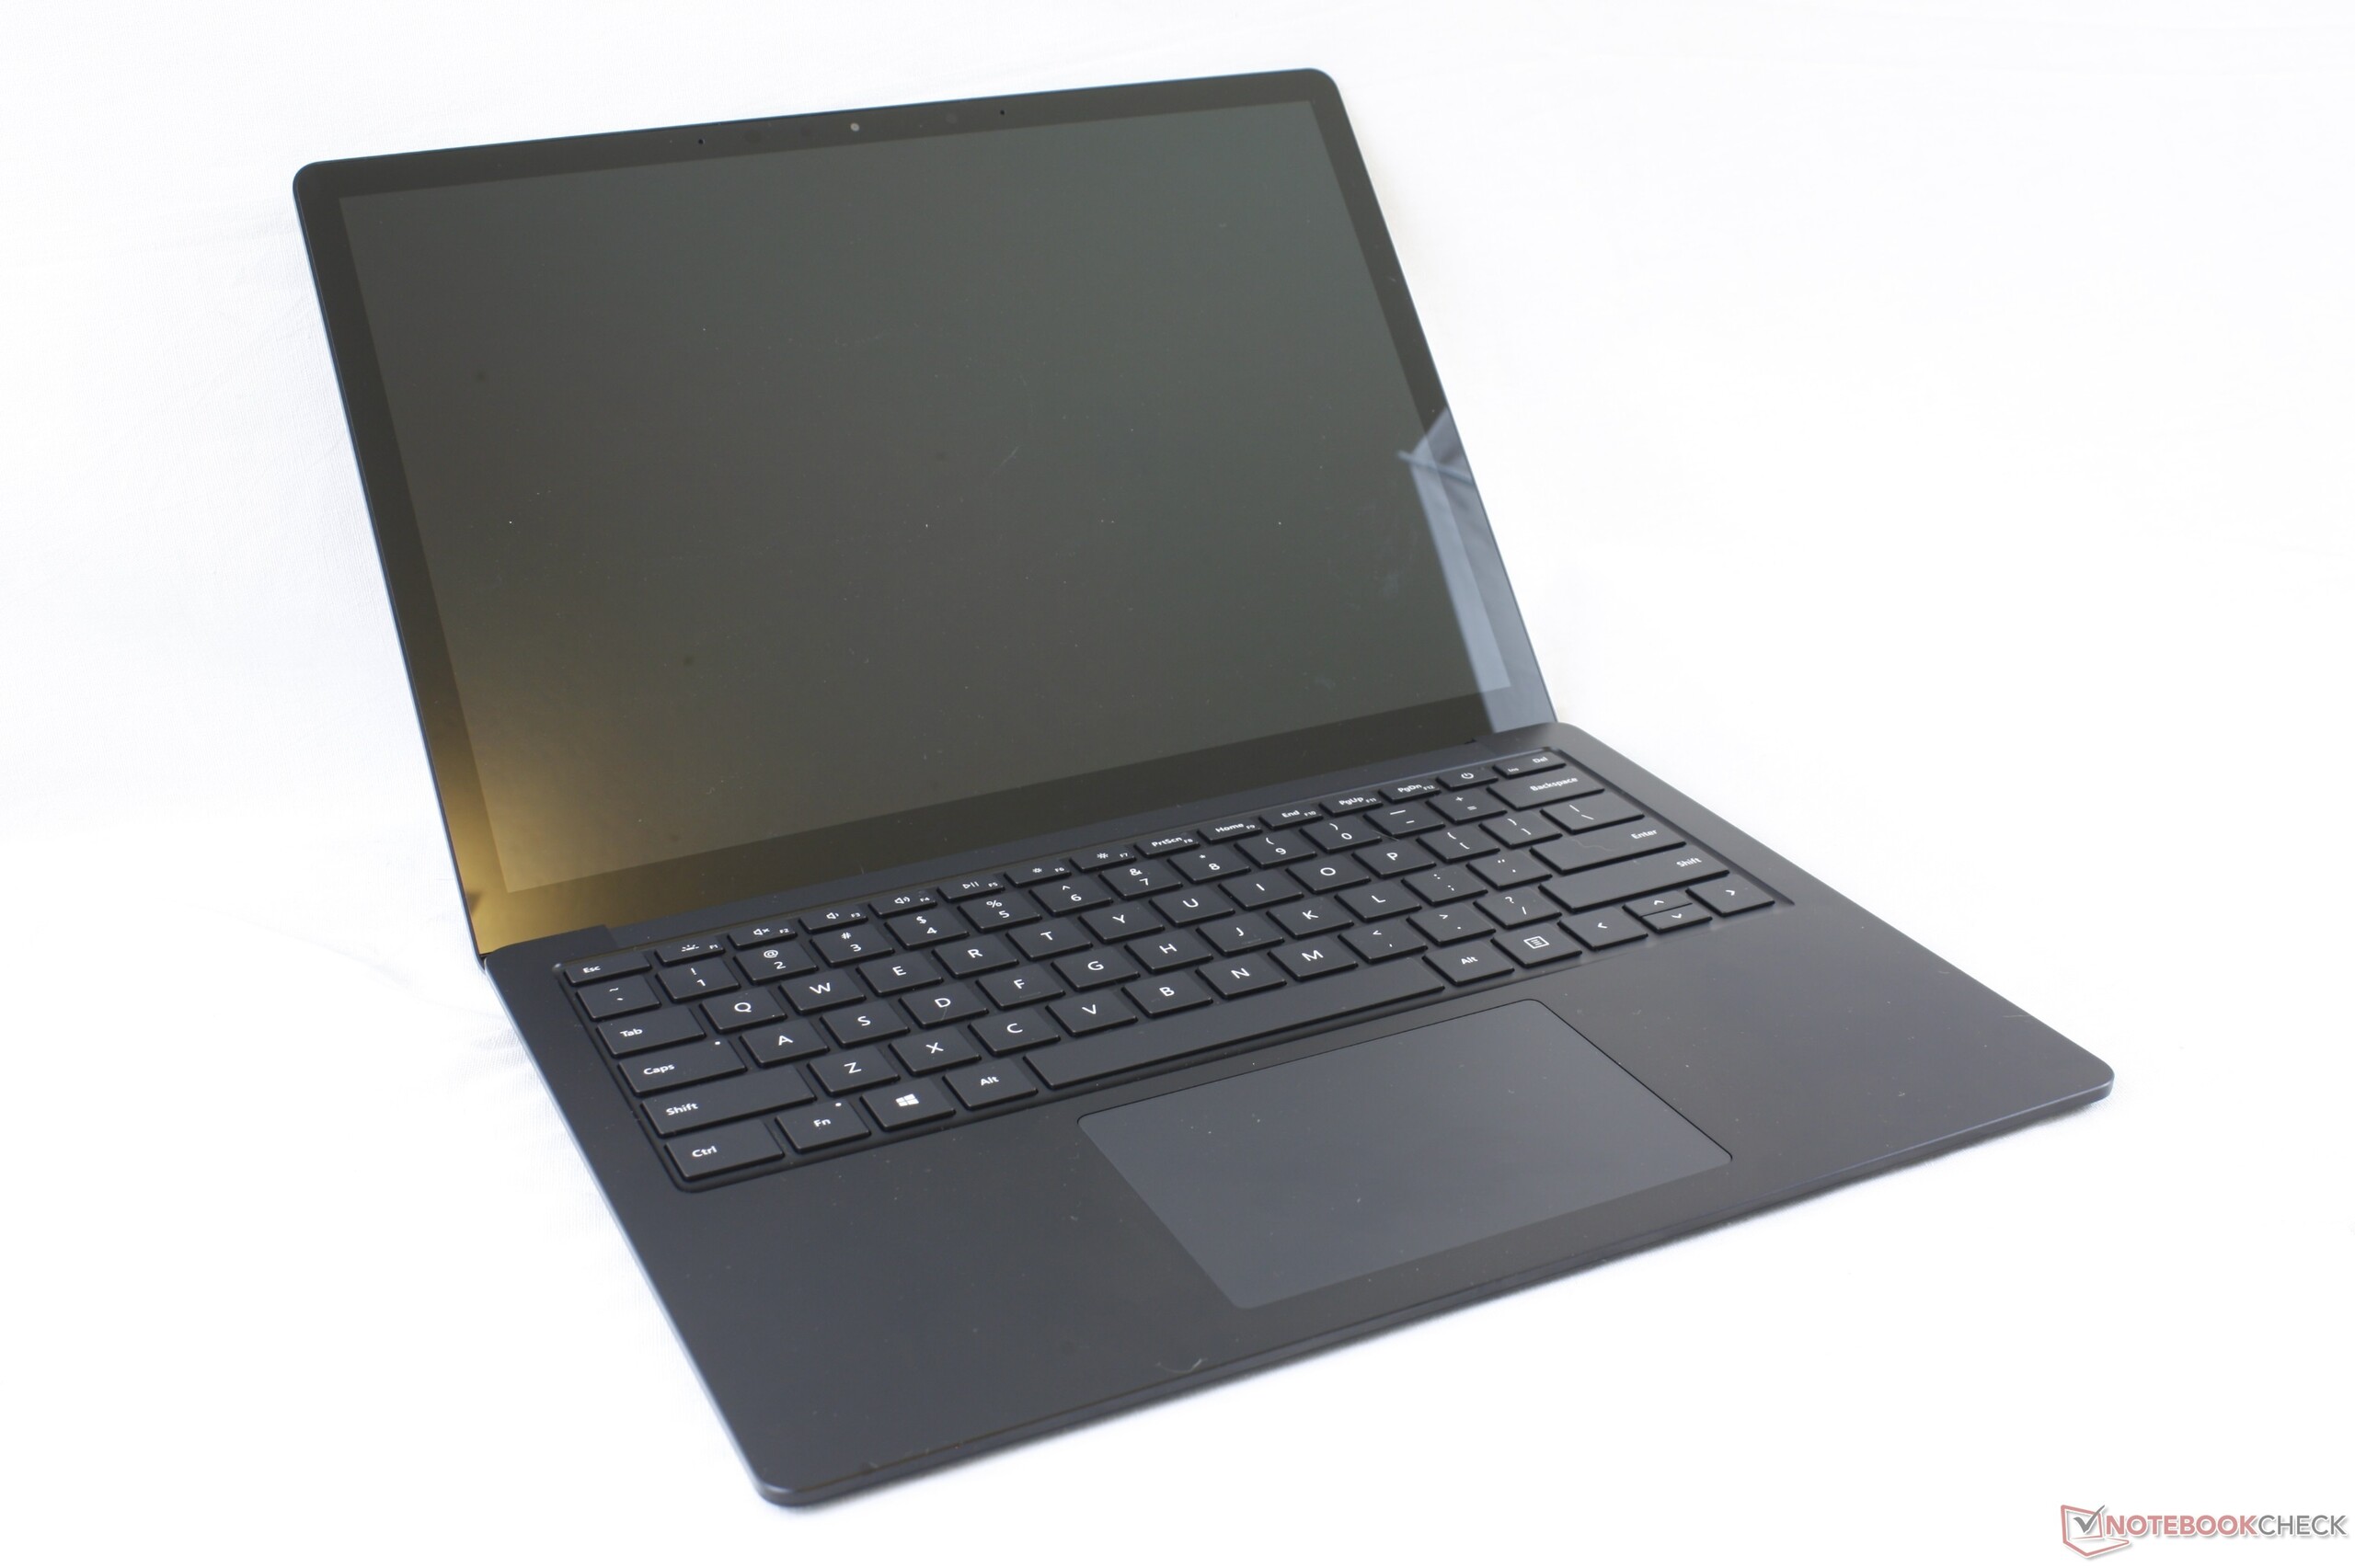
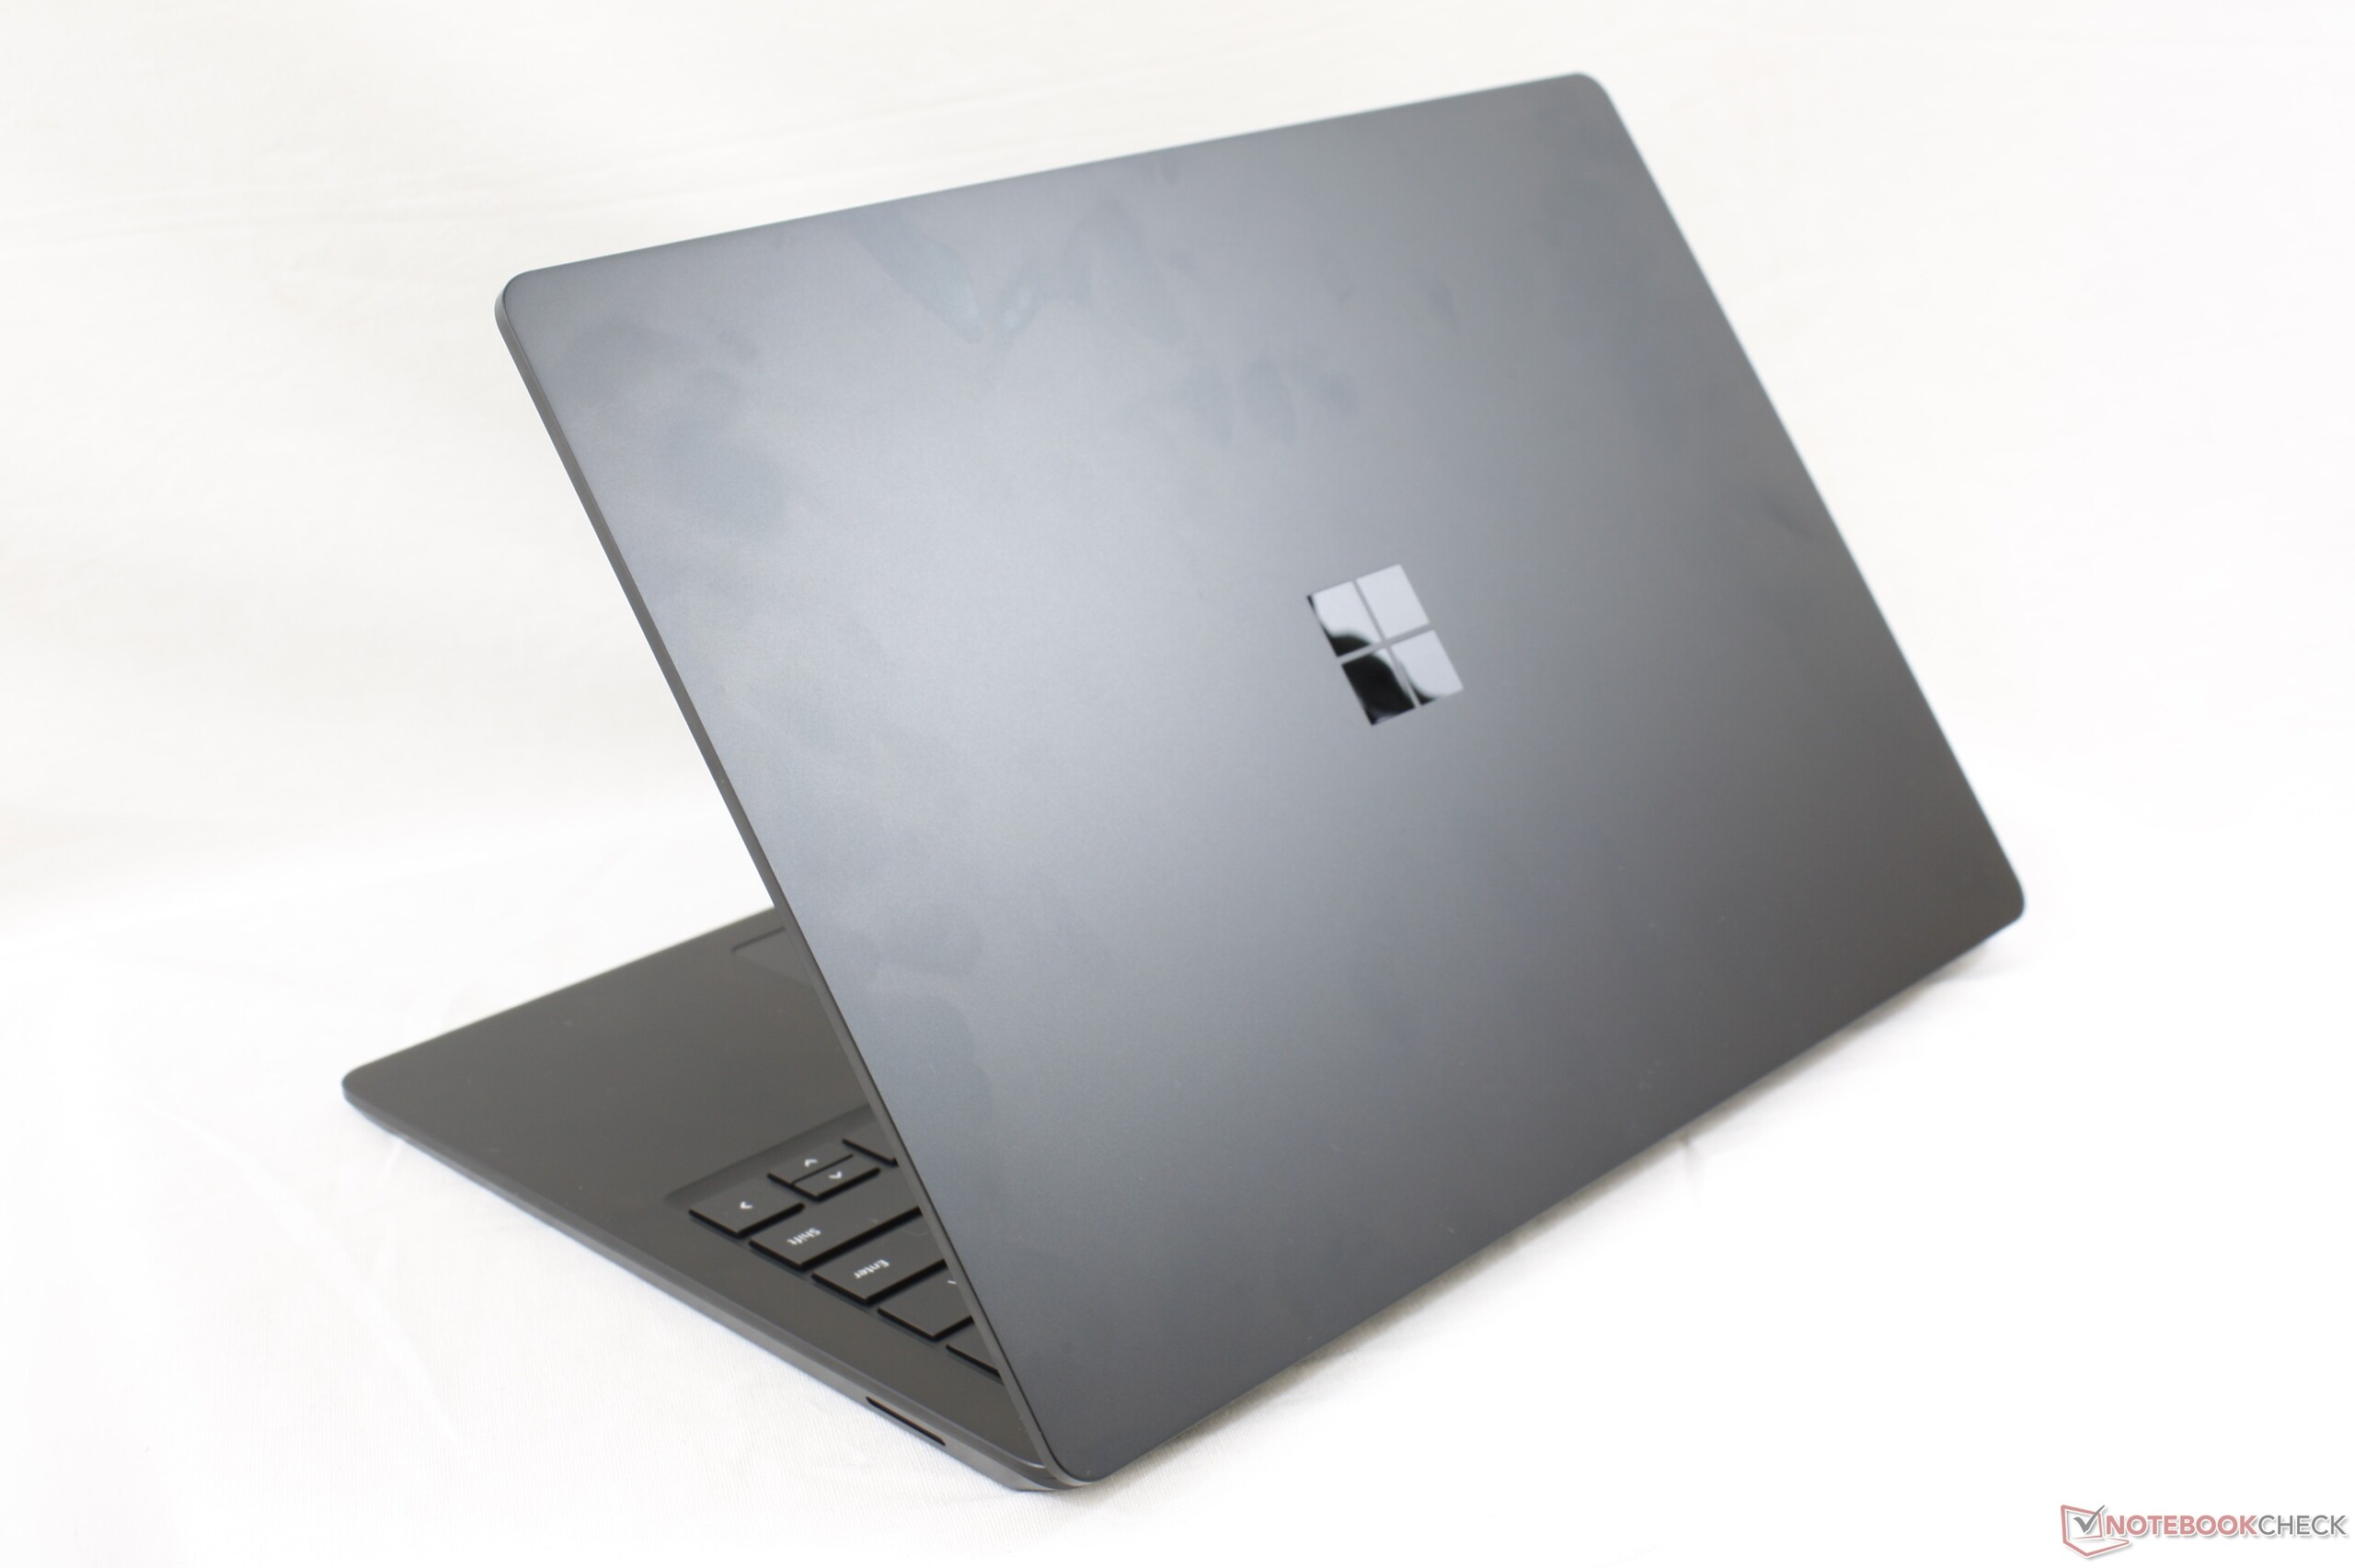
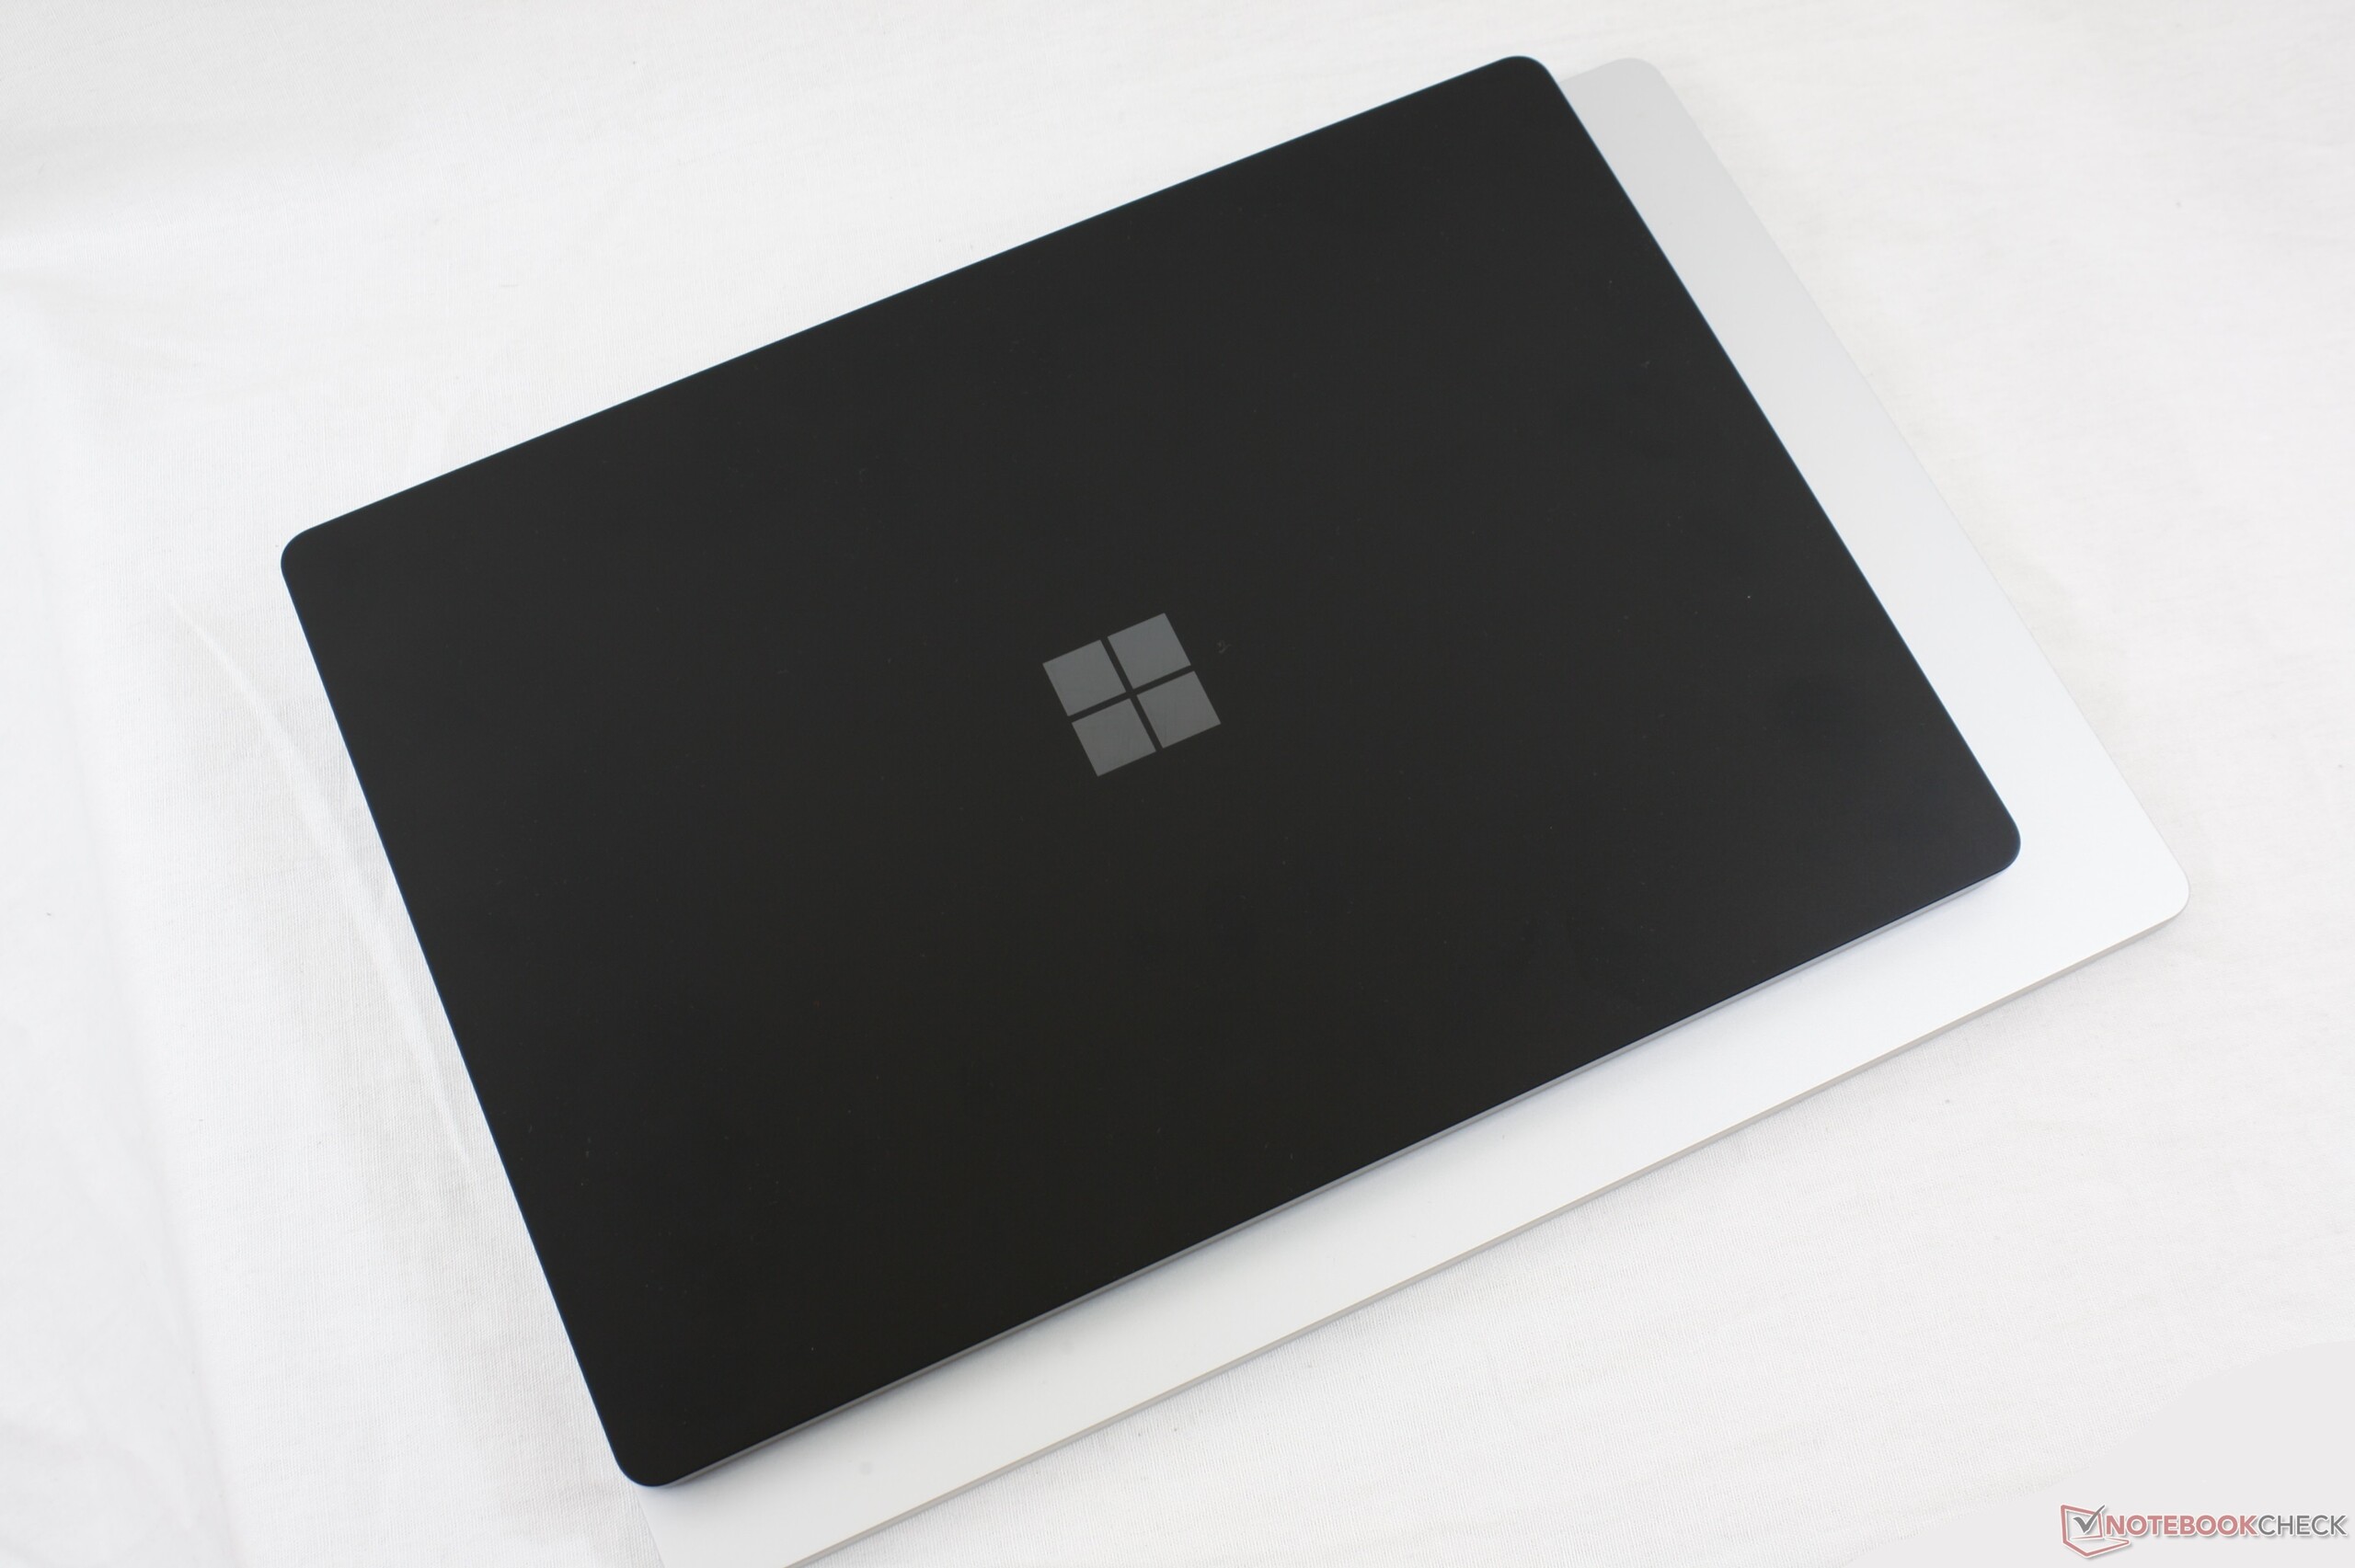
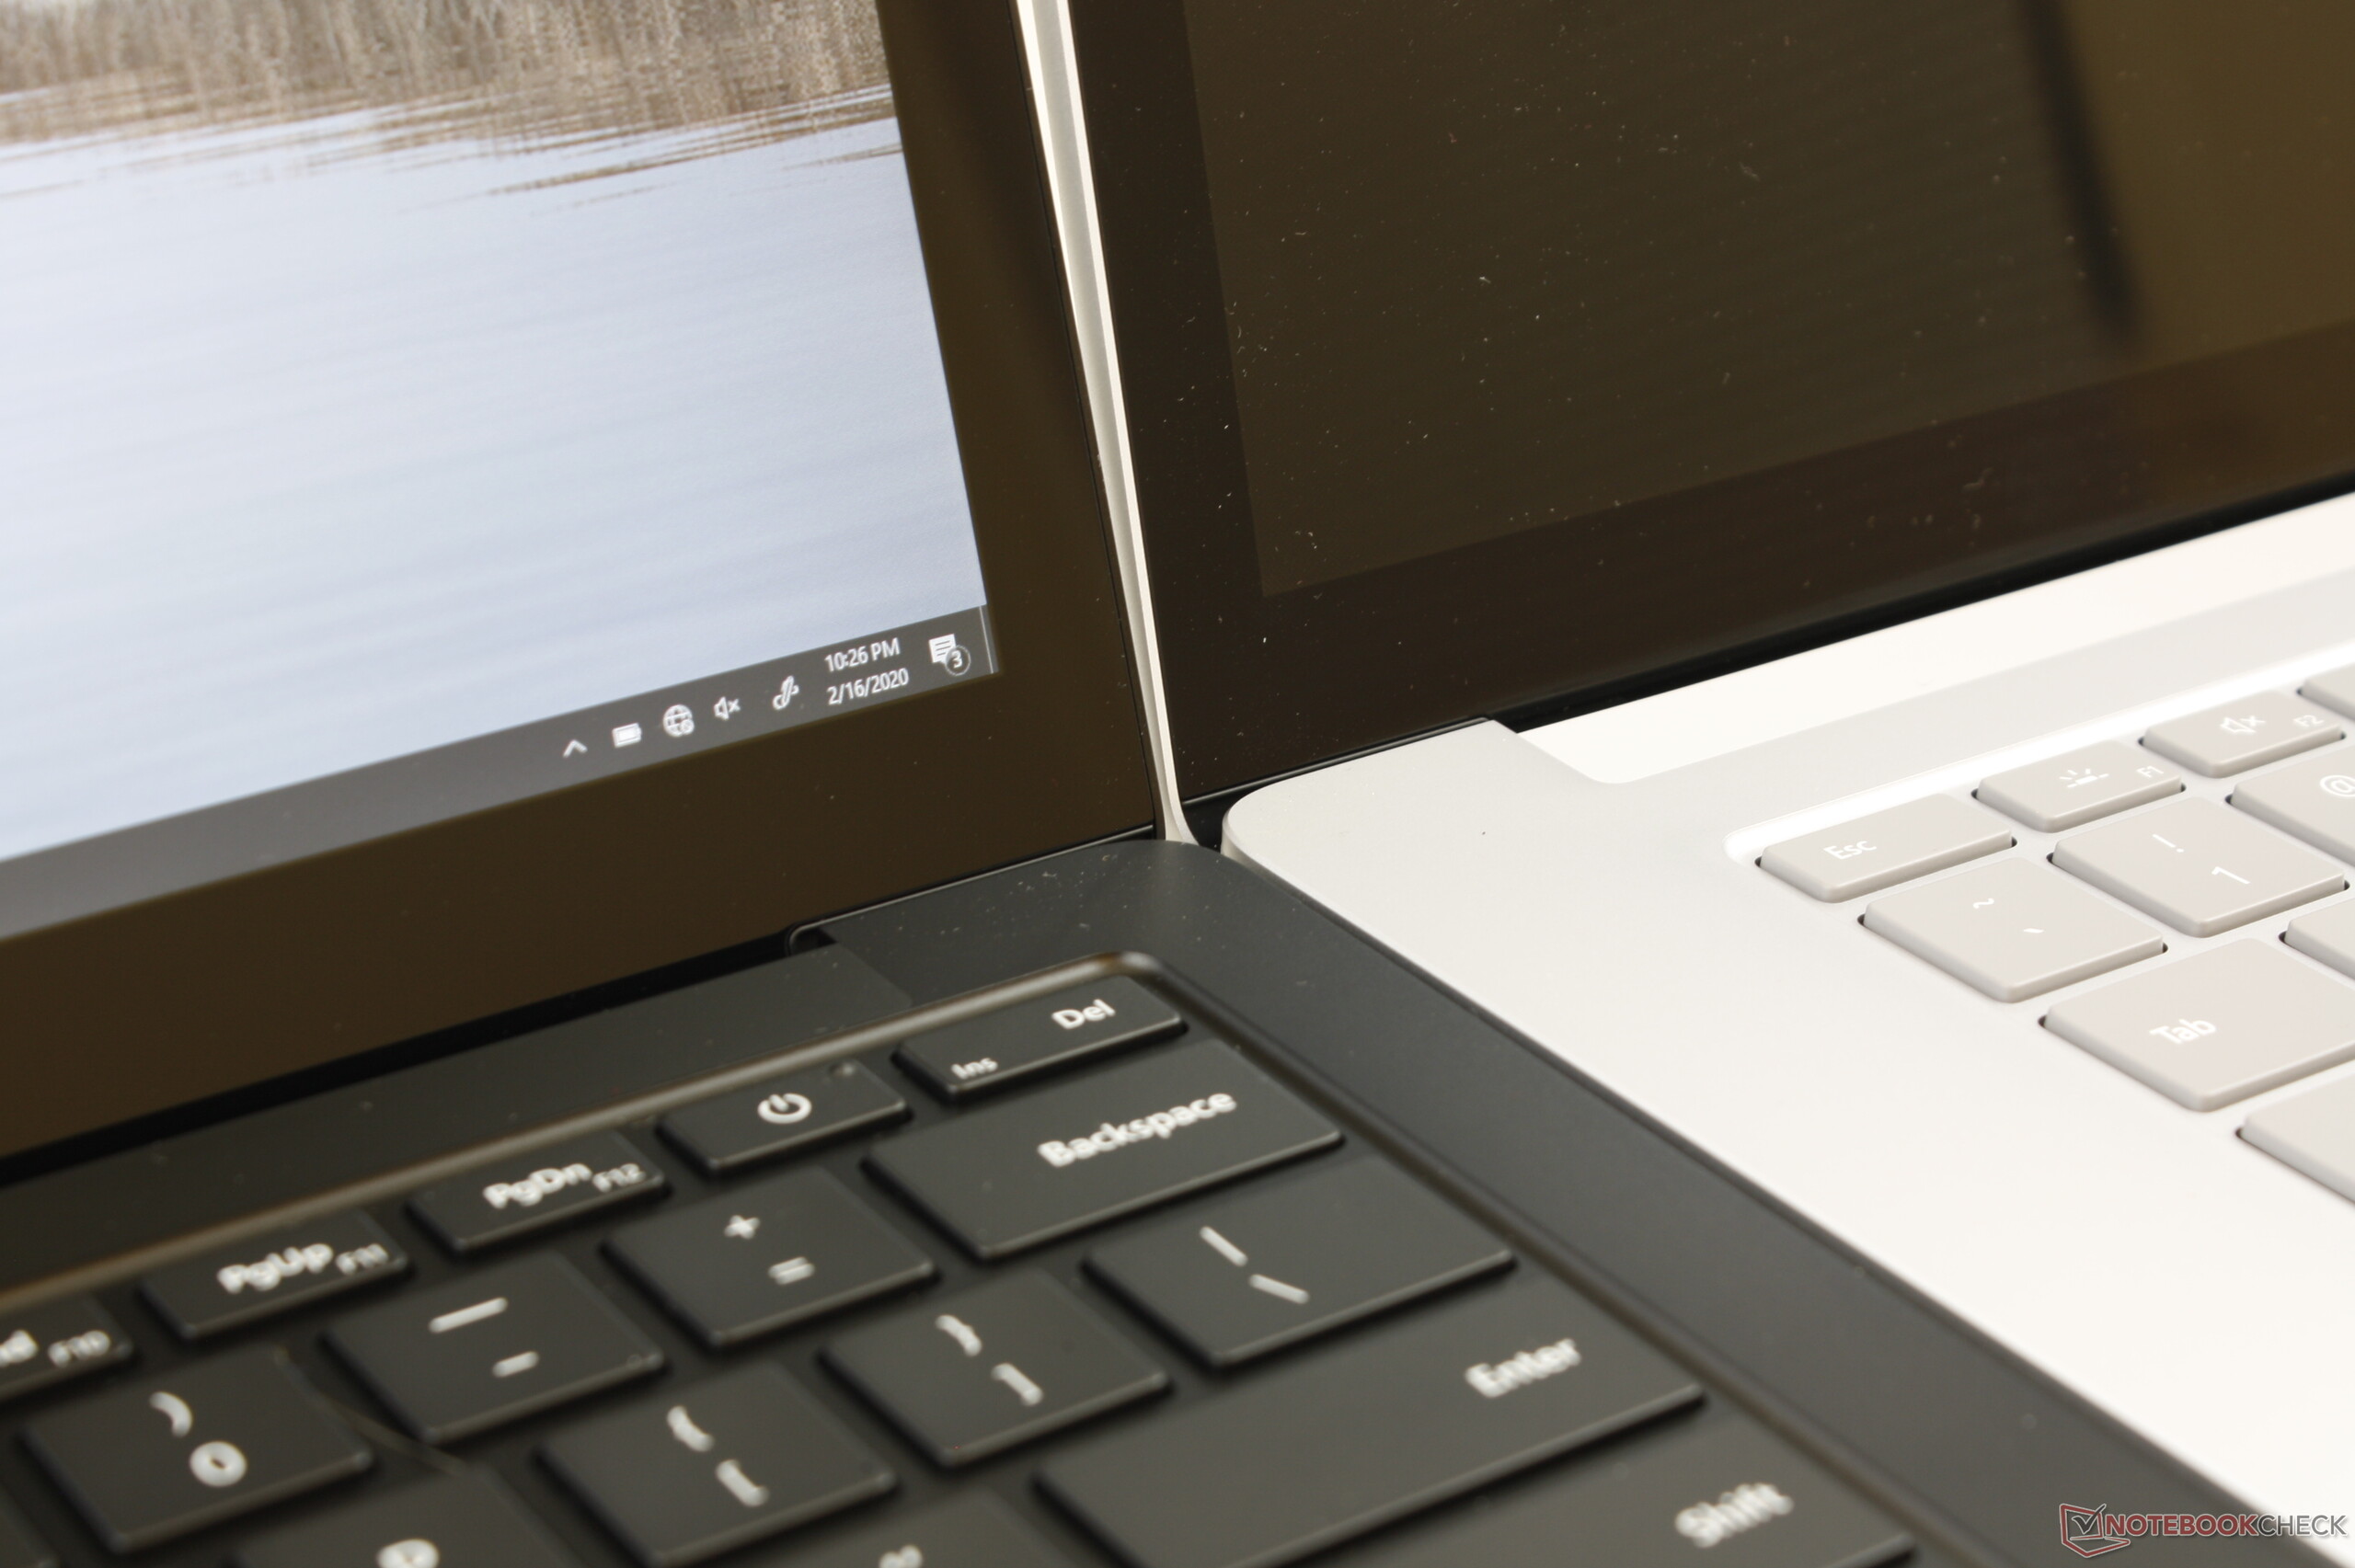
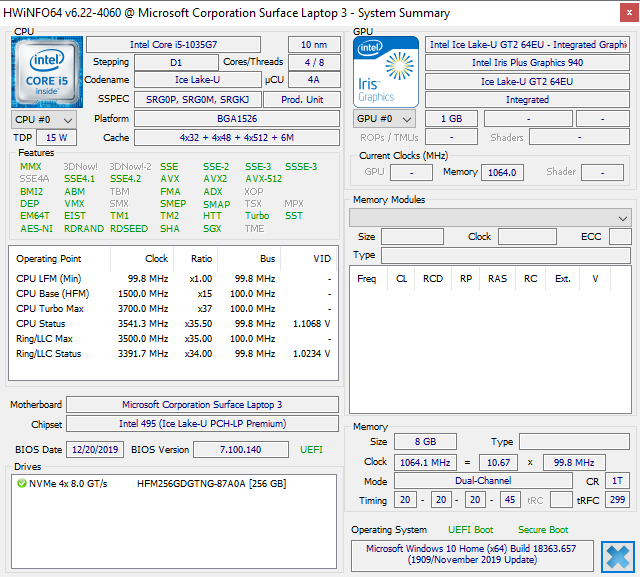
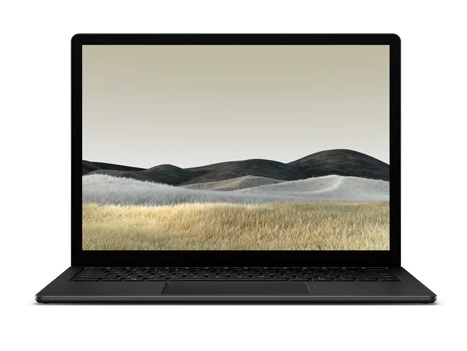
Sayonara, Alcantara: Breve Análise do Microsoft Surface Laptop 3 13,5 polegadas Core i5
Avaliação | Data | Modelo | Peso | Altura | Size | Resolução | Preço |
|---|---|---|---|---|---|---|---|
| 84 % v7 (old) | 03/2020 | Microsoft Surface Laptop 3 13 Core i5-1035G7 i5-1035G7, Iris Plus Graphics G7 (Ice Lake 64 EU) | 1.3 kg | 14.5 mm | 13.50" | 2256x1504 | |
| 90.6 % v7 (old) | 02/2020 | Apple MacBook Pro 13 2019 2TB3 i5-8257U, Iris Plus Graphics 645 | 1.4 kg | 14.9 mm | 13.30" | 2560x1600 | |
| 86.3 % v7 (old) | 10/2019 | Dell XPS 13 7390 2-in-1 Core i7 i7-1065G7, Iris Plus Graphics G7 (Ice Lake 64 EU) | 1.3 kg | 13 mm | 13.40" | 1920x1200 | |
| 90.1 % v7 (old) | 07/2019 | Lenovo ThinkPad X1 Carbon 2019-20QE000VGE i7-8665U, UHD Graphics 620 | 1.1 kg | 14.9 mm | 14.00" | 2560x1440 | |
| 83.9 % v7 (old) | 12/2019 | Microsoft Surface Laptop 3 15 i7-1065G7 i7-1065G7, Iris Plus Graphics G7 (Ice Lake 64 EU) | 1.5 kg | 14.7 mm | 15.00" | 2496x1664 |


| |||||||||||||||||||||||||
iluminação: 89 %
iluminação com acumulador: 403.4 cd/m²
Contraste: 1186:1 (Preto: 0.34 cd/m²)
ΔE ColorChecker Calman: 0.94 | ∀{0.5-29.43 Ø4.73}
calibrated: 0.99
ΔE Greyscale Calman: 0.9 | ∀{0.09-98 Ø4.97}
98.7% sRGB (Argyll 1.6.3 3D)
62.3% AdobeRGB 1998 (Argyll 1.6.3 3D)
67.8% AdobeRGB 1998 (Argyll 3D)
98.6% sRGB (Argyll 3D)
65.7% Display P3 (Argyll 3D)
Gamma: 2.13
CCT: 6620 K
| Microsoft Surface Laptop 3 13 Core i5-1035G7 Sharp LQ135P1JX51, IPS, 13.5", 2256x1504 | Apple MacBook Pro 13 2019 2TB3 APPA03D, IPS, 13.3", 2560x1600 | Huawei Matebook X Pro i5 Tianma XM, IPS, 13.9", 3000x2000 | Microsoft Surface Laptop 2-LQN-00004 VVX14T092N00, IPS, 13.5", 2256x1504 | Dell XPS 13 7390 2-in-1 Core i7 Sharp LQ134N1, IPS, 13.4", 1920x1200 | Lenovo ThinkPad X1 Carbon 2019-20QE000VGE LP140QH2-SPD1, IPS, 14", 2560x1440 | |
|---|---|---|---|---|---|---|
| Display | 24% | -1% | 1% | 4% | 6% | |
| Display P3 Coverage (%) | 65.7 | 96.1 46% | 65.9 0% | 68 4% | 69.9 6% | 72.5 10% |
| sRGB Coverage (%) | 98.6 | 99.4 1% | 95.2 -3% | 94.7 -4% | 99.2 1% | 97.8 -1% |
| AdobeRGB 1998 Coverage (%) | 67.8 | 85.6 26% | 67.6 0% | 69.2 2% | 71.5 5% | 73.8 9% |
| Response Times | 15% | 35% | -15% | 25% | 43% | |
| Response Time Grey 50% / Grey 80% * (ms) | 59.2 ? | 50.4 ? 15% | 40.4 ? 32% | 69.2 ? -17% | 47.6 ? 20% | 33.6 ? 43% |
| Response Time Black / White * (ms) | 41.6 ? | 35.2 ? 15% | 25.6 ? 38% | 46.4 ? -12% | 29.2 ? 30% | 24 ? 42% |
| PWM Frequency (Hz) | 21740 ? | 116300 ? | 2500 ? | |||
| Screen | -3% | -113% | -67% | -28% | -113% | |
| Brightness middle (cd/m²) | 403.4 | 603 49% | 442.7 10% | 392 -3% | 549.8 36% | 338 -16% |
| Brightness (cd/m²) | 397 | 577 45% | 428 8% | 390 -2% | 520 31% | 315 -21% |
| Brightness Distribution (%) | 89 | 92 3% | 84 -6% | 89 0% | 86 -3% | 88 -1% |
| Black Level * (cd/m²) | 0.34 | 0.35 -3% | 0.31 9% | 0.24 29% | 0.39 -15% | 0.43 -26% |
| Contrast (:1) | 1186 | 1723 45% | 1428 20% | 1633 38% | 1410 19% | 786 -34% |
| Colorchecker dE 2000 * | 0.94 | 1.7 -81% | 2.24 -138% | 3.2 -240% | 2.12 -126% | 4 -326% |
| Colorchecker dE 2000 max. * | 2.92 | 3.1 -6% | 7.19 -146% | 6.3 -116% | 3.66 -25% | 7.9 -171% |
| Colorchecker dE 2000 calibrated * | 0.99 | 0.7 29% | 1.11 -12% | 1.4 -41% | 1.37 -38% | 1.7 -72% |
| Greyscale dE 2000 * | 0.9 | 2.1 -133% | 9.7 -978% | 4.5 -400% | 2.6 -189% | 6.2 -589% |
| Gamma | 2.13 103% | 2.18 101% | 1.42 155% | 2.2 100% | 2.3 96% | 2.13 103% |
| CCT | 6620 98% | 6843 95% | 6227 104% | 7556 86% | 6884 94% | 6787 96% |
| Color Space (Percent of AdobeRGB 1998) (%) | 62.3 | 76.7 23% | 61.6 -1% | 63.9 3% | 65.4 5% | 68.1 9% |
| Color Space (Percent of sRGB) (%) | 98.7 | 99.4 1% | 95 -4% | 95 -4% | 99.7 1% | 97.8 -1% |
| Média Total (Programa/Configurações) | 12% /
5% | -26% /
-73% | -27% /
-48% | 0% /
-15% | -21% /
-72% |
* ... menor é melhor
Exibir tempos de resposta
| ↔ Tempo de resposta preto para branco | ||
|---|---|---|
| 41.6 ms ... ascensão ↗ e queda ↘ combinadas | ↗ 23.6 ms ascensão | 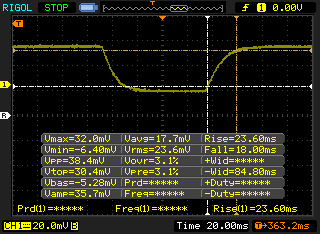 |
| ↘ 18 ms queda | ||
| A tela mostra taxas de resposta lentas em nossos testes e será insatisfatória para os jogadores. Em comparação, todos os dispositivos testados variam de 0.1 (mínimo) a 240 (máximo) ms. » 98 % de todos os dispositivos são melhores. Isso significa que o tempo de resposta medido é pior que a média de todos os dispositivos testados (19.9 ms). | ||
| ↔ Tempo de resposta 50% cinza a 80% cinza | ||
| 59.2 ms ... ascensão ↗ e queda ↘ combinadas | ↗ 28.4 ms ascensão | 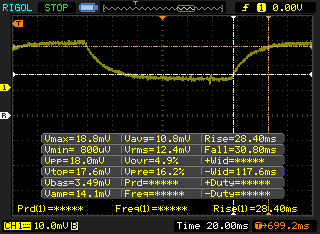 |
| ↘ 30.8 ms queda | ||
| A tela mostra taxas de resposta lentas em nossos testes e será insatisfatória para os jogadores. Em comparação, todos os dispositivos testados variam de 0.165 (mínimo) a 636 (máximo) ms. » 95 % de todos os dispositivos são melhores. Isso significa que o tempo de resposta medido é pior que a média de todos os dispositivos testados (31.1 ms). | ||
Cintilação da tela / PWM (modulação por largura de pulso)
| Tela tremeluzindo/PWM detectado | 21740 Hz | ≤ 51 % configuração de brilho | 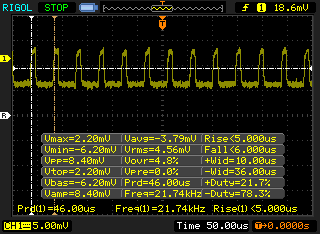 |
A luz de fundo da tela pisca em 21740 Hz (pior caso, por exemplo, utilizando PWM) Cintilação detectada em uma configuração de brilho de 51 % e abaixo. Não deve haver cintilação ou PWM acima desta configuração de brilho. A frequência de 21740 Hz é bastante alta, então a maioria dos usuários sensíveis ao PWM não deve notar nenhuma oscilação. [pwm_comparison] Em comparação: 52 % de todos os dispositivos testados não usam PWM para escurecer a tela. Se PWM foi detectado, uma média de 7801 (mínimo: 5 - máximo: 343500) Hz foi medida. | |||
* ... menor é melhor
| PCMark 8 Home Score Accelerated v2 | 3725 pontos | |
| PCMark 8 Work Score Accelerated v2 | 4755 pontos | |
| PCMark 10 Score | 4421 pontos | |
Ajuda | ||
| Microsoft Surface Laptop 3 13 Core i5-1035G7 SK hynix BC501 HFM256GDGTNG | Apple MacBook Pro 13 2019 2TB3 Apple SSD AP0256 | Huawei Matebook X Pro i5 Samsung PM961 MZVLW256HEHP | Microsoft Surface Laptop 2-LQN-00004 SK Hynix BC501 NVMe 256 GB | Dell XPS 13 7390 2-in-1 Core i7 Toshiba BG4 KBG40ZPZ512G | |
|---|---|---|---|---|---|
| AS SSD | -33% | 44% | 3% | 8% | |
| Seq Read (MB/s) | 1387 | 974 -30% | 2416 74% | 826 -40% | 1801 30% |
| Seq Write (MB/s) | 504 | 1340 166% | 1170 132% | 555 10% | 1125 123% |
| 4K Read (MB/s) | 42.35 | 11.35 -73% | 48.33 14% | 33.39 -21% | 39.7 -6% |
| 4K Write (MB/s) | 120 | 15.95 -87% | 103.1 -14% | 95.3 -21% | 67 -44% |
| 4K-64 Read (MB/s) | 497.4 | 643 29% | 1039 109% | 447 -10% | 1253 152% |
| 4K-64 Write (MB/s) | 354.9 | 163 -54% | 399.6 13% | 370.4 4% | 209 -41% |
| Access Time Read * (ms) | 0.055 | 0.316 -475% | 0.058 -5% | 0.048 13% | 0.069 -25% |
| Access Time Write * (ms) | 0.093 | 0.258 -177% | 0.036 61% | 0.048 48% | 0.625 -572% |
| Score Read (Points) | 678 | 752 11% | 1329 96% | 563 -17% | 1472 117% |
| Score Write (Points) | 525 | 313 -40% | 620 18% | 521 -1% | 388 -26% |
| Score Total (Points) | 1520 | 1465 -4% | 2575 69% | 1369 -10% | 2583 70% |
| Copy ISO MB/s (MB/s) | 764 | 1404 84% | 739 -3% | 755 -1% | 1293 69% |
| Copy Program MB/s (MB/s) | 256.1 | 406.9 59% | 312.3 22% | 325.1 27% | 560 119% |
| Copy Game MB/s (MB/s) | 368.4 | 850 131% | 486.3 32% | 577 57% | 927 152% |
| CrystalDiskMark 5.2 / 6 | 16% | -11% | 36% | ||
| Write 4K (MB/s) | 112.3 | 116.5 4% | 87.3 -22% | 106.7 -5% | |
| Read 4K (MB/s) | 42.13 | 42.18 0% | 36.52 -13% | 49.94 19% | |
| Write Seq (MB/s) | 630 | 1079 71% | 716 14% | 1223 94% | |
| Read Seq (MB/s) | 1023 | 1030 1% | 1009 -1% | 1801 76% | |
| Write 4K Q32T1 (MB/s) | 336.6 | 225.7 -33% | 324.1 -4% | 325.3 -3% | |
| Read 4K Q32T1 (MB/s) | 399.6 | 302.9 -24% | 249 -38% | 551 38% | |
| Write Seq Q32T1 (MB/s) | 821 | 1174 43% | 811 -1% | 1224 49% | |
| Read Seq Q32T1 (MB/s) | 2030 | 3394 67% | 1631 -20% | 2350 16% | |
| Média Total (Programa/Configurações) | -33% /
-33% | 30% /
34% | -4% /
-2% | 22% /
18% |
* ... menor é melhor

| 3DMark 06 Standard Score | 15227 pontos | |
| 3DMark Vantage P Result | 14442 pontos | |
| 3DMark 11 Performance | 4514 pontos | |
| 3DMark Ice Storm Standard Score | 66232 pontos | |
| 3DMark Cloud Gate Standard Score | 13409 pontos | |
| 3DMark Fire Strike Score | 2532 pontos | |
| 3DMark Time Spy Score | 899 pontos | |
Ajuda | ||
| The Witcher 3 | |
| 1024x768 Low Graphics & Postprocessing | |
| Huawei MateBook 13 i7 | |
| MSI Modern 15 A10RB | |
| Microsoft Surface Laptop 3 15 i7-1065G7 | |
| Dell Inspiron 15 5000 5585 | |
| Microsoft Surface Laptop 3 13 Core i5-1035G7 | |
| Acer Swift 3 SF314-41G-R491 | |
| Média Intel Iris Plus Graphics G7 (Ice Lake 64 EU) (28.2 - 58, n=20) | |
| Microsoft Surface Laptop 3 15 Ryzen 5 3580U | |
| Acer Swift 5 SF514-54T-501U | |
| 1366x768 Medium Graphics & Postprocessing | |
| MSI Modern 15 A10RB | |
| Huawei MateBook 13 i7 | |
| Microsoft Surface Laptop 3 15 i7-1065G7 | |
| Média Intel Iris Plus Graphics G7 (Ice Lake 64 EU) (20.8 - 36.8, n=18) | |
| Microsoft Surface Laptop 3 13 Core i5-1035G7 | |
| Acer Swift 3 SF314-41G-R491 | |
| Acer Swift 5 SF514-54T-501U | |
| Shadow of the Tomb Raider - 1280x720 Lowest Preset | |
| MSI Modern 15 A10RB | |
| Acer Swift 3 SF314-41G-R491 | |
| Dell Inspiron 15 5000 5585 | |
| Microsoft Surface Pro 7 | |
| Microsoft Surface Laptop 3 15 i7-1065G7 | |
| Microsoft Surface Laptop 3 15 Ryzen 5 3580U | |
| Média Intel Iris Plus Graphics G7 (Ice Lake 64 EU) (15.6 - 33, n=13) | |
| Microsoft Surface Laptop 3 13 Core i5-1035G7 | |
| Overwatch | |
| 1280x720 Low (Render Scale 100 %) AA:FX AF:1x | |
| Acer Swift 3 SF314-41G-R491 | |
| Microsoft Surface Laptop 3 15 Ryzen 5 3580U | |
| Microsoft Surface Laptop 3 15 i7-1065G7 | |
| HP Envy x360 15-bq102ng | |
| Média Intel Iris Plus Graphics G7 (Ice Lake 64 EU) (62.6 - 92.7, n=6) | |
| Microsoft Surface Laptop 3 13 Core i5-1035G7 | |
| 1920x1080 High (Render Scale 100 %) AA:SM AF:4x | |
| Acer Swift 3 SF314-41G-R491 | |
| Microsoft Surface Laptop 3 15 Ryzen 5 3580U | |
| Microsoft Surface Laptop 3 15 i7-1065G7 | |
| HP Envy x360 15-bq102ng | |
| Média Intel Iris Plus Graphics G7 (Ice Lake 64 EU) (29.7 - 32.9, n=4) | |
| Microsoft Surface Laptop 3 13 Core i5-1035G7 | |
| baixo | média | alto | ultra | |
|---|---|---|---|---|
| BioShock Infinite (2013) | 89.8 | 60.4 | 50.4 | 19.2 |
| The Witcher 3 (2015) | 49 | 31 | 17 | 8.8 |
| Overwatch (2016) | 62.6 | 44.1 | 30.5 | 19 |
| Rocket League (2017) | 79 | 45.6 | 31.4 | |
| Shadow of the Tomb Raider (2018) | 26 | |||
| Borderlands 3 (2019) | 30.1 |
| Microsoft Surface Laptop 3 13 Core i5-1035G7 Iris Plus Graphics G7 (Ice Lake 64 EU), i5-1035G7, SK hynix BC501 HFM256GDGTNG | Apple MacBook Pro 13 2019 2TB3 Iris Plus Graphics 645, i5-8257U, Apple SSD AP0256 | Huawei Matebook X Pro i5 GeForce MX150, i5-8250U, Samsung PM961 MZVLW256HEHP | Microsoft Surface Laptop 2-LQN-00004 UHD Graphics 620, i5-8250U, SK Hynix BC501 NVMe 256 GB | Dell XPS 13 7390 2-in-1 Core i7 Iris Plus Graphics G7 (Ice Lake 64 EU), i7-1065G7, Toshiba BG4 KBG40ZPZ512G | Lenovo ThinkPad X1 Carbon 2019-20QE000VGE UHD Graphics 620, i7-8665U, WDC PC SN720 SDAQNTW-512G | |
|---|---|---|---|---|---|---|
| Noise | -4% | -6% | 2% | -3% | 1% | |
| desligado / ambiente * (dB) | 28.5 | 29.5 -4% | 27.9 2% | 28.7 -1% | 28.1 1% | 28.4 -0% |
| Idle Minimum * (dB) | 28.5 | 29.5 -4% | 27.9 2% | 28.7 -1% | 28.1 1% | 28.4 -0% |
| Idle Average * (dB) | 28.5 | 29.5 -4% | 27.9 2% | 28.7 -1% | 28.1 1% | 28.4 -0% |
| Idle Maximum * (dB) | 28.5 | 29.5 -4% | 27.9 2% | 28.7 -1% | 28.1 1% | 28.6 -0% |
| Load Average * (dB) | 28.5 | 31.1 -9% | 36.2 -27% | 30 -5% | 31.7 -11% | 31.5 -11% |
| Witcher 3 ultra * (dB) | 40.4 | 45 -11% | 43.4 -7% | |||
| Load Maximum * (dB) | 40.4 | 39.3 3% | 45.2 -12% | 32.9 19% | 43.4 -7% | 33.1 18% |
* ... menor é melhor
Barulho
| Ocioso |
| 28.5 / 28.5 / 28.5 dB |
| Carga |
| 28.5 / 40.4 dB |
 | ||
30 dB silencioso 40 dB(A) audível 50 dB(A) ruidosamente alto |
||
min: | ||
(±) A temperatura máxima no lado superior é 42.6 °C / 109 F, em comparação com a média de 34.3 °C / 94 F , variando de 21.2 a 62.5 °C para a classe Office.
(-) A parte inferior aquece até um máximo de 45.4 °C / 114 F, em comparação com a média de 36.8 °C / 98 F
(+) Em uso inativo, a temperatura média para o lado superior é 25.5 °C / 78 F, em comparação com a média do dispositivo de 29.5 °C / ### class_avg_f### F.
(±) Jogando The Witcher 3, a temperatura média para o lado superior é 34.8 °C / 95 F, em comparação com a média do dispositivo de 29.5 °C / ## #class_avg_f### F.
(+) Os apoios para as mãos e o touchpad estão atingindo a temperatura máxima da pele (35.2 °C / 95.4 F) e, portanto, não estão quentes.
(-) A temperatura média da área do apoio para as mãos de dispositivos semelhantes foi 27.5 °C / 81.5 F (-7.7 °C / -13.9 F).
Microsoft Surface Laptop 3 13 Core i5-1035G7 análise de áudio
(±) | o volume do alto-falante é médio, mas bom (###valor### dB)
Graves 100 - 315Hz
(+) | bons graves - apenas 4.2% longe da mediana
(±) | a linearidade dos graves é média (10.5% delta para a frequência anterior)
Médios 400 - 2.000 Hz
(+) | médios equilibrados - apenas 3.6% longe da mediana
(±) | a linearidade dos médios é média (7.1% delta para frequência anterior)
Altos 2 - 16 kHz
(+) | agudos equilibrados - apenas 1.8% longe da mediana
(+) | os máximos são lineares (6.5% delta da frequência anterior)
Geral 100 - 16.000 Hz
(+) | o som geral é linear (11.4% diferença em relação à mediana)
Comparado com a mesma classe
» 3% de todos os dispositivos testados nesta classe foram melhores, 2% semelhantes, 95% piores
» O melhor teve um delta de 7%, a média foi 21%, o pior foi 53%
Comparado com todos os dispositivos testados
» 7% de todos os dispositivos testados foram melhores, 2% semelhantes, 91% piores
» O melhor teve um delta de 4%, a média foi 24%, o pior foi 134%
Apple MacBook 12 (Early 2016) 1.1 GHz análise de áudio
(+) | os alto-falantes podem tocar relativamente alto (###valor### dB)
Graves 100 - 315Hz
(±) | graves reduzidos - em média 11.3% menor que a mediana
(±) | a linearidade dos graves é média (14.2% delta para a frequência anterior)
Médios 400 - 2.000 Hz
(+) | médios equilibrados - apenas 2.4% longe da mediana
(+) | médios são lineares (5.5% delta para frequência anterior)
Altos 2 - 16 kHz
(+) | agudos equilibrados - apenas 2% longe da mediana
(+) | os máximos são lineares (4.5% delta da frequência anterior)
Geral 100 - 16.000 Hz
(+) | o som geral é linear (10.2% diferença em relação à mediana)
Comparado com a mesma classe
» 7% de todos os dispositivos testados nesta classe foram melhores, 2% semelhantes, 91% piores
» O melhor teve um delta de 5%, a média foi 18%, o pior foi 53%
Comparado com todos os dispositivos testados
» 5% de todos os dispositivos testados foram melhores, 1% semelhantes, 94% piores
» O melhor teve um delta de 4%, a média foi 24%, o pior foi 134%
| desligado | |
| Ocioso | |
| Carga |
|
Key:
min: | |
| Microsoft Surface Laptop 3 13 Core i5-1035G7 i5-1035G7, Iris Plus Graphics G7 (Ice Lake 64 EU), SK hynix BC501 HFM256GDGTNG, IPS, 2256x1504, 13.5" | Apple MacBook Pro 13 2019 2TB3 i5-8257U, Iris Plus Graphics 645, Apple SSD AP0256, IPS, 2560x1600, 13.3" | Huawei Matebook X Pro i5 i5-8250U, GeForce MX150, Samsung PM961 MZVLW256HEHP, IPS, 3000x2000, 13.9" | Microsoft Surface Laptop 2-LQN-00004 i5-8250U, UHD Graphics 620, SK Hynix BC501 NVMe 256 GB, IPS, 2256x1504, 13.5" | Dell XPS 13 7390 2-in-1 Core i7 i7-1065G7, Iris Plus Graphics G7 (Ice Lake 64 EU), Toshiba BG4 KBG40ZPZ512G, IPS, 1920x1200, 13.4" | Lenovo ThinkPad X1 Carbon 2019-20QE000VGE i7-8665U, UHD Graphics 620, WDC PC SN720 SDAQNTW-512G, IPS, 2560x1440, 14" | |
|---|---|---|---|---|---|---|
| Power Consumption | 12% | -12% | 16% | 16% | 6% | |
| Idle Minimum * (Watt) | 4.4 | 2.1 52% | 3.5 20% | 3 32% | 2.6 41% | 3 32% |
| Idle Average * (Watt) | 7.5 | 6.9 8% | 8.9 -19% | 6.8 9% | 5.3 29% | 6.3 16% |
| Idle Maximum * (Watt) | 7.8 | 7.8 -0% | 12.3 -58% | 8.76 -12% | 7 10% | 8.9 -14% |
| Load Average * (Watt) | 41.9 | 42 -0% | 54.2 -29% | 35.1 16% | 43.1 -3% | 40.8 3% |
| Witcher 3 ultra * (Watt) | 40.8 | 42.4 -4% | 43.1 -6% | |||
| Load Maximum * (Watt) | 63.9 | 64.5 -1% | 52.1 18% | 42.6 33% | 49 23% | 67.5 -6% |
* ... menor é melhor
| Microsoft Surface Laptop 3 13 Core i5-1035G7 i5-1035G7, Iris Plus Graphics G7 (Ice Lake 64 EU), 45 Wh | Apple MacBook Pro 13 2019 2TB3 i5-8257U, Iris Plus Graphics 645, 58.2 Wh | Huawei Matebook X Pro i5 i5-8250U, GeForce MX150, 57.4 Wh | Microsoft Surface Laptop 2-LQN-00004 i5-8250U, UHD Graphics 620, 45 Wh | Dell XPS 13 7390 2-in-1 Core i7 i7-1065G7, Iris Plus Graphics G7 (Ice Lake 64 EU), 51 Wh | Lenovo ThinkPad X1 Carbon 2019-20QE000VGE i7-8665U, UHD Graphics 620, 51 Wh | |
|---|---|---|---|---|---|---|
| Duração da bateria | 57% | -4% | -15% | 8% | -14% | |
| Reader / Idle (h) | 34.4 | 20.7 -40% | 20.8 -40% | |||
| WiFi v1.3 (h) | 8.3 | 13 57% | 9.3 12% | 9.1 10% | 9 8% | 8.2 -1% |
| Load (h) | 1.9 | 2.2 16% | 1.6 -16% | 1.4 -26% |
Pro
Contra
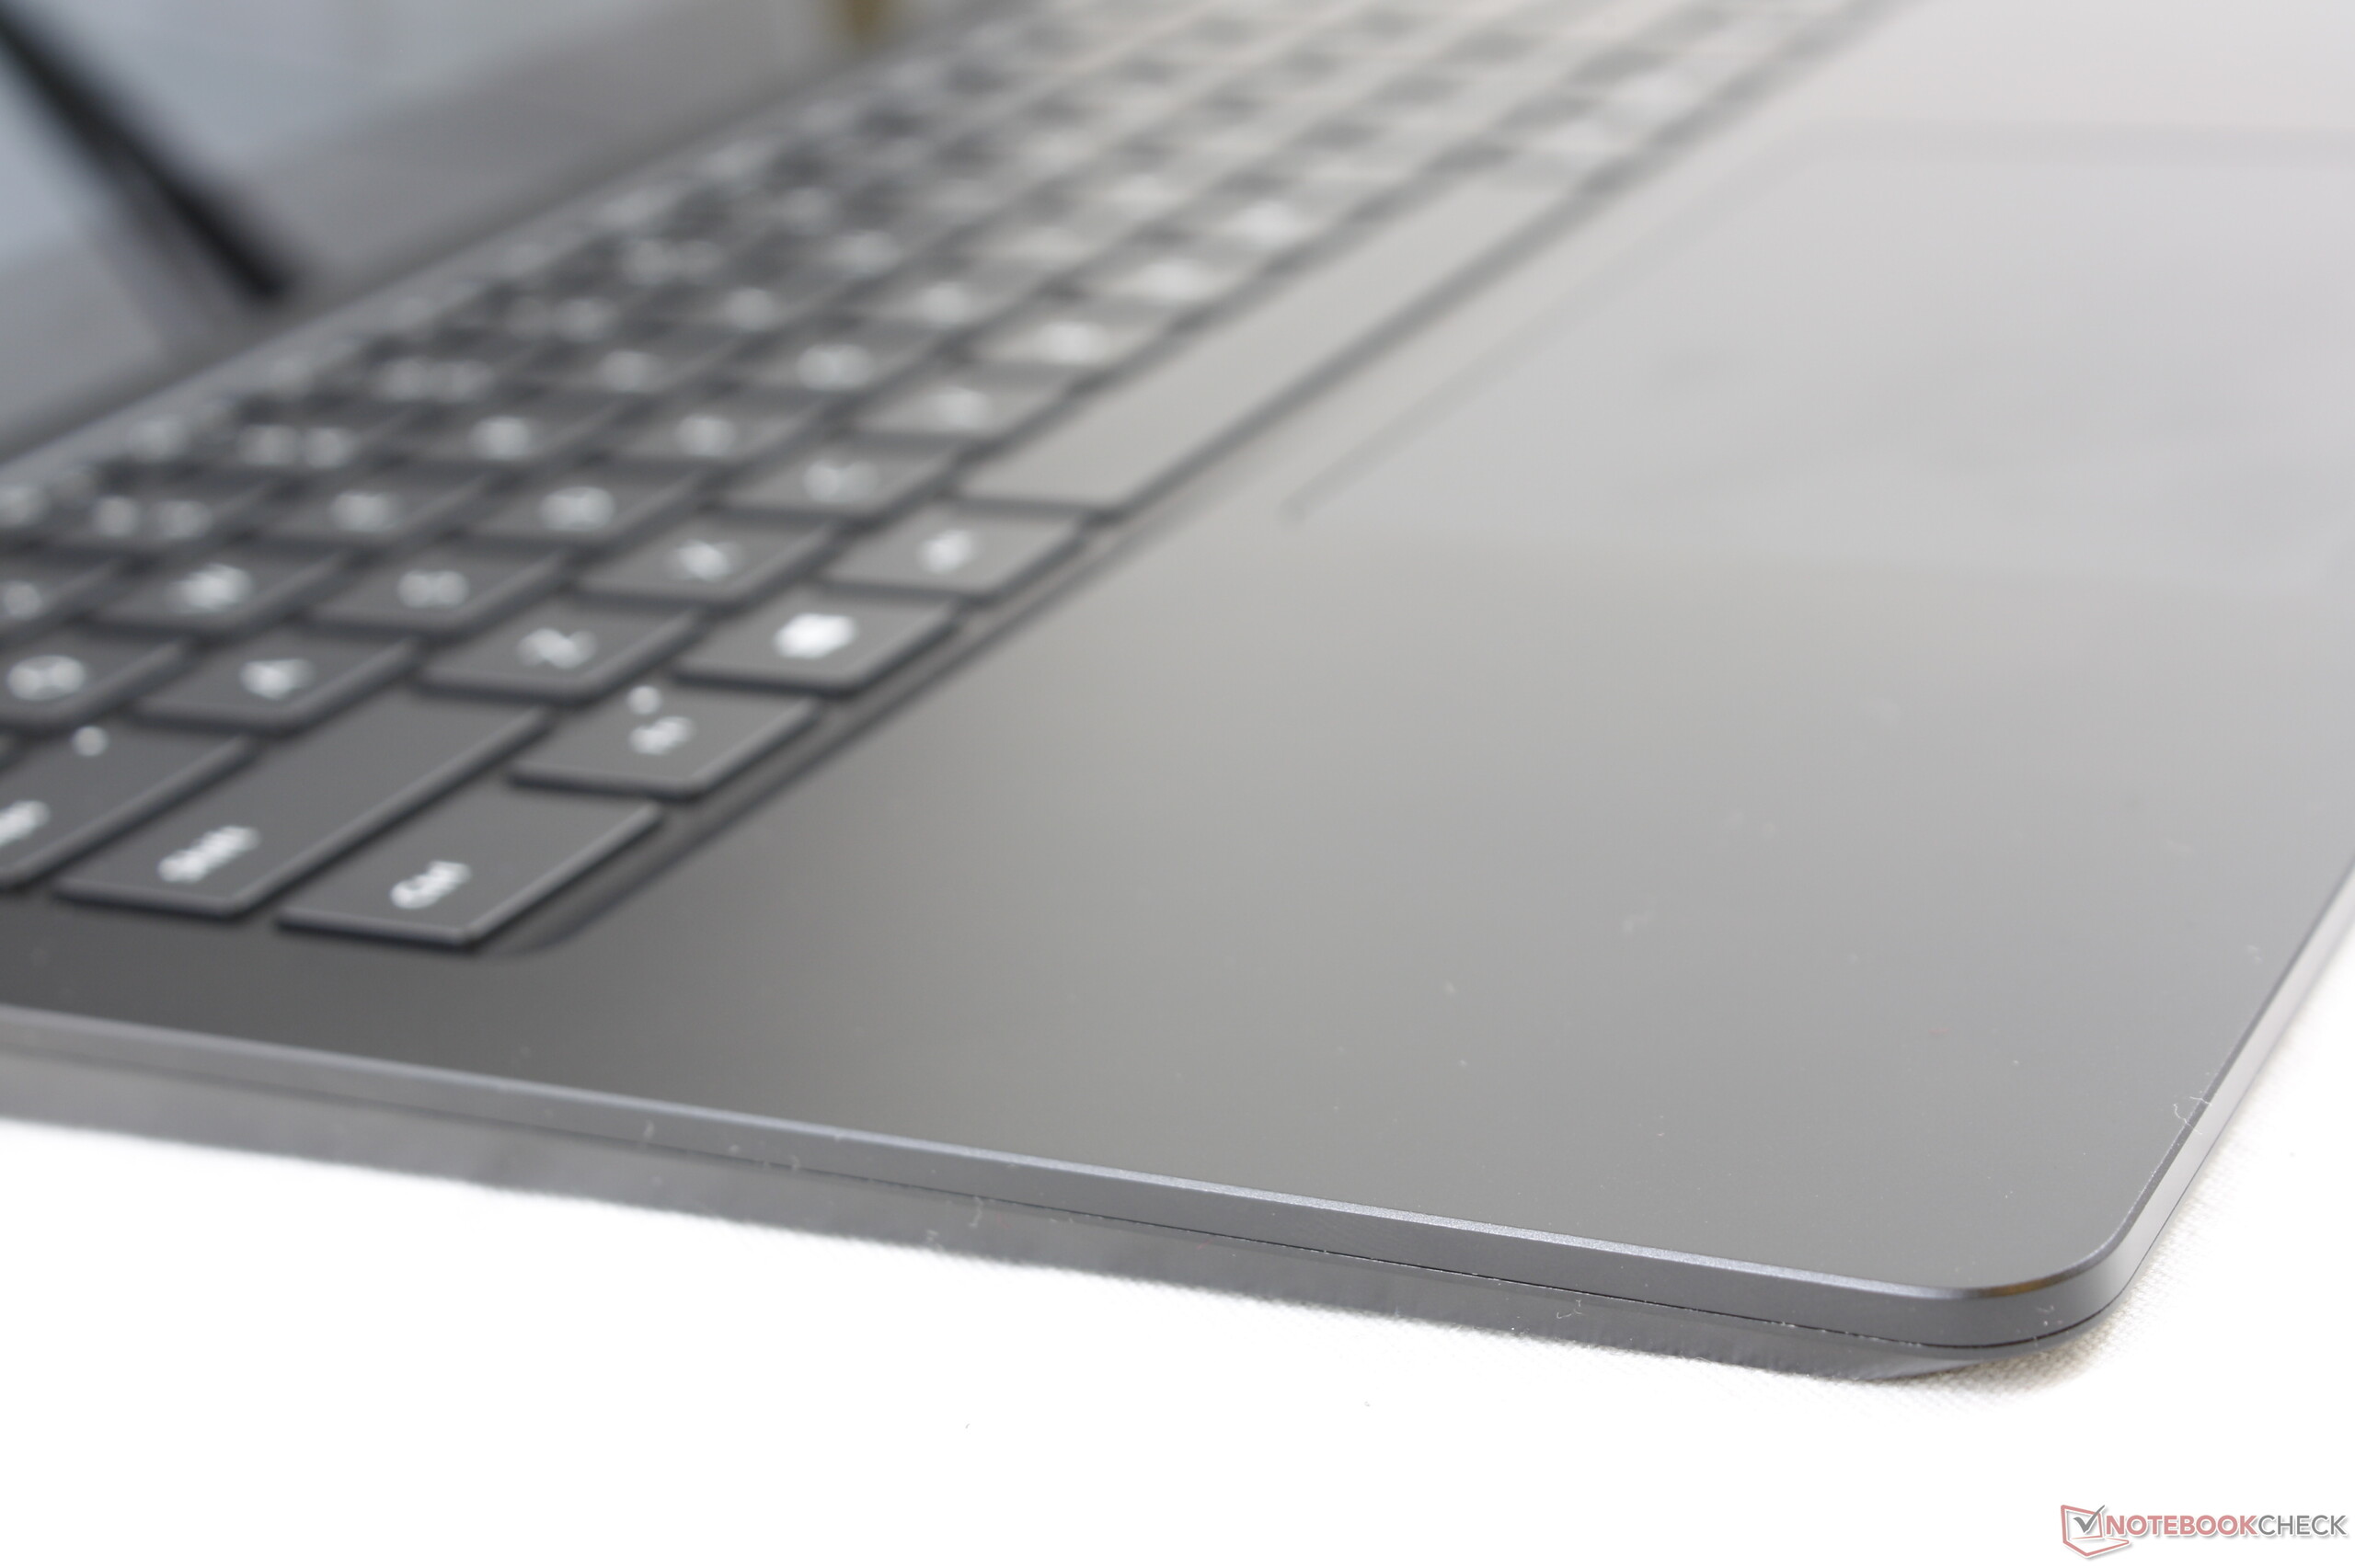
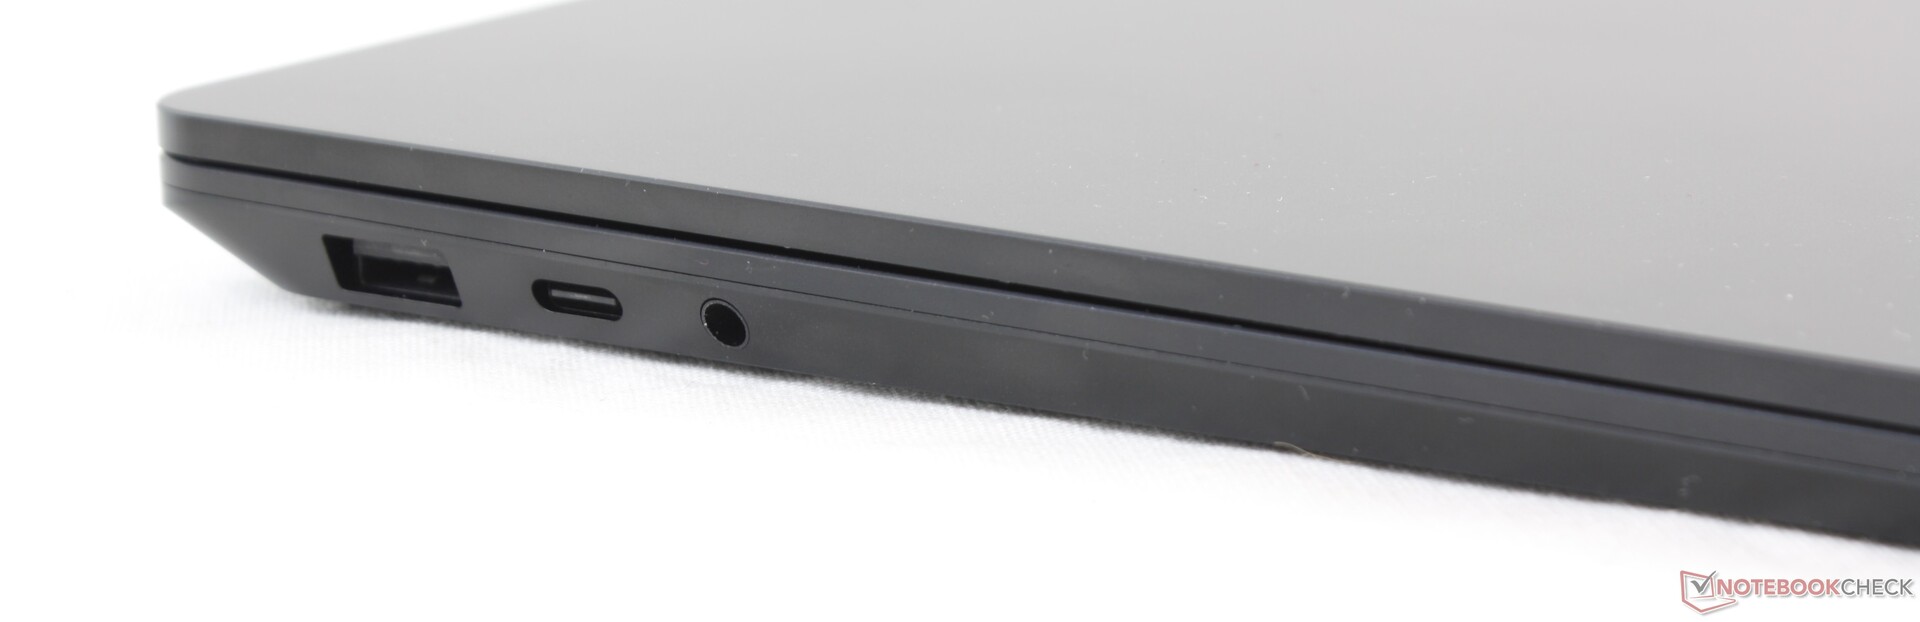
O Surface Laptop 3 está preso entre ser um Ultrabook de consumidor generalista e um portátil profissional, pois não se destaca em nenhuma categoria específica. Ultrabooks mais conhecidos como o Dell XPS 13 2-em-1, HP Spectre 13 ou Huawei MateBook X Pro têm telas mais brilhantes ou GPUs dedicadas mais rápidas que o portátil Microsoft, enquanto portáteis profissionais "adequados" como o Lenovo ThinkPad X1 Carbon ou HP O EliteBook x360 1040 são mais fáceis de reparar e tem portas mais integradas. O sistema se sente barebone e até desatualizado como resultado, apesar de ostentar a mais recente CPU Intel de 10a geração.
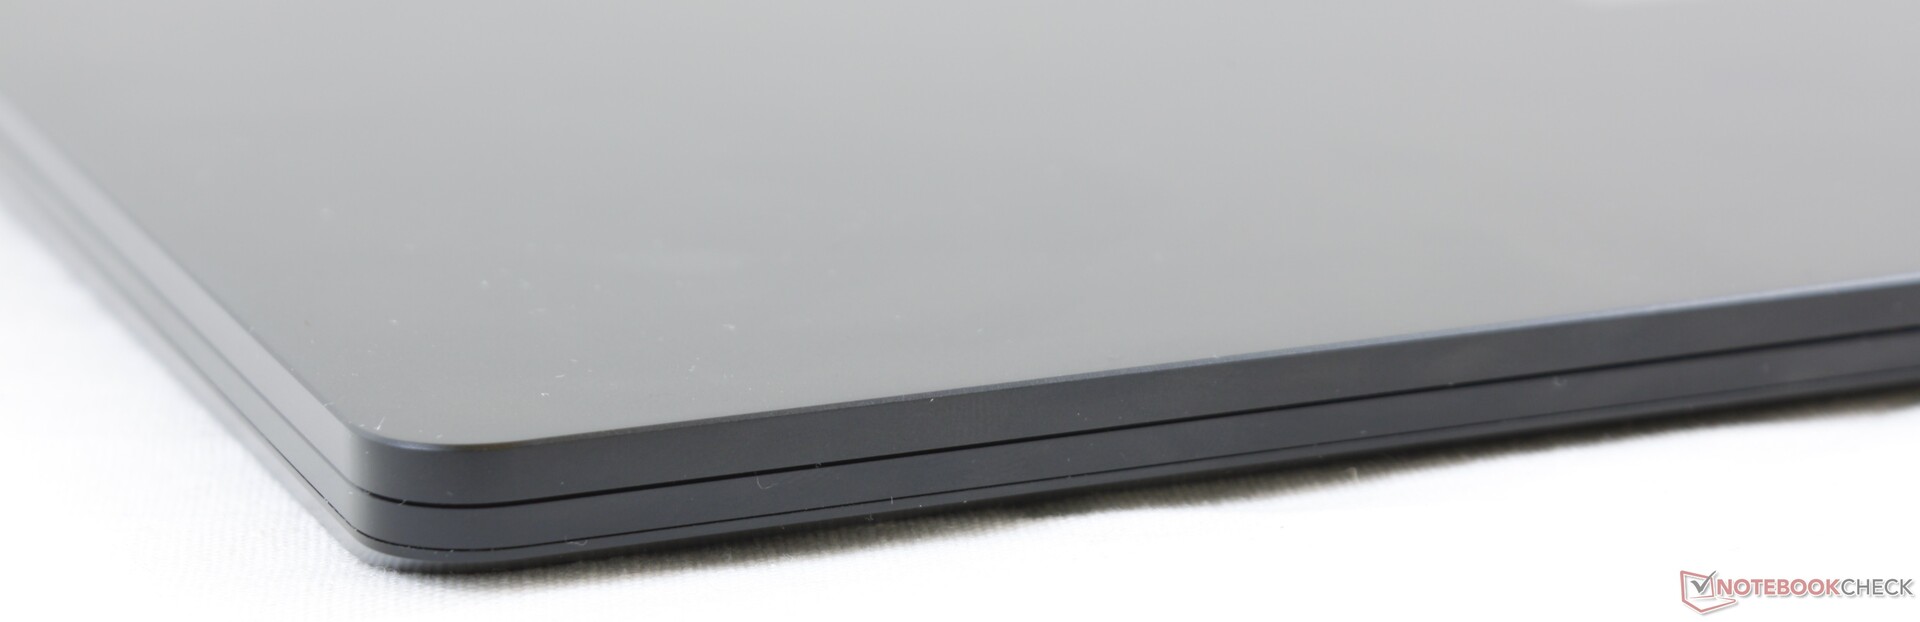
Por outro lado, o que há aqui é excelente, considerando o preço de US$ 1.000. O chassi de metal é mais forte que Alcantara, a tela brilhante é bem calibrada, a qualidade do áudio é boa para o tamanho e o ruído do ventilador é mínimo na maioria das condições. Você pode gostar do Surface Laptop 3 se não se importar com a lista de recursos ausentes, comumente encontrados na maioria dos outros Ultrabooks Windows.
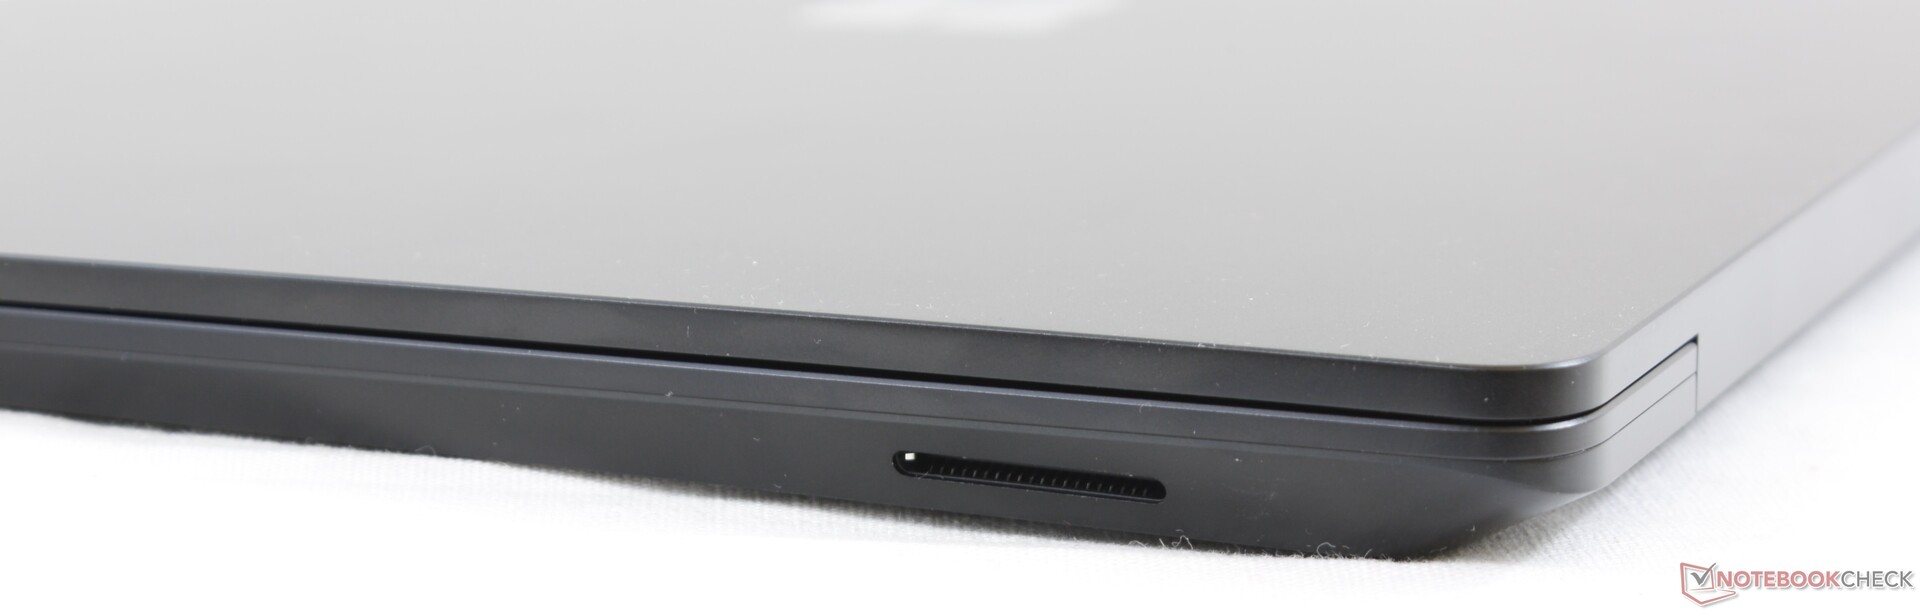
Talvez seja a hora da Microsoft atualizar completamente o design do chassi de três anos e incorporar recursos de hardware mais atraentes. O Huawei MateBook X Pro é uma excelente alternativa ao Surface Laptop 3 de 13,5 polegadas, pois oferece melhor capacidade de manutenção, um tamanho de tela 3:2 maior, gráficos GeForce MX e conectividade Thunderbolt 3 em um chassi menor.
Microsoft Surface Laptop 3 13 Core i5-1035G7
- 02/23/2020 v7 (old)
Allen Ngo
Price comparison
