Breve Análise do Portátil Dell XPS 13 9300 – Menor, mas CPU mais lenta
Avaliação | Data | Modelo | Peso | Altura | Size | Resolução | Preço |
|---|---|---|---|---|---|---|---|
| 88.8 % v7 (old) | 03/2020 | Dell XPS 13 9300 i5 FHD i5-1035G1, UHD Graphics G1 (Ice Lake 32 EU) | 1.2 kg | 14.8 mm | 13.40" | 1920x1200 | |
| 90.6 % v7 (old) | 02/2020 | Apple MacBook Pro 13 2019 2TB3 i5-8257U, Iris Plus Graphics 645 | 1.4 kg | 14.9 mm | 13.30" | 2560x1600 | |
| 87 % v7 (old) | 02/2020 | Acer Swift 3 SF313-52-71Y7 i7-1065G7, Iris Plus Graphics G7 (Ice Lake 64 EU) | 1.2 kg | 16.6 mm | 13.50" | 2256x1504 | |
| 90.3 % v6 (old) | 05/2019 | Lenovo ThinkPad X390-20Q1S02M00 i5-8265U, UHD Graphics 620 | 1.3 kg | 16.9 mm | 13.30" | 1920x1080 | |
| 88 % v6 (old) | 02/2019 | Dell XPS 13 9380 2019 i5-8265U, UHD Graphics 620 | 1.2 kg | 11.6 mm | 13.30" | 3840x2160 | |
| 86.3 % v7 (old) | 10/2019 | Dell XPS 13 7390 2-in-1 Core i7 i7-1065G7, Iris Plus Graphics G7 (Ice Lake 64 EU) | 1.3 kg | 13 mm | 13.40" | 1920x1200 |
| SD Card Reader | |
| average JPG Copy Test (av. of 3 runs) | |
| Dell XPS 13 9380 2019 (Toshiba Exceria Pro SDXC 64 GB UHS-II) | |
| Dell XPS 13 9300 i5 FHD (Toshiba Exceria Pro M501 64 GB UHS-II) | |
| Dell XPS 13 7390 2-in-1 Core i7 (Toshiba Exceria Pro M501 64 GB UHS-II) | |
| Lenovo ThinkPad X390-20Q1S02M00 (Toshiba Exceria Pro M501) | |
| Média da turma Subnotebook (23.7 - 188, n=9, últimos 2 anos) | |
| maximum AS SSD Seq Read Test (1GB) | |
| Dell XPS 13 9300 i5 FHD (Toshiba Exceria Pro M501 64 GB UHS-II) | |
| Dell XPS 13 9380 2019 (Toshiba Exceria Pro SDXC 64 GB UHS-II) | |
| Dell XPS 13 7390 2-in-1 Core i7 (Toshiba Exceria Pro M501 64 GB UHS-II) | |
| Média da turma Subnotebook (24.9 - 195, n=8, últimos 2 anos) | |
| Lenovo ThinkPad X390-20Q1S02M00 (Toshiba Exceria Pro M501) | |

| |||||||||||||||||||||||||
iluminação: 91 %
iluminação com acumulador: 528 cd/m²
Contraste: 1769:1 (Preto: 0.35 cd/m²)
ΔE ColorChecker Calman: 3 | ∀{0.5-29.43 Ø4.71}
calibrated: 1
ΔE Greyscale Calman: 5.2 | ∀{0.09-98 Ø4.96}
99.3% sRGB (Argyll 1.6.3 3D)
66.9% AdobeRGB 1998 (Argyll 1.6.3 3D)
73.5% AdobeRGB 1998 (Argyll 3D)
99.4% sRGB (Argyll 3D)
71.5% Display P3 (Argyll 3D)
Gamma: 2.14
CCT: 6340 K
| Dell XPS 13 9300 i5 FHD SHP14CB, IPS, 1920x1200, 13.4" | Apple MacBook Pro 13 2019 2TB3 APPA03D, IPS, 2560x1600, 13.3" | Acer Swift 3 SF313-52-71Y7 BOE, NE135FBM-N41, IPS, 2256x1504, 13.5" | Lenovo ThinkPad X390-20Q1S02M00 LP133WF7-SPB1, IPS LED, 1920x1080, 13.3" | Dell XPS 13 9380 2019 ID: AUO 282B B133ZAN Dell: 90NTH, IPS, 3840x2160, 13.3" | Dell XPS 13 7390 2-in-1 Core i7 Sharp LQ134N1, IPS, 1920x1200, 13.4" | |
|---|---|---|---|---|---|---|
| Display | 17% | -2% | -7% | -9% | -2% | |
| Display P3 Coverage (%) | 71.5 | 96.1 34% | 70.1 -2% | 65.3 -9% | 64.7 -10% | 69.9 -2% |
| sRGB Coverage (%) | 99.4 | 99.4 0% | 99.8 0% | 95.9 -4% | 93.1 -6% | 99.2 0% |
| AdobeRGB 1998 Coverage (%) | 73.5 | 85.6 16% | 71.2 -3% | 66.6 -9% | 65.3 -11% | 71.5 -3% |
| Response Times | 5% | 8% | 1% | -3% | 17% | |
| Response Time Grey 50% / Grey 80% * (ms) | 60 ? | 50.4 ? 16% | 55 ? 8% | 57.6 ? 4% | 58 ? 3% | 47.6 ? 21% |
| Response Time Black / White * (ms) | 33.2 ? | 35.2 ? -6% | 31 ? 7% | 34 ? -2% | 36 ? -8% | 29.2 ? 12% |
| PWM Frequency (Hz) | 2500 ? | 116300 ? | 208 ? | 2500 ? | ||
| Screen | 18% | -13% | -1% | -22% | 3% | |
| Brightness middle (cd/m²) | 619 | 603 -3% | 474 -23% | 356 -42% | 404 -35% | 549.8 -11% |
| Brightness (cd/m²) | 591 | 577 -2% | 426 -28% | 336 -43% | 389 -34% | 520 -12% |
| Brightness Distribution (%) | 91 | 92 1% | 82 -10% | 88 -3% | 85 -7% | 86 -5% |
| Black Level * (cd/m²) | 0.35 | 0.35 -0% | 0.29 17% | 0.16 54% | 0.37 -6% | 0.39 -11% |
| Contrast (:1) | 1769 | 1723 -3% | 1634 -8% | 2225 26% | 1092 -38% | 1410 -20% |
| Colorchecker dE 2000 * | 3 | 1.7 43% | 2.38 21% | 3.6 -20% | 3.72 -24% | 2.12 29% |
| Colorchecker dE 2000 max. * | 8.2 | 3.1 62% | 5.88 28% | 5.5 33% | 7.38 10% | 3.66 55% |
| Colorchecker dE 2000 calibrated * | 1 | 0.7 30% | 2.69 -169% | 1.1 -10% | 2.06 -106% | 1.37 -37% |
| Greyscale dE 2000 * | 5.2 | 2.1 60% | 3.75 28% | 4.7 10% | 4.44 15% | 2.6 50% |
| Gamma | 2.14 103% | 2.18 101% | 2.37 93% | 2.48 89% | 2.34 94% | 2.3 96% |
| CCT | 6340 103% | 6843 95% | 6466 101% | 6374 102% | 7095 92% | 6884 94% |
| Color Space (Percent of AdobeRGB 1998) (%) | 66.9 | 76.7 15% | 65 -3% | 61.3 -8% | 60 -10% | 65.4 -2% |
| Color Space (Percent of sRGB) (%) | 99.3 | 99.4 0% | 100 1% | 95.7 -4% | 93 -6% | 99.7 0% |
| Média Total (Programa/Configurações) | 13% /
16% | -2% /
-9% | -2% /
-2% | -11% /
-17% | 6% /
4% |
* ... menor é melhor
Exibir tempos de resposta
| ↔ Tempo de resposta preto para branco | ||
|---|---|---|
| 33.2 ms ... ascensão ↗ e queda ↘ combinadas | ↗ 16.4 ms ascensão | 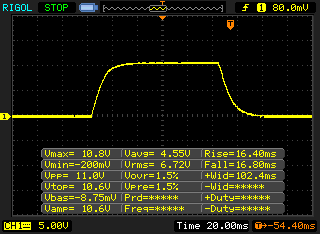 |
| ↘ 16.8 ms queda | ||
| A tela mostra taxas de resposta lentas em nossos testes e será insatisfatória para os jogadores. Em comparação, todos os dispositivos testados variam de 0.1 (mínimo) a 240 (máximo) ms. » 90 % de todos os dispositivos são melhores. Isso significa que o tempo de resposta medido é pior que a média de todos os dispositivos testados (19.8 ms). | ||
| ↔ Tempo de resposta 50% cinza a 80% cinza | ||
| 60 ms ... ascensão ↗ e queda ↘ combinadas | ↗ 28.4 ms ascensão | 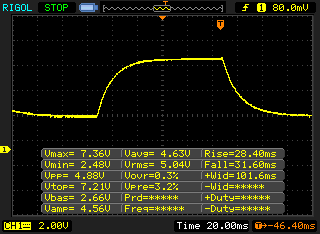 |
| ↘ 31.6 ms queda | ||
| A tela mostra taxas de resposta lentas em nossos testes e será insatisfatória para os jogadores. Em comparação, todos os dispositivos testados variam de 0.165 (mínimo) a 636 (máximo) ms. » 96 % de todos os dispositivos são melhores. Isso significa que o tempo de resposta medido é pior que a média de todos os dispositivos testados (31 ms). | ||
Cintilação da tela / PWM (modulação por largura de pulso)
| Tela tremeluzindo/PWM detectado | 2500 Hz | ≤ 20 % configuração de brilho | 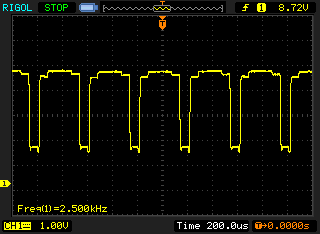 |
A luz de fundo da tela pisca em 2500 Hz (pior caso, por exemplo, utilizando PWM) Cintilação detectada em uma configuração de brilho de 20 % e abaixo. Não deve haver cintilação ou PWM acima desta configuração de brilho. A frequência de 2500 Hz é bastante alta, então a maioria dos usuários sensíveis ao PWM não deve notar nenhuma oscilação. [pwm_comparison] Em comparação: 52 % de todos os dispositivos testados não usam PWM para escurecer a tela. Se PWM foi detectado, uma média de 7757 (mínimo: 5 - máximo: 343500) Hz foi medida. | |||
| PCMark 8 Home Score Accelerated v2 | 3988 pontos | |
| PCMark 8 Creative Score Accelerated v2 | 5194 pontos | |
| PCMark 8 Work Score Accelerated v2 | 4832 pontos | |
| PCMark 10 Score | 4122 pontos | |
Ajuda | ||

| 3DMark 11 Performance | 2875 pontos | |
| 3DMark Ice Storm Standard Score | 60637 pontos | |
| 3DMark Cloud Gate Standard Score | 11119 pontos | |
| 3DMark Fire Strike Score | 1673 pontos | |
| 3DMark Time Spy Score | 542 pontos | |
Ajuda | ||
| baixo | média | alto | ultra | |
|---|---|---|---|---|
| BioShock Infinite (2013) | 74.3 | 46.8 | 40.4 | 14.4 |
| The Witcher 3 (2015) | 35 | 21.6 | 11.5 | |
| Dota 2 Reborn (2015) | 83.4 | 49.7 | 26.2 | 24.2 |
| X-Plane 11.11 (2018) | 21.9 | 14.7 | 14.2 | |
| F1 2019 (2019) | 43 | 17 | 15 |
Barulho
| Ocioso |
| 29.3 / 29.3 / 29.3 dB |
| Carga |
| 30 / 32.4 dB |
 | ||
30 dB silencioso 40 dB(A) audível 50 dB(A) ruidosamente alto |
||
min: | ||
| Dell XPS 13 9300 i5 FHD UHD Graphics G1 (Ice Lake 32 EU), i5-1035G1, Toshiba XG6 KXG60ZNV512G | Apple MacBook Pro 13 2019 2TB3 Iris Plus Graphics 645, i5-8257U, Apple SSD AP0256 | Acer Swift 3 SF313-52-71Y7 Iris Plus Graphics G7 (Ice Lake 64 EU), i7-1065G7, Intel SSD 660p 1TB SSDPEKNW010T8 | Lenovo ThinkPad X390-20Q1S02M00 UHD Graphics 620, i5-8265U, Intel SSD Pro 7600p SSDPEKKF512G8L | Dell XPS 13 9380 2019 UHD Graphics 620, i5-8265U, SK hynix PC401 HFS256GD9TNG | Dell XPS 13 7390 2-in-1 Core i7 Iris Plus Graphics G7 (Ice Lake 64 EU), i7-1065G7, Toshiba BG4 KBG40ZPZ512G | |
|---|---|---|---|---|---|---|
| Noise | -5% | -3% | -4% | -7% | -4% | |
| desligado / ambiente * (dB) | 29.3 | 29.5 -1% | 30.3 -3% | 29.2 -0% | 30.4 -4% | 28.1 4% |
| Idle Minimum * (dB) | 29.3 | 29.5 -1% | 30.3 -3% | 29.2 -0% | 30.4 -4% | 28.1 4% |
| Idle Average * (dB) | 29.3 | 29.5 -1% | 30.3 -3% | 29.2 -0% | 30.4 -4% | 28.1 4% |
| Idle Maximum * (dB) | 29.3 | 29.5 -1% | 30.3 -3% | 29.2 -0% | 30.4 -4% | 28.1 4% |
| Load Average * (dB) | 30 | 31.1 -4% | 31.7 -6% | 34.8 -16% | 31.7 -6% | 31.7 -6% |
| Load Maximum * (dB) | 32.4 | 39.3 -21% | 32.7 -1% | 34.8 -7% | 38.1 -18% | 43.4 -34% |
| Witcher 3 ultra * (dB) | 43.4 |
* ... menor é melhor
(-) A temperatura máxima no lado superior é 50.8 °C / 123 F, em comparação com a média de 35.9 °C / 97 F , variando de 21.4 a 59 °C para a classe Subnotebook.
(±) A parte inferior aquece até um máximo de 42.2 °C / 108 F, em comparação com a média de 39.2 °C / 103 F
(+) Em uso inativo, a temperatura média para o lado superior é 23.6 °C / 74 F, em comparação com a média do dispositivo de 30.8 °C / ### class_avg_f### F.
(+) Os apoios para as mãos e o touchpad são mais frios que a temperatura da pele, com um máximo de 30.1 °C / 86.2 F e, portanto, são frios ao toque.
(±) A temperatura média da área do apoio para as mãos de dispositivos semelhantes foi 28.2 °C / 82.8 F (-1.9 °C / -3.4 F).
Dell XPS 13 9300 i5 FHD análise de áudio
(±) | o volume do alto-falante é médio, mas bom (###valor### dB)
Graves 100 - 315Hz
(±) | graves reduzidos - em média 9.4% menor que a mediana
(±) | a linearidade dos graves é média (12.5% delta para a frequência anterior)
Médios 400 - 2.000 Hz
(±) | médios mais altos - em média 6.7% maior que a mediana
(+) | médios são lineares (5.6% delta para frequência anterior)
Altos 2 - 16 kHz
(+) | agudos equilibrados - apenas 4% longe da mediana
(+) | os máximos são lineares (5% delta da frequência anterior)
Geral 100 - 16.000 Hz
(±) | a linearidade do som geral é média (19.8% diferença em relação à mediana)
Comparado com a mesma classe
» 63% de todos os dispositivos testados nesta classe foram melhores, 7% semelhantes, 31% piores
» O melhor teve um delta de 5%, a média foi 18%, o pior foi 53%
Comparado com todos os dispositivos testados
» 51% de todos os dispositivos testados foram melhores, 7% semelhantes, 42% piores
» O melhor teve um delta de 4%, a média foi 23%, o pior foi 134%
Apple MacBook Pro 13 2019 2TB3 análise de áudio
(±) | o volume do alto-falante é médio, mas bom (###valor### dB)
Graves 100 - 315Hz
(±) | graves reduzidos - em média 10.7% menor que a mediana
(±) | a linearidade dos graves é média (8.7% delta para a frequência anterior)
Médios 400 - 2.000 Hz
(+) | médios equilibrados - apenas 4.6% longe da mediana
(+) | médios são lineares (3.8% delta para frequência anterior)
Altos 2 - 16 kHz
(+) | agudos equilibrados - apenas 2.3% longe da mediana
(+) | os máximos são lineares (4.7% delta da frequência anterior)
Geral 100 - 16.000 Hz
(±) | a linearidade do som geral é média (15.6% diferença em relação à mediana)
Comparado com a mesma classe
» 36% de todos os dispositivos testados nesta classe foram melhores, 5% semelhantes, 58% piores
» O melhor teve um delta de 5%, a média foi 18%, o pior foi 53%
Comparado com todos os dispositivos testados
» 23% de todos os dispositivos testados foram melhores, 5% semelhantes, 72% piores
» O melhor teve um delta de 4%, a média foi 23%, o pior foi 134%
| desligado | |
| Ocioso | |
| Carga |
|
Key:
min: | |
| Dell XPS 13 9300 i5 FHD i5-1035G1, UHD Graphics G1 (Ice Lake 32 EU), Toshiba XG6 KXG60ZNV512G, IPS, 1920x1200, 13.4" | Apple MacBook Pro 13 2019 2TB3 i5-8257U, Iris Plus Graphics 645, Apple SSD AP0256, IPS, 2560x1600, 13.3" | Acer Swift 3 SF313-52-71Y7 i7-1065G7, Iris Plus Graphics G7 (Ice Lake 64 EU), Intel SSD 660p 1TB SSDPEKNW010T8, IPS, 2256x1504, 13.5" | Lenovo ThinkPad X390-20Q1S02M00 i5-8265U, UHD Graphics 620, Intel SSD Pro 7600p SSDPEKKF512G8L, IPS LED, 1920x1080, 13.3" | Dell XPS 13 9380 2019 i5-8265U, UHD Graphics 620, SK hynix PC401 HFS256GD9TNG, IPS, 3840x2160, 13.3" | Dell XPS 13 7390 2-in-1 Core i7 i7-1065G7, Iris Plus Graphics G7 (Ice Lake 64 EU), Toshiba BG4 KBG40ZPZ512G, IPS, 1920x1200, 13.4" | Média Intel UHD Graphics G1 (Ice Lake 32 EU) | Média da turma Subnotebook | |
|---|---|---|---|---|---|---|---|---|
| Power Consumption | 0% | 36% | -6% | -18% | 10% | 1% | -9% | |
| Idle Minimum * (Watt) | 3.4 | 2.1 38% | 1.8 47% | 3.4 -0% | 4.8 -41% | 2.6 24% | 4.13 ? -21% | 3.76 ? -11% |
| Idle Average * (Watt) | 6 | 6.9 -15% | 4.6 23% | 5.6 7% | 8.6 -43% | 5.3 12% | 7.07 ? -18% | 6.54 ? -9% |
| Idle Maximum * (Watt) | 10.2 | 7.8 24% | 6.1 40% | 8.7 15% | 10.4 -2% | 7 31% | 8.36 ? 18% | 7.89 ? 23% |
| Load Average * (Watt) | 36.6 | 42 -15% | 27.4 25% | 43.6 -19% | 37.9 -4% | 43.1 -18% | 30.6 ? 16% | 42 ? -15% |
| Load Maximum * (Watt) | 49.3 | 64.5 -31% | 27 45% | 65 -32% | 48.5 2% | 49 1% | 45.6 ? 8% | 64.8 ? -31% |
| Witcher 3 ultra * (Watt) | 43.1 |
* ... menor é melhor
| Dell XPS 13 9300 i5 FHD i5-1035G1, UHD Graphics G1 (Ice Lake 32 EU), 52 Wh | Apple MacBook Pro 13 2019 2TB3 i5-8257U, Iris Plus Graphics 645, 58.2 Wh | Acer Swift 3 SF313-52-71Y7 i7-1065G7, Iris Plus Graphics G7 (Ice Lake 64 EU), 54.5 Wh | Lenovo ThinkPad X390-20Q1S02M00 i5-8265U, UHD Graphics 620, 48 Wh | Dell XPS 13 9380 2019 i5-8265U, UHD Graphics 620, 52 Wh | Dell XPS 13 7390 2-in-1 Core i7 i7-1065G7, Iris Plus Graphics G7 (Ice Lake 64 EU), 51 Wh | Média da turma Subnotebook | |
|---|---|---|---|---|---|---|---|
| Duração da bateria | 11% | -24% | -31% | -29% | -23% | -5% | |
| H.264 (h) | 14.4 | 10.5 -27% | 12.7 -12% | 15.4 ? 7% | |||
| WiFi v1.3 (h) | 11.7 | 13 11% | 10.3 -12% | 8.3 -29% | 8.3 -29% | 9 -23% | 14 ? 20% |
| Load (h) | 3.4 | 2.3 -32% | 1.6 -53% | 2.4 -29% | 1.969 ? -42% | ||
| Reader / Idle (h) | 21.4 | 17.2 | 28.6 ? |
Pro
Contra
Veredicto – O XPS 13 9300 é melhor do que antes, mas também mais caro
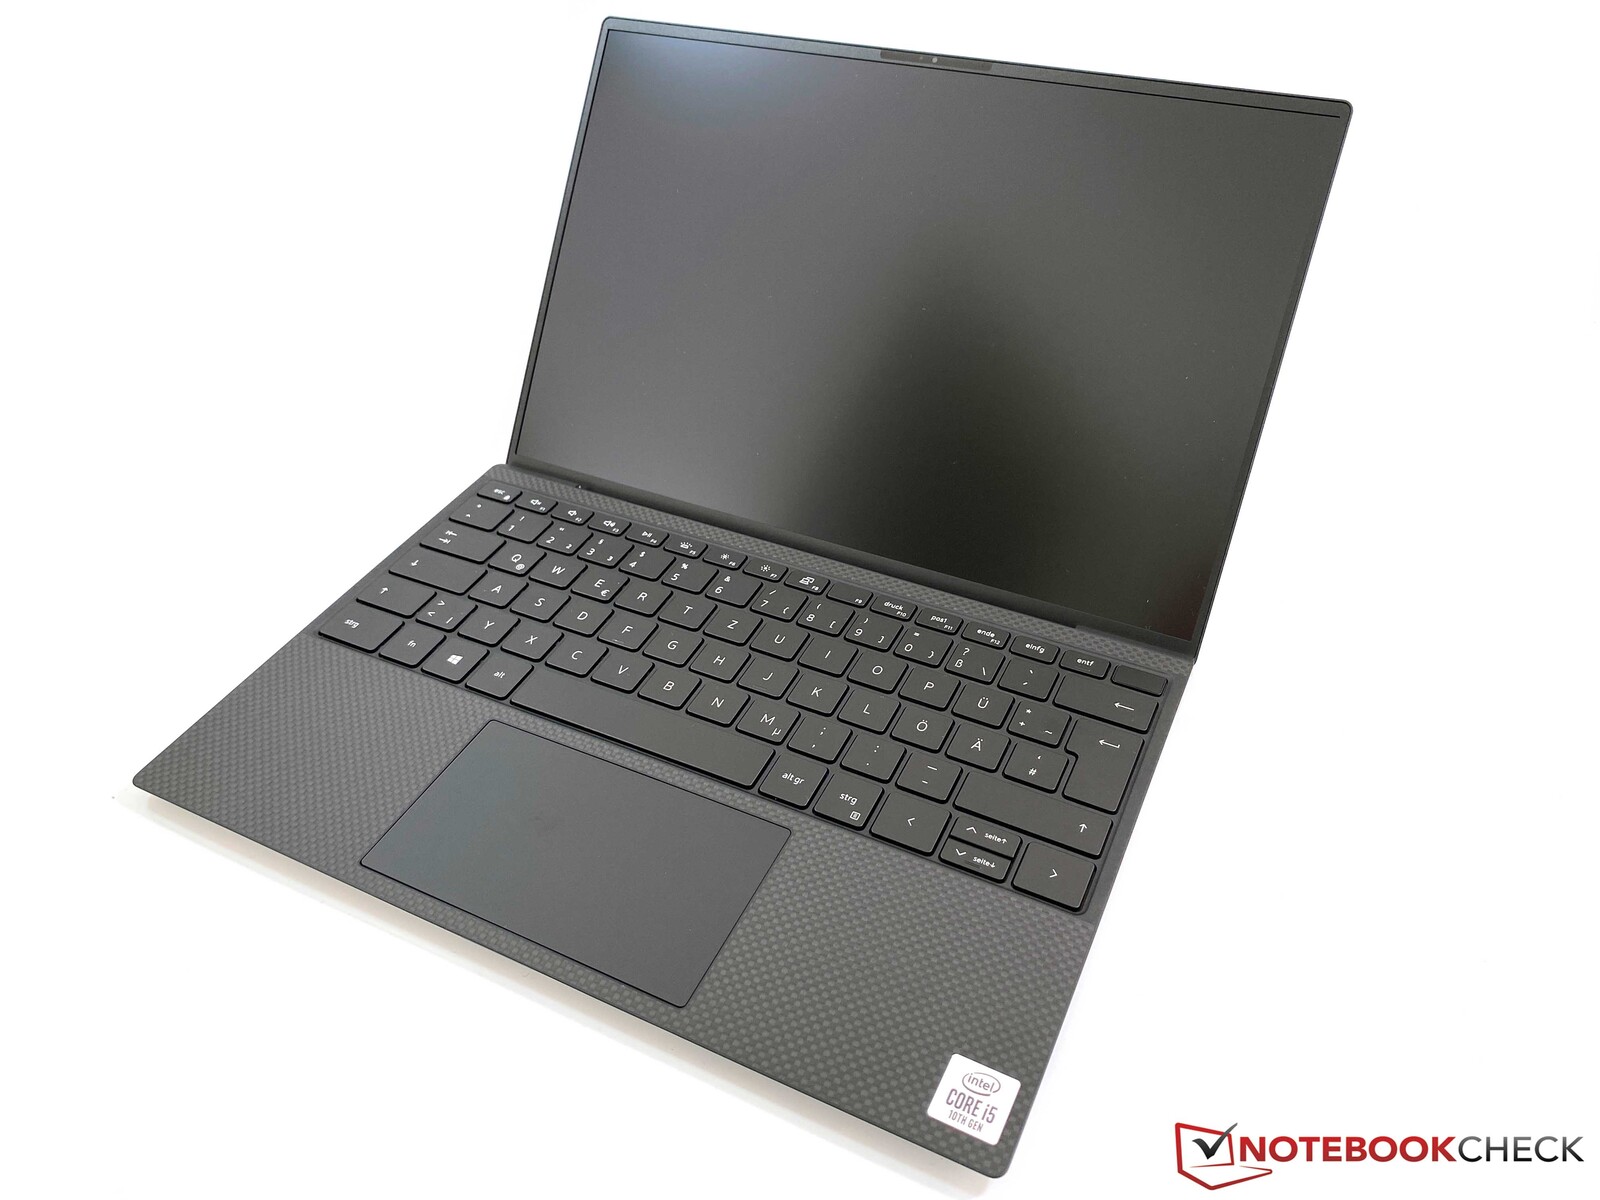
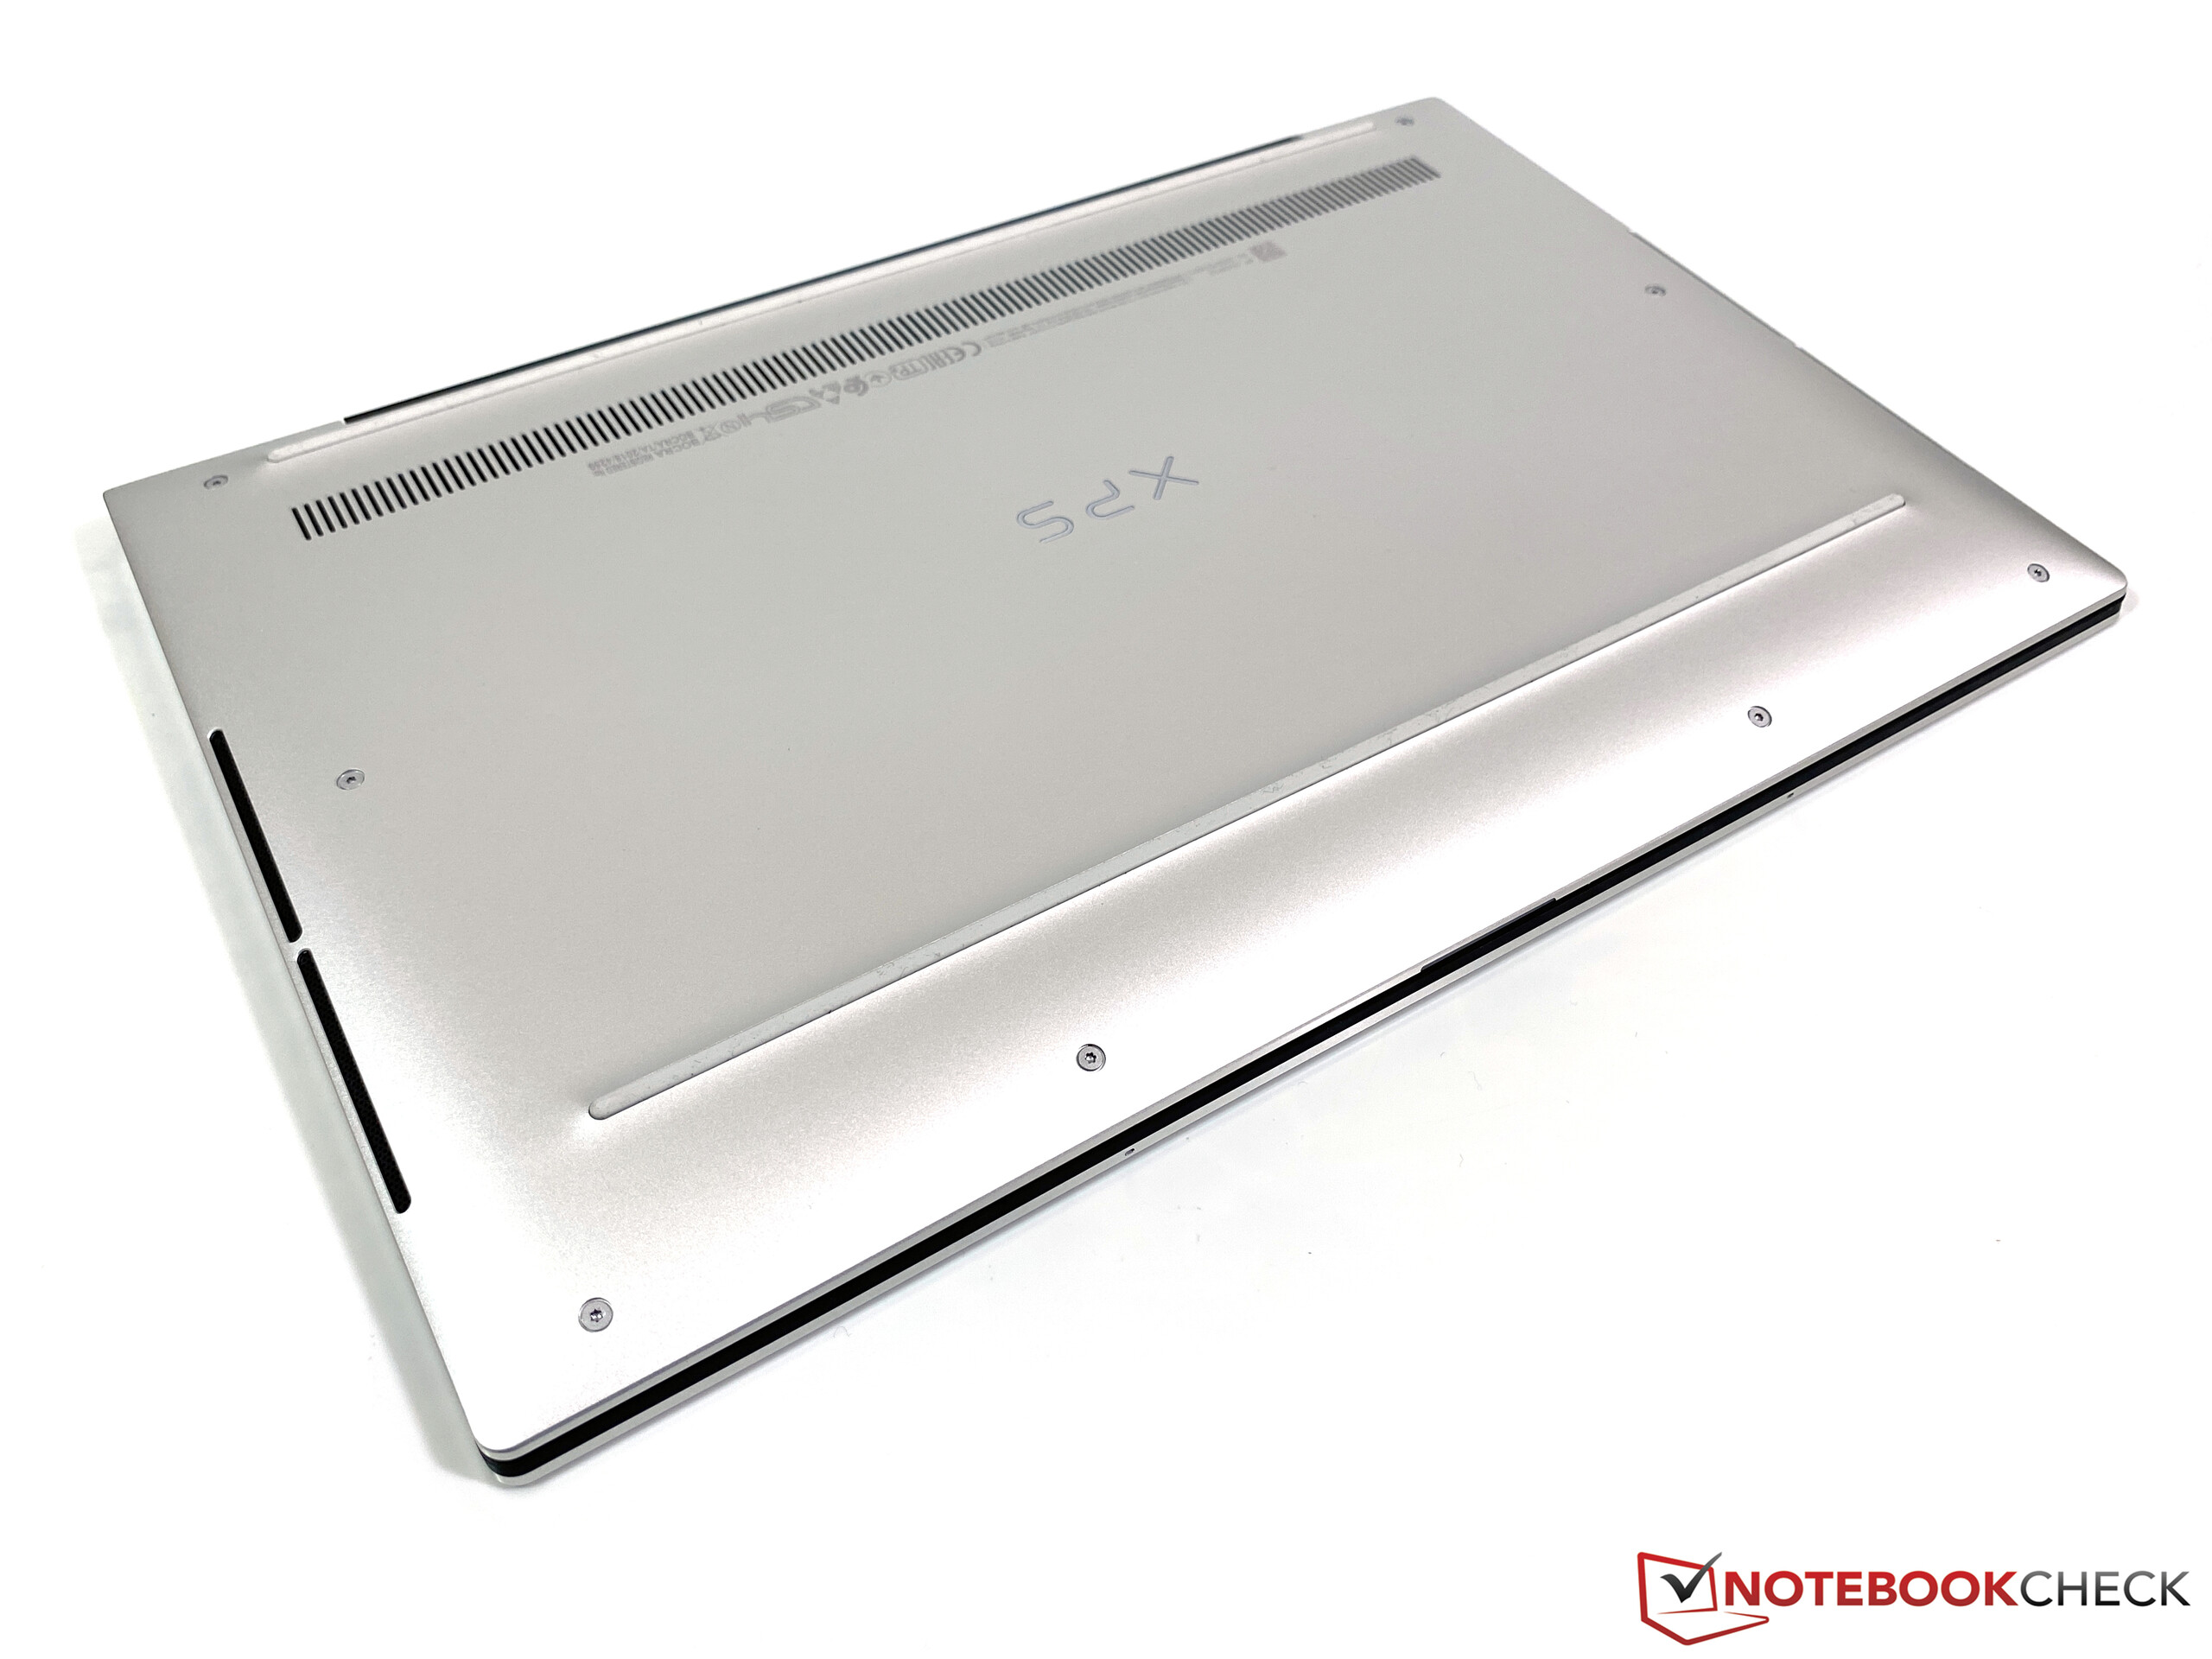
No geral, o novo XPS 13 9300 deixa uma impressão muito boa em nossa análise. A carcaça é bem construída, extremamente compacta e resistente ao mesmo tempo. A tela mate 16:10 pode nos convencer a esperar pelos tempos de resposta lentos, mas recomendamos calibrá-la. Os dois alto-falantes também são completamente suficientes.
O desempenho é uma faca de dois gumes, porque o desempenho da CPU é mais baixo em comparação com o antecessor. Esse certamente não é um desenvolvimento ideal, mas, para ser justo, o desempenho do Core i5 ainda será mais do que suficiente para muitos usuários, especialmente em combinação com o rápido SSD. O desempenho da iGPU também aumentou, para que você possa jogar alguns jogos. Isso nos leva ao Core i7 opcional com a iGPU ainda mais rápida. Não deve haver uma vantagem em termos de desempenho bruto da CPU, mas a iGPU é uma atualização significativa e vale a pena dar uma olhada.
O novo XPS 13 9300 da Dell é um sucessor muito bom para o popular subportátil. Não encontramos nenhuma desvantagem séria durante nossa análise, mas o novo modelo não é uma pechincha a um preço básico de 1.500 Euros (~$ 1.614).
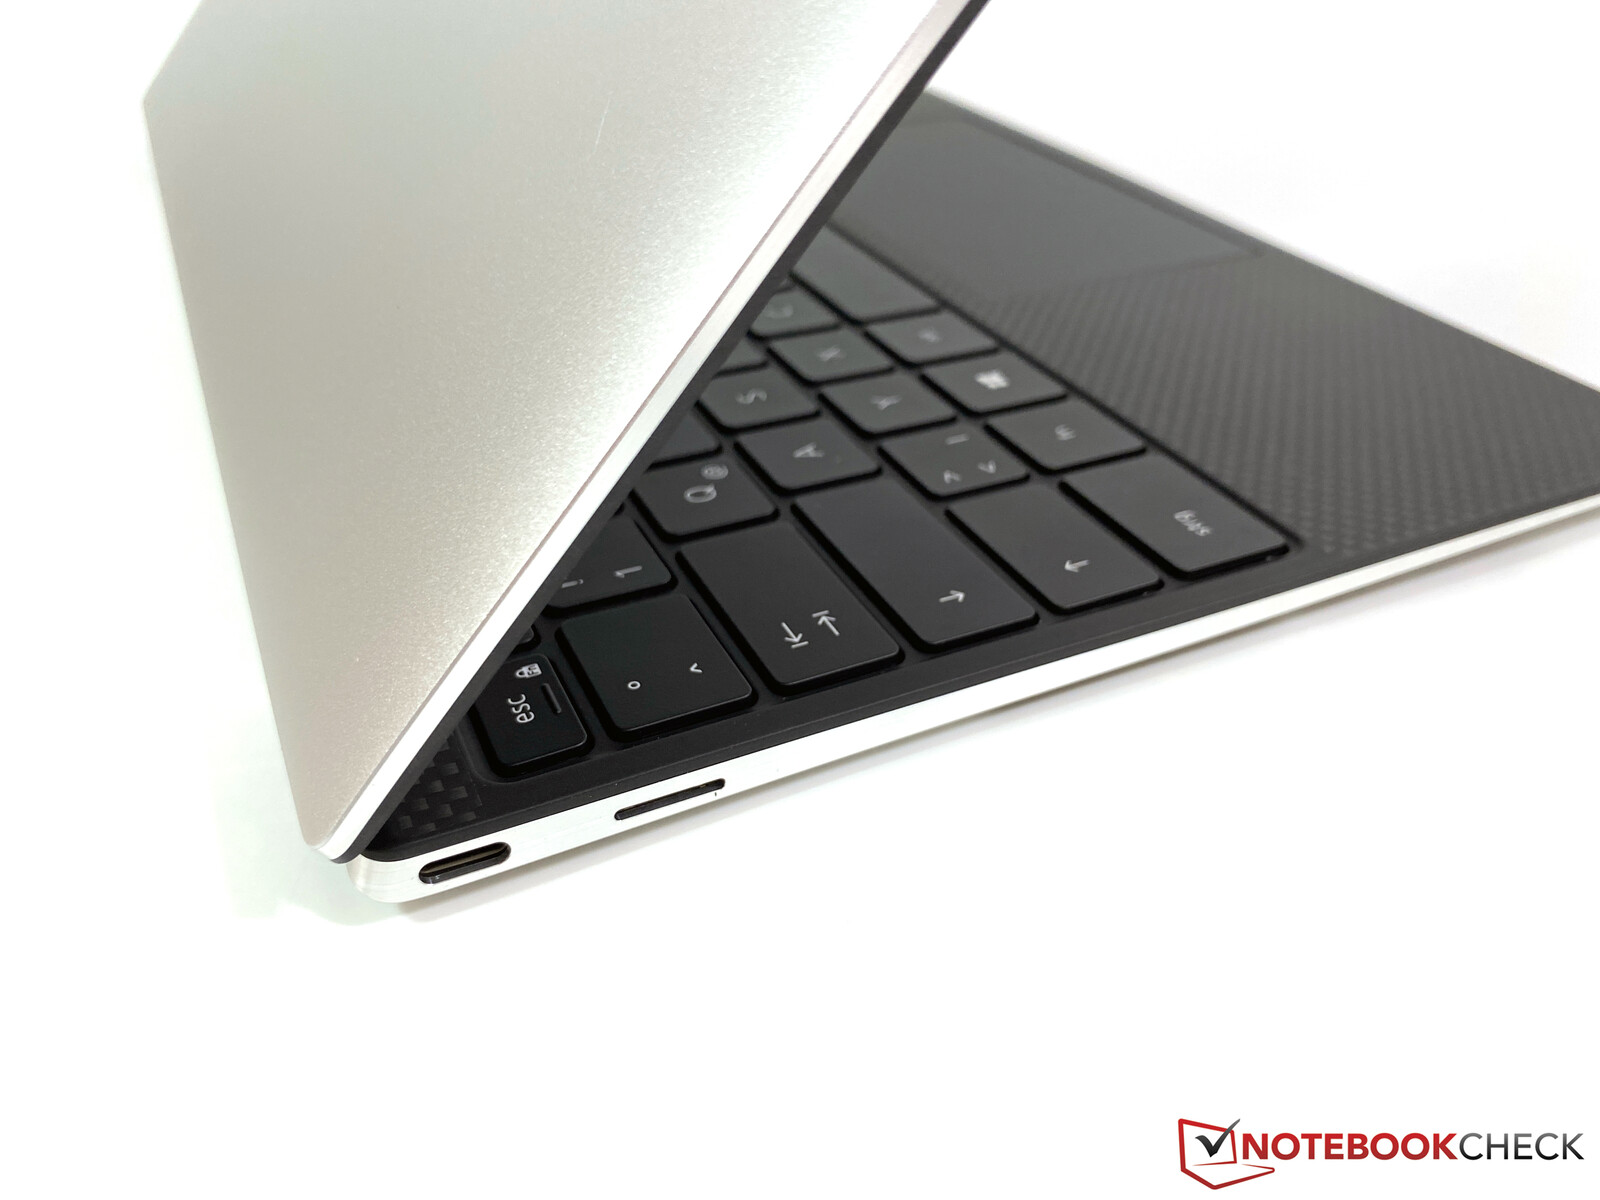
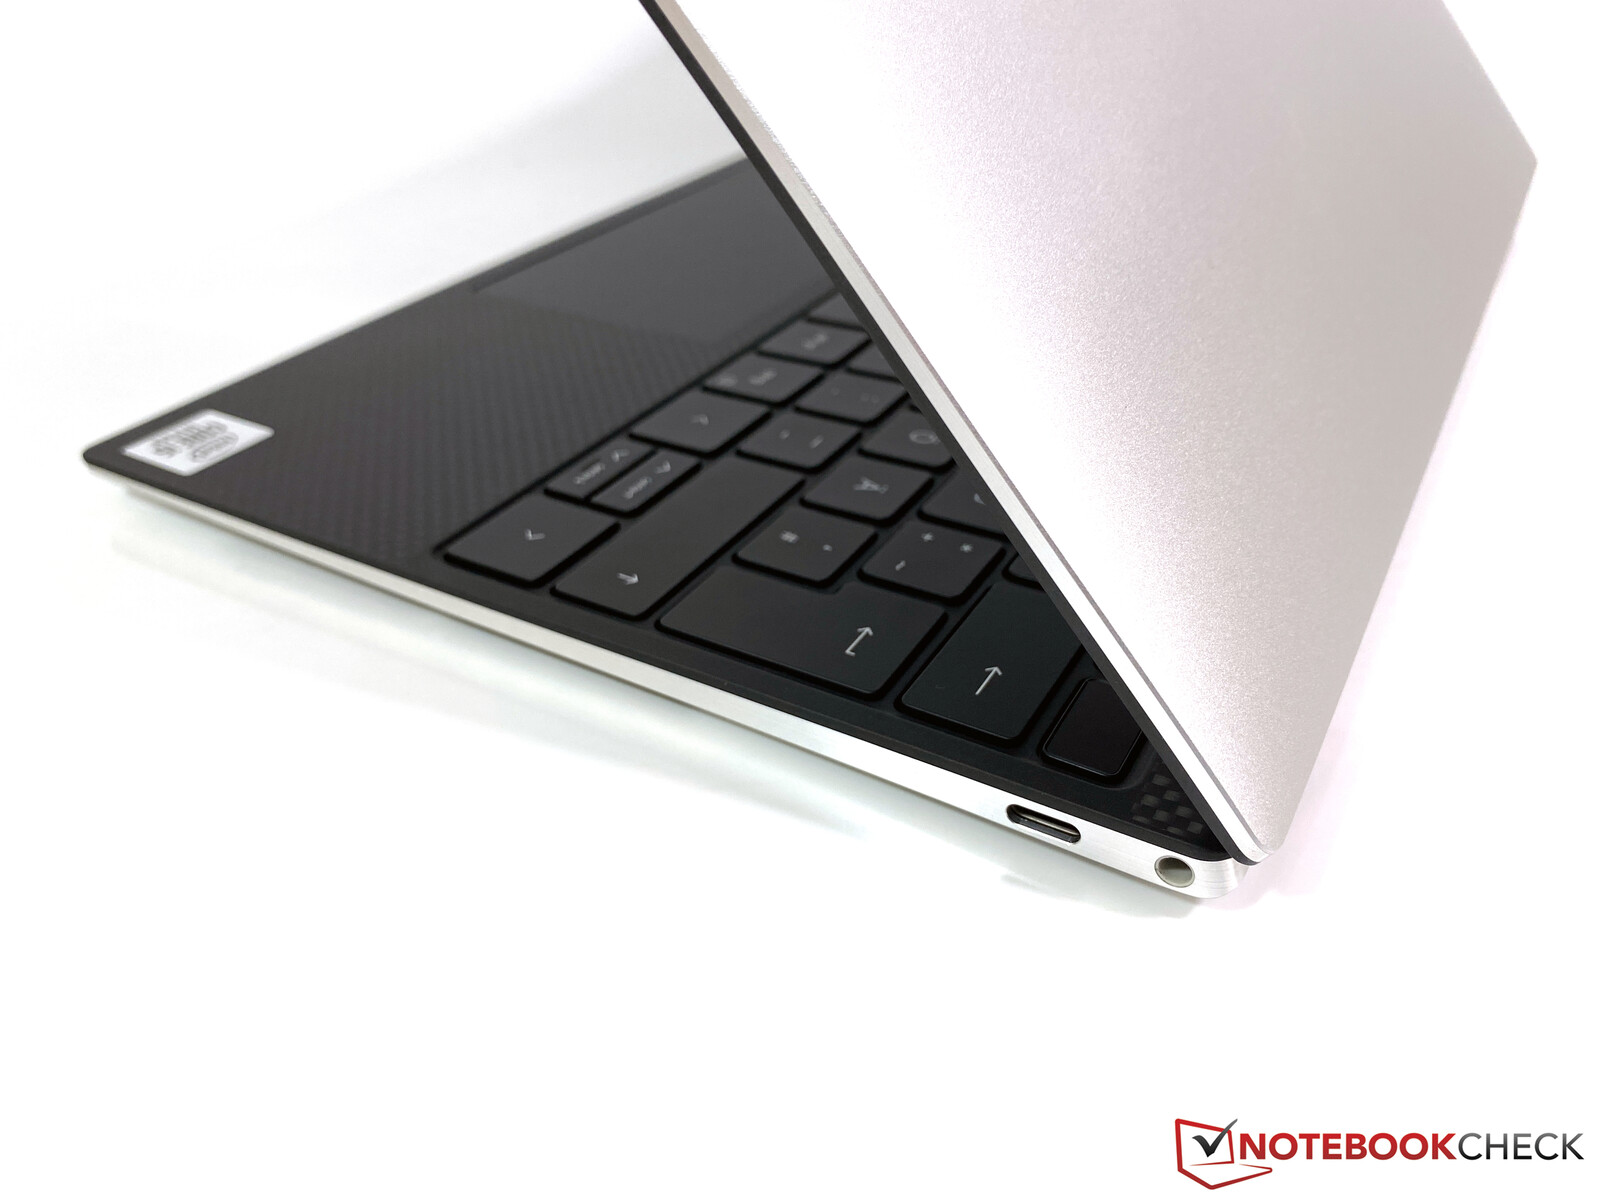
O retorno à tela 16:10 é um movimento valorizado e também gostamos do rápido leitor de cartão, mas gostaríamos de ver mais uma porta USB. Também analisaremos o XPS 13 9300 com o Core i7 mais rápido e o painel UHD, em breve.
Dell XPS 13 9300 i5 FHD
- 03/19/2020 v7 (old)
Andreas Osthoff
Price comparison
