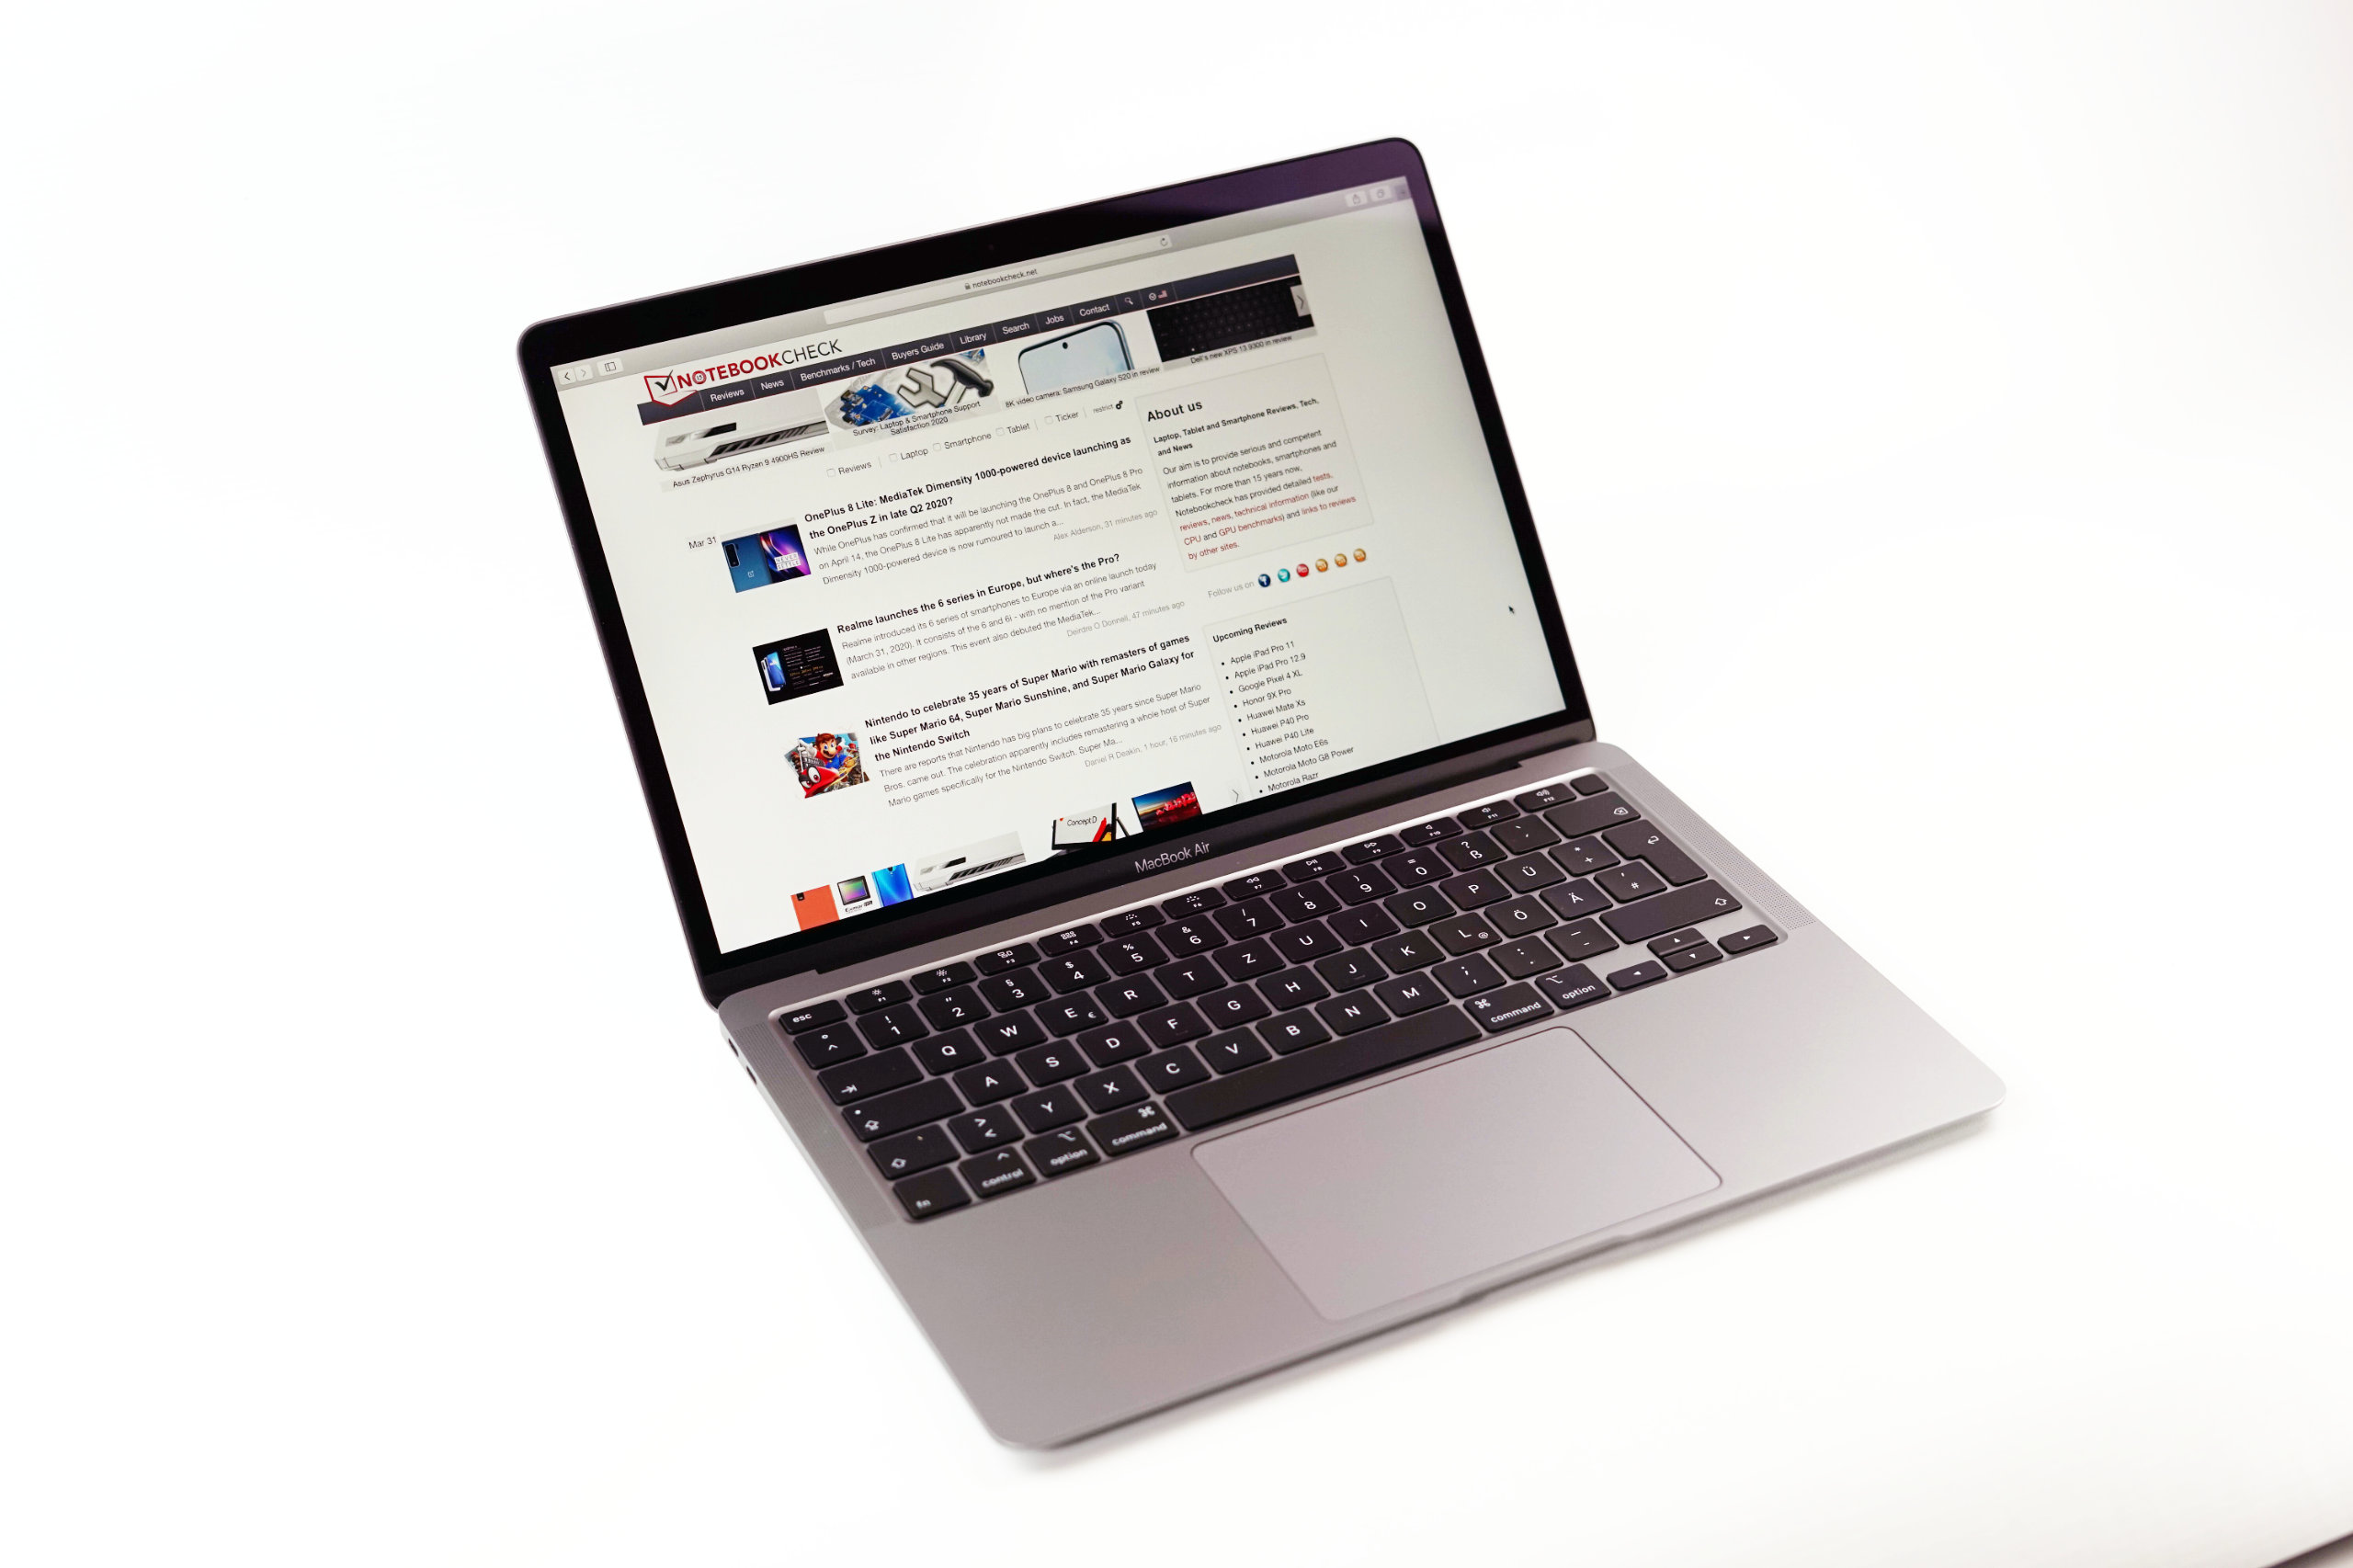
Breve Análise do Apple MacBook Air 2020 Core i5 – O melhor MacBook que pode conseguir? – Não
Avaliação | Data | Modelo | Peso | Altura | Size | Resolução | Preço |
|---|---|---|---|---|---|---|---|
| 88 % v7 (old) | 04/2020 | Apple MacBook Air 2020 i5 i5-1030NG7, Iris Plus Graphics G7 (Ice Lake 64 EU) | 1.3 kg | 16.1 mm | 13.30" | 2560x1600 | |
| 85.6 % v7 (old) | 08/2019 | Apple Macbook Air 2019 i5-8210Y, UHD Graphics 617 | 1.3 kg | 15.6 mm | 13.30" | 2560x1600 | |
| 90.6 % v7 (old) | 02/2020 | Apple MacBook Pro 13 2019 2TB3 i5-8257U, Iris Plus Graphics 645 | 1.4 kg | 14.9 mm | 13.30" | 2560x1600 | |
| 84 % v7 (old) | 03/2020 | Microsoft Surface Laptop 3 13 Core i5-1035G7 i5-1035G7, Iris Plus Graphics G7 (Ice Lake 64 EU) | 1.3 kg | 14.5 mm | 13.50" | 2256x1504 | |
| 87 % v7 (old) | 02/2020 | Acer Swift 3 SF313-52-71Y7 i7-1065G7, Iris Plus Graphics G7 (Ice Lake 64 EU) | 1.2 kg | 16.6 mm | 13.50" | 2256x1504 | |
| 88.8 % v7 (old) | 03/2020 | Dell XPS 13 9300 i5 FHD i5-1035G1, UHD Graphics G1 (Ice Lake 32 EU) | 1.2 kg | 14.8 mm | 13.40" | 1920x1200 |


, i5-1030NG7, Apple SSD AP0512")
, i5-1030NG7, Apple SSD AP0512")
| |||||||||||||||||||||||||
iluminação: 89 %
iluminação com acumulador: 427 cd/m²
Contraste: 1344:1 (Preto: 0.32 cd/m²)
ΔE ColorChecker Calman: 1.8 | ∀{0.5-29.43 Ø4.72}
calibrated: 1.6
ΔE Greyscale Calman: 1.1 | ∀{0.09-98 Ø4.97}
98.3% sRGB (Calman 2D)
97.6% sRGB (Argyll 1.6.3 3D)
64.2% AdobeRGB 1998 (Argyll 1.6.3 3D)
71.7% AdobeRGB 1998 (Argyll 3D)
97.7% sRGB (Argyll 3D)
70.4% Display P3 (Argyll 3D)
CCT: 6644 K
| Apple MacBook Air 2020 i5 APPA042, IPS, 2560x1600, 13.3" | Apple Macbook Air 2019 APPA041, IPS, 2560x1600, 13.3" | Apple MacBook Pro 13 2019 2TB3 APPA03D, IPS, 2560x1600, 13.3" | Microsoft Surface Laptop 3 13 Core i5-1035G7 Sharp LQ135P1JX51, IPS, 2256x1504, 13.5" | Acer Swift 3 SF313-52-71Y7 BOE, NE135FBM-N41, IPS, 2256x1504, 13.5" | Dell XPS 13 9300 i5 FHD SHP14CB, IPS, 1920x1200, 13.4" | |
|---|---|---|---|---|---|---|
| Display | -4% | 19% | -4% | 0% | 2% | |
| Display P3 Coverage (%) | 70.4 | 67.4 -4% | 96.1 37% | 65.7 -7% | 70.1 0% | 71.5 2% |
| sRGB Coverage (%) | 97.7 | 94.7 -3% | 99.4 2% | 98.6 1% | 99.8 2% | 99.4 2% |
| AdobeRGB 1998 Coverage (%) | 71.7 | 69.1 -4% | 85.6 19% | 67.8 -5% | 71.2 -1% | 73.5 3% |
| Response Times | -4% | -23% | -45% | -22% | -32% | |
| Response Time Grey 50% / Grey 80% * (ms) | 38.7 ? | 42.4 ? -10% | 50.4 ? -30% | 59.2 ? -53% | 55 ? -42% | 60 ? -55% |
| Response Time Black / White * (ms) | 30.44 ? | 29.6 ? 3% | 35.2 ? -16% | 41.6 ? -37% | 31 ? -2% | 33.2 ? -9% |
| PWM Frequency (Hz) | 117000 ? | 111100 ? | 116300 ? | 21740 ? | 208 ? | 2500 ? |
| Screen | -0% | 12% | 10% | -30% | -33% | |
| Brightness middle (cd/m²) | 430 | 421 -2% | 603 40% | 403.4 -6% | 474 10% | 619 44% |
| Brightness (cd/m²) | 405 | 393 -3% | 577 42% | 397 -2% | 426 5% | 591 46% |
| Brightness Distribution (%) | 89 | 88 -1% | 92 3% | 89 0% | 82 -8% | 91 2% |
| Black Level * (cd/m²) | 0.32 | 0.34 -6% | 0.35 -9% | 0.34 -6% | 0.29 9% | 0.35 -9% |
| Contrast (:1) | 1344 | 1238 -8% | 1723 28% | 1186 -12% | 1634 22% | 1769 32% |
| Colorchecker dE 2000 * | 1.8 | 1.5 17% | 1.7 6% | 0.94 48% | 2.38 -32% | 3 -67% |
| Colorchecker dE 2000 max. * | 4.6 | 3.8 17% | 3.1 33% | 2.92 37% | 5.88 -28% | 8.2 -78% |
| Colorchecker dE 2000 calibrated * | 1.6 | 0.7 56% | 0.99 38% | 2.69 -68% | 1 37% | |
| Greyscale dE 2000 * | 1.1 | 1.2 -9% | 2.1 -91% | 0.9 18% | 3.75 -241% | 5.2 -373% |
| CCT | 6644 98% | 6694 97% | 6843 95% | 6620 98% | 6466 101% | 6340 103% |
| Color Space (Percent of AdobeRGB 1998) (%) | 64.2 | 61.3 -5% | 76.7 19% | 62.3 -3% | 65 1% | 66.9 4% |
| Color Space (Percent of sRGB) (%) | 97.6 | 94.6 -3% | 99.4 2% | 98.7 1% | 100 2% | 99.3 2% |
| Gamma | 2.21 100% | 2.18 101% | 2.13 103% | 2.37 93% | 2.14 103% | |
| Média Total (Programa/Configurações) | -3% /
-1% | 3% /
9% | -13% /
1% | -17% /
-23% | -21% /
-26% |
* ... menor é melhor

Exibir tempos de resposta
| ↔ Tempo de resposta preto para branco | ||
|---|---|---|
| 30.44 ms ... ascensão ↗ e queda ↘ combinadas | ↗ 17.9 ms ascensão | 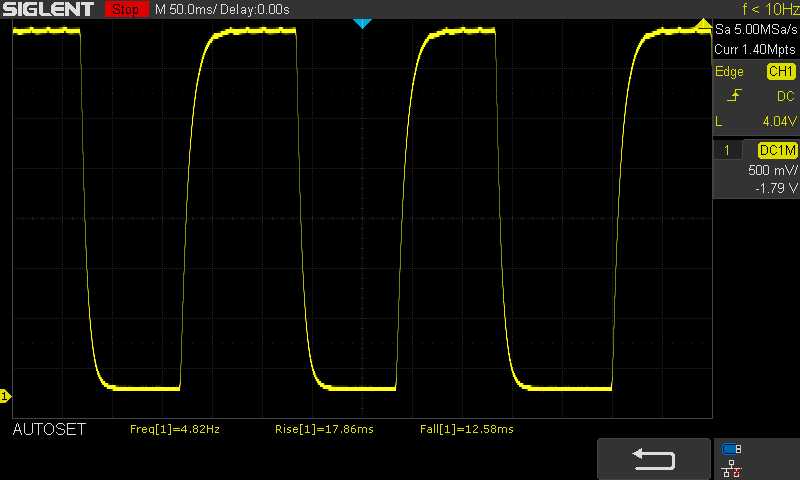 |
| ↘ 12.6 ms queda | ||
| A tela mostra taxas de resposta lentas em nossos testes e será insatisfatória para os jogadores. Em comparação, todos os dispositivos testados variam de 0.1 (mínimo) a 240 (máximo) ms. » 83 % de todos os dispositivos são melhores. Isso significa que o tempo de resposta medido é pior que a média de todos os dispositivos testados (19.8 ms). | ||
| ↔ Tempo de resposta 50% cinza a 80% cinza | ||
| 38.7 ms ... ascensão ↗ e queda ↘ combinadas | ↗ 19.6 ms ascensão | 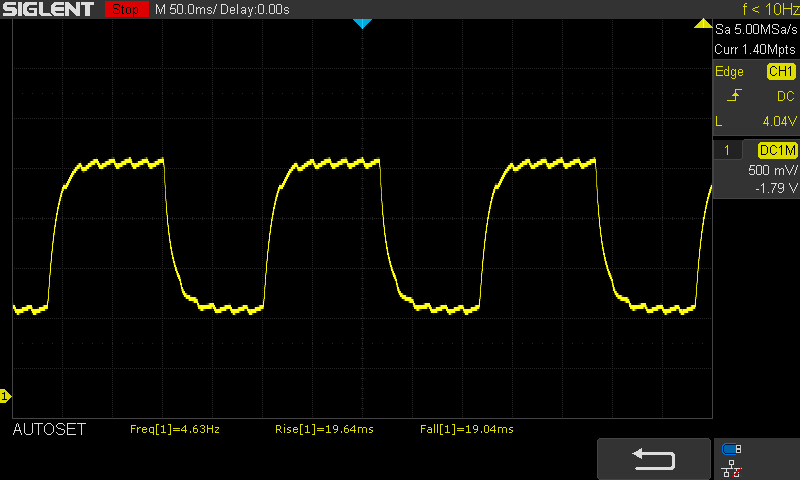 |
| ↘ 19 ms queda | ||
| A tela mostra taxas de resposta lentas em nossos testes e será insatisfatória para os jogadores. Em comparação, todos os dispositivos testados variam de 0.165 (mínimo) a 636 (máximo) ms. » 58 % de todos os dispositivos são melhores. Isso significa que o tempo de resposta medido é pior que a média de todos os dispositivos testados (31 ms). | ||
Cintilação da tela / PWM (modulação por largura de pulso)
| Tela tremeluzindo/PWM detectado | 117000 Hz | ≤ 75 % configuração de brilho | 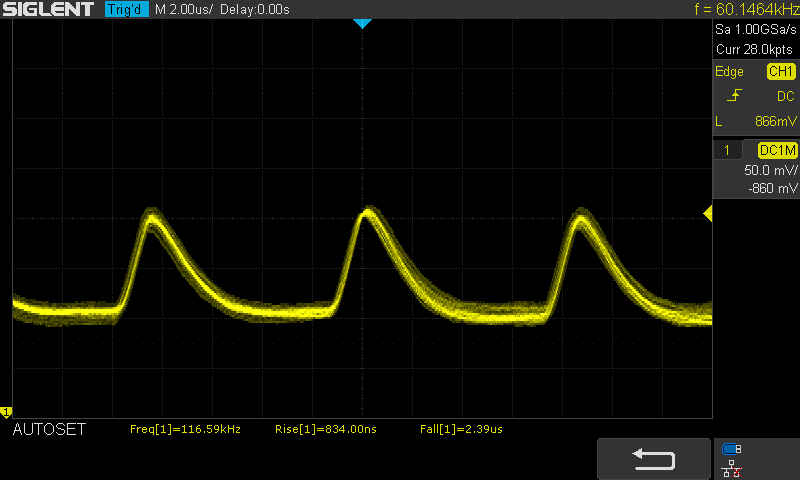 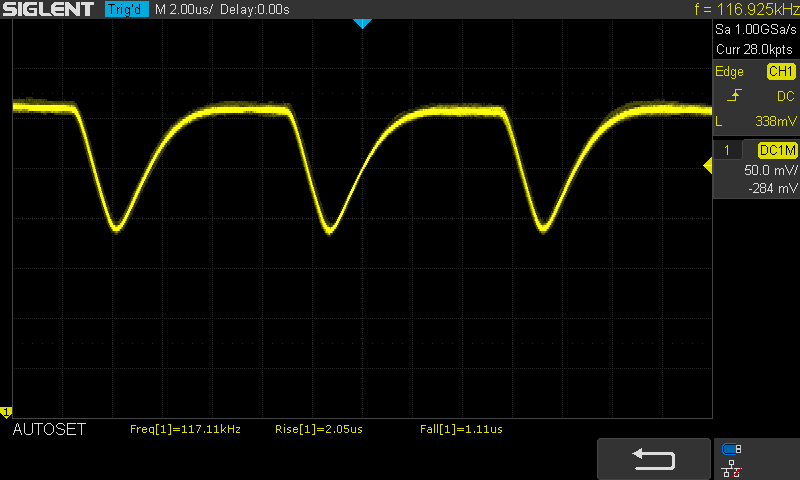 |
A luz de fundo da tela pisca em 117000 Hz (pior caso, por exemplo, utilizando PWM) Cintilação detectada em uma configuração de brilho de 75 % e abaixo. Não deve haver cintilação ou PWM acima desta configuração de brilho. A frequência de 117000 Hz é bastante alta, então a maioria dos usuários sensíveis ao PWM não deve notar nenhuma oscilação. [pwm_comparison] Em comparação: 52 % de todos os dispositivos testados não usam PWM para escurecer a tela. Se PWM foi detectado, uma média de 7778 (mínimo: 5 - máximo: 343500) Hz foi medida. | |||
| Blackmagic RAW Speed Test - 12:1 8K CPU | |
| Média da turma Subnotebook (22 - 49, n=5, últimos 2 anos) | |
| Apple MacBook Pro 16 2019 i9 5500M | |
| Apple MacBook Air 2020 i5 | |
| R Benchmark 2.5 - Overall mean | |
| Apple MacBook Air 2020 i5 (macOS) | |
| Apple MacBook Air 2020 i5 (Win 10) | |
| Dell XPS 13 9300 i5 FHD | |
| Acer Swift 3 SF313-52-71Y7 | |
| Apple MacBook Pro 16 2019 i9 5500M (macOS) | |
| Apple MacBook Pro 16 2019 i9 5500M (Win 10) | |
| Média da turma Subnotebook (0.4024 - 1.456, n=57, últimos 2 anos) | |
* ... menor é melhor
| DPC Latencies / LatencyMon - interrupt to process latency (max), Web, Youtube, Prime95 | |
| Dell XPS 13 9300 Core i7-1065G7 | |
| Lenovo ThinkPad X1 Carbon G7 20R1-000YUS | |
| Eve-Tech Eve V i7 | |
| Asus Zephyrus G14 GA401IV | |
| Apple MacBook Air 2020 i5 | |
| Schenker VIA 14 | |
| BMAX MaxBook Y11 H1M6 | |
| Média da turma Subnotebook (316 - 8148, n=39, últimos 2 anos) | |
| Dell XPS 13 9300 i5 FHD | |
| LG Gram 14T90N | |
| Dell XPS 13 2016 9350 (FHD, i7-6560U) | |
* ... menor é melhor
| Apple MacBook Air 2020 i5 Apple SSD AP0512 | Apple Macbook Air 2019 Apple SSD AP0256 | Apple MacBook Pro 13 2019 2TB3 Apple SSD AP0256 | Microsoft Surface Laptop 3 13 Core i5-1035G7 SK hynix BC501 HFM256GDGTNG | Acer Swift 3 SF313-52-71Y7 Intel SSD 660p 1TB SSDPEKNW010T8 | Dell XPS 13 9300 i5 FHD Toshiba XG6 KXG60ZNV512G | Apple MacBook Pro 16 2019 i9 5500M Apple SSD AP1024 7171 | Média da turma Subnotebook | |
|---|---|---|---|---|---|---|---|---|
| AS SSD | -16% | -4% | 50% | 139% | 218% | 194% | 294% | |
| Seq Read (MB/s) | 1153 | 933 -19% | 974 -16% | 1387 20% | 1703 48% | 2328 102% | 2531 120% | 4499 ? 290% |
| Seq Write (MB/s) | 1367 | 1139 -17% | 1340 -2% | 504 -63% | 1373 0% | 1137 -17% | 2289 67% | 2974 ? 118% |
| 4K Read (MB/s) | 12.95 | 10.53 -19% | 11.35 -12% | 42.35 227% | 56.8 339% | 48.07 271% | 15.85 22% | 59.5 ? 359% |
| 4K Write (MB/s) | 24.52 | 15.03 -39% | 15.95 -35% | 120 389% | 164.4 570% | 120.6 392% | 39.88 63% | 168.1 ? 586% |
| 4K-64 Read (MB/s) | 665 | 534 -20% | 643 -3% | 497.4 -25% | 584 -12% | 899 35% | 1267 91% | 862 ? 30% |
| 4K-64 Write (MB/s) | 159.5 | 181.6 14% | 163 2% | 354.9 123% | 783 391% | 1220 665% | 1749 997% | 1701 ? 966% |
| Score Read (Points) | 793 | 638 -20% | 752 -5% | 678 -15% | 811 2% | 1180 49% | 1536 94% | 1370 ? 73% |
| Score Write (Points) | 321 | 311 -3% | 313 -2% | 525 64% | 1085 238% | 1455 353% | 2018 529% | 2166 ? 575% |
| Score Total (Points) | 1528 | 1283 -16% | 1465 -4% | 1520 -1% | 2313 51% | 3189 109% | 4317 183% | 4175 ? 173% |
| Copy ISO MB/s (MB/s) | 1433 | 1205 -16% | 1404 -2% | 764 -47% | 1401 -2% | 1995 39% | 2594 ? 81% | |
| Copy Program MB/s (MB/s) | 363 | 302.1 -17% | 406.9 12% | 256.1 -29% | 480.4 32% | 584 61% | 829 ? 128% | |
| Copy Game MB/s (MB/s) | 725 | 627 -14% | 850 17% | 368.4 -49% | 820 13% | 1135 57% | 1783 ? 146% |

| Unigine Valley 1.0 - 1920x1080 Extreme HD Preset OpenGL AA:x8 | |
| Apple MacBook Pro 16 2019 i9 5500M | |
| Média da turma Subnotebook (4.7 - 26.2, n=5, últimos 2 anos) | |
| Apple MacBook Pro 13 2018 Touchbar i5 | |
| Apple MacBook Pro 13 2017 Touchbar i5 | |
| Apple MacBook Air 2020 i5 | |
| Média Intel Iris Plus Graphics G7 (Ice Lake 64 EU) (n=1) | |
| Basemark GPU 1.2 | |
| 3840x2160 Metal High Offscreen | |
| Apple iPad Pro 11 2020 | |
| Apple MacBook Pro 16 2019 i9 5500M | |
| Apple MacBook Air 2020 i5 | |
| Média Intel Iris Plus Graphics G7 (Ice Lake 64 EU) (n=1) | |
| 1920x1080 Metal Medium Offscreen | |
| Apple MacBook Pro 16 2019 i9 5500M | |
| Apple iPad Pro 11 2018 | |
| Apple iPad Pro 11 2020 | |
| Apple MacBook Air 2020 i5 | |
| Média Intel Iris Plus Graphics G7 (Ice Lake 64 EU) (n=1) | |
| 3DMark 06 Standard Score | 8821 pontos | |
| 3DMark 11 Performance | 2848 pontos | |
| 3DMark Fire Strike Score | 1605 pontos | |
| 3DMark Time Spy Score | 587 pontos | |
Ajuda | ||
| The Witcher 3 - 1024x768 Low Graphics & Postprocessing | |
| Média da turma Subnotebook (38.8 - 176, n=13, últimos 2 anos) | |
| Microsoft Surface Laptop 3 13 Core i5-1035G7 | |
| Média Intel Iris Plus Graphics G7 (Ice Lake 64 EU) (28.2 - 58, n=20) | |
| Apple MacBook Air 2020 i5 | |
| Shadow of the Tomb Raider - 1280x720 Lowest Preset | |
| Média da turma Subnotebook (41 - 109, n=7, últimos 2 anos) | |
| Média Intel Iris Plus Graphics G7 (Ice Lake 64 EU) (15.6 - 33, n=13) | |
| Microsoft Surface Laptop 3 13 Core i5-1035G7 | |
| Apple MacBook Air 2020 i5 | |
| baixo | média | alto | ultra | |
|---|---|---|---|---|
| BioShock Infinite (2013) | 55.6 | 33.5 | 29.1 | 10.9 |
| GTA V (2015) | 24.8 | |||
| The Witcher 3 (2015) | 28.2 | 5.13 | ||
| Dota 2 Reborn (2015) | 59.4 | 30.7 | 20.5 | 19.8 |
| Rocket League (2017) | 22.1 | 24.9 | ||
| X-Plane 11.11 (2018) | 24 | 11.6 | 10.8 | |
| World of Tanks enCore (2018) | 92.9 | 14.6 | ||
| Far Cry 5 (2018) | 11 | |||
| Shadow of the Tomb Raider (2018) | 15.6 | |||
| Battlefield V (2018) | 7.87 | |||
| Anno 1800 (2019) | 19 | |||
| FIFA 20 (2019) | 0 o jogo não começa |
Barulho
| Ocioso |
| 30 / 30 / 30 dB |
| Carga |
| 45.5 / 45.8 dB |
 | ||
30 dB silencioso 40 dB(A) audível 50 dB(A) ruidosamente alto |
||
min: | ||
| Apple MacBook Air 2020 i5 Iris Plus Graphics G7 (Ice Lake 64 EU), i5-1030NG7, Apple SSD AP0512 | Apple Macbook Air 2019 UHD Graphics 617, i5-8210Y, Apple SSD AP0256 | Apple MacBook Pro 13 2019 2TB3 Iris Plus Graphics 645, i5-8257U, Apple SSD AP0256 | Microsoft Surface Laptop 3 13 Core i5-1035G7 Iris Plus Graphics G7 (Ice Lake 64 EU), i5-1035G7, SK hynix BC501 HFM256GDGTNG | Acer Swift 3 SF313-52-71Y7 Iris Plus Graphics G7 (Ice Lake 64 EU), i7-1065G7, Intel SSD 660p 1TB SSDPEKNW010T8 | Dell XPS 13 9300 i5 FHD UHD Graphics G1 (Ice Lake 32 EU), i5-1035G1, Toshiba XG6 KXG60ZNV512G | |
|---|---|---|---|---|---|---|
| Noise | 7% | 9% | 12% | 9% | 12% | |
| desligado / ambiente * (dB) | 30 | 29.5 2% | 29.5 2% | 28.5 5% | 30.3 -1% | 29.3 2% |
| Idle Minimum * (dB) | 30 | 29.5 2% | 29.5 2% | 28.5 5% | 30.3 -1% | 29.3 2% |
| Idle Average * (dB) | 30 | 29.5 2% | 29.5 2% | 28.5 5% | 30.3 -1% | 29.3 2% |
| Idle Maximum * (dB) | 30 | 29.5 2% | 29.5 2% | 28.5 5% | 30.3 -1% | 29.3 2% |
| Load Average * (dB) | 45.5 | 34 25% | 31.1 32% | 28.5 37% | 31.7 30% | 30 34% |
| Load Maximum * (dB) | 45.8 | 41 10% | 39.3 14% | 40.4 12% | 32.7 29% | 32.4 29% |
| Witcher 3 ultra * (dB) | 40.4 |
* ... menor é melhor
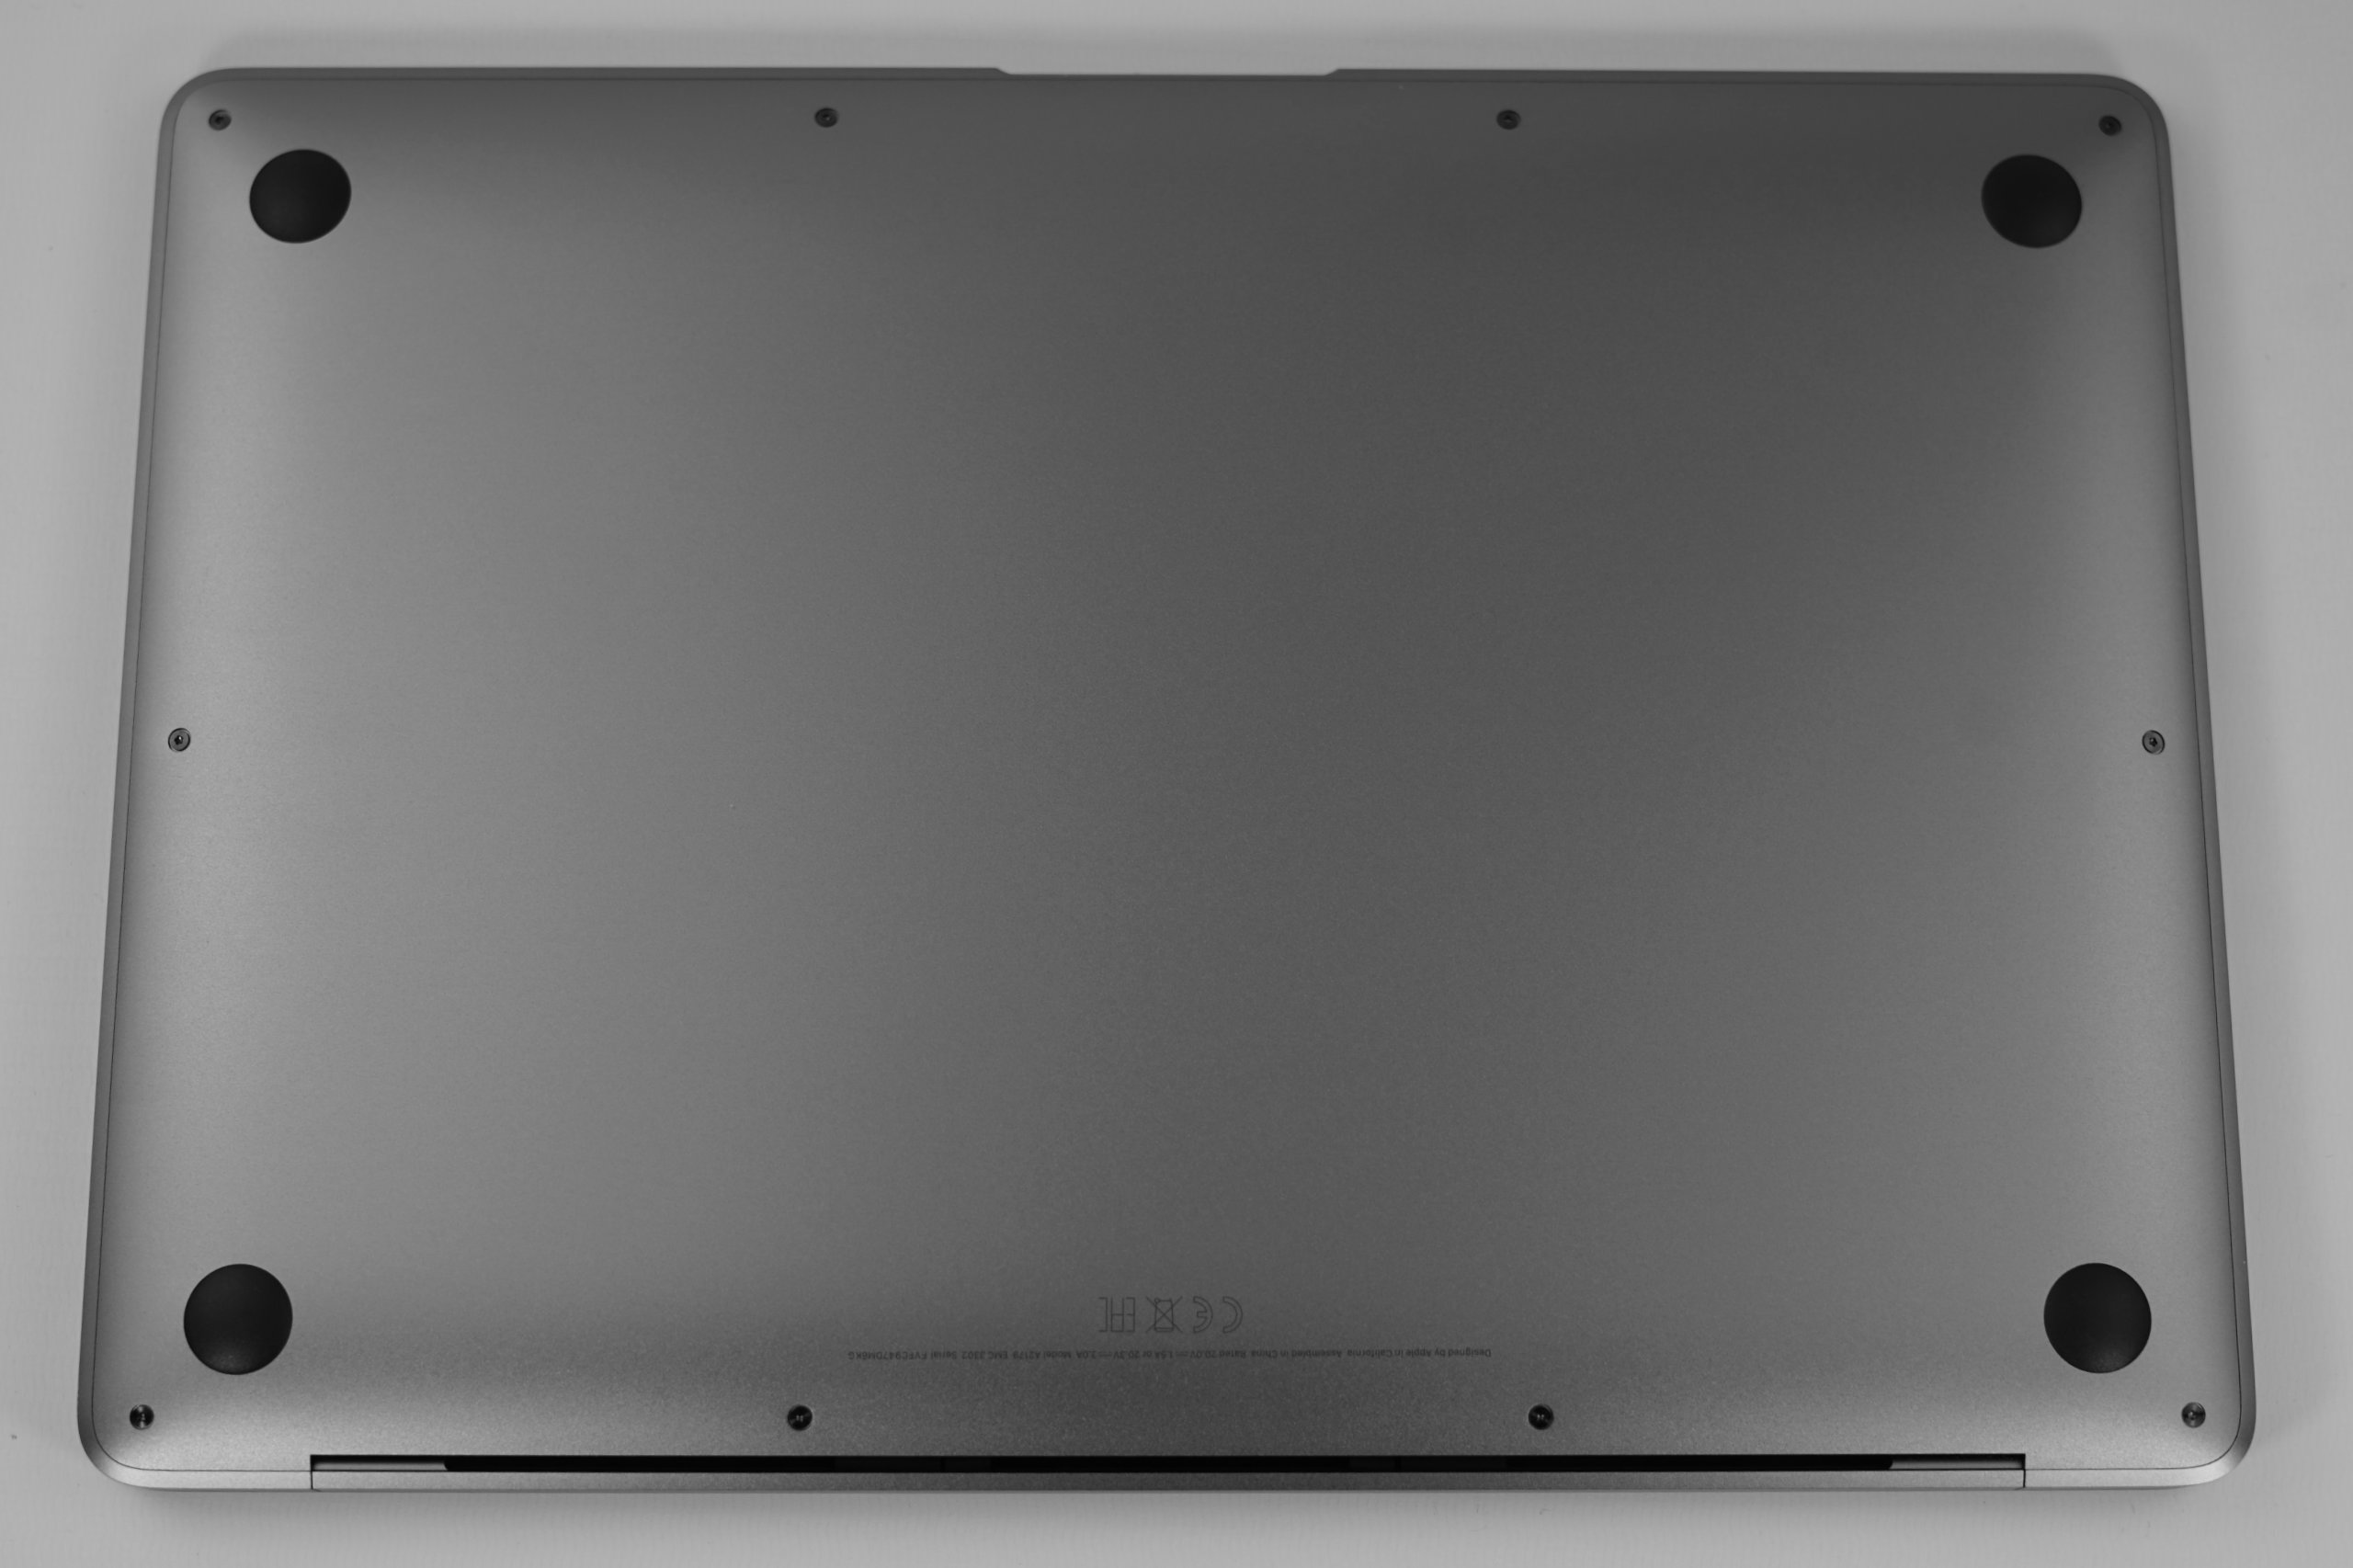
(-) A temperatura máxima no lado superior é 48 °C / 118 F, em comparação com a média de 35.9 °C / 97 F , variando de 21.4 a 59 °C para a classe Subnotebook.
(±) A parte inferior aquece até um máximo de 40 °C / 104 F, em comparação com a média de 39.2 °C / 103 F
(+) Em uso inativo, a temperatura média para o lado superior é 27.7 °C / 82 F, em comparação com a média do dispositivo de 30.8 °C / ### class_avg_f### F.
(±) Jogando The Witcher 3, a temperatura média para o lado superior é 32.8 °C / 91 F, em comparação com a média do dispositivo de 30.8 °C / ## #class_avg_f### F.
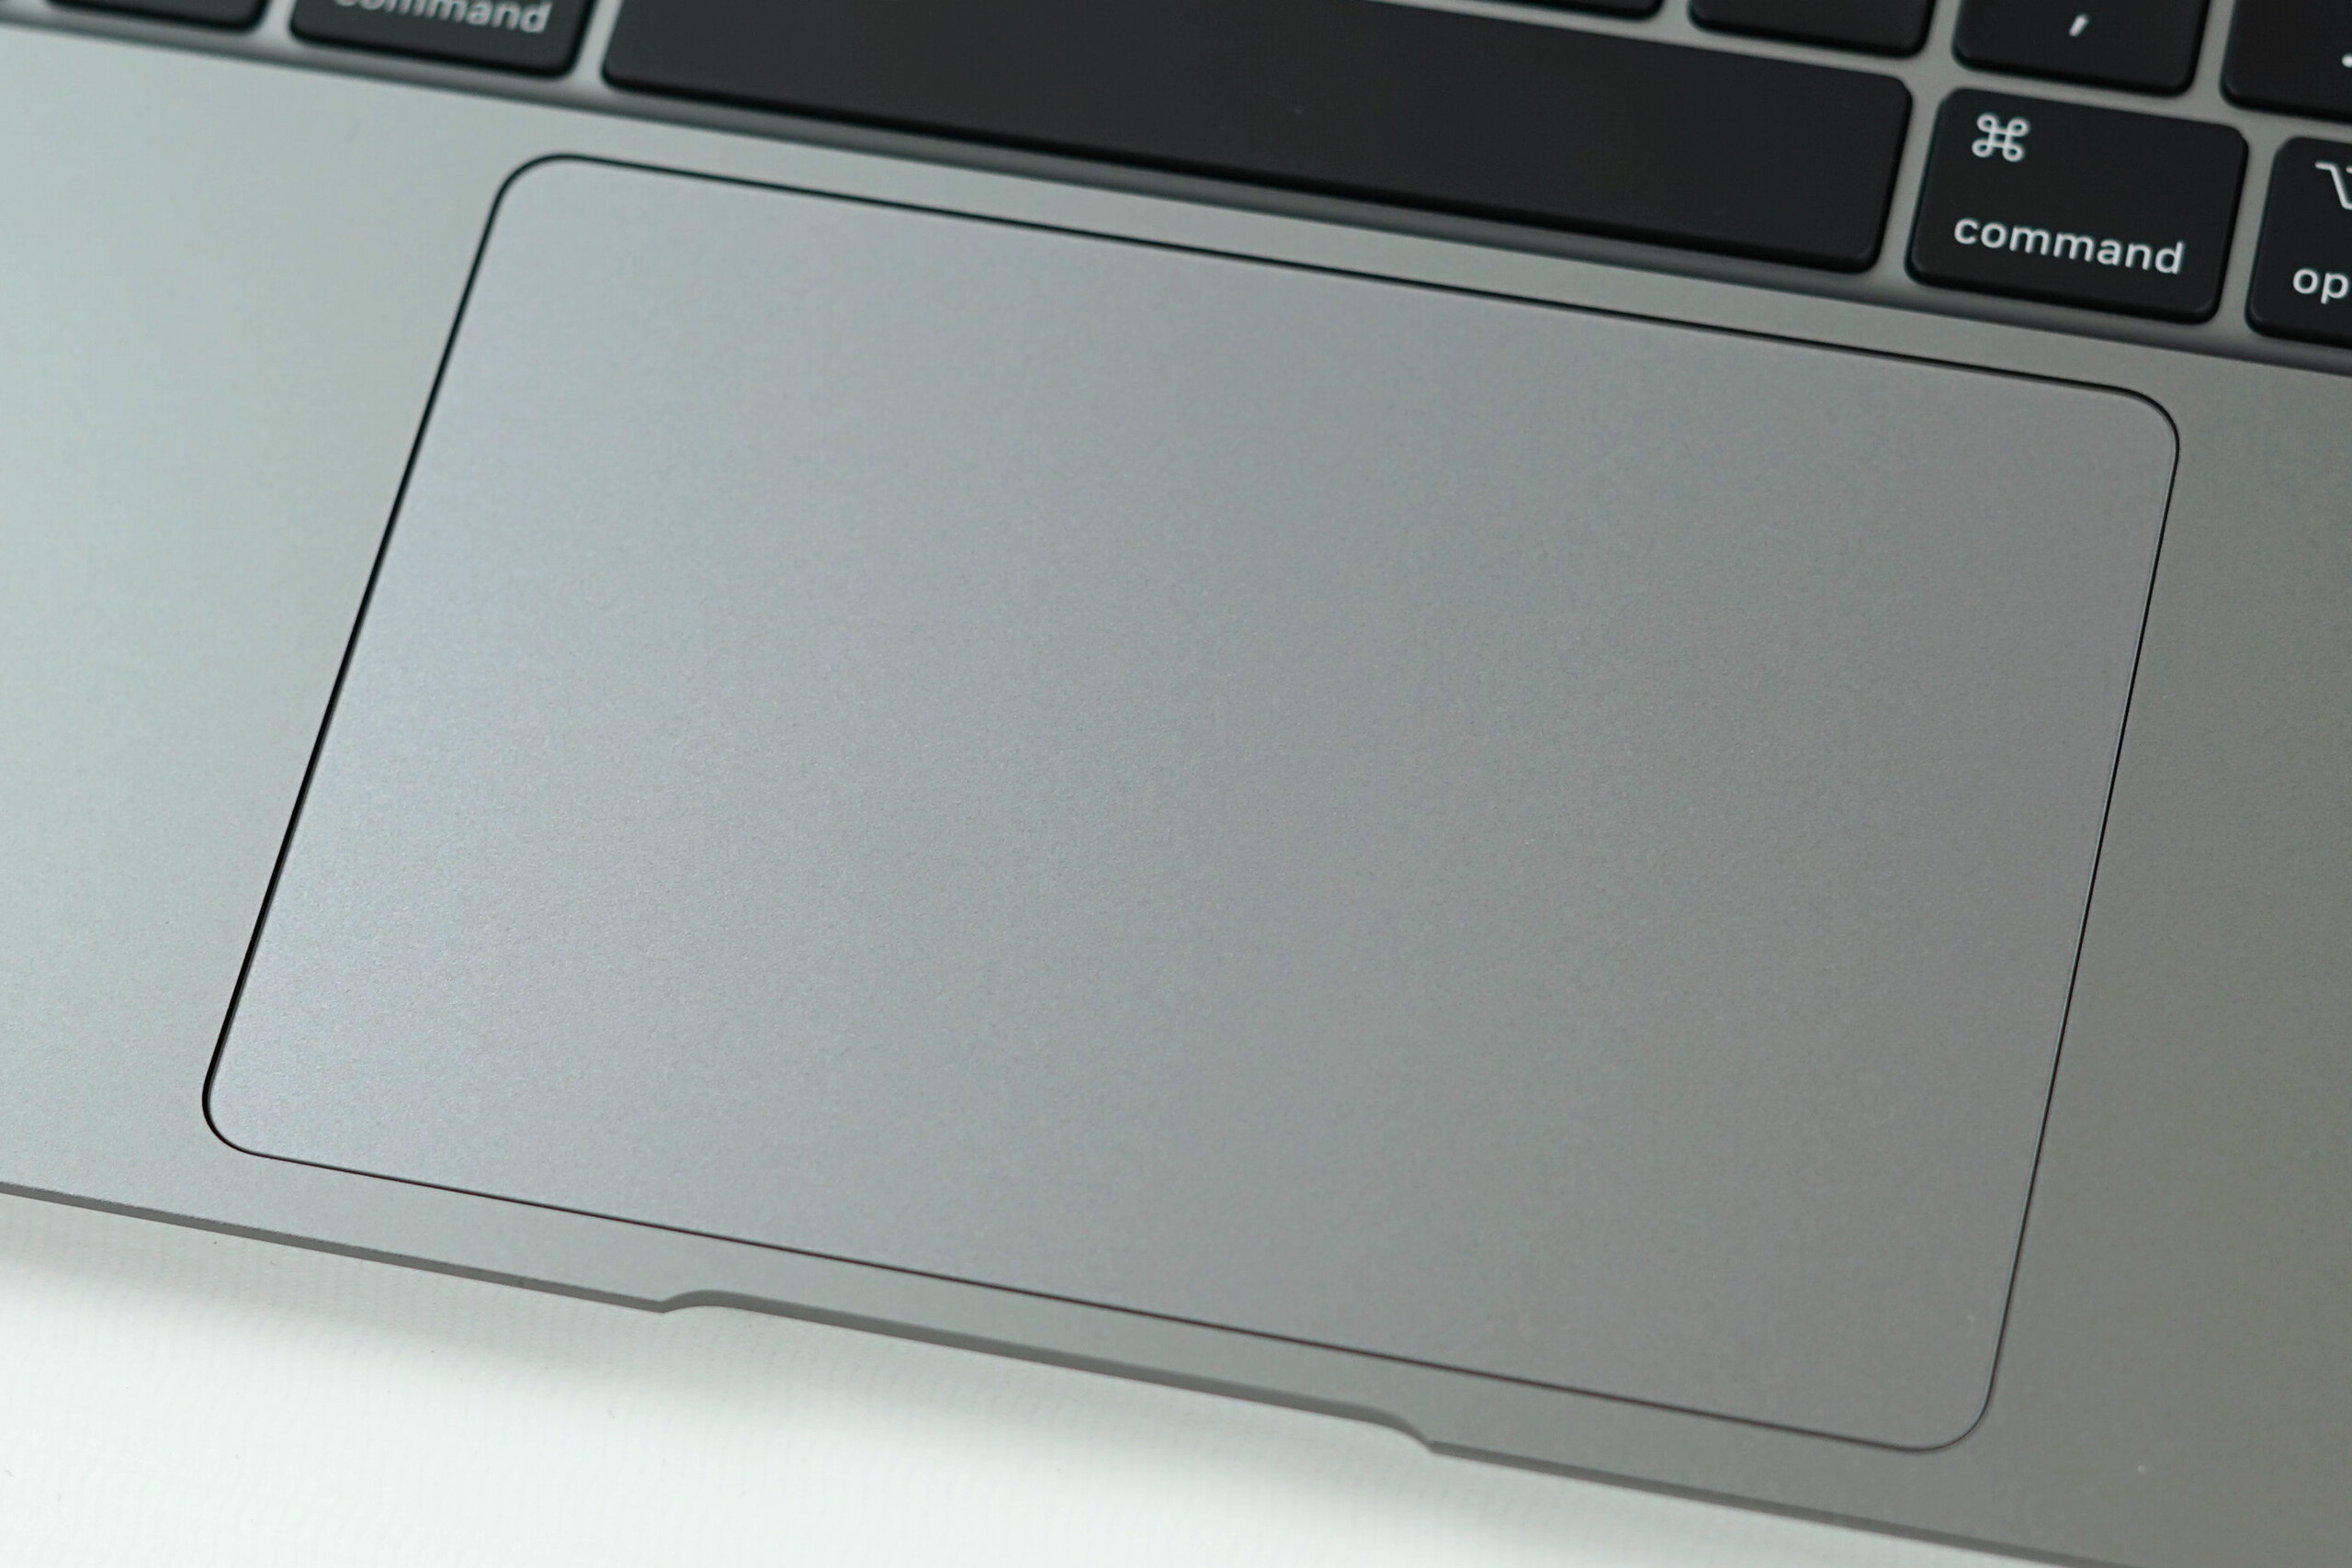
(+) Os apoios para as mãos e o touchpad são mais frios que a temperatura da pele, com um máximo de 29 °C / 84.2 F e, portanto, são frios ao toque.
(±) A temperatura média da área do apoio para as mãos de dispositivos semelhantes foi 28.2 °C / 82.8 F (-0.8 °C / -1.4 F).
Apple MacBook Air 2020 i5 análise de áudio
(±) | o volume do alto-falante é médio, mas bom (###valor### dB)
Graves 100 - 315Hz
(+) | bons graves - apenas 4.3% longe da mediana
(±) | a linearidade dos graves é média (11.5% delta para a frequência anterior)
Médios 400 - 2.000 Hz
(+) | médios equilibrados - apenas 3.4% longe da mediana
(+) | médios são lineares (6.2% delta para frequência anterior)
Altos 2 - 16 kHz
(+) | agudos equilibrados - apenas 2% longe da mediana
(+) | os máximos são lineares (3.7% delta da frequência anterior)
Geral 100 - 16.000 Hz
(+) | o som geral é linear (9.9% diferença em relação à mediana)
Comparado com a mesma classe
» 7% de todos os dispositivos testados nesta classe foram melhores, 1% semelhantes, 92% piores
» O melhor teve um delta de 5%, a média foi 18%, o pior foi 53%
Comparado com todos os dispositivos testados
» 4% de todos os dispositivos testados foram melhores, 1% semelhantes, 95% piores
» O melhor teve um delta de 4%, a média foi 24%, o pior foi 134%
Apple Macbook Air 2019 análise de áudio
(±) | o volume do alto-falante é médio, mas bom (###valor### dB)
Graves 100 - 315Hz
(±) | graves reduzidos - em média 8.9% menor que a mediana
(±) | a linearidade dos graves é média (11.6% delta para a frequência anterior)
Médios 400 - 2.000 Hz
(+) | médios equilibrados - apenas 3% longe da mediana
(+) | médios são lineares (5.1% delta para frequência anterior)
Altos 2 - 16 kHz
(+) | agudos equilibrados - apenas 2.9% longe da mediana
(+) | os máximos são lineares (4.7% delta da frequência anterior)
Geral 100 - 16.000 Hz
(+) | o som geral é linear (14.3% diferença em relação à mediana)
Comparado com a mesma classe
» 28% de todos os dispositivos testados nesta classe foram melhores, 6% semelhantes, 66% piores
» O melhor teve um delta de 5%, a média foi 18%, o pior foi 53%
Comparado com todos os dispositivos testados
» 17% de todos os dispositivos testados foram melhores, 4% semelhantes, 79% piores
» O melhor teve um delta de 4%, a média foi 24%, o pior foi 134%
Apple MacBook Pro 16 2019 i9 5500M análise de áudio
(+) | os alto-falantes podem tocar relativamente alto (###valor### dB)
Graves 100 - 315Hz
(+) | bons graves - apenas 2.3% longe da mediana
(+) | o baixo é linear (5% delta para a frequência anterior)
Médios 400 - 2.000 Hz
(+) | médios equilibrados - apenas 2.7% longe da mediana
(+) | médios são lineares (3.4% delta para frequência anterior)
Altos 2 - 16 kHz
(+) | agudos equilibrados - apenas 2.1% longe da mediana
(+) | os máximos são lineares (2.6% delta da frequência anterior)
Geral 100 - 16.000 Hz
(+) | o som geral é linear (6.9% diferença em relação à mediana)
Comparado com a mesma classe
» 5% de todos os dispositivos testados nesta classe foram melhores, 1% semelhantes, 94% piores
» O melhor teve um delta de 5%, a média foi 17%, o pior foi 45%
Comparado com todos os dispositivos testados
» 1% de todos os dispositivos testados foram melhores, 0% semelhantes, 99% piores
» O melhor teve um delta de 4%, a média foi 24%, o pior foi 134%
Microsoft Surface Laptop 3 13 Core i5-1035G7 análise de áudio
(±) | o volume do alto-falante é médio, mas bom (###valor### dB)
Graves 100 - 315Hz
(+) | bons graves - apenas 4.2% longe da mediana
(±) | a linearidade dos graves é média (10.5% delta para a frequência anterior)
Médios 400 - 2.000 Hz
(+) | médios equilibrados - apenas 3.6% longe da mediana
(±) | a linearidade dos médios é média (7.1% delta para frequência anterior)
Altos 2 - 16 kHz
(+) | agudos equilibrados - apenas 1.8% longe da mediana
(+) | os máximos são lineares (6.5% delta da frequência anterior)
Geral 100 - 16.000 Hz
(+) | o som geral é linear (11.4% diferença em relação à mediana)
Comparado com a mesma classe
» 3% de todos os dispositivos testados nesta classe foram melhores, 2% semelhantes, 95% piores
» O melhor teve um delta de 7%, a média foi 21%, o pior foi 53%
Comparado com todos os dispositivos testados
» 7% de todos os dispositivos testados foram melhores, 2% semelhantes, 91% piores
» O melhor teve um delta de 4%, a média foi 24%, o pior foi 134%
Dell XPS 13 9300 i5 FHD análise de áudio
(±) | o volume do alto-falante é médio, mas bom (###valor### dB)
Graves 100 - 315Hz
(±) | graves reduzidos - em média 9.4% menor que a mediana
(±) | a linearidade dos graves é média (12.5% delta para a frequência anterior)
Médios 400 - 2.000 Hz
(±) | médios mais altos - em média 6.7% maior que a mediana
(+) | médios são lineares (5.6% delta para frequência anterior)
Altos 2 - 16 kHz
(+) | agudos equilibrados - apenas 4% longe da mediana
(+) | os máximos são lineares (5% delta da frequência anterior)
Geral 100 - 16.000 Hz
(±) | a linearidade do som geral é média (19.8% diferença em relação à mediana)
Comparado com a mesma classe
» 62% de todos os dispositivos testados nesta classe foram melhores, 7% semelhantes, 31% piores
» O melhor teve um delta de 5%, a média foi 18%, o pior foi 53%
Comparado com todos os dispositivos testados
» 50% de todos os dispositivos testados foram melhores, 7% semelhantes, 43% piores
» O melhor teve um delta de 4%, a média foi 24%, o pior foi 134%
| desligado | |
| Ocioso | |
| Carga |
|
Key:
min: | |
| Apple MacBook Air 2020 i5 i5-1030NG7, Iris Plus Graphics G7 (Ice Lake 64 EU), Apple SSD AP0512, IPS, 2560x1600, 13.3" | Apple MacBook Air 2018 i5-8210Y, UHD Graphics 617, Apple SSD AP0256, IPS, 2560x1600, 13.3" | Apple MacBook Pro 13 2019 2TB3 i5-8257U, Iris Plus Graphics 645, Apple SSD AP0256, IPS, 2560x1600, 13.3" | Microsoft Surface Laptop 3 13 Core i5-1035G7 i5-1035G7, Iris Plus Graphics G7 (Ice Lake 64 EU), SK hynix BC501 HFM256GDGTNG, IPS, 2256x1504, 13.5" | Acer Swift 3 SF313-52-71Y7 i7-1065G7, Iris Plus Graphics G7 (Ice Lake 64 EU), Intel SSD 660p 1TB SSDPEKNW010T8, IPS, 2256x1504, 13.5" | Dell XPS 13 9300 i5 FHD i5-1035G1, UHD Graphics G1 (Ice Lake 32 EU), Toshiba XG6 KXG60ZNV512G, IPS, 1920x1200, 13.4" | Média Intel Iris Plus Graphics G7 (Ice Lake 64 EU) | Média da turma Subnotebook | |
|---|---|---|---|---|---|---|---|---|
| Power Consumption | 5% | -28% | -51% | 21% | -26% | -35% | -42% | |
| Idle Minimum * (Watt) | 2.4 | 2.2 8% | 2.1 12% | 4.4 -83% | 1.8 25% | 3.4 -42% | 3.91 ? -63% | 3.86 ? -61% |
| Idle Average * (Watt) | 6.8 | 5.7 16% | 6.9 -1% | 7.5 -10% | 4.6 32% | 6 12% | 7.33 ? -8% | 6.61 ? 3% |
| Idle Maximum * (Watt) | 10.5 | 10.3 2% | 7.8 26% | 7.8 26% | 6.1 42% | 10.2 3% | 9.16 ? 13% | 8 ? 24% |
| Load Average * (Watt) | 25.7 | 25.6 -0% | 42 -63% | 41.9 -63% | 27.4 -7% | 36.6 -42% | 39.2 ? -53% | 42.2 ? -64% |
| Witcher 3 ultra * (Watt) | 24.5 | 40.8 -67% | ||||||
| Load Maximum * (Watt) | 30.4 | 30.6 -1% | 64.5 -112% | 63.9 -110% | 27 11% | 49.3 -62% | 49.8 ? -64% | 64.5 ? -112% |
* ... menor é melhor
| Apple MacBook Air 2020 i5 i5-1030NG7, Iris Plus Graphics G7 (Ice Lake 64 EU), 49.9 Wh | Apple MacBook Air 2018 i5-8210Y, UHD Graphics 617, 50.3 Wh | Apple Macbook Air 2019 i5-8210Y, UHD Graphics 617, 49.9 Wh | Apple MacBook Pro 13 2019 2TB3 i5-8257U, Iris Plus Graphics 645, 58.2 Wh | Microsoft Surface Laptop 3 13 Core i5-1035G7 i5-1035G7, Iris Plus Graphics G7 (Ice Lake 64 EU), 45 Wh | Acer Swift 3 SF313-52-71Y7 i7-1065G7, Iris Plus Graphics G7 (Ice Lake 64 EU), 54.5 Wh | Dell XPS 13 9300 i5 FHD i5-1035G1, UHD Graphics G1 (Ice Lake 32 EU), 52 Wh | Média da turma Subnotebook | |
|---|---|---|---|---|---|---|---|---|
| Duração da bateria | -0% | 12% | 26% | -27% | -8% | 22% | 16% | |
| H.264 (h) | 10.7 | 12.3 15% | 10.5 -2% | 14.4 35% | 15.4 ? 44% | |||
| WiFi v1.3 (h) | 10.3 | 11.1 8% | 11.5 12% | 13 26% | 8.3 -19% | 10.3 0% | 11.7 14% | 14 ? 36% |
| Load (h) | 2.9 | 2.2 -24% | 1.9 -34% | 2.3 -21% | 3.4 17% | 1.969 ? -32% | ||
| Reader / Idle (h) | 34.4 | 21.4 | 28.6 ? |
Pro
Contra
Veredicto – O desempenho ainda é o calcanhar de Aquiles do MacBook Air

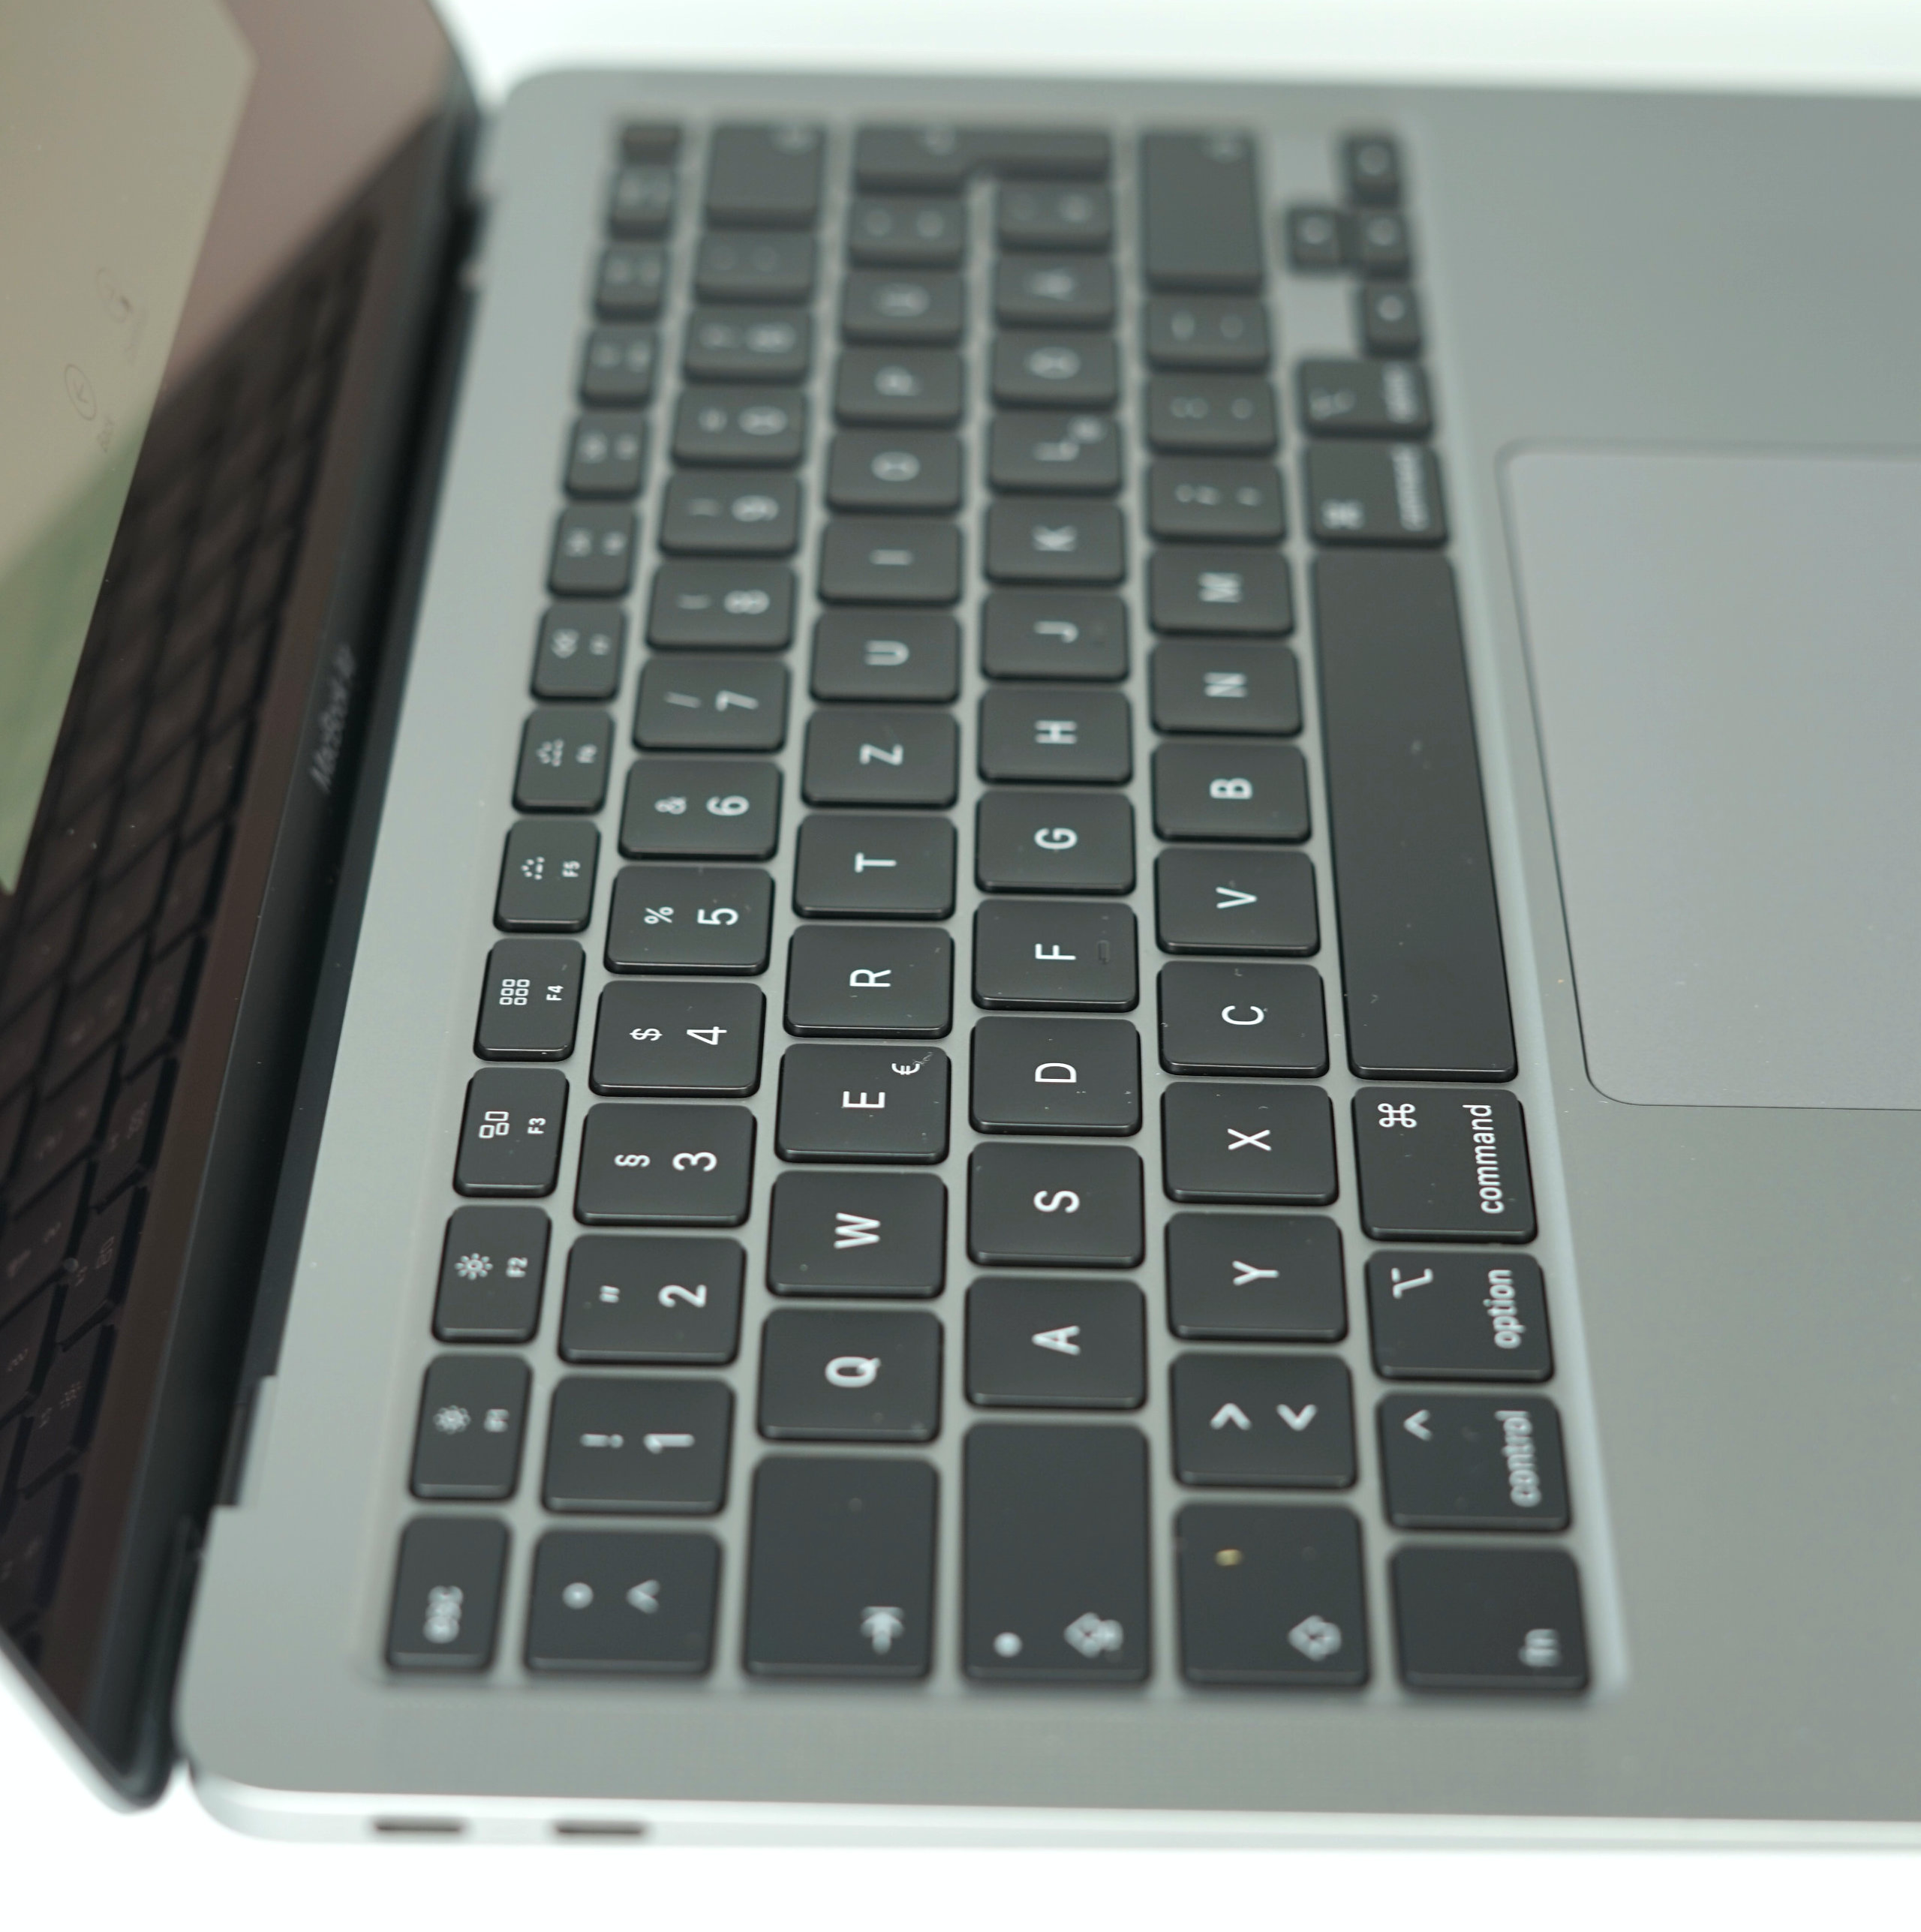
Atualmente, você pode ler muitos relatórios que dizem que o novo MacBook Air é o melhor MacBook que você pode obter atualmente. Após nossa análise abrangente, não podemos confirmar essas declarações. Sim, o teclado agora está melhor e o desempenho é um pouco mais alto, mas a Apple ainda (desnecessariamente) limita os recursos do sistema de refrigeração. O pequeno ventilador do chassi não é muito eficiente, porque não pode impedir uma queda no desempenho. Também é muito barulhento sob cargas de trabalho mais exigentes.
Na verdade, faz sentido para a Apple implementar um processador mais lento e manter distância do MacBook Pro 13. E isso não é uma coisa ruim em geral, porque o desempenho é suficiente para tarefas básicas sem muita tarefa multitarefa. No entanto, gostaríamos de ver um dispositivo com resfriamento completamente passivo. Um dispositivo completamente silencioso tornaria muito mais fácil aceitar os números de desempenho mais baixos. Talvez a Apple queira reservar esse passo para as próximas gerações com seus próprios processadores ARM (que foram rumorados durante um longo tempo).
O preço é muito alto: O processador do novo MacBook Air não é competitivo em uma máquina por 1500 Euros (~$1641) e o sistema de refrigeração é muito barulhento sob uso intenso. Se você ainda deseja o novo MacBook Air, recomendamos que aguarde ofertas especiais.
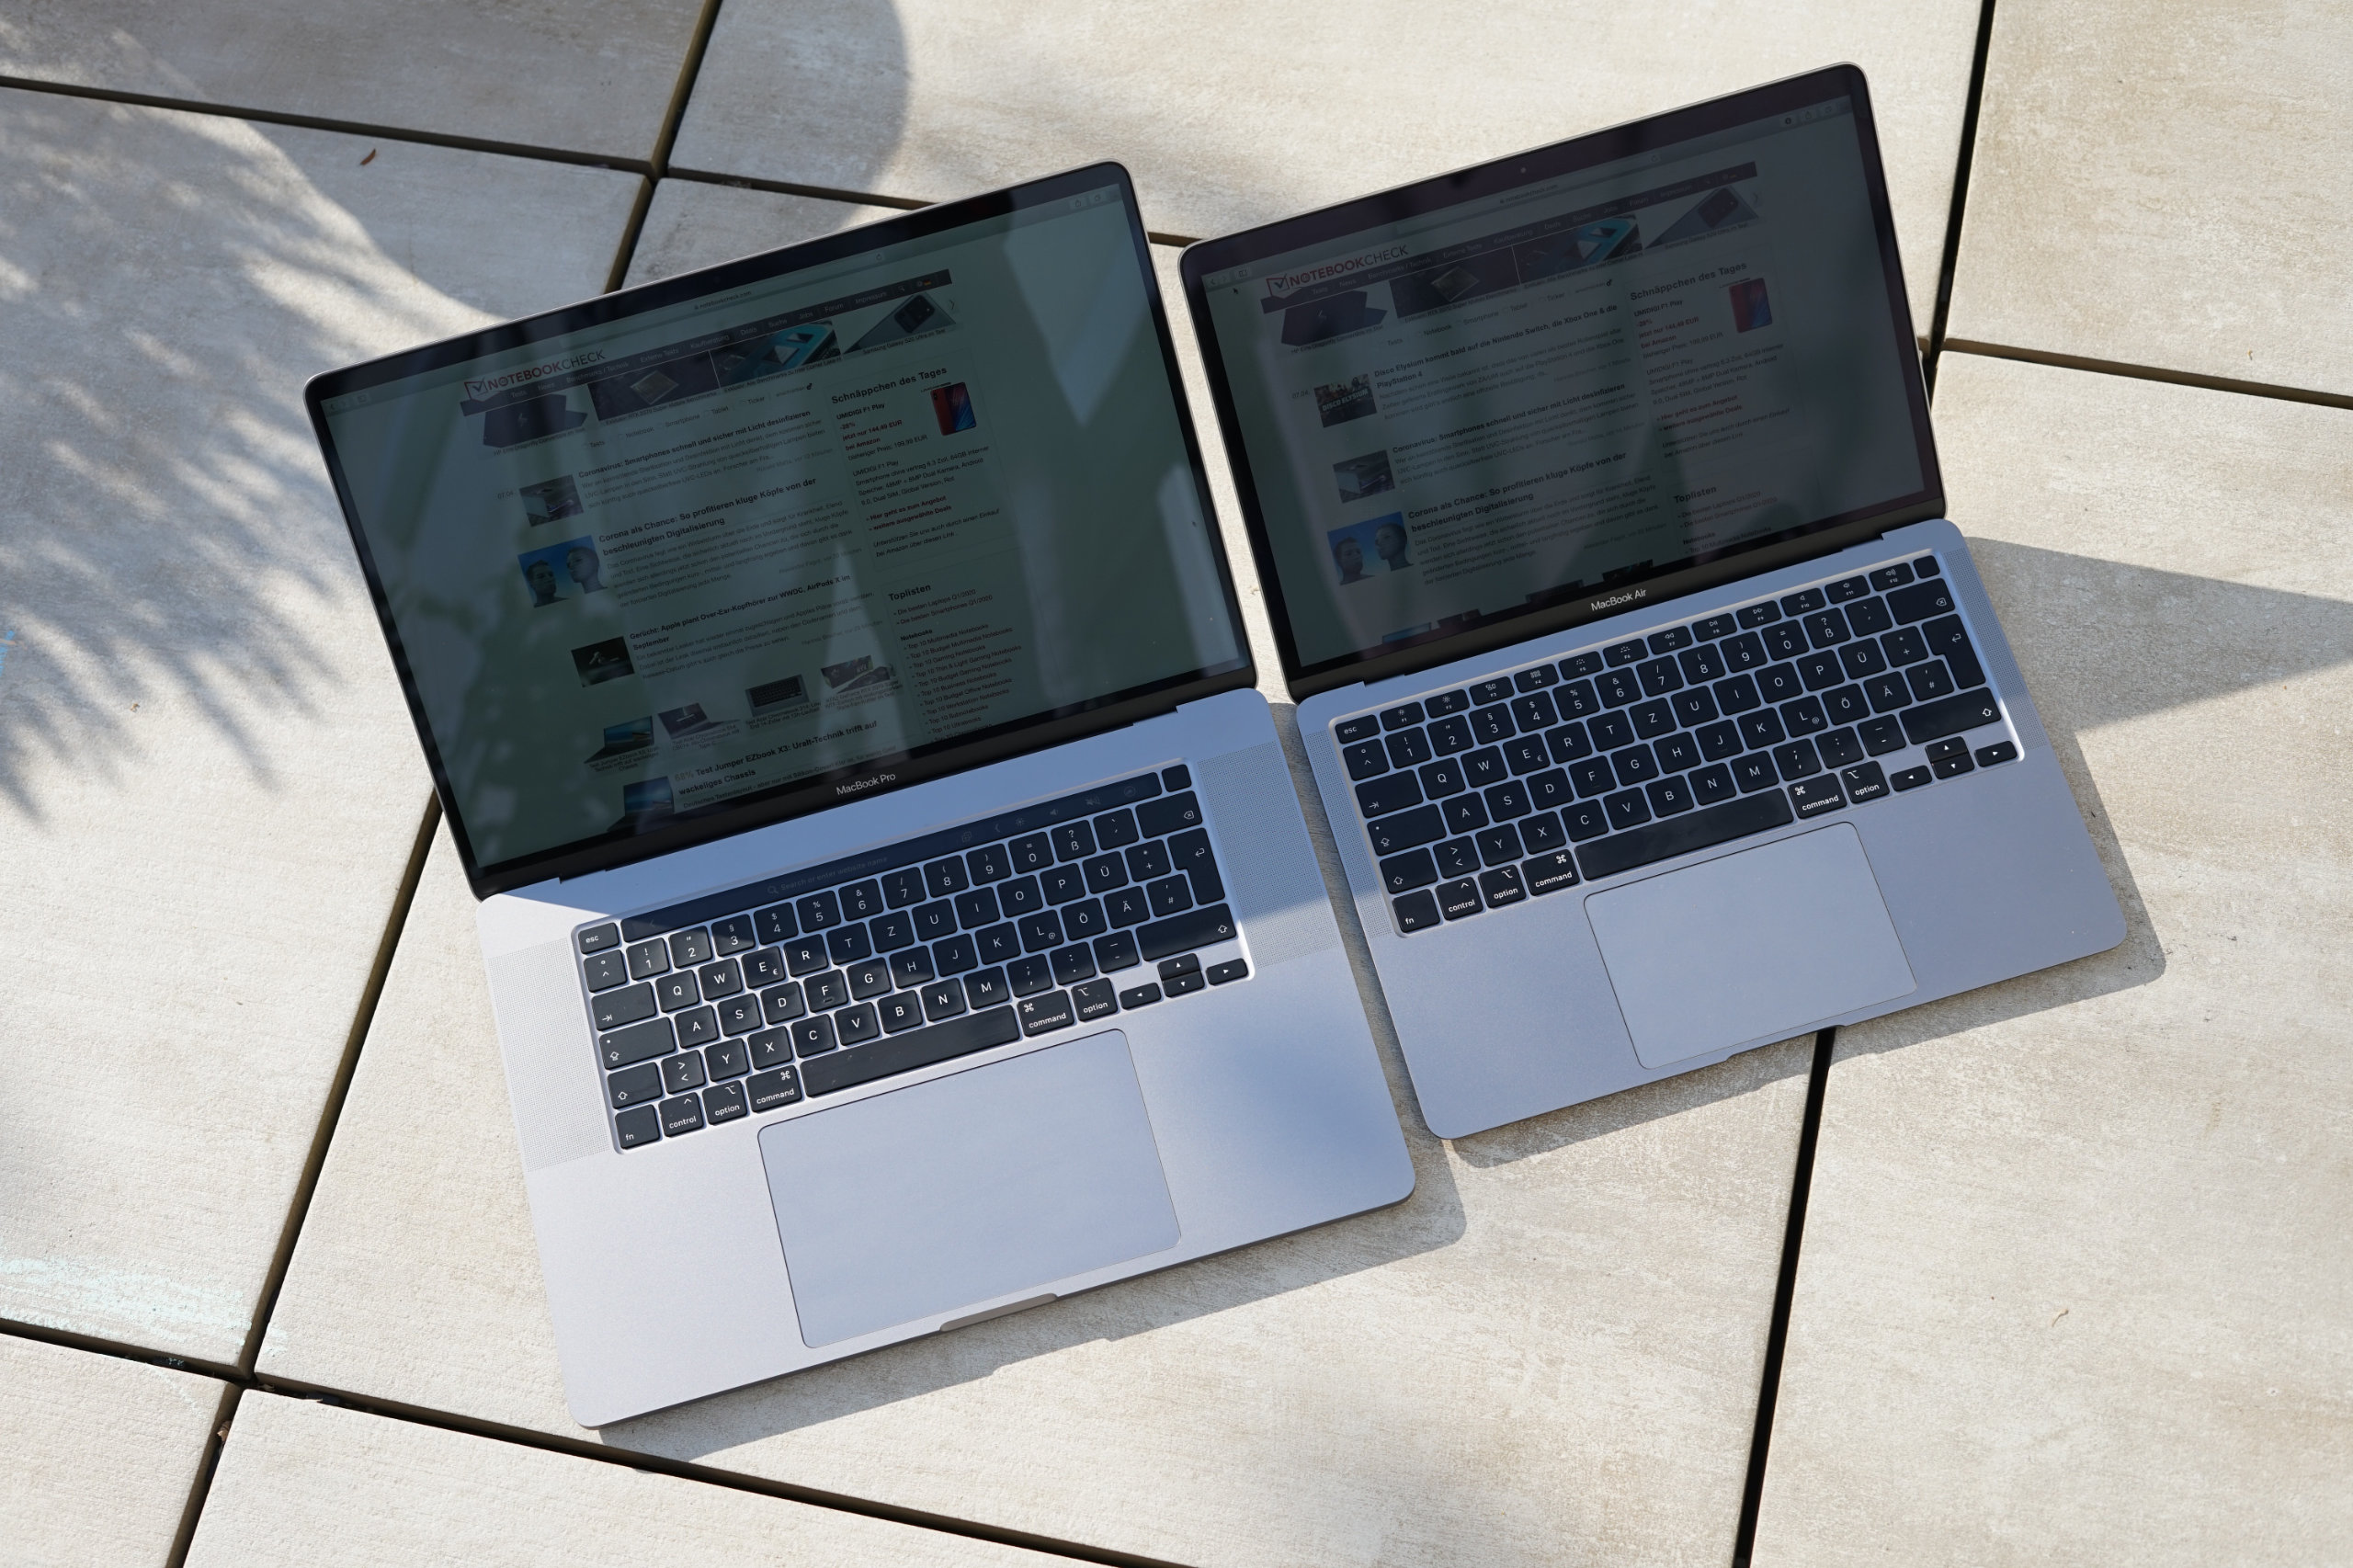
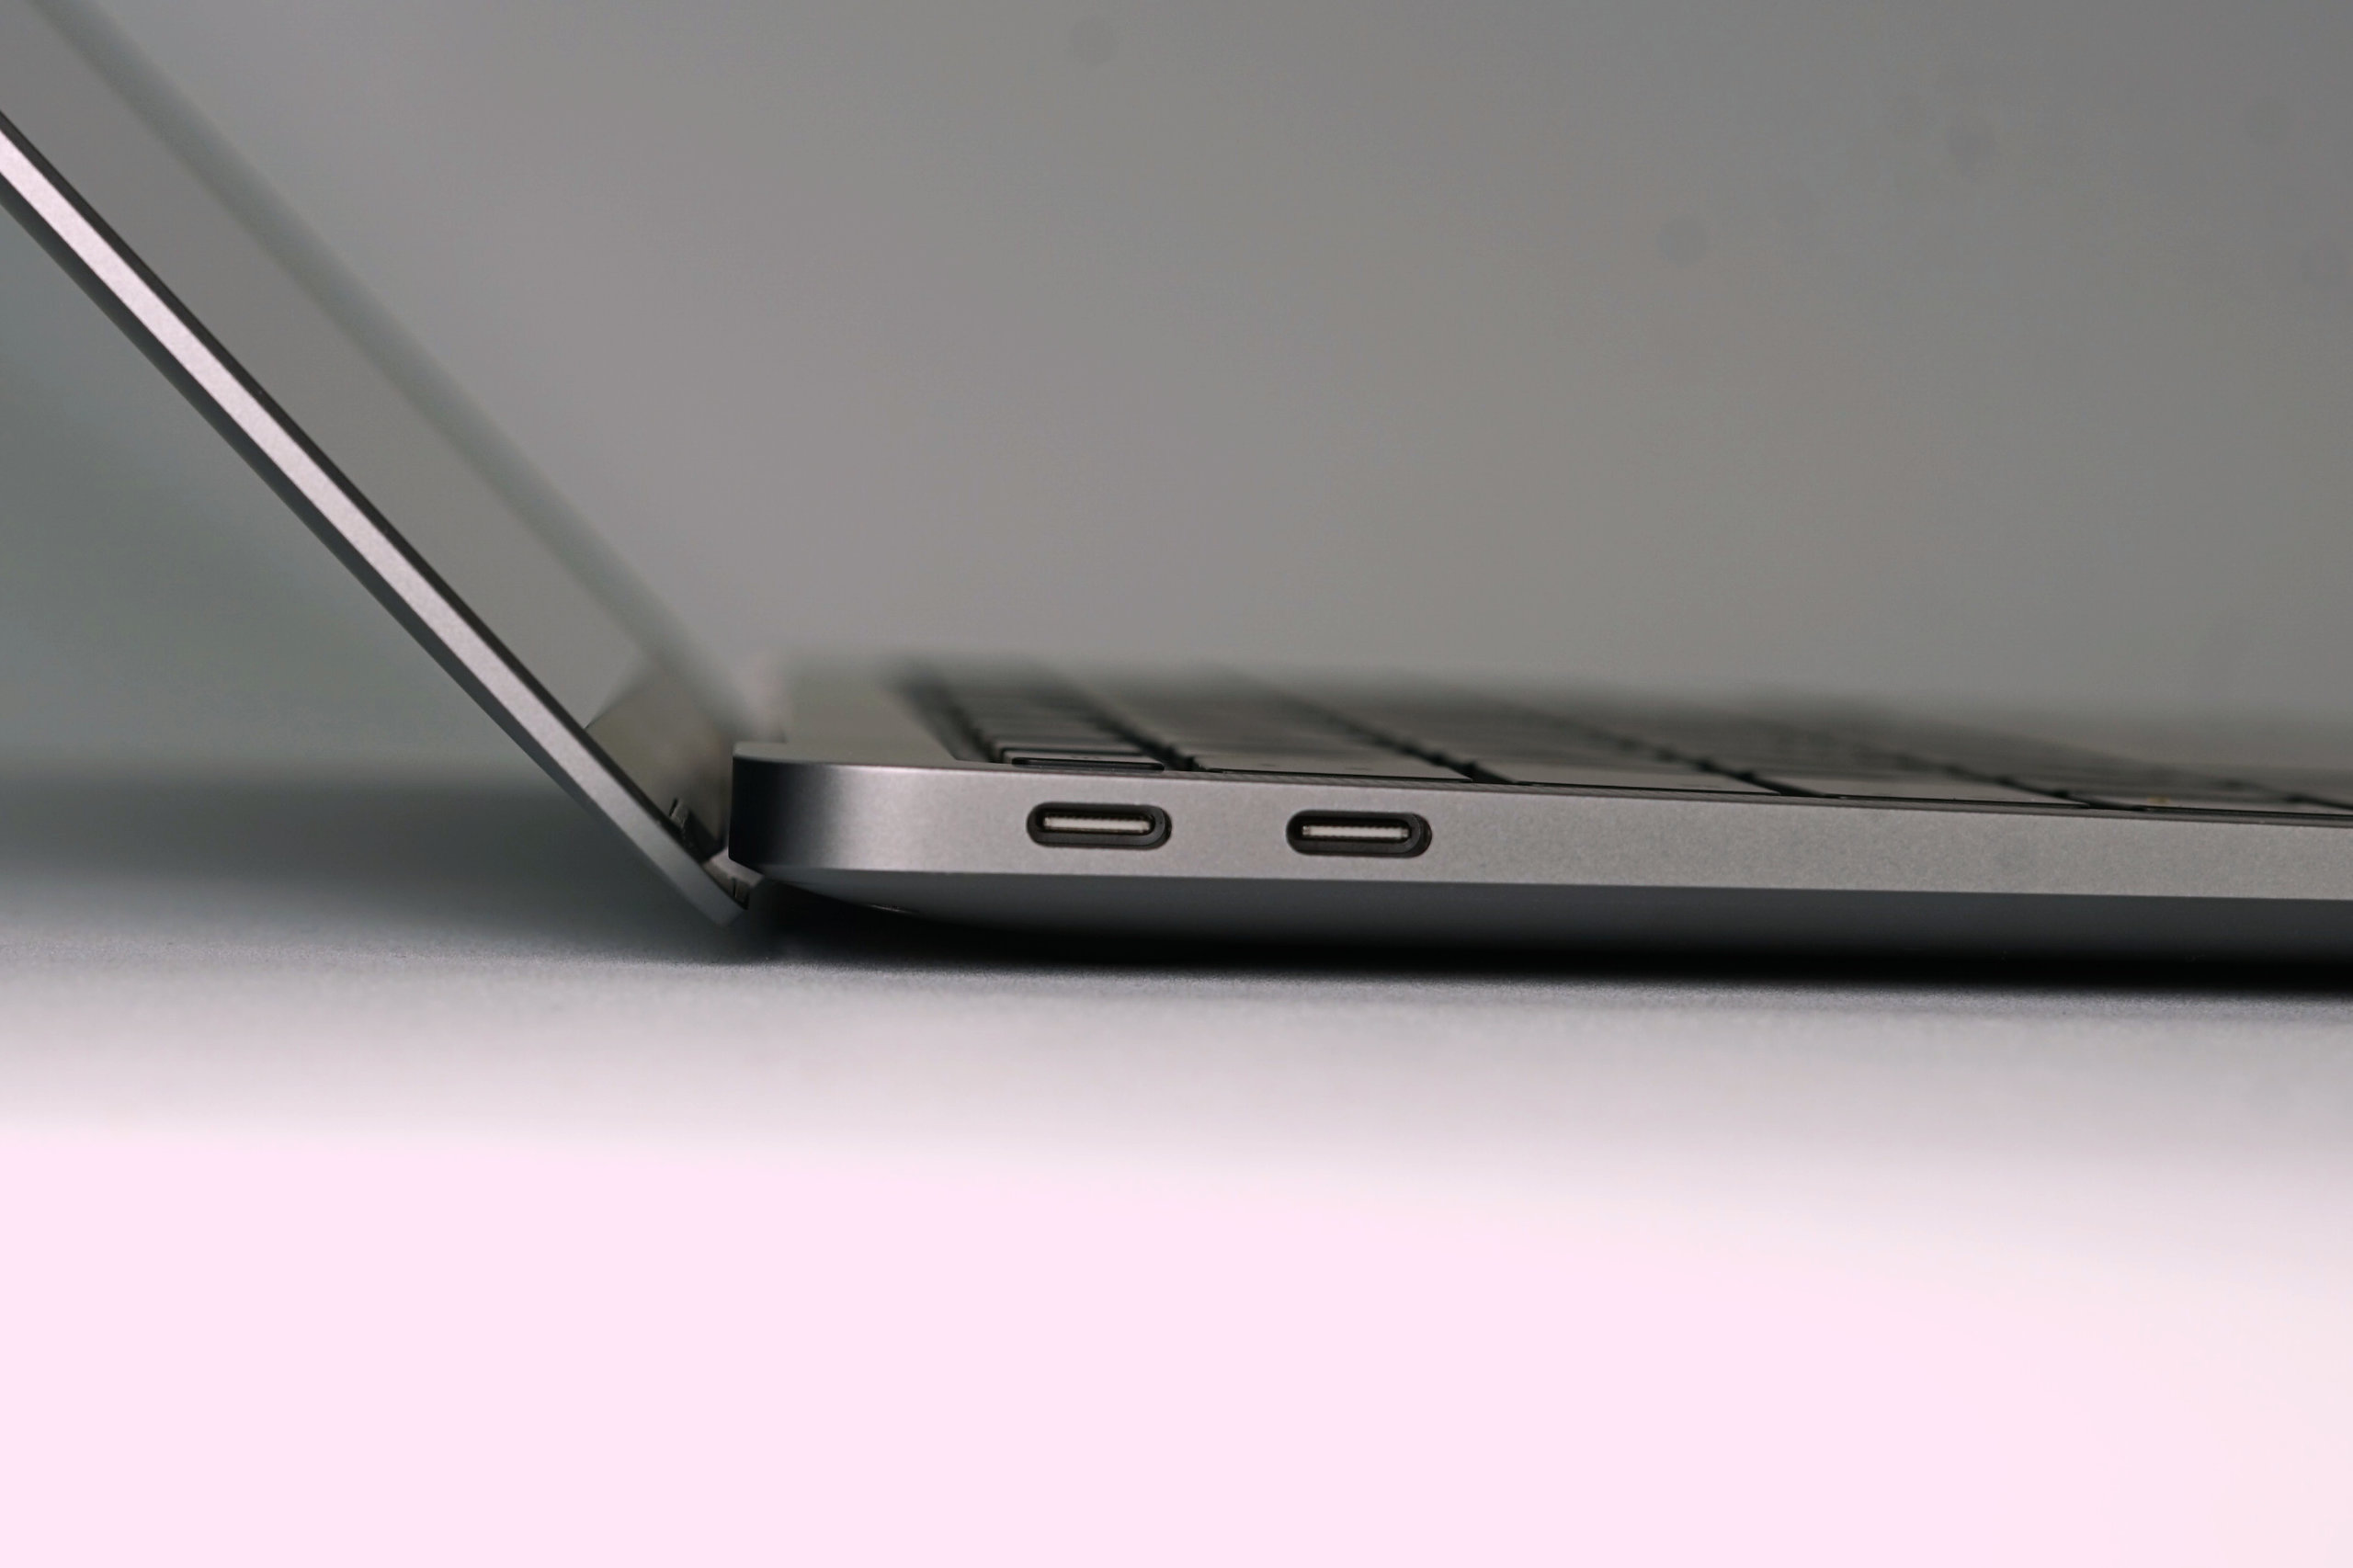
O problema é o preço alto, porque você pode obter portáteis muito mais potentes por 1500 Euros (~$1641), incluindo o MacBook Pro 13 da Apple. Mas a concorrência Windows, como o novo Dell XPS 139300 ou o Acer Swift 3, não precisa se esconder e ainda oferece mais recursos como o Wi-Fi 6, além de números de desempenho mais altos.
Se você consegue viver com o desempenho do MacBook Air e precisa apenas de itens básicos, mas exige um ótimo chassi, uma boa tela e duração de bateria longa, mais uma vez terá um ótimo companheiro móvel com o novo MacBook Air.
Definitivamente, também há muito o que gostar sobre o novo MacBook Air 2020, e apenas o nome do produto atrairá muitos clientes. Atualmente, o desempenho é completamente suficiente para coisas básicas, a tela e o chassi ainda são muito bons, o teclado foi finalmente aprimorado e os problemas de confiabilidade esperançosamente são coisa do passado. Se tiver que ser o novo MacBook Air, recomendamos aguardar ofertas ou descontos especiais, que definitivamente estarão disponíveis.
Apple MacBook Air 2020 i5
- 04/08/2020 v7 (old)
Klaus Hinum, Andreas Osthoff
Price comparison
