Breve Análise do Asus ProArt StudioBook Pro 17 W700G3T: O workstation móvel é prejudicado por pequenas coisas
Avaliação | Data | Modelo | Peso | Altura | Size | Resolução | Preço |
|---|---|---|---|---|---|---|---|
| 86.4 % v7 (old) | 05/2020 | Asus ProArt StudioBook Pro 17 W700G3T i7-9750H, Quadro RTX 3000 Max-Q | 2.5 kg | 18.4 mm | 17.00" | 1920x1200 | |
| 83.8 % v7 (old) | MSI WS75 9TL-636 i7-9750H, Quadro RTX 4000 (Laptop) | 2.3 kg | 18.95 mm | 17.30" | 1920x1080 | ||
| 89.7 % v7 (old) | 12/2019 | Apple MacBook Pro 16 2019 i9 5500M i9-9880H, Radeon Pro 5500M | 2 kg | 16.2 mm | 16.00" | 3072x1920 | |
| 84.7 % v7 (old) | Acer ConceptD 5 CN517-71-74YA i7-9750H, GeForce RTX 2060 Mobile | 2.8 kg | 24 mm | 17.30" | 3840x2160 | ||
| 87 % v7 (old) | 04/2020 | Gigabyte Aero 17 HDR XB i7-10875H, GeForce RTX 2070 Super Max-Q | 2.7 kg | 21 mm | 17.30" | 3840x2160 |
| SD Card Reader | |
| average JPG Copy Test (av. of 3 runs) | |
| Gigabyte Aero 17 HDR XB (Toshiba Exceria Pro SDXC 64 GB UHS-II) | |
| Asus ProArt StudioBook Pro 17 W700G3T (Toshiba Exceria Pro SDXC 64 GB UHS-II) | |
| MSI WS75 9TL-636 (Toshiba Exceria Pro M501 64 GB UHS-II) | |
| Média da turma Workstation (49.6 - 681, n=14, últimos 2 anos) | |
| maximum AS SSD Seq Read Test (1GB) | |
| Gigabyte Aero 17 HDR XB (Toshiba Exceria Pro SDXC 64 GB UHS-II) | |
| Asus ProArt StudioBook Pro 17 W700G3T (Toshiba Exceria Pro SDXC 64 GB UHS-II) | |
| Média da turma Workstation (87.6 - 1455, n=14, últimos 2 anos) | |
| MSI WS75 9TL-636 (Toshiba Exceria Pro M501 64 GB UHS-II) | |
| Networking | |
| iperf3 transmit AX12 | |
| Asus ProArt StudioBook Pro 17 W700G3T | |
| Gigabyte Aero 17 HDR XB | |
| Acer ConceptD 5 CN517-71-74YA | |
| Apple MacBook Pro 16 2019 i9 5500M | |
| MSI WS75 9TL-636 | |
| iperf3 receive AX12 | |
| Asus ProArt StudioBook Pro 17 W700G3T | |
| Gigabyte Aero 17 HDR XB | |
| Acer ConceptD 5 CN517-71-74YA | |
| Apple MacBook Pro 16 2019 i9 5500M | |
| MSI WS75 9TL-636 | |


| |||||||||||||||||||||||||
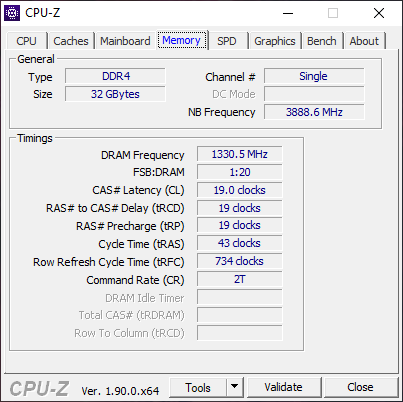
iluminação: 88 %
iluminação com acumulador: 320 cd/m²
Contraste: 897:1 (Preto: 0.36 cd/m²)
ΔE ColorChecker Calman: 1.1 | ∀{0.5-29.43 Ø4.72}
calibrated: 0.8
ΔE Greyscale Calman: 0.8 | ∀{0.09-98 Ø4.97}
99.8% sRGB (Argyll 1.6.3 3D)
75.7% AdobeRGB 1998 (Argyll 1.6.3 3D)
84.7% AdobeRGB 1998 (Argyll 3D)
99.8% sRGB (Argyll 3D)
96.2% Display P3 (Argyll 3D)
Gamma: 2.23
CCT: 6479 K
| Asus ProArt StudioBook Pro 17 W700G3T 170PUW1-A00, IPS, 1920x1200, 17" | MSI WS75 9TL-636 B173HAN04.2, IPS, 1920x1080, 17.3" | Apple MacBook Pro 16 2019 i9 5500M APPA044, IPS, 3072x1920, 16" | Acer ConceptD 5 CN517-71-74YA AUO B173ZAN03, IPS, 3840x2160, 17.3" | Gigabyte Aero 17 HDR XB AUO B173ZAN03.2 (AUO329B), IPS, 3840x2160, 17.3" | |
|---|---|---|---|---|---|
| Display | -21% | 2% | 3% | ||
| Display P3 Coverage (%) | 96.2 | 64.5 -33% | 86.2 -10% | 86.5 -10% | |
| sRGB Coverage (%) | 99.8 | 91.1 -9% | 100 0% | 100 0% | |
| AdobeRGB 1998 Coverage (%) | 84.7 | 65.8 -22% | 99.1 17% | 100 18% | |
| Response Times | 5% | -23% | -31% | -11% | |
| Response Time Grey 50% / Grey 80% * (ms) | 41.2 ? | 39.2 ? 5% | 52.4 ? -27% | 55 ? -33% | 55.2 ? -34% |
| Response Time Black / White * (ms) | 29.6 ? | 28.4 ? 4% | 34.9 ? -18% | 38 ? -28% | 26 ? 12% |
| PWM Frequency (Hz) | 131700 | ||||
| Screen | -86% | -7% | -40% | 13% | |
| Brightness middle (cd/m²) | 323 | 300 -7% | 519 61% | 410 27% | 487 51% |
| Brightness (cd/m²) | 308 | 288 -6% | 477 55% | 383 24% | 475 54% |
| Brightness Distribution (%) | 88 | 86 -2% | 86 -2% | 88 0% | 95 8% |
| Black Level * (cd/m²) | 0.36 | 0.25 31% | 0.39 -8% | 0.58 -61% | 0.38 -6% |
| Contrast (:1) | 897 | 1200 34% | 1331 48% | 707 -21% | 1282 43% |
| Colorchecker dE 2000 * | 1.1 | 3.9 -255% | 2.28 -107% | 1.91 -74% | 1.19 -8% |
| Colorchecker dE 2000 max. * | 3.3 | 6 -82% | 6.54 -98% | 4.67 -42% | 2.43 26% |
| Colorchecker dE 2000 calibrated * | 0.8 | 2.3 -187% | 0.86 -8% | 1.09 -36% | 0.5 37% |
| Greyscale dE 2000 * | 0.8 | 4.3 -437% | 0.9 -13% | 3 -275% | 1.45 -81% |
| Gamma | 2.23 99% | 2.2 100% | 2145 0% | 2.18 101% | 2.21 100% |
| CCT | 6479 100% | 7391 88% | 6572 99% | 6338 103% | 6557 99% |
| Color Space (Percent of AdobeRGB 1998) (%) | 75.7 | 59.2 -22% | 78 3% | 87 15% | 88 16% |
| Color Space (Percent of sRGB) (%) | 99.8 | 91 -9% | 100 0% | 100 0% | |
| Média Total (Programa/Configurações) | -34% /
-62% | -15% /
-10% | -23% /
-31% | 2% /
8% |
* ... menor é melhor
Exibir tempos de resposta
| ↔ Tempo de resposta preto para branco | ||
|---|---|---|
| 29.6 ms ... ascensão ↗ e queda ↘ combinadas | ↗ 16.4 ms ascensão | 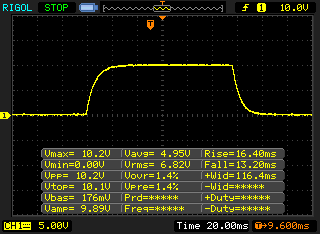 |
| ↘ 13.2 ms queda | ||
| A tela mostra taxas de resposta relativamente lentas em nossos testes e pode ser muito lenta para os jogadores. Em comparação, todos os dispositivos testados variam de 0.1 (mínimo) a 240 (máximo) ms. » 79 % de todos os dispositivos são melhores. Isso significa que o tempo de resposta medido é pior que a média de todos os dispositivos testados (19.8 ms). | ||
| ↔ Tempo de resposta 50% cinza a 80% cinza | ||
| 41.2 ms ... ascensão ↗ e queda ↘ combinadas | ↗ 22 ms ascensão | 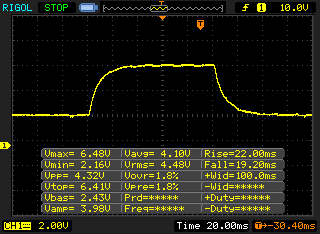 |
| ↘ 19.2 ms queda | ||
| A tela mostra taxas de resposta lentas em nossos testes e será insatisfatória para os jogadores. Em comparação, todos os dispositivos testados variam de 0.165 (mínimo) a 636 (máximo) ms. » 66 % de todos os dispositivos são melhores. Isso significa que o tempo de resposta medido é pior que a média de todos os dispositivos testados (31 ms). | ||
Cintilação da tela / PWM (modulação por largura de pulso)
| Tela tremeluzindo / PWM não detectado | 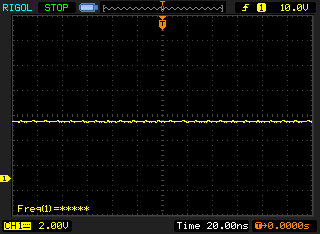 | ||
[pwm_comparison] Em comparação: 52 % de todos os dispositivos testados não usam PWM para escurecer a tela. Se PWM foi detectado, uma média de 7769 (mínimo: 5 - máximo: 343500) Hz foi medida. | |||
| Cinebench R15 | |
| CPU Single 64Bit | |
| Média da turma Workstation (191.4 - 328, n=24, últimos 2 anos) | |
| Lenovo ThinkPad P73-20QR002DGE | |
| Asus ProArt StudioBook Pro 17 W700G3T | |
| MSI WS75 9TL-636 | |
| Acer ConceptD 5 CN517-71-74YA | |
| Apple MacBook Pro 16 2019 i9 5500M (macOS 10.15.1) | |
| Apple MacBook Pro 16 2019 i9 5500M | |
| Média Intel Core i7-9750H (170 - 194, n=82) | |
| CPU Multi 64Bit | |
| Média da turma Workstation (2489 - 5810, n=24, últimos 2 anos) | |
| Apple MacBook Pro 16 2019 i9 5500M (macOS 10.15.1) | |
| Apple MacBook Pro 16 2019 i9 5500M (Win 10) | |
| Lenovo ThinkPad P73-20QR002DGE | |
| Asus ProArt StudioBook Pro 17 W700G3T (Auto) | |
| Asus ProArt StudioBook Pro 17 W700G3T (Turbo) | |
| MSI WS75 9TL-636 | |
| Média Intel Core i7-9750H (952 - 1306, n=85) | |
| Acer ConceptD 5 CN517-71-74YA | |
| PCMark 8 | |
| Home Score Accelerated v2 | |
| Apple MacBook Pro 16 2019 i9 5500M | |
| MSI WS75 9TL-636 | |
| Asus ProArt StudioBook Pro 17 W700G3T | |
| Média Intel Core i7-9750H, NVIDIA Quadro RTX 3000 Max-Q (n=1) | |
| Work Score Accelerated v2 | |
| MSI WS75 9TL-636 | |
| Asus ProArt StudioBook Pro 17 W700G3T | |
| Média Intel Core i7-9750H, NVIDIA Quadro RTX 3000 Max-Q (n=1) | |
| Apple MacBook Pro 16 2019 i9 5500M | |
| PCMark 8 Home Score Accelerated v2 | 4322 pontos | |
| PCMark 8 Creative Score Accelerated v2 | 6968 pontos | |
| PCMark 8 Work Score Accelerated v2 | 5241 pontos | |
| PCMark 10 Score | 4918 pontos | |
Ajuda | ||

| 3DMark 11 - 1280x720 Performance GPU | |
| Média da turma Workstation (12535 - 69594, n=24, últimos 2 anos) | |
| Gigabyte Aero 17 HDR XB | |
| MSI WS75 9TL-636 | |
| Asus Zephyrus G14 GA401IV | |
| Schenker XMG Pro 17 PB71RD-G | |
| MSI WE75 9TK | |
| Média NVIDIA Quadro RTX 3000 Max-Q (17074 - 19513, n=3) | |
| Lenovo ThinkPad P73-20QR002DGE | |
| Asus ProArt StudioBook Pro 17 W700G3T | |
| Apple MacBook Pro 16 2019 i9 5500M | |
| Unigine Heaven 4.0 | |
| Extreme Preset OpenGL | |
| Média da turma Workstation (72.4 - 185.3, n=4, últimos 2 anos) | |
| MSI WS75 9TL-636 | |
| Asus ProArt StudioBook Pro 17 W700G3T | |
| Média NVIDIA Quadro RTX 3000 Max-Q (n=1) | |
| Lenovo ThinkPad P73-20QR002DGE | |
| Extreme Preset DX11 | |
| Média da turma Workstation (77.7 - 222, n=4, últimos 2 anos) | |
| Gigabyte Aero 17 HDR XB | |
| MSI WS75 9TL-636 | |
| Asus Zephyrus G14 GA401IV | |
| Asus ProArt StudioBook Pro 17 W700G3T | |
| Média NVIDIA Quadro RTX 3000 Max-Q (n=1) | |
| Lenovo ThinkPad P73-20QR002DGE | |
| Unigine Valley 1.0 | |
| 1920x1080 Extreme HD DirectX AA:x8 | |
| MSI WS75 9TL-636 | |
| Asus ProArt StudioBook Pro 17 W700G3T | |
| Média NVIDIA Quadro RTX 3000 Max-Q (n=1) | |
| Média da turma Workstation (n=1últimos 2 anos) | |
| Lenovo ThinkPad P73-20QR002DGE | |
| 1920x1080 Extreme HD Preset OpenGL AA:x8 | |
| MSI WS75 9TL-636 | |
| Asus ProArt StudioBook Pro 17 W700G3T | |
| Média NVIDIA Quadro RTX 3000 Max-Q (n=1) | |
| Lenovo ThinkPad P73-20QR002DGE | |
| Média da turma Workstation (n=1últimos 2 anos) | |
| Apple MacBook Pro 16 2019 i9 5500M | |
| 3DMark 11 Performance | 14763 pontos | |
| 3DMark Ice Storm Standard Score | 79168 pontos | |
| 3DMark Cloud Gate Standard Score | 32299 pontos | |
| 3DMark Fire Strike Score | 12130 pontos | |
| 3DMark Fire Strike Extreme Score | 6117 pontos | |
| 3DMark Time Spy Score | 5070 pontos | |
Ajuda | ||
| baixo | média | alto | ultra | QHD | 4K | |
|---|---|---|---|---|---|---|
| GTA V (2015) | 155 | 150 | 111.8 | 58.5 | 49.4 | 65 |
| The Witcher 3 (2015) | 236 | 166 | 95.9 | 48.5 | 33.8 | |
| Dota 2 Reborn (2015) | 131 | 120 | 115 | 109 | 75.6 | |
| Rise of the Tomb Raider (2016) | 195 | 139 | 96.7 | 80.8 | 34 | |
| X-Plane 11.11 (2018) | 106 | 92 | 78.6 | 64.4 | ||
| Shadow of the Tomb Raider (2018) | 86 | 76 | 71 | 65 | 43 | 21 |
| Hitman 2 (2018) | 66.3 | 63.2 | 57.5 | 55.9 | 44.8 | 24.3 |
| Dirt Rally 2.0 (2019) | 203 | 128 | 101 | 64 | 47.2 | |
| The Division 2 (2019) | 114 | 86 | 68 | 50 | 34 | 17 |
| Ghost Recon Breakpoint (2019) | 75 | 65 | 59 | 45 | 32 | 16 |
| GRID 2019 (2019) | 93 | 72.4 | 66.3 | 51.4 | 46.6 | 21.2 |
| Call of Duty Modern Warfare 2019 (2019) | 142.5 | 93.8 | 81 | 54.3 | 34 | 17.5 |
| Need for Speed Heat (2019) | 82 | 74.7 | 66.7 | 61.9 | 47.5 | 25.9 |
| Star Wars Jedi Fallen Order (2019) | 76.8 | 71.8 | 66.3 | 46.8 | 24.1 | |
| Doom Eternal (2020) | 178.3 | 119.2 | 104.4 | 102.6 | 67.5 | 31.6 |
Barulho
| Ocioso |
| 29.4 / 29.9 / 29.9 dB |
| Carga |
| 31.6 / 31.6 dB |
 | ||
30 dB silencioso 40 dB(A) audível 50 dB(A) ruidosamente alto |
||
min: | ||
| Asus ProArt StudioBook Pro 17 W700G3T Quadro RTX 3000 Max-Q, i7-9750H, Samsung SSD PM981 MZVLB1T0HALR | MSI WS75 9TL-636 Quadro RTX 4000 (Laptop), i7-9750H, Samsung SSD PM981 MZVLB1T0HALR | Apple MacBook Pro 16 2019 i9 5500M Radeon Pro 5500M, i9-9880H, Apple SSD AP1024 7171 | Acer ConceptD 5 CN517-71-74YA GeForce RTX 2060 Mobile, i7-9750H, WDC PC SN720 SDAQNTW-1T00 | Gigabyte Aero 17 HDR XB GeForce RTX 2070 Super Max-Q, i7-10875H, Samsung SSD PM981a MZVLB512HBJQ | |
|---|---|---|---|---|---|
| Noise | -14% | -18% | -12% | -35% | |
| desligado / ambiente * (dB) | 29.4 | 29.4 -0% | 29.8 -1% | 29.8 -1% | 30 -2% |
| Idle Minimum * (dB) | 29.4 | 29.4 -0% | 29.9 -2% | 29.7 -1% | 35 -19% |
| Idle Average * (dB) | 29.9 | 30.1 -1% | 29.9 -0% | 29.7 1% | 36 -20% |
| Idle Maximum * (dB) | 29.9 | 30.9 -3% | 29.9 -0% | 29.7 1% | 38 -27% |
| Load Average * (dB) | 31.6 | 40.7 -29% | 43 -36% | 39.9 -26% | 47 -49% |
| Witcher 3 ultra * (dB) | 31.6 | 41.9 -33% | 45.4 -44% | 39.5 -25% | 49 -55% |
| Load Maximum * (dB) | 31.6 | 42.7 -35% | 46.1 -46% | 41 -30% | 54 -71% |
* ... menor é melhor
(-) A temperatura máxima no lado superior é 45.4 °C / 114 F, em comparação com a média de 38.2 °C / 101 F , variando de 22.2 a 69.8 °C para a classe Workstation.
(-) A parte inferior aquece até um máximo de 53.7 °C / 129 F, em comparação com a média de 41.1 °C / 106 F
(+) Em uso inativo, a temperatura média para o lado superior é 21.3 °C / 70 F, em comparação com a média do dispositivo de 32 °C / ### class_avg_f### F.
(±) Jogando The Witcher 3, a temperatura média para o lado superior é 36.5 °C / 98 F, em comparação com a média do dispositivo de 32 °C / ## #class_avg_f### F.
(+) Os apoios para as mãos e o touchpad são mais frios que a temperatura da pele, com um máximo de 31.5 °C / 88.7 F e, portanto, são frios ao toque.
(-) A temperatura média da área do apoio para as mãos de dispositivos semelhantes foi 27.8 °C / 82 F (-3.7 °C / -6.7 F).
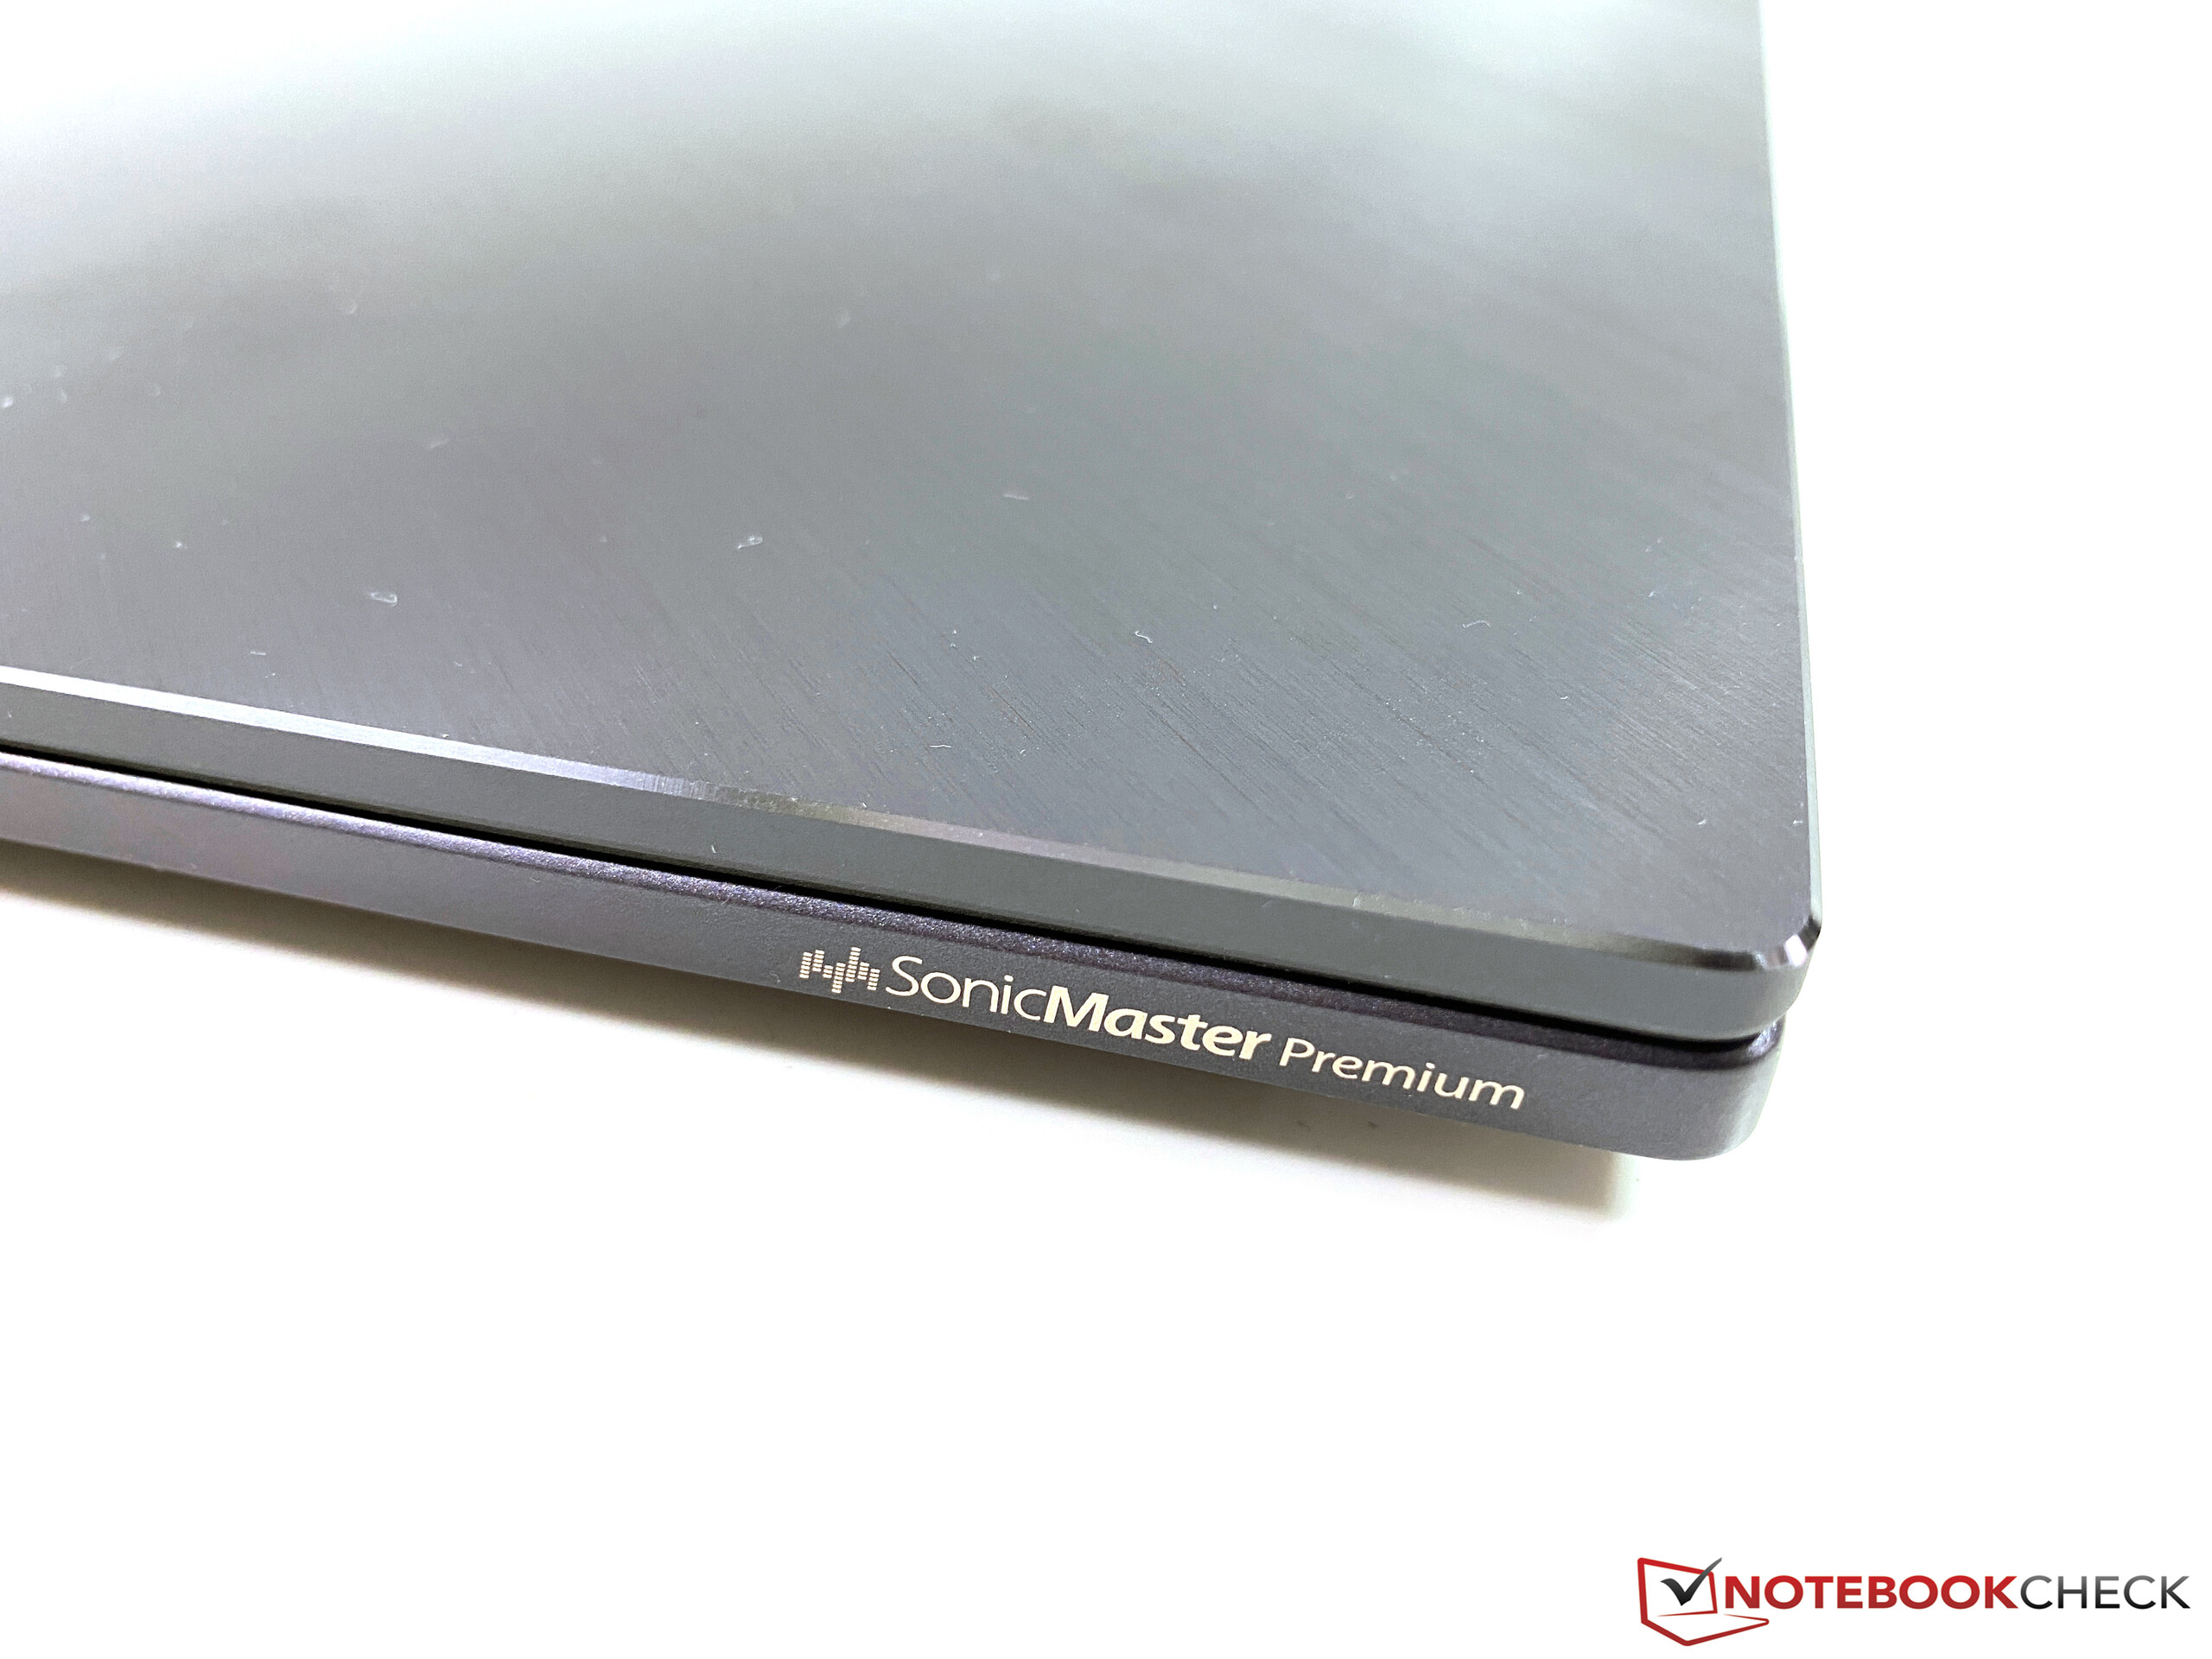
Asus ProArt StudioBook Pro 17 W700G3T análise de áudio
(±) | o volume do alto-falante é médio, mas bom (###valor### dB)
Graves 100 - 315Hz
(-) | quase nenhum baixo - em média 15% menor que a mediana
(±) | a linearidade dos graves é média (11% delta para a frequência anterior)
Médios 400 - 2.000 Hz
(+) | médios equilibrados - apenas 3.4% longe da mediana
(+) | médios são lineares (4.4% delta para frequência anterior)
Altos 2 - 16 kHz
(+) | agudos equilibrados - apenas 4.5% longe da mediana
(+) | os máximos são lineares (6.9% delta da frequência anterior)
Geral 100 - 16.000 Hz
(±) | a linearidade do som geral é média (17.1% diferença em relação à mediana)
Comparado com a mesma classe
» 50% de todos os dispositivos testados nesta classe foram melhores, 9% semelhantes, 41% piores
» O melhor teve um delta de 7%, a média foi 17%, o pior foi 35%
Comparado com todos os dispositivos testados
» 31% de todos os dispositivos testados foram melhores, 8% semelhantes, 61% piores
» O melhor teve um delta de 4%, a média foi 24%, o pior foi 134%
MSI WS75 9TL-636 análise de áudio
(±) | o volume do alto-falante é médio, mas bom (###valor### dB)
Graves 100 - 315Hz
(-) | quase nenhum baixo - em média 25.9% menor que a mediana
(±) | a linearidade dos graves é média (7.8% delta para a frequência anterior)
Médios 400 - 2.000 Hz
(±) | médios mais altos - em média 5.2% maior que a mediana
(±) | a linearidade dos médios é média (8.1% delta para frequência anterior)
Altos 2 - 16 kHz
(+) | agudos equilibrados - apenas 3.3% longe da mediana
(±) | a linearidade dos máximos é média (9.3% delta para frequência anterior)
Geral 100 - 16.000 Hz
(±) | a linearidade do som geral é média (27.5% diferença em relação à mediana)
Comparado com a mesma classe
» 94% de todos os dispositivos testados nesta classe foram melhores, 2% semelhantes, 4% piores
» O melhor teve um delta de 7%, a média foi 17%, o pior foi 35%
Comparado com todos os dispositivos testados
» 84% de todos os dispositivos testados foram melhores, 3% semelhantes, 13% piores
» O melhor teve um delta de 4%, a média foi 24%, o pior foi 134%
| desligado | |
| Ocioso | |
| Carga |
|
Key:
min: | |
| Asus ProArt StudioBook Pro 17 W700G3T i7-9750H, Quadro RTX 3000 Max-Q, Samsung SSD PM981 MZVLB1T0HALR, IPS, 1920x1200, 17" | MSI WS75 9TL-636 i7-9750H, Quadro RTX 4000 (Laptop), Samsung SSD PM981 MZVLB1T0HALR, IPS, 1920x1080, 17.3" | Apple MacBook Pro 16 2019 i9 5500M i9-9880H, Radeon Pro 5500M, Apple SSD AP1024 7171, IPS, 3072x1920, 16" | Acer ConceptD 5 CN517-71-74YA i7-9750H, GeForce RTX 2060 Mobile, WDC PC SN720 SDAQNTW-1T00, IPS, 3840x2160, 17.3" | Gigabyte Aero 17 HDR XB i7-10875H, GeForce RTX 2070 Super Max-Q, Samsung SSD PM981a MZVLB512HBJQ, IPS, 3840x2160, 17.3" | Média NVIDIA Quadro RTX 3000 Max-Q | Média da turma Workstation | |
|---|---|---|---|---|---|---|---|
| Power Consumption | -24% | 23% | 7% | -41% | 6% | 6% | |
| Idle Minimum * (Watt) | 11.3 | 16.4 -45% | 3.7 67% | 6.2 45% | 16 -42% | 7.7 ? 32% | 9.04 ? 20% |
| Idle Average * (Watt) | 16 | 21.6 -35% | 12.1 24% | 15.2 5% | 19 -19% | 14.6 ? 9% | 13.8 ? 14% |
| Idle Maximum * (Watt) | 16.8 | 22.9 -36% | 17 -1% | 17.4 -4% | 30 -79% | 16.9 ? -1% | 17.7 ? -5% |
| Load Average * (Watt) | 93.6 | 88 6% | 91.5 2% | 95 -1% | 109 -16% | 111.1 ? -19% | 96.2 ? -3% |
| Witcher 3 ultra * (Watt) | 106 | 137 -29% | 103 3% | 136 -28% | 167 -58% | ||
| Load Maximum * (Watt) | 186.6 | 193 -3% | 102.3 45% | 145 22% | 246 -32% | 173.5 ? 7% | 178.5 ? 4% |
* ... menor é melhor
| Asus ProArt StudioBook Pro 17 W700G3T i7-9750H, Quadro RTX 3000 Max-Q, 57 Wh | MSI WS75 9TL-636 i7-9750H, Quadro RTX 4000 (Laptop), 82 Wh | Apple MacBook Pro 16 2019 i9 5500M i9-9880H, Radeon Pro 5500M, 99.8 Wh | Acer ConceptD 5 CN517-71-74YA i7-9750H, GeForce RTX 2060 Mobile, 55 Wh | Gigabyte Aero 17 HDR XB i7-10875H, GeForce RTX 2070 Super Max-Q, 94 Wh | Média da turma Workstation | |
|---|---|---|---|---|---|---|
| Duração da bateria | 1% | 34% | -5% | 20% | 22% | |
| H.264 (h) | 6.9 | 8.2 19% | 9.7 41% | 9.51 ? 38% | ||
| WiFi v1.3 (h) | 5.9 | 6.6 12% | 12 103% | 5.6 -5% | 6.2 5% | 8.52 ? 44% |
| Load (h) | 1.7 | 1.2 -29% | 1 -41% | 2.3 35% | 1.429 ? -16% | |
| Reader / Idle (h) | 12.6 | 9.9 | 26.1 ? | |||
| Witcher 3 ultra (h) | 0.9 |
Pro
Contra
Veredicto – O StudioBook Pro é retido por pequenas coisas
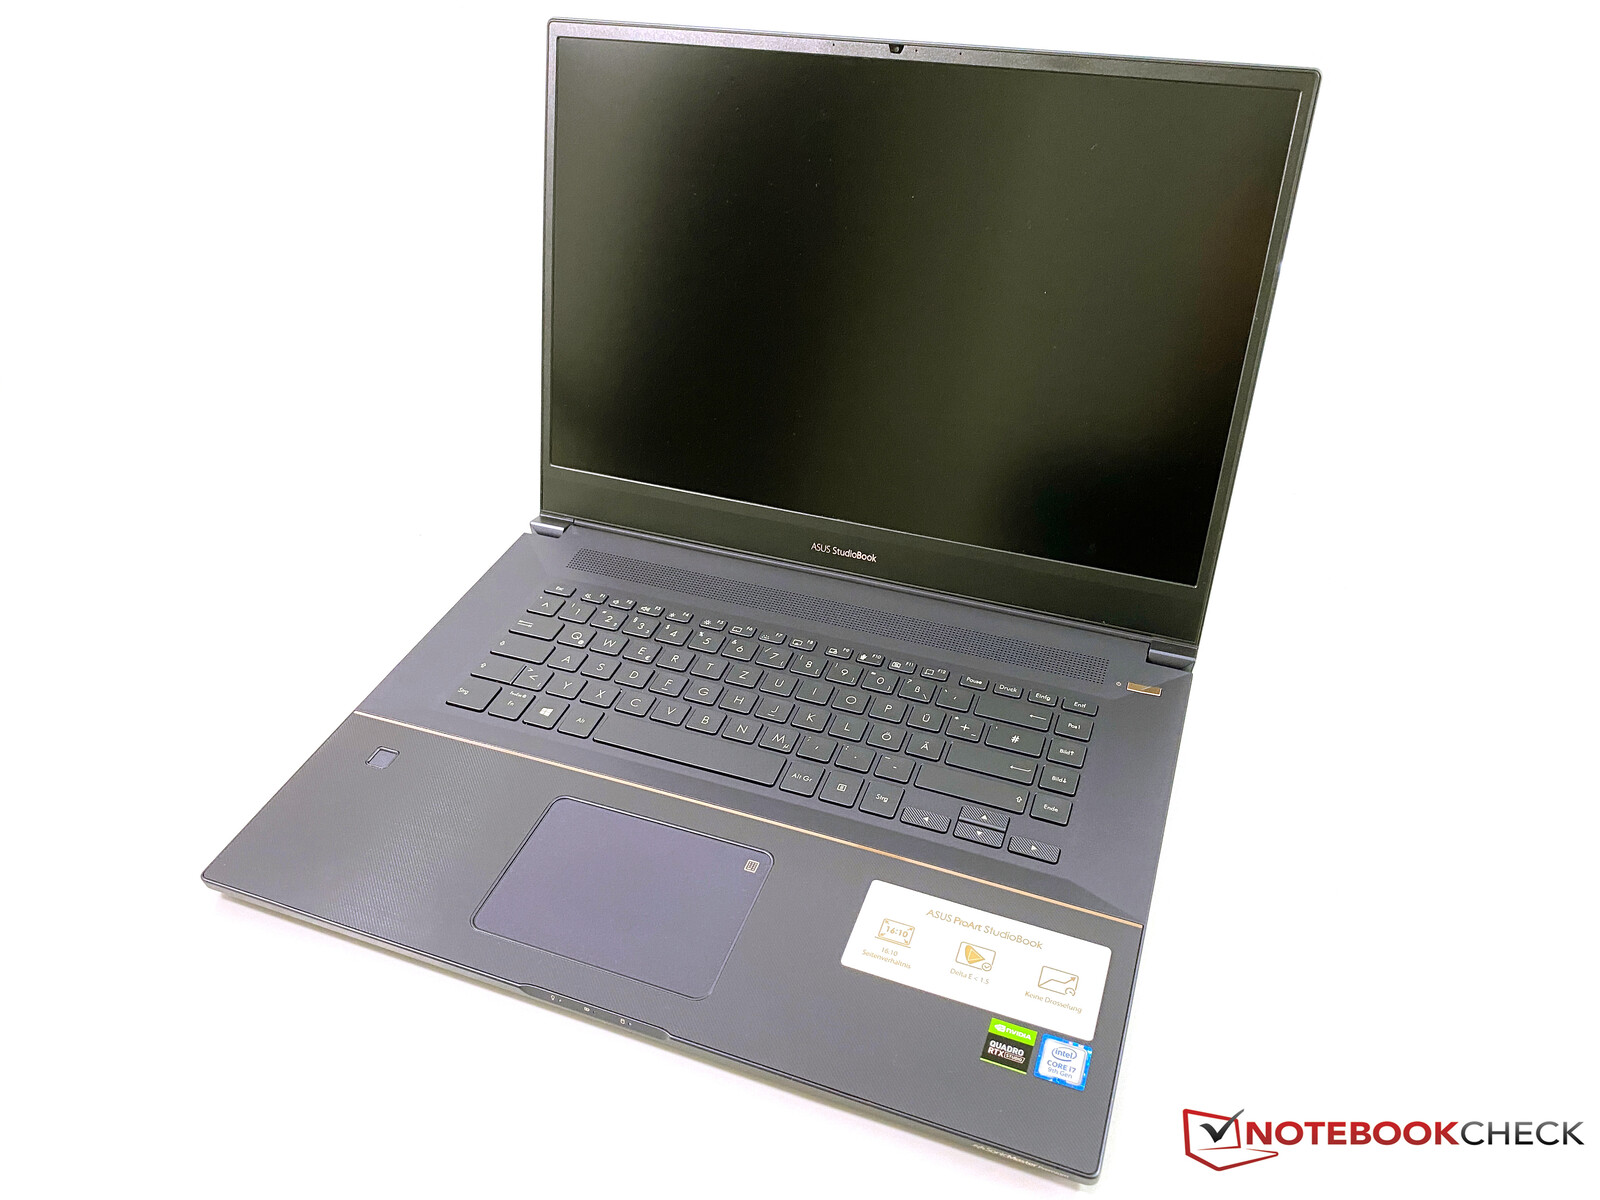
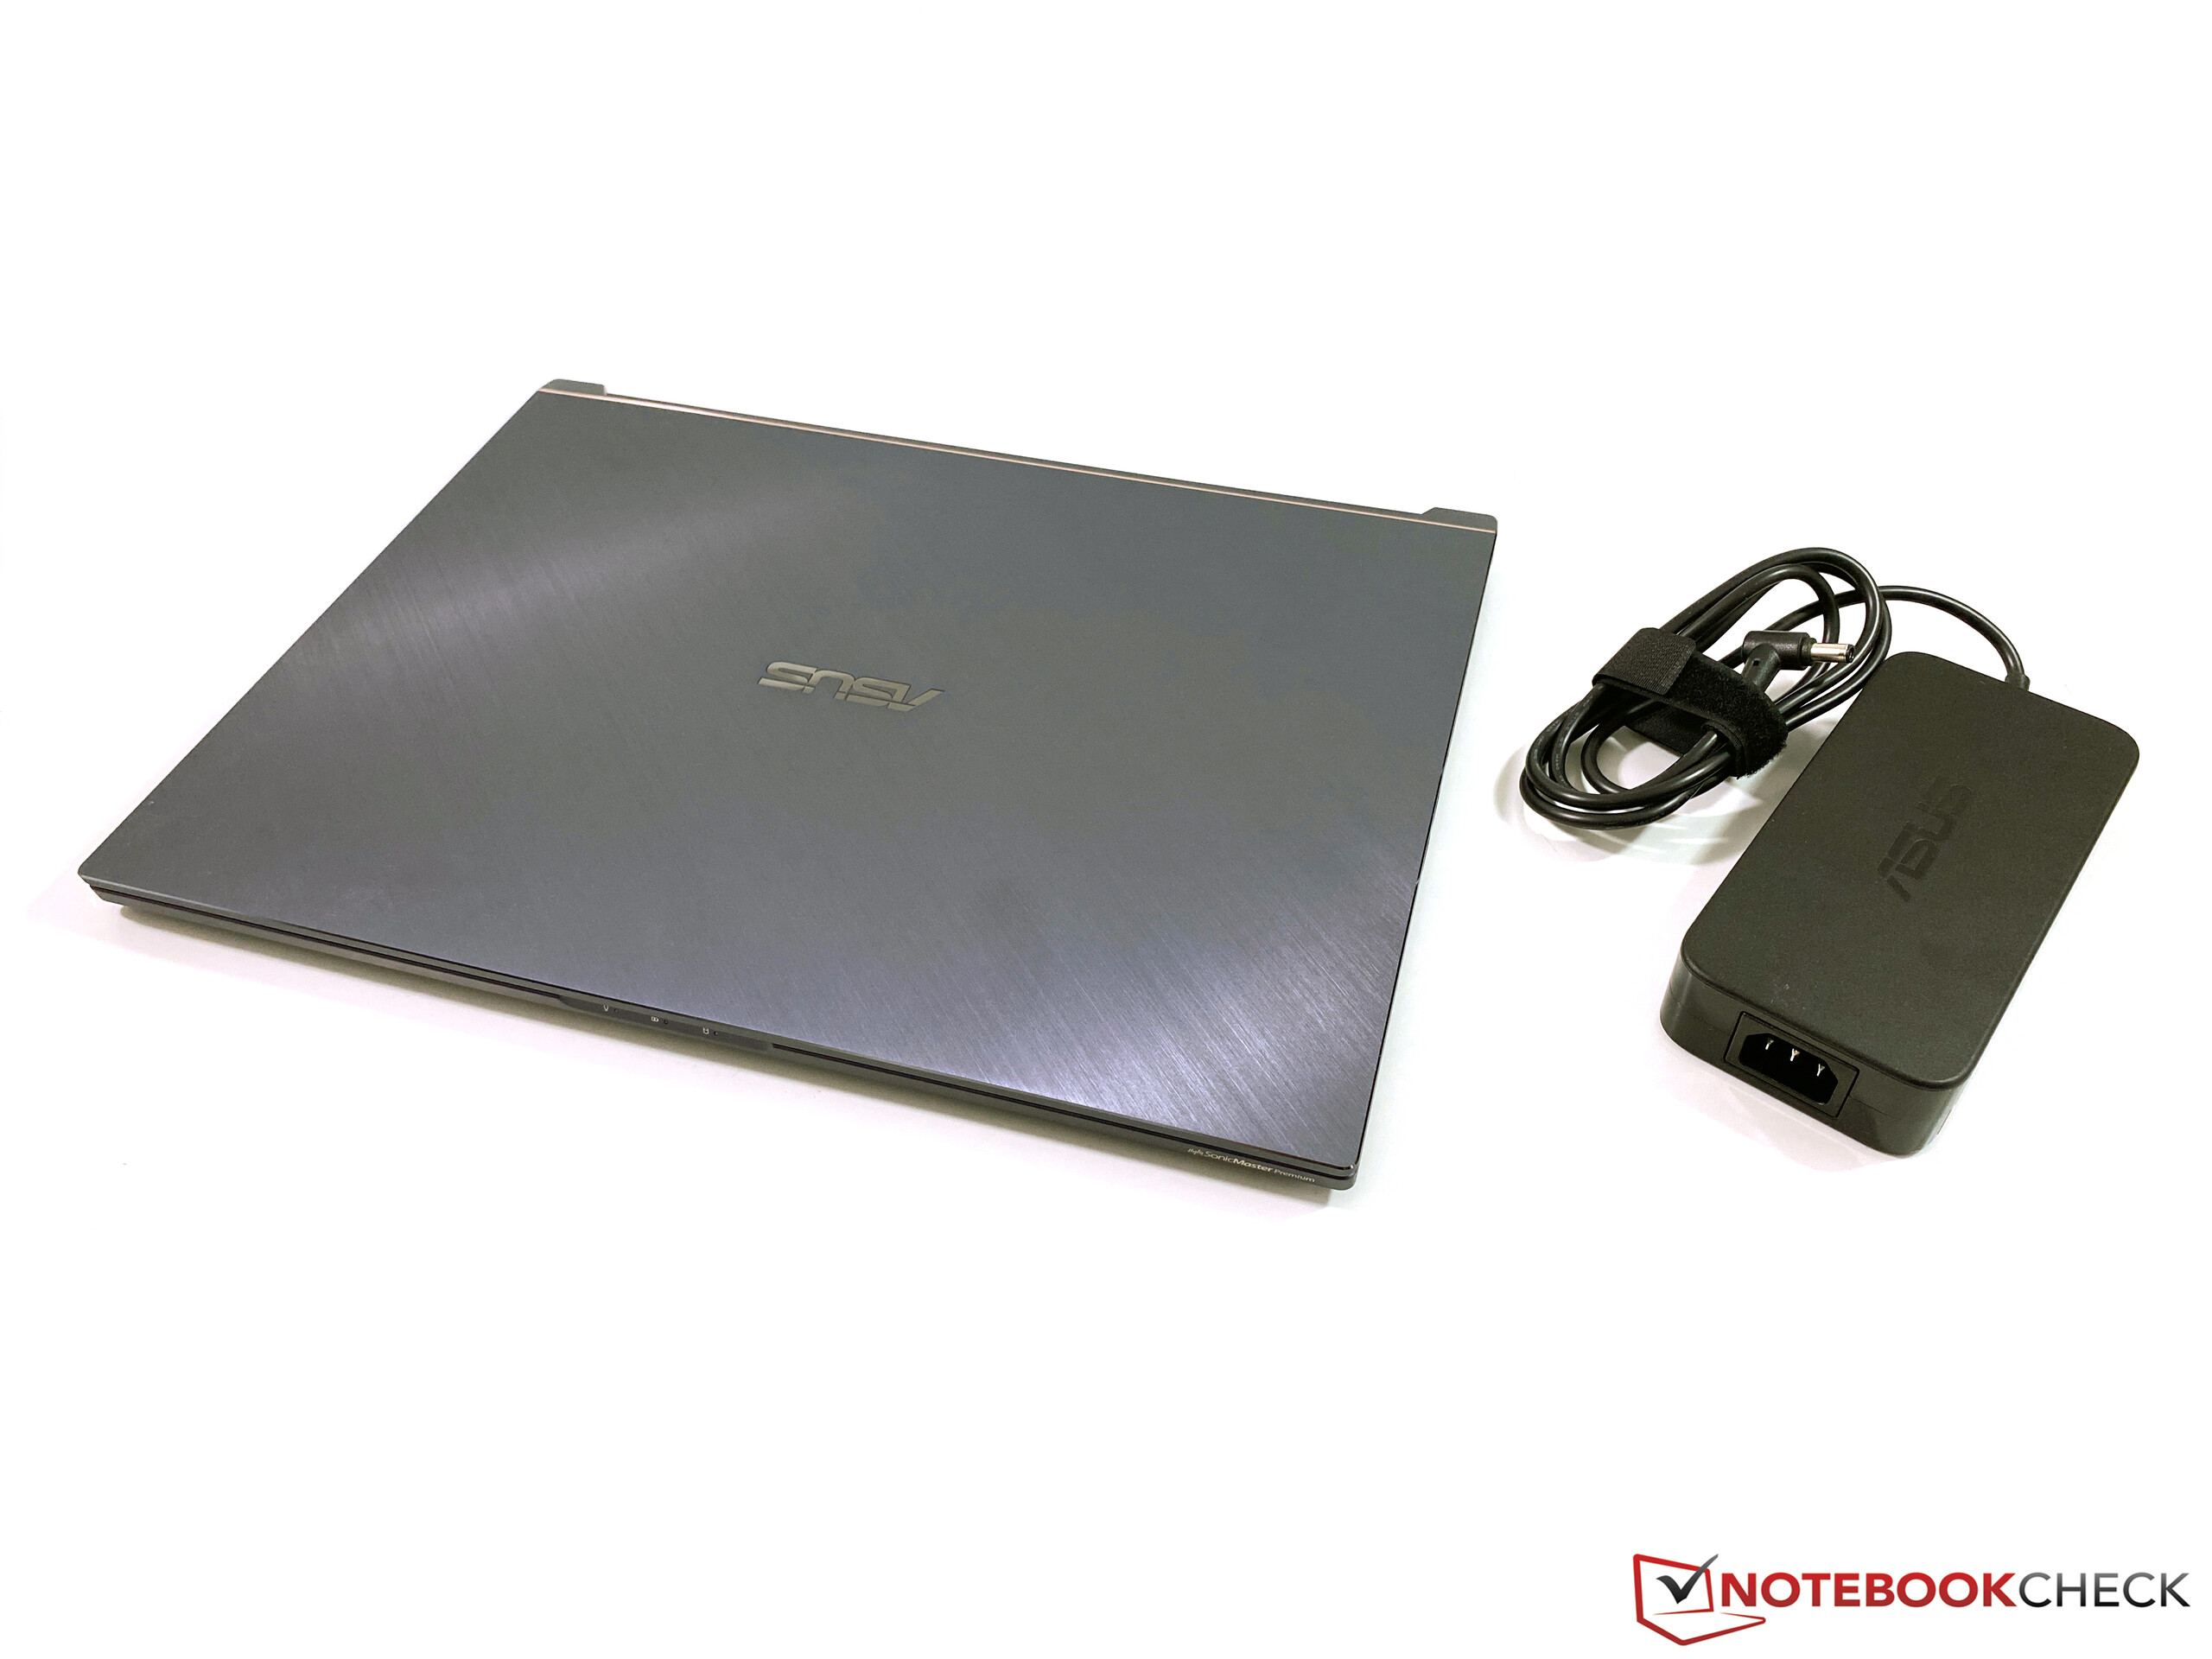
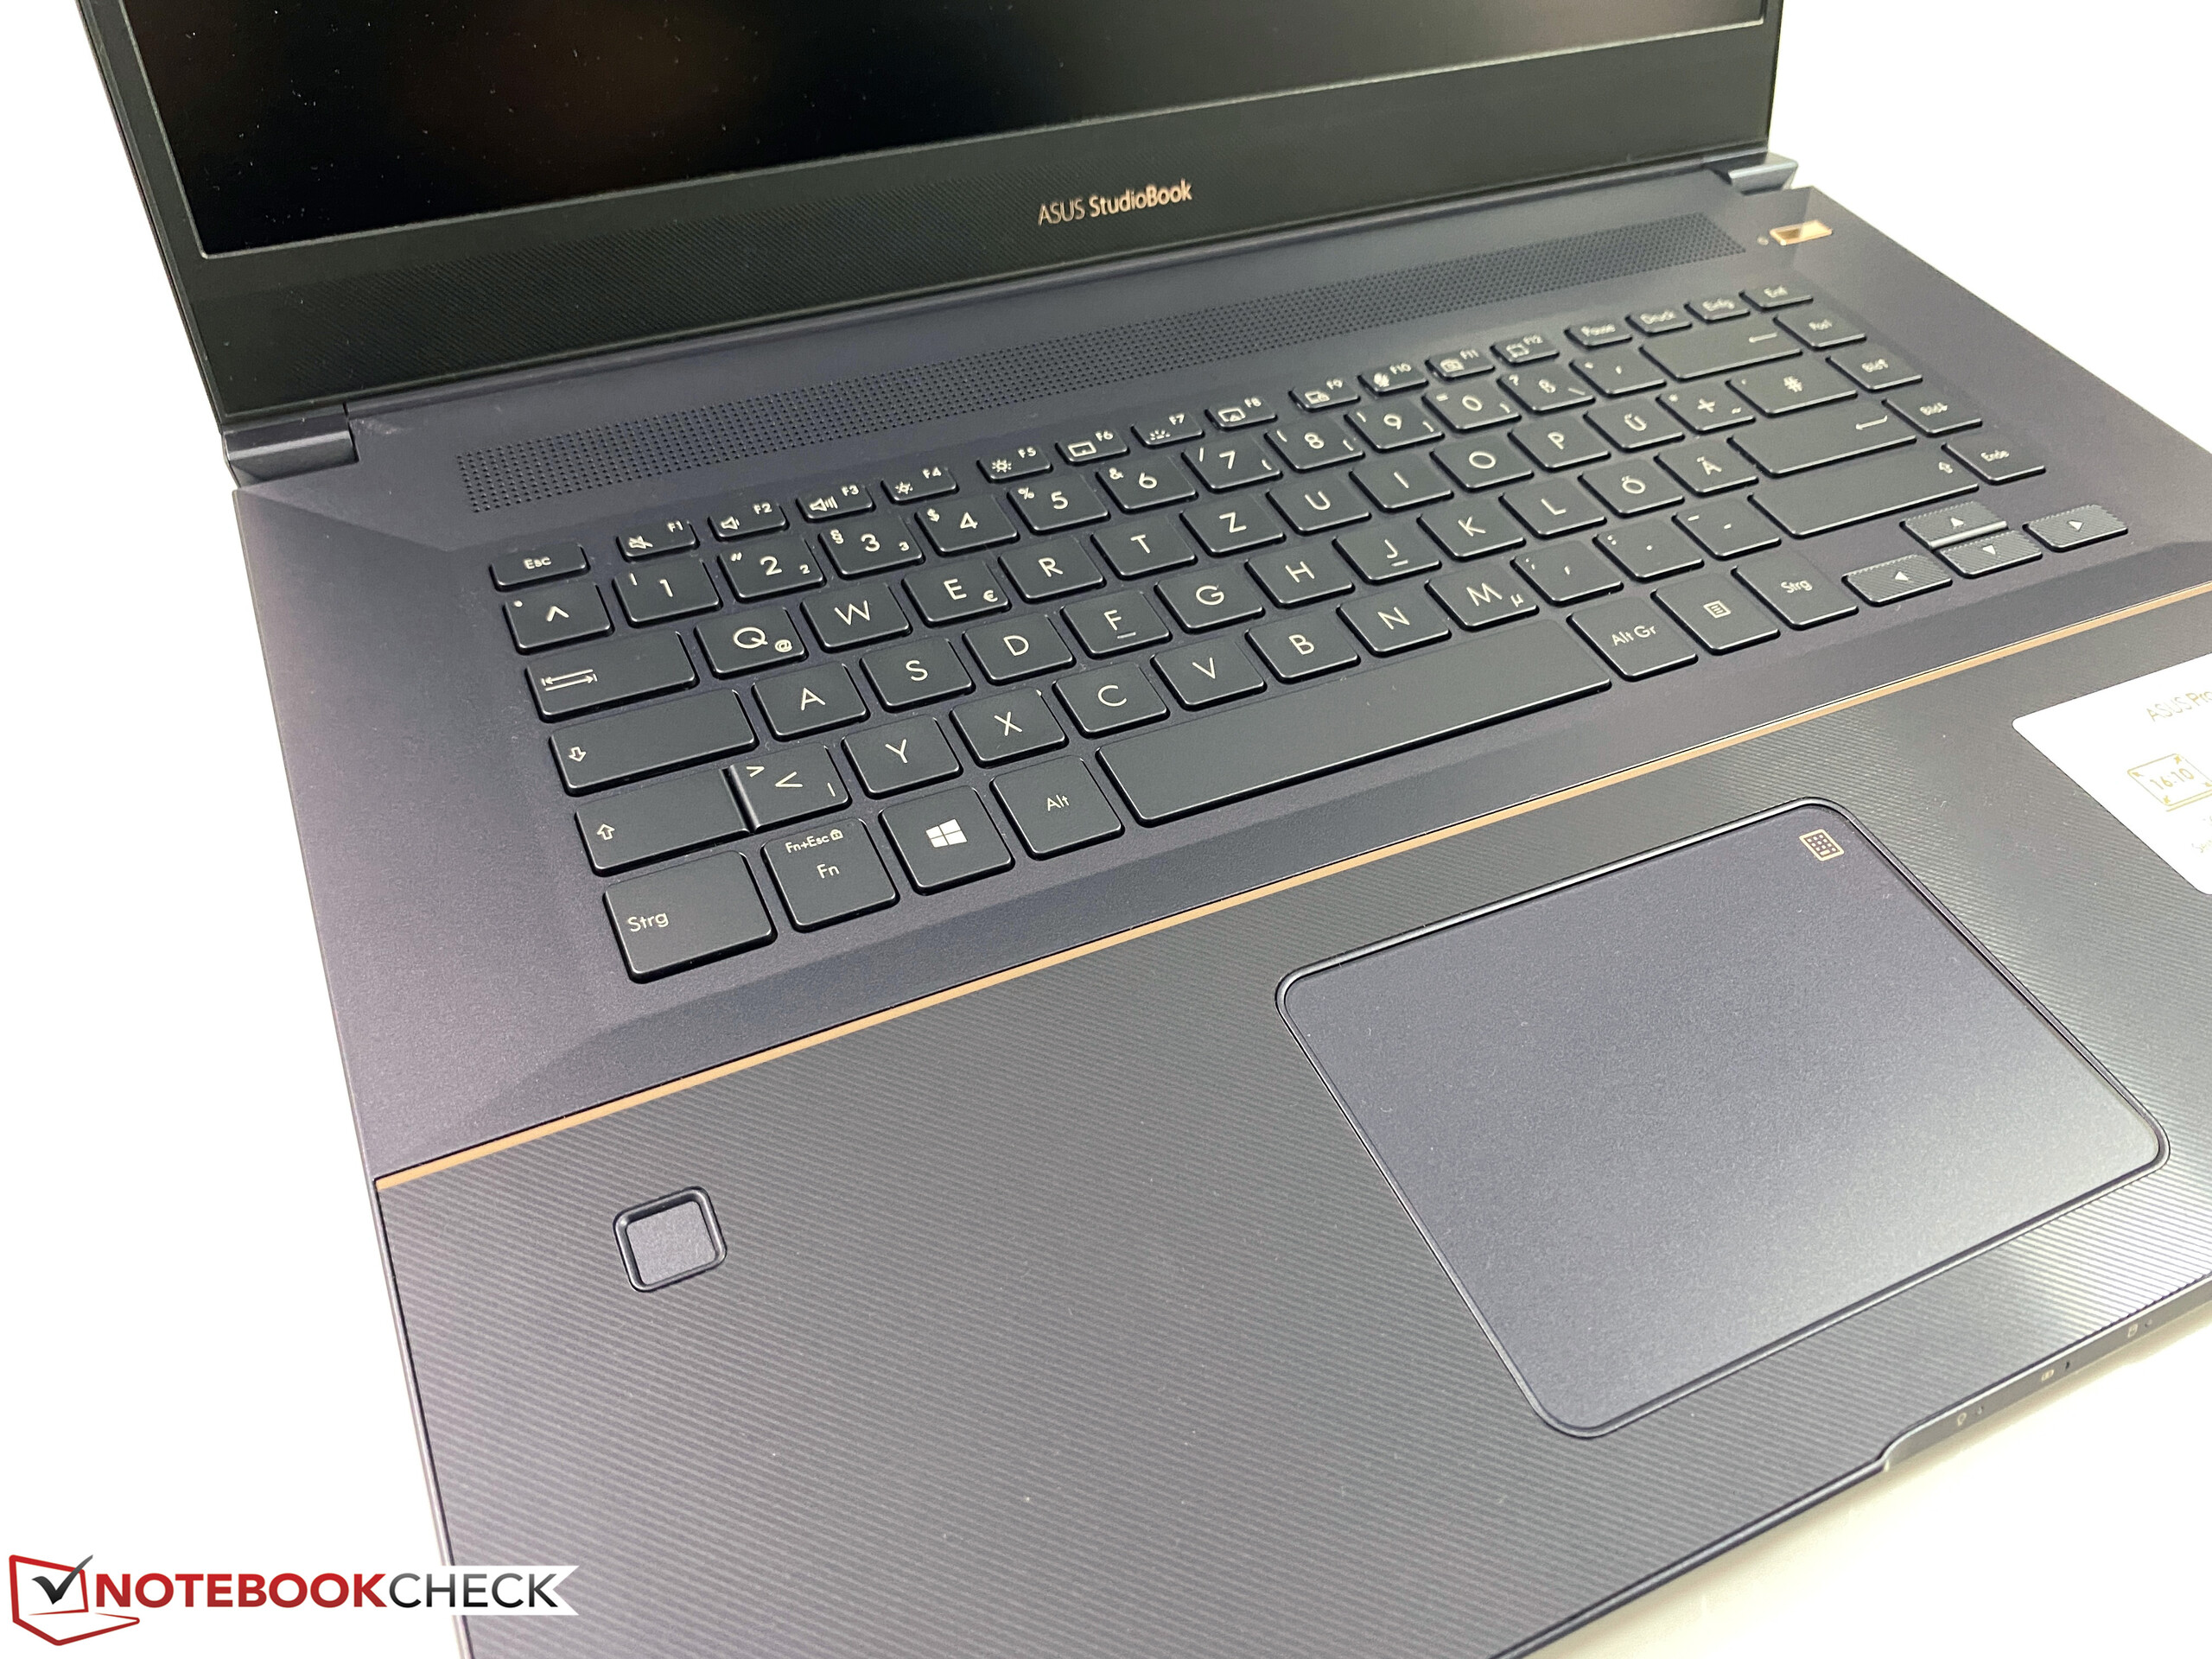
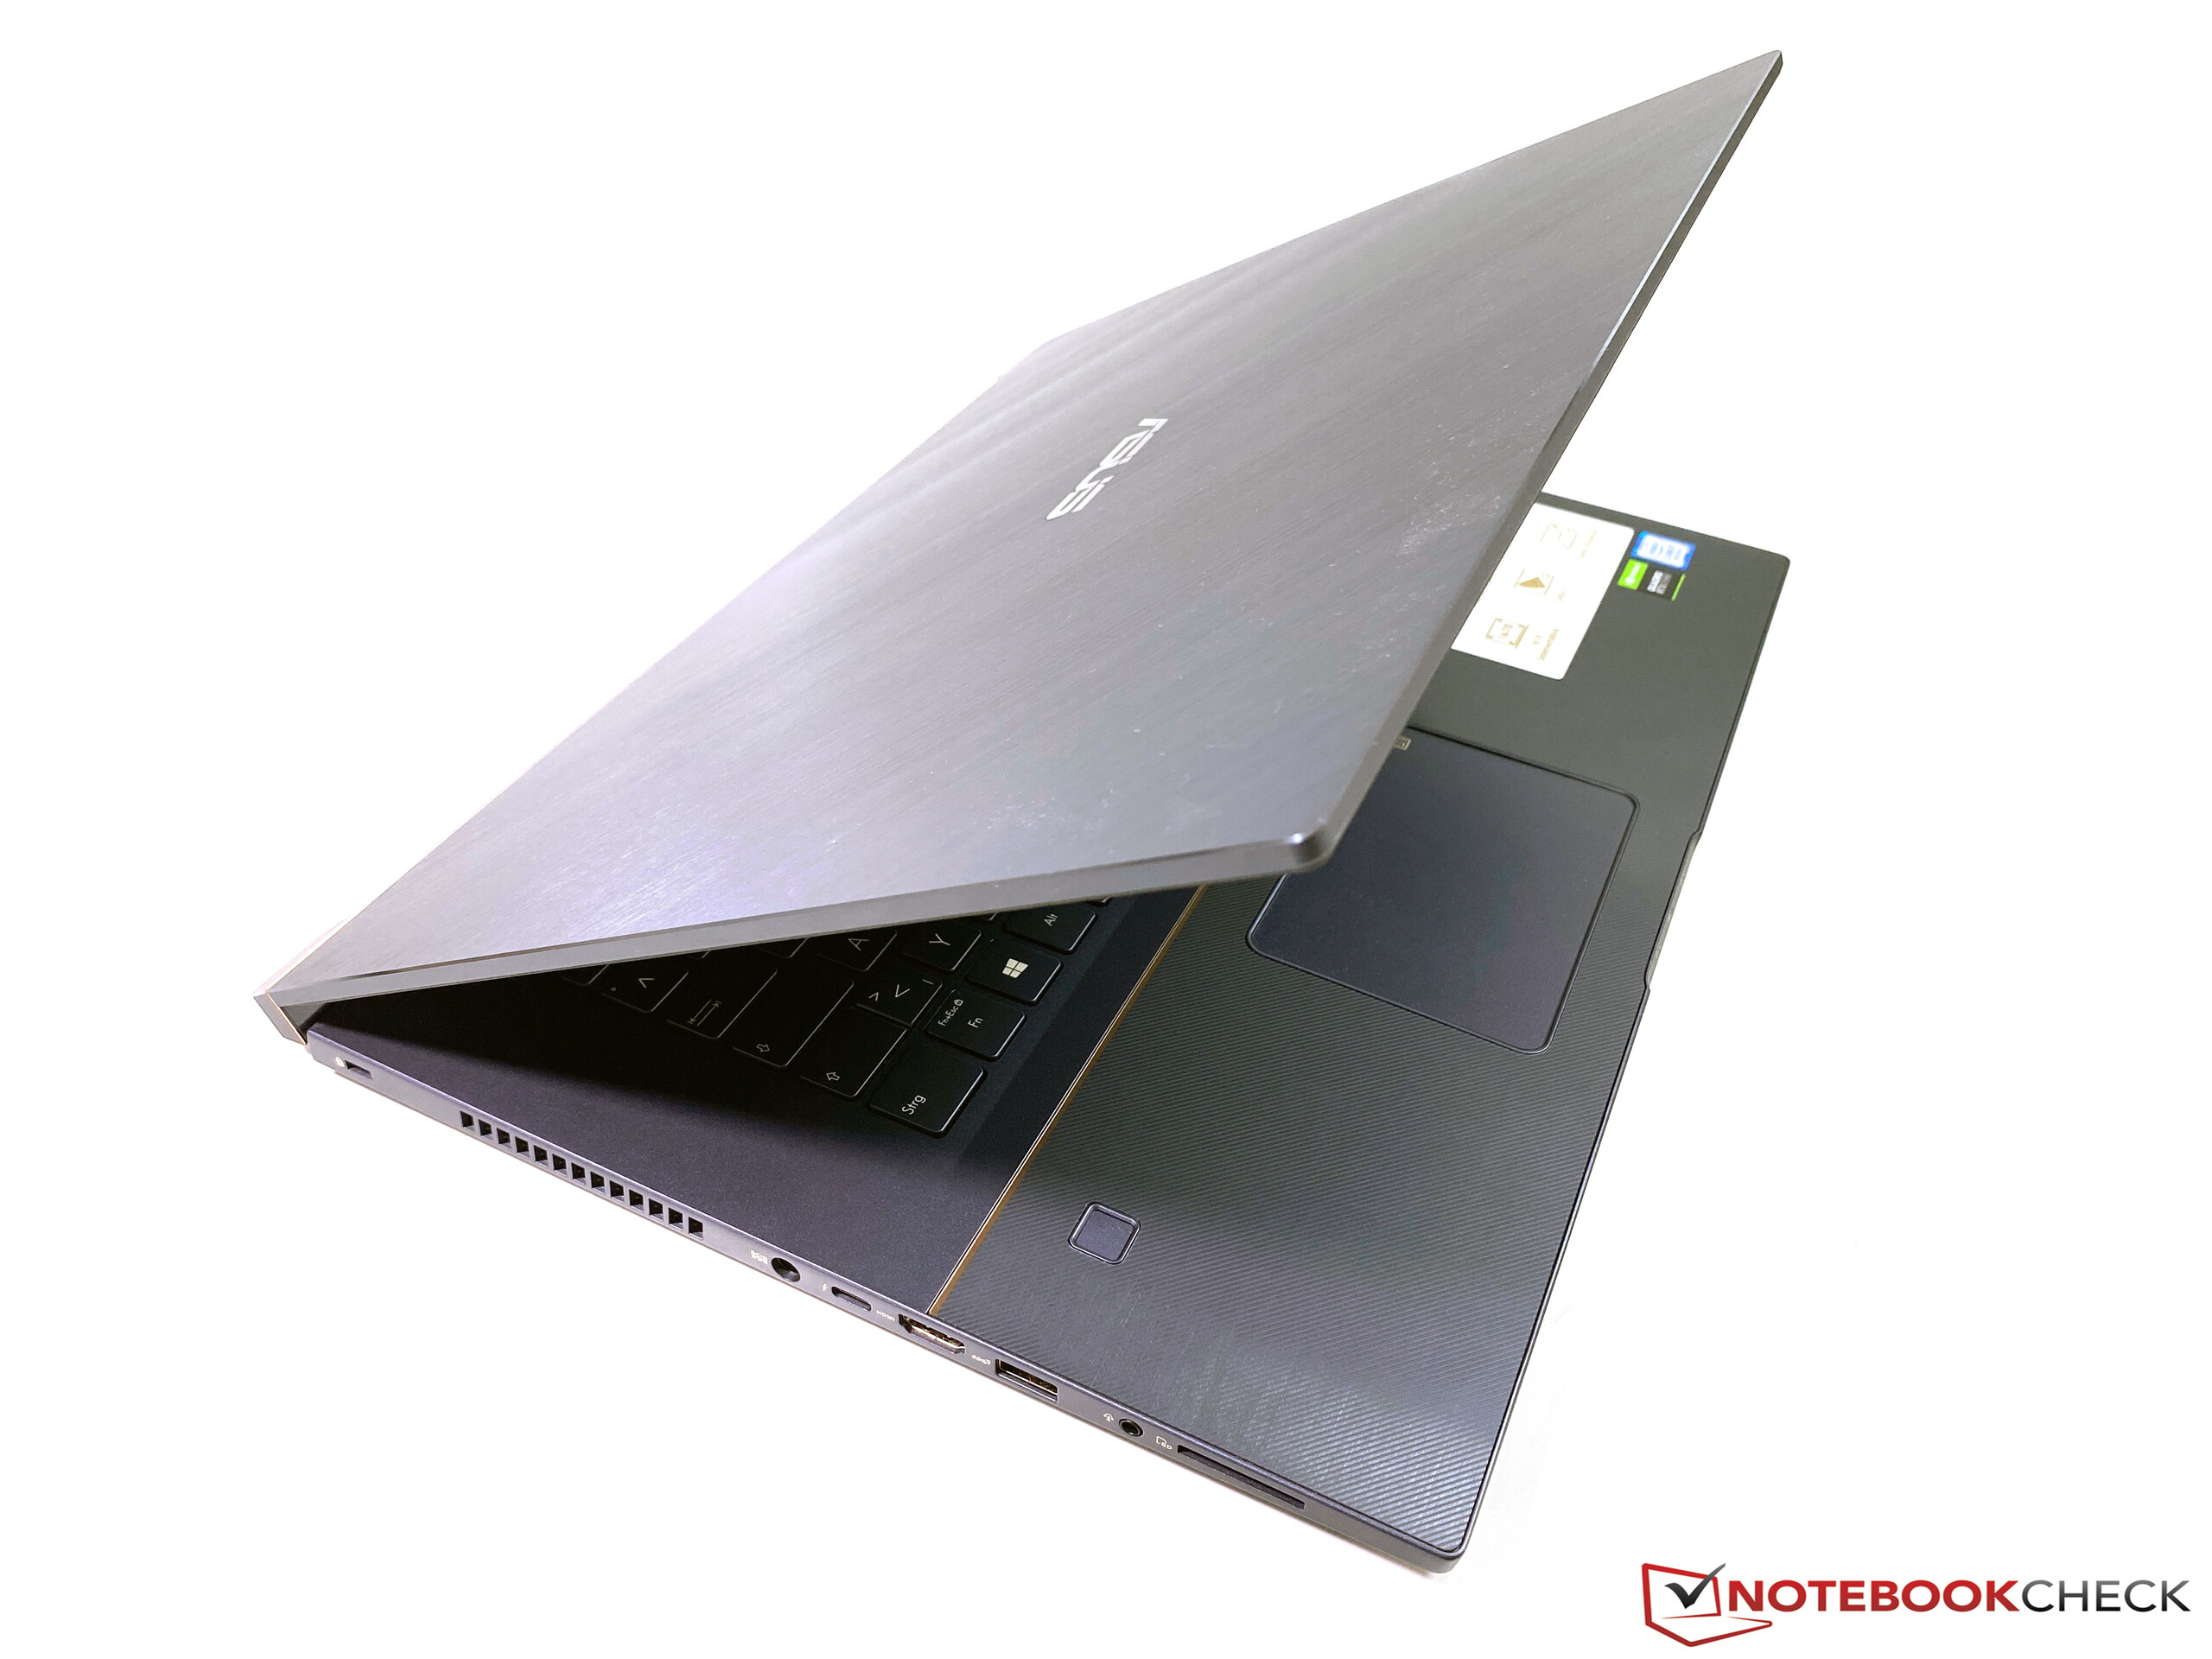
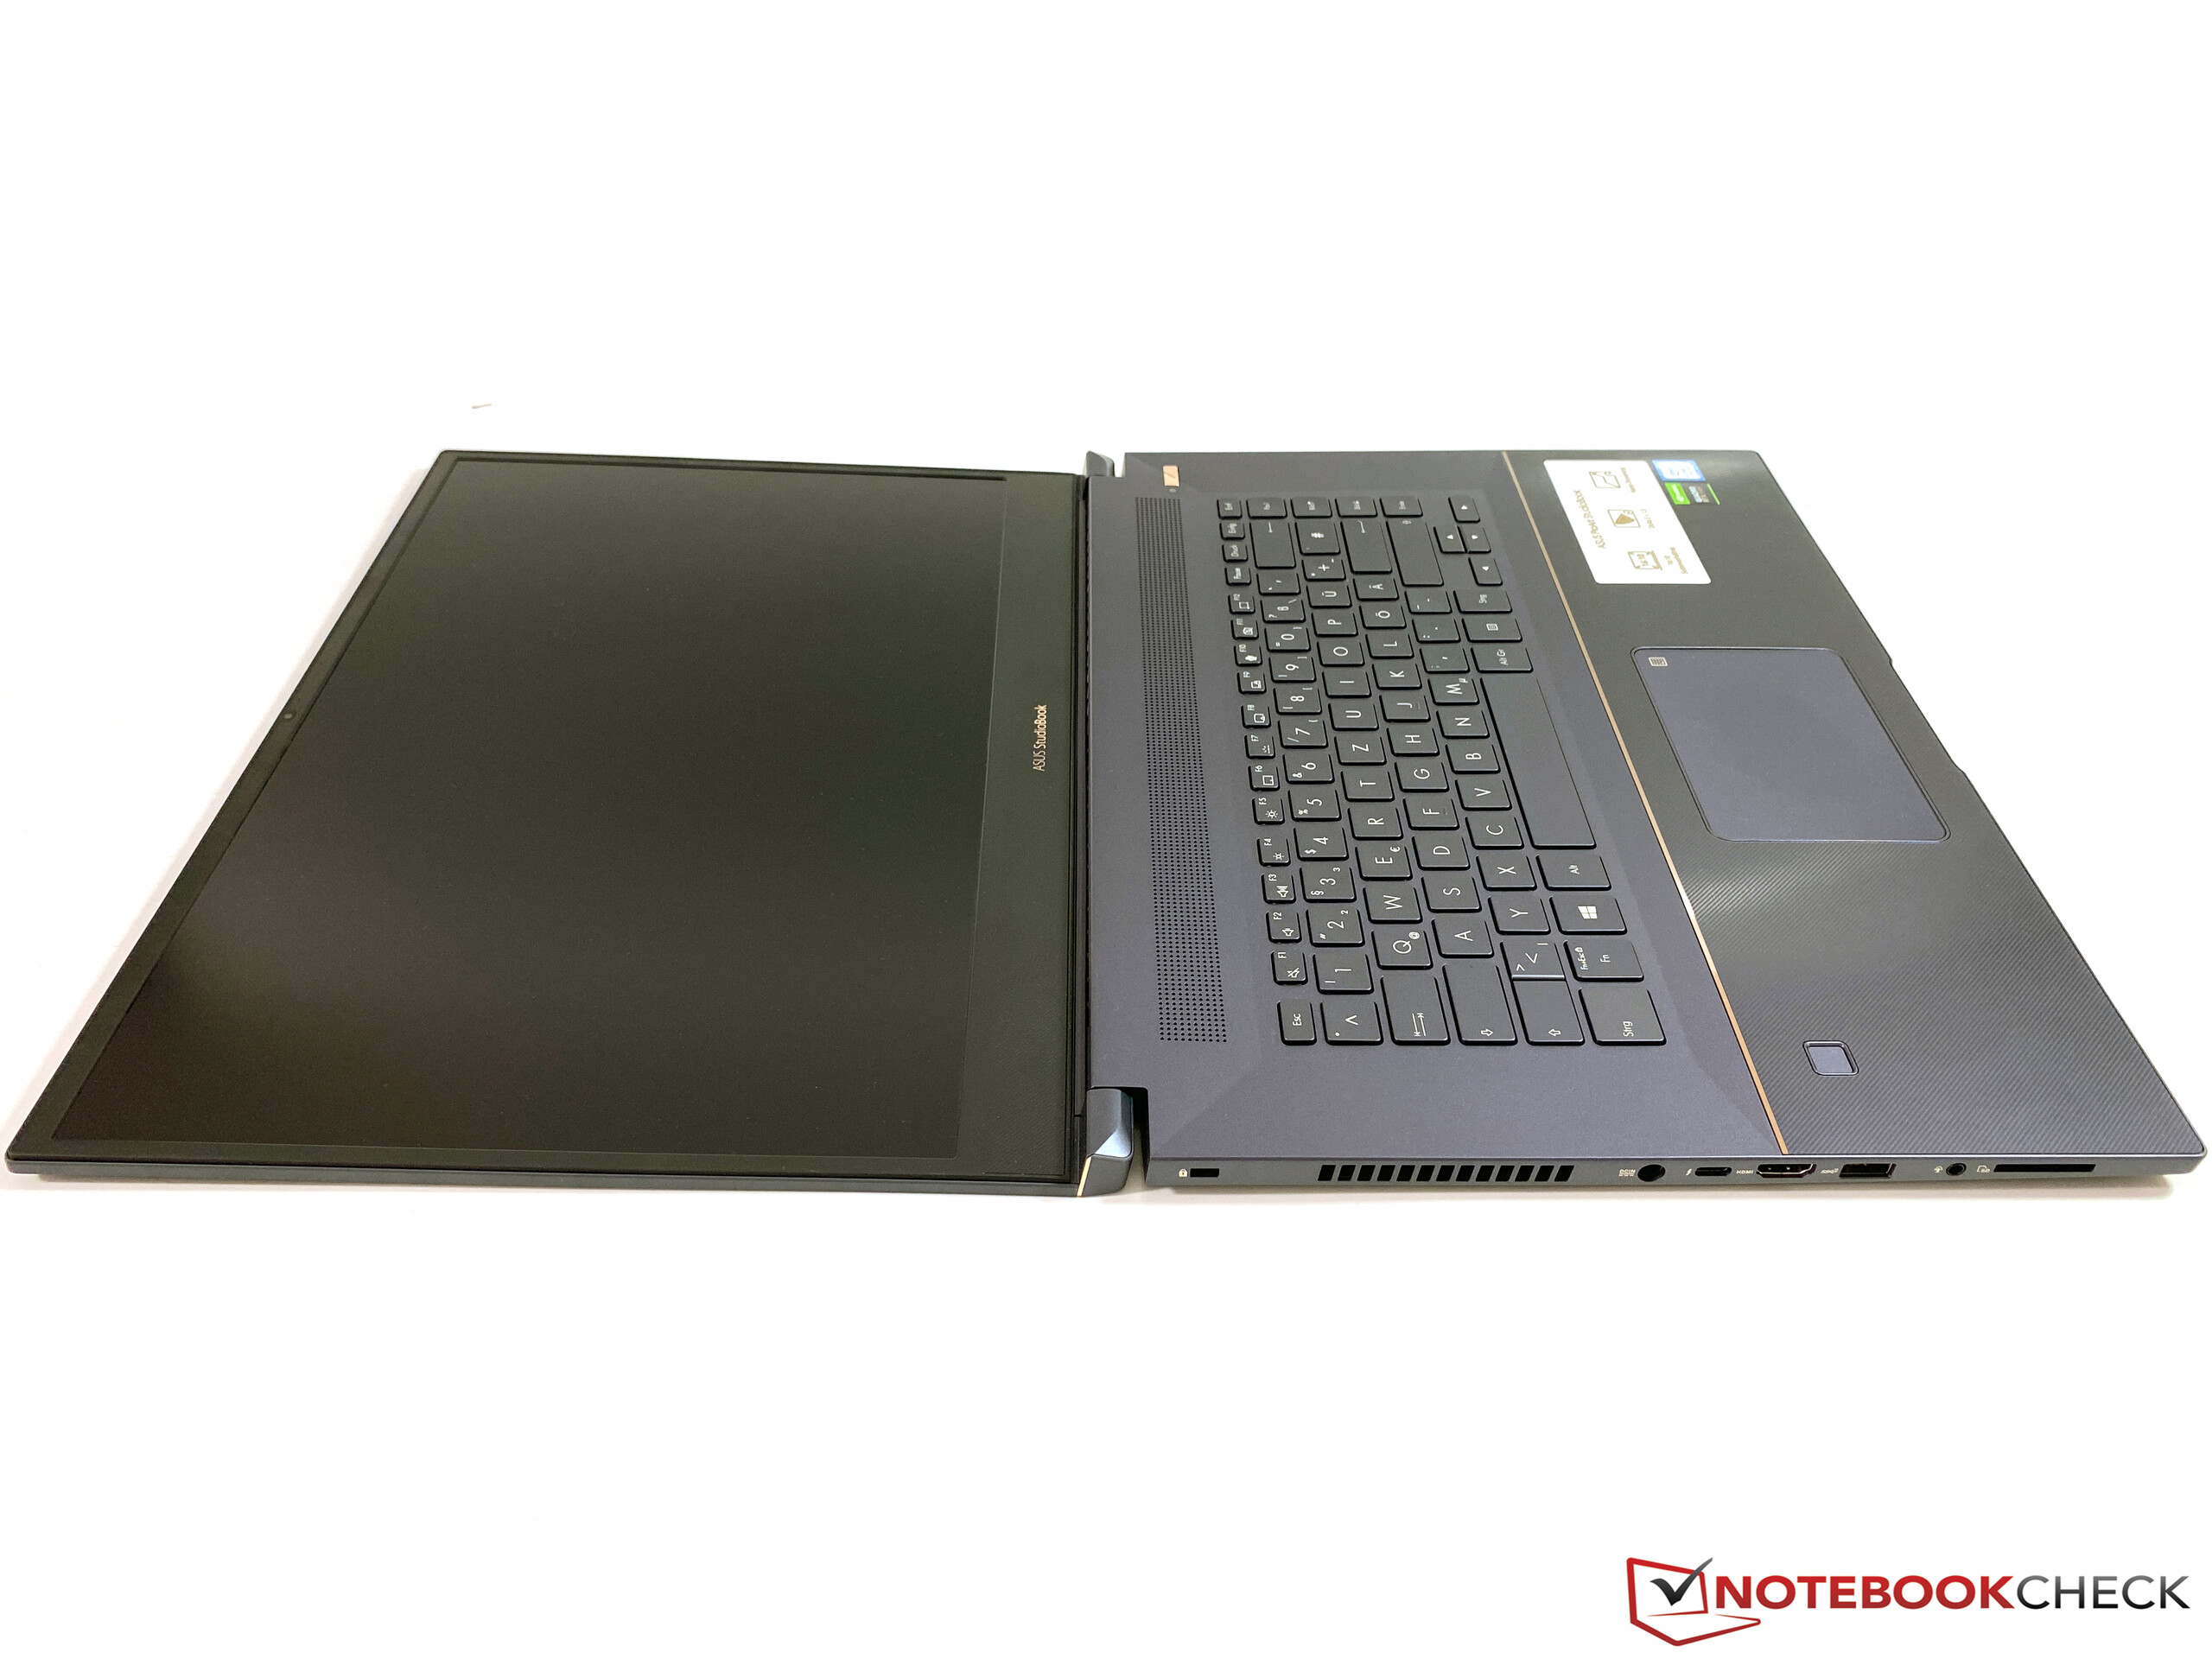
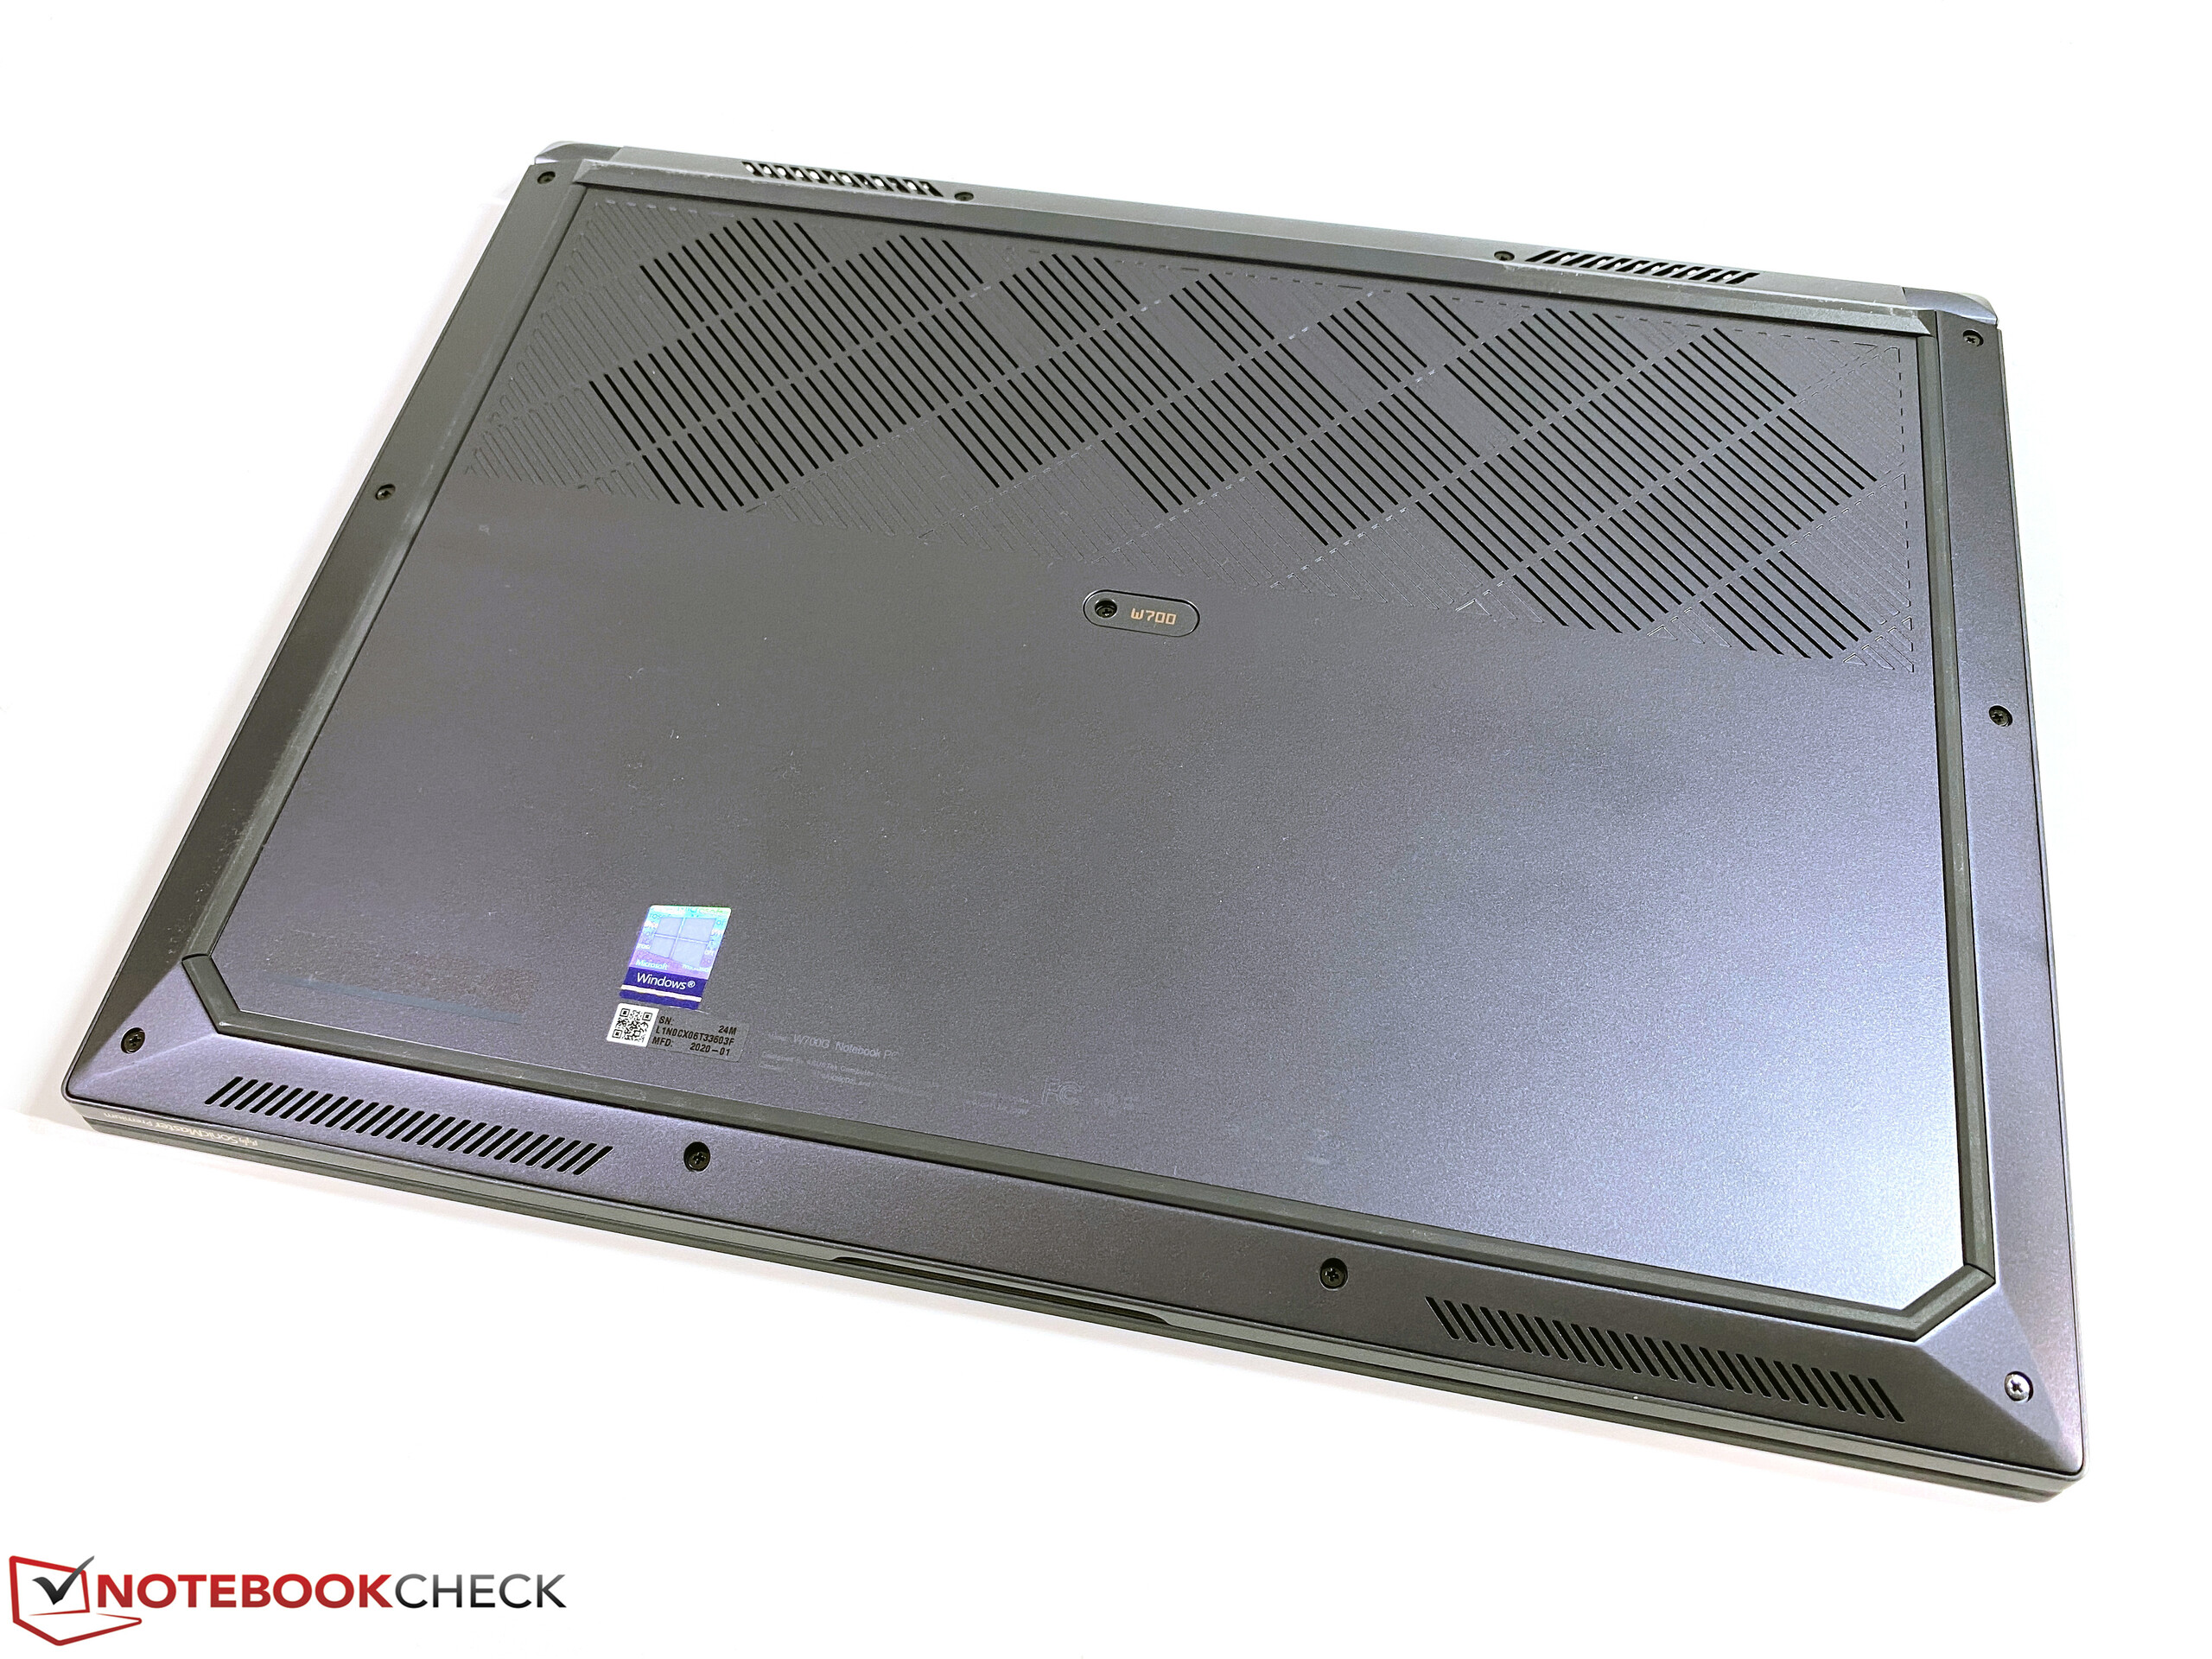
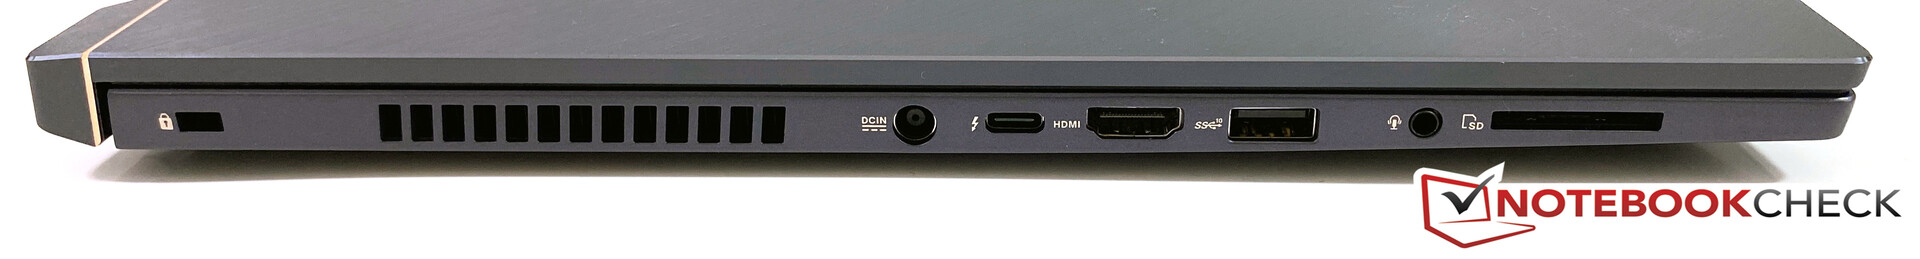
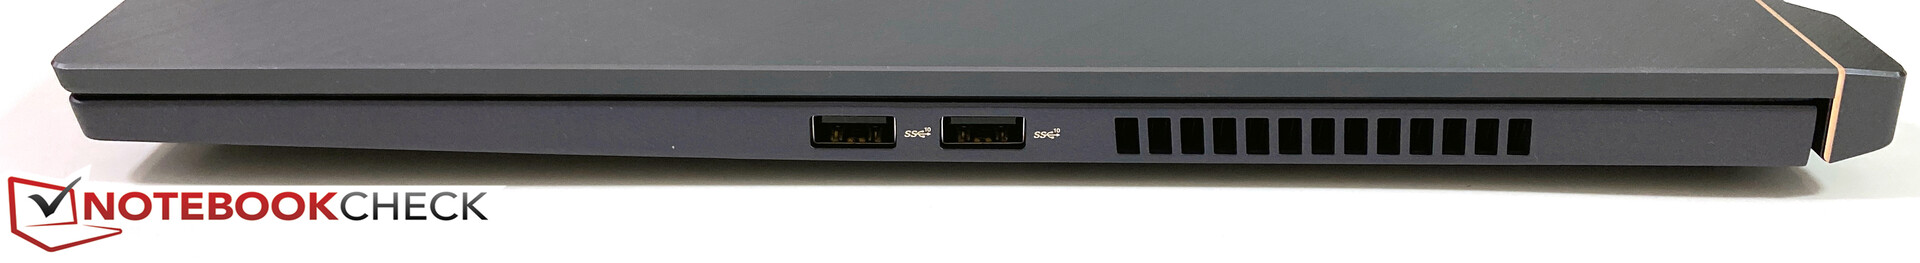
A Asus tenta vender o StudioBook Pro 17 a clientes profissionais e ao chamado grupo de criadores de conteúdo. O dispositivo de 17 polegadas convence com um chassi fino, porém resistente, mas alguns detalhes precisam de melhorias. Isso inclui o layout das portas e, especialmente, o conector de alimentação no centro do lado esquerdo foi um incômodo repetido durante o período em análise. Os dispositivos de entrada são decentes, mas também há um compromisso. Em vez de um teclado numérico dedicado (haveria espaço suficiente), você obtém um touchpad bastante pequeno com uma função de teclado numérico.
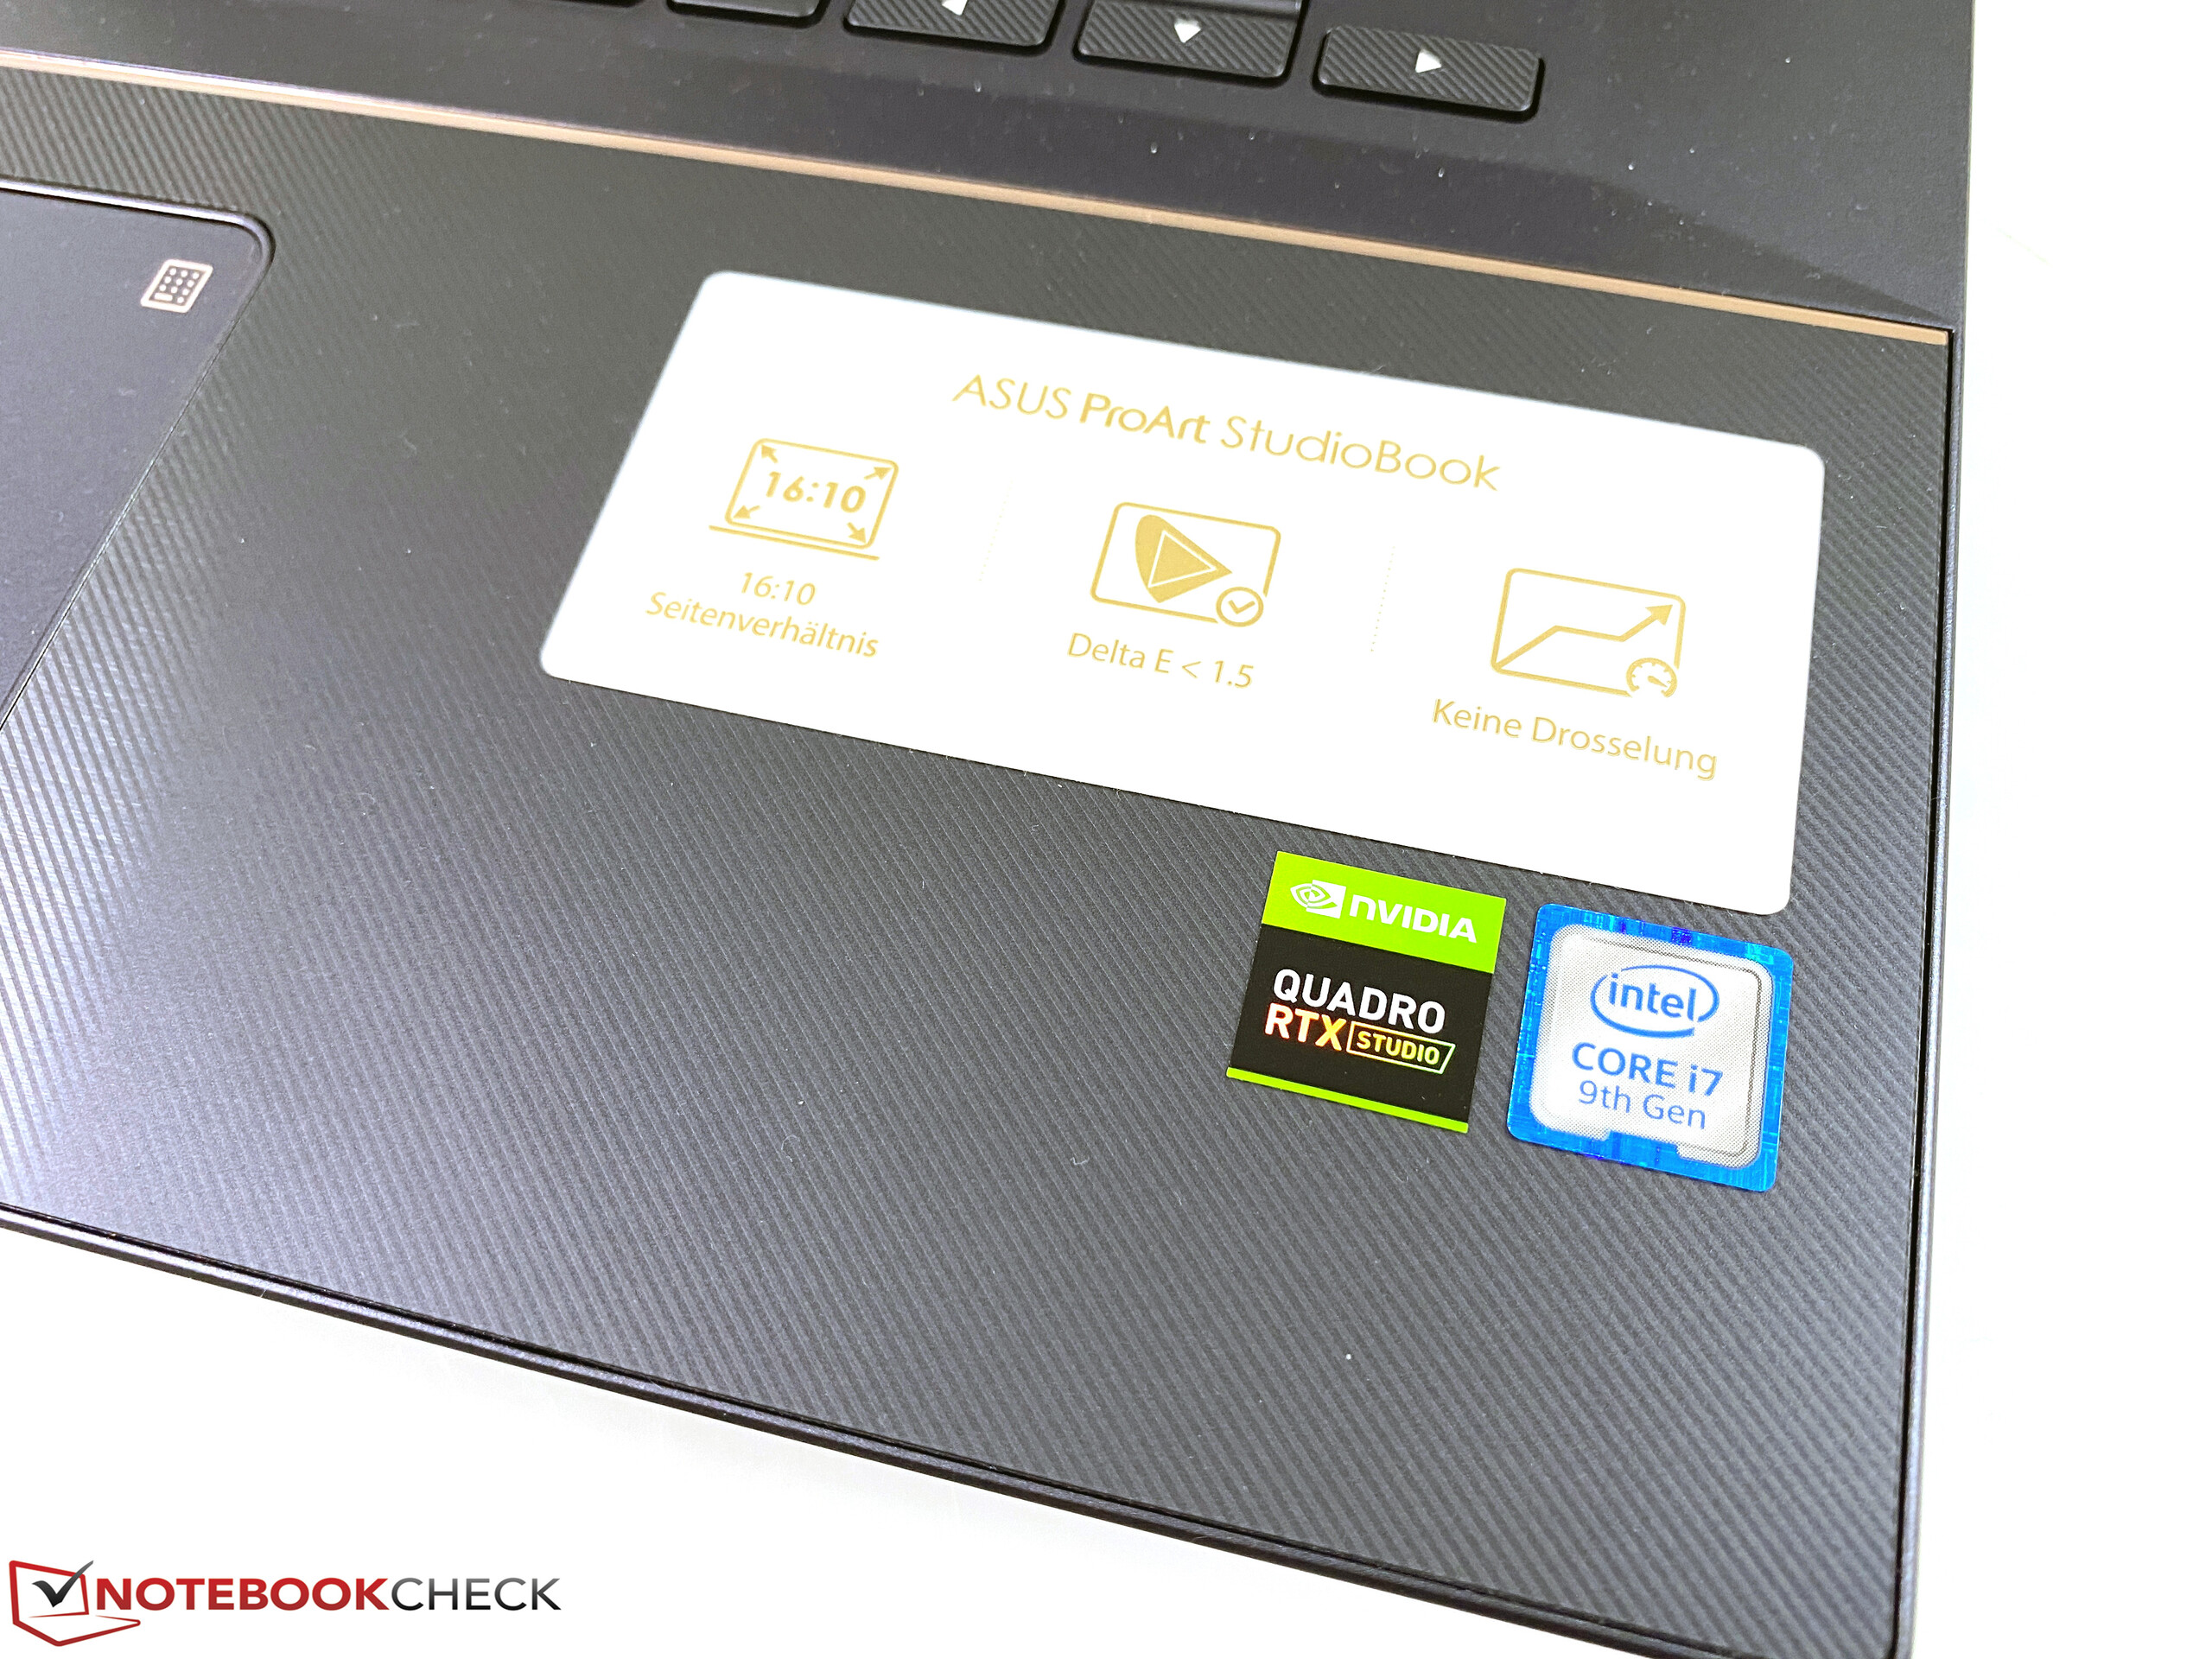
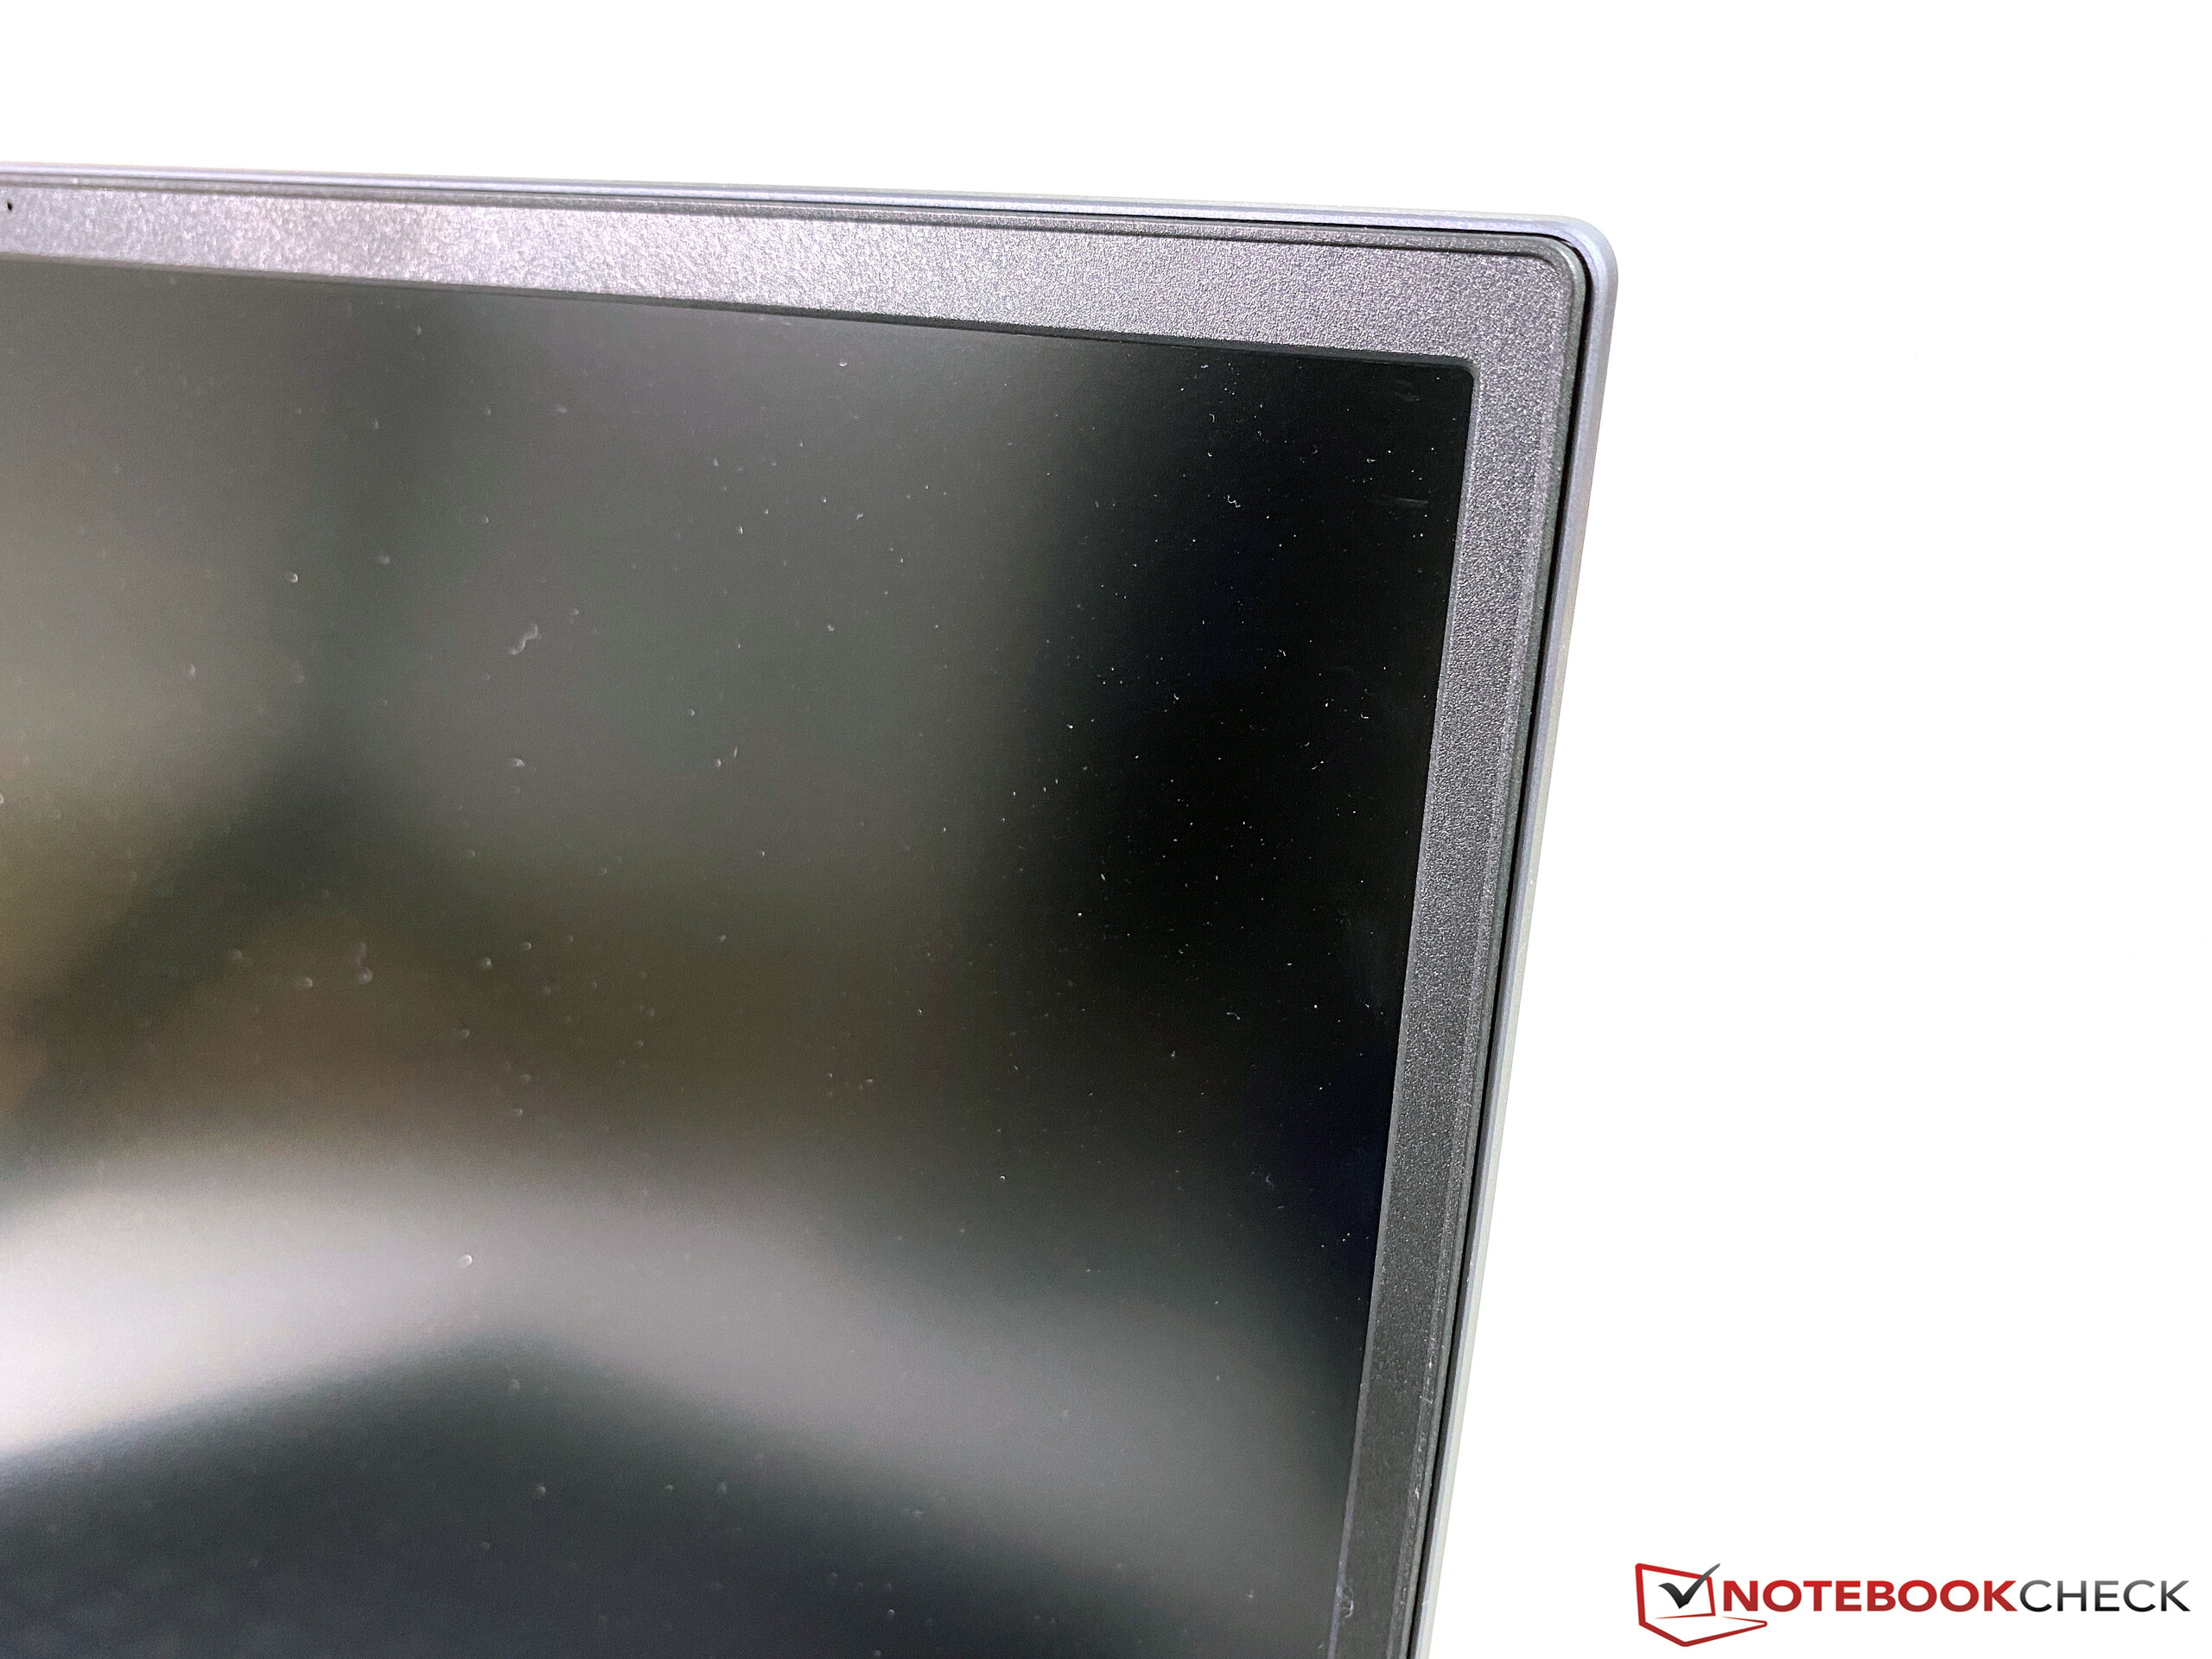
A tela também deixa uma impressão confusa. Gostamos do fato de ser um painel mate 16:10, que foi muito bem calibrado para a gama P3 pelo fabricante. No entanto, as medições básicas (luminância, valor de preto, contraste) são bastante decepcionantes, considerando o preço alto e não há outras opções de tela.
Uma boa primeira tentativa, mas muitas pequenas coisas afetam a impressão geral, especialmente com o alto preço. Gostaríamos de ver mais ajustes para o sucessor em relação aos perfis de desempenho e ao controle do ventilador.
O desempenho, ou mais precisamente, a utilização do desempenho dos componentes é bom quando conectado à rede elétrica, mas os perfis de ventilador no aplicativo MyAsus não são muito bem otimizados. A configuração padrão "Automático" manterá os ventiladores muito silenciosos (também sob carga), mas o desempenho é menor, especialmente quando você estressa os dois componentes simultaneamente. O perfil "Turbo", por outro lado, é extremamente sensível às mudanças de carga, o que é rapidamente irritante na prática. Também gostaríamos de ver uma implementação das configurações com o controle deslizante de desempenho do Windows.
Em suma, o StudioBook Pro 17 ainda é uma boa estação de trabalho móvel, mas o preço de quase 3900 Euros (~US$ 4227) é bastante alto. Outros fabricantes também oferecem GPUs mais poderosas em seus workstations finos.
Asus ProArt StudioBook Pro 17 W700G3T
- 05/06/2020 v7 (old)
Andreas Osthoff
Price comparison
