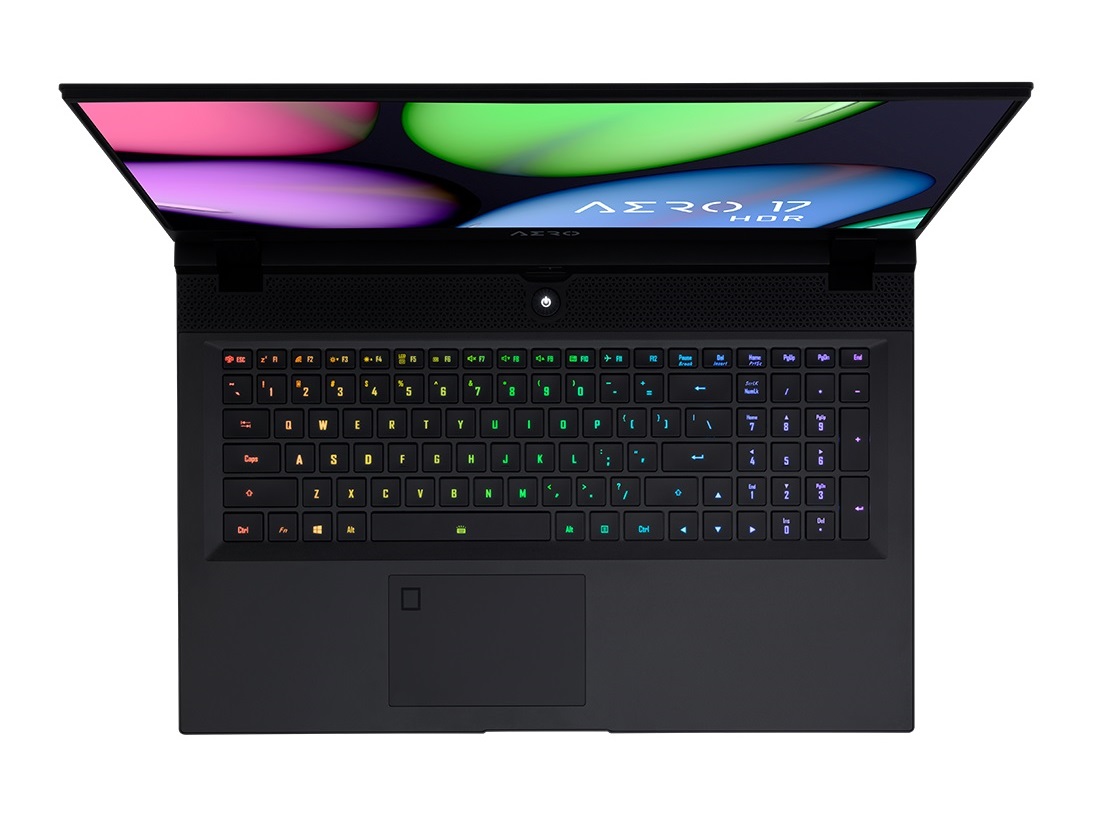
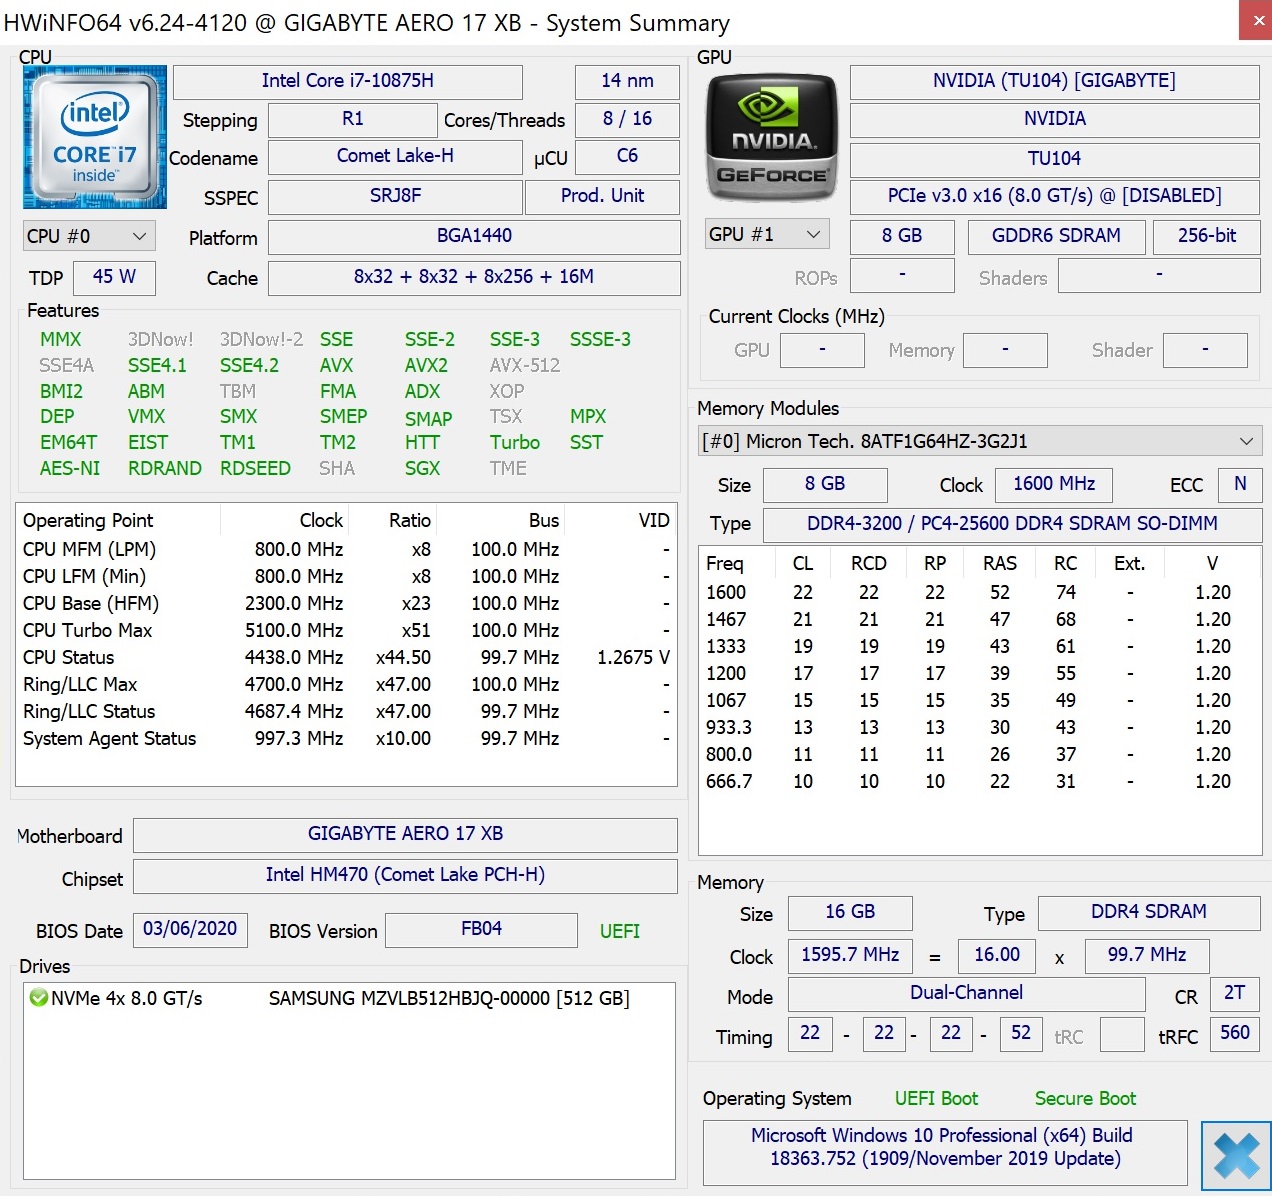
Breve Análise do Portátil Gigabyte Aero 17 HDR XB: Super Max-Q no início
Avaliação | Data | Modelo | Peso | Altura | Size | Resolução | Preço |
|---|---|---|---|---|---|---|---|
| 87 % v7 (old) | 04/2020 | Gigabyte Aero 17 HDR XB i7-10875H, GeForce RTX 2070 Super Max-Q | 2.7 kg | 21 mm | 17.30" | 3840x2160 | |
| 86.1 % v7 (old) | 09/2019 | Gigabyte Aero 17 XA RP77 i9-9980HK, GeForce RTX 2070 Max-Q | 2.5 kg | 21.4 mm | 17.30" | 3840x2160 | |
| 84.2 % v7 (old) | 03/2020 | Alienware m17 R2 P41E i9-9980HK, GeForce RTX 2080 Max-Q | 2.6 kg | 20.5 mm | 17.30" | 1920x1080 | |
| 82.9 % v7 (old) | 07/2019 | MSI GS75 Stealth 9SG i7-9750H, GeForce RTX 2080 Max-Q | 2.3 kg | 18.9 mm | 17.30" | 1920x1080 | |
| 81.2 % v7 (old) | 12/2019 | Asus ROG Zephyrus S GX701GXR i7-9750H, GeForce RTX 2080 Max-Q | 2.7 kg | 18.7 mm | 17.30" | 1920x1080 | |
| 87.7 % v7 (old) | 06/2019 | Razer Blade Pro 17 RTX 2080 Max-Q i7-9750H, GeForce RTX 2080 Max-Q | 2.8 kg | 19.9 mm | 17.30" | 1920x1080 |
| SD Card Reader | |
| average JPG Copy Test (av. of 3 runs) | |
| Gigabyte Aero 17 HDR XB (Toshiba Exceria Pro SDXC 64 GB UHS-II) | |
| Gigabyte Aero 17 XA RP77 (Toshiba Exceria Pro SDXC 64 GB UHS-II) | |
| Razer Blade Pro 17 RTX 2080 Max-Q (Toshiba Exceria Pro SDXC 64 GB UHS-II) | |
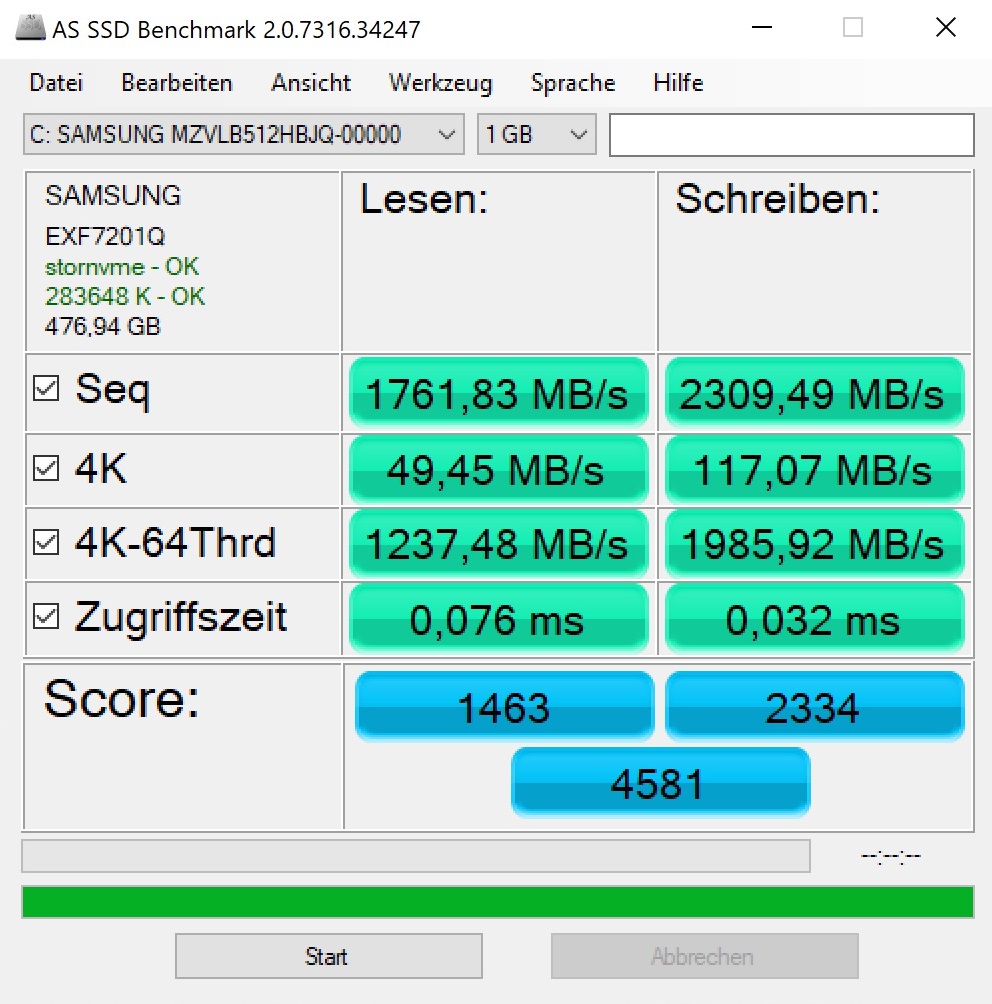
| maximum AS SSD Seq Read Test (1GB) | |
| Gigabyte Aero 17 HDR XB (Toshiba Exceria Pro SDXC 64 GB UHS-II) | |
| Gigabyte Aero 17 XA RP77 (Toshiba Exceria Pro SDXC 64 GB UHS-II) | |
| Razer Blade Pro 17 RTX 2080 Max-Q (Toshiba Exceria Pro SDXC 64 GB UHS-II) | |
| Networking | |
| iperf3 transmit AX12 | |
| Gigabyte Aero 17 HDR XB | |
| Asus ROG Zephyrus S GX701GXR | |
| iperf3 receive AX12 | |
| Gigabyte Aero 17 HDR XB | |
| Asus ROG Zephyrus S GX701GXR | |


| |||||||||||||||||||||||||
iluminação: 95 %
iluminação com acumulador: 487 cd/m²
Contraste: 1282:1 (Preto: 0.38 cd/m²)
ΔE ColorChecker Calman: 1.19 | ∀{0.5-29.43 Ø4.71}
calibrated: 0.5
ΔE Greyscale Calman: 1.45 | ∀{0.09-98 Ø4.96}
100% sRGB (Argyll 1.6.3 3D)
88% AdobeRGB 1998 (Argyll 1.6.3 3D)
100% AdobeRGB 1998 (Argyll 3D)
100% sRGB (Argyll 3D)
86.5% Display P3 (Argyll 3D)
Gamma: 2.21
CCT: 6557 K
| Gigabyte Aero 17 HDR XB AUO B173ZAN03.2 (AUO329B), IPS, 3840x2160 | Gigabyte Aero 17 XA RP77 AU Optronics B173ZAN03.2, IPS, 3840x2160 | Alienware m17 R2 P41E Chi Mei 173HCE, CMN175F, IPS, 1920x1080 | MSI GS75 Stealth 9SG Chi Mei N173HCE-G33 (CMN175C), IPS, 1920x1080 | Asus ROG Zephyrus S GX701GXR AU Optronics B173HAN05.1, IPS, 1920x1080 | Razer Blade Pro 17 RTX 2080 Max-Q AU Optronics B173HAN04.0, IPS, 1920x1080 | |
|---|---|---|---|---|---|---|
| Display | 0% | -16% | -23% | -17% | -26% | |
| Display P3 Coverage (%) | 86.5 | 86.8 0% | 70.8 -18% | 62.6 -28% | 70 -19% | 60.6 -30% |
| sRGB Coverage (%) | 100 | 100 0% | 98.5 -1% | 93.5 -6% | 96.6 -3% | 89 -11% |
| AdobeRGB 1998 Coverage (%) | 100 | 99.5 0% | 72.2 -28% | 64.7 -35% | 72.3 -28% | 62.1 -38% |
| Response Times | 0% | 64% | 75% | 81% | 76% | |
| Response Time Grey 50% / Grey 80% * (ms) | 55.2 ? | 45.6 ? 17% | 17.2 ? 69% | 7.2 ? 87% | 5.6 ? 90% | 6.8 ? 88% |
| Response Time Black / White * (ms) | 26 ? | 30.4 ? -17% | 10.8 ? 58% | 10 ? 62% | 7.6 ? 71% | 9.6 ? 63% |
| PWM Frequency (Hz) | 26320 ? | 25510 ? | ||||
| Screen | -86% | -25% | -19% | -43% | -86% | |
| Brightness middle (cd/m²) | 487 | 667.3 37% | 384.2 -21% | 366 -25% | 288 -41% | 299.3 -39% |
| Brightness (cd/m²) | 475 | 633 33% | 357 -25% | 343 -28% | 276 -42% | 294 -38% |
| Brightness Distribution (%) | 95 | 90 -5% | 90 -5% | 91 -4% | 93 -2% | 94 -1% |
| Black Level * (cd/m²) | 0.38 | 0.46 -21% | 0.29 24% | 0.29 24% | 0.24 37% | 0.29 24% |
| Contrast (:1) | 1282 | 1451 13% | 1325 3% | 1262 -2% | 1200 -6% | 1032 -20% |
| Colorchecker dE 2000 * | 1.19 | 3.53 -197% | 1.35 -13% | 1.51 -27% | 1.92 -61% | 2.55 -114% |
| Colorchecker dE 2000 max. * | 2.43 | 6.88 -183% | 3.45 -42% | 3.22 -33% | 4.57 -88% | 4.73 -95% |
| Colorchecker dE 2000 calibrated * | 0.5 | 3.79 -658% | 1.42 -184% | 0.71 -42% | 1.14 -128% | 2.9 -480% |
| Greyscale dE 2000 * | 1.45 | 0.9 38% | 1.2 17% | 1.93 -33% | 3.08 -112% | 3.5 -141% |
| Gamma | 2.21 100% | 2.17 101% | 2.23 99% | 2.38 92% | 2.42 91% | 2.28 96% |
| CCT | 6557 99% | 6533 99% | 6580 99% | 6881 94% | 7055 92% | 7101 92% |
| Color Space (Percent of AdobeRGB 1998) (%) | 88 | 87.1 -1% | 65.5 -26% | 60 -32% | 65 -26% | 57 -35% |
| Color Space (Percent of sRGB) (%) | 100 | 100 0% | 98.5 -1% | 94 -6% | 96 -4% | 88.7 -11% |
| Média Total (Programa/Configurações) | -29% /
-59% | 8% /
-12% | 11% /
-8% | 7% /
-23% | -12% /
-55% |
* ... menor é melhor
Exibir tempos de resposta
| ↔ Tempo de resposta preto para branco | ||
|---|---|---|
| 26 ms ... ascensão ↗ e queda ↘ combinadas | ↗ 9.2 ms ascensão | 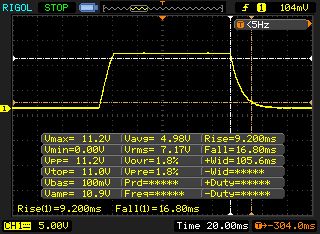 |
| ↘ 16.8 ms queda | ||
| A tela mostra taxas de resposta relativamente lentas em nossos testes e pode ser muito lenta para os jogadores. Em comparação, todos os dispositivos testados variam de 0.1 (mínimo) a 240 (máximo) ms. » 63 % de todos os dispositivos são melhores. Isso significa que o tempo de resposta medido é pior que a média de todos os dispositivos testados (19.8 ms). | ||
| ↔ Tempo de resposta 50% cinza a 80% cinza | ||
| 55.2 ms ... ascensão ↗ e queda ↘ combinadas | ↗ 26.8 ms ascensão | 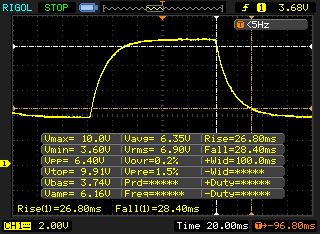 |
| ↘ 28.4 ms queda | ||
| A tela mostra taxas de resposta lentas em nossos testes e será insatisfatória para os jogadores. Em comparação, todos os dispositivos testados variam de 0.165 (mínimo) a 636 (máximo) ms. » 92 % de todos os dispositivos são melhores. Isso significa que o tempo de resposta medido é pior que a média de todos os dispositivos testados (31 ms). | ||
Cintilação da tela / PWM (modulação por largura de pulso)
| Tela tremeluzindo / PWM não detectado | 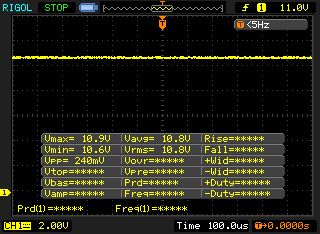 | ||
[pwm_comparison] Em comparação: 52 % de todos os dispositivos testados não usam PWM para escurecer a tela. Se PWM foi detectado, uma média de 7757 (mínimo: 5 - máximo: 343500) Hz foi medida. | |||
| DPC Latencies / LatencyMon - interrupt to process latency (max), Web, Youtube, Prime95 | |
| Gigabyte Aero 17 HDR XB | |
* ... menor é melhor
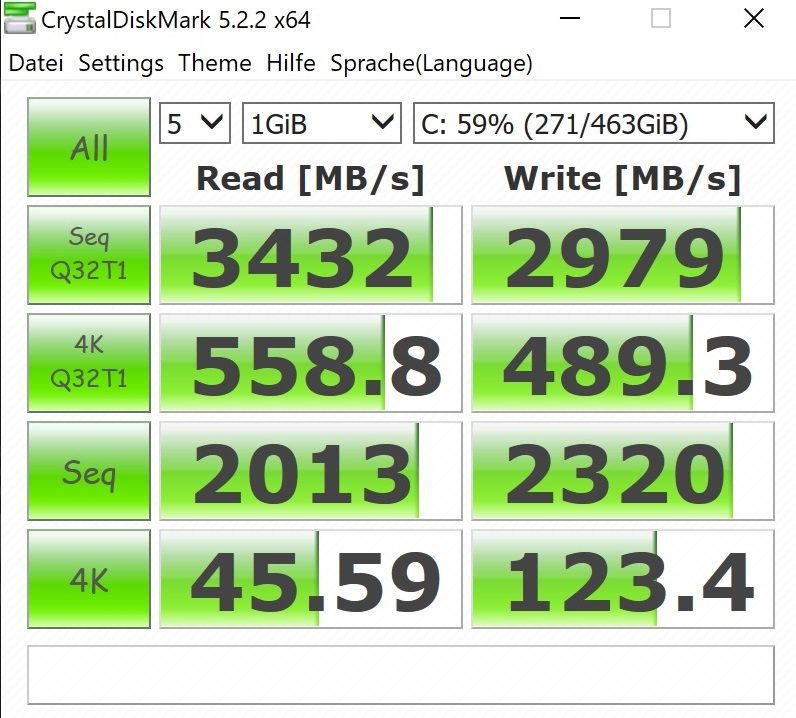
| Gigabyte Aero 17 HDR XB Samsung SSD PM981a MZVLB512HBJQ | Gigabyte Aero 17 XA RP77 Intel SSD 760p SSDPEKKW512G8 | Alienware m17 R2 P41E 2x SK Hynix PC601 NVMe 512 GB (RAID 0) | MSI GS75 Stealth 9SG 2x Samsung SSD PM981 MZVLB1T0HALR (RAID 0) | Asus ROG Zephyrus S GX701GXR Samsung SSD PM981 MZVLB1T0HALR | Razer Blade Pro 17 RTX 2080 Max-Q Samsung SSD PM981 MZVLB512HAJQ | |
|---|---|---|---|---|---|---|
| CrystalDiskMark 5.2 / 6 | -5% | -6% | 1% | -26% | -27% | |
| Write 4K (MB/s) | 123.4 | 169.6 37% | 110.6 -10% | 95.5 -23% | 96.1 -22% | 100.7 -18% |
| Read 4K (MB/s) | 45.59 | 58 27% | 41.46 -9% | 42.59 -7% | 40.86 -10% | 41.03 -10% |
| Write Seq (MB/s) | 2320 | 1516 -35% | 2378 2% | 2851 23% | 1317 -43% | 1146 -51% |
| Read Seq (MB/s) | 2013 | 2362 17% | 2114 5% | 2696 34% | 1030 -49% | 1115 -45% |
| Write 4K Q32T1 (MB/s) | 489.3 | 481.8 -2% | 445.4 -9% | 402.6 -18% | 350.4 -28% | 384.6 -21% |
| Read 4K Q32T1 (MB/s) | 559 | 506 -9% | 509 -9% | 443.9 -21% | 404.1 -28% | 429.5 -23% |
| Write Seq Q32T1 (MB/s) | 2979 | 1530 -49% | 2735 -8% | 3420 15% | 2396 -20% | 1859 -38% |
| Read Seq Q32T1 (MB/s) | 3432 | 2645 -23% | 3206 -7% | 3514 2% | 3194 -7% | 3179 -7% |

| 3DMark 06 Standard Score | 43406 pontos | |
| 3DMark Vantage P Result | 65101 pontos | |
| 3DMark 11 Performance | 24130 pontos | |
| 3DMark Cloud Gate Standard Score | 38593 pontos | |
| 3DMark Fire Strike Score | 18582 pontos | |
| 3DMark Time Spy Score | 7650 pontos | |
Ajuda | ||
| 3DMark 11 - 1280x720 Performance GPU | |
| Razer Blade Pro 17 RTX 2080 Max-Q | |
| Alienware m17 R2 P41E | |
| Asus ROG Zephyrus S GX701GXR | |
| Gigabyte Aero 17 HDR XB | |
| MSI GS75 Stealth 9SG | |
| Gigabyte Aero 17 XA RP77 | |
| SPECviewperf 13 | |
| 3ds Max (3dsmax-06) | |
| Gigabyte Aero 17 HDR XB | |
| Catia (catia-05) | |
| Gigabyte Aero 17 HDR XB | |
| Creo (creo-02) | |
| Gigabyte Aero 17 HDR XB | |
| Energy (energy-02) | |
| Gigabyte Aero 17 HDR XB | |
| Maya (maya-05) | |
| Gigabyte Aero 17 HDR XB | |
| Medical (medical-02) | |
| Gigabyte Aero 17 HDR XB | |
| Showcase (showcase-02) | |
| Gigabyte Aero 17 HDR XB | |
| Siemens NX (snx-03) | |
| Gigabyte Aero 17 HDR XB | |
| Solidworks (sw-04) | |
| Gigabyte Aero 17 HDR XB | |
| The Witcher 3 | |
| 1920x1080 Ultra Graphics & Postprocessing (HBAO+) | |
| Razer Blade Pro 17 RTX 2080 Max-Q | |
| Asus ROG Zephyrus S GX701GXR | |
| Alienware m17 R2 P41E | |
| MSI GS75 Stealth 9SG | |
| Gigabyte Aero 17 HDR XB | |
| Gigabyte Aero 17 XA RP77 | |
| 3840x2160 High Graphics & Postprocessing (Nvidia HairWorks Off) | |
| Gigabyte Aero 17 HDR XB | |
| Gigabyte Aero 17 XA RP77 | |
| baixo | média | alto | ultra | QHD | 4K | |
|---|---|---|---|---|---|---|
| GTA V (2015) | 182 | 175 | 160 | 89.9 | ||
| The Witcher 3 (2015) | 240 | 142 | 75.3 | 49.7 | ||
| Dota 2 Reborn (2015) | 163.9 | 146.6 | 139.5 | 131.4 | ||
| Fortnite (2018) | 133 | 132 | 108 | 86.2 | 43 | |
| Final Fantasy XV Benchmark (2018) | 104 | 80 | 33 | |||
| Kingdom Come: Deliverance (2018) | 127 | 108 | 75.9 | 54.4 | 27.9 | |
| X-Plane 11.11 (2018) | 119 | 104 | 87.6 | |||
| Monster Hunter World (2018) | 113 | 102 | 84.2 | 55.7 | 27.5 | |
| Shadow of the Tomb Raider (2018) | 118 | 110 | 99 | 68 | 36 | |
| Assassin´s Creed Odyssey (2018) | 99 | 81 | 62 | 47 | 32 | |
| Hitman 2 (2018) | 89.2 | 83.2 | 79.7 | 76.1 | 41.5 | |
| Battlefield V (2018) | 144 | 135 | 125 | 99.4 | 56.8 | |
| Darksiders III (2018) | 135 | 118 | 107 | 71.6 | 36.4 | |
| Just Cause 4 (2018) | 137 | 101 | 93.4 | 63.6 | 34.5 | |
| Apex Legends (2019) | 144 | 144 | 143 | 109 | 61.1 | |
| Far Cry New Dawn (2019) | 98 | 92 | 83 | 70 | 43 | |
| Metro Exodus (2019) | 92 | 72 | 57.7 | 49.1 | 26.5 | |
| Dirt Rally 2.0 (2019) | 183 | 155 | 85.8 | 66 | ||
| The Division 2 (2019) | 123 | 113 | 81 | 60 | 29 | |
| Anno 1800 (2019) | 112 | 85.5 | 47.4 | 36.6 | 21.1 | |
| Rage 2 (2019) | 119 | 99.5 | 97.1 | 62.8 | 30.1 | |
| F1 2019 (2019) | 191 | 159 | 143 | 107 | 61 | |
| Control (2019) | 92.6 | 68.4 | 43.9 | 21.1 | ||
| Borderlands 3 (2019) | 112 | 78 | 59.6 | 41.7 | 22.2 | |
| FIFA 20 (2019) | 271 | 259 | 257 | 253 | 186 | |
| Ghost Recon Breakpoint (2019) | 101 | 89 | 66 | 49 | 28 | |
| GRID 2019 (2019) | 131 | 104 | 71.1 | 60.6 | 39.7 | |
| Call of Duty Modern Warfare 2019 (2019) | 134 | 126 | 104 | 72.3 | 41 | |
| Need for Speed Heat (2019) | 103 | 94 | 82.6 | 60.5 | 33.4 | |
| Star Wars Jedi Fallen Order (2019) | 109 | 104 | 94.1 | 71.3 | 35.9 | |
| Red Dead Redemption 2 (2019) | 91.3 | 61.8 | 40.2 | 32 | 20.5 | |
| Escape from Tarkov (2020) | 121 | 116 | 107 | 79.8 | 36.8 | |
| Hunt Showdown (2020) | 109 | 96.8 | 56.8 | 27.4 | ||
| Doom Eternal (2020) | 157 | 139 | 135 | 99.6 | 51.2 |
Barulho
| Ocioso |
| 35 / 36 / 38 dB |
| Carga |
| 47 / 54 dB |
 | ||
30 dB silencioso 40 dB(A) audível 50 dB(A) ruidosamente alto |
||
min: | ||
| Gigabyte Aero 17 HDR XB i7-10875H, GeForce RTX 2070 Super Max-Q | Gigabyte Aero 17 XA RP77 i9-9980HK, GeForce RTX 2070 Max-Q | Alienware m17 R2 P41E i9-9980HK, GeForce RTX 2080 Max-Q | MSI GS75 Stealth 9SG i7-9750H, GeForce RTX 2080 Max-Q | Asus ROG Zephyrus S GX701GXR i7-9750H, GeForce RTX 2080 Max-Q | Razer Blade Pro 17 RTX 2080 Max-Q i7-9750H, GeForce RTX 2080 Max-Q | |
|---|---|---|---|---|---|---|
| Noise | 6% | 7% | 5% | 7% | 11% | |
| desligado / ambiente * (dB) | 30 | 29.3 2% | 29.1 3% | 30 -0% | 30 -0% | 28.2 6% |
| Idle Minimum * (dB) | 35 | 33 6% | 29.4 16% | 31 11% | 32 9% | 28.2 19% |
| Idle Average * (dB) | 36 | 33 8% | 29.4 18% | 32 11% | 33 8% | 28.2 22% |
| Idle Maximum * (dB) | 38 | 33 13% | 31.5 17% | 38 -0% | 34 11% | 30.8 19% |
| Load Average * (dB) | 47 | 42.5 10% | 49.7 -6% | 47 -0% | 40 15% | 42 11% |
| Witcher 3 ultra * (dB) | 49 | 42 14% | 49.5 -1% | 48 2% | 49 -0% | 51 -4% |
| Load Maximum * (dB) | 54 | 59.6 -10% | 53.3 1% | 49 9% | 50 7% | 53 2% |
* ... menor é melhor
(-) A temperatura máxima no lado superior é 53 °C / 127 F, em comparação com a média de 40.4 °C / 105 F , variando de 21.2 a 68.8 °C para a classe Gaming.
(-) A parte inferior aquece até um máximo de 59 °C / 138 F, em comparação com a média de 43.2 °C / 110 F
(+) Em uso inativo, a temperatura média para o lado superior é 25.9 °C / 79 F, em comparação com a média do dispositivo de 33.9 °C / ### class_avg_f### F.
(-) Jogando The Witcher 3, a temperatura média para o lado superior é 40 °C / 104 F, em comparação com a média do dispositivo de 33.9 °C / ## #class_avg_f### F.
(±) Os apoios para as mãos e o touchpad podem ficar muito quentes ao toque, com um máximo de 38 °C / 100.4 F.
(-) A temperatura média da área do apoio para as mãos de dispositivos semelhantes foi 28.8 °C / 83.8 F (-9.2 °C / -16.6 F).
| Gigabyte Aero 17 HDR XB i7-10875H, GeForce RTX 2070 Super Max-Q | Gigabyte Aero 17 XA RP77 i9-9980HK, GeForce RTX 2070 Max-Q | Alienware m17 R2 P41E i9-9980HK, GeForce RTX 2080 Max-Q | MSI GS75 Stealth 9SG i7-9750H, GeForce RTX 2080 Max-Q | Asus ROG Zephyrus S GX701GXR i7-9750H, GeForce RTX 2080 Max-Q | Razer Blade Pro 17 RTX 2080 Max-Q i7-9750H, GeForce RTX 2080 Max-Q | |
|---|---|---|---|---|---|---|
| Heat | -4% | -20% | -9% | -3% | 9% | |
| Maximum Upper Side * (°C) | 53 | 46.8 12% | 54.2 -2% | 55 -4% | 50 6% | 43 19% |
| Maximum Bottom * (°C) | 59 | 62.2 -5% | 61.4 -4% | 65 -10% | 47 20% | 47.2 20% |
| Idle Upper Side * (°C) | 27 | 29 -7% | 37.8 -40% | 30 -11% | 33 -22% | 27.2 -1% |
| Idle Bottom * (°C) | 29 | 34 -17% | 38.6 -33% | 32 -10% | 34 -17% | 30 -3% |
* ... menor é melhor
Gigabyte Aero 17 HDR XB análise de áudio
(+) | os alto-falantes podem tocar relativamente alto (###valor### dB)
Graves 100 - 315Hz
(-) | quase nenhum baixo - em média 18.7% menor que a mediana
(±) | a linearidade dos graves é média (9.5% delta para a frequência anterior)
Médios 400 - 2.000 Hz
(+) | médios equilibrados - apenas 4.6% longe da mediana
(+) | médios são lineares (6.4% delta para frequência anterior)
Altos 2 - 16 kHz
(+) | agudos equilibrados - apenas 4% longe da mediana
(+) | os máximos são lineares (6.1% delta da frequência anterior)
Geral 100 - 16.000 Hz
(±) | a linearidade do som geral é média (15.5% diferença em relação à mediana)
Comparado com a mesma classe
» 35% de todos os dispositivos testados nesta classe foram melhores, 7% semelhantes, 58% piores
» O melhor teve um delta de 6%, a média foi 18%, o pior foi 132%
Comparado com todos os dispositivos testados
» 23% de todos os dispositivos testados foram melhores, 4% semelhantes, 73% piores
» O melhor teve um delta de 4%, a média foi 23%, o pior foi 134%
Alienware m17 R2 P41E análise de áudio
(+) | os alto-falantes podem tocar relativamente alto (###valor### dB)
Graves 100 - 315Hz
(-) | quase nenhum baixo - em média 17.1% menor que a mediana
(±) | a linearidade dos graves é média (12.3% delta para a frequência anterior)
Médios 400 - 2.000 Hz
(+) | médios equilibrados - apenas 3.9% longe da mediana
(±) | a linearidade dos médios é média (8.2% delta para frequência anterior)
Altos 2 - 16 kHz
(+) | agudos equilibrados - apenas 3.1% longe da mediana
(±) | a linearidade dos máximos é média (8.4% delta para frequência anterior)
Geral 100 - 16.000 Hz
(±) | a linearidade do som geral é média (17% diferença em relação à mediana)
Comparado com a mesma classe
» 45% de todos os dispositivos testados nesta classe foram melhores, 12% semelhantes, 43% piores
» O melhor teve um delta de 6%, a média foi 18%, o pior foi 132%
Comparado com todos os dispositivos testados
» 31% de todos os dispositivos testados foram melhores, 8% semelhantes, 61% piores
» O melhor teve um delta de 4%, a média foi 23%, o pior foi 134%
| desligado | |
| Ocioso | |
| Carga |
|
Key:
min: | |
| Gigabyte Aero 17 HDR XB i7-10875H, GeForce RTX 2070 Super Max-Q | Gigabyte Aero 17 XA RP77 i9-9980HK, GeForce RTX 2070 Max-Q | Alienware m17 R2 P41E i9-9980HK, GeForce RTX 2080 Max-Q | MSI GS75 Stealth 9SG i7-9750H, GeForce RTX 2080 Max-Q | Asus ROG Zephyrus S GX701GXR i7-9750H, GeForce RTX 2080 Max-Q | Razer Blade Pro 17 RTX 2080 Max-Q i7-9750H, GeForce RTX 2080 Max-Q | |
|---|---|---|---|---|---|---|
| Power Consumption | -7% | -52% | 12% | -26% | 3% | |
| Idle Minimum * (Watt) | 16 | 13.9 13% | 24.7 -54% | 13 19% | 32 -100% | 16.2 -1% |
| Idle Average * (Watt) | 19 | 24.3 -28% | 35.9 -89% | 17 11% | 34 -79% | 20.4 -7% |
| Idle Maximum * (Watt) | 30 | 35.5 -18% | 69.6 -132% | 25 17% | 36 -20% | 26.1 13% |
| Load Average * (Watt) | 109 | 127.6 -17% | 141.8 -30% | 96 12% | 95 13% | 96.5 11% |
| Witcher 3 ultra * (Watt) | 167 | 158 5% | 185.8 -11% | 156 7% | 155 7% | 182.9 -10% |
| Load Maximum * (Watt) | 246 | 237.5 3% | 235.4 4% | 239 3% | 187 24% | 214.3 13% |
* ... menor é melhor
| Gigabyte Aero 17 HDR XB i7-10875H, GeForce RTX 2070 Super Max-Q, 94 Wh | Gigabyte Aero 17 XA RP77 i9-9980HK, GeForce RTX 2070 Max-Q, 94.24 Wh | Alienware m17 R2 P41E i9-9980HK, GeForce RTX 2080 Max-Q, 76 Wh | MSI GS75 Stealth 9SG i7-9750H, GeForce RTX 2080 Max-Q, 80.25 Wh | Asus ROG Zephyrus S GX701GXR i7-9750H, GeForce RTX 2080 Max-Q, 76 Wh | Razer Blade Pro 17 RTX 2080 Max-Q i7-9750H, GeForce RTX 2080 Max-Q, 70 Wh | |
|---|---|---|---|---|---|---|
| Duração da bateria | 2% | -43% | -24% | -53% | -38% | |
| Reader / Idle (h) | 9.9 | 11.9 20% | 7.1 -28% | 7.7 -22% | 4.1 -59% | 4.9 -51% |
| WiFi v1.3 (h) | 6.2 | 7.2 16% | 4.8 -23% | 6 -3% | 3 -52% | 4.7 -24% |
| Load (h) | 2.3 | 1.6 -30% | 0.5 -78% | 1.2 -48% | 1.2 -48% | 1.4 -39% |
| H.264 (h) | 6.8 | 2.8 |
Pro
Contra
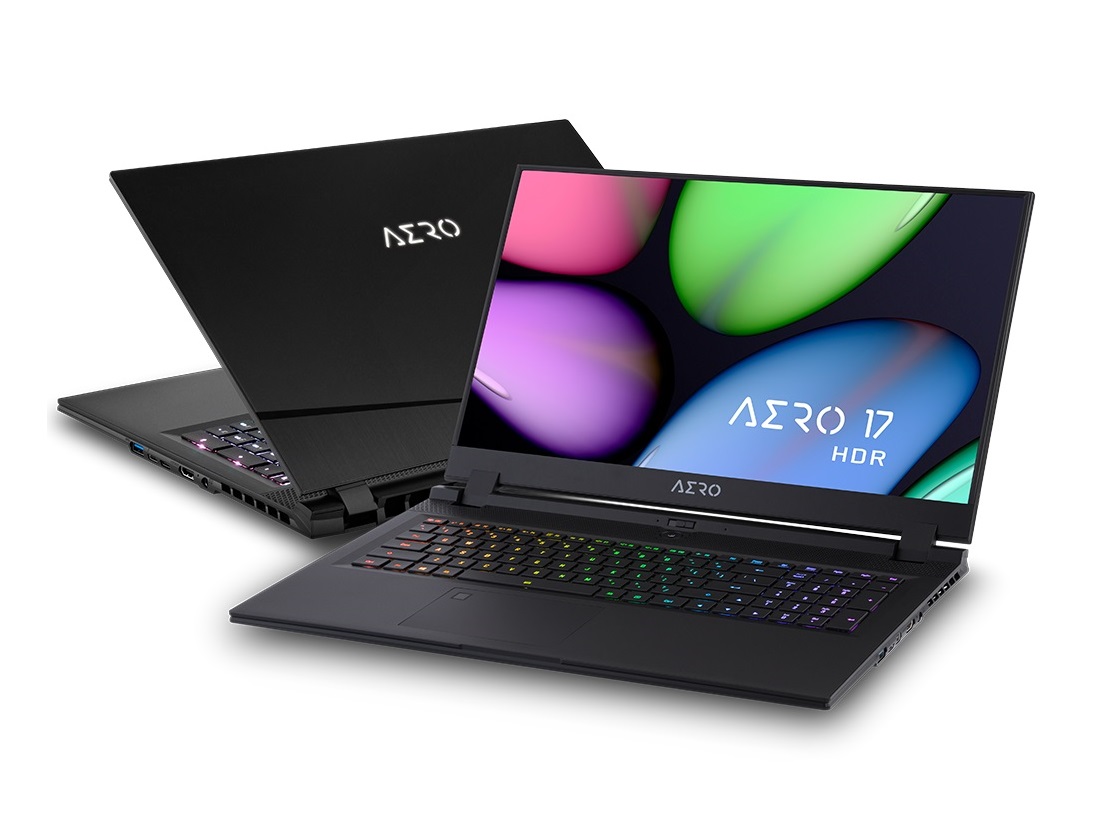
A atualização do Gigabyte Aero 17 HDR deve satisfazer quase todos os tipos de usuários.
Enquanto os criadores de conteúdo apreciam uma tela 4K brilhante com cores precisas, graças à CPU ao octa-core eGPU de gama alta, os gamers também recebem o que precisam. A Gigabyte também pensou em (quase) tudo o resto. A robusta carcaça com bons dispositivos de entrada e uma ampla quantidade de equipamentos de conexão, incluindo Thunderbolt 3. A duração da bateria também é impressionante para um portátil de jogos.
Se não fosse pelo desenvolvimento de alto ruído sob carga e alguns detalhes (posição desafortunada da webcam, falta de iluminação para funções secundárias e um posicionamento de porta que não é o ideal), gostaríamos muito de tudo sobre o Aero 17 HDR.
Gigabyte Aero 17 HDR XB
- 04/21/2020 v7 (old)
Florian Glaser
Price comparison