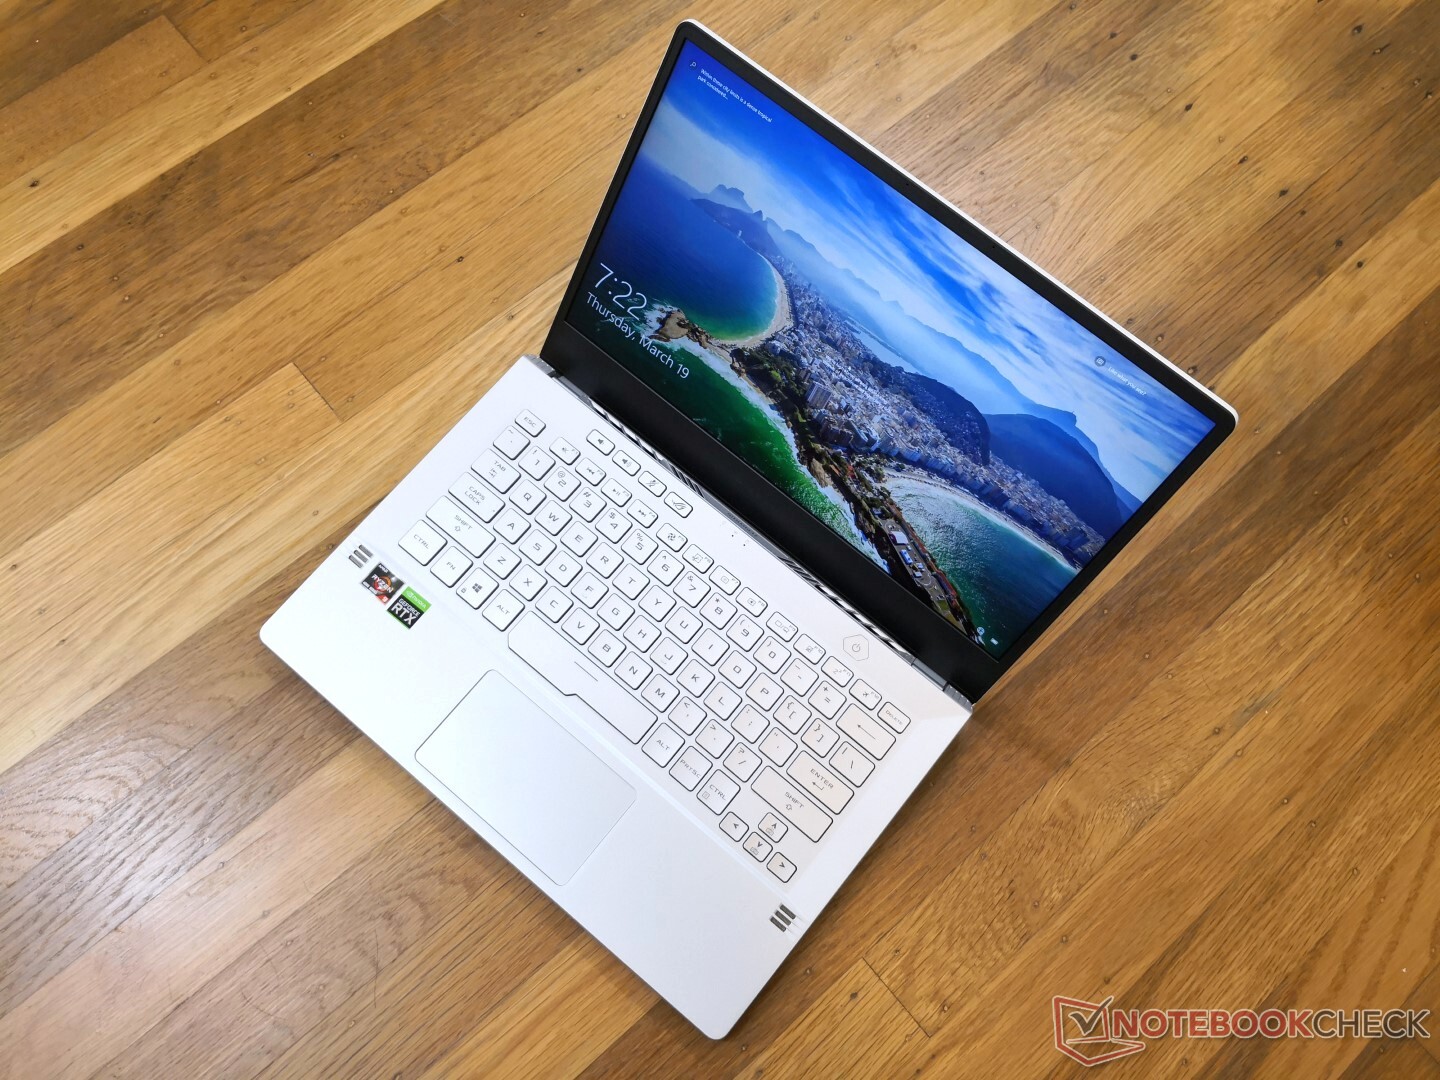
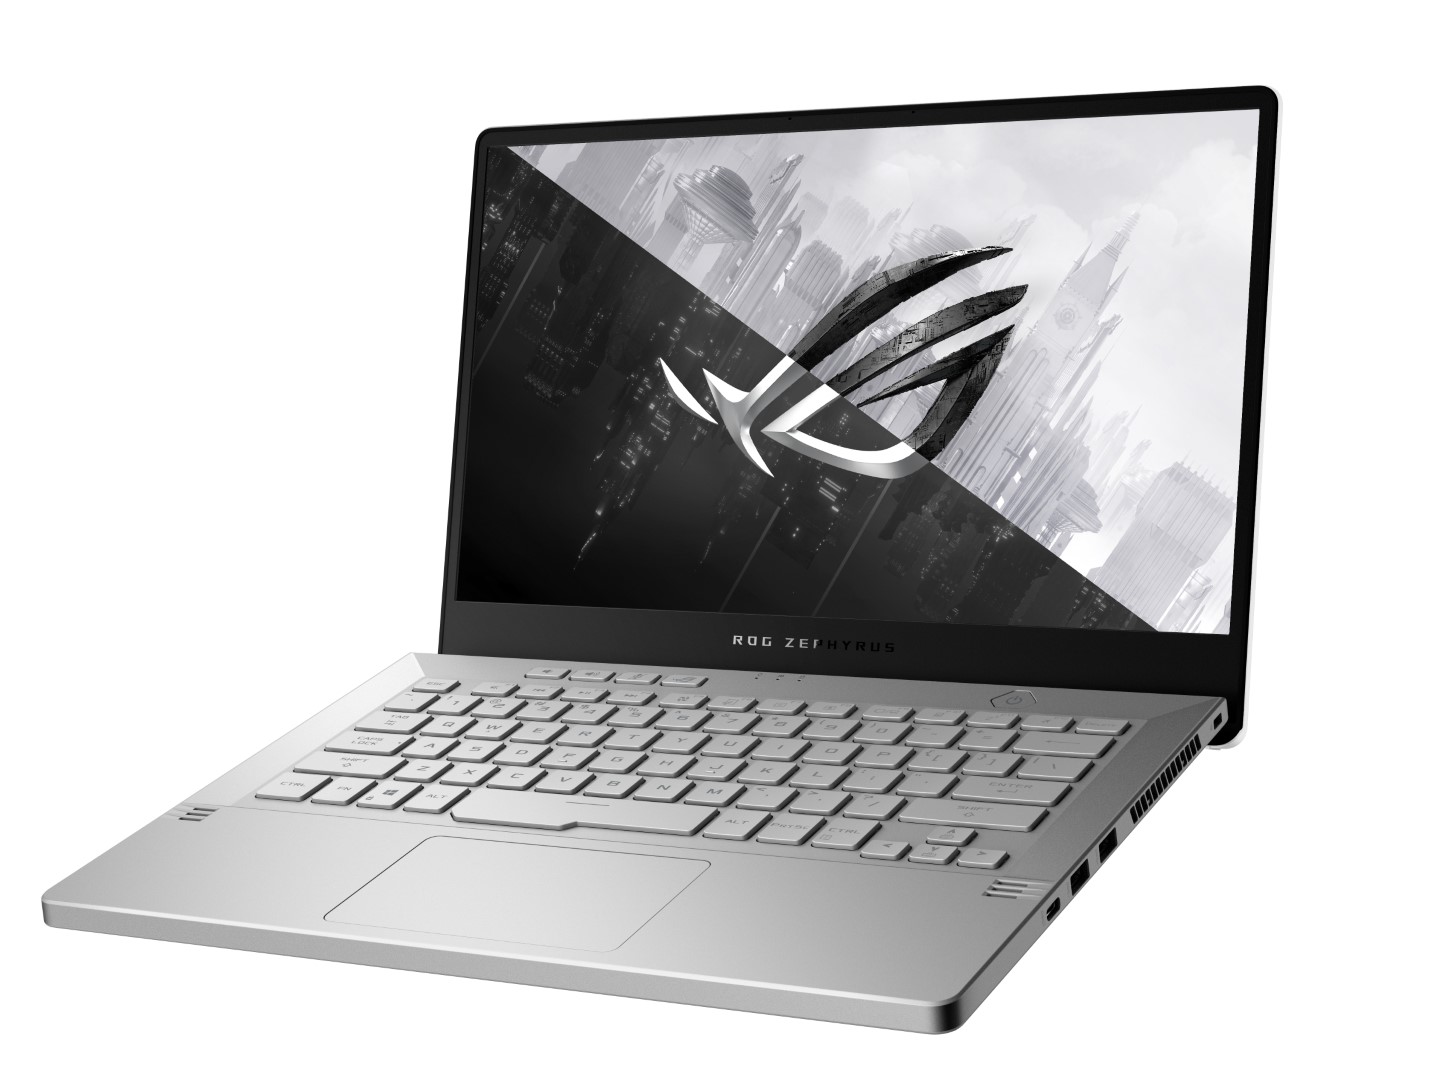
Breve Análise do Portátil Asus Zephyrus G14 Ryzen 9 GeForce RTX 2060 Max-Q: Levando o Core i9 ao limite
Avaliação | Data | Modelo | Peso | Altura | Size | Resolução | Preço |
|---|---|---|---|---|---|---|---|
| 83.6 % v7 (old) | 03/2020 | Asus Zephyrus G14 GA401IV R9 4900HS, GeForce RTX 2060 Max-Q | 1.6 kg | 17.9 mm | 14.00" | 1920x1080 | |
| 82.9 % v7 (old) | 10/2019 | Asus ROG Zephyrus M15 GU502GU-XB74 i7-9750H, GeForce GTX 1660 Ti Mobile | 2 kg | 18.9 mm | 15.60" | 1920x1080 | |
| 84.2 % v7 (old) | 09/2019 | Razer Blade 15 GTX 1660 Ti i7-9750H, GeForce GTX 1660 Ti Mobile | 2.1 kg | 19.9 mm | 15.60" | 1920x1080 | |
| 83.8 % v7 (old) | 06/2019 | MSI GS65 Stealth 9SG i7-9750H, GeForce RTX 2080 Max-Q | 2 kg | 18 mm | 15.60" | 1920x1080 | |
| 83 % v7 (old) | 09/2019 | Alienware m15 R2 P87F i7-9750H, GeForce RTX 2080 Max-Q | 2.2 kg | 18.3 mm | 15.60" | 1920x1080 | |
| 84.2 % v7 (old) | 02/2020 | MSI Prestige 14 A10SC-009 i7-10710U, GeForce GTX 1650 Max-Q | 1.3 kg | 16 mm | 14.00" | 3840x2160 |
| |||||||||||||||||||||||||
iluminação: 87 %
iluminação com acumulador: 192.3 cd/m²
Contraste: 1239:1 (Preto: 0.26 cd/m²)
ΔE ColorChecker Calman: 2.43 | ∀{0.5-29.43 Ø4.72}
calibrated: 2.29
ΔE Greyscale Calman: 3.3 | ∀{0.09-98 Ø4.97}
91.9% sRGB (Argyll 1.6.3 3D)
60% AdobeRGB 1998 (Argyll 1.6.3 3D)
67.2% AdobeRGB 1998 (Argyll 3D)
92% sRGB (Argyll 3D)
66.5% Display P3 (Argyll 3D)
Gamma: 2.22
CCT: 6902 K
| Asus Zephyrus G14 GA401IV CEC PA LM140LF-1F01, IPS, 14", 1920x1080 | Asus ROG Zephyrus M15 GU502GU-XB74 AU Optronics B156HAN08.2, IPS, 15.6", 1920x1080 | Razer Blade 15 GTX 1660 Ti BOE NV156FHM-N4K, IPS, 15.6", 1920x1080 | MSI GS65 Stealth 9SG Sharp LQ156M1JW03 (SHP14C5), IPS, 15.6", 1920x1080 | Alienware m15 R2 P87F Sharp LQ156M1, IPS, 15.6", 1920x1080 | MSI Prestige 14 A10SC-009 IPS, 14", 3840x2160 | |
|---|---|---|---|---|---|---|
| Display | -1% | -1% | 4% | -0% | ||
| Display P3 Coverage (%) | 66.5 | 66.5 0% | 65.3 -2% | 67.6 2% | 65.3 -2% | |
| sRGB Coverage (%) | 92 | 90.8 -1% | 91.8 0% | 97.5 6% | 95.1 3% | |
| AdobeRGB 1998 Coverage (%) | 67.2 | 66.5 -1% | 66.5 -1% | 68.9 3% | 65.9 -2% | |
| Response Times | 80% | 70% | 68% | 69% | -15% | |
| Response Time Grey 50% / Grey 80% * (ms) | 43.6 ? | 6.4 ? 85% | 13.6 ? 69% | 13.6 ? 69% | 16.4 ? 62% | 55 ? -26% |
| Response Time Black / White * (ms) | 34.8 ? | 8.8 ? 75% | 10 ? 71% | 12 ? 66% | 8.8 ? 75% | 36 ? -3% |
| PWM Frequency (Hz) | 200 ? | 23260 ? | 23810 ? | |||
| Screen | -17% | -17% | 13% | -39% | 24% | |
| Brightness middle (cd/m²) | 322.2 | 297.7 -8% | 312.7 -3% | 282.3 -12% | 324.2 1% | 567 76% |
| Brightness (cd/m²) | 302 | 280 -7% | 305 1% | 269 -11% | 304 1% | 516 71% |
| Brightness Distribution (%) | 87 | 84 -3% | 90 3% | 90 3% | 90 3% | 86 -1% |
| Black Level * (cd/m²) | 0.26 | 0.43 -65% | 0.27 -4% | 0.32 -23% | 0.38 -46% | 0.445 -71% |
| Contrast (:1) | 1239 | 692 -44% | 1158 -7% | 882 -29% | 853 -31% | 1274 3% |
| Colorchecker dE 2000 * | 2.43 | 3.13 -29% | 4.57 -88% | 1.17 52% | 5.01 -106% | 1.55 36% |
| Colorchecker dE 2000 max. * | 5.07 | 7.1 -40% | 6.81 -34% | 3.29 35% | 12.7 -150% | 5.14 -1% |
| Colorchecker dE 2000 calibrated * | 2.29 | 3.06 -34% | 2.91 -27% | 1.06 54% | 1.64 28% | 1.24 46% |
| Greyscale dE 2000 * | 3.3 | 1.9 42% | 4.3 -30% | 1.3 61% | 7.9 -139% | 1.48 55% |
| Gamma | 2.22 99% | 2.23 99% | 2.29 96% | 2.2 100% | 2.35 94% | 2.19 100% |
| CCT | 6902 94% | 6325 103% | 7098 92% | 6643 98% | 8455 77% | 6741 96% |
| Color Space (Percent of AdobeRGB 1998) (%) | 60 | 59.2 -1% | 59.4 -1% | 63.8 6% | 60.8 1% | |
| Color Space (Percent of sRGB) (%) | 91.9 | 90.5 -2% | 91.3 -1% | 97.5 6% | 95.5 4% | |
| Média Total (Programa/Configurações) | 21% /
-2% | 17% /
-3% | 28% /
18% | 10% /
-19% | 5% /
17% |
* ... menor é melhor
Exibir tempos de resposta
| ↔ Tempo de resposta preto para branco | ||
|---|---|---|
| 34.8 ms ... ascensão ↗ e queda ↘ combinadas | ↗ 20.4 ms ascensão | 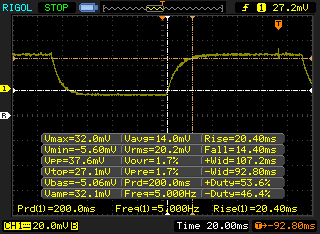 |
| ↘ 14.4 ms queda | ||
| A tela mostra taxas de resposta lentas em nossos testes e será insatisfatória para os jogadores. Em comparação, todos os dispositivos testados variam de 0.1 (mínimo) a 240 (máximo) ms. » 92 % de todos os dispositivos são melhores. Isso significa que o tempo de resposta medido é pior que a média de todos os dispositivos testados (19.8 ms). | ||
| ↔ Tempo de resposta 50% cinza a 80% cinza | ||
| 43.6 ms ... ascensão ↗ e queda ↘ combinadas | ↗ 21.2 ms ascensão | 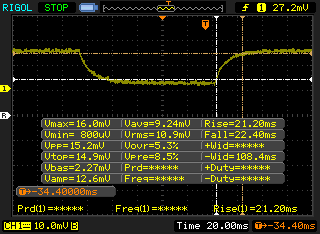 |
| ↘ 22.4 ms queda | ||
| A tela mostra taxas de resposta lentas em nossos testes e será insatisfatória para os jogadores. Em comparação, todos os dispositivos testados variam de 0.165 (mínimo) a 636 (máximo) ms. » 73 % de todos os dispositivos são melhores. Isso significa que o tempo de resposta medido é pior que a média de todos os dispositivos testados (31 ms). | ||
Cintilação da tela / PWM (modulação por largura de pulso)
| Tela tremeluzindo / PWM não detectado | 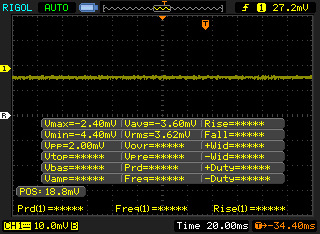 | ||
[pwm_comparison] Em comparação: 52 % de todos os dispositivos testados não usam PWM para escurecer a tela. Se PWM foi detectado, uma média de 7772 (mínimo: 5 - máximo: 343500) Hz foi medida. | |||
| Cinebench R20 | |
| CPU (Single Core) | |
| AMD Radeon RX Vega 64 | |
| Medion Erazer X15805 | |
| Corsair One i160 | |
| Asus Zephyrus G14 GA401IV | |
| Alienware m17 R2 P41E | |
| HP Omen 17-cb0020ng | |
| MSI Prestige 15 A10SC | |
| MSI GE75 9SG | |
| Asus ROG Zephyrus S GX701GXR | |
| MSI GF63 Thin 9SC | |
| MSI GE63 Raider 8SG | |
| Asus TUF FX705DT-AU068T | |
| MSI Alpha 15 A3DDK-034 | |
| CPU (Multi Core) | |
| Corsair One i160 | |
| AMD Radeon RX Vega 64 | |
| Asus Zephyrus G14 GA401IV | |
| Alienware m17 R2 P41E | |
| MSI GE75 9SG | |
| HP Omen 17-cb0020ng | |
| Medion Erazer X15805 | |
| MSI Prestige 15 A10SC | |
| Asus ROG Zephyrus S GX701GXR | |
| MSI GE63 Raider 8SG | |
| MSI GF63 Thin 9SC | |
| Asus TUF FX705DT-AU068T | |
| MSI Alpha 15 A3DDK-034 | |
| Cinebench R15 | |
| CPU Single 64Bit | |
| AMD Radeon RX Vega 64 | |
| Medion Erazer X15805 | |
| Corsair One i160 | |
| HP Omen 17-cb0020ng | |
| Alienware m17 R2 P41E | |
| Asus Zephyrus G14 GA401IV | |
| MSI Prestige 15 A10SC | |
| MSI GE75 9SG | |
| Asus ROG Zephyrus S GX701GXR | |
| MSI GF63 Thin 9SC | |
| MSI GE63 Raider 8SG | |
| Asus TUF FX705DT-AU068T | |
| MSI Alpha 15 A3DDK-034 | |
| CPU Multi 64Bit | |
| AMD Radeon RX Vega 64 | |
| Corsair One i160 | |
| Asus Zephyrus G14 GA401IV | |
| Alienware m17 R2 P41E | |
| MSI GE75 9SG | |
| HP Omen 17-cb0020ng | |
| Medion Erazer X15805 | |
| MSI Prestige 15 A10SC | |
| Asus ROG Zephyrus S GX701GXR | |
| MSI GE63 Raider 8SG | |
| MSI GF63 Thin 9SC | |
| Asus TUF FX705DT-AU068T | |
| MSI Alpha 15 A3DDK-034 | |
| Cinebench R11.5 | |
| CPU Single 64Bit | |
| Corsair One i160 | |
| AMD Radeon RX Vega 64 | |
| Asus Zephyrus G14 GA401IV | |
| MSI GE75 9SG | |
| CPU Multi 64Bit | |
| AMD Radeon RX Vega 64 | |
| Corsair One i160 | |
| MSI GE75 9SG | |
| Asus Zephyrus G14 GA401IV | |
| Cinebench R10 | |
| Rendering Multiple CPUs 32Bit | |
| Corsair One i160 | |
| MSI GE75 9SG | |
| AMD Radeon RX Vega 64 | |
| Asus Zephyrus G14 GA401IV | |
| Medion Erazer X15805 | |
| Asus ROG Zephyrus S GX701GXR | |
| MSI Alpha 15 A3DDK-034 | |
| Asus TUF FX705DT-AU068T | |
| Rendering Single 32Bit | |
| Corsair One i160 | |
| Medion Erazer X15805 | |
| MSI GE75 9SG | |
| Asus ROG Zephyrus S GX701GXR | |
| Asus Zephyrus G14 GA401IV | |
| AMD Radeon RX Vega 64 | |
| Asus TUF FX705DT-AU068T | |
| MSI Alpha 15 A3DDK-034 | |
| wPrime 2.10 - 1024m | |
| MSI GE75 9SG | |
| Corsair One i160 | |
| Asus Zephyrus G14 GA401IV | |
| AMD Radeon RX Vega 64 | |
* ... menor é melhor
| PCMark 8 Home Score Accelerated v2 | 4815 pontos | |
| PCMark 8 Work Score Accelerated v2 | 5738 pontos | |
| PCMark 10 Score | 5751 pontos | |
Ajuda | ||
| Asus Zephyrus G14 GA401IV Intel SSD 660p 1TB SSDPEKNW010T8 | Asus ROG Zephyrus M15 GU502GU-XB74 Intel SSD 660p SSDPEKNW512G8 | MSI GS65 Stealth 9SG Samsung SSD PM981 MZVLB512HAJQ | Alienware m15 R2 P87F 2x Toshiba XG6 KXG60ZNV512G (RAID 0) | MSI Prestige 14 A10SC-009 Samsung SSD PM981 MZVLB1T0HALR | |
|---|---|---|---|---|---|
| AS SSD | -30% | 47% | 23% | 60% | |
| Seq Read (MB/s) | 1278 | 1221 -4% | 2005 57% | 1925 51% | 2300 80% |
| Seq Write (MB/s) | 1624 | 911 -44% | 1580 -3% | 2371 46% | 2051 26% |
| 4K Read (MB/s) | 57.8 | 48.24 -17% | 49.33 -15% | 37.2 -36% | 46.23 -20% |
| 4K Write (MB/s) | 163 | 99.2 -39% | 103.8 -36% | 108.9 -33% | 84.6 -48% |
| 4K-64 Read (MB/s) | 582 | 321.4 -45% | 1241 113% | 1177 102% | 1552 167% |
| 4K-64 Write (MB/s) | 849 | 744 -12% | 1730 104% | 1135 34% | 1789 111% |
| Access Time Read * (ms) | 0.036 | 0.071 -97% | 0.054 -50% | 0.065 -81% | 0.049 -36% |
| Access Time Write * (ms) | 0.112 | 0.139 -24% | 0.036 68% | 0.108 4% | 0.045 60% |
| Score Read (Points) | 768 | 492 -36% | 1490 94% | 1407 83% | 1828 138% |
| Score Write (Points) | 1174 | 934 -20% | 1991 70% | 1481 26% | 2079 77% |
| Score Total (Points) | 2372 | 1681 -29% | 4230 78% | 3633 53% | 4831 104% |
| Copy ISO MB/s (MB/s) | 1660 | 906 -45% | 3025 82% | 2073 25% | |
| Copy Program MB/s (MB/s) | 443.5 | 486.6 10% | 713 61% | 576 30% | |
| Copy Game MB/s (MB/s) | 1162 | 952 -18% | 1554 34% | 1426 23% | |
| CrystalDiskMark 5.2 / 6 | -19% | -3% | 20% | 7% | |
| Write 4K (MB/s) | 189.5 | 156 -18% | 91.3 -52% | 108.8 -43% | 163.8 -14% |
| Read 4K (MB/s) | 62.7 | 60.7 -3% | 40.73 -35% | 45.41 -28% | 48.6 -22% |
| Write Seq (MB/s) | 1735 | 968 -44% | 1915 10% | 2467 42% | 2269 31% |
| Read Seq (MB/s) | 1608 | 1619 1% | 2051 28% | 2456 53% | 1963 22% |
| Write 4K Q32T1 (MB/s) | 475.5 | 485 2% | 308.3 -35% | 532 12% | 289.8 -39% |
| Read 4K Q32T1 (MB/s) | 555 | 337.3 -39% | 417.4 -25% | 590 6% | 373.6 -33% |
| Write Seq Q32T1 (MB/s) | 1802 | 969 -46% | 1922 7% | 2801 55% | 2395 33% |
| Read Seq Q32T1 (MB/s) | 1929 | 1825 -5% | 3395 76% | 3172 64% | 3479 80% |
| Média Total (Programa/Configurações) | -25% /
-26% | 22% /
29% | 22% /
22% | 34% /
38% |
* ... menor é melhor

| 3DMark | |
| 1920x1080 Fire Strike Graphics | |
| KFA2 GeForce RTX 2080 Ti EX | |
| Alienware m17 R2 P41E | |
| MSI RTX 2060 Gaming Z 6G | |
| Walmart EVOO Gaming 17 | |
| Schenker XMG Neo 15 XNE15M19 | |
| Asus Zephyrus G14 GA401IV | |
| Maingear Vector 15 | |
| Asus Zephyrus S GX531GM | |
| Lenovo IdeaPad S740-15IRH | |
| Asus TUF FX705GE-EW096T | |
| 2560x1440 Time Spy Graphics | |
| KFA2 GeForce RTX 2080 Ti EX | |
| Alienware m17 R2 P41E | |
| MSI RTX 2060 Gaming Z 6G | |
| Walmart EVOO Gaming 17 | |
| Schenker XMG Neo 15 XNE15M19 | |
| Asus Zephyrus G14 GA401IV | |
| Maingear Vector 15 | |
| Asus Zephyrus S GX531GM | |
| Lenovo IdeaPad S740-15IRH | |
| Asus TUF FX705GE-EW096T | |
| 2560x1440 Port Royal Graphics | |
| KFA2 GeForce RTX 2080 Ti EX | |
| Alienware m17 R2 P41E | |
| Walmart EVOO Gaming 17 | |
| Schenker XMG Neo 15 XNE15M19 | |
| Asus Zephyrus G14 GA401IV | |
| 2560x1440 Time Spy Score | |
| KFA2 GeForce RTX 2080 Ti EX | |
| Alienware m17 R2 P41E | |
| MSI RTX 2060 Gaming Z 6G | |
| Walmart EVOO Gaming 17 | |
| Schenker XMG Neo 15 XNE15M19 | |
| Asus Zephyrus G14 GA401IV | |
| Maingear Vector 15 | |
| Asus Zephyrus S GX531GM | |
| Lenovo IdeaPad S740-15IRH | |
| Asus TUF FX705GE-EW096T | |
| 3DMark 11 | |
| 1280x720 Performance GPU | |
| KFA2 GeForce RTX 2080 Ti EX | |
| Alienware m17 R2 P41E | |
| MSI RTX 2060 Gaming Z 6G | |
| Walmart EVOO Gaming 17 | |
| Schenker XMG Neo 15 XNE15M19 | |
| Asus Zephyrus G14 GA401IV | |
| Maingear Vector 15 | |
| Asus Zephyrus S GX531GM | |
| Lenovo IdeaPad S740-15IRH | |
| Asus TUF FX705GE-EW096T | |
| 1280x720 Performance Combined | |
| KFA2 GeForce RTX 2080 Ti EX | |
| Alienware m17 R2 P41E | |
| MSI RTX 2060 Gaming Z 6G | |
| Asus Zephyrus G14 GA401IV | |
| Walmart EVOO Gaming 17 | |
| Maingear Vector 15 | |
| Schenker XMG Neo 15 XNE15M19 | |
| Lenovo IdeaPad S740-15IRH | |
| Asus TUF FX705GE-EW096T | |
| Asus Zephyrus S GX531GM | |
| 3DMark 06 Standard Score | 37332 pontos | |
| 3DMark Vantage P Result | 50957 pontos | |
| 3DMark 11 Performance | 18937 pontos | |
| 3DMark Ice Storm Standard Score | 85539 pontos | |
| 3DMark Cloud Gate Standard Score | 38287 pontos | |
| 3DMark Fire Strike Score | 14649 pontos | |
| 3DMark Time Spy Score | 6171 pontos | |
Ajuda | ||
| Shadow of the Tomb Raider | |
| 1280x720 Lowest Preset | |
| Eurocom Sky X4C i9-9900KS | |
| MSI GE65 Raider 9SF-049US | |
| Alienware m17 R2 P41E | |
| MSI GF65 9SD | |
| MSI RTX 2060 Gaming Z 6G | |
| Walmart EVOO Gaming 17 | |
| HP Omen X 2S 15-dg0075cl | |
| Asus Zephyrus G14 GA401IV | |
| Lenovo Yoga C940-15IRH | |
| Asus ROG Zephyrus G15 GA502DU | |
| 1920x1080 High Preset AA:SM | |
| Eurocom Sky X4C i9-9900KS | |
| Alienware m17 R2 P41E | |
| MSI RTX 2060 Gaming Z 6G | |
| MSI GE65 Raider 9SF-049US | |
| Walmart EVOO Gaming 17 | |
| HP Omen X 2S 15-dg0075cl | |
| Asus Zephyrus G14 GA401IV | |
| MSI GF65 9SD | |
| Asus TUF FX705GM | |
| Asus ROG Zephyrus G15 GA502DU | |
| Lenovo Yoga C940-15IRH | |
| 1920x1080 Highest Preset AA:T | |
| Eurocom Sky X4C i9-9900KS | |
| Alienware m17 R2 P41E | |
| MSI GE65 Raider 9SF-049US | |
| MSI RTX 2060 Gaming Z 6G | |
| HP Omen X 2S 15-dg0075cl | |
| Walmart EVOO Gaming 17 | |
| Asus Zephyrus G14 GA401IV | |
| MSI GF65 9SD | |
| Asus ROG Zephyrus G15 GA502DU | |
| Asus TUF FX705GM | |
| Lenovo Yoga C940-15IRH | |
| The Witcher 3 | |
| 1024x768 Low Graphics & Postprocessing | |
| Eurocom Sky X4C i9-9900KS | |
| Alienware m17 R2 P41E | |
| HP Omen X 2S 15-dg0075cl | |
| Walmart EVOO Gaming 17 | |
| MSI GE65 Raider 9SF-049US | |
| MSI GF65 9SD | |
| MSI RTX 2060 Gaming Z 6G | |
| Asus Zephyrus G14 GA401IV | |
| Lenovo Yoga C940-15IRH | |
| Asus ROG Zephyrus G15 GA502DU | |
| 1920x1080 Ultra Graphics & Postprocessing (HBAO+) | |
| Eurocom Sky X4C i9-9900KS | |
| MSI GE65 Raider 9SF-049US | |
| Alienware m17 R2 P41E | |
| MSI RTX 2060 Gaming Z 6G | |
| HP Omen X 2S 15-dg0075cl | |
| Walmart EVOO Gaming 17 | |
| MSI GF65 9SD | |
| Asus Zephyrus G14 GA401IV | |
| Asus ROG Zephyrus G15 GA502DU | |
| Asus TUF FX705GM | |
| Lenovo Yoga C940-15IRH | |
| Rocket League | |
| 1280x720 Performance | |
| Lenovo Yoga C940-15IRH | |
| Asus Zephyrus G14 GA401IV | |
| MSI RTX 2060 Gaming Z 6G | |
| Asus ROG Zephyrus G15 GA502DU | |
| 1920x1080 High Quality AA:High FX | |
| MSI RTX 2060 Gaming Z 6G | |
| Asus Zephyrus G14 GA401IV | |
| Lenovo Yoga C940-15IRH | |
| Asus ROG Zephyrus G15 GA502DU | |
| baixo | média | alto | ultra | |
|---|---|---|---|---|
| Guild Wars 2 (2012) | 130.3 | 67.3 | 67.4 | |
| BioShock Infinite (2013) | 278.3 | 252.3 | 229.5 | 126.2 |
| The Witcher 3 (2015) | 232.2 | 168.2 | 100.6 | 58.4 |
| Metal Gear Solid V (2015) | 60 | 60 | 60 | 59.2 |
| Dota 2 Reborn (2015) | 120.8 | 115.1 | 107.8 | 103.8 |
| Ashes of the Singularity (2016) | 100.4 | 72.8 | 66.8 | |
| Doom (2016) | 125 | 125 | 118.2 | 111.5 |
| Overwatch (2016) | 299.9 | 299.7 | 229.7 | 146.9 |
| Rocket League (2017) | 246.9 | 249.7 | 219.3 | |
| Middle-earth: Shadow of War (2017) | 155 | 123 | 97 | 76 |
| Fortnite (2018) | 124 | 110.2 | 107.4 | 81.2 |
| Final Fantasy XV Benchmark (2018) | 141 | 82.7 | 62.4 | |
| X-Plane 11.11 (2018) | 94.9 | 81.9 | 69.7 | |
| Monster Hunter World (2018) | 104.5 | 94.2 | 75.6 | 63.6 |
| Shadow of the Tomb Raider (2018) | 118 | 90 | 84 | 74 |
| Assassin´s Creed Odyssey (2018) | 97 | 79 | 65 | 45 |
| Apex Legends (2019) | 143.6 | 142.8 | 126.2 | 116.6 |
| Metro Exodus (2019) | 129.6 | 72.7 | 55.2 | 43.8 |
| The Division 2 (2019) | 154 | 92 | 74 | 56 |
| Anno 1800 (2019) | 81.5 | 81.6 | 61.4 | 36.5 |
| Total War: Three Kingdoms (2019) | 201.1 | 103.3 | 69.2 | 50.7 |
| F1 2019 (2019) | 196 | 137 | 116 | 101 |
| Borderlands 3 (2019) | 117 | 89.5 | 61.9 | 48.3 |
| Ghost Recon Breakpoint (2019) | 123 | 82 | 75 | 55 |
| Need for Speed Heat (2019) | 103.2 | 88.7 | 82.2 | 79 |
| Escape from Tarkov (2020) | 78.5 | 68.5 | 68.2 | 85.3 |
| Hunt Showdown (2020) | 194.2 | 96.3 | 75.7 | |
| Doom Eternal (2020) | 176.1 | 108.7 | 95.7 | 93.3 |
| Asus Zephyrus G14 GA401IV GeForce RTX 2060 Max-Q, R9 4900HS, Intel SSD 660p 1TB SSDPEKNW010T8 | Asus ROG Zephyrus M15 GU502GU-XB74 GeForce GTX 1660 Ti Mobile, i7-9750H, Intel SSD 660p SSDPEKNW512G8 | Razer Blade 15 GTX 1660 Ti GeForce GTX 1660 Ti Mobile, i7-9750H, Samsung SSD PM981 MZVLB256HAHQ | MSI GS65 Stealth 9SG GeForce RTX 2080 Max-Q, i7-9750H, Samsung SSD PM981 MZVLB512HAJQ | Alienware m15 R2 P87F GeForce RTX 2080 Max-Q, i7-9750H, 2x Toshiba XG6 KXG60ZNV512G (RAID 0) | MSI Prestige 14 A10SC-009 GeForce GTX 1650 Max-Q, i7-10710U, Samsung SSD PM981 MZVLB1T0HALR | |
|---|---|---|---|---|---|---|
| Noise | -1% | 1% | 2% | -10% | 1% | |
| desligado / ambiente * (dB) | 28.1 | 28.2 -0% | 28.5 -1% | 28.3 -1% | 28.3 -1% | 30.3 -8% |
| Idle Minimum * (dB) | 30.4 | 28.7 6% | 30.3 -0% | 30.4 -0% | 28.5 6% | 30.3 -0% |
| Idle Average * (dB) | 31.5 | 30.5 3% | 30.5 3% | 30.5 3% | 28.5 10% | 30.3 4% |
| Idle Maximum * (dB) | 33.7 | 31 8% | 30.5 9% | 30.6 9% | 49 -45% | 30.3 10% |
| Load Average * (dB) | 34.3 | 39 -14% | 41 -20% | 37.6 -10% | 49 -43% | 40.2 -17% |
| Witcher 3 ultra * (dB) | 53.5 | 54.2 -1% | 48 10% | 46 14% | 49 8% | |
| Load Maximum * (dB) | 53.5 | 59.6 -11% | 51.9 3% | 55.1 -3% | 55 -3% | 43.5 19% |
* ... menor é melhor
Barulho
| Ocioso |
| 30.4 / 31.5 / 33.7 dB |
| Carga |
| 34.3 / 53.5 dB |
 | ||
30 dB silencioso 40 dB(A) audível 50 dB(A) ruidosamente alto |
||
min: | ||
(+) A temperatura máxima no lado superior é 36 °C / 97 F, em comparação com a média de 40.4 °C / 105 F , variando de 21.2 a 68.8 °C para a classe Gaming.
(-) A parte inferior aquece até um máximo de 46.4 °C / 116 F, em comparação com a média de 43.2 °C / 110 F
(+) Em uso inativo, a temperatura média para o lado superior é 25 °C / 77 F, em comparação com a média do dispositivo de 33.9 °C / ### class_avg_f### F.
(±) Jogando The Witcher 3, a temperatura média para o lado superior é 34.5 °C / 94 F, em comparação com a média do dispositivo de 33.9 °C / ## #class_avg_f### F.
(+) Os apoios para as mãos e o touchpad são mais frios que a temperatura da pele, com um máximo de 28.2 °C / 82.8 F e, portanto, são frios ao toque.
(±) A temperatura média da área do apoio para as mãos de dispositivos semelhantes foi 28.8 °C / 83.8 F (+0.6 °C / 1 F).
| desligado | |
| Ocioso | |
| Carga |
|
Key:
min: | |
| Asus Zephyrus G14 GA401IV R9 4900HS, GeForce RTX 2060 Max-Q, Intel SSD 660p 1TB SSDPEKNW010T8, IPS, 1920x1080, 14" | Asus ROG Zephyrus M15 GU502GU-XB74 i7-9750H, GeForce GTX 1660 Ti Mobile, Intel SSD 660p SSDPEKNW512G8, IPS, 1920x1080, 15.6" | MSI GS65 Stealth 9SG i7-9750H, GeForce RTX 2080 Max-Q, Samsung SSD PM981 MZVLB512HAJQ, IPS, 1920x1080, 15.6" | MSI Prestige 14 A10SC-009 i7-10710U, GeForce GTX 1650 Max-Q, Samsung SSD PM981 MZVLB1T0HALR, IPS, 3840x2160, 14" | Razer Blade Stealth i7-1065G7 Iris Plus i7-1065G7, Iris Plus Graphics G7 (Ice Lake 64 EU), Samsung SSD PM981 MZVLB256HAHQ, IPS, 1920x1080, 13.3" | Dell G7 7590 i7-9750H, GeForce RTX 2060 Mobile, Toshiba BG3 KBG30ZMS256G, IPS, 1920x1080, 15.6" | |
|---|---|---|---|---|---|---|
| Power Consumption | -117% | -86% | 13% | 36% | -74% | |
| Idle Minimum * (Watt) | 5.5 | 17.6 -220% | 18.3 -233% | 5.2 5% | 5.9 -7% | 11.2 -104% |
| Idle Average * (Watt) | 9.3 | 24.7 -166% | 22 -137% | 12.2 -31% | 8.1 13% | 16.3 -75% |
| Idle Maximum * (Watt) | 15.8 | 56.3 -256% | 28.8 -82% | 14.3 9% | 11.2 29% | 46.2 -192% |
| Load Average * (Watt) | 92.2 | 111.1 -20% | 93 -1% | 67 27% | 44.3 52% | 123.3 -34% |
| Witcher 3 ultra * (Watt) | 112.4 | 149 -33% | 142.6 -27% | 41.9 63% | 135.6 -21% | |
| Load Maximum * (Watt) | 156.6 | 170 -9% | 215.9 -38% | 67 57% | 50.2 68% | 181.5 -16% |
* ... menor é melhor
| Asus Zephyrus G14 GA401IV R9 4900HS, GeForce RTX 2060 Max-Q, 76 Wh | Asus ROG Zephyrus M15 GU502GU-XB74 i7-9750H, GeForce GTX 1660 Ti Mobile, 76 Wh | Razer Blade 15 GTX 1660 Ti i7-9750H, GeForce GTX 1660 Ti Mobile, 65 Wh | MSI GS65 Stealth 9SG i7-9750H, GeForce RTX 2080 Max-Q, 82 Wh | Alienware m15 R2 P87F i7-9750H, GeForce RTX 2080 Max-Q, 76 Wh | MSI Prestige 14 A10SC-009 i7-10710U, GeForce GTX 1650 Max-Q, 52 Wh | |
|---|---|---|---|---|---|---|
| Duração da bateria | -41% | -43% | -37% | -52% | -23% | |
| Reader / Idle (h) | 19 | 7.1 -63% | 9.2 -52% | 9.9 -48% | ||
| WiFi v1.3 (h) | 9.6 | 4.5 -53% | 5.5 -43% | 6 -37% | 5.5 -43% | 5.9 -39% |
| Load (h) | 1.8 | 1.7 -6% | 0.7 -61% | 2.1 17% |
Pro
Contra
Veredicto: Desempenho a qualquer custo
Todos esses slides da AMD e vazamentos de benchmark comparando o Ryzen 9 ao Core i9 resultaram verdadeiros; a Ryzen 9 4900HS de 7 nm superará o Core i9-9880H de 14 nm em cargas de trabalho multithread por margens relativamente amplas, comparando-se com o melhor que o Core i9-9980HK tem a oferecer. Ao considerar que a CPU AMD móvel mais rápida neste ano passado foi a Ryzen 7 3750H, o novo Ryzen 9 4900HS representa um salto significante tanto no desempenho quanto no desempenho-por-Watt. A Intel terá muito o que fazer quando lançar a série Comet Lake-H de 10a geração nos próximos meses.
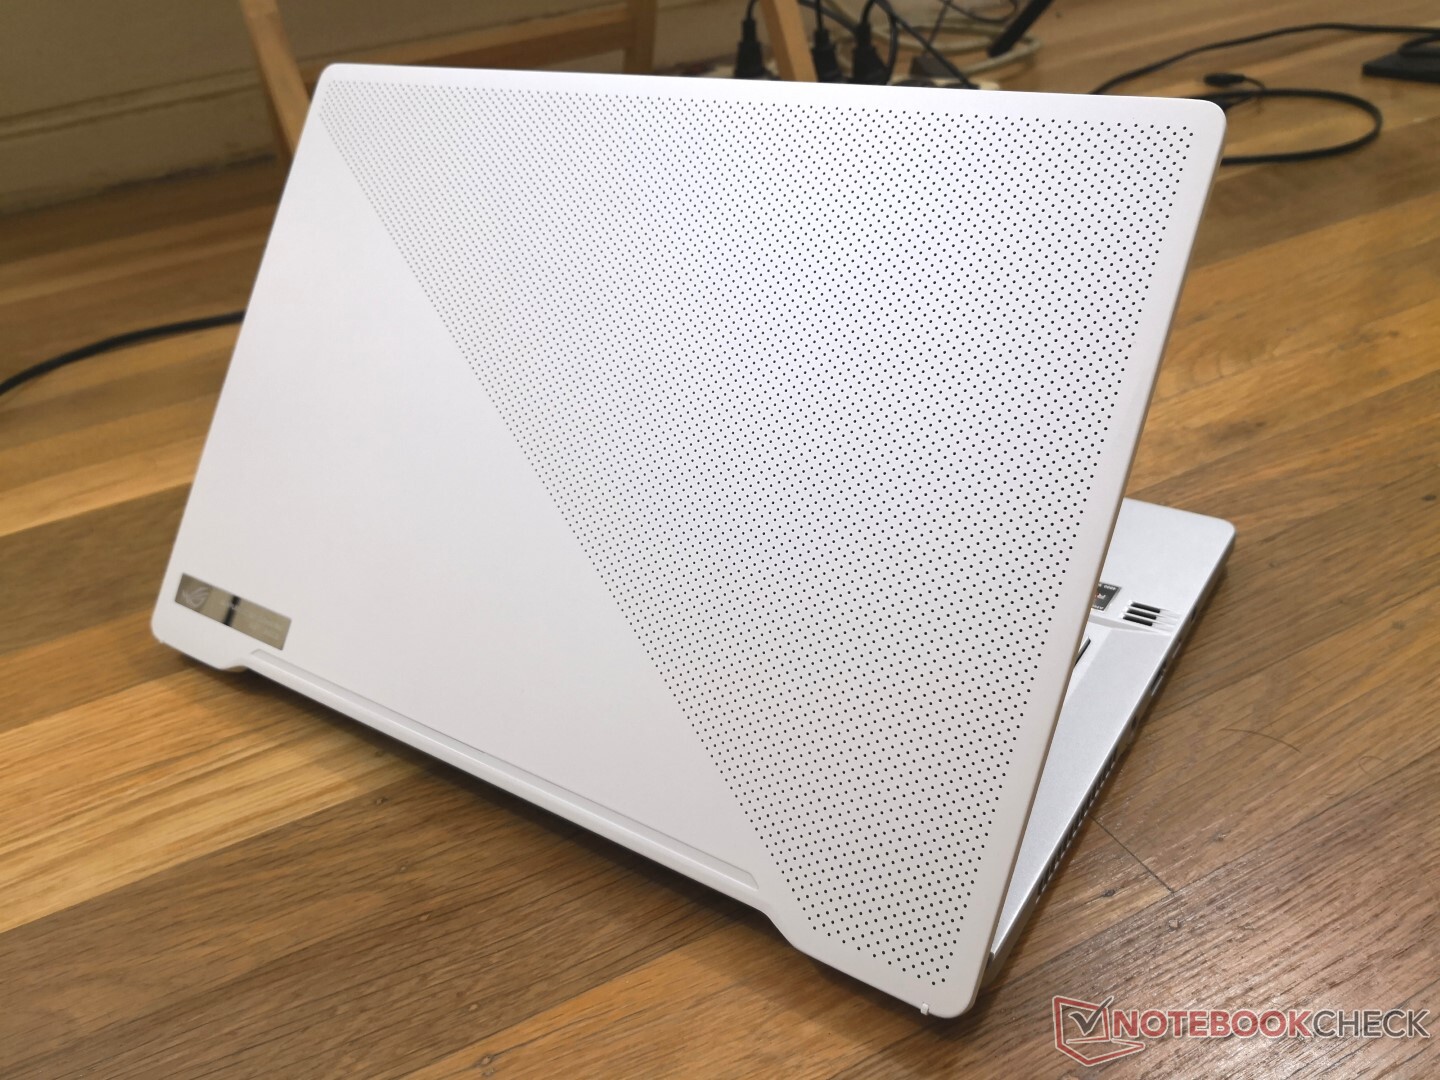
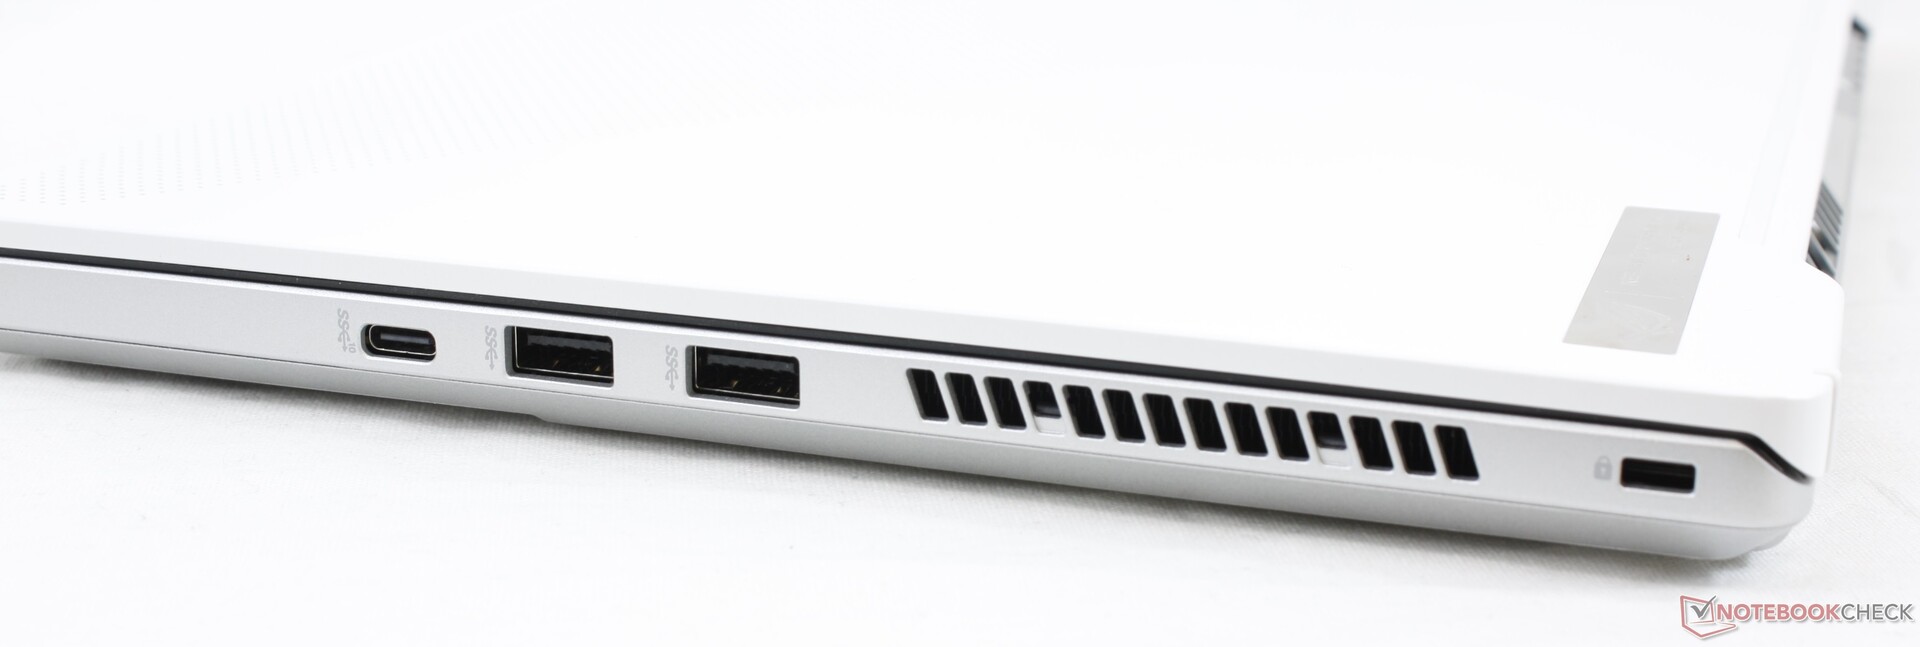
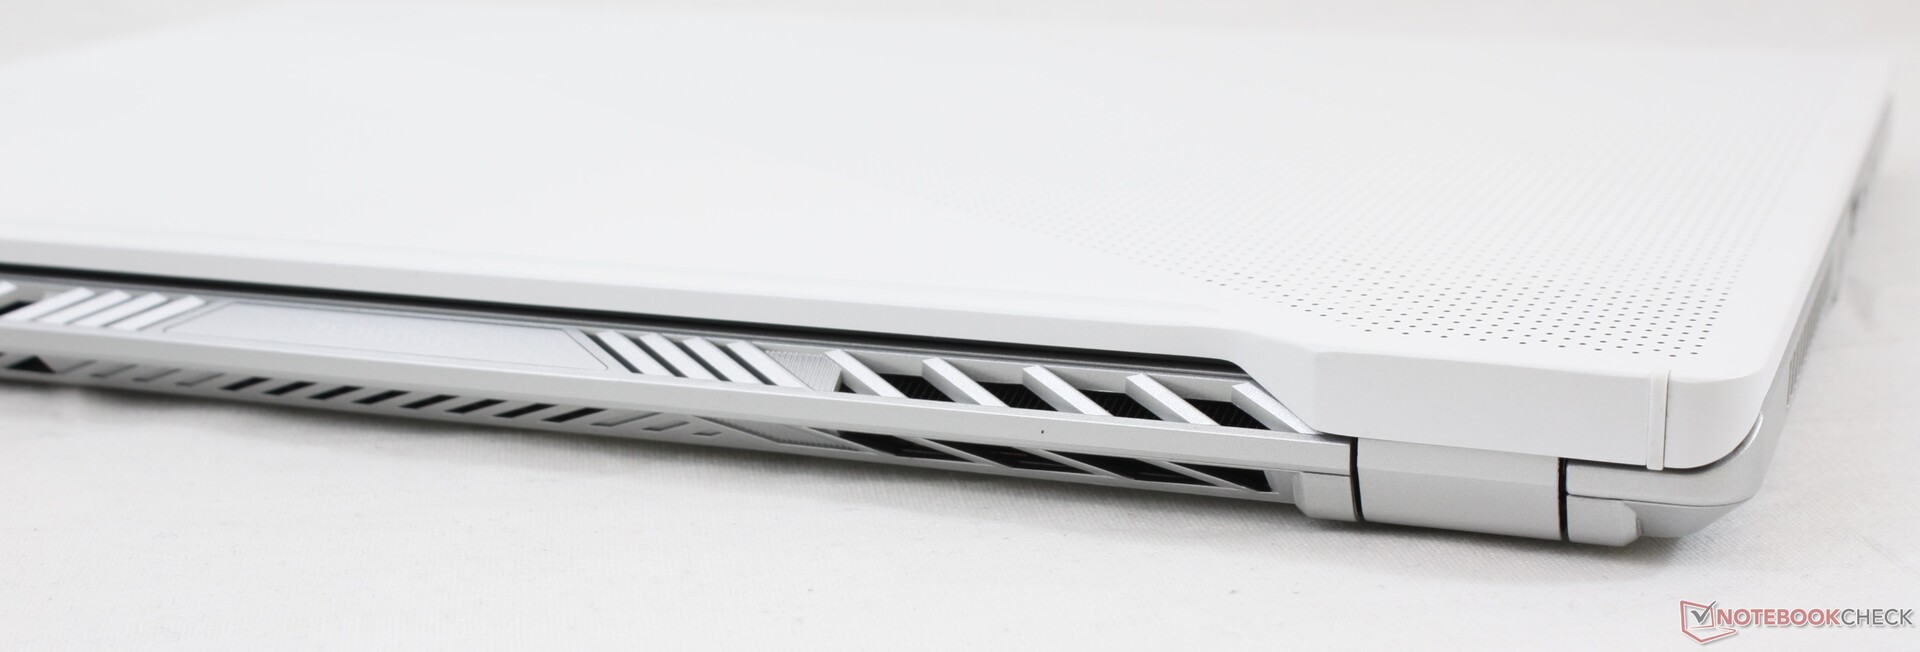
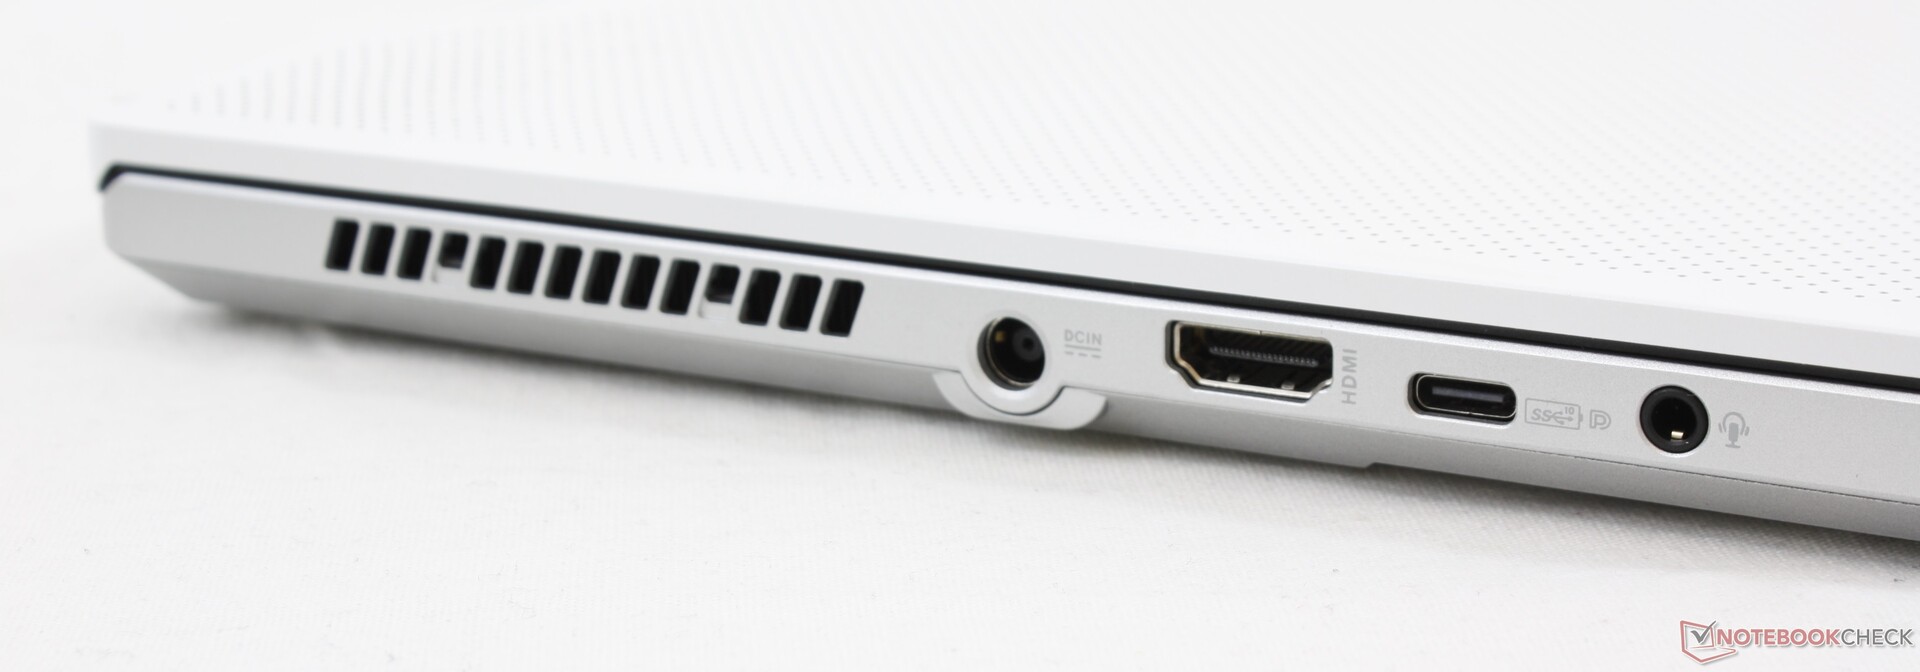
Além do novo processador AMD, estamos impressionados com o fato de a Asus ter conseguido acomodar tanto poder de computação em um chassi de 14 polegadas com marcos estreitos sem recorrer a um afogamento pesado. Estamos falando de um desempenho mais rápido que o do Core i9 no que é essencialmente um subportátil. A facilidade de manutenção, a RAM e o SSD atualizáveis, a tela FreeSync de 120 Hz, a iluminação exclusiva da tampa externa com LEDs micro e o carregamento USB tipo C estão no topo do bolo para tornar o Zephyrus G14 ainda mais exclusivo do que já é.
Há um pequeno número de desvantagens importantes. A primeira é a duração da bateria, que, na melhor das hipóteses, é apenas mediana para sua categoria. Em segundo lugar, o ruído do ventilador é alto e pulsa mais do que gostaríamos, o que será uma distração para os jogos sem um par de fones de ouvido. Em terceiro lugar, a tampa poderia ser mais rígida, pois flexiona mais, mesmo quando comparada com os próprios portáteis ZenBook da Asus. Por fim, o tempo de resposta do monitor em preto e branco de 20 ms é mais lento do que na maioria dos portáteis de jogos de 15,6 polegadas, nos quais painéis de 3 e 5 ms se tornaram comuns. É incrível poder jogar em um sistema tão pequeno e poderoso, mas o ghosting moderado e o ruído perceptível dos ventiladores lembram rapidamente as limitações atuais.
Se você viaja muito e consegue aproveitar a velocidade absurda, então o desempenho do Zephyrus G14 não decepcionará. As próximas alternativas mais próximas seriam o Razer Blade Stealth de 13,3 polegadas ou o MSI Prestige 14 de 14 polegadas, mas esses sistemas vêm "apenas" com CPUs Core U mais lentas e a GPU GTX 1650 Max-Q.
O Zephyrus G14 possui uma quantidade incrível de potência nunca antes vista nesse formato. Você perceberá lentamente as desvantagens ao longo do tempo, mas pode estar disposto a esquecê-las ao considerar o desempenho que está obtendo.
Asus Zephyrus G14 GA401IV
- 06/09/2020 v7 (old)
Allen Ngo
Price comparison
