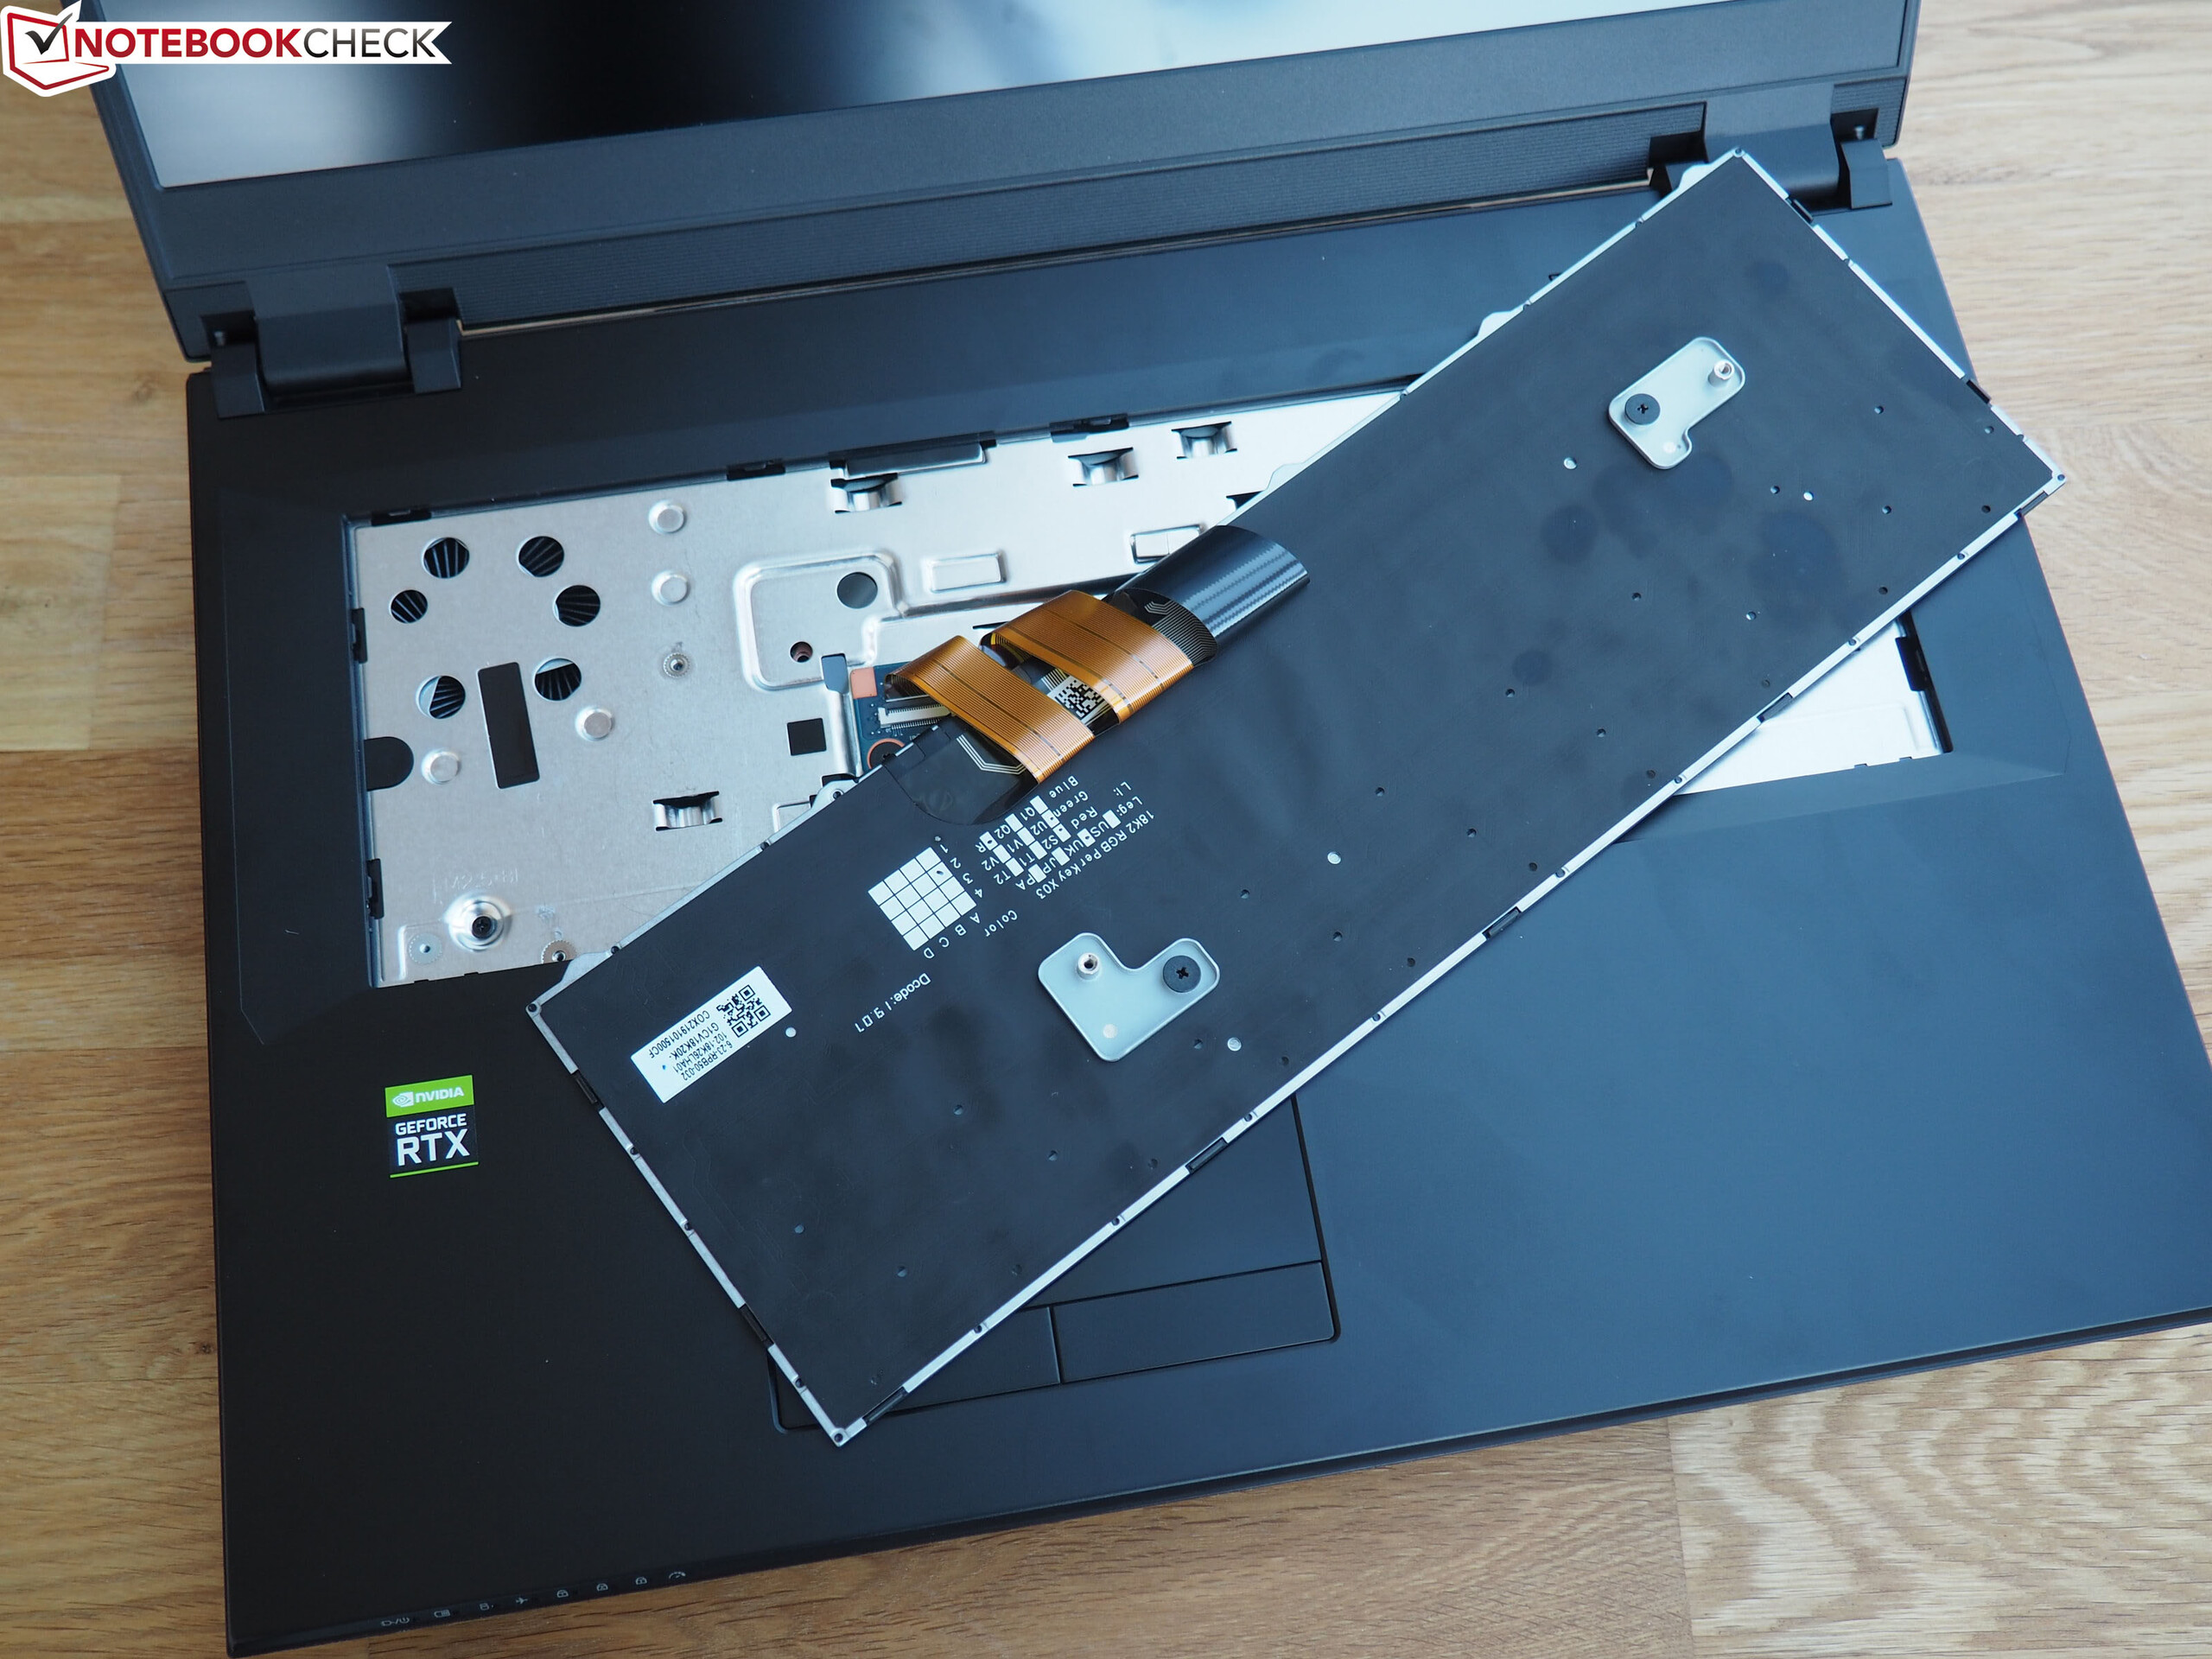
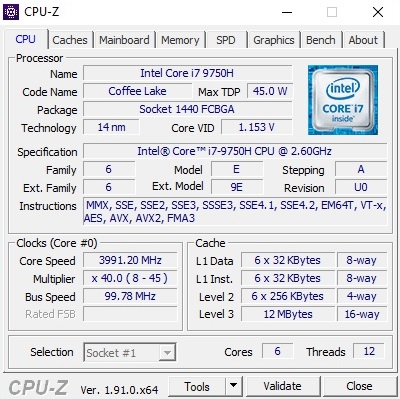
Breve Análise do Portátil Schenker XMG Pro 17 (Clevo PB71RD-G): Temperatura contra Ruído
Avaliação | Data | Modelo | Peso | Altura | Size | Resolução | Preço |
|---|---|---|---|---|---|---|---|
| 83.2 % v7 (old) | 03/2020 | Schenker XMG Pro 17 PB71RD-G i7-9750H, GeForce RTX 2060 Mobile | 2.8 kg | 30 mm | 17.30" | 1920x1080 | |
| 89.4 % v6 (old) | 08/2019 | Razer Blade Pro 17 RTX 2060 i7-9750H, GeForce RTX 2060 Mobile | 2.8 kg | 19.9 mm | 17.30" | 1920x1080 | |
| 86 % v7 (old) | 09/2019 | Asus Strix Hero III G731GV i7-9750H, GeForce RTX 2060 Mobile | 2.9 kg | 26.2 mm | 17.30" | 1920x1080 | |
| 83.2 % v7 (old) | 10/2019 | Lenovo Legion Y740-17IRH i7-9750H, GeForce RTX 2060 Mobile | 3 kg | 23 mm | 17.30" | 1920x1080 | |
| 82.9 % v7 (old) | 10/2019 | MSI GL75 9SEK-056US i7-9750H, GeForce RTX 2060 Mobile | 2.5 kg | 28 mm | 17.30" | 1920x1080 |
| SD Card Reader | |
| average JPG Copy Test (av. of 3 runs) | |
| Schenker XMG Pro 17 PB71RD-G (Toshiba Exceria Pro SDXC 64 GB UHS-II) | |
| Razer Blade Pro 17 RTX 2060 (Toshiba Exceria Pro SDXC 64 GB UHS-II) | |
| Média da turma Gaming (20.9 - 210, n=54, últimos 2 anos) | |
| MSI GL75 9SEK-056US | |
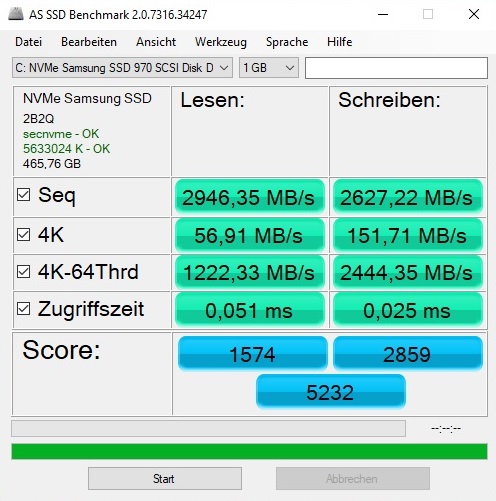
| maximum AS SSD Seq Read Test (1GB) | |
| Schenker XMG Pro 17 PB71RD-G (Toshiba Exceria Pro SDXC 64 GB UHS-II) | |
| Razer Blade Pro 17 RTX 2060 (Toshiba Exceria Pro SDXC 64 GB UHS-II) | |
| Média da turma Gaming (25.5 - 261, n=51, últimos 2 anos) | |
| MSI GL75 9SEK-056US | |

| |||||||||||||||||||||||||
iluminação: 95 %
iluminação com acumulador: 274 cd/m²
Contraste: 1054:1 (Preto: 0.26 cd/m²)
ΔE ColorChecker Calman: 4.62 | ∀{0.5-29.43 Ø4.73}
calibrated: 1.93
ΔE Greyscale Calman: 5.3 | ∀{0.09-98 Ø4.97}
90% sRGB (Argyll 1.6.3 3D)
58% AdobeRGB 1998 (Argyll 1.6.3 3D)
64.2% AdobeRGB 1998 (Argyll 3D)
89.8% sRGB (Argyll 3D)
62.8% Display P3 (Argyll 3D)
Gamma: 2.34
CCT: 7619 K
| Schenker XMG Pro 17 PB71RD-G AU Optronics B173HAN04.0 (AUO409D), IPS, 1920x1080 | Razer Blade Pro 17 RTX 2060 AU Optronics B173HAN04.0, IPS, 1920x1080 | Asus Strix Hero III G731GV AU Optronics AUO B173HAN04.0, IPS, 1920x1080 | Lenovo Legion Y740-17IRH LG Philips LP173WFG-SPD2 (LGD05E0), IPS, 1920x1080 | MSI GL75 9SEK-056US AU Optronics AUO479D (B173HAN04.7), IPS, 1920x1080 | |
|---|---|---|---|---|---|
| Display | -2% | -1% | 4% | -34% | |
| Display P3 Coverage (%) | 62.8 | 61.1 -3% | 62.9 0% | 64.8 3% | 41.12 -35% |
| sRGB Coverage (%) | 89.8 | 89.4 0% | 87.2 -3% | 96 7% | 61.1 -32% |
| AdobeRGB 1998 Coverage (%) | 64.2 | 62.5 -3% | 63.8 -1% | 65.8 2% | 42.49 -34% |
| Response Times | 44% | 30% | 10% | -79% | |
| Response Time Grey 50% / Grey 80% * (ms) | 16.8 ? | 6.8 ? 60% | 6.8 ? 60% | 14.8 ? 12% | 26 ? -55% |
| Response Time Black / White * (ms) | 12 ? | 8.8 ? 27% | 12 ? -0% | 11.2 ? 7% | 24.4 ? -103% |
| PWM Frequency (Hz) | |||||
| Screen | 9% | 4% | 8% | -27% | |
| Brightness middle (cd/m²) | 274 | 300.4 10% | 312.3 14% | 282 3% | 259.1 -5% |
| Brightness (cd/m²) | 273 | 289 6% | 297 9% | 261 -4% | 261 -4% |
| Brightness Distribution (%) | 95 | 93 -2% | 91 -4% | 87 -8% | 93 -2% |
| Black Level * (cd/m²) | 0.26 | 0.32 -23% | 0.21 19% | 0.27 -4% | 0.25 4% |
| Contrast (:1) | 1054 | 939 -11% | 1487 41% | 1044 -1% | 1036 -2% |
| Colorchecker dE 2000 * | 4.62 | 2.32 50% | 3.6 22% | 3.18 31% | 4.23 8% |
| Colorchecker dE 2000 max. * | 7.66 | 3.81 50% | 6.74 12% | 8.39 -10% | 23.39 -205% |
| Colorchecker dE 2000 calibrated * | 1.93 | 2.95 -53% | 3.95 -105% | 0.95 51% | 3.9 -102% |
| Greyscale dE 2000 * | 5.3 | 1.5 72% | 3.1 42% | 4.1 23% | 1.3 75% |
| Gamma | 2.34 94% | 2.3 96% | 2.26 97% | 2.55 86% | 2.076 106% |
| CCT | 7619 85% | 6764 96% | 7002 93% | 7260 90% | 6542 99% |
| Color Space (Percent of AdobeRGB 1998) (%) | 58 | 57.4 -1% | 56.6 -2% | 61 5% | 39 -33% |
| Color Space (Percent of sRGB) (%) | 90 | 89 -1% | 86.6 -4% | 96 7% | 61 -32% |
| Média Total (Programa/Configurações) | 17% /
11% | 11% /
6% | 7% /
8% | -47% /
-35% |
* ... menor é melhor
Exibir tempos de resposta
| ↔ Tempo de resposta preto para branco | ||
|---|---|---|
| 12 ms ... ascensão ↗ e queda ↘ combinadas | ↗ 6.8 ms ascensão | 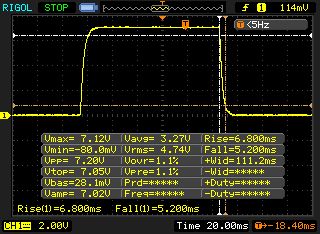 |
| ↘ 5.2 ms queda | ||
| A tela mostra boas taxas de resposta em nossos testes, mas pode ser muito lenta para jogadores competitivos. Em comparação, todos os dispositivos testados variam de 0.1 (mínimo) a 240 (máximo) ms. » 31 % de todos os dispositivos são melhores. Isso significa que o tempo de resposta medido é melhor que a média de todos os dispositivos testados (19.9 ms). | ||
| ↔ Tempo de resposta 50% cinza a 80% cinza | ||
| 16.8 ms ... ascensão ↗ e queda ↘ combinadas | ↗ 8.4 ms ascensão | 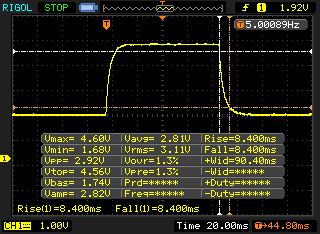 |
| ↘ 8.4 ms queda | ||
| A tela mostra boas taxas de resposta em nossos testes, mas pode ser muito lenta para jogadores competitivos. Em comparação, todos os dispositivos testados variam de 0.165 (mínimo) a 636 (máximo) ms. » 31 % de todos os dispositivos são melhores. Isso significa que o tempo de resposta medido é melhor que a média de todos os dispositivos testados (31.1 ms). | ||
Cintilação da tela / PWM (modulação por largura de pulso)
| Tela tremeluzindo / PWM não detectado | 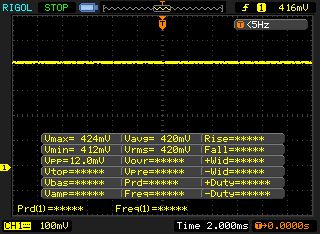 | ||
[pwm_comparison] Em comparação: 52 % de todos os dispositivos testados não usam PWM para escurecer a tela. Se PWM foi detectado, uma média de 7798 (mínimo: 5 - máximo: 343500) Hz foi medida. | |||
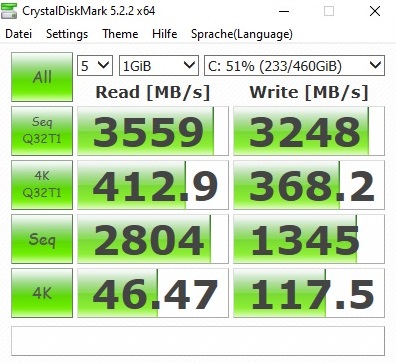
| Schenker XMG Pro 17 PB71RD-G Samsung SSD 970 EVO Plus 500GB | Razer Blade Pro 17 RTX 2060 Samsung SSD PM981 MZVLB512HAJQ | Asus Strix Hero III G731GV Intel SSD 660p SSDPEKNW512G8 | Lenovo Legion Y740-17IRH WDC PC SN520 SDAPMUW-128G | MSI GL75 9SEK-056US WDC PC SN520 SDAPNUW-512G | |
|---|---|---|---|---|---|
| CrystalDiskMark 5.2 / 6 | -3% | -20% | -44% | -1% | |
| Write 4K (MB/s) | 117.5 | 124.1 6% | 129.3 10% | 102.7 -13% | 149.1 27% |
| Read 4K (MB/s) | 46.47 | 44.75 -4% | 54.4 17% | 29.12 -37% | 48.58 5% |
| Write Seq (MB/s) | 1345 | 1292 -4% | 978 -27% | 362.2 -73% | |
| Read Seq (MB/s) | 2804 | 1272 -55% | 1447 -48% | 1010 -64% | |
| Write 4K Q32T1 (MB/s) | 368.2 | 514 40% | 476.8 29% | 298.1 -19% | 462 25% |
| Read 4K Q32T1 (MB/s) | 412.9 | 596 44% | 338.1 -18% | 349.6 -15% | 606 47% |
| Write Seq Q32T1 (MB/s) | 3248 | 1892 -42% | 982 -70% | 788 -76% | 1454 -55% |
| Read Seq Q32T1 (MB/s) | 3559 | 3209 -10% | 1622 -54% | 1490 -58% | 1724 -52% |

| 3DMark 11 Performance | 16140 pontos | |
| 3DMark Cloud Gate Standard Score | 31746 pontos | |
| 3DMark Fire Strike Score | 14712 pontos | |
| 3DMark Time Spy Score | 5830 pontos | |
Ajuda | ||
| The Witcher 3 - 1920x1080 Ultra Graphics & Postprocessing (HBAO+) | |
| Média da turma Gaming (95 - 240, n=8, últimos 2 anos) | |
| Razer Blade Pro 17 RTX 2060 | |
| Schenker XMG Pro 17 PB71RD-G | |
| Lenovo Legion Y740-17IRH | |
| MSI GL75 9SEK-056US | |
| Asus Strix Hero III G731GV | |
| baixo | média | alto | ultra | |
|---|---|---|---|---|
| The Witcher 3 (2015) | 103 | 58.5 | ||
| Dota 2 Reborn (2015) | 127 | 109 | 97.5 | 91.3 |
| X-Plane 11.11 (2018) | 91.5 | 76.3 | 66.2 | |
| Anthem (2019) | 55.8 | 47.7 | ||
| FIFA 20 (2019) | 111 | 109 | ||
| GRID 2019 (2019) | 64.8 | 58.2 | ||
| Call of Duty Modern Warfare 2019 (2019) | 87.4 | 74.1 | ||
| Need for Speed Heat (2019) | 62.8 | 57.8 | ||
| Star Wars Jedi Fallen Order (2019) | 65.8 | 65.4 | ||
| Red Dead Redemption 2 (2019) | 50.7 | 32.8 |
Barulho
| Ocioso |
| 30 / 32 / 39 dB |
| Carga |
| 51 / 54 dB |
 | ||
30 dB silencioso 40 dB(A) audível 50 dB(A) ruidosamente alto |
||
min: | ||
| Schenker XMG Pro 17 PB71RD-G i7-9750H, GeForce RTX 2060 Mobile | Razer Blade Pro 17 RTX 2060 i7-9750H, GeForce RTX 2060 Mobile | Asus Strix Hero III G731GV i7-9750H, GeForce RTX 2060 Mobile | Lenovo Legion Y740-17IRH i7-9750H, GeForce RTX 2060 Mobile | MSI GL75 9SEK-056US i7-9750H, GeForce RTX 2060 Mobile | Média da turma Gaming | |
|---|---|---|---|---|---|---|
| Noise | 11% | 7% | 3% | 8% | 15% | |
| desligado / ambiente * (dB) | 30 | 28.2 6% | 28.2 6% | 30 -0% | 28.1 6% | 24.1 ? 20% |
| Idle Minimum * (dB) | 30 | 28.2 6% | 29.5 2% | 33 -10% | 30.9 -3% | 25.8 ? 14% |
| Idle Average * (dB) | 32 | 28.2 12% | 30.3 5% | 34 -6% | 30.9 3% | 27.4 ? 14% |
| Idle Maximum * (dB) | 39 | 28.2 28% | 31.9 18% | 35 10% | 31 21% | 30 ? 23% |
| Load Average * (dB) | 51 | 43 16% | 50.4 1% | 48 6% | 39 24% | 43 ? 16% |
| Witcher 3 ultra * (dB) | 54 | 48.4 10% | 50.1 7% | 46 15% | 53.5 1% | |
| Load Maximum * (dB) | 54 | 53.4 1% | 50.1 7% | 49 9% | 53.5 1% | 54 ? -0% |
* ... menor é melhor
(-) A temperatura máxima no lado superior é 47 °C / 117 F, em comparação com a média de 40.4 °C / 105 F , variando de 21.2 a 68.8 °C para a classe Gaming.
(-) A parte inferior aquece até um máximo de 48 °C / 118 F, em comparação com a média de 43.2 °C / 110 F
(+) Em uso inativo, a temperatura média para o lado superior é 27.4 °C / 81 F, em comparação com a média do dispositivo de 33.9 °C / ### class_avg_f### F.
(±) Jogando The Witcher 3, a temperatura média para o lado superior é 35.7 °C / 96 F, em comparação com a média do dispositivo de 33.9 °C / ## #class_avg_f### F.
(+) Os apoios para as mãos e o touchpad são mais frios que a temperatura da pele, com um máximo de 27 °C / 80.6 F e, portanto, são frios ao toque.
(±) A temperatura média da área do apoio para as mãos de dispositivos semelhantes foi 28.8 °C / 83.8 F (+1.8 °C / 3.2 F).
| Schenker XMG Pro 17 PB71RD-G i7-9750H, GeForce RTX 2060 Mobile | Razer Blade Pro 17 RTX 2060 i7-9750H, GeForce RTX 2060 Mobile | Asus Strix Hero III G731GV i7-9750H, GeForce RTX 2060 Mobile | Lenovo Legion Y740-17IRH i7-9750H, GeForce RTX 2060 Mobile | MSI GL75 9SEK-056US i7-9750H, GeForce RTX 2060 Mobile | Média da turma Gaming | |
|---|---|---|---|---|---|---|
| Heat | 7% | -3% | 3% | -16% | -0% | |
| Maximum Upper Side * (°C) | 47 | 40.6 14% | 47.2 -0% | 43 9% | 49.4 -5% | 45.2 ? 4% |
| Maximum Bottom * (°C) | 48 | 45.4 5% | 51 -6% | 46 4% | 50.6 -5% | 48 ? -0% |
| Idle Upper Side * (°C) | 30 | 30 -0% | 30.2 -1% | 31 -3% | 39 -30% | 31.1 ? -4% |
| Idle Bottom * (°C) | 34 | 31 9% | 35.4 -4% | 34 -0% | 42 -24% | 34.2 ? -1% |
* ... menor é melhor
Schenker XMG Pro 17 PB71RD-G análise de áudio
(+) | os alto-falantes podem tocar relativamente alto (###valor### dB)
Graves 100 - 315Hz
(±) | graves reduzidos - em média 10.3% menor que a mediana
(±) | a linearidade dos graves é média (12.2% delta para a frequência anterior)
Médios 400 - 2.000 Hz
(±) | médios mais altos - em média 7.6% maior que a mediana
(+) | médios são lineares (6% delta para frequência anterior)
Altos 2 - 16 kHz
(+) | agudos equilibrados - apenas 1.1% longe da mediana
(+) | os máximos são lineares (2.5% delta da frequência anterior)
Geral 100 - 16.000 Hz
(+) | o som geral é linear (12% diferença em relação à mediana)
Comparado com a mesma classe
» 12% de todos os dispositivos testados nesta classe foram melhores, 4% semelhantes, 84% piores
» O melhor teve um delta de 6%, a média foi 18%, o pior foi 132%
Comparado com todos os dispositivos testados
» 9% de todos os dispositivos testados foram melhores, 2% semelhantes, 88% piores
» O melhor teve um delta de 4%, a média foi 24%, o pior foi 134%
Razer Blade Pro 17 RTX 2060 análise de áudio
(+) | os alto-falantes podem tocar relativamente alto (###valor### dB)
Graves 100 - 315Hz
(±) | graves reduzidos - em média 9.6% menor que a mediana
(±) | a linearidade dos graves é média (14.4% delta para a frequência anterior)
Médios 400 - 2.000 Hz
(±) | médios mais altos - em média 6.7% maior que a mediana
(+) | médios são lineares (5.1% delta para frequência anterior)
Altos 2 - 16 kHz
(+) | agudos equilibrados - apenas 2.4% longe da mediana
(+) | os máximos são lineares (4.4% delta da frequência anterior)
Geral 100 - 16.000 Hz
(±) | a linearidade do som geral é média (18.1% diferença em relação à mediana)
Comparado com a mesma classe
» 57% de todos os dispositivos testados nesta classe foram melhores, 8% semelhantes, 35% piores
» O melhor teve um delta de 6%, a média foi 18%, o pior foi 132%
Comparado com todos os dispositivos testados
» 38% de todos os dispositivos testados foram melhores, 8% semelhantes, 54% piores
» O melhor teve um delta de 4%, a média foi 24%, o pior foi 134%
| desligado | |
| Ocioso | |
| Carga |
|
Key:
min: | |
| Schenker XMG Pro 17 PB71RD-G i7-9750H, GeForce RTX 2060 Mobile | Razer Blade Pro 17 RTX 2060 i7-9750H, GeForce RTX 2060 Mobile | Asus Strix Hero III G731GV i7-9750H, GeForce RTX 2060 Mobile | Lenovo Legion Y740-17IRH i7-9750H, GeForce RTX 2060 Mobile | MSI GL75 9SEK-056US i7-9750H, GeForce RTX 2060 Mobile | Média da turma Gaming | |
|---|---|---|---|---|---|---|
| Power Consumption | -14% | -20% | -11% | 11% | -8% | |
| Idle Minimum * (Watt) | 11 | 16 -45% | 16.2 -47% | 20 -82% | 10.7 3% | 13.2 ? -20% |
| Idle Average * (Watt) | 18 | 21.7 -21% | 24.8 -38% | 21 -17% | 15.2 16% | 18.9 ? -5% |
| Idle Maximum * (Watt) | 28 | 26.1 7% | 28.6 -2% | 26 7% | 17.8 36% | 24.3 ? 13% |
| Load Average * (Watt) | 99 | 105.6 -7% | 127.6 -29% | 97 2% | 88.2 11% | 108 ? -9% |
| Witcher 3 ultra * (Watt) | 146 | 161.8 -11% | 147.1 -1% | 139 5% | 147.8 -1% | |
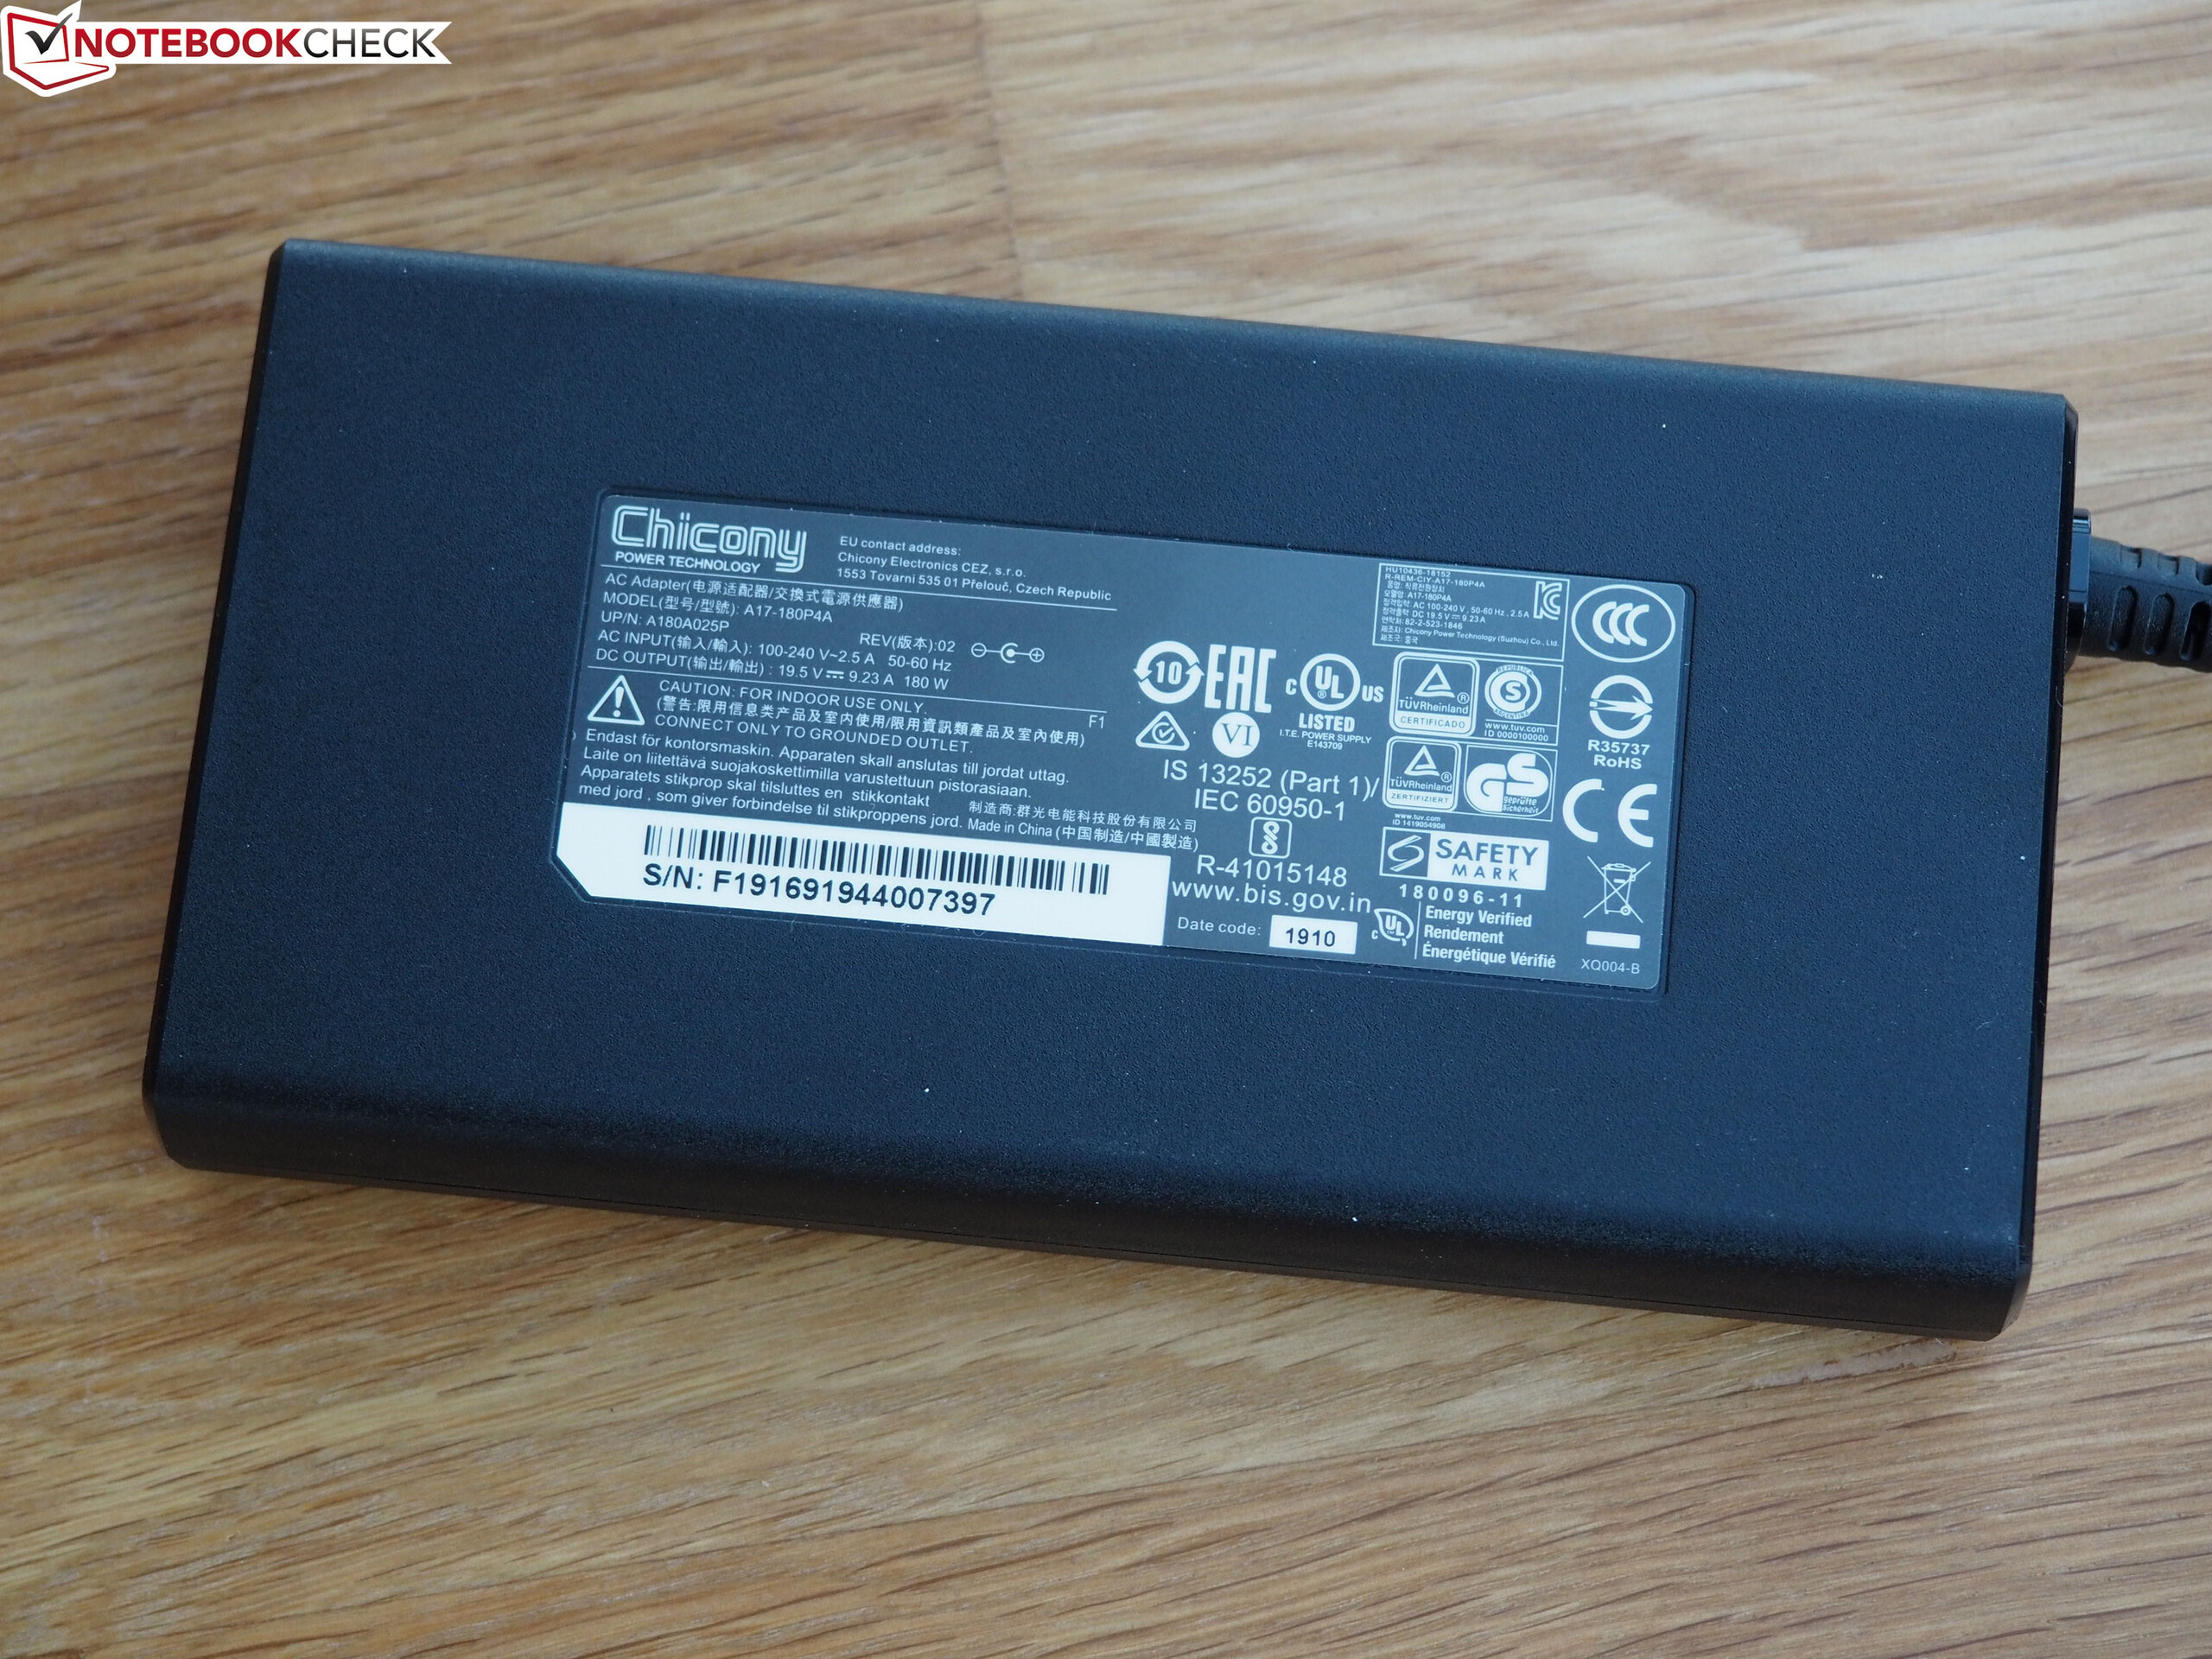
| Load Maximum * (Watt) | 210 | 225.3 -7% | 212.7 -1% | 168 20% | 206.5 2% | 254 ? -21% |
* ... menor é melhor
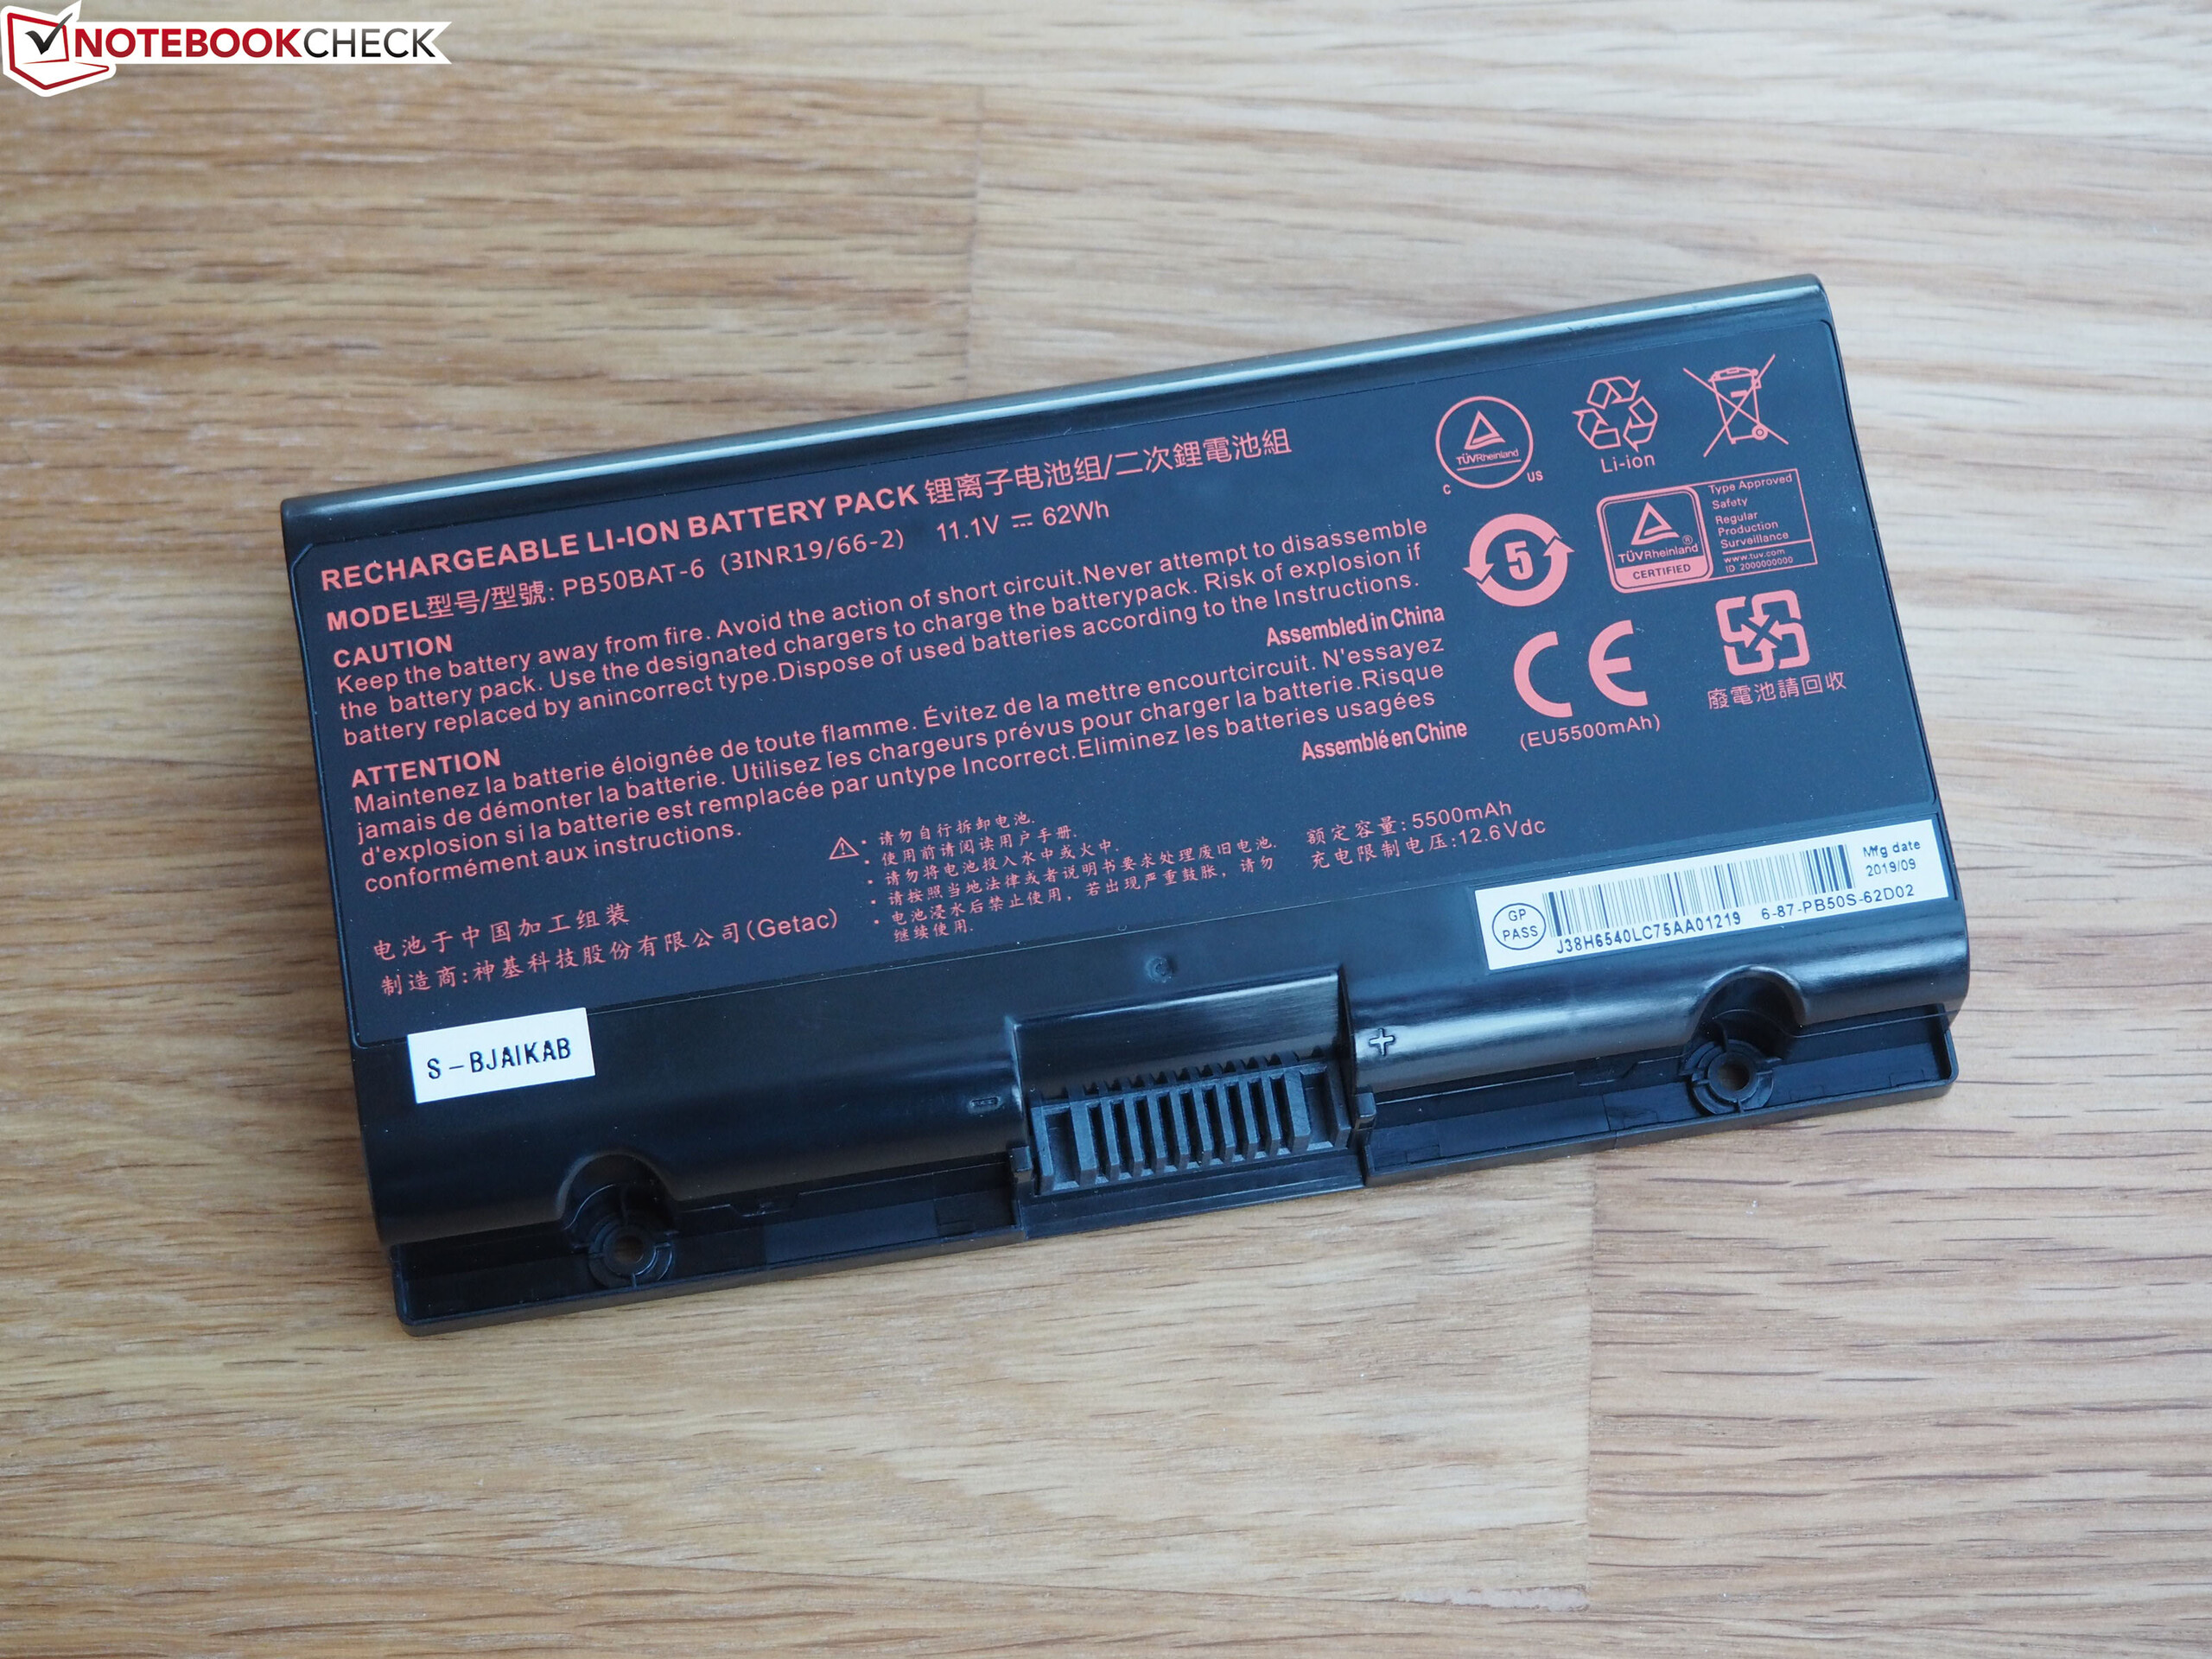
| Schenker XMG Pro 17 PB71RD-G i7-9750H, GeForce RTX 2060 Mobile, 62 Wh | Razer Blade Pro 17 RTX 2060 i7-9750H, GeForce RTX 2060 Mobile, 70 Wh | Asus Strix Hero III G731GV i7-9750H, GeForce RTX 2060 Mobile, 66 Wh | Lenovo Legion Y740-17IRH i7-9750H, GeForce RTX 2060 Mobile, 76 Wh | MSI GL75 9SEK-056US i7-9750H, GeForce RTX 2060 Mobile, 51 Wh | Média da turma Gaming | |
|---|---|---|---|---|---|---|
| Duração da bateria | 10% | 10% | 8% | 10% | 51% | |
| Reader / Idle (h) | 5.2 | 6.9 33% | 7.9 52% | 8.71 ? 68% | ||
| WiFi v1.3 (h) | 4.1 | 4.5 10% | 4.5 10% | 4.3 5% | 4.2 2% | 7.02 ? 71% |
| Load (h) | 1.3 | 1.1 -15% | 1 -23% | 1.47 ? 13% | ||
| H.264 (h) | 4.3 | 8.26 ? |
Pro
Contra
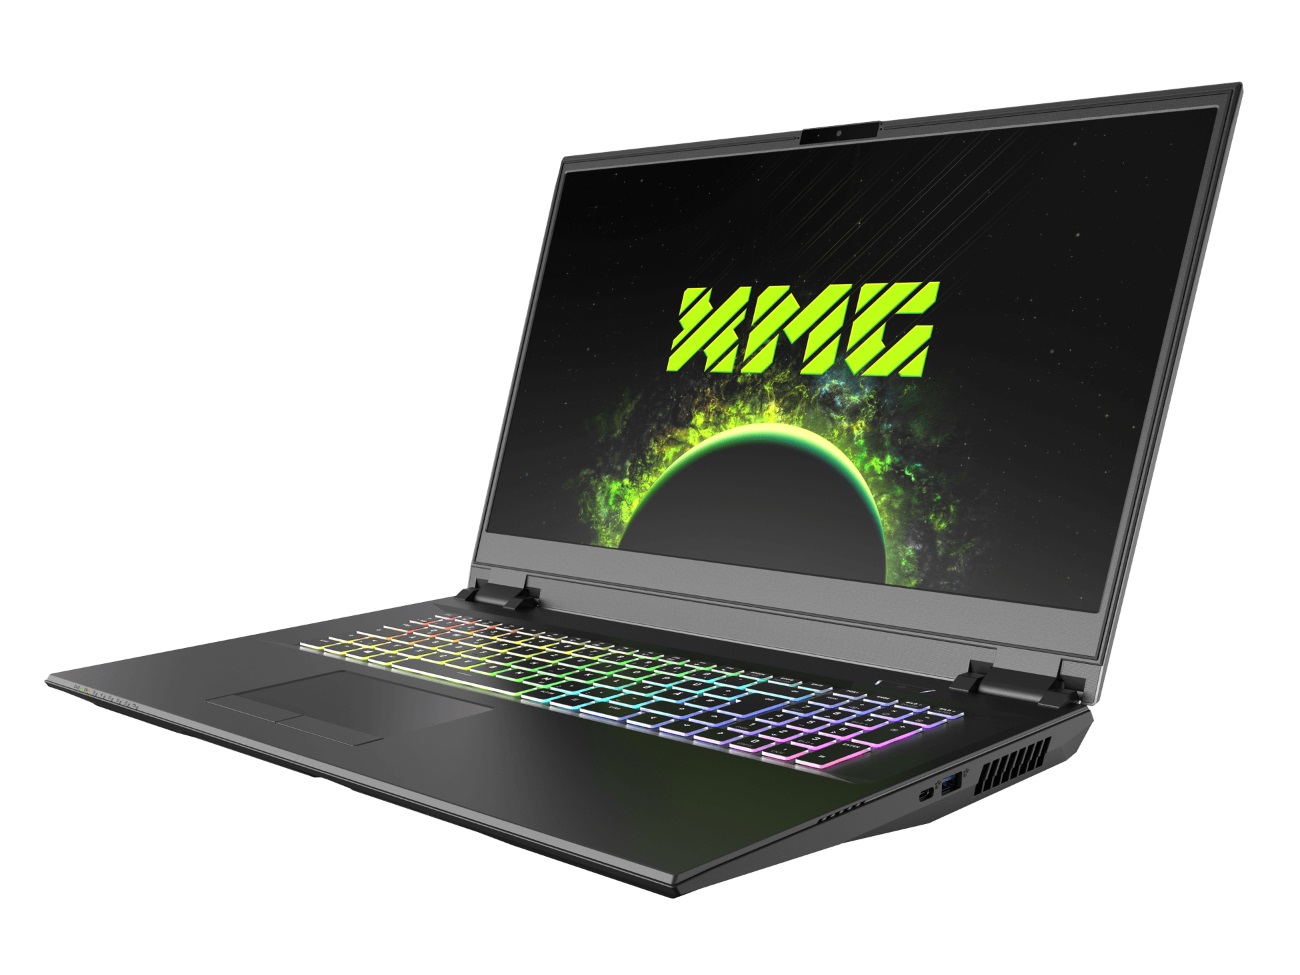
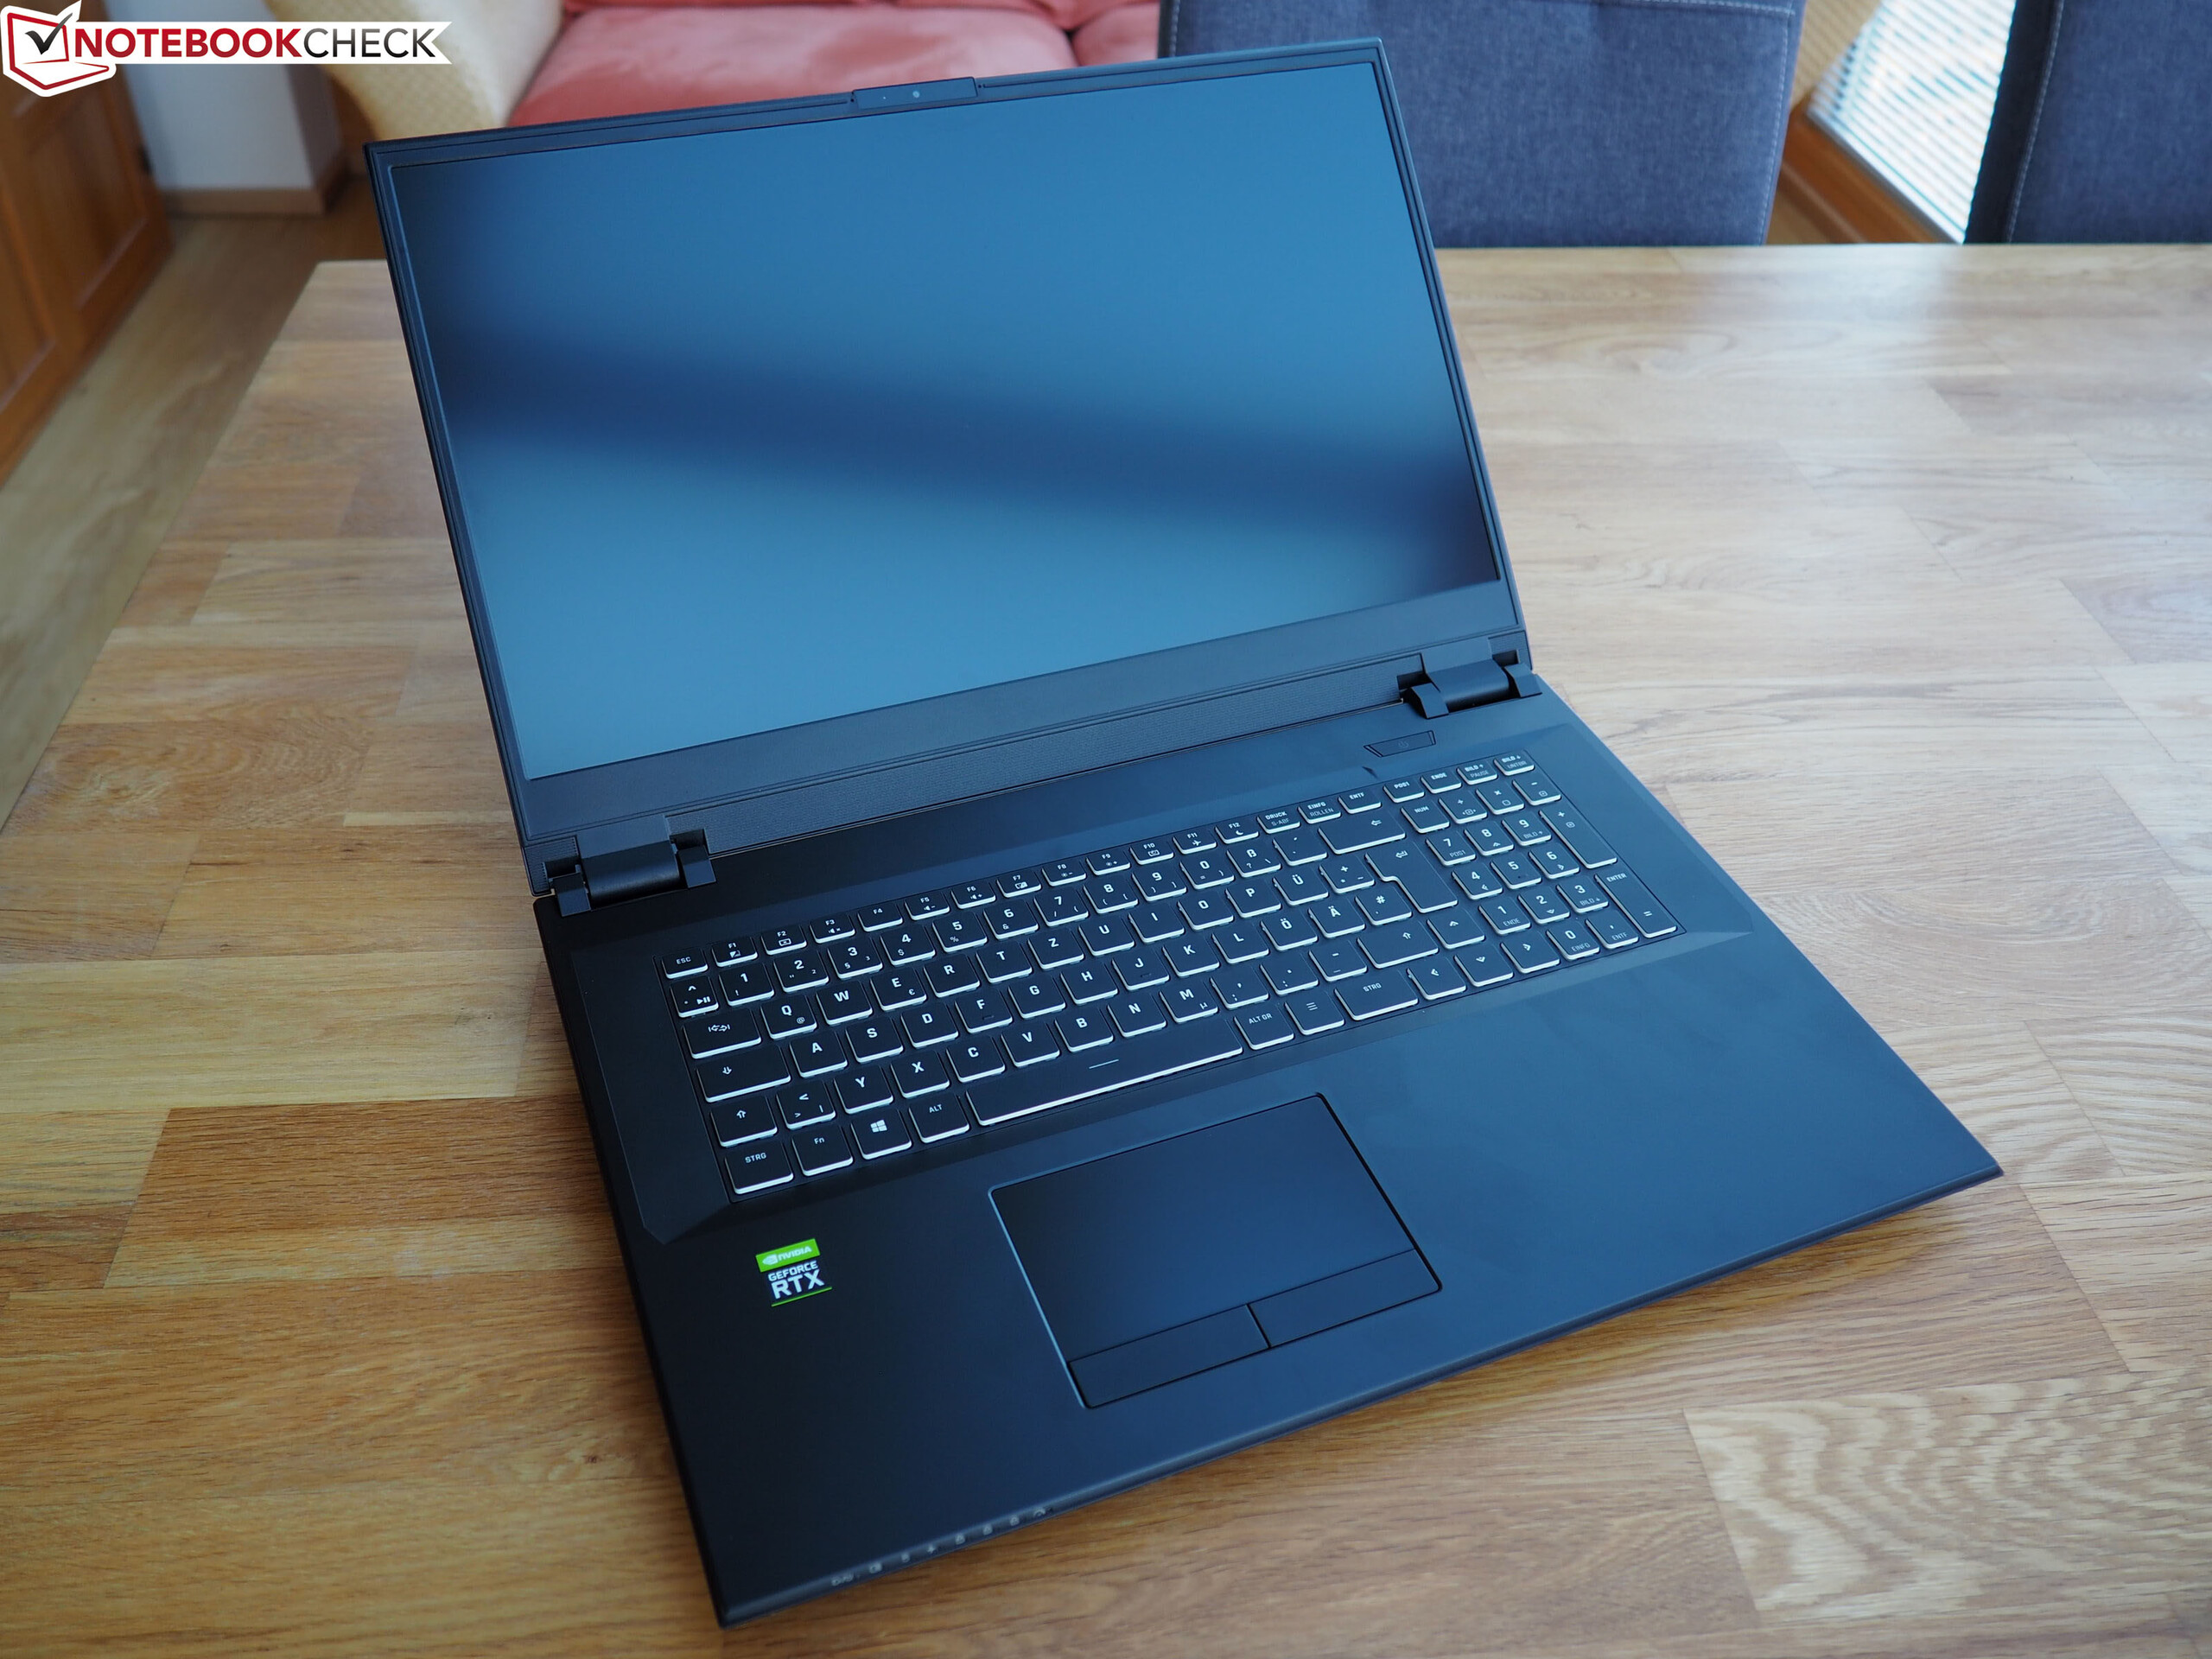
Se você não se incomoda com o barulho alto do ventilador ou usa regularmente um fone de ouvido, o XMG Pro 17 é um poderoso portátil para jogos com um design elegante, adequado para qualquer ambiente.
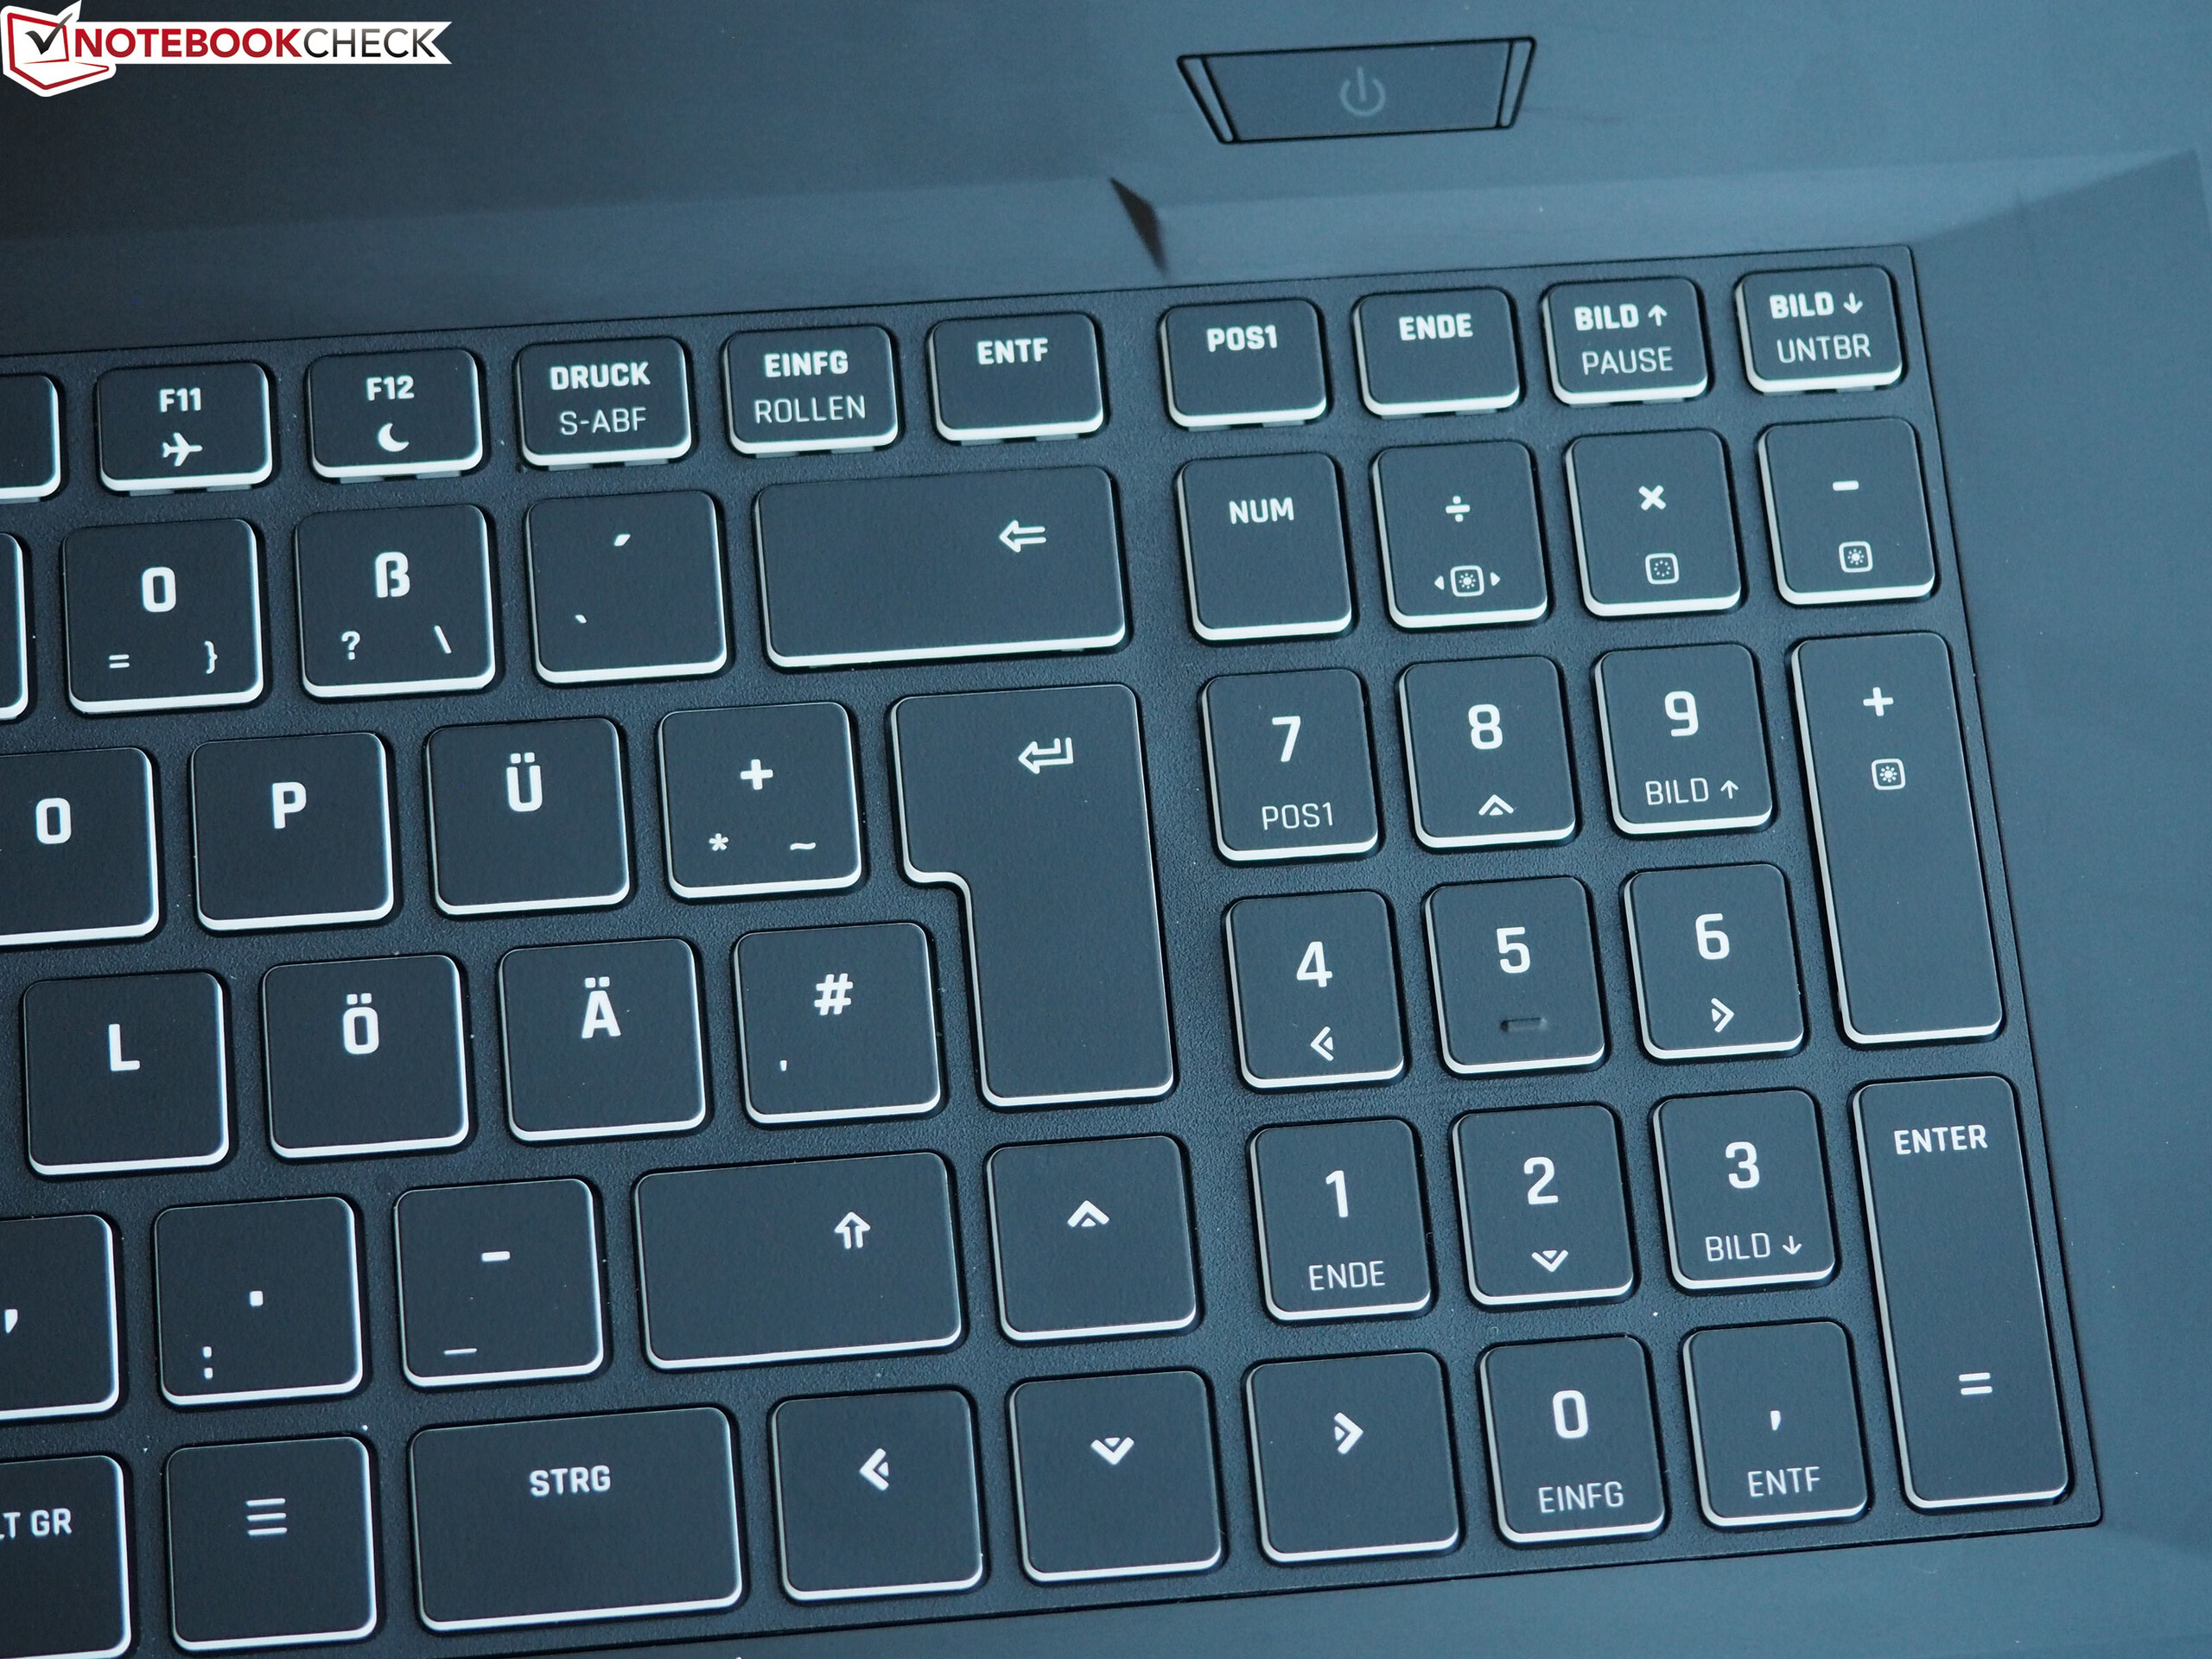
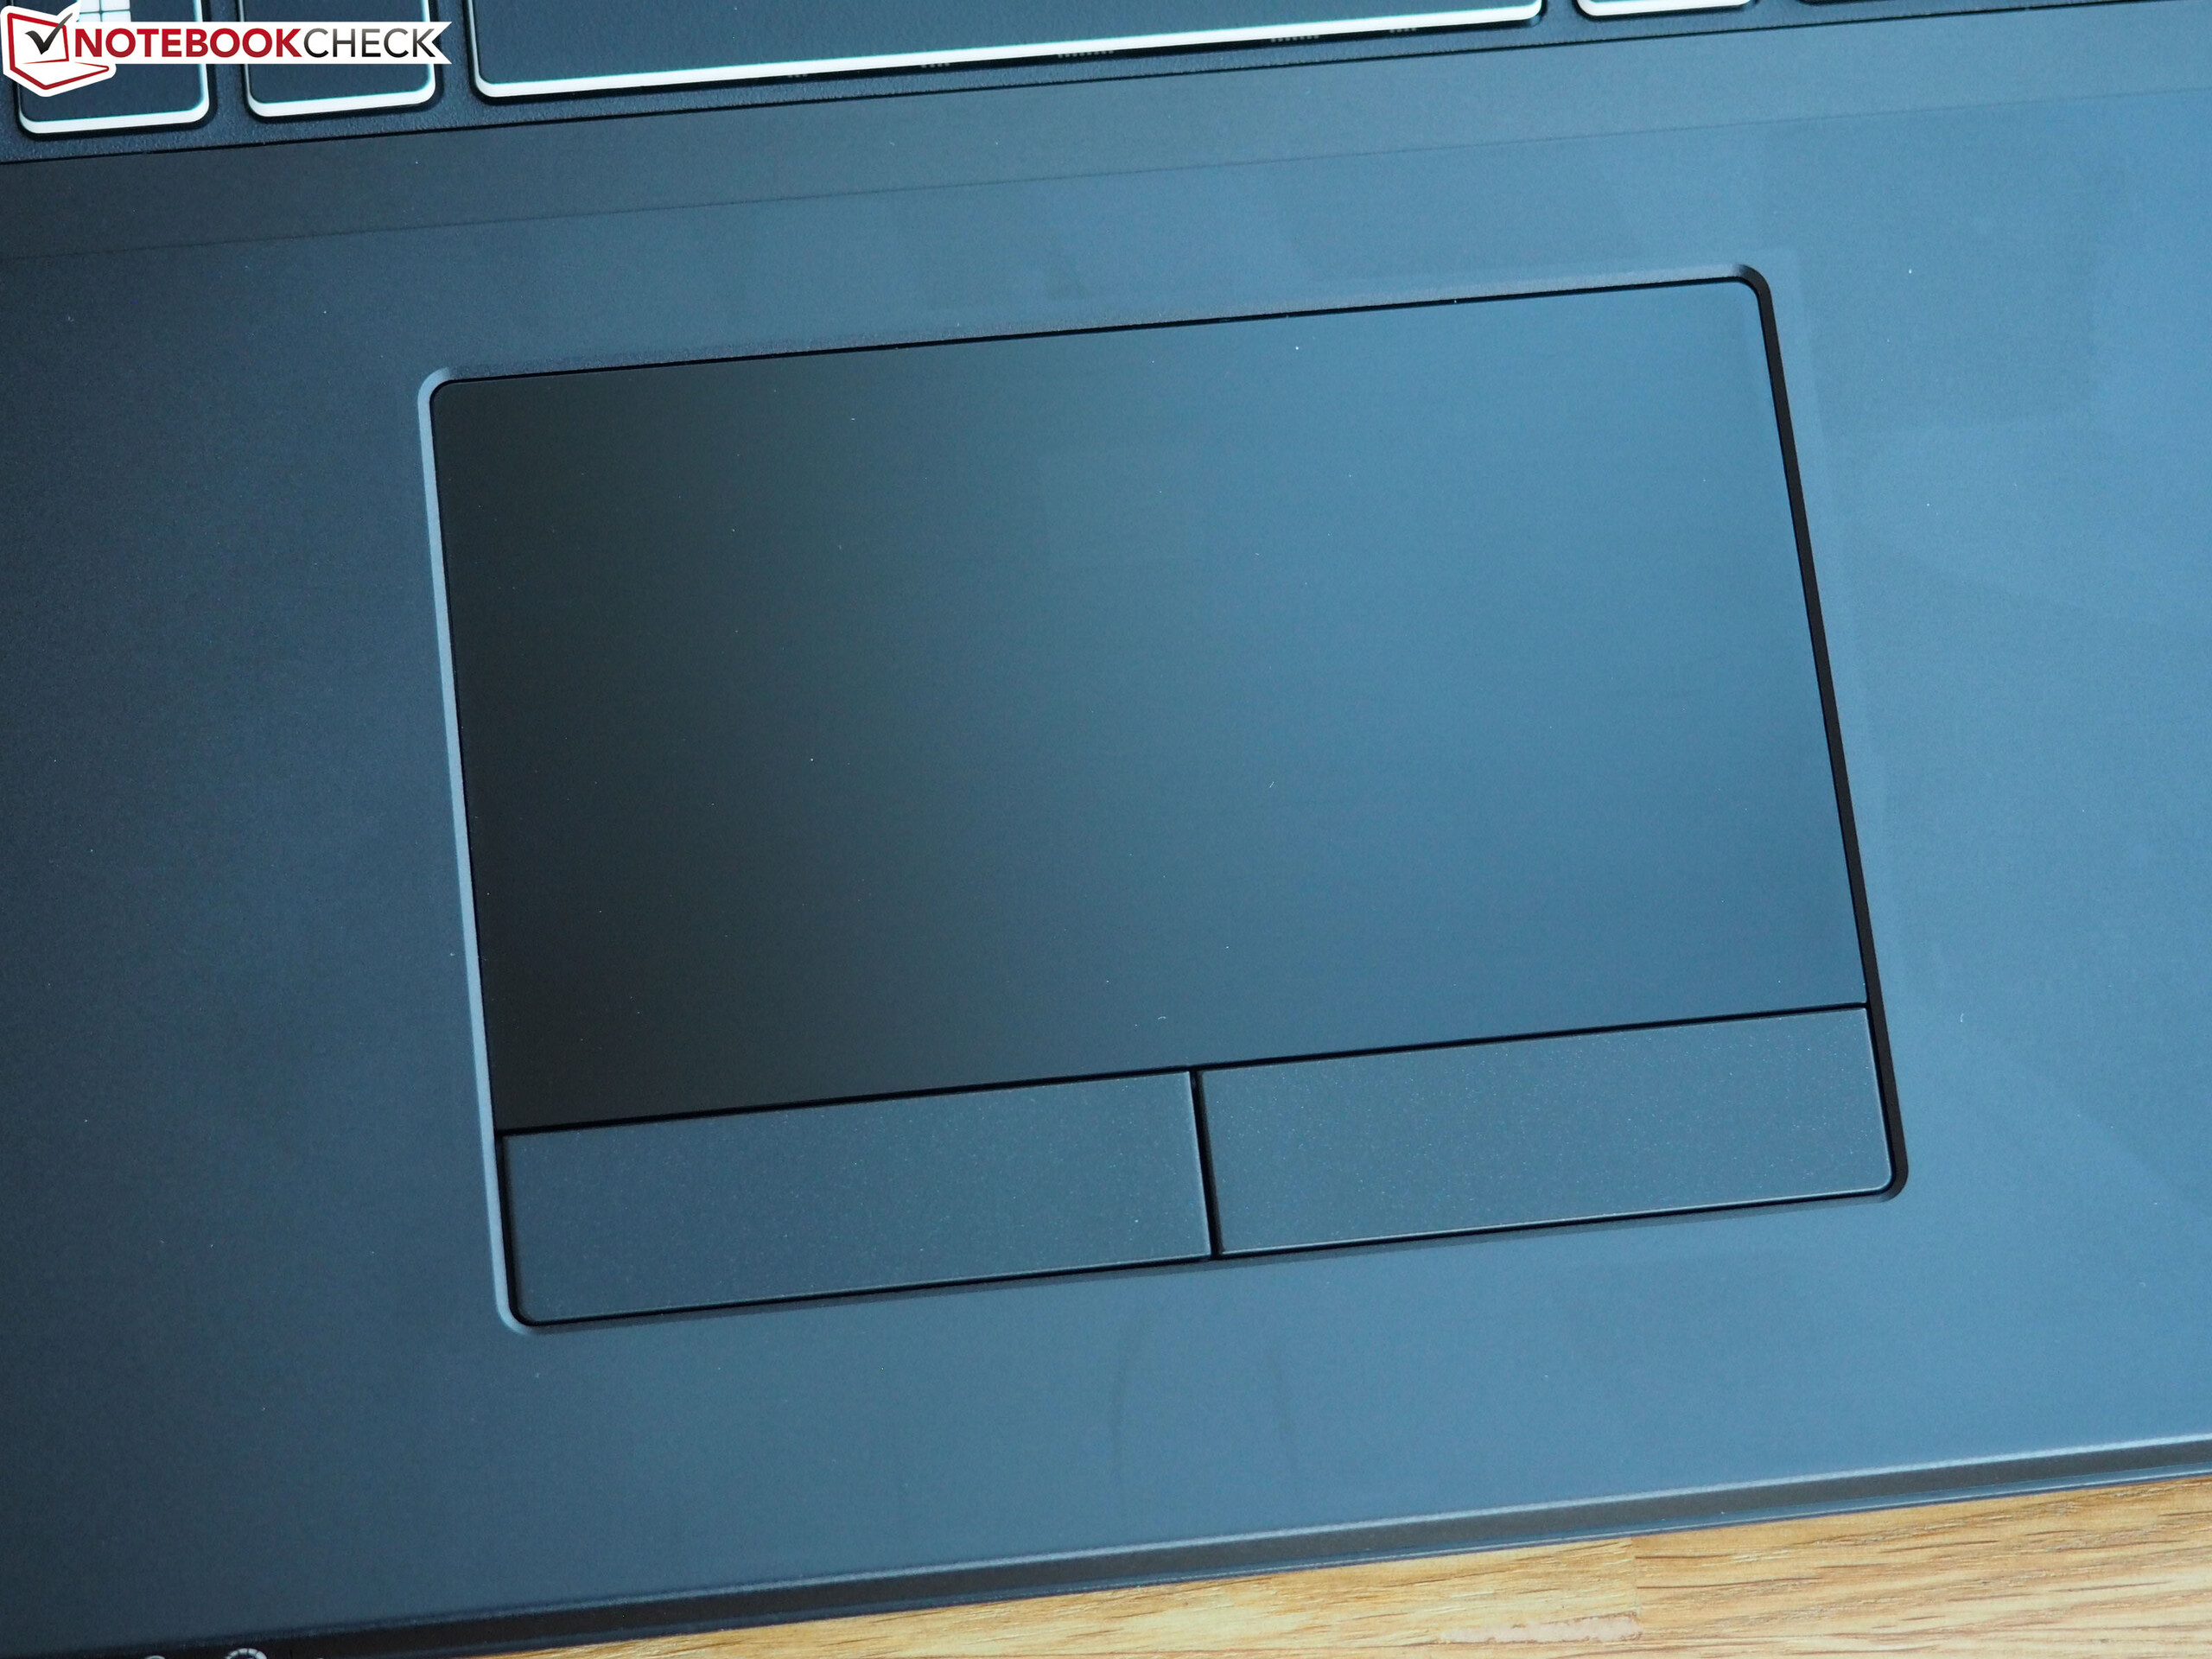
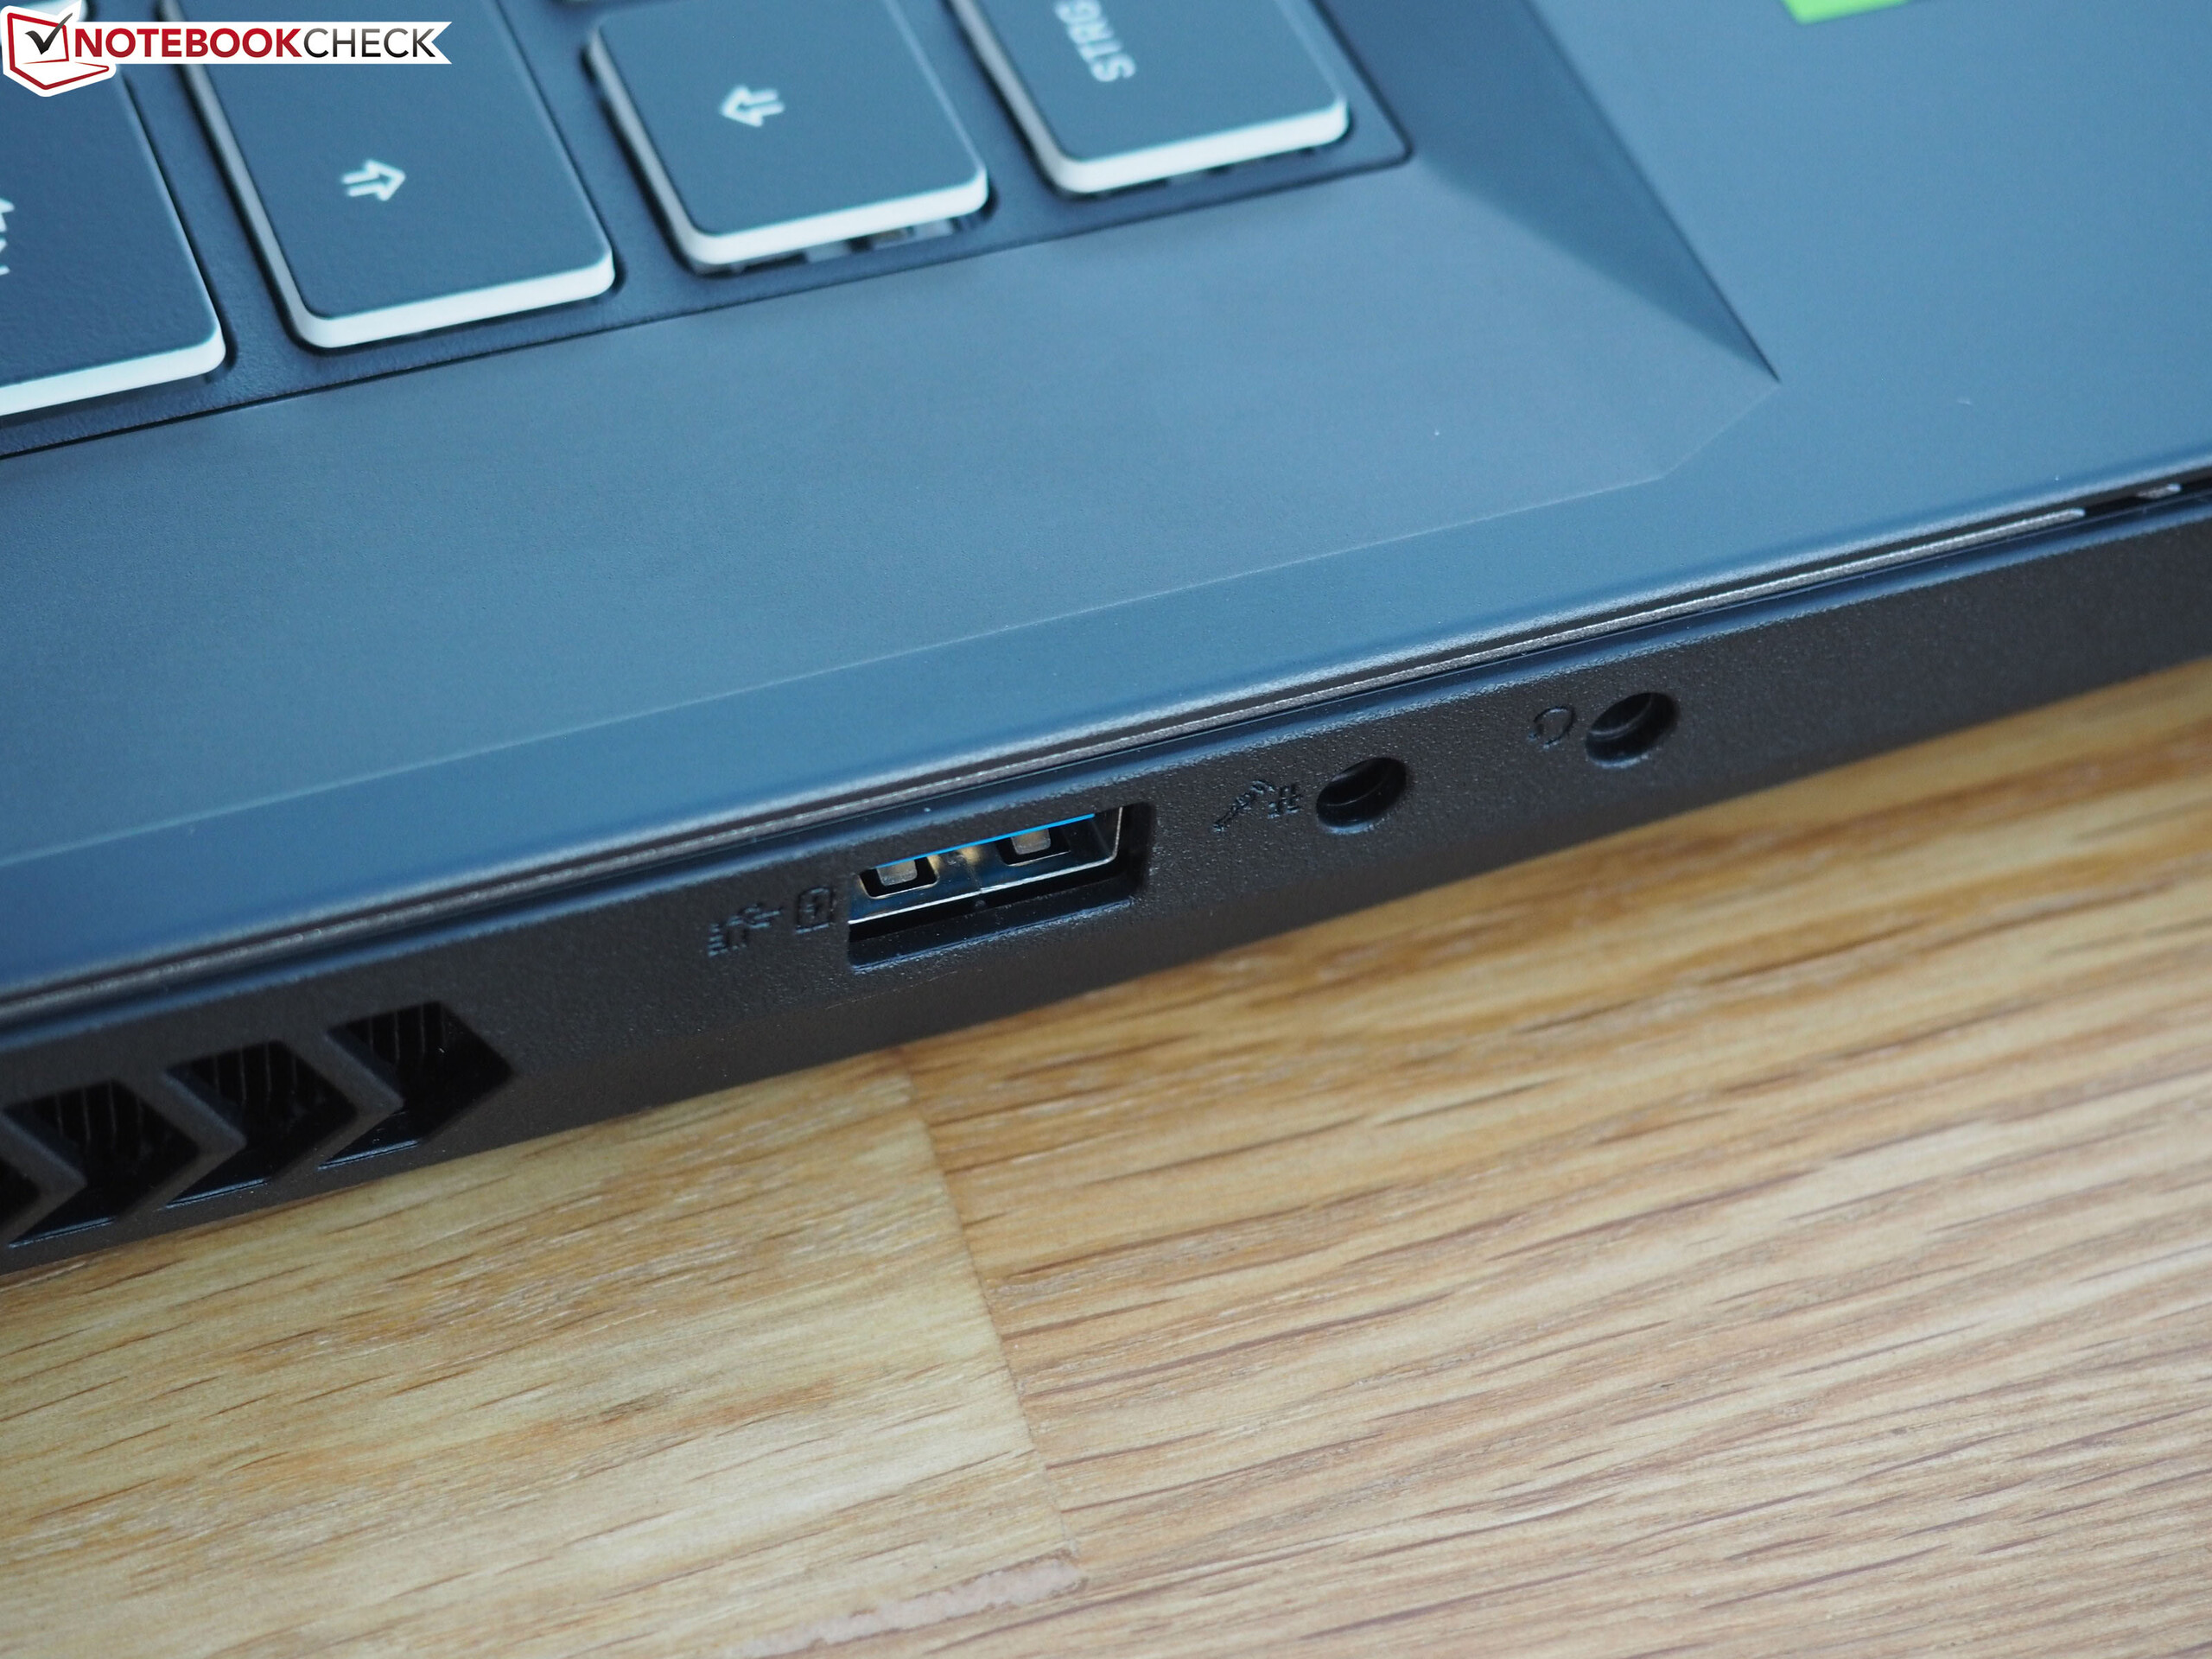
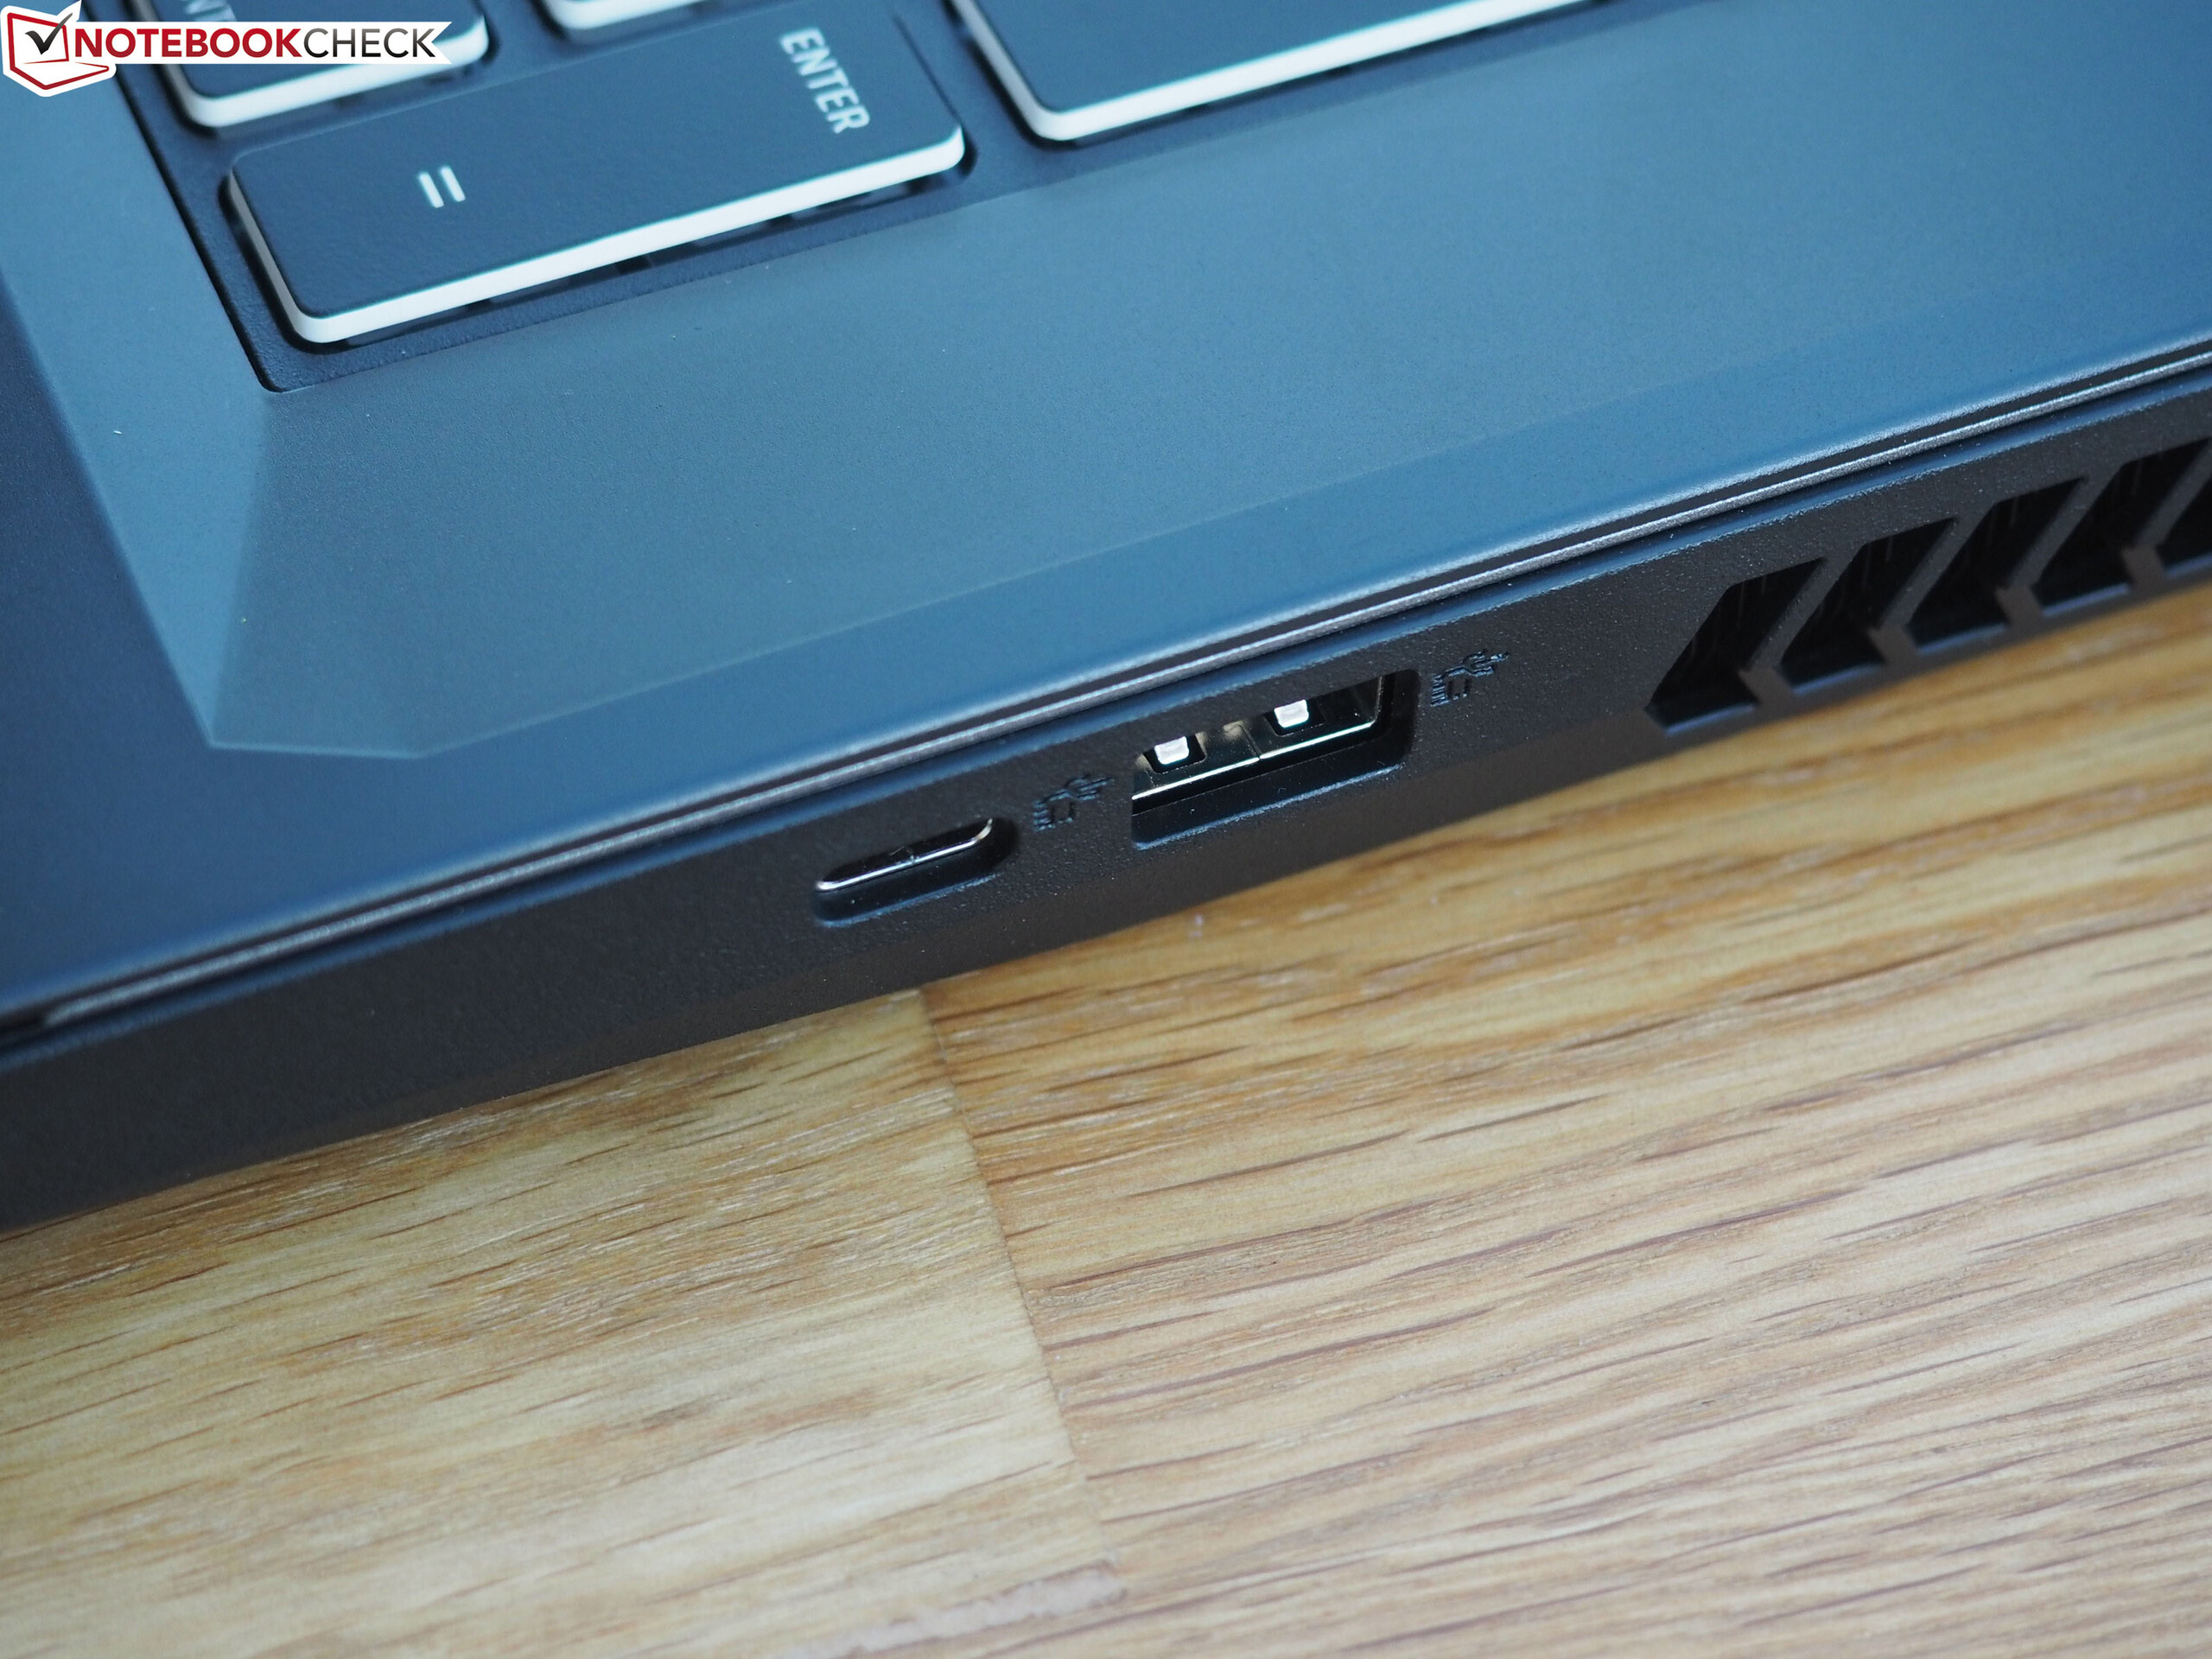
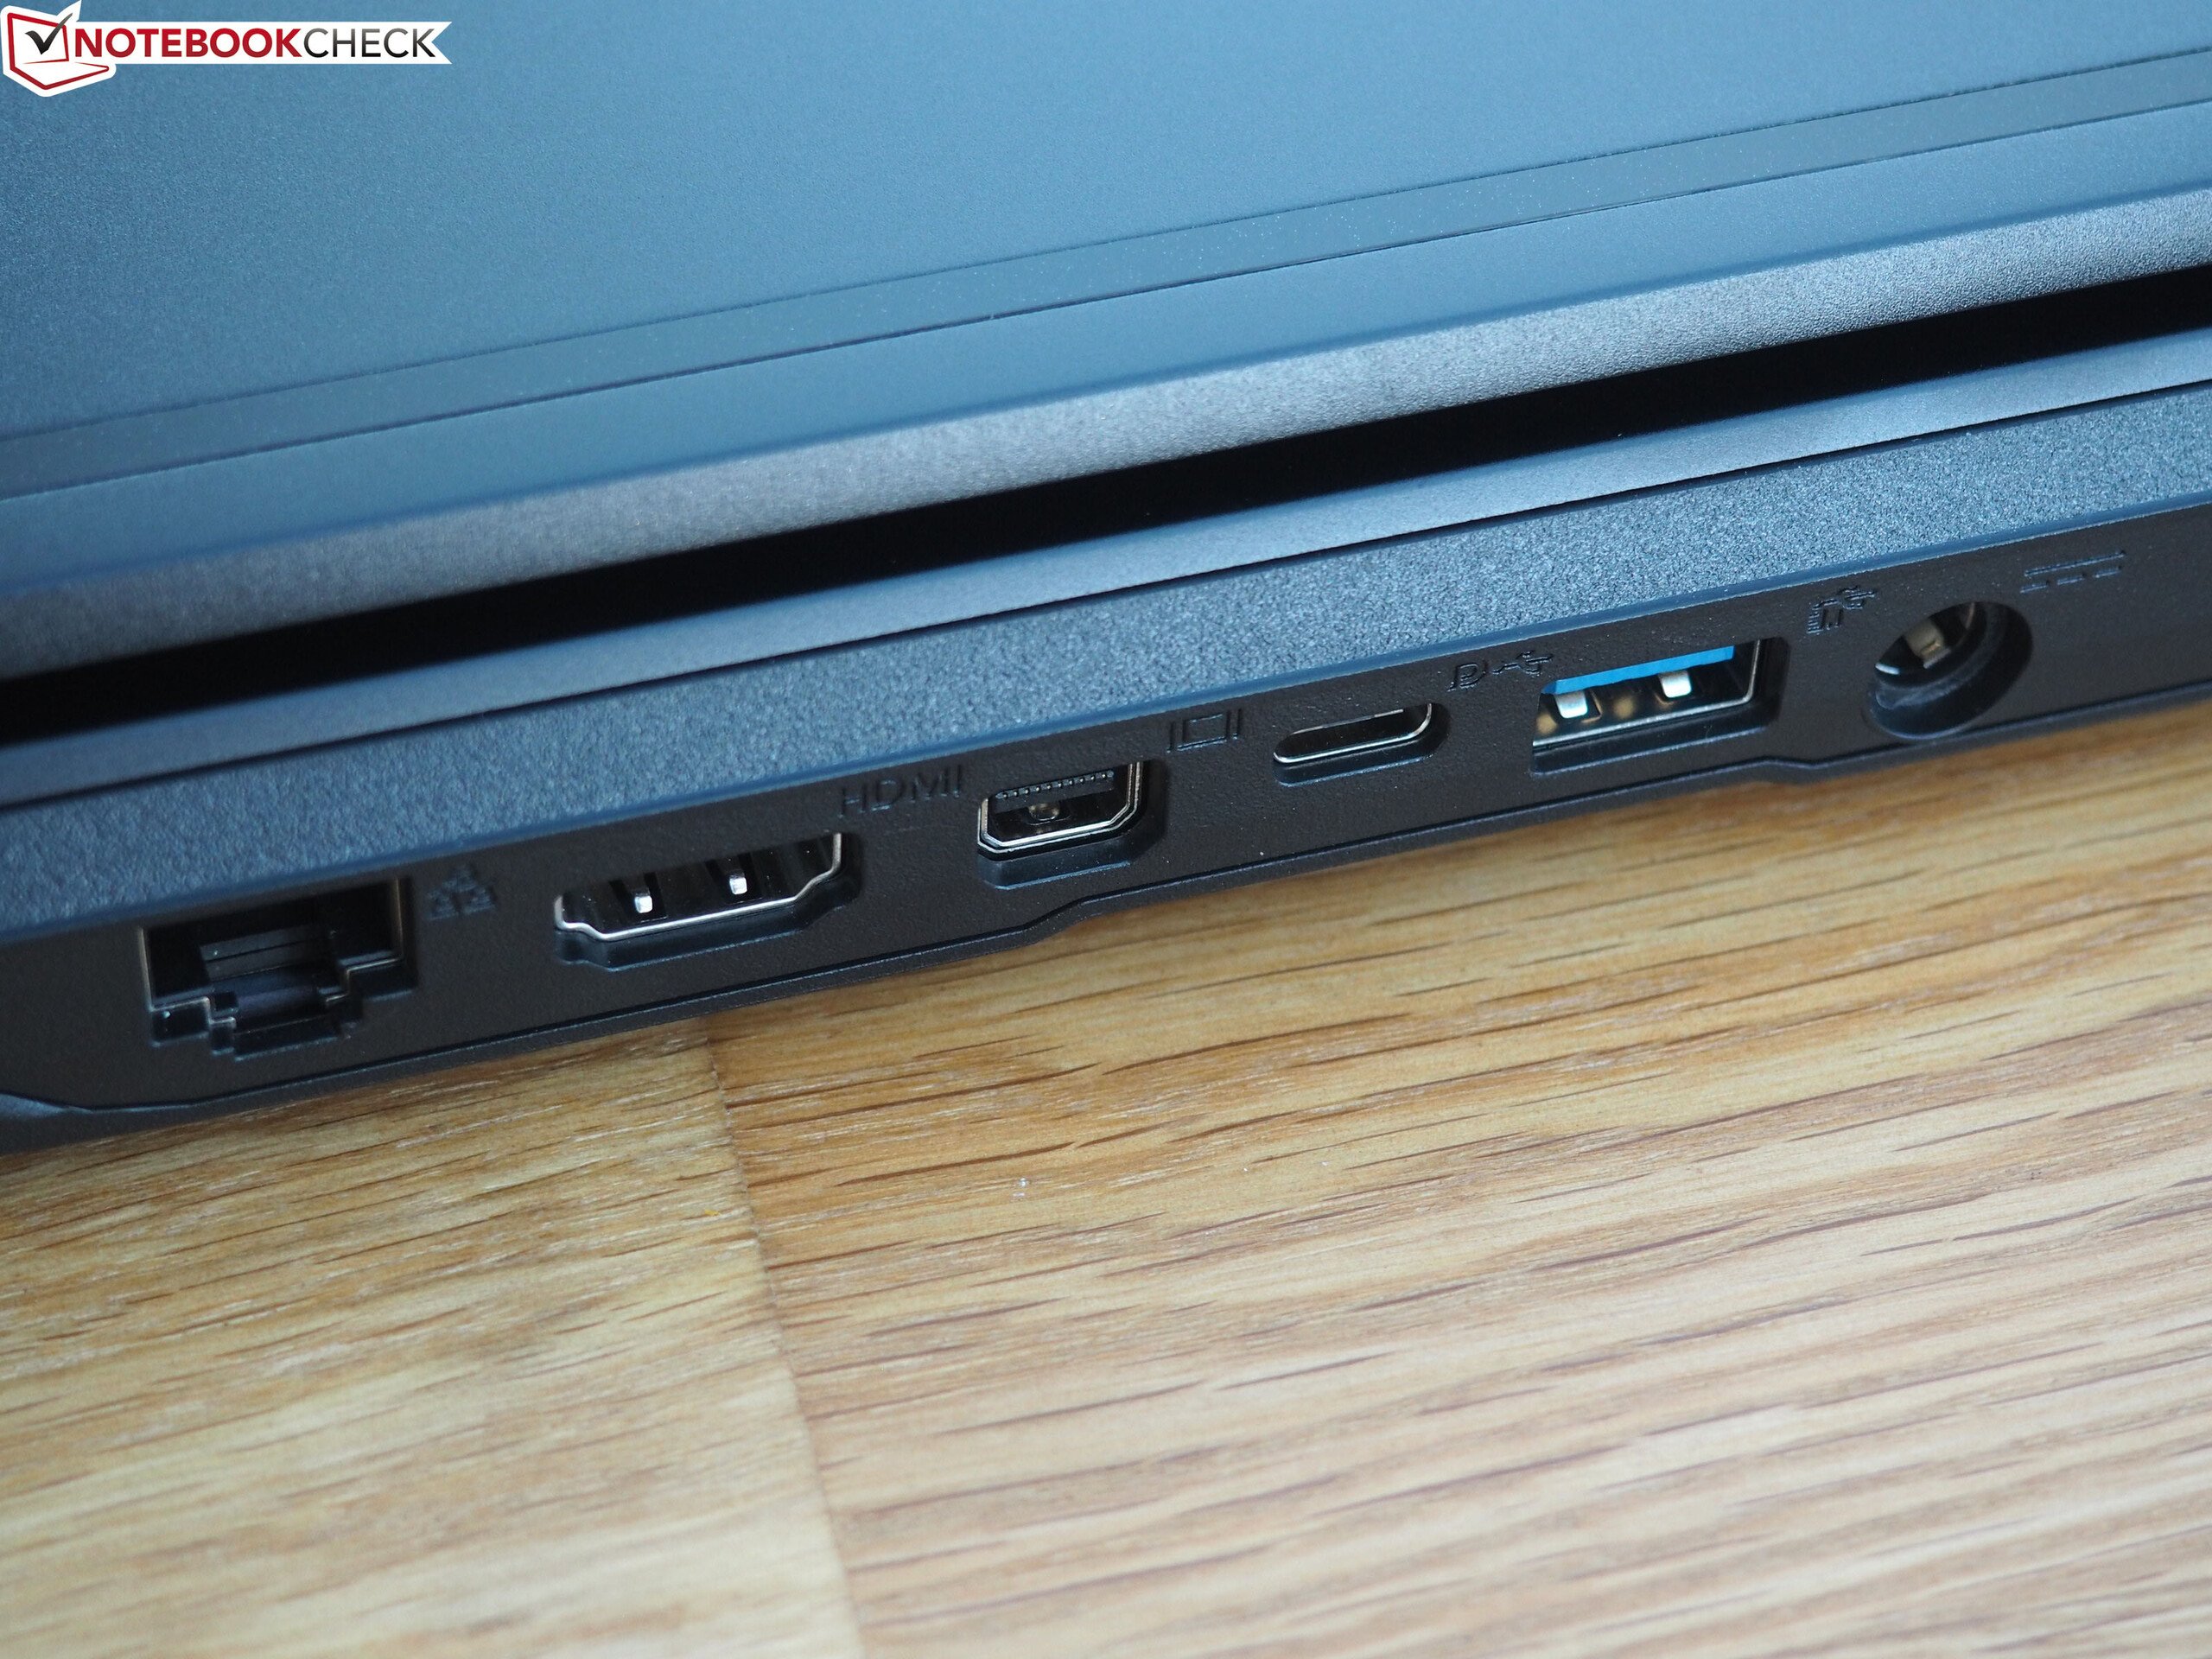
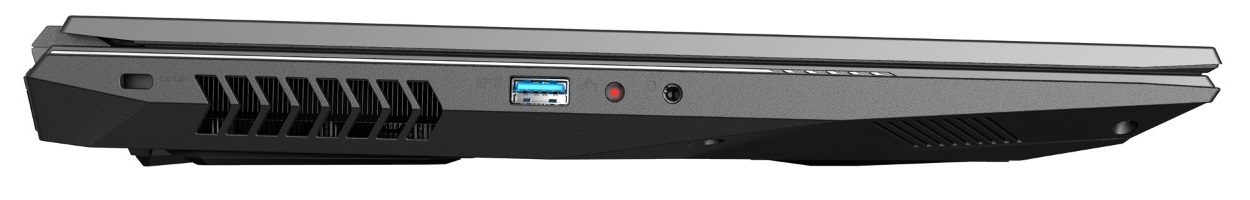
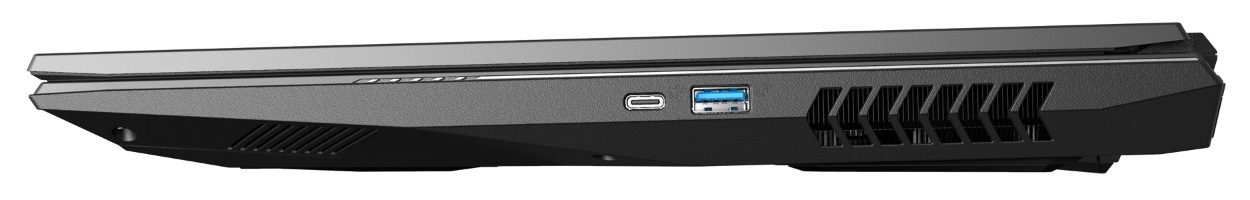
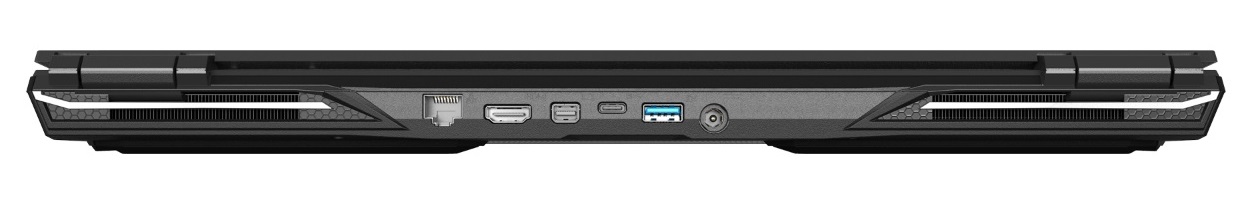
O modelo de 17 polegadas brilha com bons periféricos, várias portas (incluindo Thunderbolt 3) e temperaturas moderadas. A qualidade de imagem e de som também correspondem ao preço de compra. Muitas opções de personalização individuais são outro ponto forte do XMG Pro 17.
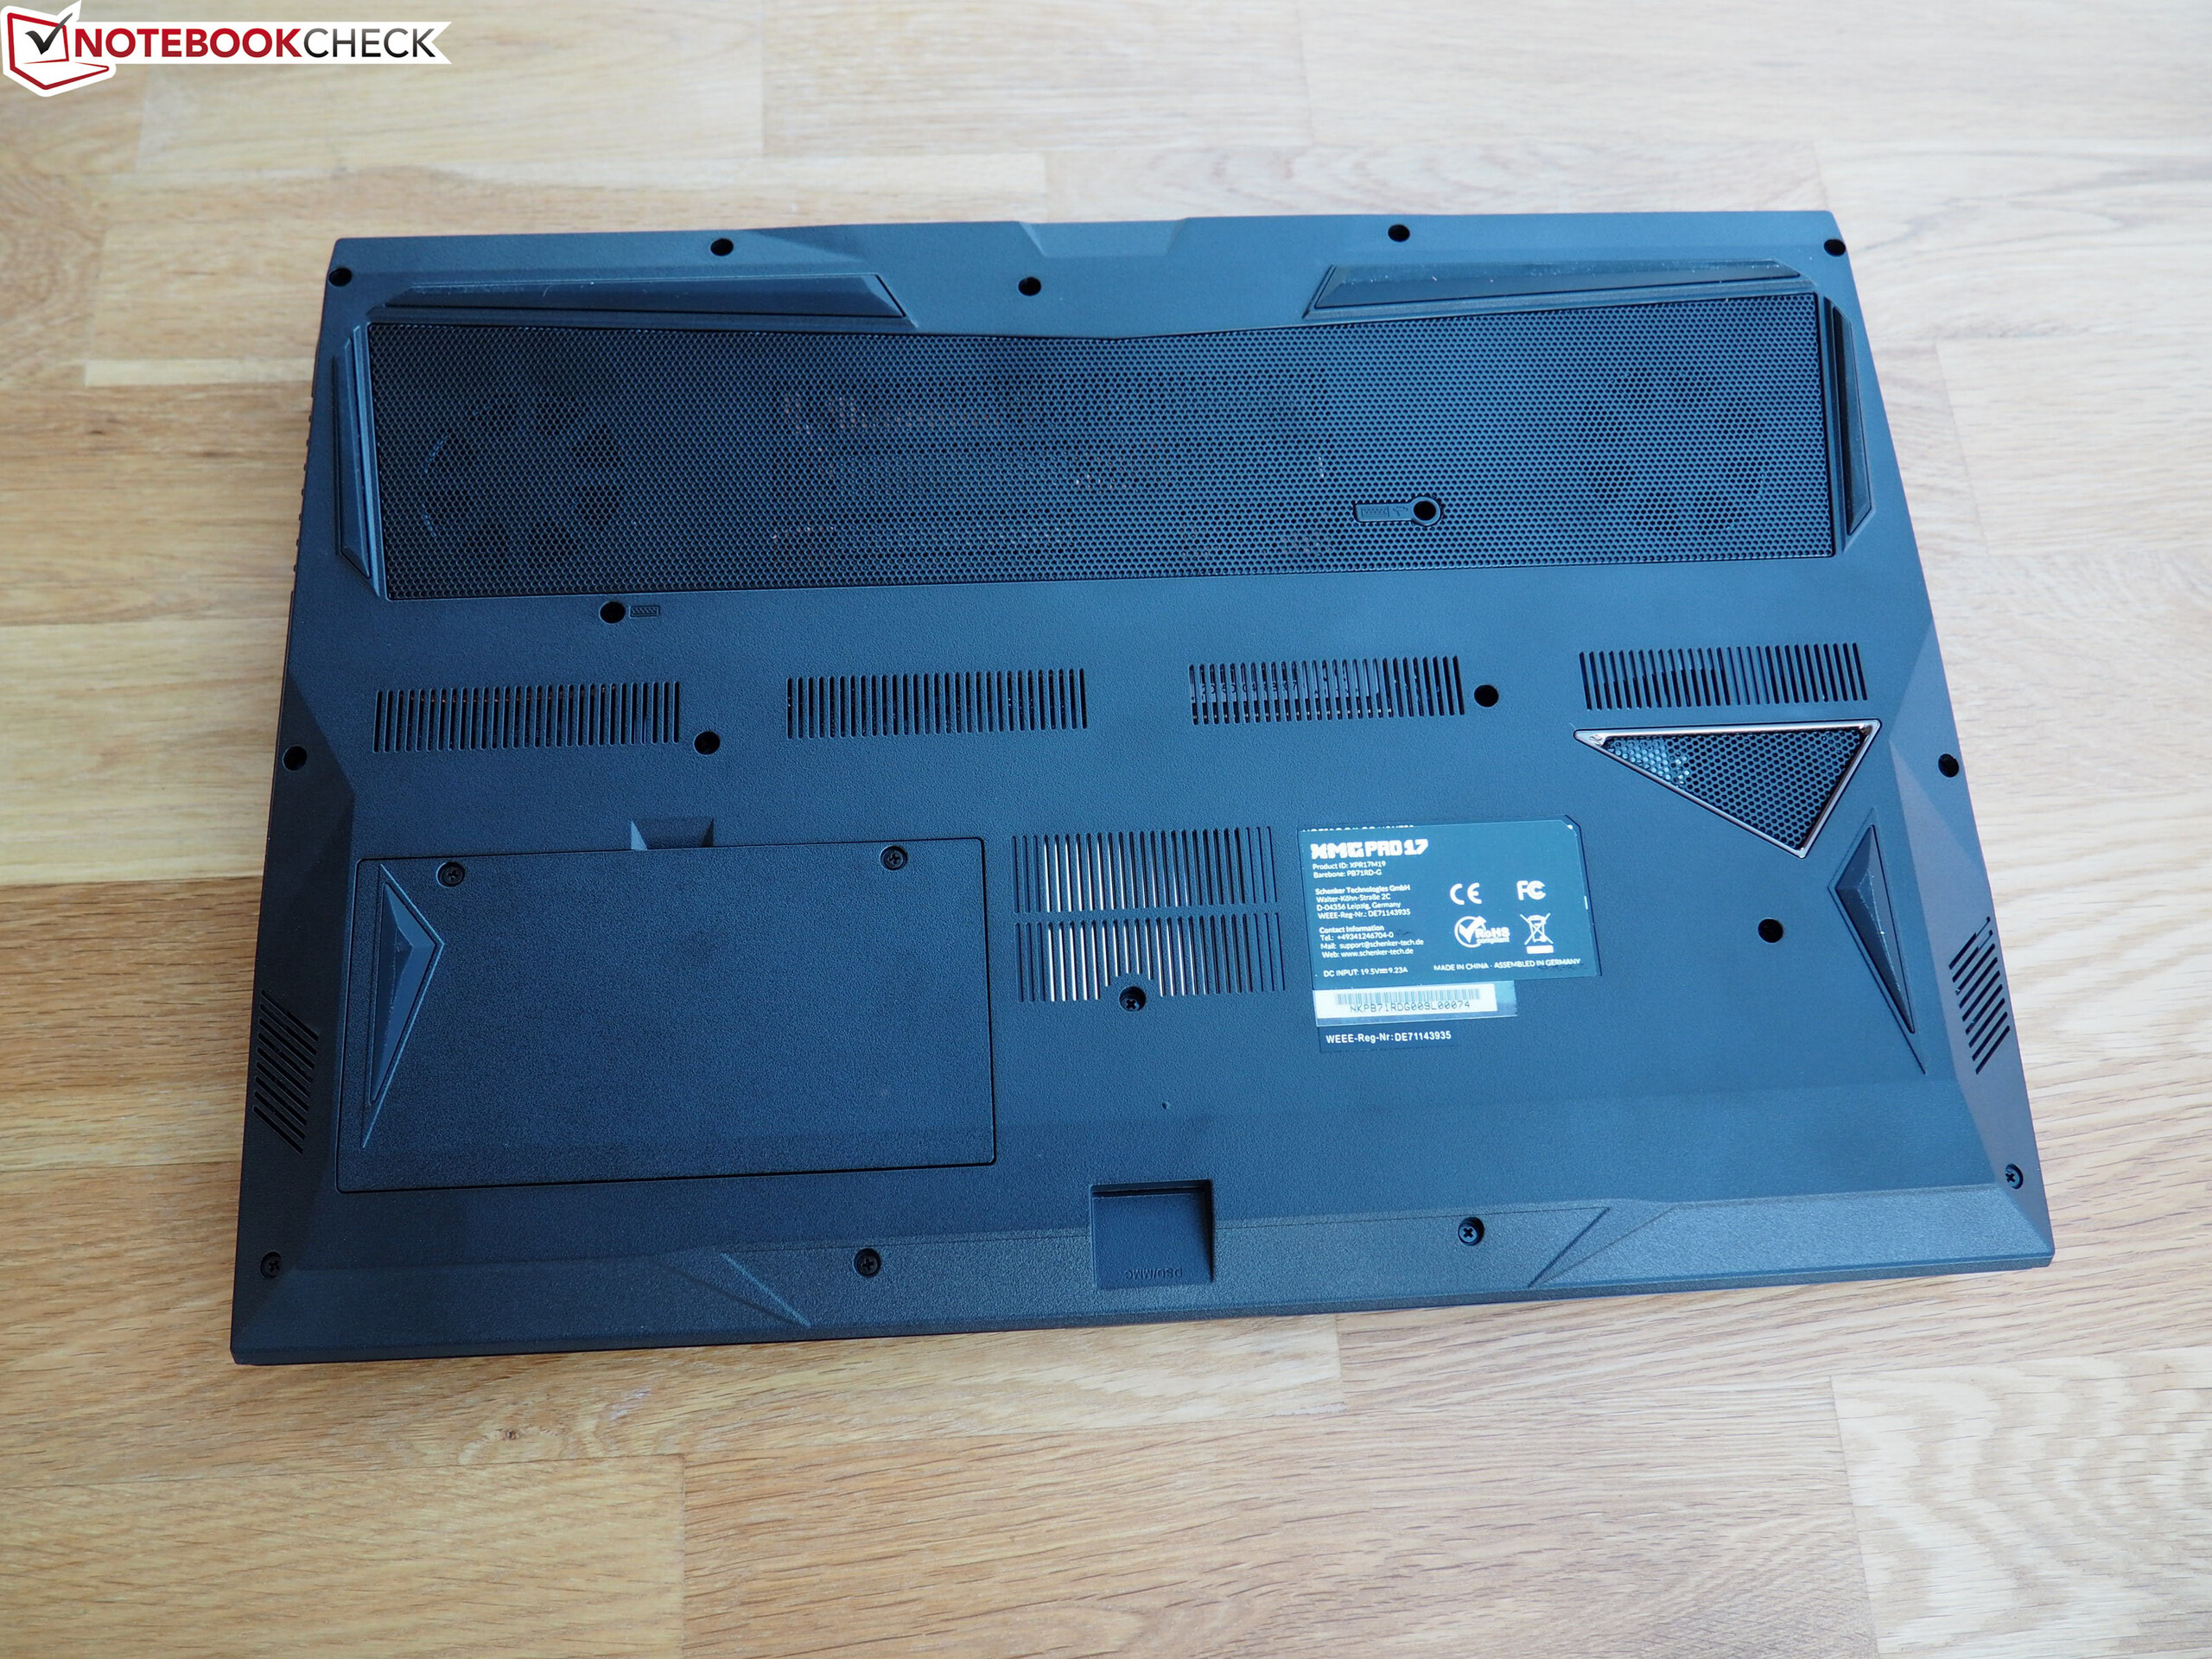
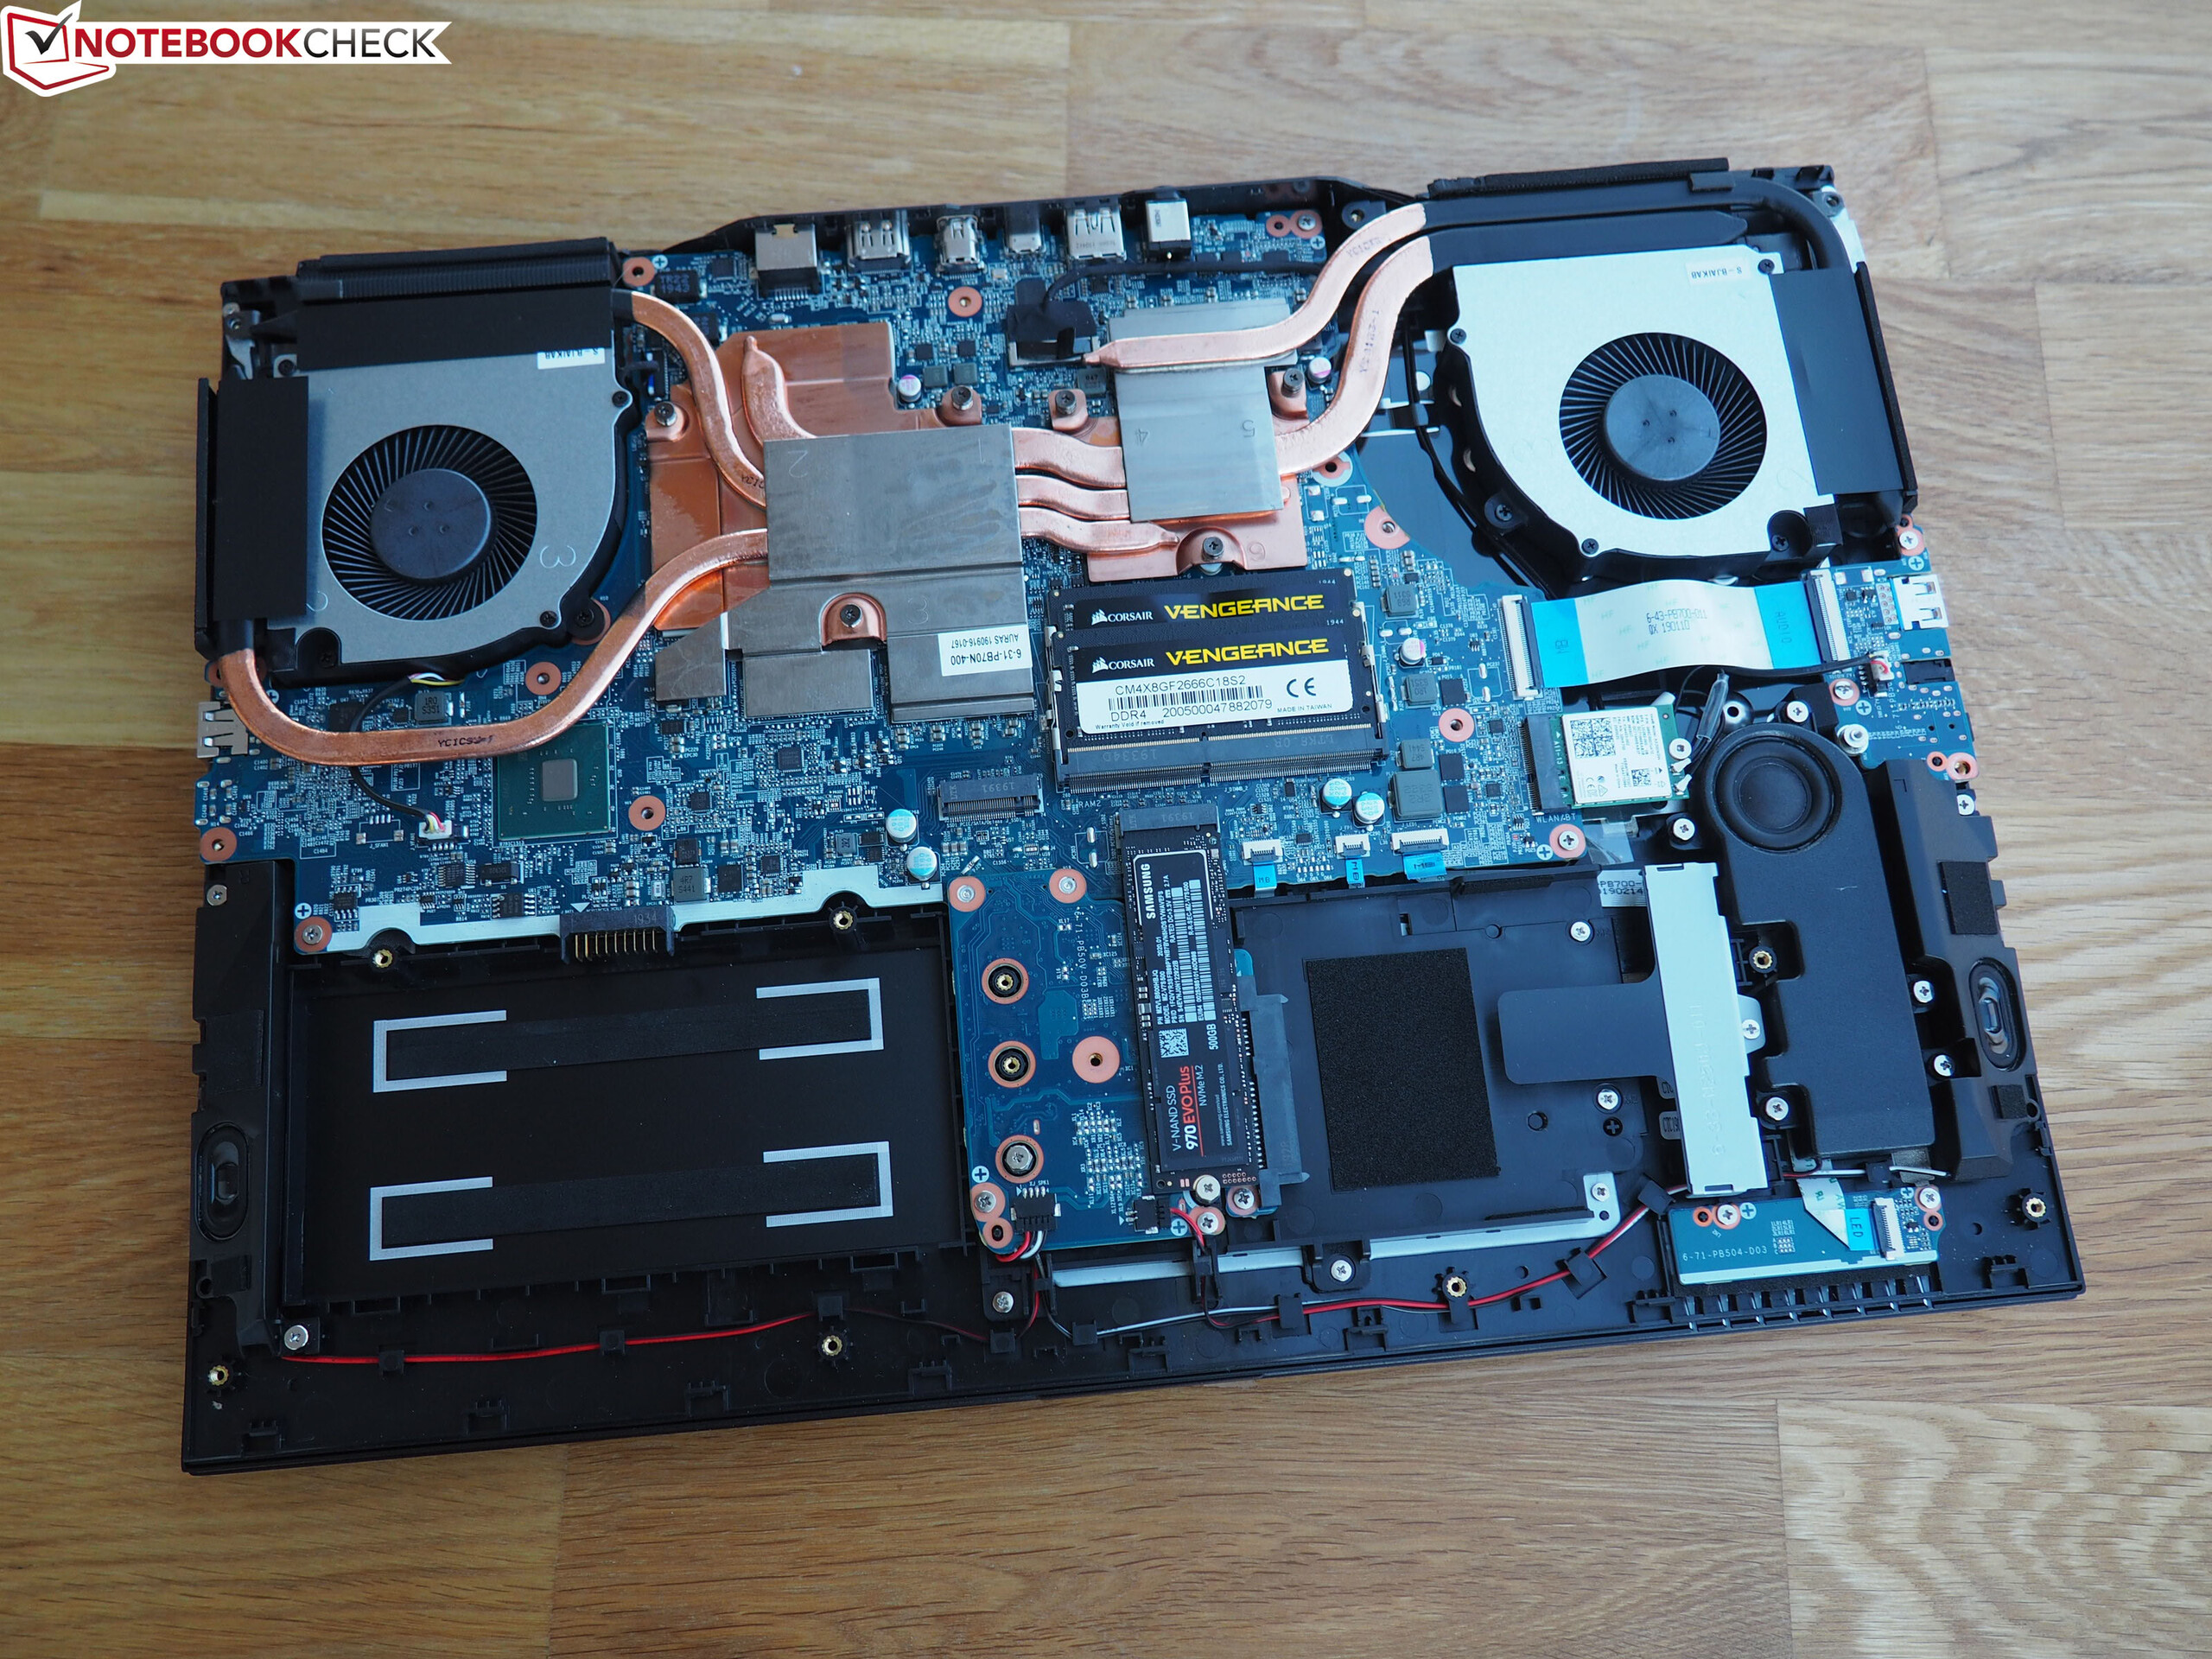
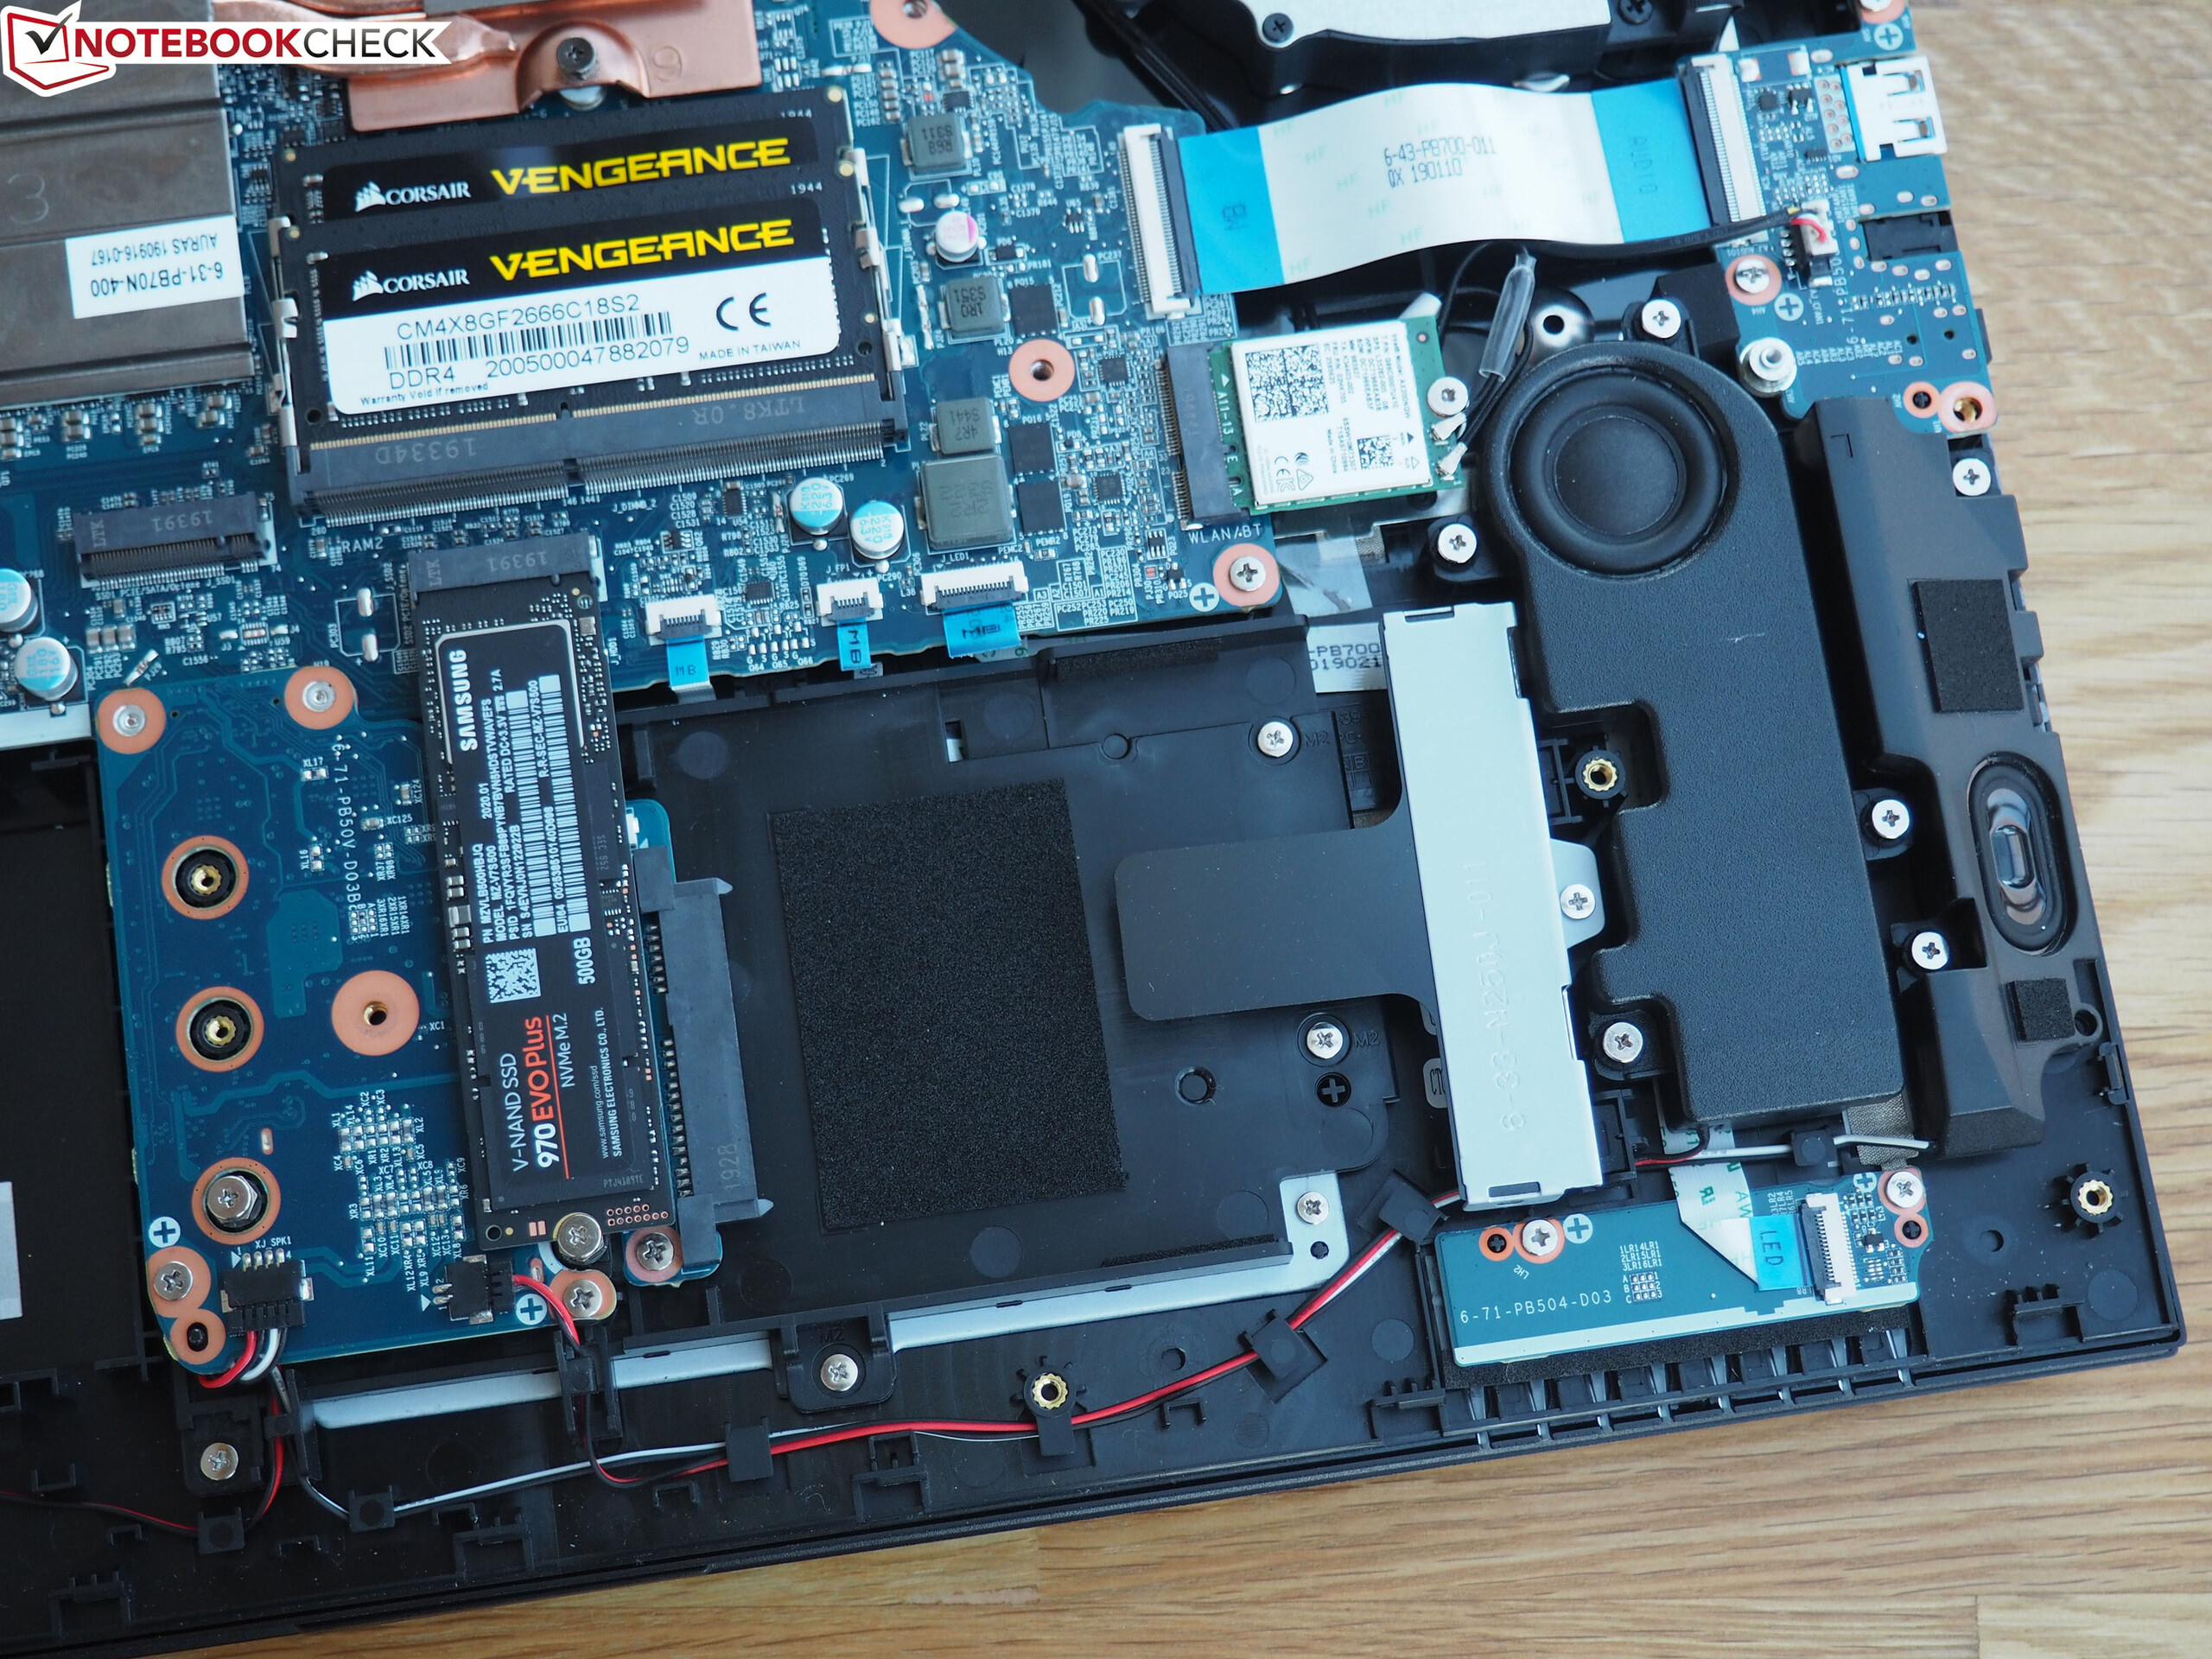
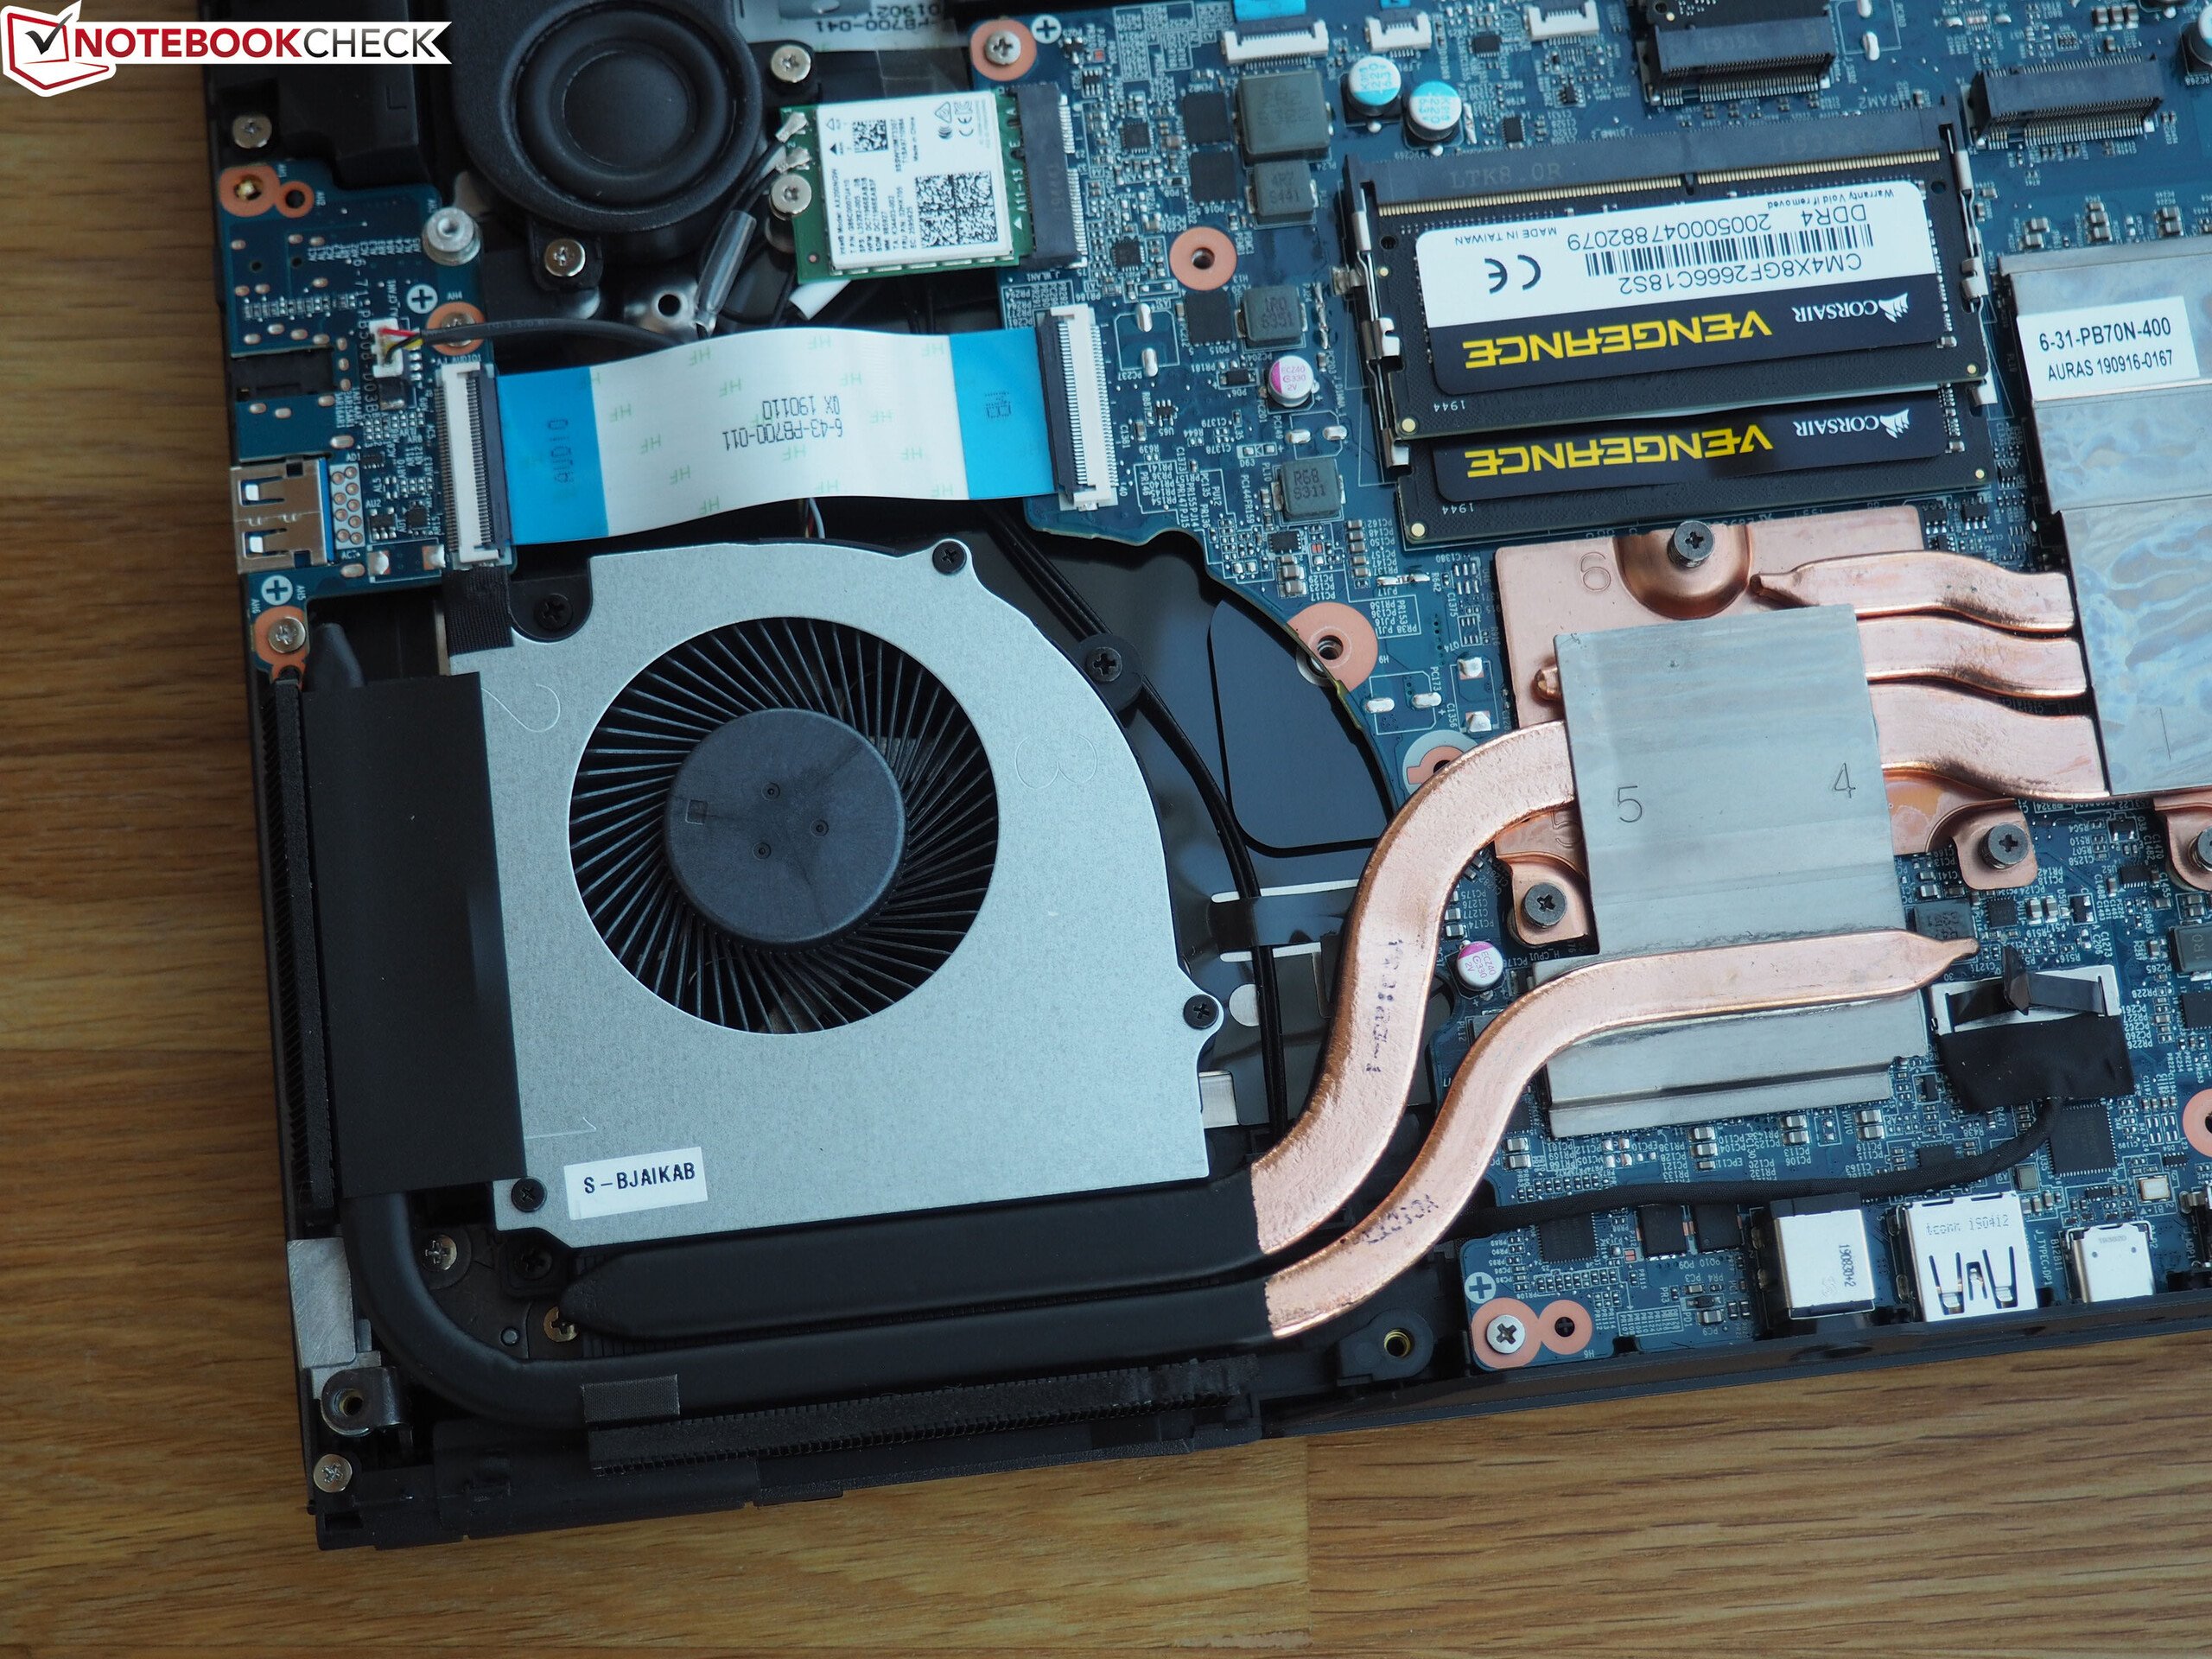
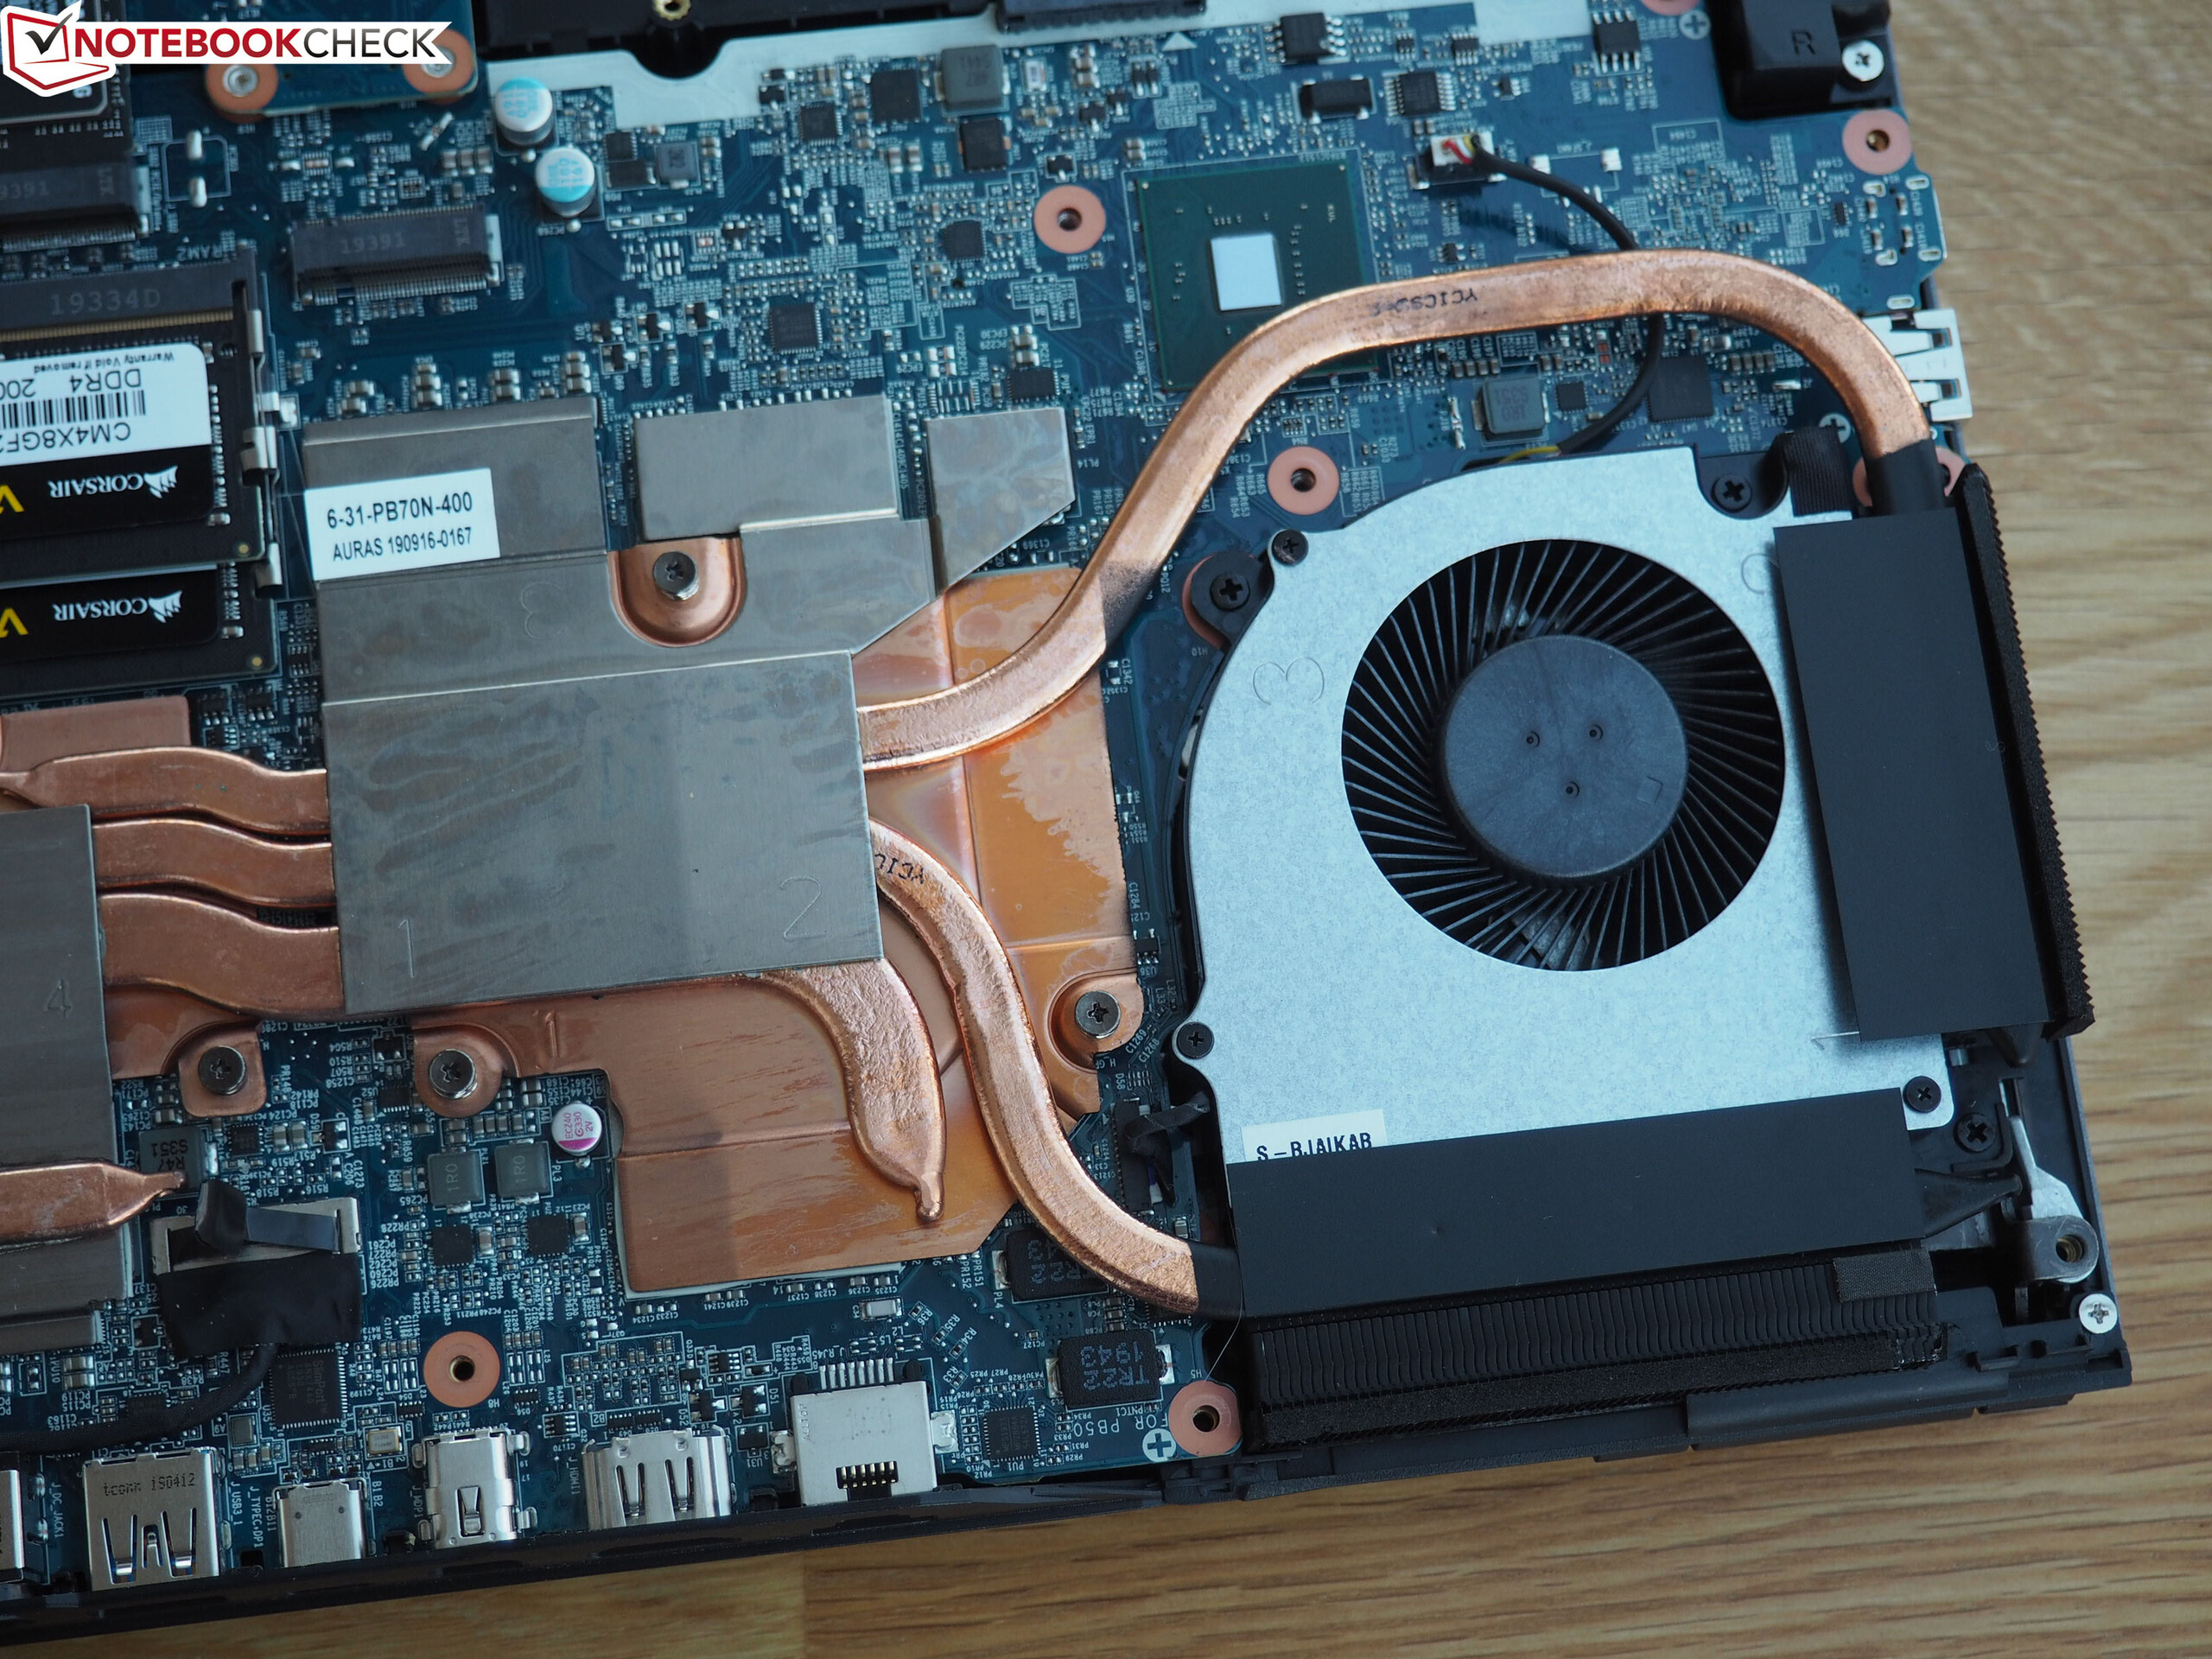
Que a pontuação final não seja mais alta é resultado da duração medíocre da bateria, do ruído durante o uso em 3D e da difícil manutenção.
Schenker XMG Pro 17 PB71RD-G
- 02/23/2020 v7 (old)
Florian Glaser
Price comparison